Magma-ascent processes during 2005–2009 at Mt Etna inferred by soil CO 2 emissions in peripheral areas of the volcano Marco Camarda ⁎, Sofia De Gregorio, Sergio Gurrieri Istituto Nazionale di Geofisica e Vulcanologia, Sezione di Palermo — V. Ugo La Malfa, 153‐90146 Palermo, Italy abstract article info Article history: Received 21 June 2011 Received in revised form 16 July 2012 Accepted 27 August 2012 Available online 1 September 2012 Editor: B. Sherwood Lollar Keywords: Soil CO 2 flux Mt Etna Volcanic activity Magma transfer In this paper, we report four years of soil CO 2 emission data measured monthly at 130 sites in two peripheral areas of Mt Etna Volcano that are well known for their high discharge rates of volcanic gas. We remove the influence of atmospheric parameters, and by means of statistical analyses, we (i) demonstrate that variations in CO 2 emissions are due mainly to CO 2 of a deep origin and (ii) quantify the total amounts of CO 2 derived from a deep magma source. Periods of anomalous deep degassing are identified in both areas. A comparison of the timing of these anomalies and geophysical data indicates that the periods of anomalous degassing can be mostly ascribed to intrusions of fresh magma into the Etna plumbing system, which is in agreement with many previous works. Based on the existing literature, we formulate an interpretative framework of magma migration within the plumbing system, consistent with temporal trends in the observed anomalies. Finally, we reconstruct the processes of recent magma ascent at Mt Etna based on our interpretative framework, published geophysical data, and records of volcanic activity. © 2012 Elsevier B.V. All rights reserved. 1. Introduction Mt Etna is the largest active volcano in Europe, with a total surface area of 1200 km 2 . It is 3300 m high and is characterised by intense CO 2 emissions from the summit craters, along its flanks (Allard et al., 1991; Gerlach, 1991) and along active structures (D'Alessandro et al., 1997a; Giammanco et al., 1997, 2010; Aiuppa et al., 2004). After water, CO 2 is the most abundant volatile species in Mt Etna basalts (Kamenetsky et al., 2007), as well as one of the less-soluble species (Papale, 1999). Therefore, CO 2 is one of the first gases released during magma ascent toward the surface, which results in wide vari- ations in measured surface emissions. Periodic soil CO 2 flux measure- ments have been performed since 1987 on the southwestern flank (Paternò area, PT) and on the eastern flank (Zafferana Etnea–Santa Venerina area, ZV) of the volcano (Giammanco et al., 1995; Giammanco and Bonfanti, 2009; Federico et al., 2011) with the pur- pose of monitoring volcanic activity (Fig. 1). Temporal variations in the soil CO 2 flux measured in these areas are closely related to the magma dynamics of Mt Etna and its eastern flank (Giammanco et al., 1995; Giammanco and Bonfanti, 2009; Federico et al., 2011). The CO 2 fluxes measured in the PT and ZV areas were the highest before the 1991–1993 eruption (Giammanco et al., 1995; Federico et al., 2011), which produced the largest volume of lava at Mt Etna in the last three centuries (Barberi et al., 1993). This suggests that the size and duration of soil CO 2 flux anomalies could provide quantitative in- formation about the mass of ascending magma. We present and discuss the results of 58 measurement campaigns of soil CO 2 flux in the PT and ZV areas between January 2005 and March 2010. Statistical analyses were performed to isolate the supply of CO 2 derived from a deep source in the two areas. The fluxes of deep-sourced CO 2 were multiplied by the actual surface area of emis- sions to obtain a temporal trend of the amount of deep-sourced CO 2 emitted (t d −1 ). Different threshold values for deep degassing were used for each area to identify periods of anomalous magmatic degassing from background degassing. Based the existing literature, we formulated an interpretative framework of magma migration within the plumbing system, which yields a good fit with temporal trends in the observed anomalies. By integrating the peaks above the thresholds, we computed the total amounts of CO 2 released during these periods. According to Henry's law, the volumes of CO 2 are associ- ated with the relative masses of ascending magma bodies. In light of the interpretative framework, the anomalies in each area were combined with geophysical data and the timing of eruptive activity at Mt Etna to reconstruct the magma dynamics during the four-year study period. 2. Site description The measurement points are distributed roughly evenly within the surveyed areas, and they are defined by a measurement grid with a mean spacing of 600 m. In the PT area (southwestern sector), the grid consists of 67 points surrounding the town of Paternò, which Chemical Geology 330–331 (2012) 218–227 ⁎ Corresponding author. Fax: +39 0916809449. E-mail address: [email protected] (M. Camarda). 0009-2541/$ – see front matter © 2012 Elsevier B.V. All rights reserved. http://dx.doi.org/10.1016/j.chemgeo.2012.08.024 Contents lists available at SciVerse ScienceDirect Chemical Geology journal homepage: www.elsevier.com/locate/chemgeo

Welcome message from author
This document is posted to help you gain knowledge. Please leave a comment to let me know what you think about it! Share it to your friends and learn new things together.
Transcript
Chemical Geology 330–331 (2012) 218–227
Contents lists available at SciVerse ScienceDirect
Chemical Geology
j ourna l homepage: www.e lsev ie r .com/ locate /chemgeo
Magma-ascent processes during 2005–2009 at Mt Etna inferred by soil CO2 emissionsin peripheral areas of the volcano
Marco Camarda ⁎, Sofia De Gregorio, Sergio GurrieriIstituto Nazionale di Geofisica e Vulcanologia, Sezione di Palermo — V. Ugo La Malfa, 153‐90146 Palermo, Italy
⁎ Corresponding author. Fax: +39 0916809449.E-mail address: [email protected] (M. Camarda)
0009-2541/$ – see front matter © 2012 Elsevier B.V. Allhttp://dx.doi.org/10.1016/j.chemgeo.2012.08.024
a b s t r a c t
a r t i c l e i n f oArticle history:Received 21 June 2011Received in revised form 16 July 2012Accepted 27 August 2012Available online 1 September 2012
Editor: B. Sherwood Lollar
Keywords:Soil CO2 fluxMt EtnaVolcanic activityMagma transfer
In this paper, we report four years of soil CO2 emission data measured monthly at 130 sites in two peripheralareas of Mt Etna Volcano that are well known for their high discharge rates of volcanic gas. We remove theinfluence of atmospheric parameters, and by means of statistical analyses, we (i) demonstrate that variationsin CO2 emissions are due mainly to CO2 of a deep origin and (ii) quantify the total amounts of CO2 derivedfrom a deep magma source. Periods of anomalous deep degassing are identified in both areas. A comparisonof the timing of these anomalies and geophysical data indicates that the periods of anomalous degassing canbe mostly ascribed to intrusions of fresh magma into the Etna plumbing system, which is in agreement withmany previous works. Based on the existing literature, we formulate an interpretative framework of magmamigration within the plumbing system, consistent with temporal trends in the observed anomalies. Finally,we reconstruct the processes of recent magma ascent at Mt Etna based on our interpretative framework,published geophysical data, and records of volcanic activity.
© 2012 Elsevier B.V. All rights reserved.
1. Introduction
Mt Etna is the largest active volcano in Europe, with a total surfacearea of 1200 km2. It is 3300 m high and is characterised by intenseCO2 emissions from the summit craters, along its flanks (Allard etal., 1991; Gerlach, 1991) and along active structures (D'Alessandroet al., 1997a; Giammanco et al., 1997, 2010; Aiuppa et al., 2004).After water, CO2 is the most abundant volatile species in Mt Etnabasalts (Kamenetsky et al., 2007), as well as one of the less-solublespecies (Papale, 1999). Therefore, CO2 is one of the first gases releasedduring magma ascent toward the surface, which results in wide vari-ations in measured surface emissions. Periodic soil CO2 flux measure-ments have been performed since 1987 on the southwestern flank(Paternò area, PT) and on the eastern flank (Zafferana Etnea–SantaVenerina area, ZV) of the volcano (Giammanco et al., 1995;Giammanco and Bonfanti, 2009; Federico et al., 2011) with the pur-pose of monitoring volcanic activity (Fig. 1). Temporal variations inthe soil CO2 flux measured in these areas are closely related to themagma dynamics of Mt Etna and its eastern flank (Giammanco etal., 1995; Giammanco and Bonfanti, 2009; Federico et al., 2011). TheCO2 fluxes measured in the PT and ZV areas were the highest beforethe 1991–1993 eruption (Giammanco et al., 1995; Federico et al.,2011), which produced the largest volume of lava at Mt Etna in thelast three centuries (Barberi et al., 1993). This suggests that the size
.
rights reserved.
and duration of soil CO2 flux anomalies could provide quantitative in-formation about the mass of ascending magma.
We present and discuss the results of 58 measurement campaignsof soil CO2 flux in the PT and ZV areas between January 2005 andMarch 2010. Statistical analyses were performed to isolate the supplyof CO2 derived from a deep source in the two areas. The fluxes ofdeep-sourced CO2 were multiplied by the actual surface area of emis-sions to obtain a temporal trend of the amount of deep-sourced CO2
emitted (t d−1). Different threshold values for deep degassing wereused for each area to identify periods of anomalous magmaticdegassing from background degassing. Based the existing literature,we formulated an interpretative framework of magma migrationwithin the plumbing system, which yields a good fit with temporaltrends in the observed anomalies. By integrating the peaks abovethe thresholds, we computed the total amounts of CO2 released duringthese periods. According to Henry's law, the volumes of CO2 are associ-ated with the relative masses of ascending magma bodies.
In light of the interpretative framework, the anomalies in eacharea were combined with geophysical data and the timing of eruptiveactivity at Mt Etna to reconstruct the magma dynamics during thefour-year study period.
2. Site description
The measurement points are distributed roughly evenly withinthe surveyed areas, and they are defined by a measurement gridwith a mean spacing of 600 m. In the PT area (southwestern sector),the grid consists of 67 points surrounding the town of Paternò, which
1000
500
1500
2500
CATANIA
S. M. Licodia
S. Alfio
Giarre
Bronte
Linguaglossa
Randazzo
10 km
Paternò
Zafferana
Pernicana fault
VDB
SicilyMt. Etna
Tyrrenian sea
Catania
N
10km
W E
N
S
PT
ZV
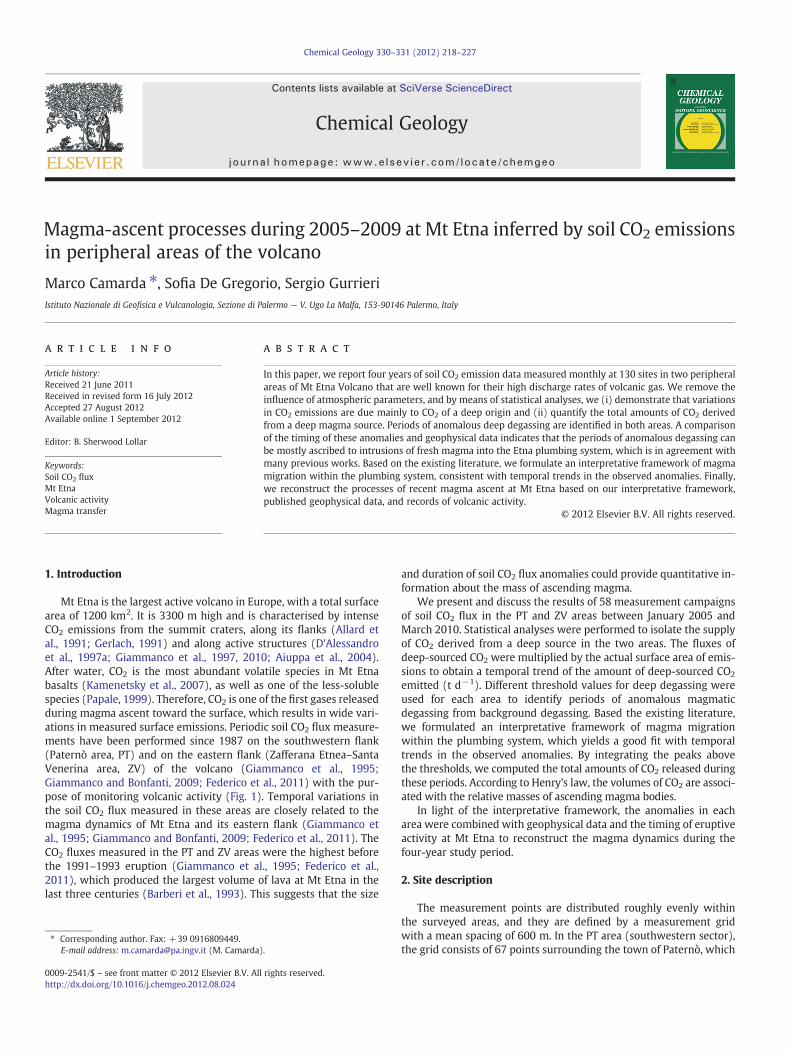
Fig. 1. Map of Mt Etna showing the monitored areas (red boxes). PT: Paternò area; ZV: Zafferana Etnea–Santa Venerina area; VDB: Valle del Bove.
219M. Camarda et al. / Chemical Geology 330–331 (2012) 218–227
is 23 km from the central craters of the volcano (Fig. 1). This area ischaracterised by contacts between outcrops of sedimentary forma-tions and volcanic lava of the Mongibello Antico and Recente Units(Romano et al., 1979). Three mud volcanoes in this area dischargelarge amounts of gases with high CO2 contents (D'Alessandro et al.,1995; Chiodini et al., 1996).
The ZV area (eastern flank) contains a grid of 63 measurementpoints surrounding the towns of Santa Venerina and ZafferanaEtnea, which are 15 km from the central craters (Fig. 1). Volcanic ter-rains of the Mongibello Recente Unit that outcrop in this area are af-fected by north–northwest to south–southeast normal faults (Neri etal., 1991; Borgia et al., 1992; Rasà et al., 1995). Because the CO2 fluxescan exhibit extreme spatial variations, the locations of flux measure-ments must remain constant over time (Diliberto et al., 2002).
3. Method
The soil CO2 flux was measured at each point using the dynamicconcentration method (Gurrieri and Valenza, 1988; Camarda et al.,2006). This method consists of measuring the CO2 concentration ina mixture of air and soil gas that has been generated in a speciallydesigned probe, inserted into the soil at a depth of 50 cm. The gasmixture was obtained by producing a very small negative pressurein the probe using a pump at a constant flux. The mixture was subse-quently analysed using an IR spectrophotometer. After a given time ofpumping (generally less than 1 min), the gas mixture reached a con-stant CO2 concentration, known as the dynamic concentration (Cd),which is proportional to the soil CO2 flux. The relationship used to cal-culate the CO2 flux from dynamic concentration values was obtained
in the laboratory by making several measurements of Cd in a soil layerthat was fed by known constant CO2 fluxes (Camarda et al., 2006).Several tests were carried out using soils with different gas perme-abilities and porosities to evaluate the influence of soil permeabilityon soil CO2 flux measurements. The results revealed that the errorproduced by neglecting soil permeability in the flux calculation isless than 5% for soils with gas permeabilities between 0.36 and123 darcy (Camarda et al., 2006).
4. Results and discussion
4.1. Effect of meteorological parameters and data filtering
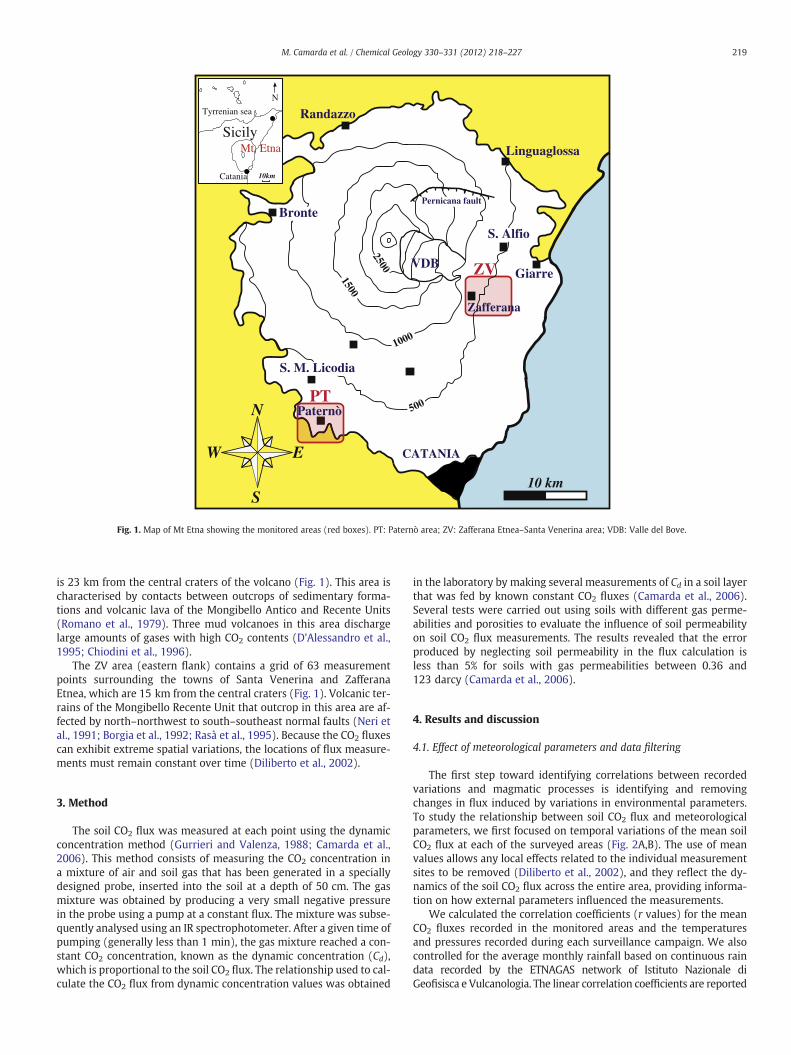
The first step toward identifying correlations between recordedvariations and magmatic processes is identifying and removingchanges in flux induced by variations in environmental parameters.To study the relationship between soil CO2 flux and meteorologicalparameters, we first focused on temporal variations of the mean soilCO2 flux at each of the surveyed areas (Fig. 2A,B). The use of meanvalues allows any local effects related to the individual measurementsites to be removed (Diliberto et al., 2002), and they reflect the dy-namics of the soil CO2 flux across the entire area, providing informa-tion on how external parameters influenced the measurements.
We calculated the correlation coefficients (r values) for the meanCO2 fluxes recorded in the monitored areas and the temperaturesand pressures recorded during each surveillance campaign. We alsocontrolled for the average monthly rainfall based on continuous raindata recorded by the ETNAGAS network of Istituto Nazionale diGeofisisca e Vulcanologia. The linear correlation coefficients are reported
Raw data
Filtered data
Raw data
Filtered data
PT area
ZV areaB
A
Fig. 2. Temporal variation of the average soil CO2 flux measured between January 2005and March 2010 in (A) the PT area and (B) the ZV area. Data that are corrected for airtemperature are indicated by filled circles; raw data are indicated by open circles. Thegeneral trend remains virtually constant even though the minimum flux increasesduring cold periods.
220 M. Camarda et al. / Chemical Geology 330–331 (2012) 218–227
in Table 1. There was a significant correlation between CO2 flux and airtemperature, with moderate correlations with rainfall only for the PTarea. Very weak correlations were found with atmospheric pressure.The effect of air temperature on soil CO2 flux differs between the sitesdue to their specific characteristics, such as porosity, gas permeability,and modality of gas transport (advective or diffusive). This results in ahighly variable correlation between the soil CO2 flux and air temperatureamong different sites. Each site has a different contribution to the aver-age areal CO2 flux depending on the actual soil CO2 flux. Therefore,each point in the data series must be corrected for variations in soilCO2 flux due to changes in the atmospheric temperature. Based on thecorrelation matrix for soil CO2 flux and atmospheric temperature at allsites, we selected the points displayingmoderate and strong correlationswith air temperature (r>0.3). Removing the influence of air tempera-ture on CO2 concentration data requires knowledge of how the soil CO2
flux varies in response to a given air temperature change for eachpoint. These relations are given by the equations of the best-fittingstraight lines for the correlation diagrams between soil CO2 flux and air
Table 1Correlation coefficients among mean soil CO2 flux data and the available meteorologi-cal parameters.
T/CO2 flux P/CO2 flux Rain/CO2 flux
r (PT) 0.73 0.17 0.28r (ZV) 0.51 0.30 0.10
temperature. We used these equations to compute the soil CO2 flux cor-responding to the measured values of air temperature (φCO2(t)) for eachpoint during each campaign. The computed values of φCO2(t) were usedto obtain CO2 fluxes that are corrected for air temperature (φCO2(corr))according to the following expression:
φCO2 corrð Þ� �
¼ φCO2 measð Þ� �
– φCO2 tð Þ� �
þ φCO2 meanð Þ� �
ð1Þ
where φCO2(meas) is the measured CO2 flux and φCO2(mean) is the meantemporal value of the CO2 flux at single measurement points. This lastterm was added to make filtered values comparable with unfilteredones. Accordingly, when computing the filtered mean values of soilCO2 flux, we used the new corrected values of φCO2(corr) for all pointswith r>0.3.
The results of this filtering process are illustrated in Fig. 2, whichshows that although CO2 flux generally decreased during the sum-mer, the highest transients in soil CO2 flux remain after data filtering.
4.2. Origins of CO2
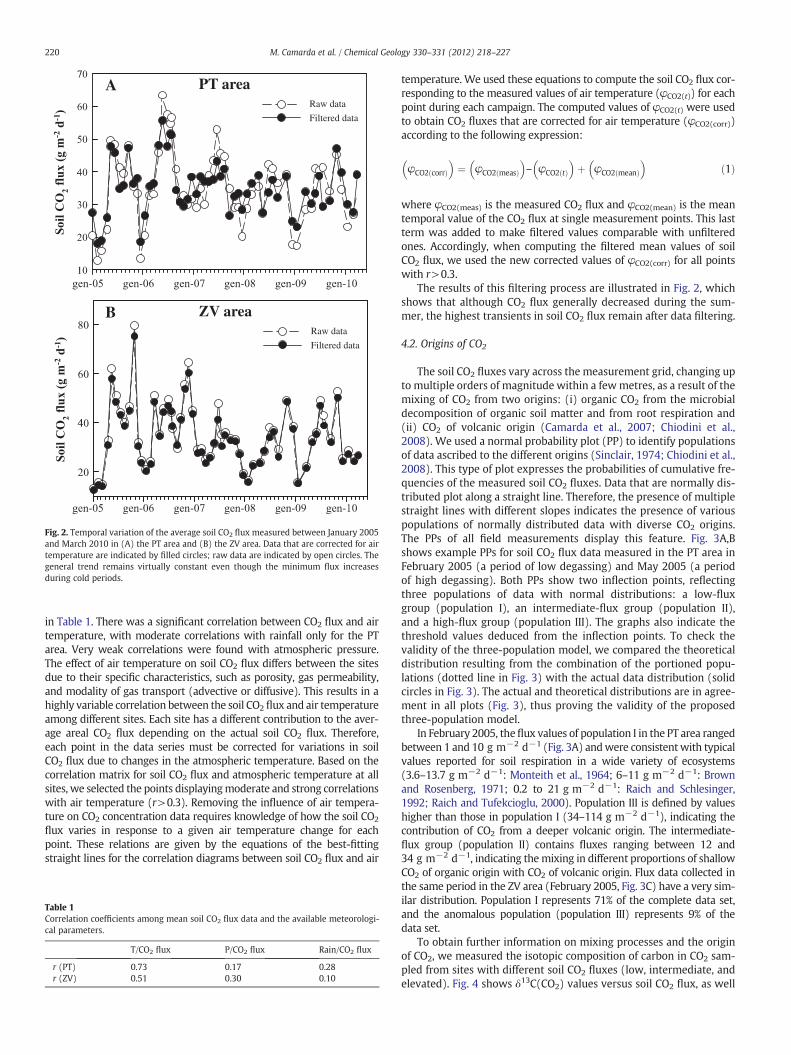
The soil CO2 fluxes vary across the measurement grid, changing upto multiple orders of magnitude within a fewmetres, as a result of themixing of CO2 from two origins: (i) organic CO2 from the microbialdecomposition of organic soil matter and from root respiration and(ii) CO2 of volcanic origin (Camarda et al., 2007; Chiodini et al.,2008). We used a normal probability plot (PP) to identify populationsof data ascribed to the different origins (Sinclair, 1974; Chiodini et al.,2008). This type of plot expresses the probabilities of cumulative fre-quencies of the measured soil CO2 fluxes. Data that are normally dis-tributed plot along a straight line. Therefore, the presence of multiplestraight lines with different slopes indicates the presence of variouspopulations of normally distributed data with diverse CO2 origins.The PPs of all field measurements display this feature. Fig. 3A,Bshows example PPs for soil CO2 flux data measured in the PT area inFebruary 2005 (a period of low degassing) and May 2005 (a periodof high degassing). Both PPs show two inflection points, reflectingthree populations of data with normal distributions: a low-fluxgroup (population I), an intermediate-flux group (population II),and a high-flux group (population III). The graphs also indicate thethreshold values deduced from the inflection points. To check thevalidity of the three-population model, we compared the theoreticaldistribution resulting from the combination of the portioned popu-lations (dotted line in Fig. 3) with the actual data distribution (solidcircles in Fig. 3). The actual and theoretical distributions are in agree-ment in all plots (Fig. 3), thus proving the validity of the proposedthree-population model.
In February 2005, theflux values of population I in the PT area rangedbetween 1 and 10 g m−2 d−1 (Fig. 3A) andwere consistentwith typicalvalues reported for soil respiration in a wide variety of ecosystems(3.6–13.7 g m−2 d−1: Monteith et al., 1964; 6–11 g m−2 d−1: Brownand Rosenberg, 1971; 0.2 to 21 g m−2 d−1: Raich and Schlesinger,1992; Raich and Tufekcioglu, 2000). Population III is defined by valueshigher than those in population I (34–114 g m−2 d−1), indicating thecontribution of CO2 from a deeper volcanic origin. The intermediate-flux group (population II) contains fluxes ranging between 12 and34 g m−2 d−1, indicating themixing in different proportions of shallowCO2 of organic origin with CO2 of volcanic origin. Flux data collected inthe same period in the ZV area (February 2005, Fig. 3C) have a very sim-ilar distribution. Population I represents 71% of the complete data set,and the anomalous population (population III) represents 9% of thedata set.
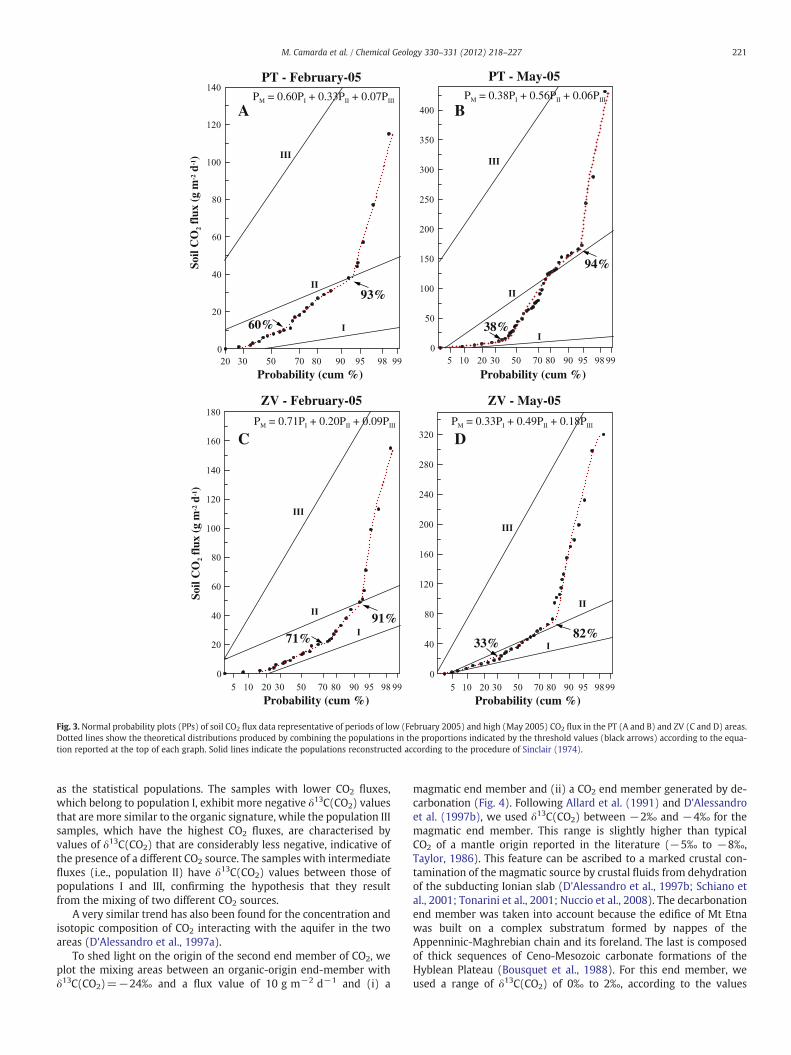
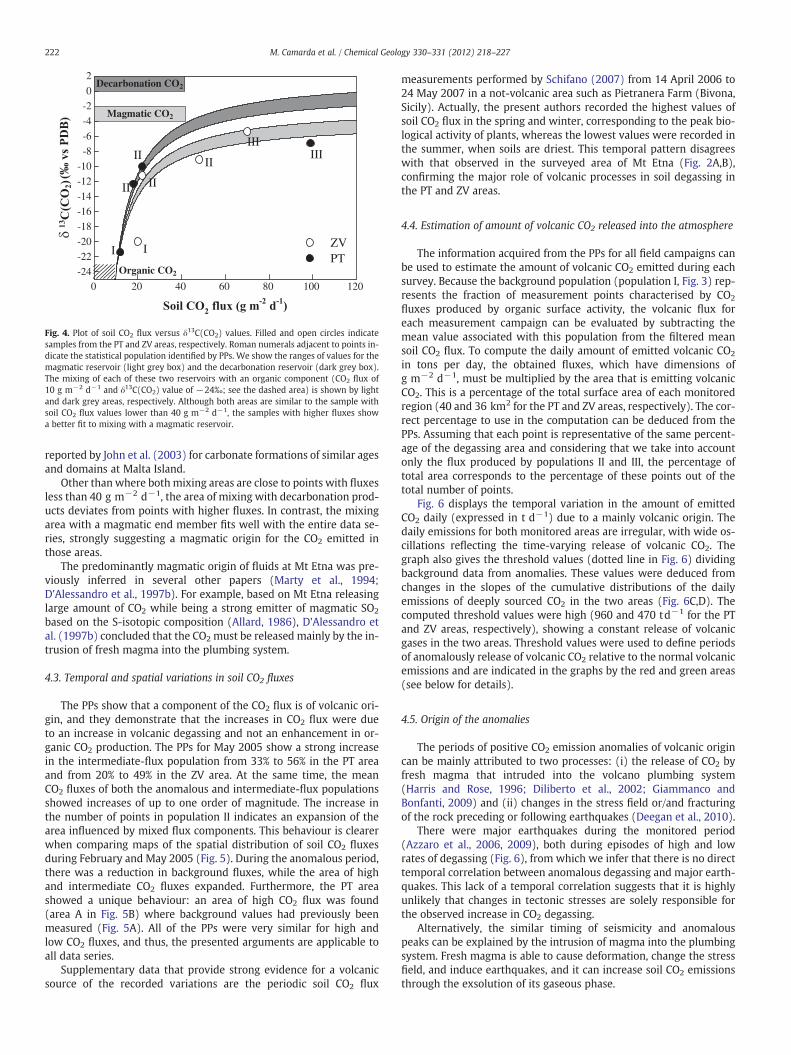
To obtain further information on mixing processes and the originof CO2, we measured the isotopic composition of carbon in CO2 sam-pled from sites with different soil CO2 fluxes (low, intermediate, andelevated). Fig. 4 shows δ13C(CO2) values versus soil CO2 flux, as well
PT - May-05PT - February-05
ZV - February-05 ZV - May-05
PM = 0.60PI + 0.33PII + 0.07PIII
PM = 0.71PI + 0.20PII + 0.09PIII
PM = 0.38PI + 0.56PII + 0.06PIII
A B
C D
Probability (cum %)
Soil
CO
2 flu
x (g
m-2 d
-1)
Soil
CO
2 flu
x (g
m-2 d
-1)
Probability (cum %)
Probability (cum %)
Probability (cum %)
PM = 0.33PI + 0.49PII + 0.18PIII
93%
60% 38%
94%
82%33%71%
91%
Fig. 3. Normal probability plots (PPs) of soil CO2 flux data representative of periods of low (February 2005) and high (May 2005) CO2 flux in the PT (A and B) and ZV (C and D) areas.Dotted lines show the theoretical distributions produced by combining the populations in the proportions indicated by the threshold values (black arrows) according to the equa-tion reported at the top of each graph. Solid lines indicate the populations reconstructed according to the procedure of Sinclair (1974).
221M. Camarda et al. / Chemical Geology 330–331 (2012) 218–227
as the statistical populations. The samples with lower CO2 fluxes,which belong to population I, exhibit more negative δ13C(CO2) valuesthat are more similar to the organic signature, while the population IIIsamples, which have the highest CO2 fluxes, are characterised byvalues of δ13C(CO2) that are considerably less negative, indicative ofthe presence of a different CO2 source. The samples with intermediatefluxes (i.e., population II) have δ13C(CO2) values between those ofpopulations I and III, confirming the hypothesis that they resultfrom the mixing of two different CO2 sources.
A very similar trend has also been found for the concentration andisotopic composition of CO2 interacting with the aquifer in the twoareas (D'Alessandro et al., 1997a).
To shed light on the origin of the second end member of CO2, weplot the mixing areas between an organic-origin end-member withδ13C(CO2)=−24‰ and a flux value of 10 g m−2 d−1 and (i) a
magmatic end member and (ii) a CO2 end member generated by de-carbonation (Fig. 4). Following Allard et al. (1991) and D'Alessandroet al. (1997b), we used δ13C(CO2) between −2‰ and −4‰ for themagmatic end member. This range is slightly higher than typicalCO2 of a mantle origin reported in the literature (−5‰ to −8‰,Taylor, 1986). This feature can be ascribed to a marked crustal con-tamination of the magmatic source by crustal fluids from dehydrationof the subducting Ionian slab (D'Alessandro et al., 1997b; Schiano etal., 2001; Tonarini et al., 2001; Nuccio et al., 2008). The decarbonationend member was taken into account because the edifice of Mt Etnawas built on a complex substratum formed by nappes of theAppenninic-Maghrebian chain and its foreland. The last is composedof thick sequences of Ceno-Mesozoic carbonate formations of theHyblean Plateau (Bousquet et al., 1988). For this end member, weused a range of δ13C(CO2) of 0‰ to 2‰, according to the values
0 20 40 60 80 100 120-24
-22
-20
-18
-16
-14
-12
-10
-8
-6
-4
-2
0
2
ZVPT
I
II
II
IIIIIIII
II
I
Organic CO2
Magmatic CO2
Decarbonation CO2
Fig. 4. Plot of soil CO2 flux versus δ13C(CO2) values. Filled and open circles indicatesamples from the PT and ZV areas, respectively. Roman numerals adjacent to points in-dicate the statistical population identified by PPs. We show the ranges of values for themagmatic reservoir (light grey box) and the decarbonation reservoir (dark grey box).The mixing of each of these two reservoirs with an organic component (CO2 flux of10 g m−2 d−1 and δ13C(CO2) value of −24‰; see the dashed area) is shown by lightand dark grey areas, respectively. Although both areas are similar to the sample withsoil CO2 flux values lower than 40 g m−2 d−1, the samples with higher fluxes showa better fit to mixing with a magmatic reservoir.
222 M. Camarda et al. / Chemical Geology 330–331 (2012) 218–227
reported by John et al. (2003) for carbonate formations of similar agesand domains at Malta Island.
Other than where bothmixing areas are close to points with fluxesless than 40 g m−2 d−1, the area of mixing with decarbonation prod-ucts deviates from points with higher fluxes. In contrast, the mixingarea with a magmatic end member fits well with the entire data se-ries, strongly suggesting a magmatic origin for the CO2 emitted inthose areas.
The predominantly magmatic origin of fluids at Mt Etna was pre-viously inferred in several other papers (Marty et al., 1994;D'Alessandro et al., 1997b). For example, based on Mt Etna releasinglarge amount of CO2 while being a strong emitter of magmatic SO2
based on the S-isotopic composition (Allard, 1986), D'Alessandro etal. (1997b) concluded that the CO2 must be released mainly by the in-trusion of fresh magma into the plumbing system.
4.3. Temporal and spatial variations in soil CO2 fluxes
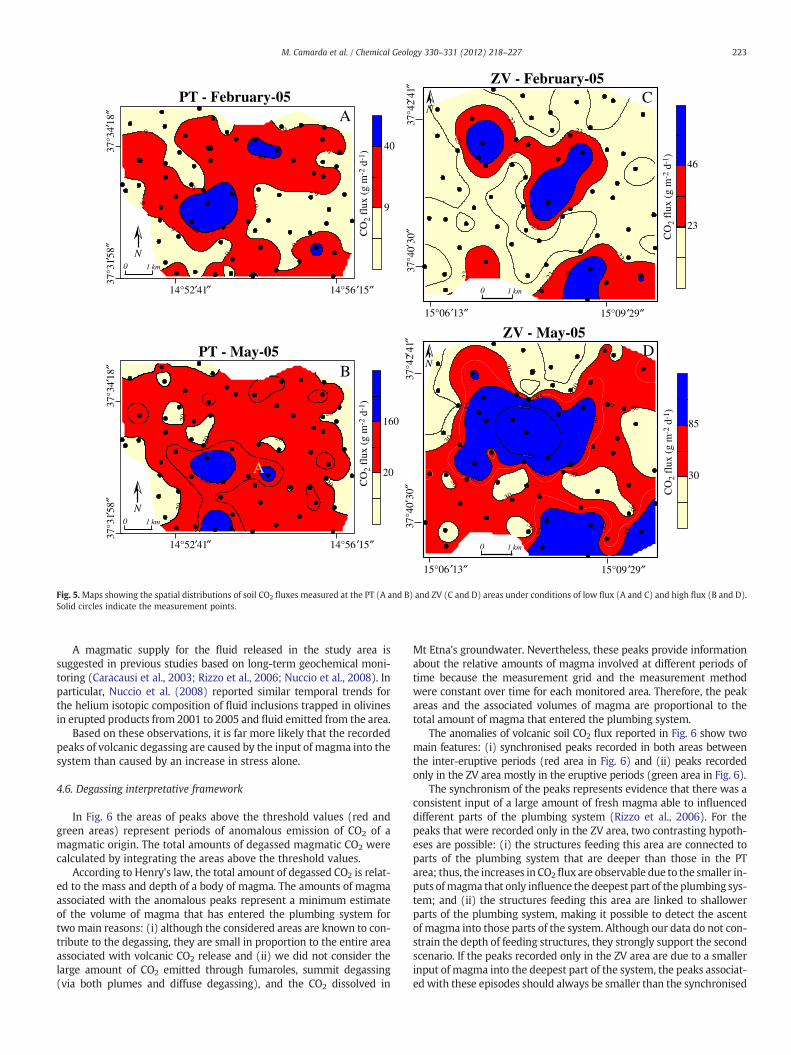
The PPs show that a component of the CO2 flux is of volcanic ori-gin, and they demonstrate that the increases in CO2 flux were dueto an increase in volcanic degassing and not an enhancement in or-ganic CO2 production. The PPs for May 2005 show a strong increasein the intermediate-flux population from 33% to 56% in the PT areaand from 20% to 49% in the ZV area. At the same time, the meanCO2 fluxes of both the anomalous and intermediate-flux populationsshowed increases of up to one order of magnitude. The increase inthe number of points in population II indicates an expansion of thearea influenced by mixed flux components. This behaviour is clearerwhen comparing maps of the spatial distribution of soil CO2 fluxesduring February and May 2005 (Fig. 5). During the anomalous period,there was a reduction in background fluxes, while the area of highand intermediate CO2 fluxes expanded. Furthermore, the PT areashowed a unique behaviour: an area of high CO2 flux was found(area A in Fig. 5B) where background values had previously beenmeasured (Fig. 5A). All of the PPs were very similar for high andlow CO2 fluxes, and thus, the presented arguments are applicable toall data series.
Supplementary data that provide strong evidence for a volcanicsource of the recorded variations are the periodic soil CO2 flux
measurements performed by Schifano (2007) from 14 April 2006 to24 May 2007 in a not-volcanic area such as Pietranera Farm (Bivona,Sicily). Actually, the present authors recorded the highest values ofsoil CO2 flux in the spring and winter, corresponding to the peak bio-logical activity of plants, whereas the lowest values were recorded inthe summer, when soils are driest. This temporal pattern disagreeswith that observed in the surveyed area of Mt Etna (Fig. 2A,B),confirming the major role of volcanic processes in soil degassing inthe PT and ZV areas.
4.4. Estimation of amount of volcanic CO2 released into the atmosphere
The information acquired from the PPs for all field campaigns canbe used to estimate the amount of volcanic CO2 emitted during eachsurvey. Because the background population (population I, Fig. 3) rep-resents the fraction of measurement points characterised by CO2
fluxes produced by organic surface activity, the volcanic flux foreach measurement campaign can be evaluated by subtracting themean value associated with this population from the filtered meansoil CO2 flux. To compute the daily amount of emitted volcanic CO2
in tons per day, the obtained fluxes, which have dimensions ofg m−2 d−1, must be multiplied by the area that is emitting volcanicCO2. This is a percentage of the total surface area of each monitoredregion (40 and 36 km2 for the PT and ZV areas, respectively). The cor-rect percentage to use in the computation can be deduced from thePPs. Assuming that each point is representative of the same percent-age of the degassing area and considering that we take into accountonly the flux produced by populations II and III, the percentage oftotal area corresponds to the percentage of these points out of thetotal number of points.
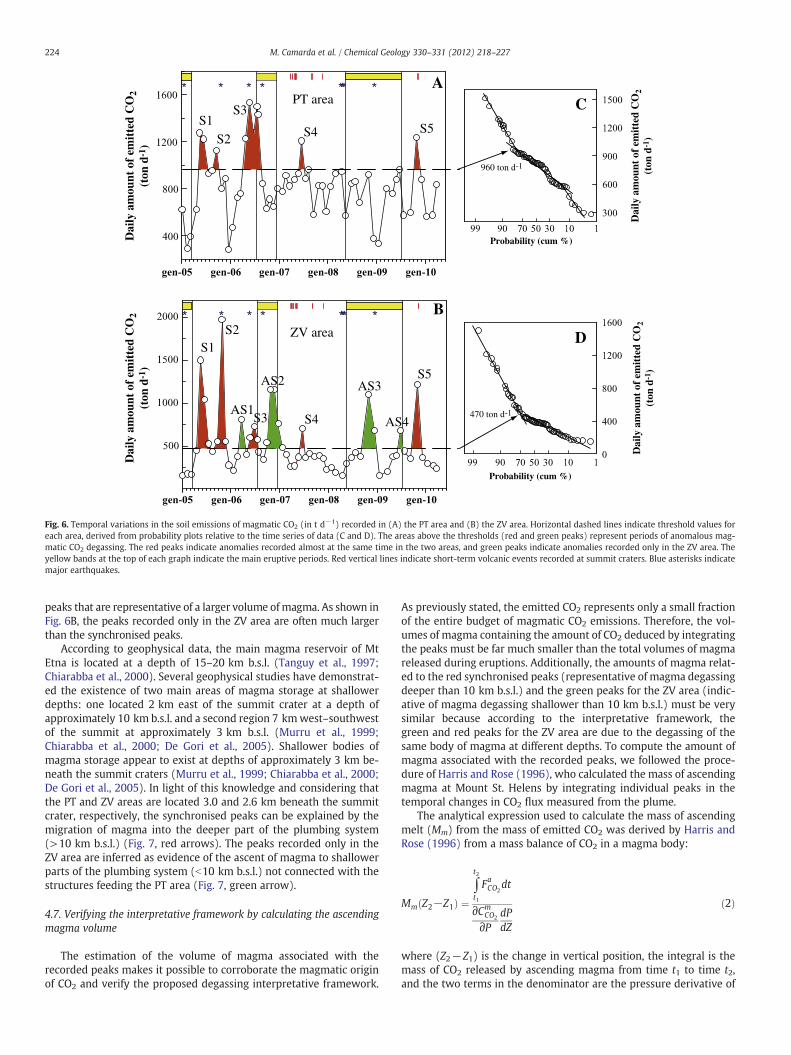
Fig. 6 displays the temporal variation in the amount of emittedCO2 daily (expressed in t d−1) due to a mainly volcanic origin. Thedaily emissions for both monitored areas are irregular, with wide os-cillations reflecting the time-varying release of volcanic CO2. Thegraph also gives the threshold values (dotted line in Fig. 6) dividingbackground data from anomalies. These values were deduced fromchanges in the slopes of the cumulative distributions of the dailyemissions of deeply sourced CO2 in the two areas (Fig. 6C,D). Thecomputed threshold values were high (960 and 470 td−1 for the PTand ZV areas, respectively), showing a constant release of volcanicgases in the two areas. Threshold values were used to define periodsof anomalously release of volcanic CO2 relative to the normal volcanicemissions and are indicated in the graphs by the red and green areas(see below for details).
4.5. Origin of the anomalies
The periods of positive CO2 emission anomalies of volcanic origincan be mainly attributed to two processes: (i) the release of CO2 byfresh magma that intruded into the volcano plumbing system(Harris and Rose, 1996; Diliberto et al., 2002; Giammanco andBonfanti, 2009) and (ii) changes in the stress field or/and fracturingof the rock preceding or following earthquakes (Deegan et al., 2010).
There were major earthquakes during the monitored period(Azzaro et al., 2006, 2009), both during episodes of high and lowrates of degassing (Fig. 6), from which we infer that there is no directtemporal correlation between anomalous degassing and major earth-quakes. This lack of a temporal correlation suggests that it is highlyunlikely that changes in tectonic stresses are solely responsible forthe observed increase in CO2 degassing.
Alternatively, the similar timing of seismicity and anomalouspeaks can be explained by the intrusion of magma into the plumbingsystem. Fresh magma is able to cause deformation, change the stressfield, and induce earthquakes, and it can increase soil CO2 emissionsthrough the exsolution of its gaseous phase.
9
9
9
9
9
99
9
9
9
40
40
9
40
PT - February-0537
°31′5
8″37
°34′
18″
14°52′41″ 14°56 ′15″
N0 1 km
20
20
20
2020
20
16020
160
PT - May-05
37°3
1′58″
37°3
4′18
″
14°52′41″ 14°56 ′15″
N0 1 km
23 23
23
23
23
23
23
23
46
46
46
46
23
46
ZV - February-05
15°06 ′13″ 15°09 ′29″
37°4
2′41
″37
°40′
30″
N
0 1 km
ZV - May-05
15°06 ′13″ 15°09 ′29″
37°4
2′41
″37
°40′
30″
N
0 1 km
30
30
30
30
30
30
30
30
30
8585
85
85
85
85
85
85
350
350
30
85
A
A
B
C
DC
O2
flux
(g
m-2
d-1
)C
O2
flux
(g
m-2
d-1
)
CO
2 fl
ux (
g m
-2 d
-1)
CO
2 fl
ux (
g m
-2 d
-1)
Fig. 5.Maps showing the spatial distributions of soil CO2 fluxes measured at the PT (A and B) and ZV (C and D) areas under conditions of low flux (A and C) and high flux (B and D).Solid circles indicate the measurement points.
223M. Camarda et al. / Chemical Geology 330–331 (2012) 218–227
A magmatic supply for the fluid released in the study area issuggested in previous studies based on long-term geochemical moni-toring (Caracausi et al., 2003; Rizzo et al., 2006; Nuccio et al., 2008). Inparticular, Nuccio et al. (2008) reported similar temporal trends forthe helium isotopic composition of fluid inclusions trapped in olivinesin erupted products from 2001 to 2005 and fluid emitted from the area.
Based on these observations, it is far more likely that the recordedpeaks of volcanic degassing are caused by the input of magma into thesystem than caused by an increase in stress alone.
4.6. Degassing interpretative framework
In Fig. 6 the areas of peaks above the threshold values (red andgreen areas) represent periods of anomalous emission of CO2 of amagmatic origin. The total amounts of degassed magmatic CO2 werecalculated by integrating the areas above the threshold values.
According to Henry's law, the total amount of degassed CO2 is relat-ed to the mass and depth of a body of magma. The amounts of magmaassociated with the anomalous peaks represent a minimum estimateof the volume of magma that has entered the plumbing system fortwomain reasons: (i) although the considered areas are known to con-tribute to the degassing, they are small in proportion to the entire areaassociated with volcanic CO2 release and (ii) we did not consider thelarge amount of CO2 emitted through fumaroles, summit degassing(via both plumes and diffuse degassing), and the CO2 dissolved in
Mt Etna's groundwater. Nevertheless, these peaks provide informationabout the relative amounts of magma involved at different periods oftime because the measurement grid and the measurement methodwere constant over time for each monitored area. Therefore, the peakareas and the associated volumes of magma are proportional to thetotal amount of magma that entered the plumbing system.
The anomalies of volcanic soil CO2 flux reported in Fig. 6 show twomain features: (i) synchronised peaks recorded in both areas betweenthe inter-eruptive periods (red area in Fig. 6) and (ii) peaks recordedonly in the ZV area mostly in the eruptive periods (green area in Fig. 6).
The synchronism of the peaks represents evidence that there was aconsistent input of a large amount of fresh magma able to influenceddifferent parts of the plumbing system (Rizzo et al., 2006). For thepeaks that were recorded only in the ZV area, two contrasting hypoth-eses are possible: (i) the structures feeding this area are connected toparts of the plumbing system that are deeper than those in the PTarea; thus, the increases in CO2flux are observable due to the smaller in-puts ofmagma that only influence the deepest part of the plumbing sys-tem; and (ii) the structures feeding this area are linked to shallowerparts of the plumbing system, making it possible to detect the ascentof magma into those parts of the system. Although our data do not con-strain the depth of feeding structures, they strongly support the secondscenario. If the peaks recorded only in the ZV area are due to a smallerinput of magma into the deepest part of the system, the peaks associat-ed with these episodes should always be smaller than the synchronised
PT area
ZV area
S1
S2
S3
S4 S5
S1S2
AS1S3 S4
AS2 AS3
AS4
S5
960 ton d-1
470 ton d-1
Probability (cum %)
Probability (cum %)
A
B
C
D
Dai
ly a
mou
nt o
f em
itte
d C
O2
(ton
d-1
)D
aily
am
ount
of
emit
ted
CO
2(t
on d
-1)
Fig. 6. Temporal variations in the soil emissions of magmatic CO2 (in t d−1) recorded in (A) the PT area and (B) the ZV area. Horizontal dashed lines indicate threshold values foreach area, derived from probability plots relative to the time series of data (C and D). The areas above the thresholds (red and green peaks) represent periods of anomalous mag-matic CO2 degassing. The red peaks indicate anomalies recorded almost at the same time in the two areas, and green peaks indicate anomalies recorded only in the ZV area. Theyellow bands at the top of each graph indicate the main eruptive periods. Red vertical lines indicate short-term volcanic events recorded at summit craters. Blue asterisks indicatemajor earthquakes.
224 M. Camarda et al. / Chemical Geology 330–331 (2012) 218–227
peaks that are representative of a larger volume ofmagma. As shown inFig. 6B, the peaks recorded only in the ZV area are often much largerthan the synchronised peaks.
According to geophysical data, the main magma reservoir of MtEtna is located at a depth of 15–20 km b.s.l. (Tanguy et al., 1997;Chiarabba et al., 2000). Several geophysical studies have demonstrat-ed the existence of two main areas of magma storage at shallowerdepths: one located 2 km east of the summit crater at a depth ofapproximately 10 km b.s.l. and a second region 7 kmwest–southwestof the summit at approximately 3 km b.s.l. (Murru et al., 1999;Chiarabba et al., 2000; De Gori et al., 2005). Shallower bodies ofmagma storage appear to exist at depths of approximately 3 km be-neath the summit craters (Murru et al., 1999; Chiarabba et al., 2000;De Gori et al., 2005). In light of this knowledge and considering thatthe PT and ZV areas are located 3.0 and 2.6 km beneath the summitcrater, respectively, the synchronised peaks can be explained by themigration of magma into the deeper part of the plumbing system(>10 km b.s.l.) (Fig. 7, red arrows). The peaks recorded only in theZV area are inferred as evidence of the ascent of magma to shallowerparts of the plumbing system (b10 km b.s.l.) not connected with thestructures feeding the PT area (Fig. 7, green arrow).
4.7. Verifying the interpretative framework by calculating the ascendingmagma volume
The estimation of the volume of magma associated with therecorded peaks makes it possible to corroborate the magmatic originof CO2 and verify the proposed degassing interpretative framework.
As previously stated, the emitted CO2 represents only a small fractionof the entire budget of magmatic CO2 emissions. Therefore, the vol-umes of magma containing the amount of CO2 deduced by integratingthe peaks must be far much smaller than the total volumes of magmareleased during eruptions. Additionally, the amounts of magma relat-ed to the red synchronised peaks (representative of magma degassingdeeper than 10 km b.s.l.) and the green peaks for the ZV area (indic-ative of magma degassing shallower than 10 km b.s.l.) must be verysimilar because according to the interpretative framework, thegreen and red peaks for the ZV area are due to the degassing of thesame body of magma at different depths. To compute the amount ofmagma associated with the recorded peaks, we followed the proce-dure of Harris and Rose (1996), who calculated the mass of ascendingmagma at Mount St. Helens by integrating individual peaks in thetemporal changes in CO2 flux measured from the plume.
The analytical expression used to calculate the mass of ascendingmelt (Mm) from the mass of emitted CO2 was derived by Harris andRose (1996) from a mass balance of CO2 in a magma body:
Mm Z2−Z1ð Þ ¼∫t2
t1
FaCO2dt
∂CmCO2
∂PdPdZ
ð2Þ
where (Z2−Z1) is the change in vertical position, the integral is themass of CO2 released by ascending magma from time t1 to time t2,and the two terms in the denominator are the pressure derivative of
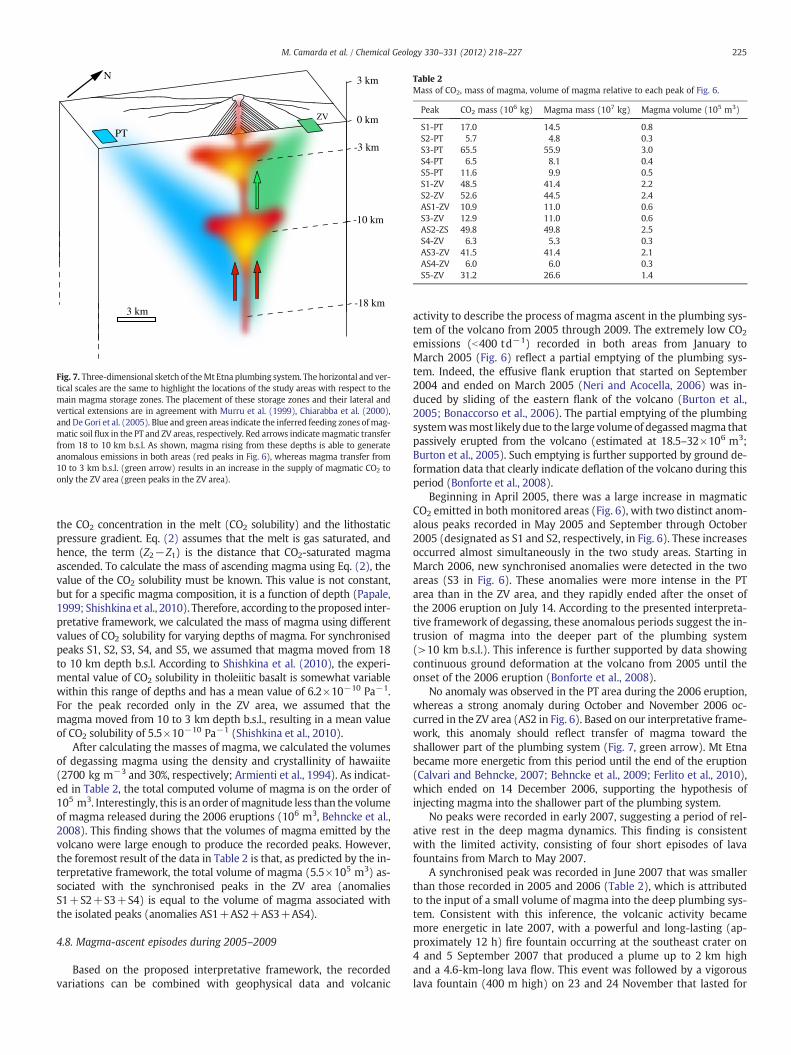
Table 2Mass of CO2, mass of magma, volume of magma relative to each peak of Fig. 6.
Peak CO2 mass (106 kg) Magma mass (107 kg) Magma volume (105 m3)
S1-PT 17.0 14.5 0.8S2-PT 5.7 4.8 0.3S3-PT 65.5 55.9 3.0S4-PT 6.5 8.1 0.4S5-PT 11.6 9.9 0.5S1-ZV 48.5 41.4 2.2S2-ZV 52.6 44.5 2.4AS1-ZV 10.9 11.0 0.6S3-ZV 12.9 11.0 0.6AS2-ZS 49.8 49.8 2.5S4-ZV 6.3 5.3 0.3AS3-ZV 41.5 41.4 2.1AS4-ZV 6.0 6.0 0.3S5-ZV 31.2 26.6 1.4
PT
ZV
-3 km
-10 km
-18 km
3 km
0 km
N
3 km
Fig. 7. Three-dimensional sketch of theMt Etna plumbing system. The horizontal and ver-tical scales are the same to highlight the locations of the study areas with respect to themain magma storage zones. The placement of these storage zones and their lateral andvertical extensions are in agreement with Murru et al. (1999), Chiarabba et al. (2000),and De Gori et al. (2005). Blue and green areas indicate the inferred feeding zones ofmag-matic soil flux in the PT and ZV areas, respectively. Red arrows indicate magmatic transferfrom 18 to 10 km b.s.l. As shown, magma rising from these depths is able to generateanomalous emissions in both areas (red peaks in Fig. 6), whereas magma transfer from10 to 3 km b.s.l. (green arrow) results in an increase in the supply of magmatic CO2 toonly the ZV area (green peaks in the ZV area).
225M. Camarda et al. / Chemical Geology 330–331 (2012) 218–227
the CO2 concentration in the melt (CO2 solubility) and the lithostaticpressure gradient. Eq. (2) assumes that the melt is gas saturated, andhence, the term (Z2−Z1) is the distance that CO2-saturated magmaascended. To calculate the mass of ascending magma using Eq. (2), thevalue of the CO2 solubility must be known. This value is not constant,but for a specific magma composition, it is a function of depth (Papale,1999; Shishkina et al., 2010). Therefore, according to the proposed inter-pretative framework, we calculated the mass of magma using differentvalues of CO2 solubility for varying depths of magma. For synchronisedpeaks S1, S2, S3, S4, and S5, we assumed that magma moved from 18to 10 km depth b.s.l. According to Shishkina et al. (2010), the experi-mental value of CO2 solubility in tholeiitic basalt is somewhat variablewithin this range of depths and has a mean value of 6.2×10⁻¹⁰ Pa−1.For the peak recorded only in the ZV area, we assumed that themagma moved from 10 to 3 km depth b.s.l., resulting in a mean valueof CO2 solubility of 5.5×10⁻¹⁰ Pa−1 (Shishkina et al., 2010).
After calculating the masses of magma, we calculated the volumesof degassing magma using the density and crystallinity of hawaiite(2700 kg m−3 and 30%, respectively; Armienti et al., 1994). As indicat-ed in Table 2, the total computed volume of magma is on the order of105 m3. Interestingly, this is an order ofmagnitude less than the volumeof magma released during the 2006 eruptions (106 m3, Behncke et al.,2008). This finding shows that the volumes of magma emitted by thevolcano were large enough to produce the recorded peaks. However,the foremost result of the data in Table 2 is that, as predicted by the in-terpretative framework, the total volume of magma (5.5×10⁵ m3) as-sociated with the synchronised peaks in the ZV area (anomaliesS1+S2+S3+S4) is equal to the volume of magma associated withthe isolated peaks (anomalies AS1+AS2+AS3+AS4).
4.8. Magma-ascent episodes during 2005–2009
Based on the proposed interpretative framework, the recordedvariations can be combined with geophysical data and volcanic
activity to describe the process of magma ascent in the plumbing sys-tem of the volcano from 2005 through 2009. The extremely low CO2
emissions (b400 td−1) recorded in both areas from January toMarch 2005 (Fig. 6) reflect a partial emptying of the plumbing sys-tem. Indeed, the effusive flank eruption that started on September2004 and ended on March 2005 (Neri and Acocella, 2006) was in-duced by sliding of the eastern flank of the volcano (Burton et al.,2005; Bonaccorso et al., 2006). The partial emptying of the plumbingsystemwasmost likely due to the large volumeof degassedmagma thatpassively erupted from the volcano (estimated at 18.5–32×106 m3;Burton et al., 2005). Such emptying is further supported by ground de-formation data that clearly indicate deflation of the volcano during thisperiod (Bonforte et al., 2008).
Beginning in April 2005, there was a large increase in magmaticCO2 emitted in both monitored areas (Fig. 6), with two distinct anom-alous peaks recorded in May 2005 and September through October2005 (designated as S1 and S2, respectively, in Fig. 6). These increasesoccurred almost simultaneously in the two study areas. Starting inMarch 2006, new synchronised anomalies were detected in the twoareas (S3 in Fig. 6). These anomalies were more intense in the PTarea than in the ZV area, and they rapidly ended after the onset ofthe 2006 eruption on July 14. According to the presented interpreta-tive framework of degassing, these anomalous periods suggest the in-trusion of magma into the deeper part of the plumbing system(>10 km b.s.l.). This inference is further supported by data showingcontinuous ground deformation at the volcano from 2005 until theonset of the 2006 eruption (Bonforte et al., 2008).
No anomaly was observed in the PT area during the 2006 eruption,whereas a strong anomaly during October and November 2006 oc-curred in the ZV area (AS2 in Fig. 6). Based on our interpretative frame-work, this anomaly should reflect transfer of magma toward theshallower part of the plumbing system (Fig. 7, green arrow). Mt Etnabecame more energetic from this period until the end of the eruption(Calvari and Behncke, 2007; Behncke et al., 2009; Ferlito et al., 2010),which ended on 14 December 2006, supporting the hypothesis ofinjecting magma into the shallower part of the plumbing system.
No peaks were recorded in early 2007, suggesting a period of rel-ative rest in the deep magma dynamics. This finding is consistentwith the limited activity, consisting of four short episodes of lavafountains from March to May 2007.
A synchronised peak was recorded in June 2007 that was smallerthan those recorded in 2005 and 2006 (Table 2), which is attributedto the input of a small volume of magma into the deep plumbing sys-tem. Consistent with this inference, the volcanic activity becamemore energetic in late 2007, with a powerful and long-lasting (ap-proximately 12 h) fire fountain occurring at the southeast crater on4 and 5 September 2007 that produced a plume up to 2 km highand a 4.6-km-long lava flow. This event was followed by a vigorouslava fountain (400 m high) on 23 and 24 November that lasted for
226 M. Camarda et al. / Chemical Geology 330–331 (2012) 218–227
approximately 6 h (Andronico et al., 2008; Patanè et al., 2008;Bonaccorso et al., 2011).
InMay 2008, an eruption occurred at Mt Etna that lasted until 6 July2009. Nearly all geophysical data recorded during and before this erup-tion are consistentwith themigration ofmagma into a shallower part ofthe plumbing system (b10 km b.s.l.; for details see Bonaccorso et al.,2011). In particular, Aloisi et al. (2011) indicated that throughout the2008–2009 eruptive period, the recorded deformation patterns arecompatible with batches of magma rising from as deep as 6.5 km b.s.l.The only geophysical data that may indicate the intrusion of a deepermagma body are several earthquakes that occurred in January 2008 ata depth of 20 km b.s.l. (Di Grazia et al., 2009; Bonaccorso et al., 2011).
Our data are in agreement with an intrusion into the shallower partof the plumbing system, given that there are no synchronised peaksseveral months before the eruption, while there were two peaks inthe ZV area during the eruption (AS3 and AS4 in Fig. 6). At the end ofOctober 2009, a new synchronised peak was recorded in both moni-tored areas (S5 in Fig. 6), which we attribute to deep magma intrusion.Although there are no geophysical data confirming our inferences, anunusual phenomena on the eastern slope of the southeast crater inNovember 2009, consisting of the formation of a new vent with contin-uous degassing and some episodes of weak ash emission, suggests achange in themagmadynamics of the plumbing system and an increasein the amount of magma and/or a rise in the magma level.
5. Conclusions
In this paper, we use the CO2 fluxes emitted in peripheral areas ofa volcano to isolate and quantify the contribution of CO2 of a magmat-ic origin to the total flux. This allows us to identify anomalous peaksresulting from intense degassing due to magma input and transferin the plumbing system. A degassing interpretative framework wasdeveloped based on the temporal patterns of CO2 peaks and datafrom the existing literature.
The interpretative framework allowed us to use the time series ofCO2 of a volcanic origin to describe episodes of magma ascent fromdeeper parts of the plumbing system and the transfer of this magmato shallower parts of the system. Our reconstruction is supported bygeophysical data and the observed eruptive activity.
We have demonstrated that measurements of soil CO2 flux in pe-ripheral areas of a volcano can be used to detect the movement ofmagma within the plumbing system. This provides the opportunity totake a picture of the state of the plumbing system over time, and this in-formation, combined with other geochemical and geophysical parame-ters, allows the eruptive potential of a volcano to be evaluated.
Acknowledgements
The authors thank F. Grassa for performing the carbon–isotope anal-yses, as well as the Editor and two anonymous reviewers, whose com-ments helped improve the manuscript.
References
Aiuppa, A., Allard, P., D'Alessandro, W., Giammanco, S., Parello, F., Valenza, M., 2004.Magmatic gas leakage at Mount Etna (Sicily, Italy): relationships with thevolcano-tectonic structures, the hydrological pattern and the eruptive activity.In: Calvari, S., Bonaccorso, A., Coltelli, M., Del Negro, C., Falsaperla, S. (Eds.), Mt. Etna:Volcano Laboratory: A.G.U. Geophysical Monograph Series, 143, pp. 129–145. http://dx.doi.org/10.1029/143GM09.
Allard, P., 1986. Geochimie isotopique et origine de l'eau, du carbone et du soufre dansles gaz magmatiques: Zones de rift, marges continentales et arcs insulaires. ThèseUniversité de Paris, 7 . 340 pp.
Allard, P., Carbonnelle, J., Dajlevic, D., Le Bronec, J.C., Morel, P., Maurenas, J.M., Robe,M.C., Faivre-Pierret, R., Sabroux, J.C., Zettwoog, P., 1991. Eruptive and diffuse emis-sions of carbon dioxide from Etna volcano. Nature 351, 387–391.
Aloisi, M., Mattia, M., Ferlito, C., Palano, M., Bruno, V., Cannavò, F., 2011. Imaging themulti-level magma reservoir at Mt. Etna volcano (Italy). Geophysical ResearchLetters 38, L16306. http://dx.doi.org/10.1029/2011GL048488.
Andronico, D., Cristalli, A., Scollo, S., 2008. The 4–5 September 2007 lava fountain atSouth-East Crater of Mt. Etna, Italy. Journal of Volcanology and Geothermal Research173, 325–328.
Armienti, P., Pareschi, M.T., Innocenti, F., Pompilio, M., 1994. Effects of magma storageand ascent on the kinetics of crystal growth. Contributions to Mineralogy andPetrology 115, 402–414.
Azzaro, R., D'Amico, S., Mostaccio, A., Scarfì, L., Tuvè, T., 2006. Terremoti con effettimacrosismici in Sicilia orientale nel periodo Gennaio 2002–Dicembre 2005.Quad. Geof., 41 . 62 pp.
Azzaro, R., D'Amico, S., Mostaccio, A., Scarfì, L., Tuvè, T., 2009. Catalogo Macrosismicodei Terremoti Etnei Aggiornamento 2006–2008. Quaderni di Geofisica, 72. 39 pp.
Barberi, F., Carapezza, M.L., Valenza, M., Villari, L., 1993. The control of lava flow duringthe 1991–1992 eruption ofMt. Etna. Journal of Volcanology andGeothermal Research56, 1–34.
Behncke, B., Calvari, S., Giammanco, S., Neri, M., Pinkerton, H., 2008. Pyroclastic densitycurrents resulting from the interaction of basaltic magma with hydrothermallyaltered rock: an example from the 2006 summit eruptions ofMount Etna, Italy. Bulletinof Volcanology 70, 1249–1268. http://dx.doi.org/10.1007/s00445-008-0200-7.
Behncke, B., Falsaperla, S., Pecora, E., 2009. Complex magma dynamics at Mount Etnarevealed by seismic, thermal, and volcanological data. Journal of Geophysical Research114, B03211. http://dx.doi.org/10.1029/2008JB005882.
Bonaccorso, A., Bonforte, A., Guglielmino, F., Palano, M., Puglisi, G., 2006. Compositeground deformation pattern forerunning the 2004–2005 Mount Etna eruption.Journal of Geophysical Research 111. http://dx.doi.org/10.1029/2005JB004206.
Bonaccorso, A., Bonforte, A., Calvari, S., Del Negro, C., Di Grazia, G., Ganci, G., Neri, M.,Vicari, A., Boschi, E., 2011. The initial phases of the 2008–2009 Mount Etna eruption:a multidisciplinary approach for hazard assessment. Journal of Geophysical Research116, B03203. http://dx.doi.org/10.1029/2010JB007906.
Bonforte, A., Bonaccorso, A., Guglielmino, F., Palano, M., Puglisi, G., 2008. Feeding sys-tem and magma storage beneath Mt. Etna as revealed by recent inflation/deflationcycles. Journal of Geophysical Research 113, B05406. http://dx.doi.org/10.1029/2007JB005334.
Borgia, A., Ferrari, L., Pasquarè, G., 1992. Importance of gravitational spreading in thetectonic and volcanic evolution of Mt. Etna. Nature 357, 231–235.
Bousquet, J.C., Lanzafame, G., Paquin, C., 1988. Tectonic stresses and volcanism: in-situstress measurements and neotectonic investigations in the Etna area (Italy).Tectonophysics 149, 219–231.
Brown, K.W., Rosenberg, N.J., 1971. Energy and CO2 balance of an irrigated sugar beet(Beta vulgaris) field in the Great Plains. Agronomy Journal 63, 207–213.
Burton, M.R., Neri, M., Andronico, D., Branca, S., Caltabiano, T., Calvari, S., Corsaro, R.A., DelCarlo, P., Lanzafame, G., Lodato, L., Miraglia, L., Salerno, G., Spampinato, L., 2005. Etna2004–2005: an archetype for geodynamically-controlled effusive eruptions.Geophysical Research Letters 32, L09303. http://dx.doi.org/10.1029/2005GL022527.
Calvari, S., Behncke, B., 2007. Etna: episodes of eruptions continue between 4 Novemberand 14 December 2006. Bulletin of the Global Volcanism Network 32, 22–26.
Camarda, M., Gurrieri, S., Valenza, M., 2006. CO2 flux measurements in volcanic areasusing the dynamic concentration method: influence of soil permeability. Journalof Geophysical Research 111, B05202. http://dx.doi.org/10.1029/2005JB003898.
Camarda, M., De Gregorio, S., Favara, R., Gurrieri, S., 2007. Evaluation of carbon isotopefractionation of soil CO2 under an advective–diffusive regimen: a tool for comput-ing the isotopic composition of unfractionated deep source. Geochimica etCosmochimica Acta 71, 3016–3027.
Caracausi, A., Italiano, F., Paonita, A., Rizzo, A., Nuccio, P.M., 2003. Evidence of deepmagma degassing and ascent by geochemistry of peripheral gas emissions atMount Etna (Italy): assessment of the magmatic reservoir pressure. Journal ofGeophysical Research 108, B10 2463. http://dx.doi.org/10.1029/2002JB002095.
Chiarabba, C., Amato, A., Boschi, E., Barberi, F., 2000. Recent seismicity and tomographicmodeling of the Mount Etna plumbing system. Journal of Geophysical Research105 (10), 923–10938.
Chiodini, G., D'Alessandro, W., Parello, F., 1996. Geochemistry f the gases and of thewaters discharged by the mud volcanoes of Paternò, Mt. Etna (Italy). Bulletin ofVolcanology 58, 51–58.
Chiodini, G., Caliro, S., Cardellini, C., Avino, R., Granieri, D., Schmidt, A., 2008. Carbonisotopic composition of soil CO2 efflux, a powerful method to discriminate differ-ent sources feeding soil CO2 degassing in volcanic-hydrothermal areas. Earth andPlanetary Science Letters 274, 372–379.
D'Alessandro, W., De Domenico, R., Parello, F., Valenza, M., 1995. Geochemical Anomaliesin the Gaseous Phase of the Mud Volcanoes of Paternò, Sicily. Proceedings ScientificMeeting on the Seismic Protection, Venice, 12–13 July, 1993, pp. 171–175.
D'Alessandro, W., De Gregorio, S., Dongarrà, G., Gurrieri, S., Parello, F., Parisi, B., 1997a.Chemical and isotopic characterization of the gases of Mount Etna. Journal ofVolcanology and Geothermal Research 78, 65–76.
D'Alessandro, W., Giammanco, S., Parello, F., Valenza, M., 1997b. CO2 output andδ13C(CO2) from Mount Etna as indicators of degassing of shallow asthenosphere.Bulletin of Volcanology 58, 455–458. http://dx.doi.org/10.1007/s004450050154.
De Gori, P., Chiarabba, C., Patanè, D., 2005. Qp structure of Mt. Etna: constraints for the440 physics of the plumbing system. Journal of Geophysical Research 110, B05303.http://dx.doi.org/10.1029/2003JB002875.
Deegan, F.M., Troll, V.R., Freda, C., Misiti, V., Chadwick, J.P., Mcleod, C.L., Davidson, J.P.,2010. Magma–carbonate interaction processes and associated CO2 release at MerapiVolcano, Indonesia: insights from experimental petrology. Journal of Petrology 51,1027–1051. http://dx.doi.org/10.1093/petrology/egq010.
Di Grazia, G., Cannata, A., Montalto, P., Patanè, D., Privitera, E., Zuccarello, L., Boschi, E.,2009. A multiparameter approach to volcano monitoring based on 4D analyses ofseismo-volcanic and acoustic signals: the 2008 Mt. Etna eruption. GeophysicalResearch Letters 36, L18307. http://dx.doi.org/10.1029/2009GL039567.
227M. Camarda et al. / Chemical Geology 330–331 (2012) 218–227
Diliberto, I.S., Gurrieri, S., Valenza, M., 2002. Relationships between diffuse CO2 emis-sions and volcanic activity on the island of Vulcano (Aeolian Islands, Italy) duringthe period 1984–1994. Bulletin of Volcanology 64, 219–228.
Federico, C., Camarda, M., De Gregorio, S., Gurrieri, S., 2011. Long-term record of CO2
degassing along Mt. Etna's flanks and its relationship with magma dynamics andeastern flank instability. Geochemistry, Geophysics, Geosystems 12, Q10002.http://dx.doi.org/10.1029/2011GC003601.
Ferlito, C., Viccaro, M., Nicotra, E., Cristofolini, R., 2010. Relationship between the flanksliding of the South East Crater (Mt. Etna, Italy) and the paroxysmal event ofNovember 16, 2006. Bulletin of Volcanology 72, 1179–1190. http://dx.doi.org/10.1007/s00445-010-0384-5.
Gerlach, T.M., 1991. Etna's greenhouse pump. Nature 315, 352–353.Giammanco, S., Bonfanti, P., 2009. Cluster analysis of soil CO2 data fromMt. Etna (Italy)
reveals volcanic influences on temporal and spatial patterns of degassing. Bulletinof Volcanology 71, 201–218. http://dx.doi.org/10.1007/s00445-008-0218-x.
Giammanco, S., Gurrieri, S., Valenza, M., 1995. Soil CO2 degassing on Mt. Etna (Sicily)during the period 1989–1993: discrimination between climatic and volcanic influ-ences. Bulletin of Volcanology 57, 52–60.
Giammanco, S., Gurrieri, S., Valenza,M., 1997. Soil CO2 degassing along tectonic structuresof Mount Etna (Sicily): the Pernicana fault. Applied Geochemistry 12, 429–436.
Giammanco, S., Bellotti, F., Groppelli, G., Pinton, A., 2010. Statistical analysis revealsspatial and temporal anomalies of soil CO2 efflux on Mount Etna volcano (Italy).Journal of Volcanology and Geothermal Research 194, 1–14.
Gurrieri, S., Valenza, M., 1988. Gas transport in natural porous mediums: a method formeasuring CO2 flows from the ground in volcanic and geothermal areas.Rendiconti della Societa Italiana di Mineralogica et Petrographica 43, 1151–1158.
Harris, D.M., Rose, W.I., 1996. Dynamics of carbon dioxide emissions, crystallization,and magma ascent: hypotheses, theory, and applications to volcano monitoringat Mount St. Helens. Bulletin of Volcanology 58, 163–174.
John, C.M., Mutti, M., Adatte, T., 2003. Mixed carbonate-siliciclastic record on the NorthAfrican margin (Malta) — coupling of weathering processes and mid Miocene cli-mate. Geological Society of America Bulletin 115, 217–229.
Kamenetsky, V.S., Pompilio, M., Métrich, N., Sobolev, A.V., Kuzmin, D.V., Thomas, R.,2007. Arrival of extremely volatile-rich high-Mg magmas changes explosivity ofMount Etna. Geology 35, 255–258. http://dx.doi.org/10.1130/G23163A.1.
Marty, B., Trull, T., Lussiez, P., Basile, I., Tanguy, J.C., 1994. He, Ar, O, Sr and Nd isotopeconstraints on the origin and evolution of Mount Etna magmatism. Earth and Plan-etary Science Letters 126, 23–39.
Monteith, J.L., Szeicz, G., Yabuki, K., 1964. Crop photosynthesis and the flux of carbondioxide below the canopy. Journal of Applied Ecology 1, 321–327.
Murru, M., Montuori, C., Wyss, M., Privitera, E., 1999. The locations of magma chambers atMt. Etna, Italy, mapped by b-values. Geophysical Research Letters 26, 2553–2556.
Neri,M., Acocella, V., 2006. The 2004–05 Etna eruption: implications for flank deformationand structural behaviour of the volcano. Journal of Volcanology and GeothermalResearch 158, 195–206. http://dx.doi.org/10.1016/j.jvolgeores.2006.04.022.
Neri, M., Garduno, V.H., Pasquaré, G., Rasà, R., 1991. Studio strutturale e modellocinematico della Valle del Bove e del settore nord-orientale Etneo. Acta Vulcanologica1, 17–24.
Nuccio, P.M., Paonita, A., Rizzo, A., Rosciglione, A., 2008. Elemental and isotope covari-ation of noble gases in mineral phases from Etnean volcanics erupted during 20012005, and genetic relation with peripheral gas discharges. Earth and PlanetaryScience Letters 272, 683–690.
Papale, P., 1999. Modeling of the solubility of a two-component H2O+CO2 fluid in sil-icate liquids. American Mineralogist 84, 477–492.
Patanè, D., Di Grazia, G., Cannata, A., Montalto, P., Boschi, E., 2008. Shallow magmapathway geometry at Mt. Etna volcano. Geochemistry, Geophysics, Geosystems 9.http://dx.doi.org/10.1029/2008GC002131.
Raich, J.W., Schlesinger, W.H., 1992. The global carbon dioxide flux in soil respirationand its relationship to vegetation and climate. Tellus 44B, 81–99.
Raich, J.W., Tufekcioglu, A., 2000. Vegetation and soil respiration: correlations and con-trols. Biogeochemistry 48, 71–90.
Rasà, R., Ferrucci, F., Gresta, S., Patanè, D., 1995. Etna: sistema di alimentazione profondo,assetto geostatico locale e bimodalità di funzionamento del vulcano. In: Ferrucci, F.,Innocenti, F. (Eds.), Progetto-Etna 1993–1995. Giardini, Pisa, pp. 145–150.
Rizzo, A., Caracausi, A., Favara, R., Martelli, M., Paonita, A., Paternoster, M., Nuccio, P.M.,Rosciglione, A., 2006. New insights into magma dynamics during last two erup-tions of Mount Etna as inferred by geochemical monitoring from 2002 to 2005.Geochemistry, Geophysics, Geosystems 7, Q06008. http://dx.doi.org/10.1029/2005GC001175.
Romano, R., Lentini, F., Sturiale, C., Amore, C., Atzori, P., Carter, S.R., Cristofolini, R., DiGeronimo, I., Di Grande, A., Duncan, A.M., Ferrara, V., Ghisetti, F., Guest, J.E., Hamill,H., Patanè, G., Pezzino, A., Puglisi, D., Schilirò, F., Torre, G., Vezzani, L., 1979. Cartageologica del Monte Etna, scala 1:50.000. Litogr. Art. Cartogr., Firenze.
Schiano, P., Clocchiatti, R., Ottolini, L., Busa, T., 2001. Transition of Mount Etna lavasfrom a mantle-plume to an island-arc magmatic source. Nature 412, 900–904.http://dx.doi.org/10.1038/35091056.
Schifano, R., 2007. Mechanisms of gas efflux through soils: discrimination between or-ganic and magmatic components in diffuse CO2 emissions and environmental in-fluences on diffuse volcanic degassing. PhD Thesis, University of Palermo, Palermo.
Shishkina, T.A., Botcharnikov, R.E., Holtz, F., Almeev, R.R., Portnyagin,M.V., 2010. Solubility ofH2O- and CO2-bearing fluids in tholeiitic basalts at pressures up to 500 MPa. ChemicalGeology 277, 115–125.
Sinclair, A.J., 1974. Selection of threshold values in geochemical data using probabilitygraphs. Journal of Geochemical Exploration 3, 129–149.
Tanguy, J.C., Condomines, M., Kieffer, G., 1997. Evolution of the Mount Etna magma:constraints on the present feeding system and eruptive mechanism. Journal ofVolcanology and Geothermal Research 75, 221–250.
Taylor, B.E., 1986. Magmatic volatiles: isotopic variation of C, H and S. Reviews in Min-eralogy 16, 185–225.
Tonarini, S., Armienti, P., D'Orazio, M., Innocenti, F., 2001. Subduction-like fluids in thegenesis of Mt. Etna magmas: evidence from boron isotopes and fluid mobile ele-ments. Earth and Planetary Science Letters 192, 471–483. http://dx.doi.org/10.1016/S0012-821X(01), 00487-3.
Related Documents