Macroscopic traffic flow modeling and control of heterogeneous cities with multi-sensor data Dr Konstantinos Ampountolas School of Engineering University of Glasgow United Kingdom Data Management for Urban Transport Operations Urban Big Data Centre, June10, 2016 @Urbanbigdata Outline • Motivation • Aggregated modeling with multi-sensor data • Application to San Francisco • Field implementation in Melbourne, Australia • Aggregated Modeling for bi-modal networks 2

Welcome message from author
This document is posted to help you gain knowledge. Please leave a comment to let me know what you think about it! Share it to your friends and learn new things together.
Transcript

Macroscopic traffic flow modeling and control of heterogeneous cities with multi-sensor data
Dr Konstantinos Ampountolas School of Engineering University of Glasgow United Kingdom Data Management for Urban Transport Operations Urban Big Data Centre, June10, 2016
@Urbanbigdata
Outline
• Motivation • Aggregated modeling with multi-sensor data • Application to San Francisco • Field implementation in Melbourne, Australia • Aggregated Modeling for bi-modal networks
2
Motivation
Goal: • Mitigate congestion in transport networks via appropriate
control policies and by using multi-sensor data Approach: • Understand what causes congestion (+gridlocks) • Urban road networks: Meter the input flow to the system and
hold vehicles outside the system if necessary (to maintain maximum throughput, e.g. number of trip completion)
• Motorways: Meter the input flow to the on-ramp (merging area) and hold vehicles outside the motorway if necessary (to maintain maximum throughput in the mainline)
3
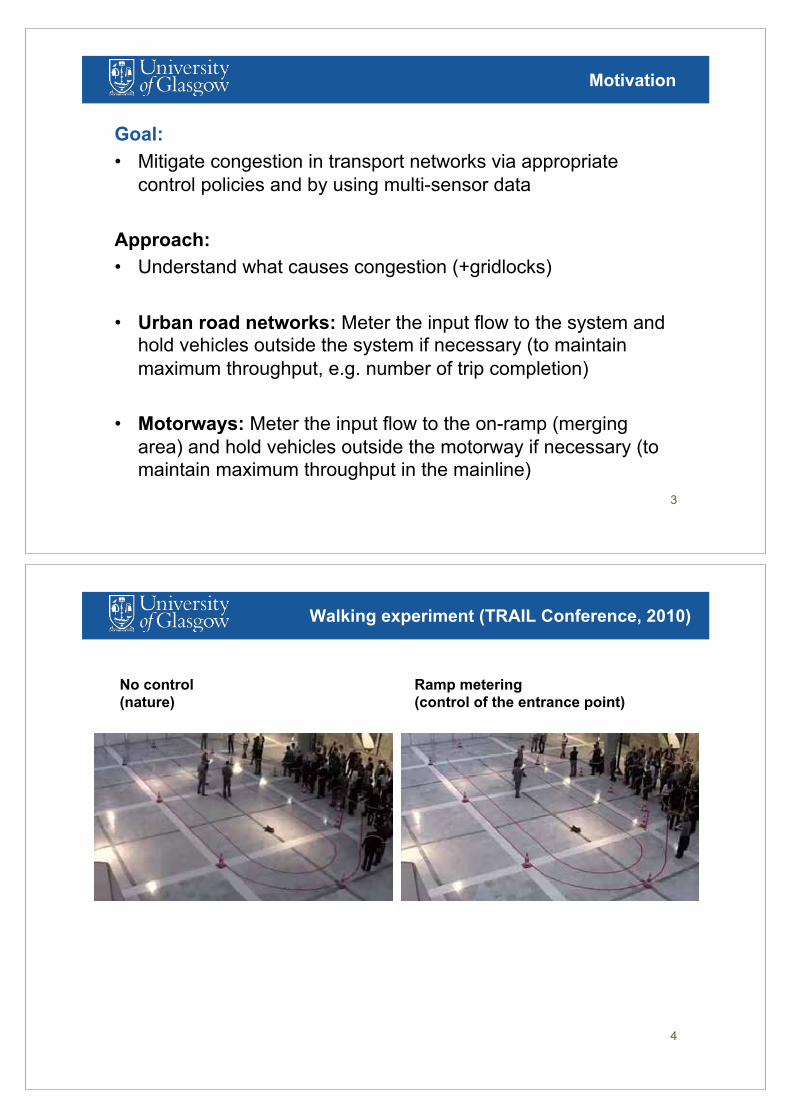
Walking experiment (TRAIL Conference, 2010)
No control (nature)
Ramp metering (control of the entrance point)
4
Urban road networks
Funnel experiment • Poor rice into a funnel using two different strategies:
– Poor as much rice into the funnel as possible without spilling – Try to limit the inflow such that there is “no queue of rice”
• Which strategy is quicker or maximises the output?
• Funnel = merging traffic infrastructure
• Rice = vehicles
• Output = number of trips completed
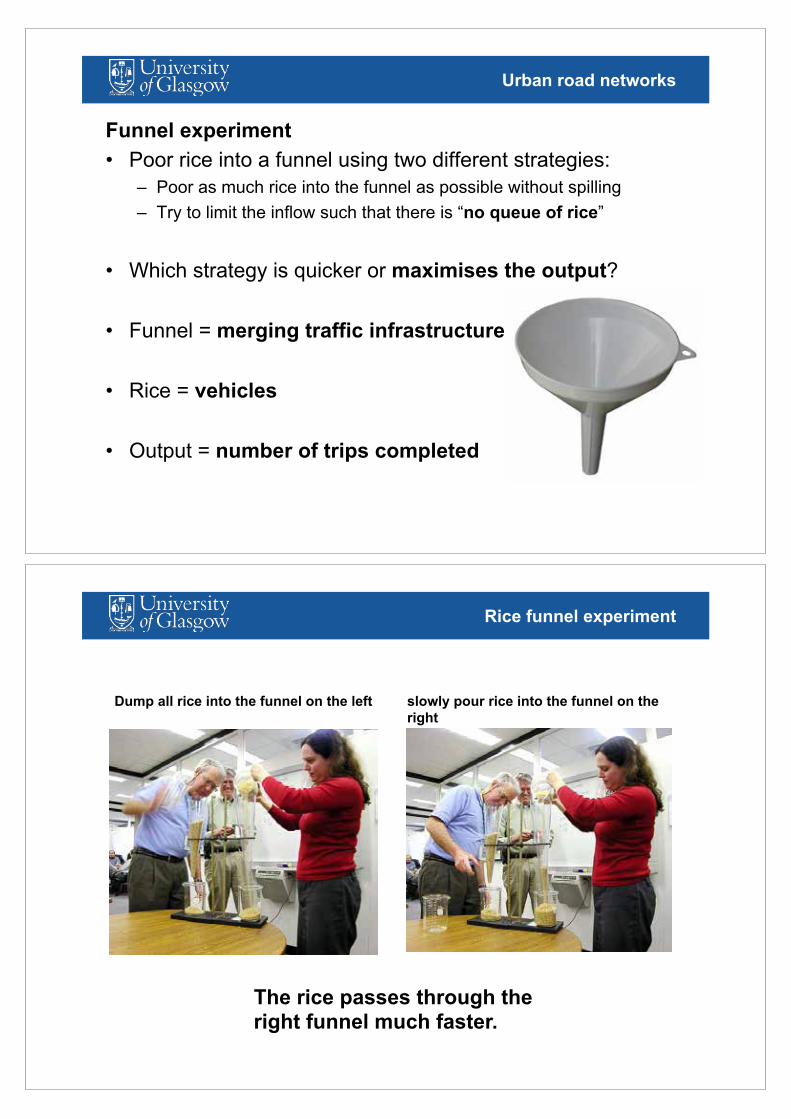
Rice funnel experiment
Dump all rice into the funnel on the left slowly pour rice into the funnel on the right
The rice passes through the right funnel much faster.
Aggregated modeling with multi-sensor data
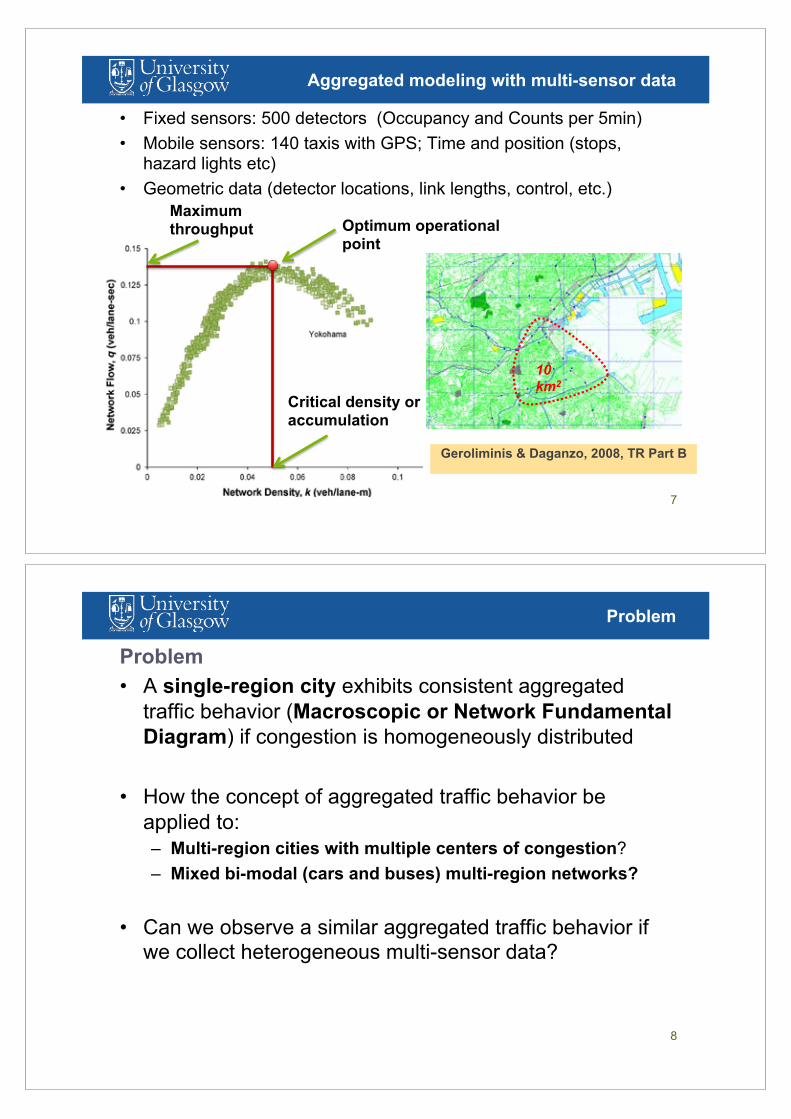
• Fixed sensors: 500 detectors (Occupancy and Counts per 5min) • Mobile sensors: 140 taxis with GPS; Time and position (stops,
hazard lights etc) • Geometric data (detector locations, link lengths, control, etc.)
7
10 km2
Maximum throughput
Critical density or accumulation
Optimum operational point
Geroliminis & Daganzo, 2008, TR Part B
Problem
Problem • A single-region city exhibits consistent aggregated
traffic behavior (Macroscopic or Network Fundamental Diagram) if congestion is homogeneously distributed
• How the concept of aggregated traffic behavior be applied to: – Multi-region cities with multiple centers of congestion? – Mixed bi-modal (cars and buses) multi-region networks?
• Can we observe a similar aggregated traffic behavior if we collect heterogeneous multi-sensor data?
8
Modeling: City-wide, homogeneous, single-region
• A single-region city exhibits consistent aggregated traffic behavior: Macroscopic Fundamental Diagram (MFD)
• Network flow (q) vs. Accumulation (n) or Density (k): q = O(n)
9
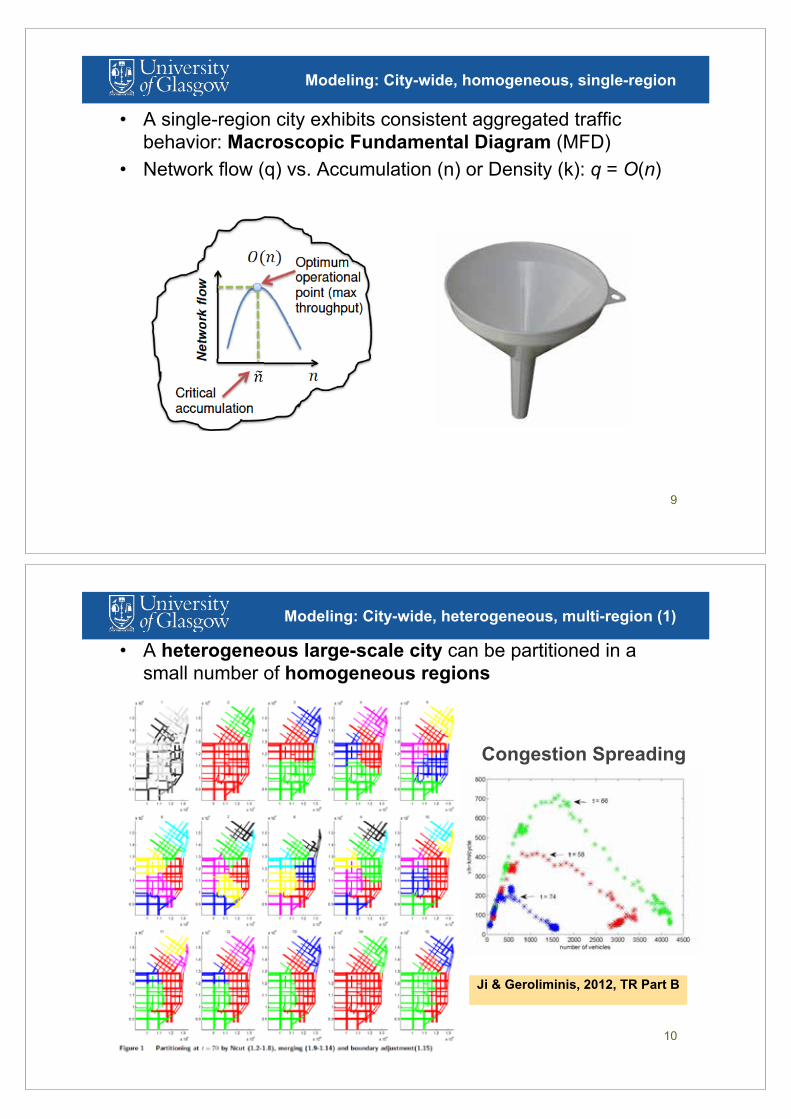
Modeling: City-wide, heterogeneous, multi-region (1)
• A heterogeneous large-scale city can be partitioned in a small number of homogeneous regions
10
Congestion Spreading
Ji & Geroliminis, 2012, TR Part B
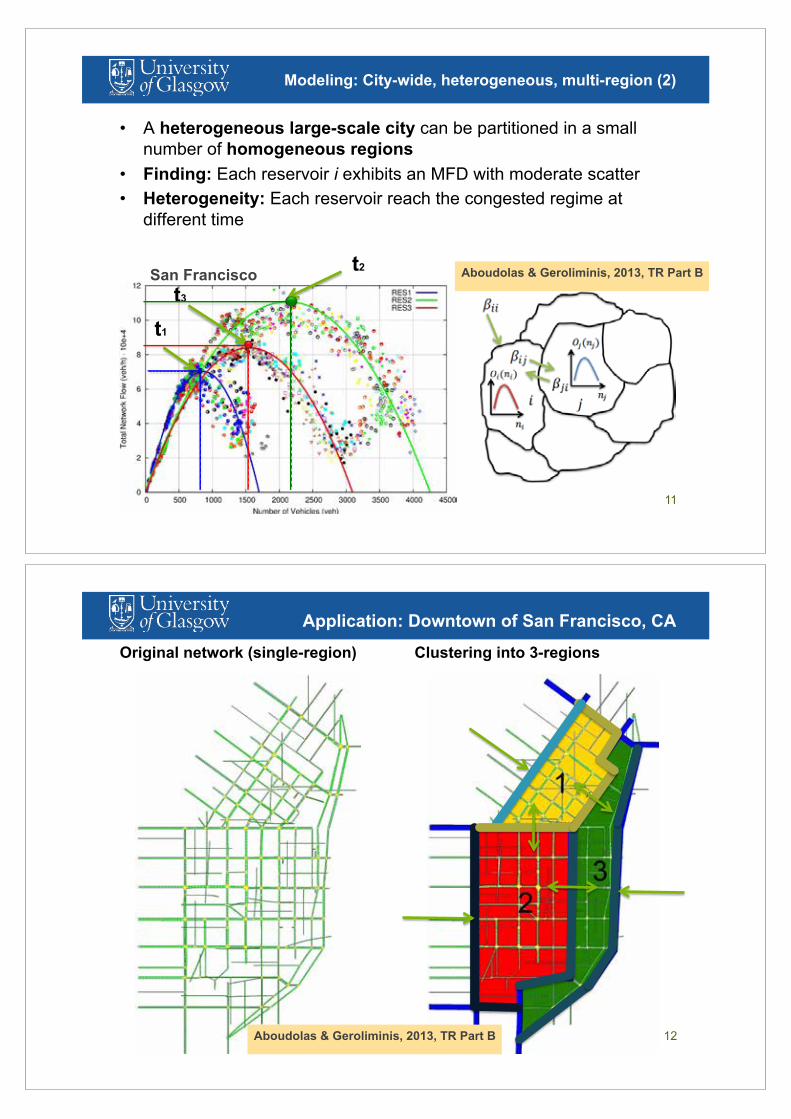
Modeling: City-wide, heterogeneous, multi-region (2)
• A heterogeneous large-scale city can be partitioned in a small number of homogeneous regions
• Finding: Each reservoir i exhibits an MFD with moderate scatter • Heterogeneity: Each reservoir reach the congested regime at
different time
11
San Francisco
t1
t2 t3
Aboudolas & Geroliminis, 2013, TR Part B
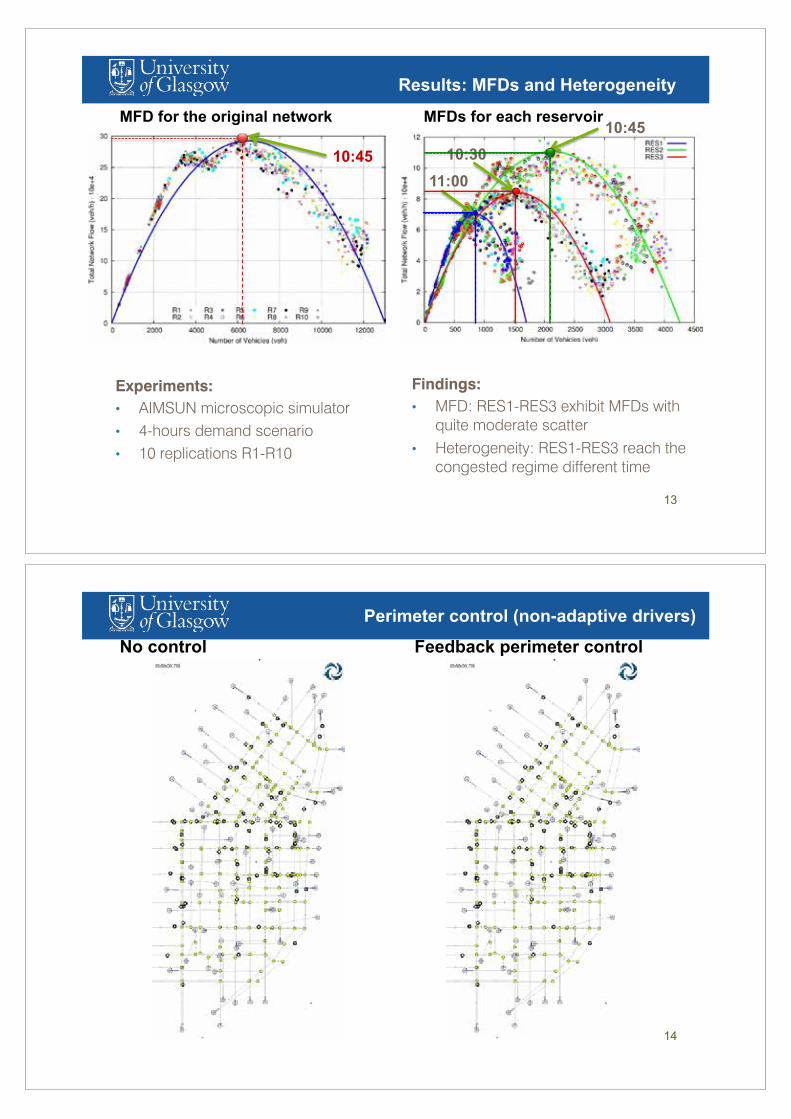
Application: Downtown of San Francisco, CA
Original network (single-region) Clustering into 3-regions
12 Aboudolas & Geroliminis, 2013, TR Part B
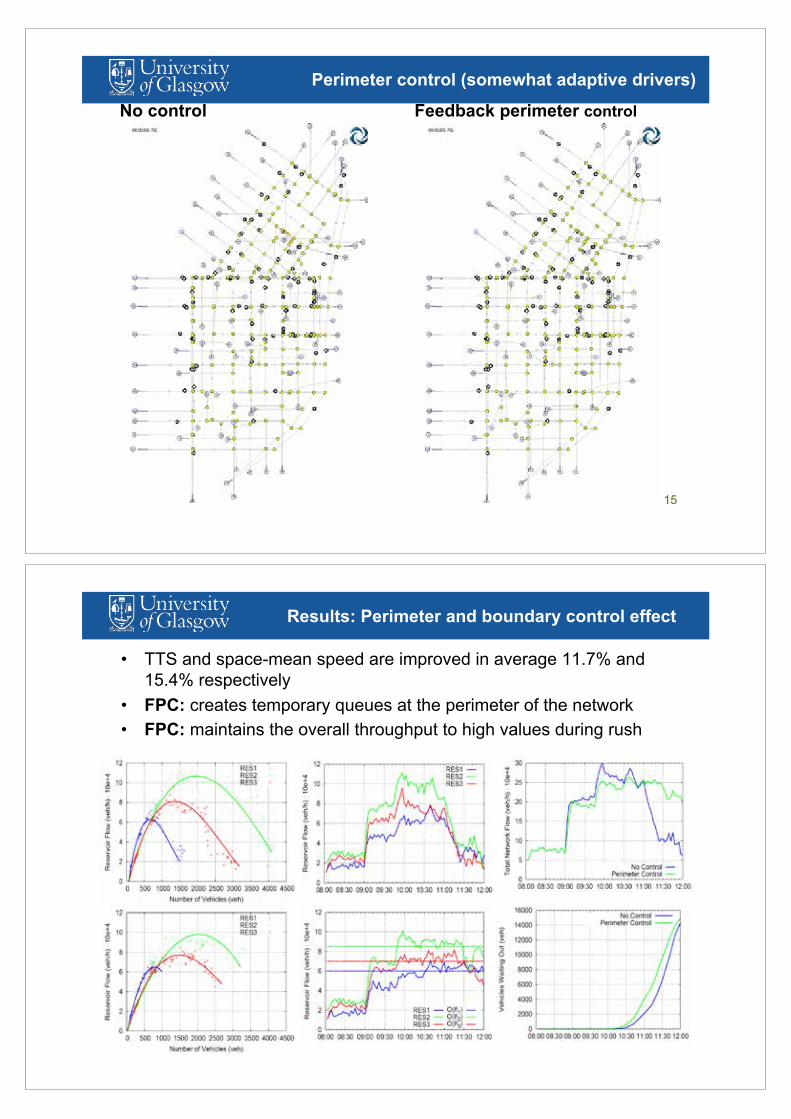
Results: MFDs and Heterogeneity
MFD for the original network MFDs for each reservoir
13
Experiments: • AIMSUN microscopic simulator
• 4-hours demand scenario
• 10 replications R1-R10
Findings: • MFD: RES1-RES3 exhibit MFDs with
quite moderate scatter
• Heterogeneity: RES1-RES3 reach the
congested regime different time
10:45 10:30
11:00 10:45
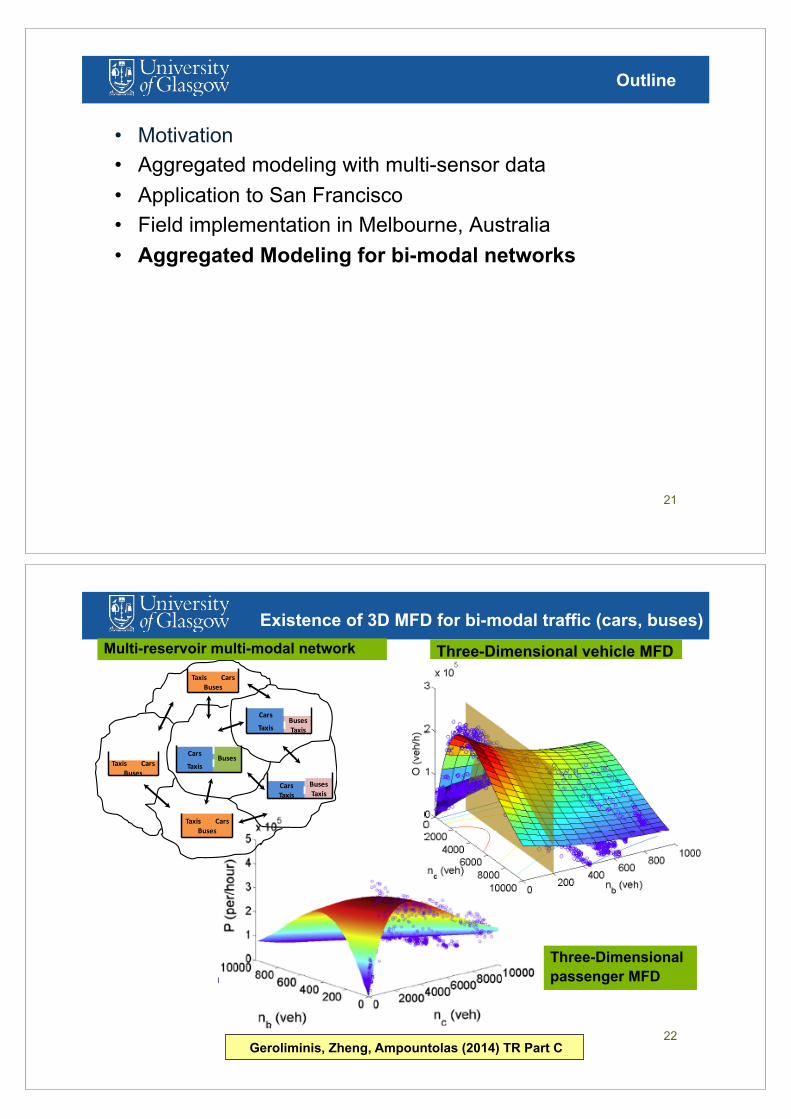
Perimeter control (non-adaptive drivers)
No control Feedback perimeter control
14
Perimeter control (somewhat adaptive drivers)
No control Feedback perimeter control
15
Results: Perimeter and boundary control effect
• TTS and space-mean speed are improved in average 11.7% and 15.4% respectively
• FPC: creates temporary queues at the perimeter of the network • FPC: maintains the overall throughput to high values during rush
16

Results: Perimeter and boundary control effect
• Simulation with OD + DTA: improvement in average 45% • Comparison with Bang-bang control: Improvement 10% • FPC: No temporal queues at the perimeter of the network • FPC: maintains throughput; respect reservoirs’ homogeneity
17
Field Implementation in Melbourne, AU
18
Stonnington area, around 120 intersections

Field Implementation in Melbourne, AU
• Progression of congestion from 7:00 am to 9:00 am
19
7:30-8:00am
8:00-8:30am 8:30-9:00am
7:00-7:30am
Field Implementation in Melbourne, AU
20
Morning peak and Partition
Evening peak and Partition
1 3
2
1
2
Outline
• Motivation • Aggregated modeling with multi-sensor data • Application to San Francisco • Field implementation in Melbourne, Australia • Aggregated Modeling for bi-modal networks
21
Existence of 3D MFD for bi-modal traffic (cars, buses)
22
BusesTaxis
Cars
Taxis
TaxisCarsBuses
TaxisCarsBuses
TaxisCarsBuses
BusesTaxis
CarsTaxis
BusesCars
Taxis
Multi-reservoir multi-modal network Three-Dimensional vehicle MFD
Three-Dimensional passenger MFD
Geroliminis, Zheng, Ampountolas (2014) TR Part C
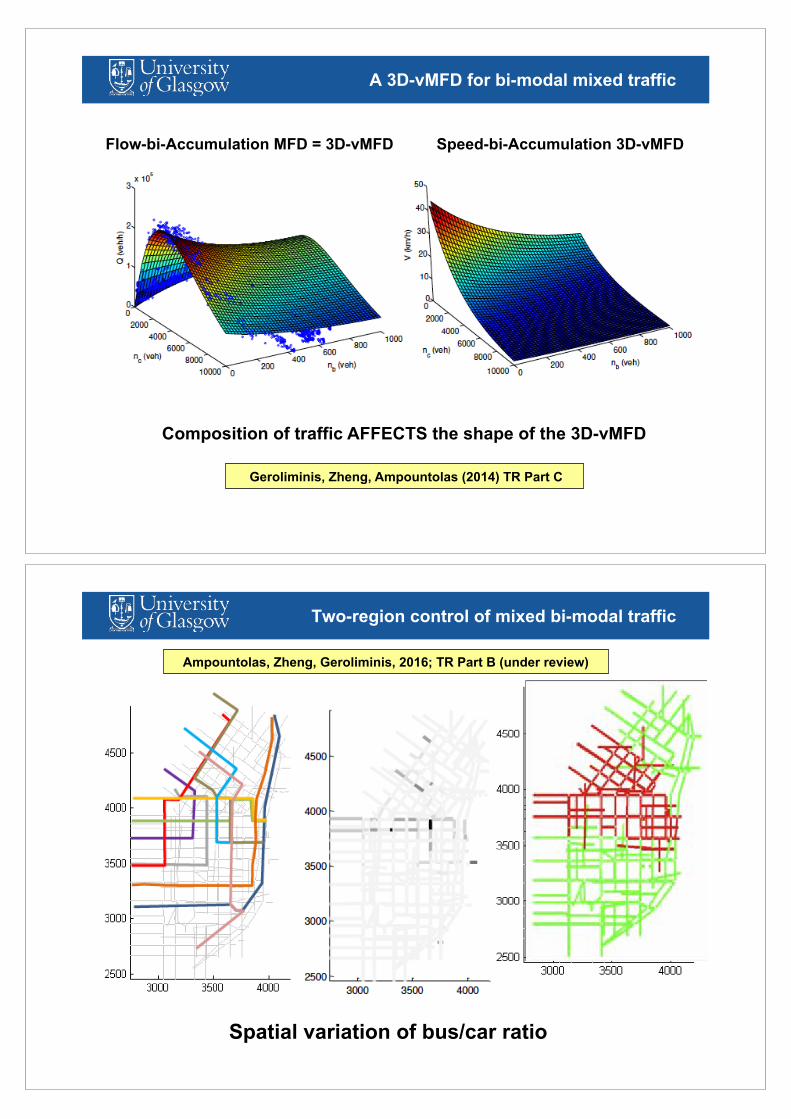
A 3D-vMFD for bi-modal mixed traffic
Flow-bi-Accumulation MFD = 3D-vMFD Speed-bi-Accumulation 3D-vMFD
Geroliminis, Zheng, Ampountolas (2014) TR Part C
Composition of traffic AFFECTS the shape of the 3D-vMFD
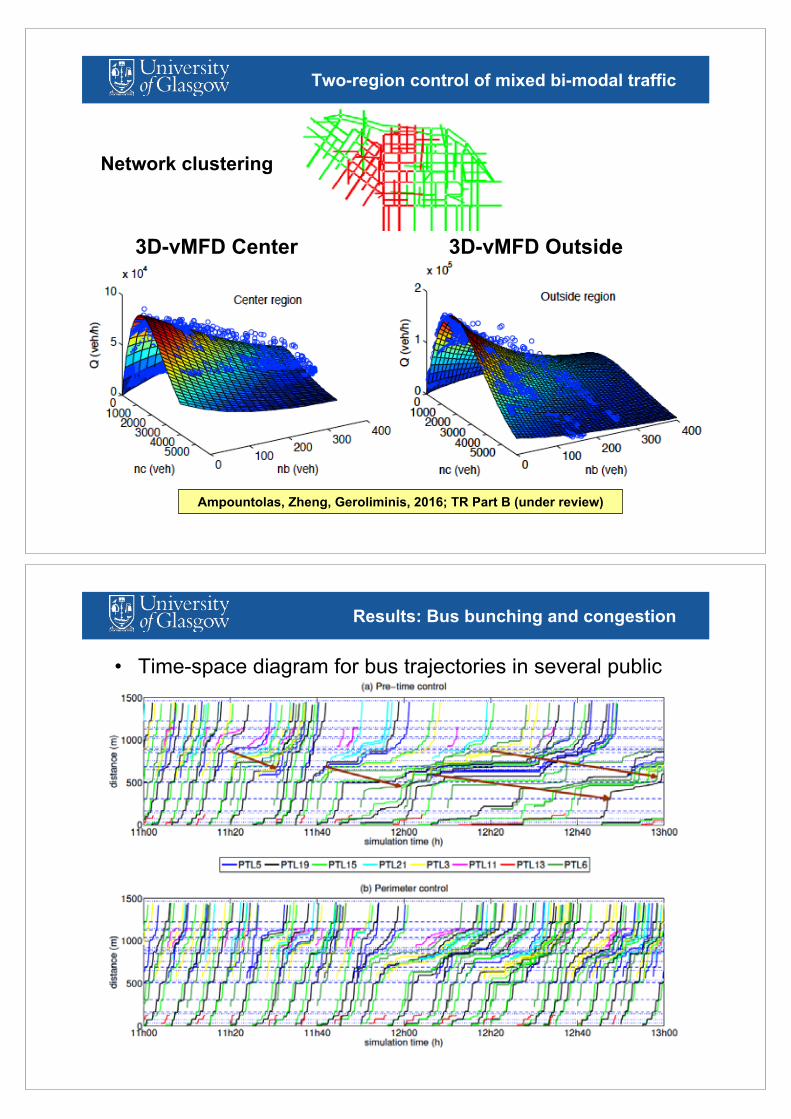
Two-region control of mixed bi-modal traffic
Spatial variation of bus/car ratio
Ampountolas, Zheng, Geroliminis, 2016; TR Part B (under review)
Two-region control of mixed bi-modal traffic
3D-vMFD Center 3D-vMFD Outside
Network clustering
Ampountolas, Zheng, Geroliminis, 2016; TR Part B (under review)
Results: Bus bunching and congestion
• Time-space diagram for bus trajectories in several public transport lines
26

Bus bunching phenomena
0 10 20 30 400
20
40
60
Headway (min)
Freq
uenc
yLine 3, Schedule:6min
StDev:12Mean:12.9
0 10 20 30 400
20
40
60
Headway (min)
Freq
uenc
y
Line 5, Schedule:4.5min
StDev:10Mean:8.3
0 10 20 30 400
20
40
60
Headway (min)
Freq
uenc
y
Line 15, Schedule:5min
StDev:8Mean:8.6
0 10 20 30 400
20
40
60
Headway (min)
Freq
uenc
y
Line 19, Schedule:5min
StDev:9Mean:8.7
0 10 20 30 400
20
40
60
Headway (min)
Freq
uenc
y
Line 3, Schedule:6min
StDev:5Mean:6.3
0 10 20 30 400
20
40
60
Headway (min)
Freq
uenc
y
Line 5, Schedule:4.5min
StDev:4Mean:5.6
0 10 20 30 400
20
40
60
Headway (min)
Freq
uenc
y
Line 15, Schedule:5min
StDev:3Mean:4.9
0 10 20 30 400
20
40
60
Headway (min)
Freq
uenc
y
Line 19, Schedule:5min
StDev:3Mean:4.9
Histograms of headways for 4 bus lines
PRE-TIMED TRAFFIC LIGHTS
SMART TRAFFIC LIGHTS FOR 2 REGIONS
Traffic flow / speed curve by NO2
15 min traffic volume (no. vehicles)
15 m
in a
vera
ge s
peed
(mph
)
0
20
40
60
0 200 400 600 800
10
20
30
40
50
60
70
80
Other sensor data: Speed-flow relationship by NO2
Source of image Transport Scotland
Thanks for your attention!
Questions?
@Urbanbigdata
Related Documents