1 Macroprudential indicators of the financial sector December 2015 Macroeconomic risk indicators ............................................................................................... 3 1 Manufacturing Purchasing Managers’ Index (PMI) in selected economies ....................... 3 2 Services Purchasing Managers’ Index (PMI) in selected economies.................................. 3 3 Consumer confidence indicators in the United States ......................................................... 3 4 Economic sentiment indicators in the euro area .................................................................. 3 5 Unemployment rates in selected economies ....................................................................... 3 6 Consumer price inflation in selected economies ................................................................. 3 7 Industrial production indices in selected economies ........................................................... 4 8 Retail sales indices in selected economies .......................................................................... 4 9 General government balances of EU countries in 2014 (%) ............................................... 4 10 Gross government debt of EU countries in the third quarter of 2015 (%) ........................ 4 Financial market risk indicators ............................................................................................. 4 11 Price commodity indices ................................................................................................... 4 12 Exchange rate indices ........................................................................................................ 4 13 Equity indices .................................................................................................................... 5 14 Share price indices of the parent institutions of the five largest domestic banks .............. 5 15 Yield curve slopes in selected economies ......................................................................... 5 16 Volatility of equity indices ................................................................................................ 5 17 CDS spread indices ........................................................................................................... 5 18 CDSs of the parent institutions of the largest Slovak banks ............................................. 5 19 Three-month rates and the OIS spread .............................................................................. 6 20 Inflation-linked swap prices .............................................................................................. 6 21 Credit spreads on 5-year government bonds issued by lower-rated countries .................. 6 22 Credit spreads on 5-year government bonds issued by selected central European countries and Germany........................................................................................................... 6 Corporate credit risk indicators ............................................................................................. 6 23 Exports and the business environment .............................................................................. 6 24 Exports and corporate sales ............................................................................................... 6 25 Sales in selected sectors compared with their level for the period 06/2007 to 06/2008 ... 7 26 Corporate loans and sales .................................................................................................. 7 27 Interest rate spreads on new loans to NFCs ...................................................................... 7 28 Non-performing loans and default rates ............................................................................ 7 29 Loans at risk ...................................................................................................................... 7 30 Debt-service burden and its components........................................................................... 7 31 Commercial real estate: price and vacancy rates in the office segment ............................ 8 32 Commercial real estate: sales in the residential segment (new flats) ................................ 8

Welcome message from author
This document is posted to help you gain knowledge. Please leave a comment to let me know what you think about it! Share it to your friends and learn new things together.
Transcript

1
Macroprudential indicators of the financial sector
December 2015
Macroeconomic risk indicators ............................................................................................... 3
1 Manufacturing Purchasing Managers’ Index (PMI) in selected economies ....................... 3
2 Services Purchasing Managers’ Index (PMI) in selected economies.................................. 3
3 Consumer confidence indicators in the United States ......................................................... 3
4 Economic sentiment indicators in the euro area .................................................................. 3
5 Unemployment rates in selected economies ....................................................................... 3
6 Consumer price inflation in selected economies ................................................................. 3
7 Industrial production indices in selected economies ........................................................... 4
8 Retail sales indices in selected economies .......................................................................... 4
9 General government balances of EU countries in 2014 (%) ............................................... 4
10 Gross government debt of EU countries in the third quarter of 2015 (%) ........................ 4
Financial market risk indicators ............................................................................................. 4
11 Price commodity indices ................................................................................................... 4
12 Exchange rate indices ........................................................................................................ 4
13 Equity indices .................................................................................................................... 5
14 Share price indices of the parent institutions of the five largest domestic banks .............. 5
15 Yield curve slopes in selected economies ......................................................................... 5
16 Volatility of equity indices ................................................................................................ 5
17 CDS spread indices ........................................................................................................... 5
18 CDSs of the parent institutions of the largest Slovak banks ............................................. 5
19 Three-month rates and the OIS spread .............................................................................. 6
20 Inflation-linked swap prices .............................................................................................. 6
21 Credit spreads on 5-year government bonds issued by lower-rated countries .................. 6
22 Credit spreads on 5-year government bonds issued by selected central European
countries and Germany ........................................................................................................... 6
Corporate credit risk indicators ............................................................................................. 6
23 Exports and the business environment .............................................................................. 6
24 Exports and corporate sales ............................................................................................... 6
25 Sales in selected sectors compared with their level for the period 06/2007 to 06/2008 ... 7
26 Corporate loans and sales .................................................................................................. 7
27 Interest rate spreads on new loans to NFCs ...................................................................... 7
28 Non-performing loans and default rates ............................................................................ 7
29 Loans at risk ...................................................................................................................... 7
30 Debt-service burden and its components........................................................................... 7
31 Commercial real estate: price and vacancy rates in the office segment ............................ 8
32 Commercial real estate: sales in the residential segment (new flats) ................................ 8

2
33 Comparison of corporate balance sheets and sales ........................................................... 8
34 Liabilities of non-financial corporations ........................................................................... 8
Household credit risk indicators ............................................................................................. 8
35 Household indebtedness in Slovakia and in selected countries (%) ................................. 8
36 Changes in household financial assets .............................................................................. 8
37 Number of unemployed by income category .................................................................... 9
38 Employment in selected sectors - index ............................................................................ 9
39 Expected employment in selected sectors - index ............................................................. 9
40 Real wages in selected sectors - index .............................................................................. 9
41 The consumer confidence index and its components ........................................................ 9
42 Non-performing household loans ...................................................................................... 9
43 Loan-to-value (LTV) ratio ............................................................................................... 10
44 Housing affordability index............................................................................................. 10
Market risk and liquidity risk indicators ............................................................................. 10
45 Value at Risk for investments in different types of financial instruments ...................... 10
46 Sensitivity to different risk types in the banking sector .................................................. 10
47 Sensitivity to different risk types in the sector of PFMC funds ...................................... 11
48 Sensitivity to different risk types in the SPMC funds sector .......................................... 11
49 Sensitivity to different risk types in the collective investment sector ............................. 11
50 Sensitivity of insurers' assets to different risk types ....................................................... 11
51 Loan-to-deposit ratio ....................................................................................................... 11
52 Liquid asset ratio ............................................................................................................. 11
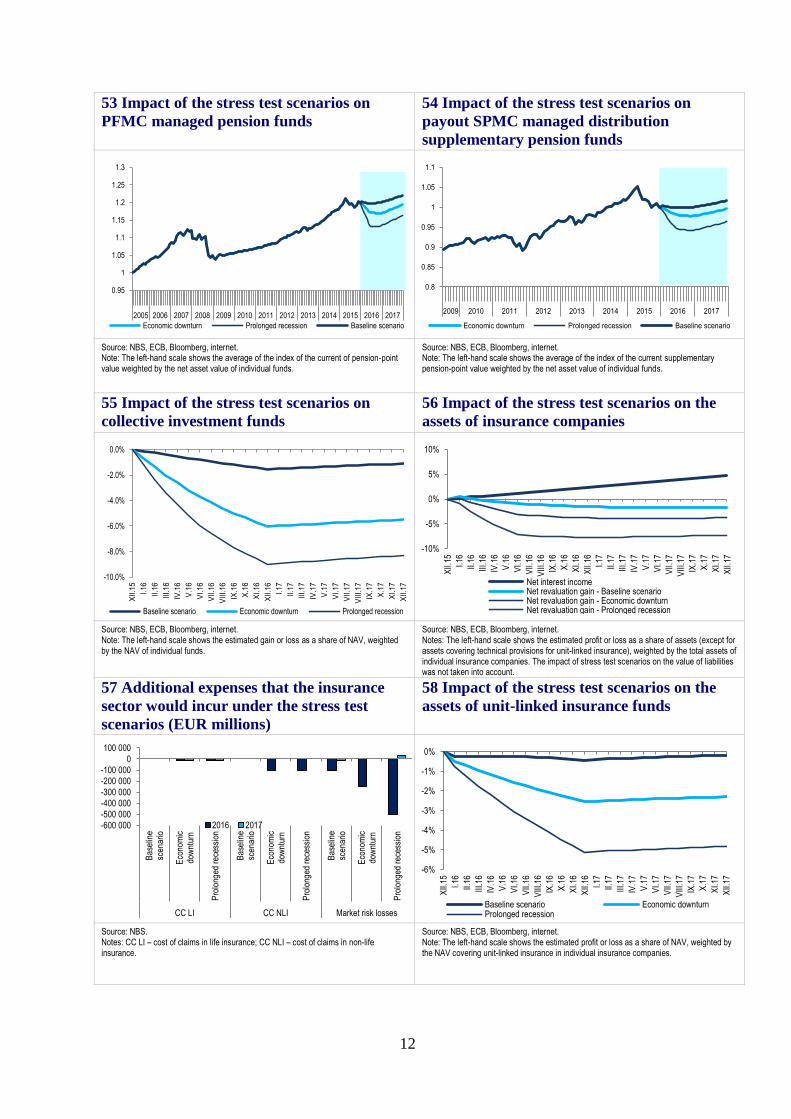
53 Impact of the stress test scenarios on PFMC managed pension funds ............................ 12
54 Impact of the stress test scenarios on payout SPMC managed distribution supplementary
pension funds ........................................................................................................................ 12
55 Impact of the stress test scenarios on collective investment funds ................................. 12
56 Impact of the stress test scenarios on the assets of insurance companies ....................... 12
57 Additional expenses that the insurance sector would incur under the stress test scenarios
.............................................................................................................................................. 12
58 Impact of the stress test scenarios on the assets of unit-linked insurance funds ............. 12
General note:
'Index: 31 December 2015 = 1' means that the given index was normalized so that its value on the specified
date (31 December 2015) was equal to 1.

3
Macroeconomic risk indicators
1 Manufacturing Purchasing Managers’
Index (PMI) in selected economies
2 Services Purchasing Managers’ Index
(PMI) in selected economies
Source: Bloomberg. Note: PMI (Purchasing Managers’ Index) is an indicator of the economic health of the manufacturing or service sector: an index value of more than 50 represents expansion, while a value of below 50 represents contraction.
Source: Bloomberg. Note: PMI (Purchasing Managers’ Index) is an indicator of the economic health of the manufacturing or service sector: an index value of more than 50 represents expansion, while a value of below 50 represents contraction.
3 Consumer confidence indicators in the
United States
4 Economic sentiment indicators in the euro
area
Source: Bloomberg. Note: The chart refers to US consumer confidence indices produced by two different institutions.
Source: Bloomberg. Notes: ESI is the Economic Sentiment Indicator compiled by the European Commission. ZEW represents the economic sentiment indicator compiled by a private company ZEW (Zentrum für Europäische Wirtschaftsforschung).
5 Unemployment rates in selected economies 6 Consumer price inflation in selected
economies
Source: Eurostat, Bureau of Labor Statistics. Note: Seasonally adjusted.
Source: Eurostat, Bureau of Labor Statistics. Note: Year-on-year percentage changes in the consumer price indices.
30
35
40
45
50
55
60
65
1.07
7.07
1.08
7.08
1.09
7.09
1.10
7.10
1.11
7.11
1.12
7.12
1.13
7.13
1.14
7.14
1.15
7.15
1.16
Euro area United States China
30
35
40
45
50
55
60
65
1.07
7.07
1.08
7.08
1.09
7.09
1.10
7.10
1.11
7.11
1.12
7.12
1.13
7.13
1.14
7.14
1.15
7.15
1.16
Euro area United States
20
40
60
80
100
120
1.07
7.07
1.08
7.08
1.09
7.09
1.10
7.10
1.11
7.11
1.12
7.12
1.13
7.13
1.14
7.14
1.15
7.15
1.16
Conference Board Consumer Confidence Index
University of Michigan Consumer Sentiment Index
-80
-60
-40
-20
0
20
40
60
80
60
70
80
90
100
110
1.08
7.08
1.09
7.09
1.10
7.10
1.11
7.11
1.12
7.12
1.13
7.13
1.14
7.14
1.15
7.15
1.16
ESI ZEW (right-hand scale)
3%
5%
7%
9%
11%
13%
15%
1.07
7.07
1.08
7.08
1.09
7.09
1.10
7.10
1.11
7.11
1.12
7.12
1.13
7.13
1.14
7.14
1.15
7.15
1.16
Euro area United States Slovakia
-1%
0%
1%
2%
3%
4%
5%
1.10
5.10
9.10
1.11
5.11
9.11
1.12
5.12
9.12
1.13
5.13
9.13
1.14
5.14
9.14
1.15
5.15
9.15
1.16
Euro area United States Slovakia

4
7 Industrial production indices in selected
economies
8 Retail sales indices in selected economies
Source: Eurostat, US Federal Reserve. Notes: Rebalanced (average: 2007 = 100). Seasonally adjusted.
Source: Eurostat, US Department of Commerce. Notes: Rebalanced (average 2007 = 100). Seasonally adjusted.
9 General government balances of EU
countries in 2014 (%)
10 Gross government debt of EU countries in
the third quarter of 2015 (%)
Source: Eurostat. Note: Balance is expressed as a percentage of GDP.
Source: Eurostat. Note: Gross government debt is expressed as a percentage of shares of GDP.
Financial market risk indicators
11 Price commodity indices (31. 12. 2014 = 1) 12 Exchange rate indices (31. 12. 2013 = 1)
Source: Bloomberg, NBS.
Source: Bloomberg, NBS.
80
90
100
110
120
130
140
150
1.07
7.07
1.08
7.08
1.09
7.09
1.10
7.10
1.11
7.11
1.12
7.12
1.13
7.13
1.14
7.14
1.15
7.15
1.16
Euro area United States Slovakia Germany
90
95
100
105
110
115
120
125
1.07
7.07
1.08
7.08
1.09
7.09
1.10
7.10
1.11
7.11
1.12
7.12
1.13
7.13
1.14
7.14
1.15
7.15
1.16
Euro area United States Slovakia Germany
-10
-8
-6
-4
-2
0
2
Cyp
rus
Por
tuga
lS
pain
Bul
garia
UK
Cro
atia
Slo
veni
aIr
elan
dF
ranc
eG
reec
eP
olan
dF
inla
ndB
elgi
umIta
lyS
lova
kia
Aus
tria
Eur
o ar
eaH
unga
ryN
ethe
rland
sM
alta
Cze
ch R
epub
licS
wed
enLa
tvia
Rom
ania
Lith
uani
aG
erm
any
Est
onia
Luxe
mbo
urg
Den
mar
k
020406080
100120140160180
Gre
ece
Ital
yP
ortu
gal
Cyp
rus
Bel
gium
Irel
and
Spa
inF
ranc
eE
uro
area UK
Cro
atia
Aus
tria
Slo
veni
aH
unga
ryG
erm
any
Mal
taN
ethe
rland
sF
inla
ndS
lova
kia
Pol
and
Sw
eden
Den
mar
kC
zech
Rep
ublic
Lith
uani
aR
oman
iaLa
tvia
Bul
garia
Luxe
mbo
urg
Est
onia
0.0
0.2
0.4
0.6
0.8
1.0
1.2
1.4
1.6
1.8
2.0
1.1.2010 1.1.2011 1.1.2012 1.1.2013 1.1.2014 1.1.2015 1.1.2016
Brent oil price index
Gold price index
0.7
0.8
0.9
1.0
1.1
1.2
1.1.20071.1.20081.1.20091.1.20101.1.20111.1.20121.1.20131.1.20141.1.20151.1.2016
USD / EURCZK / EURHUF / EUR

5
13 Equity indices (31. 12. 2014 = 1) 14 Share price indices of the parent
institutions of the five largest domestic banks
(31. 12. 2014 = 1)
Source: Bloomberg, NBS. Source: Bloomberg, NBS.
15 Yield curve slopes in selected economies
(p. p.)
16 Volatility of equity indices
Source: Bloomberg, NBS. Notes: The yield curve slope is expressed as the difference between the yield to maturity on 10-year and 3-month government bonds. p. p. – percentage points
Source: Bloomberg.
17 CDS spread indices (b. p.)
18 CDSs of the parent institutions of the
largest Slovak banks (b. p.)
Source: Bloomberg, NBS. Note: b. p. – basis points
Source: Bloomberg, NBS. Note: b. p. – basis points
0.0
0.2
0.4
0.6
0.8
1.0
1.2
1.4 EUROSTOXX
NIKKEI
S&P 500
0.0
0.5
1.0
1.5
2.0
2.5
3.0
3.5
1.1.2010 1.1.2011 1.1.2012 1.1.2013 1.1.2014 1.1.2015 1.1.2016
UniCreditKBCErste BankRZBIntesa
-2
-1
0
1
2
3
4
5
Germany
United States0
20
40
60
80
100
VIX
VSTOXX
0
50
100
150
200
250
300
350
400
iTraxx Europe 5Y
iTraxx SeniorFinancials 5Y
0
100
200
300
400
500
600
700
1.1.
2007
1.1.
2008
1.1.
2009
1.1.
2010
1.1.
2011
1.1.
2012
1.1.
2013
1.1.
2014
1.1.
2015
1.1.
2016
Max. - min. CDS spreads of parent banks
iTraxx Senior Financials 5Y
6
19 Three-month rates and the OIS spread
(%, p. p.)
20 Inflation-linked swap prices (p. p.)
Source: Bloomberg, NBS. Note: p.p. – percentage points.
Source: Bloomberg, NBS. Notes: Inflation-linked swaps are swap transactions in which one counterparty pays a fixed rate (a swap price) and the other pays a rate corresponding to the return on a selected price index. The inflation-linked swap price is calculated on a non-coupon basis. p.p. – percentage points.
21 Credit spreads on 5-year government
bonds issued by lower-rated countries (p. p.)
22 Credit spreads on 5-year government
bonds issued by selected central European
countries and Germany (p. p.)
Source: Bloomberg, NBS. Notes: The vertical scales shows differences between the yield on 5-year bonds issued by the given countries and 5-year OIS rates, representing a 5-year interest rate on high-rated bonds. p. p. – percentage points.
Source: Bloomberg, NBS. Notes: The Chart shows the difference between yields on 5-year government bonds denominated in the domestic currencies of the given countries and 5-year swap rates for the respective currencies. p. p. – percentage points.
Corporate credit risk indicators
23 Exports and the business environment
24 Exports and corporate sales
Source: NBS, OECD, Statistics Office of the SR. Source: Ministry of Economy of the SR, NBS, OECD, Statistical Office of the SR.
-1
0
1
2
3
4
5
6
OIS Spread
3-month EURIBOR
3-month OIS
-6
-4
-2
0
2
4
5-year swaps linked to euro area inflation5-year swaps linked to US inflation1-year swaps linked to euro area inflation1-year swaps linked to US inflation
0
10
20
30
40
50
60
0
5
10
15
20
25 IrelandItalySpainPortugalGreece (right-hand scale)
-2
-1
0
1
2
3SlovakiaCzech RepublicPolandGermany
-40%
-30%
-20%
-10%
0%
10%
20%
30%
40%
70
80
90
100
110
120
130
12-0
8
6-09
12-0
9
6-10
12-1
0
6-11
12-1
1
6-12
12-1
2
6-13
12-1
3
6-14
12-1
4
6-15
12-1
5
Business sentiment - Slovakia (left-hand scale)Business sentiment - main trading partners (left-hand scale)Economic Sentiment Indicator (left-hand scale)Exports - annual percentage changes (right-hand scale)
-40%
-30%
-20%
-10%
0%
10%
20%
30%
40%
12-0
8
6-09
12-0
9
6-10
12-1
0
6-11
12-1
1
6-12
12-1
2
6-13
12-1
3
6-14
12-1
4
6-15
12-1
5
Exports - annual percentage change
Sales in total - annual percentage change
Sales weighted by bank exposures - annual percentage change

7
25 Sales in selected sectors compared with
their level for the period 06/2007 to 06/2008
26 Corporate loans and sales
Source: Statistical Office of the SR. Source: NBS, Statistical Office of the SR.
27 Interest rate spreads on new loans to
NFCs
28 Non-performing loans and default rates
Source: NBS, European Banking Federation. Note: The spread is defined as the difference between the monthly EURIBOR rate and the average rate on new loans in the respective category.
Source: NBS. Notes: Data on the right-hand scale are in EUR mil. Default rates refer to the number/volume of loans re-categorised as defaulted to the number/volume of non-defaulted loans at the beginning of the period under review.
29 Loans at risk 30 Debt-service burden and its components
Source: NBS. Note: The chart shows the interquartile range.
Source: NBS, SO SR. Note: Data on the right-hand scale are in EUR mil.
20%
45%
70%
95%
120%
12-08 12-09 12-10 12-11 12-12 12-13 12-14 12-15
Corporate sector in total IndustryConstruction Trade and motor vehicle salesHotels and restaurants -25%
-15%
-5%
5%
15%
12-0
8
6-09
12-0
9
6-10
12-1
0
6-11
12-1
1
6-12
12-1
2
6-13
12-1
3
6-14
12-1
4
6-15
12-1
5
Total sales - annual percentage change
Year-on-year growth in loans from domestic banks to non-financial corporations
-1%
0%
1%
2%
3%
4%
5%
6%
12-0
9
6-10
12-1
0
6-11
12-1
1
6-12
12-1
2
6-13
12-1
3
6-14
12-1
4
6-15
12-1
5
EURIBOR 1MLoans of up to and including €0.25 million Loans of more than €0.25 million, up to and including €1 million Loans of more than €1 million
-150
-100
-50
0
50
100
150
200
0%
1%
2%
3%
4%
5%
6%
7%
8%
9%
10%12
-08
6-09
12-0
9
6-10
12-1
0
6-11
12-1
1
6-12
12-1
2
6-13
12-1
3
6-14
12-1
4
6-15
12-1
5
Th
ou
san
ds
Change in the amount of NPL - m/m (right-hand scale)Default rates (amount of loans)Default rates (number of loans)Ratio of non-performing loans
0%
2%
4%
6%
8%
10%
3.11
6.11
9.11
12.1
1
3.12
6.12
9.12
12.1
2
3.13
6.13
9.13
12.1
3
3.14
6.14
9.14
12.1
4
3.15
6.15
9.15
Average Median
0
25
50
75
100
125
150
-8%
-6%
-4%
-2%
0%
2%
4%
1-08 7-08 1-09 7-09 1-10 7-10 1-11 7-11 1-12 7-12 1-13 7-13 1-14 7-14 1-15 7-15
Interest rate (left-hand scale)Loans (left-hand scale)Sales (left-hand scale)Debt-service burden - domestic loans - indexDebt-service burden at 2008 rates - domestic loans - indexDebt burden-service - total loans - indexDebt-service burden at 2008 rates - total loans - index
8
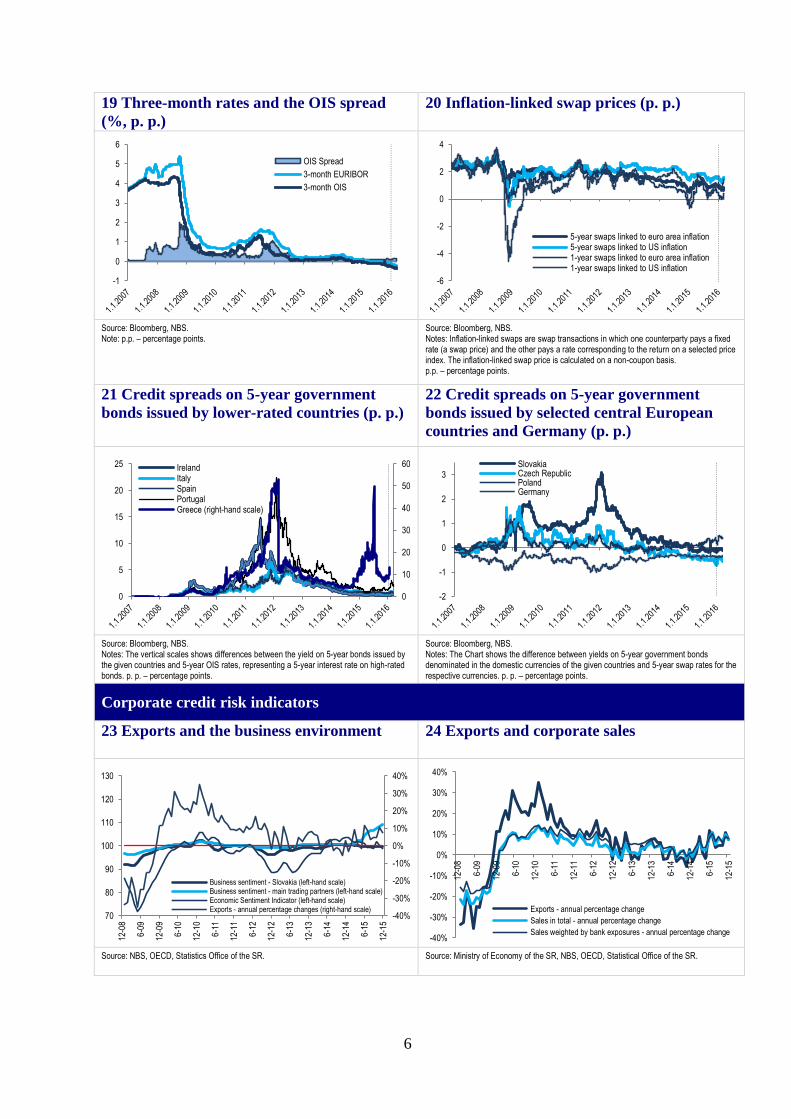
31 Commercial real estate: price and
vacancy rates in the office segment
32 Commercial real estate: sales in the
residential segment (new flats)
Source: CBRE, NBS. Note: The chart shows prices and vacancy rates in Bratislava.
Source: Lexxus, NBS.
Note: The chart shows developments in Bratislava.
33 Comparison of corporate balance sheets
and sales
34 Liabilities of non-financial corporations
Source: NBS, Statistical Office of the SR. Source: NBS.
Note: NFC - non-financial corporations.
Household credit risk indicators
35 Household indebtedness in Slovakia and
in selected countries (%)
36 Changes in household financial assets
Source: Eurostat. Note: The indicator is calculated as the ratio of households’ total debt to their disposable income.
Source: NBS. Notes: Data refer to quarter-on-quarter changes. Owing to a methodological change, historical data are not available as yet.
0%
10%
20%
0
10
20
3.09
6.09
9.09
12.0
93.
106.
109.
1012
.10
3.11
6.11
9.11
12.1
13.
126.
129.
1212
.12
3.13
6.13
9.13
12.1
33.
146.
149.
1412
.14
3.15
6.15
9.15
12.1
5
Price per m2 / month - inner centre
Price per m2 / month - outer centre
Price per m2 / month - outside centre
Office vacancy rate - inner centre (right-hand scale)
Office vacancy rate - outer centre (right-hand scale)
Office vacancy rate - outside centre (right-hand scale)
(EUR/m2)
0%
10%
20%
30%
40%
50%
60%
70%
80%
90%
-600
-300
0
300
600
900
1 200
3.09
9.09
3.10
9.10
3.11
9.11
3.12
9.12
3.13
9.13
3.14
9.14
3.15
9.15
Number of flats whose sale fell through (left-hand scale)
Number of flats sold in a given quarter (left-hand scale)
Residential segment: Net sales of flats (left-hand scale)
Share of projects with positive net sales of flats (right-hand scale)
0%
10%
20%
30%
12.0
7
6.08
12.0
8
6.09
12.0
9
6.10
12.1
0
6.11
12.1
1
6.12
12.1
2
6.13
12.1
3
6.14
12.1
4
6.15
Ratio of domestic bank loans (excl. Loans for commercial property) to annual sales
Ratio of domestic bank loans to annual sales
Ratio of external funding to annual sales0%
10%
20%
30%
40%
50%
3.04
3.05
3.06
3.07
3.08
3.09
3.10
3.11
3.12
3.13
3.14
3.15
External funding as a share of total NFC liabilitiesFunds from the rest of the world sector as a share of NFC liabilities
0
20
40
60
80
100
120
2000 2001 2002 2003 2004 2005 2006 2007 2008 2009 2010 2011 2012 2013 2014
Euro area (19 countries) SlovakiaVisegrad Four Baltic states
0%
10%
20%
30%
40%
50%
60%
70%
-1000
0
1000
2000
3000
4000
13Q1 13Q2 13Q3 13Q4 14Q1 14Q2 14Q3 14Q4 15Q1 15Q2 15Q3
Th
ou
san
ds
Curenncy and depositsShares and other equityInsurance, pension and standardised guarantee systemsRatio of financial liabilities to financial assets (right-hand scale)Currency and deposits as a share of financial assets (right-hand scale)
(mil. EUR)

9
37 Number of unemployed by income
category
38 Employment in selected sectors - index
Source: Central Office of Labour, Social Affairs and Family of the SR. Notes: Left-hand and right-hand scales: Numbers of job seekers are in thousands. Household income categories – categorisation based on the KZAM employment classification and KZAM income data; it consists of three categories: higher-income category (income of over €800 per month) – legislators, senior officials and managers, scientists, professionals, technicians, health professionals, and teaching professionals; middle-income category (income between €600 and €800 per month) – office workers, craft and skilled workers, processors, and plant and machinery operators; lower-income category (income of up to €600) – service and retail workers, agricultural and forestry workers, auxiliary and unskilled workers.
Source: Statistical Office of the SR. Note: Year-on-year changes.
39 Expected employment in selected sectors -
index
40 Real wages in selected sectors - index
Source: Statistical Office of the SR.
Source: Statistical Office of the SR. Note: HICP - Harmonised Index of Consumer Prices, change on the same period of the previous year.
41 The consumer confidence index and its
components
42 Non-performing household loans
Source: Statistical Office of the SR. Source: NBS.
Note: Left-hand scale: ratio of non-performing household loans to total household loans.
0
20
40
60
80
100
120
0
2
4
6
8
10
12
I.07
X.0
7V
II.08
IV.0
9I.1
0X
.10
VII.
11IV
.12
I.13
X.1
3V
II.14
IV.1
5I.
16 I.07
X.0
7V
II.08
IV.0
9I.1
0X
.10
VII.
11IV
.12
I.13
X.1
3V
II.14
IV.1
5I.
16
Th
ou
san
ds
Higher-income category Medium-income category
Lower-income category
Inflow of job seekers Number of job seekers
80
85
90
95
100
105
110
I.10
IV.1
0
VII.
10
X.1
0
I.11
IV.1
1
VII.
11
X.1
1
I.12
IV.1
2
VII.
12
X.1
2
I.13
IV.1
3
VII.
13
X.1
3
I.14
IV.1
4
VII.
14
X.1
4
I.15
IV.1
5
VII.
15
X.1
5
Manufacturing Construction
Wholesale trade Retail trade
Accomodation Transportation and storage
-60
-40
-20
0
20
40
I.08
V.0
8
IX.0
8
I.09
V.0
9
IX.0
9
I.10
V.1
0
IX.1
0
I.11
V.1
1
IX.1
1
I.12
V.1
2
IX.1
2
I.13
V.1
3
IX.1
3
I.14
V.1
4
IX.1
4
I.15
V.1
5
IX.1
5
I.16
Services Industry Trade Construction
98
100
102
104
106
85
90
95
100
105
110
I.09
V.0
9
IX.0
9
I.10
V.1
0
IX.1
0
I.11
V.1
1
IX.1
1
I.12
V.1
2
IX.1
2
I.13
V.1
3
IX.1
3
I.14
V.1
4
IX.1
4
I.15
V.1
5
IX.1
5
I.16
HICP (righ-hand scale)IndustryConstructionWholesale trade except for motor vehiclesRetail trade except for motor vehicles
-60
-30
0
30
60
90
I.08
V.0
8
IX.0
8
I.09
V.0
9
IX.0
9
I.10
V.1
0
IX.1
0
I.11
V.1
1
IX.1
1
I.12
V.1
2
IX.1
2
I.13
V.1
3
IX.1
3
I.14
V.1
4
IX.1
4
I.15
V.1
5
IX.1
5
I.16
Consumer confidence indexExpected financial situation of householdsExpected economic situation in SlovakiaExpected unemploymentExpected household savings
-90
-60
-30
0
30
60
90
120
150
0
2
4
6
8
10
I.09
IV.0
9V
II.09
X.0
9I.1
0IV
.10
VII.
10X
.10
I.11
IV.1
1V
II.11
X.1
1I.1
2IV
.12
VII.
12X
.12
I.13
IV.1
3V
II.13
X.1
3I.1
4IV
.14
VII.
14X
.14
I.15
IV.1
5V
II.15
X.1
5
Upper and lower quartiles of the non-performing loan (NPL) ratioWeighted average of the NPL ratioMonth-on-month changes in the amount of NPLs (right-hand scale)
(%) (mil. EUR)
(mil. EUR)
10
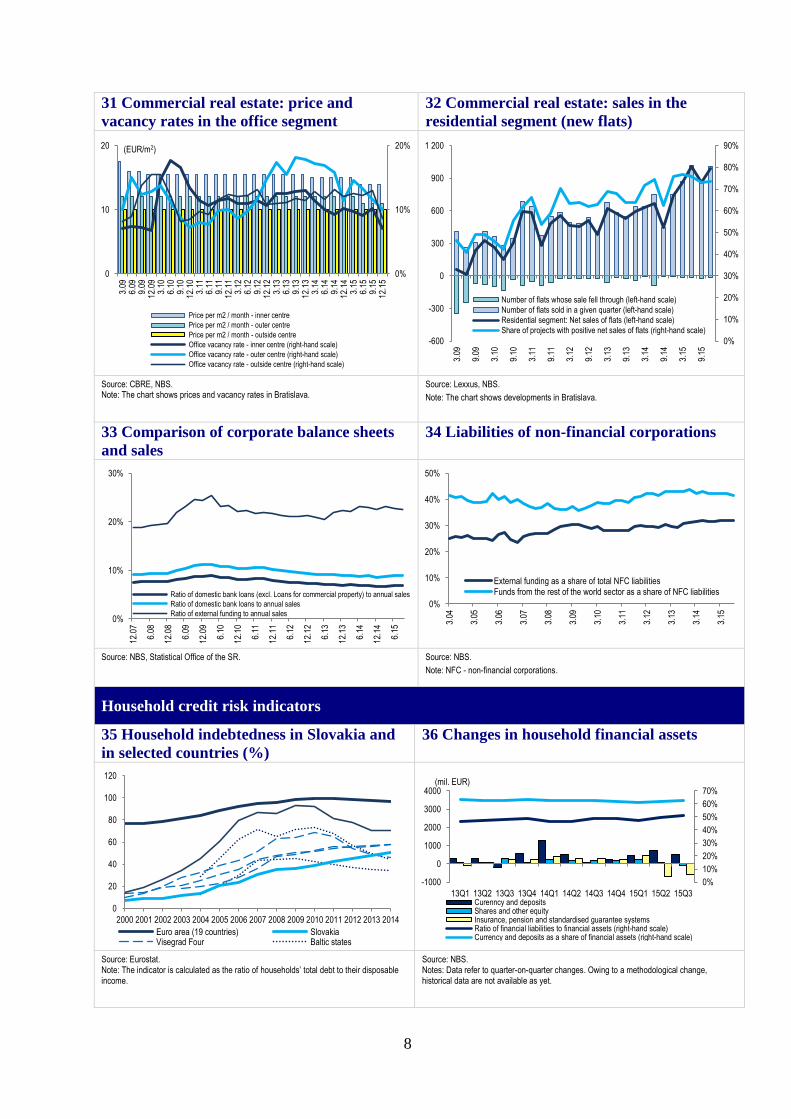
43 Loan-to-value (LTV) ratio 44 Housing affordability index
Source: NBS. Note: Loan-to-value ratio is the loan value divided by the value of the loan collateral.
Source: NBS, Statistical Office of the SR. Notes: Housing affordability index is an index representing the ratio of disposable income to loan instalments. The calculation of disposable income takes into account the average wage and average expenditure of households; the calculation of the instalment amount takes into account the average apartment price, average interest rate, average maturity, and a constant LTV ratio (75%). The calculation methodology for the housing affordability index is set out in the following paper: Rychtárik, Š., Krčmár, M. (2011), “Vývoj na trhu úverov na bývanie a jeho interpretácia” (Developments in the housing loan market and their interpretation), Nehnuteľnosti a bývanie 2010 (Real Estate and Housing), Vol. no 2, Bratislava, 2010.
Market risk and liquidity risk indicators
45 Value at Risk for investments in different
types of financial instruments
46 Sensitivity to different risk types in the
banking sector
Source: Bloomberg, NBS. Notes: The data represent the loss (as a percentage of the given investment) that should not be exceeded over a period of 10 days at a confidence level of 99%. This loss was determined on the basis of a risk factor volatility calculation, using exponentially weighted moving averages.
Source: Bloomberg, NBS. Notes: The data represent the loss (as a percentage of assets) under each scenario of the sensitivity analysis. Sensitivity analysis includes four scenarios as follows: share prices declining by 10%; other currencies weakening against the euro by 5%; interest rates increasing in parallel by 0.3 percentage point; and credit spreads on bonds issued by Greece, Portugal, Ireland, Spain and Italy widening by 2 percentage points. In the case of interest rate risk, the impact on the revaluation of instruments valued at fair value is calculated, as is the impact on the economic value that represents the revaluation of all financial instruments. Individual risk types include also indirect risks that institutions are exposed to by virtue of their investments in common fund shares/units. The calculation of these indirect risks was based on the mapping of the different types of fund units/shares into the set of risk factors. Light blue line represents data as at 31 December 2014, dark blue line represents data as at 31 December 2015.
50%
60%
70%
80%
90%
100%
I.10
IV.1
0
VII.
10
X.1
0
I.11
IV.1
1
VII.
11
X.1
1
I.12
IV.1
2
VII.
12
X.1
2
I.13
IV.1
3
VII.
13
X.1
3
I.14
IV.1
4
VII.
14
X.1
4
I.15
IV.1
5
VII.
15
X.1
5
Interquartile range Banks in total Large banks0
50
100
150
200
250
12.04 12.05 12.06 12.07 12.08 12.09 12.10 12.11 12.12 12.13 12.14 12.15
Housing affordability index (constant LTV)
Housing affordability index (variable LTV)
0%
10%
20%
30%
40%Open position in USD
5-year euro-denominated bonds
Equity investments (EUROSTOXX index)
0.0%
0.5%
1.0%
1.5%
2.0%Foreign exchange risk
Equity risk
Interest rate risk(revaluation)
Interest rate risk (changein economic value)
Credit spread change risk

11
47 Sensitivity to different risk types in the
sector of PFMC funds
48 Sensitivity to different risk types in the
SPMC funds sector
Source: Bloomberg, NBS. Notes: The data represent the loss (as a percentage of NAV) under each scenario of the sensitivity analysis. The sensitivity analysis is described in the note to chart 46. Light blue line represents data as at 31 December 2014, dark blue line represents data as at 31 December 2015.
Source: Bloomberg, NBS. Notes: The data represent the loss (as a percentage of NAV) under each scenario of the sensitivity analysis. The sensitivity analysis is described in the note to chart 46. Light blue line represents data as at 31 December 2014, dark blue line represents data as at 31 December 2015.
49 Sensitivity to different risk types in the
collective investment sector
50 Sensitivity of insurers' assets to different
risk types
Source: Bloomberg, NBS. Notes: The data represent the loss (as a percentage of NAV) under each scenario of the sensitivity analysis. The sensitivity analysis is described in the note to chart 46. Light blue line represents data as at 31 December 2014, dark blue line represents data as at 31 December 2015.
Source: Bloomberg, NBS. Notes: The data represent the percentage decline in the value of assets under each scenario of the sensitivity analysis. The sensitivity analysis is described in the note to chart 46. Light blue line represents data as at 31 December 2014, dark blue line represents data as at 31 December 2015.
51 Loan-to-deposit ratio 52 Liquid asset ratio
Source: NBS.
Source: NBS.
0.0%
0.5%
1.0%
1.5%
2.0%Foreign exchange risk
Equity risk
Interest rate risk(revaluation)
Interest rate risk(change in economic
value)
Credit spread changerisk
0.0%
0.5%
1.0%
1.5%
2.0%Foreign exchange risk
Equity risk
Interest rate risk(revaluation)
Interest rate risk(change in economic
value)
Credit spread changerisk
0.0%
0.5%
1.0%
1.5%
2.0%Foreign exchange risk
Equity risk
Interest rate risk(revaluation)
Interest rate risk(change in economic
value)
Credit spread changerisk
0.0%
0.5%
1.0%
1.5%
2.0%Foreign exchange risk
Equity risk
Interest rate risk(revaluation)
Interest rate risk (changein economic value)
Credit spread changerisk
0%
20%
40%
60%
80%
100%
Loan-to-deposit ratio
Loan-to-deposit ratio (excluding mortgage bonds issued)
Loan-to-deposit ratio (retail sector)
0
0.5
1
1.5
2
2.5
3
12-09 12-10 12-11 12-12 12-13 12-14 12-15
Banking sector - median
Retail banks - median
Weighted average
12
53 Impact of the stress test scenarios on
PFMC managed pension funds
54 Impact of the stress test scenarios on
payout SPMC managed distribution
supplementary pension funds
Source: NBS, ECB, Bloomberg, internet. Note: The left-hand scale shows the average of the index of the current of pension-point value weighted by the net asset value of individual funds.
Source: NBS, ECB, Bloomberg, internet. Note: The left-hand scale shows the average of the index of the current supplementary pension-point value weighted by the net asset value of individual funds.
55 Impact of the stress test scenarios on
collective investment funds
56 Impact of the stress test scenarios on the
assets of insurance companies
Source: NBS, ECB, Bloomberg, internet. Note: The left-hand scale shows the estimated gain or loss as a share of NAV, weighted by the NAV of individual funds.
Source: NBS, ECB, Bloomberg, internet. Notes: The left-hand scale shows the estimated profit or loss as a share of assets (except for assets covering technical provisions for unit-linked insurance), weighted by the total assets of individual insurance companies. The impact of stress test scenarios on the value of liabilities was not taken into account.
57 Additional expenses that the insurance
sector would incur under the stress test
scenarios (EUR millions)
58 Impact of the stress test scenarios on the
assets of unit-linked insurance funds
Source: NBS. Notes: CC LI – cost of claims in life insurance; CC NLI – cost of claims in non-life insurance.
Source: NBS, ECB, Bloomberg, internet. Note: The left-hand scale shows the estimated profit or loss as a share of NAV, weighted by the NAV covering unit-linked insurance in individual insurance companies.
0.95
1
1.05
1.1
1.15
1.2
1.25
1.3
2005 2006 2007 2008 2009 2010 2011 2012 2013 2014 2015 2016 2017
Economic downturn Prolonged recession Baseline scenario
0.8
0.85
0.9
0.95
1
1.05
1.1
2009 2010 2011 2012 2013 2014 2015 2016 2017
Economic downturn Prolonged recession Baseline scenario
-10.0%
-8.0%
-6.0%
-4.0%
-2.0%
0.0%
XII
.15
I.16
II.1
6
III.1
6
IV.1
6
V.1
6
VI.
16
VII
.16
VII
I.1
6
IX.1
6
X.1
6
XI.
16
XII
.16
I.17
II.1
7
III.1
7
IV.1
7
V.1
7
VI.
17
VII
.17
VII
I.1
7
IX.1
7
X.1
7
XI.
17
XII
.17
Baseline scenario Economic downturn Prolonged recession
-10%
-5%
0%
5%
10%X
II.15 I.16
II.16
III.1
6
IV.1
6
V.1
6
VI.1
6
VII.
16
VIII
.16
IX.1
6
X.1
6
XI.1
6
XII.
16 I.17
II.17
III.1
7
IV.1
7
V.1
7
VI.1
7
VII.
17
VIII
.17
IX.1
7
X.1
7
XI.1
7
XII.
17
Net interest incomeNet revaluation gain - Baseline scenarioNet revaluation gain - Economic downturnNet revaluation gain - Prolonged recession
-600 000
-500 000
-400 000
-300 000
-200 000
-100 000
0
100 000
Bas
elin
esc
enar
io
Eco
nom
icdo
wnt
urn
Pro
long
ed r
eces
sion
Bas
elin
esc
enar
io
Eco
nom
icdo
wnt
urn
Pro
long
ed r
eces
sion
Bas
elin
esc
enar
io
Eco
nom
icdo
wnt
urn
Pro
long
ed r
eces
sion
CC LI CC NLI Market risk losses
2016 2017
-6%
-5%
-4%
-3%
-2%
-1%
0%
XII.
15 I.16
II.16
III.1
6
IV.1
6
V.1
6
VI.1
6
VII.
16
VIII
.16
IX.1
6
X.1
6
XI.1
6
XII.
16 I.17
II.17
III.1
7
IV.1
7
V.1
7
VI.1
7
VII.
17
VIII
.17
IX.1
7
X.1
7
XI.1
7
XII.
17
Baseline scenario Economic downturnProlonged recession
Related Documents