Macroglial and retinal changes in hypercholesterolemic rabbits after normalization of cholesterol levels Ana I. Ramı ´rez a , Juan J. Salazar a , Rosa De Hoz a , Blanca Rojas a , Emilio Ruiz b , Teresa Tejerina b , Jose M. Ramı ´rez a, * , Alberto Trivin ˜o a, * a Instituto de Investigaciones Oftalmolo ´gicas Ramo ´n Castroviejo, School of Medicine, Complutense University, Ciudad Universitaria s/n UCM, 28040 Madrid, Spain b Department of Pharmacology, School of Medicine, Complutense University, Ciudad Universitaria s/n UCM, 28040 Madrid, Spain Received 4 May 2006; accepted in revised form 22 July 2006 Available online 26 September 2006 Abstract This study evaluates hypercholesterolemic rabbits, examining the retinal changes in Mu ¨ller cells and astrocytes as well as their variations after a period of normal blood-cholesterol values induced by a standard diet. New Zealand rabbits were divided into three groups: G0, fed a standard diet; G1A, fed a 0.5% cholesterol-enriched diet for 8 months; and G1B, fed as G1A followed by standard diet for 6 months. Eyes were processed for transmission electron microscopy and immunohistochemistry (GFAP). While G1B resembled G0 more than did G1A, they shared alterations with G1A: a) as in G1A, Mu ¨ller cells were GFAP(þ), filled spaces left by axonal degeneration, formed glial scars and their nuclei were displaced to the nerve-fibre layer. The area occupied by the astrocytes associated with the nerve-fibre bundles (AANFB) and by perivascular astrocytes (PVA) in G1A and G1B was significantly lower than in controls. However, no significant differences in PVAwere found between G1A and G1B. In G1B, type I PVAwas absent and replaced by hypertrophic type II cells; b) Bruch’s membrane (BM) was thinner in G1B than in G1A; c) the retinal pigment epithelium (RPE) cytoplasm contained fewer lipids in G1B than in G1A; d) in G1A and G1B choriocapillaris and retinal vessel showed alterations with respect to G0; e) cell death and axonal degeneration in the retina were similar in G1A and G1B. The substitution of a hyperlipemic diet by a standard one normalizes blood-lipid levels. However, the persistence of damage at retinal vessels and BM-RPE could trigger chronic ischemia. Ó 2006 Elsevier Ltd. All rights reserved. Keywords: cholesterol-fed rabbit; retina; electron microscopy; immunohistochemistry; GFAP; Bruch’s membrane; astrocytes; Mu ¨ller cells 1. Introduction Recent studies have demonstrated the relationships between dietary fat and the promotion of vascular disease (SanGiovanni and Chew, 2005). Lipoprotein metabolism has also been associated with neurodegenerative disorders in rats (Ong et al., 2001) but preliminary results of the group of Flies- ler, did not show marked changes in apo-E knockout mice (Fliesler et al., 2000). Eukaryotic cells require sterols to achieve normal structure and function of their plasma membranes, and deviations from normal sterol composition can perturb these features and compromise cell and organism viability (Berring et al., 2005). Given that cholesterol is required by neurons, an intimate relationship could exist between cholesterol homeostasis and the development, main- tenance, and repair of these cells (Ong et al., 2001). The particular spatial arrangement of retinal macroglial cells (astrocytes and Mu ¨ller cells) that are intercalated between vasculature and neurons points to their importance in the uptake of nutrients from the circulation, metabolism, and transfer of energy to neurons (Stone and Dreher, 1987; Trivin ˜o et al., 1992; Ramı ´rez et al., 1994, 1996). Moreover, * Corresponding authors. Tel.: þ34 91 394 7080; fax: þ34 91 394 1359. E-mail addresses: [email protected] (J.M. Ramı ´rez), atrivino@med. ucm.es (A. Trivin ˜o). 0014-4835/$ - see front matter Ó 2006 Elsevier Ltd. All rights reserved. doi:10.1016/j.exer.2006.07.023 Experimental Eye Research 83 (2006) 1423e1438 www.elsevier.com/locate/yexer

Welcome message from author
This document is posted to help you gain knowledge. Please leave a comment to let me know what you think about it! Share it to your friends and learn new things together.
Transcript
Experimental Eye Research 83 (2006) 1423e1438www.elsevier.com/locate/yexer
Macroglial and retinal changes in hypercholesterolemic rabbits afternormalization of cholesterol levels
Ana I. Ramırez a, Juan J. Salazar a, Rosa De Hoz a, Blanca Rojas a, Emilio Ruiz b,Teresa Tejerina b, Jose M. Ramırez a,*, Alberto Trivino a,*
a Instituto de Investigaciones Oftalmologicas Ramon Castroviejo, School of Medicine, Complutense University,
Ciudad Universitaria s/n UCM, 28040 Madrid, Spainb Department of Pharmacology, School of Medicine, Complutense University, Ciudad Universitaria s/n UCM, 28040 Madrid, Spain
Received 4 May 2006; accepted in revised form 22 July 2006
Available online 26 September 2006
Abstract
This study evaluates hypercholesterolemic rabbits, examining the retinal changes in Muller cells and astrocytes as well as their variations aftera period of normal blood-cholesterol values induced by a standard diet. New Zealand rabbits were divided into three groups: G0, fed a standarddiet; G1A, fed a 0.5% cholesterol-enriched diet for 8 months; and G1B, fed as G1A followed by standard diet for 6 months. Eyes were processedfor transmission electron microscopy and immunohistochemistry (GFAP). While G1B resembled G0 more than did G1A, they shared alterationswith G1A: a) as in G1A, Muller cells were GFAP(þ), filled spaces left by axonal degeneration, formed glial scars and their nuclei were displacedto the nerve-fibre layer. The area occupied by the astrocytes associated with the nerve-fibre bundles (AANFB) and by perivascular astrocytes(PVA) in G1A and G1B was significantly lower than in controls. However, no significant differences in PVA were found between G1A and G1B.In G1B, type I PVA was absent and replaced by hypertrophic type II cells; b) Bruch’s membrane (BM) was thinner in G1B than in G1A; c) theretinal pigment epithelium (RPE) cytoplasm contained fewer lipids in G1B than in G1A; d) in G1A and G1B choriocapillaris and retinal vesselshowed alterations with respect to G0; e) cell death and axonal degeneration in the retina were similar in G1A and G1B. The substitution ofa hyperlipemic diet by a standard one normalizes blood-lipid levels. However, the persistence of damage at retinal vessels and BM-RPE couldtrigger chronic ischemia.� 2006 Elsevier Ltd. All rights reserved.
Keywords: cholesterol-fed rabbit; retina; electron microscopy; immunohistochemistry; GFAP; Bruch’s membrane; astrocytes; Muller cells
1. Introduction
Recent studies have demonstrated the relationshipsbetween dietary fat and the promotion of vascular disease(SanGiovanni and Chew, 2005). Lipoprotein metabolism hasalso been associated with neurodegenerative disorders in rats(Ong et al., 2001) but preliminary results of the group of Flies-ler, did not show marked changes in apo-E knockout mice(Fliesler et al., 2000). Eukaryotic cells require sterols to
* Corresponding authors. Tel.: þ34 91 394 7080; fax: þ34 91 394 1359.
E-mail addresses: [email protected] (J.M. Ramırez), atrivino@med.
ucm.es (A. Trivino).
0014-4835/$ - see front matter � 2006 Elsevier Ltd. All rights reserved.
doi:10.1016/j.exer.2006.07.023
achieve normal structure and function of their plasmamembranes, and deviations from normal sterol compositioncan perturb these features and compromise cell and organismviability (Berring et al., 2005). Given that cholesterol isrequired by neurons, an intimate relationship could existbetween cholesterol homeostasis and the development, main-tenance, and repair of these cells (Ong et al., 2001).
The particular spatial arrangement of retinal macroglialcells (astrocytes and Muller cells) that are intercalatedbetween vasculature and neurons points to their importancein the uptake of nutrients from the circulation, metabolism,and transfer of energy to neurons (Stone and Dreher, 1987;Trivino et al., 1992; Ramırez et al., 1994, 1996). Moreover,
1424 A.I. Ramırez et al. / Experimental Eye Research 83 (2006) 1423e1438
apoliprotein E (Apo E), which plays a central role in serum-cholesterol homeostasis through its ability to bind cholesterolwith other lipids and to mediate their transport into cells, isproduced by glial cells (Mahley, 1988).
Reactive gliosis, a general response to injury and inflamma-tion in the adult brain (Norton et al., 1992; Rungger-Brandleet al., 2000), is characterized by up-regulation of various kindsof molecules, the best known being glial fibrillary acidicprotein (GFAP) (Laping et al., 1994). The de novo expressionof GFAP by Muller cells of the retina is indicative of retinalimpairment, whether induced by glaucoma (Tanihara et al.,1997), retinal detachment (Okada et al., 1990; Lewis et al.,1994), diabetic retinopathy (Mizutani et al., 1998; Rungger-Brandle et al., 2000; Agardh et al., 2001) or age-relatedmacular degeneration (AMD) (Madigan et al., 1994; Guidryet al., 2002; Ramırez et al., 2001). By contrast, retinal astro-cytes may not only acquire gliotic features but may alsodecrease in number when there is either vessel damagewith increased permeability of the blood-retinal barrier(Chan-Ling and Stone, 1992) or a massive loss of neurons(Rungger-Brandle and Leuenberger, 1997).
Given the intricate metabolic interdependence betweenvessels, macroglial cells, and neurons, high cholesterol levelscould deregulate a number of cell functions in both macro-glial and neuronal cells. In a previous work, we reportedthat a cholesterol-enriched diet induces ultrastructuralchanges in neurons and macroglial cells of the rabbit retina(Trivino et al., 2006). Thus, in this study, we analyse and ex-amine qualitative and quantitative changes in astrocytes aswell as the response of Muller cells of rabbits fed with an en-riched cholesterol diet, in comparison with normal animals. Ina second step, we analyse the behaviour of astrocytes andMuller cells in the same group of animals after the normali-zation of lipid levels by switching the hyperlipemic diet toa standard one. Changes in the Bruch’s membrane (BM), ret-inal pigment epithelium (RPE), and retina, are compared withour previous findings in hypercholesterolemic rabbits (Trivinoet al., 2006).
2. Materials and methods
2.1. Experimental design
Thirty adult male New Zealand White rabbits weighing2.5 � 0.5 Kg were housed separately in cages in an air-conditioned room with a 12-h light/dark cycle. All animalswere fed a rabbit standard diet (carbohydrates 50%, fibre15.5%, protein 13.5%, moisture 11%, minerals 7%, and lipids3%; Panlab S.L. Barcelona, Spain) at least 7 days before thebeginning of the experiment and allowed ad libitum accessto water. The animals were divided into three groups: 1) Con-trol group (G0; n ¼ 10), rabbits fed the standard diet; 5animals were killed at 8 months (control for the age of the hy-percholesterolemic rabbits, G0A) and the other 5 at 14 months(control for the age of the reverted group, G0B). 2) Hypercho-lesterolemic rabbits (G1A; n ¼ 10), rabbits fed the standarddiet enriched with 0.5% cholesterol (U.A.R., Paris, France)
for 8 months. 3) Reverted group (G1B; n ¼ 10) rabbits feda rabbit standard diet enriched with 0.5% cholesterol(U.A.R., Paris, France) for 8 months, and then with the stan-dard diet for another 6 months.
Weight was recorded immediately before the experimentand monitored monthly thereafter. The same schedule wasused to track serum values of total cholesterol, triglycerides,phospholipids, high-density lipoproteins (HDL), low-densitylipoproteins (LDL) and very-low-density lipoproteins(VLDL) (Table 1).
Blood samples were taken from the marginal vein of the earand analysed with commercially available enzymatic kitsfollowing the manufacturer’s instruction. Briefly, phospho-lipids, triglycerides and total cholesterol ester were hydrolysedby enzymes, giving hydrogen peroxide, which was detectableby colorimetry. Lipoproteins were selectively separated byprecipitation with polymers (Bio Merieux, France) followedby detection by colorimetry.
The animals were killed with an overdose of sodium pento-barbital. Care and use of animals conformed to the ARVOguidelines for the use of animals in ophthalmic and visionresearch.
Eyes (n ¼ 60) were enucleated immediately after death andslit behind the limbus with a razor blade in order to facilitatepenetration of the fixative. For each animal, one of the eyeswas used for immunohistochemistry (n ¼ 30) and the otherone for electron microscopy (n ¼ 30).
2.2. Transmission electron microscopy (TEM)
Eyes were immersed in 2% glutaraldehyde in 0.1 Mphosphate buffer (PB), pH 7.4 at 4 �C for 5 h. After beingwashed in 0.1 M PB, the wall of the posterior segment ofthe eyes was diced into small pieces; this segment came
Table 1
Serum concentration of lipids
Group 0
(mg/100 ml)
Group 1A
(mg/100 ml)
Group 1B
(mg/100 ml)
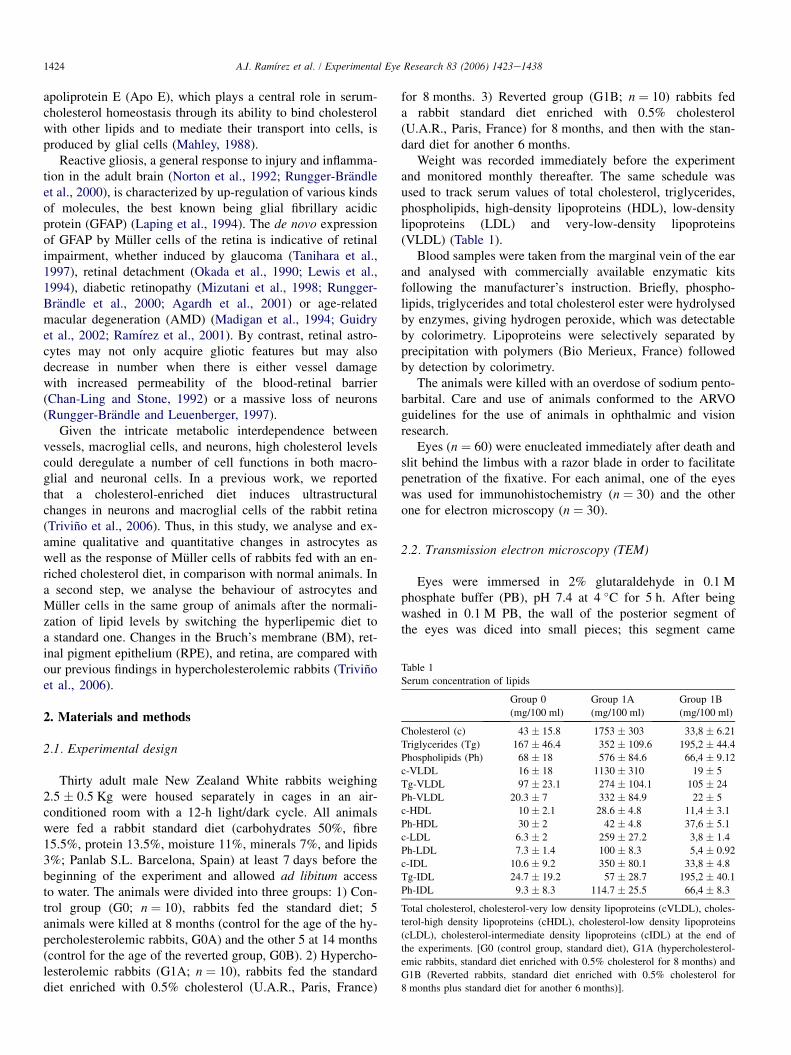
Cholesterol (c) 43 � 15.8 1753 � 303 33,8 � 6.21
Triglycerides (Tg) 167 � 46.4 352 � 109.6 195,2 � 44.4
Phospholipids (Ph) 68 � 18 576 � 84.6 66,4 � 9.12
c-VLDL 16 � 18 1130 � 310 19 � 5
Tg-VLDL 97 � 23.1 274 � 104.1 105 � 24
Ph-VLDL 20.3 � 7 332 � 84.9 22 � 5
c-HDL 10 � 2.1 28.6 � 4.8 11,4 � 3.1
Ph-HDL 30 � 2 42 � 4.8 37,6 � 5.1
c-LDL 6.3 � 2 259 � 27.2 3,8 � 1.4
Ph-LDL 7.3 � 1.4 100 � 8.3 5,4 � 0.92
c-IDL 10.6 � 9.2 350 � 80.1 33,8 � 4.8
Tg-IDL 24.7 � 19.2 57 � 28.7 195,2 � 40.1
Ph-IDL 9.3 � 8.3 114.7 � 25.5 66,4 � 8.3
Total cholesterol, cholesterol-very low density lipoproteins (cVLDL), choles-
terol-high density lipoproteins (cHDL), cholesterol-low density lipoproteins
(cLDL), cholesterol-intermediate density lipoproteins (cIDL) at the end of
the experiments. [G0 (control group, standard diet), G1A (hypercholesterol-
emic rabbits, standard diet enriched with 0.5% cholesterol for 8 months) and
G1B (Reverted rabbits, standard diet enriched with 0.5% cholesterol for
8 months plus standard diet for another 6 months)].
1425A.I. Ramırez et al. / Experimental Eye Research 83 (2006) 1423e1438
from both the medullated nerve fibre region (MNFR) or theperiphery of the retina, thus comprising all regions of theretina. These fragments were post-fixed in 1% osmium te-troxide in 0.1 M PB for 2 h at 4 �C. The tissues were thendehydrated in graded acetone and embedded in araldite.The semi-thin sections were stained with toluidine blue,and after selection the blocks were further trimmed for ul-tramicrotomy (Reichert OM-V3 ultramicrotome, Leica,Germany). The thin sections were contrasted with 2% uranylacetate in water and lead citrate (Reynolds, 1963), and ex-amined by transmission electron microscopy (TEM; Zeiss902 electron microscope).
2.3. Immunohistochemistry
Eyes were fixed with 4% paraformaldehyde in 0.1 M PBpH 7.4 for 4 h and then processed as retinal whole-mountswith the immunohistochemical protocol described elsewhere(Ramırez et al., 1994). A monoclonal antibody directed againstGFAP (clone GA-5, Sigma, St. Louis, Missouri, USA) was usedas a primary antibody in a 1/300 dilution.
2.4. Quantification of retinal astrocytes
2.4.1. Total area occupied by astrocytes in the MNFTo determine whether there was a decrease in the total area
of the retina occupied by astroglia in the MNFR, we useda computer-assisted morphometric analysis to quantifythe retinal area containing astrocytes. For this, we used theMetamorph Imaging System, version 4.5 computer program(� Universal Imaging Corps) in association with an Axioplan2 Imaging Microscope (Zeiss). Each slide studied had thewhole-mount of a hemi-retina and thus one of the MNFR.The entire hemi-retinal whole-mount was photographed usingthe motorized stage of the microscope to scan the wholepreparation along the x-y axis. Thus, all subsequentphotographed fields were contiguous and were taken systemat-ically to assure that no portion of the hemi-retinal whole-mount would be omitted or duplicated. Photographs weretaken with a 10� microscope objective. The images madeby this method allowed a complete reconstruction of eachimmunostained MNFR. Then, the outline of the immuno-stained tissue containing astrocytes was delineated by handusing one of the tools of the Metamorph program. Thus, thetotal area occupied by astrocytes in each MNFR was delimitedby a line. This total area was then calculated (in mm2) usingthe Metamorph program.
2.4.2. Area occupied by astrocytes associated with thenerve-fibre bundles (AANFB)
The morphology of this type of astrocyte hampered an ac-curate quantification of individual cells. Thus, to determinewhether there was a loss of this astroglial type, we measuredthe retinal area occupied by AANFB. The measurement wasmade in zones previously selected. The selection criterionwas that the zones should be free of perivascular astrocytes,
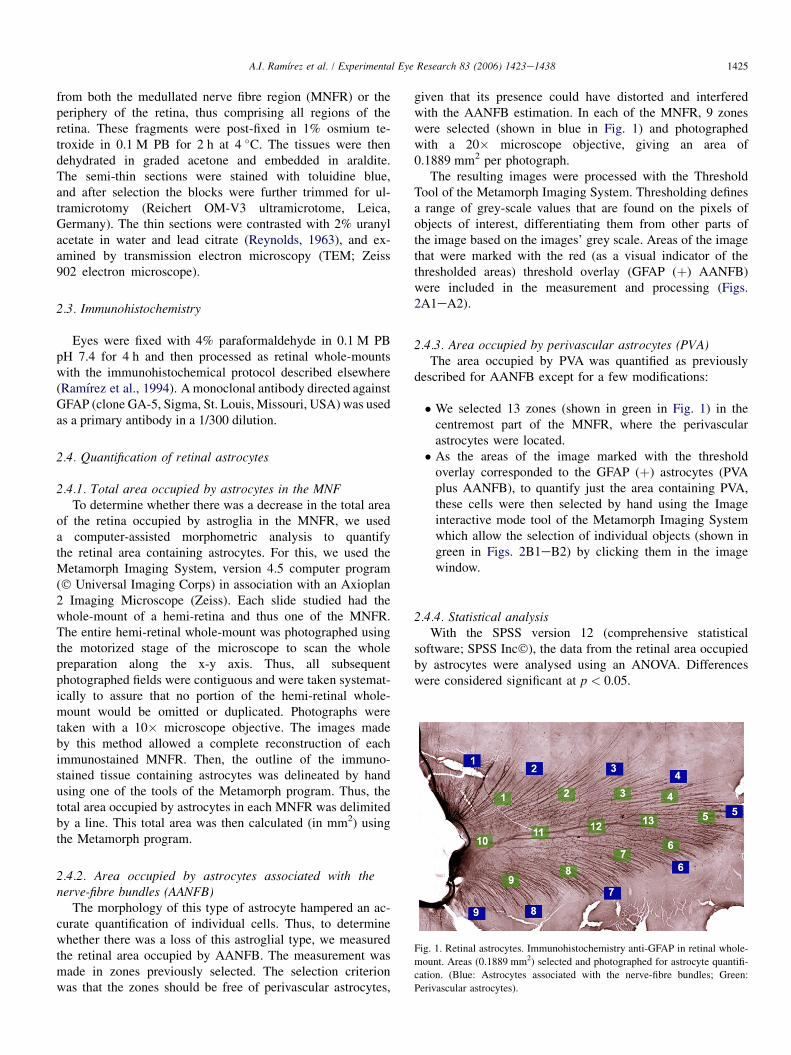
given that its presence could have distorted and interferedwith the AANFB estimation. In each of the MNFR, 9 zoneswere selected (shown in blue in Fig. 1) and photographedwith a 20� microscope objective, giving an area of0.1889 mm2 per photograph.
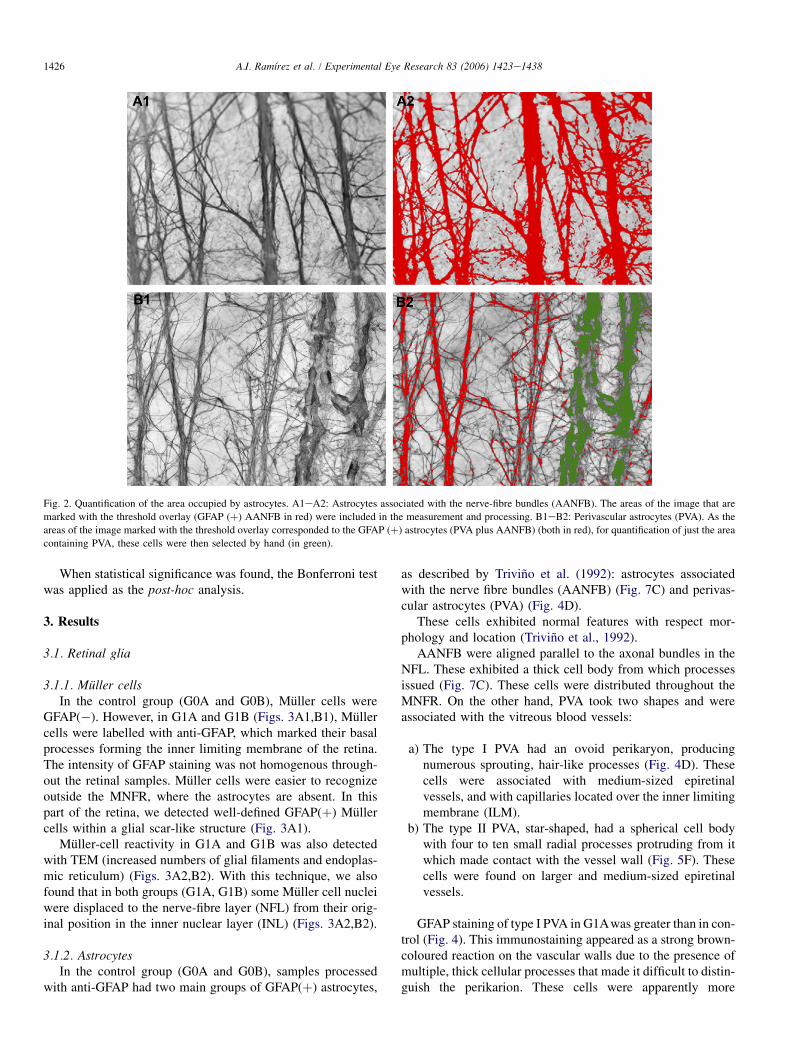
The resulting images were processed with the ThresholdTool of the Metamorph Imaging System. Thresholding definesa range of grey-scale values that are found on the pixels ofobjects of interest, differentiating them from other parts ofthe image based on the images’ grey scale. Areas of the imagethat were marked with the red (as a visual indicator of thethresholded areas) threshold overlay (GFAP (þ) AANFB)were included in the measurement and processing (Figs.2A1eA2).
2.4.3. Area occupied by perivascular astrocytes (PVA)The area occupied by PVA was quantified as previously
described for AANFB except for a few modifications:
� We selected 13 zones (shown in green in Fig. 1) in thecentremost part of the MNFR, where the perivascularastrocytes were located.� As the areas of the image marked with the threshold
overlay corresponded to the GFAP (þ) astrocytes (PVAplus AANFB), to quantify just the area containing PVA,these cells were then selected by hand using the Imageinteractive mode tool of the Metamorph Imaging Systemwhich allow the selection of individual objects (shown ingreen in Figs. 2B1eB2) by clicking them in the imagewindow.
2.4.4. Statistical analysisWith the SPSS version 12 (comprehensive statistical
software; SPSS Inc�), the data from the retinal area occupiedby astrocytes were analysed using an ANOVA. Differenceswere considered significant at p < 0.05.
Fig. 1. Retinal astrocytes. Immunohistochemistry anti-GFAP in retinal whole-
mount. Areas (0.1889 mm2) selected and photographed for astrocyte quantifi-
cation. (Blue: Astrocytes associated with the nerve-fibre bundles; Green:
Perivascular astrocytes).
1426 A.I. Ramırez et al. / Experimental Eye Research 83 (2006) 1423e1438
Fig. 2. Quantification of the area occupied by astrocytes. A1eA2: Astrocytes associated with the nerve-fibre bundles (AANFB). The areas of the image that are
marked with the threshold overlay (GFAP (þ) AANFB in red) were included in the measurement and processing. B1eB2: Perivascular astrocytes (PVA). As the
areas of the image marked with the threshold overlay corresponded to the GFAP (þ) astrocytes (PVA plus AANFB) (both in red), for quantification of just the area
containing PVA, these cells were then selected by hand (in green).
When statistical significance was found, the Bonferroni testwas applied as the post-hoc analysis.
3. Results
3.1. Retinal glia
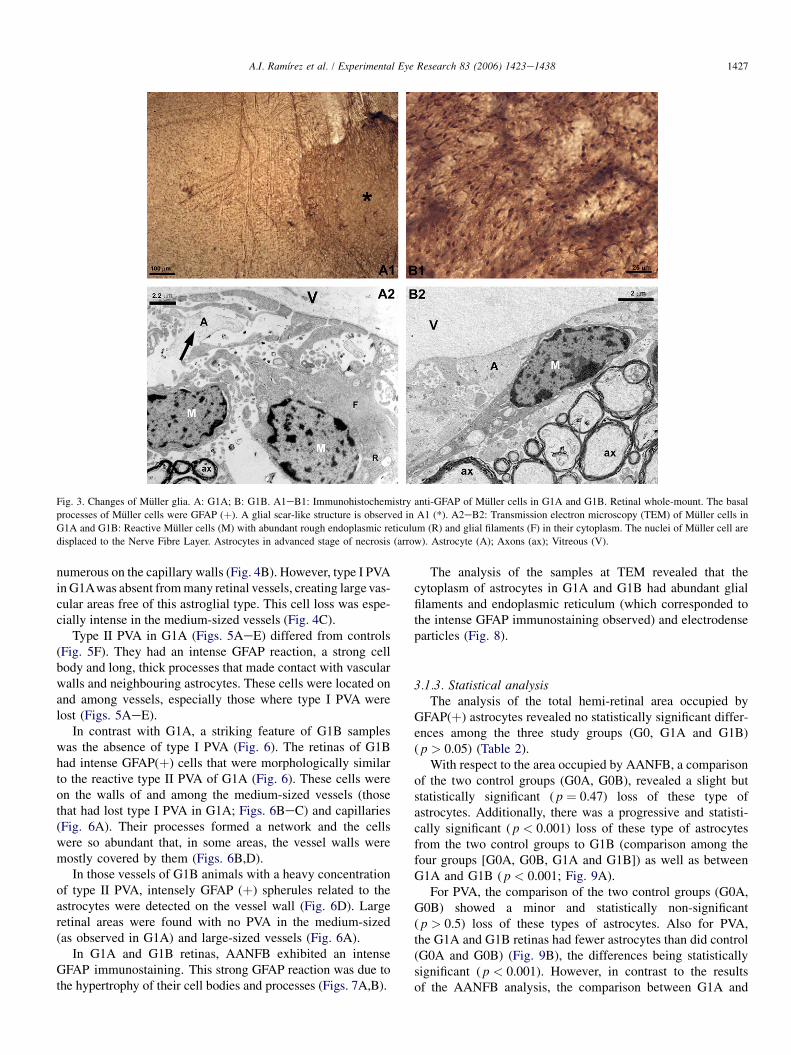
3.1.1. Muller cellsIn the control group (G0A and G0B), Muller cells were
GFAP(�). However, in G1A and G1B (Figs. 3A1,B1), Mullercells were labelled with anti-GFAP, which marked their basalprocesses forming the inner limiting membrane of the retina.The intensity of GFAP staining was not homogenous through-out the retinal samples. Muller cells were easier to recognizeoutside the MNFR, where the astrocytes are absent. In thispart of the retina, we detected well-defined GFAP(þ) Mullercells within a glial scar-like structure (Fig. 3A1).
Muller-cell reactivity in G1A and G1B was also detectedwith TEM (increased numbers of glial filaments and endoplas-mic reticulum) (Figs. 3A2,B2). With this technique, we alsofound that in both groups (G1A, G1B) some Muller cell nucleiwere displaced to the nerve-fibre layer (NFL) from their orig-inal position in the inner nuclear layer (INL) (Figs. 3A2,B2).
3.1.2. AstrocytesIn the control group (G0A and G0B), samples processed
with anti-GFAP had two main groups of GFAP(þ) astrocytes,
as described by Trivino et al. (1992): astrocytes associatedwith the nerve fibre bundles (AANFB) (Fig. 7C) and perivas-cular astrocytes (PVA) (Fig. 4D).
These cells exhibited normal features with respect mor-phology and location (Trivino et al., 1992).
AANFB were aligned parallel to the axonal bundles in theNFL. These exhibited a thick cell body from which processesissued (Fig. 7C). These cells were distributed throughout theMNFR. On the other hand, PVA took two shapes and wereassociated with the vitreous blood vessels:
a) The type I PVA had an ovoid perikaryon, producingnumerous sprouting, hair-like processes (Fig. 4D). Thesecells were associated with medium-sized epiretinalvessels, and with capillaries located over the inner limitingmembrane (ILM).
b) The type II PVA, star-shaped, had a spherical cell bodywith four to ten small radial processes protruding from itwhich made contact with the vessel wall (Fig. 5F). Thesecells were found on larger and medium-sized epiretinalvessels.
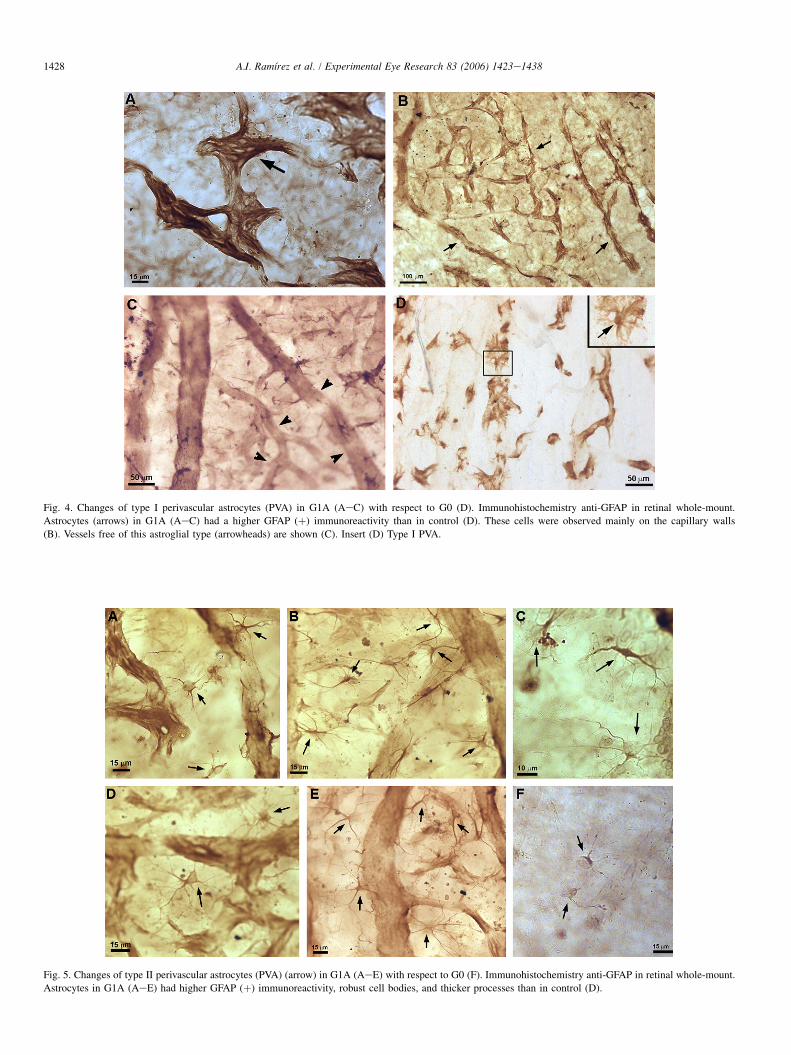
GFAP staining of type I PVA in G1Awas greater than in con-trol (Fig. 4). This immunostaining appeared as a strong brown-coloured reaction on the vascular walls due to the presence ofmultiple, thick cellular processes that made it difficult to distin-guish the perikarion. These cells were apparently more
1427A.I. Ramırez et al. / Experimental Eye Research 83 (2006) 1423e1438
Fig. 3. Changes of Muller glia. A: G1A; B: G1B. A1eB1: Immunohistochemistry anti-GFAP of Muller cells in G1A and G1B. Retinal whole-mount. The basal
processes of Muller cells were GFAP (þ). A glial scar-like structure is observed in A1 (*). A2eB2: Transmission electron microscopy (TEM) of Muller cells in
G1A and G1B: Reactive Muller cells (M) with abundant rough endoplasmic reticulum (R) and glial filaments (F) in their cytoplasm. The nuclei of Muller cell are
displaced to the Nerve Fibre Layer. Astrocytes in advanced stage of necrosis (arrow). Astrocyte (A); Axons (ax); Vitreous (V).
numerous on the capillary walls (Fig. 4B). However, type I PVAin G1Awas absent from many retinal vessels, creating large vas-cular areas free of this astroglial type. This cell loss was espe-cially intense in the medium-sized vessels (Fig. 4C).
Type II PVA in G1A (Figs. 5AeE) differed from controls(Fig. 5F). They had an intense GFAP reaction, a strong cellbody and long, thick processes that made contact with vascularwalls and neighbouring astrocytes. These cells were located onand among vessels, especially those where type I PVA werelost (Figs. 5AeE).
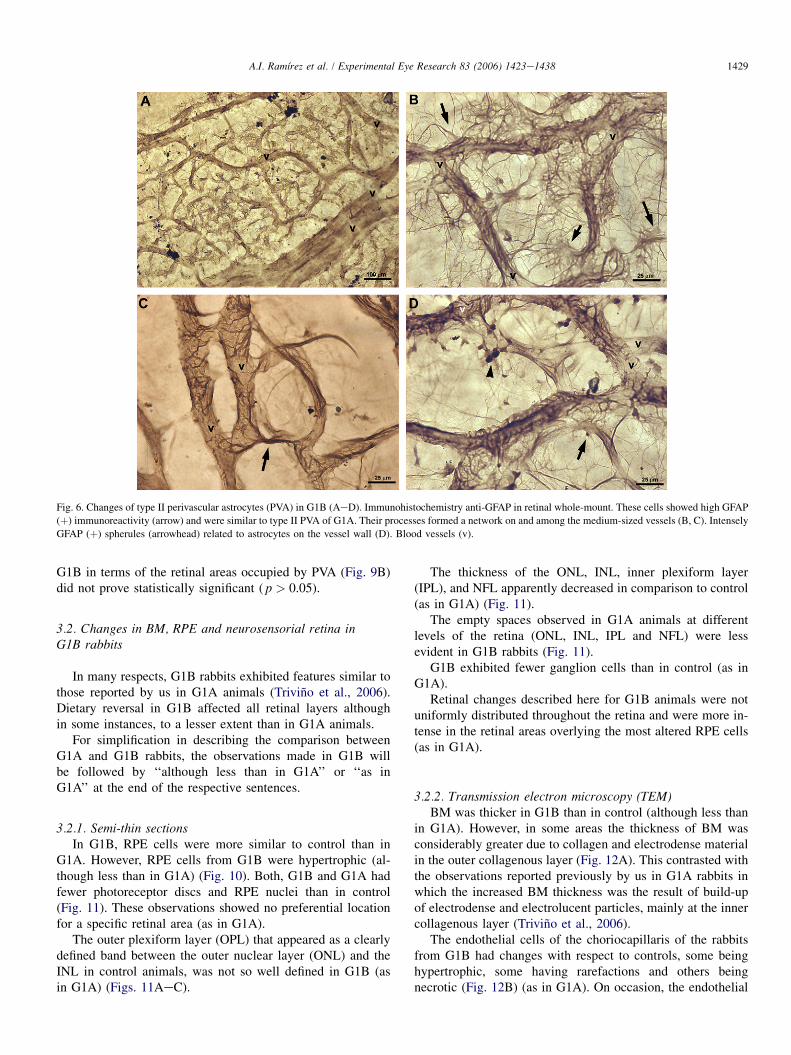
In contrast with G1A, a striking feature of G1B sampleswas the absence of type I PVA (Fig. 6). The retinas of G1Bhad intense GFAP(þ) cells that were morphologically similarto the reactive type II PVA of G1A (Fig. 6). These cells wereon the walls of and among the medium-sized vessels (thosethat had lost type I PVA in G1A; Figs. 6BeC) and capillaries(Fig. 6A). Their processes formed a network and the cellswere so abundant that, in some areas, the vessel walls weremostly covered by them (Figs. 6B,D).
In those vessels of G1B animals with a heavy concentrationof type II PVA, intensely GFAP (þ) spherules related to theastrocytes were detected on the vessel wall (Fig. 6D). Largeretinal areas were found with no PVA in the medium-sized(as observed in G1A) and large-sized vessels (Fig. 6A).
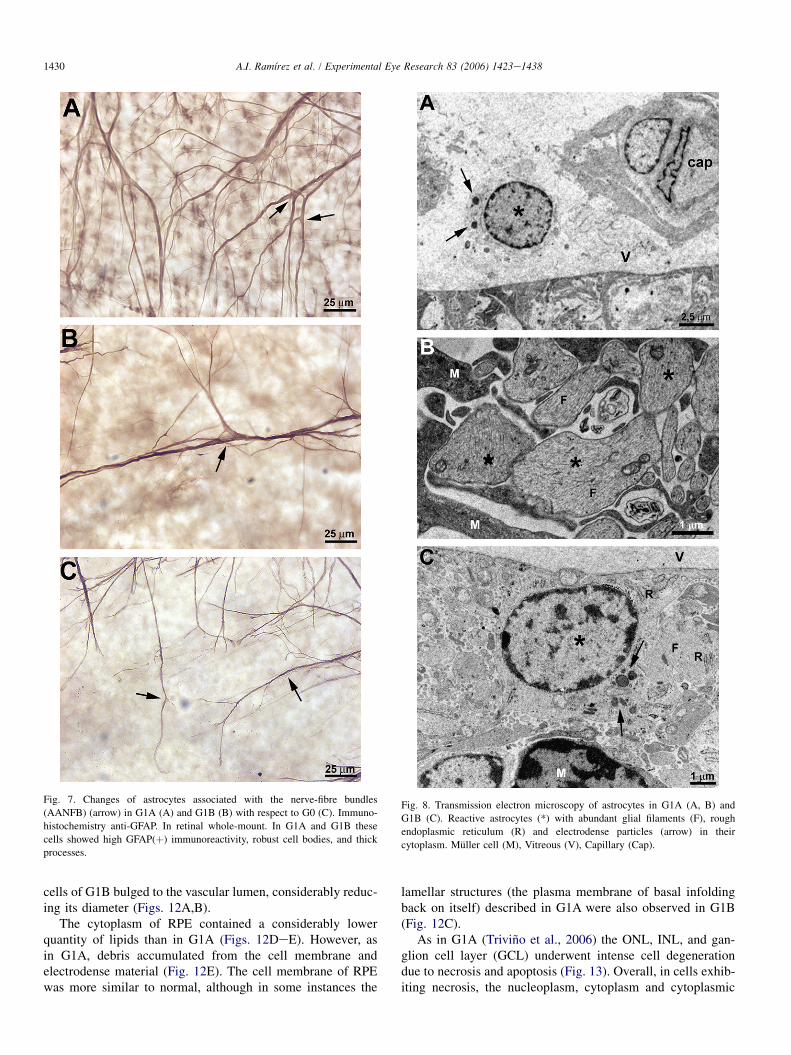
In G1A and G1B retinas, AANFB exhibited an intenseGFAP immunostaining. This strong GFAP reaction was due tothe hypertrophy of their cell bodies and processes (Figs. 7A,B).
The analysis of the samples at TEM revealed that thecytoplasm of astrocytes in G1A and G1B had abundant glialfilaments and endoplasmic reticulum (which corresponded tothe intense GFAP immunostaining observed) and electrodenseparticles (Fig. 8).
3.1.3. Statistical analysisThe analysis of the total hemi-retinal area occupied by
GFAP(þ) astrocytes revealed no statistically significant differ-ences among the three study groups (G0, G1A and G1B)( p > 0.05) (Table 2).
With respect to the area occupied by AANFB, a comparisonof the two control groups (G0A, G0B), revealed a slight butstatistically significant ( p ¼ 0.47) loss of these type ofastrocytes. Additionally, there was a progressive and statisti-cally significant ( p < 0.001) loss of these type of astrocytesfrom the two control groups to G1B (comparison among thefour groups [G0A, G0B, G1A and G1B]) as well as betweenG1A and G1B ( p < 0.001; Fig. 9A).
For PVA, the comparison of the two control groups (G0A,G0B) showed a minor and statistically non-significant( p > 0.5) loss of these types of astrocytes. Also for PVA,the G1A and G1B retinas had fewer astrocytes than did control(G0A and G0B) (Fig. 9B), the differences being statisticallysignificant ( p < 0.001). However, in contrast to the resultsof the AANFB analysis, the comparison between G1A and
1428 A.I. Ramırez et al. / Experimental Eye Research 83 (2006) 1423e1438
Fig. 4. Changes of type I perivascular astrocytes (PVA) in G1A (AeC) with respect to G0 (D). Immunohistochemistry anti-GFAP in retinal whole-mount.
Astrocytes (arrows) in G1A (AeC) had a higher GFAP (þ) immunoreactivity than in control (D). These cells were observed mainly on the capillary walls
(B). Vessels free of this astroglial type (arrowheads) are shown (C). Insert (D) Type I PVA.
Fig. 5. Changes of type II perivascular astrocytes (PVA) (arrow) in G1A (AeE) with respect to G0 (F). Immunohistochemistry anti-GFAP in retinal whole-mount.
Astrocytes in G1A (AeE) had higher GFAP (þ) immunoreactivity, robust cell bodies, and thicker processes than in control (D).
1429A.I. Ramırez et al. / Experimental Eye Research 83 (2006) 1423e1438
Fig. 6. Changes of type II perivascular astrocytes (PVA) in G1B (AeD). Immunohistochemistry anti-GFAP in retinal whole-mount. These cells showed high GFAP
(þ) immunoreactivity (arrow) and were similar to type II PVA of G1A. Their processes formed a network on and among the medium-sized vessels (B, C). Intensely
GFAP (þ) spherules (arrowhead) related to astrocytes on the vessel wall (D). Blood vessels (v).
G1B in terms of the retinal areas occupied by PVA (Fig. 9B)did not prove statistically significant ( p > 0.05).
3.2. Changes in BM, RPE and neurosensorial retina inG1B rabbits
In many respects, G1B rabbits exhibited features similar tothose reported by us in G1A animals (Trivino et al., 2006).Dietary reversal in G1B affected all retinal layers althoughin some instances, to a lesser extent than in G1A animals.
For simplification in describing the comparison betweenG1A and G1B rabbits, the observations made in G1B willbe followed by ‘‘although less than in G1A’’ or ‘‘as inG1A’’ at the end of the respective sentences.
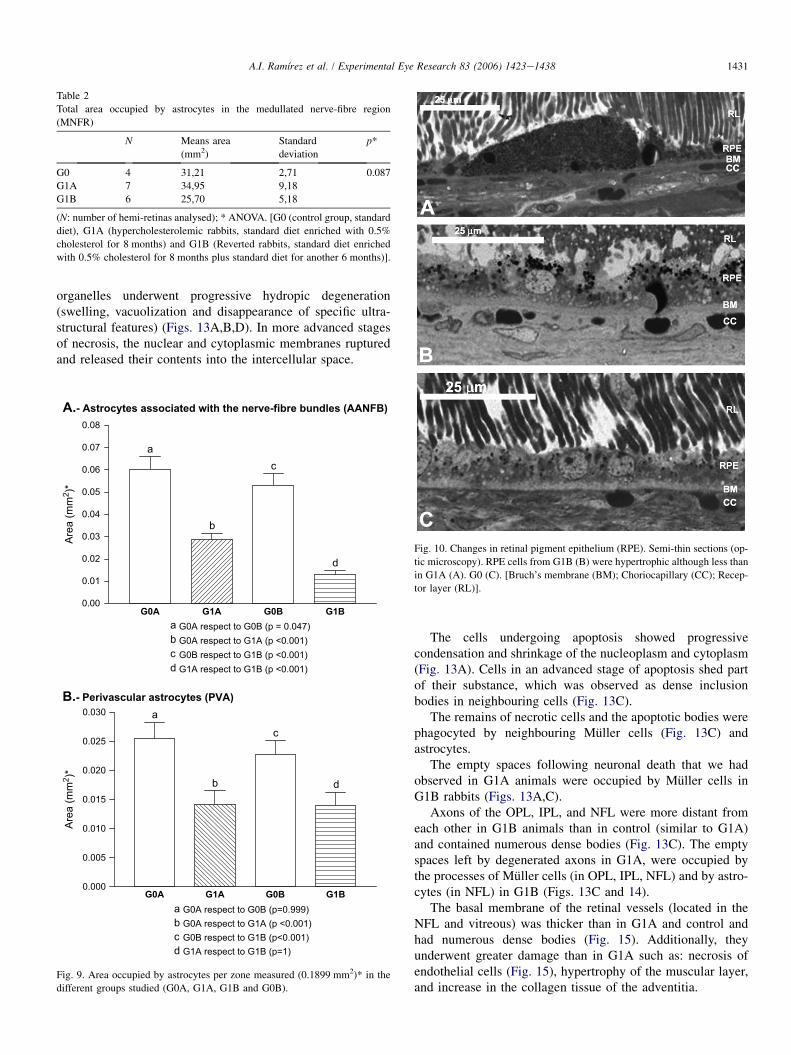
3.2.1. Semi-thin sectionsIn G1B, RPE cells were more similar to control than in
G1A. However, RPE cells from G1B were hypertrophic (al-though less than in G1A) (Fig. 10). Both, G1B and G1A hadfewer photoreceptor discs and RPE nuclei than in control(Fig. 11). These observations showed no preferential locationfor a specific retinal area (as in G1A).
The outer plexiform layer (OPL) that appeared as a clearlydefined band between the outer nuclear layer (ONL) and theINL in control animals, was not so well defined in G1B (asin G1A) (Figs. 11AeC).
The thickness of the ONL, INL, inner plexiform layer(IPL), and NFL apparently decreased in comparison to control(as in G1A) (Fig. 11).
The empty spaces observed in G1A animals at differentlevels of the retina (ONL, INL, IPL and NFL) were lessevident in G1B rabbits (Fig. 11).
G1B exhibited fewer ganglion cells than in control (as inG1A).
Retinal changes described here for G1B animals were notuniformly distributed throughout the retina and were more in-tense in the retinal areas overlying the most altered RPE cells(as in G1A).
3.2.2. Transmission electron microscopy (TEM)BM was thicker in G1B than in control (although less than
in G1A). However, in some areas the thickness of BM wasconsiderably greater due to collagen and electrodense materialin the outer collagenous layer (Fig. 12A). This contrasted withthe observations reported previously by us in G1A rabbits inwhich the increased BM thickness was the result of build-upof electrodense and electrolucent particles, mainly at the innercollagenous layer (Trivino et al., 2006).
The endothelial cells of the choriocapillaris of the rabbitsfrom G1B had changes with respect to controls, some beinghypertrophic, some having rarefactions and others beingnecrotic (Fig. 12B) (as in G1A). On occasion, the endothelial
1430 A.I. Ramırez et al. / Experimental Eye Research 83 (2006) 1423e1438
cells of G1B bulged to the vascular lumen, considerably reduc-ing its diameter (Figs. 12A,B).
The cytoplasm of RPE contained a considerably lowerquantity of lipids than in G1A (Figs. 12DeE). However, asin G1A, debris accumulated from the cell membrane andelectrodense material (Fig. 12E). The cell membrane of RPEwas more similar to normal, although in some instances the
Fig. 7. Changes of astrocytes associated with the nerve-fibre bundles
(AANFB) (arrow) in G1A (A) and G1B (B) with respect to G0 (C). Immuno-
histochemistry anti-GFAP. In retinal whole-mount. In G1A and G1B these
cells showed high GFAP(þ) immunoreactivity, robust cell bodies, and thick
processes.
lamellar structures (the plasma membrane of basal infoldingback on itself) described in G1A were also observed in G1B(Fig. 12C).
As in G1A (Trivino et al., 2006) the ONL, INL, and gan-glion cell layer (GCL) underwent intense cell degenerationdue to necrosis and apoptosis (Fig. 13). Overall, in cells exhib-iting necrosis, the nucleoplasm, cytoplasm and cytoplasmic
Fig. 8. Transmission electron microscopy of astrocytes in G1A (A, B) and
G1B (C). Reactive astrocytes (*) with abundant glial filaments (F), rough
endoplasmic reticulum (R) and electrodense particles (arrow) in their
cytoplasm. Muller cell (M), Vitreous (V), Capillary (Cap).
1431A.I. Ramırez et al. / Experimental Eye Research 83 (2006) 1423e1438
organelles underwent progressive hydropic degeneration(swelling, vacuolization and disappearance of specific ultra-structural features) (Figs. 13A,B,D). In more advanced stagesof necrosis, the nuclear and cytoplasmic membranes rupturedand released their contents into the intercellular space.
A.- Astrocytes associated with the nerve-fibre bundles (AANFB)
0.00
0.01
0.02
0.03
0.04
0.05
0.06
0.07
0.08
G0A G1A G0B G1B
G0A G1A G0B G1B
a
b
c
d
a G0A respect to G0B (p = 0.047)b G0A respect to G1A (p <0.001)c G0B respect to G1B (p <0.001)d G1A respect to G1B (p <0.001)
Area
(mm
2 )*
Area
(mm
2 )*
B.- Perivascular astrocytes (PVA)
0.000
0.005
0.010
0.015
0.020
0.025
0.030 a
b
a G0A respect to G0B (p=0.999)b G0A respect to G1A (p <0.001)c G0B respect to G1B (p<0.001)d G1A respect to G1B (p=1)
c
d
Fig. 9. Area occupied by astrocytes per zone measured (0.1899 mm2)* in the
different groups studied (G0A, G1A, G1B and G0B).
Table 2
Total area occupied by astrocytes in the medullated nerve-fibre region
(MNFR)
N Means area
(mm2)
Standard
deviation
p*
G0 4 31,21 2,71 0.087
G1A 7 34,95 9,18
G1B 6 25,70 5,18
(N: number of hemi-retinas analysed); * ANOVA. [G0 (control group, standard
diet), G1A (hypercholesterolemic rabbits, standard diet enriched with 0.5%
cholesterol for 8 months) and G1B (Reverted rabbits, standard diet enriched
with 0.5% cholesterol for 8 months plus standard diet for another 6 months)].
The cells undergoing apoptosis showed progressivecondensation and shrinkage of the nucleoplasm and cytoplasm(Fig. 13A). Cells in an advanced stage of apoptosis shed partof their substance, which was observed as dense inclusionbodies in neighbouring cells (Fig. 13C).
The remains of necrotic cells and the apoptotic bodies werephagocyted by neighbouring Muller cells (Fig. 13C) andastrocytes.
The empty spaces following neuronal death that we hadobserved in G1A animals were occupied by Muller cells inG1B rabbits (Figs. 13A,C).
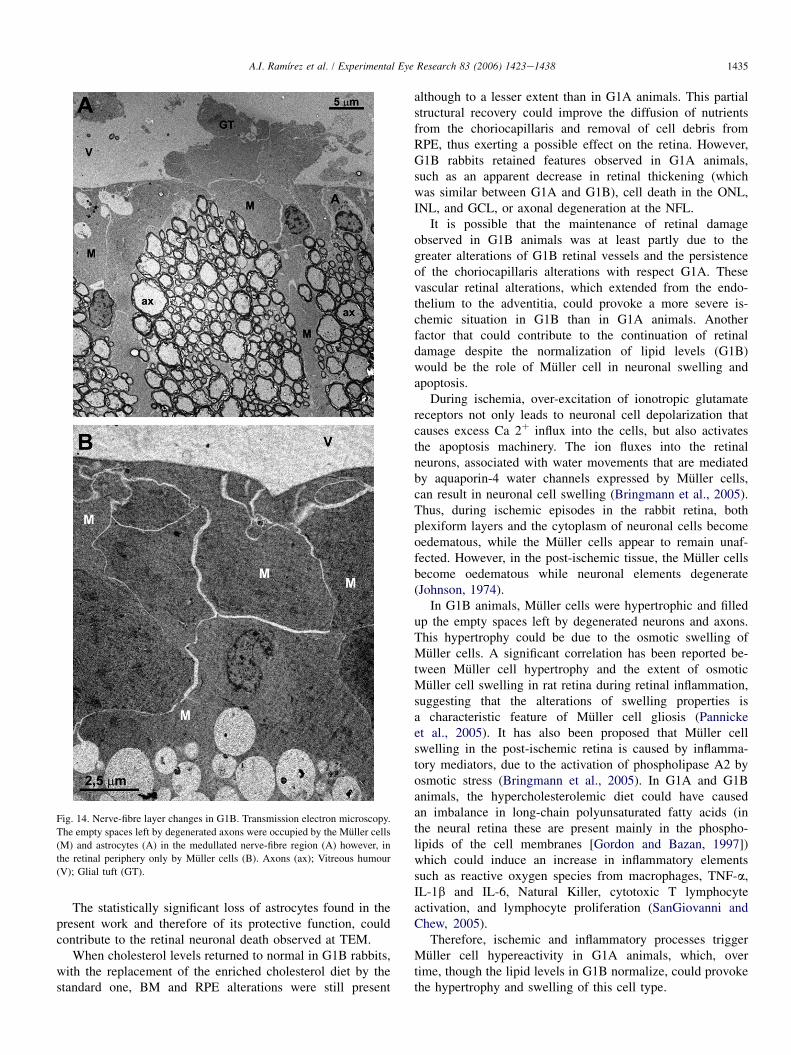
Axons of the OPL, IPL, and NFL were more distant fromeach other in G1B animals than in control (similar to G1A)and contained numerous dense bodies (Fig. 13C). The emptyspaces left by degenerated axons in G1A, were occupied bythe processes of Muller cells (in OPL, IPL, NFL) and by astro-cytes (in NFL) in G1B (Figs. 13C and 14).
The basal membrane of the retinal vessels (located in theNFL and vitreous) was thicker than in G1A and control andhad numerous dense bodies (Fig. 15). Additionally, theyunderwent greater damage than in G1A such as: necrosis ofendothelial cells (Fig. 15), hypertrophy of the muscular layer,and increase in the collagen tissue of the adventitia.
Fig. 10. Changes in retinal pigment epithelium (RPE). Semi-thin sections (op-
tic microscopy). RPE cells from G1B (B) were hypertrophic although less than
in G1A (A). G0 (C). [Bruch’s membrane (BM); Choriocapillary (CC); Recep-
tor layer (RL)].
1432 A.I. Ramırez et al. / Experimental Eye Research 83 (2006) 1423e1438
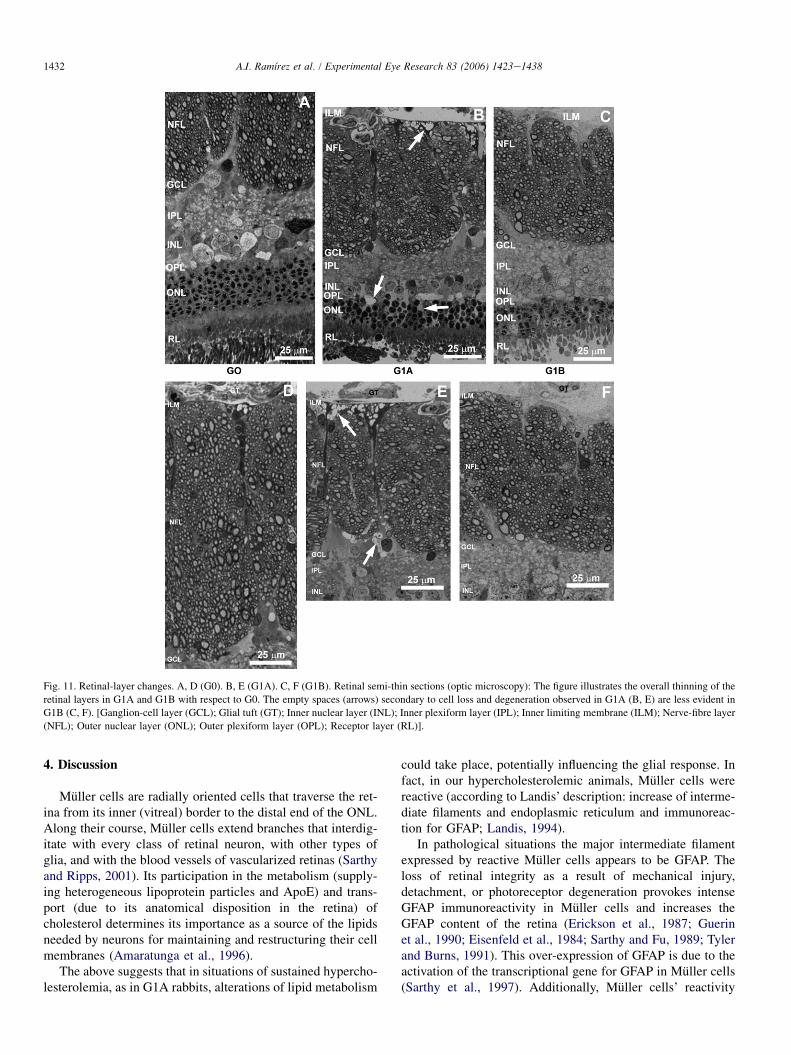
Fig. 11. Retinal-layer changes. A, D (G0). B, E (G1A). C, F (G1B). Retinal semi-thin sections (optic microscopy): The figure illustrates the overall thinning of the
retinal layers in G1A and G1B with respect to G0. The empty spaces (arrows) secondary to cell loss and degeneration observed in G1A (B, E) are less evident in
G1B (C, F). [Ganglion-cell layer (GCL); Glial tuft (GT); Inner nuclear layer (INL); Inner plexiform layer (IPL); Inner limiting membrane (ILM); Nerve-fibre layer
(NFL); Outer nuclear layer (ONL); Outer plexiform layer (OPL); Receptor layer (RL)].
4. Discussion
Muller cells are radially oriented cells that traverse the ret-ina from its inner (vitreal) border to the distal end of the ONL.Along their course, Muller cells extend branches that interdig-itate with every class of retinal neuron, with other types ofglia, and with the blood vessels of vascularized retinas (Sarthyand Ripps, 2001). Its participation in the metabolism (supply-ing heterogeneous lipoprotein particles and ApoE) and trans-port (due to its anatomical disposition in the retina) ofcholesterol determines its importance as a source of the lipidsneeded by neurons for maintaining and restructuring their cellmembranes (Amaratunga et al., 1996).
The above suggests that in situations of sustained hypercho-lesterolemia, as in G1A rabbits, alterations of lipid metabolism
could take place, potentially influencing the glial response. Infact, in our hypercholesterolemic animals, Muller cells werereactive (according to Landis’ description: increase of interme-diate filaments and endoplasmic reticulum and immunoreac-tion for GFAP; Landis, 1994).
In pathological situations the major intermediate filamentexpressed by reactive Muller cells appears to be GFAP. Theloss of retinal integrity as a result of mechanical injury,detachment, or photoreceptor degeneration provokes intenseGFAP immunoreactivity in Muller cells and increases theGFAP content of the retina (Erickson et al., 1987; Guerinet al., 1990; Eisenfeld et al., 1984; Sarthy and Fu, 1989; Tylerand Burns, 1991). This over-expression of GFAP is due to theactivation of the transcriptional gene for GFAP in Muller cells(Sarthy et al., 1997). Additionally, Muller cells’ reactivity
1433A.I. Ramırez et al. / Experimental Eye Research 83 (2006) 1423e1438
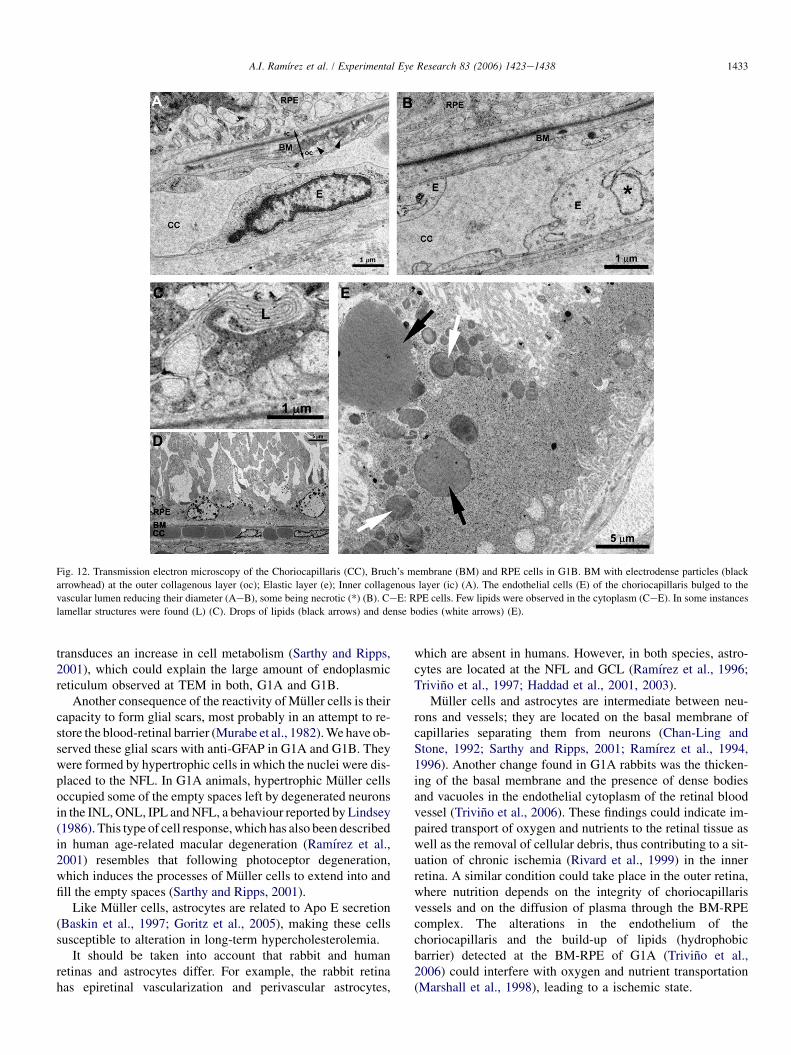
Fig. 12. Transmission electron microscopy of the Choriocapillaris (CC), Bruch’s membrane (BM) and RPE cells in G1B. BM with electrodense particles (black
arrowhead) at the outer collagenous layer (oc); Elastic layer (e); Inner collagenous layer (ic) (A). The endothelial cells (E) of the choriocapillaris bulged to the
vascular lumen reducing their diameter (AeB), some being necrotic (*) (B). CeE: RPE cells. Few lipids were observed in the cytoplasm (CeE). In some instances
lamellar structures were found (L) (C). Drops of lipids (black arrows) and dense bodies (white arrows) (E).
transduces an increase in cell metabolism (Sarthy and Ripps,2001), which could explain the large amount of endoplasmicreticulum observed at TEM in both, G1A and G1B.
Another consequence of the reactivity of Muller cells is theircapacity to form glial scars, most probably in an attempt to re-store the blood-retinal barrier (Murabe et al., 1982). We have ob-served these glial scars with anti-GFAP in G1A and G1B. Theywere formed by hypertrophic cells in which the nuclei were dis-placed to the NFL. In G1A animals, hypertrophic Muller cellsoccupied some of the empty spaces left by degenerated neuronsin the INL, ONL, IPL and NFL, a behaviour reported by Lindsey(1986). This type of cell response, which has also been describedin human age-related macular degeneration (Ramırez et al.,2001) resembles that following photoceptor degeneration,which induces the processes of Muller cells to extend into andfill the empty spaces (Sarthy and Ripps, 2001).
Like Muller cells, astrocytes are related to Apo E secretion(Baskin et al., 1997; Goritz et al., 2005), making these cellssusceptible to alteration in long-term hypercholesterolemia.
It should be taken into account that rabbit and humanretinas and astrocytes differ. For example, the rabbit retinahas epiretinal vascularization and perivascular astrocytes,
which are absent in humans. However, in both species, astro-cytes are located at the NFL and GCL (Ramırez et al., 1996;Trivino et al., 1997; Haddad et al., 2001, 2003).
Muller cells and astrocytes are intermediate between neu-rons and vessels; they are located on the basal membrane ofcapillaries separating them from neurons (Chan-Ling andStone, 1992; Sarthy and Ripps, 2001; Ramırez et al., 1994,1996). Another change found in G1A rabbits was the thicken-ing of the basal membrane and the presence of dense bodiesand vacuoles in the endothelial cytoplasm of the retinal bloodvessel (Trivino et al., 2006). These findings could indicate im-paired transport of oxygen and nutrients to the retinal tissue aswell as the removal of cellular debris, thus contributing to a sit-uation of chronic ischemia (Rivard et al., 1999) in the innerretina. A similar condition could take place in the outer retina,where nutrition depends on the integrity of choriocapillarisvessels and on the diffusion of plasma through the BM-RPEcomplex. The alterations in the endothelium of thechoriocapillaris and the build-up of lipids (hydrophobicbarrier) detected at the BM-RPE of G1A (Trivino et al.,2006) could interfere with oxygen and nutrient transportation(Marshall et al., 1998), leading to a ischemic state.
1434 A.I. Ramırez et al. / Experimental Eye Research 83 (2006) 1423e1438
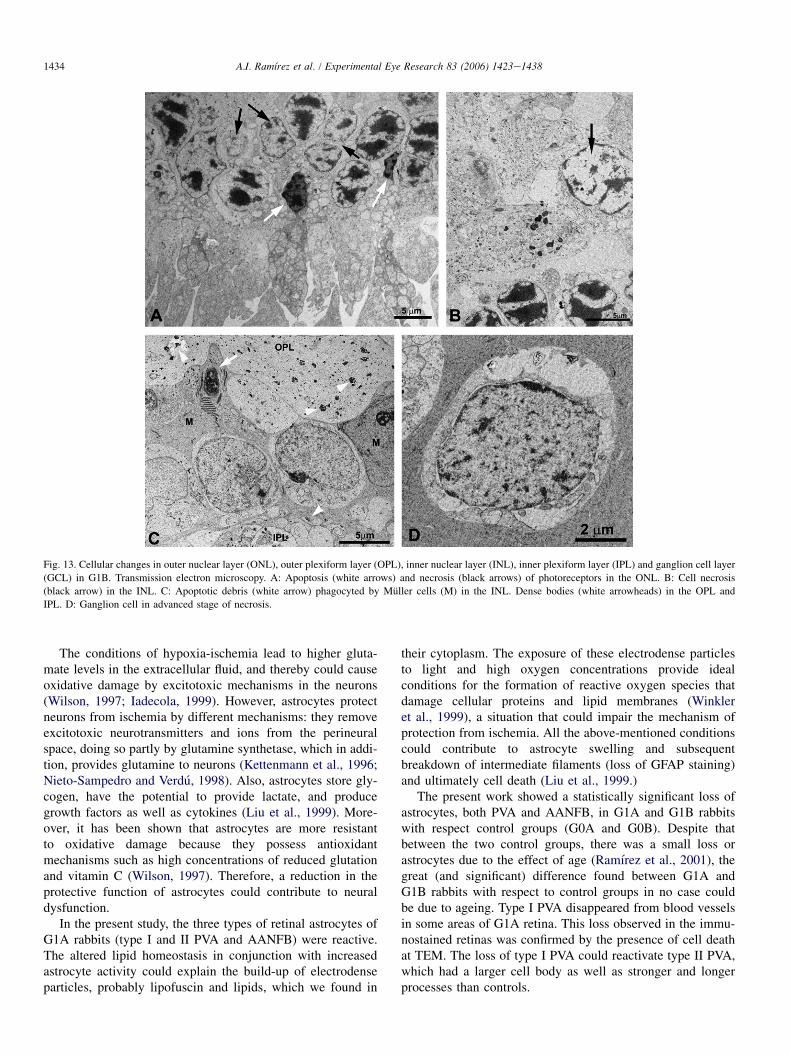
Fig. 13. Cellular changes in outer nuclear layer (ONL), outer plexiform layer (OPL), inner nuclear layer (INL), inner plexiform layer (IPL) and ganglion cell layer
(GCL) in G1B. Transmission electron microscopy. A: Apoptosis (white arrows) and necrosis (black arrows) of photoreceptors in the ONL. B: Cell necrosis
(black arrow) in the INL. C: Apoptotic debris (white arrow) phagocyted by Muller cells (M) in the INL. Dense bodies (white arrowheads) in the OPL and
IPL. D: Ganglion cell in advanced stage of necrosis.
The conditions of hypoxia-ischemia lead to higher gluta-mate levels in the extracellular fluid, and thereby could causeoxidative damage by excitotoxic mechanisms in the neurons(Wilson, 1997; Iadecola, 1999). However, astrocytes protectneurons from ischemia by different mechanisms: they removeexcitotoxic neurotransmitters and ions from the perineuralspace, doing so partly by glutamine synthetase, which in addi-tion, provides glutamine to neurons (Kettenmann et al., 1996;Nieto-Sampedro and Verdu, 1998). Also, astrocytes store gly-cogen, have the potential to provide lactate, and producegrowth factors as well as cytokines (Liu et al., 1999). More-over, it has been shown that astrocytes are more resistantto oxidative damage because they possess antioxidantmechanisms such as high concentrations of reduced glutationand vitamin C (Wilson, 1997). Therefore, a reduction in theprotective function of astrocytes could contribute to neuraldysfunction.
In the present study, the three types of retinal astrocytes ofG1A rabbits (type I and II PVA and AANFB) were reactive.The altered lipid homeostasis in conjunction with increasedastrocyte activity could explain the build-up of electrodenseparticles, probably lipofuscin and lipids, which we found in
their cytoplasm. The exposure of these electrodense particlesto light and high oxygen concentrations provide idealconditions for the formation of reactive oxygen species thatdamage cellular proteins and lipid membranes (Winkleret al., 1999), a situation that could impair the mechanism ofprotection from ischemia. All the above-mentioned conditionscould contribute to astrocyte swelling and subsequentbreakdown of intermediate filaments (loss of GFAP staining)and ultimately cell death (Liu et al., 1999.)
The present work showed a statistically significant loss ofastrocytes, both PVA and AANFB, in G1A and G1B rabbitswith respect control groups (G0A and G0B). Despite thatbetween the two control groups, there was a small loss orastrocytes due to the effect of age (Ramırez et al., 2001), thegreat (and significant) difference found between G1A andG1B rabbits with respect to control groups in no case couldbe due to ageing. Type I PVA disappeared from blood vesselsin some areas of G1A retina. This loss observed in the immu-nostained retinas was confirmed by the presence of cell deathat TEM. The loss of type I PVA could reactivate type II PVA,which had a larger cell body as well as stronger and longerprocesses than controls.
1435A.I. Ramırez et al. / Experimental Eye Research 83 (2006) 1423e1438
The statistically significant loss of astrocytes found in thepresent work and therefore of its protective function, couldcontribute to the retinal neuronal death observed at TEM.
When cholesterol levels returned to normal in G1B rabbits,with the replacement of the enriched cholesterol diet by thestandard one, BM and RPE alterations were still present
Fig. 14. Nerve-fibre layer changes in G1B. Transmission electron microscopy.
The empty spaces left by degenerated axons were occupied by the Muller cells
(M) and astrocytes (A) in the medullated nerve-fibre region (A) however, in
the retinal periphery only by Muller cells (B). Axons (ax); Vitreous humour
(V); Glial tuft (GT).
although to a lesser extent than in G1A animals. This partialstructural recovery could improve the diffusion of nutrientsfrom the choriocapillaris and removal of cell debris fromRPE, thus exerting a possible effect on the retina. However,G1B rabbits retained features observed in G1A animals,such as an apparent decrease in retinal thickening (whichwas similar between G1A and G1B), cell death in the ONL,INL, and GCL, or axonal degeneration at the NFL.
It is possible that the maintenance of retinal damageobserved in G1B animals was at least partly due to thegreater alterations of G1B retinal vessels and the persistenceof the choriocapillaris alterations with respect G1A. Thesevascular retinal alterations, which extended from the endo-thelium to the adventitia, could provoke a more severe is-chemic situation in G1B than in G1A animals. Anotherfactor that could contribute to the continuation of retinaldamage despite the normalization of lipid levels (G1B)would be the role of Muller cell in neuronal swelling andapoptosis.
During ischemia, over-excitation of ionotropic glutamatereceptors not only leads to neuronal cell depolarization thatcauses excess Ca 2þ influx into the cells, but also activatesthe apoptosis machinery. The ion fluxes into the retinalneurons, associated with water movements that are mediatedby aquaporin-4 water channels expressed by Muller cells,can result in neuronal cell swelling (Bringmann et al., 2005).Thus, during ischemic episodes in the rabbit retina, bothplexiform layers and the cytoplasm of neuronal cells becomeoedematous, while the Muller cells appear to remain unaf-fected. However, in the post-ischemic tissue, the Muller cellsbecome oedematous while neuronal elements degenerate(Johnson, 1974).
In G1B animals, Muller cells were hypertrophic and filledup the empty spaces left by degenerated neurons and axons.This hypertrophy could be due to the osmotic swelling ofMuller cells. A significant correlation has been reported be-tween Muller cell hypertrophy and the extent of osmoticMuller cell swelling in rat retina during retinal inflammation,suggesting that the alterations of swelling properties isa characteristic feature of Muller cell gliosis (Pannickeet al., 2005). It has also been proposed that Muller cellswelling in the post-ischemic retina is caused by inflamma-tory mediators, due to the activation of phospholipase A2 byosmotic stress (Bringmann et al., 2005). In G1A and G1Banimals, the hypercholesterolemic diet could have causedan imbalance in long-chain polyunsaturated fatty acids (inthe neural retina these are present mainly in the phospho-lipids of the cell membranes [Gordon and Bazan, 1997])which could induce an increase in inflammatory elementssuch as reactive oxygen species from macrophages, TNF-a,IL-1b and IL-6, Natural Killer, cytotoxic T lymphocyteactivation, and lymphocyte proliferation (SanGiovanni andChew, 2005).
Therefore, ischemic and inflammatory processes triggerMuller cell hypereactivity in G1A animals, which, overtime, though the lipid levels in G1B normalize, could provokethe hypertrophy and swelling of this cell type.

1436 A.I. Ramırez et al. / Experimental Eye Research 83 (2006) 1423e1438
Fig. 15. Retinal-vessel changes in G1B. Transmission electron microscopy. A: Vessel located in the NFL. B: Vessel located in the vitreous. The basal membrane
(BM) was thick and had numerous dense bodies (arrow). Necrotic features (arrowhead) were observed in some endothelial cells (E). Astrocyte (A); Vascular lumen
(L); Axon (ax).
G1A animals had both types of PVA (type I and II).However, after the introduction and maintenance of a standarddiet (G1B), the intense GFAP immunoreactivity observed inthe retinal blood vessels was due mainly to type II PVA.The processes of these cells formed a network similar tothat exhibited by the type I PVA of the control group.
The statistical analysis of our data revealed that the areaoccupied by PVA in both G1A and G1B was significantlysmaller than in control groups. The maintenance of the areaoccupied by the PVA in G1B animals could be due to thehyperplasia of type II PVA as an attempt to compensate forthe loss of type I PVA. This cell proliferation is presumablya response to the sustained retinal ischemia suffered by G1Brabbits despite of normalization of cholesterol levels. Type IIPVA of G1B were reactive, hypertrophic, and had an enlarge-ment of their cell bodies and processes. These features plus theabove-mentioned hyperplasia are typical changes of glial cellsin response to nerve damage (Landis, 1994; Ridet et al., 1997).
The specific function of reactive gliosis is unknown. It hasbeen reported that glial cells undergoing reactive gliosis up-regulate the production of cytokines and neurotrophic factorswhich may be crucial for the viability of injured neurons(Sarthy and Ripps, 2001). Additionally, it is presumed thatreactive gliosis is involved in phagocytosis of debris and inrestoring breaches in the blood-brain barrier by scar formation(Reier, 1986).
In our study, Muller cells and astrocytes from G1A andG1B rabbits had cell debris in their cytoplasms. It has beenreported that astrocytes (Penfold and Provis, 1986) as well asMuller cells (Mano and Puro, 1990) can exert phagocytic func-tions and that the microglia (the main phagocytic cell of thenervous system) intervene only when the build-up of debrisin the nervous tissue is abundant (Cook and Wisniewski,1973). Phagocytosis of exogenous particles, cell debris, andhemorrhagic products may be an important scavenging func-tion of Muller cells (Sarthy and Ripps, 2001). It has been sug-gested that the phagocytic process of these cells is similar tothat associated with macrophages and that in addition theycan function as antigen-presenting cells (Sarthy and Ripps,2001).
From the data of this study, we conclude that the substitu-tion of a hyperlipemic diet by a standard one in an
experimental rabbit model normalizes the blood-lipid levelsand considerably decreases the ocular build-up of lipids. How-ever, the regression of ocular damage is only partial. The re-maining changes in the BM, choriocapillaris vessels, andretinal blood vessels could favour a situation of chronic retinalischemia, most probably progressive and irreversible.
Acknowledgements
The research was supported by Comunidad de MadridGrant 08.4/0017.1/99 and UCM Grant PR48/01-9905 andInstituto Salud Carlos III Grant Redes Tematicas CO3/01and C03/13. We thank Agustın Fernandez and the Centro deMicroscopia Electronica ‘‘Luis Bru’’ (Complutense Universityof Madrid) for technical assistance in electron microscopy, andDavid Nesbitt for linguistic assistance.
References
Agardh, E., Bruun, A., Agardh, C.D., 2001. Retinal glial cell immunoreactivity
and neuronal cell changes in rats with STZ-induced diabetes. Curr. Eye
Res. 23, 276e284.
Amaratunga, A., Abraham, C.R., Edwards, R.B., Sandell, J.H.,
Schreiber, B.M., Fine, R.E., 1996. Apolipoprotein E is synthesized in
the retina by Muller glial cells, secreted into the vitreous, and rapidly
transported into the optic nerve by retinal ganglion cells. J. Biol. Chem.
271, 5628e5632.
Baskin, F., Smith, G.A., Fosmire, J.A., Rosenberg, R.N., 1997. Altered
apolipoprotein E secretion in cytokine treated human astrocytes cultures.
J. Neurol. Sci. 148, 15e18.
Berring, E.E., Borrenpohl, K., Fliesler, S.J., Serfis, A.B., 2005. A comparison
of the behavior of cholesterol and selected derivatives in mixed sterol-
phospholipid Langmuir monolayers: a fluorescence microscopy study.
Chem. Phys. Lipids 136, 1e12.
Bringmann, A., Uckermann, O., Pannicke, T., Iandiev, I., Reichenbach, A.,
Wiedemann, P., 2005. Neuronal versus glial cell swelling in the ischaemic
retina. Acta Ophthalmol. Scan. 83, 528e538.
Chan-Ling, T., Stone, J., 1992. Degeneration of astrocytes in feline retinopathy
of prematurity causes failure of the blood-retinal barrier. Invest. Ophthal-
mol. Vis. Sci. 33, 2148e2159.
Cook, D.R., Wisniewski, H.M., 1973. The role of the oligodendroglia and
astroglia in wallerian degeneration of the optic nerve. Brain Res. 61,
191e206.
Eisenfeld, A.J., Bunt-Milam, A.H., Sarthy, P.V., 1984. Muller cell expression
of glial fibrillary acidic protein after genetic and experimental
1437A.I. Ramırez et al. / Experimental Eye Research 83 (2006) 1423e1438
photoreceptor degeneration in the rat retina. Invest. Ophthalmol. Vis. Sci.
25, 1321e1328.
Erickson, P.A., Fisher, S.R., Guerin, C.J., Anderson, D.H., Kaska, D.D., 1987.
Glial fibrillary acidic protein increases in Muller cells after retinal detach-
ment. Exp. Eye Res. 44, 37e48.
Fliesler, S.J., Richards, M.J., Peachey, N.S., Kauser, K., 2000. Hypercholester-
olemia does not alter retinal sterol composition or compromise retinal
structure or function in apolipoprotein E (ApoE)-knockout mice. Invest.
Ophthalmol. Vis. Sci. 41 (4), S199.
Gordon, W.C., Bazan, N.G., 1997. Retina. In: Harding, J.J. (Ed.), Biochemistry
of the Eye, first ed. Chapman and Hall, London, pp. 144e275.
Goritz, C., Mauch, D.H., Pfrieger, F.W., 2005. Multiple mechanisms mediate
cholesterol-induced synaptogenesis in a CNS neurons. Mol. Cell. Neuro-
sci. 29, 190e201.
Guerin, C.J., Anderson, D.H., Fisher, S.K., 1990. Changes in intermediate
filament immunolabeling occur in response to retinal detachment and
reattachment in primates. Invest. Ophthalmol. Vis. Sci. 31, 1474e1482.
Guidry, C., Medeiros, N.E., Curcio, C.A., 2002. Phenotypic variation of retinal
pigment epithelium in age-related macular degeneration. Invest. Ophthal-
mol. Vis. Sci. 43, 267e273.
Haddad, A., Ramırez, A.I., Laicine, E.M., Salazar, J.J., Trivino, A.,
Ramırez, J.M., 2001. Immmunohistochemistry in association with scan-
ning electron microscopy for the morphological characterization and loca-
tion of astrocytes of the rabbit retina. J. Neurosci. Methods 106, 131e137.
Haddad, A., Salazar, J.J., Laicine, E.M., Ramırez, A.I., Ramırez, J.M.,
Trivino, A., 2003. A direct contact between astrocyte and vitreous body
is possible in the rabbit eye due to discontinuities in the basement
membrane of the retinal inner limiting membrane. Braz. J. Med. Biol.
Res. 36, 207e211.
Iadecola, C., 1999. Mechanisms of cerebral ischemic damage. In: Walz, W.
(Ed.), Cerebral Ischemia: Molecular and Cellular Pathophysiology. Humana
Press Inc, Totowa, pp. 3e32.
Johnson, N.F., 1974. Effects of acute ischaemia on the structure of the rabbit
retina. Trans. Ophthalmol. Soc. UK 94, 394e405.
Kettenmann, H., Faissner, A., Trotter, J., 1996. Neuron-glia interactions in
homeostasis and degeneration. In: Greger, R., Windhorst, U. (Eds.), Compre-
hensive Human Physiology. From Cellular Mechanisms to Integration.
Springer-Verlag, Berlin, pp. 533e543.
Landis, D.M.D., 1994. The early reactions of non-neuronal cells to brain
injury. Annu. Rev. Neurosci. 17, 133e151.
Laping, N.J., Teter, B., Nichols, N.R., Rozovsky, I., Finch, C.E., 1994. Glial fi-
brillary acidic protein: regulation by hormones, cytokines, and growth fac-
tors. Brain Pathol 1, 259e275.
Lewis, G.P., Guerin, C.J., Anderson, D.H., Matsumoto, B., Fisher, S.K., 1994.
Rapid changes in the expression of glial cell proteins caused by experimen-
tal retinal detachment. Am. J. Ophthalmol. 118, 368e376.
Lindsey, R.M., 1986. Reactive gliosis. In: Fedoroff, S., Vernadakis, A. (Eds.),
Astrocytes, vol. 3. Academic Press, Orlando, pp. 231e262.
Liu, D., Smith, C.L., Barone, F.C., Ellison, J.A., Lysco, P.G., Li, K.,
Simpson, I.A., 1999. Astrocytic demise precedes delayed neuronal death
in focal ischemic rat brain. Mol. Brain Res. 68, 29e41.
Madigan, M.C., Penfold, P.L., Provis, J.M., Balind, T.K., Billson, F.A., 1994.
Intermediate filament expression in human retinal macroglia. Histopatho-
logic changes associated with age-related macular degeneration. Retina
14, 65e74.
Mahley, R.W., 1988. Apolipoprotein E: cholesterol transport protein with
expanding role in cell biology. Science 240, 622e630.
Mano, T., Puro, D.G., 1990. Phagocytosis by human retinal glial cells in
culture. Invest. Ophthalmol. Vis. Sci. 31, 1047e1055.
Marshall, J., Hussain, A.A., Starita, C., Moore, D.J., Patmore, A.L., 1998. Aging
and Bruch’s membrane. In: Marmor, M.F., Wolfnsberger, T.J. (Eds.), The
Retinal Pigment Epithelium. Oxford University, New York, pp. 669e692.
Mizutani, M., Gerhardinger, C., Lorenzi, M., 1998. Muller cell changes in
human diabetic retinopathy. Diabetes 47, 445e449.
Murabe, Y., Ibata, Y., Sano, Y., 1982. Morphological studies on neuroglia.
IV. Proliferative response of non-neuronal elements in the hippocampus
of the rat to kainic acid-induced lesions. Cell. Tissue Res. 222,
223e226.
Nieto-Sampedro, M., Verdu, E., 1998. Lesiones del sistema nervioso:
respuesta neuronal y reparacion. In: Delgado, J.M., Ferrus, A., Mora, F.,
Rubia, F.J. (Eds.), Manual de neurociencia. Editorial Sıntesis S.A., Madrid,
pp. 929e969.
Norton, W.T., Aquino, D.A., Hozumi, I., Chiu, F.-C., Brosnan, C.F., 1992.
Quantitative aspects of reactive gliosis: a review. Neurochem. Res. 17,
877e885.
Okada, M., Matsumura, M., Ogino, N., Honda, Y., 1990. Muller cells in
detached human retina express glial fibrillary acidic protein and vimentin.
Graef. Arch. Clin. Exp. Ophthalmol. 228, 467e474.
Ong, J.M., Zorapapel, N.C., Rich, K.A., Wagstaff, R.E., Lambert, R.W.,
Rosenberg, S.E., Moghaddas, F., Pirouzmanesh, A., Aoki, A.M., Kenney, C.,
2001. Effects of cholesterol and Apolipoprotein E on retinal abnormalities in
ApoE-deficient mice. Invest. Ophthalmol. Vis. Sci. 42, 1891e1900.
Pannicke, T., Uckermann, O., Iandiev, I., Wiedemann, P., Reichenbach, A.,
Bringmann, A., 2005. Ocular inflammation alters swelling and mem-
brane characteristic of rat Muller glial cells. J. Neuroimmunol. 161,
145e154.
Penfold, P.L., Provis, J.M., 1986. Cell death in the development of the human
retina: phagocitosis of pyknotic and apoptotic bodies by retinal cells.
Graef. Arch. Clin. Exp. 228, 255e263.
Ramırez, J.M., Trivino, A., Ramırez, A.I., Salazar, J.J., Garcıa-Sanchez, J.,
1994. Immunohistochemical study of human retinal astroglia. Vis. Res.
34, 1935e1946.
Ramırez, J.M., Trivino, A., Ramırez, A.I., Salazar, J.J., Garcıa-Sanchez, J.,
1996. Structural specializations of human retinal glial cells. Vis. Res. 36,
2029e2036.
Ramırez, J.M., Ramırez, A.I., Salazar, J.J., De Hoz, R., Trivino, A., 2001.
Changes of astrocytes in retinal ageing and age-related macular degenera-
tion. Exp. Eye Res. 73, 601e615.
Reier, P.J., 1986. Gliosis following CNS injury: the anatomy of astrocytic scars
and their influences on axonal elongation. In: Fedoroff, S., Vernadakis, A.
(Eds.), Astrocytes, Vol. 3. Academic. Press, Orlando, pp. 263e324.
Reynolds, E.S., 1963. The use of lead citrate at high pH as an electron-opaque
stain in electron microscopy. J. Cell. Biol. 17, 208e212.
Ridet, J.L., Malhotra, S.K., Privat, A., Gage, F.H., 1997. Reactive astrocytes:
cellular and molecular cues to biological function. Trends Neurosci 20,
570e577.
Rivard, A., Fabre, J.-E., Silver, M., Chen, D., Murohara, T., Kearney, M.,
Magner, M., Asahara, T., Isner, J.M., 1999. Age-dependent impairment
of angiogenesis. Circulation 99, 111e120.
Rungger-Brandle, E., Leuenberger, P.M., 1997. Senile retinal deficiencies in
astrocytes and blood vessels. In: LaVail, M.M., Hollyfield, J.G.,
Anderson, R.E. (Eds.), Degenerative Retinal Diseases. Plenum Press,
New York, pp. 409e415.
Rungger-Brandle, E., Dosso, A.A., Leuenberger, P.M., 2000. Glial reactivity,
an early feature of diabetic retinopathy. Invest. Ophthalmol. Vis. Sci. 41,
1971e1980.
SanGiovanni, J.P., Chew, E.Y., 2005. The role of omega-3 long-chain polyun-
saturated fatty acids in health and disease of the retina. Prog. Ret. Eye Res.
24, 87e138.
Sarthy, V., Brodjian, S.J., Smith, S., 1997. Ciliary neurotrophic factor (CNTF)
induces reactive gliosis and GFAP gene expression in Muller cells. Invest.
Ophthalmol. Vis. Sci. 38, S590.
Sarthy, P.V., Fu, M., 1989. Transcriptional activation of an intermediate
filament protein gene in mice with retinal dystrophy. DNA J. Mol. Cell.
Biol. 8, 437e446.
Sarthy, V., Ripps, H., 2001. The Retinal Muller Cell: Structure and Function.
Kluwer Academic/Plenum Publishers, New York.
Stone, J., Dreher, Z., 1987. Relationship between astrocytes, ganglion cells and
vasculature of the retina. J. Comp. Neurol. 255, 35e49.
Tanihara, H., Hangai, M., Sawaguchi, S., Abe, H., Kageyama, M., Nakazawa, F.,
Shirasawa, E., Honda, Y., 1997. Up-regulation of glial fibrillary acidic pro-
tein in the retina of primate eyes with experimental glaucoma. Arch. Oph-
thalmol. 115, 752e756.
Trivino, A., Ramırez, J.M., Ramırez, A.I., Salazar, J.J., Garcıa Sanchez, J.,
1992. Retinal perivascular astroglia: an immunoperoxidase study. Vis.
Res. 32, 1601e1607.

1438 A.I. Ramırez et al. / Experimental Eye Research 83 (2006) 1423e1438
Trivino, A., Ramırez, J.M., Ramırez, A.I., Salazar, J.J., Garcıa-Sanchez, J.,
1997. Comparative study of astrocytes in human and rabbit retinae. Vis.
Res. 37, 1707e1711.
Trivino, A., Ramırez, A.I., Salazar, J.J., De Hoz, R., Rojas, B., Padilla, E.,
Tejerina, T., Ramırez, J.M., 2006. A cholesterol-enriched diet induces
ultrastructural changes in retinal and macroglial rabbit cells. Exp. Eye
Res. 83, 357e366.
Tyler, N.K., Burns, M.S., 1991. Alterations in glial cells morphology and glial
fibrillary acidic protein expression in urethane-induced retinopathy. Invest.
Ophthalmol. Vis. Sci. 32, 246e256.
Wilson, J.X., 1997. Antioxidant defense of the brain: a role for astrocytes. Can.
J. Physiol. Pharmacol. 75, 1149e1163.
Winkler, B.S., Boulton, M.E., Gottsch, J.D., Sternberg, P., 1999. Oxidative
damage and age-related macular degeneration. Mol. Vis. 5, 32.
Related Documents