Macroeconomics - ECO 2013 Fall 2005 – 1 Term August 24 – December 16, 2005

Macroeconomics - ECO 2013 Fall 2005 – 1 Term August 24 – December 16, 2005.
Dec 22, 2015
Welcome message from author
This document is posted to help you gain knowledge. Please leave a comment to let me know what you think about it! Share it to your friends and learn new things together.
Transcript

Macroeconomics - ECO 2013
Fall 2005 – 1 TermAugust 24 – December 16, 2005

Chapter 8: Intro to Economic Growth & Stability
Economic GrowthBusiness CycleUnemploymentInflation

Economic Growth
Defined by two ways: An increase in real GDP occurring
over some time period An increase in real GDP per capita
occurring over some time period Best for comparing living standards
between countries Calculated as a percentage rate of
growth per year

Growth as a Goal
Expansion of total output v. population growth results in rising real wages and incomes higher SOL Better able to meet society’s wants &
resolve socioeconomic problems Rising real wages & income provide more
opportunities to individuals & families w/o sacrificing others
Undertake new programs to alleviate poverty or protect environment

Main Sources of Growth
Increasing Inputs of Resources (1/3) FFOP: Land, Labor, Capital, &
Entrepreneurial Abilities
Increasing Production of Inputs (2/3) Improvements in health, training, education
& motivation of workers Capital enhancements (machinery) Better natural resources Organization & Management Labor reallocated by efficiency

Results of Economics Growth in the U.S.
Improved Products & ServicesAdded Leisure (50 to 40 hrs/week)Environmental Impacts (Damaging)Quality of Life (Stress)

The Business Cycle: Four Phases
Peak: Business activity reaches temporary maximumRecession: Period of decline in Total Output, Income, Employment, Trade
Lasts more than 6 months Depression: a severe & prolonged recession, falling
prices are likely
Trough: Output & employment “bottoms out” at lowest levels
Can be long or short
Recovery: Expansion phase where output & employment rise toward full employment
Prices may rise
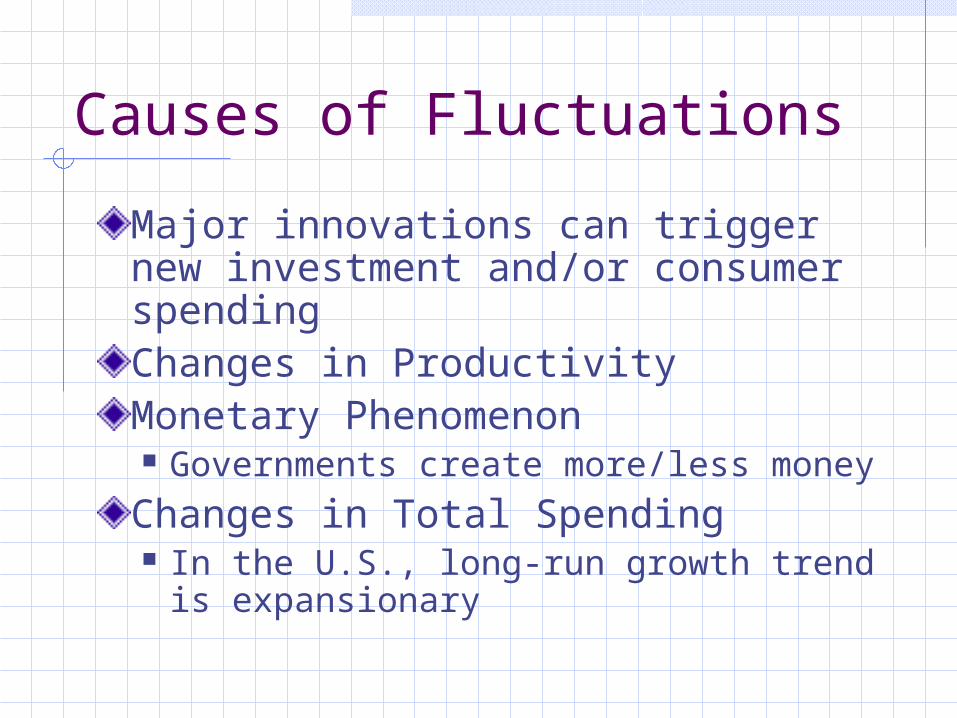
Causes of Fluctuations
Major innovations can trigger new investment and/or consumer spendingChanges in ProductivityMonetary Phenomenon Governments create more/less money
Changes in Total Spending In the U.S., long-run growth trend is
expansionary

Who is affected by Recessions in the Business Cycle?
Everyone & EverywhereFirms & Industries producing Capital & Consumer Durable Goods are most affectedService industries and Nondurable Consumer Goods are somewhat “insulated”

Measuring Unemployment
Who is eligible & available to work? Ineligible: Those less than 17 years and/or
institutionalized Not in Labor Force: Those not employed
and NOT SEEKING WORK Employed Unemployed: Those not employed and
SEEKING WORKLabor Force = Employed + Unemployed Approximately 50% of U.S. Population Those “willing and able” to work

Unemployment Rate
Calculated as a Percentage of Labor Force:Unemployment Rate = (Unemployed / Labor Force) * 100
BLS conducts survey of 60,000 households monthly

Unemployment Rate
Part-time Employment underestimates the true unemployment rate Many would prefer full-time work but
can’t find it
Discouraged workers understate the true unemployment rate Not in labor force but they wish they
were
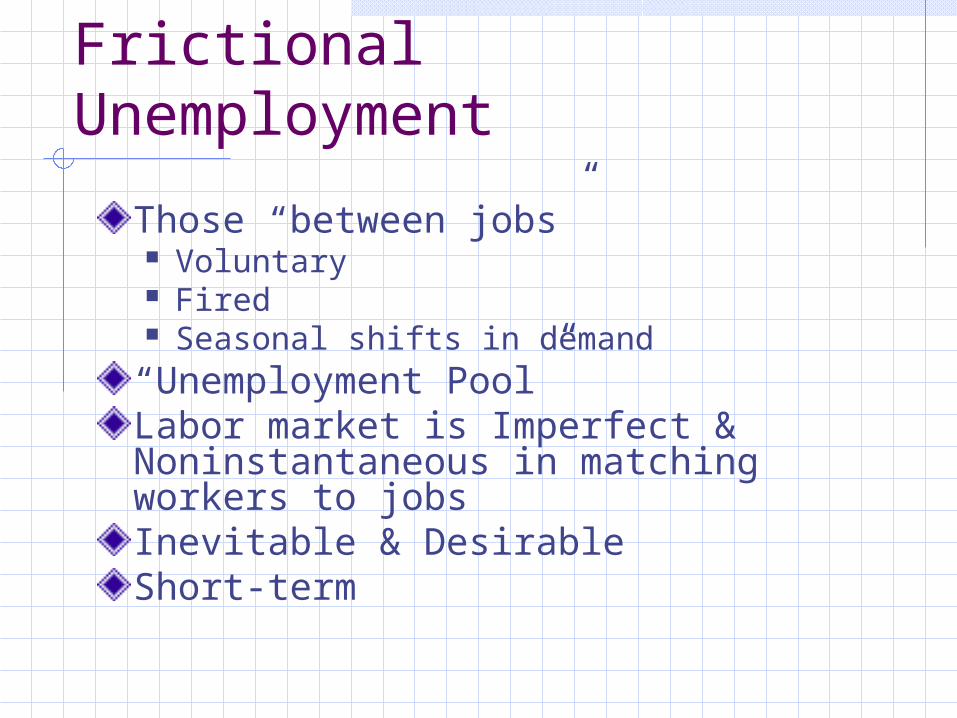
Frictional Unemployment
Those “between jobs” Voluntary Fired Seasonal shifts in demand
“Unemployment Pool”Labor market is Imperfect & Noninstantaneous in matching workers to jobsInevitable & DesirableShort-term
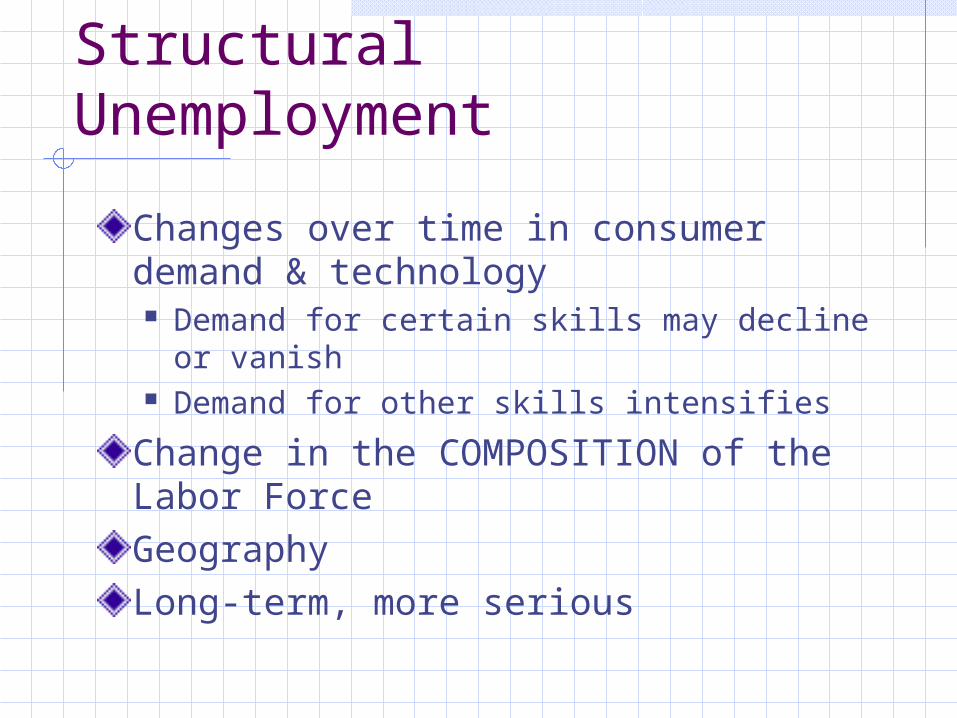
Structural Unemployment
Changes over time in consumer demand & technology Demand for certain skills may decline or
vanish Demand for other skills intensifies
Change in the COMPOSITION of the Labor ForceGeographyLong-term, more serious
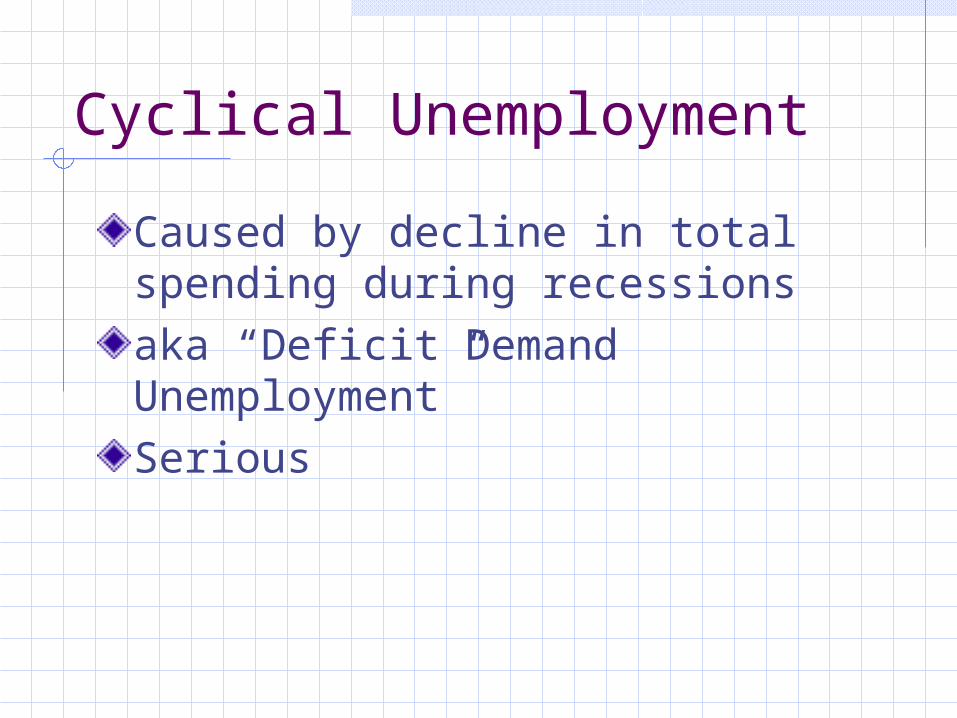
Cyclical Unemployment
Caused by decline in total spending during recessionsaka “Deficit Demand Unemployment”Serious

Full Employment
Occurs when economy is experiencing only frictional & structural unemployment (i.e., no cyclical unemployment)Full Employment Rate of Unemployment or Natural Rate of Unemployment (NRU)Economy is producing its Potential OutputNRU occurs when Job Seekers = Job Vacancies

Reasons for the Decline in NRU
Less younger workers in the labor forceGrowth of temp agenciesImproved information technologyWelfare reformDoubling of U.S. prison population

Economic Costs of Unemployment: GDP Gap
When the economy fails to create enough jobs for all who are able and willing to work, potential production of goods & services is lostGDP Gap: Potential GDP – Actual GDPPotential GDP is at the NRU

Economic Costs of Unemployment: Unequal Burdens
Costs are unequally distributed among different groupsOccupation Low-skilled laborers > High-skilled
professionals More frequent & longer unemployment spells Bear brunt of recessions
Age Teenagers > Adults Lower skills Less geographical mobility New in labor market

Economic Costs of Unemployment: Unequal Burdens
Race & Ethnicity: African-Americans & Hispanics >
Caucasian Lower rates of educational attainment Greater concentration of low-skilled jobs Discrimination in the labor market
Education: Less educated > More educated
Duration

Inflation
Rise in the general level of prices Does NOT mean ALL prices are rising Prices rise unevenly
Measuring Inflation Consumer Price Index [CPI(2) – CPI(1)]/CPI(1) * 100

Redistribution Effects of Inflation
Who is hurt by Inflation (assuming it is unanticipated) Fixed Income Receivers (e.g., elderly) Savers
Value of savings will decline if rate of inflation is greater than the rate of interest
Creditors

Who is Unaffected or Benefits from Inflation?
Flexible-Income Receivers Cost of Living Adjustments (COLAs) Social Security Recipients
Borrowers

Chapter 8 Study Questions
4: Business Cycle5 & 6: Unemployment
Related Documents


