Macroeconomics

Macroeconomics
Dec 30, 2015
Macroeconomics. Macroeconomics. Macroeconomics is the study of the economy in the aggregate. The “Big Three” Macroeconomic Concepts: Unemployment Inflation Productivity. - PowerPoint PPT Presentation
Welcome message from author
This document is posted to help you gain knowledge. Please leave a comment to let me know what you think about it! Share it to your friends and learn new things together.
Transcript
Macroeconomics
Macroeconomics
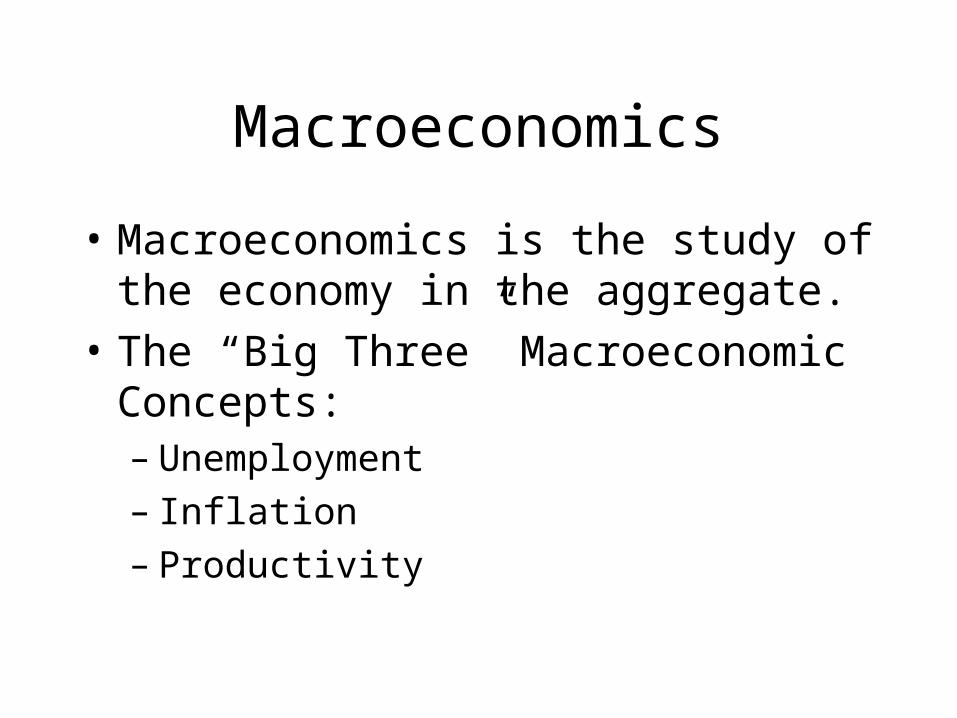
• Macroeconomics is the study of the economy in the aggregate.
• The “Big Three” Macroeconomic Concepts:– Unemployment– Inflation– Productivity
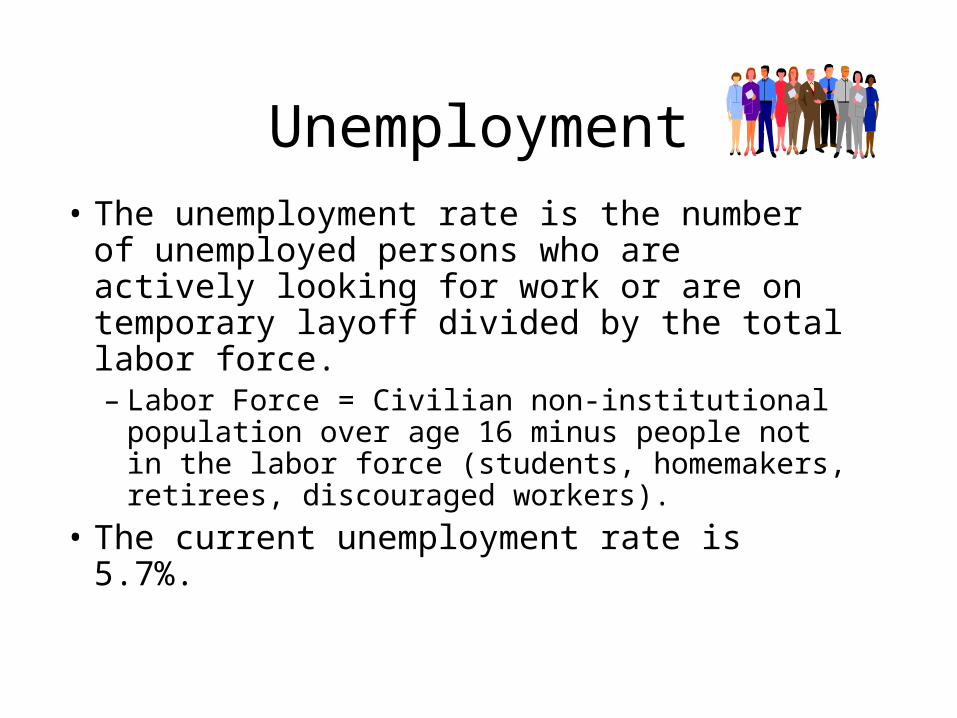
Unemployment
• The unemployment rate is the number of unemployed persons who are actively looking for work or are on temporary layoff divided by the total labor force.– Labor Force = Civilian non-institutional
population over age 16 minus people not in the labor force (students, homemakers, retirees, discouraged workers).
• The current unemployment rate is 5.7%.
Definitions
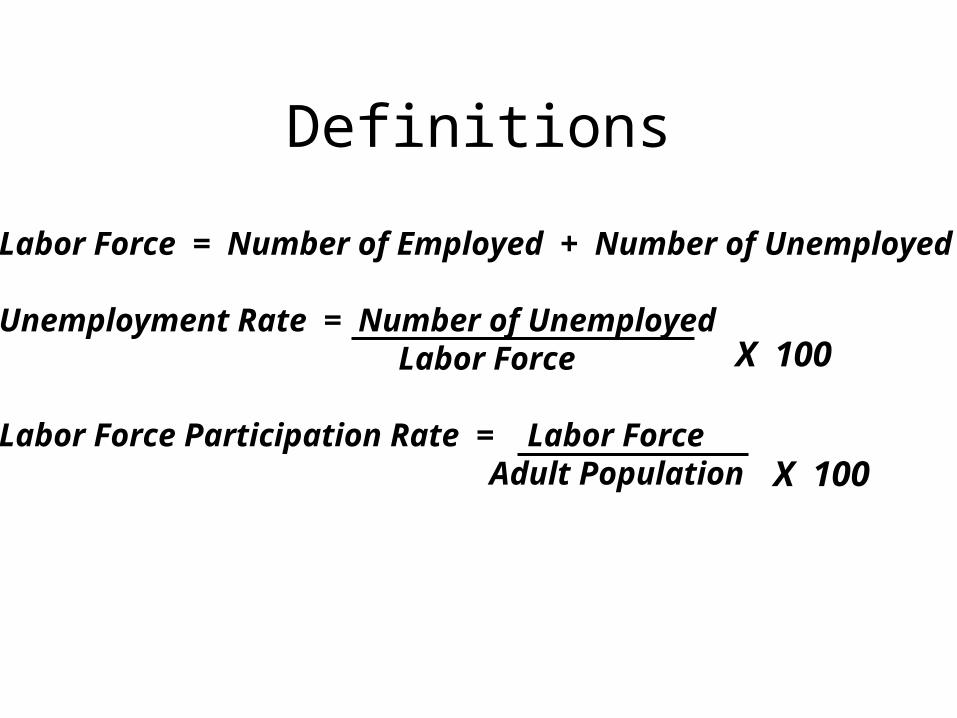
Labor Force = Number of Employed + Number of Unemployed
Unemployment Rate = Number of Unemployed Labor Force
Labor Force Participation Rate = Labor Force Adult Population X 100
X 100
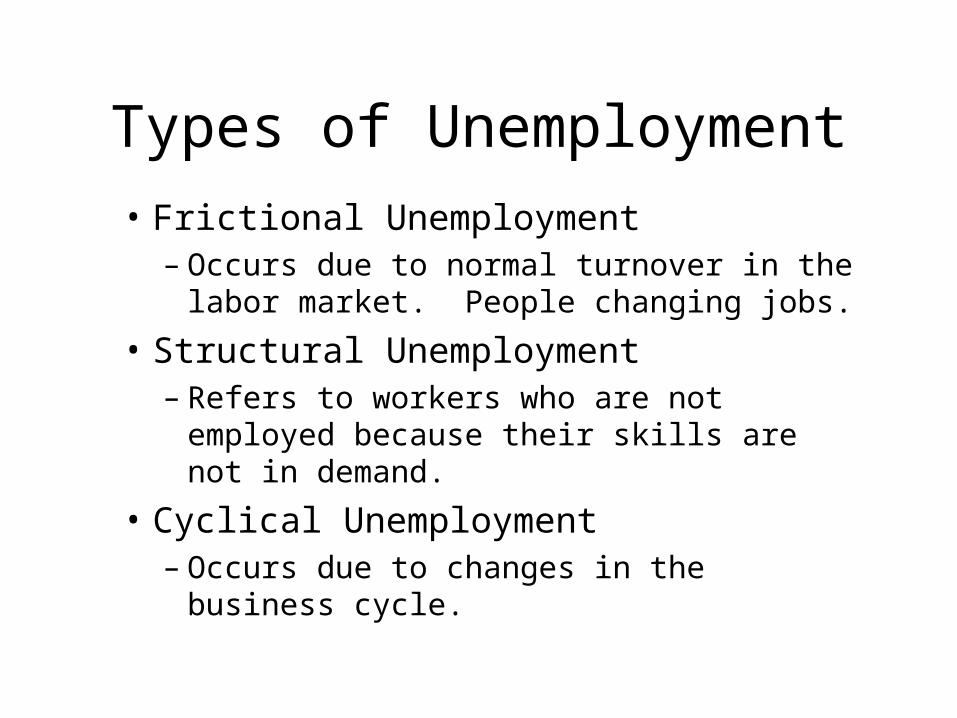
Types of Unemployment
• Frictional Unemployment– Occurs due to normal turnover in the labor
market. People changing jobs.
• Structural Unemployment– Refers to workers who are not employed
because their skills are not in demand.
• Cyclical Unemployment– Occurs due to changes in the business cycle.
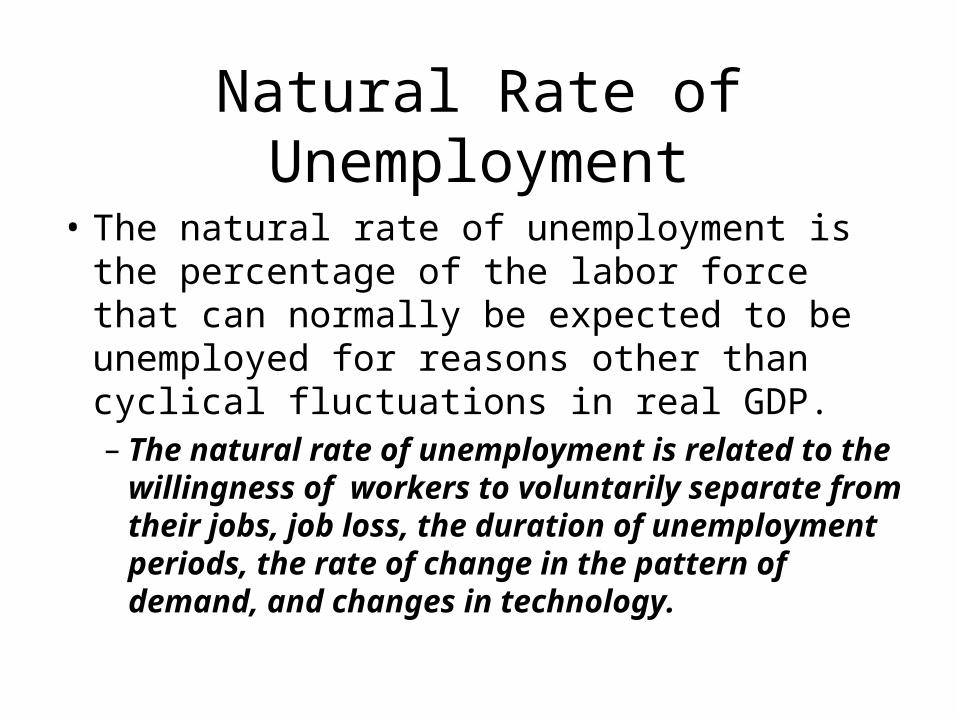
Natural Rate of Unemployment
• The natural rate of unemployment is the percentage of the labor force that can normally be expected to be unemployed for reasons other than cyclical fluctuations in real GDP.– The natural rate of unemployment is related to
the willingness of workers to voluntarily separate from their jobs, job loss, the duration of unemployment periods, the rate of change in the pattern of demand, and changes in technology.
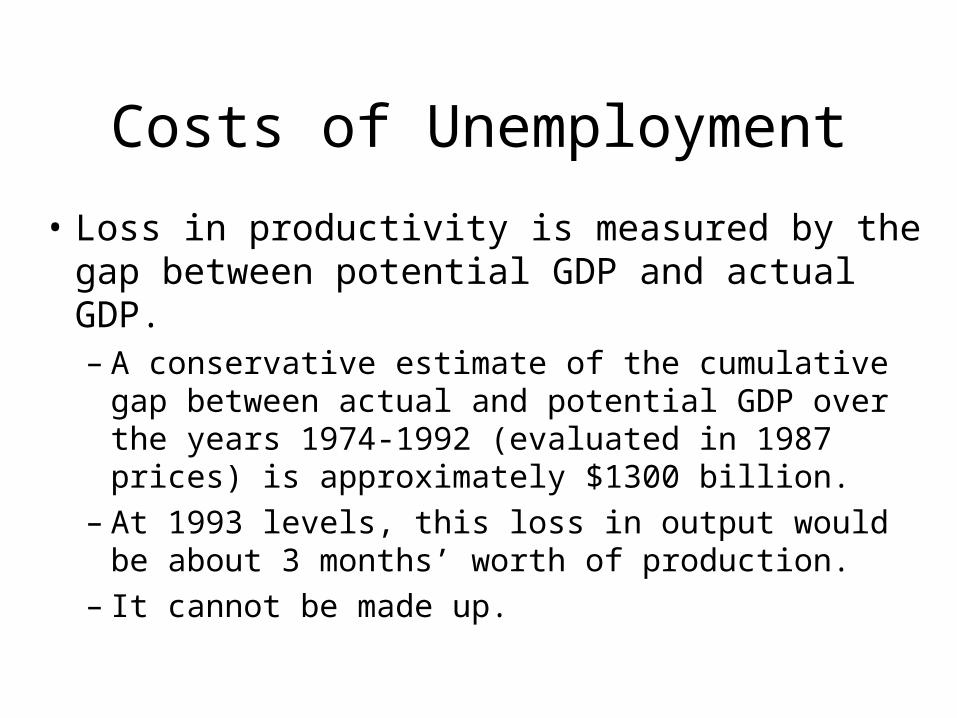
Costs of Unemployment
• Loss in productivity is measured by the gap between potential GDP and actual GDP.– A conservative estimate of the cumulative gap between
actual and potential GDP over the years 1974-1992 (evaluated in 1987 prices) is approximately $1300 billion.
– At 1993 levels, this loss in output would be about 3 months’ worth of production.
– It cannot be made up.
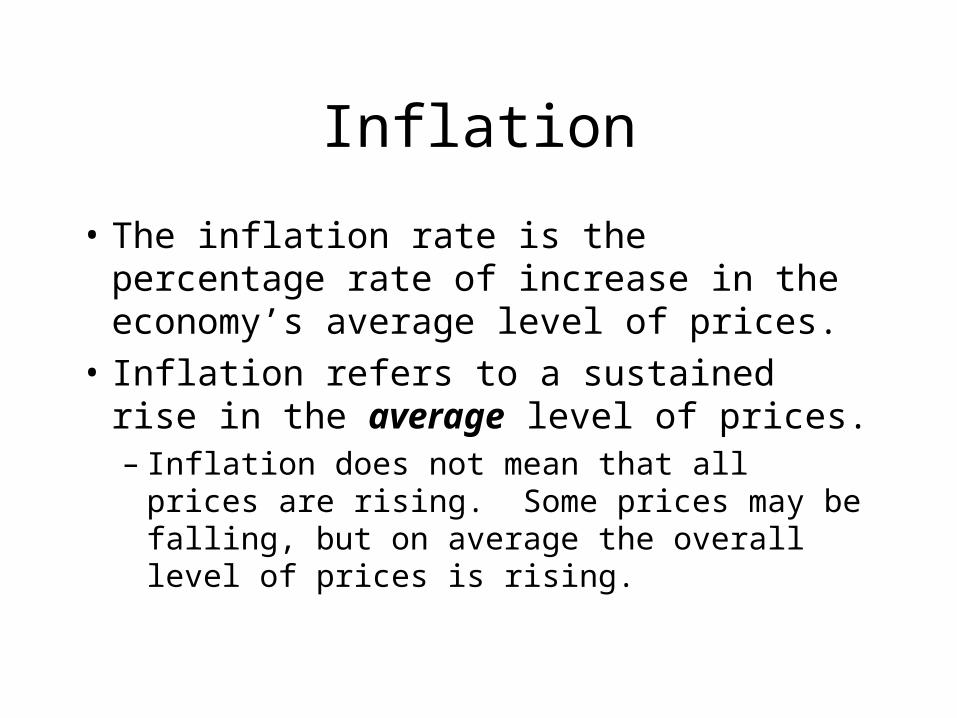
Inflation
• The inflation rate is the percentage rate of increase in the economy’s average level of prices.
• Inflation refers to a sustained rise in the average level of prices.– Inflation does not mean that all prices are
rising. Some prices may be falling, but on average the overall level of prices is rising.
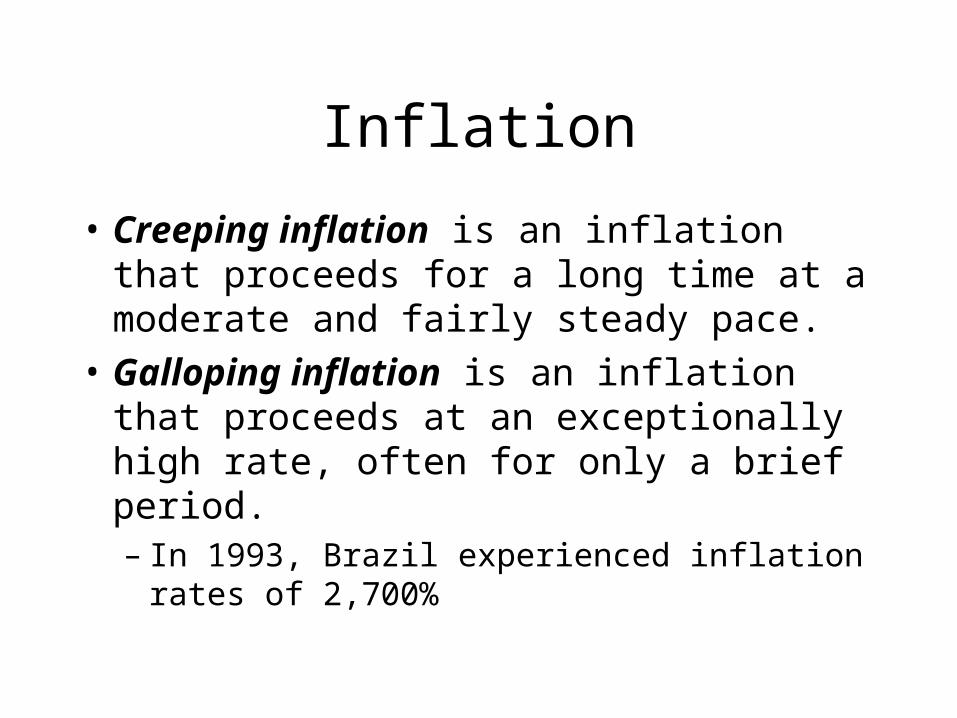
• Creeping inflation is an inflation that proceeds for a long time at a moderate and fairly steady pace.
• Galloping inflation is an inflation that proceeds at an exceptionally high rate, often for only a brief period.– In 1993, Brazil experienced inflation rates of
2,700%
Inflation
The Costs of Inflation
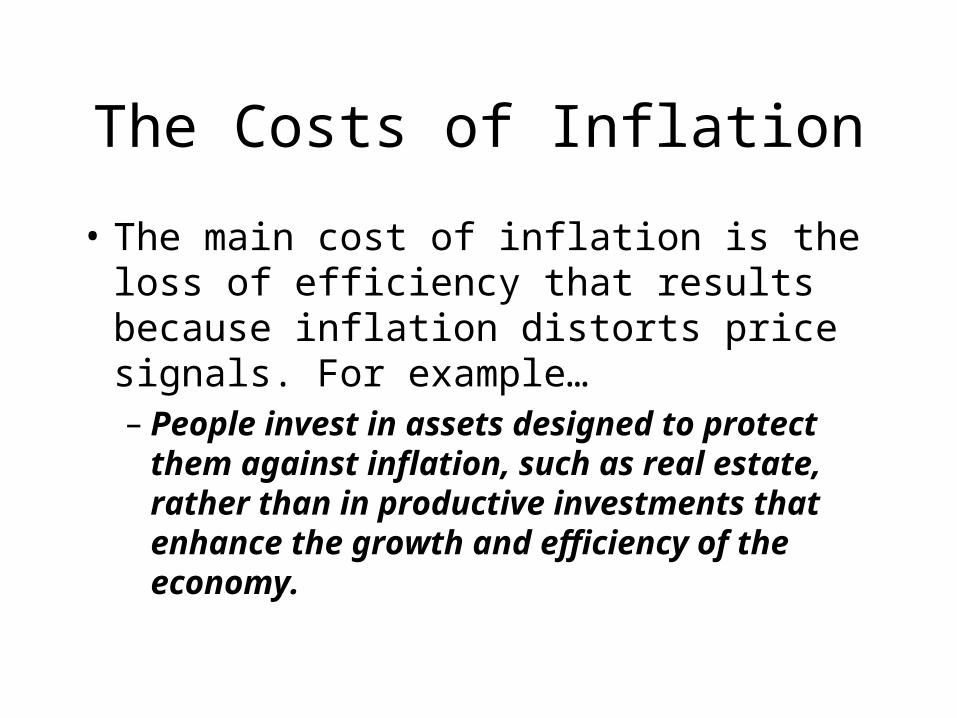
• The main cost of inflation is the loss of efficiency that results because inflation distorts price signals. For example…– People invest in assets designed to protect
them against inflation, such as real estate, rather than in productive investments that enhance the growth and efficiency of the economy.
– Business collect bills more promptly, using resources that could otherwise have been used to produce goods and services.
– Individuals reduce money holdings, which is inconvenient and misallocates the individual’s personal resources of time, energy , and leisure.
– In the case of hyperinflation, inflation over 100%, the currency system breaks down and the economy reverts to barter.
The Costs of Inflation
Purchasing Power and Inflation
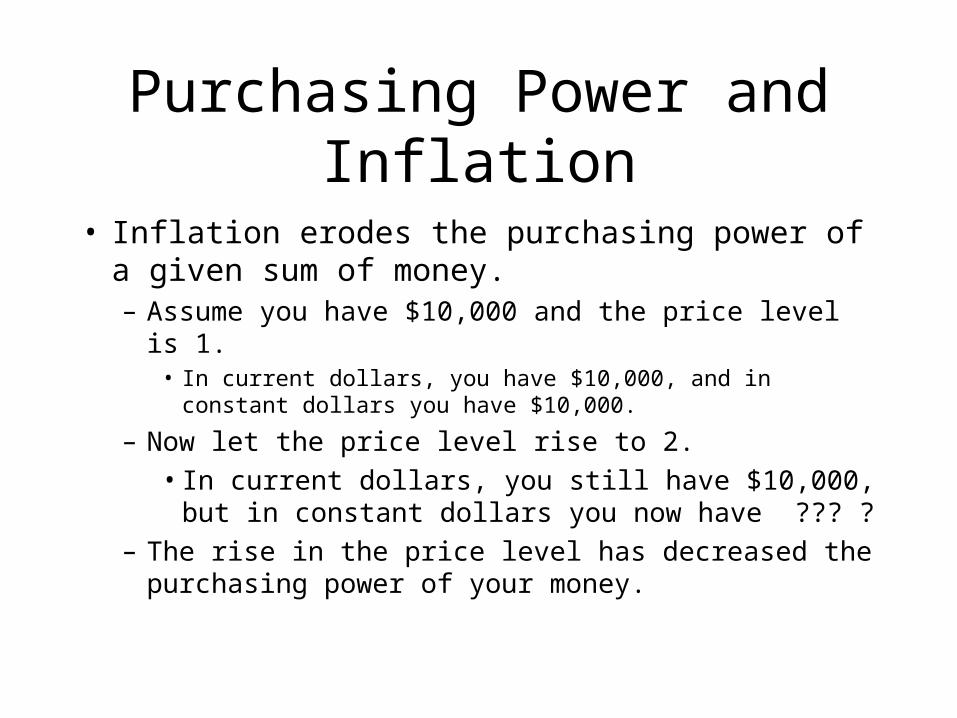
• Inflation erodes the purchasing power of a given sum of money.– Assume you have $10,000 and the price level is 1.
• In current dollars, you have $10,000, and in constant dollars you have $10,000.
– Now let the price level rise to 2.
• In current dollars, you still have $10,000, but in constant dollars you now have ??? ?
– The rise in the price level has decreased the purchasing power of your money.
Productivity
• Productivity is the average output produced per employee or per hour.– In 2002, productivity was about $44 per
worker-hour in the United States.
• Growth in productivity is one way to measure economic progress.– If productivity grows by 3% per year, by 2022
U.S. productivity would rise to $80 per worker- hour.
Productivity and Economic Growth
• Increases in productivity are one source of economic growth.
• Other sources of economic growth are increases in capital and labor.
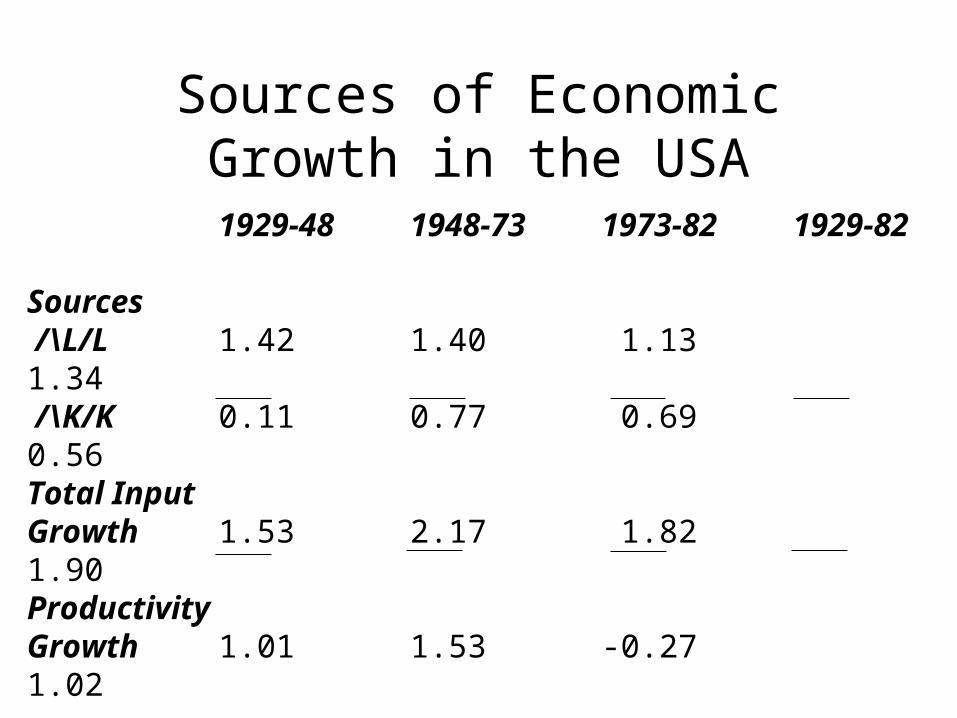
Sources of Economic Growth in the USA
1929-48 1948-73 1973-82 1929-82
Sources /\L/L 1.42 1.40 1.13 1.34 /\K/K 0.11 0.77 0.69 0.56Total InputGrowth 1.53 2.17 1.82 1.90ProductivityGrowth 1.01 1.53 -0.27 1.02
Output Growth 2.54 3.70 1.55 2.92
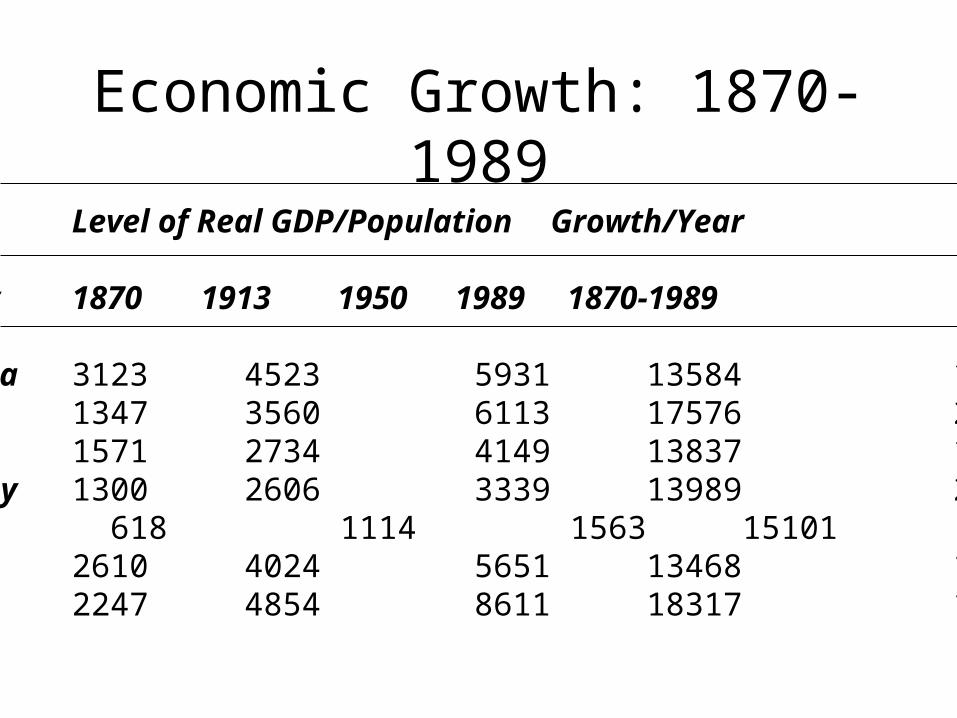
Economic Growth: 1870-1989
Level of Real GDP/Population Growth/Year
Country 1870 1913 1950 1989 1870-1989
Australia 3123 4523 5931 13584 1.2%Canada 1347 3560 6113 17576 2.2%France 1571 2734 4149 13837 1.8%Germany 1300 2606 3339 13989 2.0%Japan 618 1114 1563 15101 2.7%U.K. 2610 4024 5651 13468 1.4%U.S.A. 2247 4854 8611 18317 1.8%
Business Cycles
Business Cycles
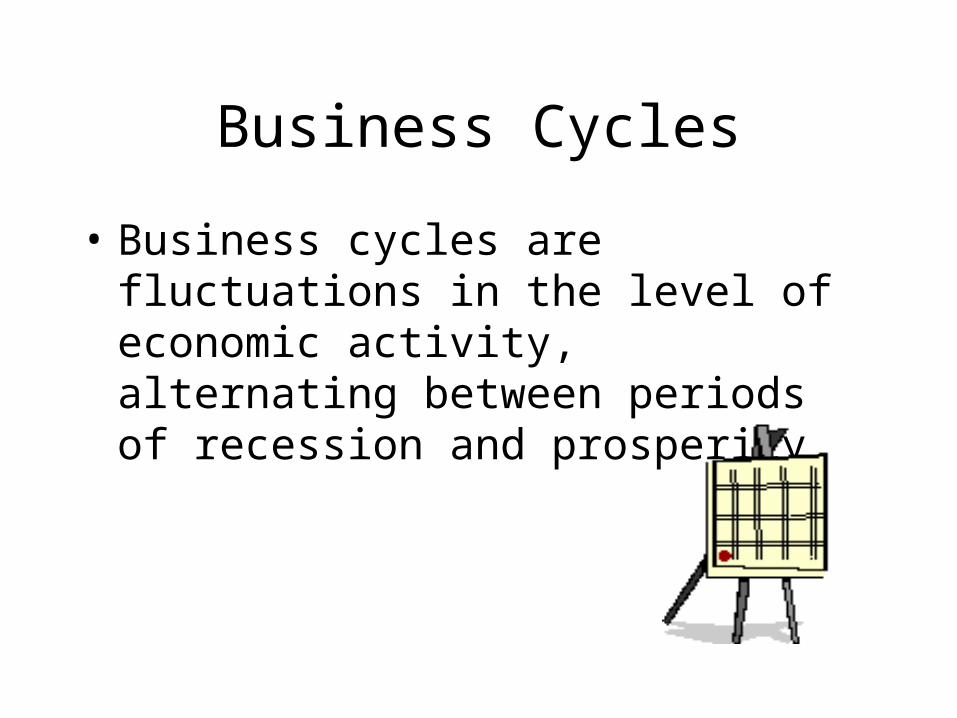
• Business cycles are fluctuations in the level of economic activity, alternating between periods of recession and prosperity.
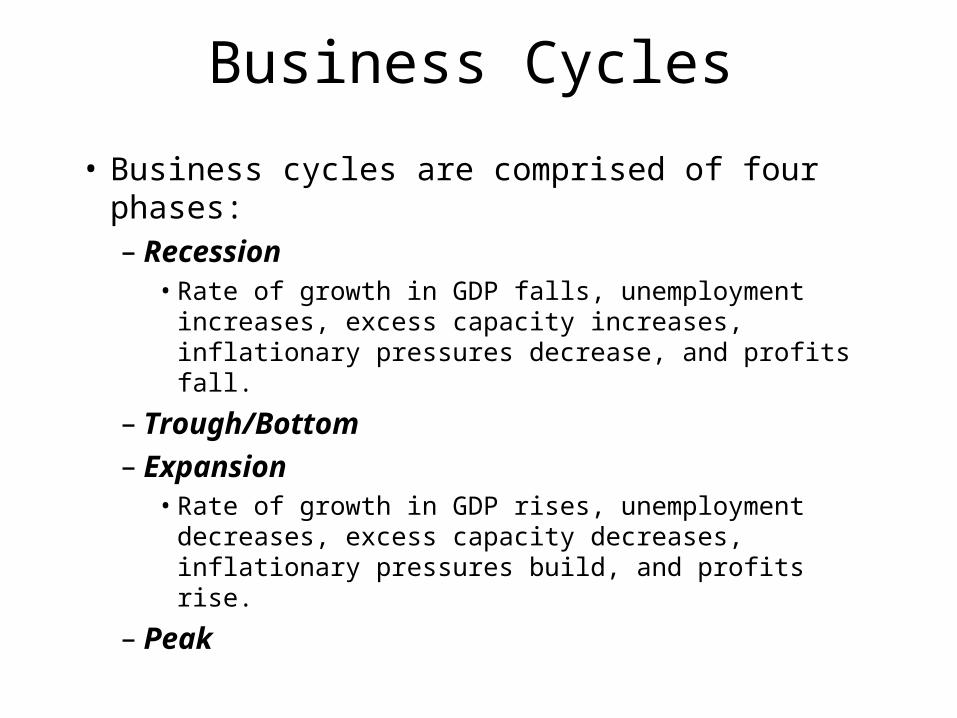
Business Cycles
• Business cycles are comprised of four phases:– Recession
• Rate of growth in GDP falls, unemployment increases, excess capacity increases, inflationary pressures decrease, and profits fall.
– Trough/Bottom– Expansion
• Rate of growth in GDP rises, unemployment decreases, excess capacity decreases, inflationary pressures build, and profits rise.
– Peak
GDPGDP
TimeTime
Time Time
Unemp Rate
InflRate
Actual Real GDP
Natural GDP
Natural GDP
Actual Real GDP
Inflation Rate
Inflation Slows
Inflation Rises
t0 t1 t2 t0 t1 t2 0
0 0
0
NaturalRate of Un
ActualUnemp
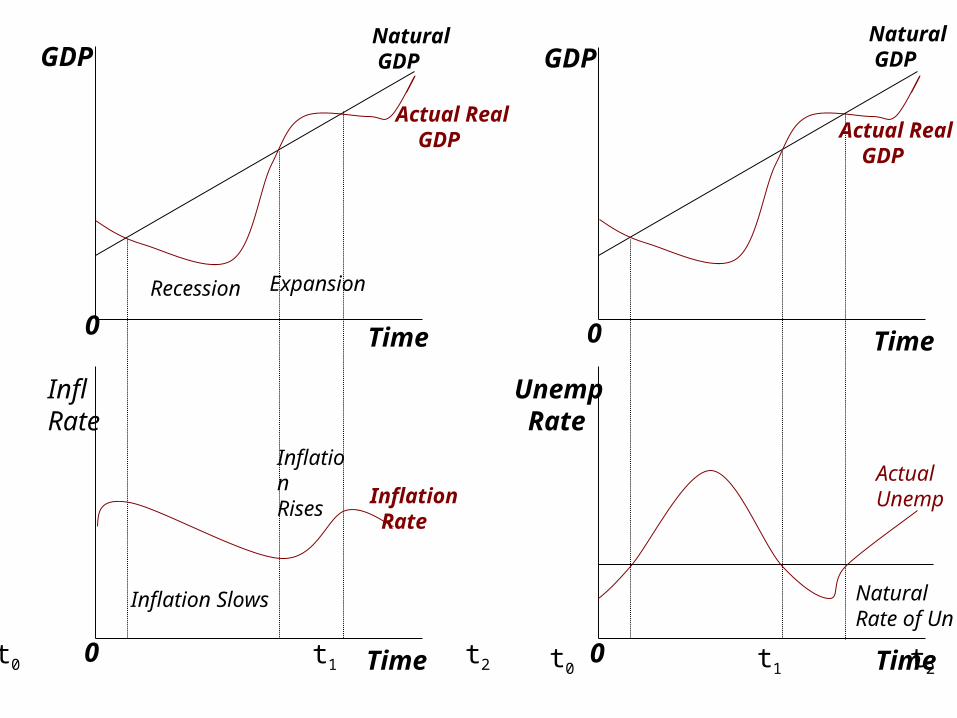
Recession Expansion
Graphs: Description
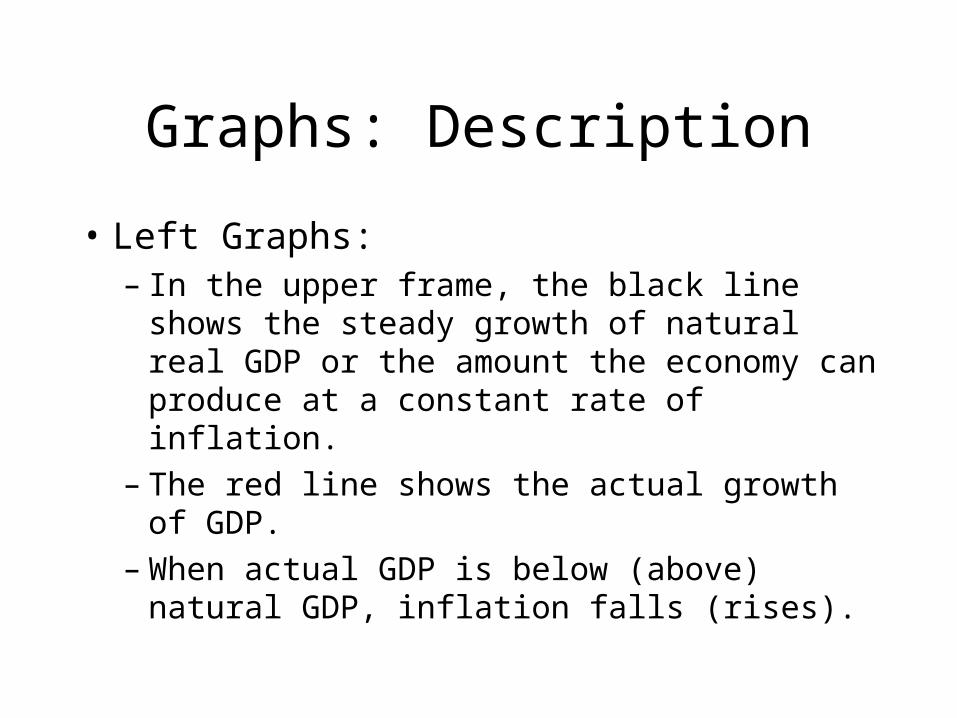
• Left Graphs:– In the upper frame, the black line shows the
steady growth of natural real GDP or the amount the economy can produce at a constant rate of inflation.
– The red line shows the actual growth of GDP.– When actual GDP is below (above) natural
GDP, inflation falls (rises).
Graphs: Description
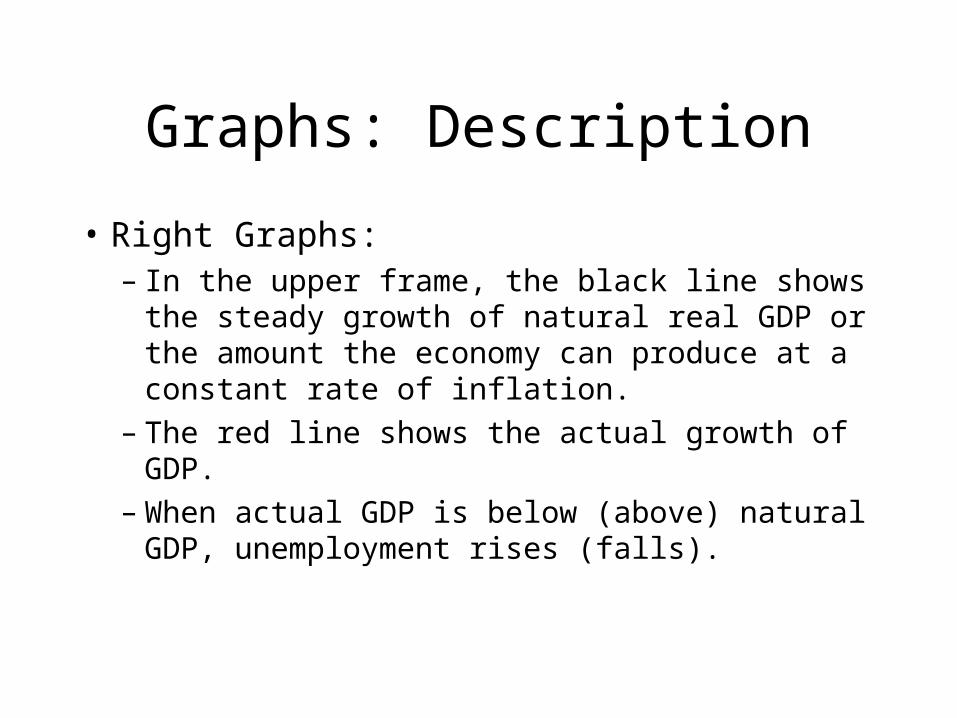
• Right Graphs:– In the upper frame, the black line shows the
steady growth of natural real GDP or the amount the economy can produce at a constant rate of inflation.
– The red line shows the actual growth of GDP.– When actual GDP is below (above) natural
GDP, unemployment rises (falls).
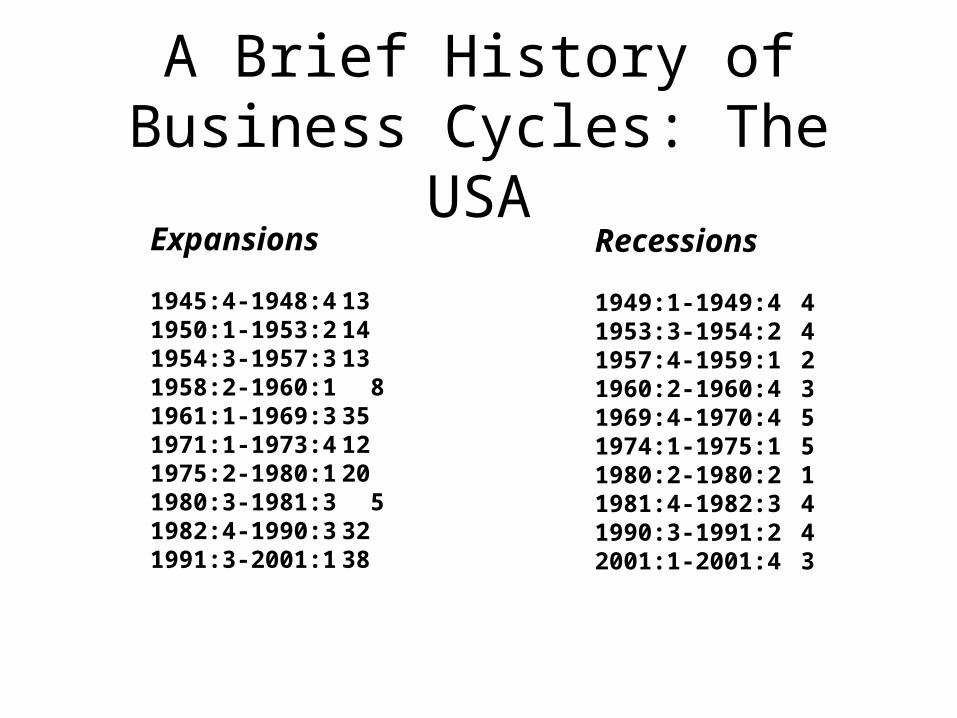
A Brief History of Business Cycles: The USA
Expansions
1945:4-1948:4 131950:1-1953:2 141954:3-1957:3 131958:2-1960:1 81961:1-1969:3 351971:1-1973:4 121975:2-1980:1 201980:3-1981:3 51982:4-1990:3 321991:3-2001:1 38
Recessions
1949:1-1949:4 41953:3-1954:2 41957:4-1959:1 21960:2-1960:4 31969:4-1970:4 51974:1-1975:1 51980:2-1980:2 11981:4-1982:3 41990:3-1991:2 42001:1-2001:4 3
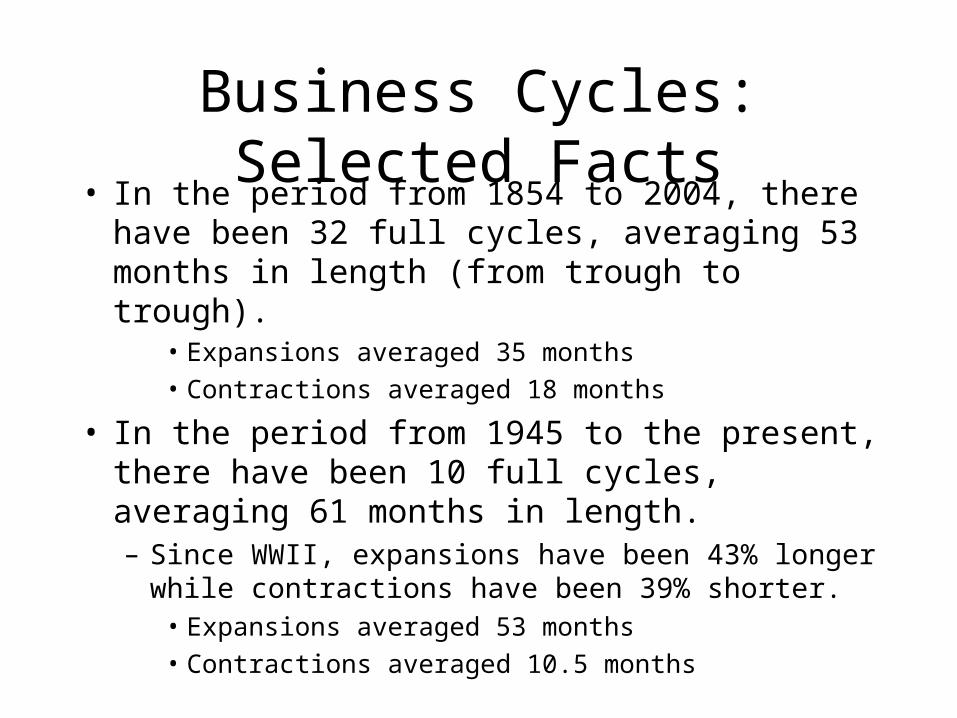
Business Cycles: Selected Facts• In the period from 1854 to 2004, there have been 32
full cycles, averaging 53 months in length (from trough to trough).
• Expansions averaged 35 months
• Contractions averaged 18 months
• In the period from 1945 to the present, there have been 10 full cycles, averaging 61 months in length.– Since WWII, expansions have been 43% longer while
contractions have been 39% shorter.• Expansions averaged 53 months
• Contractions averaged 10.5 months
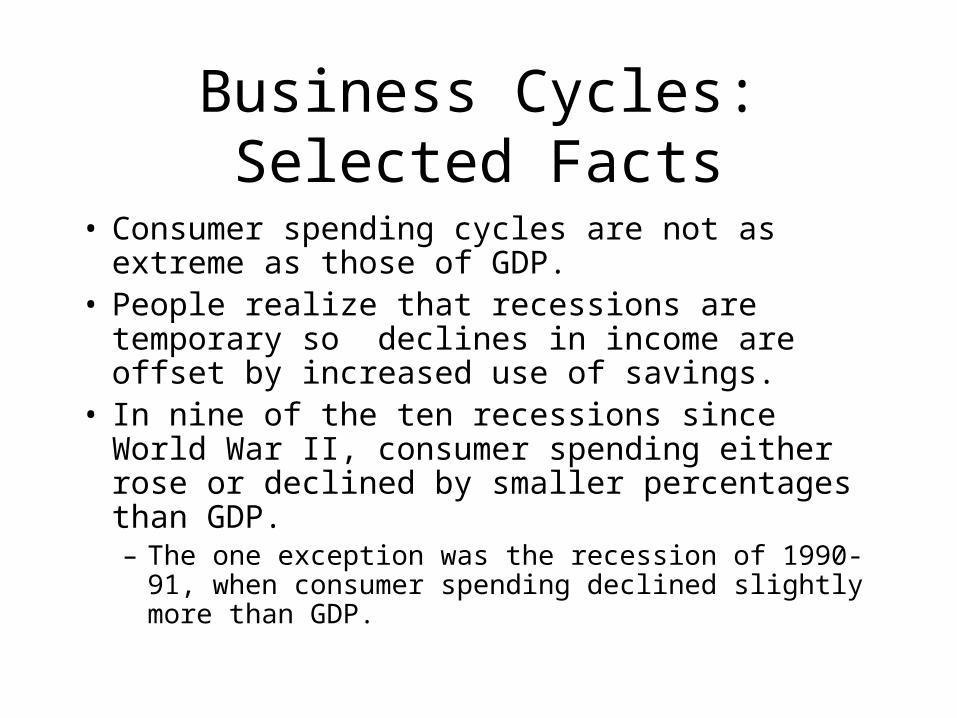
Business Cycles: Selected Facts
• Consumer spending cycles are not as extreme as those of GDP.
• People realize that recessions are temporary so declines in income are offset by increased use of savings.
• In nine of the ten recessions since World War II, consumer spending either rose or declined by smaller percentages than GDP.– The one exception was the recession of 1990-91, when
consumer spending declined slightly more than GDP.
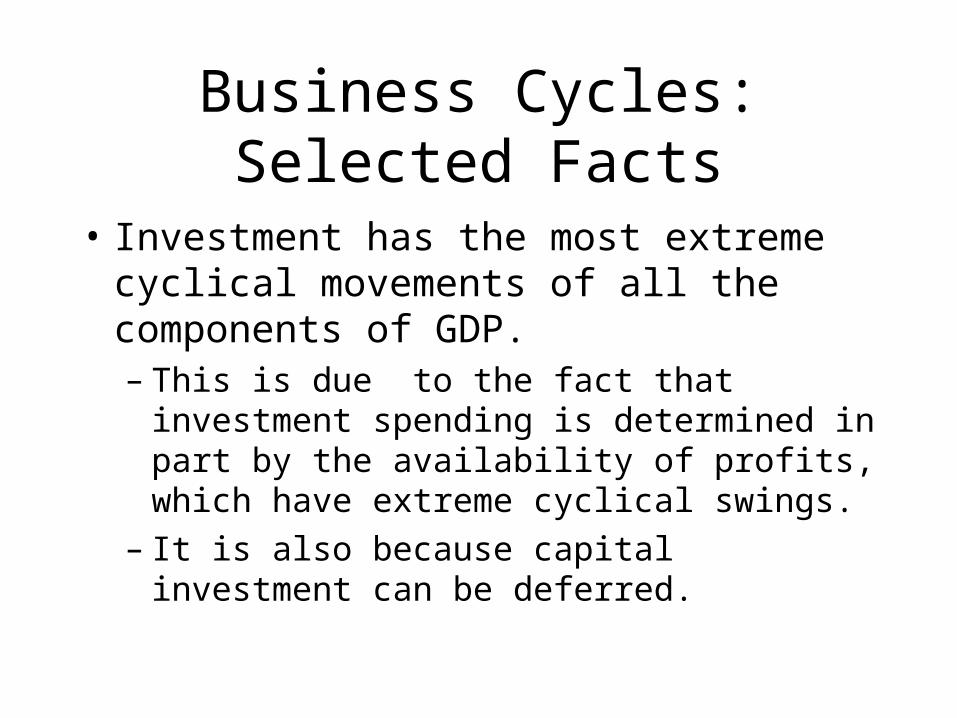
Business Cycles: Selected Facts
• Investment has the most extreme cyclical movements of all the components of GDP.– This is due to the fact that investment spending
is determined in part by the availability of profits, which have extreme cyclical swings.
– It is also because capital investment can be deferred.
Taming Business Cycles
Stabilization Policy
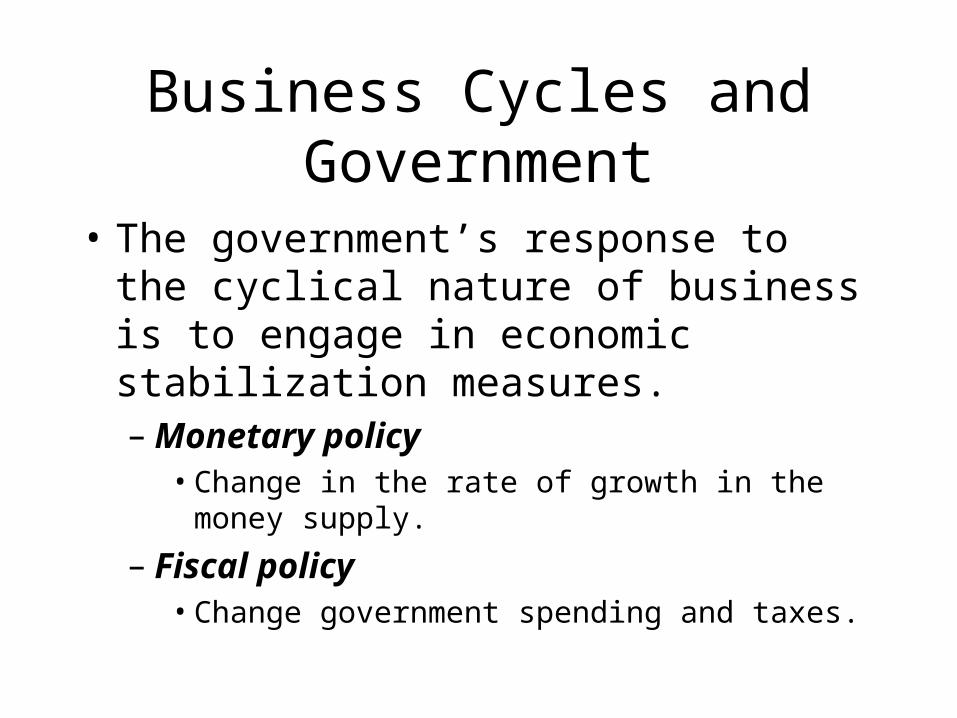
Business Cycles and Government
• The government’s response to the cyclical nature of business is to engage in economic stabilization measures.– Monetary policy
• Change in the rate of growth in the money supply.
– Fiscal policy• Change government spending and taxes.
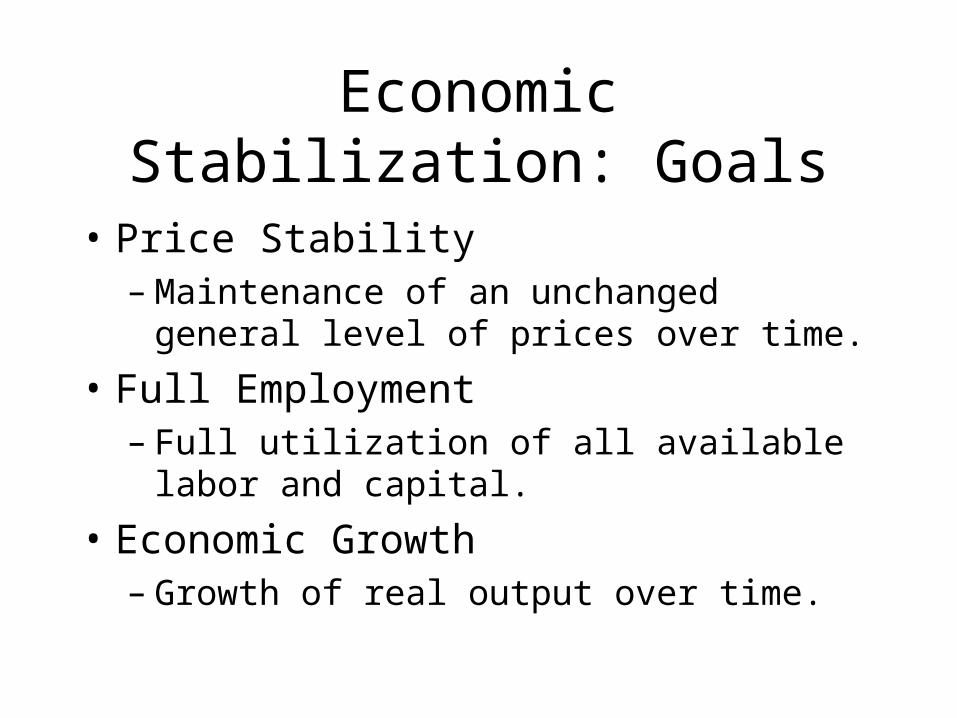
Economic Stabilization: Goals
• Price Stability– Maintenance of an unchanged general level of
prices over time.
• Full Employment– Full utilization of all available labor and
capital.
• Economic Growth– Growth of real output over time.
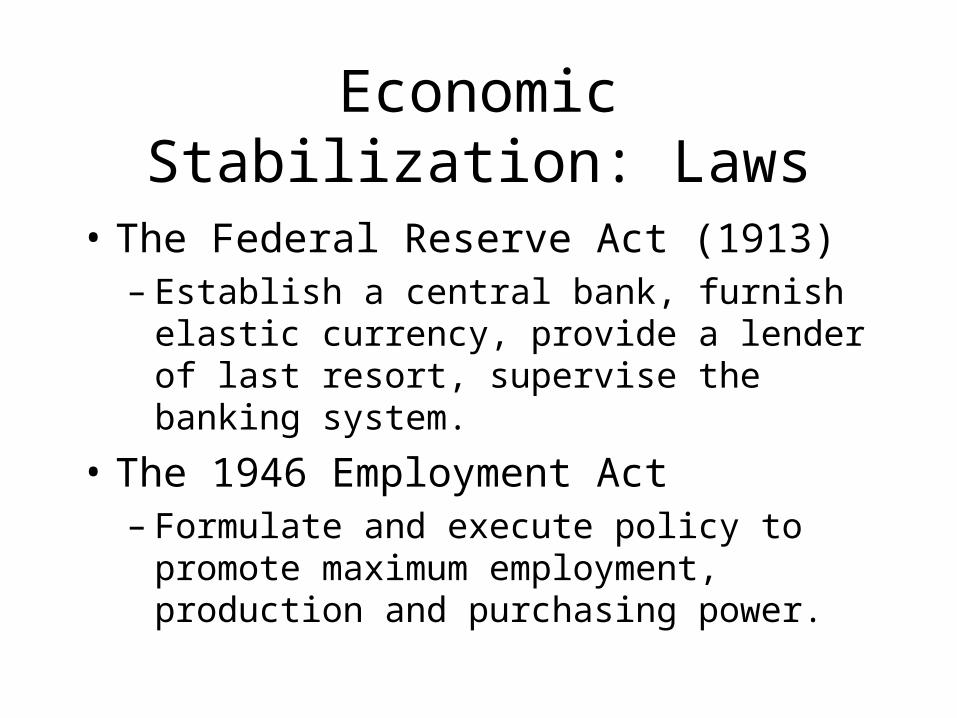
Economic Stabilization: Laws
• The Federal Reserve Act (1913)– Establish a central bank, furnish elastic
currency, provide a lender of last resort, supervise the banking system.
• The 1946 Employment Act– Formulate and execute policy to promote
maximum employment, production and purchasing power.
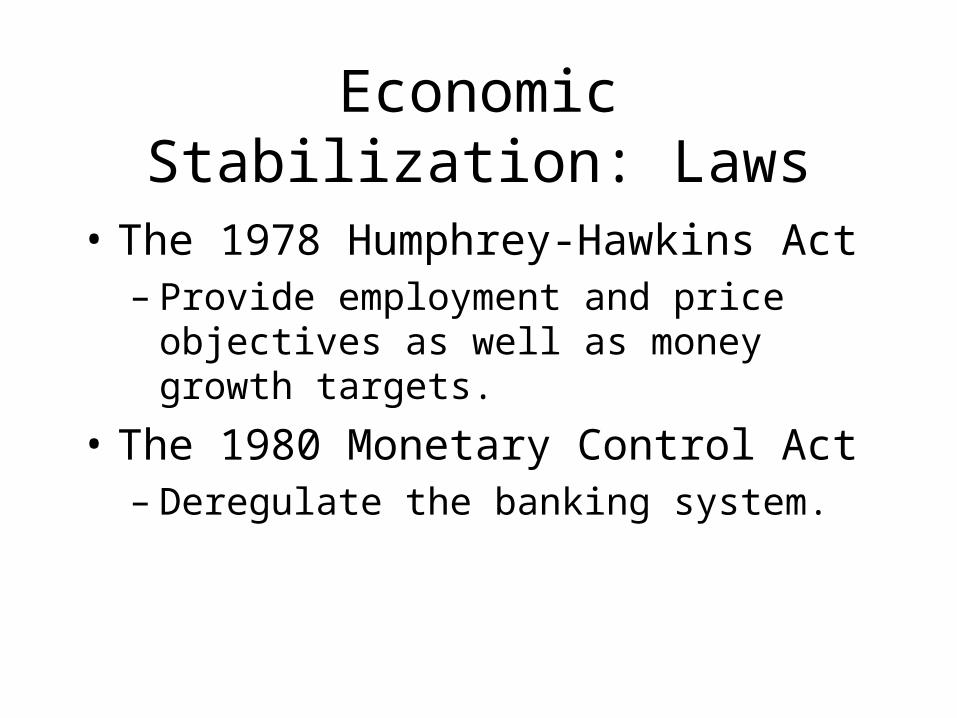
Economic Stabilization: Laws
• The 1978 Humphrey-Hawkins Act– Provide employment and price objectives as
well as money growth targets.
• The 1980 Monetary Control Act– Deregulate the banking system.
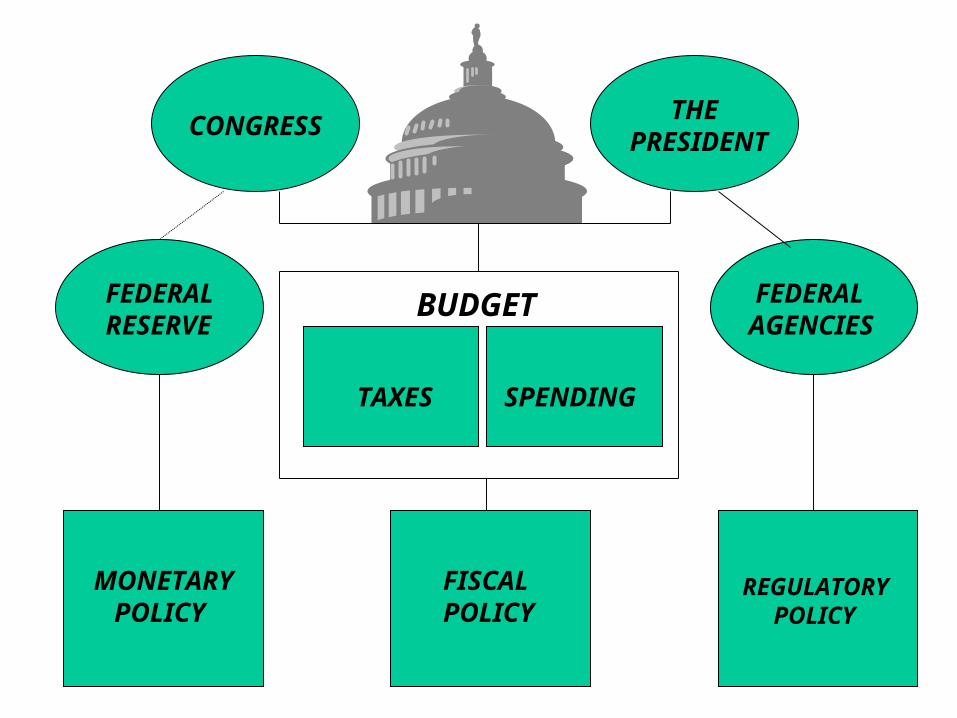
CONGRESS THEPRESIDENT
FEDERALAGENCIES
FEDERALRESERVE
MONETARY POLICY
FISCALPOLICY
REGULATORY POLICY
TAXES SPENDING
BUDGET
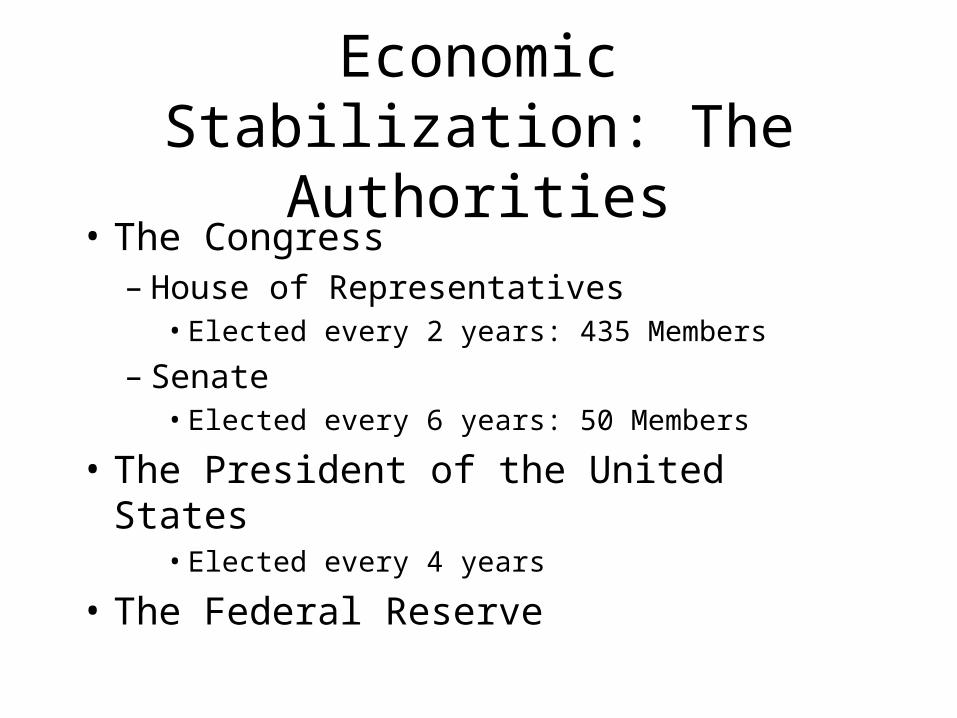
Economic Stabilization: The Authorities
• The Congress– House of Representatives
• Elected every 2 years: 435 Members
– Senate• Elected every 6 years: 50 Members
• The President of the United States• Elected every 4 years
• The Federal Reserve
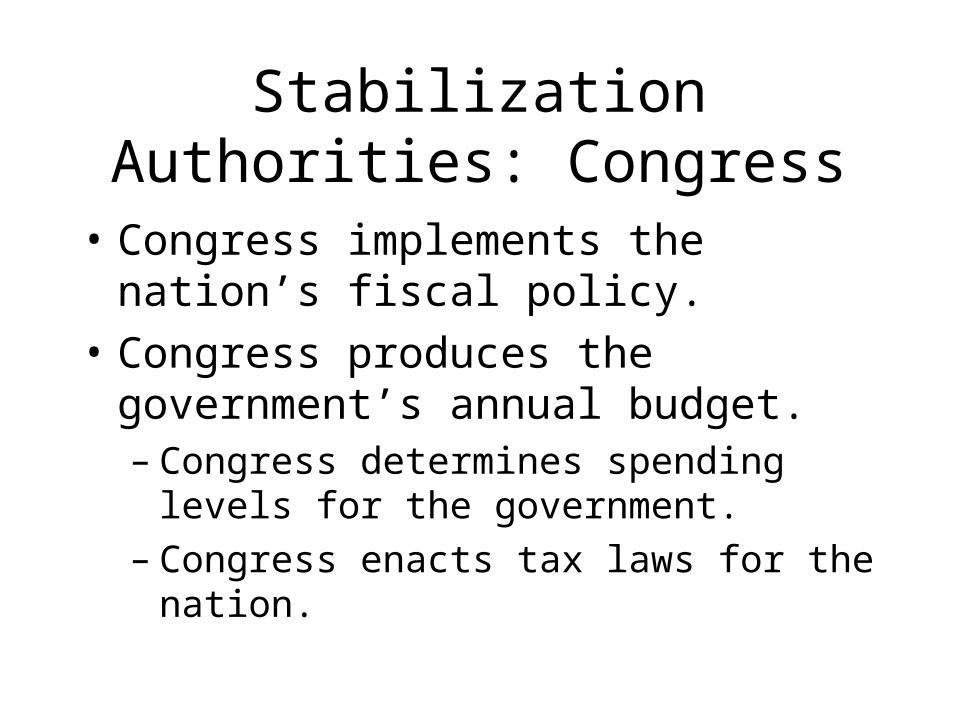
Stabilization Authorities: Congress
• Congress implements the nation’s fiscal policy.
• Congress produces the government’s annual budget.– Congress determines spending levels for the
government.– Congress enacts tax laws for the nation.
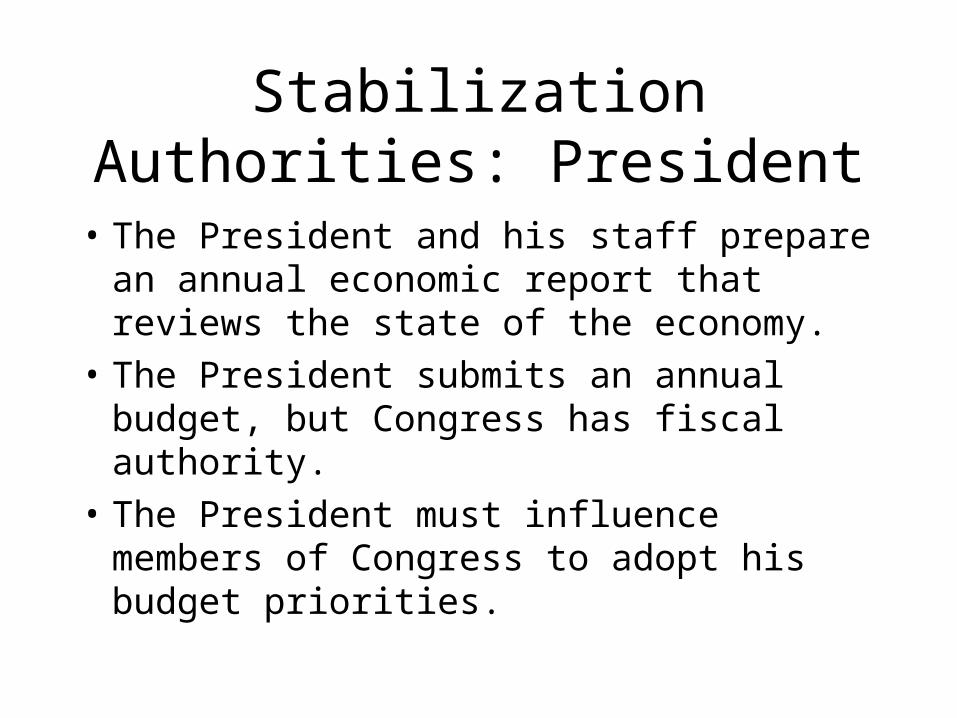
Stabilization Authorities: President
• The President and his staff prepare an annual economic report that reviews the state of the economy.
• The President submits an annual budget, but Congress has fiscal authority.
• The President must influence members of Congress to adopt his budget priorities.
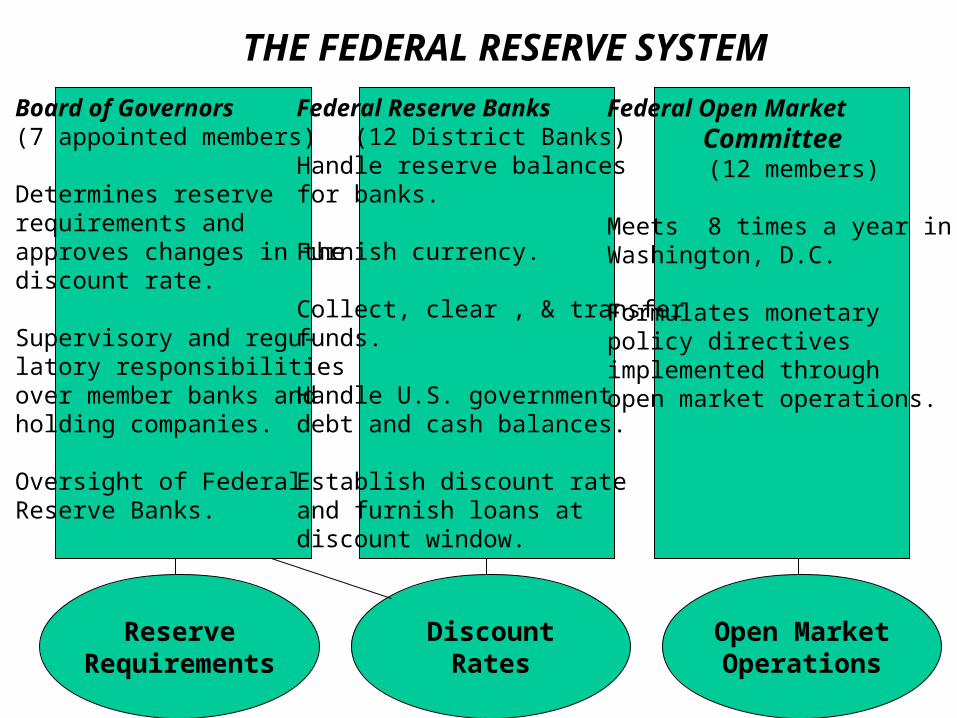
THE FEDERAL RESERVE SYSTEM
ReserveRequirements
DiscountRates
Open MarketOperations
Board of Governors(7 appointed members)
Determines reserve requirements and approves changes in thediscount rate.
Supervisory and regu-latory responsibilitiesover member banks andholding companies.
Oversight of FederalReserve Banks.
Federal Reserve Banks (12 District Banks)Handle reserve balancesfor banks.
Furnish currency.
Collect, clear , & transferfunds.
Handle U.S. governmentdebt and cash balances.
Establish discount rate and furnish loans atdiscount window.
Federal Open Market Committee (12 members)
Meets 8 times a year inWashington, D.C.
Formulates monetarypolicy directivesimplemented through open market operations.
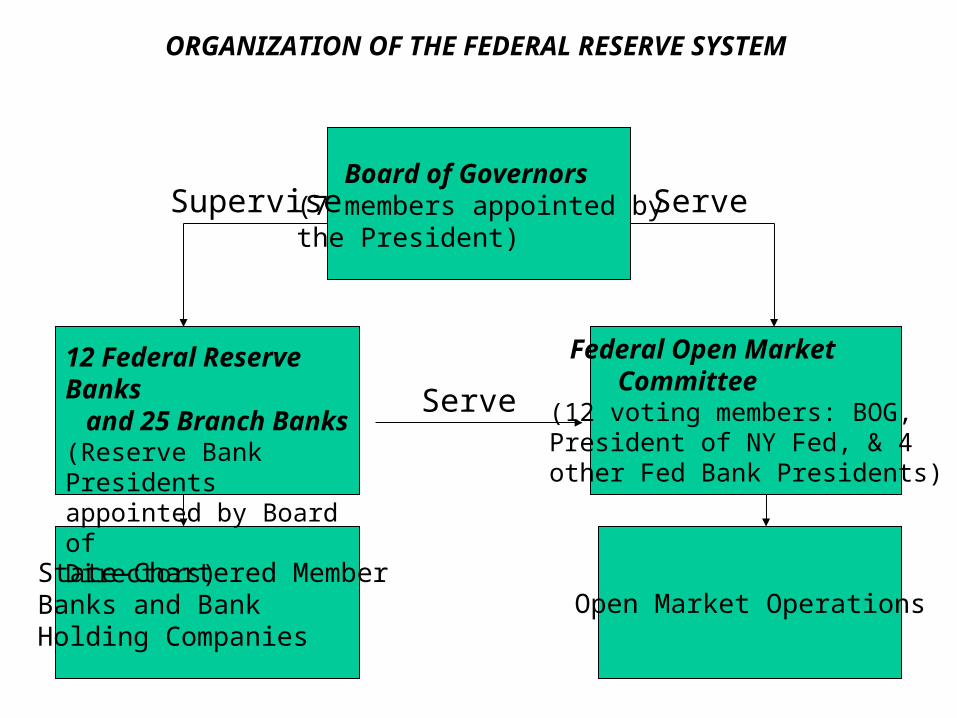
ORGANIZATION OF THE FEDERAL RESERVE SYSTEM
Open Market Operations
Board of Governors(7 members appointed bythe President)
12 Federal Reserve Banks and 25 Branch Banks(Reserve Bank Presidentsappointed by Board ofDirectors)
Federal Open Market Committee(12 voting members: BOG,President of NY Fed, & 4other Fed Bank Presidents)
State-Chartered MemberBanks and BankHolding Companies
Supervise Serve
Serve
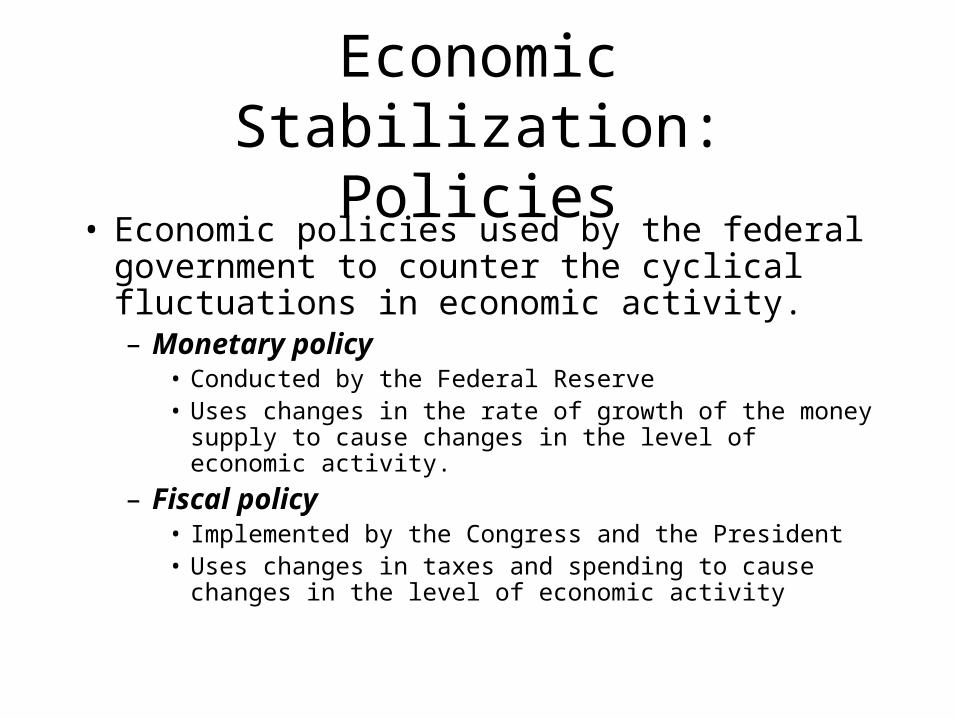
Economic Stabilization: Policies
• Economic policies used by the federal government to counter the cyclical fluctuations in economic activity.– Monetary policy
• Conducted by the Federal Reserve• Uses changes in the rate of growth of the money supply to
cause changes in the level of economic activity.
– Fiscal policy• Implemented by the Congress and the President• Uses changes in taxes and spending to cause changes in the
level of economic activity
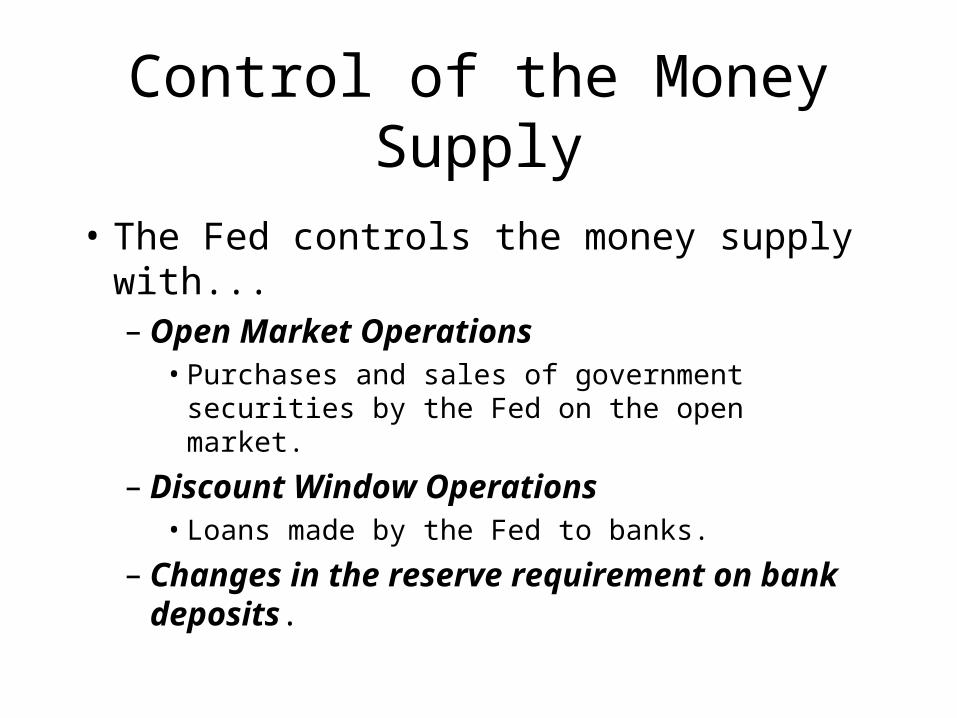
Control of the Money Supply
• The Fed controls the money supply with...– Open Market Operations
• Purchases and sales of government securities by the Fed on the open market.
– Discount Window Operations• Loans made by the Fed to banks.
– Changes in the reserve requirement on bank deposits.
Thinking Like an Economist
A Guide to Business Cycle Theories
• Questions to be Answered:– What is the primary source of economic
disturbance in the macroeconomy?– How fast do expectations adjust to changing
circumstances?– Are other frictions in the market clearing process
important?– Are policy lags highly variable and
unpredictable?
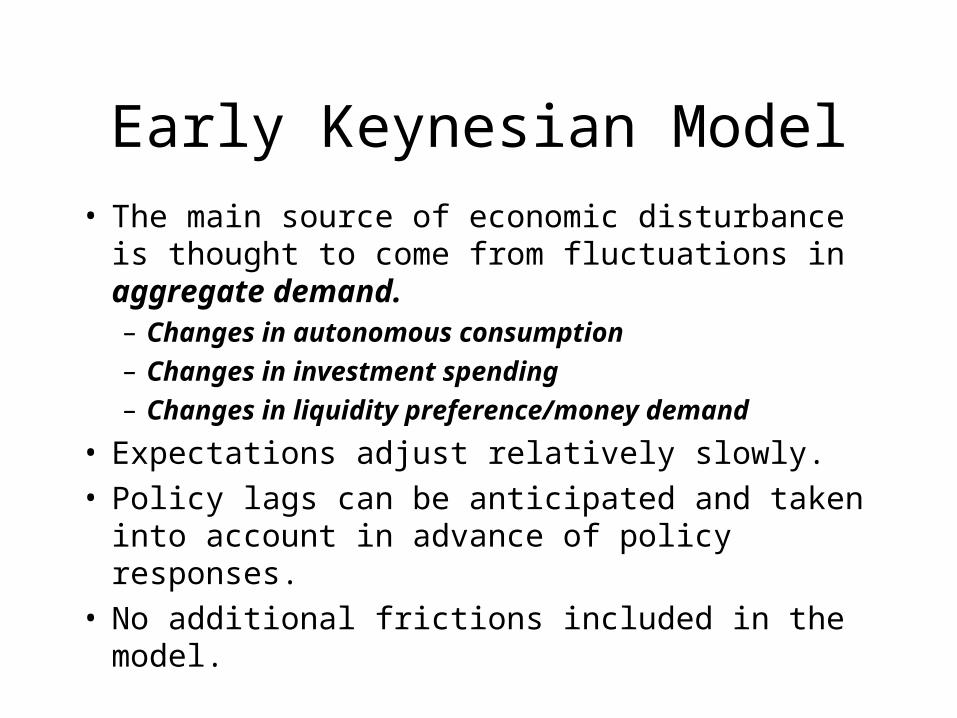
Early Keynesian Model
• The main source of economic disturbance is thought to come from fluctuations in aggregate demand.– Changes in autonomous consumption
– Changes in investment spending
– Changes in liquidity preference/money demand
• Expectations adjust relatively slowly.• Policy lags can be anticipated and taken into
account in advance of policy responses.• No additional frictions included in the model.
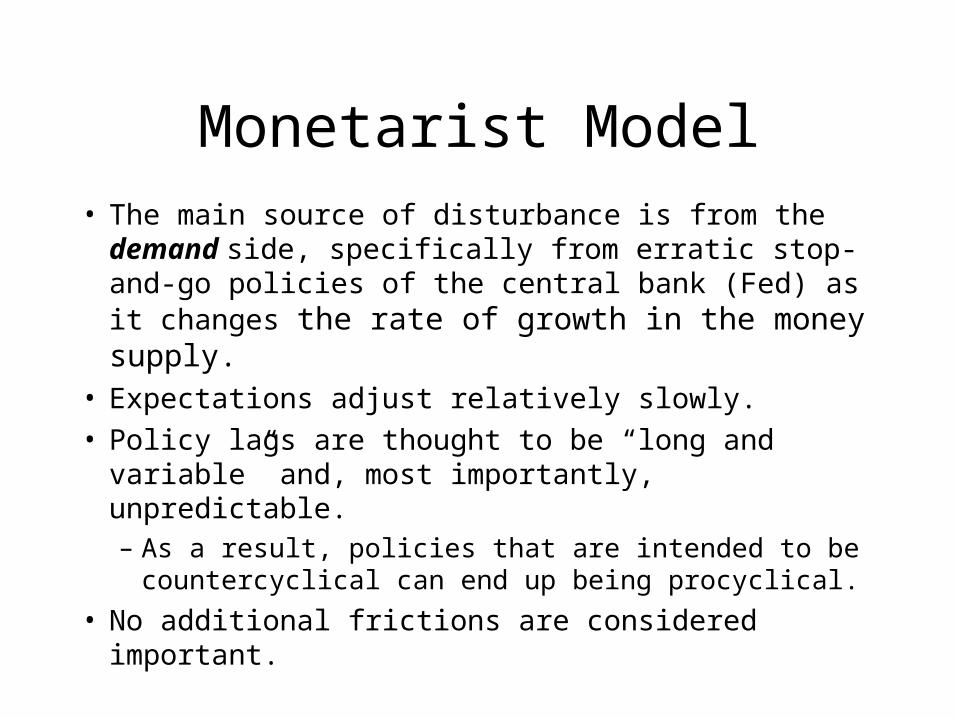
Monetarist Model
• The main source of disturbance is from the demand side, specifically from erratic stop-and-go policies of the central bank (Fed) as it changes the rate of growth in the money supply.
• Expectations adjust relatively slowly.• Policy lags are thought to be “long and variable”
and, most importantly, unpredictable.– As a result, policies that are intended to be
countercyclical can end up being procyclical.
• No additional frictions are considered important.
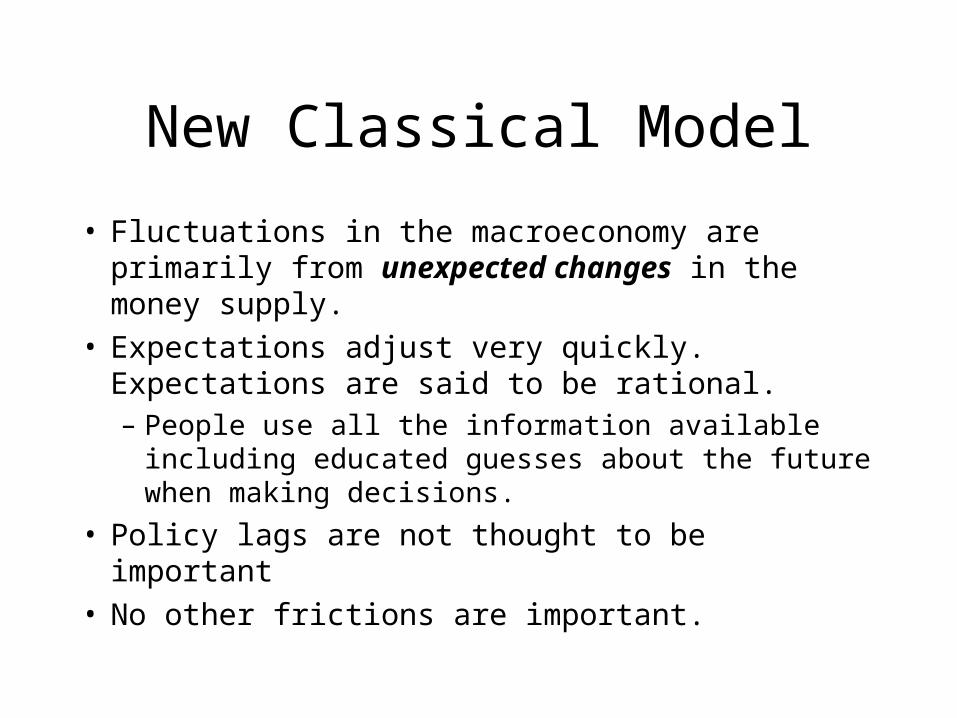
New Classical Model
• Fluctuations in the macroeconomy are primarily from unexpected changes in the money supply.
• Expectations adjust very quickly. Expectations are said to be rational.– People use all the information available including
educated guesses about the future when making decisions.
• Policy lags are not thought to be important• No other frictions are important.
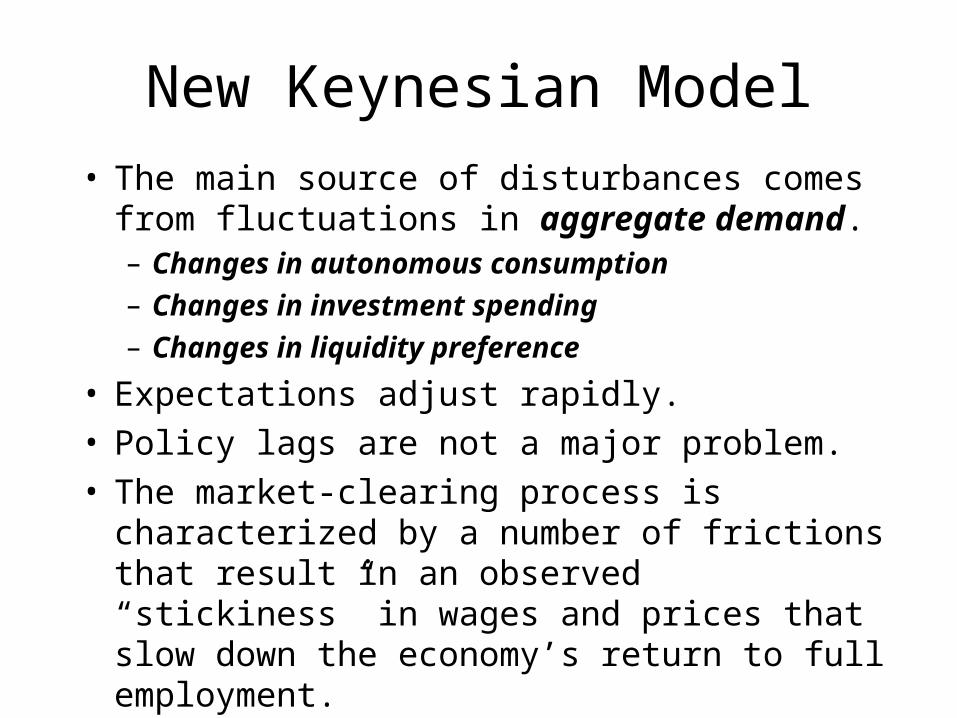
New Keynesian Model
• The main source of disturbances comes from fluctuations in aggregate demand.– Changes in autonomous consumption
– Changes in investment spending
– Changes in liquidity preference
• Expectations adjust rapidly.• Policy lags are not a major problem.• The market-clearing process is characterized by a
number of frictions that result in an observed “stickiness” in wages and prices that slow down the economy’s return to full employment.
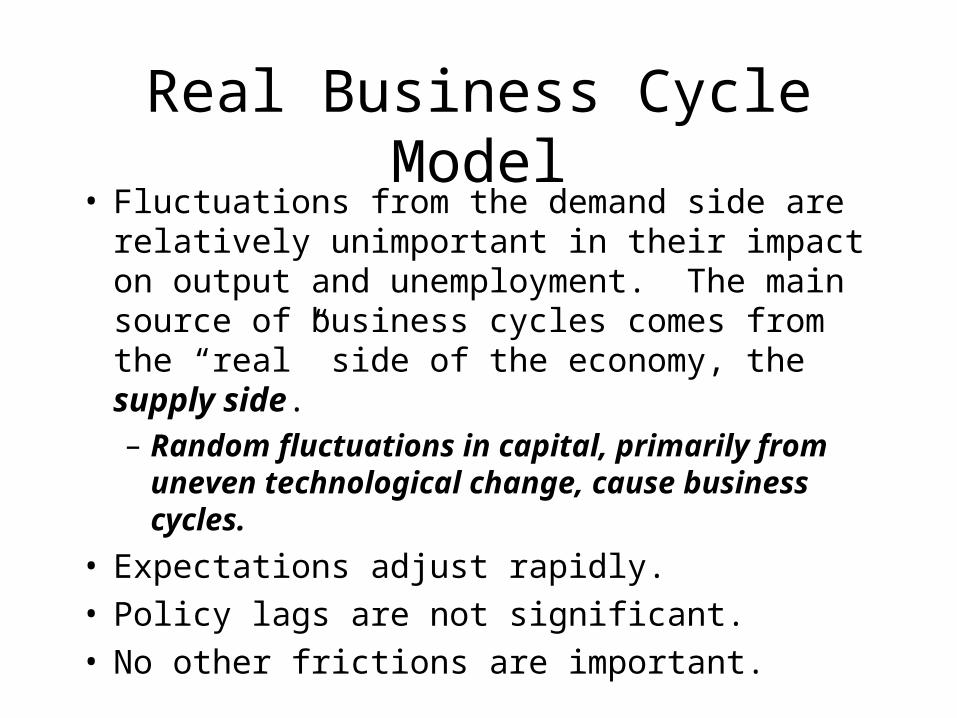
Real Business Cycle Model• Fluctuations from the demand side are relatively
unimportant in their impact on output and unemployment. The main source of business cycles comes from the “real” side of the economy, the supply side.– Random fluctuations in capital, primarily from
uneven technological change, cause business cycles.
• Expectations adjust rapidly.• Policy lags are not significant.• No other frictions are important.
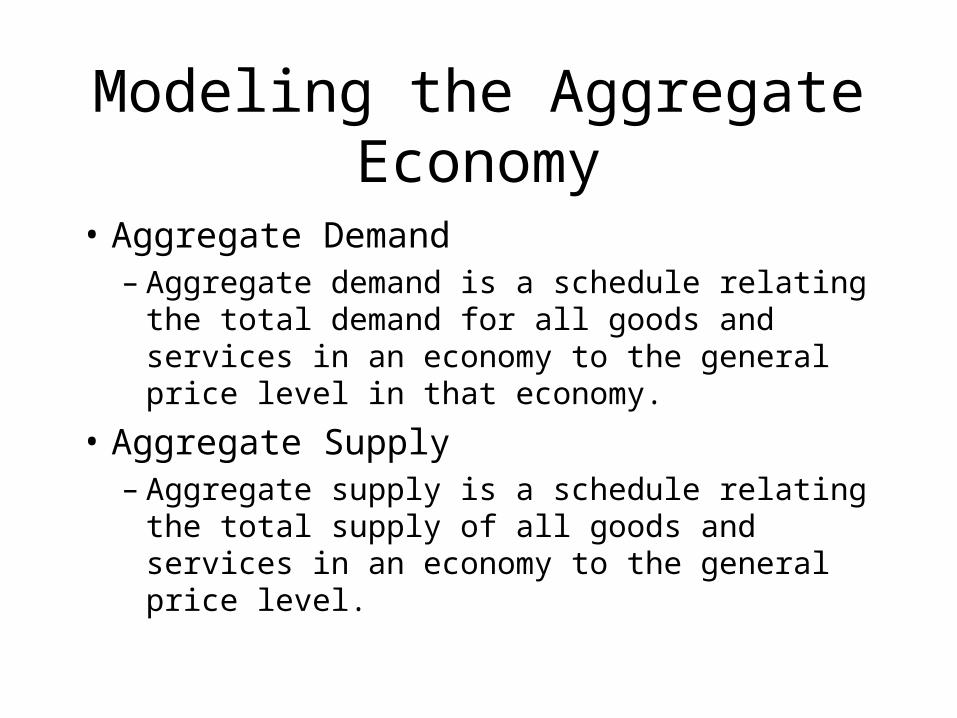
Modeling the Aggregate Economy
• Aggregate Demand– Aggregate demand is a schedule relating the total
demand for all goods and services in an economy to the general price level in that economy.
• Aggregate Supply– Aggregate supply is a schedule relating the total
supply of all goods and services in an economy to the general price level.
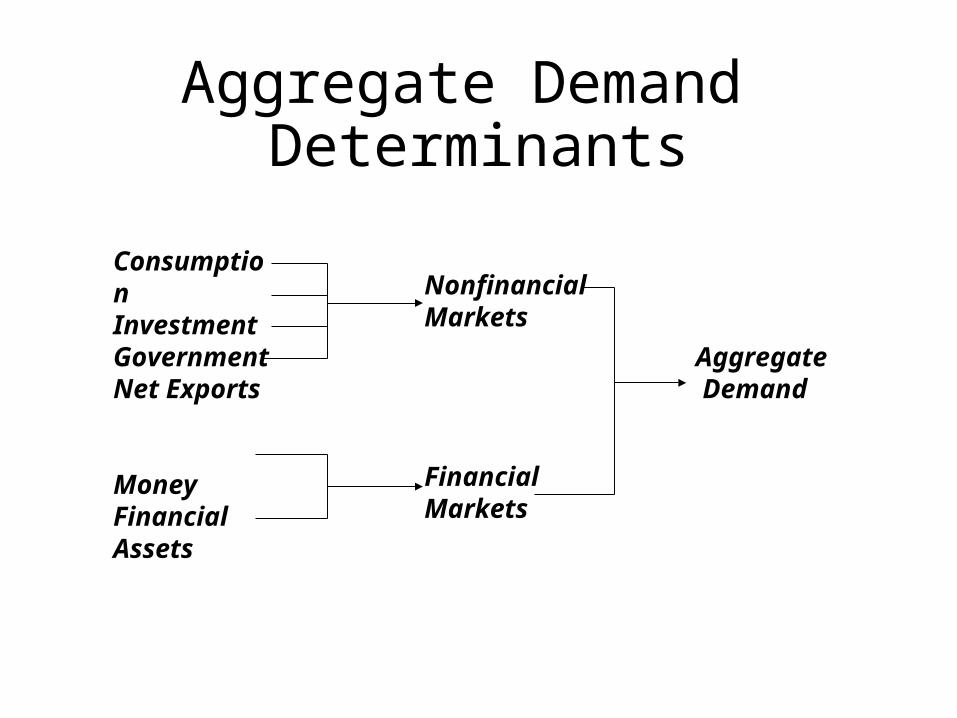
Aggregate Demand Determinants
ConsumptionInvestmentGovernmentNet Exports
MoneyFinancial Assets
NonfinancialMarkets
FinancialMarkets
Aggregate Demand
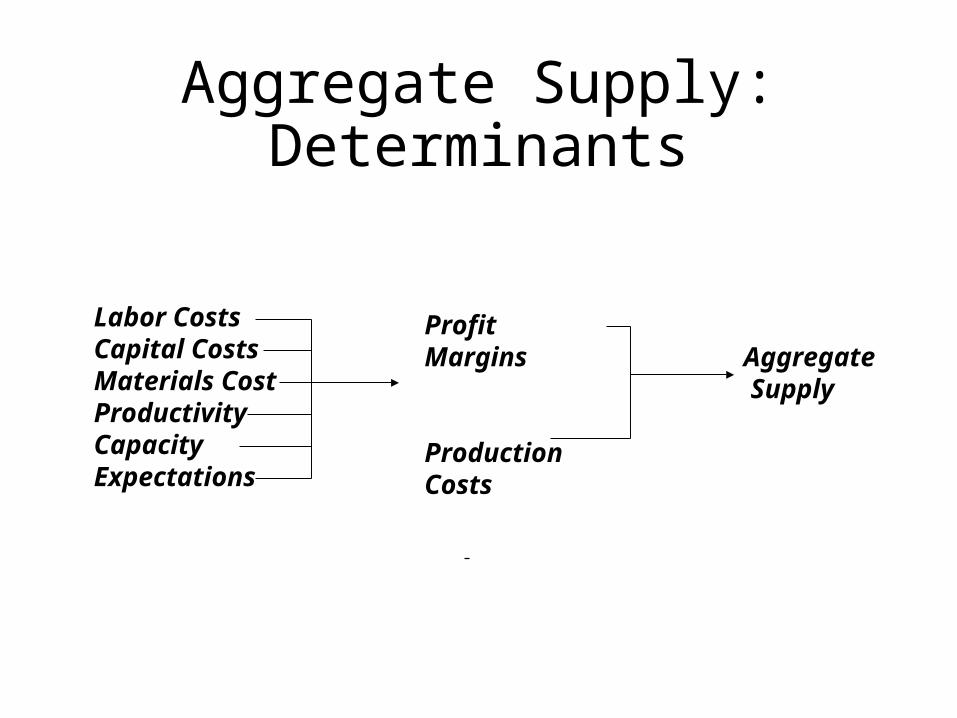
Aggregate Supply: Determinants
Labor CostsCapital CostsMaterials CostProductivityCapacityExpectations
Profit Margins
Production Costs
Aggregate Supply
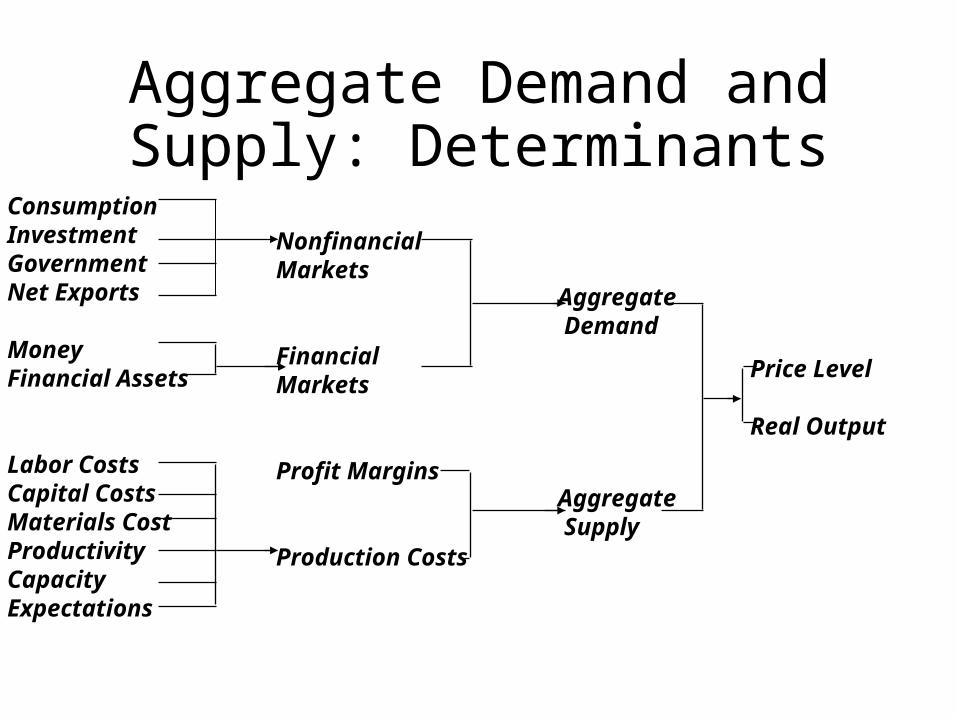
Aggregate Demand and Supply: Determinants
ConsumptionInvestmentGovernmentNet Exports
MoneyFinancial Assets
Labor CostsCapital CostsMaterials CostProductivityCapacityExpectations
NonfinancialMarkets
FinancialMarkets
Profit Margins
Production Costs
Aggregate Demand
Aggregate Supply
Price Level
Real Output
Related Documents