EUROPEAN ECONOMY Occasional Papers 143 | April 2013 Macroeconomic Imbalances United Kingdom 2013 Economic and Financial Affairs ISSN 1725-3209

Welcome message from author
This document is posted to help you gain knowledge. Please leave a comment to let me know what you think about it! Share it to your friends and learn new things together.
Transcript

EUROPEAN ECONOMY
Occasional Papers 143 | April 2013
Macroeconomic Imbalances United Kingdom 2013
Economic and Financial Aff airs
ISSN 1725-3209

Occasional Papers are written by the Staff of the Directorate-General for Economic and Financial Affairs, or by experts working in association with them. The “Papers” are intended to increase awareness of the technical work being done by the staff and cover a wide spectrum of subjects. Views expressed do not necessarily reflect the official views of the European Commission. Comments and enquiries should be addressed to: European Commission Directorate-General for Economic and Financial Affairs Publications B-1049 Brussels Belgium E-mail: mailto:[email protected] Legal notice Neither the European Commission nor any person acting on its behalf may be held responsible for the use which may be made of the information contained in this publication, or for any errors which, despite careful preparation and checking, may appear. This paper exists in English only and can be downloaded from the website ec.europa.eu/economy_finance/publications A great deal of additional information is available on the Internet. It can be accessed through the Europa server (ec.europa.eu ) KC-AH-13-143-EN-N ISBN 978-92-79-28557-8 doi: 10.2765/41676 © European Union, 2013 Reproduction is authorised provided the source is acknowledged.
European Commission
Directorate-General for Economic and Financial Affairs
Macroeconomic Imbalances –
United Kingdom 2013
EUROPEAN ECONOMY Occasional Papers 143

ACKNOWLEDGEMENTS
ii
This report was prepared in the Directorate General for Economic and Financial Affairs under the direction of Servaas Deroose, deputy director-general, Matthias Mors and Anne Bucher, directors.
The main contributors were Matthias Mors, Christian Weise, Olivia Mollen, Daniel Monteiro and Sam Whittaker. Statistical assistance was provided by Samuela Caramanica, Johann Korner and Laura Fernández Vilaseca.
Comments on the report would be gratefully received and should be sent, by mail or e-mail to:
Christian Weise European Commission, DG ECFIN, Unit G.2 BRU-CHAR 10/198 B-1049 Brussels. e-mail: [email protected]
The cut-off date for this report was March 4, 2013.
3
Results of in-depth reviews under Regulation (EU) No 1176/2011 on the prevention and correction of macroeconomic imbalances
THE UNITED KINGDOM is experiencing macroeconomic imbalances, which deserve monitoring and policy action. In particular, macroeconomic developments in the areas of household debt, linked to the high levels of mortgage debt and the characteristics of the housing market, as well as unfavourable developments in external competitiveness, especially as regards goods exports and weak productivity growth, continue to deserve attention. More specifically, the UK faces tensions between the needs for deleveraging, maintaining financial stability and avoiding compromising investment and growth. The primary cause of the growth in household debt was high and volatile house prices, linked to an insufficient and rigid supply of housing. Household deleveraging continued in 2012 and house prices corrected further but this may not be sustained once the economy improves and housing transactions return to more normal levels. Policy measures have been introduced aiming at increasing residential construction, although it is not yet clear whether they will prove effective. As a consequence of a combination of high house prices and the widespread and growing use of variable-rate mortgages, households are particularly exposed to interest rate changes. The stock of UK corporate debt is modestly high yet some firms are having difficulty accessing adequate funding for investment. The UK is also confronted with the twin challenge of sustaining the pre-crisis dynamism in service exports and boosting the underlying drivers of productivity in the industrial sectors in order to regain the external competitiveness that was partly eroded in the pre-crisis years. The net trade outturn for 2012 was lower than expected. Overall public investment remains low and it is not clear when and to what extent private investment will pick-up. On current policies, the flow of credit may only be normalised once broader macroeconomic conditions improve. Skill gaps persist and closing them will require a substantial long-term investment. Given the size of the British economy, the imbalances may generate spill-overs to the other European economies.
Excerpt of country-specific findings on The United Kingdom, COM(2013) 199 final, 10.4.2013.

5
Executive Summary and Conclusions 9
1. Introduction 13
2. Macroeconomic Situation and Potential Imbalances 15
2.1. Macroeconomic scene setter 15
2.2. Competitiveness and export performance 16
2.3. Sustainability of external positions 18
2.4. Government indebtedness 19
2.5. Private sector indebtedness 20
3. In-Depth Analysis of Selected Topics 25
3.1. External competitiveness 25
3.1.1. Developments in external competitiveness 25
3.1.2. Characteristics of the UK trading sector 29
3.1.3. Structural challenges 33
3.1.4. Conclusions 37
3.2. Private debt, deleveraging and growth 39
3.2.1. Corporate debt and access to finance 39
3.2.2. Housing policy and household debt 43
3.2.3. What risks do private debt dynamics and servicing costs pose to stability and growth? 51
3.2.4. Conclusions 55
4. Policy Challenges 57
References 60
LIST OF TABLES 3.1. UK Export Market Shares (y-o-y growth, value terms) 25
3.2. Top UK Exports by Category of Goods and Services (2010) 29
3.3. Investment rates1 for the UK and EU 27 34
LIST OF GRAPHS 2.1. UK export market share growth 16
2.2. Decomposition of the UK current account 17
2.3. Decomposition of developments in the UK REER 17
6
2.4. Decomposition of developments in the UK unit labour costs 17
2.5. Financing of the UK current account 18
2.6a. Decomposition of the UK net international investment position 18
2.6b. Decomposition of changes in net international investment position 18
2.7. UK government debt 19
2.8. Net lending or borrowing by sector 20
2.9. Decomposition of financial liabilities in the UK economy 20
2.10. Decomposition of net credit flows in the economy 21
2.11. Household leverage indicators 21
2.12. Households debt-to-assets ratio 22
2.13. UK dwelling completions by type 22
2.14. Developments in UK house prices and mortgage lending 23
3.1. UK firms citing factors abroad as inhibiting exports 26
3.2. International market shares of the six largest service exporters in the EU 26
3.3a. Developments in UK aggregate and financial services exports 27
3.3b. UK export market share growth decomposition 27
3.4. UK exchange rate and trade balance performance 27
3.5. Contribution to UK market share growth from geographical and sectoral composition 28
3.6. Overlapping indices with China 28
3.7. UK export products - similarity with China vs. share in total UK exports 28
3.8. UK goods exports to BRIC and other countries 29
3.9a. Trade in oil balance 30
3.9b. Oil production 30
3.10. Decomposition of UK service exports 30
3.11. Current price GDP per hour worked relative to the UK 31
3.12a. Number of UK firms distribution by firm size class 32
3.12b. UK exports by destination 32
3.12c. UK labour productivity distribution by firm size class 32
3.13. Import content of exports (2009) 33
3.14. UK infrastructure compared with other countries 34
3.15. Recruitment difficulties 35
3.16a. Average incidence of vertical mismatch (2001-2011) in EU-27 countries, % of employees
(aged 25-64) 36
3.16b. Incidence of horizontal mismatch in Europe, % of employed, 2009, EU-27 36
3.17. Index of SME access to bank loans 37
3.18. Indicators of leverage in non-financial corporations 39
3.19a. Profitability of non-financial corporations 40
3.19b. Savings and investment by non-financial corporations 40
3.20. Financial corporations' liabliities and loan to deposit ratio 41
3.21. Net funds raised by UK businesses 41
3.22a. Indicative median interest rates on new SME variable rate loan facilities 42
3.22b. Availability an demand for credit by firm size 42

7
3.23a. UK house price cycle compared to other EU Member States 44
3.23b. UK price to income ratio, 1996=100 44
3.24a. Residential investment and buliding permits 45
3.24b. Residential investment, % GDP 45
3.25a. Approvals of loans secured on dwellings 47
3.25b. Mortgage arrears and repossession rates 47
3.26. Quoted interest rates on fixed rate and floating rate mortgages 48
3.27. Savings rate and growth in real household disposable income 49
3.28. Housing tenure and housing cost overburden rates (2008-2010 average) 50
3.29. Banks' tier 1 capital ratios (%) 51
3.30. UK household debt: 2009-2017 52
3.31. Company liquidations in England and Wales and an estimate of loss-making companies 53
3.32a. Write off rates on lending to UK businesses and individuals 54
3.32b. Bank of England base rate and forward market expectations 54


EXECUTIVE SUMMARY AND CONCLUSIONS
9
In May 2012, the Commission concluded that the UK was experiencing macroeconomic imbalances, in particular as regards developments related to household debt, the housing market and, to some extent, external competitiveness. In the Alert Mechanism Report (AMR) published on 28 November 2012, the Commission found it useful, also taking into account the identification of an imbalance in May, to examine further the persistence of imbalances or their unwinding. To this end this In-Depth Review (IDR) takes a broad view of the UK economy in line with the scope of the surveillance under the Macroeconomic Imbalances Procedure (MIP). The main observations and findings from this analysis are:
• The challenges identified in the 2012 IDR, namely the high levels of household debt and the deterioration in external competitiveness, remain valid. As such, the 2013 edition of the IDR revisits these themes, while expanding and going deeper into selected aspects, including the dynamics of private debt, both household and corporate. In the short term the macroeconomic imbalances that the UK is experiencing pose a more immediate threat to growth than to stability, but if not addressed they could store up future risks to macroeconomic stability and to the financial sector.
• As regards external competitiveness, the UK experienced a large drop in export market shares from 2007 to 2010. The trade balance has been negative since 1997, mainly as the result of a chronic deficit in goods trade. Nevertheless, export volumes have been a modest net driver of growth in the UK economy in the crisis period. Exports were 3.3% higher in 2011 than 2007, while total GDP remained below its pre-crisis peak. External performance in 2012 was worse than anticipated, although the current account is expected to continue to move towards a more balanced position in the medium term. The deterioration in the UK's current account balance in 2012 was mainly due to weaknesses in external demand and foreign income, in particular from European countries, unfavourable developments in oil trade, and buoyant imports despite the economic recession. The effects of the depreciation of sterling in 2008 seem to have passed through whilst providing only a modest boost to the trade balance, and to make sustained improvements the UK needs to confront structural challenges in the areas of transport infrastructure, skills and access to finance. The UK faces the twin challenges of sustaining the pre-crisis dynamism in service exports and boosting the underlying drivers of productivity in the industrial sectors in order to regain the external competitiveness that was partly eroded in the pre-crisis years. As regards trade in services, the UK has maintained a significant surplus for several decades, which continues to sustain the current account despite the negative effects of the global financial and economic crisis on the financial and professional services cluster. As regards trade in goods, the balance has been in a persistent deficit since the early 1980s and productivity levels in the manufacturing sector have fallen behind those of other highly-advanced economies.
• Household debt is currently falling, largely due to low levels of new mortgage lending, but is likely to remain at a high level. Low interest rates and forbearance mask risks associated with a minority of over-indebted households. The level of household debt, which is mainly in the form of mortgages, decreased slightly in 2011 to 96% of GDP. Both residential construction and new mortgage lending remain low, and continue to be affected by a weak domestic economy, deleveraging pressures and policy constraints. Despite falling by 17% in real terms since 2008, UK house prices remain high relative to incomes, supported by a shortage of housing supply. The government has put in place a number of regulatory and fiscal measures aimed at increasing residential construction, but it is not yet clear how effective these will be in boosting the supply of housing. Total mortgage servicing costs have been reduced by low interest rates and a high share of variable-rate debt. However, this hides a significant minority of very highly indebted households. As a consequence of a combination of high house prices and the widespread and growing use of variable-rate mortgages, households are particularly exposed to interest rate changes, as well as to rises in unemployment. A sharp fall in house prices remains a possibility, but household debt is likely to pick up again in the medium term, as housing transactions return to more normal levels, unless real progress is made in addressing housing supply shortages. The private rental market has grown in recent years as more households
10
have been priced out of home ownership, but renting is still not seen by most tenants as a desirable long term option.
• The stock of UK corporate debt is moderately high and there are signs of less-than-viable companies being kept in business through low interest rates and bank forbearance, while other firms are having difficulty accessing adequate funding for investment. Many corporations have accumulated significant surpluses in recent years and have built strong balance sheets, but there is a divergent picture across sectors and firms. Evidence suggests that a number of companies continue operating despite having little prospect of paying off their stock of debt. This can store up risks to financial stability and prevent credit from being reallocated to more dynamic and productive sectors of the economy. A fine balance has to be struck in order to reconcile the longer term benefits of "creative destruction", and the shorter term advantages of low insolvency rates supporting employment in a weak domestic economy. Firms in sectors such as construction and real estate, and many SMEs, suffer from debt overhang or are experiencing difficulty in obtaining credit to finance investment. Overall public investment remains low and it is not clear when and to what extent private investment will pick-up. On current policies, the flow of credit may only be normalised once broader macroeconomic conditions improve.
• The government deficit, although decreasing, remains elevated while government debt is high and increasing. The UK is currently subject to the Excessive Deficit Procedure of the Stability and Growth Pact and to the Council recommendations which frame the adjustment to be undertaken. The government is implementing a fiscal consolidation programme and plan to continue it until the financial year 2017-18, after having extended it by one year in the Autumn Statement. These developments will be discussed in detail in the European Commission's assessment of the UK Convergence Programme, as part of the European Semester in May 2013.
The IDR also discusses the policy challenges stemming from these developments and possible policy responses. A number of elements can be considered:
• As regards the challenge of increasing external competitiveness, many of the drivers of the UK's persistent trade deficit relate to structural weaknesses that disproportionately impact upon capital-intensive sectors and goods' producers. Firstly, the competitiveness of the UK economy could be boosted by addressing shortages in airport and seaport capacity, by tackling road congestion and by upgrading the rail network. This would entail meeting the substantial transport infrastructure investment needs indicated in the National Infrastructure Plan 2011, much of which is currently unfunded, by identifying additional sources of funding, addressing high unit costs in transport, and removing regulatory barriers to investment. Secondly, industrial producers require a labour force with the correct advanced and intermediate technical skills, an area where evidence suggests that gaps and recruitment difficulties persist. Ensuring that the National Apprenticeship Programme effectively equips participants with the professional and technical skills demanded by the tradable sectors of the economy can contribute to closing the skills gap and fostering export performance. Finally, access to finance is crucial for UK firms seeking to enter, or expand in, exporting sectors. Difficulties in accessing finance are a cross-cutting problem at the current juncture, particularly for smaller and younger companies. It is important that they be addressed at an economy-wide level as well as through specific financing instruments for exporting companies.
• Concerning the challenge linked to deleveraging, maintaining financial stability and avoiding unduly compromising investment and growth, policy needs to carefully balance a pressing need for new lending to support investment with a long term need for macroeconomic and financial stability. In the short term, loose monetary policy is appropriate in a context of weak domestic and external demand, but this should not be at the cost of allowing existing imbalances to remain unresolved indefinitely. The government's focus on broader actions to improve access to finance are also appropriate given

11
that credit constraints are contributing to low investment and weak growth. To maximise the impact of the Funding for Lending Scheme and other access to finance policies they need to focus as far as possible on supporting an increase in productive investment rather than bidding up the price of existing assets. Action to address the problems of companies with limited prospects of paying back their outstanding debts and hidden risks in bank balance sheets – namely through higher levels of provisioning by banks and, possibly, further company debt restructurings – could both deal with risks to the stability of the financial system and support the reallocation of resources through investment in more productive firms and sectors. Alleviating the housing shortage over the medium term would reduce the risk of imbalances related to persistently high house prices and household debt. This could be aided by further liberalising spatial planning laws, ensuring the planning system operates efficiently, and partially relaxing green belt restrictions. Moving toward a flat rate property or land tax could be a relatively efficient way if raising additional revenue and improving the functioning of the land market. Making long-term private renting more attractive by giving more security to tenants and fostering a professionalisation of the sector could enhance the welfare of households who rent and help reduce the pressure on households to take on high levels of mortgage debt.


1. INTRODUCTION
13
On 28 November 2012, the European Commission presented its second Alert Mechanism Report (AMR), prepared in accordance with Article 3 of Regulation (EU) No. 1176/2011 on the prevention and correction of macroeconomic imbalances. The AMR serves as an initial screening device helping to identify Member States that warrant further in-depth analysis to determine whether imbalances exist or risk emerging. According to Article 5 of Regulation No. 1176/2011, these country-specific in-depth reviews (IDR) should examine the nature, origin and severity of macroeconomic developments in the Member State concerned, which constitute, or could lead to, imbalances. On the basis of this analysis, the Commission will establish whether it considers that an imbalance exists and what type of follow-up it will recommend to the Council.
This is the second IDR for the UK. The previous IDR was published on 30 May 2012 on the basis of which the Commission concluded that the UK was experiencing macroeconomic imbalances, in particular as regards developments related to external competitiveness, household indebtedness and the housing market. Overall, in the AMR-2013 the Commission found it useful, also taking into account the identification of an imbalance in May, to examine further the persistence of imbalances or their unwinding. To this end this IDR takes a broad view of the UK economy in line with the scope of the surveillance under the Macroeconomic Imbalance Procedure (MIP).
Against this background, Section 2 of this in-depth review looks more in detail into developments covering both the external and internal dimensions of the UK economy. This is followed by a specific focus on external competitiveness and the level and dynamics of private sector debt in Section 3. Section 4 discusses policy considerations.


2. MACROECONOMIC SITUATION AND POTENTIAL IMBALANCES
15
2.1. MACROECONOMIC SCENE SETTER
The economic and financial crisis had a severe effect on the UK economy. Real GDP growth was -1.0% in 2008 and -4.0% in 2009, mainly as a result of large declines in household consumption and private investment. Household consumptions fell by 1.6% in 2008 and 3.1% in 2009, and private investment fell by 13.7% in 2009 alone. Unemployment (1) jumped from 5.3% in 2007 to 8.0% in 2011, with youth unemployment (2) reaching a historical high of 21.1% in 2011. Despite weak GDP growth, inflation remained stubbornly high and even increased from 2.2% in 2009 to 4.5% in 2011. This was mainly as a result of imported inflation following a fall in the value of sterling of more than 20% over 2008-2009. The current account deficit remains in deficit, with goods exports lagging but the exports of services remaining more vibrant.
The fiscal position of the UK deteriorated rapidly after the onset of the crisis. The deficit increased from 5.1% to 11.5% of GDP between 2008 and 2009 as a result of falling tax revenue and increasing expenditure, owing to the operation of automatic stabilisers and government injections in the financial sector. Government debt also rose substantially from 52.3% in 2008 to 85.3% in 2011.
The UK has experienced a slow, subdued and stuttering recovery from the financial crisis. In the final quarter of 2012, the level of real UK GDP was 3% below the pre-crisis peak in the first quarter of 2008 (per capita GDP is approximately 6% lower). GDP growth was just 0.2% in 2012 and is forecast to only gradually pick up in 2013 and 2014, 0.9% and 1.9% respectively. (3)
The unemployment rate peaked at 8.3% in the second half of 2011 but fell back to 7.8% in the third quarter of 2012. The recent fall in unemployment is surprising given the weakness of GDP growth. Public sector employment has been (1) Eurostat definition for total unemployment: less than 25
years and 25-74 years. (2) Less than 25 years. (3) Forecasts stem from the Commission services' 2013 Winter
Forecast.
falling every quarter since the third quarter of 2009 where it was 6.37 million, to 5.75 million in September 2012. (4) This labour has been reallocated to the private sector, where employment has continued to increase, with recent strong growth in the business services and consumer sectors. In the third quarter of 2012, the employment rate (5) reached 70.5%, the highest rate since the final quarter of 2008 whilst the inactivity rate (6) has remained relatively stable around 24.3% since 2005.
The strength of the labour market has been surprising given the recent weakness in GDP, even after taking into account the possibility of data revisions. Labour hoarding, weak real wages and an increase in part-time work and self-employment account for part of this phenomenon. The consequence of weak GDP growth combined with a resilient labour market has been a marked drop in labour productivity. It is unlikely that the unemployment rate can continue falling given the weak growth outlook. Unemployment may have reached its trough and it is forecast to increase to 8.0% in 2013 before falling back to 7.8% in 2014.
Inflation has mostly been on a general downward trajectory since September 2011 where it peaked at 5.2%. Inflation was 2.7% in the final three months of 2012 and the first month of 2013, up from 2.2% in September. This increase is largely due to temporary factors such as the increase in tuition fees in England in October and rises in utility prices. However, inflation is still expected to fall given weak demand, but at a slower rate than previously forecast. Inflation is estimated at 2.6% in 2013 and 2.3% in 2014.
The UK economy's adjustment capacity is affected by the degree of flexibility of its product and labour markets. According to international benchmarks, UK product markets are among the (4) It should be noted that Further Education Corporations and
Sixth Form College Corporations in England were classified as public sector until March 2012 and as private sector from June 2012. These educational bodies employed 196,000 people in March 2012 and the reclassification therefore results in a large fall in public sector employment and a corresponding large increase in private sector employment between March and June 2012.
(5) Eurostat definition: 15-64 years. (6) Eurostat definition: 15-64 years.
European Commission Macroeconomic Imbalances - United Kingdom 2013
16
least regulated in the EU and worldwide, and its business environment is generally favourable. With no large collective bargaining arrangements outside the public sector, which has seen widespread pay freezes, and very little automatic wage indexation, real wages have been falling for three years. While this has had a negative impact on household consumption, it has also helped to limit increases in unemployment. The UK's flexible labour and product markets remain a strength but low public and private investment, impaired credit flows, and a resulting low level of churn in the economy could all impair the effective reallocation of resources in response to the shocks that the UK economy has experienced.
2.2. COMPETITIVENESS AND EXPORT PERFORMANCE
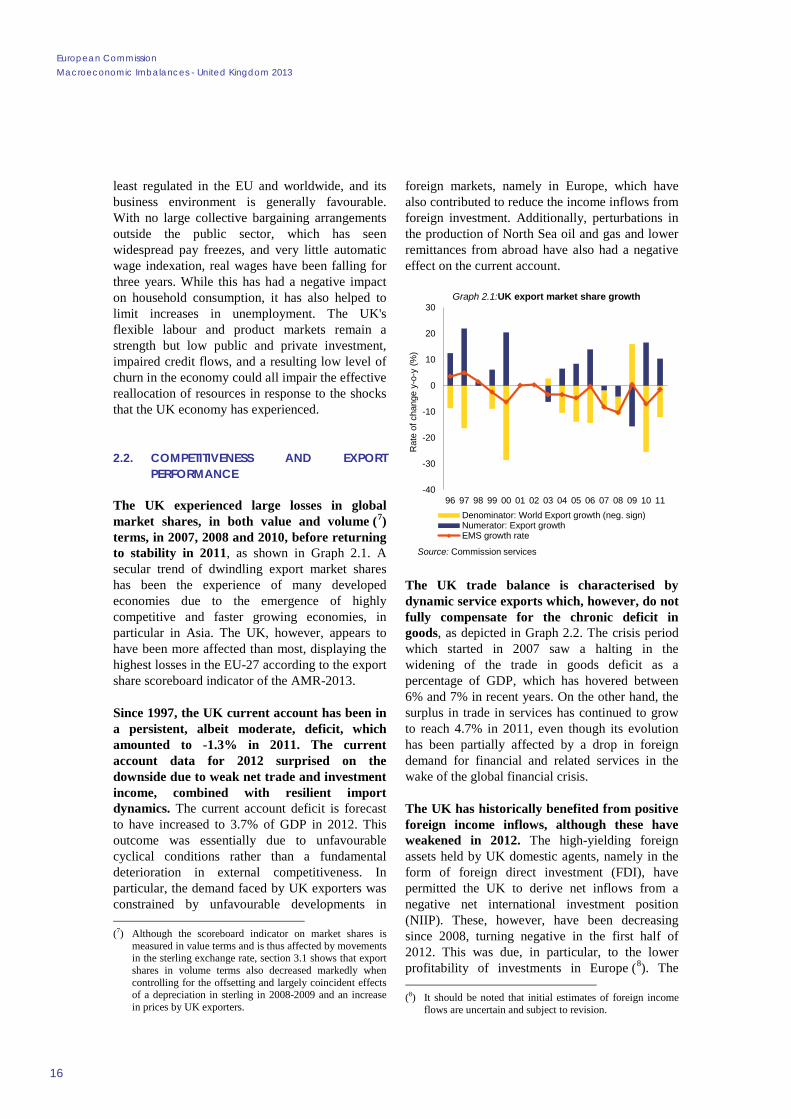
The UK experienced large losses in global market shares, in both value and volume (7) terms, in 2007, 2008 and 2010, before returning to stability in 2011, as shown in Graph 2.1. A secular trend of dwindling export market shares has been the experience of many developed economies due to the emergence of highly competitive and faster growing economies, in particular in Asia. The UK, however, appears to have been more affected than most, displaying the highest losses in the EU-27 according to the export share scoreboard indicator of the AMR-2013.
Since 1997, the UK current account has been in a persistent, albeit moderate, deficit, which amounted to -1.3% in 2011. The current account data for 2012 surprised on the downside due to weak net trade and investment income, combined with resilient import dynamics. The current account deficit is forecast to have increased to 3.7% of GDP in 2012. This outcome was essentially due to unfavourable cyclical conditions rather than a fundamental deterioration in external competitiveness. In particular, the demand faced by UK exporters was constrained by unfavourable developments in (7) Although the scoreboard indicator on market shares is
measured in value terms and is thus affected by movements in the sterling exchange rate, section 3.1 shows that export shares in volume terms also decreased markedly when controlling for the offsetting and largely coincident effects of a depreciation in sterling in 2008-2009 and an increase in prices by UK exporters.
foreign markets, namely in Europe, which have also contributed to reduce the income inflows from foreign investment. Additionally, perturbations in the production of North Sea oil and gas and lower remittances from abroad have also had a negative effect on the current account.
The UK trade balance is characterised by dynamic service exports which, however, do not fully compensate for the chronic deficit in goods, as depicted in Graph 2.2. The crisis period which started in 2007 saw a halting in the widening of the trade in goods deficit as a percentage of GDP, which has hovered between 6% and 7% in recent years. On the other hand, the surplus in trade in services has continued to grow to reach 4.7% in 2011, even though its evolution has been partially affected by a drop in foreign demand for financial and related services in the wake of the global financial crisis.
The UK has historically benefited from positive foreign income inflows, although these have weakened in 2012. The high-yielding foreign assets held by UK domestic agents, namely in the form of foreign direct investment (FDI), have permitted the UK to derive net inflows from a negative net international investment position (NIIP). These, however, have been decreasing since 2008, turning negative in the first half of 2012. This was due, in particular, to the lower profitability of investments in Europe (8). The (8) It should be noted that initial estimates of foreign income
flows are uncertain and subject to revision.
-40
-30
-20
-10
0
10
20
30
96 97 98 99 00 01 02 03 04 05 06 07 08 09 10 11
Rat
e of
cha
nge
y-o-
y (%
)
Graph 2.1:UK export market share growth
Denominator: World Export growth (neg. sign)Numerator: Export growthEMS growth rate
Source: Commission services

2. Macroeconomic Situation and Potential Imbalances
17
independent Office for Budget Responsibility expects investment income to return to positive ground in 2013 and to remain stable over its forecast horizon. (9) Current transfers have historically been negative, reflecting government transfer outflows and the effects of remittances (the UK is a recipient of net immigration inflows).
After a sharp depreciation in 2007-2009, the real effective exchange rate (REER) remained relatively stable in 2011 and appreciated somewhat in 2012. As shown in Graph 2.3, these movements have been mostly driven by swings in the nominal exchange rate. The sharp nominal depreciation in the wake of the crisis contributed to (9) Office for Budget Responsibility (2012).
stabilise the trade in goods deficit, which had been increasing since 1997, when sterling entered a decade-long period of relative strength. The confidence crisis in parts of Europe contributed to the appreciation of sterling in 2012 which, coupled with an inflation rate that has remained persistently above target, has led to a higher REER in 2012. However, sterling started weakening towards the end of 2012 and beginning of 2013.
Unit labour costs (ULCs) have increased moderately in recent years due to high inflation and weak labour productivity, which is the result of a surprisingly strong labour market in a context of weak or negative growth. Even though real ULCs decreased in 2011 as nominal wages continued to grow below inflation, nominal ULC growth in the UK has outpaced that of the euro area, thereby contributing to erode the competitiveness of the UK vis-à-vis its main trading partners (Graph 2.4). However, even taking into account the recent appreciation of sterling, the strong 2007-2008 nominal depreciation has so far been sufficient in offsetting the cumulated increases in ULCs from a strict price competitiveness point of view.
UK current account deficits have generally been funded by portfolio investment into UK securities, such as shares and bonds, and by other investments such as loans (see Graph 2.5). By contrast, the UK built up a positive international position in FDI by being a foreign direct investor in most years. This funding profile
-10
-8
-6
-4
-2
0
2
4
6
8
95 96 97 98 99 00 01 02 03 04 05 06 07 08 09 10 1112*
% o
f GD
P
Graph 2.2:Decomposition of the UK current account
Capital account (KA)Current transfersIncome balance Trade balance - services Trade balance - goodsTrade balanceCurrent account balance (CA)Net lending/borrowing (CA+KA)
Source: Commission services
-15
-10
-5
0
5
10
98 99 00 01 02 03 04 05 06 07 08 09 10 11 12 13 14
Rat
e of
cha
nge
y-o-
y (%
)
Graph 2.3:Decomposition of developments in the UK REER
NEER relative HICP (-)REER (HICP) REER (ULC)
Source: Commission services
-4
-2
0
2
4
6
8
98 99 00 01 02 03 04 05 06 07 08 09 10 11 12 13 14
Rat
e of
cha
nge
y-o-
y (%
)
Graph 2.4:Decomposition of developments in the UK unit labour costs
Inflation (GDP deflator growth)Real Compensation per EmployeeProductivity Contribution (negative sign)Nominal unit labour costULC in Euro Area
Source: Commission services
European Commission Macroeconomic Imbalances - United Kingdom 2013
18
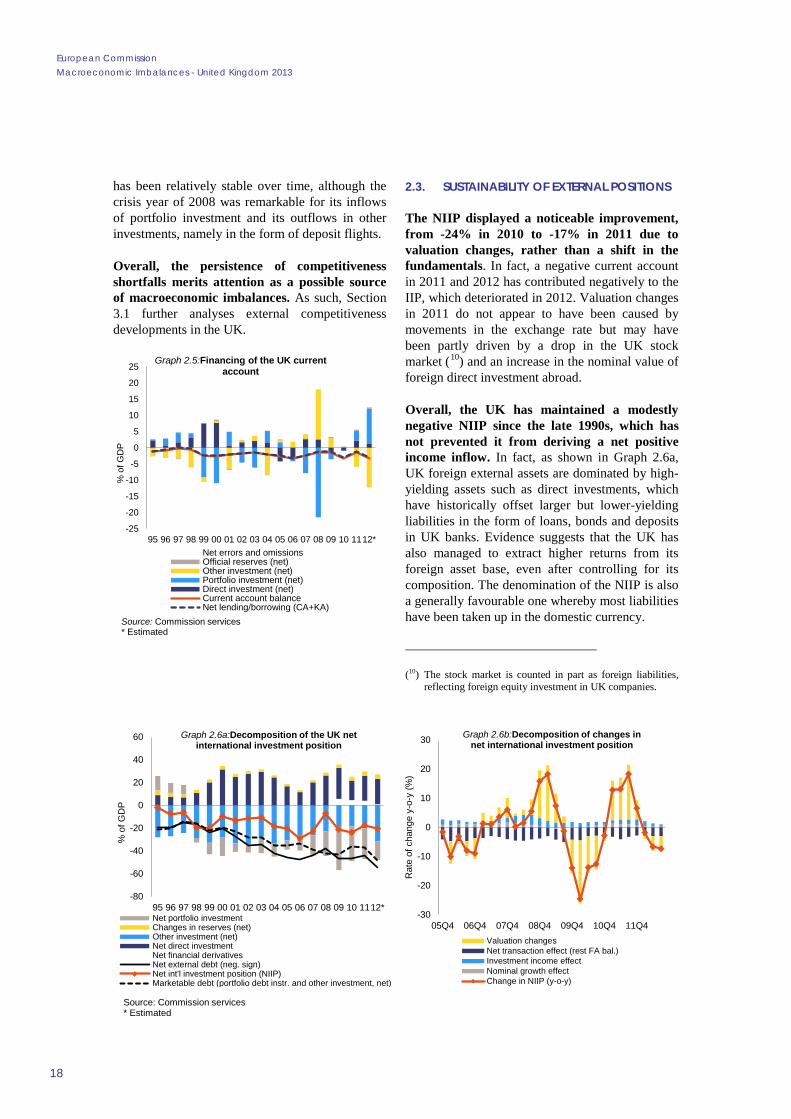
has been relatively stable over time, although the crisis year of 2008 was remarkable for its inflows of portfolio investment and its outflows in other investments, namely in the form of deposit flights.
Overall, the persistence of competitiveness shortfalls merits attention as a possible source of macroeconomic imbalances. As such, Section 3.1 further analyses external competitiveness developments in the UK.
2.3. SUSTAINABILITY OF EXTERNAL POSITIONS
The NIIP displayed a noticeable improvement, from -24% in 2010 to -17% in 2011 due to valuation changes, rather than a shift in the fundamentals. In fact, a negative current account in 2011 and 2012 has contributed negatively to the IIP, which deteriorated in 2012. Valuation changes in 2011 do not appear to have been caused by movements in the exchange rate but may have been partly driven by a drop in the UK stock market (10) and an increase in the nominal value of foreign direct investment abroad.
Overall, the UK has maintained a modestly negative NIIP since the late 1990s, which has not prevented it from deriving a net positive income inflow. In fact, as shown in Graph 2.6a, UK foreign external assets are dominated by high-yielding assets such as direct investments, which have historically offset larger but lower-yielding liabilities in the form of loans, bonds and deposits in UK banks. Evidence suggests that the UK has also managed to extract higher returns from its foreign asset base, even after controlling for its composition. The denomination of the NIIP is also a generally favourable one whereby most liabilities have been taken up in the domestic currency.
(10) The stock market is counted in part as foreign liabilities,
reflecting foreign equity investment in UK companies.
-25
-20
-15
-10
-5
0
5
10
15
20
25
95 96 97 98 99 00 01 02 03 04 05 06 07 08 09 10 1112*
% o
f GD
P
Graph 2.5:Financing of the UK current account
Net errors and omissionsOfficial reserves (net)Other investment (net)Portfolio investment (net)Direct investment (net)Current account balanceNet lending/borrowing (CA+KA)
Source: Commission services* Estimated
-80
-60
-40
-20
0
20
40
60
95 96 97 98 99 00 01 02 03 04 05 06 07 08 09 10 1112*
% o
f GD
P
Net portfolio investmentChanges in reserves (net)Other investment (net)Net direct investmentNet financial derivativesNet external debt (neg. sign)Net int'l investment position (NIIP)Marketable debt (portfolio debt instr. and other investment, net)
Graph 2.6a:Decomposition of the UK net international investment position
-30
-20
-10
0
10
20
30
05Q4 06Q4 07Q4 08Q4 09Q4 10Q4 11Q4
Rat
e of
cha
nge
y-o-
y (%
)
Valuation changesNet transaction effect (rest FA bal.)Investment income effectNominal growth effectChange in NIIP (y-o-y)
Graph 2.6b:Decomposition of changes in net international investment position
Source: Commission services* Estimated

2. Macroeconomic Situation and Potential Imbalances
19
Although the evolution of the UK NIIP is rather volatile due to erratic valuation changes (Graph 2.6b), it remains well within the scoreboard indicator threshold of -35% and appears to be sustainable in the medium term. According to Commission and consensus estimates, the UK current account is expected to move closer to the NIIP-stabilising value, which, excluding valuation effects, should preclude a rapid and sustained deterioration of the NIIP in the medium term.
2.4. GOVERNMENT INDEBTEDNESS
The general government deficit fell to 7.8% of GDP in 2011, after spiking at 11.5% in 2009. The Commission services' Winter forecast estimates a deficit of 6.3% in 2012, which includes a one-off Royal Mail pension fund transfer of GBP 28 billion (approx. 1.8% of GDP), 7.4% in 2013, which includes the sale of 4G mobile phone licences and 6.0% in 2014.
The debt ratio was 85.2% in 2011 and is forecast at 89.8% in 2012. It is expected to continue increasing in 2013 and 2014 and reach 95.4% and 97.9%, respectively (Graph 2.7 ). This is far above the 60% threshold specified in the scoreboard indicators and the Maastricht threshold. In the Autumn Statement (11), the UK government has continued its fiscal consolidation plans without any major changes to the general thrust of the strategy. Some adjustments were made by substituting current for capital spending but within the same expenditure envelope and the period of consolidation was extended by one further year to the financial year (FY) 2017-18. Due to the impact of weak GDP growth on public finances, the deficit is unlikely to fall exceptionally quickly despite a considerable decrease in government expenditure as part of the government's multi-year consolidation programme. However, due to some one-off transfers into the general government accounts, the deficit figure looks better than the underlying position. (12)
(11) HM Treasury (2012). (12) Apart from taking over the Royal Mail pension fund in
April 2012, which reduced the deficit by 1.8 pp. that year and the sale of 4G mobile phone licences in March 2013, which reduced the deficit by 0.1pp. approx., both one-off effects, the government also decided to transfer the excess cash held at the Bank of England's Asset Purchase Facility
The UK has been under the Excessive Deficit Procedure (EDP) since July 2008. In 2009, acknowledging the worsening macroeconomic situation and the need to support growth in the short term, the Council adopted a decision and recommendation that led to the extension of the EDP deadline to 2014-15. The UK fiscal position will be discussed in detail in the assessment of the UK Convergence Programme to be carried out in a forthcoming Commission Staff Working Document.
It is not clear how much of the recent drop in UK sovereign yields has been driven by increasing confidence in the UK's fiscal position. Yields are likely to have been depressed by quantitative easing, international financial flows in the midst of a confidence crisis affecting the euro area, and (perversely) by weakening growth prospects which have reduced expectations of future interest rate rises. This has led to very favourable interest rates on public debt. While it is difficult to predict the timing, speed or direction of any change to this situation, a return to interest rates more consistent with historical trends may have a significant impact on the capacity of both the public and the private sectors to honour interest payments without further squeezing investment and consumption.
to the general government accounts. The treatment of this transfer, including the expected future flow of the coupon payments on the gilts had not been confirmed by Eurostat at the time of the forecast and therefore does not feature
0
20
40
60
80
100
120
95 96 97 98 99 00 01 02 03 04 05 06 07 08 09 10 1112*13*14*%
of G
DP
Graph 2.7:UK government debt
Source: Commission services* Forecast
European Commission Macroeconomic Imbalances - United Kingdom 2013
20
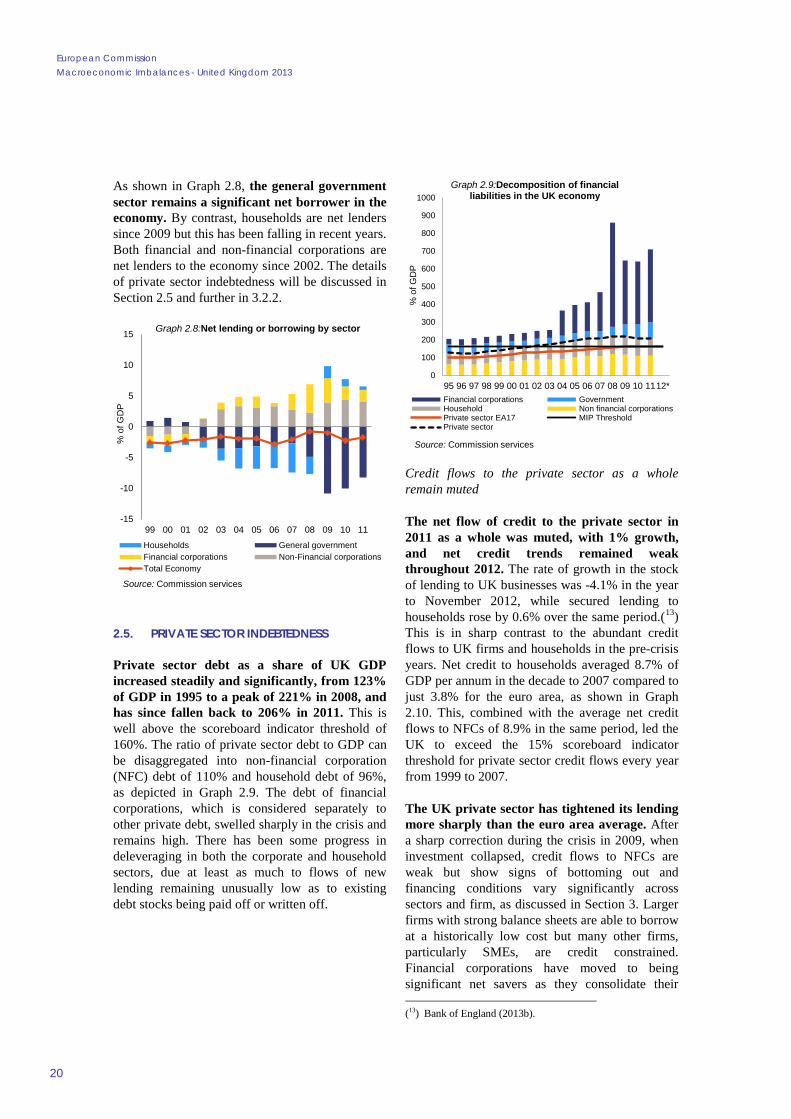
As shown in Graph 2.8, the general government sector remains a significant net borrower in the economy. By contrast, households are net lenders since 2009 but this has been falling in recent years. Both financial and non-financial corporations are net lenders to the economy since 2002. The details of private sector indebtedness will be discussed in Section 2.5 and further in 3.2.2.
2.5. PRIVATE SECTOR INDEBTEDNESS
Private sector debt as a share of UK GDP increased steadily and significantly, from 123% of GDP in 1995 to a peak of 221% in 2008, and has since fallen back to 206% in 2011. This is well above the scoreboard indicator threshold of 160%. The ratio of private sector debt to GDP can be disaggregated into non-financial corporation (NFC) debt of 110% and household debt of 96%, as depicted in Graph 2.9. The debt of financial corporations, which is considered separately to other private debt, swelled sharply in the crisis and remains high. There has been some progress in deleveraging in both the corporate and household sectors, due at least as much to flows of new lending remaining unusually low as to existing debt stocks being paid off or written off.
Credit flows to the private sector as a whole remain muted
The net flow of credit to the private sector in 2011 as a whole was muted, with 1% growth, and net credit trends remained weak throughout 2012. The rate of growth in the stock of lending to UK businesses was -4.1% in the year to November 2012, while secured lending to households rose by 0.6% over the same period.(13) This is in sharp contrast to the abundant credit flows to UK firms and households in the pre-crisis years. Net credit to households averaged 8.7% of GDP per annum in the decade to 2007 compared to just 3.8% for the euro area, as shown in Graph 2.10. This, combined with the average net credit flows to NFCs of 8.9% in the same period, led the UK to exceed the 15% scoreboard indicator threshold for private sector credit flows every year from 1999 to 2007.
The UK private sector has tightened its lending more sharply than the euro area average. After a sharp correction during the crisis in 2009, when investment collapsed, credit flows to NFCs are weak but show signs of bottoming out and financing conditions vary significantly across sectors and firm, as discussed in Section 3. Larger firms with strong balance sheets are able to borrow at a historically low cost but many other firms, particularly SMEs, are credit constrained. Financial corporations have moved to being significant net savers as they consolidate their (13) Bank of England (2013b).
-15
-10
-5
0
5
10
15
99 00 01 02 03 04 05 06 07 08 09 10 11
% o
f GD
P
Graph 2.8:Net lending or borrowing by sector
Households General governmentFinancial corporations Non-Financial corporationsTotal Economy
Source: Commission services
0
100
200
300
400
500
600
700
800
900
1000
95 96 97 98 99 00 01 02 03 04 05 06 07 08 09 10 1112*
% o
f GD
P
Graph 2.9:Decomposition of financial liabilities in the UK economy
Financial corporations GovernmentHousehold Non financial corporationsPrivate sector EA17 MIP ThresholdPrivate sector
Source: Commission services

2. Macroeconomic Situation and Potential Imbalances
21
balance sheets. A low level of housing transactions and tighter mortgage lending criteria has reduced credit flows to households.
Recent gradual deleveraging of NFCs has been driven by low investment
While the debt of NFCs has fallen slightly since 2008, business investment has remained at a very low level and the stock of lending to UK businesses has been falling consistently since 2009. (14) An unprecedented drop in business investment after 2007 saw the UK level of gross fixed capital formation as a share of GDP fall to 14.2 % in 2011, the third lowest level in the EU-27. Business investment has started to pick up slightly, with an annual increase of 5.1% to the third quarter of 2012, but remains low. Public investment has been cut sharply as part of the government's fiscal consolidation programme. The low investment rate is due not only to the low share of capital-intensive manufacturing in GDP but also to the combined effects of an uncertain and unfavourable economic environment and difficulties in accessing finance, especially on the part of small and medium companies.
Structural features partly explain the higher leverage levels of UK companies compared to the euro area average. The UK has a relatively large share of output generated by large companies and by multinationals, both of which are associated (14) Bank of England (2013b).
with higher levels of leverage, and investment. Multinational companies, in particular, are able to service debt taken up in the UK with revenue streams from overseas. The corporate sector in the UK is also likely to be more integrated, for example making use of inter-company loans, which also tends to raise the headline unconsolidated debt figures.
Household debt falling from historic highs, mainly due to a low volume of new lending
The run-up to the crisis saw the housing market overheat, with house price-to-income ratios reaching historic highs in the context of a growing housing supply shortage, leading to the accumulation of high levels of mortgage debt. The level of household debt rose from 69% of GDP in 2000 to a peak of 104% in 2009 and the 2012 in-depth review of the UK concluded that high household debt, around 85% of which is mortgage debt, constitutes an internal imbalance in the UK economy. Graph 2.11 shows that net deleveraging of households started in 2009 measured against gross disposable income, or 2010 measured against GDP (GDP fell more sharply than disposable income in the recession). In 2011, household debt fell from 99.6% of GDP to 96%, against a euro area average of 64%. As discussed in Section 3, to date household deleveraging has been driven mainly by an abnormally low level of housing transactions although the household saving rate has also picked up to 7.7% in the third quarter of 2012.
-15
-10
-5
0
5
10
15
20
25
30
35
95 96 97 98 99 00 01 02 03 04 05 06 07 08 09 10 1112*
% o
f GD
P
Graph 2.10:Decomposition of net credit flows in the economy
Financial corporations GovernmentHousehold Non financial corporationsPrivate sector EA17 MIP ThresholdPrivate sector
Source: Commission servicesNote: Non-consolidated data. Figures for each sector are the sum of the flow of loans and securities other than shares.
0
20
40
60
80
100
120
140
160
180
0
20
40
60
80
100
120
95 97 99 01 03 05 07 09 11
% G
DI
% o
f GD
P a
nd a
sset
s
Graph 2.11:Household leverage indicators
Debt / GDP, HouseholdsDebt / fin. assets, HouseholdsDebt / gross disposable income, Households (right axis)
Source: Commission services
European Commission Macroeconomic Imbalances - United Kingdom 2013
22
Households have significant net assets but this masks growing inequality in net worth
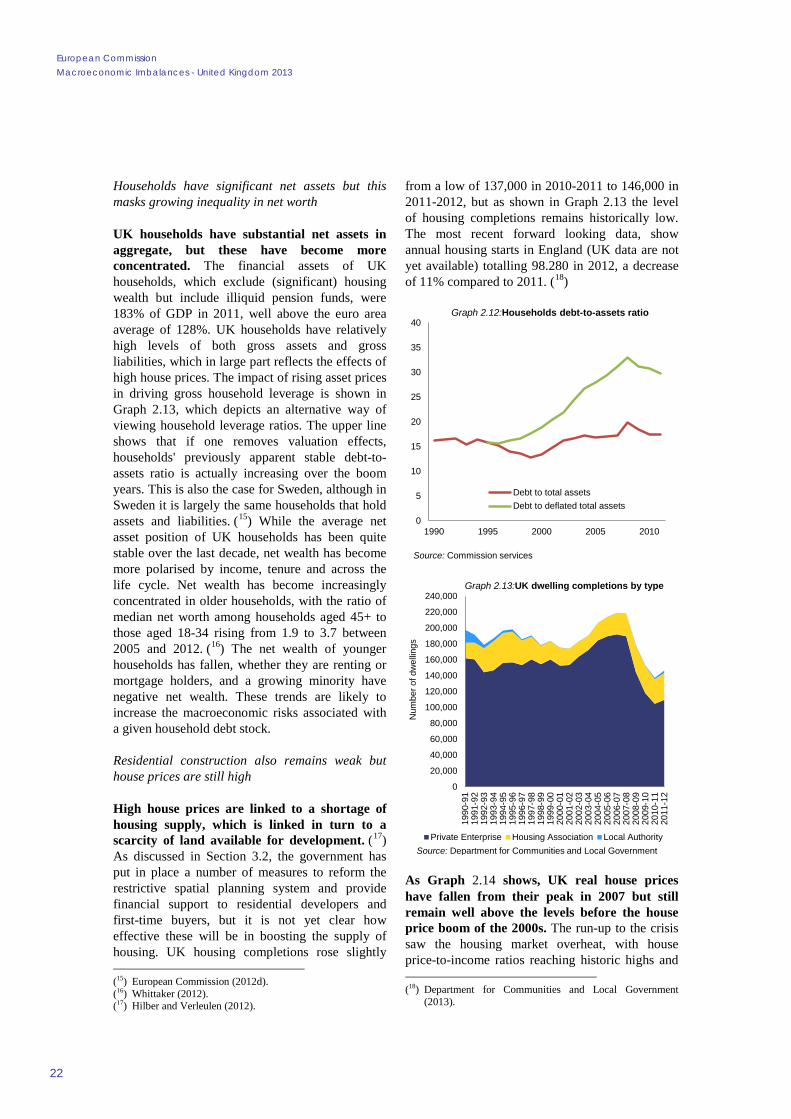
UK households have substantial net assets in aggregate, but these have become more concentrated. The financial assets of UK households, which exclude (significant) housing wealth but include illiquid pension funds, were 183% of GDP in 2011, well above the euro area average of 128%. UK households have relatively high levels of both gross assets and gross liabilities, which in large part reflects the effects of high house prices. The impact of rising asset prices in driving gross household leverage is shown in Graph 2.13, which depicts an alternative way of viewing household leverage ratios. The upper line shows that if one removes valuation effects, households' previously apparent stable debt-to-assets ratio is actually increasing over the boom years. This is also the case for Sweden, although in Sweden it is largely the same households that hold assets and liabilities. (15) While the average net asset position of UK households has been quite stable over the last decade, net wealth has become more polarised by income, tenure and across the life cycle. Net wealth has become increasingly concentrated in older households, with the ratio of median net worth among households aged 45+ to those aged 18-34 rising from 1.9 to 3.7 between 2005 and 2012. (16) The net wealth of younger households has fallen, whether they are renting or mortgage holders, and a growing minority have negative net wealth. These trends are likely to increase the macroeconomic risks associated with a given household debt stock.
Residential construction also remains weak but house prices are still high
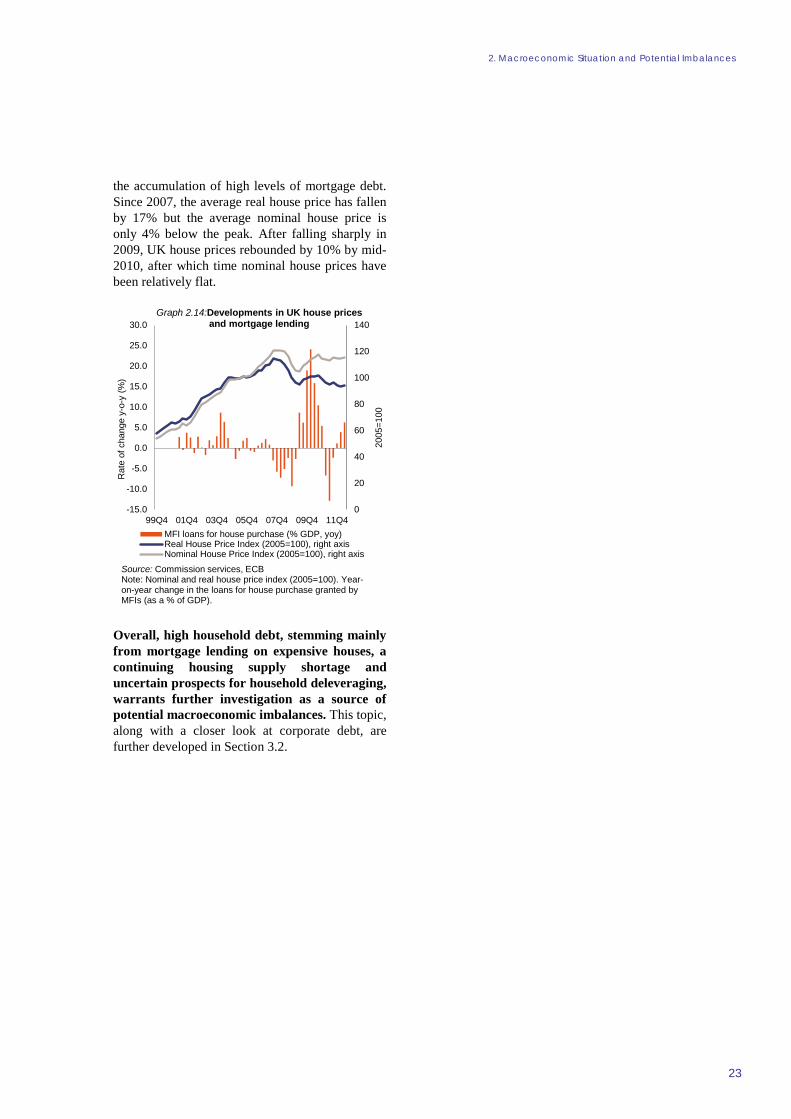
High house prices are linked to a shortage of housing supply, which is linked in turn to a scarcity of land available for development. (17) As discussed in Section 3.2, the government has put in place a number of measures to reform the restrictive spatial planning system and provide financial support to residential developers and first-time buyers, but it is not yet clear how effective these will be in boosting the supply of housing. UK housing completions rose slightly (15) European Commission (2012d). (16) Whittaker (2012). (17) Hilber and Verleulen (2012).
from a low of 137,000 in 2010-2011 to 146,000 in 2011-2012, but as shown in Graph 2.13 the level of housing completions remains historically low. The most recent forward looking data, show annual housing starts in England (UK data are not yet available) totalling 98.280 in 2012, a decrease of 11% compared to 2011. (18)
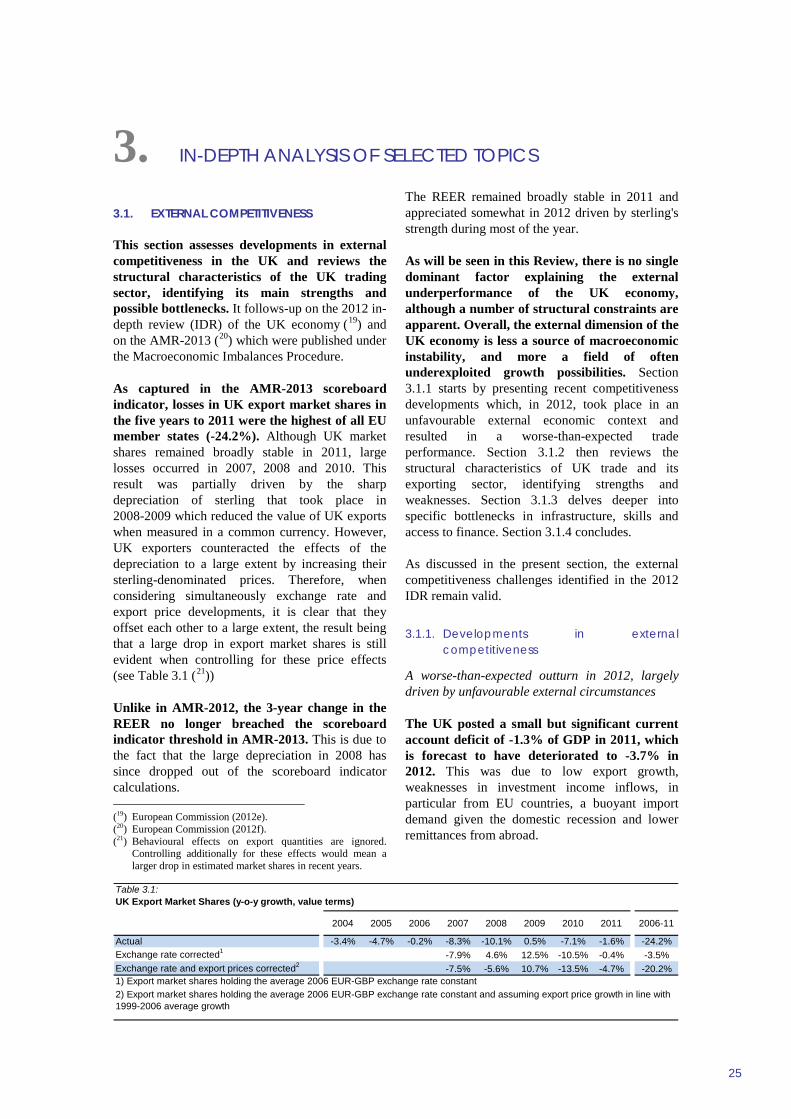
As Graph 2.14 shows, UK real house prices have fallen from their peak in 2007 but still remain well above the levels before the house price boom of the 2000s. The run-up to the crisis saw the housing market overheat, with house price-to-income ratios reaching historic highs and (18) Department for Communities and Local Government
(2013).
0
5
10
15
20
25
30
35
40
1990 1995 2000 2005 2010
Graph 2.12:Households debt-to-assets ratio
Debt to total assetsDebt to deflated total assets
Source: Commission services
0
20,000
40,000
60,000
80,000
100,000
120,000
140,000
160,000
180,000
200,000
220,000
240,000
1990
-91
1991
-92
1992
-93
1993
-94
1994
-95
1995
-96
1996
-97
1997
-98
1998
-99
1999
-00
2000
-01
2001
-02
2002
-03
2003
-04
2004
-05
2005
-06
2006
-07
2007
-08
2008
-09
2009
-10
2010
-11
2011
-12
Num
ber o
f dw
ellin
gs
Graph 2.13:UK dwelling completions by type
Private Enterprise Housing Association Local AuthoritySource: Department for Communities and Local Government
2. Macroeconomic Situation and Potential Imbalances
23
the accumulation of high levels of mortgage debt. Since 2007, the average real house price has fallen by 17% but the average nominal house price is only 4% below the peak. After falling sharply in 2009, UK house prices rebounded by 10% by mid-2010, after which time nominal house prices have been relatively flat.
Overall, high household debt, stemming mainly from mortgage lending on expensive houses, a continuing housing supply shortage and uncertain prospects for household deleveraging, warrants further investigation as a source of potential macroeconomic imbalances. This topic, along with a closer look at corporate debt, are further developed in Section 3.2.
0
20
40
60
80
100
120
140
-15.0
-10.0
-5.0
0.0
5.0
10.0
15.0
20.0
25.0
30.0
99Q4 01Q4 03Q4 05Q4 07Q4 09Q4 11Q4
2005
=100
Rat
e of
cha
nge
y-o-
y (%
)
Graph 2.14:Developments in UK house prices and mortgage lending
MFI loans for house purchase (% GDP, yoy)Real House Price Index (2005=100), right axisNominal House Price Index (2005=100), right axis
Source: Commission services, ECBNote: Nominal and real house price index (2005=100). Year-on-year change in the loans for house purchase granted by MFIs (as a % of GDP).

3. IN-DEPTH ANALYSIS OF SELECTED TOPICS
25
3.1. EXTERNAL COMPETITIVENESS
This section assesses developments in external competitiveness in the UK and reviews the structural characteristics of the UK trading sector, identifying its main strengths and possible bottlenecks. It follows-up on the 2012 in-depth review (IDR) of the UK economy (19) and on the AMR-2013 (20) which were published under the Macroeconomic Imbalances Procedure.
As captured in the AMR-2013 scoreboard indicator, losses in UK export market shares in the five years to 2011 were the highest of all EU member states (-24.2%). Although UK market shares remained broadly stable in 2011, large losses occurred in 2007, 2008 and 2010. This result was partially driven by the sharp depreciation of sterling that took place in 2008-2009 which reduced the value of UK exports when measured in a common currency. However, UK exporters counteracted the effects of the depreciation to a large extent by increasing their sterling-denominated prices. Therefore, when considering simultaneously exchange rate and export price developments, it is clear that they offset each other to a large extent, the result being that a large drop in export market shares is still evident when controlling for these price effects (see Table 3.1 (21))
Unlike in AMR-2012, the 3-year change in the REER no longer breached the scoreboard indicator threshold in AMR-2013. This is due to the fact that the large depreciation in 2008 has since dropped out of the scoreboard indicator calculations. (19) European Commission (2012e). (20) European Commission (2012f). (21) Behavioural effects on export quantities are ignored.
Controlling additionally for these effects would mean a larger drop in estimated market shares in recent years.
The REER remained broadly stable in 2011 and appreciated somewhat in 2012 driven by sterling's strength during most of the year.
As will be seen in this Review, there is no single dominant factor explaining the external underperformance of the UK economy, although a number of structural constraints are apparent. Overall, the external dimension of the UK economy is less a source of macroeconomic instability, and more a field of often underexploited growth possibilities. Section 3.1.1 starts by presenting recent competitiveness developments which, in 2012, took place in an unfavourable external economic context and resulted in a worse-than-expected trade performance. Section 3.1.2 then reviews the structural characteristics of UK trade and its exporting sector, identifying strengths and weaknesses. Section 3.1.3 delves deeper into specific bottlenecks in infrastructure, skills and access to finance. Section 3.1.4 concludes.
As discussed in the present section, the external competitiveness challenges identified in the 2012 IDR remain valid.
3.1.1. Developments in external competitiveness
A worse-than-expected outturn in 2012, largely driven by unfavourable external circumstances
The UK posted a small but significant current account deficit of -1.3% of GDP in 2011, which is forecast to have deteriorated to -3.7% in 2012. This was due to low export growth, weaknesses in investment income inflows, in particular from EU countries, a buoyant import demand given the domestic recession and lower remittances from abroad.
Table 3.1:UK Export Market Shares (y-o-y growth, value terms)
2004 2005 2006 2007 2008 2009 2010 2011 2006-11
Actual -3.4% -4.7% -0.2% -8.3% -10.1% 0.5% -7.1% -1.6% -24.2%Exchange rate corrected1 -7.9% 4.6% 12.5% -10.5% -0.4% -3.5%Exchange rate and export prices corrected2 -7.5% -5.6% 10.7% -13.5% -4.7% -20.2%1) Export market shares holding the average 2006 EUR-GBP exchange rate constant2) Export market shares holding the average 2006 EUR-GBP exchange rate constant and assuming export price growth in line with 1999-2006 average growth
European Commission Macroeconomic Imbalances - United Kingdom 2013
26
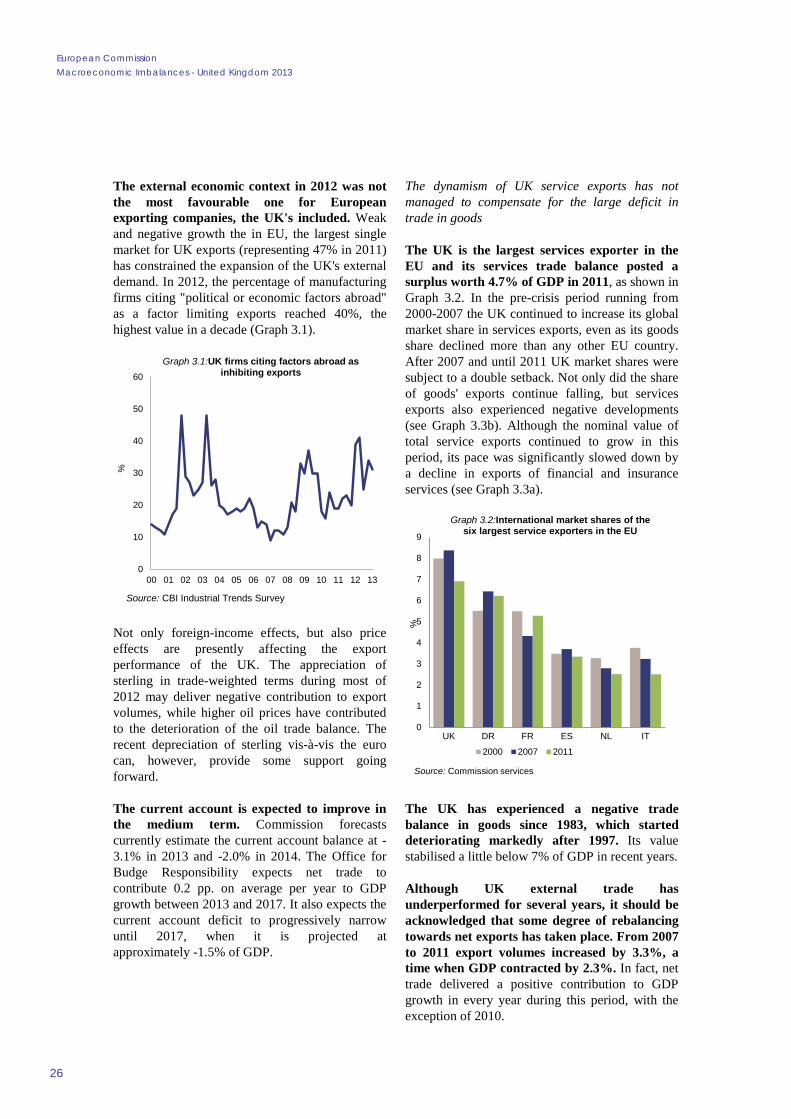
The external economic context in 2012 was not the most favourable one for European exporting companies, the UK's included. Weak and negative growth the in EU, the largest single market for UK exports (representing 47% in 2011) has constrained the expansion of the UK's external demand. In 2012, the percentage of manufacturing firms citing "political or economic factors abroad" as a factor limiting exports reached 40%, the highest value in a decade (Graph 3.1).
Not only foreign-income effects, but also price effects are presently affecting the export performance of the UK. The appreciation of sterling in trade-weighted terms during most of 2012 may deliver negative contribution to export volumes, while higher oil prices have contributed to the deterioration of the oil trade balance. The recent depreciation of sterling vis-à-vis the euro can, however, provide some support going forward.
The current account is expected to improve in the medium term. Commission forecasts currently estimate the current account balance at -3.1% in 2013 and -2.0% in 2014. The Office for Budge Responsibility expects net trade to contribute 0.2 pp. on average per year to GDP growth between 2013 and 2017. It also expects the current account deficit to progressively narrow until 2017, when it is projected at approximately -1.5% of GDP.
The dynamism of UK service exports has not managed to compensate for the large deficit in trade in goods
The UK is the largest services exporter in the EU and its services trade balance posted a surplus worth 4.7% of GDP in 2011, as shown in Graph 3.2. In the pre-crisis period running from 2000-2007 the UK continued to increase its global market share in services exports, even as its goods share declined more than any other EU country. After 2007 and until 2011 UK market shares were subject to a double setback. Not only did the share of goods' exports continue falling, but services exports also experienced negative developments (see Graph 3.3b). Although the nominal value of total service exports continued to grow in this period, its pace was significantly slowed down by a decline in exports of financial and insurance services (see Graph 3.3a).
The UK has experienced a negative trade balance in goods since 1983, which started deteriorating markedly after 1997. Its value stabilised a little below 7% of GDP in recent years.
Although UK external trade has underperformed for several years, it should be acknowledged that some degree of rebalancing towards net exports has taken place. From 2007 to 2011 export volumes increased by 3.3%, a time when GDP contracted by 2.3%. In fact, net trade delivered a positive contribution to GDP growth in every year during this period, with the exception of 2010.
0
10
20
30
40
50
60
00 01 02 03 04 05 06 07 08 09 10 11 12 13
%
Graph 3.1:UK firms citing factors abroad as inhibiting exports
Source: CBI Industrial Trends Survey
0
1
2
3
4
5
6
7
8
9
UK DR FR ES NL IT
%
Graph 3.2:International market shares of the six largest service exporters in the EU
2000 2007 2011
Source: Commission services

3. In-Depth Analysis of Selected Topics
27
The post-crisis depreciation of sterling provided only a modest boost
Sterling depreciated sharply in 2008-2009, after a decade of strength which saw the UK trade balance deteriorate markedly (see Graph 3.4). Notwithstanding this exchange rate correction, Commission services' analysis of the equilibrium exchange rate suggests that sterling may have remained slightly overvalued during most of 2012. The drop in sterling vis-à-vis the euro towards the end of 2012 and beginning of 2013 may thus mean a movement towards equilibrium values. The recent depreciation of sterling can also be understood as the consequence of the resolution of uncertainties regarding the euro area crisis, concerns over UK public finances, expectations of further quantitative easing and rising uncertainties
regarding the UK’s future relationship with the EU.
The depreciation of sterling was not, however, sufficient to put the trade balance on a sustained upward trend. This could be due to a number of factors. Firstly, exporters compensated for the depreciation by raising their sterling-denominated prices. The fact that exporters opted to increase their margins rather than expand market shares and invest in capacity may be due to uncertainties regarding the likelihood of sterling remaining at its new low level and a cautious approach in the face of a volatile external environment. However, as sterling remains at a relatively low level, exporters strengthen their balance sheets and uncertainty resolves, expansion should become an increasingly attractive option. Secondly, the depreciation contributed to raise input prices for some exporters. Thirdly, the depreciation took place at the same time as the external demand for UK goods collapsed due to the global financial and economic crisis, which would mask the positive effects accruing from the new exchange rate. (22)These factors have been highlighted in a recent survey of manufacturers where the global economic downturn, rising input costs and significant movements in the exchange (22) The average estimate for the price elasticity of UK exports
has been estimated at -0.4, the same as the price elasticity of imports. By contrast, the income elasticities of exports and imports tend to be higher and are often found to be unitary. See Bank of England (2011).
-12
-10
-8
-6
-4
-2
0
2
4
6
96 97 98 99 00 01 02 03 04 05 06 07 08 09 10 11
Rat
e of
cha
nge
y-o-
y (%
)
Graph 3.3b:UK export market share growth decomposition
Contribution to EMS: goodsContribution to EMS: servicesExport market share growth yoy
Source: Commission services
0
20,000
40,000
60,000
80,000
100,000
120,000
140,000
160,000
180,000
200,000
91 92 93 94 95 96 97 98 99 00 01 02 03 04 05 06 07 08 09 10 11 12*
GB
P m
Graph 3.3a:Developments in UK aggregate and financial services exports
Other servicesFinancial and insurance servicesTotal services exports
-4.0%-3.5%-3.0%-2.5%-2.0%-1.5%-1.0%-0.5%0.0%0.5%1.0%
60
70
80
90
100
110
120
130
1994
Q1
1995
Q2
1996
Q3
1997
Q4
1999
Q1
2000
Q2
2001
Q3
2002
Q4
2004
Q1
2005
Q2
2006
Q3
2007
Q4
2009
Q1
2010
Q2
2011
Q3
% o
f GD
P
2005
=100
Graph 3.4:UK exchange rate and trade balance performance
REER (ULC-based, lhs)NEER (lhs)Exports/GDP (2005=100, 4-month average, lhs)Trade Balance (4-month average, rhs)
Source: Commission services

European Commission Macroeconomic Imbalances - United Kingdom 2013
28
rate were cited as the three foremost risks to growth. (23)
Finally, as discussed in subsection 3.1.3, a number of bottlenecks are constraining the external performance of the UK.
Competitiveness losses and unfavourable geographical specialisation drove the post-crisis fall in market shares
In the pre-crisis period of 2000-2007, UK export markets grew in line with the world average. In this period, the geographical markets in which the UK was specialised, especially European markets, were growing in line with global trends. Likewise, the product markets in which the UK was specialised were growing, on aggregate, in line with overall product markets. In this period decreases in market shares were thus due to competitiveness losses, namely with respect to fast-growing emerging economies.
In the post-crisis period of 2007-2010 UK exports were affected by their focus on slow-growing markets, competitiveness losses in geographical destinations and by competitiveness losses in product markets (Graph 3.5). In fact, the traditional geographical markets to which the UK exported, namely advanced economies in Europe, slowed down. Furthermore, the UK appears to have suffered from strong competition in the products and (23) EEF (2013).
destinations in which it specialises. However, as shown in Graph 3.6, the UK is likely to have faced only moderate competition from China, as the overlapping index (24) between both countries is in the mid-range when compared with other EU economies. Considering a breakdown of the overlapping products, the categories where direct competition from China appears to be more relevant are in minerals, chemicals and, particularly, machines (see Graph 3.7).
(24) The overlap was calculated using the Finger-Kreinin index.
It is based on the number of HS 6-digit products that are exported to the rest of the world, and that both China and the UK export.
-12.0
-10.0
-8.0
-6.0
-4.0
-2.0
0.0
2.0
Pre-crisis Post-crisis
United Kingdom
Rat
e of
cha
nge
y-o-
y (%
)
Graph 3.5:Contribution to UK market share growth from geographical and sectoral
composition
Market share gains in product marketsMarket share gains in geographical destinationsInitial product specialisationIntial geographical specialisation
Source: Commission services
0
5
10
15
20
25
30
35
40
IT DE NL
HU ES FR SE AT DK
UK BE PT SI BG FI GR IE CY
MT
Graph 3.6:Overlapping indices with China
Source: Commission services, Comtrade
animals
vegetables
fats
food
wood
mineral
chemical
plasticleather
paper
textilefootwear
stonepearls
arms
metals machines
vehicles
optical
othermanuf
art
0
10
20
30
40
50
60
70
80
0 10 20 30
Ove
rlapp
ing
(%)
Export shares (%)
Graph 3.7:UK export products - similarity with China vs. share in total UK exports
Source: Commission services

3. In-Depth Analysis of Selected Topics
29
Rebalancing towards new geographical markets is unfolding
In 2011, the EU still represented approximately half of the UK export market, but exports to new emerging markets have been rising fast since 2009. As shown in Graph 3.8, export values to the BRIC countries have more than doubled, albeit from a low base, since a trough in 2009. By year-end 2012, BRIC countries represented approximately 8% of total goods exports.
The dynamism of exports to BRIC countries contrasts with the slow growth of exports to the rest of the world over the same period. In particular, export volumes to EU countries in 2012 were only slightly above those witnessed in 2009. This was due not only to weaknesses in the euro area, but also to the slow appreciation of sterling vis-à-vis the euro since mid-2011 and through the first half of 2012.
Fast-growing countries present an important opportunity for selected British goods. Exports to Asian countries have shown a remarkable dynamism since the 2007 crisis. For instance, exports to China and Korea more than trebled during this period, although this was from a low starting point. Fast-growing Asian markets have shown an appetite for UK cars (25), fashion products and other luxury goods, as well as, to (25) More than half of cars exported by the UK go to non-EU
markets, whereas the equivalent figures for France, Italy and Spain range between 10% and 30%.
some extent, capital goods and professional services, which could be further exploited.
3.1.2. Characteristics of the UK trading sector
Trade in goods and services is relatively diverse, but with important specialisation areas
The UK trades a diverse mix of goods and services (Table 3.2). As to the former, industries with a strong export propensity in the UK include machinery and electrical products, vehicles, aeronautics and aerospace, chemicals, pharmaceuticals, and metals, stones and related products. Car exports have been particularly dynamic in recent years. The UK posted its first quarterly car trade surplus since 1976 last year and approximately eight in ten cars produced in the UK are now exported.
The trade in oil balance turned negative in 2005 and is expected to continue to drag down the trade balance in the future (Graphs 3.9a and 3.9b). By year-end 2012, trade in oil contributed nearly 1 pp. to the current account deficit. Besides an on-going trend of declining oil production, the recent deterioration was also due to a rise in oil
80
100
120
140
160
180
200
220
240
260
280
07 08 09 10 11 12
Jan.
200
7 =
100,
3-m
onth
rolli
ng a
vera
ge
Graph 3.8:UK goods exports to BRIC and other countries
Brazil, Russia, India and China Rest of the world
Source: ONS
Category UK Exports (£ Thou.)
Share of UK Exports
UK Share of World Exports
Machinery / Electrical Products 57,925,389 13.90% 2.40%
Other business services 48,686,360 11.70% 8.00%Mineral Products 34,204,540 8.20% 2.00%Financial services 30,804,482 7.40% 17.90%Transport Equipment 26,135,941 6.30% 3.10%Chemicals / Related Industries 24,938,688 6.00% 4.00%
Transport 20,503,950 4.90% 4.00%Travel 19,798,257 4.70% 3.20%Metals / Metal Products 16,485,278 3.90% 2.30%Stone / Glass / Ceramics 12,712,743 3.00% 3.50%Foodstuffs 10,529,160 2.50% 3.70%Precision Instruments 10,467,262 2.50% 3.10%Royalties and licence fees 9,245,229 2.20% 5.80%Plastics / Rubbers 9,154,219 2.20% 2.20%Aerospace 8,808,721 2.10% 6.00%Computer and information services 7,529,553 1.80% 5.40%
Insurance 6,720,272 1.60% 12.30%Textiles 6,465,765 1.50% 1.50%Wood / Wood Products 6,050,554 1.40% 2.50%Other 5,305,038 1.30% 2.70%Communications 4,836,265 1.20% 8.90%Animal / Animal Products 3,826,391 0.90% 2.20%Miscellaneous Manufacturing 3,451,230 0.80% 1.80%
Personal, cultural and recreational serv 2,557,329 0.60% 9.20%
Total 416,602,880 100% 3.40%Source: ITC Trade Database, own calculations
Table 3.2:Top UK Exports by Category of Goods and Services (2010)

European Commission Macroeconomic Imbalances - United Kingdom 2013
30
prices, which has further contributed to increase price pressures for (non-oil) UK exporters.
The financial and professional services cluster is of obvious importance to UK services' trade. As depicted in Graph 3.10, financial, insurance and business services constitute the majority of UK service exports. Tourism and transport make up most of the remainder.
The dividing lines between goods and services are increasingly blurred, which can play to the UK's commercial strengths. Services can
complement, add value to and be bundled with goods and other services. The UK's strengths in professional services, media, publishing, entertainment and in range of immaterial goods can be further exploited, not only for the growth potential that these increasingly global markets represent, but also in association with other productive activities.
UK productivity lags behind that of other leading economies
Labour productivity increased rapidly in the 1990s in the UK, but remains somewhat below that of France or Germany (see Graph 3.11). In particular, productivity growth in the goods-producing sector lagged behind that of the services sector. Whereas the UK displayed the seventh highest labour productivity growth in the EU-27 from 2000 to 2010 in the services sector, it ranks sixteenth when the same measure is applied to the industrial sector. (26) Additionally, the evolution of total factor productivity in manufacturing from 2001 to 2009 compares unfavourably to that of other EU countries. (27) While rates of return on employed capital where similar in 1997 in the services and manufacturing sectors (28), they have since diverged and are now significantly higher in the services sector. In fact, (26) Data from DG ECFIN's Sectoral Performance Indicators
database, which is based on public sources. (27) See Altomonte et al (2012). (28) See ONS (2013b).
0 20 40
1 - Transport
2 - Travel
3 - Other services
3a - Communications
3b - Construction
3c - Insurance
3d - Financial services
3e - Computer andinformation
3g - Other businessservices
3h - Personal, culturaland recreational services
% share in services exports
Graph 3.10:Decomposition of UK service exports
2004 2010
Source: Commission services
-1.2
-1.0
-0.8
-0.6
-0.4
-0.2
0.0
0.2
0.4
0.6
0.8
1.0
90 95 00 05 10
% o
f GD
P
Graph 3.9a:Trade in oil balance
0
20
40
60
80
100
120
140
1980 1985 1990 1995 2000 2005 2010 2015
Mt
OBRforecast
Graph 3.9b:Oil production
Source: Office for National Statistics (a) and DECC, OBR (b)
3. In-Depth Analysis of Selected Topics
31
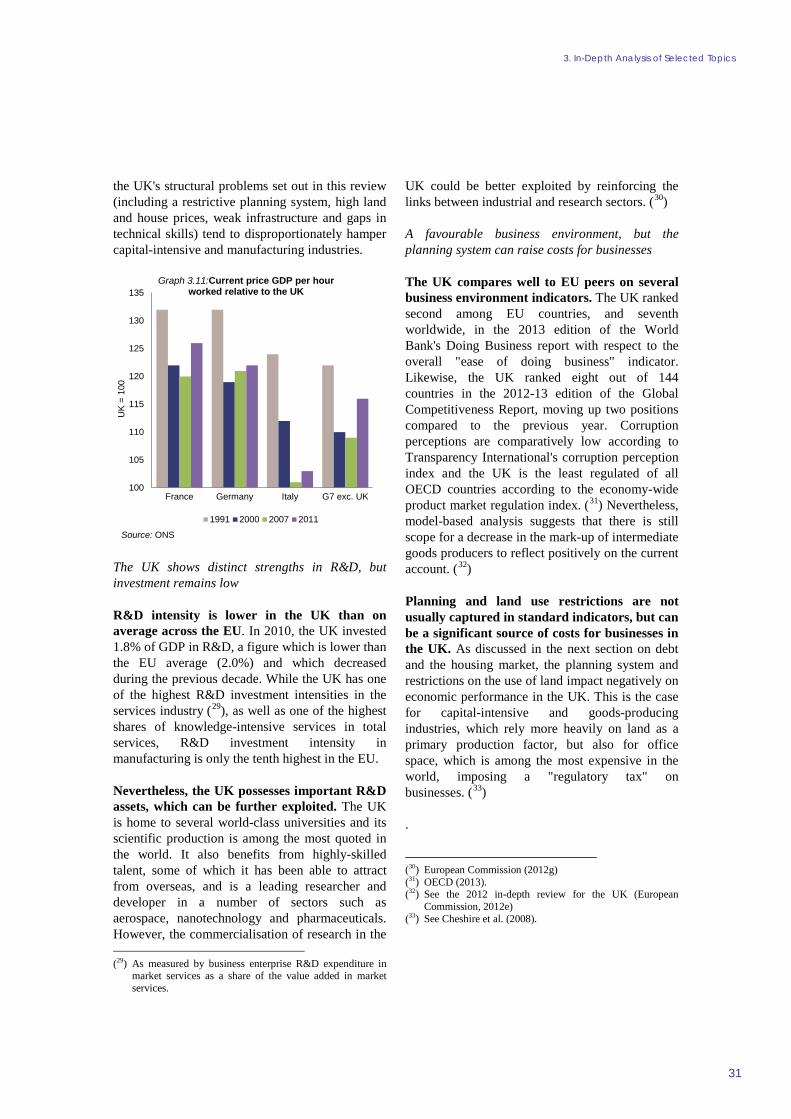
the UK's structural problems set out in this review (including a restrictive planning system, high land and house prices, weak infrastructure and gaps in technical skills) tend to disproportionately hamper capital-intensive and manufacturing industries.
The UK shows distinct strengths in R&D, but investment remains low
R&D intensity is lower in the UK than on average across the EU. In 2010, the UK invested 1.8% of GDP in R&D, a figure which is lower than the EU average (2.0%) and which decreased during the previous decade. While the UK has one of the highest R&D investment intensities in the services industry (29), as well as one of the highest shares of knowledge-intensive services in total services, R&D investment intensity in manufacturing is only the tenth highest in the EU.
Nevertheless, the UK possesses important R&D assets, which can be further exploited. The UK is home to several world-class universities and its scientific production is among the most quoted in the world. It also benefits from highly-skilled talent, some of which it has been able to attract from overseas, and is a leading researcher and developer in a number of sectors such as aerospace, nanotechnology and pharmaceuticals. However, the commercialisation of research in the (29) As measured by business enterprise R&D expenditure in
market services as a share of the value added in market services.
UK could be better exploited by reinforcing the links between industrial and research sectors. (30)
A favourable business environment, but the planning system can raise costs for businesses
The UK compares well to EU peers on several business environment indicators. The UK ranked second among EU countries, and seventh worldwide, in the 2013 edition of the World Bank's Doing Business report with respect to the overall "ease of doing business" indicator. Likewise, the UK ranked eight out of 144 countries in the 2012-13 edition of the Global Competitiveness Report, moving up two positions compared to the previous year. Corruption perceptions are comparatively low according to Transparency International's corruption perception index and the UK is the least regulated of all OECD countries according to the economy-wide product market regulation index. (31) Nevertheless, model-based analysis suggests that there is still scope for a decrease in the mark-up of intermediate goods producers to reflect positively on the current account. (32)
Planning and land use restrictions are not usually captured in standard indicators, but can be a significant source of costs for businesses in the UK. As discussed in the next section on debt and the housing market, the planning system and restrictions on the use of land impact negatively on economic performance in the UK. This is the case for capital-intensive and goods-producing industries, which rely more heavily on land as a primary production factor, but also for office space, which is among the most expensive in the world, imposing a "regulatory tax" on businesses. (33)
.
(30) European Commission (2012g) (31) OECD (2013). (32) See the 2012 in-depth review for the UK (European
Commission, 2012e) (33) See Cheshire et al. (2008).
100
105
110
115
120
125
130
135
France Germany Italy G7 exc. UK
UK
= 10
0
Graph 3.11:Current price GDP per hour worked relative to the UK
1991 2000 2007 2011
Source: ONS

European Commission Macroeconomic Imbalances - United Kingdom 2013
32
SMEs dominate the corporate landscape in the UK, as they do in the EU generally
SMEs constitute the vast majority of companies in the UK and in the EU, and tend to display a lower export propensity. As shown in graphs 3.12a and 3.12b, firm size is strongly correlated with productivity for industrial companies and with export propensity more generally. In fact, the ability to compete internationally is usually reserved for the most productive companies. It is therefore important that legislation and business frameworks do not incentivise SMEs to stay small. Overall, the UK does not stand out negatively when compared to EU peers in terms of market structure and number of firms by size class, and it is home to a significant number of large and multinational companies.
Exporting companies in the UK tend to be larger when compared with EU peers and there is scope for increasing the number of exporting SMEs. Small and medium enterprises in the UK are more focused on the internal market and make up less of the total number of exporting companies than they do in Germany or France. By contrast, the UK possesses a comparatively high share of firms in the two extremes of the size distribution of exporting companies (approximately 60% and 15% of exporting companies in the large and micro category, respectively). Whereas 25% of EU SMEs exported in 2006-2008, this figure drops to 21% in the case of the UK. (34) Therefore, helping SMEs gain a foothold in external markets could contribute towards boosting the UK export performance.
The import content of exports is relatively low in the UK mainly due to the large size of its economy and the importance of service exports
The import content of UK exports was the lowest in the EU-27 in 2009, standing at approximately 18%, as shown in Graph 3.13. This means that the UK imports relatively few intermediate imports to further process into exports. In general, the extent of imported intermediate inputs typically reflects access to greater input variety in terms of quality and price, which should benefit a country's exports. It also (34) European Commission (2010).
0
10
20
30
40
50
60
70
80
0-9 10-49 50-249 250 plus
%
Firm size class
Graph 3.12b:UK exports by destination
EU27 ExtraEU27
0
10
20
30
40
50
60
70
80
90
100
0-9 10-19 20-49 50-249 250 plus
%
Firm size class
Graph 3.12a:Number of UK firms distribution by firm size class
Industry Services
0
20
40
60
80
100
120
0-9 10-19 20-49 50-249 250 plus
EU
R th
ousa
nds
per w
orke
r
Firm size class
Graph 3.12c:UK labour productivity distribution by firm size class
Industry Services
Source: Commission services
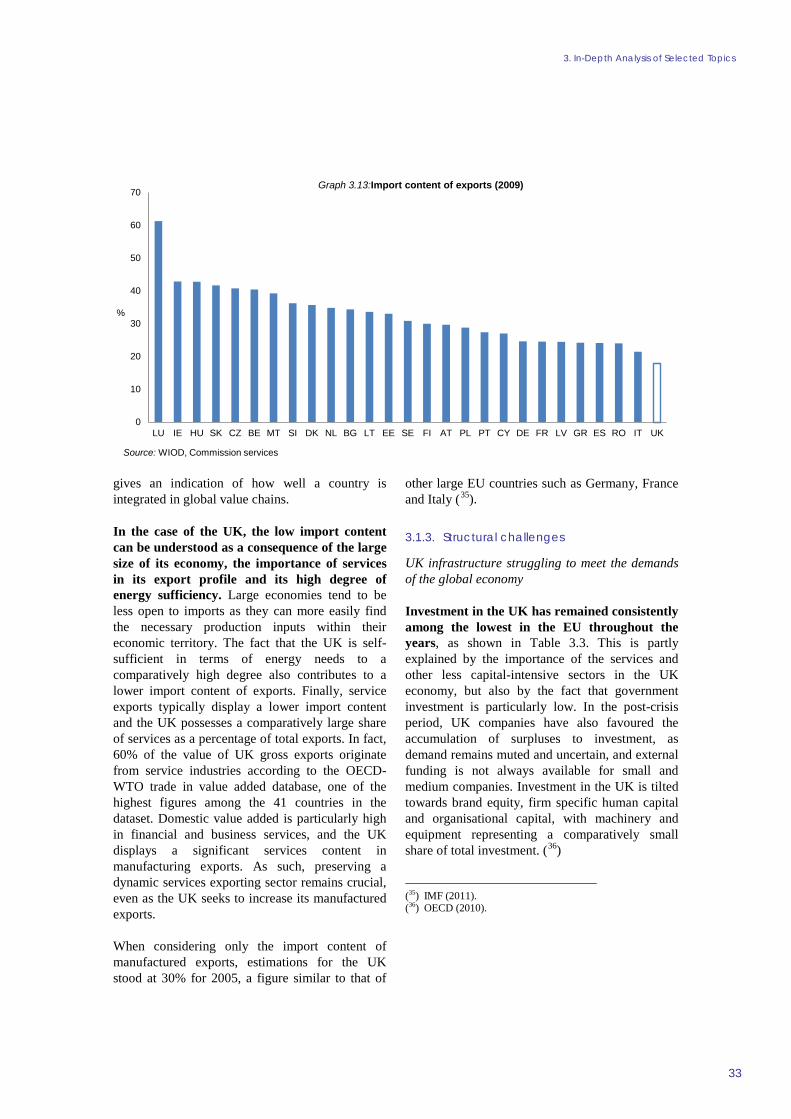
3. In-Depth Analysis of Selected Topics
33
gives an indication of how well a country is integrated in global value chains.
In the case of the UK, the low import content can be understood as a consequence of the large size of its economy, the importance of services in its export profile and its high degree of energy sufficiency. Large economies tend to be less open to imports as they can more easily find the necessary production inputs within their economic territory. The fact that the UK is self-sufficient in terms of energy needs to a comparatively high degree also contributes to a lower import content of exports. Finally, service exports typically display a lower import content and the UK possesses a comparatively large share of services as a percentage of total exports. In fact, 60% of the value of UK gross exports originate from service industries according to the OECD-WTO trade in value added database, one of the highest figures among the 41 countries in the dataset. Domestic value added is particularly high in financial and business services, and the UK displays a significant services content in manufacturing exports. As such, preserving a dynamic services exporting sector remains crucial, even as the UK seeks to increase its manufactured exports.
When considering only the import content of manufactured exports, estimations for the UK stood at 30% for 2005, a figure similar to that of
other large EU countries such as Germany, France and Italy (35).
3.1.3. Structural challenges
UK infrastructure struggling to meet the demands of the global economy
Investment in the UK has remained consistently among the lowest in the EU throughout the years, as shown in Table 3.3. This is partly explained by the importance of the services and other less capital-intensive sectors in the UK economy, but also by the fact that government investment is particularly low. In the post-crisis period, UK companies have also favoured the accumulation of surpluses to investment, as demand remains muted and uncertain, and external funding is not always available for small and medium companies. Investment in the UK is tilted towards brand equity, firm specific human capital and organisational capital, with machinery and equipment representing a comparatively small share of total investment. (36)
(35) IMF (2011). (36) OECD (2010).
0
10
20
30
40
50
60
70
LU IE HU SK CZ BE MT SI DK NL BG LT EE SE FI AT PL PT CY DE FR LV GR ES RO IT UK
%
Graph 3.13:Import content of exports (2009)
Source: WIOD, Commission services

European Commission Macroeconomic Imbalances - United Kingdom 2013
34
The UK displays important investment needs in infrastructure. According to the World Economic Forum, the UK currently ranks 24th on quality of its overall infrastructure. As a comparison, France ranks fifth and Germany ninth. Transport infrastructure is of particular importance for the goods-producing sector, an area where the UK trade balance is in a persistent and significant deficit. UK producers need to be able to move goods and factors around in their economic territory and to export them overseas. Around GBP 310 billion of investment is needed over the duration of the current parliament and beyond in energy, roads and network rail, according to Infrastructure UK, a unit of HM Treasury. The need to upgrade the UK's infrastructure is also widely recognised in business surveys (see Graph 3.14 for an example).
Transport is a significant contributor to producer's costs. The increase in the UK's HICP of transport services was the highest of all Member States in the 2009-2011 period.
The UK's motorway and rail network is one of the least dense in the EU-27 with respect to the number of inhabitants and airline passenger transport services display one of the worst market performance indicators (37). The UK's ratio of average speed to free-flow traffic speed is also one of the lowest in the EU (38) and research by the Federation of Small Businesses suggests that the state of roads costs approximately half of small businesses up to GBP 5000 per year due to congestion and poor maintenance.
Seaport capacity is of particular importance to the UK given that its ports handle the second highest gross weight of goods in the EU and seaports could benefit from better transport connections. Additionally, there is a growing shortage of airport capacity in the south east of England, where demand is concentrated.
Shortfalls in energy capacity are looming and some companies are reporting electricity shortages. A large part of the UK's electricity generation capacity will require renewal or upgrading in the next decade. According to a recent survey by the British Chambers of Commerce, more than half of the surveyed companies had experienced an energy interruption in the last three years, with a large share of companies considering that the security of energy supply will be a greater issue in the future.
The government has stated it wants to access pension funds and other private capital to fund infrastructure improvements including new road developments and replacing ageing electricity generating capacity. However, while the impact of sharp cuts to publicly-funded construction and maintenance is already being felt, (37) European Commission (2012c). (38) European Commission (2012c).
0 50 100
2011
2012
2011
2012
2011
2012
EU
Non
-EU
deve
lope
dco
untri
esEm
ergi
ngec
onom
ies
Graph 3.14:UK infrastructure compared with other countries
more favourable no difference less favourable
Source: CBI/KPMG infrastructure survey
Table 3.3:Investment rates1 for the UK and EU 27
2005 2006 2007 2008 2009 2010 2011 2008-2011 1995-2011UK 17% 18% 18% 17% 14% 15% 15% 15% 17%EU 272 23% 25% 26% 25% 19% 20% 20% 21% 22%UK's Rank 27 27 27 27 26 26 25 26 27Source: Eurostat, own calculations1) Investment rates defined as gross capital formation/GDP2) The EU 27 rate is calculated as the simple average of the 27 EU countries.
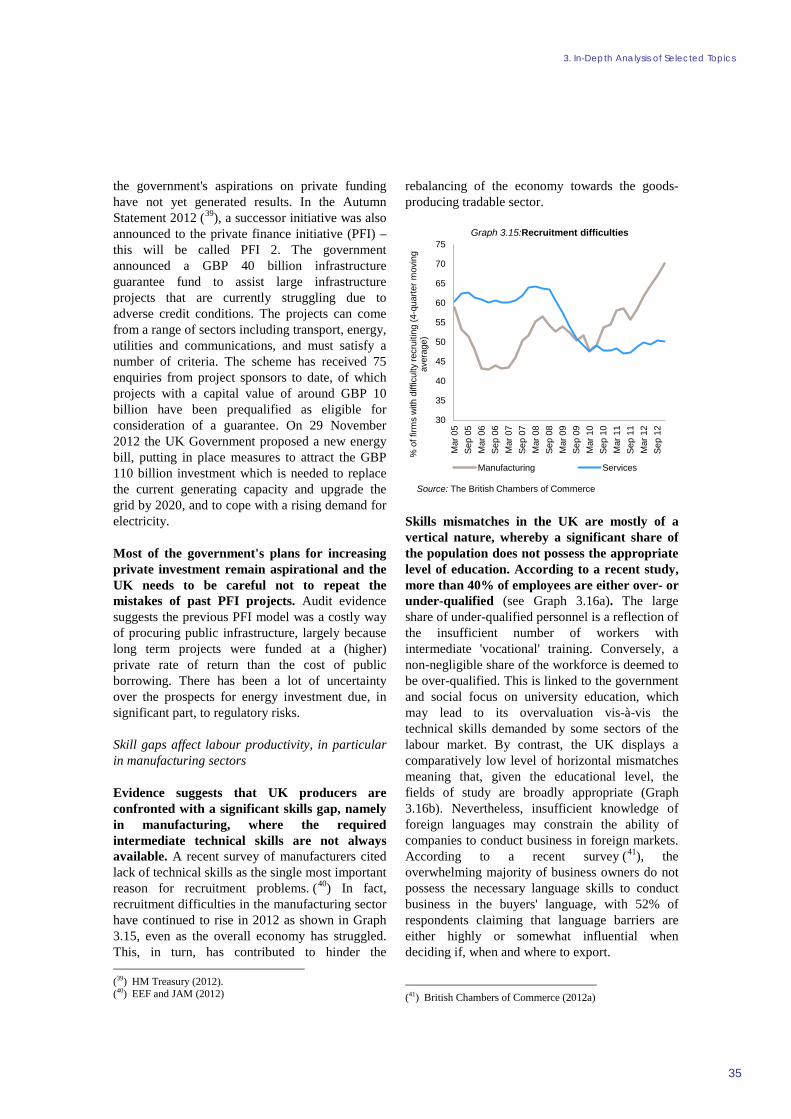
3. In-Depth Analysis of Selected Topics
35
the government's aspirations on private funding have not yet generated results. In the Autumn Statement 2012 (39), a successor initiative was also announced to the private finance initiative (PFI) – this will be called PFI 2. The government announced a GBP 40 billion infrastructure guarantee fund to assist large infrastructure projects that are currently struggling due to adverse credit conditions. The projects can come from a range of sectors including transport, energy, utilities and communications, and must satisfy a number of criteria. The scheme has received 75 enquiries from project sponsors to date, of which projects with a capital value of around GBP 10 billion have been prequalified as eligible for consideration of a guarantee. On 29 November 2012 the UK Government proposed a new energy bill, putting in place measures to attract the GBP 110 billion investment which is needed to replace the current generating capacity and upgrade the grid by 2020, and to cope with a rising demand for electricity.
Most of the government's plans for increasing private investment remain aspirational and the UK needs to be careful not to repeat the mistakes of past PFI projects. Audit evidence suggests the previous PFI model was a costly way of procuring public infrastructure, largely because long term projects were funded at a (higher) private rate of return than the cost of public borrowing. There has been a lot of uncertainty over the prospects for energy investment due, in significant part, to regulatory risks.
Skill gaps affect labour productivity, in particular in manufacturing sectors
Evidence suggests that UK producers are confronted with a significant skills gap, namely in manufacturing, where the required intermediate technical skills are not always available. A recent survey of manufacturers cited lack of technical skills as the single most important reason for recruitment problems. (40) In fact, recruitment difficulties in the manufacturing sector have continued to rise in 2012 as shown in Graph 3.15, even as the overall economy has struggled. This, in turn, has contributed to hinder the (39) HM Treasury (2012). (40) EEF and JAM (2012)
rebalancing of the economy towards the goods-producing tradable sector.
Skills mismatches in the UK are mostly of a vertical nature, whereby a significant share of the population does not possess the appropriate level of education. According to a recent study, more than 40% of employees are either over- or under-qualified (see Graph 3.16a). The large share of under-qualified personnel is a reflection of the insufficient number of workers with intermediate 'vocational' training. Conversely, a non-negligible share of the workforce is deemed to be over-qualified. This is linked to the government and social focus on university education, which may lead to its overvaluation vis-à-vis the technical skills demanded by some sectors of the labour market. By contrast, the UK displays a comparatively low level of horizontal mismatches meaning that, given the educational level, the fields of study are broadly appropriate (Graph 3.16b). Nevertheless, insufficient knowledge of foreign languages may constrain the ability of companies to conduct business in foreign markets. According to a recent survey (41), the overwhelming majority of business owners do not possess the necessary language skills to conduct business in the buyers' language, with 52% of respondents claiming that language barriers are either highly or somewhat influential when deciding if, when and where to export.
(41) British Chambers of Commerce (2012a)
30
35
40
45
50
55
60
65
70
75
Mar
05
Sep
05M
ar 0
6Se
p 06
Mar
07
Sep
07M
ar 0
8Se
p 08
Mar
09
Sep
09M
ar 1
0Se
p 10
Mar
11
Sep
11M
ar 1
2Se
p 12
% o
f firm
s w
ith d
iffic
ulty
recr
uitin
g (4
-qua
rter m
ovin
g av
erag
e)
Graph 3.15:Recruitment difficulties
Manufacturing Services
Source: The British Chambers of Commerce

European Commission Macroeconomic Imbalances - United Kingdom 2013
36
More restrictive immigration policies may affect the UK's ability to compete for global talent. According to the Office for National Statistics, net migration to the UK decreased by one quarter in 2012. This was partly due to more people leaving the country, but also due to 20,000 fewer overseas students entering the country. The UK authorities have made it more difficult for graduates to work in the UK, affecting the UK higher education industry, which has a significant export propensity. Additionally, the fact that visa applications may take a long time to be processed and that allocations are not fully used may hamper the UK's ability to attract globally-mobile talent.
A number of initiatives are underway to improve skills and reform the educational offer in the UK, among them the national apprenticeships programme. The number of apprenticeship starts in 2011-2012 was 520,600, up from 457,200 in the previous academic year. It is crucial that apprenticeships deliver high quality training to participants and that the technical and professional skills so developed be properly assessed. (42) A review of the national curriculum in England is also currently underway and new programmes of study are planned to be introduced in 2014. In Scotland, the new curriculum for schools from age 3-18 is gradually being (42) See Richard (2012).
0%
10%
20%
30%
40%
50%
60%
70%
80%
90%
100%
SK CZ RO SI PL HU BG LU FI DK PT DE AT SE LV EE MT IT LT UK CY NL FR GR BE ES IE
Graph 3.16a:Average incidence of vertical mismatch (2001-2011) in EU-27 countries, % of employees (aged 25-64)
Over-qualification Under-qualification Matched qualification
0
5
10
15
20
25
30
35
40
45
IE ES GR UK IT LU BE FI EU DE NL SE AU LV EE RO FR DK HU SI CY BG LT CZ SK PL
Graph 3.16b:Incidence of horizontal mismatch in Europe, % of employed, 2009, EU-27
Source: Commission services (a) and Commission services, Randstad (b)
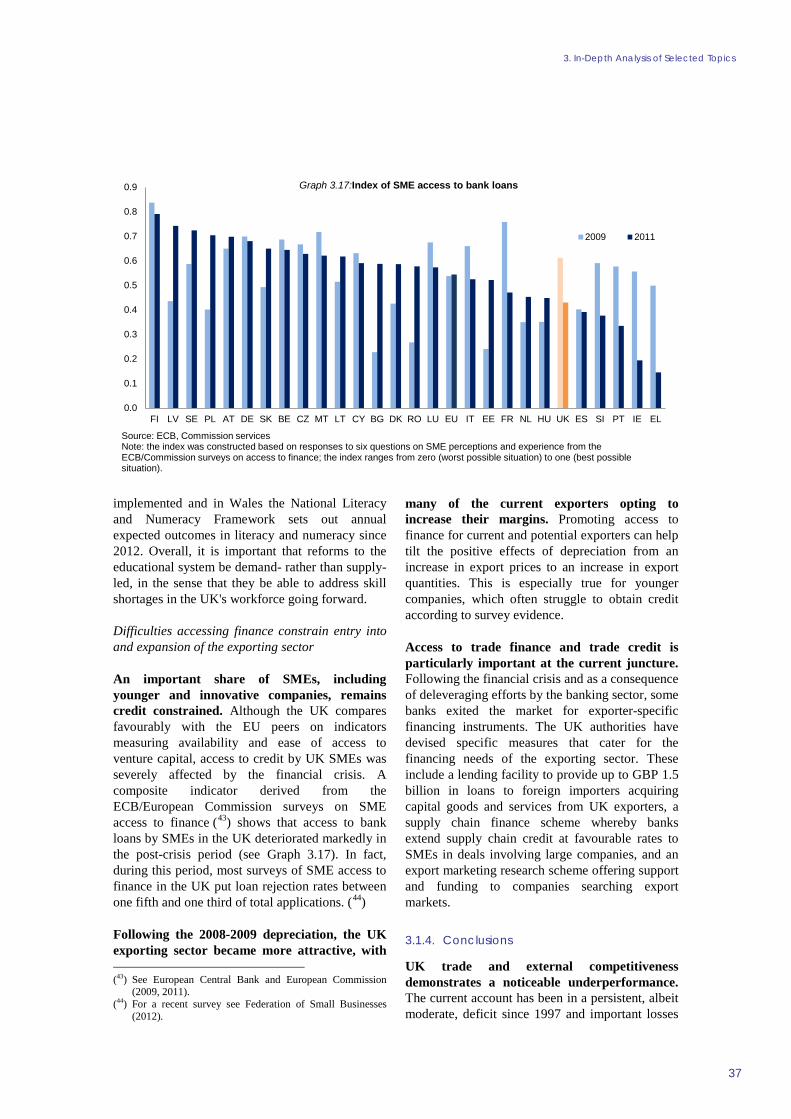
3. In-Depth Analysis of Selected Topics
37
implemented and in Wales the National Literacy and Numeracy Framework sets out annual expected outcomes in literacy and numeracy since 2012. Overall, it is important that reforms to the educational system be demand- rather than supply-led, in the sense that they be able to address skill shortages in the UK's workforce going forward.
Difficulties accessing finance constrain entry into and expansion of the exporting sector
An important share of SMEs, including younger and innovative companies, remains credit constrained. Although the UK compares favourably with the EU peers on indicators measuring availability and ease of access to venture capital, access to credit by UK SMEs was severely affected by the financial crisis. A composite indicator derived from the ECB/European Commission surveys on SME access to finance (43) shows that access to bank loans by SMEs in the UK deteriorated markedly in the post-crisis period (see Graph 3.17). In fact, during this period, most surveys of SME access to finance in the UK put loan rejection rates between one fifth and one third of total applications. (44)
Following the 2008-2009 depreciation, the UK exporting sector became more attractive, with (43) See European Central Bank and European Commission
(2009, 2011). (44) For a recent survey see Federation of Small Businesses
(2012).
many of the current exporters opting to increase their margins. Promoting access to finance for current and potential exporters can help tilt the positive effects of depreciation from an increase in export prices to an increase in export quantities. This is especially true for younger companies, which often struggle to obtain credit according to survey evidence.
Access to trade finance and trade credit is particularly important at the current juncture. Following the financial crisis and as a consequence of deleveraging efforts by the banking sector, some banks exited the market for exporter-specific financing instruments. The UK authorities have devised specific measures that cater for the financing needs of the exporting sector. These include a lending facility to provide up to GBP 1.5 billion in loans to foreign importers acquiring capital goods and services from UK exporters, a supply chain finance scheme whereby banks extend supply chain credit at favourable rates to SMEs in deals involving large companies, and an export marketing research scheme offering support and funding to companies searching export markets.
3.1.4. Conclusions
UK trade and external competitiveness demonstrates a noticeable underperformance. The current account has been in a persistent, albeit moderate, deficit since 1997 and important losses
0.0
0.1
0.2
0.3
0.4
0.5
0.6
0.7
0.8
0.9
FI LV SE PL AT DE SK BE CZ MT LT CY BG DK RO LU EU IT EE FR NL HU UK ES SI PT IE EL
Graph 3.17:Index of SME access to bank loans
2009 2011
Source: ECB, Commission servicesNote: the index was constructed based on responses to six questions on SME perceptions and experience from the ECB/Commission surveys on access to finance; the index ranges from zero (worst possible situation) to one (best possible situation).
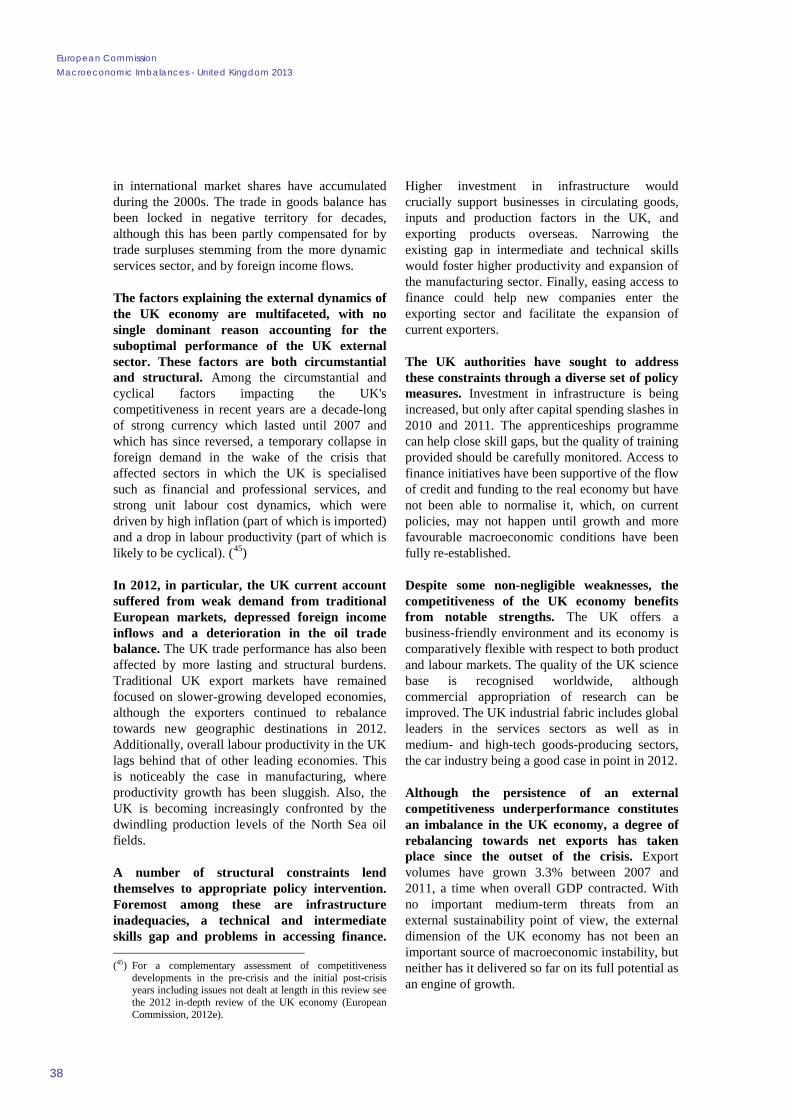
European Commission Macroeconomic Imbalances - United Kingdom 2013
38
in international market shares have accumulated during the 2000s. The trade in goods balance has been locked in negative territory for decades, although this has been partly compensated for by trade surpluses stemming from the more dynamic services sector, and by foreign income flows.
The factors explaining the external dynamics of the UK economy are multifaceted, with no single dominant reason accounting for the suboptimal performance of the UK external sector. These factors are both circumstantial and structural. Among the circumstantial and cyclical factors impacting the UK's competitiveness in recent years are a decade-long of strong currency which lasted until 2007 and which has since reversed, a temporary collapse in foreign demand in the wake of the crisis that affected sectors in which the UK is specialised such as financial and professional services, and strong unit labour cost dynamics, which were driven by high inflation (part of which is imported) and a drop in labour productivity (part of which is likely to be cyclical). (45)
In 2012, in particular, the UK current account suffered from weak demand from traditional European markets, depressed foreign income inflows and a deterioration in the oil trade balance. The UK trade performance has also been affected by more lasting and structural burdens. Traditional UK export markets have remained focused on slower-growing developed economies, although the exporters continued to rebalance towards new geographic destinations in 2012. Additionally, overall labour productivity in the UK lags behind that of other leading economies. This is noticeably the case in manufacturing, where productivity growth has been sluggish. Also, the UK is becoming increasingly confronted by the dwindling production levels of the North Sea oil fields.
A number of structural constraints lend themselves to appropriate policy intervention. Foremost among these are infrastructure inadequacies, a technical and intermediate skills gap and problems in accessing finance. (45) For a complementary assessment of competitiveness
developments in the pre-crisis and the initial post-crisis years including issues not dealt at length in this review see the 2012 in-depth review of the UK economy (European Commission, 2012e).
Higher investment in infrastructure would crucially support businesses in circulating goods, inputs and production factors in the UK, and exporting products overseas. Narrowing the existing gap in intermediate and technical skills would foster higher productivity and expansion of the manufacturing sector. Finally, easing access to finance could help new companies enter the exporting sector and facilitate the expansion of current exporters.
The UK authorities have sought to address these constraints through a diverse set of policy measures. Investment in infrastructure is being increased, but only after capital spending slashes in 2010 and 2011. The apprenticeships programme can help close skill gaps, but the quality of training provided should be carefully monitored. Access to finance initiatives have been supportive of the flow of credit and funding to the real economy but have not been able to normalise it, which, on current policies, may not happen until growth and more favourable macroeconomic conditions have been fully re-established.
Despite some non-negligible weaknesses, the competitiveness of the UK economy benefits from notable strengths. The UK offers a business-friendly environment and its economy is comparatively flexible with respect to both product and labour markets. The quality of the UK science base is recognised worldwide, although commercial appropriation of research can be improved. The UK industrial fabric includes global leaders in the services sectors as well as in medium- and high-tech goods-producing sectors, the car industry being a good case in point in 2012.
Although the persistence of an external competitiveness underperformance constitutes an imbalance in the UK economy, a degree of rebalancing towards net exports has taken place since the outset of the crisis. Export volumes have grown 3.3% between 2007 and 2011, a time when overall GDP contracted. With no important medium-term threats from an external sustainability point of view, the external dimension of the UK economy has not been an important source of macroeconomic instability, but neither has it delivered so far on its full potential as an engine of growth.

3. In-Depth Analysis of Selected Topics
39
3.2. PRIVATE DEBT, DELEVERAGING AND GROWTH
This section analyses the distribution and dynamics of corporate and household debt in turn, and how current government policy and macroeconomic conditions are affecting them. It then assesses the potential paths of private debt stocks, flows and servicing costs, and the extent to which they are a potential source of macroeconomic instability or persistently weak growth.
3.2.1. Corporate debt and access to finance
Though total non-financial corporation (NFC) debt is on the high side, firms are saving in aggregate and some are cash-rich
As discussed in Section 2.5 and shown in Graph 3.18, the leverage of UK NFCs increased in the pre-crisis period and corporate debt remains above the EU average, despite some deleveraging since 2008. In common with firms across the EU, UK businesses steadily increased their total borrowing in the decade before the crisis, encouraged by benign macroeconomic conditions and easy availability of credit. The corporate debt-to-equity ratio increased rapidly in the early 2000s, due to a fall in the UK stock market following the bursting of the international dot-com bubble, then stabilised until the crisis. However, the increase in debt-to-equity did not lead to a period of deleveraging as wider economic conditions remained favourable. In the run up to the financial crisis banks continued to be willing to lend and companies to take on additional debt. Debt-to-equity spiked in 2008 due to temporary valuation effects from a drop in the stock market. In contrast, the NFC debt-to-financial-assets ratio has remained broadly stable since 1995, as financial assets have grown at a similar rate to debt. Note that, as discussed below, the assets and liabilities are not necessarily in the same firms and sectors.
As Graph 3.19a shows, in aggregate UK NFCs remained profitable before and during the crisis, with a higher share of retained earnings than the euro area average every year since 2003. A combination of continued profitability and low investment has led to NFCs being net lenders since 2002, as seen in Graph 3.19b. Since the onset of the crisis, when business investment fell sharply but profits held up relatively well in a context of falling real wages, net lending of NFCs has increased further. UK NFCs as a whole have consequently accumulated significant surpluses, as many businesses are wary of investing in face of a subdued and volatile demand. Additionally, a large fraction of smaller businesses have had to build up internal funding buffers due to difficulties accessing credit and some companies have been faced with the need to save to recapitalise pension funds. For example, while the fall in interest rates is favourable for firms wanting to borrow, it has created a hole in the finances of companies with defined benefit pension schemes. A recent call for evidence from the UK Department for Work and Pensions (46) concerns the tension between the need to ensure that pension fund deficits are addressed in a timely manner, and the potential negative impact on investment and macroeconomic stability if firms are required to make good any shortfalls resulting from asset price movements too quickly.
(46) Department for Work and Pensions (2013).
0
20
40
60
80
100
120
140
95 96 97 98 99 00 01 02 03 04 05 06 07 08 09 10 11 12*R
atio
s of
deb
t to
equi
ty, G
DP
and
tota
l ass
ets
(%)
Graph 3.18:Indicators of leverage in non-financial corporations
Debt / GDPDebt / equityDebt / assetsDebt / assets, consolidated
Source: Commission services
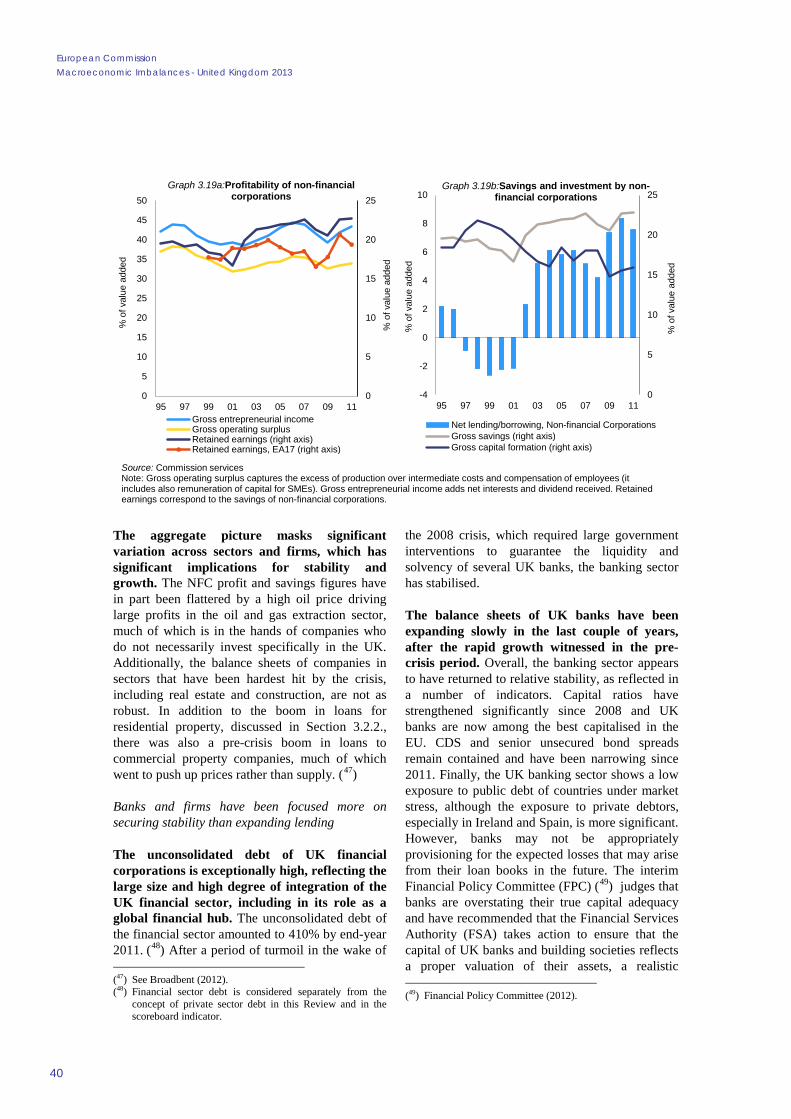
European Commission Macroeconomic Imbalances - United Kingdom 2013
40
The aggregate picture masks significant variation across sectors and firms, which has significant implications for stability and growth. The NFC profit and savings figures have in part been flattered by a high oil price driving large profits in the oil and gas extraction sector, much of which is in the hands of companies who do not necessarily invest specifically in the UK. Additionally, the balance sheets of companies in sectors that have been hardest hit by the crisis, including real estate and construction, are not as robust. In addition to the boom in loans for residential property, discussed in Section 3.2.2., there was also a pre-crisis boom in loans to commercial property companies, much of which went to push up prices rather than supply. (47)
Banks and firms have been focused more on securing stability than expanding lending
The unconsolidated debt of UK financial corporations is exceptionally high, reflecting the large size and high degree of integration of the UK financial sector, including in its role as a global financial hub. The unconsolidated debt of the financial sector amounted to 410% by end-year 2011. (48) After a period of turmoil in the wake of (47) See Broadbent (2012). (48) Financial sector debt is considered separately from the
concept of private sector debt in this Review and in the scoreboard indicator.
the 2008 crisis, which required large government interventions to guarantee the liquidity and solvency of several UK banks, the banking sector has stabilised.
The balance sheets of UK banks have been expanding slowly in the last couple of years, after the rapid growth witnessed in the pre-crisis period. Overall, the banking sector appears to have returned to relative stability, as reflected in a number of indicators. Capital ratios have strengthened significantly since 2008 and UK banks are now among the best capitalised in the EU. CDS and senior unsecured bond spreads remain contained and have been narrowing since 2011. Finally, the UK banking sector shows a low exposure to public debt of countries under market stress, although the exposure to private debtors, especially in Ireland and Spain, is more significant. However, banks may not be appropriately provisioning for the expected losses that may arise from their loan books in the future. The interim Financial Policy Committee (FPC) (49) judges that banks are overstating their true capital adequacy and have recommended that the Financial Services Authority (FSA) takes action to ensure that the capital of UK banks and building societies reflects a proper valuation of their assets, a realistic (49) Financial Policy Committee (2012).
0
5
10
15
20
25
0
5
10
15
20
25
30
35
40
45
50
95 97 99 01 03 05 07 09 11
% o
f val
ue a
dded
% o
f val
ue a
dded
Graph 3.19a:Profitability of non-financial corporations
Gross entrepreneurial incomeGross operating surplusRetained earnings (right axis)Retained earnings, EA17 (right axis)
0
5
10
15
20
25
-4
-2
0
2
4
6
8
10
95 97 99 01 03 05 07 09 11
% o
f val
ue a
dded
% o
f val
ue a
dded
Graph 3.19b:Savings and investment by non-financial corporations
Net lending/borrowing, Non-financial CorporationsGross savings (right axis)Gross capital formation (right axis)
Source: Commission servicesNote: Gross operating surplus captures the excess of production over intermediate costs and compensation of employees (it includes also remuneration of capital for SMEs). Gross entrepreneurial income adds net interests and dividend received. Retainedearnings correspond to the savings of non-financial corporations.
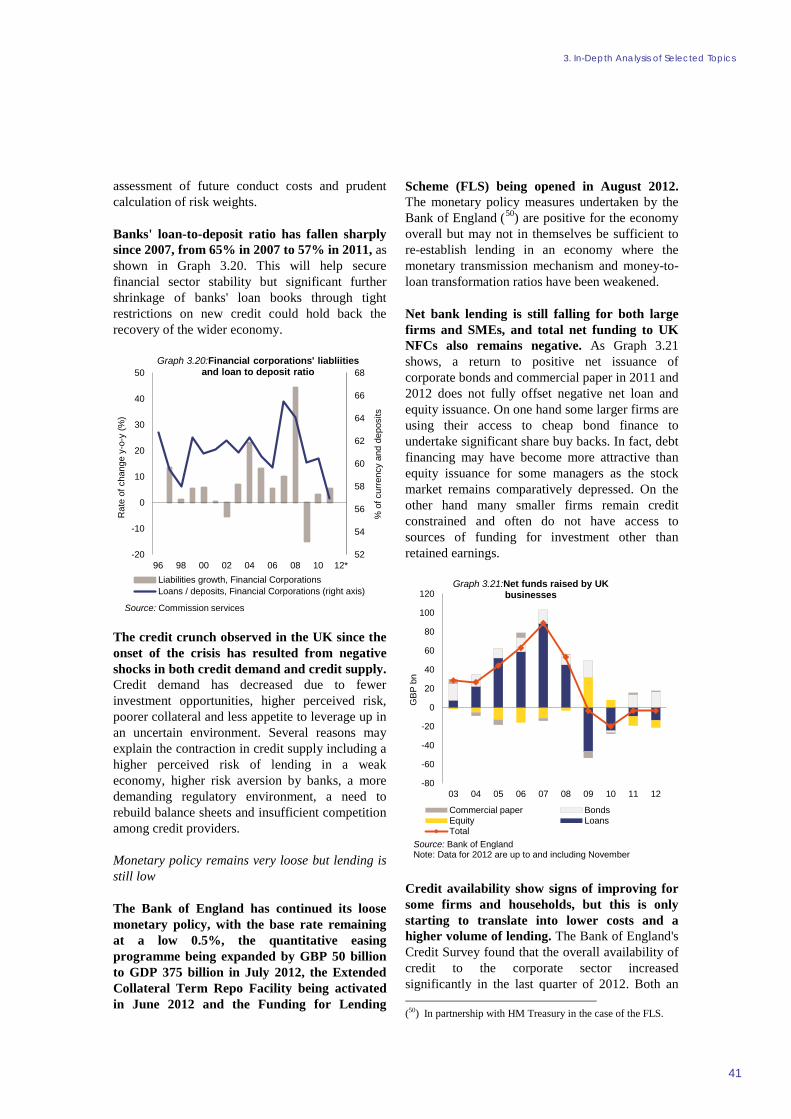
3. In-Depth Analysis of Selected Topics
41
assessment of future conduct costs and prudent calculation of risk weights.
Banks' loan-to-deposit ratio has fallen sharply since 2007, from 65% in 2007 to 57% in 2011, as shown in Graph 3.20. This will help secure financial sector stability but significant further shrinkage of banks' loan books through tight restrictions on new credit could hold back the recovery of the wider economy.
The credit crunch observed in the UK since the onset of the crisis has resulted from negative shocks in both credit demand and credit supply. Credit demand has decreased due to fewer investment opportunities, higher perceived risk, poorer collateral and less appetite to leverage up in an uncertain environment. Several reasons may explain the contraction in credit supply including a higher perceived risk of lending in a weak economy, higher risk aversion by banks, a more demanding regulatory environment, a need to rebuild balance sheets and insufficient competition among credit providers.
Monetary policy remains very loose but lending is still low
The Bank of England has continued its loose monetary policy, with the base rate remaining at a low 0.5%, the quantitative easing programme being expanded by GBP 50 billion to GDP 375 billion in July 2012, the Extended Collateral Term Repo Facility being activated in June 2012 and the Funding for Lending
Scheme (FLS) being opened in August 2012. The monetary policy measures undertaken by the Bank of England (50) are positive for the economy overall but may not in themselves be sufficient to re-establish lending in an economy where the monetary transmission mechanism and money-to-loan transformation ratios have been weakened.
Net bank lending is still falling for both large firms and SMEs, and total net funding to UK NFCs also remains negative. As Graph 3.21 shows, a return to positive net issuance of corporate bonds and commercial paper in 2011 and 2012 does not fully offset negative net loan and equity issuance. On one hand some larger firms are using their access to cheap bond finance to undertake significant share buy backs. In fact, debt financing may have become more attractive than equity issuance for some managers as the stock market remains comparatively depressed. On the other hand many smaller firms remain credit constrained and often do not have access to sources of funding for investment other than retained earnings.
Credit availability show signs of improving for some firms and households, but this is only starting to translate into lower costs and a higher volume of lending. The Bank of England's Credit Survey found that the overall availability of credit to the corporate sector increased significantly in the last quarter of 2012. Both an (50) In partnership with HM Treasury in the case of the FLS.
52
54
56
58
60
62
64
66
68
-20
-10
0
10
20
30
40
50
96 98 00 02 04 06 08 10 12*
% o
f cur
renc
y an
d de
posi
ts
Rat
e of
cha
nge
y-o-
y (%
)
Graph 3.20:Financial corporations' liabliities and loan to deposit ratio
Liabilities growth, Financial CorporationsLoans / deposits, Financial Corporations (right axis)
Source; Commission services
-80
-60
-40
-20
0
20
40
60
80
100
120
03 04 05 06 07 08 09 10 11 12
GB
P b
n
Graph 3.21:Net funds raised by UK businesses
Commercial paper BondsEquity LoansTotal
Source: Bank of EnglandNote: Data for 2012 are up to and including November
European Commission Macroeconomic Imbalances - United Kingdom 2013
42
improvement in external economic conditions and credit easing policies appear to have contributed to this trend. However, demand for credit remained muted and major UK lenders report that a lack of confidence among firms is still weighing down on the demand for credit. The cost of credit has fallen slightly for SMEs in recent months (see Graph 3.22a) but remains above 2009 levels. Similarly while the reported availability of credit has improved across the board, as shown in Graph 3.22b) there has been least improvement for small businesses.
Access to finance policies aim to boost credit to firms
In June 2012, the government and the Bank of England announced the FLS to provide cheap funding for banks in order to boost lending to the real economy. Banks and building societies that increase lending to UK households and businesses will be able to borrow at lower cost than banks that scale back on lending. Participating banks and building societies will be able to borrow up to 5% of their stock of existing lending to the real economy, plus any net expansion of lending during a reference period (from end-June 2012 to end-December 2013). There is no upper limit on the size of either individual or aggregate borrowing under the scheme. Banks will be able to borrow under the FLS until 31 January 2014 by pledging their household and NFC loan books as
collateral. According to the second data release (51) and to the list of participating institutions published as of March 2013, 39 banks and building societies representing more than 80% of the lending stock to households and NFCs have signed up for the FLS. Of these, 13 banks and building societies had used the scheme by the end of 2012, representing a total of GBP 13.83 billion in outstanding drawings. While the 39 participating institutions registered a small decrease in net lending during the first two quarters of operation of the scheme, it is still early to measure the effects of the FLS as they continue to pass through to the real economy. The funding costs of UK banks have fallen more sharply than those of EU peers since the FLS was launched in July 2012, likely reflecting the effects of the scheme but also improved sentiment in global financial markets. (52) Lower funding costs should facilitate a gradual easing in domestic credit conditions which may explain why respondents to a recent Bank of England survey (53) expected that the availability of credit to all sectors would increase further in the first quarter of 2013. While the scheme has likely contributed to increased mortgage lending, it has been less successful so far in boosting corporate lending, in particular to SMEs. It is possible that even if the FLS has some positive impact, it may only succeed in arresting the decline in lending to SMEs, rather than reversing it. (51) 4 March 2013. (52) Bank of England (2013c). (53) Bank of England, (2013a).
0
1
2
3
4
5
6
Nov
08
May
09
Nov
09
May
10
Nov
10
May
11
Nov
11
May
12
Nov
12
%
Graph 3.22a:Indicative median interest rates on new SME variable rate loan facilities
Smaller SMEs Medium SMEsAll SMEs Bank rate
-25
-20
-15
-10
-5
0
5
10
15
20
25
Reportedchange
Expectedchange
Reportedchange
Expectedchange
Availability Demand
Net
per
cent
age
bala
nces
Graph 3.22b:Availability an demand for credit by firm size
Small businessesMedium PNFCsLarge PNFCs
Source: BIS, Bank of England and BoE calculations (a) and Commission services (b)

3. In-Depth Analysis of Selected Topics
43
The FLS builds on a range of other access to finance policies. The government will invest GBP 1 billion in a new "British Business Bank" to support the provision of long-term loans to SMEs via existing financial institutions. Plans for the Business Bank are under development but one element will be providing co-financing for the private sector to invest in sources of finance that help diversify the business finance market. If properly designed and implemented, the Business Bank could make some contribution to increased competition in the banking industry. The National Loan Guarantee Scheme has been underway since March 2012 to reduce the costs of bank loans and to promote lending to businesses. According to HM Treasury, GBP 2.5 billion in cheaper loans have been offered to over 16,000 businesses so far.
Both banking competition and access to non-bank finance are narrow
Access to non-bank lending remains largely restricted to bigger firms. UK bond markets are comparatively well-developed for large companies, which rely more strongly on wholesale debt markets than their counterparts in many other EU countries. In the UK, in common with most of Europe, other firms primarily finance investment through a combination of retained earnings and bank loans. When the availability of bank loans dropped sharply in the crisis this consequently had a greater impact on smaller firms, while larger firms were able to mitigate the effects of the credit crunch by temporarily becoming more reliant on other forms of finance. In the US, a wider range of firms use equity or the capital markets directly, allowing them to bypass an impaired banking system. The Breedon Task Force, commissioned by the government to inquire into alternatives to bank funding for businesses, estimated a substantial ongoing financing gap over the next five years, especially for SMEs. The government welcomed the report's conclusions and a number of related initiatives are being considered or implemented. (54)
Competition in the banking sector is also limited, which is more of a problem for SMEs. Evidence suggests that competition in UK retail banking markets is low, with concentration levels (54) Department for Business, Innovation and Skills (2012b).
rising markedly in the wake of the financial crisis as the assets of distressed banks were taken over by the government or rival banks. The government is attempting to help increase competition in the banking sector through the divestiture of part of the branch networks and loan books of large incumbent retail banks to challenger banks. The government is also working with the banking industry to reduce switching costs for bank accounts.
The tension between corporate deleveraging and access to credit is as much of a growth concern as a stability one in the short term, but risks from a high debt stock remain
The stock of UK corporate debt is relatively high, but in the short term tight credit conditions are as much of a problem as excessive debt. If banks are seeking to reduce their balance sheets but hesitating to recognise losses from a potentially stale stock of debt, it could both store up risks to financial stability and prevent credit from being reallocated to more dynamic and productive sectors of the economy. A fine balance has to be struck in order to reconcile the longer term benefits of "creative destruction", and the shorter term advantages of low insolvency rates supporting employment in a weak domestic economy. There is also a tension between the need for a sound banking system and the need to increase credit flows to fund investment.
3.2.2. Housing policy and household debt
The 2012 in-depth review of the UK concluded that high household debt constitutes an internal imbalance in the UK economy. As discussed in Section 2.5, household debt grew unsustainably in the boom years preceding the crisis. Commission services' analysis suggests that between 2002 and 2007 the cumulative increase in UK household debt above the sustainable path was 26pps. of GDP. Since 2008 real household debt, which is mainly in the form of mortgages, has been falling gradually as mortgage issuance has remained at unusually low levels (nominal household debt has been broadly flat). Debt secured on a mortgage was almost 86% of total household debt at the end of June 2012. (55) Given that household debt levels remain high, there is a continuing need for (55) Bank of England.
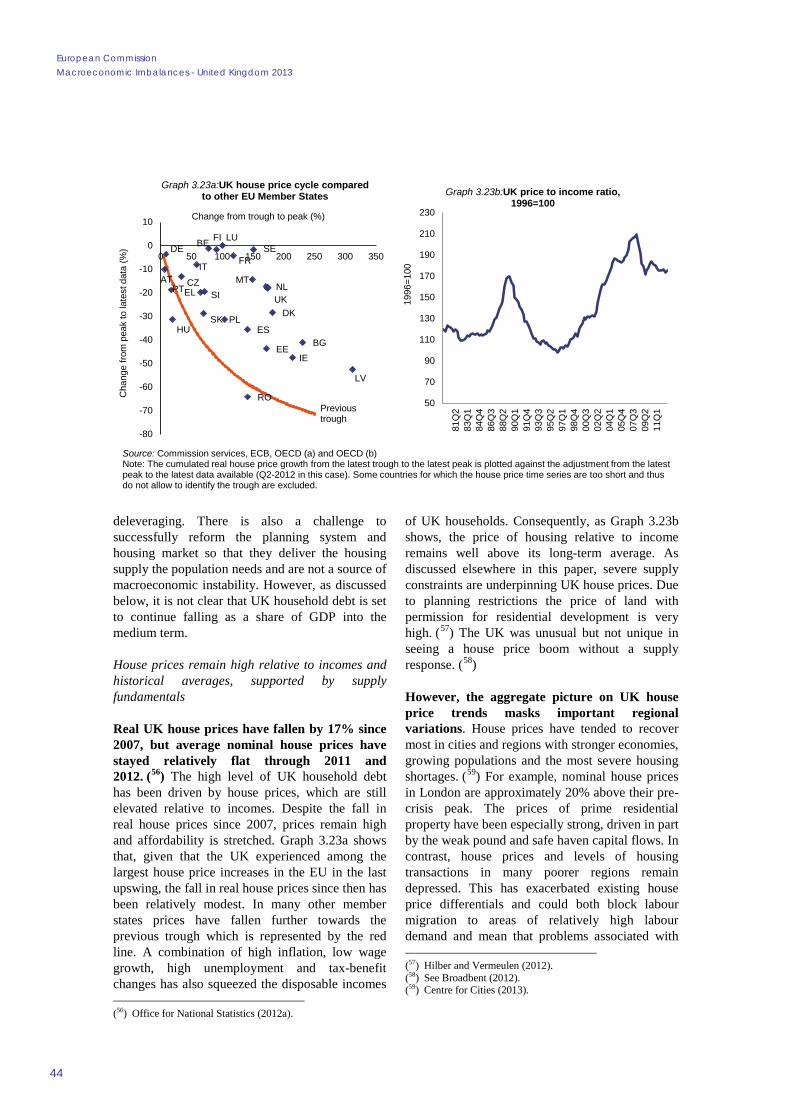
European Commission Macroeconomic Imbalances - United Kingdom 2013
44
deleveraging. There is also a challenge to successfully reform the planning system and housing market so that they deliver the housing supply the population needs and are not a source of macroeconomic instability. However, as discussed below, it is not clear that UK household debt is set to continue falling as a share of GDP into the medium term.
House prices remain high relative to incomes and historical averages, supported by supply fundamentals
Real UK house prices have fallen by 17% since 2007, but average nominal house prices have stayed relatively flat through 2011 and 2012. (56) The high level of UK household debt has been driven by house prices, which are still elevated relative to incomes. Despite the fall in real house prices since 2007, prices remain high and affordability is stretched. Graph 3.23a shows that, given that the UK experienced among the largest house price increases in the EU in the last upswing, the fall in real house prices since then has been relatively modest. In many other member states prices have fallen further towards the previous trough which is represented by the red line. A combination of high inflation, low wage growth, high unemployment and tax-benefit changes has also squeezed the disposable incomes (56) Office for National Statistics (2012a).
of UK households. Consequently, as Graph 3.23b shows, the price of housing relative to income remains well above its long-term average. As discussed elsewhere in this paper, severe supply constraints are underpinning UK house prices. Due to planning restrictions the price of land with permission for residential development is very high. (57) The UK was unusual but not unique in seeing a house price boom without a supply response. (58)
However, the aggregate picture on UK house price trends masks important regional variations. House prices have tended to recover most in cities and regions with stronger economies, growing populations and the most severe housing shortages. (59) For example, nominal house prices in London are approximately 20% above their pre-crisis peak. The prices of prime residential property have been especially strong, driven in part by the weak pound and safe haven capital flows. In contrast, house prices and levels of housing transactions in many poorer regions remain depressed. This has exacerbated existing house price differentials and could both block labour migration to areas of relatively high labour demand and mean that problems associated with (57) Hilber and Vermeulen (2012). (58) See Broadbent (2012). (59) Centre for Cities (2013).
50
70
90
110
130
150
170
190
210
230
81Q
283
Q1
84Q
486
Q3
88Q
290
Q1
91Q
493
Q3
95Q
297
Q1
98Q
400
Q3
02Q
204
Q1
05Q
407
Q3
09Q
211
Q1
1996
=100
Graph 3.23b:UK price to income ratio, 1996=100
BEDE
IE
EL
ES
FRIT
LU
MTNL
ATPT SI
SK
FI
BG
CZ
DK
EE
LV
HUPL
RO
SE
UK
-80
-70
-60
-50
-40
-30
-20
-10
0
10
0 50 100 150 200 250 300 350
Cha
nge
from
pea
k to
late
st d
ata
(%)
Change from trough to peak (%)
Graph 3.23a:UK house price cycle compared to other EU Member States
Previous trough
Source: Commission services, ECB, OECD (a) and OECD (b)Note: The cumulated real house price growth from the latest trough to the latest peak is plotted against the adjustment from the latest peak to the latest data available (Q2-2012 in this case). Some countries for which the house price time series are too short and thus do not allow to identify the trough are excluded.
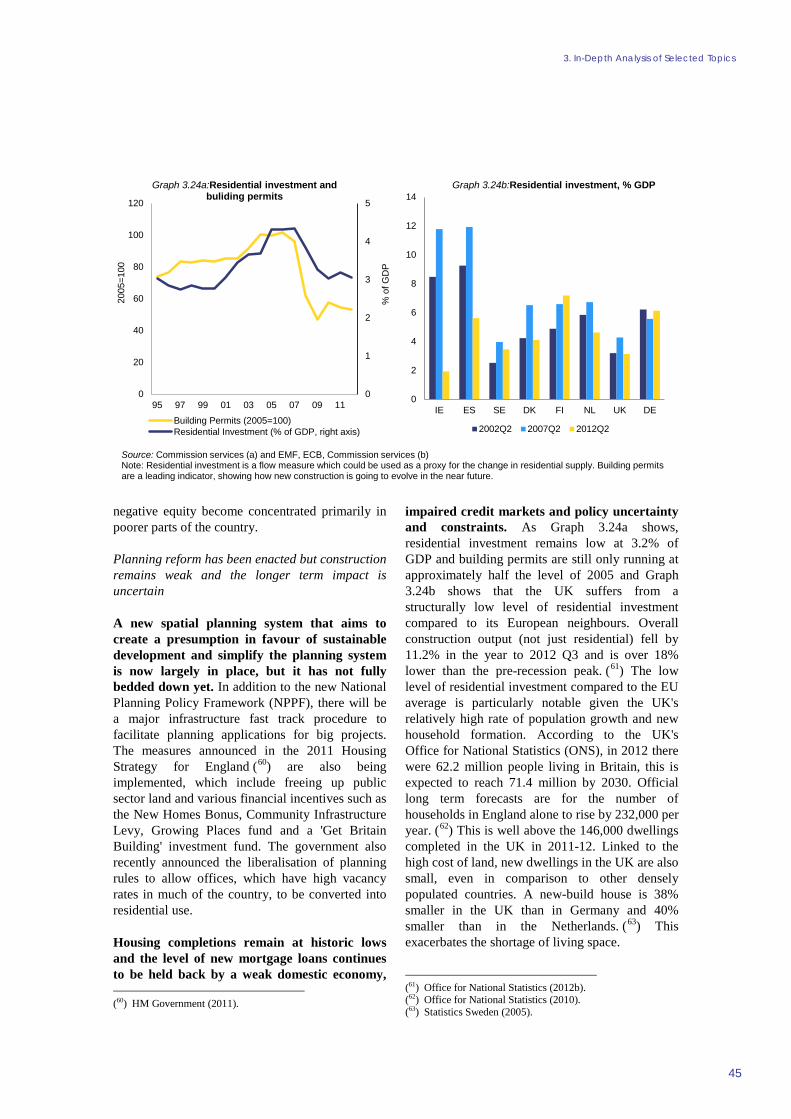
3. In-Depth Analysis of Selected Topics
45
negative equity become concentrated primarily in poorer parts of the country.
Planning reform has been enacted but construction remains weak and the longer term impact is uncertain
A new spatial planning system that aims to create a presumption in favour of sustainable development and simplify the planning system is now largely in place, but it has not fully bedded down yet. In addition to the new National Planning Policy Framework (NPPF), there will be a major infrastructure fast track procedure to facilitate planning applications for big projects. The measures announced in the 2011 Housing Strategy for England (60) are also being implemented, which include freeing up public sector land and various financial incentives such as the New Homes Bonus, Community Infrastructure Levy, Growing Places fund and a 'Get Britain Building' investment fund. The government also recently announced the liberalisation of planning rules to allow offices, which have high vacancy rates in much of the country, to be converted into residential use.
Housing completions remain at historic lows and the level of new mortgage loans continues to be held back by a weak domestic economy, (60) HM Government (2011).
impaired credit markets and policy uncertainty and constraints. As Graph 3.24a shows, residential investment remains low at 3.2% of GDP and building permits are still only running at approximately half the level of 2005 and Graph 3.24b shows that the UK suffers from a structurally low level of residential investment compared to its European neighbours. Overall construction output (not just residential) fell by 11.2% in the year to 2012 Q3 and is over 18% lower than the pre-recession peak. (61) The low level of residential investment compared to the EU average is particularly notable given the UK's relatively high rate of population growth and new household formation. According to the UK's Office for National Statistics (ONS), in 2012 there were 62.2 million people living in Britain, this is expected to reach 71.4 million by 2030. Official long term forecasts are for the number of households in England alone to rise by 232,000 per year. (62) This is well above the 146,000 dwellings completed in the UK in 2011-12. Linked to the high cost of land, new dwellings in the UK are also small, even in comparison to other densely populated countries. A new-build house is 38% smaller in the UK than in Germany and 40% smaller than in the Netherlands. (63) This exacerbates the shortage of living space.
(61) Office for National Statistics (2012b). (62) Office for National Statistics (2010). (63) Statistics Sweden (2005).
0
1
2
3
4
5
0
20
40
60
80
100
120
95 97 99 01 03 05 07 09 11
% o
f GD
P
2005
=100
Graph 3.24a:Residential investment and buliding permits
Building Permits (2005=100)Residential Investment (% of GDP, right axis)
0
2
4
6
8
10
12
14
IE ES SE DK FI NL UK DE
Graph 3.24b:Residential investment, % GDP
2002Q2 2007Q2 2012Q2
Source: Commission services (a) and EMF, ECB, Commission services (b)Note: Residential investment is a flow measure which could be used as a proxy for the change in residential supply. Building permits are a leading indicator, showing how new construction is going to evolve in the near future.
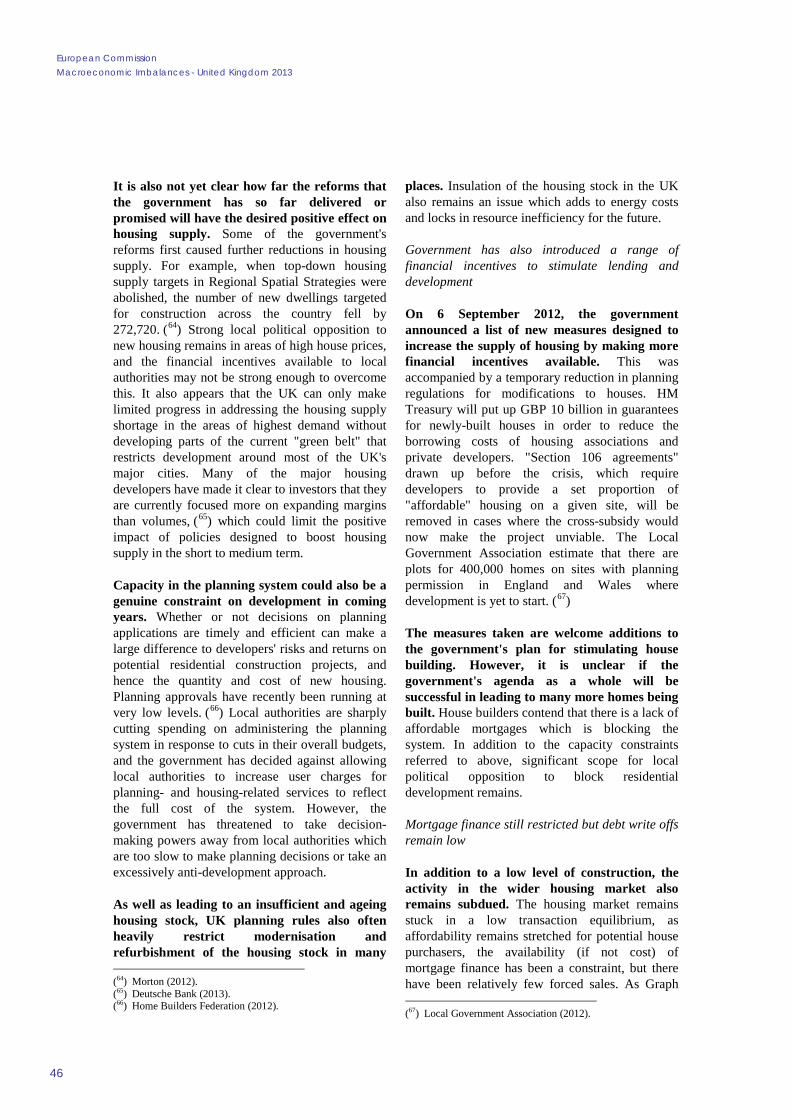
European Commission Macroeconomic Imbalances - United Kingdom 2013
46
It is also not yet clear how far the reforms that the government has so far delivered or promised will have the desired positive effect on housing supply. Some of the government's reforms first caused further reductions in housing supply. For example, when top-down housing supply targets in Regional Spatial Strategies were abolished, the number of new dwellings targeted for construction across the country fell by 272,720. (64) Strong local political opposition to new housing remains in areas of high house prices, and the financial incentives available to local authorities may not be strong enough to overcome this. It also appears that the UK can only make limited progress in addressing the housing supply shortage in the areas of highest demand without developing parts of the current "green belt" that restricts development around most of the UK's major cities. Many of the major housing developers have made it clear to investors that they are currently focused more on expanding margins than volumes, (65) which could limit the positive impact of policies designed to boost housing supply in the short to medium term.
Capacity in the planning system could also be a genuine constraint on development in coming years. Whether or not decisions on planning applications are timely and efficient can make a large difference to developers' risks and returns on potential residential construction projects, and hence the quantity and cost of new housing. Planning approvals have recently been running at very low levels. (66) Local authorities are sharply cutting spending on administering the planning system in response to cuts in their overall budgets, and the government has decided against allowing local authorities to increase user charges for planning- and housing-related services to reflect the full cost of the system. However, the government has threatened to take decision-making powers away from local authorities which are too slow to make planning decisions or take an excessively anti-development approach.
As well as leading to an insufficient and ageing housing stock, UK planning rules also often heavily restrict modernisation and refurbishment of the housing stock in many (64) Morton (2012). (65) Deutsche Bank (2013). (66) Home Builders Federation (2012).
places. Insulation of the housing stock in the UK also remains an issue which adds to energy costs and locks in resource inefficiency for the future.
Government has also introduced a range of financial incentives to stimulate lending and development
On 6 September 2012, the government announced a list of new measures designed to increase the supply of housing by making more financial incentives available. This was accompanied by a temporary reduction in planning regulations for modifications to houses. HM Treasury will put up GBP 10 billion in guarantees for newly-built houses in order to reduce the borrowing costs of housing associations and private developers. "Section 106 agreements" drawn up before the crisis, which require developers to provide a set proportion of "affordable" housing on a given site, will be removed in cases where the cross-subsidy would now make the project unviable. The Local Government Association estimate that there are plots for 400,000 homes on sites with planning permission in England and Wales where development is yet to start. (67)
The measures taken are welcome additions to the government's plan for stimulating house building. However, it is unclear if the government's agenda as a whole will be successful in leading to many more homes being built. House builders contend that there is a lack of affordable mortgages which is blocking the system. In addition to the capacity constraints referred to above, significant scope for local political opposition to block residential development remains.
Mortgage finance still restricted but debt write offs remain low
In addition to a low level of construction, the activity in the wider housing market also remains subdued. The housing market remains stuck in a low transaction equilibrium, as affordability remains stretched for potential house purchasers, the availability (if not cost) of mortgage finance has been a constraint, but there have been relatively few forced sales. As Graph (67) Local Government Association (2012).
3. In-Depth Analysis of Selected Topics
47
3.25a shows, the number of loans for house purchase has been quite stable for the last three years, at less than half the rate before the crisis. The rate of re-mortgaging remains flat, at a fraction of the levels seen before the crisis. There has also been a decrease in households trading down, possibly reflecting the low transaction equilibrium in which the housing market has been. There is some evidence that the cost of new mortgages is starting to fall and the availability of mortgages with loan-to-value (LTV) ratios of over 75% to increase, (68) possibly in part due to the impact of the FLS. However, the vast majority of mortgages are still at an LTV of less than 90%, and 65% are at an LTV of less than 75%. (69) At the end of 2011, the Financial Services Authority (FSA) announced its Mortgage Market Review which aims to deter risky mortgage lending and ensure the sustainability of the mortgage market. A policy statement (70) was announced in October 2012 with most of the changes coming into effect in April 2014. The main changes are that lenders are fully responsible for determining the customers’ affordability even if an intermediary is used, affordability assessments should allow for interest rate increases and interest-only loans should only be available where there is a credible strategy for repaying the mortgage.
(68) Bank of England (2012d). (69) Financial Services Authority (2012b). (70) Financial Services Authority (2012a).
While the rate of mortgage arrears and house repossessions did rise after the onset of the crisis, they remain quite low. As shown in Graph 3.25b, a little more of than 1% of mortgages are in arrears and the annual repossession rate is below 0.5%. Both arrears and repossessions have remained much lower than the levels they reached in the early to mid-1990s, when interest rates were much higher. The Council of Mortgage Lenders (71) forecasts arrears and repossessions to rise only very slightly over the next two years, during which time interest rates are expected to remain low (see Graph 3.32b). As discussed in Section 3.2.3, there are risks that rising interest rates, higher unemployment or possibly a house price crash could lead to a less benign outcome.
Average interest costs fell in the crisis, and most mortgages are now variable rate, but rates for high LTV loans are much higher
Average mortgage costs fell following the base rate fall, then stabilised, but a minority of borrowers are trapped on high rates. When the Bank of England cut the base rate sharply at the onset of the crisis, from 5.75 in July 2007 to 0.5 in March 2009 where it has since remained, the gap between the average interest rate paid on mortgages and the base rate increased sharply, even as average mortgage rates fell. Before 2008, almost no mortgage holders paid more than 2 pp. above the base rate, but since 2009 nearly half (71) Council of Mortgage Lenders (2012).
0
20
40
60
80
100
120
140
Jan
07
Jul 0
7
Jan
08
Jul 0
8
Jan
09
Jul 0
9
Jan
10
Jul 1
0
Jan
11
Jul 1
1
Jan
12
Jul 1
2
Thou
sand
s
Graph 3.25a:Approvals of loans secured on dwellings
House purchase Remortgaging
0
0.1
0.2
0.3
0.4
0.5
0.6
0.7
0.8
0.9
0.0
0.5
1.0
1.5
2.0
2.5
3.0
3.5
4.0
90 91 92 93 94 95 96 97 98 99 00 01 02 03 04 05 06 07 08 09 10 11
Per
cen
t
Graph 3.25b:Mortgage arrears and repossession rates
Mortgage arrears (lhs)Properties taken into possession (rhs)
Source: Bank of England (a) and Department for Communities and Local Government (b)

European Commission Macroeconomic Imbalances - United Kingdom 2013
48
have been paying more than 3 pp. above base rate. (72) Initially, this was largely due to a substantial apportion of mortgage holders being on fixed rates with interest rates dating from pre-crisis conditions. As these fixed rate deals gradually expire, mortgage holders may either move onto a variable rate or sign up for another fixed rate deal at lower post-crisis interest rates. The proportion of mortgage holders who are currently on a variable rate has increased from approximately half at the onset of the crisis to more than 70%. (73)
However, there has also been the growth of a "dual" mortgage market where those taking out new mortgages with a large deposit pay a much lower interest rate than people with a high LTV, whether for new or older mortgages. As shown in Graph 3.26, banks have been increasing their standard variable rates (SVRs), which a growing proportion of mortgage holders are on, although the FLS may help to halt or partially reverse this trend. Many people with a high LTV loan are unable to re-mortgage because they are seen as too risky to be accepted by other lenders and are therefore effectively "trapped" on the existing SVR. Most of these mortgage holders would not be eligible for the various government policies to aid first time buyers, purchases of new houses or loans for other new mortgages. A higher cost and restricted availability for high LTV mortgages is justified by the greater risk and the need for banks to hold more capital against them, but the continued rise on SVRs could also be a reflection of an appreciation by the banks that they have a captive market.
(72) Financial Services Authority (2012). (73) Financial Services Authority (2012).
A rise in household saving has not translated into more "active" deleveraging by mortgage holders
The household savings rate picked up sharply from historically low levels in the pre-crisis years (below 2% of GDP in 2007) as households increased their precautionary saving and began deleveraging from high levels of cumulated debt. Although the savings rate rose rapidly during the recent crisis, it had until recently remained lower than in the aftermath of the recessions of the 1980s and 1990s, as shown in Graph 3.27. The household savings rate picked up to 7.7% in the third quarter of 2012, aided by stronger growth in total household incomes and continued precautionary saving in an uncertain macroeconomic environment. Many households that are not currently home owners are also likely to have increased their saving on the expectation that they will now need to accumulate a larger deposit before they can obtain a mortgage.
0
1
2
3
4
5
6
7
8
9
Jan
05Ju
l 05
Jan
06Ju
l 06
Jan
07Ju
l 07
Jan
08Ju
l 08
Jan
09Ju
l 09
Jan
10Ju
l 10
Jan
11Ju
l 11
Jan
12Ju
l 12
per c
ent
Graph 3.26:Quoted interest rates on fixed rate and floating rate mortgages
Standard variable rate90% loan to value, two-year fixed(b)75% loan to value, two-year fixed75% loan to value, five-year fixedBank Rate
Source: Bank of England

3. In-Depth Analysis of Selected Topics
49
Despite a higher saving rate, the rate of "active" deleveraging by households making repayments over and above regular mortgage servicing requirements does not appear to have risen. (74) Although debt servicing costs having fallen significantly for many borrowers, falling real wages and an increased risk of unemployment have placed pressure on the finances of many households. Unlike many other countries, mortgage interest is not tax-deductible in the UK so there is no explicit tax incentive to avoid paying off mortgages early.
Unsecured lending has stretched the finances of a minority of households
The stock of non-secured lending is limited in aggregate, but it contributes to financial pressure on poorer households. Lower income households spend a larger proportion of their incomes on debt repayments, although they are less likely than higher-income households to be home owners. (75) Households with debt in the bottom decile have four times their annual income in debt and pay 47% of their gross monthly income in servicing this debt. Low income households instead tend to have more unsecured debt, which is usually subject to higher interest rates in part because it does not have property as collateral. A 2011 NMG Consulting Survey found that of unsecured borrowers benefiting from some form of (74) Reinold (2011). (75) Whittaker (2012).
forbearance, 47% said that they would be behind on their debt repayments without the forbearance and that another 31% would only be able to keep up payments with difficulty. (76) Only 28% of secured borrowers receiving forbearance said they would be behind with their payments without the forbearance, even though their debts tend to be larger.
High housing costs also put pressure on tenants, and renting is not seen as a desirable long term option
The UK home ownership rate has been falling for the last decade as an increasing number of households have been priced out of home ownership. The home ownership rate has fallen from 70% in 2002 to 65% in 2011, while the proportion of households renting privately has increased from 10% to 17% over the same period. (77) While there have been some recent signs of a pick-up in mortgage market activity, much of this appears to be for prime and buy-to-let lending. (78) The private rented sector in the UK is dominated by short term, unsecure tenancies. (79) Tenancy agreements tend to set for a relatively short fixed period, following which they revert to a rolling basis (running on a week-to-week or month-to-month basis). Notice is usually given on a one to six month basis. One reason for the flexibility and dominance of short term tenancies in the private rental market renting is that it has generally seen as a temporary solution with most people having the aim of buying their own house at some point in the future.
On average it is tenants not home owners who have the highest housing costs relative to incomes. Graph 3.28 shows that the rate of home ownership in the UK is similar to the euro area average, although home ownership has been falling in the UK. The average housing cost overburden rate (80) for UK owner-occupiers in 2008-2010 was only 10.6%, also similar to the euro zone average, although this is currently being (76) Bank of England (2012a). (77) Department for Communities and Local Government
(2012). (78) Bank of England (2013a). (79) Shelter (2012). (80) The housing cost overburden rate is the % of the
population living in households where the total housing costs ('net' of housing allowances) represent more than 40 % of disposable income ('net' of housing allowances).
HH disposable
income (rhs)
Savings rate
-6
-4
-2
0
2
4
6
8
10
12
14
16
-6
-4
-2
0
2
4
6
8
10
12
14
16
09Q1 09Q3 10Q1 10Q3 11Q1 11Q3 12Q1 12Q3
% y
oy
% G
DP
Graph 3.27:Savings rate and growth in real household disposable income
Early '80s recession savings, 80Q1-83Q2Early '90s recession savings, 90Q2-93Q3
Source: Office for National Statistics
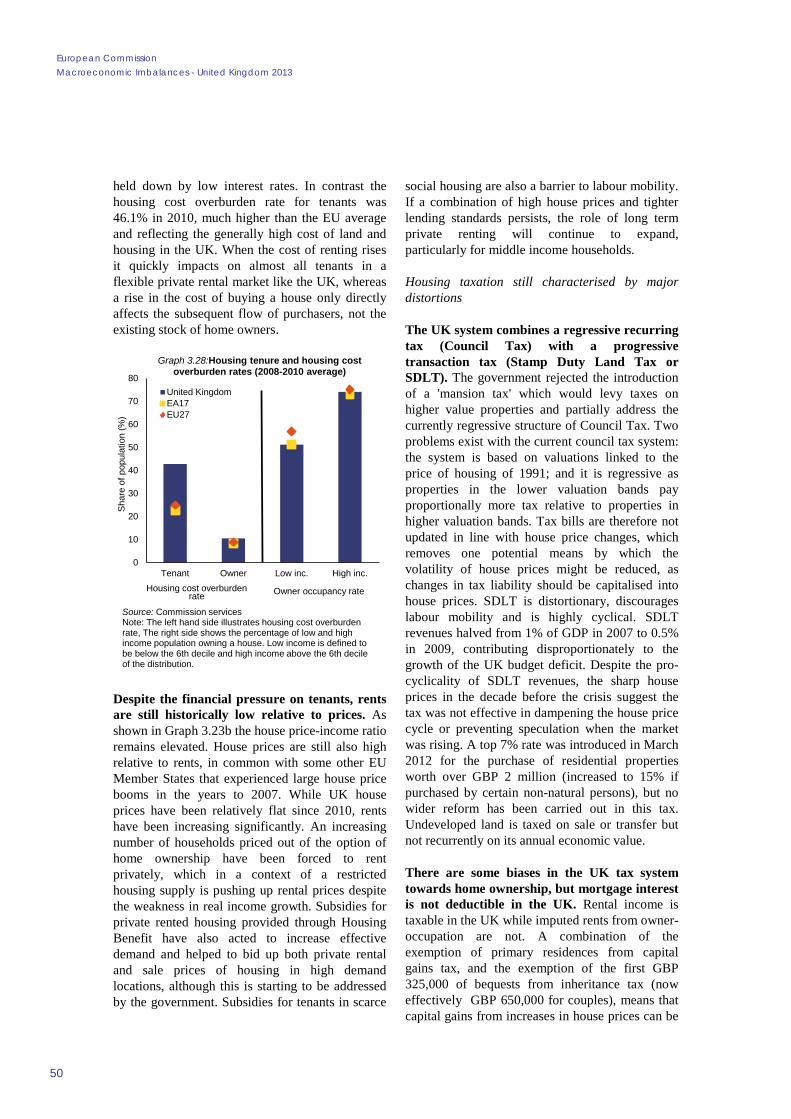
European Commission Macroeconomic Imbalances - United Kingdom 2013
50
held down by low interest rates. In contrast the housing cost overburden rate for tenants was 46.1% in 2010, much higher than the EU average and reflecting the generally high cost of land and housing in the UK. When the cost of renting rises it quickly impacts on almost all tenants in a flexible private rental market like the UK, whereas a rise in the cost of buying a house only directly affects the subsequent flow of purchasers, not the existing stock of home owners.
Despite the financial pressure on tenants, rents are still historically low relative to prices. As shown in Graph 3.23b the house price-income ratio remains elevated. House prices are still also high relative to rents, in common with some other EU Member States that experienced large house price booms in the years to 2007. While UK house prices have been relatively flat since 2010, rents have been increasing significantly. An increasing number of households priced out of the option of home ownership have been forced to rent privately, which in a context of a restricted housing supply is pushing up rental prices despite the weakness in real income growth. Subsidies for private rented housing provided through Housing Benefit have also acted to increase effective demand and helped to bid up both private rental and sale prices of housing in high demand locations, although this is starting to be addressed by the government. Subsidies for tenants in scarce
social housing are also a barrier to labour mobility. If a combination of high house prices and tighter lending standards persists, the role of long term private renting will continue to expand, particularly for middle income households.
Housing taxation still characterised by major distortions
The UK system combines a regressive recurring tax (Council Tax) with a progressive transaction tax (Stamp Duty Land Tax or SDLT). The government rejected the introduction of a 'mansion tax' which would levy taxes on higher value properties and partially address the currently regressive structure of Council Tax. Two problems exist with the current council tax system: the system is based on valuations linked to the price of housing of 1991; and it is regressive as properties in the lower valuation bands pay proportionally more tax relative to properties in higher valuation bands. Tax bills are therefore not updated in line with house price changes, which removes one potential means by which the volatility of house prices might be reduced, as changes in tax liability should be capitalised into house prices. SDLT is distortionary, discourages labour mobility and is highly cyclical. SDLT revenues halved from 1% of GDP in 2007 to 0.5% in 2009, contributing disproportionately to the growth of the UK budget deficit. Despite the pro-cyclicality of SDLT revenues, the sharp house prices in the decade before the crisis suggest the tax was not effective in dampening the house price cycle or preventing speculation when the market was rising. A top 7% rate was introduced in March 2012 for the purchase of residential properties worth over GBP 2 million (increased to 15% if purchased by certain non-natural persons), but no wider reform has been carried out in this tax. Undeveloped land is taxed on sale or transfer but not recurrently on its annual economic value.
There are some biases in the UK tax system towards home ownership, but mortgage interest is not deductible in the UK. Rental income is taxable in the UK while imputed rents from owner-occupation are not. A combination of the exemption of primary residences from capital gains tax, and the exemption of the first GBP 325,000 of bequests from inheritance tax (now effectively GBP 650,000 for couples), means that capital gains from increases in house prices can be
0
10
20
30
40
50
60
70
80
Tenant Owner Low inc. High inc.
Sha
re o
f pop
ulat
ion
(%)
Graph 3.28:Housing tenure and housing cost overburden rates (2008-2010 average)
United KingdomEA17EU27
Housing cost overburden rate Owner occupancy rate
Source: Commission servicesNote: The left hand side illustrates housing cost overburden rate, The right side shows the percentage of low and high income population owning a house. Low income is defined to be below the 6th decile and high income above the 6th decile of the distribution.
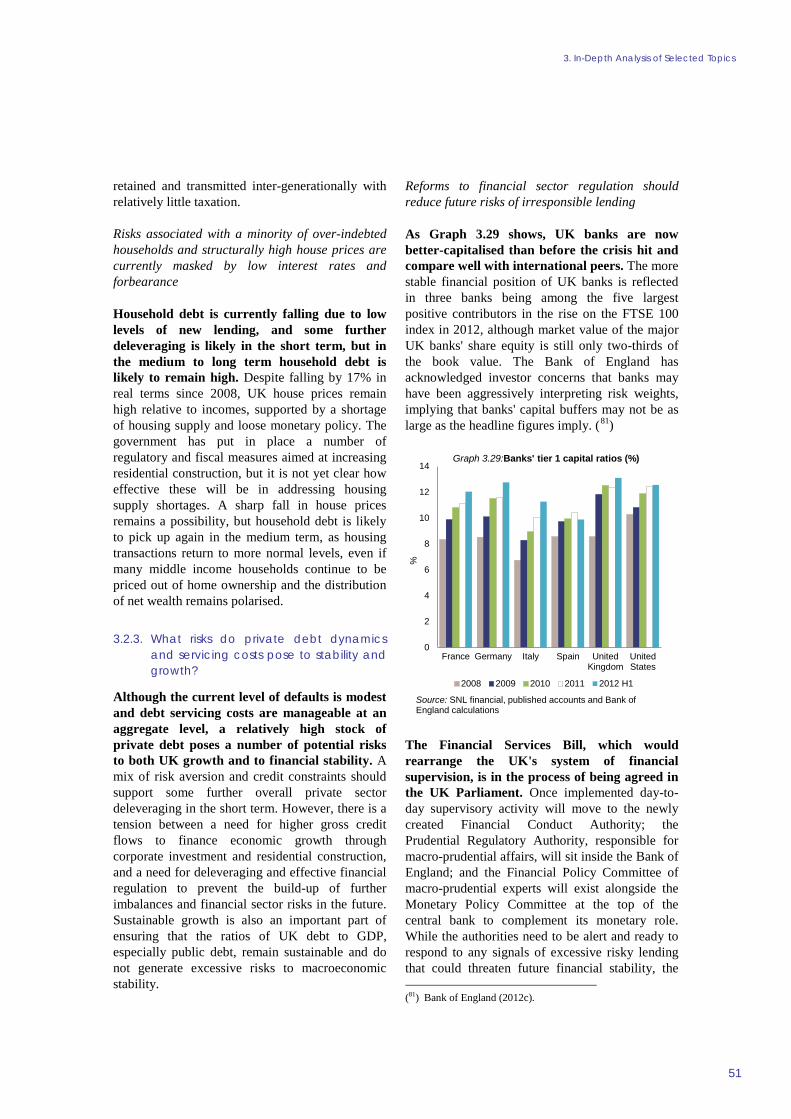
3. In-Depth Analysis of Selected Topics
51
retained and transmitted inter-generationally with relatively little taxation.
Risks associated with a minority of over-indebted households and structurally high house prices are currently masked by low interest rates and forbearance
Household debt is currently falling due to low levels of new lending, and some further deleveraging is likely in the short term, but in the medium to long term household debt is likely to remain high. Despite falling by 17% in real terms since 2008, UK house prices remain high relative to incomes, supported by a shortage of housing supply and loose monetary policy. The government has put in place a number of regulatory and fiscal measures aimed at increasing residential construction, but it is not yet clear how effective these will be in addressing housing supply shortages. A sharp fall in house prices remains a possibility, but household debt is likely to pick up again in the medium term, as housing transactions return to more normal levels, even if many middle income households continue to be priced out of home ownership and the distribution of net wealth remains polarised.
3.2.3. What risks do private debt dynamics and servicing costs pose to stability and growth?
Although the current level of defaults is modest and debt servicing costs are manageable at an aggregate level, a relatively high stock of private debt poses a number of potential risks to both UK growth and to financial stability. A mix of risk aversion and credit constraints should support some further overall private sector deleveraging in the short term. However, there is a tension between a need for higher gross credit flows to finance economic growth through corporate investment and residential construction, and a need for deleveraging and effective financial regulation to prevent the build-up of further imbalances and financial sector risks in the future. Sustainable growth is also an important part of ensuring that the ratios of UK debt to GDP, especially public debt, remain sustainable and do not generate excessive risks to macroeconomic stability.
Reforms to financial sector regulation should reduce future risks of irresponsible lending
As Graph 3.29 shows, UK banks are now better-capitalised than before the crisis hit and compare well with international peers. The more stable financial position of UK banks is reflected in three banks being among the five largest positive contributors in the rise on the FTSE 100 index in 2012, although market value of the major UK banks' share equity is still only two-thirds of the book value. The Bank of England has acknowledged investor concerns that banks may have been aggressively interpreting risk weights, implying that banks' capital buffers may not be as large as the headline figures imply. (81)
The Financial Services Bill, which would rearrange the UK's system of financial supervision, is in the process of being agreed in the UK Parliament. Once implemented day-to-day supervisory activity will move to the newly created Financial Conduct Authority; the Prudential Regulatory Authority, responsible for macro-prudential affairs, will sit inside the Bank of England; and the Financial Policy Committee of macro-prudential experts will exist alongside the Monetary Policy Committee at the top of the central bank to complement its monetary role. While the authorities need to be alert and ready to respond to any signals of excessive risky lending that could threaten future financial stability, the (81) Bank of England (2012c).
0
2
4
6
8
10
12
14
France Germany Italy Spain UnitedKingdom
UnitedStates
%
Graph 3.29:Banks' tier 1 capital ratios (%)
2008 2009 2010 2011 2012 H1
Source: SNL financial, published accounts and Bank of England calculations

European Commission Macroeconomic Imbalances - United Kingdom 2013
52
economy would also benefit from a period of regulatory stability.
In the medium term a normalisation of lending conditions could see household debt start to rise again
The insufficient and rigid supply of housing in the UK continues to expose the country to higher and volatile house prices, and consequently high household debt. As Graph 3.30 shows, the independent Office for Budget Responsibility (OBR) forecast that household debt will soon start to rise again relative to disposable incomes, although at a much less rapid rate than seen before the crisis. As discussed in Section 3.2.2, the fundamentals point to UK house prices remaining high relative to incomes, and in the short term low interest rates are supporting asset prices despite a weak domestic economy. A sustained and significant fall in household debt is only likely if both house prices fall relative to disposable income, and levels of home ownership continue to decline.
The optimal scenario for the short and long term growth and stability of the UK economy would be a gradual elimination of the housing shortage accompanied by house prices falling gradually in real terms, without sharp nominal price falls. However, as discussed above, it is unclear how far housing supply will expand, and UK house prices have historically been unstable. Rapid house price falls would risk pushing many households into negative equity and create
negative wealth effects. In contrast, significant house price rises would increase risks to macroeconomic stability while also pushing up household debt levels.
If credit is too tight it could harm the prospects for addressing the UK's investment deficit
The UK also has a need for increased investment, which would not be helped by rapid deleveraging or tight credit conditions. The challenge must be balanced with the need to reduce the risk of future debt-related instability in the UK macroeconomy. An unprecedented drop in business investment after 2007 saw the UK level of gross fixed capital formation as a share of GDP fall to 14.3% in 2011, the third lowest level in the EU-27. All types of private investment (business, residential and infrastructure) continue to be very weak in the UK.
This is holding back short-term growth, preventing the "rebalancing" of the UK economy from consumption and debt towards investment and net exports, and exacerbating existing weaknesses (of low capital stock, housing shortage and inadequate and congested infrastructure). The UK also risks losing the capacity to cost-effectively ramp up investment later if a combination of weak demand and tight credit conditions continues to drive low investment and a loss of construction capacity. UK investment needs in transport and energy infrastructure, and related government initiatives, are discussed in Section 3.1.2.
There are specific issues with the structure of the residential construction market and the incentives for developers that may be reducing the response of housing supply to market signals and to housing policy. As land is expensive and developers typically purchase the land on which they subsequently build, a large part of developers' profitability rests on how successfully they play the land market and negotiate the planning system. This creates significant barriers to entry but also often creates incentives for developers to hang on to undeveloped land with planning permission, rather than building on it as soon as possible, either in the hope of future price rises or in order to avoid having to write down the value of land bought in the run up to the crisis when land prices were
0%
20%
40%
60%
80%
100%
120%
140%
160%
180%
200%
0
200
400
600
800
1,000
1,200
1,400
1,600
1,800
2,000
1988
Q1
1990
Q1
1992
Q1
1994
Q1
1996
Q1
1998
Q1
2000
Q1
2002
Q1
2004
Q1
2006
Q1
2008
Q1
2010
Q1
2012
Q1
2014
Q1
2016
Q1
2018
Q1
Graph 3.30:UK household debt: 2009-2017
Household Liabilities (£bn) % Disposable Income (rhs)
Source: Office for Budget Responsibility

3. In-Depth Analysis of Selected Topics
53
higher than they are now. (82) It is currently the stated policy of most major residential developers to build margins rather than market share, which risks diverting government subsidies into the profits of developers or into higher house prices, rather than into a net increase in housing supply. Developers' share prices have recently increased significantly without an increase in construction volumes. (83) Developers have also expressed concerns that increased capital requirements for bank financing commercial real estate could reduce new development in that sector. (84)
Excessive and prolonged forbearance could harm stability and growth
One of the aims of loose monetary policy is to aid short-term growth by preventing excessively rapid deleveraging in the short term, but this risks harming the functioning of the economy if it persists for too long. In particular, in a climate of low interests rates and incentives for banks to delay calling in or writing down loans that are unlikely to be paid back, there is a risk that large parts of banks' loan books become "ossified", crowding out new lending, and that bank balance sheets continue to carry hidden risks. As discussed above, the data suggest that turnover in the loans stock is low and falling, driven by a weakness in new lending. (85)
There is some evidence of "zombie" firms which continue operating despite having little prospect of paying off their stock of debt, aided by a low interest environment. R3, the insolvency industry trade body, found that 160,000 companies are only able to pay the interest on their debt but do not see a prospect of being able to pay back the principal, and the number is rising. (86) Corporate insolvencies have remained low in the UK, despite more firms reporting that they are loss-making, as shown in Graph 3.31. If banks are seeking to reduce their balance sheets but hesitating to recognise losses from a potentially stale stock of debt, it could both store up risks to financial stability and prevent credit from being reallocated to more dynamic and productive sectors of the economy. It could also contribute to (82) Morton (2012a). (83) Financial Time (2013b). (84) Financial Times (2013a). (85) Bank of England (2013b). (86) R3 (2013).
low productivity as weaker firms fail to exit the market. Evidence from the ONS (87) shows a widening of the dispersion of productivity performance across firms in 2008 and 2009, with a possible weakening of competitive pressure contributing to this. More recent data on firm level productivity is not available but in a climate of weak growth, weak investment and low insolvencies, it is likely that high firm-level dispersion of productivity has persisted.
There is also a risk that access to finance policies could subsidise increased bank profits or private sector gearing more than growth
Access to finance policies need to be carefully designed and monitored to ensure they benefit investment and growth without increasing potential macroeconomic instability or subsidising banks or healthy firms. The FLS is incentivised by scale but not by sector or firm size. There is a risk that individual banks and building societies take advantage of the scheme without actually increasing their lending to credit constrained firms.
If housing supply remains constrained there is also a risk that the FLS ends up channelling money into bank margins, wealthier households or inflating the price of existing housing. Mortgage lending on existing houses is included in the FLS, not just lending to finance construction or business investment. It is therefore at least as much (87) Field and Franklin (2013).
0
5
10
15
20
25
30
35
0
5
10
15
20
25
30
35
1984
1988
1992
1996
2000
2004
2008
2012
Num
ber o
f liq
uida
tions
per
yea
r ('0
00)
per c
ent
Graph 3.31:Company liquidations in England and Wales and an estimate of loss-making
companies
Loss-making companies (lhs)Company liquidations (rhs)
Source: Bureau van Dijk, The Insolvency Service and Bank of England calculationsNote: 2012 figure estimated based on data for Q1 and Q2

European Commission Macroeconomic Imbalances - United Kingdom 2013
54
of a demand side as a supply side policy operating in a market with constrained supply. On the one hand, there are currently relatively few attractive investment options for households, and property retains a number of tax advantages, as set out in Section 3.1.2 Bank of England evidence (88) suggests banks are looking to expand their volume of secured lending but are reluctant to loosen the scoring criteria that have limited loan availability to households without large deposits. On the other hand, the FLS and other drivers of lower bank funding costs do appear to be leading to reductions in the cost of credit for less risky borrowers, which may lead to either an increase in remortgaging or bidding up the prices that the existing pool of eligible borrowers are able to pay for housing.
A rise in interest rates could cause a shake out of non-performing loans and hit the macroeconomy, but does not look imminent
Write-offs of all forms of debt rose after the onset of the crisis as shown in Graph 3.32a, though much less for mortgages than other forms of debt. While the fall in interest rates in 2008-2009 reduced debt servicing costs for most borrowers significantly, a moderate increase in insolvencies and unemployment led to unavoidable defaults. Write-offs rose most for consumer credit, where as discussed in Section 3.2.2, a minority of households have very high debt servicing costs although consumer credit is a small share of (88) Bank of England (2012a).
overall lending and poses limited risks to financial and macroeconomic stability. Despite forbearance, the defaults rate on NFC loans has also risen. Given forecasts that the UK economic recovery will continue to be muted, the Bank of England is not expected to significantly increase the base rate for some time. As shown in Graph 3.32b market expectations are that the bank base rate will still be below 1% until 2015. There are however two potential risks from the high private debt stock when interest rates do rise. If interest rates rose sharply, it would risk making the interest burdens of large numbers of households and businesses unsustainable, as happened when official interest rates peaked in the early 1990s. This could generate business insolvencies, repossessions and significant losses for the banking system. A large stock of variable rate private debt also means that the sensitivity of aggregate debt servicing costs as a share of GDP to interest rate changes has increased.
Mortgage defaults have been modest to date but could increase in the future if unemployment or interest rates rise. As discussed in Section 3.2.2, mortgage arrears and defaults have remained relatively low since the crisis, in contrast with some other European countries that saw housing market busts. Real wages have been weak but most people who remain in work have been able to meet mortgage repayments, which have often fallen significantly as a result of lower interest rates. Except for the depths of the recession, redundancies have not been especially high. On the
-1
0
1
2
3
4
5
6
7
8
93Q
494
Q4
95Q
496
Q4
97Q
498
Q4
99Q
400
Q4
01Q
402
Q4
03Q
404
Q4
05Q
406
Q4
07Q
408
Q4
09Q
410
Q4
11Q
4
per c
ent
Graph 3.32a:Write off rates on lending to UK businesses and individuals
Businesses(b) Mortgages Consumer credit
0
1
2
3
4
5
6
7
99 00 01 02 03 04 05 06 07 08 09 10 11 12 13 14 15 16%
Graph 3.32b:Bank of England base rate and forward market expectations
BoE Base Rate Forward market interest rates
Source: Bank of England (a) and Bank of England and Bloomberg (b)

3. In-Depth Analysis of Selected Topics
55
whole, it is the youth and those who are currently excluded from the option of home ownership who have been hit hardest by the recession and muted recovery. Fewer existing homeowners have suffered from long term unemployment. However, if unemployment does rise overall it could lead to increased mortgage defaults. While interest rates may not rise until the economy and labour market are strengthening, households whose income has fallen permanently as a result of the crisis may get into difficulty when interest rates rise back towards historical norms. This may for example include people who lost their previous job and have had to move into a lower paying sector or post, or households that have moved from having two earners to one earner. Households with high LTVs who are stuck on standard variable rates with limited scope to remortgage could be especially vulnerable.
3.2.4. Conclusions
The level of household debt remains high and constitutes an imbalance. There has been some progress in deleveraging in both the corporate and household sectors but there is a tension between needs for further deleveraging and for improved access to credit to fuel an investment-led recovery. Aggregate debt service costs are sustainable at current low interest rates thus short term pressures are low, but the high stock of household debt poses potential risks to both UK growth and to financial stability when interest rates rise. To date household deleveraging has been driven more by a low level of new lending than by an increase in the rate at which existing debt stocks are paid or written off. The financial sector has returned to relative stability following the crisis and, although large, the balance sheets of UK banks are not expanding rapidly. There is a tension between a need for higher gross credit flows to finance economic growth through corporate investment and residential construction, and a need for deleveraging and effective financial regulation to prevent the maintenance and future build-up of imbalances and financial sector risks. Low interest rates have partially masked the issue of a significant minority of very highly indebted households, and there is a risk of a sharp increase in mortgage arrears if official or effective interest rise significantly, or unemployment rises. Overall, it is currently unlikely that households will in aggregate see sustained strong deleveraging.


4. POLICY CHALLENGES
57
The analysis in Sections 2 and 3 indicates that developments in external competitiveness and the need for both deleveraging and safeguarding financial stability, without unduly hampering growth, are the main challenges relating to macroeconomic imbalances in the UK.
It should be recalled that these challenges were identified under the MIP in the first IDR and relevant policy responses were reflected and integrated in the country-specific recommendations issued for the UK in July 2012. The assessment of progress in the implementation of those recommendations will take place in the context of the assessment of the UK National Reform Programme and Convergence Programme under the 2013 European Semester. Against this background, this section discusses different avenues that could be envisaged to address the challenges identified in this IDR.
Concerning the challenge of improving external competitiveness, a number of different avenues can be considered as regards:
Investment in infrastructure: as set out in this review and in line with Council recommendations issued in 2012 (89), there is significant scope for the UK to improve its transport infrastructure by addressing shortages in airport and seaport capacity, tackling road congestion and upgrading its rail network. In the first instance, this would entail meeting the substantial transport infrastructure investment needs indicated in the National Infrastructure Plan 2011, much of which are currently unfunded, by identifying additional sources of funding, addressing high unit costs in transport in the UK, and removing regulatory barriers to investment. In order to reconcile the need for increased investment in infrastructure with the budgetary constraints arising from consolidation needs, the UK authorities could endeavour to harness private funding by introducing user pricing schemes where appropriate, and by relying on the strength of the government's balance sheet to provide guarantees. Careful design and implementation of such schemes is crucial to safeguard their value for money. This would call for a clear division of risks (89) The Council recommendations mentioned in this section
refer to Recommendation 2012/C 219/27 as published in the Official Journal of the European Union.
between public and private sectors, and an avoidance of other deficiencies identified in previous private finance initiatives.
Skill gaps: exporters require a labour force with the right skills. Intermediate and advanced technical skills are an area where evidence suggests that gaps and recruitment difficulties persist. As set out in this review, labour productivity growth in manufacturing has been slow in the UK and lags behind that of other advanced economies. Effective implementation of the national apprenticeship programme could help close the skills gap. This would require apprenticeships to be high quality and to equip participants with the skills needed by the tradable sectors of the economy. There is scope for further cooperation between the Government and employers to increase the number of apprenticeships and foster work-based experience. Appropriately addressing the related 2012 Council recommendation on young people's skills and early school leaving (which is comparatively high in the UK) would also contribute positively in this regard. Finally, reinforcing the role of science, engineering and foreign languages in educational curricula could also help the educational system meet the needs of employers, in particular in export-oriented sectors.
Access to finance: difficulties in accessing finance are a cross-cutting problem at the current juncture, particularly for smaller and younger companies. They could be addressed at an economy-wide level, as well as with regard to the specific financing instruments for exporting companies. The UK authorities have implemented a number of initiatives which respond to the 2012 Council recommendations on access to finance. Some of these initiatives are still embryonic, such as the British Business Bank and, as discussed below, the Funding for Lending Scheme (FLS). Overall, cross-cutting measures promoting access to finance can foster entry into, and expansion of, the exporting sector, which has become more attractive following the post-crisis depreciation of sterling. Measures promoting financing instruments that are specific to the exporting sector could also be strengthened, subject to state aid rules.

European Commission Macroeconomic Imbalances - United Kingdom 2013
58
Other elements: the external performance of the UK economy is affected by a multitude of other factors, some of which can be shaped by policy action. The geographical composition of UK exports continues to reorient itself towards faster-growing markets, and the initiatives of government bodies such as UK Trade and Investment can continue to have positive effects in this regard. There is also scope to further reinforce the links between the strong UK research base and industrial sectors. Finally, the UK witnessed strong unit labour cost (ULC) dynamics in the pre-crisis years. In order to maintain the price competitiveness of the UK economy, it is desirable that ULC growth does not outpace productivity gains.
Concerning the challenge linked to the needs for deleveraging, maintaining financial stability and avoiding unduly compromising investment and growth, there are a number of issues that can be considered:
Increasing residential construction: alleviating the housing shortage over the medium term would reduce the risk of imbalances related to high house prices and consequently household debt persisting into the long term. This could be achieved by a combination of ensuring that interpretation of the new planning system is clear and that it is effectively resourced, further simplifying the planning system, relaxing green belt restrictions that prevent development of new land in many of the areas of highest demand, increasing the fiscal incentives given to local communities that allow development, and potentially a land value tax. Undeveloped land with planning permission, which is not currently subject to recurrent taxes as the system focuses on taxing existing property, could also be taxed on its imputed economic rent on an annual basis. This could help incentivise developers to build housing rather than hold onto undeveloped land with planning permission in the hope of a rise in land values. The government could also look for ways to promote greater competition in the residential development sector by lowering barriers to entry and changing the incentives for firms. The UK sector is dominated by firms which both purchase land and build property. The UK authorities could look at further options for encouraging higher volumes of self-build construction projects, as are seen in many other European countries, although reducing the
barriers imposed by the planning system will be key.
Property taxation: the recurrent taxation of land and property ownership is relatively economically efficient and there is some scope to reform UK property taxes. Transaction-based property taxation can discourage speculation, but it also involves significant distortions and can generate highly cyclical revenues. The property tax system a whole could be made less distortionary and regressive by a combination of setting SDLT at a low flat rate, or abolishing it, and reforming Council Tax so that it both reflects current property values and is paid as a fixed percentage of the property value rather than the existing regressive system of bands. This could be done in combination with a broader land value tax as noted above. Such reforms could improve the functioning of the housing market and the efficiency of the tax system, promote better labour mobility and efficient capital allocation. It could also potentially contribute to fiscal consolidation if net revenues increased. There would be some risks involved in raising property taxes for households with existing problems servicing their mortgages in an environment of low liquidity, but this is unlikely to include many of the higher income, high net wealth households that would predominantly be affected by a flatter rate Council Tax replacement.
Rental market: a combination of high house prices, stretched household finances and more responsible lending criteria are likely to continue to exclude many middle income households from the option of home ownership. Subsidies for private rented housing provided through Housing Benefit have acted to increase effective demand and helped to bid up both private rental and sale prices of housing in high demand locations, although this is starting to be addressed by the government. Subsidies for tenants in scarce social housing are also a barrier to labour mobility. The private rental market is currently dominated by short term, unsecure tenancies. Long-term private renting could be made more attractive as a long term option by improving the current rental framework so as to promote greater use of longer term contracts that give more security to tenants, and by a further professionalisation of the sector. This could improve the welfare of households who rent and help tackle high levels of household debt
4. Policy Challenges
59
by reducing the pressure that UK households often feel to borrow heavily to get on the property ladder as soon as possible.
Financial stability: economic policy as a whole needs to carefully balance a pressing need for new lending to support investment and growth, with a long term need for deleveraging and macroeconomic and financial stability. In the short term, loose monetary policy remains appropriate in a context of weak domestic and external demand, but this should not be at the cost of allowing existing imbalances to remain unresolved indefinitely. The government's focus on broader actions to improve access to finance is also appropriate given that credit constraints are contributing to low investment and weak growth. For the FLS and other access to finance policies to maximise their impact they need to focus as far as possible on supporting an increase in productive investment rather than bidding up the price of existing assets. Action to address the problems of companies with limited prospects of paying back their outstanding debts and hidden risks in bank balance sheets – namely through higher levels of provisioning by banks and, possibly, further company debt restructurings – could both deal with risks to the stability of the financial system and support the reallocation of resources through investment in more productive firms and sectors. Effectively addressing the recommendation of the interim Financial Policy Committee (90) that banks need to assess more realistically their true capital adequacy ratios could help dissipate concerns about hidden risks in banks' balance sheets. This would imply taking action to ensure that bank capital and provisions reflect proper asset valuations and that a realistic assessment of expected losses and a prudent calculation of risk weights are applied.
(90) Financial Policy Committee (2012).

REFERENCES
60
Altomonte, C., Aquilante, T. and Ottaviano, G. I. P., ‘The triggers of competitiveness - The EFIGE cross-country report’, 2012
Bank of England, ‘Credit Conditions Survey – 2012 Q4’, January 2013a
Bank of England, ‘Trends in Lending’, January 2013b
Bank of England, ‘Inflation Report February 2013’, 2013c
Bank of England, ‘NMG Consulting Survey’, 2012a
Bank of England, ‘Credit Conditions Survey – 2012 Q3’, September 2012b
Bank of England, ‘Financial Stability Report’, November 2012c
Bank of England, ‘Mortgage Approvals’, December 2012d
Bank of England, ‘Understanding recent developments in UK external trade’, Quarterly Bulletin, Q4 2011
Ben Broadbent, ‘Deconstruction, speech to Lancaster University Management School’, 29th October 2012
British Chambers of Commerce, ‘Exporting is good for Britain and exporters need skills’, 2012a
British Chambers of Commerce, ‘The energy market: business requires security’, 2012b
Centre for Cities, ‘Cities Outlook 2013’, January 2013
Cheshire, P. C. and Hilber C. A. L., ‘Office space supply restrictions in Britain: the political economy of market revenge’, The Economic Journal 118, June 2008
Confederation of British Industry and KPMG, ‘Infrastructure Survey 2012’, September 2012
Consensus Forecasts, Survey Report, 14 January 2013
Council of Mortgage Lenders, ‘Housing and mortgage forecasts’, December 2012
Council of the European Union, ‘Council Recommendation of 10 July 2012 on the National Reform Programme 2012 of the United Kingdom and delivering a Council opinion on the Convergence Programme of the United Kingdom, 2012-2017’, Official Journal of the European Union (2012/C 219/27)
Department for Business, Innovation and Skills, ‘Industrial strategy: UK sector analysis’, BIS Economics Paper no. 18, September 2012a
Department for Business, Innovation and Skills, ‘Implementing the recommendations from the Breedon Review – a progress report’, November 2012b
Department for Communities and Local Government, ‘House Building: December Quarter 2012, England’, February 2013
Department for Communities and Local Government, ‘Table 101 Dwelling stock: by tenure, United Kingdom’, December 2012
Department for Work and Pensions, ‘Pensions and Growth: Whether to smooth assets and liabilities in scheme funding valuations; Whether to introduce a new statutory objective for the Pensions Regulator; A call for evidence’, January 2013
Deutsche Bank, ‘UK Building Sector - What to expect from the Q4 12 results’, February 2013
EEF, ‘Executive Survey 2013’, January 2013
EEF and JAM, ‘Skills for Growth: A More Productive and Flexible Labour Force’, 2012
European Central Bank and European Commission, ‘Access to Finance – Analytical Report’, September 2009
European Central Bank and European Commission, ‘SMEs' Access to Finance - Survey 2011’, December 2011
European Commission, ‘Employment and Social Developments in Europe 2012’, 2012a
References
61
European Commission, ‘Key areas: comparing Member States' performances, SME access to finance, http://ec.europa.eu/europe2020/making-it-happen/key-areas/index_en.htm, 2012b
European Commission, ‘Key areas: comparing Member States' performances, Network industries – Transport’, http://ec.europa.eu/europe2020/making-it-happen/key-areas/index_en.htm, 2012c
European Commission, ‘Macroeconomic imbalances – Sweden, Occasional Papers 108, July 2012d
European Commission, ‘Macroeconomic imbalances – United Kingdom’, Occasional Papers 110, July 2012e
European Commission, ‘Report from the Commission, Alert Mechanism Report – 2013’, 2012f
European Commission, ‘Research and Innovation performance in EU Member States and Associated countries – Innovation Union progress at country level’, 2012g
European Commission, ‘Internationalisation of European SMEs’, 2010
Federation of Small Businesses, ‘Voice of Small Business Index’, Q4 2012
Field, S. and Franklin, M., 'Micro-data perspectives on the UK productivity conundrum', Office for National Statistics, January 2013.
Financial Policy Committee, ‘Record of the Interim Financial Policy Committee Meeting – 21 November 2012’, December 2012
Financial Services Authority, ‘Mortgage Market Review – feedback on CP11/31 and final rules’, October 2012a
Financial Services Authority, ‘FSA statistics on mortgage lending’, December 2012b
Financial Times, ‘Zombie companies stalk UK economy’, November 18, 2012
Financial Times, ‘FSA clampdown sparks friction’, January 16, 2013a
Financial Times, ‘House builders enjoy state backed boom’, January 22, 2013b
Hilber, C. and Vermeulen, W., ‘The Impact of Supply Constraints on House Prices in England’, September 2012
HM Government, ‘Laying the Foundations: A housing strategy for England’, November 2011
HM Treasury, ‘Autumn Statement 2012’, December 2012
Home Builders Federation, ‘Housing Pipeline Report – Q3 2012 report’, December 2012
IMF, ‘Changing Patterns of Global Trade’, June 2011
Local Government Association, ‘An analysis of unimplemented planning permissions for residential dwellings’, September 2012
Morton, A., ‘Why aren’t we building enough attractive new homes?’, Policy Exchange, September 2012a
Morton, A., ‘Planning for Less: The impact of abolishing regional planning’, Policy Exchange, December 2012b
Office for Budget Responsibility, ‘Economic and Fiscal Outlook’, December 2012
Office for National Statistics, ‘International Comparisons of Productivity - Final Estimates for 2011’, February 2013a
Office for National Statistics, ‘Profitability of UK Companies, Q3 2012’, January 2013b
Office for National Statistics, ‘ONS House Price Index’, November 2012a
Office for National Statistics, ‘Quarterly National Accounts Q3 2012’, December 2012b
Office for National Statistics, ‘Household Projections, 2008 to 2033, England’, 2010

European Commission Macroeconomic Imbalances - United Kingdom 2013
62
OECD, ‘Measuring Innovation: A New Perspective’, 2010
OECD, ‘OECD Economic Surveys: United Kingdom’, 2013
R3, ‘Today's official insolvency figures - decreasing insolvency’, February 2013
Reinold, K., ‘Housing equity withdrawal since the financial crisis’, Bank of England Quarterly Review, 2011 Q2
Richard, D., ‘The Richard Review of Apprenticeships’, November 2012
Rubini, L., Desmet, K., Piguillem, F. and Crespo, A., ‘Breaking down the barriers to firm growth in Europe - The fourth EFIGE policy report’, 2012
Shelter, ‘A better deal: Towards more stable private renting’, September 2012
Statistics Sweden, ‘Housing Statistics in the European Union 2004’, 2005
Weale, M., ‘The Balance of Payments’ (speech given at the Warwick Economics Summit 2013), February 2013
The World Bank and the International Finance Corporation, ‘Doing Business 2013’, 2013
Whittaker, M., ‘On borrowed time?’, Resolution Foundation, December 2012
World Economic Forum, ‘The Global Competitiveness Report 2012-2013’, 2012

KC-AH-13-143-EN
-N
Related Documents