U.S. and World Cotton Economic Outlook May 2011 Prepared by: Economic Services National Cotton Council

Macroeconomic Environment
Jan 05, 2016
U.S. and World Cotton Economic Outlook May 2011 Prepared by: Economic Services National Cotton Council. Macroeconomic Environment. U.S. Real GDP Growth. U.S. Crude Oil Spot Price. U.S. #2 Diesel, Gulf Coast. Civilian Unemployment Rate. U.S. Federal Budget Surplus (CBO Projection). - PowerPoint PPT Presentation
Welcome message from author
This document is posted to help you gain knowledge. Please leave a comment to let me know what you think about it! Share it to your friends and learn new things together.
Transcript

U.S. and World Cotton Economic Outlook
May 2011
Prepared by:Economic Services
National Cotton Council
U.S. and World Cotton Economic Outlook
May 2011
Prepared by:Economic Services
National Cotton Council

Macroeconomic Environment
U.S. Real GDP Growth
Percent
-10
-8
-6
-4
-2
0
2
4
6
8
10
05 06 07 08 09 10 11

Dollars per Barrel
2030405060708090
100110120130140150160
Au
g-0
5
No
v-0
5
Fe
b-0
6
Ma
y-0
6
Ju
l-0
6
Oc
t-0
6
Ja
n-0
7
Ap
r-0
7
Ju
l-0
7
Oc
t-0
7
De
c-0
7
Ma
r-0
8
Ju
n-0
8
Se
p-0
8
De
c-0
8
Ma
r-0
9
Ju
n-0
9
Au
g-0
9
No
v-0
9
Fe
b-1
0
Ma
y-1
0
Au
g-1
0
No
v-1
0
Fe
b-1
1
Ap
r-1
1
U.S. Crude Oil Spot Price

Cents per Gallon
80110140170200230260290320350380410440
Jun
-06
Sep
-06
Dec
-06
Mar
-07
May
-07
Au
g-0
7
No
v-07
Feb
-08
May
-08
Au
g-0
8
Oct
-08
Jan
-09
Ap
r-09
Jul-
09
Oct
-09
Jan
-10
Ap
r-10
Jul-
10
Sep
-10
Dec
-10
Mar
-11
U.S. #2 Diesel, Gulf Coast
Percent
3.5
4.0
4.5
5.0
5.5
6.0
6.5
7.0
7.5
8.0
8.5
9.0
9.5
10.0
10.5
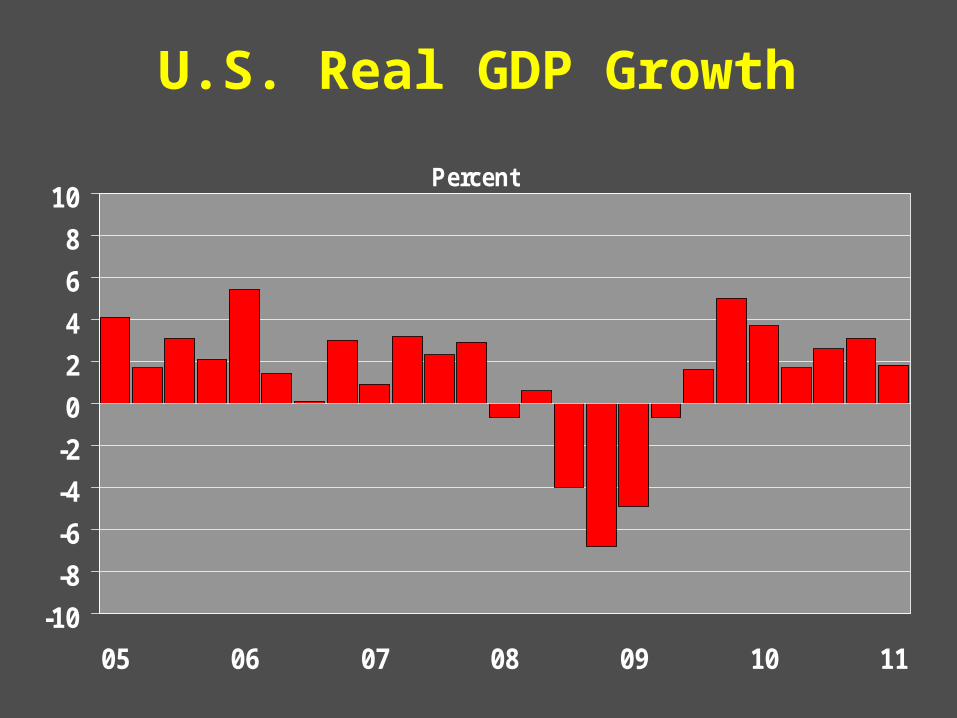
99 00 01 02 03 04 05 06 07 08 09 10 11
Percent
3.5
4.0
4.5
5.0
5.5
6.0
6.5
7.0
7.5
8.0
8.5
9.0
9.5
10.0
10.5
99 00 01 02 03 04 05 06 07 08 09 10 11
Civilian Unemployment Rate
$ Billions
-1,800
-1,400
-1,000
-600
-200
200
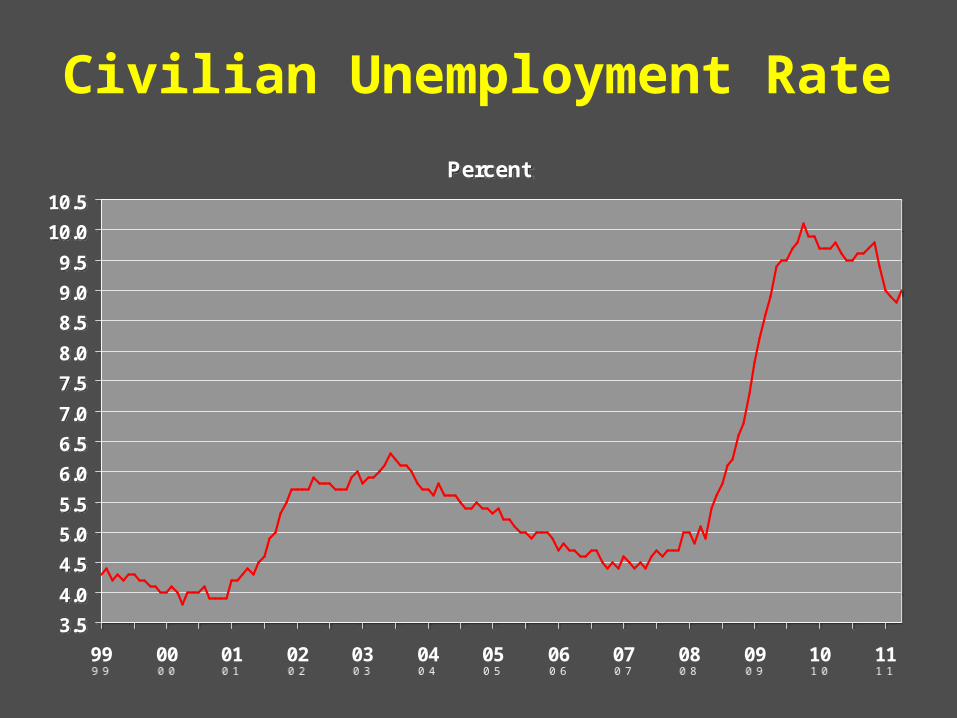
10 11 12 13 14 15 16 17 18 19 20
10-Aug 11-Jan
U.S. Federal Budget Surplus(CBO Projection)
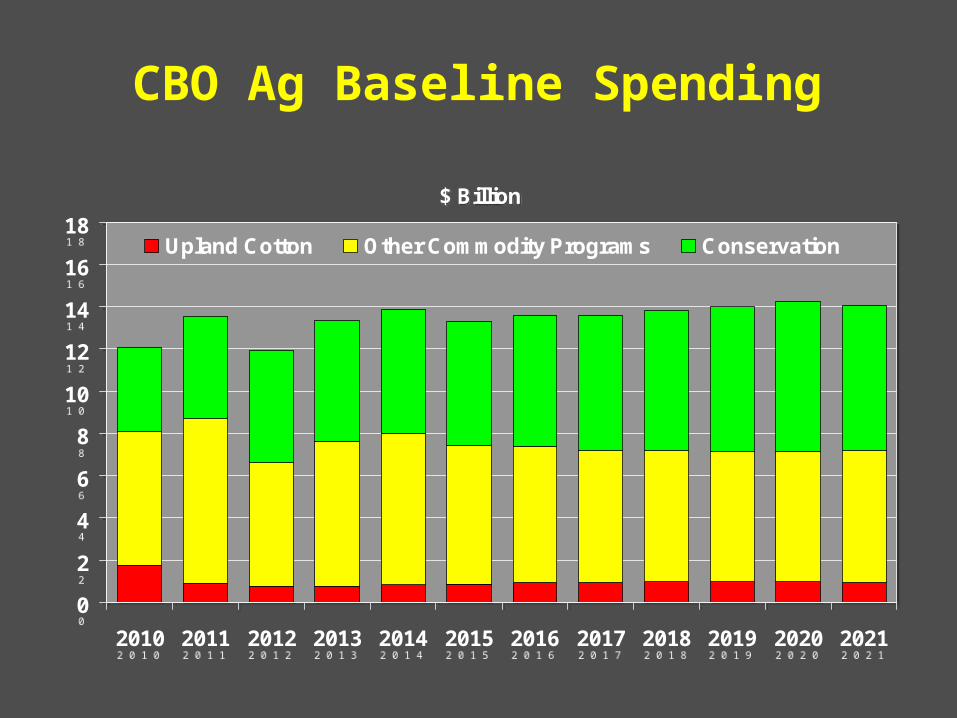
$ Billion
0
2
4
6
8
10
12
14
16
18
2010 2011 2012 2013 2014 2015 2016 2017 2018 2019 2020 2021
Upland Cotton Other Commodity Programs Conservation
$ Billion
0
2
4
6
8
10
12
14
16
18
2010 2011 2012 2013 2014 2015 2016 2017 2018 2019 2020 2021
Upland Cotton Other Commodity Programs Conservation
CBO Ag Baseline Spending
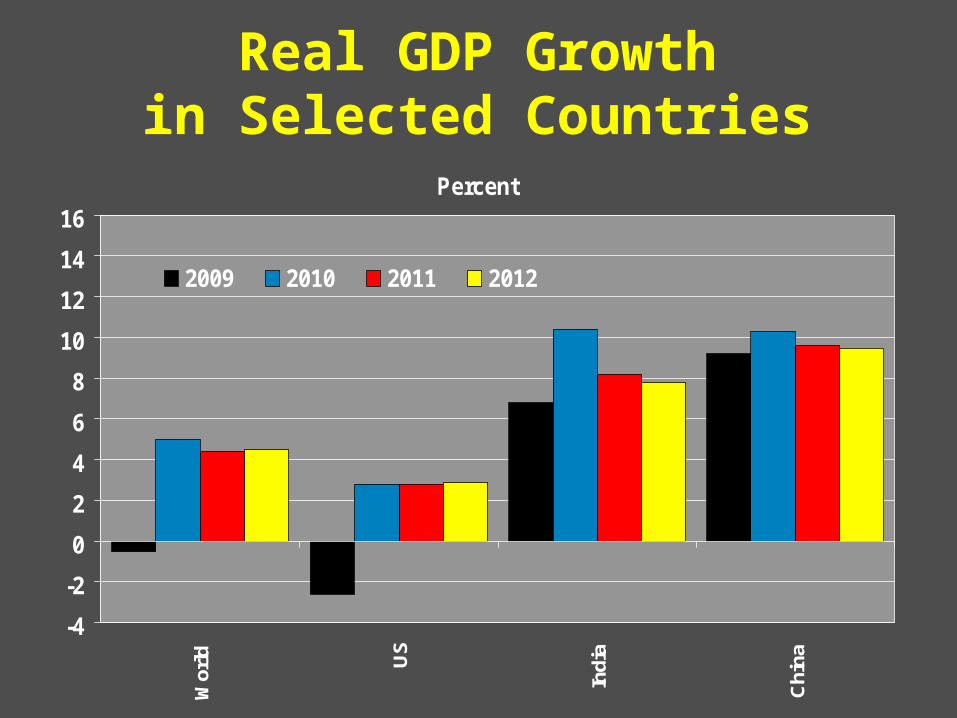
Percent
-4
-2
0
2
4
6
8
10
12
14
16W
orld US
Indi
a
Chi
na
2009 2010 2011 2012
Real GDP Growthin Selected Countries

0.55
0.65
0.75
0.85
0.95
1.05
1.15
1.25
Jan
-97
Jul
Jan
-98
Jul
Jan
-99
Jul
Jan
-00
Jul
Jan
-01
Jul
Jan
-02
Jul
Jan
-03
Jul
Jan
-04
Jul
Jan
-05
Jul
Jan
-06
Jul
Jan
-07
Jul
Jan
-08
July
Jan
-09
July
Jan
-10
July
Jan
-11
Euro(Currency per U.S. Dollar)
90
95
100
105
110
115
120
125
130
Jan
-01
Jan
-02
Jan
-03
Jan
-04
Jan
-05
Jan
-06
Jan
-07
Jan
-08
Jan
-09
Jan
-10
Jan
-11
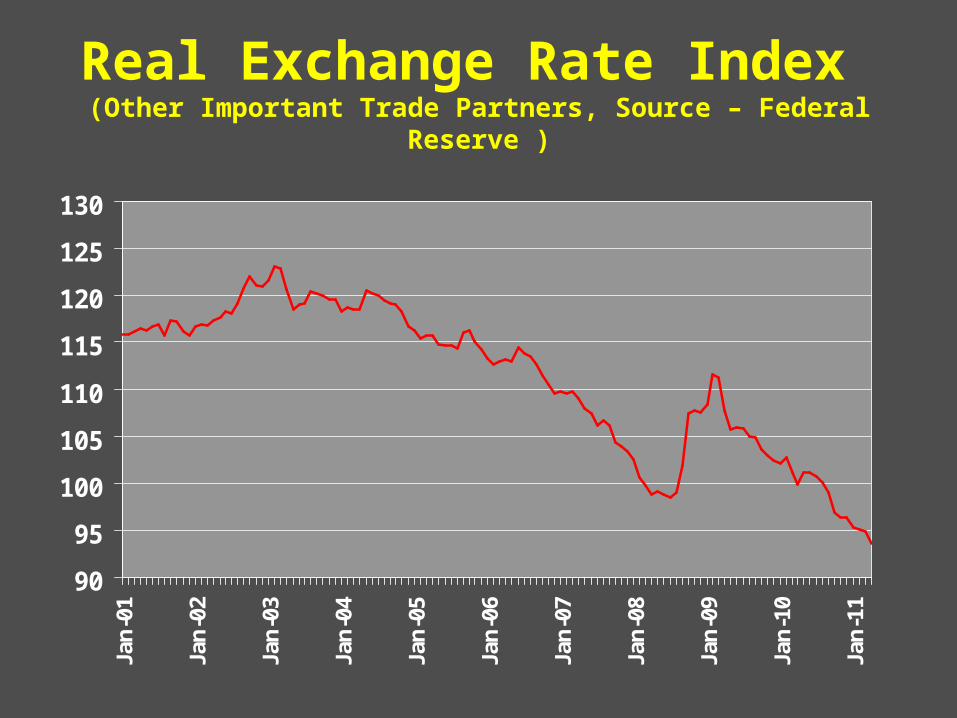
Real Exchange Rate Index (Other Important Trade Partners, Source – Federal Reserve )
8090
100110120130140150160170180190200210
Jan
-95
Jul
Jan
-96
Jul
Jan
-97
Jul
Jan
-98
Jul
Jan
-99
Jul
Jan
-00
Jul
Jan
-01
Jul
Jan
-02
Jul
Jan
-03
Jul
Jan
-04
Jul
Jan
-05
Jul
Jan
-06
Jul
Jan
-07
Jul
Jan
-08
Jul
Jan
-09
Jul
Jan
-10
Jul
Jan
-11
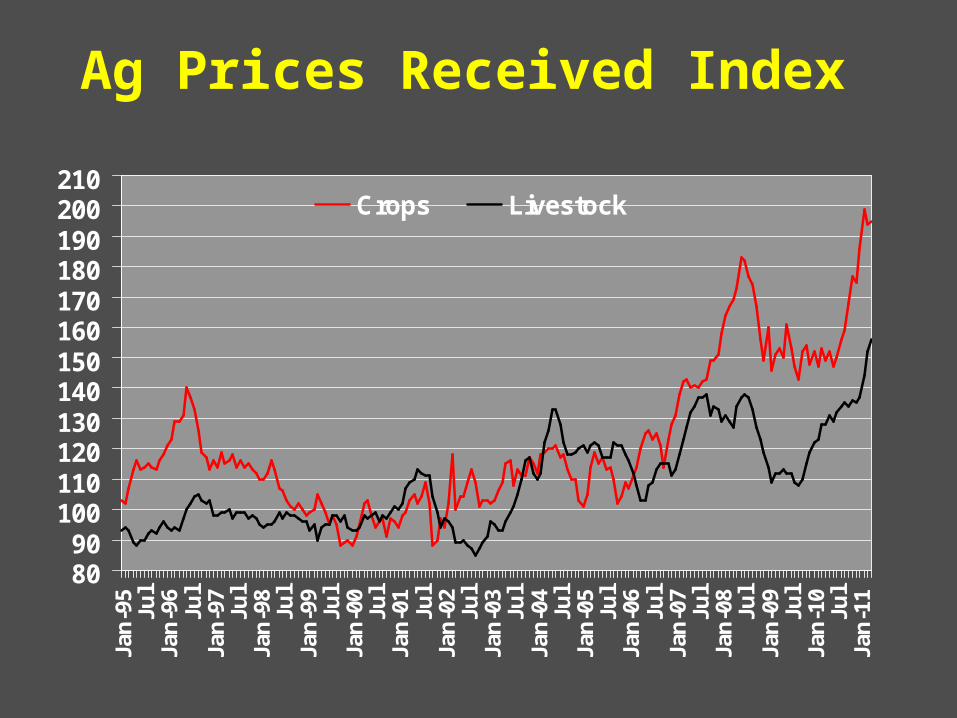
Crops Livestock
Ag Prices Received Index
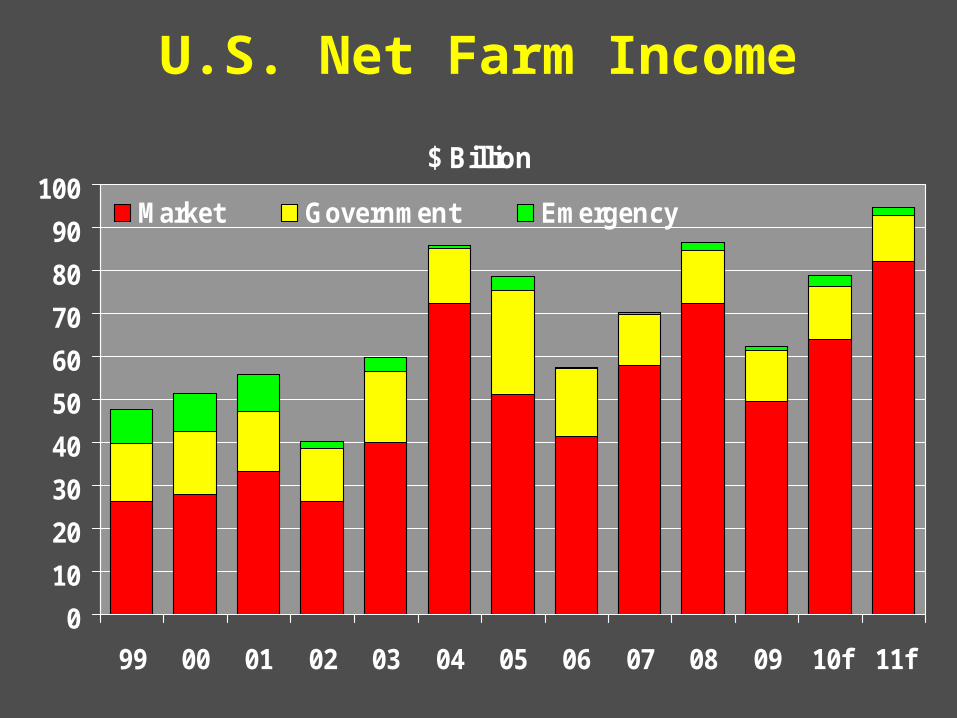
$ Billion
0
10
20
30
40
50
60
70
80
90
100
99 00 01 02 03 04 05 06 07 08 09 10f 11f
Market Government Emergency
U.S. Net Farm Income
U.S. Cotton Supply
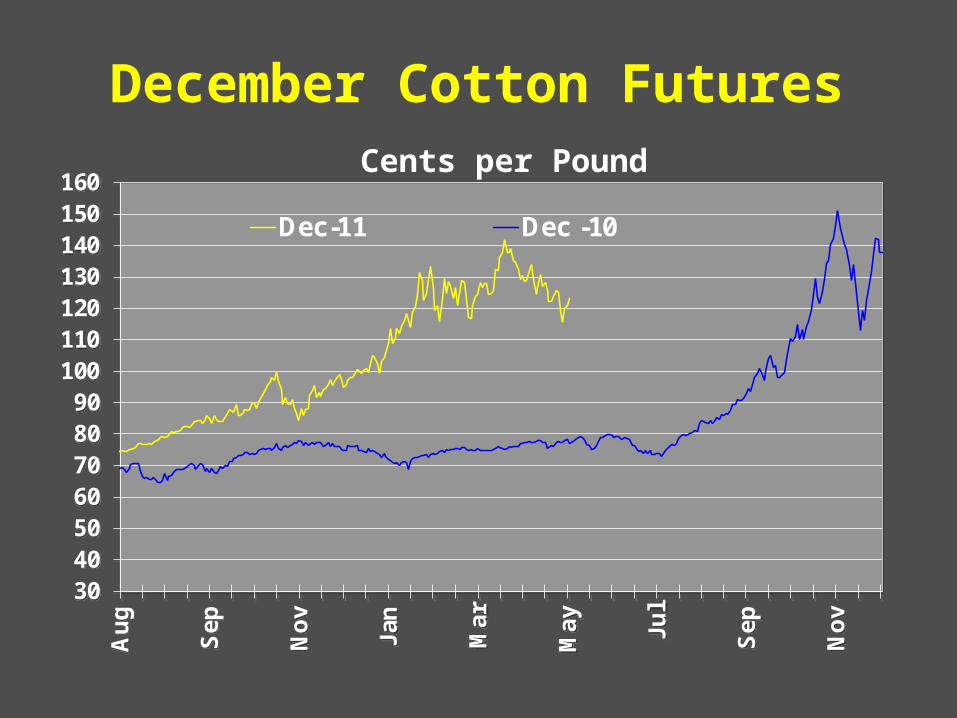
30405060708090
100110120130140150160
Au
g
Se
p
No
v
Jan
Ma
r
Ma
y
Ju
l
Se
p
No
v
Dec-11 Dec -10
30405060708090
100110120130140150160
Au
g
Se
p
No
v
Jan
Ma
r
Ma
y
Ju
l
Se
p
No
v
Dec-11 Dec -10
December Cotton FuturesCents per Pound
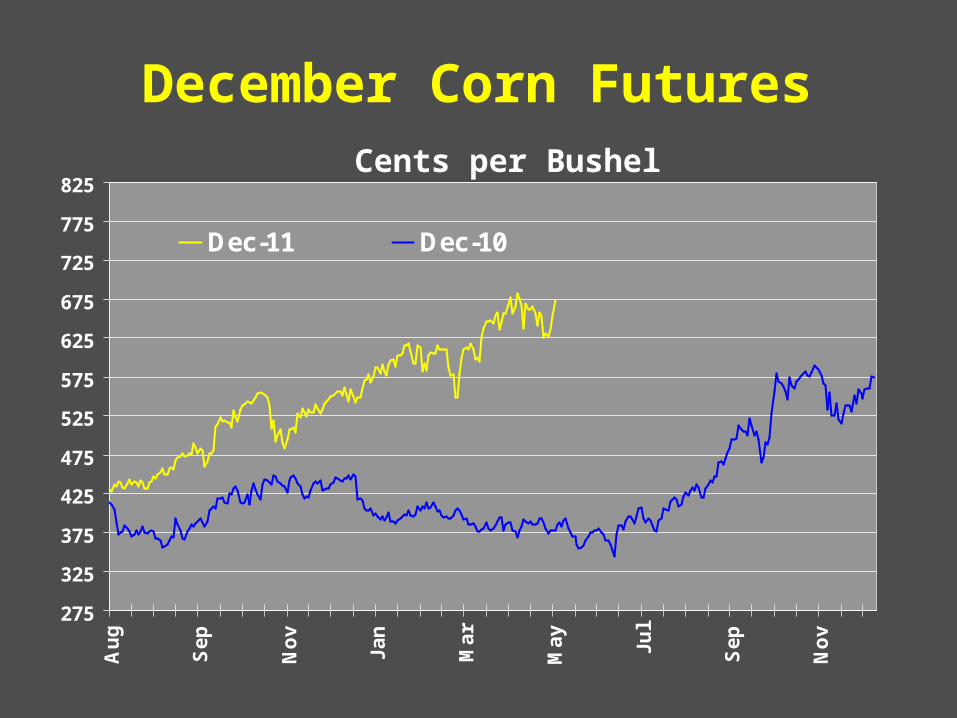
275
325
375
425
475
525
575
625
675
725
775
825
Au
g
Se
p
No
v
Ja
n
Ma
r
Ma
y
Ju
l
Se
p
No
v
Dec-11 Dec-10
December Corn FuturesCents per Bushel
580
680
780
880
980
1080
1180
1280
1380
1480
1580
1680
Au
g
Se
p
No
v
Ja
n
Ma
r
Ma
y
Ju
l
Se
p
No
v
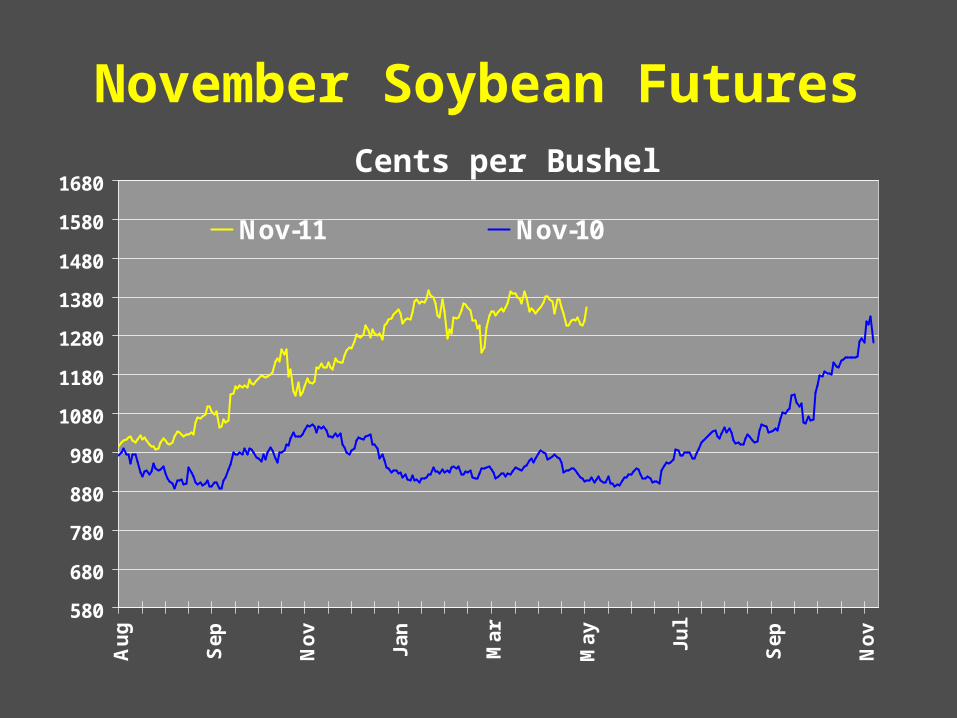
Nov-11 Nov-10
November Soybean FuturesCents per Bushel
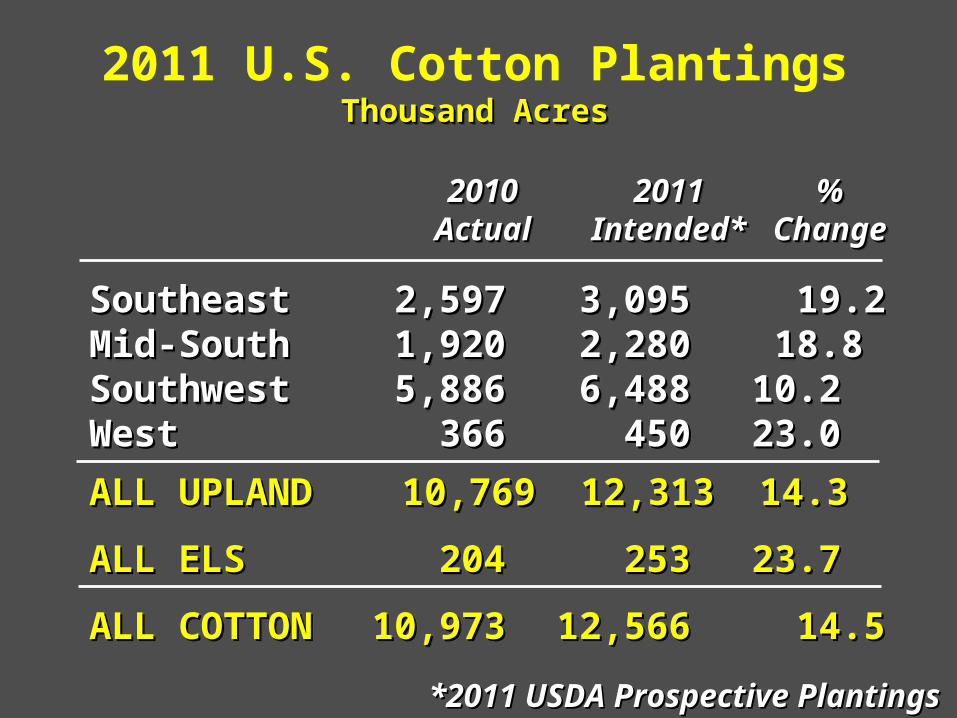
SoutheastSoutheast 2,597 2,597 3,095 3,095 19.219.2Mid-SouthMid-South 1,920 1,920 2,280 2,280 18.8 18.8 SouthwestSouthwest 5,886 5,886 6,488 6,488 10.2 10.2 WestWest 366 366 450 450 23.0 23.0
ALL UPLANDALL UPLAND 10,76910,769 12,31312,313 14.314.3
ALL ELSALL ELS 204 204 253 253 23.7 23.7
ALL COTTONALL COTTON 10,973 10,973 12,566 12,566 14.514.5
2011 U.S. Cotton Plantings
20102010 20112011 %% Actual Actual Intended* Intended* ChangeChange
20102010 20112011 %% Actual Actual Intended* Intended* ChangeChange
Thousand AcresThousand AcresThousand AcresThousand Acres
*2011 USDA Prospective Plantings*2011 USDA Prospective Plantings

SoutheastSoutheast 1,051 1,051 1,253 1,253 19.219.2Mid-SouthMid-South 777 777 923 923 18.8 18.8 SouthwestSouthwest 2,382 2,382 2,626 2,626 10.2 10.2 WestWest 148 148 182 182 23.0 23.0
ALL UPLANDALL UPLAND 4,3584,358 4,9834,983 14.314.3
ALL ELSALL ELS 83 83 102 102 23.7 23.7
ALL COTTONALL COTTON 4,441 4,441 5,085 5,085 14.514.5
2011 U.S. Cotton Plantings
20102010 20112011 %% Actual Actual Intended* Intended* ChangeChange
20102010 20112011 %% Actual Actual Intended* Intended* ChangeChange
Thousand HectaresThousand HectaresThousand HectaresThousand Hectares
*2011 USDA Prospective Plantings*2011 USDA Prospective Plantings
0
4
8
12
16
20
24
28
97 98 99 00 01 02 03 04 05 06 07 08 09 10e 11p
Mill
ion
Ba
les
0
1
2
3
4
5
6
Mill
ion
Me
tric
To
ns
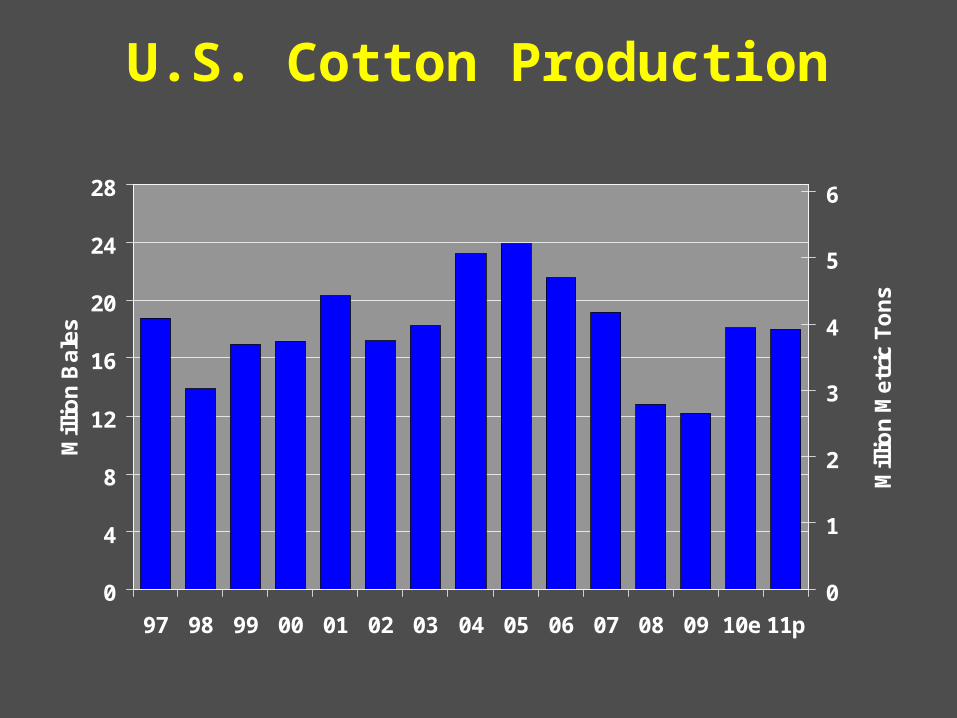
U.S. Cotton Production

0
5
10
15
20
25
30
35
97 98 99 00 01 02 03 04 05 06 07 08 09 10e 11p
Mill
ion
Ba
les
0
1
2
3
4
5
6
7
Mill
ion
Me
tric
To
ns
Beg Stocks Imports Production
U.S. Cotton Supply

U.S. Cotton Demand
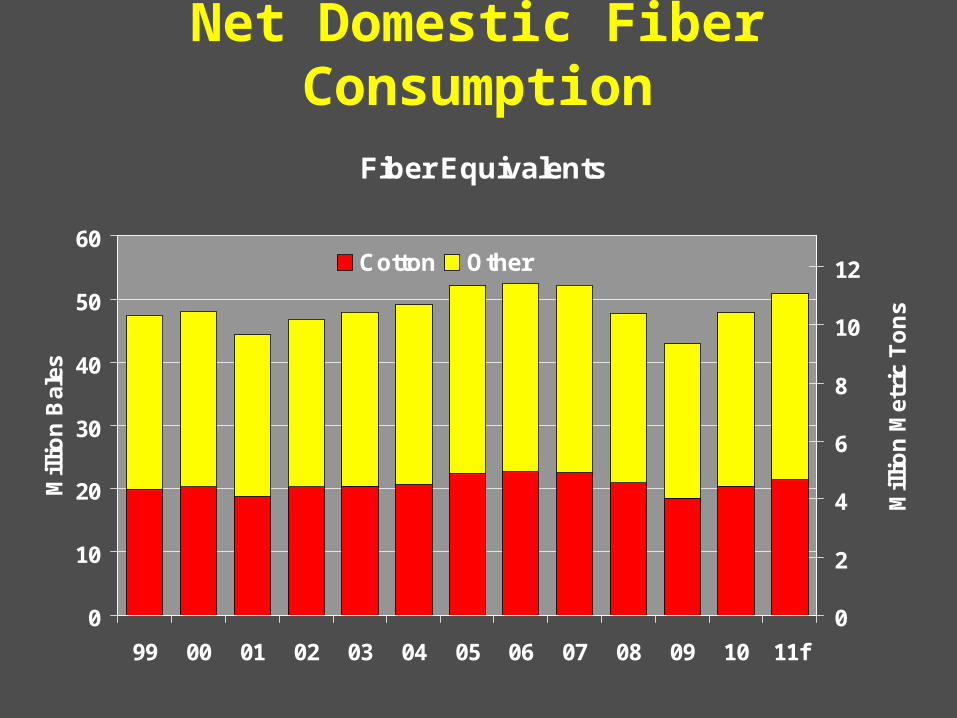
Fiber Equivalents
0
10
20
30
40
50
60
99 00 01 02 03 04 05 06 07 08 09 10 11f
Mill
ion
Bal
es
0
2
4
6
8
10
12
Mill
ion
Met
ric
To
ns
Cotton Other
Net Domestic Fiber Consumption
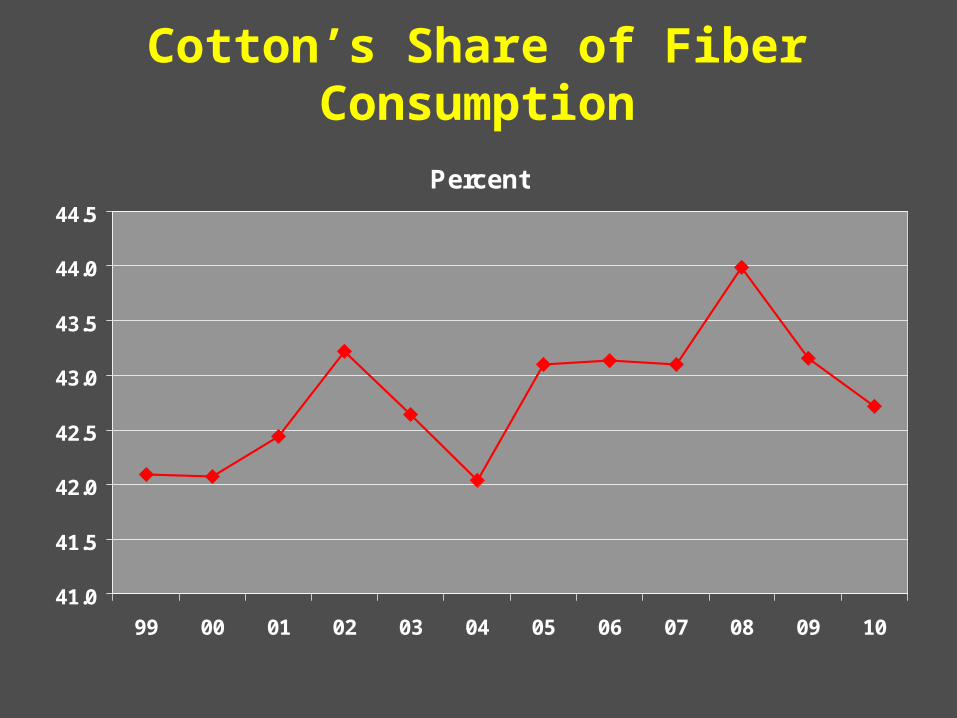
Percent
41.0
41.5
42.0
42.5
43.0
43.5
44.0
44.5
99 00 01 02 03 04 05 06 07 08 09 10
Cotton’s Share of Fiber Consumption
Fiber Equivalents
0
4
8
12
16
20
24
28
99 00 01 02 03 04 05 06 07 08 09 10 11f
Mill
ion
Ba
les
0
1
2
3
4
5
6
Mill
ion
Me
tric
To
ns
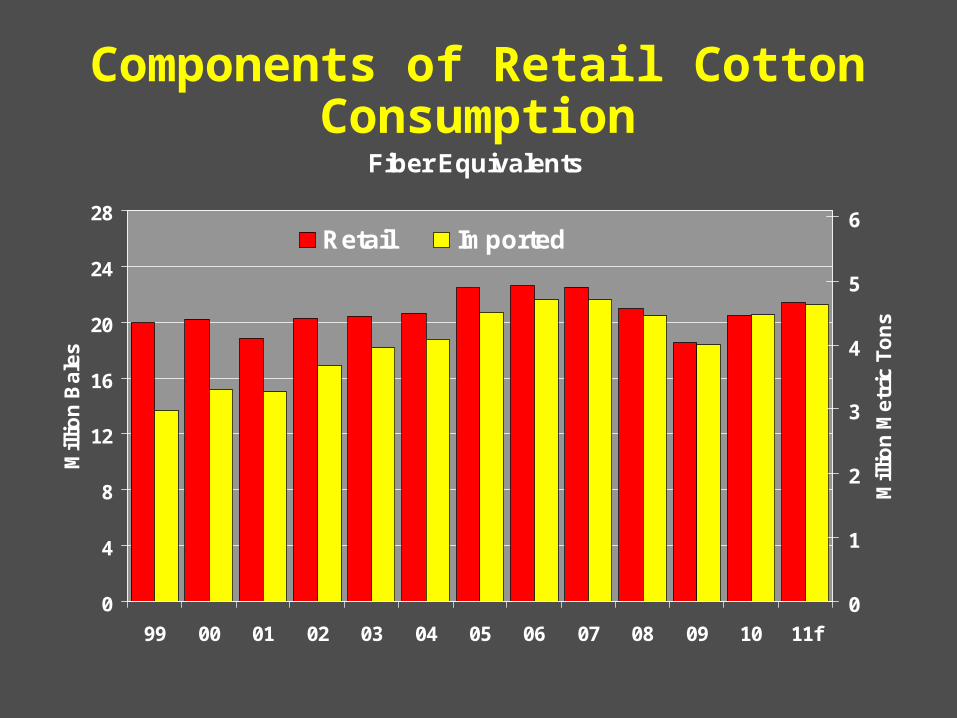
Retail Imported
Components of Retail Cotton Consumption
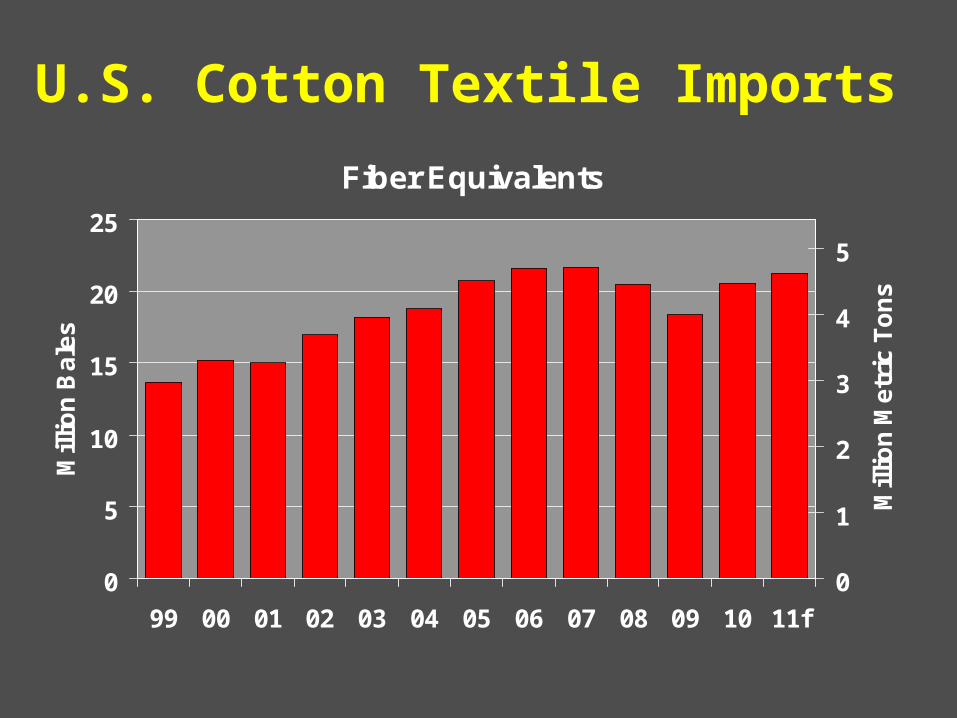
Fiber Equivalents
0
5
10
15
20
25
99 00 01 02 03 04 05 06 07 08 09 10 11f
Mill
ion
Ba
les
0
1
2
3
4
5
Mill
ion
Me
tric
To
ns
U.S. Cotton Textile Imports
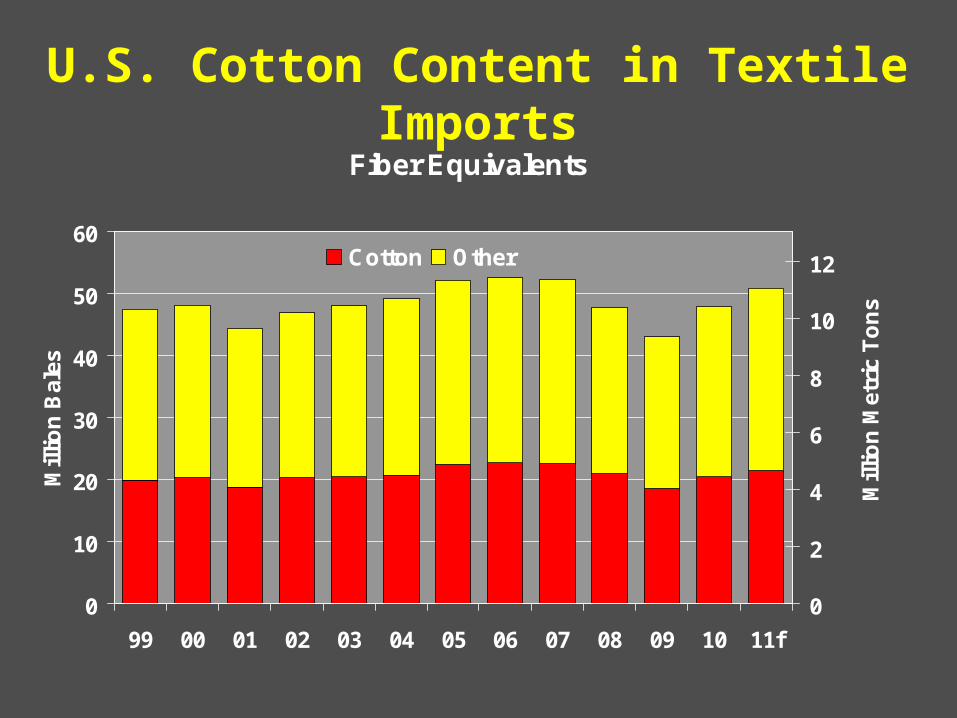
U.S. Cotton Content in Textile ImportsFiber Equivalents
0
10
20
30
40
50
60
99 00 01 02 03 04 05 06 07 08 09 10 11f
Mill
ion
Bal
es
0
2
4
6
8
10
12
Mill
ion
Met
ric
To
ns
Cotton Other
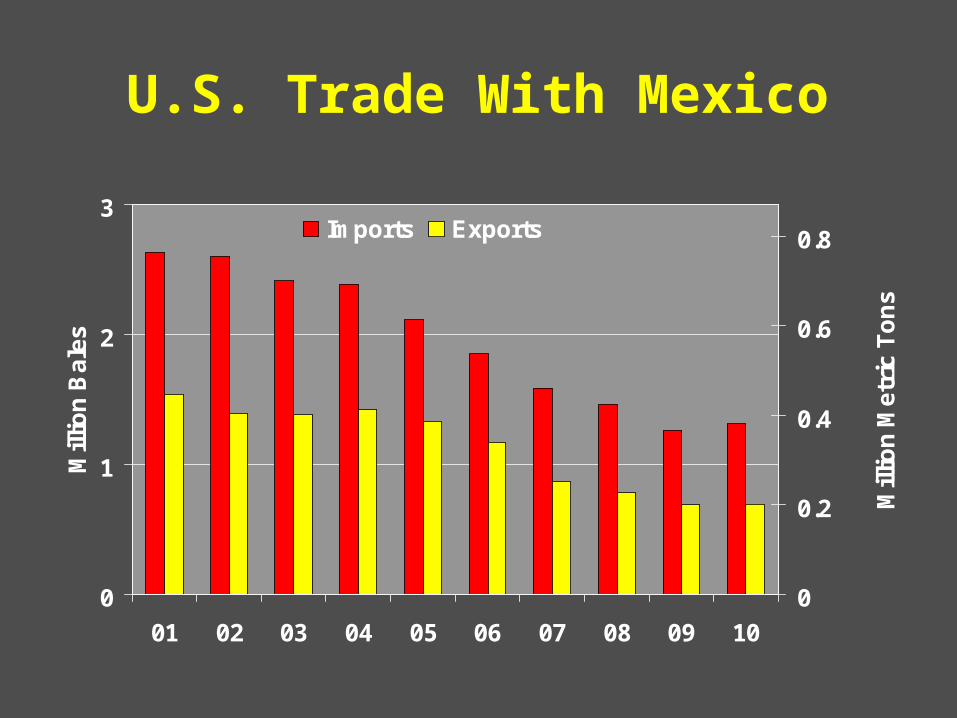
U.S. Trade With Mexico
0
1
2
3
01 02 03 04 05 06 07 08 09 10
Mill
ion
Ba
les
0
0.2
0.4
0.6
0.8
Mill
ion
Me
tric
To
ns
Imports Exports
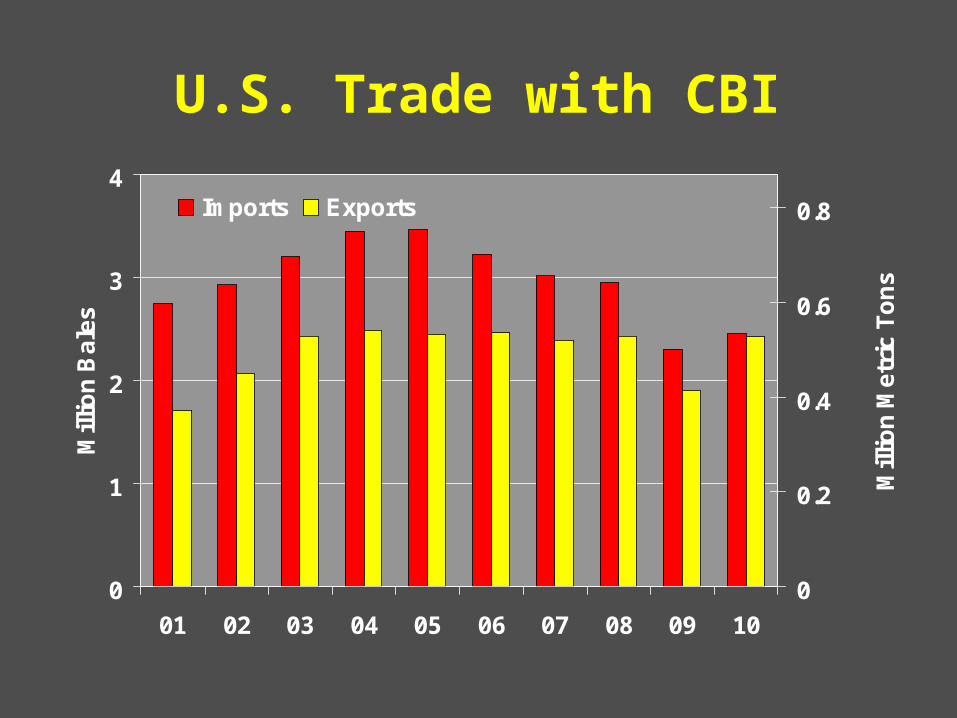
U.S. Trade with CBI
0
1
2
3
4
01 02 03 04 05 06 07 08 09 10
Mill
ion
Ba
les
0
0.2
0.4
0.6
0.8
Mill
ion
Me
tric
To
ns
Imports Exports
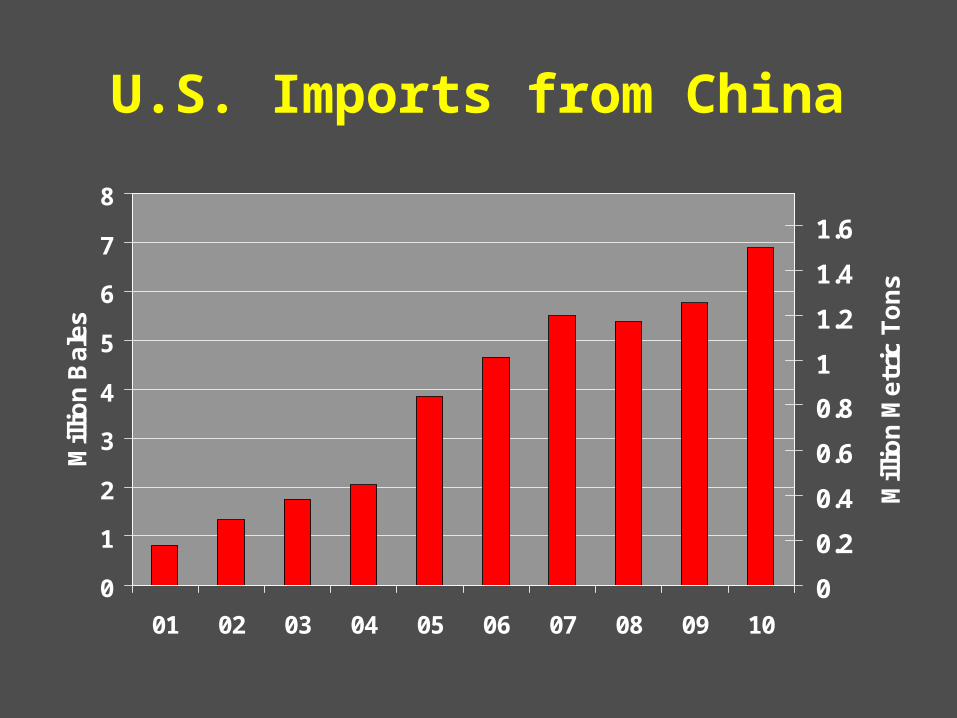
U.S. Imports from China
0
1
2
3
4
5
6
7
8
01 02 03 04 05 06 07 08 09 10
Mill
ion
Ba
les
0
0.2
0.4
0.6
0.8
1
1.2
1.4
1.6
Mill
ion
Me
tric
To
ns
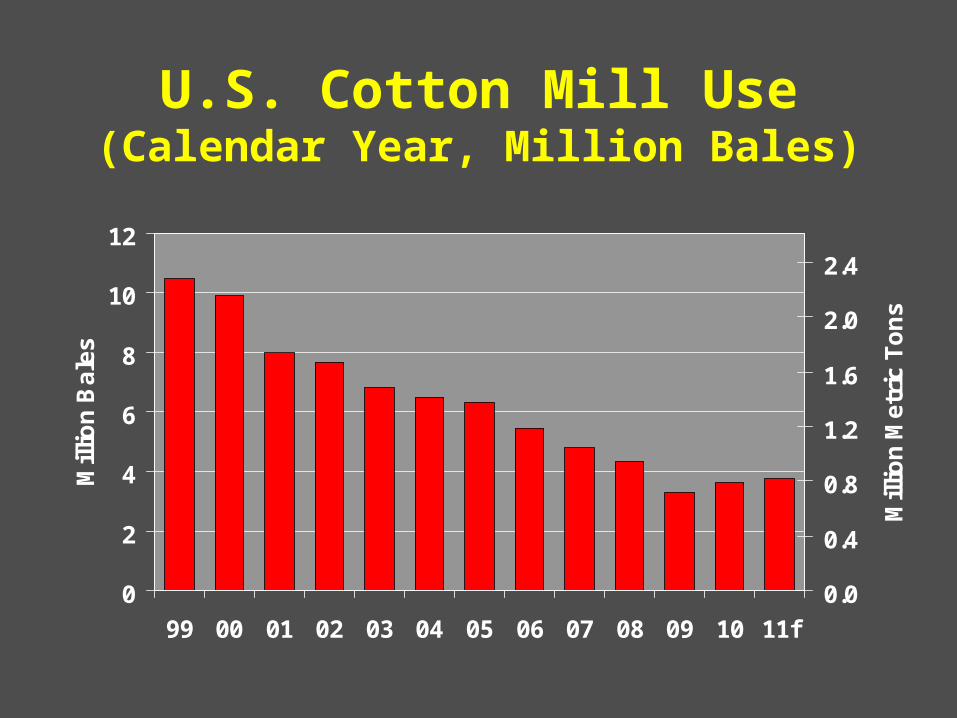
U.S. Cotton Mill Use(Calendar Year, Million Bales)
0
2
4
6
8
10
12
99 00 01 02 03 04 05 06 07 08 09 10 11f
Mill
ion
Ba
les
0.0
0.4
0.8
1.2
1.6
2.0
2.4
Mill
ion
Me
tric
To
ns
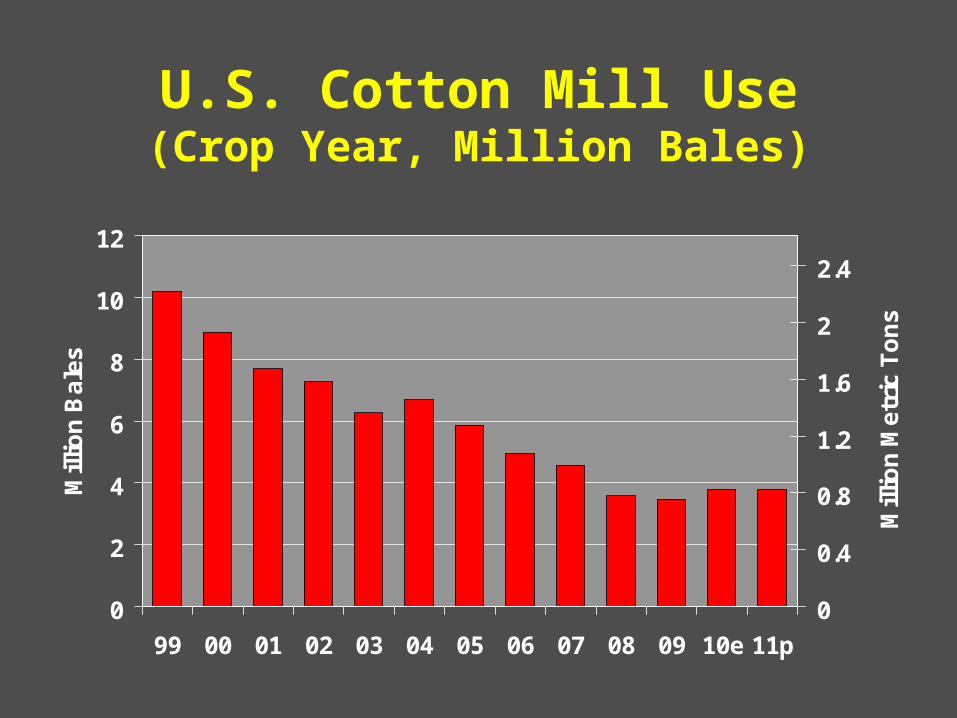
U.S. Cotton Mill Use(Crop Year, Million Bales)
0
2
4
6
8
10
12
99 00 01 02 03 04 05 06 07 08 09 10e 11p
Mill
ion
Ba
les
0
0.4
0.8
1.2
1.6
2
2.4
Mill
ion
Me
tric
To
ns
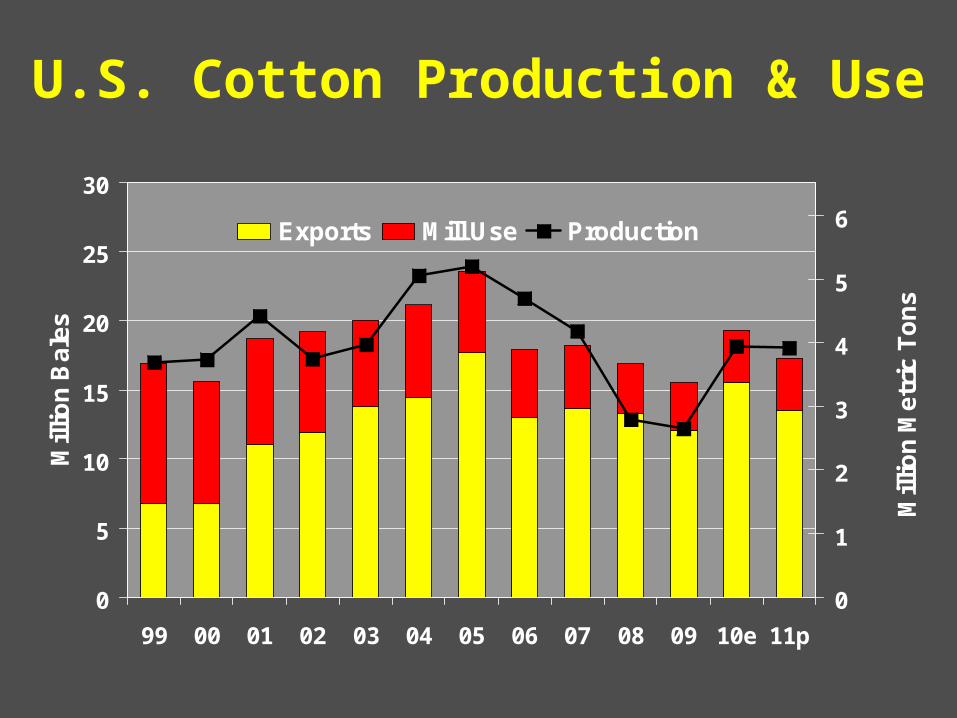
0
5
10
15
20
25
30
99 00 01 02 03 04 05 06 07 08 09 10e 11p
Mill
ion
Ba
les
0
1
2
3
4
5
6
Mill
ion
Me
tric
To
ns
Exports Mill Use Production
U.S. Cotton Production & Use

The World Market & U.S. Cotton Exports
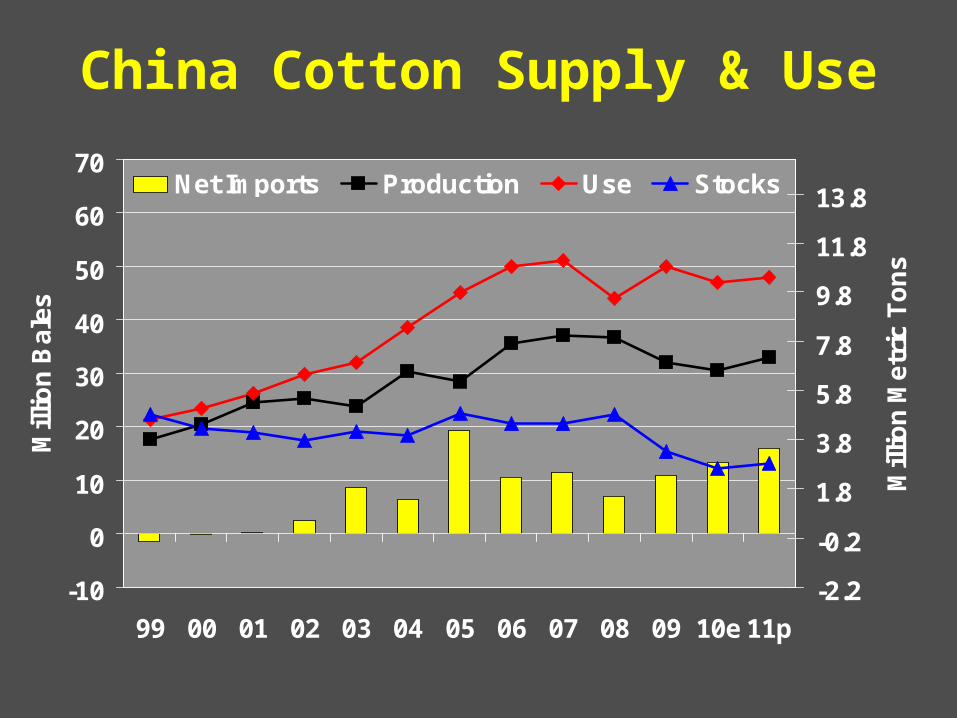
-10
0
10
20
30
40
50
60
70
99 00 01 02 03 04 05 06 07 08 09 10e 11p
Mill
ion
Ba
les
-2.2
-0.2
1.8
3.8
5.8
7.8
9.8
11.8
13.8
Mill
ion
Me
tric
To
ns
Net Imports Production Use Stocks
China Cotton Supply & Use

World Cotton Production
0
25
50
75
100
125
150
99 00 01 02 03 04 05 06 07 08 09 10e 11p
Mill
ion
Ba
les
0
5
10
15
20
25
Mill
ion
Me
tric
To
ns

0
20
40
60
80
100
120
140
160
98 99 00 01 02 03 04 05 06 07 08 09e 10f
Mill
ion
Ba
les
0
5
10
15
20
25
30
Mill
ion
Me
tric
To
ns
Cotton Polyester
World Fiber Mill Use
*PCI

Cents per Pound
30
50
70
90
110
130
150
170
190
210
230
250
Ja
n-0
4
Ap
r-0
4A
ug
-04
No
v-0
4
Ma
r-0
5J
un
-05
Se
p-0
5
Ja
n-0
6A
pr-
06
Au
g-0
6
No
v-0
6M
ar-
07
Ju
n-0
7
Oc
t-0
7J
an
-08
Ma
y-0
8
Au
g-0
8N
ov
-08
Ma
r-0
9
Ju
n-0
9O
ct-
09
Ja
n-1
0
Ma
y-1
0A
ug
-10
De
c-1
0
Ma
r-1
1
"A" FE Index
Asian Polyester Staple
Fiber Prices
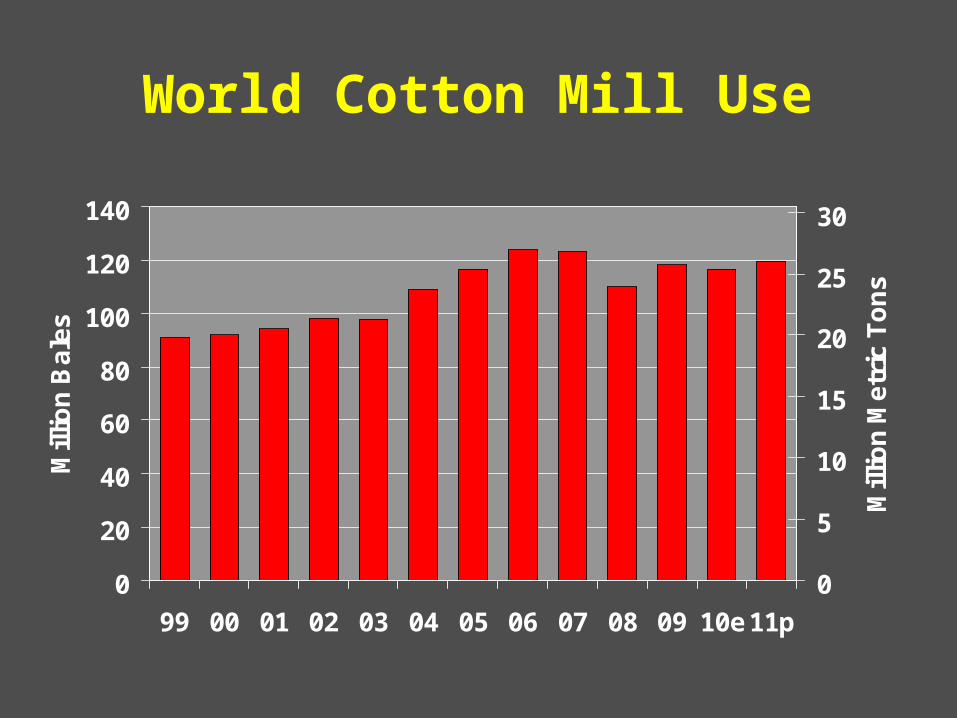
World Cotton Mill Use
0
20
40
60
80
100
120
140
99 00 01 02 03 04 05 06 07 08 09 10e 11p
Mill
ion
Ba
les
0
5
10
15
20
25
30
Mill
ion
Me
tric
To
ns
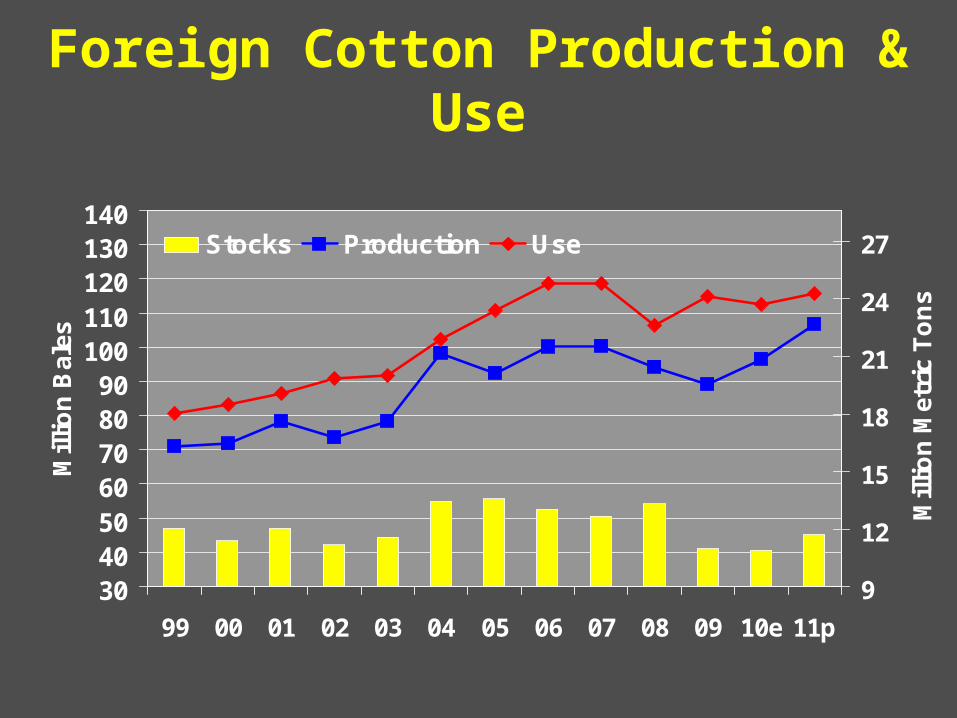
30405060708090
100110120130140
99 00 01 02 03 04 05 06 07 08 09 10e 11p
Mill
ion
Bal
es
9
12
15
18
21
24
27
Mill
ion
Met
ric
To
ns
Stocks Production Use
Foreign Cotton Production & Use

U.S. Cotton Exports
0
2
4
6
8
10
12
14
16
18
20
99 00 01 02 03 04 05 06 07 08 09 10e 11p
Mill
ion
Ba
les
0
1
2
3
4
Mill
ion
Me
tric
To
ns
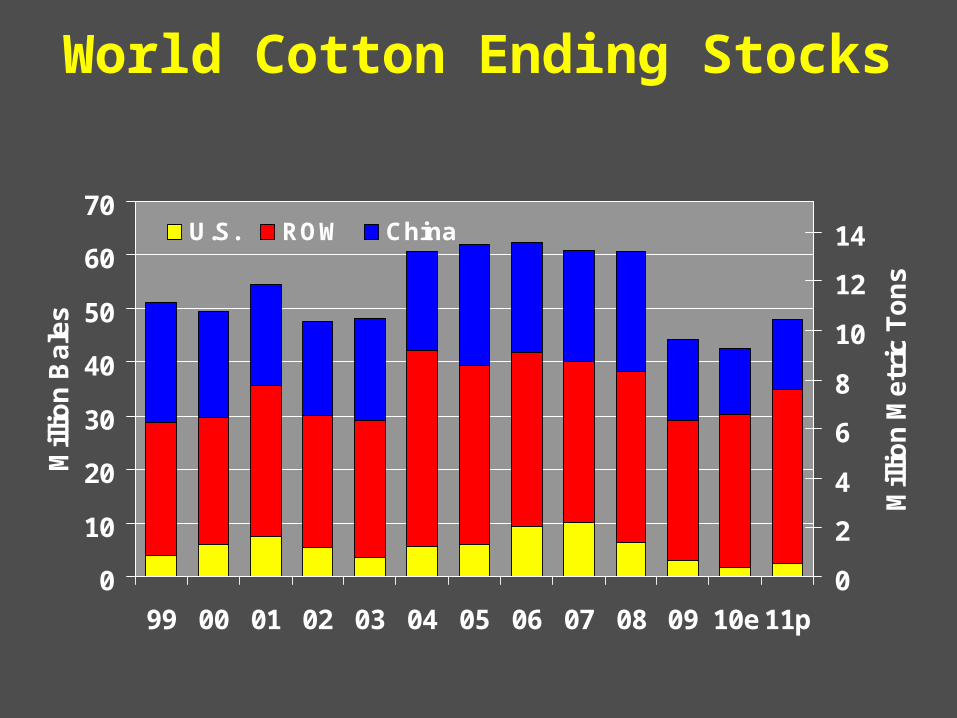
World Cotton Ending Stocks
0
10
20
30
40
50
60
70
99 00 01 02 03 04 05 06 07 08 09 10e 11p
Mill
ion
Ba
les
0
2
4
6
8
10
12
14
Mill
ion
Me
tric
To
ns
U.S. ROW China
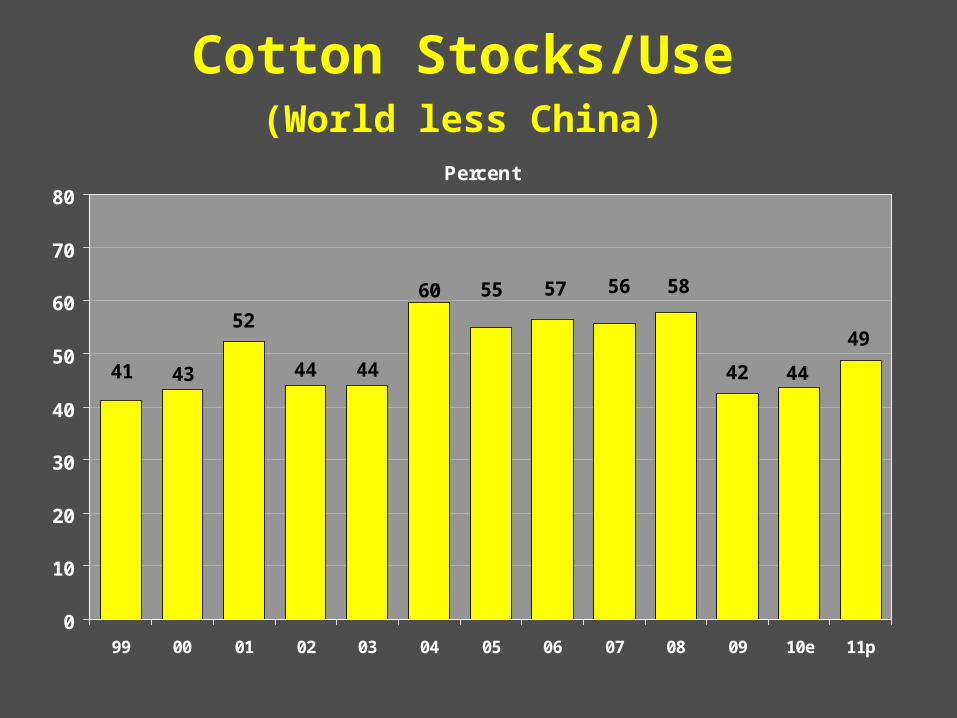
55
52
4341
60
4444
58
49
4442
5657
0
10
20
30
40
50
60
70
80
99 00 01 02 03 04 05 06 07 08 09 10e 11p
Percent
Cotton Stocks/Use (World less China)
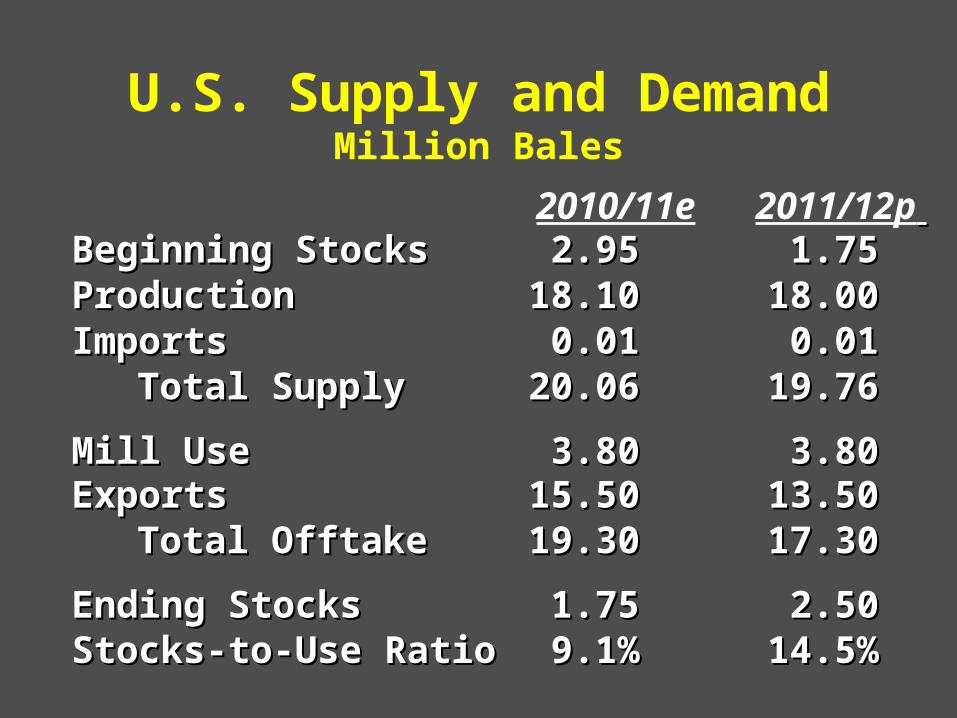
U.S. Supply and DemandMillion Bales
Beginning StocksBeginning Stocks 2.952.95 1.751.75ProductionProduction 18.1018.10 18.0018.00ImportsImports 0.010.01 0.010.01
Total SupplyTotal Supply 20.0620.06 19.7619.76
Mill UseMill Use 3.803.80 3.803.80ExportsExports 15.5015.50 13.5013.50
Total OfftakeTotal Offtake 19.3019.30 17.3017.30
Ending StocksEnding Stocks 1.751.75 2.502.50Stocks-to-Use RatioStocks-to-Use Ratio 9.1%9.1% 14.5%14.5%
2010/11e 2011/12p

U.S. Supply and DemandMillion Metric Tons
Beginning StocksBeginning Stocks 0.640.64 0.380.38ProductionProduction 3.943.94 3.923.92ImportsImports 0.000.00 0.000.00
Total SupplyTotal Supply 4.594.59 4.314.31
Mill UseMill Use 0.830.83 0.830.83ExportsExports 3.383.38 2.942.94
Total OfftakeTotal Offtake 4.204.20 3.773.77
Ending StocksEnding Stocks 0.380.38 0.540.54Stocks-to-Use RatioStocks-to-Use Ratio 9.1%9.1% 14.5%14.5%
2010/11e 2011/12p
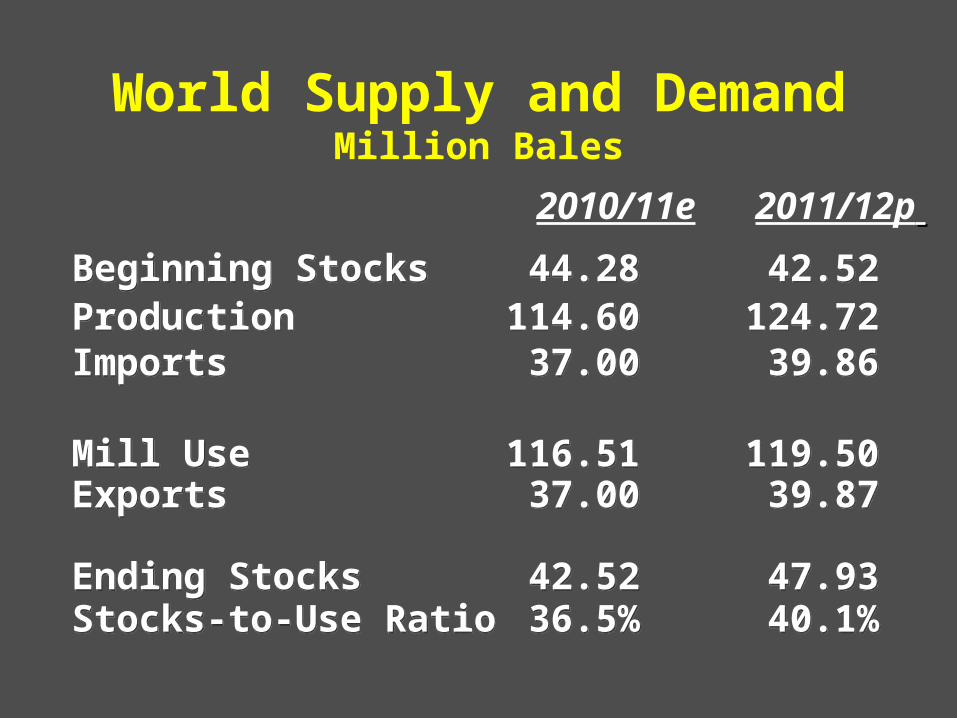
Beginning Stocks 44.28 42.52Production 114.60 124.72Imports 37.00 39.86
Mill Use 116.51 119.50Exports 37.00 39.87
Ending Stocks 42.52 47.93Stocks-to-Use Ratio 36.5% 40.1%
Beginning Stocks 44.28 42.52Production 114.60 124.72Imports 37.00 39.86
Mill Use 116.51 119.50Exports 37.00 39.87
Ending Stocks 42.52 47.93Stocks-to-Use Ratio 36.5% 40.1%
World Supply and DemandMillion Bales
2010/11e 2011/12p
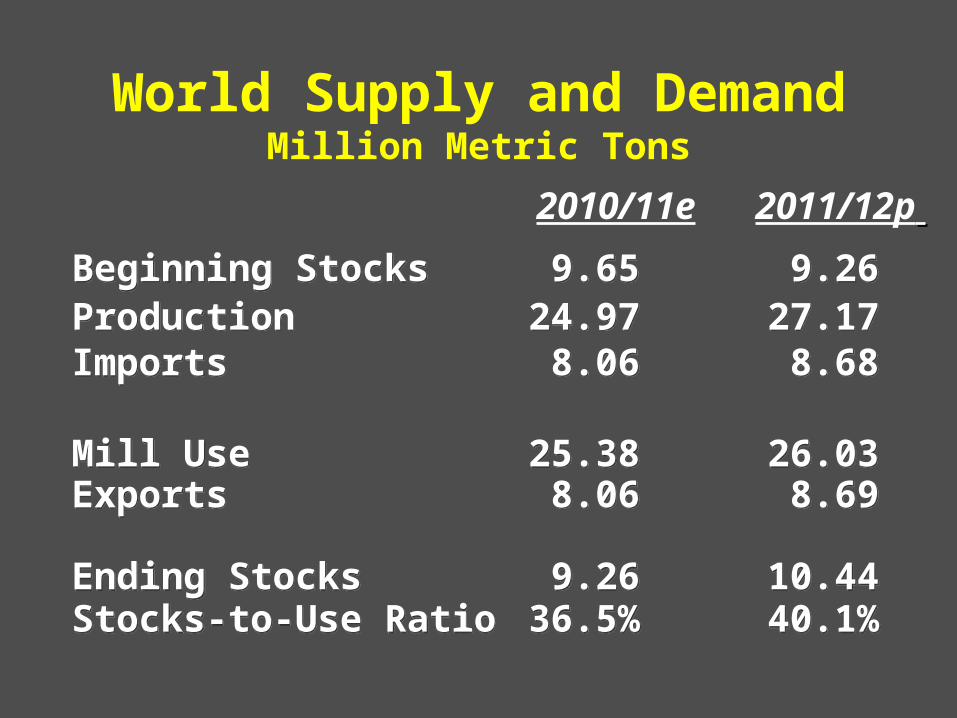
Beginning Stocks 9.65 9.26Production 24.97 27.17Imports 8.06 8.68
Mill Use 25.38 26.03Exports 8.06 8.69
Ending Stocks 9.26 10.44Stocks-to-Use Ratio 36.5% 40.1%
Beginning Stocks 9.65 9.26Production 24.97 27.17Imports 8.06 8.68
Mill Use 25.38 26.03Exports 8.06 8.69
Ending Stocks 9.26 10.44Stocks-to-Use Ratio 36.5% 40.1%
World Supply and DemandMillion Metric Tons
2010/11e 2011/12p
MerchantsMerchantsGinnersGinners CottonseedCottonseed
ProducersProducers
CooperativesCooperatives
WarehousesWarehousesManufacturersManufacturers
Related Documents