Model Documentation Report: Macroeconomic Activity Module (MAM) of the National Energy Modeling System May 2014 Independent Statistics & Analysis www.eia.gov U.S. Department of Energy Washington, DC 20585

Welcome message from author
This document is posted to help you gain knowledge. Please leave a comment to let me know what you think about it! Share it to your friends and learn new things together.
Transcript

Model Documentation Report: Macroeconomic Activity Module (MAM) of the National Energy Modeling System
May 2014
Independent Statistics & Analysis
www.eia.gov
U.S. Department of Energy
Washington, DC 20585
U.S. Energy Information Administration | NEMS Macroeconomic Activity Module Documentation Report i
This report was prepared by the U.S. Energy Information Administration (EIA), the statistical and
analytical agency within the U.S. Department of Energy. By law, EIA’s data, analyses, and forecasts are
independent of approval by any other officer or employee of the United States Government. The views
in this report therefore should not be construed as representing those of the U.S. Department of Energy
or other Federal agencies.

May 2014
U.S. Energy Information Administration | NEMS Macroeconomic Activity Module Documentation Report ii
Update Information
This edition of the Macroeconomic Activity Model (MAM) – Model Documentation 2014 reflects
changes made to the MAM over the past year for the Annual Energy Outlook 2014. These changes
include:
Updates to date ranges and programming code descriptions in the MAM source and input files
Updates to data for all the MAM models including factors used when assuming technology
penetration
Linked bulk chemical industry feedstock prices to NEMS ethane and petroleum feedstock prices
Combined textile, apparel, and leather industries to improve modeling of similar products
May 2014
U.S. Energy Information Administration | NEMS Macroeconomic Activity Module Documentation Report iii
Table of Contents
Update Information ...................................................................................................................................... ii
Introduction .................................................................................................................................................. 1
Part A. Macroeconomic Activity Module (MAM) of the National Energy Modeling System ....................... 2
1. Modeling System Overview ................................................................................................................ 2
IHS Global Insight’s Model of the U.S. Economy ..................................................................................... 4
IHS Global Insight’s Industrial Output Model .......................................................................................... 4
IHS Global Insight’s Employment by Industry Model .............................................................................. 4
U.S. Energy Information Administration’s Regional Economic Activity Model ....................................... 4
U.S. Energy Information Administration’s Regional Industrial Output and Employment by Industry
Models ..................................................................................................................................................... 4
U.S. Energy Information Administration’s Regional Commercial Floor Space Model ............................. 5
2. IHS Global Insight’s Model of the U.S. Economy ...................................................................................... 6
The Model’s Theoretical Position ............................................................................................................ 6
Major Sectors ........................................................................................................................................... 9
3. IHS Global Insight’s Industrial Output and Employment by Industry Models ....................................... 17
Industrial Output Model Overview ........................................................................................................ 17
The Input‐Output Block ......................................................................................................................... 17
Revenue/Output for Manufacturing Industries..................................................................................... 18
Revenue/Output for Non‐manufacturing Industries/Services .............................................................. 20
Aggregation to the NEMS Sectors ......................................................................................................... 21
Employment by Industry Model Overview ............................................................................................ 23
Total Non‐farm, Private Non‐farm and Government Employment ....................................................... 23
Manufacturing Employment .................................................................................................................. 24
Non‐manufacturing Employment .......................................................................................................... 26
Aggregation to the NEMS Sectors ......................................................................................................... 28
4. U.S. Energy Information Administration’s Regional Models .................................................................. 29
Overview ................................................................................................................................................ 29
Macroeconomic Variables ..................................................................................................................... 30
Industry Variables ........................................................................................................................... 38
Part B. THE MAM INTERFACE WITH THE NEMS .......................................................................................... 47
5. Integrated Simulations Using the MAM ........................................................................................... 47
May 2014
U.S. Energy Information Administration | NEMS Macroeconomic Activity Module Documentation Report iv
Integrated Simulations of Alternative Energy Conditions or Events ..................................................... 47
Model Levers and Simulation Rules ....................................................................................................... 49
6. Operation of MAM within NEMS ...................................................................................................... 63
Appendix A: VARIABLES AND CLASSIFICATIONS IN MAM MODELS ........................................................... 74
Macroeconomic Model Detail ............................................................................................................... 74
Regional Model Detail ........................................................................................................................... 89
Appendix B: MAM Inputs and Outputs ...................................................................................................... 93
Introduction ........................................................................................................................................... 93
Appendix C: Equations in Regional Submodule ....................................................................................... 132
Appendix C1: Regional Macroeconomic Model ................................................................................. 132
Appendix C2: Regional Commercial Floorspace Model ...................................................................... 136
Appendix C3: Regional Industrial Output and Employment Models .................................................. 155
Regional Industrial Output Model ................................................................................................. 155
Regional Employment Model ........................................................................................................ 216
May 2014
U.S. Energy Information Administration | NEMS Macroeconomic Activity Module Documentation Report v
Tables
Table A1. Real personal consumption* ...................................................................................................... 74
Table A2. Real business investment* .......................................................................................................... 75
Table A3. Real residential investment* ...................................................................................................... 76
Table A4. Key federal government expenditure* ....................................................................................... 77
Table A5. Key State & local government expenditure variables* ............................................................... 78
Table A6. Components of nominal national income* ................................................................................ 79
Table A7. Components of nominal personal income* ................................................................................ 80
Table A8. Key variables in the tax sector* .................................................................................................. 81
Table A9. Key variables in the trade sector* .............................................................................................. 82
Table A10. Key variables in the financial sector* ....................................................................................... 83
Table A11. Macroeconomic expenditure categories driving the industry model ...................................... 84
Table A12. Detailed Sector Classification for Industry and Employment Models ...................................... 86
Table A13. Regional economic variables .................................................................................................... 89
Table A14. Regional industry output and employment .............................................................................. 90
Table A15. Commercial floorspace types ................................................................................................... 92
Table B1. MAM input and output files ........................................................................................................ 95
Table B2. MAM input controls and parameters ......................................................................................... 97
Table B3. NEMS input variables for MAM national submodule ................................................................. 99
Table B4. Energy industry and employment growth determined by NEMS results ................................. 109
Table B5. MC_NATIONAL output variables ............................................................................................... 110
Table B6. MC_INDUSTRIAL output variables (variables by region) .......................................................... 112
Table B7. MC_EMPLOYMENT output variables ........................................................................................ 114
Table B8. MC_VEHICLES output variables ................................................................................................ 116
Table B9. MC_REGIONAL output variables ............................................................................................... 117
Table B10. MC_REGMAC output variables (variables by region) ............................................................. 121
Table B11. MC_COMMFLR output variables (variables by region) ........................................................... 122
Table B12. MC_REGEMP output variables (variables by region) .............................................................. 123
Table B13. MC_REGIO output variables (variables by region) .................................................................. 125
Table B14. MAM variables used by other NEMS modules ....................................................................... 127
May 2014
U.S. Energy Information Administration | NEMS Macroeconomic Activity Module Documentation Report vi
Figures
Figure 1. Macroeconomic Activity Module Flow ........................................................................................ 56
Figure 2. Macroeconomic Submodule Flow ............................................................................................... 57
Figure 3. Industry Submodule – Industry Model ........................................................................................ 58
Figure 4. Industry Submodule – Employment by Industry Model .............................................................. 59
Figure 5. Regional Submodule – Regional Macroeconomic Model ............................................................ 60
Figure 6. Regional Submodule –Regional Building Model .......................................................................... 61
Figure 7. Regional Submodule – Regional Industry and Employment by Industry Model ......................... 62
Figure 8. Flow of Control within MAM........................................................................................................ 67
Figure 9. Subroutine READMAC .................................................................................................................. 68
Figure 10. Subroutine DRTLINK ................................................................................................................... 69
Figure 11. Subroutine INDUSTSUB .............................................................................................................. 70
Figure 12. Subroutine REGIONSUB ............................................................................................................. 70
Figure 13. Subroutine EMPLOYMENT ......................................................................................................... 71
Figure 14. Subroutine COMFLR ................................................................................................................... 71
Figure 15. Subroutine TRANC ...................................................................................................................... 72
Figure 16. Subroutine MACOUTPUT ........................................................................................................... 73
May 2014
U.S. Energy Information Administration | NEMS Macroeconomic Activity Module Documentation Report 1
Introduction
The National Energy Modeling System (NEMS) is a comprehensive, mid‐term energy forecasting and policy
analysis tool used by the EIA. The NEMS projects energy supply, demand, prices, and environmental emissions,
by region, given assumptions about the state of the economy, international markets, and energy policies. The
Macroeconomic Activity Module (MAM) links the NEMS to the rest of the economy by providing projections of
economic driver variables for use by the supply, demand, and conversion modules of the NEMS. The MAM’s
baseline economic projection contains the initial economic assumptions used in the NEMS to help determine
energy demand and supply. The MAM can also provide the NEMS with alternative economic assumptions
representing a range of uncertainty about economic growth. Different assumptions regarding the path of world
oil prices or of the penetration of new technologies can also be modeled in the MAM. The resulting economic
impacts of such assumptions are inputs to the remaining supply and demand modules of the NEMS (Table B14 in
Appendix B on page 127). Outside of the Annual Energy Outlook (AEO) setting, the MAM represents a system of
linked modules capable of assessing the potential impacts on the economy of changes in energy events or of
policy proposals as specified by a non‐EIA requestor. These economic impacts result from assumptions about
energy events resulting from policy proposals built into the NEMS. The linked modules of the NEMS then iterate
to a solution.
This report documents the objectives and analytical approach of the MAM that is used to develop the Annual
Energy Outlook for 2014 (AEO2014). It serves as a reference document providing a description of the MAM
used for the AEO2014 production runs for model analysts, users, and the public. It also facilitates continuity in
model development by providing documentation from which energy analysts can undertake model
enhancement and modifications. This documentation report is divided into two separate components.
Part A presents the structural models comprising the MAM. These include:
IHS Global Insight’s model of the U.S. economy
IHS Global Insight’s models of industrial output and of employment by industry
U.S. Energy Information Administration’s models of the regional economies
Part B focuses on the MAM’s interface with the NEMS. This section identifies the set of model levers and
simulation rules used to operate the system. It also provides a discussion of three types of integrated
simulations carried out with the NEMS. This section also views the MAM from the perspective of a programmer
focusing on the ties that link the various models together to form the MAM and how the MAM communicates
with the NEMS.
Appendices A and B provide detailed information on variable listings and sectoral definitions.
Appendix C provides a detailed listing of the equations for the regional models.
May 2014
U.S. Energy Information Administration | NEMS Macroeconomic Activity Module Documentation Report 2
Part A. Macroeconomic Activity Module (MAM) of the National Energy Modeling System
1. Modeling system overview Economic activity driving the National Energy Modeling System (NEMS) is determined by an economic modeling
system comprised of three sets of models:
IHS Global Insight’s model of the U.S. economy
IHS Global Insight’s industrial output and employment by industry models
U.S. Energy Information Administration’s (EIA) regional models
IHS Global Insight’s model of the U.S. economy is the same model used by IHS Global Insight, Inc. to produce its
economic forecasts for the company’s monthly assessment of the U.S. economy. The IHS Global Insight U.S.
model used for the AEO2014 is the US2013A version. EIA’s Industrial Output and Employment by Industry
Models are derivatives of IHS Global Insight’s industrial output and employment by industry models. The
models have been tailored in order to provide the industrial output and employment by industry detail required
by the NEMS modeling system. EIA’s regional models consist of models of economic activity, industrial output,
employment by industry and commercial floor space. The first two models were developed during 2004 for use
in the preparation of the AEO2005 and are updated annually. The regional models were re‐estimated for the
AEO 2010.
All of the MAM models are linked to provide a fully integrated approach to estimating economic activity at the
national, industrial and regional levels. IHS Global Insight’s model of the U.S. economy determines the national
economy's growth path and the final demand mix. EIA’s Industrial Output Model ensures that supply by
industry is consistent with the final demands (consumption, investment, government spending, exports and
imports) calculated in the U.S. model. Industrial output is the key driver of the employment estimation in EIA’s
Employment by Industry model. The employment by industry projection also uses aggregate hours per week
and productivity trends found in the U.S. model. The employment by industry projection is aligned with the
aggregate employment estimation of the U.S. model. Key inputs to EIA’s regional models include projections of
national output, employment by industry, population, national income and housing activity. EIA’s regional
models then calculate levels of industrial output, employment by industry, population, incomes, and housing
activity for each of the nine Census Divisions. The sum of each of these concepts across the nine Census
Divisions is aligned with the national totals estimated by the U.S. model. Together, these models of the U.S.
economy, industrial output, employment by industry and of regional economic activity constitute the
Macroeconomic Activity Module (MAM) of the National Energy Modeling System (NEMS).
May 2014
U.S. Energy Information Administration | NEMS Macroeconomic Activity Module Documentation Report 3
Before the MAM can execute its suite of models, it requires exogenous assumptions regarding energy prices,
consumption and domestic production. Over seventy energy prices and quantities are extracted from the
output of the demand and supply modules of the NEMS. Transformations of the exogenous assumptions are
necessary to map these inputs from the NEMS into more aggregated concepts in the MAM. After the
appropriate transformations are done, the U.S., Industrial Output, Employment by Industry and Regional Models
execute in sequence to produce an estimate of economic activity at the national, industrial and regional levels.
Drawn from the projections are economic driver variables that are then passed to the supply, demand and
conversion modules of the NEMS (Table B14 in Appendix B on page 127). The NEMS then reacts to the new
economic activity assumptions. Estimates of energy prices and quantities based upon these new economic
assumptions are then passed back to the MAM. A NEMS “cycle” is completed once all the modules of the NEMS
solve. Cycles are repeated as the NEMS iterates to a stable solution.
There are a few industrial output and employment by industry concepts whose projections in the MAM are
determined by the NEMS. The MAM’s results for industrial output of the five energy‐related sectors are based
upon growth rates extracted from the appropriate modules in the NEMS. The growth rates in output of
petroleum refining, coal mining, oil and gas extraction, electric utilities and gas utilities are applied to the last
historical value of the appropriate series in the MAM’s Industrial Output Model (Table B4 in Appendix B on page
109). A similar computation is done for employment by industry but for only two of the five energy sectors.
Growth in employment is computed for coal mining and for oil and gas extraction using projections from the
appropriate NEMS modules. These growth rates are then applied to the last historical value of the appropriate
series in the MAM’s employment by industry model.

May 2014
U.S. Energy Information Administration | NEMS Macroeconomic Activity Module Documentation Report 4
IHS Global Insight’s Model of the U.S. Economy Key Inputs: National population by age cohort, total factor productivity, federal tax rates and nominal
expenditures, money supply, energy prices and quantities and GDP of major and other important trading
partners.
Key Outputs: Final demands (consumption, investment, government purchases, exports, imports), inflation,
foreign exchange and interest rates, incomes, employment, federal and state/local government revenues and
expenditures and balance of payments.
IHS Global Insight’s Industrial Output Model Key Inputs: Final demands, prices and productivity measures from IHS Global Insight’s model of the U.S.
economy and input‐output coefficient matrix.
Key Outputs: Real output value (defined by value of shipments or revenue) for 64 industrial and service sectors.
IHS Global Insight’s Employment by Industry Model Key Inputs: Industrial outputs from the industrial output model, capital service cost determinants, productivity
measures and total employment from IHS Global Insight’s model of the U.S. economy.
Key Outputs: Employment for 59 industrial and service sectors.
U.S. Energy Information Administration’s Regional Economic Activity Model Key Inputs: National gross domestic product, wages, incomes, population, housing activity and prices from IHS
Global Insight’s model of the U.S. economy. State population estimates and projections from the U.S. Bureau of
the Census.
Key Outputs: Wages and salaries, personal income, disposable income, population and housing activity for the
nine Census Divisions.
U.S. Energy Information Administration’s Regional Industrial Output and Employment by Industry Models Key Inputs: National sectoral output, prices and employment from the industrial output and employment by
industry models; regional gross product, disposable income, prices, interest rates, population, wages and
salaries and housing activity from the regional economic activity model.
Key Outputs: Output values for 42 industrial sectors and employment for 44 industrial output and service
sectors for the nine Census Divisions.
May 2014
U.S. Energy Information Administration | NEMS Macroeconomic Activity Module Documentation Report 5
U.S. Energy Information Administration’s Regional Commercial Floor Space Model Key Inputs: Gross domestic product, consumer spending, employment, private investment, change in business
inventories, interest rates, population and lagged values of additions and stocks.
Key Outputs: Commercial floor space in thousand square feet for 13 commercial floor space types in each of the
nine Census Divisions.
Each of these models is discussed below, with further detail presented in the Appendices to this document.
May 2014
U.S. Energy Information Administration | NEMS Macroeconomic Activity Module Documentation Report 6
2. IHS Global Insight’s Model of the U.S. Economy
The model’s theoretical position Econometric models built in the 1950s and 1960s were largely Keynesian income‐expenditure systems that
assumed a closed domestic economy. High computation costs involving statistical estimation and model
manipulation, along with the underdeveloped state of macroeconomic theory, limited the size of the models
and the richness of the linkages of spending to financial conditions, inflation, and international developments.
Since that time, however, computer costs have fallen spectacularly; macroeconomic theory has also benefited
from five decades of postwar data observation and from the intellectual attention of many eminent economists.
An Econometric Dynamic Equilibrium Growth Model: IHS Global Insight’s model of the U.S. economy strives to
incorporate the best insights of many theoretical approaches to the business cycle: Keynesian, neoclassical,
monetarist, supply‐side and rational expectations. In addition, IHS Global Insight’s model of the U.S. economy
embodies the major properties of the long‐term growth models presented by James Tobin, Robert Solow,
Edmund Phelps and others. This structure guarantees that short‐run cyclical developments will converge to a
robust long‐run equilibrium.
In growth models, the expansion rates of technical progress, the labor force and the capital stock, both physical
capital and human capital, determine the productive potential of an economy. Both technical progress and the
capital stock are governed by investment, which in turn must be in balance with post‐tax capital costs, available
savings and the capacity requirements of current spending. As a result, monetary and fiscal policies will
influence both the short‐ and the long‐term characteristics of such an economy through their impacts on
national saving and investment.
A modern model of output, prices and financial conditions is melded with the growth model to present detailed,
short‐run dynamics of the economy. In specific goods markets, the interactions of a set of supply and demand
relations jointly determine spending, production, and price levels. Typically, the level of inflation‐adjusted
demand is driven by prices, income, wealth, expectations and financial conditions. The capacity to supply goods
and services is keyed to a production function combining the basic inputs of labor hours, energy usage, and the
capital stocks of business equipment and structures and government infrastructure. The “total factor
productivity” of this composite of tangible inputs is driven by expenditures on research and development that
produce technological progress.
Prices adjust in response to short‐run gaps between current production and supply potential and to changes in
the cost of inputs. Wages adjust to labor supply‐demand gaps (indicated by a demographically‐adjusted
unemployment rate), current and expected inflation (with a unit long‐run elasticity), productivity, tax rates and
minimum wage legislation. The supply of labor responds positively to the perceived availability of jobs, to the
after‐tax wage level and to the growth and age‐gender mix of the population. Demand for labor is keyed to the
level of output in the economy and to the productivity of labor, capital and energy. Because the capital stock
does not change much in the short run, a higher level of output requires more employment and energy inputs.
Such increases are not necessarily equal to the percentage increase in output because of the improved
efficiencies typically achieved during an upturn. Tempering the whole process of wage and price determination
is the exchange rate; a rise signals prospective losses of jobs and markets unless costs and prices are reduced.

May 2014
U.S. Energy Information Administration | NEMS Macroeconomic Activity Module Documentation Report 7
For financial markets, the model predicts exchange rates, interest rates, stock prices, loans and investments
interactively with the preceding GDP and inflation variables. The Federal Reserve sets the supply of reserves in
the banking system and the fractional reserve requirements for deposits. Private sector demands to hold
deposits are driven by national income, expected inflation and by the deposit interest yield relative to the yields
offered on alternative investments. Banks and other thrift institutions, in turn, set deposit yields based on the
market yields of their investment opportunities with comparable maturities and on the intensity of their need to
expand reserves to meet legal requirements. In other words, the contrast between the supply and demand for
reserves sets the critical short‐term interest rate for interbank transactions, the federal funds rate. Other
interest rates are keyed to this rate, plus expected inflation, Treasury borrowing requirements and sectoral
credit demand intensities.
The old tradition in macroeconomic model simulations of exogenous fiscal policy changes was to hold the
Federal Reserve’s supply of reserves constant at baseline levels. While this approach makes static analysis
easier in the classroom, it sometimes creates unrealistic policy analyses when a dynamic model is appropriate.
In IHS Global Insight’s model of the U.S. economy, “monetary policy” is defined by a set of targets, instruments
and regular behavioral linkages between targets and instruments. The model user can choose to define
unchanged monetary policy as unchanged reserves, or as an unchanged reaction function in which interest rates
or reserves are changed in response to changes in such policy concerns as the price level and the unemployment
rate.
Monetarist aspects: The model pays due attention to valid lessons of monetarism by carefully representing the
diverse portfolio aspects of money demand and by capturing the central bank's role in long‐term inflationary
trends.
The private sector may demand money balances as one portfolio choice among transactions media (currency,
checkable deposits), investment media (bonds, stocks, short‐term securities) and durable assets (homes, cars,
equipment, structures). Given this range of choices, each asset’s implicit and explicit yield must therefore match
expected inflation, offset perceived risk and respond to the scarcity of real savings. Money balances provide
benefits by facilitating spending transactions and can be expected to rise nearly proportionately with
transactions requirements unless the yield of an alternative asset changes.
Now that even demand deposit yields can float to a limited extent in response to changes in Treasury bill rates,
money demand no longer shifts quite as sharply when market rates change. Nevertheless, the velocity of
circulation (the ratio of nominal spending to money demand) is still far from stable during a cycle of monetary
expansion or contraction. Thus the simple monetarist link from money growth to price inflation or nominal
spending is considered invalid as a rigid short‐run proposition.
Equally important, as long‐run growth models demonstrate, induced changes in capital formation can also
invalidate a naive long‐run identity between monetary growth and price increases. Greater demand for physical
capital investment can enhance the economy's supply potential in the event of more rapid money creation or
new fiscal policies. If simultaneous, countervailing influences deny an expansion of the economy's real
potential, the model will translate all money growth into a proportionate increase in prices rather than in
physical output.

May 2014
U.S. Energy Information Administration | NEMS Macroeconomic Activity Module Documentation Report 8
Supply‐side economics: Since 1980, supply‐side political economists have pointed out that the economy's
growth potential is sensitive to the policy environment. They focused on potential labor supply, capital spending
and savings impacts of tax rate changes. IHS Global Insight’s model of the U.S. economy embodies supply‐side
hypotheses to the extent supportable by empirical evidence embodied in the available data. This is considerable
in the many areas that supply‐side hypotheses share with long‐run growth models. These features, however,
have been fundamental ingredients of the model since 1976.
Rational expectations: As the rational expectations school has pointed out, much of economic decision‐making
is forward looking. For example, the decision to buy a car or a home is not only a question of current
affordability but also one of timing. The delay of a purchase until interest rates or prices decline has become
particularly common since the mid‐1970s when both inflation and interest rates were very high and volatile.
Consumer sentiment surveys, such as those conducted by the University of Michigan Survey Research Center,
clearly confirm this speculative element in spending behavior.
However, households can be shown to base their expectations, to a large extent, on their past experiences:
they believe that the best guide to the future is an extrapolation of recent economic conditions and the changes
in those conditions. Consumer sentiment about whether this is a “good time to buy” can therefore be
successfully modeled as a function of recent levels and changes in employment, interest rates, inflation and
inflation expectations. Similarly, inflation expectations (influencing financial conditions) and market strength
expectations (influencing inventory and capital spending decisions) can be modeled as functions of recent rates
of increase in prices and spending.
This largely retrospective approach is not, of course, wholly satisfactory to pure adherents of the rational
expectations doctrine. In particular, this group argues that the announcement of macroeconomic policy
changes would significantly influence expectations of inflation or growth prior to any realized change in prices or
spending. If an increase in government expenditures is announced, the argument purports, expectations of
higher taxes to finance the spending might lead to lower consumer or business spending in spite of temporarily
higher incomes from the initial government spending stimulus. A rational expectations theorist would thus
argue that multiplier effects will tend to be smaller and more short‐lived than a mainstream economist would
expect.
These propositions are subject to empirical evaluation. IHS Global Insight’s conclusions are that expectations do
play a significant role in private sector spending and investment decisions; but, until change has occurred in the
economy, there is very little room for significant changes in expectations in advance of an actual change in the
variable about which the expectation is formed. The rational expectations school thus correctly emphasizes a
previously understated element of decision‐making, but exaggerates its significance for economic policy‐making
and model building.
IHS Global Insight’s model of the U.S. economy allows a choice in this matter. On the one hand, the user can
simply accept IHS Global Insight's judgments and let the model translate policy initiatives into initial changes in
the economy, simultaneous or delayed changes in expectations, and subsequent changes in the economy. On
the other hand, the user can manipulate the clearly identified expectations variables in the model, i.e.,
consumer sentiment, and inflation expectations. For example, if the user believes that fear of higher taxes
would subdue spending; the user could reduce the consumer sentiment index.
May 2014
U.S. Energy Information Administration | NEMS Macroeconomic Activity Module Documentation Report 9
Theory as a constraint: The conceptual basis of each equation in IHS Global Insight’s model of the U.S. economy
was thoroughly worked out before the regression analysis was initiated. The list of explanatory variables
includes a carefully selected set of demographic and financial inputs. Each estimated coefficient was then
thoroughly tested to be certain that it met the tests of modern theory and business practice. This attention to
equation specification and coefficient results has eliminated the “short circuits” that can occur in evaluating a
derivative risk or an alternative policy scenario. Because each equation will stand up to a thorough inspection,
IHS Global Insight’s model is a reliable analytical tool and can be used without excessive iterations. The model is
not a black box: it functions like a personal computer spreadsheet in which each interactive cell has a carefully
computed, theoretically consistent entry and thus performs logical computations simultaneously.
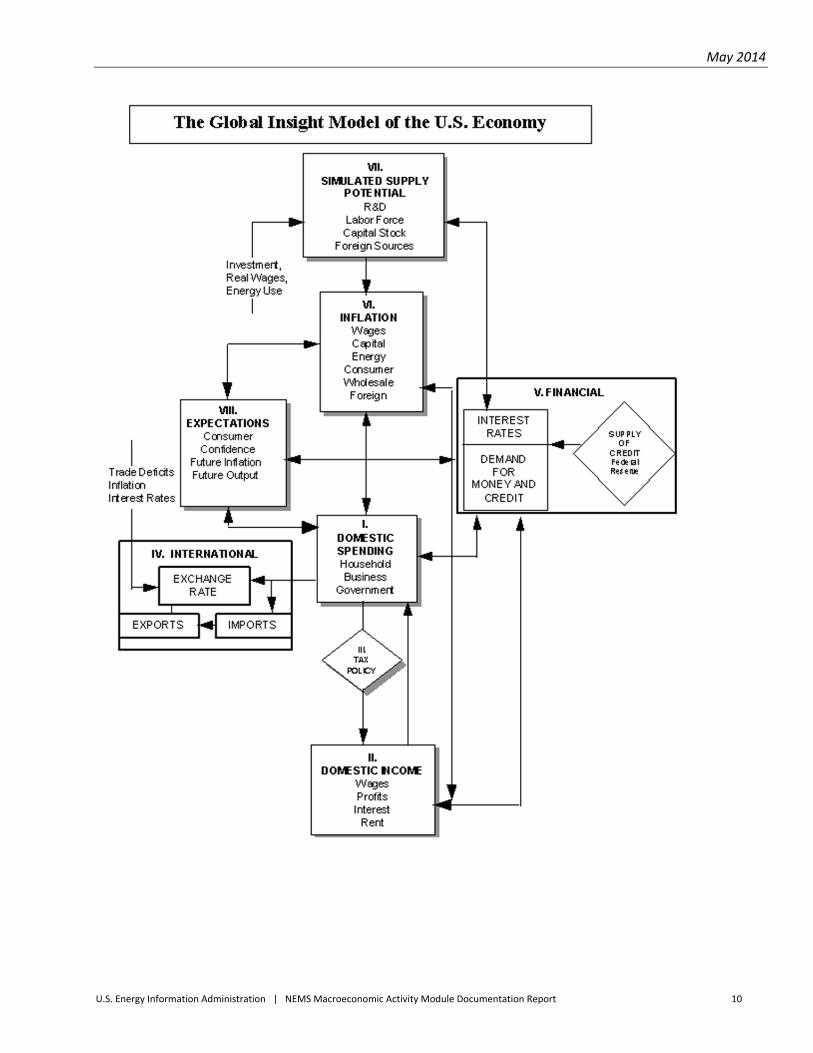
Major sectors IHS Global Insight’s model of the U.S. economy captures the full simultaneity of the U.S. economy, forecasting
over 1700 concepts spanning final demands, aggregate supply, prices, incomes, international trade, industrial
detail, interest rates and financial flows. The chart below summarizes the structure of the eight interactive
sectors (in Roman numerals). The following discussion presents the logic of each sector and significant
interactions with other sectors.
May 2014
U.S. Energy Information Administration | NEMS Macroeconomic Activity Module Documentation Report 10
May 2014
U.S. Energy Information Administration | NEMS Macroeconomic Activity Module Documentation Report 11
Spending ‐ consumer: The domestic spending (I), income (II) and tax policy (III) sectors model the central
circular flow of behavior as measured by the national income and product accounts. If the rest of the model
were “frozen”, these blocks would produce a Keynesian system similar to the models pioneered by Tinbergen
and Klein, except that neoclassical price factors have been imbedded in the investment and other primary
demand equations.
Consumer spending on durable goods is divided into nine categories: light vehicles; used automobiles; motor‐
vehicle parts; other vehicles; computers; software; other household equipment and furnishings; ophthalmic and
orthopedic products and “other”. Spending on non‐durable goods is divided into nine categories: three food
categories, clothing and shoes, gasoline and oil, fuel oil and coal, tobacco, drugs and “other”. Spending on
services is divided into 16 categories: housing, six household operation subcategories, four transportation
categories, medical care, recreation, two personal business service categories and other services (see Table A1
in Appendix A on page 76). In nearly all cases, real consumption expenditures are motivated by real income and
the consumer price of a particular category relative to the prices of other consumer goods. Durable and semi‐
durable goods are also especially sensitive to current financing costs, and consumer speculation on whether it is
a “good time to buy”. The University of Michigan Survey of Consumer Sentiment monitors this last influence;
with the index itself modeled as a function of current and lagged values of inflation, unemployment and the
prime rate.
Spending ‐ business investment: Business spending includes nine fixed investment categories for equipment
and seven for construction: four information processing equipment categories, industrial equipment, three
transportation equipment categories, other producers’ durable equipment, four building categories, mines and
wells, and two public utility structures (see Table A2 in Appendix A on page 77). Equipment and business
structures (non‐utility, non‐mining) spending components are determined by their specific effective post‐tax
capital costs, capacity utilization and replacement needs. The cost terms are sophisticated blends of post‐tax
debt and equity financing costs (offset by expected capital gains) and the purchase price of the investment good
(offset by possible tax credits and depreciation‐related tax benefits). This updates the well‐known work of Dale
Jorgenson, Robert Hall and Charles Bischoff.
Given any cost/financing environment, the need to expand capacity is monitored by recent growth in national
goods output weighted by the capital intensity of such production. Public utility structure expenditures are
motivated by similar concepts except that the output terms are restricted to utility output rather than total
national goods output. Net investment in mining and petroleum structures responds to movements in real
domestic oil prices and to oil and natural gas production.
Inventory demand is the most erratic component of GDP, reflecting the pro‐cyclical, speculative nature of the
private sector, which accumulates during booms and is drawn down during downturns. The forces that drive
the five non‐farm inventory categories are changes in spending, short‐term interest rates and expected inflation,
surges in imports and changes in capacity utilization or the speed of vendor deliveries. Unexpected increases in
demand lead to an immediate draw down of stocks that are then rebuilt over time; the reverse naturally holds
for sudden reductions in final demand. Inventory demands are sensitive to the cost of holding the stock,
measured by such terms as interest costs adjusted for expected price increases and by variables monitoring the
presence of bottlenecks. The cost of a bottleneck that slows delivery times is lost sales: an inventory spiral can
May 2014
U.S. Energy Information Administration | NEMS Macroeconomic Activity Module Documentation Report 12
therefore be set in motion when all firms accelerate their accumulation during a period of strong growth but
then try to deplete excessive inventories when the peak is past.
Spending ‐ residential investment: The residential investment sector of the model includes two housing starts
(single and multi‐family starts) and three housing sales categories (new and existing single family sales and new
single family units for sale). Housing starts and sales, in turn, drive investment demand in five GDP account
categories: single family housing; multi‐family housing; improvements; other residential structure and
residential equipment (see Table A3 in Appendix A on page 78).
Residential construction is typically the first sector to contract in a recession and the first to rebound in a
recovery. Moreover, the magnitude of the building cycle is a prominent determinant of the subsequent
macroeconomic cycles. The housing sector of IHS Global Insight’s model of the U.S. economy explains new
construction as a decision primarily based upon the after‐tax cost of home ownership relative to disposable
income. This cost is estimated as the product of the average new home price adjusted for changes in quality;
and the mortgage rate, plus operating costs, property taxes and an amortized down payment. “Lever variables”
allow the model user to specify the extent to which mortgage interest payments, property taxes and
depreciation allowances (for rental properties) produce tax deductions that reduce the effective cost.
The equations also include a careful specification of demographic forces. After estimating changes in the
propensity of specific age‐gender groups to form independent households, the resulting “headship rates” are
multiplied by corresponding population statistics to estimate the trend expansion of single‐ and multi‐family
households. The housing equations are then specified to explain current starts relative to the increase in trend
households over the past year, plus pent‐up demand and replacement needs. The basic phenomenon being
scrutinized is therefore the proportion of the trend expansion in households whose housing needs are met by
current construction. The primary determinants of this proportion are housing affordability, consumer
confidence and the weather. Actual construction spending in the GDP accounts is the value of construction
“put‐in‐place” in each period after the start of construction (with a lag of up to six quarters in the case of multi‐
family units), plus residential improvements and brokerage fees.
Spending ‐ government: The last sector of domestic demand for goods and services, that of the government, is
largely exogenous (user‐determined) at the federal level and endogenous (equation‐determined) at the state
and local level. The user sets the real level of federal non‐defense and defense purchases (for compensation,
consumption of fixed capital, Commodity Credit Corporation inventory change, other consumption and gross
investment), medical and non‐medical transfer payments, and medical and non‐medical grants to state and local
governments. The model calculates the nominal values through multiplication by the relevant estimated prices.
Transfers to foreigners, wage accruals and subsidies (agricultural, housing and other) are also specified by the
user, but in nominal dollars. One category of federal government spending – net interest payments – is
determined within the model because of its dependence on the model’s financial and tax sectors. Net federal
interest payments are determined by the level of privately‐held federal debt, short and long‐term interest rates
and the maturity of the debt (see Table A4 in Appendix A on page 79).
The presence of a large and growing deficit imposes no constraint on federal spending. This contrasts sharply
with the state and local sector where legal requirements for balanced budgets mean that declining surpluses or
emerging deficits produce both tax increases and reductions in spending growth. State and local purchases (for
May 2014
U.S. Energy Information Administration | NEMS Macroeconomic Activity Module Documentation Report 13
compensation, consumption of fixed capital, other consumption and construction) are also driven by the level of
federal grants (due to the matching requirements of many programs), population growth and trend increases in
personal income (see Table A5 in Appendix A on page 80).
Income: Domestic spending, adjusted for trade flows, defines the economy's value‐added or gross national
product (GNP) and gross domestic product (GDP). Because all value‐added must accrue to some sector of the
economy, the expenditure measure of GNP (GDP plus net exports of factor services) also determines the
nation's gross income. The distribution of income among households, business, and government is determined
in sectors II and III of the model.
Pre‐tax income categories include private and government wages, corporate profits, interest, rent and
entrepreneurial returns. Each pre‐tax income category except corporate profits is determined by some
combination of wages, prices, interest rates, debt levels and capacity utilization or unemployment rates. In
some cases such as wage income, these are identities based on previously calculated wage rates, employment
and hours per week.
Profits are logically the most volatile component of GNP on the income side. When national spending changes
rapidly, the contractual arrangements for labor, borrowed funds and energy imply that the return to equity
holders is a residual that will soar in a boom and collapse in a recession. The model reflects this by calculating
wage, interest and rental income as thoroughly reliable near‐identities (e.g., wages equal average earnings
multiplied by hours worked) and then subtracting each non‐profit item from national income to solve for profits
(see Tables A6 and A7 in Appendix A on pages 81 and 82).
Taxes: Since post‐tax rather than pre‐tax incomes drive expenditures, each income category must be taxed at
an appropriate rate; the model therefore tracks personal, corporate, payroll and excise taxes separately. Users
may set federal tax rates; tax revenues are then simultaneously calculated as the product of the rate and the
associated pre‐tax income components. However, the model automatically adjusts the effective average
personal tax rate for variations in inflation and income per household and the effective average corporate rate
for credits earned on equipment, utility structures and R&D. Substitutions or additions of “flat” taxes and value‐
added taxes for existing taxes are accomplished with specific tax rates and new definitions of tax bases. As
appropriate, these are aggregated into personal, corporate or excise tax totals.
State and local corporate profits and social insurance (payroll) tax rates are exogenous in the model, while
personal income and excise taxes are fully endogenous: the U.S. model makes reasonable adjustments
automatically to press the sector toward the legally‐required approximate budget balance. The average
personal tax rate rises with income and falls with the government‐operating surplus. Property and sales taxes
provide the bulk of state excise revenue and reflect changes in oil and natural gas production, gasoline
purchases and retail sales, as well as revenue requirements. The feedback from expenditures to taxes and taxes
to expenditures works quite well in reproducing both the secular growth of the state and local sector and its
cyclical volatility (see Table A8 in Appendix A on page 83).
International: The international sector (IV) is a critical, fully simultaneous block that can either add or divert
strength from the central circular flow of domestic income and spending. Depending on the prices of foreign
output, the U.S. exchange rate and competing domestic prices, imports capture varying shares of domestic
demand.

May 2014
U.S. Energy Information Administration | NEMS Macroeconomic Activity Module Documentation Report 14
Depending on similar variables and the level of world gross domestic product, exports can add to domestic
spending on U.S. production. The exchange rate itself responds to international differences in inflation, interest
rates, trade deficits and capital flows between the U.S. and its competitors. In preparing forecasts, IHS Global
Insight's U.S. Economic Service and the World Service collaborate in determining internally consistent trade
prices and volumes, interest rates and financial flows.
Eight categories of goods and one of services are modeled separately for both imports and exports, with one
additional goods category for oil imports (see Table A9 in Appendix A on page 84). For example, export and
import detail for business machines is included as a natural counterpart to the inclusion of the office equipment
component of producers' durable equipment spending. The business machines detail allows more accurate
analysis because computers are rapidly declining in effective quality‐adjusted prices relative to all other goods,
and because such equipment is rising rapidly in prominence as businesses push ahead with new production and
information processing technologies.
Investment income flows are also explicitly modeled. The stream of huge current account deficits incurred by
the U.S. has important implications for the U.S. investment income balance. As current account deficits
accumulate, the U.S. net international investment position and the U.S. investment income balance deteriorate.
U.S. foreign assets and liabilities are therefore included in the model, with the current account deficit
determining the path of the net investment position.
The reactions of overseas prices, interest rates and GDP to U.S. development are robust and automatic. In the
case of depreciation in the dollar, for example, U.S. activity may expand at the expense of foreign activity and
U.S. inflation may rise while the rate in other countries slows.
Financial: The use of a detailed financial sector (V) and of interest rate and wealth effects in the spending
equations recognizes the importance of credit conditions on the business cycle and on the long‐run growth
prospects for the economy.
Interest rates, the key output of this sector, are modeled as a term structure, pivoting off the federal funds rate.
As noted earlier, the model gives the user the flexibility of using the supply of reserves as the key monetary
policy instrument, reflecting the Federal Reserve's open market purchases or sales of Treasury securities, or
using a reaction function as the policy instrument. If the supply of reserves is chosen as the policy instrument,
the federal funds rate depends upon the balance between the demand
May 2014
U.S. Energy Information Administration | NEMS Macroeconomic Activity Module Documentation Report 15
and supply of reserves to the banking system. Banks and other thrift institutions demand reserves to meet the
reserve requirements on their deposits and the associated (exogenous) fractional reserve requirements. The
private sector in turn demands deposits of various types, depending on current yields, income, and expected
inflation.
If the reaction function is chosen as the monetary policy instrument, the federal funds rate is determined in
response to changes in such policy concerns as inflation and unemployment. The reaction function recognizes
that monetary policy seeks to stabilize prices (or to sustain a low inflation rate) and to keep the unemployment
rate as close to the natural rate as is consistent with the price objective. A scenario designed to display the
impact of a fiscal policy change in the context of unchanged monetary policy is arguably more realistic when
unchanged or traditional reactions to economic cycles are recognized, than when the supply of reserves is left
unchanged.
Longer‐term interest rates are driven by shorter‐term rates as well as factors affecting the slope of the yield
curve. In IHS Global Insight’s model of the U.S. economy, such factors include inflation expectations, government
borrowing requirements and corporate financing needs. The expected real rate of return varies over time and
across the spectrum of maturities. An important goal of the financial sector model is to both capture the
persistent elements of the term structure and to interpret changes in this structure. Twenty‐four interest rates
are covered in order to meet client needs regarding investment and financial allocation strategies (see Table A10
in Appendix A on page 85).
Inflation: Inflation (VI) is modeled as a carefully controlled, interactive process involving wages, prices and
market conditions. Equations embodying a near accelerationist point of view produce substantial secondary
inflation effects from any initial impetus such as a change in wage demands or a rise in foreign oil prices. Unless
the Federal Reserve expands the supply of credit, real liquidity is reduced by any such shock. Given the real‐
financial interactions described above, this can significantly reduce growth. The process also works in reverse: a
spending shock can significantly change wage‐price prospects and then have important secondary impacts on
financial conditions. Inspection of the simulation properties of IHS Global Insight’s model of the U.S. economy,
including full interaction among real demands, inflation and financial conditions, confirms that the model has
moved towards a central position in the controversy between fiscalists and monetarists, and in the debates
among neoclassicists, institutionalists and rational expectationists.
The principal domestic cost influences are labor compensation, non‐farm productivity (output per hour) and
foreign input costs. Foreign input costs are driven by the exchange rate, the price of oil and foreign wholesale
price inflation. Excise taxes paid by the producer are an additional cost fully fed into the pricing decision. This
set of cost influences drives each of the 19 industry‐specific producer price indexes, in combination with a
demand pressure indicator and appropriately weighted composites of the other 18 producer price indexes. In
other words, the inflation rate of each industry price index is the reliably weighted sum of the inflation rates of
labor, energy, imported goods and domestic intermediate goods; plus a variable markup reflecting the intensity
of capacity utilization or the presence of bottlenecks. If the economy is in balance‐‐with unemployment near
5%, manufacturing capacity utilization steady near 80 to 85%, and foreign influences neutral‐‐then prices will
rise in line with costs and neither will show signs of acceleration or deceleration.
May 2014
U.S. Energy Information Administration | NEMS Macroeconomic Activity Module Documentation Report 16
Supply: The first principle of the market economy is that prices and output are determined simultaneously by
the factors underlying both demand and supply. As noted above, the “supply‐siders” have not been neglected
in IHS Global Insight’s model of the U.S. economy; indeed, substantial emphasis on this side of the economy (VII)
was incorporated as early as 1976. In IHS Global Insight’s model of the U.S. economy, aggregate supply is
estimated by a Cobb‐Douglas production function that combines factor input growth and improvements in total
factor productivity. Factor input equals a weighted average of labor, business fixed capital, public infrastructure
and energy provided by the energy sector. Based upon each factor's historical share of total input costs, the
elasticity of potential output with respect to labor is 0.65 (i.e., a 1% increase in the labor supply increases
potential GDP 0.65%); the business capital elasticity is 0.26; the infrastructure elasticity is 0.025; and the energy
elasticity is 0.07. Factor supplies are defined by estimates of the full employment labor force, the full
employment capital stock, end‐use energy demand and the stock of infrastructure. To avoid double‐counting
energy input, the labor and capital inputs are both adjusted to deduct estimates of the labor and capital that
produce energy. Potential GDP is the sum of the aggregate supply concept derived from the production
function, less net energy imports, plus housing services and the compensation of government employees. Total
factor productivity depends upon the stock of research and development capital and trend technological
change.
Taxation and other government policies influence labor supply and all investment decisions, thereby linking tax
changes to changes in potential GDP. An expansion of potential GDP first reduces prices and then credit costs,
thus spurring demand. Demand rises until it equilibrates with potential output. Therefore, the growth of
aggregate supply is the fundamental constraint on the long‐term growth of demand. Inflation, created by
demand that exceeds potential GDP or by a supply‐side shock or excise tax increase, raises credit costs and
weakens consumer sentiment, thus putting the brakes on aggregate demand.
Expectations: The contributions to the model of the U.S. economy and its simulation properties of the rational
expectations school are as rich as the data will support. Expectations (Sector VIII) impact several expenditure
categories in IHS Global Insight’s model of the U.S. economy, but the principle nuance relates to the entire
spectrum of interest rates. Shifts in price expectations or the expected capital needs of the government are
captured through price expectations and budget deficit terms, with the former impacting the level of rates
throughout the maturity spectrum, and the latter impacting intermediate and long‐term rates, and hence
affecting the shape of the yield curve. On the expenditure side, inflationary expectations impact consumption
via consumer sentiment, while growth expectations affect business investment.
May 2014
U.S. Energy Information Administration | NEMS Macroeconomic Activity Module Documentation Report 17
3. IHS Global Insight’s Industrial Output and Employment by Industry Models
Industrial Output Model overview The Industrial Output Model is a combination input‐output/stochastic model of activity for 64 industries and
service sectors in the United States. The model estimates the real value of shipments, or revenue, as a measure
of output for each sector. The output level generated in the Industrial Output Model reflects a level of domestic
production that is consistent with the economic expenditures generated in IHS Global Insight’s model of the U.S.
economy. Table A11 in Appendix A on page 86 identifies the economic expenditure categories driving the
Industrial Output Model. Table A12 in Appendix A on page 88 lists the nonmanufacturing and manufacturing
industries modeled in the Industrial Output and Employment Models. In addition, this table maps the codes for
each industry as used by IHS Global Insight, the North American Industry Classification System (NAICS) and
NEMS.
The industrial and service sectors are defined according to NAICS codes. The industry details follow the
manufacturing industries reported by the Department of Commerce in its monthly Manufacturers’ Shipments,
Inventories and Orders survey. Details are mostly three or four‐digit NAICS aggregations with some
dissaggregations beyond four digits. The non‐manufacturing industries and the service sectors are two, three or
four‐digit NAICS aggregations. The real value of shipments is based in 2005 dollars, compatible with the 2005‐
based final demands from the model of the U.S. economy.
The input‐output block of the model translates macroeconomic estimates from IHS Global Insight’s model of the
U.S. economy into demand by industry. All other model concepts are projected by statistical equations and
identities.
The model projections are at a quarterly frequency. Historical data supporting the model are, for the most part,
monthly series released by various government agencies typically within a few months of the observation. All
data, unless otherwise specified, are seasonally adjusted at annual rates.
The input‐output block Standard input‐output analysis proceeds in two steps. First, the vector of economic expenditures from the
Macroeconomic Model (the components of GDP) is converted into a vector of industrial deliveries to final
demand. This conversion is represented for any time period as:
∗ .
where
F = vector of industrial deliveries to final demand;
H = benchmark bridge matrix recording the industrial composition of each expenditure category;
and
G = vector of the real final expenditure components of GDP.
May 2014
U.S. Energy Information Administration | NEMS Macroeconomic Activity Module Documentation Report 18
A fixed bridge matrix, constructed from the 2002 input‐output table1 that was based on the NAICS, is used in this
step. Once the final demand vector, F, has been calculated, standard input‐output techniques are used to derive
estimates of the industrial output required to produce this bill of goods for final use. According to the basic
input‐output model, intermediate inputs, industrial deliveries to final demand and gross output are related as
follows:
∗ ,
where
A = matrix of direct input coefficients describing the amount of each input industry’s product
required per unit of industrial output; and
X = vector of gross output by industry.
This equation can be considered an equilibrium condition; that is, total demand equals total supply. The
product A * X is equal to intermediate demand, and F is equal to final demand. The sum of the two is total
demand; which, in equilibrium, is equal to total supply or production.
Following standard input‐output conventions, it is assumed that the technology of production as reflected by
the matrix of direct input coefficients, A, remains relatively stable over time. This matrix is also NAICS‐based and
uses 2002 values1. In addition, production processes are assumed to be linear and exhibit constant returns to
scale with no possibility for substitution among inputs. However, these restrictions apply for the calculation of
demand by industry only; equations for actual shipments and production include factors that allow for other
variables coming from the IHS Global Insight Model of the U.S. Economy to impact industrial shipments. The
basic input‐output equation is then solved for output:
,
This equation describes the relationship between final demand and industrial output levels that would be
required to deliver this bill of goods under the restrictive assumptions detailed above. The vector X should equal
total demand and supply for each industry, in equilibrium. In the Industrial Output Model, 128 industries satisfy
59 macroeconomic final demands.
Revenue/output for manufacturing industries Industry revenues are measured in billions of constant dollars and are available for each of the manufacturing
industries in the model. The current dollar historical series are quarterly averages of the Department of
Commerce’s value of shipments data from its monthly Manufacturers’ Shipments, Inventories and Orders survey
that are converted to annual rates. Constant dollar historical values are the current dollar series deflated using
each industry’s price index. These indexes are computed outside of the model by IHS Global Insight’s U.S.
Industry Service, which produces short‐term industry forecasts. To attain consistency with the economic
1 U.S. Bureau of Economic Analysis, Benchmark Input-Output Accounts of the U.S. Economy, 2002, http://bea.gov/newsreleases/industry/io/ionewsrelease.htm.
May 2014
U.S. Energy Information Administration | NEMS Macroeconomic Activity Module Documentation Report 19
variables in the Macroeconomic Model, industry revenues are converted into constant 2005 dollars after the
model is run.
Constant‐dollar revenue by industry is modeled as a function of total demand from the input‐output analysis,
relative prices, cyclical variables and a time trend. The functional form used imposes a unitary elasticity on the
demand term, which embodies most of the explanatory power of the equations. Generally, the economic
expenditure categories from the Macroeconomic Model have incorporated in them the effect of changes in
prices. However, a relative price variable is used in select industries to explicitly capture the industry‐specific
effect of changes in producer prices.
Additional non‐demand terms are included in the equation used to explain patterns not well accounted for by
the input‐output model and its demand cyclicality and technological change indicators.
1. Macroeconomic variables feed down into the Industrial Output Model equations through demand, but
these weighted demand terms are in most cases smoother and less cyclical than industrial production
indexes. Therefore, cyclical variables, such as capacity utilization, housing starts, unemployment rate or
interest rates, are included in most equations. Cyclical variables were chosen with care to reflect the
appropriate business cycle for each industry.
2. The use of constant 2002 input‐output tables in the construction of total demand becomes less accurate
the further from the base year the estimates go. This is because shifts in relative prices for inputs, as well as
other factor, can in the long run change the technological processes used to manufacture goods. To account
for this slowly changing divergence between input‐output coefficients and actual production processes, a
time trend is used in many model equations that use input‐output concepts.
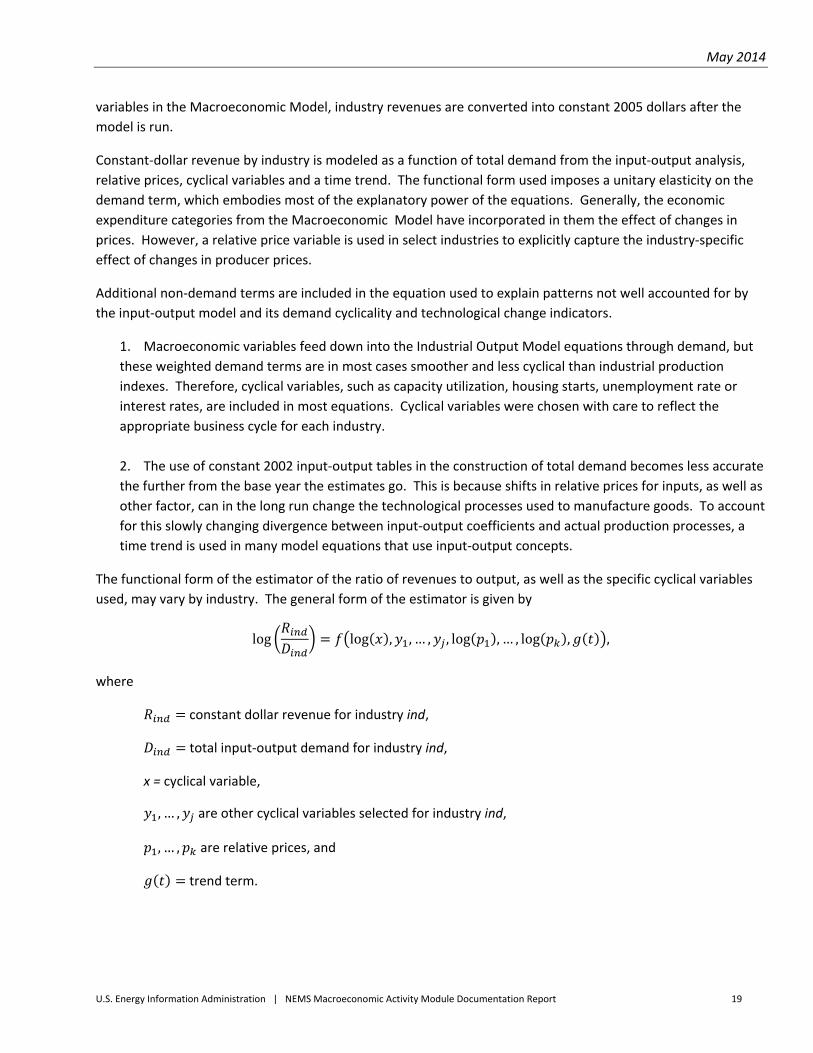
The functional form of the estimator of the ratio of revenues to output, as well as the specific cyclical variables
used, may vary by industry. The general form of the estimator is given by
log log , , … , , log , … , log , ,
where
constant dollar revenue for industry ind,
total input‐output demand for industry ind,
x = cyclical variable,
, … , are other cyclical variables selected for industry ind,
, … , are relative prices, and
trend term.
May 2014
U.S. Energy Information Administration | NEMS Macroeconomic Activity Module Documentation Report 20
Output is measured in real dollars for all industries except two. Rapid increases in computer technology in the
last two decades have led to sharp declines in the quality‐adjusted price deflators for computer manufacturing
(NAICS 3341) and semiconductor manufacturing (NAICS 334413). This in turn results in steep increases in the
industries’ real dollar output measures. This makes the real output value an inappropriate proxy for volume
measure. Consequently, nominal dollars rather than real dollars are used for these two sectors.
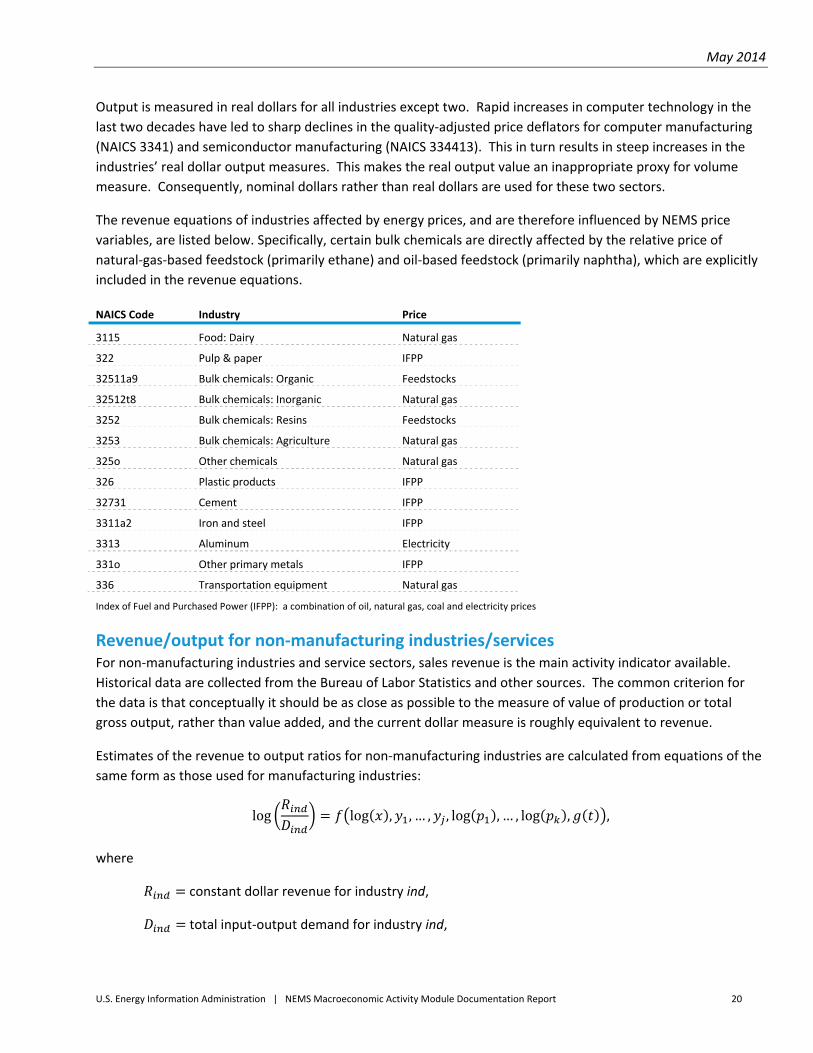
The revenue equations of industries affected by energy prices, and are therefore influenced by NEMS price
variables, are listed below. Specifically, certain bulk chemicals are directly affected by the relative price of
natural‐gas‐based feedstock (primarily ethane) and oil‐based feedstock (primarily naphtha), which are explicitly
included in the revenue equations.
NAICS Code Industry Price
3115 Food: Dairy Natural gas
322 Pulp & paper IFPP
32511a9 Bulk chemicals: Organic Feedstocks
32512t8 Bulk chemicals: Inorganic Natural gas
3252 Bulk chemicals: Resins Feedstocks
3253 Bulk chemicals: Agriculture Natural gas
325o Other chemicals Natural gas
326 Plastic products IFPP
32731 Cement IFPP
3311a2 Iron and steel IFPP
3313 Aluminum Electricity
331o Other primary metals IFPP
336 Transportation equipment Natural gas
Index of Fuel and Purchased Power (IFPP): a combination of oil, natural gas, coal and electricity prices
Revenue/output for non‐manufacturing industries/services For non‐manufacturing industries and service sectors, sales revenue is the main activity indicator available.
Historical data are collected from the Bureau of Labor Statistics and other sources. The common criterion for
the data is that conceptually it should be as close as possible to the measure of value of production or total
gross output, rather than value added, and the current dollar measure is roughly equivalent to revenue.
Estimates of the revenue to output ratios for non‐manufacturing industries are calculated from equations of the
same form as those used for manufacturing industries:
log log , , … , , log , … , log , ,
where
constant dollar revenue for industry ind,
total input‐output demand for industry ind,
May 2014
U.S. Energy Information Administration | NEMS Macroeconomic Activity Module Documentation Report 21
x = cyclical variable,
, … , are other cyclical variables selected for industry ind,
, … , are relative prices, and
trend term.
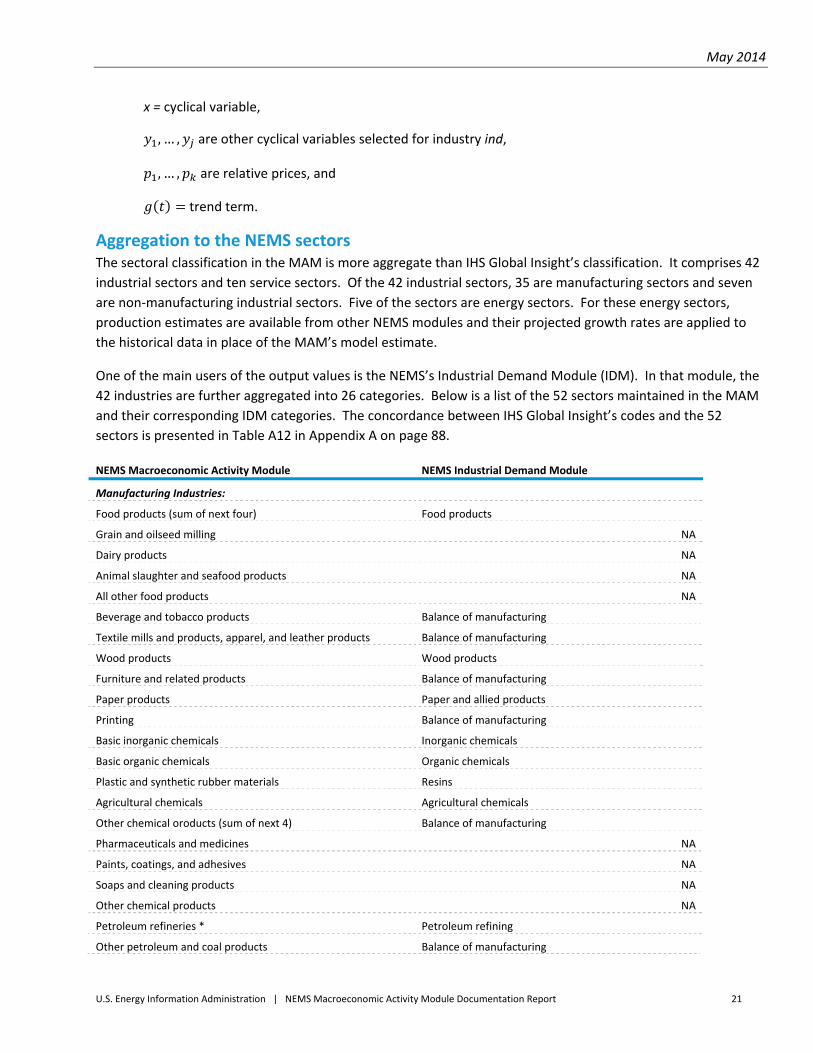
Aggregation to the NEMS sectors The sectoral classification in the MAM is more aggregate than IHS Global Insight’s classification. It comprises 42
industrial sectors and ten service sectors. Of the 42 industrial sectors, 35 are manufacturing sectors and seven
are non‐manufacturing industrial sectors. Five of the sectors are energy sectors. For these energy sectors,
production estimates are available from other NEMS modules and their projected growth rates are applied to
the historical data in place of the MAM’s model estimate.
One of the main users of the output values is the NEMS’s Industrial Demand Module (IDM). In that module, the
42 industries are further aggregated into 26 categories. Below is a list of the 52 sectors maintained in the MAM
and their corresponding IDM categories. The concordance between IHS Global Insight’s codes and the 52
sectors is presented in Table A12 in Appendix A on page 88.
NEMS Macroeconomic Activity Module NEMS Industrial Demand Module
Manufacturing Industries:
Food products (sum of next four) Food products
Grain and oilseed milling NA
Dairy products NA
Animal slaughter and seafood products NA
All other food products NA
Beverage and tobacco products Balance of manufacturing
Textile mills and products, apparel, and leather products Balance of manufacturing
Wood products Wood products
Furniture and related products Balance of manufacturing
Paper products Paper and allied products
Printing Balance of manufacturing
Basic inorganic chemicals Inorganic chemicals
Basic organic chemicals Organic chemicals
Plastic and synthetic rubber materials Resins
Agricultural chemicals Agricultural chemicals
Other chemical oroducts (sum of next 4) Balance of manufacturing
Pharmaceuticals and medicines NA
Paints, coatings, and adhesives NA
Soaps and cleaning products NA
Other chemical products NA
Petroleum refineries * Petroleum refining
Other petroleum and coal products Balance of manufacturing
May 2014
U.S. Energy Information Administration | NEMS Macroeconomic Activity Module Documentation Report 22
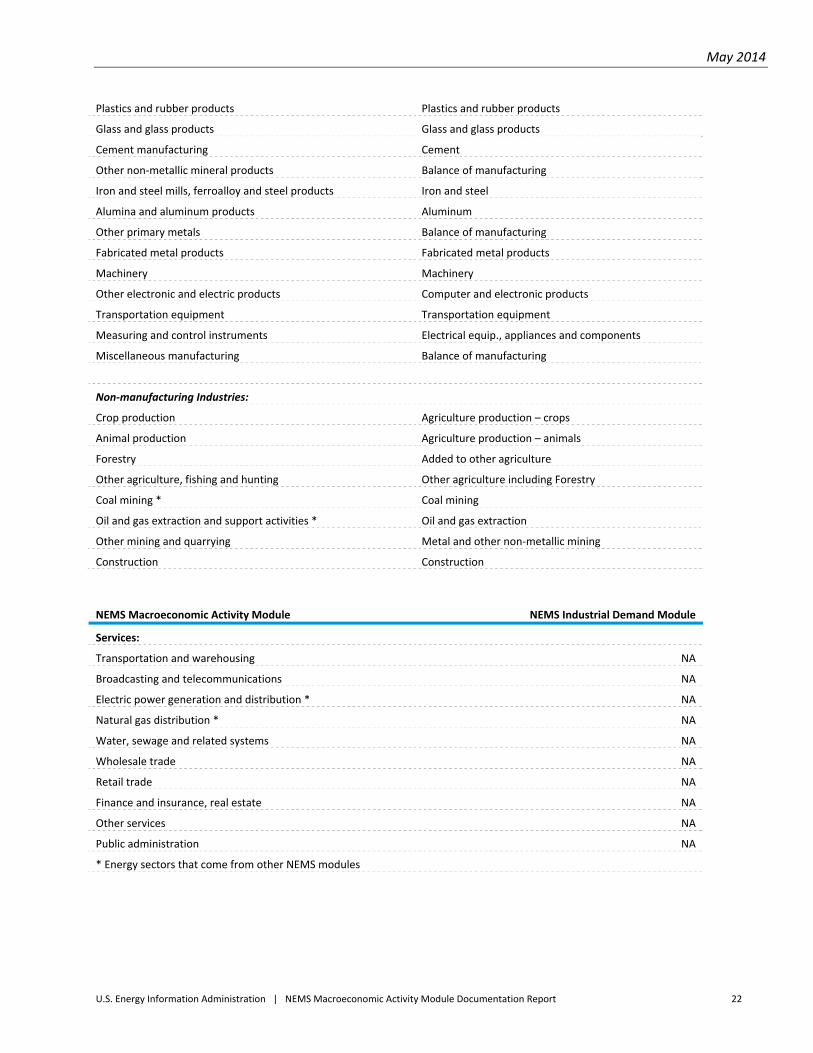
Plastics and rubber products Plastics and rubber products
Glass and glass products Glass and glass products
Cement manufacturing Cement
Other non‐metallic mineral products Balance of manufacturing
Iron and steel mills, ferroalloy and steel products Iron and steel
Alumina and aluminum products Aluminum
Other primary metals Balance of manufacturing
Fabricated metal products Fabricated metal products
Machinery Machinery
Other electronic and electric products Computer and electronic products
Transportation equipment Transportation equipment
Measuring and control instruments Electrical equip., appliances and components
Miscellaneous manufacturing Balance of manufacturing
Non‐manufacturing Industries:
Crop production Agriculture production – crops
Animal production Agriculture production – animals
Forestry Added to other agriculture
Other agriculture, fishing and hunting Other agriculture including Forestry
Coal mining * Coal mining
Oil and gas extraction and support activities * Oil and gas extraction
Other mining and quarrying Metal and other non‐metallic mining
Construction Construction
NEMS Macroeconomic Activity Module NEMS Industrial Demand Module
Services:
Transportation and warehousing NA
Broadcasting and telecommunications NA
Electric power generation and distribution * NA
Natural gas distribution * NA
Water, sewage and related systems NA
Wholesale trade NA
Retail trade NA
Finance and insurance, real estate NA
Other services NA
Public administration NA
* Energy sectors that come from other NEMS modules
May 2014
U.S. Energy Information Administration | NEMS Macroeconomic Activity Module Documentation Report 23
Employment by Industry Model Overview The Employment Model determines employment in 59 industries and service sectors in the United States. (see
Table A12 in Appendix A on page 88), consistent with the projection of non‐farm employment (EEA) from the
Macroeconomic Model. Industrial output, relative factor prices and productivity and average workweek trends
are the key determinates of industrial employment. Real outputs in the industries are from the Industrial
Output Model. Productivity trends, average workweek trends, labor compensation, capital service cost
determinants, other factor prices and cyclical variables are determined in the Macroeconomic Model.
The basic behavioral equations in the Employment Model are the total manufacturing employment (EMF) and
unconstrained employment (XXX_E{ind}) equations for each of the detailed industries (ind). Employment is
based upon production theory. Consistent with production theory, the key determinant of employment by
industry is industrial output. Both current and lagged output values enter in the employment specification,
reflecting the tendency of firms to hire employees in response to lagged output growth and to layoff employees
in response to lagged output declines. The labor‐to‐output ratio varies with changes in relative factor prices,
productivity, the national average workweek, cyclical factors and technological change. Relative factor prices
are represented by labor cost, capital cost, energy and other factor prices and interest rates. National
productivity trends and industry‐specific time trends are used to capture changes in the employment‐to‐output
relationship due to technological advances. Change in the average length of the workweek also alters this
relationship. Some industries’ workweek tends to increase relative to the national average with declines in the
cyclical unemployment rate and with increases in manufacturing capacity utilization rates. Both factors cause
industries to increase their utilization of existing labor.
Total non‐farm, private non‐farm and government employment Projections for total non‐farm (EEA) and government federal and state and local employment (EG91 and EGSL)
are established in the Macroeconomic Model. Private non‐farm employment (EEAPIO) is determined by
subtracting government employment from total non‐farm employment:
91 .
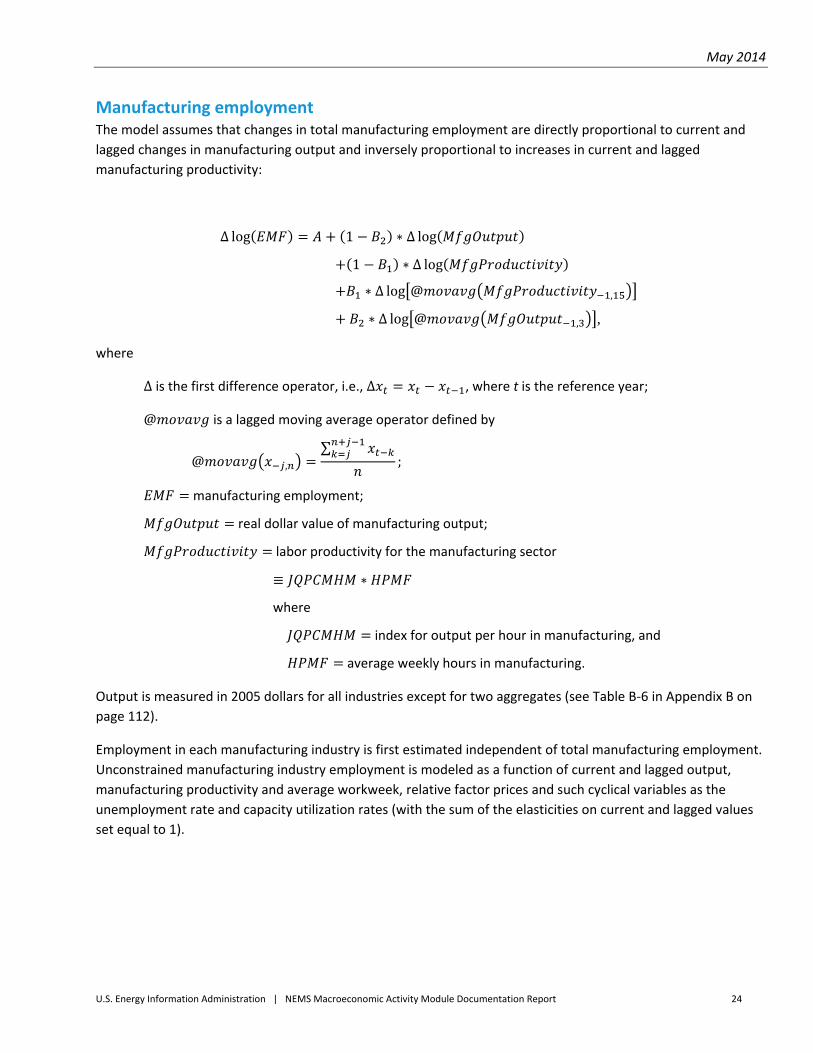
May 2014
U.S. Energy Information Administration | NEMS Macroeconomic Activity Module Documentation Report 24
Manufacturing employment The model assumes that changes in total manufacturing employment are directly proportional to current and
lagged changes in manufacturing output and inversely proportional to increases in current and lagged
manufacturing productivity:
∆ log 1 ∗ ∆ log
1 ∗ ∆ log
∗ ∆ log @ ,
∗ ∆ log @ , ,
where
∆ is the first difference operator, i.e., ∆ , where t is the reference year;
@ is a lagged moving average operator defined by
@ ,
∑;
manufacturing employment;
real dollar value of manufacturing output;
labor productivity for the manufacturing sector
≡ ∗
where
index for output per hour in manufacturing, and
average weekly hours in manufacturing.
Output is measured in 2005 dollars for all industries except for two aggregates (see Table B‐6 in Appendix B on
page 112).
Employment in each manufacturing industry is first estimated independent of total manufacturing employment.
Unconstrained manufacturing industry employment is modeled as a function of current and lagged output,
manufacturing productivity and average workweek, relative factor prices and such cyclical variables as the
unemployment rate and capacity utilization rates (with the sum of the elasticities on current and lagged values
set equal to 1).
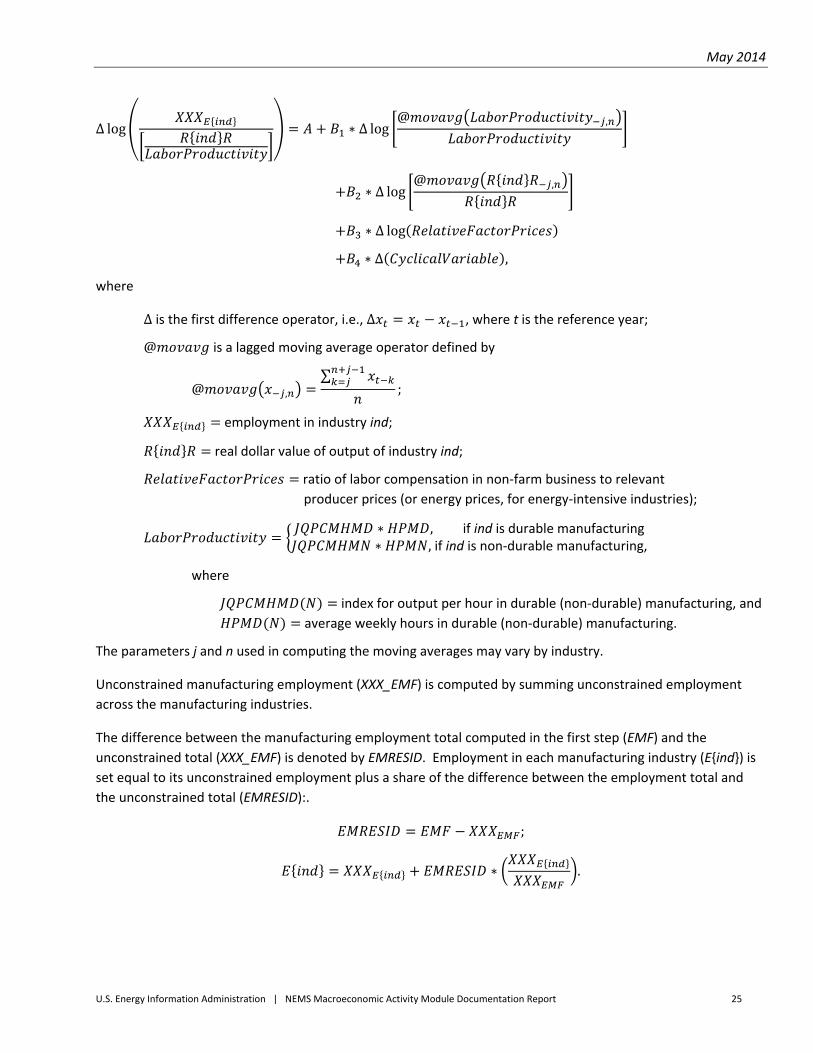
May 2014
U.S. Energy Information Administration | NEMS Macroeconomic Activity Module Documentation Report 25
∆ log ∗ ∆ log@ ,
∗ ∆ log@ ,
∗ ∆ log
∗ ∆ ,
where
∆ is the first difference operator, i.e., ∆ , where t is the reference year;
@ is a lagged moving average operator defined by
@ ,
∑;
employment in industry ind;
real dollar value of output of industry ind;
ratio of labor compensation in non‐farm business to relevant
producer prices (or energy prices, for energy‐intensive industries);
∗ , if ind is durable manufacturing∗ , if ind is non‐durable manufacturing,
where
index for output per hour in durable (non‐durable) manufacturing, and
average weekly hours in durable (non‐durable) manufacturing.
The parameters j and n used in computing the moving averages may vary by industry.
Unconstrained manufacturing employment (XXX_EMF) is computed by summing unconstrained employment
across the manufacturing industries.
The difference between the manufacturing employment total computed in the first step (EMF) and the
unconstrained total (XXX_EMF) is denoted by EMRESID. Employment in each manufacturing industry (E{ind}) is
set equal to its unconstrained employment plus a share of the difference between the employment total and
the unconstrained total (EMRESID):.
;
∗ .
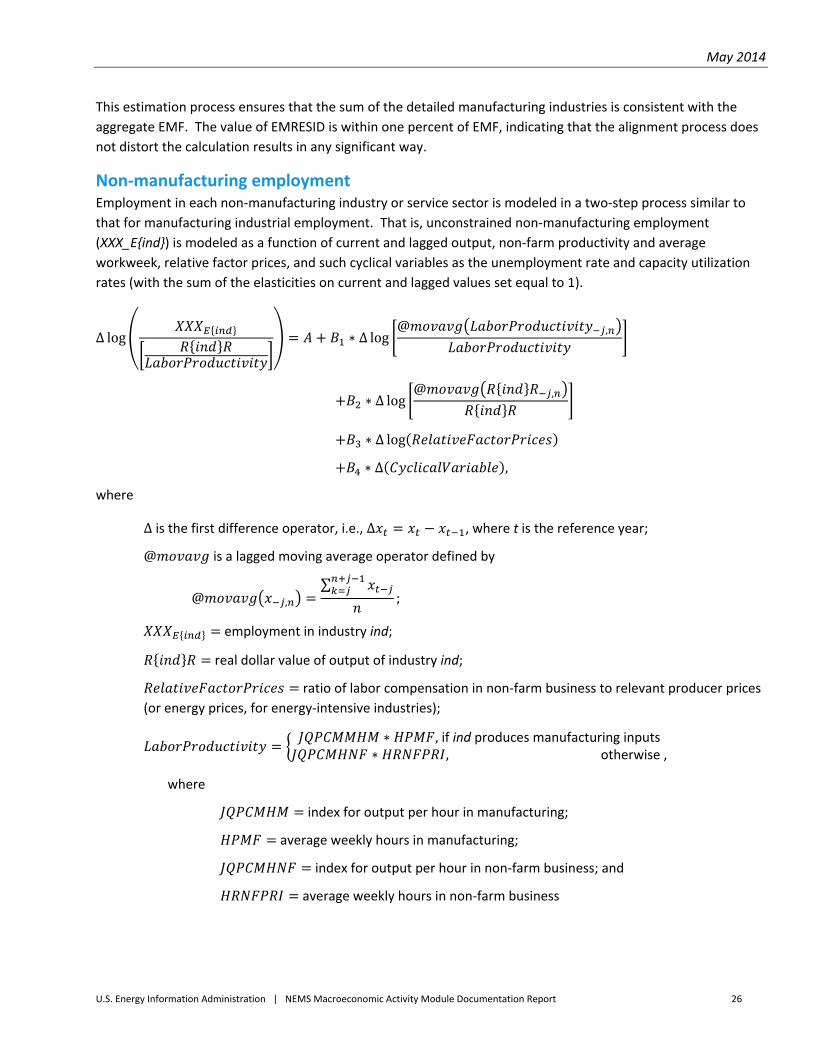
May 2014
U.S. Energy Information Administration | NEMS Macroeconomic Activity Module Documentation Report 26
This estimation process ensures that the sum of the detailed manufacturing industries is consistent with the
aggregate EMF. The value of EMRESID is within one percent of EMF, indicating that the alignment process does
not distort the calculation results in any significant way.
Non‐manufacturing employment Employment in each non‐manufacturing industry or service sector is modeled in a two‐step process similar to
that for manufacturing industrial employment. That is, unconstrained non‐manufacturing employment
(XXX_E{ind}) is modeled as a function of current and lagged output, non‐farm productivity and average
workweek, relative factor prices, and such cyclical variables as the unemployment rate and capacity utilization
rates (with the sum of the elasticities on current and lagged values set equal to 1).
∆ log ∗ ∆ log@ ,
∗ ∆ log@ ,
∗ ∆ log
∗ ∆ ,
where
∆ is the first difference operator, i.e., ∆ , where t is the reference year;
@ is a lagged moving average operator defined by
@ ,
∑;
employment in industry ind;
real dollar value of output of industry ind;
ratio of labor compensation in non‐farm business to relevant producer prices
(or energy prices, for energy‐intensive industries);
∗ , if ind produces manufacturing inputs∗ , otherwise ,
where
index for output per hour in manufacturing;
average weekly hours in manufacturing;
index for output per hour in non‐farm business; and
average weekly hours in non‐farm business
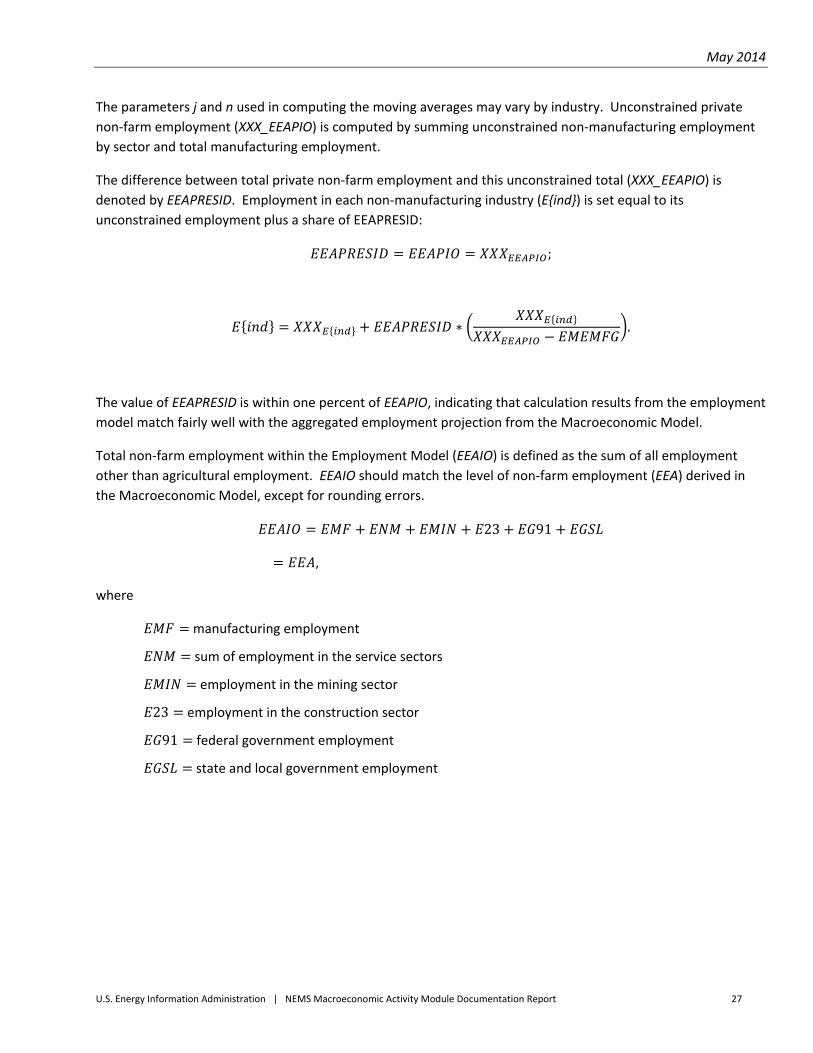
May 2014
U.S. Energy Information Administration | NEMS Macroeconomic Activity Module Documentation Report 27
The parameters j and n used in computing the moving averages may vary by industry. Unconstrained private
non‐farm employment (XXX_EEAPIO) is computed by summing unconstrained non‐manufacturing employment
by sector and total manufacturing employment.
The difference between total private non‐farm employment and this unconstrained total (XXX_EEAPIO) is
denoted by EEAPRESID. Employment in each non‐manufacturing industry (E{ind}) is set equal to its
unconstrained employment plus a share of EEAPRESID:
;
∗ .
The value of EEAPRESID is within one percent of EEAPIO, indicating that calculation results from the employment
model match fairly well with the aggregated employment projection from the Macroeconomic Model.
Total non‐farm employment within the Employment Model (EEAIO) is defined as the sum of all employment
other than agricultural employment. EEAIO should match the level of non‐farm employment (EEA) derived in
the Macroeconomic Model, except for rounding errors.
23 91
,
where
manufacturing employment
sum of employment in the service sectors
employment in the mining sector
23 employment in the construction sector
91 federal government employment
state and local government employment
May 2014
U.S. Energy Information Administration | NEMS Macroeconomic Activity Module Documentation Report 28
Aggregation to the NEMS sectors As in the case of industrial output, employment estimates are also aggregated to the coarser level of the NEMS
categories. The classification for employment is the same as that for output (see Page 21), except that the
public sector is further disaggregated into two categories – Federal Government, and State and Local
Government.
Among the five energy sectors, employment projections for coal mining and for oil and gas extraction are
available from other NEMS Modules. Their estimated growth rates are applied to the historical data in place of
the MAM calculations (Table B4 in Appendix B on page 109).
May 2014
U.S. Energy Information Administration | NEMS Macroeconomic Activity Module Documentation Report 29
4. U.S. Energy Information Administration’s Regional Models
Overview Economic concepts below the national level are required by NEMS demand modules. The level of regional detail
is defined by the nine Census Divisions:
1. New England (NENG)
2. Middle Atlantic (MATL)
3. South Atlantic (SATL)
4. East North Central (ENC)
5. East South Central (ESC)
6. West North Central (WNC)
7. West South Central (WSC)
8. Mountain (MTN)
9. Pacific (PAC)
A suite of regional models has been developed to provide projections for the following concepts by Census
Divisions:
1. Macroeconomic variables – population, economic activity, prices and wages
2. Industry variables – output and employment by sector
3. Building variables – residential housing starts and commercial floor space additions and stocks
The regional models are downstream models in the Macroeconomic Activity Module. That is, they run after the
national models. There is no feedback mechanism to revise the national estimates based upon the regional
results. Instead, an alignment process is introduced to calibrate the regional calculations so that the sum of the
regional estimates equals the corresponding national estimate, if the national model computes the latter. This
“top‐down” approach is adopted because only selected macroeconomic variables are covered in the regional
models, and because the national variables are used as explanatory variables. Without a complete regional
economic framework, it is not possible to adopt a “bottom‐up” approach for selected variables.
Detailed descriptions of the variables are listed in Tables A13‐A15 in Appendix A on pages 91 through 94.
Detailed structural forms and coefficients for the regional models are presented in Appendix C.
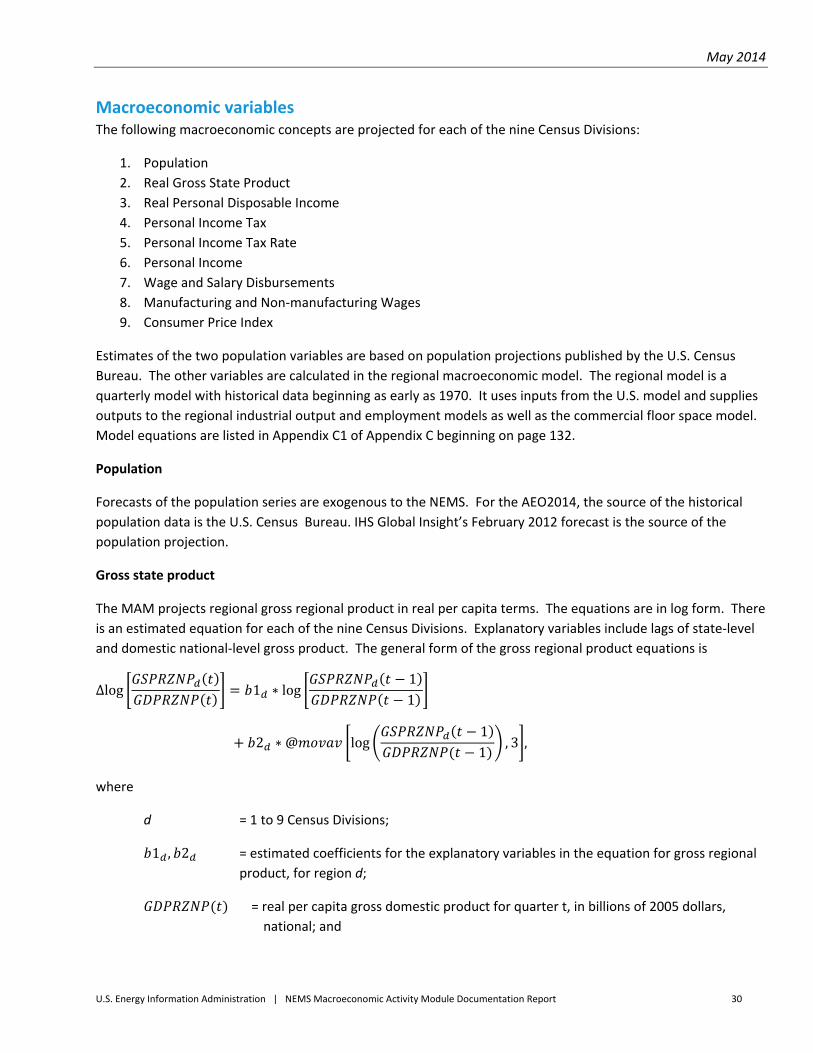
May 2014
U.S. Energy Information Administration | NEMS Macroeconomic Activity Module Documentation Report 30
Macroeconomic variables The following macroeconomic concepts are projected for each of the nine Census Divisions:
1. Population
2. Real Gross State Product
3. Real Personal Disposable Income
4. Personal Income Tax
5. Personal Income Tax Rate
6. Personal Income
7. Wage and Salary Disbursements
8. Manufacturing and Non‐manufacturing Wages
9. Consumer Price Index
Estimates of the two population variables are based on population projections published by the U.S. Census
Bureau. The other variables are calculated in the regional macroeconomic model. The regional model is a
quarterly model with historical data beginning as early as 1970. It uses inputs from the U.S. model and supplies
outputs to the regional industrial output and employment models as well as the commercial floor space model.
Model equations are listed in Appendix C1 of Appendix C beginning on page 132.
Population
Forecasts of the population series are exogenous to the NEMS. For the AEO2014, the source of the historical
population data is the U.S. Census Bureau. IHS Global Insight’s February 2012 forecast is the source of the
population projection.
Gross state product
The MAM projects regional gross regional product in real per capita terms. The equations are in log form. There
is an estimated equation for each of the nine Census Divisions. Explanatory variables include lags of state‐level
and domestic national‐level gross product. The general form of the gross regional product equations is
Δlog 1 ∗ log11
2 ∗ @ log11
, 3 ,
where
d = 1 to 9 Census Divisions;
1 , 2 = estimated coefficients for the explanatory variables in the equation for gross regional
product, for region d;
= real per capita gross domestic product for quarter t, in billions of 2005 dollars,
national; and
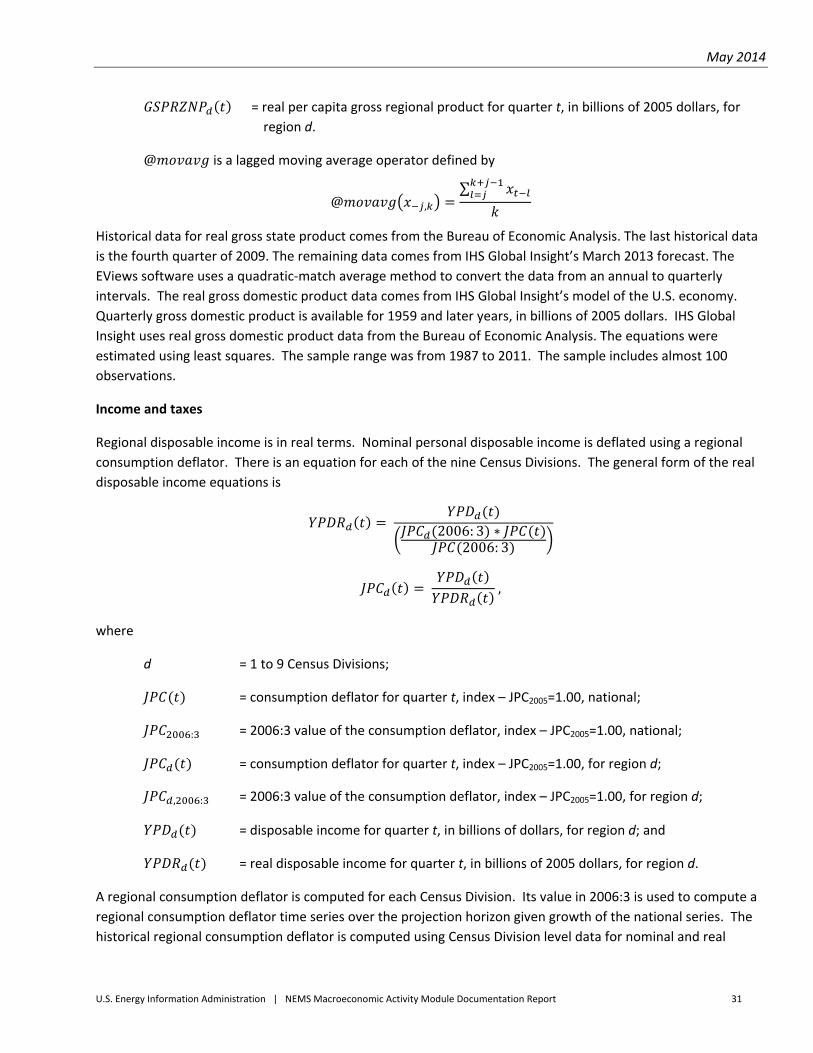
May 2014
U.S. Energy Information Administration | NEMS Macroeconomic Activity Module Documentation Report 31
= real per capita gross regional product for quarter t, in billions of 2005 dollars, for
region d.
@ is a lagged moving average operator defined by
@ ,
∑
Historical data for real gross state product comes from the Bureau of Economic Analysis. The last historical data
is the fourth quarter of 2009. The remaining data comes from IHS Global Insight’s March 2013 forecast. The
EViews software uses a quadratic‐match average method to convert the data from an annual to quarterly
intervals. The real gross domestic product data comes from IHS Global Insight’s model of the U.S. economy.
Quarterly gross domestic product is available for 1959 and later years, in billions of 2005 dollars. IHS Global
Insight uses real gross domestic product data from the Bureau of Economic Analysis. The equations were
estimated using least squares. The sample range was from 1987 to 2011. The sample includes almost 100
observations.
Income and taxes
Regional disposable income is in real terms. Nominal personal disposable income is deflated using a regional
consumption deflator. There is an equation for each of the nine Census Divisions. The general form of the real
disposable income equations is
2006: 3 ∗2006: 3
,
where
d = 1 to 9 Census Divisions;
= consumption deflator for quarter t, index – JPC2005=1.00, national;
: = 2006:3 value of the consumption deflator, index – JPC2005=1.00, national;
= consumption deflator for quarter t, index – JPC2005=1.00, for region d;
, : = 2006:3 value of the consumption deflator, index – JPC2005=1.00, for region d;
= disposable income for quarter t, in billions of dollars, for region d; and
= real disposable income for quarter t, in billions of 2005 dollars, for region d.
A regional consumption deflator is computed for each Census Division. Its value in 2006:3 is used to compute a
regional consumption deflator time series over the projection horizon given growth of the national series. The
historical regional consumption deflator is computed using Census Division level data for nominal and real
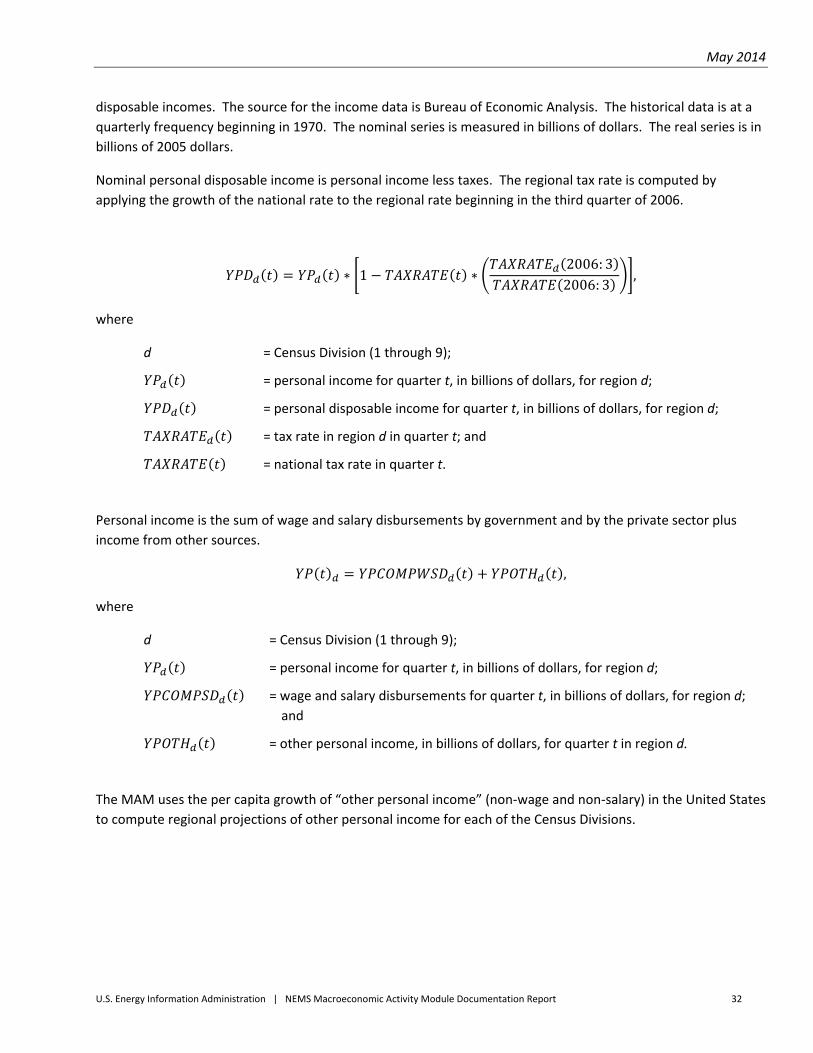
May 2014
U.S. Energy Information Administration | NEMS Macroeconomic Activity Module Documentation Report 32
disposable incomes. The source for the income data is Bureau of Economic Analysis. The historical data is at a
quarterly frequency beginning in 1970. The nominal series is measured in billions of dollars. The real series is in
billions of 2005 dollars.
Nominal personal disposable income is personal income less taxes. The regional tax rate is computed by
applying the growth of the national rate to the regional rate beginning in the third quarter of 2006.
∗ 1 ∗2006: 32006: 3
,
where
d = Census Division (1 through 9);
= personal income for quarter t, in billions of dollars, for region d;
= personal disposable income for quarter t, in billions of dollars, for region d;
= tax rate in region d in quarter t; and
= national tax rate in quarter t.
Personal income is the sum of wage and salary disbursements by government and by the private sector plus
income from other sources.
,
where
d = Census Division (1 through 9);
= personal income for quarter t, in billions of dollars, for region d;
= wage and salary disbursements for quarter t, in billions of dollars, for region d;
and
= other personal income, in billions of dollars, for quarter t in region d.
The MAM uses the per capita growth of “other personal income” (non‐wage and non‐salary) in the United States
to compute regional projections of other personal income for each of the Census Divisions.
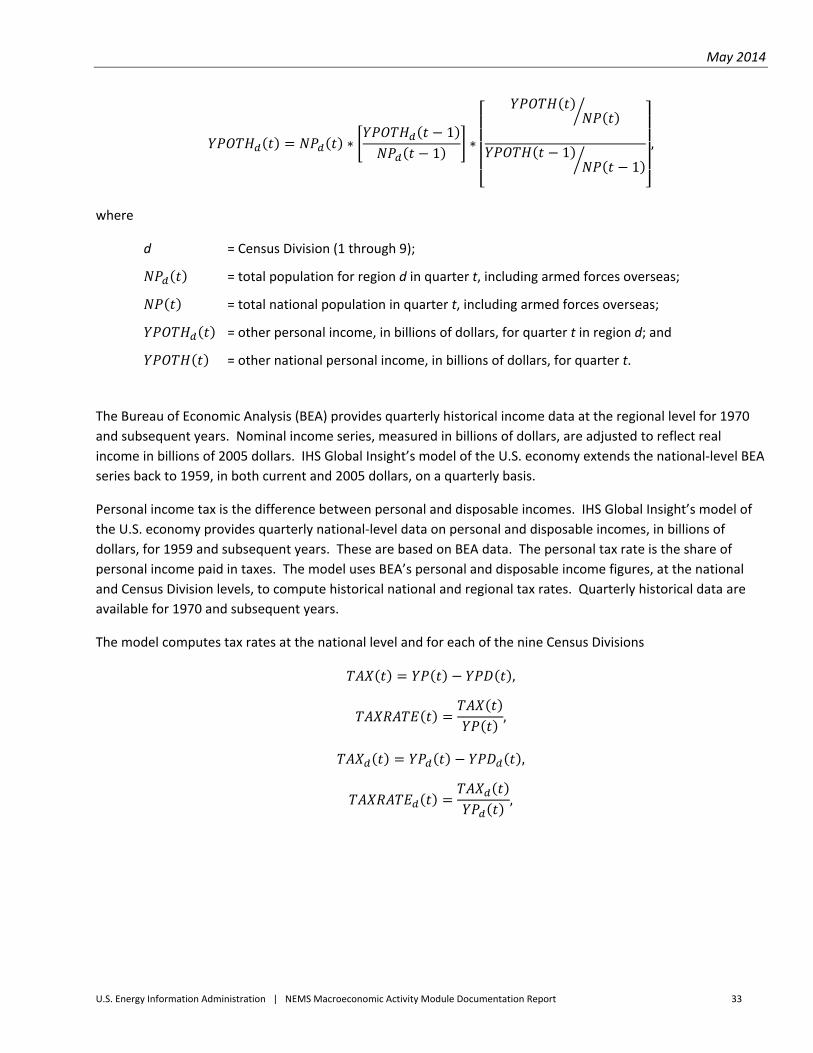
May 2014
U.S. Energy Information Administration | NEMS Macroeconomic Activity Module Documentation Report 33
∗1
1∗
11
,
where
d = Census Division (1 through 9);
= total population for region d in quarter t, including armed forces overseas;
= total national population in quarter t, including armed forces overseas;
= other personal income, in billions of dollars, for quarter t in region d; and
= other national personal income, in billions of dollars, for quarter t.
The Bureau of Economic Analysis (BEA) provides quarterly historical income data at the regional level for 1970
and subsequent years. Nominal income series, measured in billions of dollars, are adjusted to reflect real
income in billions of 2005 dollars. IHS Global Insight’s model of the U.S. economy extends the national‐level BEA
series back to 1959, in both current and 2005 dollars, on a quarterly basis.
Personal income tax is the difference between personal and disposable incomes. IHS Global Insight’s model of
the U.S. economy provides quarterly national‐level data on personal and disposable incomes, in billions of
dollars, for 1959 and subsequent years. These are based on BEA data. The personal tax rate is the share of
personal income paid in taxes. The model uses BEA’s personal and disposable income figures, at the national
and Census Division levels, to compute historical national and regional tax rates. Quarterly historical data are
available for 1970 and subsequent years.
The model computes tax rates at the national level and for each of the nine Census Divisions
,
,
,
,
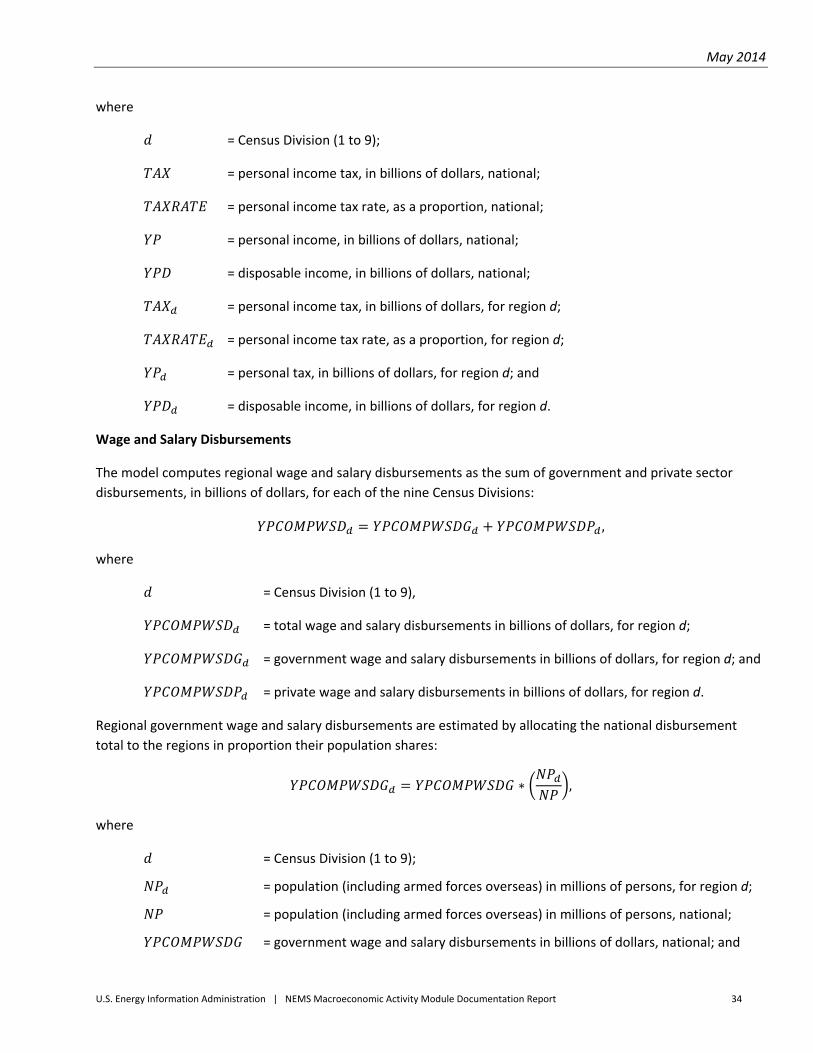
May 2014
U.S. Energy Information Administration | NEMS Macroeconomic Activity Module Documentation Report 34
where
= Census Division (1 to 9);
= personal income tax, in billions of dollars, national;
= personal income tax rate, as a proportion, national;
= personal income, in billions of dollars, national;
= disposable income, in billions of dollars, national;
= personal income tax, in billions of dollars, for region d;
= personal income tax rate, as a proportion, for region d;
= personal tax, in billions of dollars, for region d; and
= disposable income, in billions of dollars, for region d.
Wage and Salary Disbursements
The model computes regional wage and salary disbursements as the sum of government and private sector
disbursements, in billions of dollars, for each of the nine Census Divisions:
,
where
= Census Division (1 to 9),
= total wage and salary disbursements in billions of dollars, for region d;
= government wage and salary disbursements in billions of dollars, for region d; and
= private wage and salary disbursements in billions of dollars, for region d.
Regional government wage and salary disbursements are estimated by allocating the national disbursement
total to the regions in proportion their population shares:
∗ ,
where
= Census Division (1 to 9);
= population (including armed forces overseas) in millions of persons, for region d;
= population (including armed forces overseas) in millions of persons, national;
= government wage and salary disbursements in billions of dollars, national; and
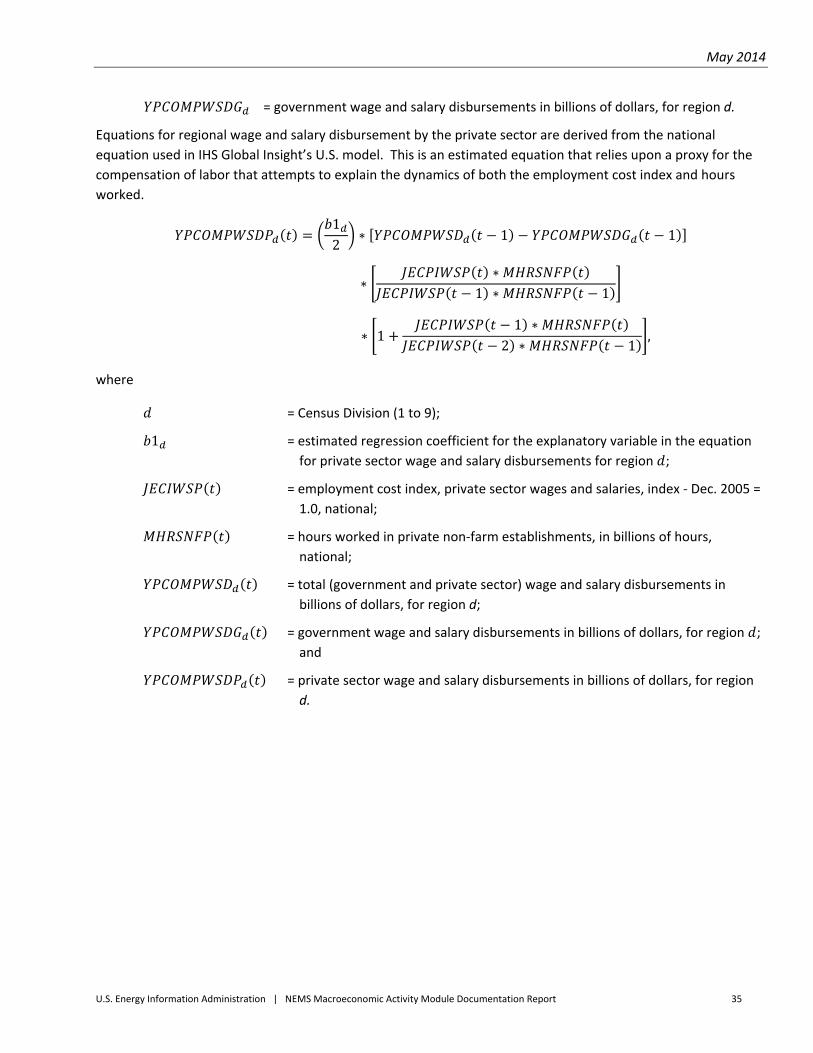
May 2014
U.S. Energy Information Administration | NEMS Macroeconomic Activity Module Documentation Report 35
= government wage and salary disbursements in billions of dollars, for region d.
Equations for regional wage and salary disbursement by the private sector are derived from the national
equation used in IHS Global Insight’s U.S. model. This is an estimated equation that relies upon a proxy for the
compensation of labor that attempts to explain the dynamics of both the employment cost index and hours
worked.
12
∗ 1 1
∗∗
1 ∗ 1
∗ 11 ∗
2 ∗ 1,
where
= Census Division (1 to 9);
1 = estimated regression coefficient for the explanatory variable in the equation
for private sector wage and salary disbursements for region ;
= employment cost index, private sector wages and salaries, index ‐ Dec. 2005 =
1.0, national;
= hours worked in private non‐farm establishments, in billions of hours,
national;
= total (government and private sector) wage and salary disbursements in
billions of dollars, for region d;
= government wage and salary disbursements in billions of dollars, for region ;
and
= private sector wage and salary disbursements in billions of dollars, for region
d.
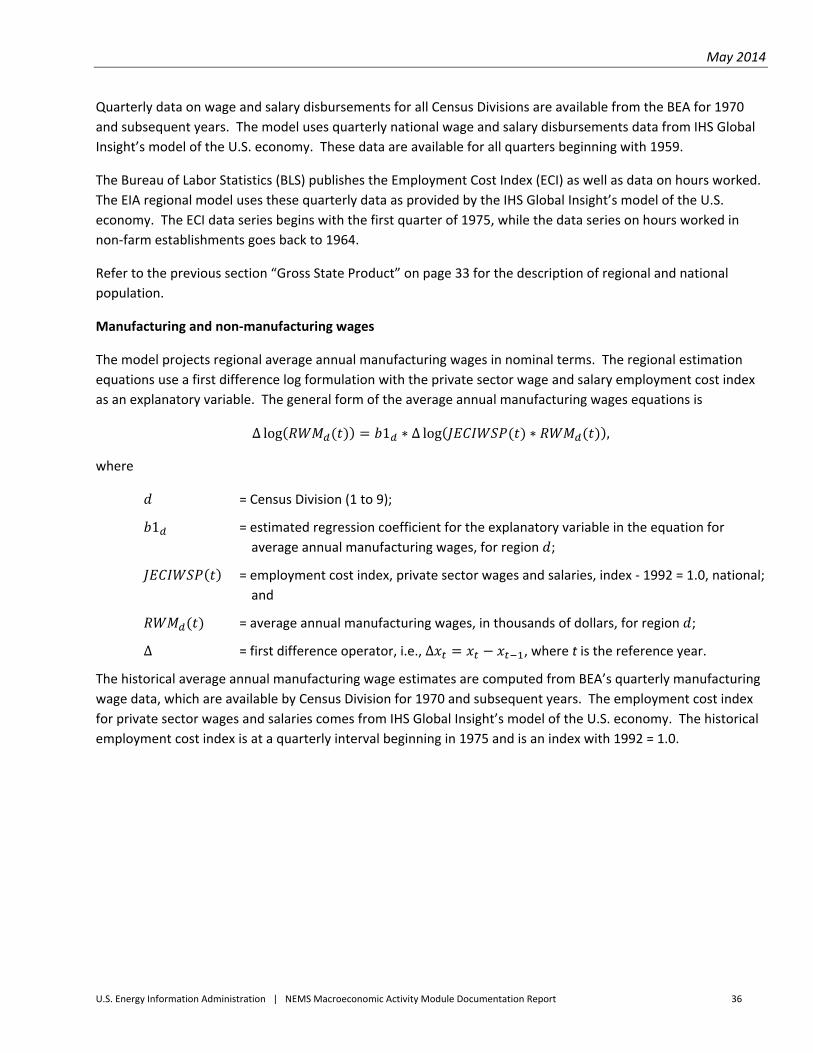
May 2014
U.S. Energy Information Administration | NEMS Macroeconomic Activity Module Documentation Report 36
Quarterly data on wage and salary disbursements for all Census Divisions are available from the BEA for 1970
and subsequent years. The model uses quarterly national wage and salary disbursements data from IHS Global
Insight’s model of the U.S. economy. These data are available for all quarters beginning with 1959.
The Bureau of Labor Statistics (BLS) publishes the Employment Cost Index (ECI) as well as data on hours worked.
The EIA regional model uses these quarterly data as provided by the IHS Global Insight’s model of the U.S.
economy. The ECI data series begins with the first quarter of 1975, while the data series on hours worked in
non‐farm establishments goes back to 1964.
Refer to the previous section “Gross State Product” on page 33 for the description of regional and national
population.
Manufacturing and non‐manufacturing wages
The model projects regional average annual manufacturing wages in nominal terms. The regional estimation
equations use a first difference log formulation with the private sector wage and salary employment cost index
as an explanatory variable. The general form of the average annual manufacturing wages equations is
∆ log 1 ∗ ∆ log ∗ ,
where
= Census Division (1 to 9);
1 = estimated regression coefficient for the explanatory variable in the equation for
average annual manufacturing wages, for region ;
= employment cost index, private sector wages and salaries, index ‐ 1992 = 1.0, national;
and
= average annual manufacturing wages, in thousands of dollars, for region ;
∆ = first difference operator, i.e., ∆ , where t is the reference year.
The historical average annual manufacturing wage estimates are computed from BEA’s quarterly manufacturing
wage data, which are available by Census Division for 1970 and subsequent years. The employment cost index
for private sector wages and salaries comes from IHS Global Insight’s model of the U.S. economy. The historical
employment cost index is at a quarterly interval beginning in 1975 and is an index with 1992 = 1.0.
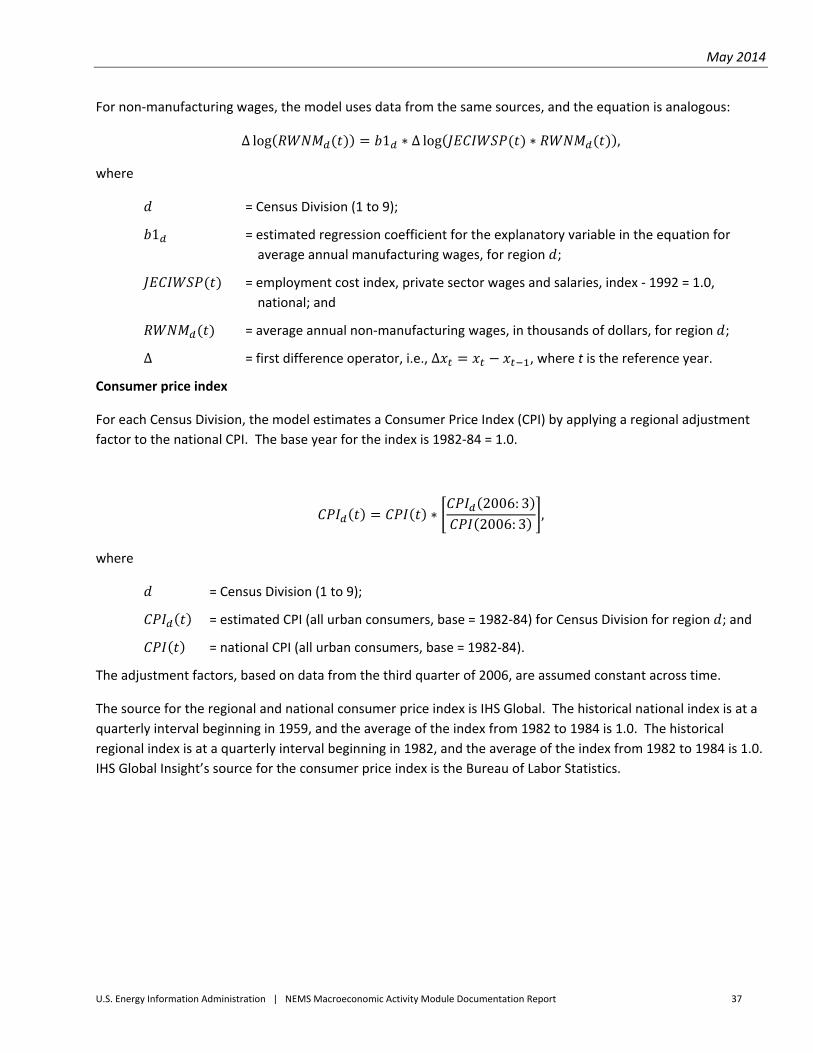
May 2014
U.S. Energy Information Administration | NEMS Macroeconomic Activity Module Documentation Report 37
For non‐manufacturing wages, the model uses data from the same sources, and the equation is analogous:
∆ log 1 ∗ ∆ log ∗ ,
where
= Census Division (1 to 9);
1 = estimated regression coefficient for the explanatory variable in the equation for
average annual manufacturing wages, for region ;
= employment cost index, private sector wages and salaries, index ‐ 1992 = 1.0,
national; and
= average annual non‐manufacturing wages, in thousands of dollars, for region ;
∆ = first difference operator, i.e., ∆ , where t is the reference year.
Consumer price index
For each Census Division, the model estimates a Consumer Price Index (CPI) by applying a regional adjustment
factor to the national CPI. The base year for the index is 1982‐84 = 1.0.
∗2006: 32006: 3
,
where
= Census Division (1 to 9);
= estimated CPI (all urban consumers, base = 1982‐84) for Census Division for region ; and
= national CPI (all urban consumers, base = 1982‐84).
The adjustment factors, based on data from the third quarter of 2006, are assumed constant across time.
The source for the regional and national consumer price index is IHS Global. The historical national index is at a
quarterly interval beginning in 1959, and the average of the index from 1982 to 1984 is 1.0. The historical
regional index is at a quarterly interval beginning in 1982, and the average of the index from 1982 to 1984 is 1.0.
IHS Global Insight’s source for the consumer price index is the Bureau of Labor Statistics.
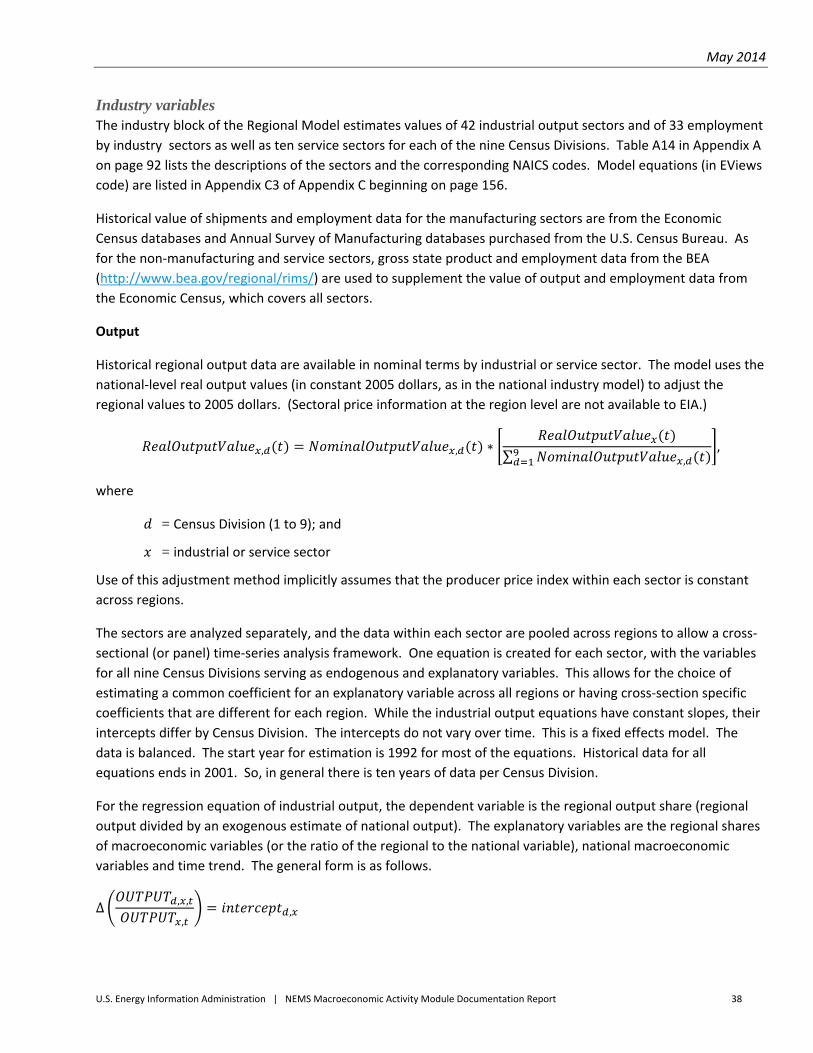
May 2014
U.S. Energy Information Administration | NEMS Macroeconomic Activity Module Documentation Report 38
Industry variables The industry block of the Regional Model estimates values of 42 industrial output sectors and of 33 employment
by industry sectors as well as ten service sectors for each of the nine Census Divisions. Table A14 in Appendix A
on page 92 lists the descriptions of the sectors and the corresponding NAICS codes. Model equations (in EViews
code) are listed in Appendix C3 of Appendix C beginning on page 156.
Historical value of shipments and employment data for the manufacturing sectors are from the Economic
Census databases and Annual Survey of Manufacturing databases purchased from the U.S. Census Bureau. As
for the non‐manufacturing and service sectors, gross state product and employment data from the BEA
(http://www.bea.gov/regional/rims/) are used to supplement the value of output and employment data from
the Economic Census, which covers all sectors.
Output
Historical regional output data are available in nominal terms by industrial or service sector. The model uses the
national‐level real output values (in constant 2005 dollars, as in the national industry model) to adjust the
regional values to 2005 dollars. (Sectoral price information at the region level are not available to EIA.)
, , ∗∑ ,
,
where
= Census Division (1 to 9); and
= industrial or service sector
Use of this adjustment method implicitly assumes that the producer price index within each sector is constant
across regions.
The sectors are analyzed separately, and the data within each sector are pooled across regions to allow a cross‐
sectional (or panel) time‐series analysis framework. One equation is created for each sector, with the variables
for all nine Census Divisions serving as endogenous and explanatory variables. This allows for the choice of
estimating a common coefficient for an explanatory variable across all regions or having cross‐section specific
coefficients that are different for each region. While the industrial output equations have constant slopes, their
intercepts differ by Census Division. The intercepts do not vary over time. This is a fixed effects model. The
data is balanced. The start year for estimation is 1992 for most of the equations. Historical data for all
equations ends in 2001. So, in general there is ten years of data per Census Division.
For the regression equation of industrial output, the dependent variable is the regional output share (regional
output divided by an exogenous estimate of national output). The explanatory variables are the regional shares
of macroeconomic variables (or the ratio of the regional to the national variable), national macroeconomic
variables and time trend. The general form is as follows.
∆ , ,
,,
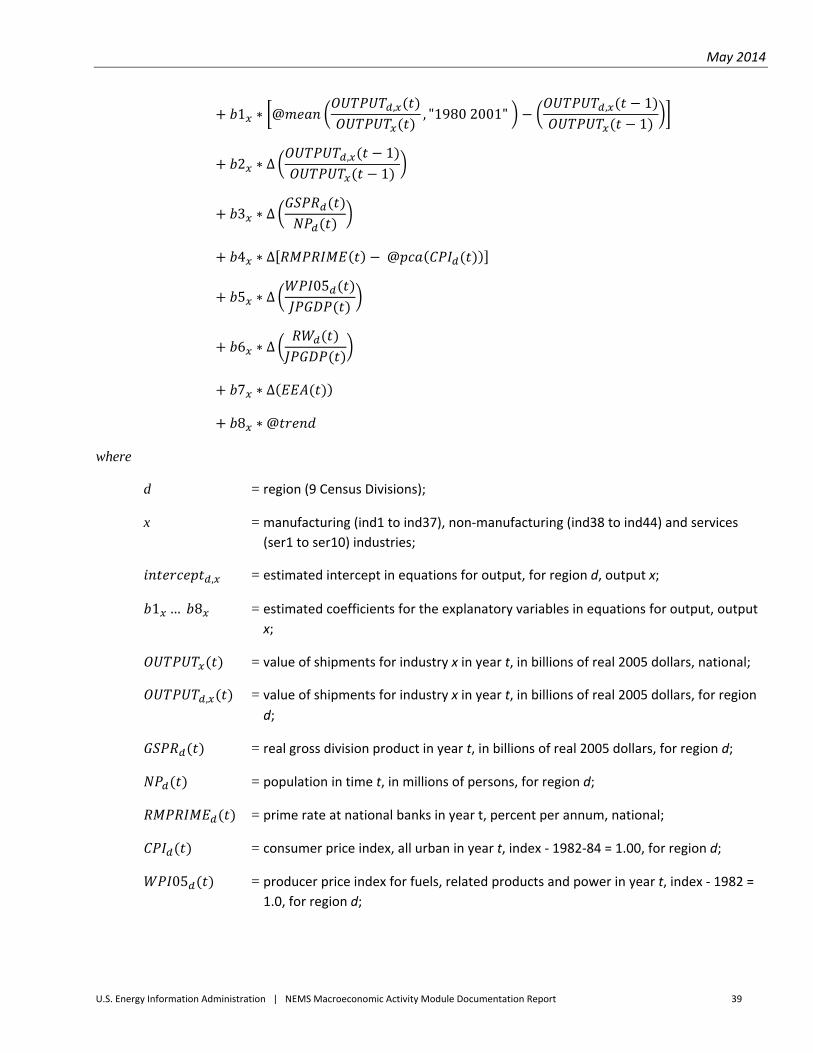
May 2014
U.S. Energy Information Administration | NEMS Macroeconomic Activity Module Documentation Report 39
1 ∗ @ , , "19802001" , 11
2 ∗ ∆ , 11
3 ∗ ∆
4 ∗ ∆ @
5 ∗ ∆05
6 ∗ ∆
7 ∗ ∆
8 ∗ @
where
d = region (9 Census Divisions);
x = manufacturing (ind1 to ind37), non‐manufacturing (ind38 to ind44) and services
(ser1 to ser10) industries;
, = estimated intercept in equations for output, for region d, output x;
1 … 8 = estimated coefficients for the explanatory variables in equations for output, output
x;
= value of shipments for industry x in year t, in billions of real 2005 dollars, national;
, = value of shipments for industry x in year t, in billions of real 2005 dollars, for region
d;
= real gross division product in year t, in billions of real 2005 dollars, for region d;
= population in time t, in millions of persons, for region d;
= prime rate at national banks in year t, percent per annum, national;
= consumer price index, all urban in year t, index ‐ 1982‐84 = 1.00, for region d;
05 = producer price index for fuels, related products and power in year t, index ‐ 1982 = 1.0, for region d;
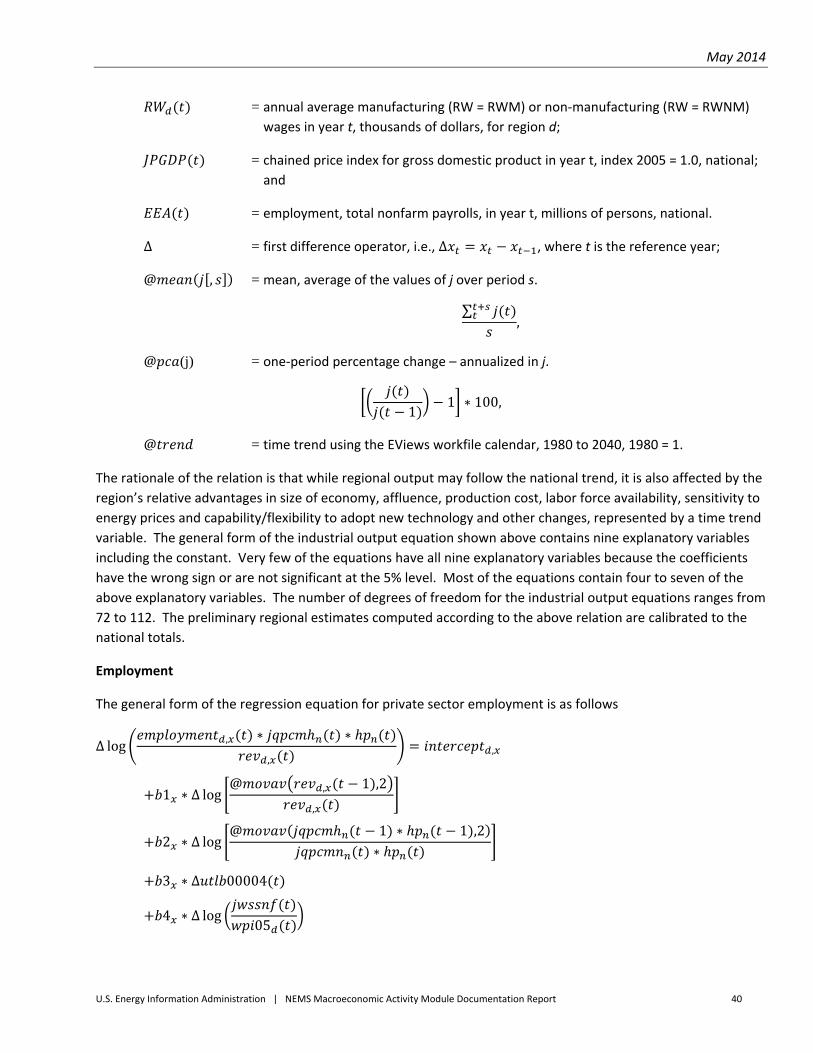
May 2014
U.S. Energy Information Administration | NEMS Macroeconomic Activity Module Documentation Report 40
= annual average manufacturing (RW = RWM) or non‐manufacturing (RW = RWNM)
wages in year t, thousands of dollars, for region d;
= chained price index for gross domestic product in year t, index 2005 = 1.0, national;
and
= employment, total nonfarm payrolls, in year t, millions of persons, national.
∆ = first difference operator, i.e., ∆ , where t is the reference year;
@ , = mean, average of the values of j over period s.
∑,
@ (j) = one‐period percentage change – annualized in j.
11 ∗ 100,
@ = time trend using the EViews workfile calendar, 1980 to 2040, 1980 = 1.
The rationale of the relation is that while regional output may follow the national trend, it is also affected by the
region’s relative advantages in size of economy, affluence, production cost, labor force availability, sensitivity to
energy prices and capability/flexibility to adopt new technology and other changes, represented by a time trend
variable. The general form of the industrial output equation shown above contains nine explanatory variables
including the constant. Very few of the equations have all nine explanatory variables because the coefficients
have the wrong sign or are not significant at the 5% level. Most of the equations contain four to seven of the
above explanatory variables. The number of degrees of freedom for the industrial output equations ranges from
72 to 112. The preliminary regional estimates computed according to the above relation are calibrated to the
national totals.
Employment
The general form of the regression equation for private sector employment is as follows
∆ log , ∗ ∗
,,
1 ∗ ∆ log@ , 1 ,2
,
2 ∗ ∆ log@ 1 ∗ 1 ,2
∗
3 ∗ ∆ 00004
4 ∗ ∆ log05
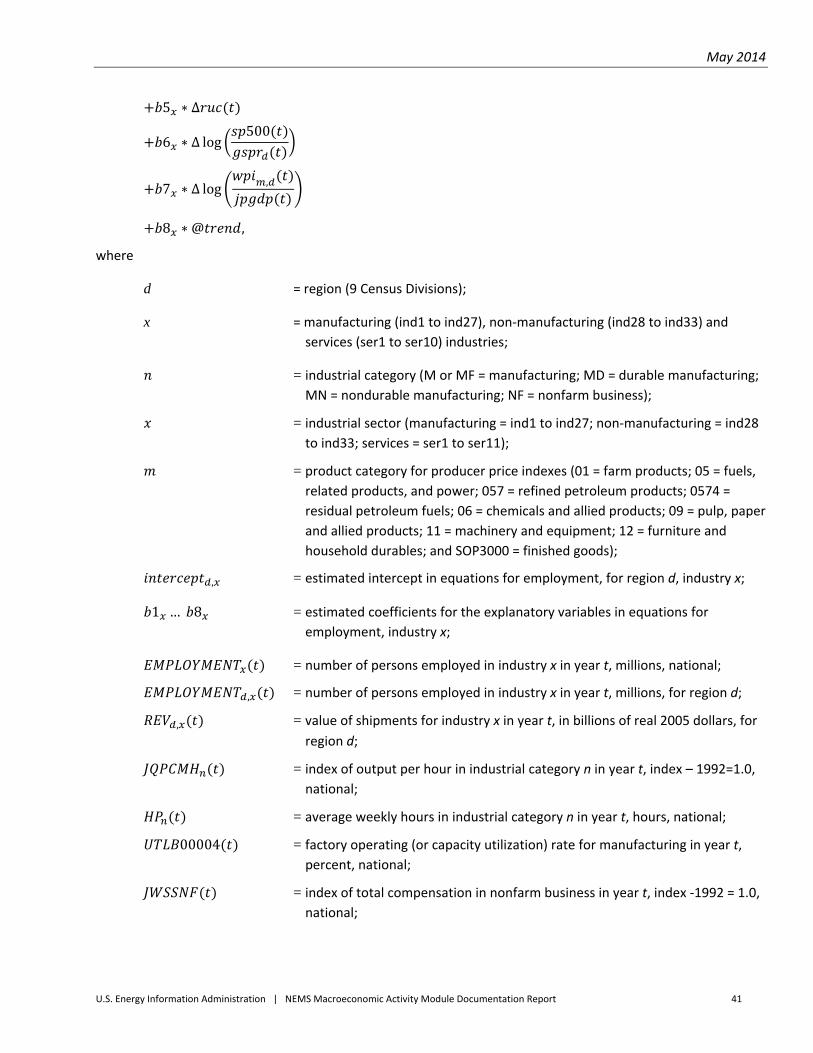
May 2014
U.S. Energy Information Administration | NEMS Macroeconomic Activity Module Documentation Report 41
5 ∗ ∆
6 ∗ ∆ log500
7 ∗ ∆ log ,
8 ∗ @ ,
where
d = region (9 Census Divisions);
x = manufacturing (ind1 to ind27), non‐manufacturing (ind28 to ind33) and
services (ser1 to ser10) industries;
= industrial category (M or MF = manufacturing; MD = durable manufacturing;
MN = nondurable manufacturing; NF = nonfarm business);
= industrial sector (manufacturing = ind1 to ind27; non‐manufacturing = ind28
to ind33; services = ser1 to ser11);
= product category for producer price indexes (01 = farm products; 05 = fuels,
related products, and power; 057 = refined petroleum products; 0574 =
residual petroleum fuels; 06 = chemicals and allied products; 09 = pulp, paper
and allied products; 11 = machinery and equipment; 12 = furniture and
household durables; and SOP3000 = finished goods);
, = estimated intercept in equations for employment, for region d, industry x;
1 … 8 = estimated coefficients for the explanatory variables in equations for
employment, industry x;
= number of persons employed in industry x in year t, millions, national;
, = number of persons employed in industry x in year t, millions, for region d;
, = value of shipments for industry x in year t, in billions of real 2005 dollars, for
region d;
= index of output per hour in industrial category n in year t, index – 1992=1.0, national;
= average weekly hours in industrial category n in year t, hours, national;
00004 = factory operating (or capacity utilization) rate for manufacturing in year t,
percent, national;
= index of total compensation in nonfarm business in year t, index ‐1992 = 1.0,
national;
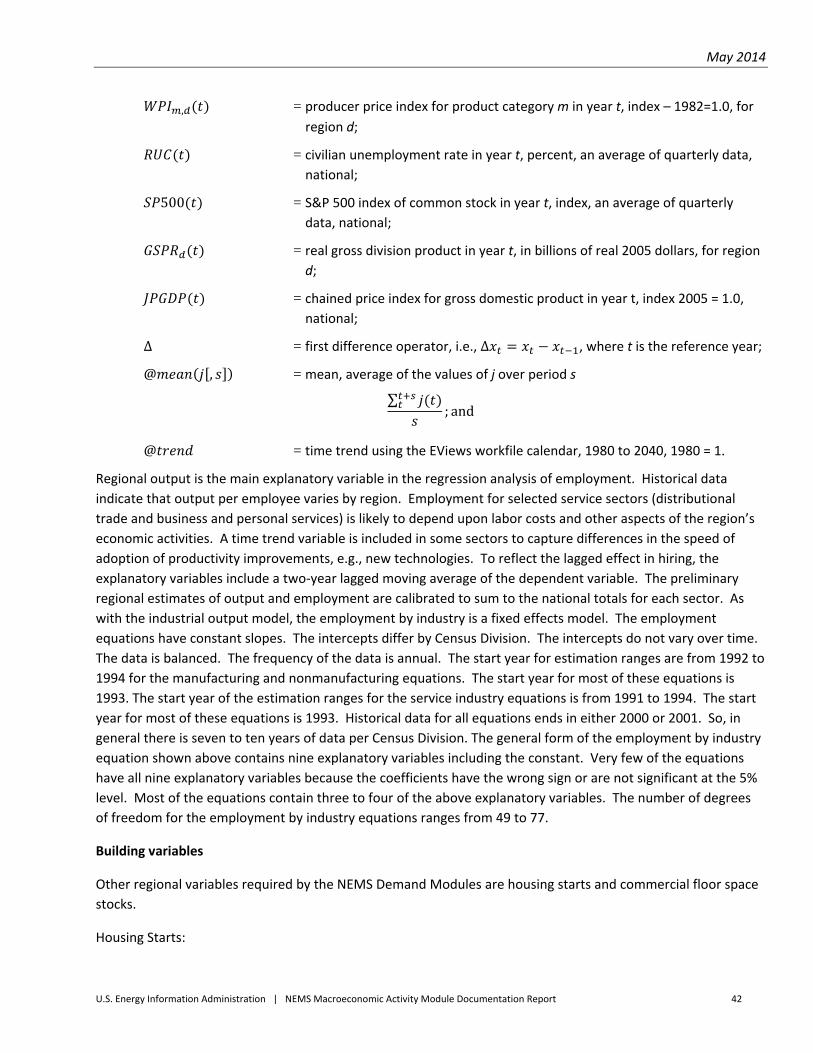
May 2014
U.S. Energy Information Administration | NEMS Macroeconomic Activity Module Documentation Report 42
, = producer price index for product category m in year t, index – 1982=1.0, for
region d;
= civilian unemployment rate in year t, percent, an average of quarterly data,
national;
500 = S&P 500 index of common stock in year t, index, an average of quarterly
data, national;
= real gross division product in year t, in billions of real 2005 dollars, for region d;
= chained price index for gross domestic product in year t, index 2005 = 1.0,
national;
∆ = first difference operator, i.e., ∆ , where t is the reference year;
@ , = mean, average of the values of j over period s
∑; and
@ = time trend using the EViews workfile calendar, 1980 to 2040, 1980 = 1.
Regional output is the main explanatory variable in the regression analysis of employment. Historical data
indicate that output per employee varies by region. Employment for selected service sectors (distributional
trade and business and personal services) is likely to depend upon labor costs and other aspects of the region’s
economic activities. A time trend variable is included in some sectors to capture differences in the speed of
adoption of productivity improvements, e.g., new technologies. To reflect the lagged effect in hiring, the
explanatory variables include a two‐year lagged moving average of the dependent variable. The preliminary
regional estimates of output and employment are calibrated to sum to the national totals for each sector. As
with the industrial output model, the employment by industry is a fixed effects model. The employment
equations have constant slopes. The intercepts differ by Census Division. The intercepts do not vary over time.
The data is balanced. The frequency of the data is annual. The start year for estimation ranges are from 1992 to
1994 for the manufacturing and nonmanufacturing equations. The start year for most of these equations is
1993. The start year of the estimation ranges for the service industry equations is from 1991 to 1994. The start
year for most of these equations is 1993. Historical data for all equations ends in either 2000 or 2001. So, in
general there is seven to ten years of data per Census Division. The general form of the employment by industry
equation shown above contains nine explanatory variables including the constant. Very few of the equations
have all nine explanatory variables because the coefficients have the wrong sign or are not significant at the 5%
level. Most of the equations contain three to four of the above explanatory variables. The number of degrees
of freedom for the employment by industry equations ranges from 49 to 77.
Building variables
Other regional variables required by the NEMS Demand Modules are housing starts and commercial floor space
stocks.
Housing Starts:

May 2014
U.S. Energy Information Administration | NEMS Macroeconomic Activity Module Documentation Report 43
1. Single Family Housing Starts
2. Multi‐Family Housing Starts
3. Mobile Home Shipments
Commercial floor space (thousand square feet) types:
1. Stores – stores and restaurants
2. Warehouse – manufacturing and wholesale trade, public and federally‐owned warehouses
3. Office – private, federal, and state and local offices
4. Automotive – auto service and parking garages
5. Manufacturing
6. Education – primary/secondary and higher education
7. Health – hospitals and nursing homes
8. Public – federal and state and local
9. Religious
10. Amusement
11. Miscellaneous, non‐residential – transportation related and all other not elsewhere classified
12. Hotel – hotels and motels
13. Dormitories – educational and federally‐owned (primarily military)
May 2014
U.S. Energy Information Administration | NEMS Macroeconomic Activity Module Documentation Report 44
Housing starts
The regional residential housing projection for single and multi‐family housing starts and for mobile home
shipments are done using shares supplied by the NEMS’s Residential Module manager. The shares are derived
from annual changes in regional population relative to that for the nation. Population estimates are exogenous
to the MAM models. Starts and shipments are measured in millions of units. Beginning in 2002, there is an
annual share value for single and for multi‐family housing starts as well as for mobile home shipments in each of
the nine Census Divisions. The shares are applied to the respective national total from IHS Global Insight’s
model of the U.S. economy. Historical data for housing starts and mobile home shipments are quarterly and
begin in 1959. The Census Bureau is IHS Global Insight’s source for single‐family starts and mobile home
shipments. IHS Global Insight constructs multi‐family housing starts. Since the frequency of the shares is annual
and that for IHS Global Insight’s U.S. and EIA’s regional models are quarterly, the shares are converted to a
quarterly frequency. Constant‐match average is the method used in EViews to convert the frequency to
quarterly from annual.
Commercial floor space
The COMFLR submodule of the MAM contains 280 equations of which 13 (corresponding to the 13 commercial
floor space types) project national floor space additions using historical data beginning in 1970. The remaining
267 equations are definitional. Of these equations, 117 allocate the national floor space additions, by floor
space type, to the Census Division level using shares computed as moving averages over 20 quarters. Another
117 equations compute regional stocks by floor space type by adding net additions to last period’s existing
stock. A related 13 equations sum regional stocks by floor space type to compute national stocks by floor space
type. The final 20 equations aggregate additions and stocks by region (nine Census regions) and then aggregate
these regional sums for national totals of additions and of stocks.
COMFLR calculates both the additions and stocks of 13 floor space types in each of the 9 Census Divisions. The
units are thousands of square feet of commercial floor space, and the frequency is quarterly. The quarterly
additions are aggregated, and the resulting annual stock solution is written to the NEMS common block as the
reported annual floor space estimate. Model equations are listed in Appendix C2 of Appendix C on page 136.
The commercial floor space model is a stock adjustment model. The endogenous variable is the change in the
addition of commercial floor space in thousands of square feet by floor space type. The explanatory variables
include lagged values of own commercial floor space additions and stocks, trends of own commercial floor space
additions and stocks, per capita real gross domestic product, real per capita consumption of goods and services,
real private investment in commercial buildings, real change in the stock of business inventories, employment,
interest rates and total additions to national floor space. The general form of the estimated commercial floor
space equations is as follows.
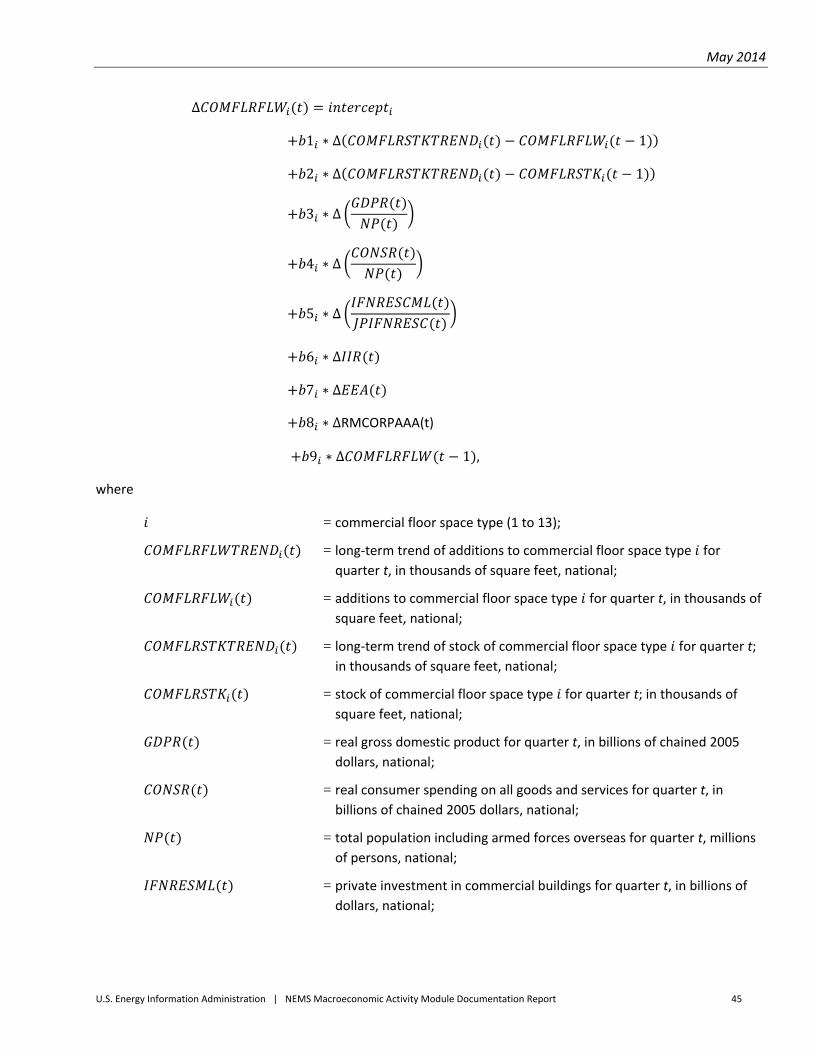
May 2014
U.S. Energy Information Administration | NEMS Macroeconomic Activity Module Documentation Report 45
∆
1 ∗ ∆ 1
2 ∗ ∆ 1
3 ∗ ∆
4 ∗ ∆
5 ∗ ∆
6 ∗ ∆
7 ∗ ∆
8 ∗ ∆RMCORPAAA(t)
9 ∗ ∆ 1 ,
where
= commercial floor space type (1 to 13);
= long‐term trend of additions to commercial floor space type for
quarter t, in thousands of square feet, national;
= additions to commercial floor space type for quarter t, in thousands of
square feet, national;
= long‐term trend of stock of commercial floor space type for quarter t;
in thousands of square feet, national;
= stock of commercial floor space type for quarter t; in thousands of
square feet, national;
= real gross domestic product for quarter t, in billions of chained 2005
dollars, national;
= real consumer spending on all goods and services for quarter t, in
billions of chained 2005 dollars, national;
= total population including armed forces overseas for quarter t, millions
of persons, national;
= private investment in commercial buildings for quarter t, in billions of
dollars, national;
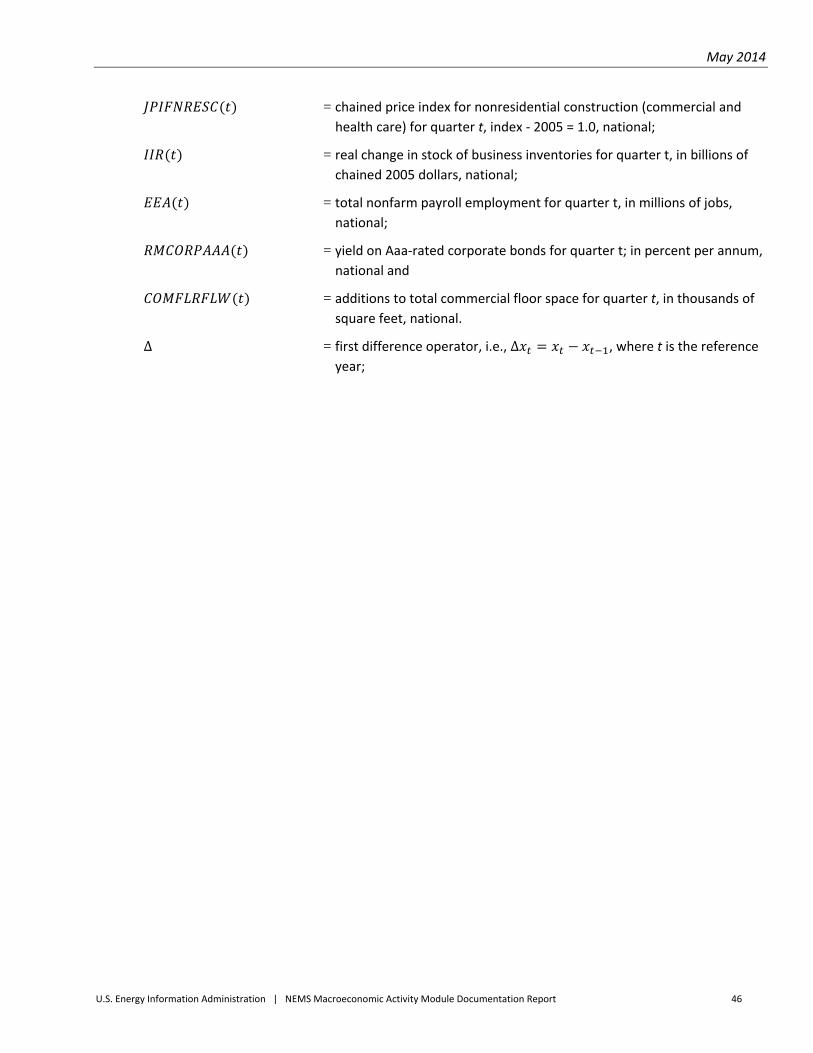
May 2014
U.S. Energy Information Administration | NEMS Macroeconomic Activity Module Documentation Report 46
= chained price index for nonresidential construction (commercial and
health care) for quarter t, index ‐ 2005 = 1.0, national;
= real change in stock of business inventories for quarter t, in billions of chained 2005 dollars, national;
= total nonfarm payroll employment for quarter t, in millions of jobs,
national;
= yield on Aaa‐rated corporate bonds for quarter t; in percent per annum,
national and
= additions to total commercial floor space for quarter t, in thousands of
square feet, national.
∆ = first difference operator, i.e., ∆ , where t is the reference
year;
May 2014
U.S. Energy Information Administration | NEMS Macroeconomic Activity Module Documentation Report 47
Part B. THE MAM INTERFACE WITH THE NEMS
5. Integrated simulations using the MAM This section first describes the types of integrated simulations of the Macroeconomic Activity Module (MAM)
within the National Energy Modeling System (NEMS). It then briefly lays out the setup of the models constituting
the MAM and the aspects that are common to all the simulations. As indicated above, the set of models is
designed to run in a recursive manner. EIA’s version of IHS Global Insight’s model of the U.S. economy, the
Macroeconomic Model, provides estimates of over 1700 concepts spanning final demands, aggregate supply,
prices, incomes, international trade, industrial detail, interest rates and financial flows.
The Industrial Output Model takes the final demand projections from the Macroeconomic Model as inputs and
provides projections of output for 66 sectors, covering the entire economy, at the three and sometimes four‐
digit NAICS code levels. The Employment Model projects employment levels for 59 industries, based on the
output projections from the Industrial Output Model, national wage rates, productivity trends, and average
workweek trends from the Macroeconomic Model. The non‐farm employment projections are calibrated to
sum to the national total projected by the Macroeconomic Model. The Regional Model allocates the national
totals of output and employment to the nine Census Divisions. The Commercial Floor Space Model calculates
regional floor space, by Census Division, for 13 floor space types.
Integrated simulations of alternative energy conditions or events The integrated NEMS projections center on estimating the state of the energy‐economic system given a set of
alternative energy conditions. Typically, the projections fall into the following four types of integrated NEMS
simulations:
1. Reference case projection
2. Alternative world oil prices
3. Changes in or proposed energy fees or emissions permits
4. Proposed changes in Combined Average Fuel Economy (CAFE) standards
In these integrated NEMS simulations, estimated values for over 240 macroeconomic and demographic variables
from MAM are passed to NEMS. After making any transformations required by the simulation, the modules of
NEMS solve for demand, supply and prices of energy over the projection period. These energy prices and
quantities are then returned to MAM and a new calculation, Scenario 1, is solved in the MAM’s U.S., Industrial
Output, Employment by industry, Regional and Commercial Floor Space Models. Details of each type of
integrated simulation are discussed below.
May 2014
U.S. Energy Information Administration | NEMS Macroeconomic Activity Module Documentation Report 48
Reference projection: The development of the MAM’s Reference case is an iterative process requiring many
integrated simulations of the NEMS before global convergence is attained. But before the first integrated run
can be done, it is necessary to create a baseline for the U.S. Model. Modifications are made to IHS Global
Insight’s model of the U.S. economy so that it includes EIA’s assumption about the path of the world oil price.
The results of this model solution become the preliminary baseline, Scenario 0, of the U.S. Model.
At this point, the MAM is included in integrated simulations of the NEMS. Energy market conditions as supplied
by the modules of the NEMS are assumptions exogenous to the U.S. Model. The U.S. Model is simulated using
these assumptions. The resulting projection is labeled “Scenario 1” in the EViews workfile. The MAM is a
collection of models, with the U.S. Model (also referred to as the Macroeconomic Model) being the first to
execute. Models of industrial output and employment by industry at the national level are solved sequentially
using the U.S. Model results. Simulations of regional models of economic activity, housing starts, commercial
floor space and of industrial output and employment by industry then follow.
Once all the models of the MAM are solved, a subset of the projection is written to the global data structure so
that the modules of NEMS can react to these new economic assumptions (Table B14 in Appendix B on page 92).
This is a “cycle” of the NEMS. Cycles are repeated until convergence factors are satisfied. At some point,
following many runs of the NEMS, the Reference case is declared to be frozen. The “Scenario 1” solution in the
U.S. Model then becomes the final baseline used as the starting point for analyzing policy proposals and changes
in energy markets. These results are reported in the AEO as the Reference case.
Alternative world oil prices: Crude oil prices are determined in the international market and are influenced by
production decisions in OPEC and non‐OPEC nations. Two simulations are normally performed in conjunction
with the reference projection for the AEO. These are based on a High World Oil Price scenario and a Low World
Oil Price scenario. These high and low prices are based on different assumptions about the world’s liquids
market. For each of these cases, the MAM starts from the Reference case, as explained above, and passes the
values of the required macro variables to the modules of NEMS. The NEMS reacts to the alternative world oil
price and various measures of economic activity. A new set of energy variables, including new oil prices, are
passed back to the MAM, which then re‐solves its series of models.
Changes in or proposed energy taxes or emission permits: This class of simulations levies some kind of tax on
an energy sector. It could be a per‐unit tax (x‐cents per gallon) or an ad‐valorem tax (x% of revenues). It could
be a tax on a fuel by type or on emissions by type. When taxes are levied on an industry, prices are expected to
rise in proportion to the tax. These taxes, if collected by the federal government, will change the budget deficit
relative to the baseline. Since these taxes are not levied for revenue raising purposes, although the raising of
revenue has also been considered in previous years, assumptions are made as to how these are returned to the
economy. Generally, three alternative schemes are implemented. First, it can be assumed that taxes are
retained within the business sector (grandfathered). Second, they can be returned to households. Third, a
fraction can be returned to the households while the remaining fraction is retained within the business sector.
In practice, these alternative schemes have also included spending on government research and development
projects as well as transfers to help ameliorate the impacts of the tax.
The grandfathered case is easiest to implement since the revenues stay in the business sector. Here, as in all
simulations, reference scenario values for macroeconomic and demographic variables are passed to the NEMS.
May 2014
U.S. Energy Information Administration | NEMS Macroeconomic Activity Module Documentation Report 49
Increases in or introductions of new energy taxes raise energy prices and reduce production and consumption in
the NEMS, which returns the newly estimated values to the MAM. The increase in federal revenues due to
energy taxes is also returned to the MAM. In this case the business sector retains all tax revenues.
In the case where revenues are returned to the consumers, the increased revenues are subtracted from
corporate profits before taxes (ZB) by increasing Federal excise tax accruals other than for a value added tax
(TXIMGFOTH) through the add factor associated with it (TXIMGFOTH_A). Second, the add factor associated with
federal personal tax receipts (TXPGF_A) is reduced by the same amount as the increase in the excise tax.
Essentially these two procedures imply that the federal government takes the energy tax revenues away from
the business sector as a lump sum amount and then returns them to consumers in the form of a lump sum.
In the case where a portion of the tax revenue is allowed to stay in the business sector and the remaining
amount is returned to consumers, the add factor for TXIMGFOTH is increased by the amount that has to be
returned to the consumers. Then the add factor for TXPGF is reduced by the same amount.
Proposed changes in CAFE standards: This class of simulations is based on changing (increasing) the combined
average fuel economy of new light vehicles relative to the baseline CAFE standards. Increases in the CAFE
standards are associated with an increase in the cost of production of new light vehicles, which are calculated by
the Transportation Module of the NEMS. This increased cost is passed to the MAM. The additional cost per new
light vehicle is added to the reference average price of new light duty vehicles (PLVAVG).
Once the MAM solves its series of models using the new assumption, it writes its new projection to the global
data structure. The other modules of the NEMS read the new MAM and CAFE assumptions and recalculate their
projections. The resulting new energy prices and quantities along with the incremental cost for new light
vehicles are returned to the MAM. The MAM uses the newly estimated energy market assumptions to re‐solve.
This process continues until the NEMS forecast converges.
Model levers and simulation rules IHS Global Insight provides a series of levers and simulation tools in its models that permit change in key
assumptions. All these levers and simulation rules are presented below along with a discussion of how they are
modified in the MAM.
May 2014
U.S. Energy Information Administration | NEMS Macroeconomic Activity Module Documentation Report 50
Energy prices and quantities: The projected values for energy prices and quantities appearing in the MAM’s
U.S. Model are exogenous assumptions provided by the supply and demand modules of the NEMS. The
production and end‐use demand of energy is measured in quadrillion BTUs. Similarly, projections of output for
five energy‐related industries and of employment in two energy‐related industries are determined by the NEMS.
The estimated values of the following energy variables are exogenous to the MAM and are determined in the
supply and demand modules of the NEMS:
a. Production of energy
ENGDOMPETANG = Domestic production of petroleum & natural gas, quadrillion BTUs
ENGDOMO = Domestic production of energy excluding petroleum & natural gas, quadrillion BTUs
ENGRESID = Difference between total energy supply and total energy demand, quadrillion BTUs
ENDUSEPCCOAL = Coal share of electric utility fuel use
ENDUSEPCNG = Natural gas share of electric utility fuel use
ENDUSEPCPET = Petroleum share of electric utility fuel use
b. End‐use demand for energy
DALLFUELS = Demand for all fuels, quadrillion BTUs
DENDUCOAL = End use demand for coal (excludes electricity generation), quadrillion BTUs
DENDUELC = Sales of electricity to ultimate consumers, quadrillion BTUs
DENDUNG = End use demand for natural gas, quadrillion BTUs
DENDUPET = End use demand for petroleum, quadrillion BTUs
c. Consumer spending on energy
CNEFAOR = Real consumer spending on fuel oil & coal
CSVUGR = Real consumer spending on natural gas
CSVUER = Real consumer spending on electricity
CNEGAOR = Real consumer spending on gasoline & motor oil
QGASASF = Highway consumption of gasoline & special fuels
May 2014
U.S. Energy Information Administration | NEMS Macroeconomic Activity Module Documentation Report 51
d. Prices of Energy
JPCNEFAO = Chained price index consumer fuel oil & coal
JPCSVUE = Chained price index household electricity
JPCSVUG = Chained price index household natural gas
JPCNEGAO = Chained price index consumer gasoline & oil
WPI051 = Producer price index coal
WPI054 = Producer price index electric power
WPI055 = Producer price index utility natural gas
WPI0561 = Producer price index crude petroleum
WPI057 = Producer price index refined petroleum products
WPI0574 = Producer price index residual petroleum fuels
PNGHH = Henry Hub spot market price of natural gas
PNGWL = Average wellhead price of natural gas
POILIMP = Weighted average price of imported crude received in refinery inventories
POILWTI = Average price of West Texas intermediate crude
PETIN = Industrial ethane feedstock price
PLGINPF = LPG feedstock price
PPFIN = Petrochemical feedstock price
e. Industrial production indices
IPSN2121 = Industrial production index coal mining
IPSG211A3 = Industrial production index oil & gas extraction & support activities
f. Industrial output
Though the output projections of the following energy‐related industries are endogenously determined in the
MAM’s Industrial Output Model, its values are overwritten. The MAM’s final results are computed by applying
the growth rates from the NEMS projections to the last historical data point in the MAM’s Industrial Output
Model.
May 2014
U.S. Energy Information Administration | NEMS Macroeconomic Activity Module Documentation Report 52
R2121R = Real Output of coal mining
R211R and R213R = Real Output of oil and gas extraction and support activities
R32411R = Real Output of petroleum refining
R2211R = Real Output of electric utilities
R2212R = Real Output of gas utilities
g. Employment by industry
Though the employment projections of the following energy‐related industries are endogenously determined in
the MAM’s employment model, its values are overwritten. The MAM’s final results are computed by applying
the growth rates from the NEMS projections to the last historical data point in the MAM’s employment model.
E2121 = Employment of coal mining industry
E211 and E213 = Employment of oil and gas extraction industry
Fiscal policy assumptions: Unless mentioned otherwise, the MAM retains IHS Global Insight’s default settings
for fiscal policy levers and assumptions.
a. Federal purchases
Real federal government spending for each spending category is an exogenous input in the model. The price
deflator associated with each of the goods categories reflects goods inflation in the private sector of the
economy. Price deflators associated with the federal wage categories (JPGFMLCWSS and JPGFOCWSS) are
closely tied to legislated pay increases; this pay increase concept explains 70‐80% of the inflation in government
wages while wage inflation in the private sector of the economy explains the remainder.
The determination of federal government pay increases (GFMLPAY and GFOPAY) is controlled by model lever
GFPAYLEV. If GFPAYLEV is set to 1, federal government pay increases are specified exogenously by the model
user (they should supply values for exogenous variables GFMLPAYEXO and GFOPAYEXO that are annual percent
pay increases for the two categories respectively). If GFPAYLEV is set to 0, federal government pay increases are
modeled to rise with inflation as indicated by the chained price index of consumer purchases (JPC). The default
value for GFPAYLEV is 1.0.
b. Federal transfer payments
The model lever JSSLEV allows users to simulate Congressional decisions to trim (negative annual percentage
rate) or augment (positive annual percentage rate) the cost‐of‐living adjustment (COLA) on social security
payments (YPTRFGFSISS) based upon CPI inflation. For example, setting the lever value to 1 increases the social
security COLA by 1%. The default value for JSSLEV is 0.
c. Personal income tax rates
May 2014
U.S. Energy Information Administration | NEMS Macroeconomic Activity Module Documentation Report 53
Tax rates in the model are largely exogenous at the federal level and endogenous at the state and local level.
However, the model lever TXINFLEV allows the user to raise personal income tax rates if consumer prices rise. If
TXINFLEV is set to 0, changes in the federal personal income tax rate (RTXPGF) are controlled through the add
factor RTXPGF_A. If TXINFLEV is set to 1, the tax rate is indexed to CPI inflation. The default value for TXINFLEV
is 1. The add factor RTXPGF_A can be used to target search the full employment federal budget surplus
(NETSAVGFFE).
Monetary policy assumptions: The model lever RMFFLEV gives the user the flexibility of using the supply of
reserves as the key monetary policy instrument, reflecting the Federal Reserve's open market purchases or sales
of Treasury securities, or of using a reaction function as the policy instrument. If RMFFLEV is set to 0, the model
uses non‐borrowed reserves as the monetary policy instrument and the federal funds rate is determined by the
balance between the demand and supply of reserves existing in the banking system (equation RMFFRES). The
Federal Reserve does not engage in an active policy to stabilize the economy. The federal funds rate is
determined by the demand for federal funds existing in the banking system. If the lever is set to 1, the model
uses a Federal Reserve reaction function. This is an econometrically estimated equation which models the past
behavior of the Federal Reserve in setting the federal funds rate in response to changes in inflation and
unemployment (equation RMFFRCT). This implies that the Federal Reserve targets interest rates trading off
changes in inflation and the unemployment rate.
In the baseline forecast of IHS Global Insight’s model of the U.S. economy, both the RMFFRES equation and the
RMFFRCT equation yield the same federal funds rate forecast. Therefore, setting the lever at any value will not
alter these baseline projections. For policy simulations,setting the value anywhere between 0 and 1 reflects the
model user’s view about the degree of active monetary policy undertaken by the Federal Reserve. In the
simulations described above the lever is set at 0.9 to allow for a fairly active monetary policy. This reflects the
view that the Federal Reserve will act quickly to stabilize the economy in the case of energy events that have the
potential to disrupt the economy significantly.
Foreign assumptions: In general, IHS Global Insight’s default values are used. Exceptions are discussed below.
a. Interest rates
The long‐term government bond yield in rest‐of‐world industrial economies (RMGBLMTP) is exogenous and
equal to its baseline value RMGBLMTPB if the model lever RMGBLMTPLEV is set to 0. If RMGBLMTPLEV is set to
1, this rate changes by the same amount as the rate on the 10‐year U.S. Treasury note. If it is assumed that
there is international monetary policy coordination between the United States and the other major industrial
economies, then RMGBLMTPLEV should be set to 1. The default value for this lever is 0. This setting indicates
that the interest rate differential between the U.S. and the rest‐of‐world industrial economies may differ.
b. Foreign prices
Export and import demands are highly sensitive to changes in U.S. prices relative to foreign prices. While U.S.
prices are modeled in considerable detail with a high level of sophistication, the prices of our major trading
partners are largely exogenous assumptions in the model. At times, policy or event‐related simulations can
May 2014
U.S. Energy Information Administration | NEMS Macroeconomic Activity Module Documentation Report 54
cause relative (U.S./foreign) prices to deviate significantly from baseline when foreign prices are fixed, causing
trade volumes to respond strongly. In the case of a carbon tax that impacts our major trading partners to equal
degrees, for example, relative prices should not be changing. Hence simple simulation rules have been added to
the model to allow for movements in foreign prices relative to baseline levels.
b.1. Producer prices and relative prices.
The model lever TRADEPLEV was introduced to allow users to negate any changes in relative prices on export
and import demands. When TRADEPLEV is set to 1, export and import demands are determined by foreign
output demand and relative (U.S./trading partner) prices. When TRADEPLEV is set to 0, relative prices are
assumed to remain at baseline levels; export and import demands change from baseline levels only in response
to changes in output, not relative prices. The default value for TRADEPLEV is 1.
The producer price index for the rest of the industrialized world (WPIWMTP) is both the key determinant of
import prices and the key foreign price index driving the U.S. exchange rate with industrialized countries.
WPIWMTP is determined by one of two simulation rules based upon the value of the model lever WPIWLEV. If
WPIWLEV is set to 0, foreign producer prices are changed relative to baseline levels with changes in imported oil
prices (JPMGPET), U.S. merchandise export prices (JPXGXCPP), exchange rates (JEXCHMTP) and foreign
economic activity (JGDPMTPR and JGDPOITPR). If WPIWLEV is set to 1, foreign producer prices move in line with
U.S. merchandise export prices. The default value for WPIWLEV is 0.
b.2. Exchange Rates.
There are two nominal exchange rates in IHS Global Insight’s model of the U.S. economy. These are JEXCHMTP
and JEXCHOITP and are defined as trade‐weighted exchange rates (in U.S. $) for industrialized countries and for
developing countries, respectively. In the MAM, these variables are set exogenously to their baseline projected
values for all simulations.
c. Foreign GDP
There are two foreign real GDP variables in the Macroeconomic Model. These are real GDP in the rest of the
industrialized world (JGDPMTPR) and real GDP in developing countries (JGDPOITPR). If the model levers
corresponding to JGDPMTPR and JGDDPOITPR (JGDPMTPRLEV and JGDPOITPRLEV, respectively) are set to 0, the
values of the GDP variables are exogenous. When JGDPMTPRLEV and JGDPOITPRLEV

May 2014
U.S. Energy Information Administration | NEMS Macroeconomic Activity Module Documentation Report 55
levers equal 1, both foreign real GDP concepts change in the same proportion as the changes in U.S. real GDP.
The default values for JGDPMTPRLEV and JGDPOITPRLEV are 0. In the Alternative World Oil Price Simulations,
discussed above, the model assumes that the elasticity of the two foreign real GDP variables with respect to
world oil prices is 0.02. (This implies that these GDPs change by 0.02 percent for every 1 percent change in the
world oil price from the Reference Case price.) The value of 0.02 for the GDP elasticity with respect to world oil
price is based on empirical research findings.
Flowcharts of MAM
The following seven flowcharts show the flow of information from the NEMS to the MAM and how the energy
data and economic information are passed among the components of the MAM. This set of flowcharts identifies
the tasks performed by each of the MAM’s models and may not necessarily follow the actual programming
sequence. The latter will be discussed in the next section, along with another set of flowcharts presenting the
programming steps and subroutines.
Figure 1 summarizes the entire NEMS‐MAM integrated system. The remaining six figures focus on the various
models contained in the Macroeconomic, Industrial Output, Employment and Regional Models of the MAM. In
each model, a reference economic forecast using the structural models described in Part A was created and
linked to the NEMS to initialize the system.
The MAM is a feedback system that modifies the Reference scenario based on assumed changes in energy
events or policies. This approach is applied to all NEMS runs including the Reference and sensitivity cases of the
AEO. Alternative NEMS values of energy prices and quantities are first transformed into concepts compatible
with those in the MAM models. The growth rates of these alternative NEMS series are applied to the most
recent historical data values to create new energy projections. These new series are put into the MAM as
predetermined variables, and a new scenario is run.
The models in the MAM are run sequentially. The Macroeconomic Model is the first to run with the new energy
market assumptions. It is followed by the Industrial Output and Employment Models and finally by the Regional
Models. The downstream models in the MAM use the projections generated by the models further upstream as
predetermined variables. There is no feedback loop within MAM. That is, the estimate of an upstream model is
not affected by the results of a downstream model in the same NEMS cycle. When one cycle of the MAM is
complete, the projection is written to the global data structure of the NEMS for use by other modules.
Subsequent energy market estimates from the NEMS are returned to the MAM, if model convergence criteria
are not satisfied.
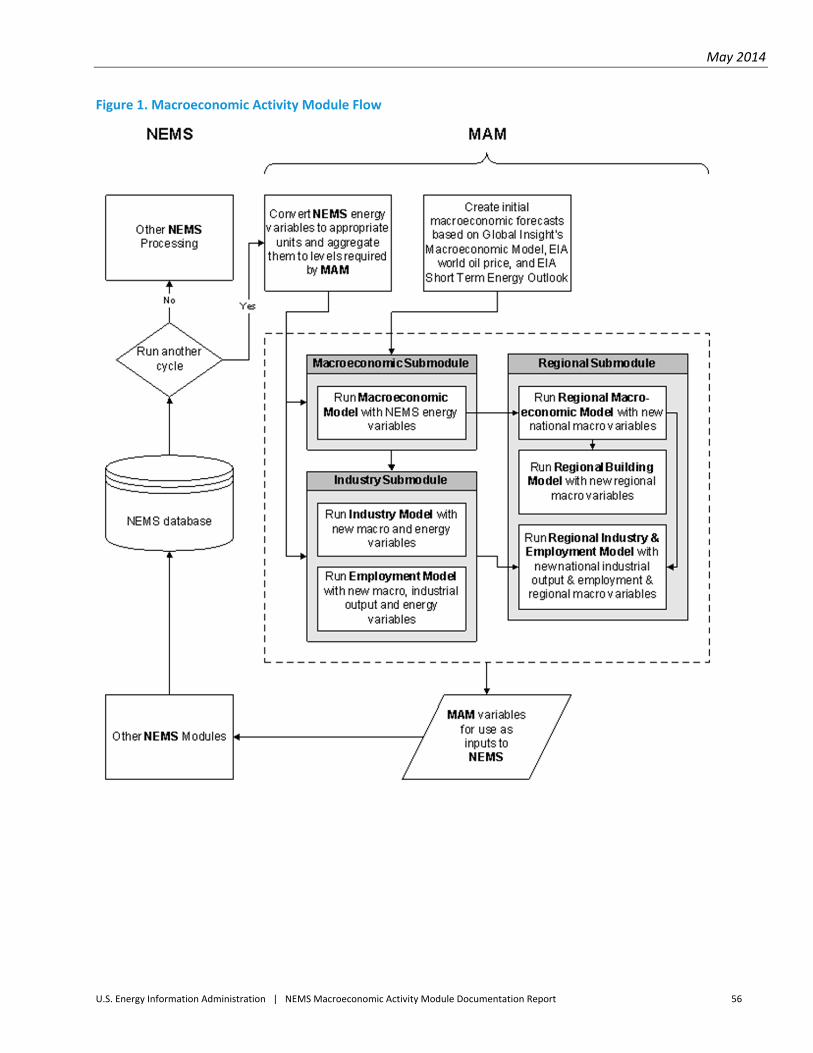
May 2014
U.S. Energy Information Administration | NEMS Macroeconomic Activity Module Documentation Report 56
Figure 1. Macroeconomic Activity Module Flow
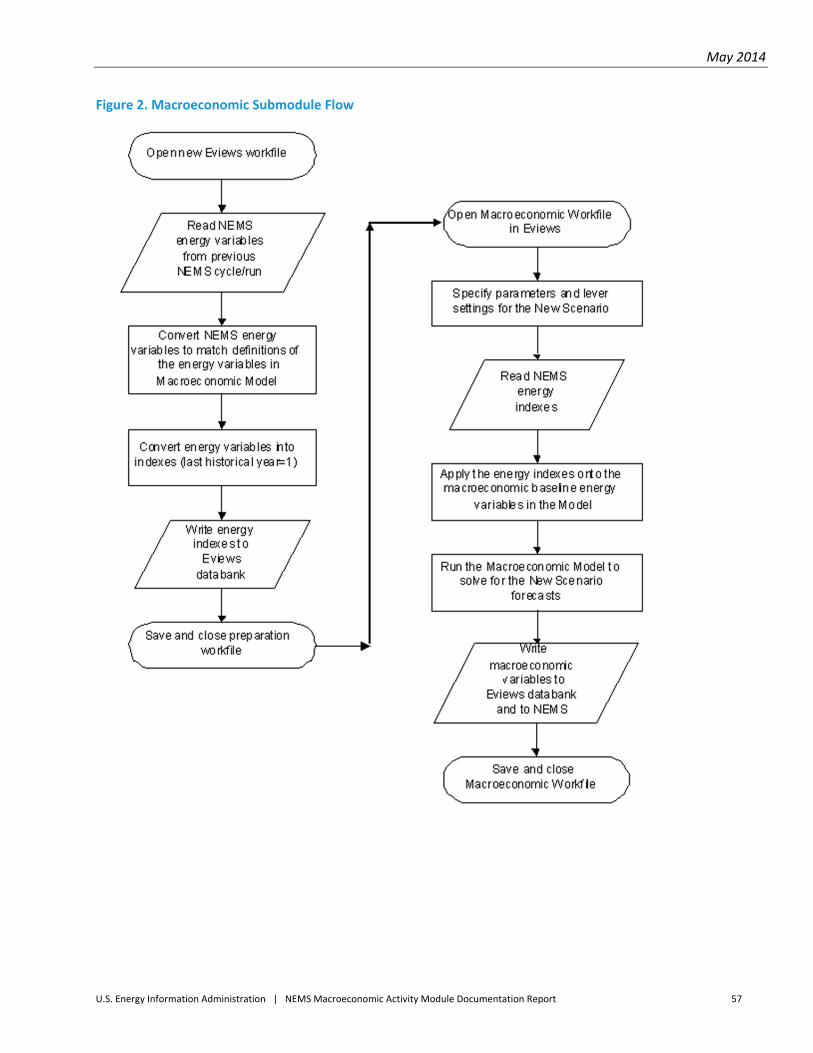
May 2014
U.S. Energy Information Administration | NEMS Macroeconomic Activity Module Documentation Report 57
Figure 2. Macroeconomic Submodule Flow
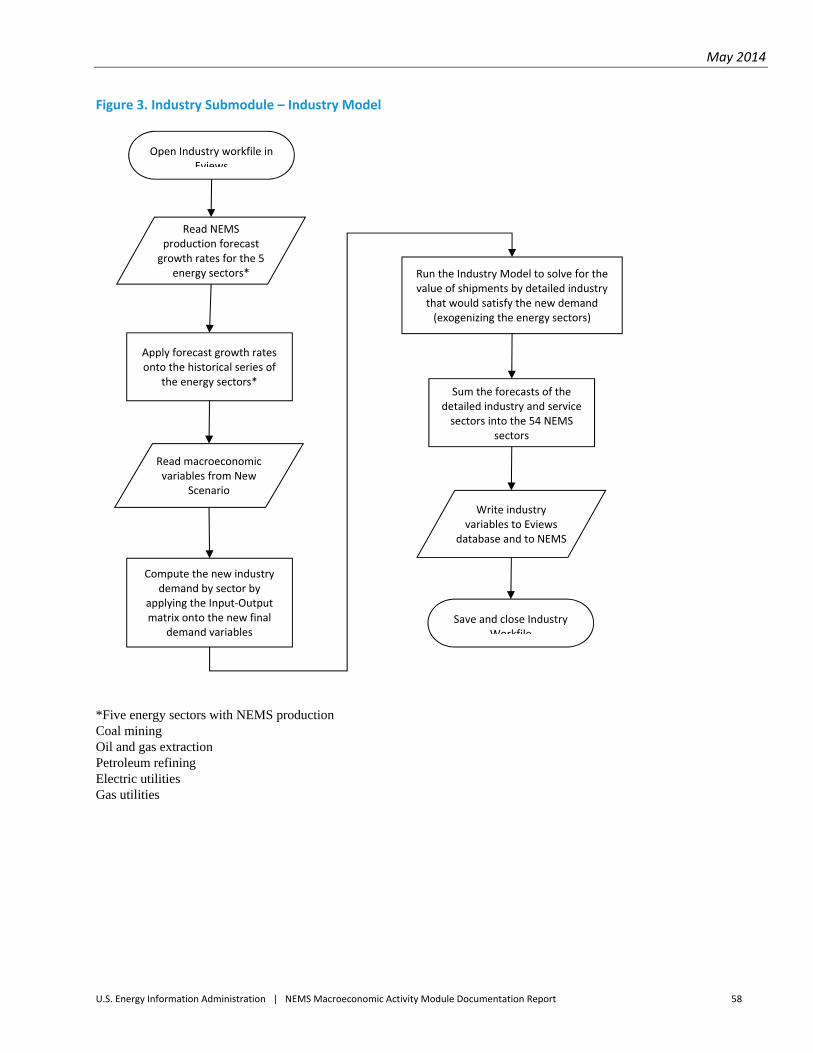
May 2014
U.S. Energy Information Administration | NEMS Macroeconomic Activity Module Documentation Report 58
Figure 3. Industry Submodule – Industry Model
*Five energy sectors with NEMS production Coal mining Oil and gas extraction Petroleum refining Electric utilities Gas utilities
Apply forecast growth rates onto the historical series of
the energy sectors*
Open Industry workfile in Eviews
Read NEMS production forecast growth rates for the 5
energy sectors*
Read macroeconomic variables from New
Scenario
Compute the new industry demand by sector by
applying the Input‐Output matrix onto the new final
demand variables
Run the Industry Model to solve for the value of shipments by detailed industry that would satisfy the new demand (exogenizing the energy sectors)
Sum the forecasts of the detailed industry and service sectors into the 54 NEMS
sectors
Write industry variables to Eviews
database and to NEMS
Save and close Industry Workfile
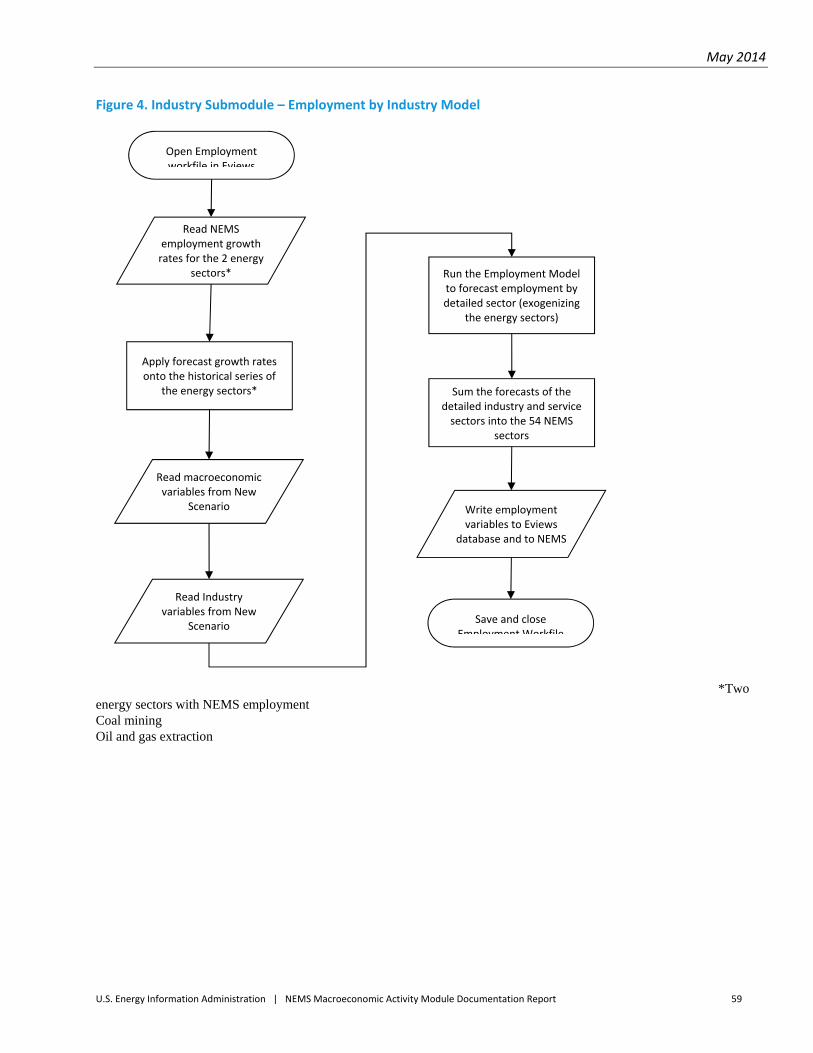
May 2014
U.S. Energy Information Administration | NEMS Macroeconomic Activity Module Documentation Report 59
Figure 4. Industry Submodule – Employment by Industry Model
*Two energy sectors with NEMS employment Coal mining Oil and gas extraction
Apply forecast growth rates onto the historical series of
the energy sectors*
Open Employment workfile in Eviews
Read NEMS employment growth rates for the 2 energy
sectors*
Read macroeconomic variables from New
Scenario
Run the Employment Model to forecast employment by detailed sector (exogenizing
the energy sectors)
Sum the forecasts of the detailed industry and service sectors into the 54 NEMS
sectors
Write employment variables to Eviews
database and to NEMS
Save and close Employment Workfile
Read Industry variables from New
Scenario
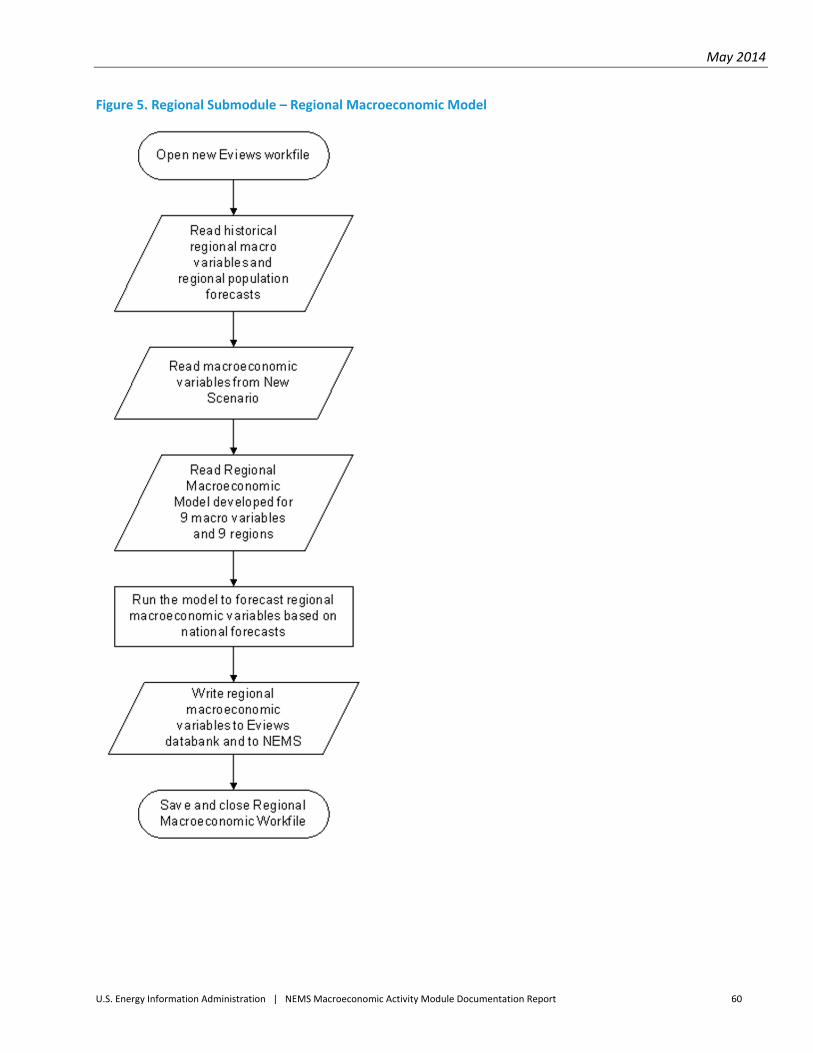
May 2014
U.S. Energy Information Administration | NEMS Macroeconomic Activity Module Documentation Report 60
Figure 5. Regional Submodule – Regional Macroeconomic Model
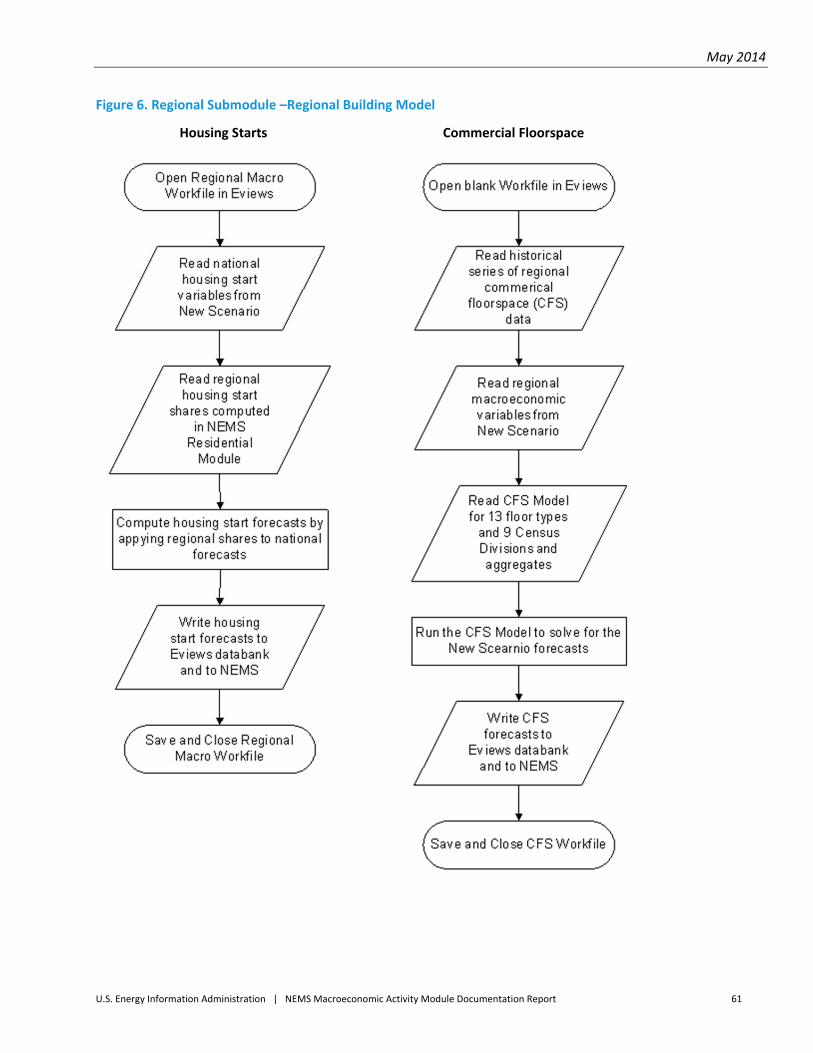
May 2014
U.S. Energy Information Administration | NEMS Macroeconomic Activity Module Documentation Report 61
Figure 6. Regional Submodule –Regional Building Model
Housing Starts Commercial Floorspace
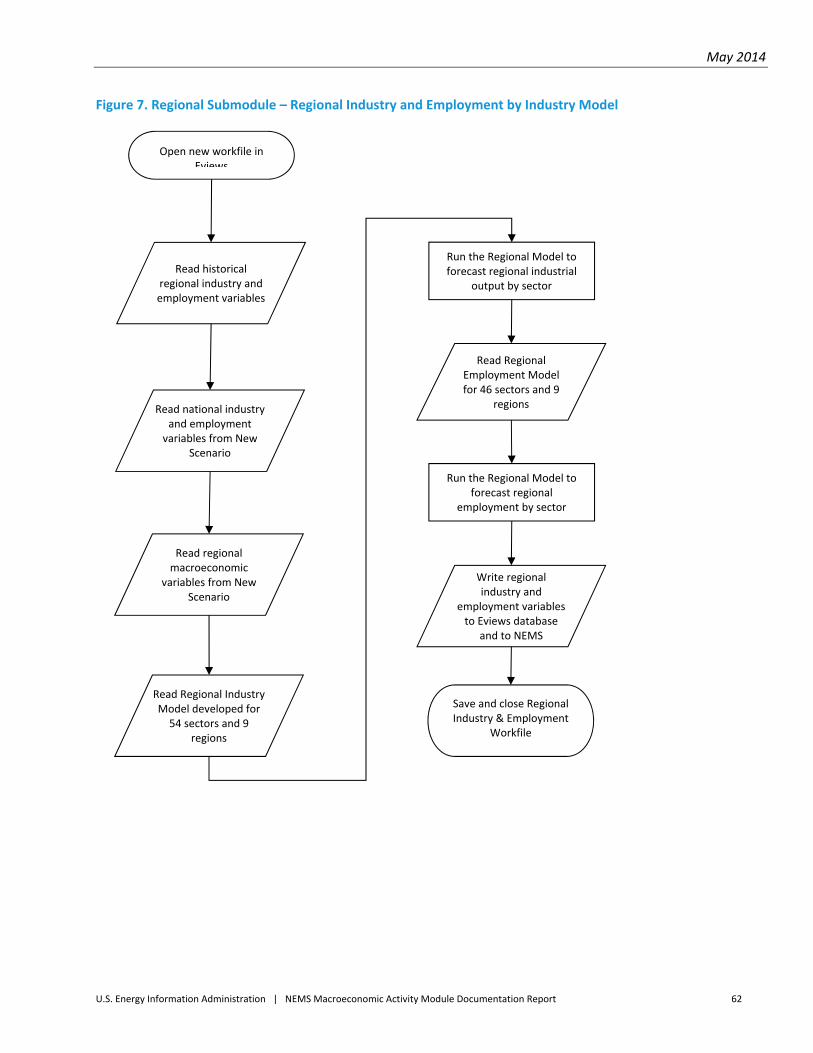
May 2014
U.S. Energy Information Administration | NEMS Macroeconomic Activity Module Documentation Report 62
Figure 7. Regional Submodule – Regional Industry and Employment by Industry Model
Open new workfile in Eviews
Read historical regional industry and employment variables
Read regional macroeconomic
variables from New Scenario
Run the Regional Model to forecast regional industrial
output by sector
Run the Regional Model to forecast regional
employment by sector
Write regional industry and
employment variables to Eviews database
and to NEMS
Save and close Regional Industry & Employment
Workfile
Read Regional Industry Model developed for 54 sectors and 9
regions
Read national industry and employment variables from New
Scenario
Read Regional Employment Model for 46 sectors and 9
regions
May 2014
U.S. Energy Information Administration | NEMS Macroeconomic Activity Module Documentation Report 63
6. Operation of MAM within NEMS The Macroeconomic Activity Module (MAM) is one of a number of source files (also known as modules) that,
after compiled and linked, compose the National Energy Modeling System (NEMS) executable. The MAM
consists of nine subroutines used to read inputs, compute and apply shocks to the MAM models, run the model
simulations and write out the resulting projection. Figure 8 shows the flow of control within the MAM.
MAC subroutine
All of the activities in the MAM are directed by the MAC subroutine, the driver subroutine. In addition to
making calls on the remaining eight subroutines in the MAM, the MAC subroutine has two tasks of its own. It
writes the MC_ENERGY output 2 text file of the NEMS energy prices and quantities that are the exogenous
assumptions to the models in the MAM. This text file includes aggregates and components used to compute the
prices and quantities. The values of the NEMS energy prices and quantities contained in the text file, reported in
2005 dollars, are read from the global data structure. The MAC subroutine’s second task is to write the MAM
results to the global data structure for use by the remaining NEMS modules and the NEMS report writer. Once
this is complete, the MAC subroutine returns program control to the NEMS.
READMAC subroutine
As mentioned above, the MAC subroutine functions as the driver within MAM and calls all the remaining
subroutines. The first subroutine called is READMAC. Figure 9 shows the flow of control within READMAC. This
subroutine is called just once per run in the first iteration of the first year of a NEMS run. The READMAC
subroutine opens and reads the contents of one input file, a text file of the MAM parameter settings named
MCPARMS (Table B2 in Appendix B on page 99).
DRTLINK subroutine
DRTLINK is the second subroutine called by the MAC and is responsible for executing the suite of IHS Global
Insight’s national and EIA’s regional models. Like the READMAC subroutine, the DRTLINK subroutine executes
only in the first iteration of the first year of a NEMS run. Figure 10 shows the flow of control within DRTLINK.
There are instances when the modeler does not want the estimation of the other NEMS modules affected by a
change from the MAM’s reference values. The presence of feedback is controlled with the NEMS parameter
MACFDBK. When the feedback switch is set to zero, the DRTLINK subroutine is not called. The value of the
MACFDBK parameter is set in the NEMS scenario descriptor file (Table B2 in Appendix B on page 99).
2 Files that are “output” files reside in the NEMS simulation output directory. The NEMS directory names begin with the character “d” which is followed by a date key and a letter identifying
the particular run done that day. Files that are “input” files reside within the input subdirectory of the NEMS output directory.

May 2014
U.S. Energy Information Administration | NEMS Macroeconomic Activity Module Documentation Report 64
Much of what the DRTLINK subroutine does is preparation for executing the suite of IHS Global Insight’s national
and EIA’s regional models within Quantitative Micro Software’s EViews software. The programming in the
subroutine begins by mapping the NEMS energy prices and quantities read from the global data input variables
to comparable variables in IHS Global Insight’s national model (Table B3 in Appendix B on page 101). It then
builds an EViews output program file called DRIVERS. The DRIVERS program file contains instructions written in
the EViews programming language. The commands in this program import exogenous assumptions, temporarily
alter the model structure, simulate IHS Global Insight’s and EIA’s models and then export the results. Program
control is temporarily transferred to EViews as it executes the commands in the DRIVERS program file. The
resulting model estimates are written to the following six output text files:
1. EPMAC.CSV – level of national economic activity, industrial output and employment
2. MC_COMMFLR.CSV – level of commercial floor space by Census Division (Table B11 in Appendix B on
page 122)
3. MC_DETAIL.CSV – level of energy detail used as assumptions in the MAM
4. MC_REGEMP.CSV – level of employment by Census Division (Table B12 in Appendix B on page 123)
5. MC_REGIO.CSV – level of industrial output by Census Division (Table B13 in Appendix B on page
125)
6. MC_REGMAC.CSV – level of economic activity by Census Division (Table B10 in Appendix B on page
121)
7. MC_VEHICLES.CSV – national level of light truck sales by sales class (Table B8 in Appendix B on page
116)
8. MC_XTABS.CSV – level of national economic activity in more detail
Once EViews completes execution of the DRIVERS program, control is returned to the DRTLINK subroutine. The
DRTLINK subroutine reads the results contained in each of the above text files. Control is then returned to the
MAC subroutine. The MAC subroutine then calls its third subroutine, INDUSTSUB.
INDUSTSUB subroutine
The INDUSTSUB subroutine operates in a manner similar to that described for the MAC subroutine. Figure 11
diagrams the flow of control within INDUSTSUB. Estimated levels coming from IHS Global Insight’s model of
industrial output are stored in the EPMAC text file. The resulting projection covers 42 categories of industrial
output and ten categories of services. The results are written to the MC_INDUSTRIAL text file (Table B6 in
Appendix B on page 112).
May 2014
U.S. Energy Information Administration | NEMS Macroeconomic Activity Module Documentation Report 65
In the MAM, data for the five NEMS energy industries are overwritten by NEMS output:
1. Petroleum refining
2. Coal mining
3. Oil and gas extraction
4. Electric utilities and
5. Gas utilities
The MAM computes annual growth rates using NEMS’s projections of energy prices and quantities. Each of the
growth rates is dynamically applied beginning with an initial historical value. The resulting time series becomes
the industrial output projection for the five energy industries.
REGIONSUB subroutine
REGIONSUB, the fourth subroutine called by the MAC subroutine, copies and aggregates EIA’s regional model
results for export to the global data structure and writes to the MC_REGIONAL text file (Table B9 in Appendix B
on page 117). (Prior to the introduction to the MAM of EIA’s regional models, the REGIONSUB subroutine
allocated the national projection out to the nine Census Divisions.)
EMPLOYMENT subroutine
The fifth subroutine called by the MAC subroutine is named EMPLOYMENT. This subroutine works just like the
INDUSTSUB subroutine. Estimated levels coming from IHS Global Insight’s model of employment by industry are
written to the EPMAC output text file. The resulting projection is for 33 categories of industrial and eleven
categories of service employment.
The NEMS supplies employment projections for the coal mining and oil and gas extraction industries (Table B4 in
Appendix B on page 109). These results are estimated by the same method used to project shipments for the
energy‐related industries in the Industrial Output Model. The NEMS supplies the projections, and the MAM
computes annual growth rates that are dynamically applied beginning with an initial historical value for each
variable.
For the three remaining energy industries (petroleum refining, electric utilities, and gas utilities), employment
projections are computed as for all the other employment variables. Since the Industrial Output Model executes
before the Employment Model, the employment results for the remaining three energy sectors are affected by
the NEMS industrial estimates.
COMFLR subroutine
Figure 14 shows the flow of control within COMFLR, the sixth subroutine called by the MAC subroutine. The
COMFLR subroutine copies and aggregates the EViews model results in preparation for output to the global data
structure and to the MC_REGIONAL text file (Table B9 in Appendix B on page 117). (This subroutine once
contained a FORTRAN model of commercial floor space, which has been moved to EViews.)
TRANC subroutine
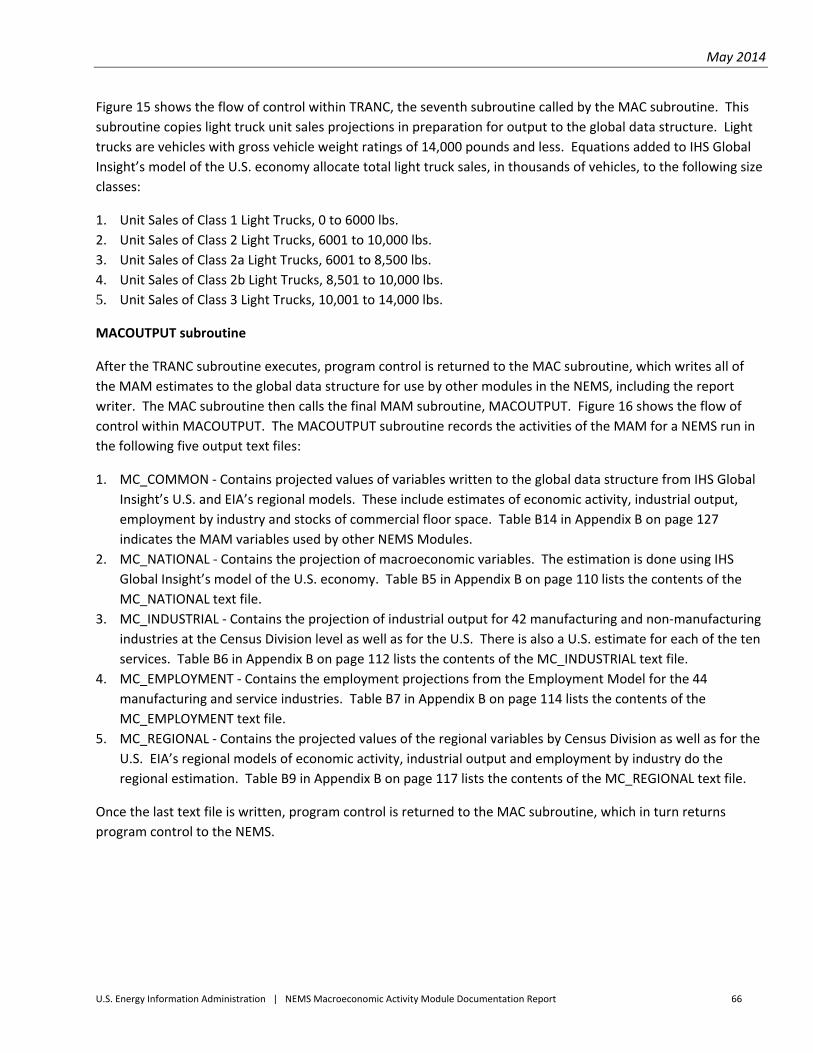
May 2014
U.S. Energy Information Administration | NEMS Macroeconomic Activity Module Documentation Report 66
Figure 15 shows the flow of control within TRANC, the seventh subroutine called by the MAC subroutine. This
subroutine copies light truck unit sales projections in preparation for output to the global data structure. Light
trucks are vehicles with gross vehicle weight ratings of 14,000 pounds and less. Equations added to IHS Global
Insight’s model of the U.S. economy allocate total light truck sales, in thousands of vehicles, to the following size
classes:
1. Unit Sales of Class 1 Light Trucks, 0 to 6000 lbs.
2. Unit Sales of Class 2 Light Trucks, 6001 to 10,000 lbs.
3. Unit Sales of Class 2a Light Trucks, 6001 to 8,500 lbs.
4. Unit Sales of Class 2b Light Trucks, 8,501 to 10,000 lbs.
5. Unit Sales of Class 3 Light Trucks, 10,001 to 14,000 lbs.
MACOUTPUT subroutine
After the TRANC subroutine executes, program control is returned to the MAC subroutine, which writes all of
the MAM estimates to the global data structure for use by other modules in the NEMS, including the report
writer. The MAC subroutine then calls the final MAM subroutine, MACOUTPUT. Figure 16 shows the flow of
control within MACOUTPUT. The MACOUTPUT subroutine records the activities of the MAM for a NEMS run in
the following five output text files:
1. MC_COMMON ‐ Contains projected values of variables written to the global data structure from IHS Global
Insight’s U.S. and EIA’s regional models. These include estimates of economic activity, industrial output,
employment by industry and stocks of commercial floor space. Table B14 in Appendix B on page 127
indicates the MAM variables used by other NEMS Modules. 2. MC_NATIONAL ‐ Contains the projection of macroeconomic variables. The estimation is done using IHS
Global Insight’s model of the U.S. economy. Table B5 in Appendix B on page 110 lists the contents of the
MC_NATIONAL text file. 3. MC_INDUSTRIAL ‐ Contains the projection of industrial output for 42 manufacturing and non‐manufacturing
industries at the Census Division level as well as for the U.S. There is also a U.S. estimate for each of the ten
services. Table B6 in Appendix B on page 112 lists the contents of the MC_INDUSTRIAL text file. 4. MC_EMPLOYMENT ‐ Contains the employment projections from the Employment Model for the 44
manufacturing and service industries. Table B7 in Appendix B on page 114 lists the contents of the
MC_EMPLOYMENT text file.
5. MC_REGIONAL ‐ Contains the projected values of the regional variables by Census Division as well as for the
U.S. EIA’s regional models of economic activity, industrial output and employment by industry do the
regional estimation. Table B9 in Appendix B on page 117 lists the contents of the MC_REGIONAL text file.
Once the last text file is written, program control is returned to the MAC subroutine, which in turn returns
program control to the NEMS.
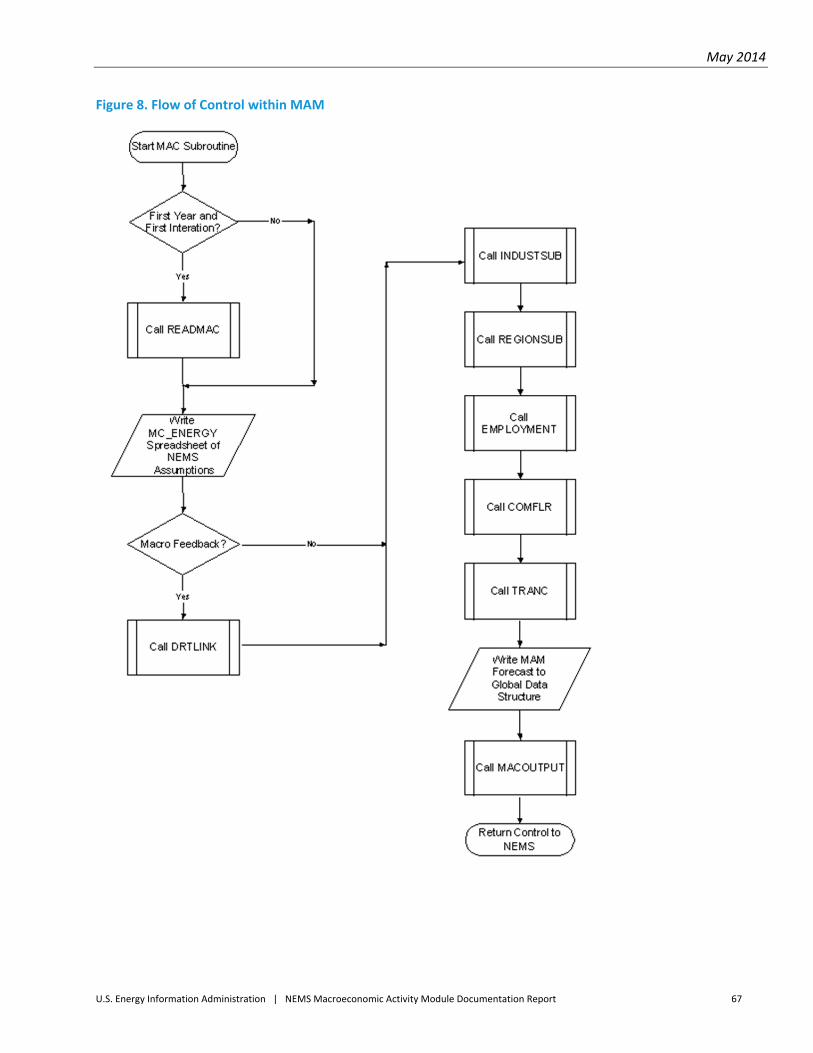
May 2014
U.S. Energy Information Administration | NEMS Macroeconomic Activity Module Documentation Report 67
Figure 8. Flow of Control within MAM
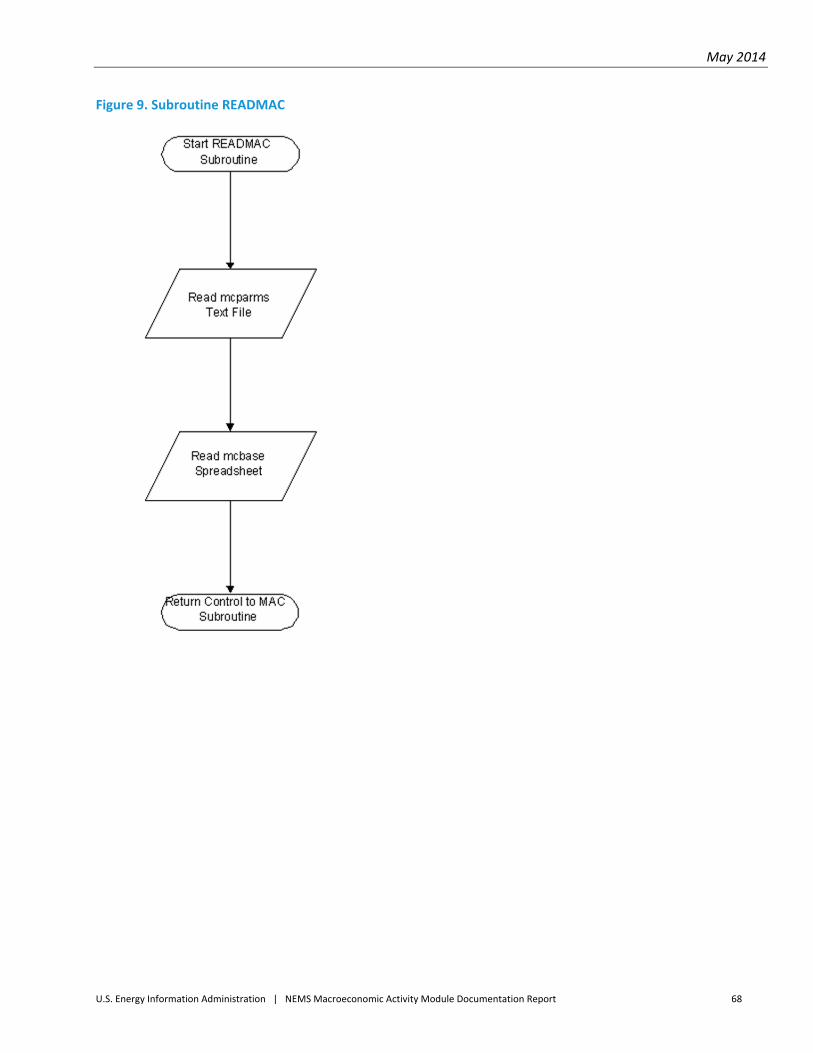
May 2014
U.S. Energy Information Administration | NEMS Macroeconomic Activity Module Documentation Report 68
Figure 9. Subroutine READMAC
May 2014
U.S. Energy Information Administration | NEMS Macroeconomic Activity Module Documentation Report 69
Figure 10. Subroutine DRTLINK
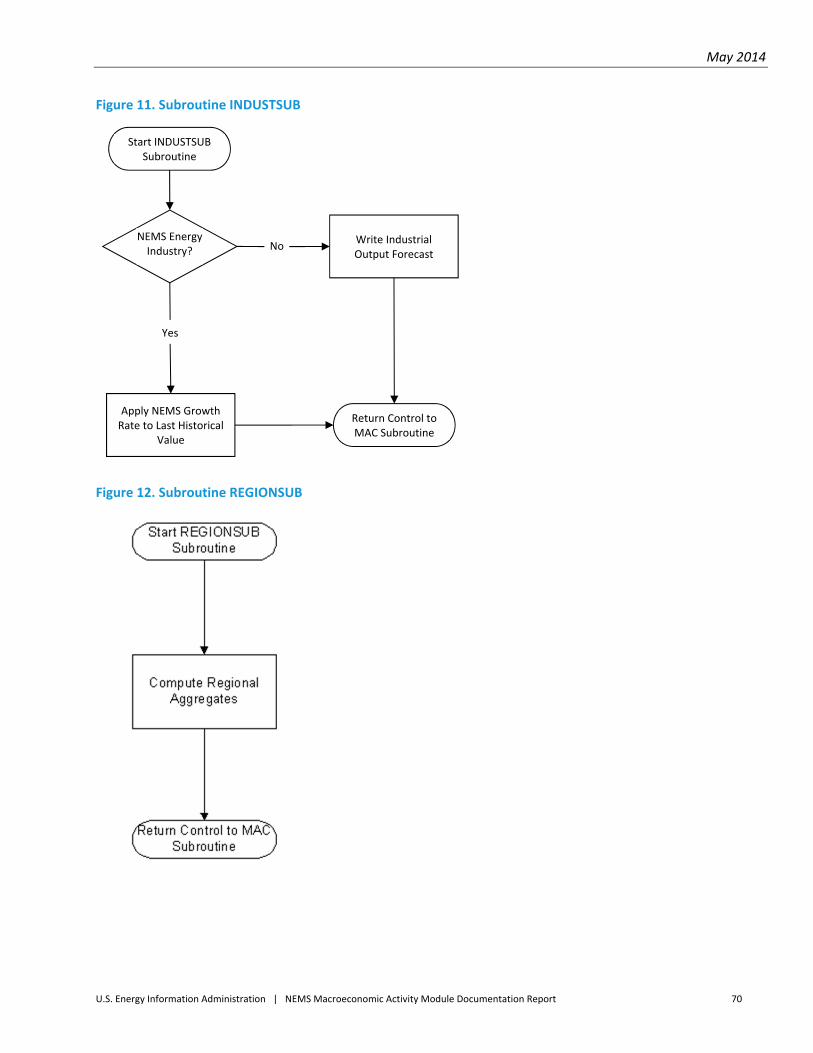
May 2014
U.S. Energy Information Administration | NEMS Macroeconomic Activity Module Documentation Report 70
Figure 11. Subroutine INDUSTSUB
Figure 12. Subroutine REGIONSUB
Start INDUSTSUB Subroutine
NEMS Energy Industry?
Write Industrial Output Forecast
Apply NEMS Growth Rate to Last Historical
Value
Return Control to MAC Subroutine
No
Yes
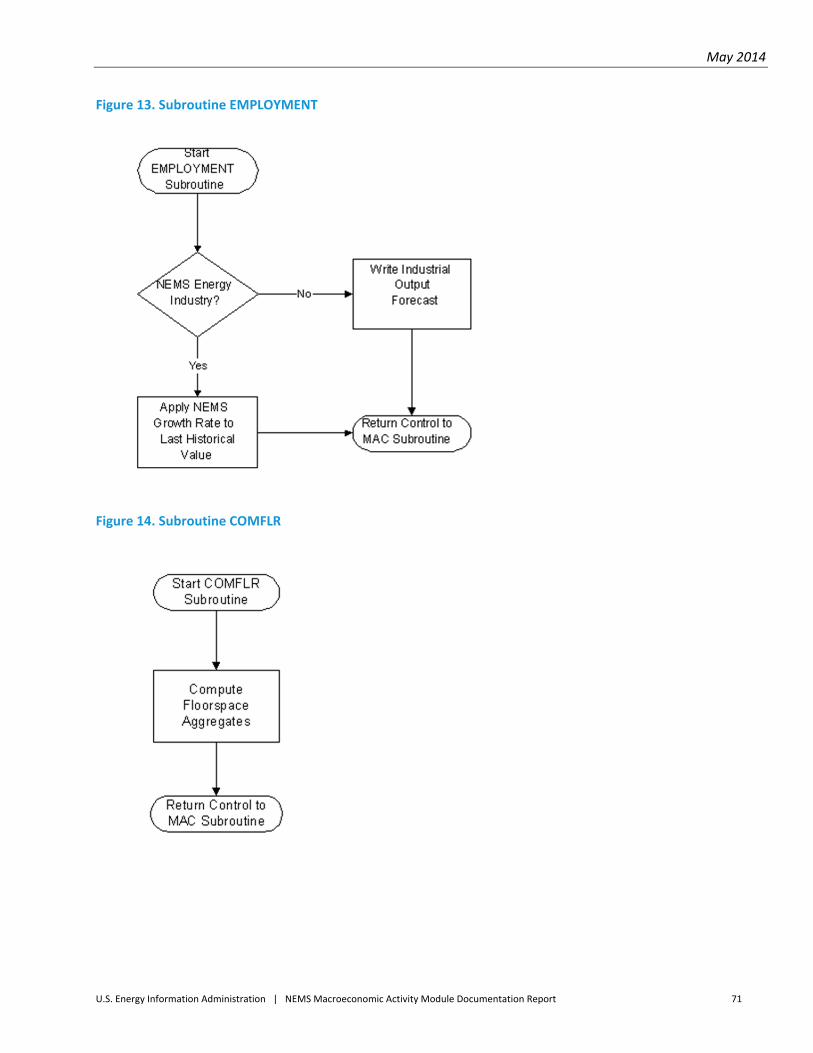
May 2014
U.S. Energy Information Administration | NEMS Macroeconomic Activity Module Documentation Report 71
Figure 13. Subroutine EMPLOYMENT
Figure 14. Subroutine COMFLR
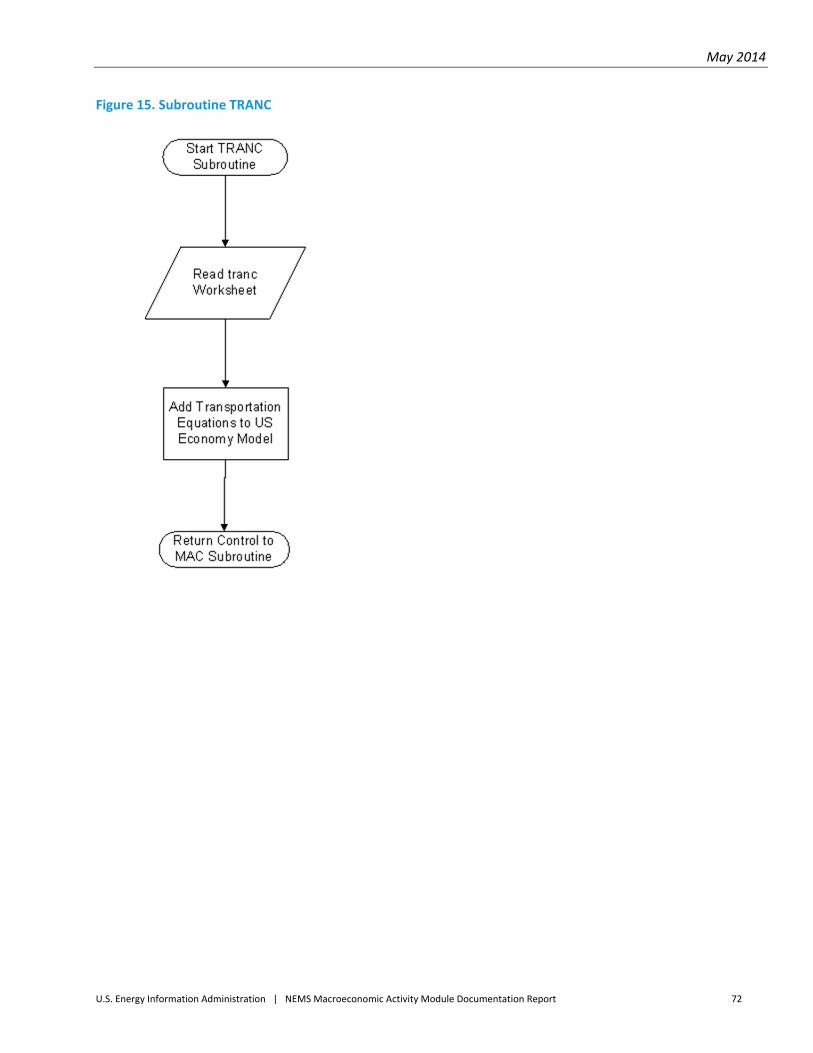
May 2014
U.S. Energy Information Administration | NEMS Macroeconomic Activity Module Documentation Report 72
Figure 15. Subroutine TRANC
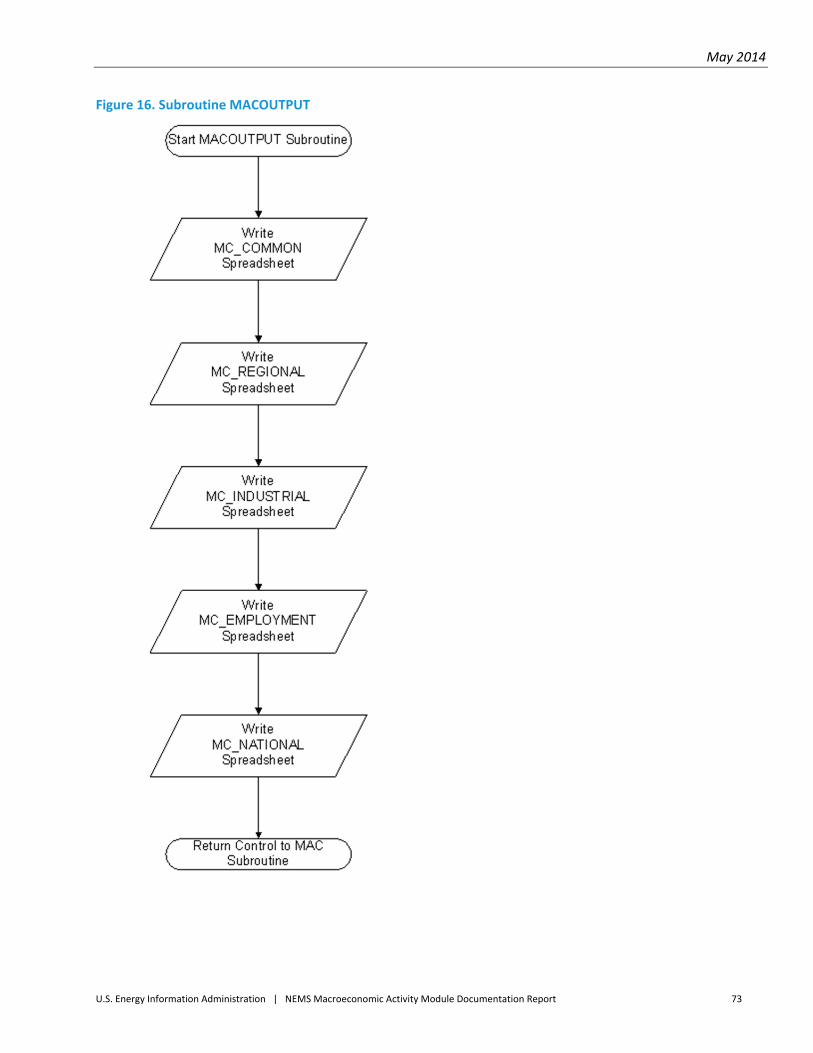
May 2014
U.S. Energy Information Administration | NEMS Macroeconomic Activity Module Documentation Report 73
Figure 16. Subroutine MACOUTPUT
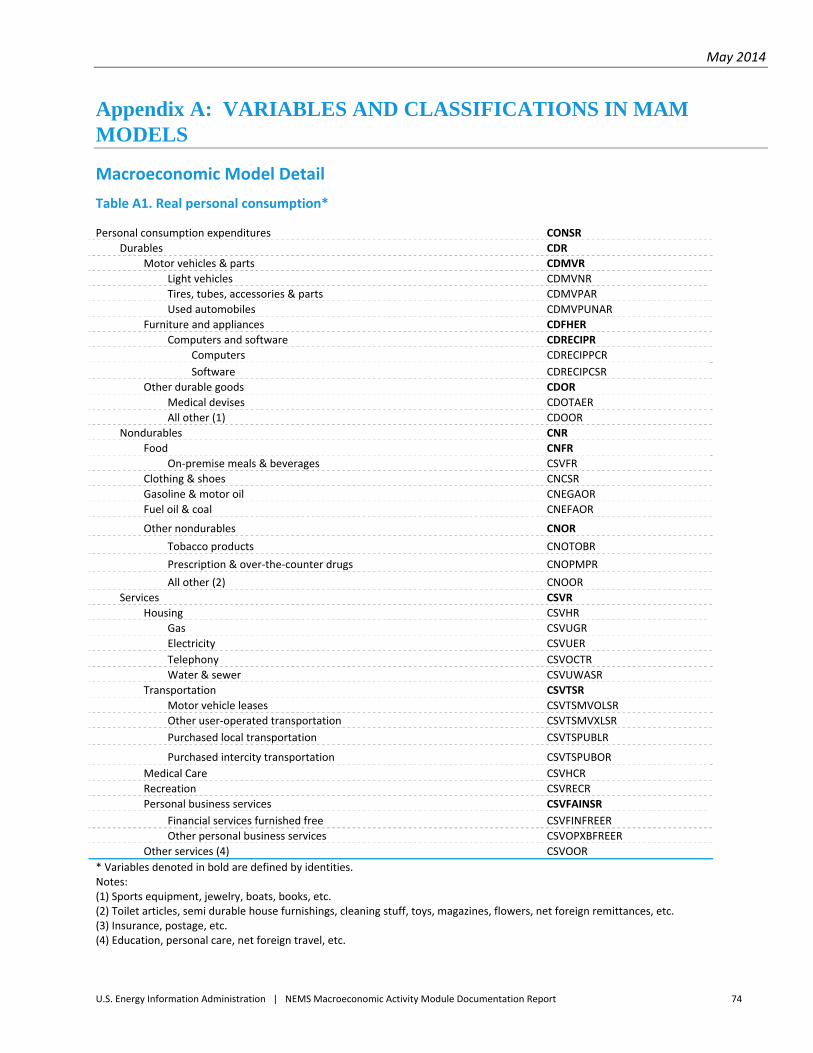
May 2014
U.S. Energy Information Administration | NEMS Macroeconomic Activity Module Documentation Report 74
Appendix A: VARIABLES AND CLASSIFICATIONS IN MAM MODELS
Macroeconomic Model Detail
Table A1. Real personal consumption*
Personal consumption expenditures CONSR
Durables CDR
Motor vehicles & parts CDMVR
Light vehicles CDMVNR
Tires, tubes, accessories & parts CDMVPAR
Used automobiles CDMVPUNAR
Furniture and appliances CDFHER
Computers and software CDRECIPR
Computers CDRECIPPCR
Software CDRECIPCSR
Other durable goods CDOR
Medical devises CDOTAER
All other (1) CDOOR
Nondurables CNR
Food CNFR
On‐premise meals & beverages CSVFR
Clothing & shoes CNCSR
Gasoline & motor oil CNEGAOR
Fuel oil & coal CNEFAOR
Other nondurables CNOR
Tobacco products CNOTOBR
Prescription & over‐the‐counter drugs CNOPMPR
All other (2) CNOOR
Services CSVR
Housing CSVHR
Gas CSVUGR
Electricity CSVUER
Telephony CSVOCTR
Water & sewer CSVUWASR
Transportation CSVTSR
Motor vehicle leases CSVTSMVOLSR
Other user‐operated transportation CSVTSMVXLSR
Purchased local transportation CSVTSPUBLR
Purchased intercity transportation CSVTSPUBOR
Medical Care CSVHCR
Recreation CSVRECR
Personal business services CSVFAINSR
Financial services furnished free CSVFINFREER
Other personal business services CSVOPXBFREER
Other services (4) CSVOOR
* Variables denoted in bold are defined by identities. Notes: (1) Sports equipment, jewelry, boats, books, etc. (2) Toilet articles, semi durable house furnishings, cleaning stuff, toys, magazines, flowers, net foreign remittances, etc. (3) Insurance, postage, etc. (4) Education, personal care, net foreign travel, etc.
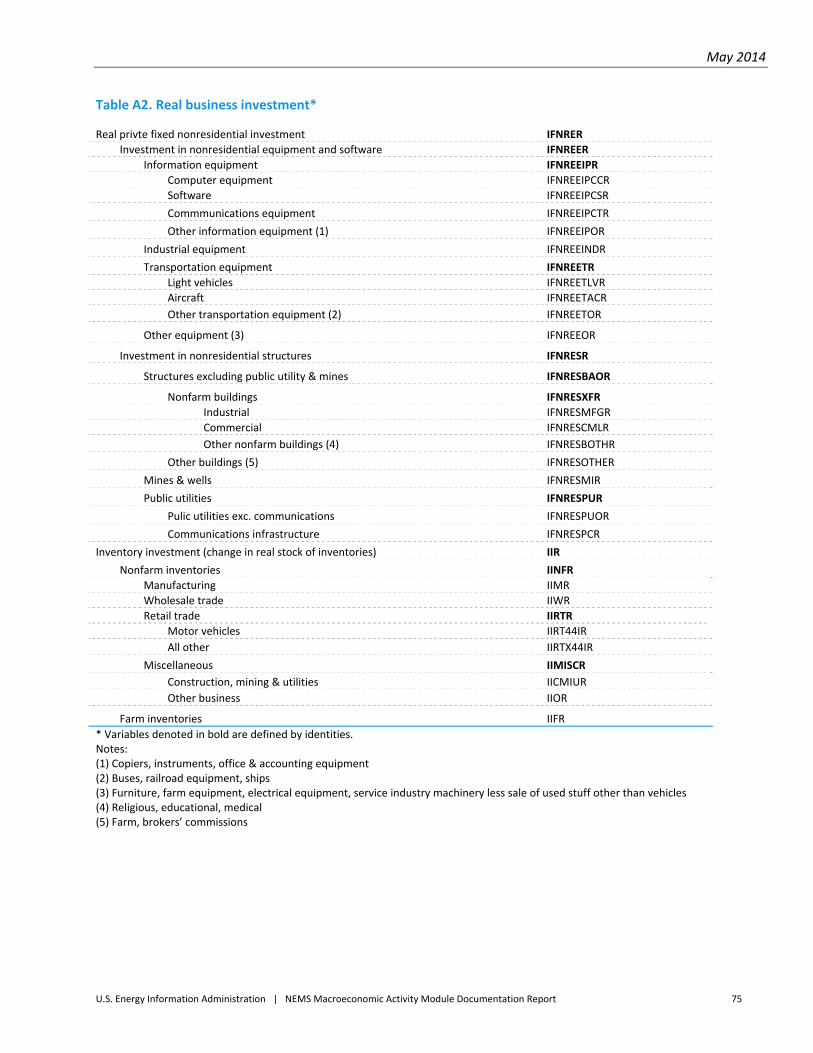
May 2014
U.S. Energy Information Administration | NEMS Macroeconomic Activity Module Documentation Report 75
Table A2. Real business investment*
Real privte fixed nonresidential investment IFNRER
Investment in nonresidential equipment and software IFNREER
Information equipment IFNREEIPR
Computer equipment IFNREEIPCCR
Software IFNREEIPCSR
Commmunications equipment IFNREEIPCTR
Other information equipment (1) IFNREEIPOR
Industrial equipment IFNREEINDR
Transportation equipment IFNREETR
Light vehicles IFNREETLVR
Aircraft IFNREETACR
Other transportation equipment (2) IFNREETOR
Other equipment (3) IFNREEOR
Investment in nonresidential structures IFNRESR
Structures excluding public utility & mines IFNRESBAOR
Nonfarm buildings IFNRESXFR
Industrial IFNRESMFGR
Commercial IFNRESCMLR
Other nonfarm buildings (4) IFNRESBOTHR
Other buildings (5) IFNRESOTHER
Mines & wells IFNRESMIR
Public utilities IFNRESPUR
Pulic utilities exc. communications IFNRESPUOR
Communications infrastructure IFNRESPCR
Inventory investment (change in real stock of inventories) IIR
Nonfarm inventories IINFR
Manufacturing IIMR
Wholesale trade IIWR
Retail trade IIRTR
Motor vehicles IIRT44IR
All other IIRTX44IR
Miscellaneous IIMISCR
Construction, mining & utilities IICMIUR
Other business IIOR
Farm inventories IIFR
* Variables denoted in bold are defined by identities. Notes: (1) Copiers, instruments, office & accounting equipment (2) Buses, railroad equipment, ships (3) Furniture, farm equipment, electrical equipment, service industry machinery less sale of used stuff other than vehicles (4) Religious, educational, medical (5) Farm, brokers’ commissions
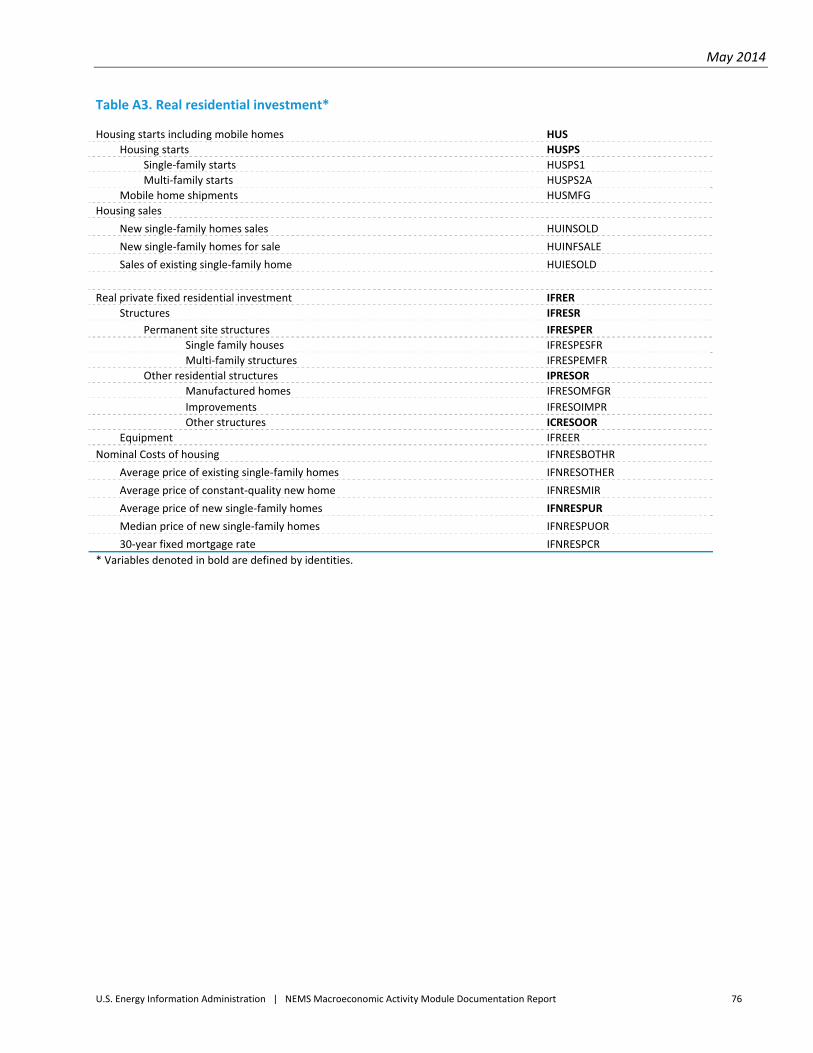
May 2014
U.S. Energy Information Administration | NEMS Macroeconomic Activity Module Documentation Report 76
Table A3. Real residential investment*
Housing starts including mobile homes HUS
Housing starts HUSPS
Single‐family starts HUSPS1
Multi‐family starts HUSPS2A
Mobile home shipments HUSMFG
Housing sales
New single‐family homes sales HUINSOLD
New single‐family homes for sale HUINFSALE
Sales of existing single‐family home HUIESOLD
Real private fixed residential investment IFRER
Structures IFRESR
Permanent site structures IFRESPER
Single family houses IFRESPESFR
Multi‐family structures IFRESPEMFR
Other residential structures IPRESOR
Manufactured homes IFRESOMFGR
Improvements IFRESOIMPR
Other structures ICRESOOR
Equipment IFREER
Nominal Costs of housing IFNRESBOTHR
Average price of existing single‐family homes IFNRESOTHER
Average price of constant‐quality new home IFNRESMIR
Average price of new single‐family homes IFNRESPUR
Median price of new single‐family homes IFNRESPUOR
30‐year fixed mortgage rate IFNRESPCR
* Variables denoted in bold are defined by identities.
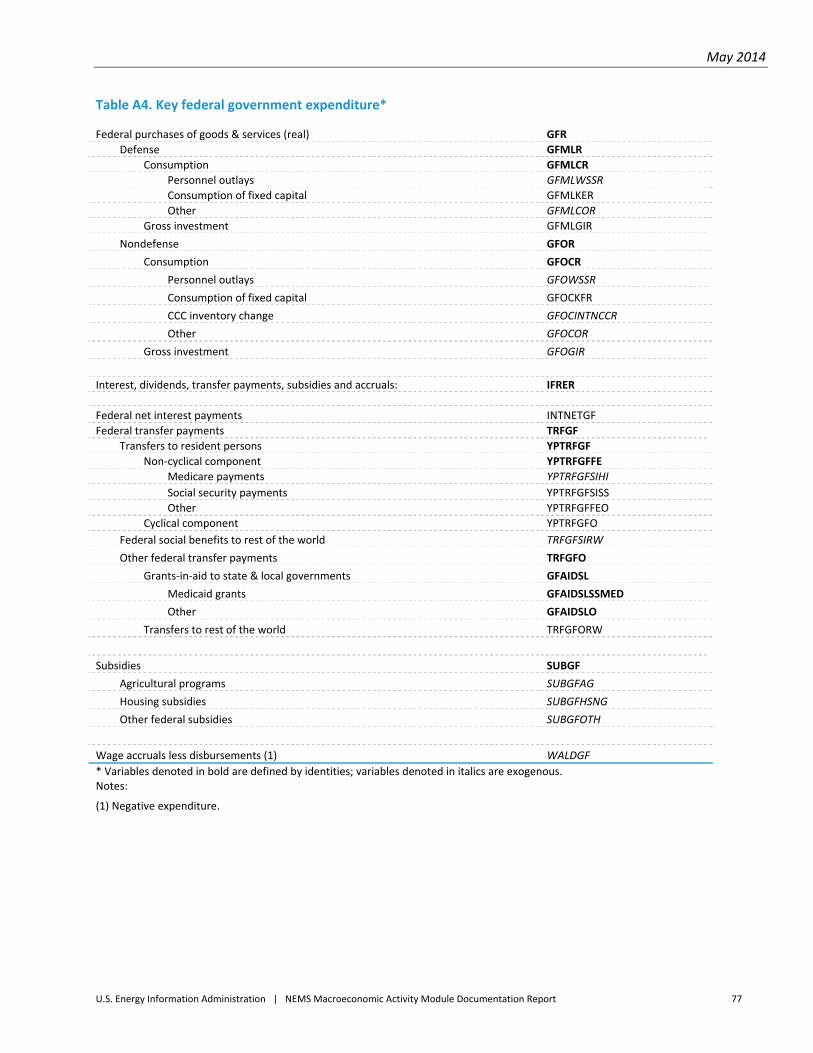
May 2014
U.S. Energy Information Administration | NEMS Macroeconomic Activity Module Documentation Report 77
Table A4. Key federal government expenditure*
Federal purchases of goods & services (real) GFR
Defense GFMLR
Consumption GFMLCR
Personnel outlays GFMLWSSR
Consumption of fixed capital GFMLKER
Other GFMLCOR
Gross investment GFMLGIR
Nondefense GFOR
Consumption GFOCR
Personnel outlays GFOWSSR
Consumption of fixed capital GFOCKFR
CCC inventory change GFOCINTNCCR
Other GFOCOR
Gross investment GFOGIR
Interest, dividends, transfer payments, subsidies and accruals: IFRER
Federal net interest payments INTNETGF
Federal transfer payments TRFGF
Transfers to resident persons YPTRFGF
Non‐cyclical component YPTRFGFFE
Medicare payments YPTRFGFSIHI
Social security payments YPTRFGFSISS
Other YPTRFGFFEO
Cyclical component YPTRFGFO
Federal social benefits to rest of the world TRFGFSIRW
Other federal transfer payments TRFGFO
Grants‐in‐aid to state & local governments GFAIDSL
Medicaid grants GFAIDSLSSMED
Other GFAIDSLO
Transfers to rest of the world TRFGFORW
Subsidies SUBGF
Agricultural programs SUBGFAG
Housing subsidies SUBGFHSNG
Other federal subsidies SUBGFOTH
Wage accruals less disbursements (1) WALDGF
* Variables denoted in bold are defined by identities; variables denoted in italics are exogenous. Notes:
(1) Negative expenditure.
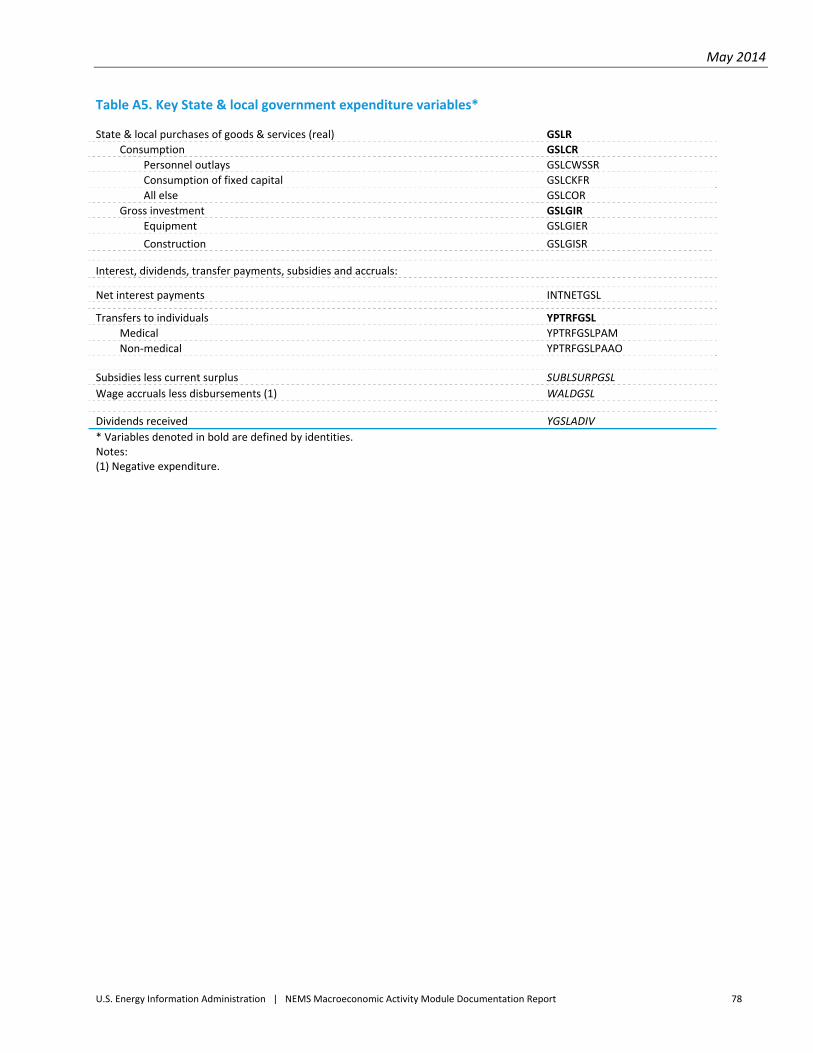
May 2014
U.S. Energy Information Administration | NEMS Macroeconomic Activity Module Documentation Report 78
Table A5. Key State & local government expenditure variables*
State & local purchases of goods & services (real) GSLR
Consumption GSLCR
Personnel outlays GSLCWSSR
Consumption of fixed capital GSLCKFR
All else GSLCOR
Gross investment GSLGIR
Equipment GSLGIER
Construction GSLGISR
Interest, dividends, transfer payments, subsidies and accruals:
Net interest payments INTNETGSL
Transfers to individuals YPTRFGSL
Medical YPTRFGSLPAM
Non‐medical YPTRFGSLPAAO
Subsidies less current surplus SUBLSURPGSL
Wage accruals less disbursements (1) WALDGSL
Dividends received YGSLADIV
* Variables denoted in bold are defined by identities. Notes: (1) Negative expenditure.
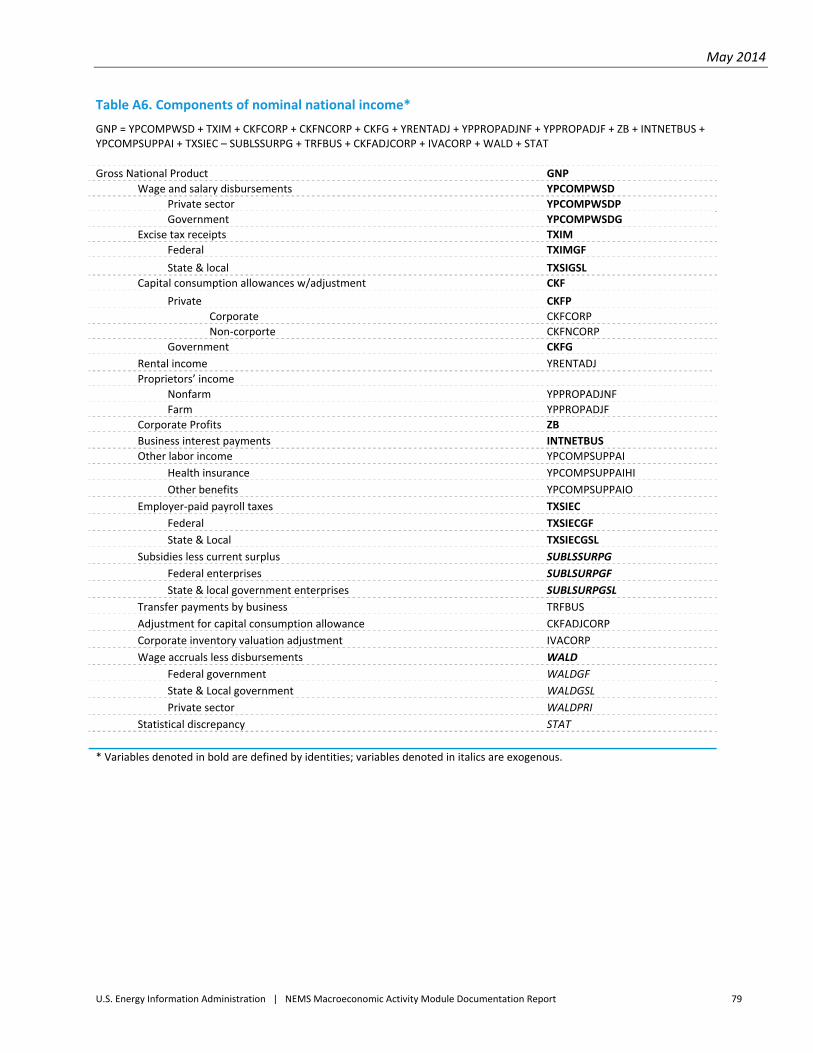
May 2014
U.S. Energy Information Administration | NEMS Macroeconomic Activity Module Documentation Report 79
Table A6. Components of nominal national income*
GNP = YPCOMPWSD + TXIM + CKFCORP + CKFNCORP + CKFG + YRENTADJ + YPPROPADJNF + YPPROPADJF + ZB + INTNETBUS + YPCOMPSUPPAI + TXSIEC – SUBLSSURPG + TRFBUS + CKFADJCORP + IVACORP + WALD + STAT
Gross National Product GNP
Wage and salary disbursements YPCOMPWSD
Private sector YPCOMPWSDP
Government YPCOMPWSDG
Excise tax receipts TXIM
Federal TXIMGF
State & local TXSIGSL
Capital consumption allowances w/adjustment CKF
Private CKFP
Corporate CKFCORP
Non‐corporte CKFNCORP
Government CKFG
Rental income YRENTADJ
Proprietors’ income Nonfarm YPPROPADJNF
Farm YPPROPADJF
Corporate Profits ZB
Business interest payments INTNETBUS
Other labor income YPCOMPSUPPAI
Health insurance YPCOMPSUPPAIHI
Other benefits YPCOMPSUPPAIO
Employer‐paid payroll taxes TXSIEC
Federal TXSIECGF
State & Local TXSIECGSL
Subsidies less current surplus SUBLSSURPG
Federal enterprises SUBLSURPGF
State & local government enterprises SUBLSURPGSL
Transfer payments by business TRFBUS
Adjustment for capital consumption allowance CKFADJCORP
Corporate inventory valuation adjustment IVACORP
Wage accruals less disbursements WALD
Federal government WALDGF
State & Local government WALDGSL
Private sector WALDPRI
Statistical discrepancy STAT
* Variables denoted in bold are defined by identities; variables denoted in italics are exogenous.
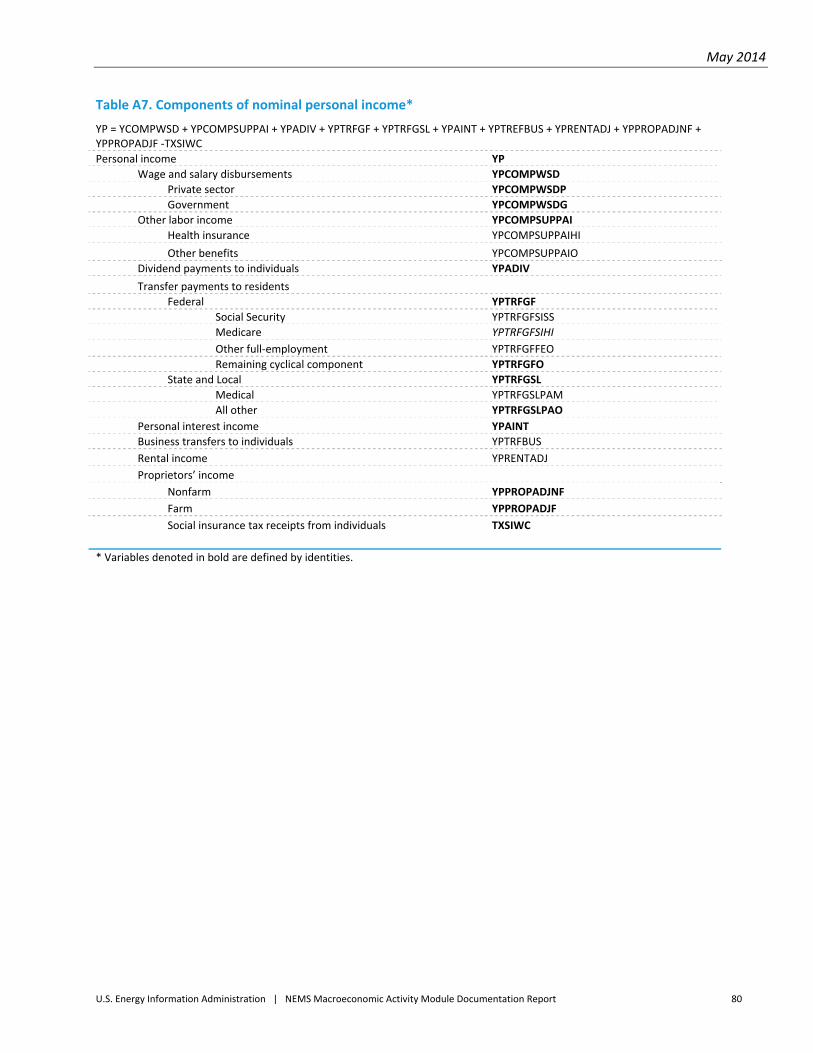
May 2014
U.S. Energy Information Administration | NEMS Macroeconomic Activity Module Documentation Report 80
Table A7. Components of nominal personal income*
YP = YCOMPWSD + YPCOMPSUPPAI + YPADIV + YPTRFGF + YPTRFGSL + YPAINT + YPTREFBUS + YPRENTADJ + YPPROPADJNF + YPPROPADJF ‐TXSIWC
Personal income YP
Wage and salary disbursements YPCOMPWSD
Private sector YPCOMPWSDP
Government YPCOMPWSDG
Other labor income YPCOMPSUPPAI
Health insurance YPCOMPSUPPAIHI
Other benefits YPCOMPSUPPAIO
Dividend payments to individuals YPADIV
Transfer payments to residents Federal YPTRFGF
Social Security YPTRFGFSISS
Medicare YPTRFGFSIHI
Other full‐employment YPTRFGFFEO
Remaining cyclical component YPTRFGFO
State and Local YPTRFGSL
Medical YPTRFGSLPAM
All other YPTRFGSLPAO
Personal interest income YPAINT
Business transfers to individuals YPTRFBUS
Rental income YPRENTADJ
Proprietors’ income Nonfarm YPPROPADJNF
Farm YPPROPADJF
Social insurance tax receipts from individuals TXSIWC
* Variables denoted in bold are defined by identities.
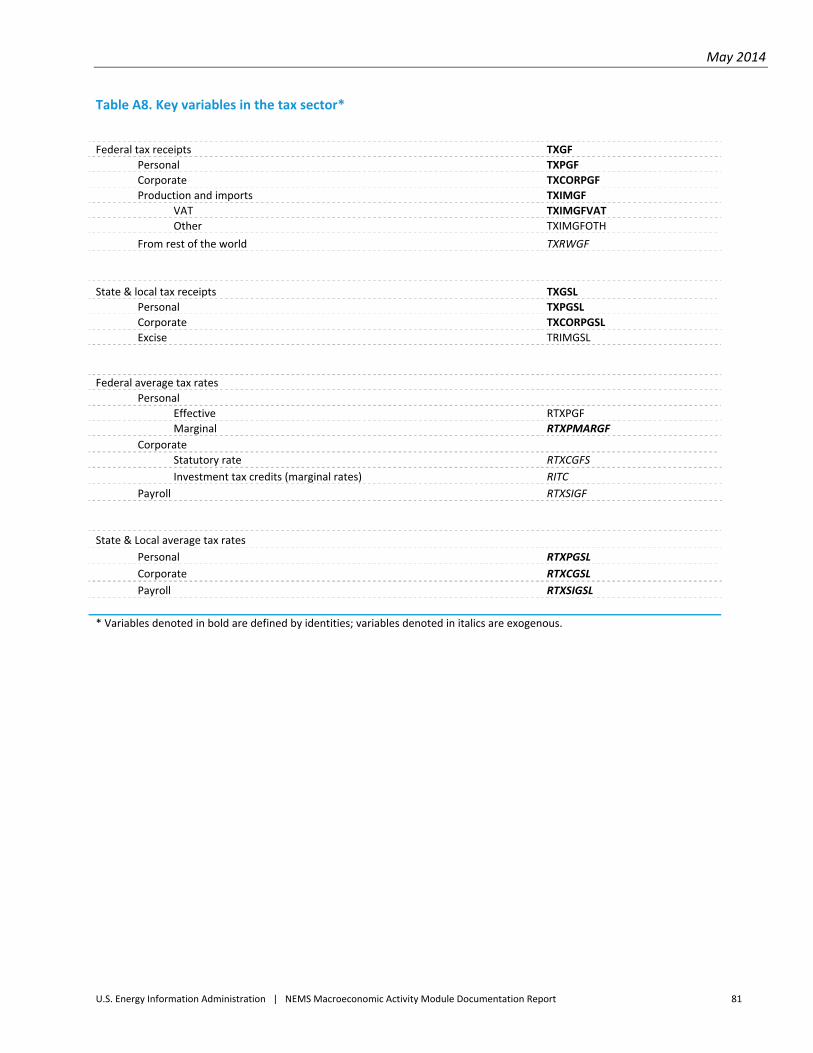
May 2014
U.S. Energy Information Administration | NEMS Macroeconomic Activity Module Documentation Report 81
Table A8. Key variables in the tax sector*
Federal tax receipts TXGF
Personal TXPGF
Corporate TXCORPGF
Production and imports TXIMGF
VAT TXIMGFVAT
Other TXIMGFOTH
From rest of the world TXRWGF
State & local tax receipts TXGSL
Personal TXPGSL
Corporate TXCORPGSL
Excise TRIMGSL
Federal average tax rates
Personal Effective RTXPGF
Marginal RTXPMARGF
Corporate Statutory rate RTXCGFS
Investment tax credits (marginal rates) RITC
Payroll RTXSIGF
State & Local average tax rates
Personal RTXPGSL
Corporate RTXCGSL
Payroll RTXSIGSL
* Variables denoted in bold are defined by identities; variables denoted in italics are exogenous.
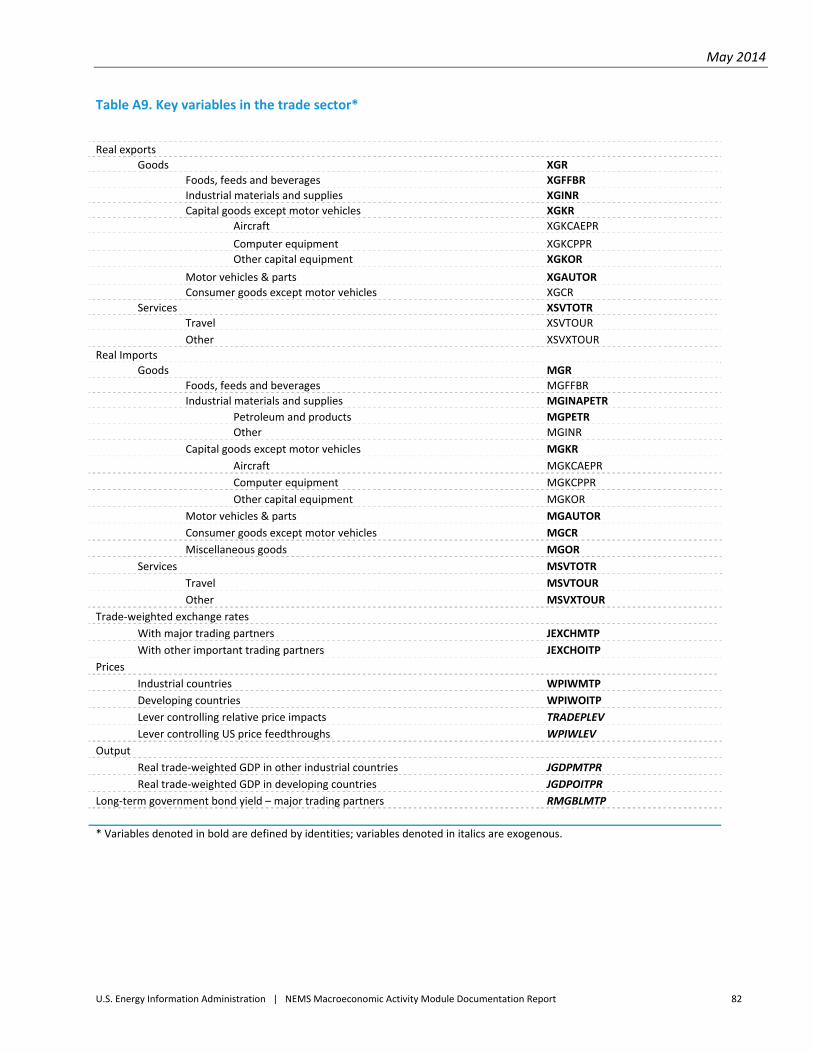
May 2014
U.S. Energy Information Administration | NEMS Macroeconomic Activity Module Documentation Report 82
Table A9. Key variables in the trade sector*
Real exports
Goods XGR
Foods, feeds and beverages XGFFBR
Industrial materials and supplies XGINR
Capital goods except motor vehicles XGKR
Aircraft XGKCAEPR
Computer equipment XGKCPPR
Other capital equipment XGKOR
Motor vehicles & parts XGAUTOR
Consumer goods except motor vehicles XGCR
Services XSVTOTR
Travel XSVTOUR
Other XSVXTOUR
Real Imports
Goods MGR
Foods, feeds and beverages MGFFBR
Industrial materials and supplies MGINAPETR
Petroleum and products MGPETR
Other MGINR
Capital goods except motor vehicles MGKR
Aircraft MGKCAEPR
Computer equipment MGKCPPR Other capital equipment MGKOR
Motor vehicles & parts MGAUTOR
Consumer goods except motor vehicles MGCR
Miscellaneous goods MGOR
Services MSVTOTR
Travel MSVTOUR
Other MSVXTOUR
Trade‐weighted exchange rates
With major trading partners JEXCHMTP
With other important trading partners JEXCHOITP
Prices
Industrial countries WPIWMTP
Developing countries WPIWOITP
Lever controlling relative price impacts TRADEPLEV
Lever controlling US price feedthroughs WPIWLEV
Output
Real trade‐weighted GDP in other industrial countries JGDPMTPR
Real trade‐weighted GDP in developing countries JGDPOITPR
Long‐term government bond yield – major trading partners RMGBLMTP
* Variables denoted in bold are defined by identities; variables denoted in italics are exogenous.
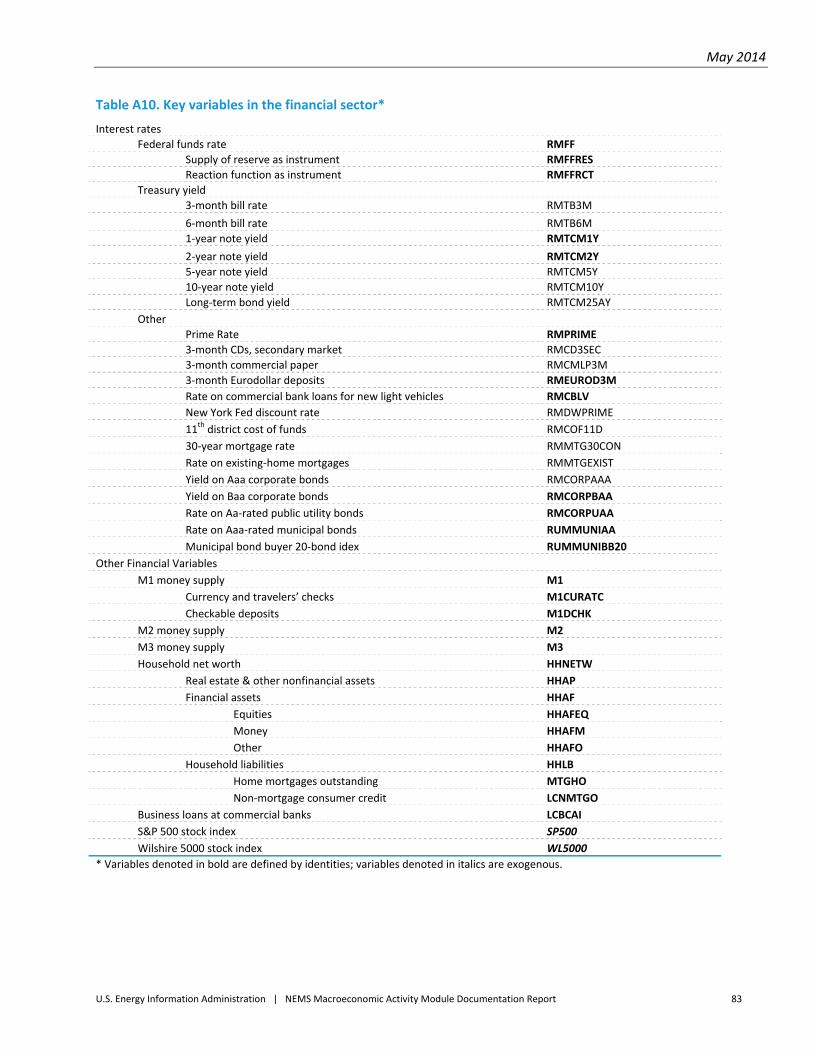
May 2014
U.S. Energy Information Administration | NEMS Macroeconomic Activity Module Documentation Report 83
Table A10. Key variables in the financial sector*
Interest rates
Federal funds rate RMFF
Supply of reserve as instrument RMFFRES
Reaction function as instrument RMFFRCT
Treasury yield 3‐month bill rate RMTB3M
6‐month bill rate RMTB6M
1‐year note yield RMTCM1Y
2‐year note yield RMTCM2Y
5‐year note yield RMTCM5Y
10‐year note yield RMTCM10Y
Long‐term bond yield RMTCM25AY
Other Prime Rate RMPRIME
3‐month CDs, secondary market RMCD3SEC
3‐month commercial paper RMCMLP3M
3‐month Eurodollar deposits RMEUROD3M
Rate on commercial bank loans for new light vehicles RMCBLV
New York Fed discount rate RMDWPRIME
11th district cost of funds RMCOF11D
30‐year mortgage rate RMMTG30CON
Rate on existing‐home mortgages RMMTGEXIST Yield on Aaa corporate bonds RMCORPAAA Yield on Baa corporate bonds RMCORPBAA
Rate on Aa‐rated public utility bonds RMCORPUAA
Rate on Aaa‐rated municipal bonds RUMMUNIAA
Municipal bond buyer 20‐bond idex RUMMUNIBB20
Other Financial Variables
M1 money supply M1
Currency and travelers’ checks M1CURATC
Checkable deposits M1DCHK
M2 money supply M2
M3 money supply M3
Household net worth HHNETW
Real estate & other nonfinancial assets HHAP
Financial assets HHAF
Equities HHAFEQ
Money HHAFM
Other HHAFO
Household liabilities HHLB
Home mortgages outstanding MTGHO
Non‐mortgage consumer credit LCNMTGO
Business loans at commercial banks LCBCAI
S&P 500 stock index SP500
Wilshire 5000 stock index WL5000
* Variables denoted in bold are defined by identities; variables denoted in italics are exogenous.
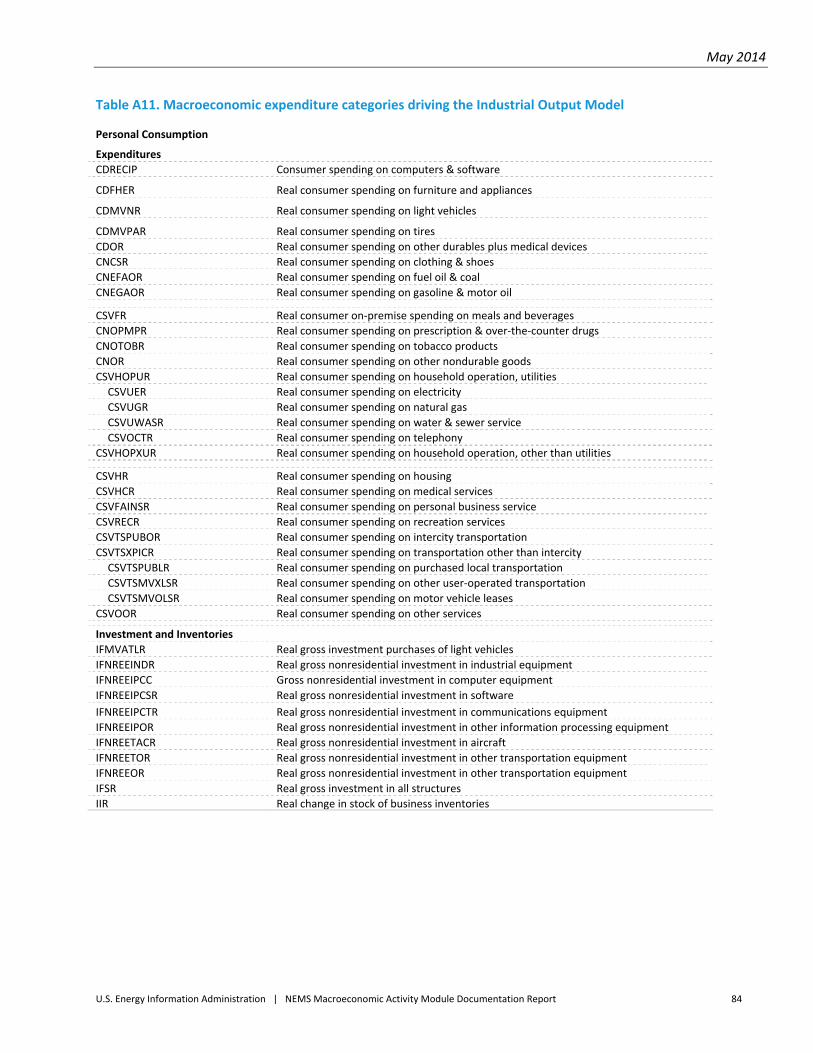
May 2014
U.S. Energy Information Administration | NEMS Macroeconomic Activity Module Documentation Report 84
Table A11. Macroeconomic expenditure categories driving the Industrial Output Model
Personal Consumption
Expenditures
CDRECIP Consumer spending on computers & software
CDFHER Real consumer spending on furniture and appliances
CDMVNR Real consumer spending on light vehicles
CDMVPAR Real consumer spending on tires
CDOR Real consumer spending on other durables plus medical devices
CNCSR Real consumer spending on clothing & shoes
CNEFAOR Real consumer spending on fuel oil & coal
CNEGAOR Real consumer spending on gasoline & motor oil
CSVFR Real consumer on‐premise spending on meals and beverages
CNOPMPR Real consumer spending on prescription & over‐the‐counter drugs
CNOTOBR Real consumer spending on tobacco products
CNOR Real consumer spending on other nondurable goods
CSVHOPUR Real consumer spending on household operation, utilities
CSVUER Real consumer spending on electricity
CSVUGR Real consumer spending on natural gas
CSVUWASR Real consumer spending on water & sewer service
CSVOCTR Real consumer spending on telephony
CSVHOPXUR Real consumer spending on household operation, other than utilities
CSVHR Real consumer spending on housing
CSVHCR Real consumer spending on medical services
CSVFAINSR Real consumer spending on personal business service
CSVRECR Real consumer spending on recreation services
CSVTSPUBOR Real consumer spending on intercity transportation
CSVTSXPICR Real consumer spending on transportation other than intercity
CSVTSPUBLR Real consumer spending on purchased local transportation
CSVTSMVXLSR Real consumer spending on other user‐operated transportation
CSVTSMVOLSR Real consumer spending on motor vehicle leases
CSVOOR Real consumer spending on other services
Investment and Inventories
IFMVATLR Real gross investment purchases of light vehicles
IFNREEINDR Real gross nonresidential investment in industrial equipment
IFNREEIPCC Gross nonresidential investment in computer equipment
IFNREEIPCSR Real gross nonresidential investment in software
IFNREEIPCTR Real gross nonresidential investment in communications equipment
IFNREEIPOR Real gross nonresidential investment in other information processing equipment
IFNREETACR Real gross nonresidential investment in aircraft
IFNREETOR Real gross nonresidential investment in other transportation equipment
IFNREEOR Real gross nonresidential investment in other transportation equipment
IFSR Real gross investment in all structures
IIR Real change in stock of business inventories
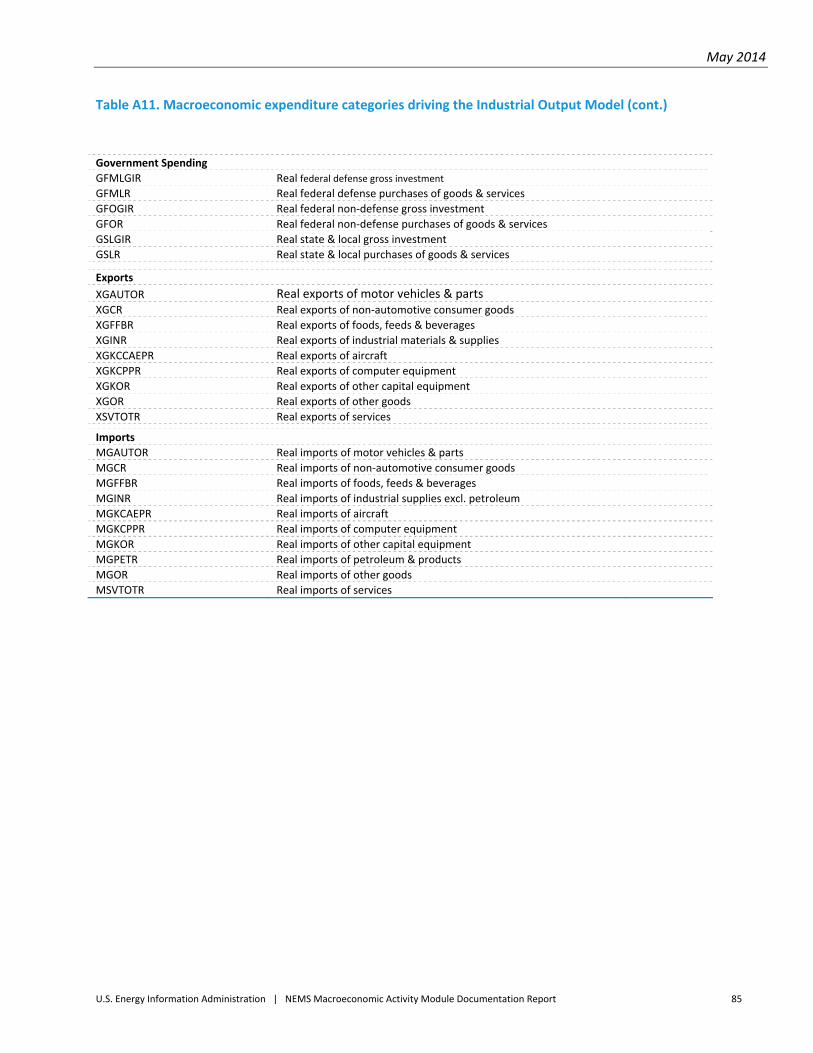
May 2014
U.S. Energy Information Administration | NEMS Macroeconomic Activity Module Documentation Report 85
Table A11. Macroeconomic expenditure categories driving the Industrial Output Model (cont.)
Government Spending
GFMLGIR Real federal defense gross investment
GFMLR Real federal defense purchases of goods & services
GFOGIR Real federal non‐defense gross investment
GFOR Real federal non‐defense purchases of goods & services
GSLGIR Real state & local gross investment
GSLR Real state & local purchases of goods & services
Exports
XGAUTOR Real exports of motor vehicles & parts XGCR Real exports of non‐automotive consumer goods
XGFFBR Real exports of foods, feeds & beverages
XGINR Real exports of industrial materials & supplies
XGKCCAEPR Real exports of aircraft
XGKCPPR Real exports of computer equipment
XGKOR Real exports of other capital equipment
XGOR Real exports of other goods
XSVTOTR Real exports of services
Imports
MGAUTOR Real imports of motor vehicles & parts
MGCR Real imports of non‐automotive consumer goods
MGFFBR Real imports of foods, feeds & beverages
MGINR Real imports of industrial supplies excl. petroleum
MGKCAEPR Real imports of aircraft
MGKCPPR Real imports of computer equipment
MGKOR Real imports of other capital equipment
MGPETR Real imports of petroleum & products
MGOR Real imports of other goods
MSVTOTR Real imports of services
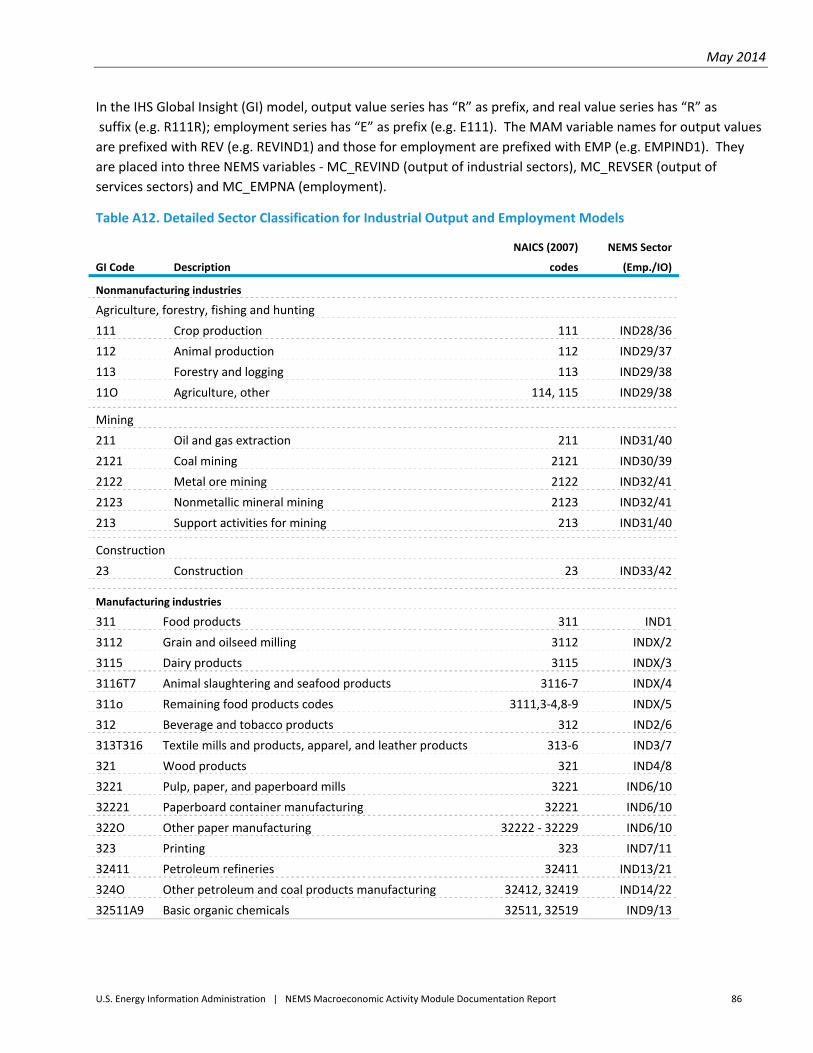
May 2014
U.S. Energy Information Administration | NEMS Macroeconomic Activity Module Documentation Report 86
In the IHS Global Insight (GI) model, output value series has “R” as prefix, and real value series has “R” as
suffix (e.g. R111R); employment series has “E” as prefix (e.g. E111). The MAM variable names for output values
are prefixed with REV (e.g. REVIND1) and those for employment are prefixed with EMP (e.g. EMPIND1). They
are placed into three NEMS variables ‐ MC_REVIND (output of industrial sectors), MC_REVSER (output of
services sectors) and MC_EMPNA (employment).
Table A12. Detailed Sector Classification for Industrial Output and Employment Models
GI Code Description
NAICS (2007)
codes
NEMS Sector
(Emp./IO)
Nonmanufacturing industries
Agriculture, forestry, fishing and hunting
111 Crop production 111 IND28/36
112 Animal production 112 IND29/37
113 Forestry and logging 113 IND29/38
11O Agriculture, other 114, 115 IND29/38
Mining
211 Oil and gas extraction 211 IND31/40
2121 Coal mining 2121 IND30/39
2122 Metal ore mining 2122 IND32/41
2123 Nonmetallic mineral mining 2123 IND32/41
213 Support activities for mining 213 IND31/40
Construction
23 Construction 23 IND33/42
Manufacturing industries
311 Food products 311 IND1
3112 Grain and oilseed milling 3112 INDX/2
3115 Dairy products 3115 INDX/3
3116T7 Animal slaughtering and seafood products 3116‐7 INDX/4
311o Remaining food products codes 3111,3‐4,8‐9 INDX/5
312 Beverage and tobacco products 312 IND2/6
313T316 Textile mills and products, apparel, and leather products 313‐6 IND3/7
321 Wood products 321 IND4/8
3221 Pulp, paper, and paperboard mills 3221 IND6/10
32221 Paperboard container manufacturing 32221 IND6/10
322O Other paper manufacturing 32222 ‐ 32229 IND6/10
323 Printing 323 IND7/11
32411 Petroleum refineries 32411 IND13/21
324O Other petroleum and coal products manufacturing 32412, 32419 IND14/22
32511A9 Basic organic chemicals 32511, 32519 IND9/13
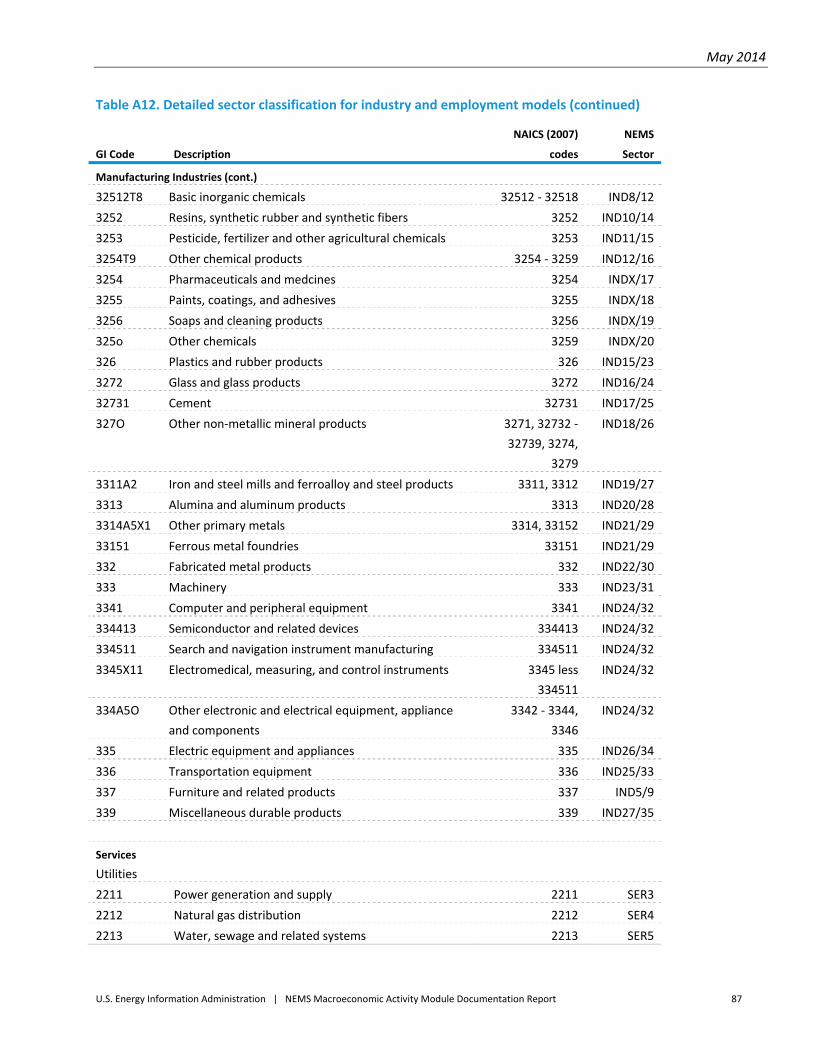
May 2014
U.S. Energy Information Administration | NEMS Macroeconomic Activity Module Documentation Report 87
Table A12. Detailed sector classification for industry and employment models (continued)
GI Code Description
NAICS (2007)
codes
NEMS
Sector
Manufacturing Industries (cont.)
32512T8 Basic inorganic chemicals 32512 ‐ 32518 IND8/12
3252 Resins, synthetic rubber and synthetic fibers 3252 IND10/14
3253 Pesticide, fertilizer and other agricultural chemicals 3253 IND11/15
3254T9 Other chemical products 3254 ‐ 3259 IND12/16
3254 Pharmaceuticals and medcines 3254 INDX/17
3255 Paints, coatings, and adhesives 3255 INDX/18
3256 Soaps and cleaning products 3256 INDX/19
325o Other chemicals 3259 INDX/20
326 Plastics and rubber products 326 IND15/23
3272 Glass and glass products 3272 IND16/24
32731 Cement 32731 IND17/25
327O Other non‐metallic mineral products 3271, 32732 ‐
32739, 3274,
3279
IND18/26
3311A2 Iron and steel mills and ferroalloy and steel products 3311, 3312 IND19/27
3313 Alumina and aluminum products 3313 IND20/28
3314A5X1 Other primary metals 3314, 33152 IND21/29
33151 Ferrous metal foundries 33151 IND21/29
332 Fabricated metal products 332 IND22/30
333 Machinery 333 IND23/31
3341 Computer and peripheral equipment 3341 IND24/32
334413 Semiconductor and related devices 334413 IND24/32
334511 Search and navigation instrument manufacturing 334511 IND24/32
3345X11 Electromedical, measuring, and control instruments 3345 less
334511
IND24/32
334A5O Other electronic and electrical equipment, appliance
and components
3342 ‐ 3344,
3346
IND24/32
335 Electric equipment and appliances 335 IND26/34
336 Transportation equipment 336 IND25/33
337 Furniture and related products 337 IND5/9
339 Miscellaneous durable products 339 IND27/35
Services
Utilities
2211 Power generation and supply 2211 SER3
2212 Natural gas distribution 2212 SER4
2213 Water, sewage and related systems 2213 SER5
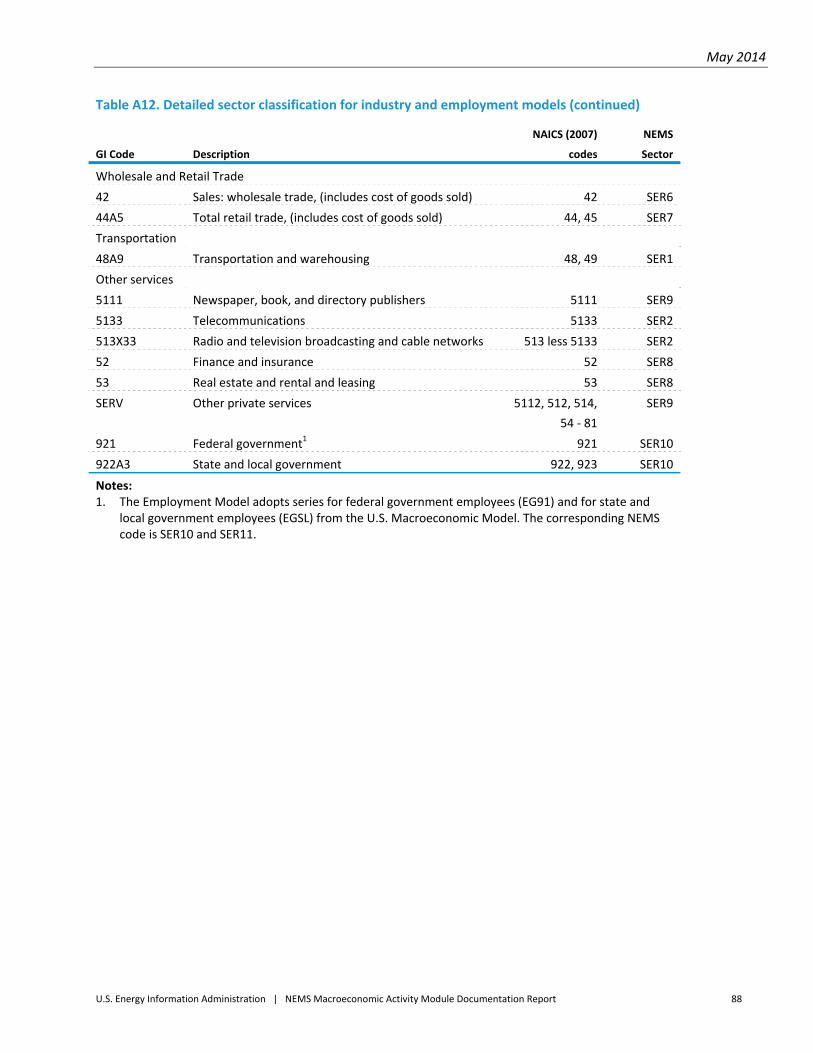
May 2014
U.S. Energy Information Administration | NEMS Macroeconomic Activity Module Documentation Report 88
Table A12. Detailed sector classification for industry and employment models (continued)
GI Code Description
NAICS (2007)
codes
NEMS
Sector
Wholesale and Retail Trade
42 Sales: wholesale trade, (includes cost of goods sold) 42 SER6
44A5 Total retail trade, (includes cost of goods sold) 44, 45 SER7
Transportation
48A9 Transportation and warehousing 48, 49 SER1
Other services
5111 Newspaper, book, and directory publishers 5111 SER9
5133 Telecommunications 5133 SER2
513X33 Radio and television broadcasting and cable networks 513 less 5133 SER2
52 Finance and insurance 52 SER8
53 Real estate and rental and leasing 53 SER8
SERV Other private services 5112, 512, 514,
54 ‐ 81
SER9
921 Federal government1 921 SER10
922A3 State and local government 922, 923 SER10
Notes: 1. The Employment Model adopts series for federal government employees (EG91) and for state and
local government employees (EGSL) from the U.S. Macroeconomic Model. The corresponding NEMS code is SER10 and SER11.
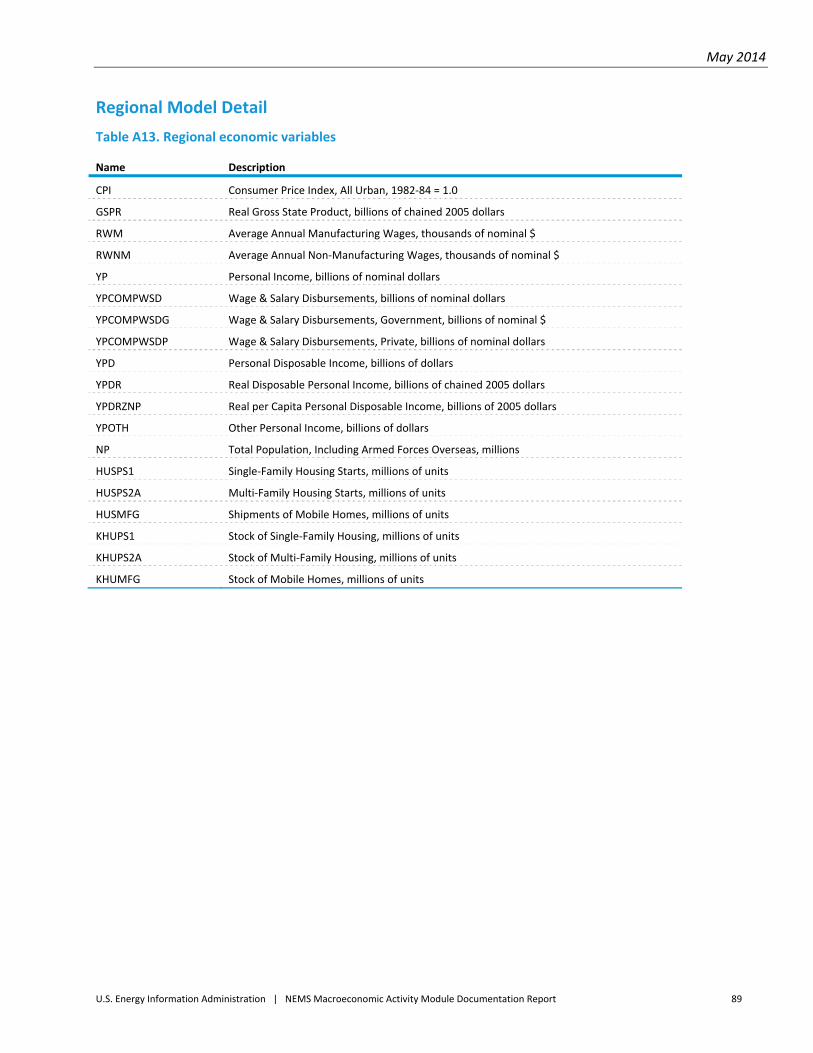
May 2014
U.S. Energy Information Administration | NEMS Macroeconomic Activity Module Documentation Report 89
Regional Model Detail
Table A13. Regional economic variables
Name Description
CPI Consumer Price Index, All Urban, 1982‐84 = 1.0
GSPR Real Gross State Product, billions of chained 2005 dollars
RWM Average Annual Manufacturing Wages, thousands of nominal $
RWNM Average Annual Non‐Manufacturing Wages, thousands of nominal $
YP Personal Income, billions of nominal dollars
YPCOMPWSD Wage & Salary Disbursements, billions of nominal dollars
YPCOMPWSDG Wage & Salary Disbursements, Government, billions of nominal $
YPCOMPWSDP Wage & Salary Disbursements, Private, billions of nominal dollars
YPD Personal Disposable Income, billions of dollars
YPDR Real Disposable Personal Income, billions of chained 2005 dollars
YPDRZNP Real per Capita Personal Disposable Income, billions of 2005 dollars
YPOTH Other Personal Income, billions of dollars
NP Total Population, Including Armed Forces Overseas, millions
HUSPS1 Single‐Family Housing Starts, millions of units
HUSPS2A Multi‐Family Housing Starts, millions of units
HUSMFG Shipments of Mobile Homes, millions of units
KHUPS1 Stock of Single‐Family Housing, millions of units
KHUPS2A Stock of Multi‐Family Housing, millions of units
KHUMFG Stock of Mobile Homes, millions of units
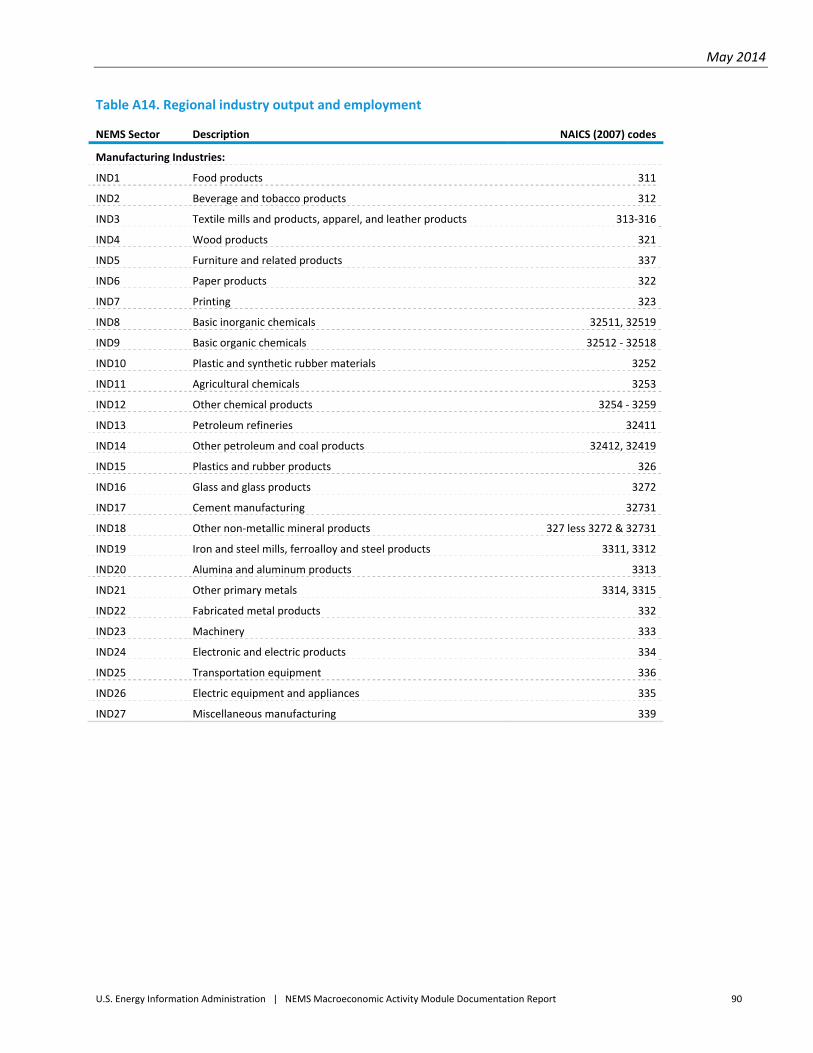
May 2014
U.S. Energy Information Administration | NEMS Macroeconomic Activity Module Documentation Report 90
Table A14. Regional industry output and employment
NEMS Sector Description NAICS (2007) codes
Manufacturing Industries:
IND1 Food products 311
IND2 Beverage and tobacco products 312
IND3 Textile mills and products, apparel, and leather products 313‐316
IND4 Wood products 321
IND5 Furniture and related products 337
IND6 Paper products 322
IND7 Printing 323
IND8 Basic inorganic chemicals 32511, 32519
IND9 Basic organic chemicals 32512 ‐ 32518
IND10 Plastic and synthetic rubber materials 3252
IND11 Agricultural chemicals 3253
IND12 Other chemical products 3254 ‐ 3259
IND13 Petroleum refineries 32411
IND14 Other petroleum and coal products 32412, 32419
IND15 Plastics and rubber products 326
IND16 Glass and glass products 3272
IND17 Cement manufacturing 32731
IND18 Other non‐metallic mineral products 327 less 3272 & 32731
IND19 Iron and steel mills, ferroalloy and steel products 3311, 3312
IND20 Alumina and aluminum products 3313
IND21 Other primary metals 3314, 3315
IND22 Fabricated metal products 332
IND23 Machinery 333
IND24 Electronic and electric products 334
IND25 Transportation equipment 336
IND26 Electric equipment and appliances 335
IND27 Miscellaneous manufacturing 339
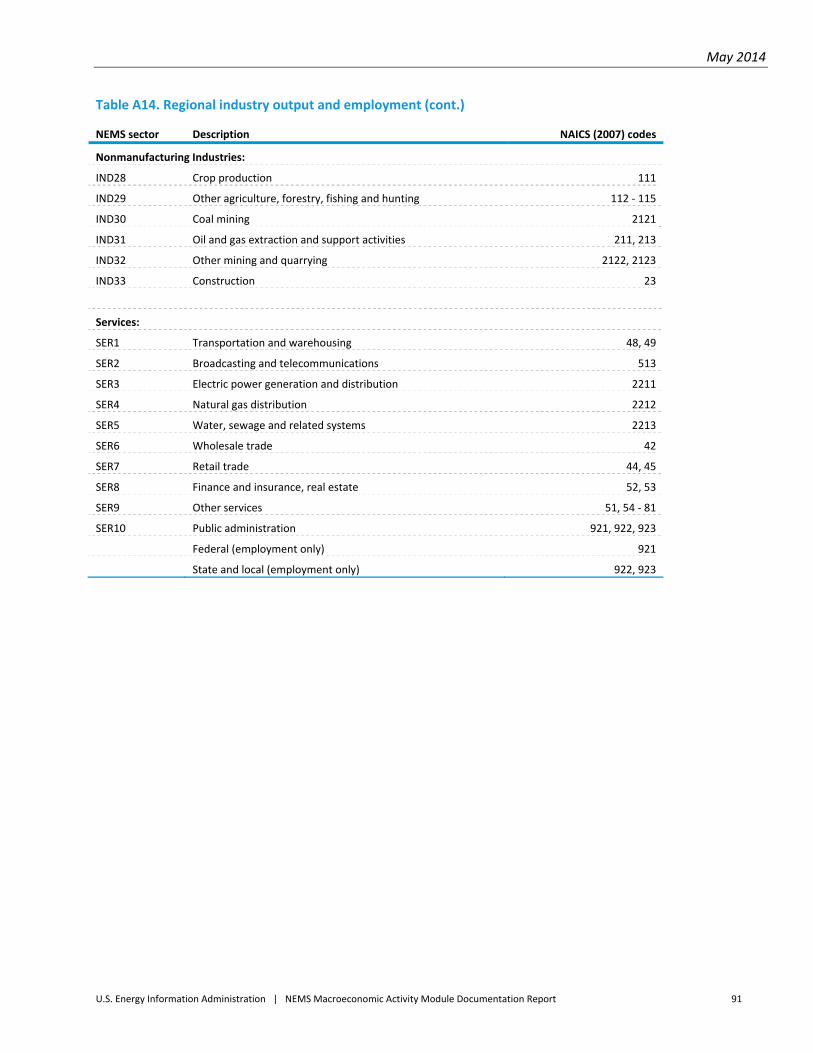
May 2014
U.S. Energy Information Administration | NEMS Macroeconomic Activity Module Documentation Report 91
Table A14. Regional industry output and employment (cont.)
NEMS sector Description NAICS (2007) codes
Nonmanufacturing Industries:
IND28 Crop production 111
IND29 Other agriculture, forestry, fishing and hunting 112 ‐ 115
IND30 Coal mining 2121
IND31 Oil and gas extraction and support activities 211, 213
IND32 Other mining and quarrying 2122, 2123
IND33 Construction 23
Services:
SER1 Transportation and warehousing 48, 49
SER2 Broadcasting and telecommunications 513
SER3 Electric power generation and distribution 2211
SER4 Natural gas distribution 2212
SER5 Water, sewage and related systems 2213
SER6 Wholesale trade 42
SER7 Retail trade 44, 45
SER8 Finance and insurance, real estate 52, 53
SER9 Other services 51, 54 ‐ 81
SER10 Public administration 921, 922, 923
Federal (employment only) 921
State and local (employment only) 922, 923
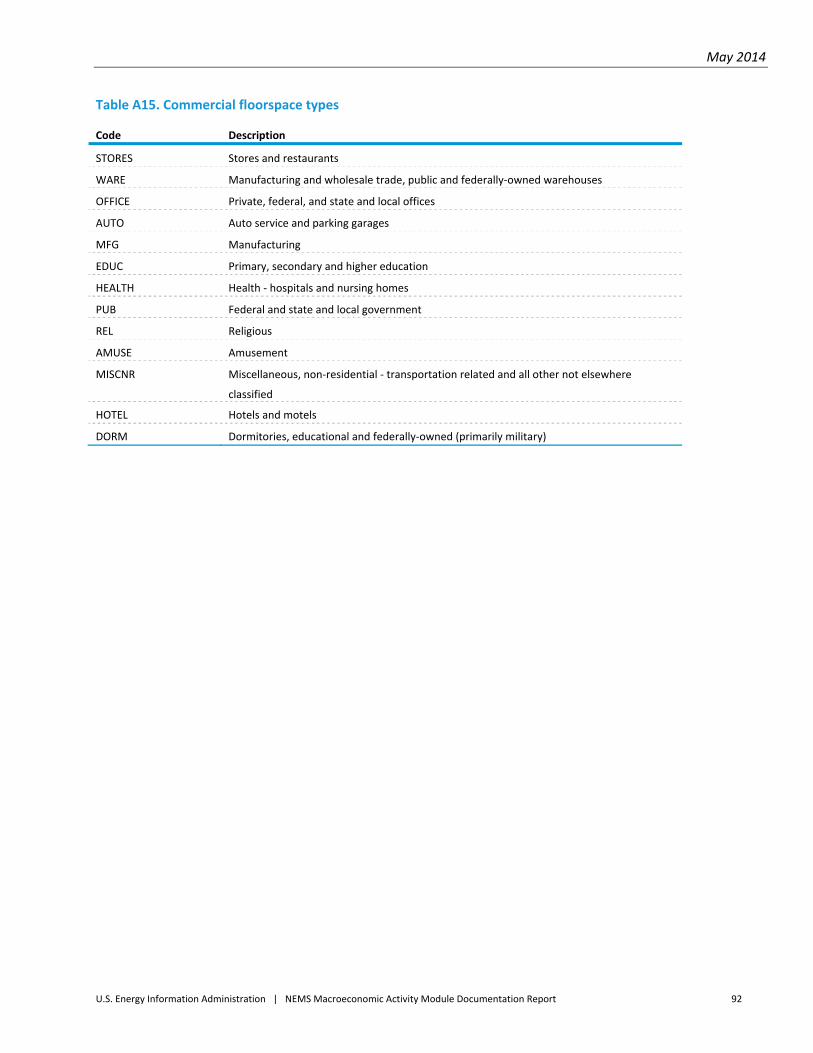
May 2014
U.S. Energy Information Administration | NEMS Macroeconomic Activity Module Documentation Report 92
Table A15. Commercial floorspace types
Code Description
STORES Stores and restaurants
WARE Manufacturing and wholesale trade, public and federally‐owned warehouses
OFFICE Private, federal, and state and local offices
AUTO Auto service and parking garages
MFG Manufacturing
EDUC Primary, secondary and higher education
HEALTH Health ‐ hospitals and nursing homes
PUB Federal and state and local government
REL Religious
AMUSE Amusement
MISCNR Miscellaneous, non‐residential ‐ transportation related and all other not elsewhere
classified
HOTEL Hotels and motels
DORM Dormitories, educational and federally‐owned (primarily military)
May 2014
U.S. Energy Information Administration | NEMS Macroeconomic Activity Module Documentation Report 93
Appendix B: MAM Inputs and Outputs
Introduction Appendix B describes the inputs, parameters and files required for execution of the Direct Link, Industrial
Output, Employment, Regional, Commercial Floorspace and Transportation submodules of the Macroeconomic
Activity Module (MAM). This appendix also presents the primary outputs generated by MAM for the benefit of
NEMS and of the MAM output files. As described in the main text of this volume, the Direct Link submodule of
MAM uses IHS Global Insight’s U.S. Macroeconomic Activity, Industrial Output and Employment models. The EIA
staff and contract support developed the remaining models of the MAM. These include models of regional
economic activity, industrial output and employment, changes to the regional stocks of commercial floorspace
and unit sales of light trucks. Unlike IHS Global Insight’s models, the EIA models are not proprietary. Table B1
identifies the files that are used and are created by the MAM during the execution of the NEMS. It also indicates
whether each file is an input or an output file and describes its contents.
Inputs
Table B2 describes the MAM parameters and controls specified at the start of a NEMS run. They include user‐
specified modeling switches and array dimensions used in MAM’s FORTRAN source code. The user‐specified
switches enable the modeler to choose among alternative assumptions for the scenario.
Inputs from NEMS
Before the MAM executes IHS Global Insight’s U.S. model in EViews, 33 energy prices and quantities are
computed using inputs from the NEMS. These are energy assumptions exogenous to IHS Global Insight’s
models. Table B3 lists and defines these energy assumptions. For each, the IHS Global Insight model mnemonic
is given along with its definition. The final column of Table B3 lists the NEMS variables used to calculate the
corresponding IHS Global Insight variable.
The MAM also calculates industrial gross output growth rates for the energy sectors (petroleum refining, coal
mining, oil and gas extraction, electric utilities, and gas utilities) based upon physical activity for the appropriate
NEMS supply or conversion modules, and then applies them to the historical output series in the Industrial
Output Model. In the Employment Model, employment estimates for two energy sectors (coal mining and oil
and gas extraction) are computed using growth rates extracted from the appropriate NEMS modules. Table B4
describes the NEMS variables used to calculate the growth rates for each sector.
May 2014
U.S. Energy Information Administration | NEMS Macroeconomic Activity Module Documentation Report 94
Outputs
Table B5 lists the U.S. macroeconomic variable outputs returned to the MAM from EViews. Annual data
beginning in 1990 and estimated through 2040 are recorded in the spreadsheet named MC_NATIONAL.
Table B6 defines industrial gross output variables contained within the Industrial Output Model of the MAM.
Projected growth rates of the five energy industry sectors are replaced by the NEMS results. MC_INDUSTRIAL is
a spreadsheet that presents the history and projections of industrial output by sector for the nine Census
Divisions and for the United States.
Table B7 defines the employment variables contained in the Employment Model of the MAM. Projected growth
rates of two energy sectors are replaced by the NEMS results. Historical and estimated values for the detailed
industrial sectors and aggregates are shown in the MC_EMPLOYMENT spreadsheet.
Table B8 defines the light truck variables contained in the TRANC Submodule of the MAM. Annual data
beginning in 1990 and estimated through 2040 are recorded in the spreadsheet named MC_VEHICLES.
Regional data and commercial floorspace data produced by the Regional Model and the Commercial Floorspace
Model of the MAM are presented in the MC_REGIONAL spreadsheet. Table B9 describes the regions and
variables contained in that spreadsheet. The same regional projections for economic activity, commercial
floorspace, employment and industrial output contained in the MC_REGIONAL spreadsheet are also found in the
MC_REGMAC, MC_COMMFLR, MC_REGEMP and MC_REGIO spreadsheets, respectively. Table B10 describes
the regions and variables contained in the output spreadsheet MC_REGMAC for EIA’s Regional Economic Activity
Model. Table B11 describes the regions and variables contained in the output spreadsheet MC_COMMFLR for
EIA’s Regional Commercial Floorspace Model. Table B12 describes the regions and variables contained in the
output spreadsheet MC_REGEMP for EIA’s Regional Employment Model. Table B13 describes the regions and
variables contained in the output spreadsheet MC_REGIO for EIA’s Regional Industrial Output Model.
Table B14 lists the MACOUT common block variables referenced by other NEMS modules. The final column lists
the referencing NEMS modules and submodules. A description of the module and submodule abbreviations
follows Table B14.
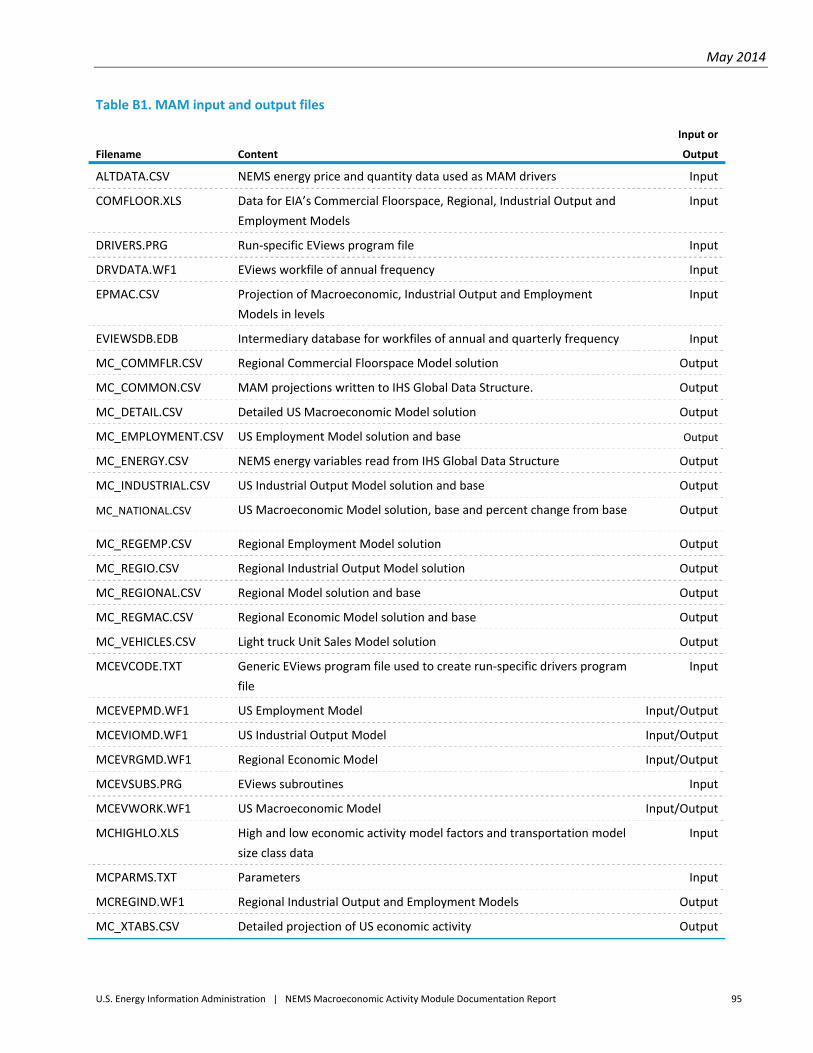
May 2014
U.S. Energy Information Administration | NEMS Macroeconomic Activity Module Documentation Report 95
Table B1. MAM input and output files
Filename Content
Input or
Output
ALTDATA.CSV NEMS energy price and quantity data used as MAM drivers Input
COMFLOOR.XLS Data for EIA’s Commercial Floorspace, Regional, Industrial Output and
Employment Models
Input
DRIVERS.PRG Run‐specific EViews program file Input
DRVDATA.WF1 EViews workfile of annual frequency Input
EPMAC.CSV Projection of Macroeconomic, Industrial Output and Employment
Models in levels
Input
EVIEWSDB.EDB Intermediary database for workfiles of annual and quarterly frequency Input
MC_COMMFLR.CSV Regional Commercial Floorspace Model solution Output
MC_COMMON.CSV MAM projections written to IHS Global Data Structure. Output
MC_DETAIL.CSV Detailed US Macroeconomic Model solution Output
MC_EMPLOYMENT.CSV US Employment Model solution and base Output
MC_ENERGY.CSV NEMS energy variables read from IHS Global Data Structure Output
MC_INDUSTRIAL.CSV US Industrial Output Model solution and base Output
MC_NATIONAL.CSV US Macroeconomic Model solution, base and percent change from base Output
MC_REGEMP.CSV Regional Employment Model solution Output
MC_REGIO.CSV Regional Industrial Output Model solution Output
MC_REGIONAL.CSV Regional Model solution and base Output
MC_REGMAC.CSV Regional Economic Model solution and base Output
MC_VEHICLES.CSV Light truck Unit Sales Model solution Output
MCEVCODE.TXT Generic EViews program file used to create run‐specific drivers program
file
Input
MCEVEPMD.WF1 US Employment Model Input/Output
MCEVIOMD.WF1 US Industrial Output Model Input/Output
MCEVRGMD.WF1 Regional Economic Model Input/Output
MCEVSUBS.PRG EViews subroutines Input
MCEVWORK.WF1 US Macroeconomic Model Input/Output
MCHIGHLO.XLS High and low economic activity model factors and transportation model
size class data
Input
MCPARMS.TXT Parameters Input
MCREGIND.WF1 Regional Industrial Output and Employment Models Output
MC_XTABS.CSV Detailed projection of US economic activity Output
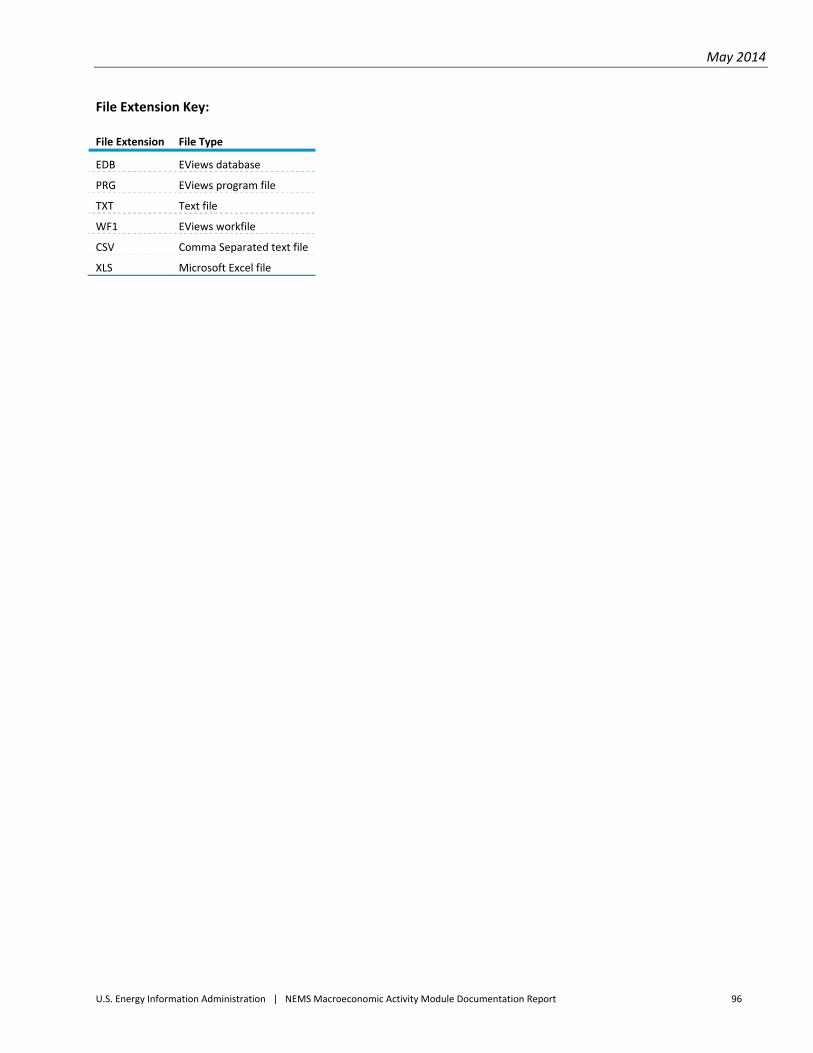
May 2014
U.S. Energy Information Administration | NEMS Macroeconomic Activity Module Documentation Report 96
File Extension Key:
File Extension File Type
EDB EViews database
PRG EViews program file
TXT Text file
WF1 EViews workfile
CSV Comma Separated text file
XLS Microsoft Excel file
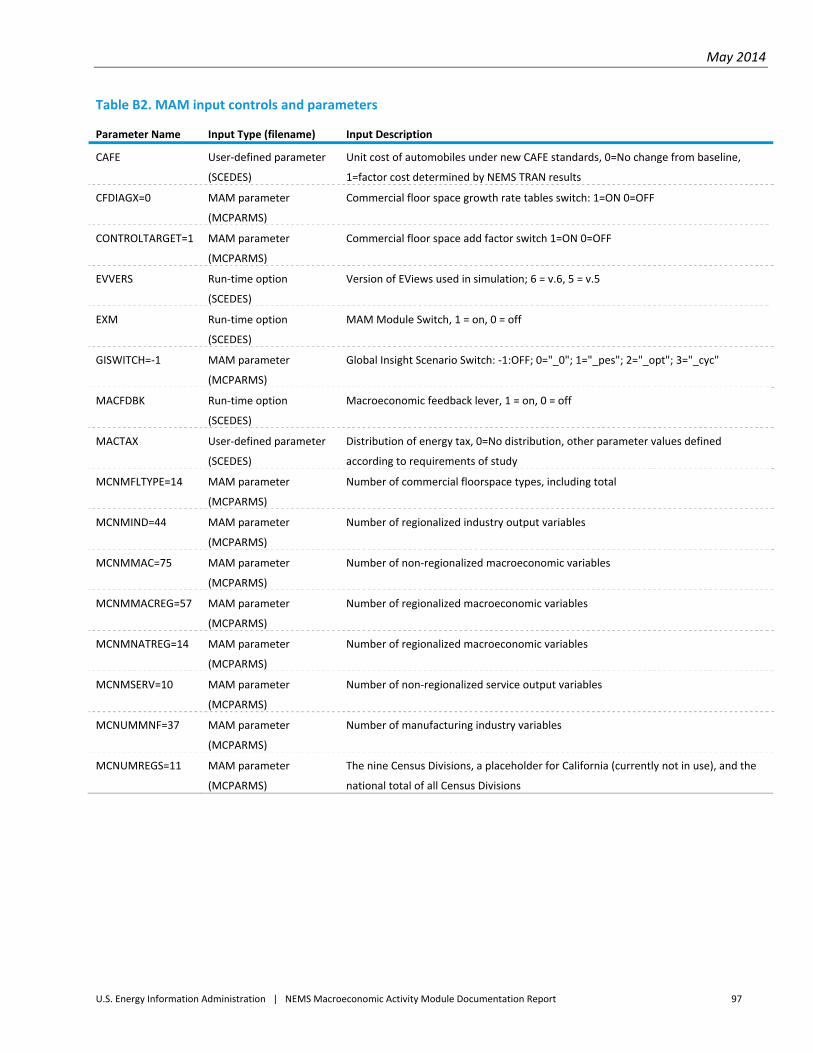
May 2014
U.S. Energy Information Administration | NEMS Macroeconomic Activity Module Documentation Report 97
Table B2. MAM input controls and parameters
Parameter Name Input Type (filename) Input Description
CAFE User‐defined parameter
(SCEDES)
Unit cost of automobiles under new CAFE standards, 0=No change from baseline,
1=factor cost determined by NEMS TRAN results
CFDIAGX=0 MAM parameter
(MCPARMS)
Commercial floor space growth rate tables switch: 1=ON 0=OFF
CONTROLTARGET=1 MAM parameter
(MCPARMS)
Commercial floor space add factor switch 1=ON 0=OFF
EVVERS Run‐time option
(SCEDES)
Version of EViews used in simulation; 6 = v.6, 5 = v.5
EXM Run‐time option
(SCEDES)
MAM Module Switch, 1 = on, 0 = off
GISWITCH=‐1 MAM parameter
(MCPARMS)
Global Insight Scenario Switch: ‐1:OFF; 0="_0"; 1="_pes"; 2="_opt"; 3="_cyc"
MACFDBK Run‐time option
(SCEDES)
Macroeconomic feedback lever, 1 = on, 0 = off
MACTAX User‐defined parameter
(SCEDES)
Distribution of energy tax, 0=No distribution, other parameter values defined
according to requirements of study
MCNMFLTYPE=14 MAM parameter
(MCPARMS)
Number of commercial floorspace types, including total
MCNMIND=44 MAM parameter
(MCPARMS)
Number of regionalized industry output variables
MCNMMAC=75 MAM parameter
(MCPARMS)
Number of non‐regionalized macroeconomic variables
MCNMMACREG=57 MAM parameter
(MCPARMS)
Number of regionalized macroeconomic variables
MCNMNATREG=14 MAM parameter
(MCPARMS)
Number of regionalized macroeconomic variables
MCNMSERV=10 MAM parameter
(MCPARMS)
Number of non‐regionalized service output variables
MCNUMMNF=37 MAM parameter
(MCPARMS)
Number of manufacturing industry variables
MCNUMREGS=11 MAM parameter
(MCPARMS)
The nine Census Divisions, a placeholder for California (currently not in use), and the
national total of all Census Divisions
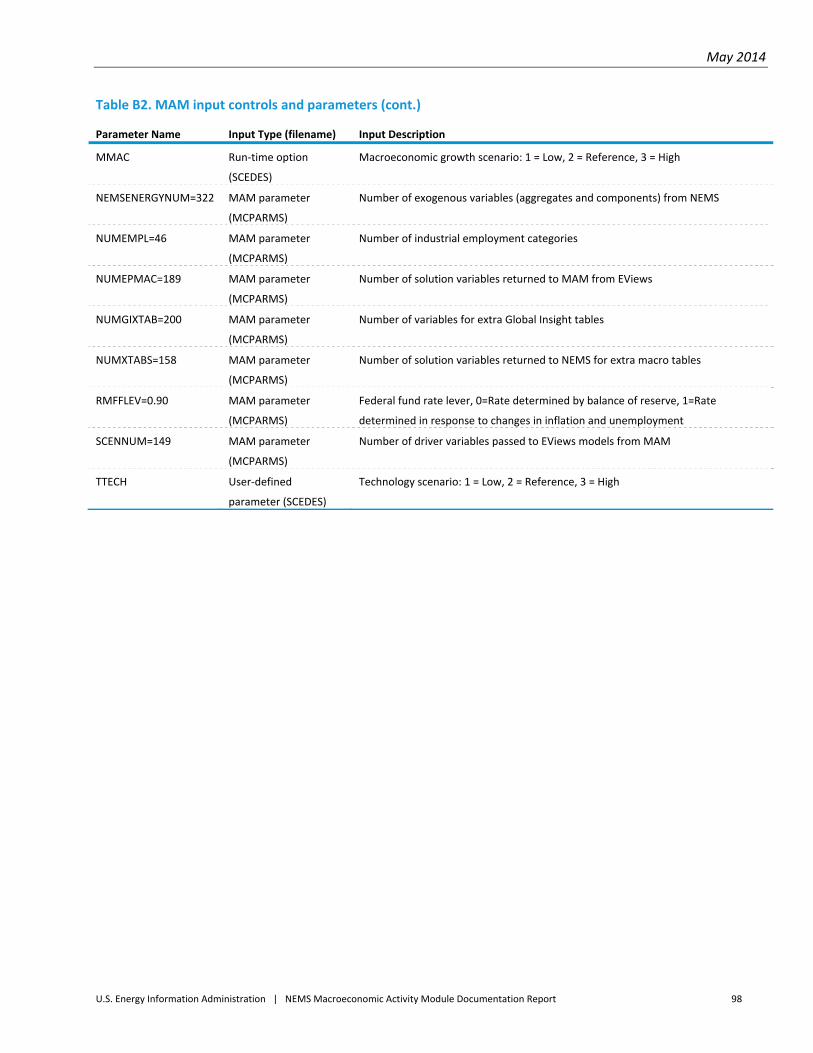
May 2014
U.S. Energy Information Administration | NEMS Macroeconomic Activity Module Documentation Report 98
Table B2. MAM input controls and parameters (cont.)
Parameter Name Input Type (filename) Input Description
MMAC Run‐time option
(SCEDES)
Macroeconomic growth scenario: 1 = Low, 2 = Reference, 3 = High
NEMSENERGYNUM=322 MAM parameter
(MCPARMS)
Number of exogenous variables (aggregates and components) from NEMS
NUMEMPL=46 MAM parameter
(MCPARMS)
Number of industrial employment categories
NUMEPMAC=189 MAM parameter
(MCPARMS)
Number of solution variables returned to MAM from EViews
NUMGIXTAB=200 MAM parameter
(MCPARMS)
Number of variables for extra Global Insight tables
NUMXTABS=158 MAM parameter
(MCPARMS)
Number of solution variables returned to NEMS for extra macro tables
RMFFLEV=0.90 MAM parameter
(MCPARMS)
Federal fund rate lever, 0=Rate determined by balance of reserve, 1=Rate
determined in response to changes in inflation and unemployment
SCENNUM=149 MAM parameter
(MCPARMS)
Number of driver variables passed to EViews models from MAM
TTECH User‐defined
parameter (SCEDES)
Technology scenario: 1 = Low, 2 = Reference, 3 = High
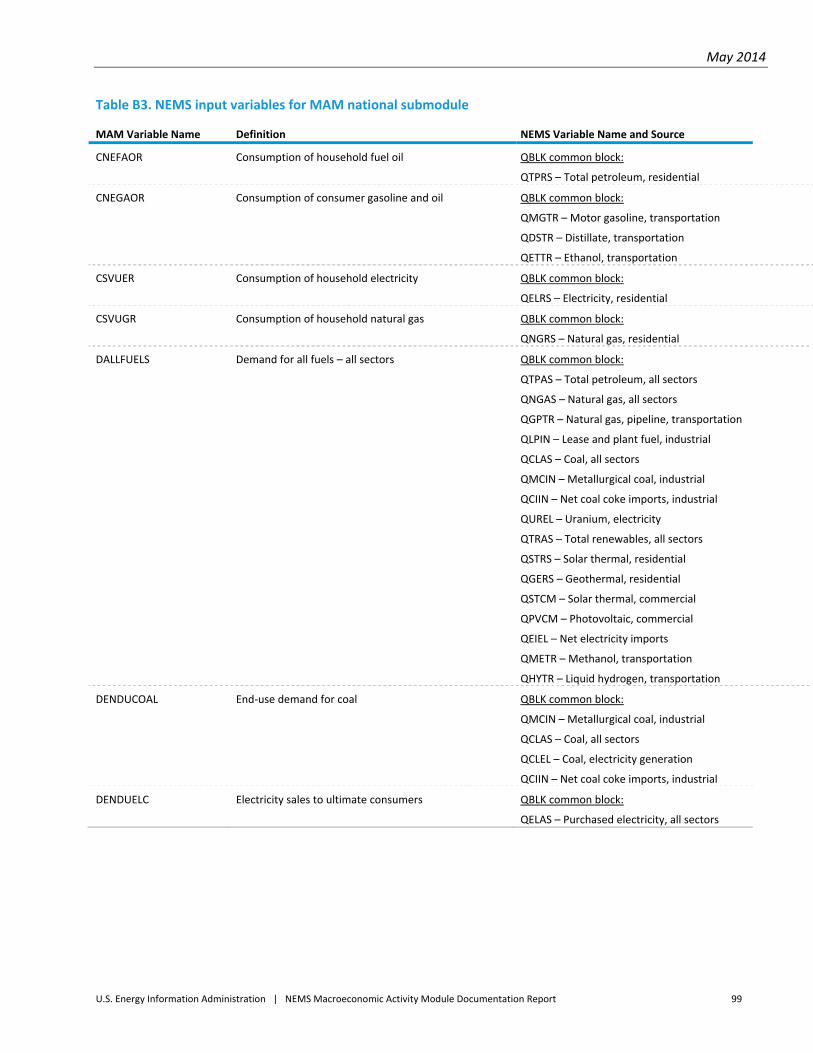
May 2014
U.S. Energy Information Administration | NEMS Macroeconomic Activity Module Documentation Report 99
Table B3. NEMS input variables for MAM national submodule
MAM Variable Name Definition NEMS Variable Name and Source
CNEFAOR Consumption of household fuel oil QBLK common block:
QTPRS – Total petroleum, residential
CNEGAOR Consumption of consumer gasoline and oil QBLK common block:
QMGTR – Motor gasoline, transportation
QDSTR – Distillate, transportation
QETTR – Ethanol, transportation
CSVUER Consumption of household electricity QBLK common block:
QELRS – Electricity, residential
CSVUGR Consumption of household natural gas QBLK common block:
QNGRS – Natural gas, residential
DALLFUELS Demand for all fuels – all sectors QBLK common block:
QTPAS – Total petroleum, all sectors
QNGAS – Natural gas, all sectors
QGPTR – Natural gas, pipeline, transportation
QLPIN – Lease and plant fuel, industrial
QCLAS – Coal, all sectors
QMCIN – Metallurgical coal, industrial
QCIIN – Net coal coke imports, industrial
QUREL – Uranium, electricity
QTRAS – Total renewables, all sectors
QSTRS – Solar thermal, residential
QGERS – Geothermal, residential
QSTCM – Solar thermal, commercial
QPVCM – Photovoltaic, commercial
QEIEL – Net electricity imports
QMETR – Methanol, transportation
QHYTR – Liquid hydrogen, transportation
DENDUCOAL End‐use demand for coal QBLK common block:
QMCIN – Metallurgical coal, industrial
QCLAS – Coal, all sectors
QCLEL – Coal, electricity generation
QCIIN – Net coal coke imports, industrial
DENDUELC Electricity sales to ultimate consumers QBLK common block:
QELAS – Purchased electricity, all sectors
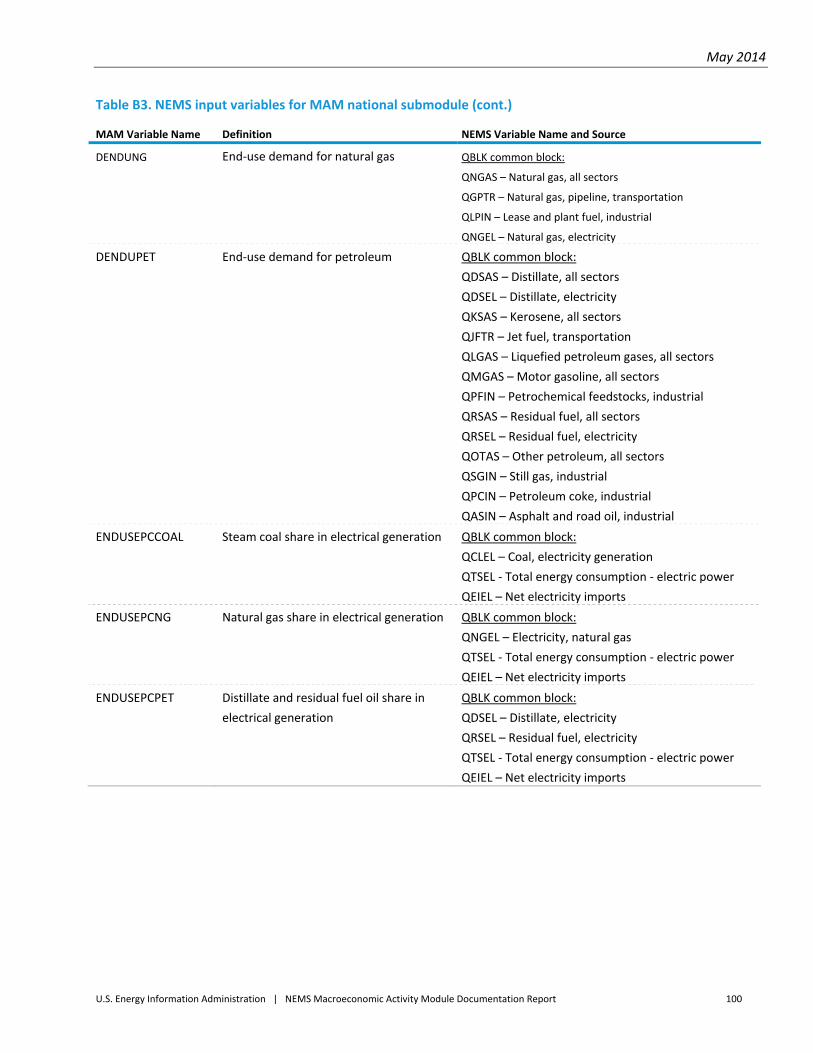
May 2014
U.S. Energy Information Administration | NEMS Macroeconomic Activity Module Documentation Report 100
Table B3. NEMS input variables for MAM national submodule (cont.)
MAM Variable Name Definition NEMS Variable Name and Source
DENDUNG End‐use demand for natural gas QBLK common block:
QNGAS – Natural gas, all sectors
QGPTR – Natural gas, pipeline, transportation
QLPIN – Lease and plant fuel, industrial
QNGEL – Natural gas, electricity
DENDUPET End‐use demand for petroleum QBLK common block:
QDSAS – Distillate, all sectors
QDSEL – Distillate, electricity
QKSAS – Kerosene, all sectors
QJFTR – Jet fuel, transportation
QLGAS – Liquefied petroleum gases, all sectors
QMGAS – Motor gasoline, all sectors
QPFIN – Petrochemical feedstocks, industrial
QRSAS – Residual fuel, all sectors
QRSEL – Residual fuel, electricity
QOTAS – Other petroleum, all sectors
QSGIN – Still gas, industrial
QPCIN – Petroleum coke, industrial
QASIN – Asphalt and road oil, industrial
ENDUSEPCCOAL Steam coal share in electrical generation QBLK common block:
QCLEL – Coal, electricity generation
QTSEL ‐ Total energy consumption ‐ electric power
QEIEL – Net electricity imports
ENDUSEPCNG Natural gas share in electrical generation QBLK common block:
QNGEL – Electricity, natural gas
QTSEL ‐ Total energy consumption ‐ electric power
QEIEL – Net electricity imports
ENDUSEPCPET Distillate and residual fuel oil share in
electrical generation
QBLK common block:
QDSEL – Distillate, electricity
QRSEL – Residual fuel, electricity
QTSEL ‐ Total energy consumption ‐ electric power
QEIEL – Net electricity imports
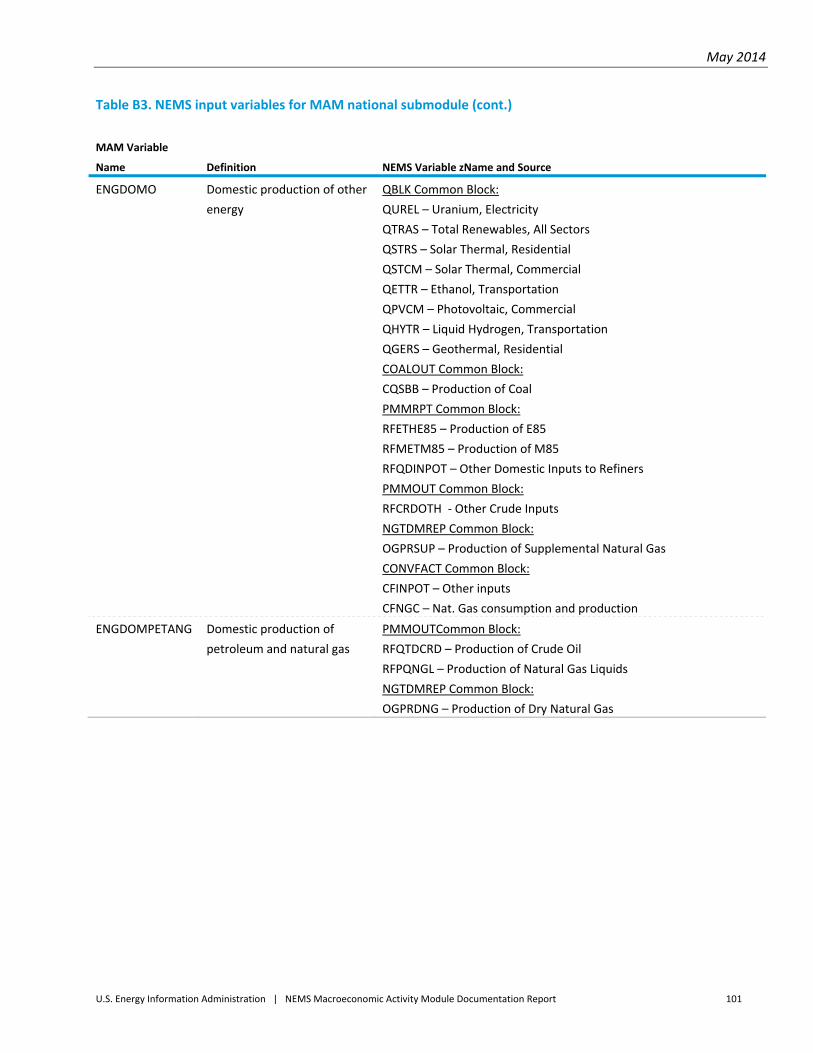
May 2014
U.S. Energy Information Administration | NEMS Macroeconomic Activity Module Documentation Report 101
Table B3. NEMS input variables for MAM national submodule (cont.)
MAM Variable
Name Definition NEMS Variable zName and Source
ENGDOMO Domestic production of other
energy
QBLK Common Block:
QUREL – Uranium, Electricity
QTRAS – Total Renewables, All Sectors
QSTRS – Solar Thermal, Residential
QSTCM – Solar Thermal, Commercial
QETTR – Ethanol, Transportation
QPVCM – Photovoltaic, Commercial
QHYTR – Liquid Hydrogen, Transportation
QGERS – Geothermal, Residential
COALOUT Common Block:
CQSBB – Production of Coal
PMMRPT Common Block:
RFETHE85 – Production of E85
RFMETM85 – Production of M85
RFQDINPOT – Other Domestic Inputs to Refiners
PMMOUT Common Block:
RFCRDOTH ‐ Other Crude Inputs
NGTDMREP Common Block:
OGPRSUP – Production of Supplemental Natural Gas
CONVFACT Common Block:
CFINPOT – Other inputs
CFNGC – Nat. Gas consumption and production
ENGDOMPETANG Domestic production of
petroleum and natural gas
PMMOUTCommon Block:
RFQTDCRD – Production of Crude Oil
RFPQNGL – Production of Natural Gas Liquids
NGTDMREP Common Block:
OGPRDNG – Production of Dry Natural Gas
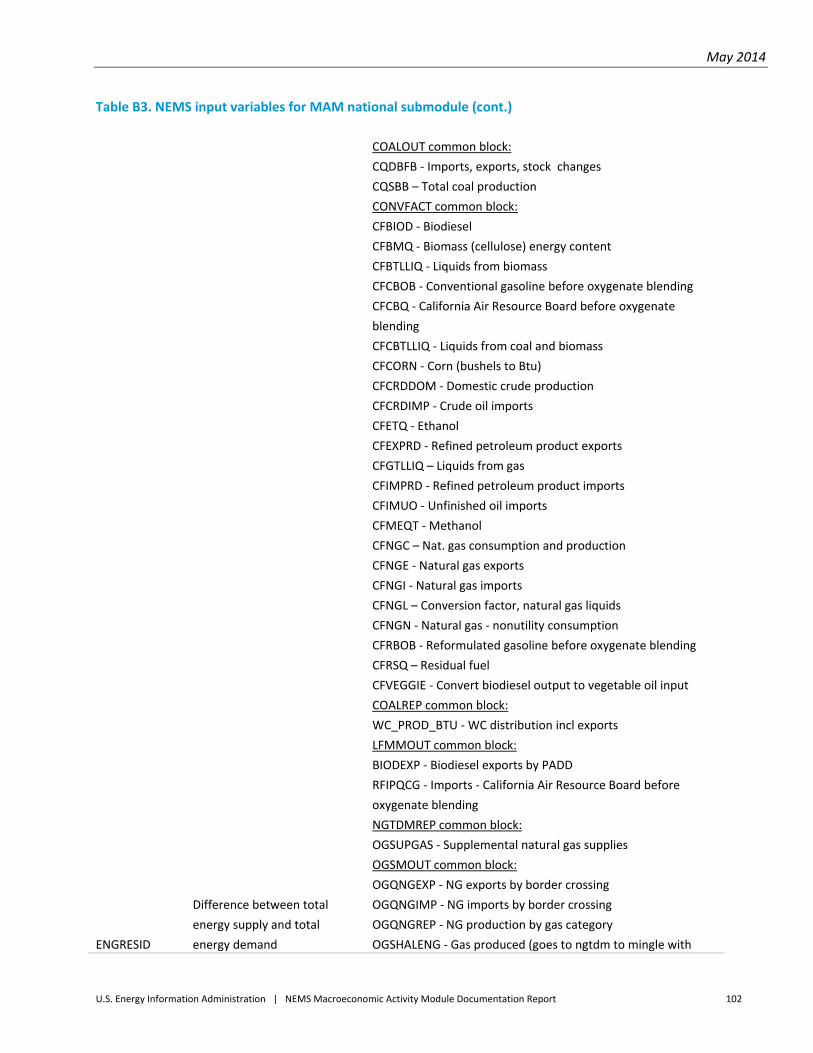
May 2014
U.S. Energy Information Administration | NEMS Macroeconomic Activity Module Documentation Report 102
Table B3. NEMS input variables for MAM national submodule (cont.)
ENGRESID
Difference between total
energy supply and total
energy demand
COALOUT common block:
CQDBFB ‐ Imports, exports, stock changes
CQSBB – Total coal production
CONVFACT common block:
CFBIOD ‐ Biodiesel
CFBMQ ‐ Biomass (cellulose) energy content
CFBTLLIQ ‐ Liquids from biomass
CFCBOB ‐ Conventional gasoline before oxygenate blending
CFCBQ ‐ California Air Resource Board before oxygenate
blending
CFCBTLLIQ ‐ Liquids from coal and biomass
CFCORN ‐ Corn (bushels to Btu)
CFCRDDOM ‐ Domestic crude production
CFCRDIMP ‐ Crude oil imports
CFETQ ‐ Ethanol
CFEXPRD ‐ Refined petroleum product exports
CFGTLLIQ – Liquids from gas
CFIMPRD ‐ Refined petroleum product imports
CFIMUO ‐ Unfinished oil imports
CFMEQT ‐ Methanol
CFNGC – Nat. gas consumption and production
CFNGE ‐ Natural gas exports
CFNGI ‐ Natural gas imports
CFNGL – Conversion factor, natural gas liquids
CFNGN ‐ Natural gas ‐ nonutility consumption
CFRBOB ‐ Reformulated gasoline before oxygenate blending
CFRSQ – Residual fuel
CFVEGGIE ‐ Convert biodiesel output to vegetable oil input
COALREP common block:
WC_PROD_BTU ‐ WC distribution incl exports
LFMMOUT common block:
BIODEXP ‐ Biodiesel exports by PADD
RFIPQCG ‐ Imports ‐ California Air Resource Board before
oxygenate blending
NGTDMREP common block:
OGSUPGAS ‐ Supplemental natural gas supplies
OGSMOUT common block:
OGQNGEXP ‐ NG exports by border crossing
OGQNGIMP ‐ NG imports by border crossing
OGQNGREP ‐ NG production by gas category
OGSHALENG ‐ Gas produced (goes to ngtdm to mingle with
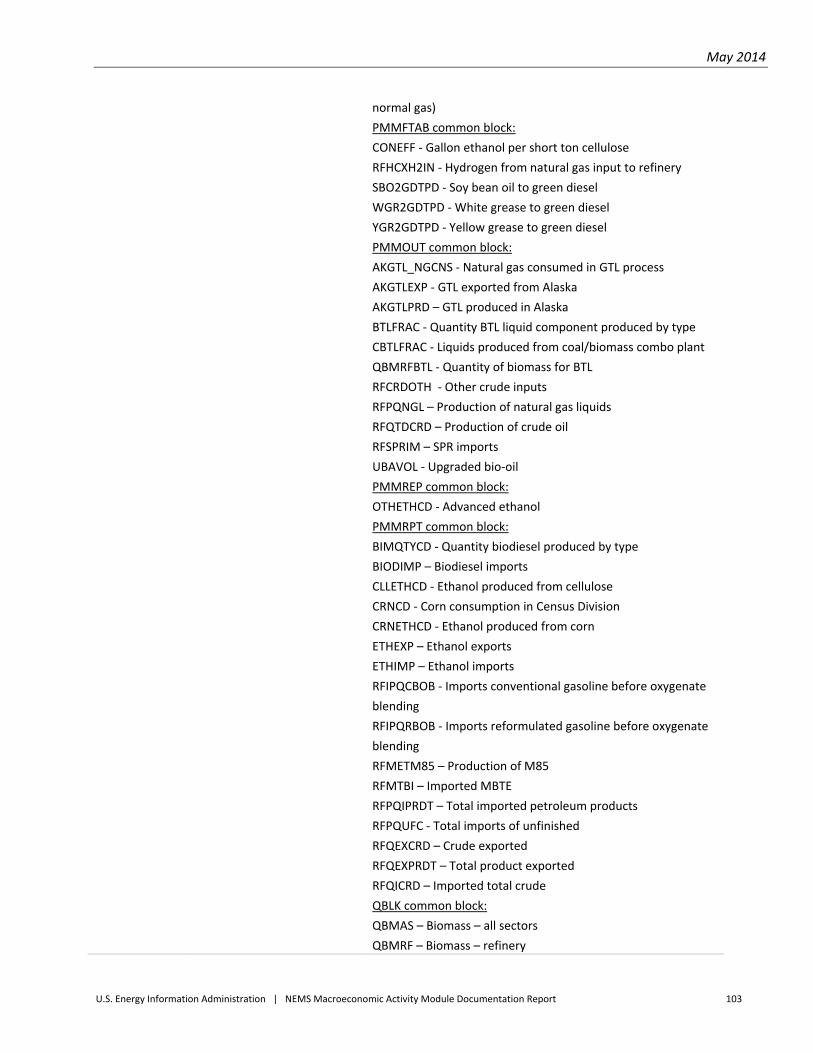
May 2014
U.S. Energy Information Administration | NEMS Macroeconomic Activity Module Documentation Report 103
normal gas)
PMMFTAB common block:
CONEFF ‐ Gallon ethanol per short ton cellulose
RFHCXH2IN ‐ Hydrogen from natural gas input to refinery
SBO2GDTPD ‐ Soy bean oil to green diesel
WGR2GDTPD ‐ White grease to green diesel
YGR2GDTPD ‐ Yellow grease to green diesel
PMMOUT common block:
AKGTL_NGCNS ‐ Natural gas consumed in GTL process
AKGTLEXP ‐ GTL exported from Alaska
AKGTLPRD – GTL produced in Alaska
BTLFRAC ‐ Quantity BTL liquid component produced by type
CBTLFRAC ‐ Liquids produced from coal/biomass combo plant
QBMRFBTL ‐ Quantity of biomass for BTL
RFCRDOTH ‐ Other crude inputs
RFPQNGL – Production of natural gas liquids
RFQTDCRD – Production of crude oil
RFSPRIM – SPR imports
UBAVOL ‐ Upgraded bio‐oil
PMMREP common block:
OTHETHCD ‐ Advanced ethanol
PMMRPT common block:
BIMQTYCD ‐ Quantity biodiesel produced by type
BIODIMP – Biodiesel imports
CLLETHCD ‐ Ethanol produced from cellulose
CRNCD ‐ Corn consumption in Census Division
CRNETHCD ‐ Ethanol produced from corn
ETHEXP – Ethanol exports
ETHIMP – Ethanol imports
RFIPQCBOB ‐ Imports conventional gasoline before oxygenate
blending
RFIPQRBOB ‐ Imports reformulated gasoline before oxygenate
blending
RFMETM85 – Production of M85
RFMTBI – Imported MBTE
RFPQIPRDT – Total imported petroleum products
RFPQUFC ‐ Total imports of unfinished
RFQEXCRD – Crude exported
RFQEXPRDT – Total product exported
RFQICRD – Imported total crude
QBLK common block:
QBMAS – Biomass – all sectors
QBMRF – Biomass – refinery
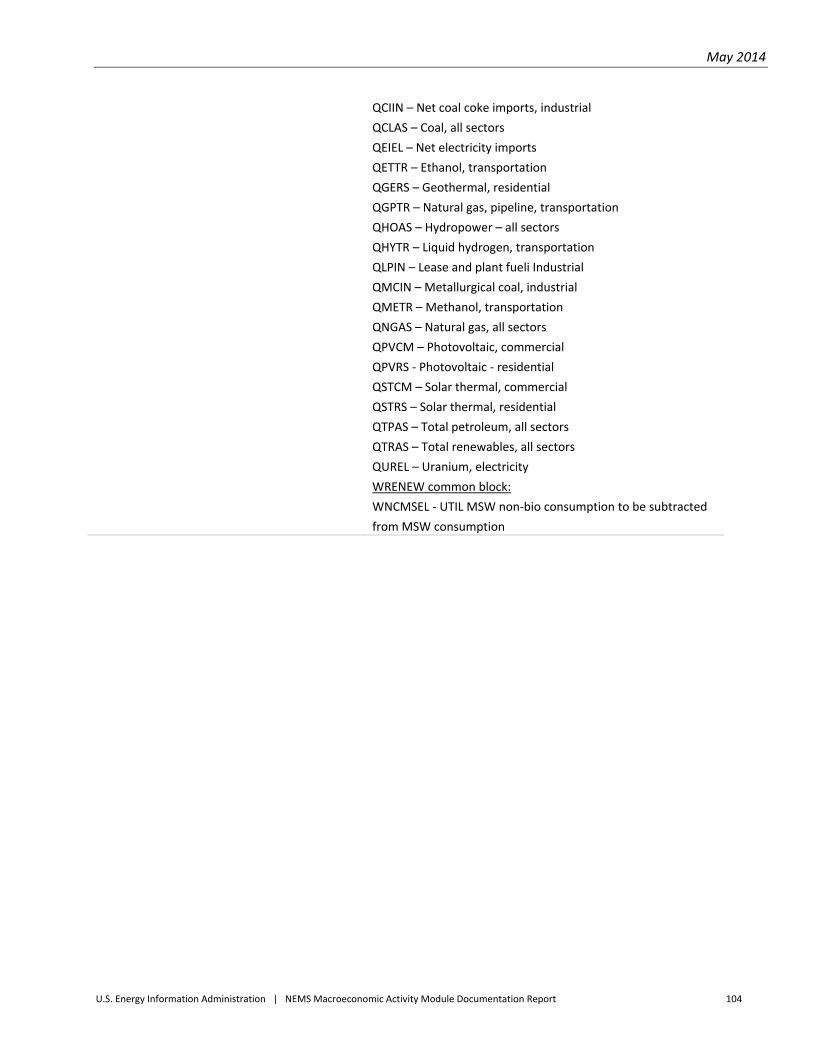
May 2014
U.S. Energy Information Administration | NEMS Macroeconomic Activity Module Documentation Report 104
QCIIN – Net coal coke imports, industrial
QCLAS – Coal, all sectors
QEIEL – Net electricity imports
QETTR – Ethanol, transportation
QGERS – Geothermal, residential
QGPTR – Natural gas, pipeline, transportation
QHOAS – Hydropower – all sectors
QHYTR – Liquid hydrogen, transportation
QLPIN – Lease and plant fueli Industrial
QMCIN – Metallurgical coal, industrial
QMETR – Methanol, transportation
QNGAS – Natural gas, all sectors
QPVCM – Photovoltaic, commercial
QPVRS ‐ Photovoltaic ‐ residential
QSTCM – Solar thermal, commercial
QSTRS – Solar thermal, residential
QTPAS – Total petroleum, all sectors
QTRAS – Total renewables, all sectors
QUREL – Uranium, electricity
WRENEW common block:
WNCMSEL ‐ UTIL MSW non‐bio consumption to be subtracted
from MSW consumption
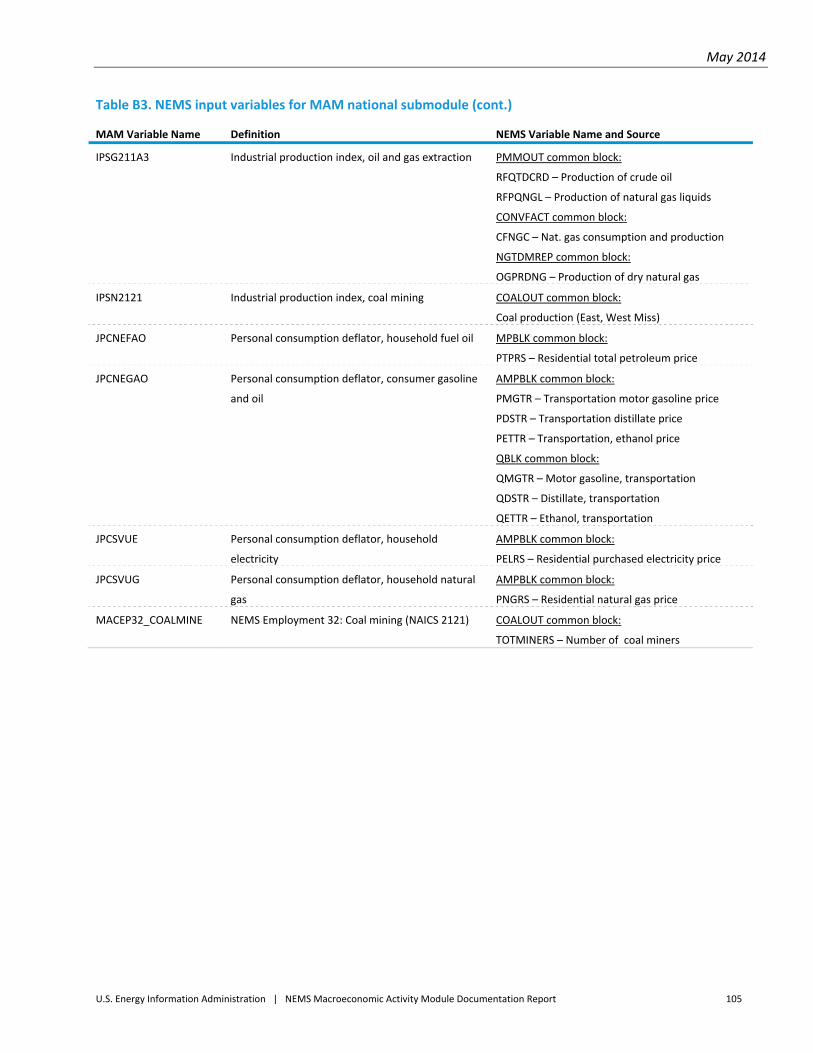
May 2014
U.S. Energy Information Administration | NEMS Macroeconomic Activity Module Documentation Report 105
Table B3. NEMS input variables for MAM national submodule (cont.)
MAM Variable Name Definition NEMS Variable Name and Source
IPSG211A3 Industrial production index, oil and gas extraction PMMOUT common block:
RFQTDCRD – Production of crude oil
RFPQNGL – Production of natural gas liquids
CONVFACT common block:
CFNGC – Nat. gas consumption and production
NGTDMREP common block:
OGPRDNG – Production of dry natural gas
IPSN2121 Industrial production index, coal mining COALOUT common block:
Coal production (East, West Miss)
JPCNEFAO Personal consumption deflator, household fuel oil MPBLK common block:
PTPRS – Residential total petroleum price
JPCNEGAO Personal consumption deflator, consumer gasoline
and oil
AMPBLK common block:
PMGTR – Transportation motor gasoline price
PDSTR – Transportation distillate price
PETTR – Transportation, ethanol price
QBLK common block:
QMGTR – Motor gasoline, transportation
QDSTR – Distillate, transportation
QETTR – Ethanol, transportation
JPCSVUE Personal consumption deflator, household
electricity
AMPBLK common block:
PELRS – Residential purchased electricity price
JPCSVUG Personal consumption deflator, household natural
gas
AMPBLK common block:
PNGRS – Residential natural gas price
MACEP32_COALMINE NEMS Employment 32: Coal mining (NAICS 2121) COALOUT common block:
TOTMINERS – Number of coal miners
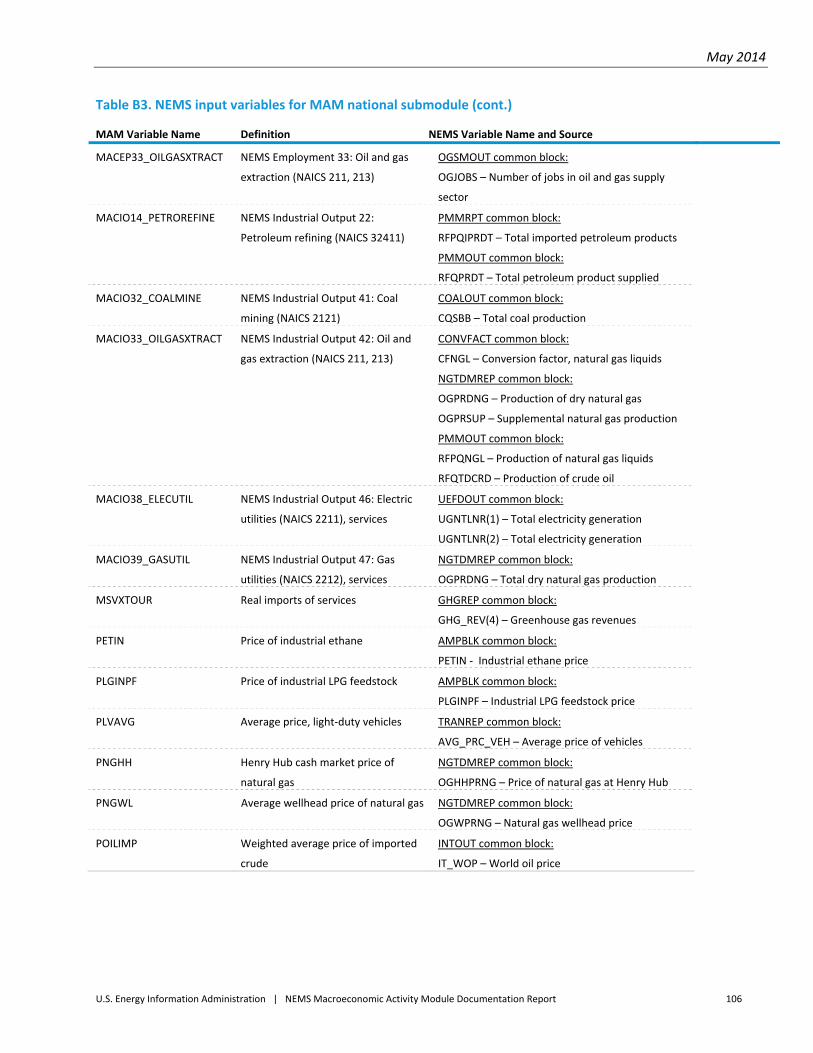
May 2014
U.S. Energy Information Administration | NEMS Macroeconomic Activity Module Documentation Report 106
Table B3. NEMS input variables for MAM national submodule (cont.)
MAM Variable Name Definition NEMS Variable Name and Source
MACEP33_OILGASXTRACT NEMS Employment 33: Oil and gas
extraction (NAICS 211, 213)
OGSMOUT common block:
OGJOBS – Number of jobs in oil and gas supply
sector
MACIO14_PETROREFINE NEMS Industrial Output 22:
Petroleum refining (NAICS 32411)
PMMRPT common block:
RFPQIPRDT – Total imported petroleum products
PMMOUT common block:
RFQPRDT – Total petroleum product supplied
MACIO32_COALMINE NEMS Industrial Output 41: Coal
mining (NAICS 2121)
COALOUT common block:
CQSBB – Total coal production
MACIO33_OILGASXTRACT NEMS Industrial Output 42: Oil and
gas extraction (NAICS 211, 213)
CONVFACT common block:
CFNGL – Conversion factor, natural gas liquids
NGTDMREP common block:
OGPRDNG – Production of dry natural gas
OGPRSUP – Supplemental natural gas production
PMMOUT common block:
RFPQNGL – Production of natural gas liquids
RFQTDCRD – Production of crude oil
MACIO38_ELECUTIL NEMS Industrial Output 46: Electric
utilities (NAICS 2211), services
UEFDOUT common block:
UGNTLNR(1) – Total electricity generation
UGNTLNR(2) – Total electricity generation
MACIO39_GASUTIL NEMS Industrial Output 47: Gas
utilities (NAICS 2212), services
NGTDMREP common block:
OGPRDNG – Total dry natural gas production
MSVXTOUR Real imports of services GHGREP common block:
GHG_REV(4) – Greenhouse gas revenues
PETIN Price of industrial ethane AMPBLK common block:
PETIN ‐ Industrial ethane price
PLGINPF Price of industrial LPG feedstock AMPBLK common block:
PLGINPF – Industrial LPG feedstock price
PLVAVG Average price, light‐duty vehicles TRANREP common block:
AVG_PRC_VEH – Average price of vehicles
PNGHH Henry Hub cash market price of
natural gas
NGTDMREP common block:
OGHHPRNG – Price of natural gas at Henry Hub
PNGWL Average wellhead price of natural gas NGTDMREP common block:
OGWPRNG – Natural gas wellhead price
POILIMP Weighted average price of imported
crude
INTOUT common block:
IT_WOP – World oil price
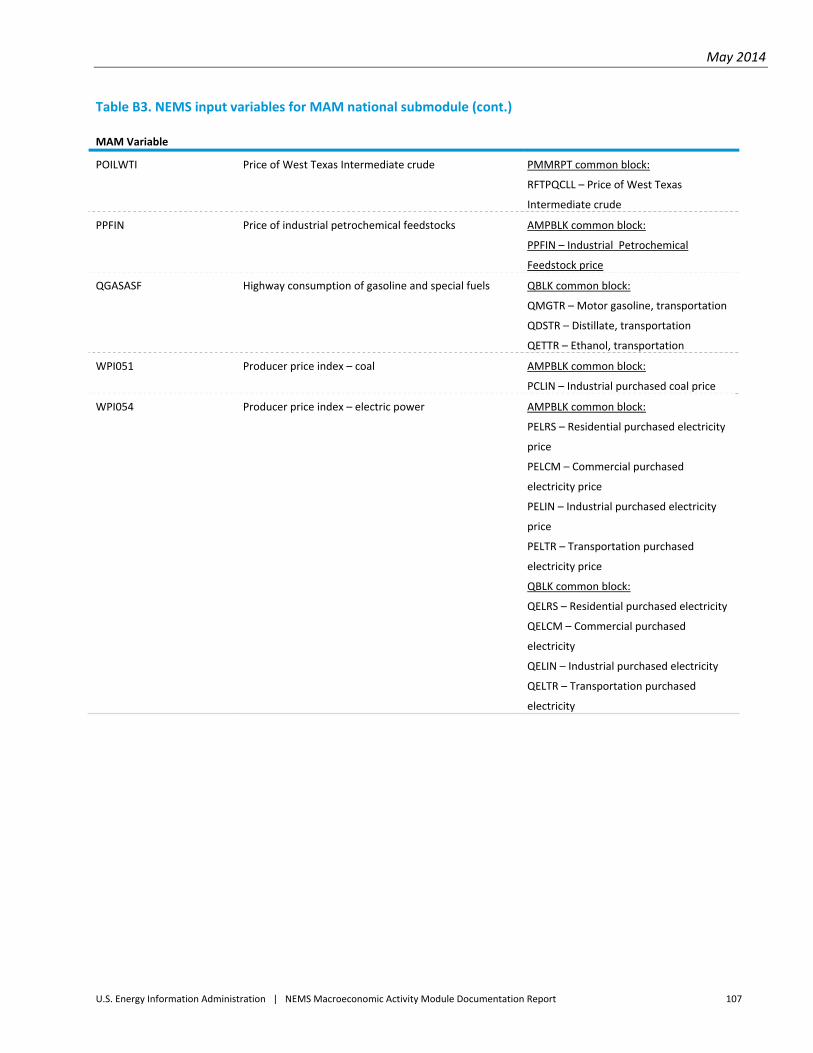
May 2014
U.S. Energy Information Administration | NEMS Macroeconomic Activity Module Documentation Report 107
Table B3. NEMS input variables for MAM national submodule (cont.)
MAM Variable
POILWTI Price of West Texas Intermediate crude PMMRPT common block:
RFTPQCLL – Price of West Texas
Intermediate crude
PPFIN Price of industrial petrochemical feedstocks AMPBLK common block:
PPFIN – Industrial Petrochemical
Feedstock price
QGASASF Highway consumption of gasoline and special fuels QBLK common block:
QMGTR – Motor gasoline, transportation
QDSTR – Distillate, transportation
QETTR – Ethanol, transportation
WPI051 Producer price index – coal AMPBLK common block:
PCLIN – Industrial purchased coal price
WPI054 Producer price index – electric power AMPBLK common block:
PELRS – Residential purchased electricity
price
PELCM – Commercial purchased
electricity price
PELIN – Industrial purchased electricity
price
PELTR – Transportation purchased
electricity price
QBLK common block:
QELRS – Residential purchased electricity
QELCM – Commercial purchased
electricity
QELIN – Industrial purchased electricity
QELTR – Transportation purchased
electricity
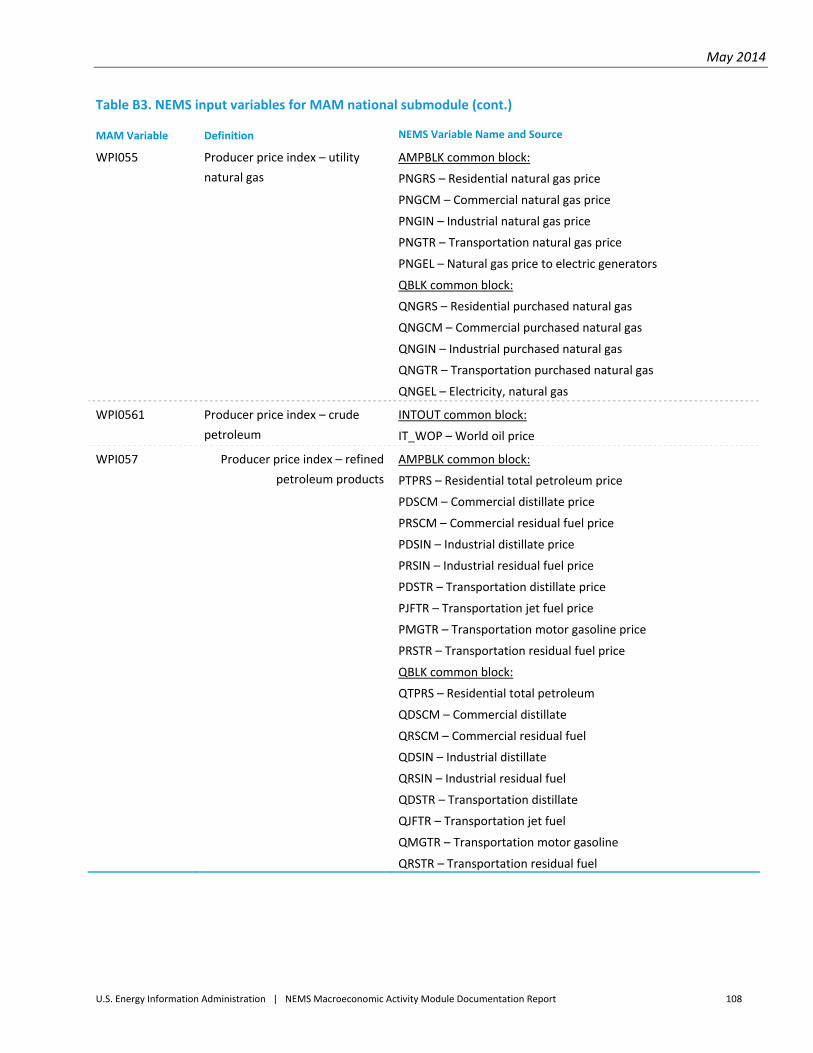
May 2014
U.S. Energy Information Administration | NEMS Macroeconomic Activity Module Documentation Report 108
Table B3. NEMS input variables for MAM national submodule (cont.)
MAM Variable Definition NEMS Variable Name and Source
WPI055 Producer price index – utility
natural gas
AMPBLK common block:
PNGRS – Residential natural gas price
PNGCM – Commercial natural gas price
PNGIN – Industrial natural gas price
PNGTR – Transportation natural gas price
PNGEL – Natural gas price to electric generators
QBLK common block:
QNGRS – Residential purchased natural gas
QNGCM – Commercial purchased natural gas
QNGIN – Industrial purchased natural gas
QNGTR – Transportation purchased natural gas
QNGEL – Electricity, natural gas
WPI0561 Producer price index – crude
petroleum
INTOUT common block:
IT_WOP – World oil price
WPI057 Producer price index – refined
petroleum products
AMPBLK common block:
PTPRS – Residential total petroleum price
PDSCM – Commercial distillate price
PRSCM – Commercial residual fuel price
PDSIN – Industrial distillate price
PRSIN – Industrial residual fuel price
PDSTR – Transportation distillate price
PJFTR – Transportation jet fuel price
PMGTR – Transportation motor gasoline price
PRSTR – Transportation residual fuel price
QBLK common block:
QTPRS – Residential total petroleum
QDSCM – Commercial distillate
QRSCM – Commercial residual fuel
QDSIN – Industrial distillate
QRSIN – Industrial residual fuel
QDSTR – Transportation distillate
QJFTR – Transportation jet fuel
QMGTR – Transportation motor gasoline
QRSTR – Transportation residual fuel
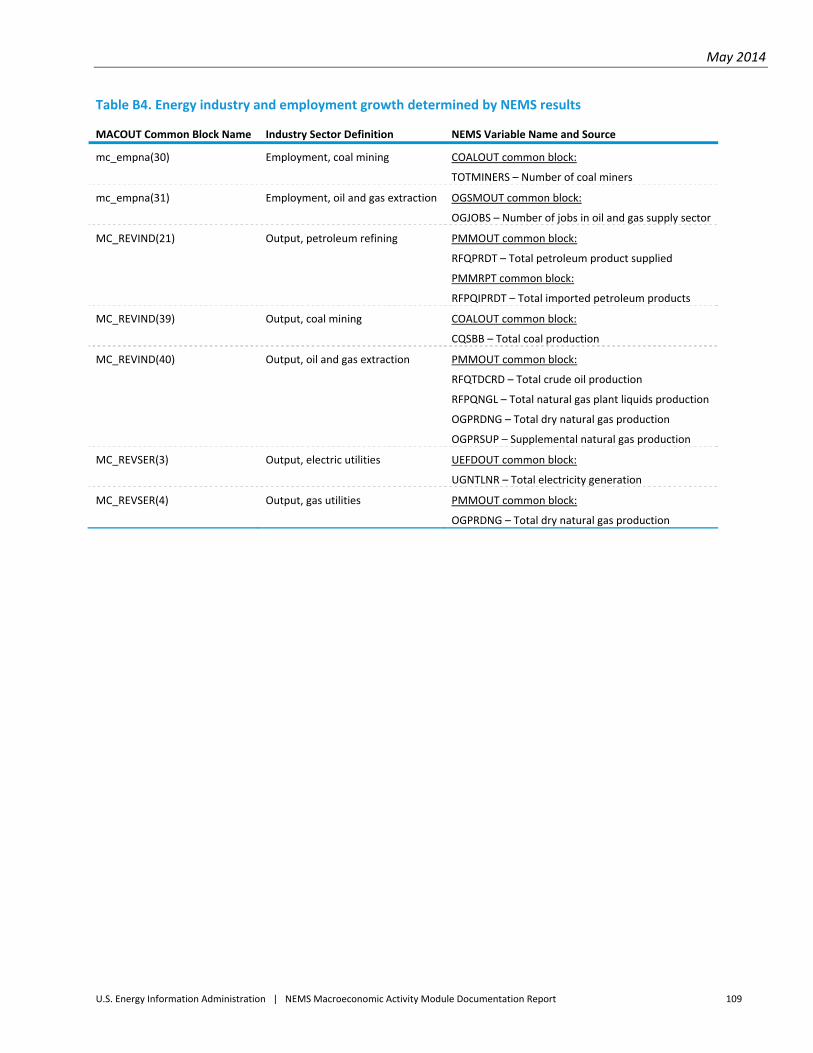
May 2014
U.S. Energy Information Administration | NEMS Macroeconomic Activity Module Documentation Report 109
Table B4. Energy industry and employment growth determined by NEMS results
MACOUT Common Block Name Industry Sector Definition NEMS Variable Name and Source
mc_empna(30) Employment, coal mining COALOUT common block:
TOTMINERS – Number of coal miners
mc_empna(31) Employment, oil and gas extraction OGSMOUT common block:
OGJOBS – Number of jobs in oil and gas supply sector
MC_REVIND(21) Output, petroleum refining PMMOUT common block:
RFQPRDT – Total petroleum product supplied
PMMRPT common block:
RFPQIPRDT – Total imported petroleum products
MC_REVIND(39) Output, coal mining COALOUT common block:
CQSBB – Total coal production
MC_REVIND(40) Output, oil and gas extraction PMMOUT common block:
RFQTDCRD – Total crude oil production
RFPQNGL – Total natural gas plant liquids production
OGPRDNG – Total dry natural gas production
OGPRSUP – Supplemental natural gas production
MC_REVSER(3) Output, electric utilities UEFDOUT common block:
UGNTLNR – Total electricity generation
MC_REVSER(4) Output, gas utilities PMMOUT common block:
OGPRDNG – Total dry natural gas production
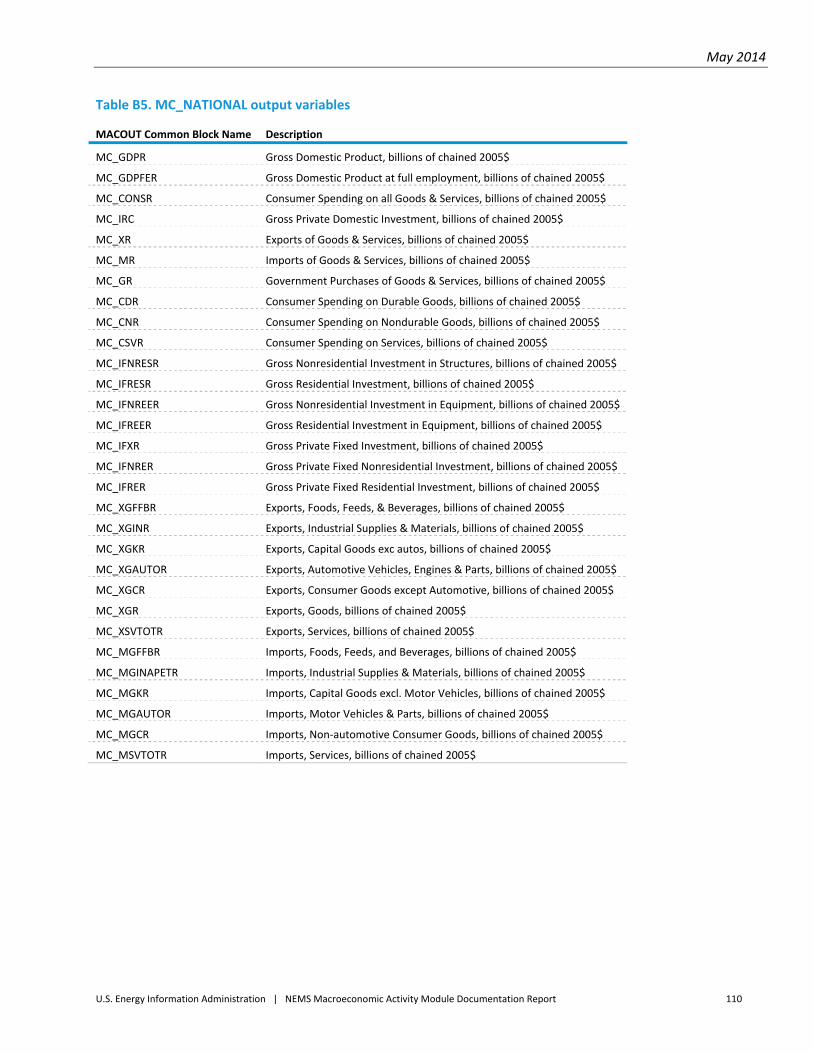
May 2014
U.S. Energy Information Administration | NEMS Macroeconomic Activity Module Documentation Report 110
Table B5. MC_NATIONAL output variables
MACOUT Common Block Name Description
MC_GDPR Gross Domestic Product, billions of chained 2005$
MC_GDPFER Gross Domestic Product at full employment, billions of chained 2005$
MC_CONSR Consumer Spending on all Goods & Services, billions of chained 2005$
MC_IRC Gross Private Domestic Investment, billions of chained 2005$
MC_XR Exports of Goods & Services, billions of chained 2005$
MC_MR Imports of Goods & Services, billions of chained 2005$
MC_GR Government Purchases of Goods & Services, billions of chained 2005$
MC_CDR Consumer Spending on Durable Goods, billions of chained 2005$
MC_CNR Consumer Spending on Nondurable Goods, billions of chained 2005$
MC_CSVR Consumer Spending on Services, billions of chained 2005$
MC_IFNRESR Gross Nonresidential Investment in Structures, billions of chained 2005$
MC_IFRESR Gross Residential Investment, billions of chained 2005$
MC_IFNREER Gross Nonresidential Investment in Equipment, billions of chained 2005$
MC_IFREER Gross Residential Investment in Equipment, billions of chained 2005$
MC_IFXR Gross Private Fixed Investment, billions of chained 2005$
MC_IFNRER Gross Private Fixed Nonresidential Investment, billions of chained 2005$
MC_IFRER Gross Private Fixed Residential Investment, billions of chained 2005$
MC_XGFFBR Exports, Foods, Feeds, & Beverages, billions of chained 2005$
MC_XGINR Exports, Industrial Supplies & Materials, billions of chained 2005$
MC_XGKR Exports, Capital Goods exc autos, billions of chained 2005$
MC_XGAUTOR Exports, Automotive Vehicles, Engines & Parts, billions of chained 2005$
MC_XGCR Exports, Consumer Goods except Automotive, billions of chained 2005$
MC_XGR Exports, Goods, billions of chained 2005$
MC_XSVTOTR Exports, Services, billions of chained 2005$
MC_MGFFBR Imports, Foods, Feeds, and Beverages, billions of chained 2005$
MC_MGINAPETR Imports, Industrial Supplies & Materials, billions of chained 2005$
MC_MGKR Imports, Capital Goods excl. Motor Vehicles, billions of chained 2005$
MC_MGAUTOR Imports, Motor Vehicles & Parts, billions of chained 2005$
MC_MGCR Imports, Non‐automotive Consumer Goods, billions of chained 2005$
MC_MSVTOTR Imports, Services, billions of chained 2005$
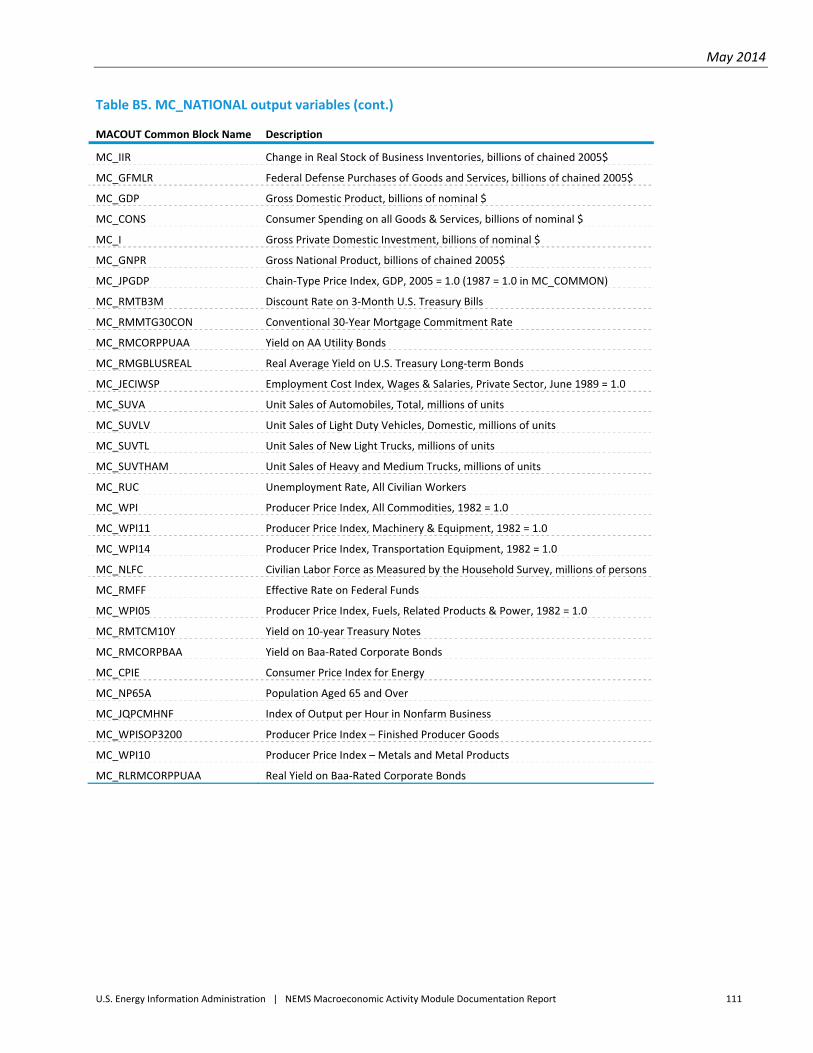
May 2014
U.S. Energy Information Administration | NEMS Macroeconomic Activity Module Documentation Report 111
Table B5. MC_NATIONAL output variables (cont.)
MACOUT Common Block Name Description
MC_IIR Change in Real Stock of Business Inventories, billions of chained 2005$
MC_GFMLR Federal Defense Purchases of Goods and Services, billions of chained 2005$
MC_GDP Gross Domestic Product, billions of nominal $
MC_CONS Consumer Spending on all Goods & Services, billions of nominal $
MC_I Gross Private Domestic Investment, billions of nominal $
MC_GNPR Gross National Product, billions of chained 2005$
MC_JPGDP Chain‐Type Price Index, GDP, 2005 = 1.0 (1987 = 1.0 in MC_COMMON)
MC_RMTB3M Discount Rate on 3‐Month U.S. Treasury Bills
MC_RMMTG30CON Conventional 30‐Year Mortgage Commitment Rate
MC_RMCORPPUAA Yield on AA Utility Bonds
MC_RMGBLUSREAL Real Average Yield on U.S. Treasury Long‐term Bonds
MC_JECIWSP Employment Cost Index, Wages & Salaries, Private Sector, June 1989 = 1.0
MC_SUVA Unit Sales of Automobiles, Total, millions of units
MC_SUVLV Unit Sales of Light Duty Vehicles, Domestic, millions of units
MC_SUVTL Unit Sales of New Light Trucks, millions of units
MC_SUVTHAM Unit Sales of Heavy and Medium Trucks, millions of units
MC_RUC Unemployment Rate, All Civilian Workers
MC_WPI Producer Price Index, All Commodities, 1982 = 1.0
MC_WPI11 Producer Price Index, Machinery & Equipment, 1982 = 1.0
MC_WPI14 Producer Price Index, Transportation Equipment, 1982 = 1.0
MC_NLFC Civilian Labor Force as Measured by the Household Survey, millions of persons
MC_RMFF Effective Rate on Federal Funds
MC_WPI05 Producer Price Index, Fuels, Related Products & Power, 1982 = 1.0
MC_RMTCM10Y Yield on 10‐year Treasury Notes
MC_RMCORPBAA Yield on Baa‐Rated Corporate Bonds
MC_CPIE Consumer Price Index for Energy
MC_NP65A Population Aged 65 and Over
MC_JQPCMHNF Index of Output per Hour in Nonfarm Business
MC_WPISOP3200 Producer Price Index – Finished Producer Goods
MC_WPI10 Producer Price Index – Metals and Metal Products
MC_RLRMCORPPUAA Real Yield on Baa‐Rated Corporate Bonds
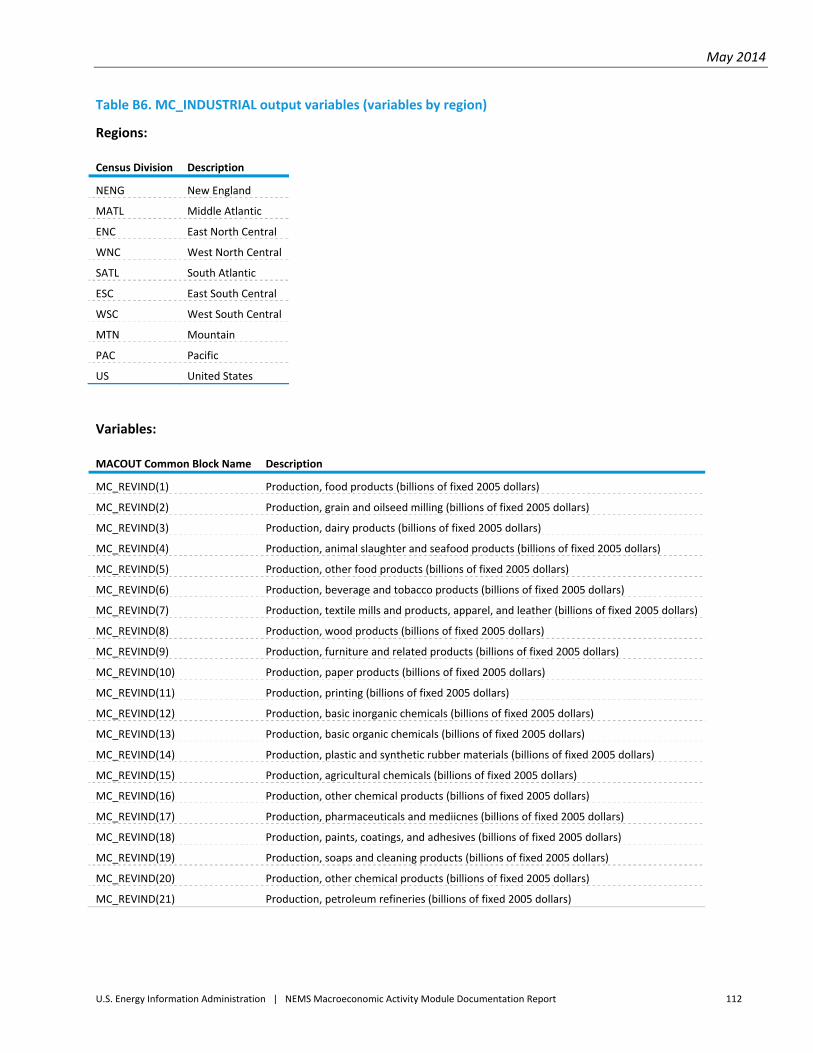
May 2014
U.S. Energy Information Administration | NEMS Macroeconomic Activity Module Documentation Report 112
Table B6. MC_INDUSTRIAL output variables (variables by region)
Regions:
Census Division Description
NENG New England
MATL Middle Atlantic
ENC East North Central
WNC West North Central
SATL South Atlantic
ESC East South Central
WSC West South Central
MTN Mountain
PAC Pacific
US United States
Variables:
MACOUT Common Block Name Description
MC_REVIND(1) Production, food products (billions of fixed 2005 dollars)
MC_REVIND(2) Production, grain and oilseed milling (billions of fixed 2005 dollars)
MC_REVIND(3) Production, dairy products (billions of fixed 2005 dollars)
MC_REVIND(4) Production, animal slaughter and seafood products (billions of fixed 2005 dollars)
MC_REVIND(5) Production, other food products (billions of fixed 2005 dollars)
MC_REVIND(6) Production, beverage and tobacco products (billions of fixed 2005 dollars)
MC_REVIND(7) Production, textile mills and products, apparel, and leather (billions of fixed 2005 dollars)
MC_REVIND(8) Production, wood products (billions of fixed 2005 dollars)
MC_REVIND(9) Production, furniture and related products (billions of fixed 2005 dollars)
MC_REVIND(10) Production, paper products (billions of fixed 2005 dollars)
MC_REVIND(11) Production, printing (billions of fixed 2005 dollars)
MC_REVIND(12) Production, basic inorganic chemicals (billions of fixed 2005 dollars)
MC_REVIND(13) Production, basic organic chemicals (billions of fixed 2005 dollars)
MC_REVIND(14) Production, plastic and synthetic rubber materials (billions of fixed 2005 dollars)
MC_REVIND(15) Production, agricultural chemicals (billions of fixed 2005 dollars)
MC_REVIND(16) Production, other chemical products (billions of fixed 2005 dollars)
MC_REVIND(17) Production, pharmaceuticals and mediicnes (billions of fixed 2005 dollars)
MC_REVIND(18) Production, paints, coatings, and adhesives (billions of fixed 2005 dollars)
MC_REVIND(19) Production, soaps and cleaning products (billions of fixed 2005 dollars)
MC_REVIND(20) Production, other chemical products (billions of fixed 2005 dollars)
MC_REVIND(21) Production, petroleum refineries (billions of fixed 2005 dollars)
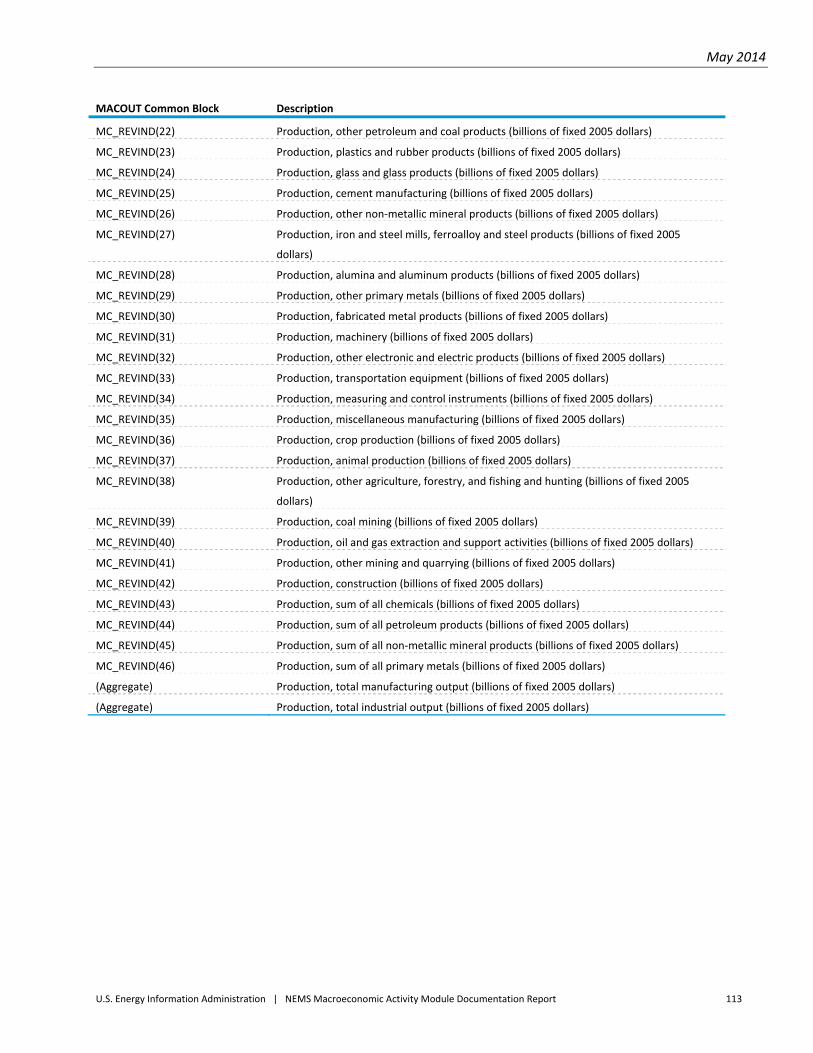
May 2014
U.S. Energy Information Administration | NEMS Macroeconomic Activity Module Documentation Report 113
MACOUT Common Block Description
MC_REVIND(22) Production, other petroleum and coal products (billions of fixed 2005 dollars)
MC_REVIND(23) Production, plastics and rubber products (billions of fixed 2005 dollars)
MC_REVIND(24) Production, glass and glass products (billions of fixed 2005 dollars)
MC_REVIND(25) Production, cement manufacturing (billions of fixed 2005 dollars)
MC_REVIND(26) Production, other non‐metallic mineral products (billions of fixed 2005 dollars)
MC_REVIND(27) Production, iron and steel mills, ferroalloy and steel products (billions of fixed 2005
dollars)
MC_REVIND(28) Production, alumina and aluminum products (billions of fixed 2005 dollars)
MC_REVIND(29) Production, other primary metals (billions of fixed 2005 dollars)
MC_REVIND(30) Production, fabricated metal products (billions of fixed 2005 dollars)
MC_REVIND(31) Production, machinery (billions of fixed 2005 dollars)
MC_REVIND(32) Production, other electronic and electric products (billions of fixed 2005 dollars)
MC_REVIND(33) Production, transportation equipment (billions of fixed 2005 dollars)
MC_REVIND(34) Production, measuring and control instruments (billions of fixed 2005 dollars)
MC_REVIND(35) Production, miscellaneous manufacturing (billions of fixed 2005 dollars)
MC_REVIND(36) Production, crop production (billions of fixed 2005 dollars)
MC_REVIND(37) Production, animal production (billions of fixed 2005 dollars)
MC_REVIND(38) Production, other agriculture, forestry, and fishing and hunting (billions of fixed 2005
dollars)
MC_REVIND(39) Production, coal mining (billions of fixed 2005 dollars)
MC_REVIND(40) Production, oil and gas extraction and support activities (billions of fixed 2005 dollars)
MC_REVIND(41) Production, other mining and quarrying (billions of fixed 2005 dollars)
MC_REVIND(42) Production, construction (billions of fixed 2005 dollars)
MC_REVIND(43) Production, sum of all chemicals (billions of fixed 2005 dollars)
MC_REVIND(44) Production, sum of all petroleum products (billions of fixed 2005 dollars)
MC_REVIND(45) Production, sum of all non‐metallic mineral products (billions of fixed 2005 dollars)
MC_REVIND(46) Production, sum of all primary metals (billions of fixed 2005 dollars)
(Aggregate) Production, total manufacturing output (billions of fixed 2005 dollars)
(Aggregate) Production, total industrial output (billions of fixed 2005 dollars)
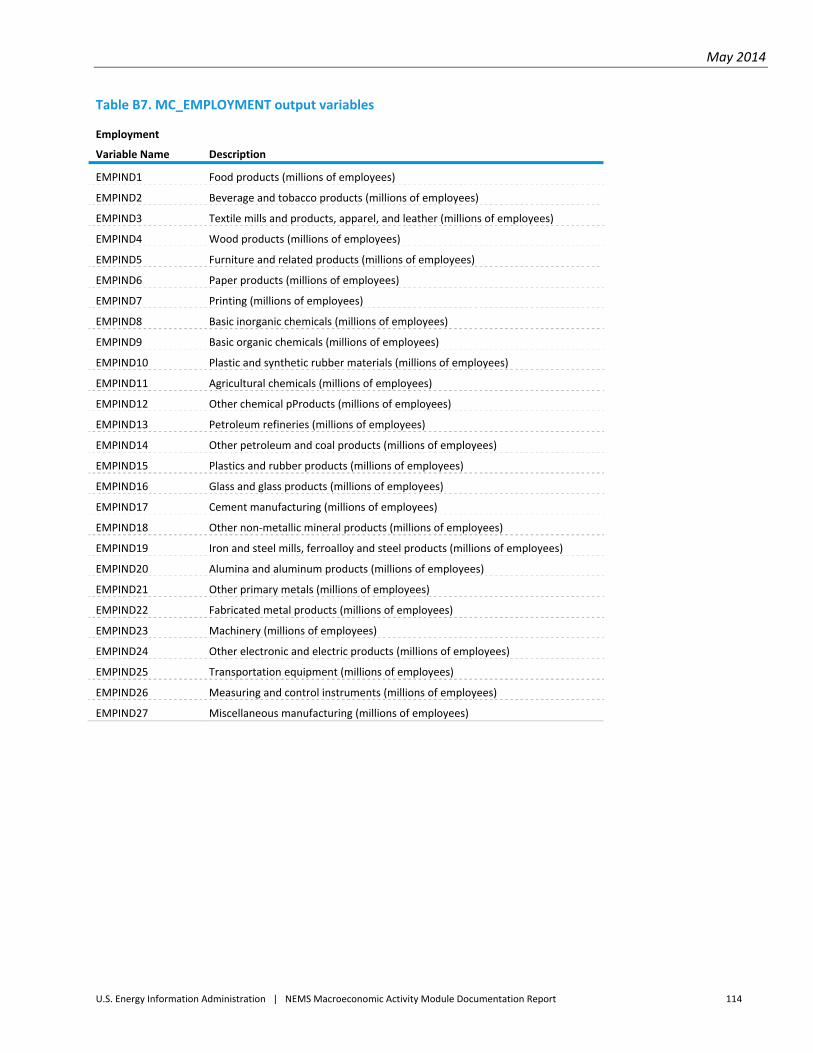
May 2014
U.S. Energy Information Administration | NEMS Macroeconomic Activity Module Documentation Report 114
Table B7. MC_EMPLOYMENT output variables
Employment
Variable Name Description
EMPIND1 Food products (millions of employees)
EMPIND2 Beverage and tobacco products (millions of employees)
EMPIND3 Textile mills and products, apparel, and leather (millions of employees)
EMPIND4 Wood products (millions of employees)
EMPIND5 Furniture and related products (millions of employees)
EMPIND6 Paper products (millions of employees)
EMPIND7 Printing (millions of employees)
EMPIND8 Basic inorganic chemicals (millions of employees)
EMPIND9 Basic organic chemicals (millions of employees)
EMPIND10 Plastic and synthetic rubber materials (millions of employees)
EMPIND11 Agricultural chemicals (millions of employees)
EMPIND12 Other chemical pProducts (millions of employees)
EMPIND13 Petroleum refineries (millions of employees)
EMPIND14 Other petroleum and coal products (millions of employees)
EMPIND15 Plastics and rubber products (millions of employees)
EMPIND16 Glass and glass products (millions of employees)
EMPIND17 Cement manufacturing (millions of employees)
EMPIND18 Other non‐metallic mineral products (millions of employees)
EMPIND19 Iron and steel mills, ferroalloy and steel products (millions of employees)
EMPIND20 Alumina and aluminum products (millions of employees)
EMPIND21 Other primary metals (millions of employees)
EMPIND22 Fabricated metal products (millions of employees)
EMPIND23 Machinery (millions of employees)
EMPIND24 Other electronic and electric products (millions of employees)
EMPIND25 Transportation equipment (millions of employees)
EMPIND26 Measuring and control instruments (millions of employees)
EMPIND27 Miscellaneous manufacturing (millions of employees)
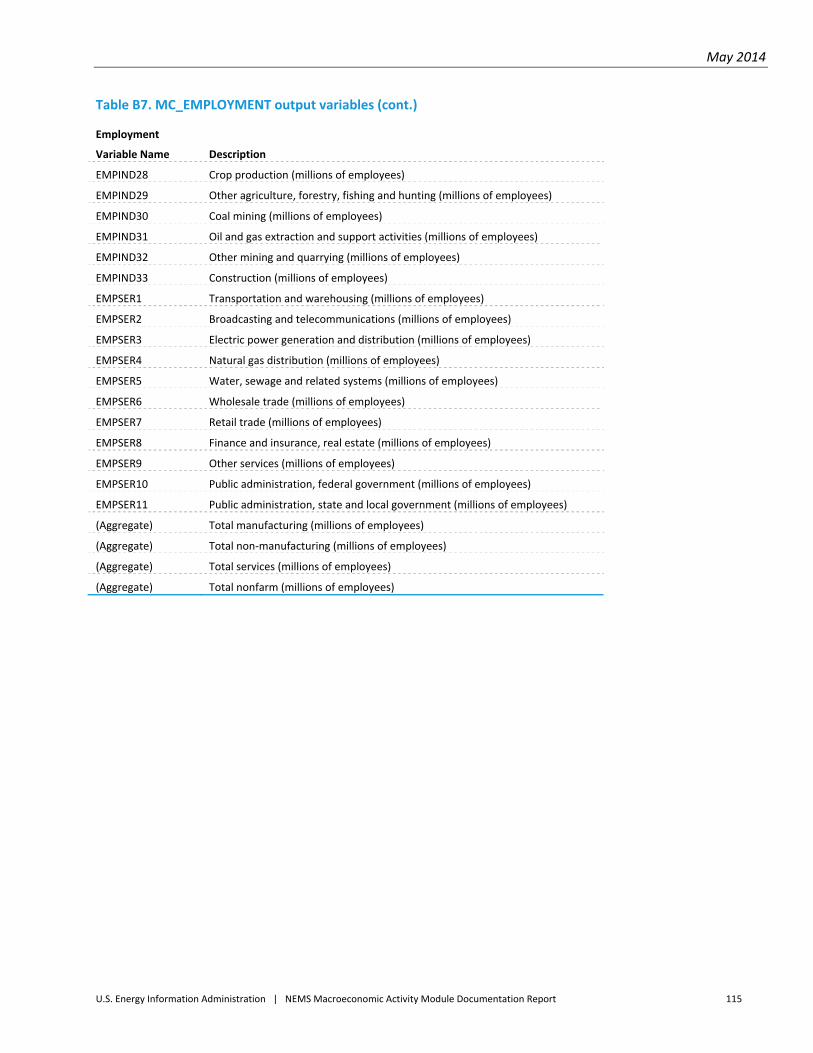
May 2014
U.S. Energy Information Administration | NEMS Macroeconomic Activity Module Documentation Report 115
Table B7. MC_EMPLOYMENT output variables (cont.)
Employment
Variable Name Description
EMPIND28 Crop production (millions of employees)
EMPIND29 Other agriculture, forestry, fishing and hunting (millions of employees)
EMPIND30 Coal mining (millions of employees)
EMPIND31 Oil and gas extraction and support activities (millions of employees)
EMPIND32 Other mining and quarrying (millions of employees)
EMPIND33 Construction (millions of employees)
EMPSER1 Transportation and warehousing (millions of employees)
EMPSER2 Broadcasting and telecommunications (millions of employees)
EMPSER3 Electric power generation and distribution (millions of employees)
EMPSER4 Natural gas distribution (millions of employees)
EMPSER5 Water, sewage and related systems (millions of employees)
EMPSER6 Wholesale trade (millions of employees)
EMPSER7 Retail trade (millions of employees)
EMPSER8 Finance and insurance, real estate (millions of employees)
EMPSER9 Other services (millions of employees)
EMPSER10 Public administration, federal government (millions of employees)
EMPSER11 Public administration, state and local government (millions of employees)
(Aggregate) Total manufacturing (millions of employees)
(Aggregate) Total non‐manufacturing (millions of employees)
(Aggregate) Total services (millions of employees)
(Aggregate) Total nonfarm (millions of employees)
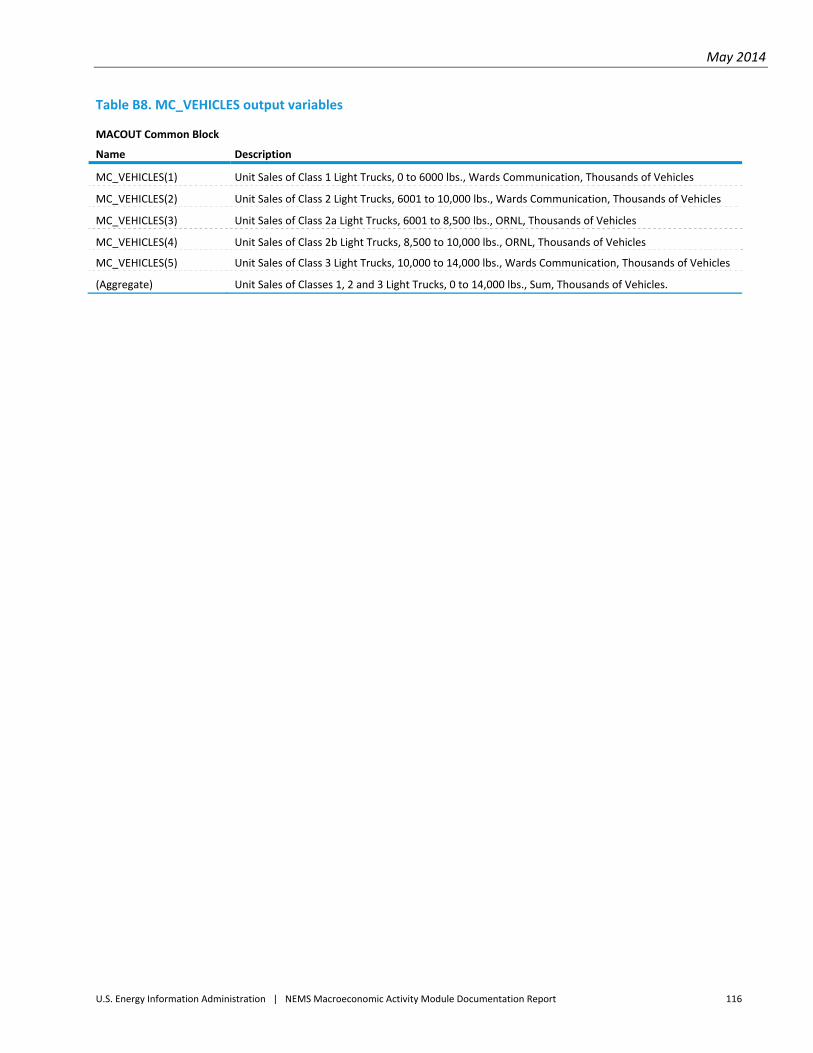
May 2014
U.S. Energy Information Administration | NEMS Macroeconomic Activity Module Documentation Report 116
Table B8. MC_VEHICLES output variables
MACOUT Common Block
Name Description
MC_VEHICLES(1) Unit Sales of Class 1 Light Trucks, 0 to 6000 lbs., Wards Communication, Thousands of Vehicles
MC_VEHICLES(2) Unit Sales of Class 2 Light Trucks, 6001 to 10,000 lbs., Wards Communication, Thousands of Vehicles
MC_VEHICLES(3) Unit Sales of Class 2a Light Trucks, 6001 to 8,500 lbs., ORNL, Thousands of Vehicles
MC_VEHICLES(4) Unit Sales of Class 2b Light Trucks, 8,500 to 10,000 lbs., ORNL, Thousands of Vehicles
MC_VEHICLES(5) Unit Sales of Class 3 Light Trucks, 10,000 to 14,000 lbs., Wards Communication, Thousands of Vehicles
(Aggregate) Unit Sales of Classes 1, 2 and 3 Light Trucks, 0 to 14,000 lbs., Sum, Thousands of Vehicles.
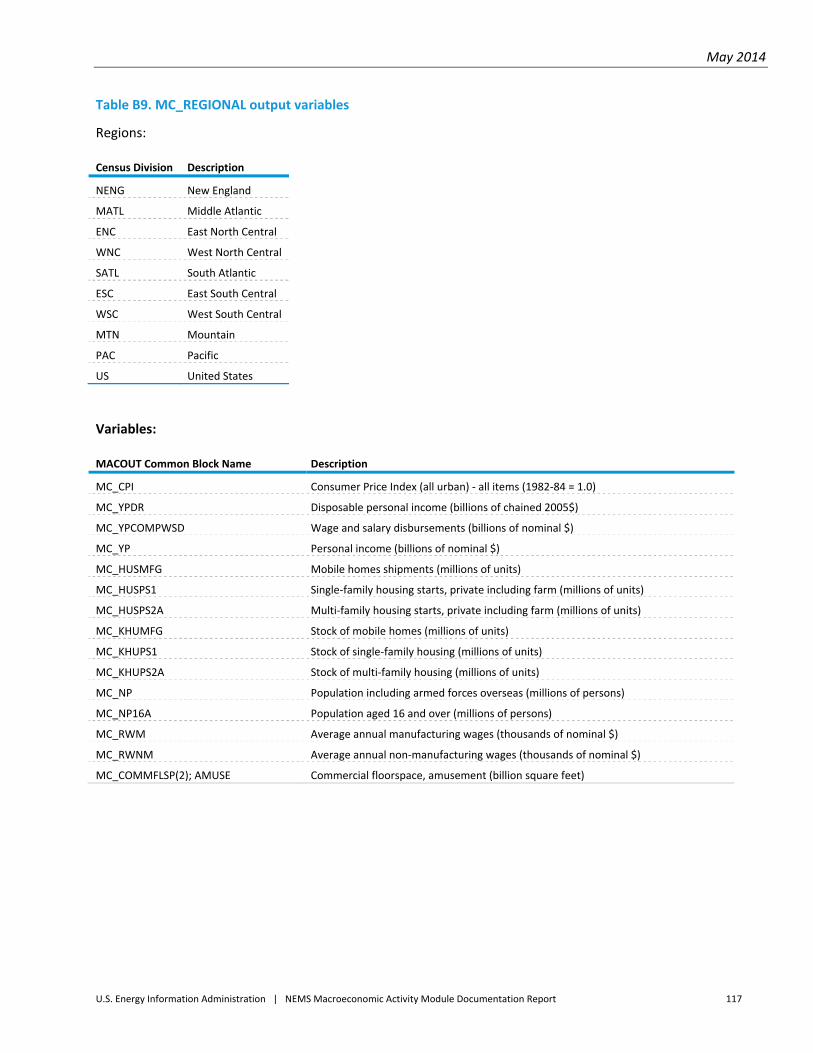
May 2014
U.S. Energy Information Administration | NEMS Macroeconomic Activity Module Documentation Report 117
Table B9. MC_REGIONAL output variables
Regions:
Census Division Description
NENG New England
MATL Middle Atlantic
ENC East North Central
WNC West North Central
SATL South Atlantic
ESC East South Central
WSC West South Central
MTN Mountain
PAC Pacific
US United States
Variables:
MACOUT Common Block Name Description
MC_CPI Consumer Price Index (all urban) ‐ all items (1982‐84 = 1.0)
MC_YPDR Disposable personal income (billions of chained 2005$)
MC_YPCOMPWSD Wage and salary disbursements (billions of nominal $)
MC_YP Personal income (billions of nominal $)
MC_HUSMFG Mobile homes shipments (millions of units)
MC_HUSPS1 Single‐family housing starts, private including farm (millions of units)
MC_HUSPS2A Multi‐family housing starts, private including farm (millions of units)
MC_KHUMFG Stock of mobile homes (millions of units)
MC_KHUPS1 Stock of single‐family housing (millions of units)
MC_KHUPS2A Stock of multi‐family housing (millions of units)
MC_NP Population including armed forces overseas (millions of persons)
MC_NP16A Population aged 16 and over (millions of persons)
MC_RWM Average annual manufacturing wages (thousands of nominal $)
MC_RWNM Average annual non‐manufacturing wages (thousands of nominal $)
MC_COMMFLSP(2); AMUSE Commercial floorspace, amusement (billion square feet)
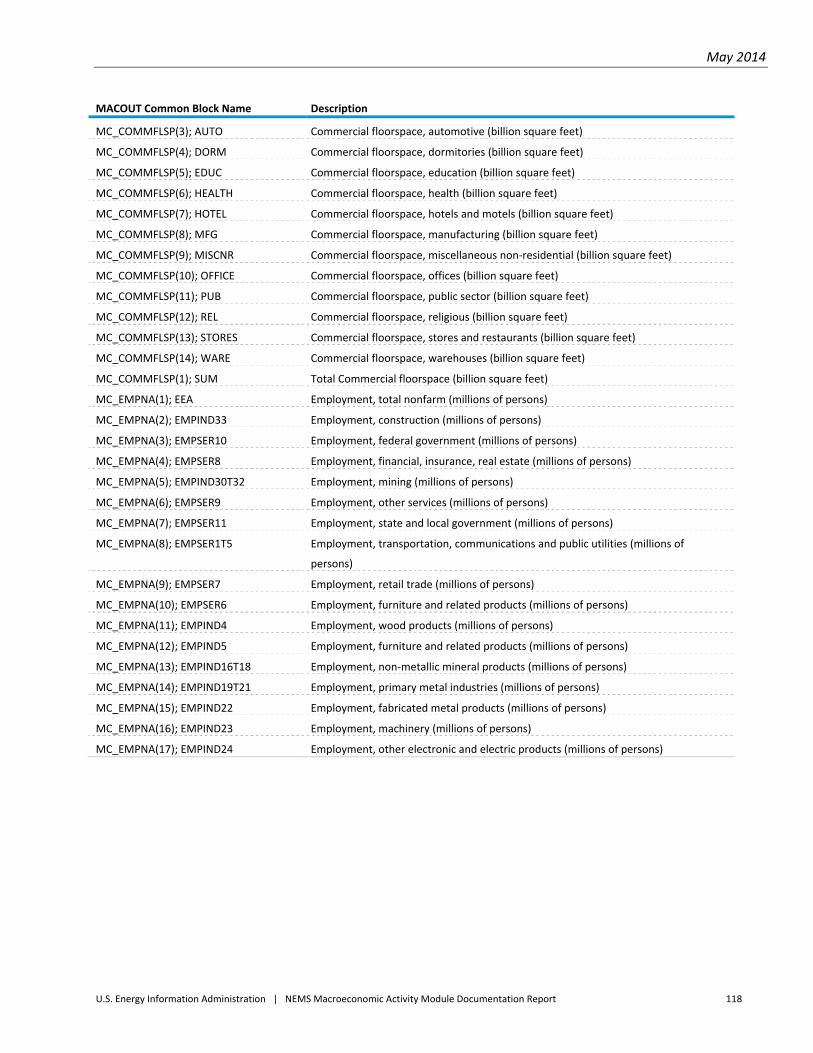
May 2014
U.S. Energy Information Administration | NEMS Macroeconomic Activity Module Documentation Report 118
MACOUT Common Block Name Description
MC_COMMFLSP(3); AUTO Commercial floorspace, automotive (billion square feet)
MC_COMMFLSP(4); DORM Commercial floorspace, dormitories (billion square feet)
MC_COMMFLSP(5); EDUC Commercial floorspace, education (billion square feet)
MC_COMMFLSP(6); HEALTH Commercial floorspace, health (billion square feet)
MC_COMMFLSP(7); HOTEL Commercial floorspace, hotels and motels (billion square feet)
MC_COMMFLSP(8); MFG Commercial floorspace, manufacturing (billion square feet)
MC_COMMFLSP(9); MISCNR Commercial floorspace, miscellaneous non‐residential (billion square feet)
MC_COMMFLSP(10); OFFICE Commercial floorspace, offices (billion square feet)
MC_COMMFLSP(11); PUB Commercial floorspace, public sector (billion square feet)
MC_COMMFLSP(12); REL Commercial floorspace, religious (billion square feet)
MC_COMMFLSP(13); STORES Commercial floorspace, stores and restaurants (billion square feet)
MC_COMMFLSP(14); WARE Commercial floorspace, warehouses (billion square feet)
MC_COMMFLSP(1); SUM Total Commercial floorspace (billion square feet)
MC_EMPNA(1); EEA Employment, total nonfarm (millions of persons)
MC_EMPNA(2); EMPIND33 Employment, construction (millions of persons)
MC_EMPNA(3); EMPSER10 Employment, federal government (millions of persons)
MC_EMPNA(4); EMPSER8 Employment, financial, insurance, real estate (millions of persons)
MC_EMPNA(5); EMPIND30T32 Employment, mining (millions of persons)
MC_EMPNA(6); EMPSER9 Employment, other services (millions of persons)
MC_EMPNA(7); EMPSER11 Employment, state and local government (millions of persons)
MC_EMPNA(8); EMPSER1T5 Employment, transportation, communications and public utilities (millions of
persons)
MC_EMPNA(9); EMPSER7 Employment, retail trade (millions of persons)
MC_EMPNA(10); EMPSER6 Employment, furniture and related products (millions of persons)
MC_EMPNA(11); EMPIND4 Employment, wood products (millions of persons)
MC_EMPNA(12); EMPIND5 Employment, furniture and related products (millions of persons)
MC_EMPNA(13); EMPIND16T18 Employment, non‐metallic mineral products (millions of persons)
MC_EMPNA(14); EMPIND19T21 Employment, primary metal industries (millions of persons)
MC_EMPNA(15); EMPIND22 Employment, fabricated metal products (millions of persons)
MC_EMPNA(16); EMPIND23 Employment, machinery (millions of persons)
MC_EMPNA(17); EMPIND24 Employment, other electronic and electric products (millions of persons)
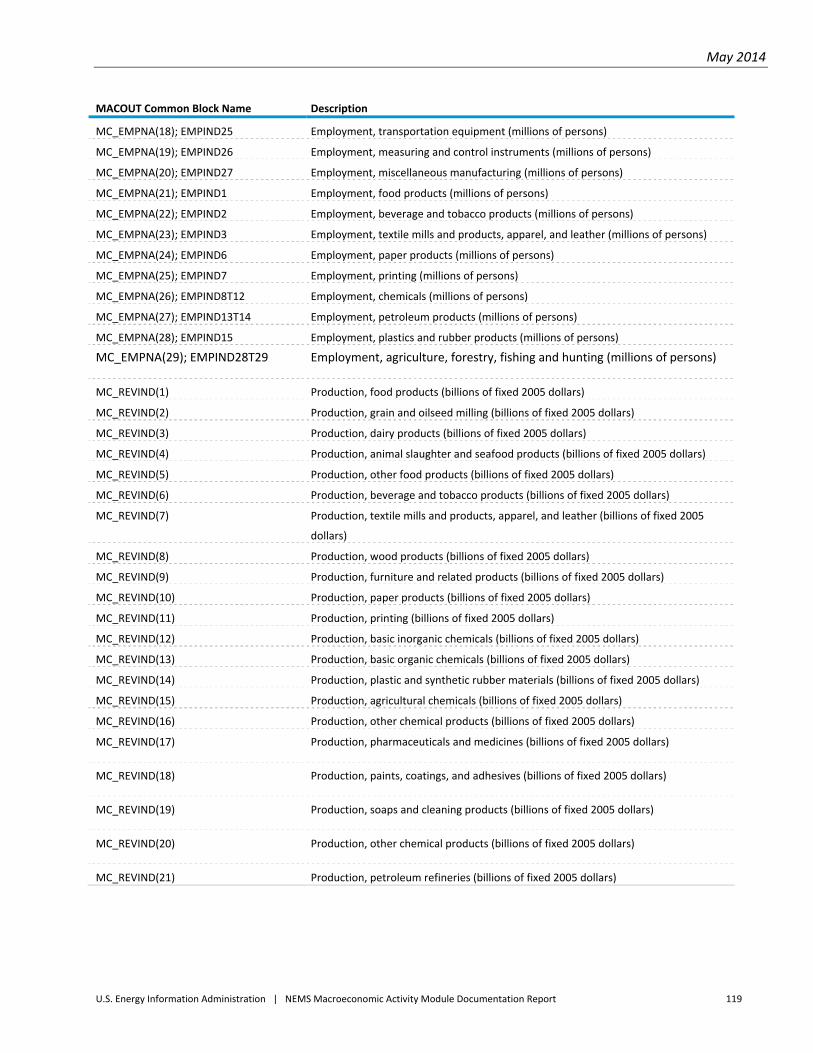
May 2014
U.S. Energy Information Administration | NEMS Macroeconomic Activity Module Documentation Report 119
MACOUT Common Block Name Description
MC_EMPNA(18); EMPIND25 Employment, transportation equipment (millions of persons)
MC_EMPNA(19); EMPIND26 Employment, measuring and control instruments (millions of persons)
MC_EMPNA(20); EMPIND27 Employment, miscellaneous manufacturing (millions of persons)
MC_EMPNA(21); EMPIND1 Employment, food products (millions of persons)
MC_EMPNA(22); EMPIND2 Employment, beverage and tobacco products (millions of persons)
MC_EMPNA(23); EMPIND3 Employment, textile mills and products, apparel, and leather (millions of persons)
MC_EMPNA(24); EMPIND6 Employment, paper products (millions of persons)
MC_EMPNA(25); EMPIND7 Employment, printing (millions of persons)
MC_EMPNA(26); EMPIND8T12 Employment, chemicals (millions of persons)
MC_EMPNA(27); EMPIND13T14 Employment, petroleum products (millions of persons)
MC_EMPNA(28); EMPIND15 Employment, plastics and rubber products (millions of persons)
MC_EMPNA(29); EMPIND28T29 Employment, agriculture, forestry, fishing and hunting (millions of persons)
MC_REVIND(1) Production, food products (billions of fixed 2005 dollars)
MC_REVIND(2) Production, grain and oilseed milling (billions of fixed 2005 dollars)
MC_REVIND(3) Production, dairy products (billions of fixed 2005 dollars)
MC_REVIND(4) Production, animal slaughter and seafood products (billions of fixed 2005 dollars)
MC_REVIND(5) Production, other food products (billions of fixed 2005 dollars)
MC_REVIND(6) Production, beverage and tobacco products (billions of fixed 2005 dollars)
MC_REVIND(7) Production, textile mills and products, apparel, and leather (billions of fixed 2005
dollars)
MC_REVIND(8) Production, wood products (billions of fixed 2005 dollars)
MC_REVIND(9) Production, furniture and related products (billions of fixed 2005 dollars)
MC_REVIND(10) Production, paper products (billions of fixed 2005 dollars)
MC_REVIND(11) Production, printing (billions of fixed 2005 dollars)
MC_REVIND(12) Production, basic inorganic chemicals (billions of fixed 2005 dollars)
MC_REVIND(13) Production, basic organic chemicals (billions of fixed 2005 dollars)
MC_REVIND(14) Production, plastic and synthetic rubber materials (billions of fixed 2005 dollars)
MC_REVIND(15) Production, agricultural chemicals (billions of fixed 2005 dollars)
MC_REVIND(16) Production, other chemical products (billions of fixed 2005 dollars)
MC_REVIND(17) Production, pharmaceuticals and medicines (billions of fixed 2005 dollars)
MC_REVIND(18) Production, paints, coatings, and adhesives (billions of fixed 2005 dollars)
MC_REVIND(19) Production, soaps and cleaning products (billions of fixed 2005 dollars)
MC_REVIND(20) Production, other chemical products (billions of fixed 2005 dollars)
MC_REVIND(21) Production, petroleum refineries (billions of fixed 2005 dollars)
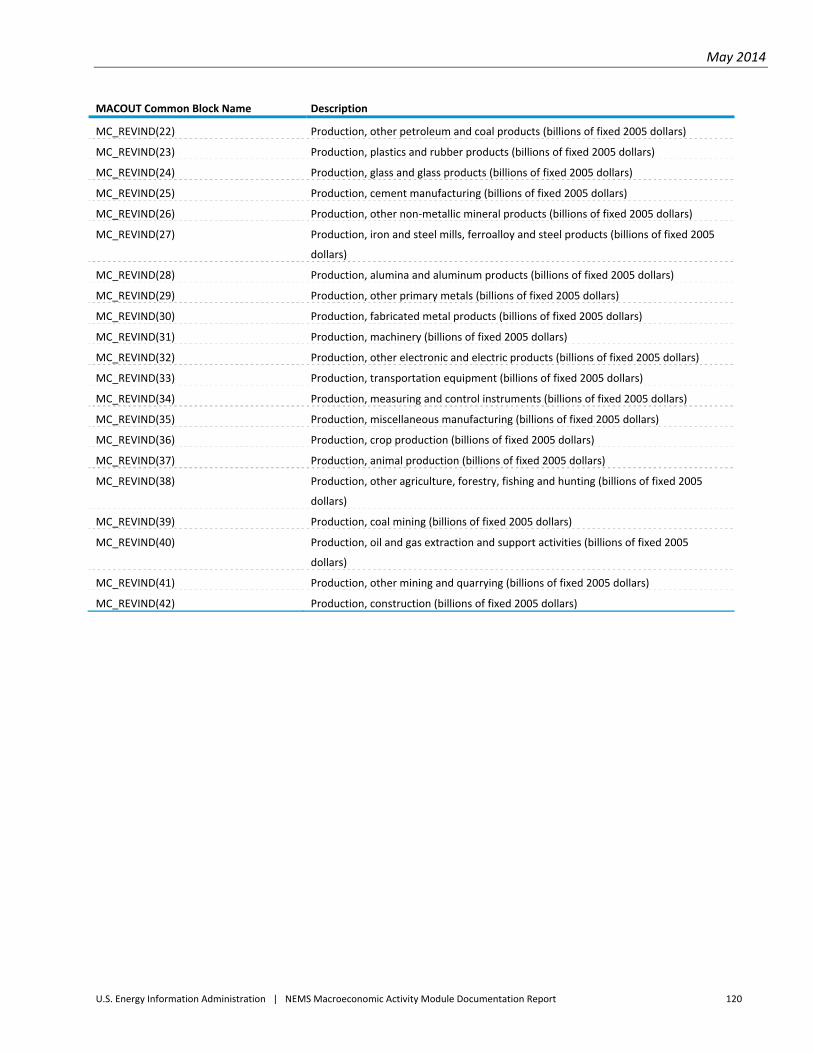
May 2014
U.S. Energy Information Administration | NEMS Macroeconomic Activity Module Documentation Report 120
MACOUT Common Block Name Description
MC_REVIND(22) Production, other petroleum and coal products (billions of fixed 2005 dollars)
MC_REVIND(23) Production, plastics and rubber products (billions of fixed 2005 dollars)
MC_REVIND(24) Production, glass and glass products (billions of fixed 2005 dollars)
MC_REVIND(25) Production, cement manufacturing (billions of fixed 2005 dollars)
MC_REVIND(26) Production, other non‐metallic mineral products (billions of fixed 2005 dollars)
MC_REVIND(27) Production, iron and steel mills, ferroalloy and steel products (billions of fixed 2005
dollars)
MC_REVIND(28) Production, alumina and aluminum products (billions of fixed 2005 dollars)
MC_REVIND(29) Production, other primary metals (billions of fixed 2005 dollars)
MC_REVIND(30) Production, fabricated metal products (billions of fixed 2005 dollars)
MC_REVIND(31) Production, machinery (billions of fixed 2005 dollars)
MC_REVIND(32) Production, other electronic and electric products (billions of fixed 2005 dollars)
MC_REVIND(33) Production, transportation equipment (billions of fixed 2005 dollars)
MC_REVIND(34) Production, measuring and control instruments (billions of fixed 2005 dollars)
MC_REVIND(35) Production, miscellaneous manufacturing (billions of fixed 2005 dollars)
MC_REVIND(36) Production, crop production (billions of fixed 2005 dollars)
MC_REVIND(37) Production, animal production (billions of fixed 2005 dollars)
MC_REVIND(38) Production, other agriculture, forestry, fishing and hunting (billions of fixed 2005
dollars)
MC_REVIND(39) Production, coal mining (billions of fixed 2005 dollars)
MC_REVIND(40) Production, oil and gas extraction and support activities (billions of fixed 2005
dollars)
MC_REVIND(41) Production, other mining and quarrying (billions of fixed 2005 dollars)
MC_REVIND(42) Production, construction (billions of fixed 2005 dollars)
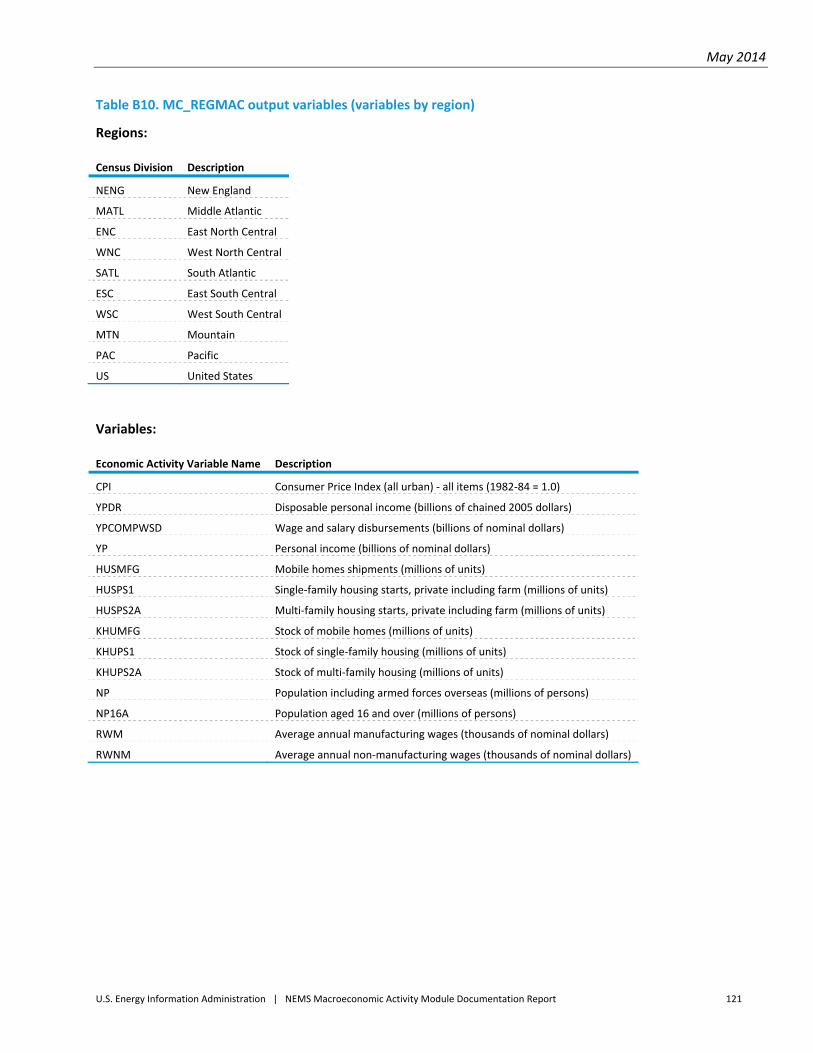
May 2014
U.S. Energy Information Administration | NEMS Macroeconomic Activity Module Documentation Report 121
Table B10. MC_REGMAC output variables (variables by region)
Regions:
Census Division Description
NENG New England
MATL Middle Atlantic
ENC East North Central
WNC West North Central
SATL South Atlantic
ESC East South Central
WSC West South Central
MTN Mountain
PAC Pacific
US United States
Variables:
Economic Activity Variable Name Description
CPI Consumer Price Index (all urban) ‐ all items (1982‐84 = 1.0)
YPDR Disposable personal income (billions of chained 2005 dollars)
YPCOMPWSD Wage and salary disbursements (billions of nominal dollars)
YP Personal income (billions of nominal dollars)
HUSMFG Mobile homes shipments (millions of units)
HUSPS1 Single‐family housing starts, private including farm (millions of units)
HUSPS2A Multi‐family housing starts, private including farm (millions of units)
KHUMFG Stock of mobile homes (millions of units)
KHUPS1 Stock of single‐family housing (millions of units)
KHUPS2A Stock of multi‐family housing (millions of units)
NP Population including armed forces overseas (millions of persons)
NP16A Population aged 16 and over (millions of persons)
RWM Average annual manufacturing wages (thousands of nominal dollars)
RWNM Average annual non‐manufacturing wages (thousands of nominal dollars)
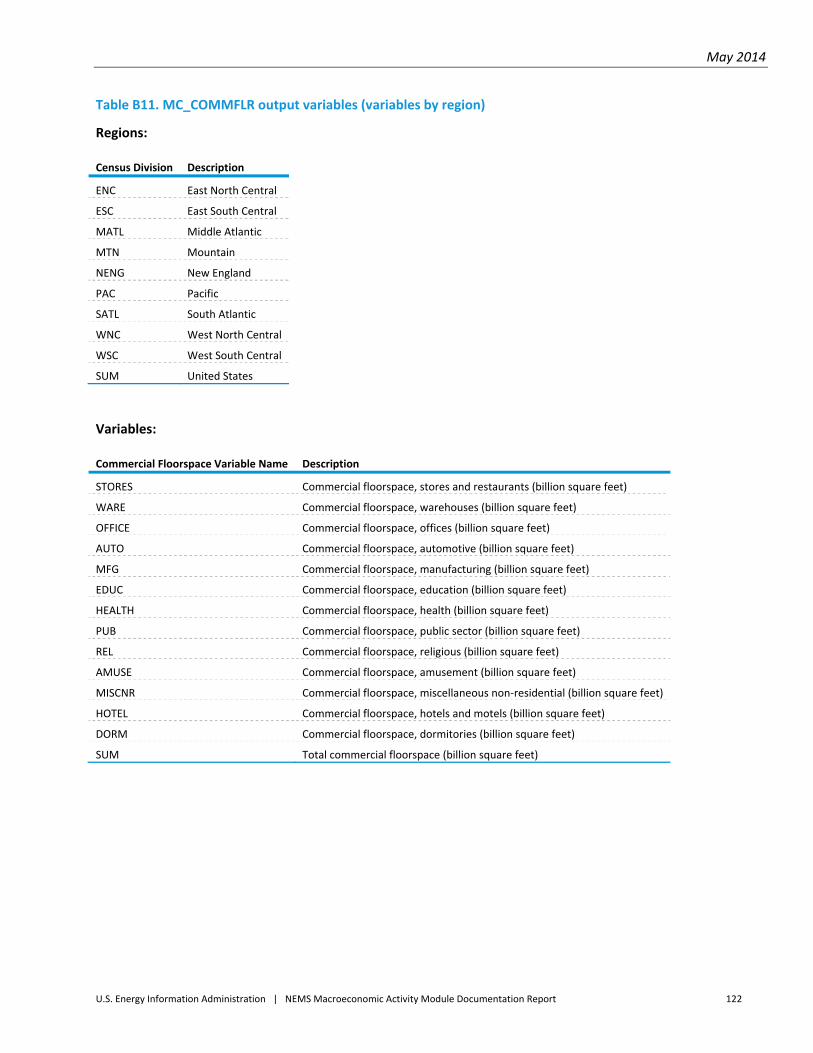
May 2014
U.S. Energy Information Administration | NEMS Macroeconomic Activity Module Documentation Report 122
Table B11. MC_COMMFLR output variables (variables by region)
Regions:
Census Division Description
ENC East North Central
ESC East South Central
MATL Middle Atlantic
MTN Mountain
NENG New England
PAC Pacific
SATL South Atlantic
WNC West North Central
WSC West South Central
SUM United States
Variables:
Commercial Floorspace Variable Name Description
STORES Commercial floorspace, stores and restaurants (billion square feet)
WARE Commercial floorspace, warehouses (billion square feet)
OFFICE Commercial floorspace, offices (billion square feet)
AUTO Commercial floorspace, automotive (billion square feet)
MFG Commercial floorspace, manufacturing (billion square feet)
EDUC Commercial floorspace, education (billion square feet)
HEALTH Commercial floorspace, health (billion square feet)
PUB Commercial floorspace, public sector (billion square feet)
REL Commercial floorspace, religious (billion square feet)
AMUSE Commercial floorspace, amusement (billion square feet)
MISCNR Commercial floorspace, miscellaneous non‐residential (billion square feet)
HOTEL Commercial floorspace, hotels and motels (billion square feet)
DORM Commercial floorspace, dormitories (billion square feet)
SUM Total commercial floorspace (billion square feet)
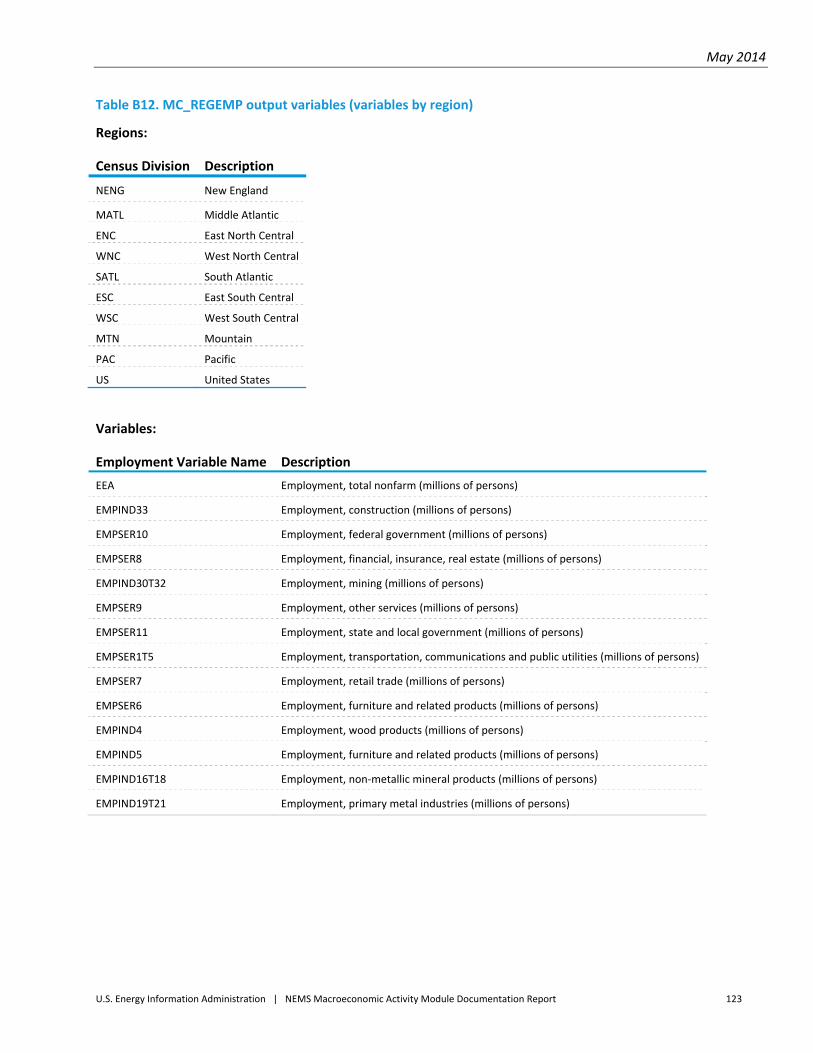
May 2014
U.S. Energy Information Administration | NEMS Macroeconomic Activity Module Documentation Report 123
Table B12. MC_REGEMP output variables (variables by region)
Regions:
Census Division Description
NENG New England
MATL Middle Atlantic
ENC East North Central
WNC West North Central
SATL South Atlantic
ESC East South Central
WSC West South Central
MTN Mountain
PAC Pacific
US United States
Variables:
Employment Variable Name Description
EEA Employment, total nonfarm (millions of persons)
EMPIND33 Employment, construction (millions of persons)
EMPSER10 Employment, federal government (millions of persons)
EMPSER8 Employment, financial, insurance, real estate (millions of persons)
EMPIND30T32 Employment, mining (millions of persons)
EMPSER9 Employment, other services (millions of persons)
EMPSER11 Employment, state and local government (millions of persons)
EMPSER1T5 Employment, transportation, communications and public utilities (millions of persons)
EMPSER7 Employment, retail trade (millions of persons)
EMPSER6 Employment, furniture and related products (millions of persons)
EMPIND4 Employment, wood products (millions of persons)
EMPIND5 Employment, furniture and related products (millions of persons)
EMPIND16T18 Employment, non‐metallic mineral products (millions of persons)
EMPIND19T21 Employment, primary metal industries (millions of persons)
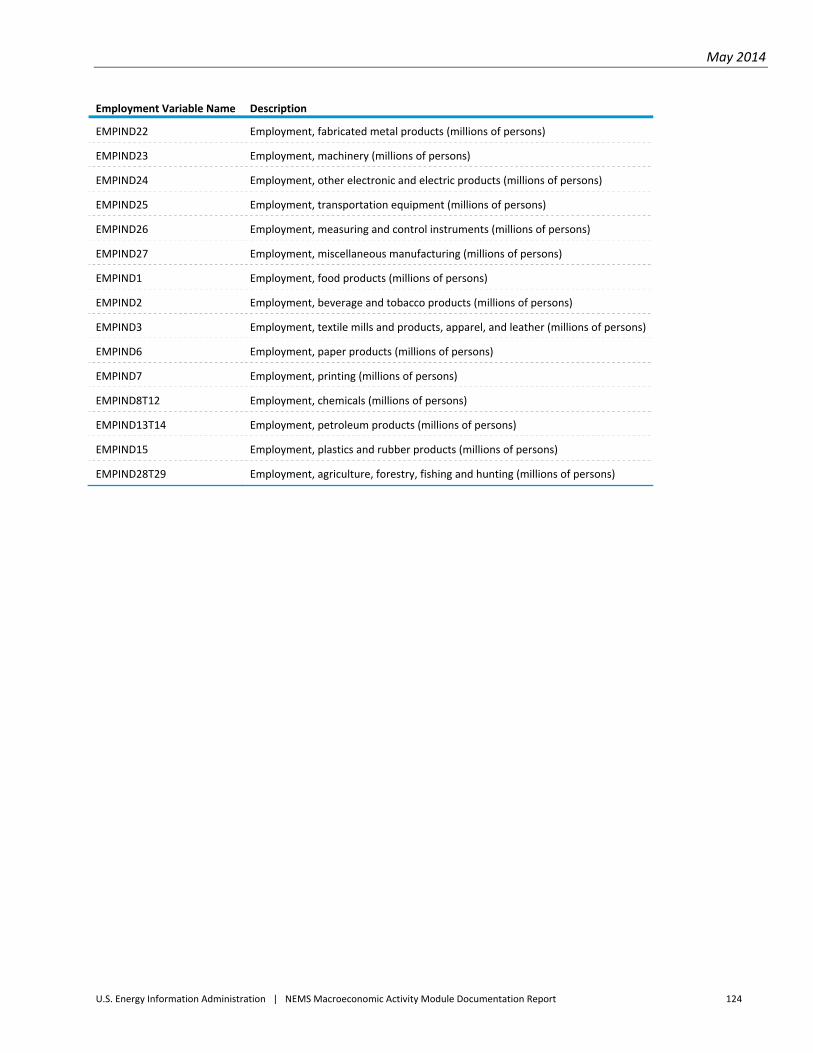
May 2014
U.S. Energy Information Administration | NEMS Macroeconomic Activity Module Documentation Report 124
Employment Variable Name Description
EMPIND22 Employment, fabricated metal products (millions of persons)
EMPIND23 Employment, machinery (millions of persons)
EMPIND24 Employment, other electronic and electric products (millions of persons)
EMPIND25 Employment, transportation equipment (millions of persons)
EMPIND26 Employment, measuring and control instruments (millions of persons)
EMPIND27 Employment, miscellaneous manufacturing (millions of persons)
EMPIND1 Employment, food products (millions of persons)
EMPIND2 Employment, beverage and tobacco products (millions of persons)
EMPIND3 Employment, textile mills and products, apparel, and leather (millions of persons)
EMPIND6 Employment, paper products (millions of persons)
EMPIND7 Employment, printing (millions of persons)
EMPIND8T12 Employment, chemicals (millions of persons)
EMPIND13T14 Employment, petroleum products (millions of persons)
EMPIND15 Employment, plastics and rubber products (millions of persons)
EMPIND28T29 Employment, agriculture, forestry, fishing and hunting (millions of persons)
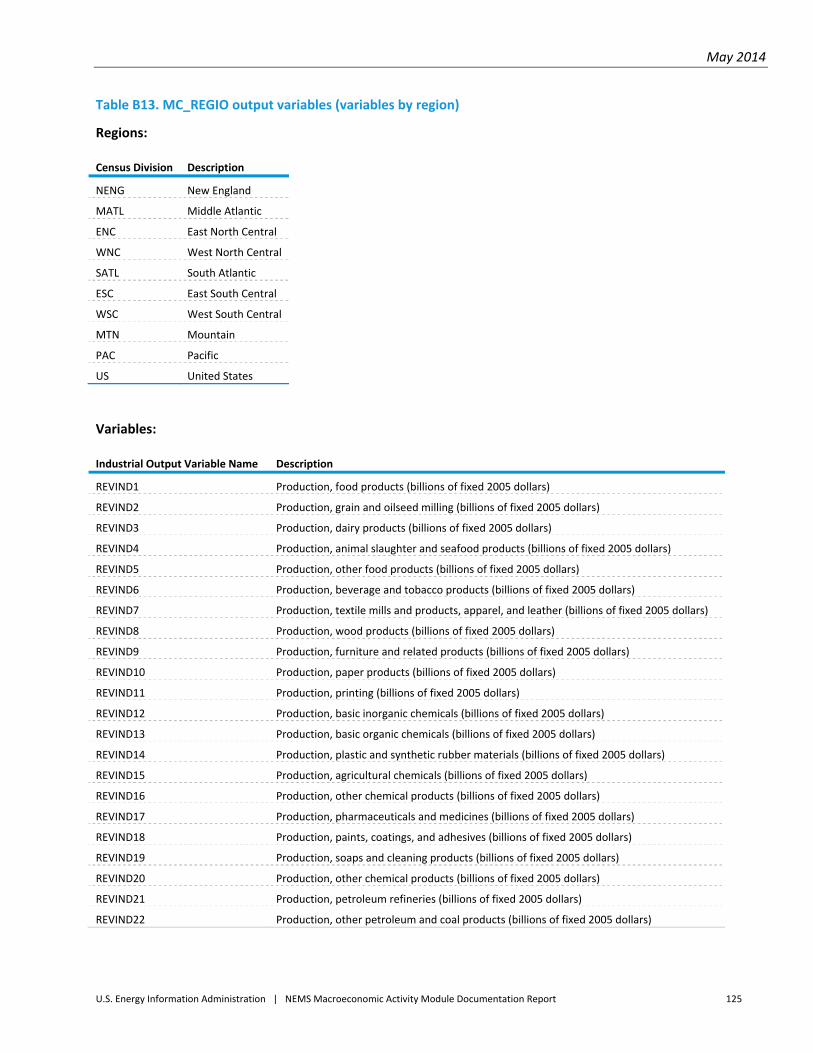
May 2014
U.S. Energy Information Administration | NEMS Macroeconomic Activity Module Documentation Report 125
Table B13. MC_REGIO output variables (variables by region)
Regions:
Census Division Description
NENG New England
MATL Middle Atlantic
ENC East North Central
WNC West North Central
SATL South Atlantic
ESC East South Central
WSC West South Central
MTN Mountain
PAC Pacific
US United States
Variables:
Industrial Output Variable Name Description
REVIND1 Production, food products (billions of fixed 2005 dollars)
REVIND2 Production, grain and oilseed milling (billions of fixed 2005 dollars)
REVIND3 Production, dairy products (billions of fixed 2005 dollars)
REVIND4 Production, animal slaughter and seafood products (billions of fixed 2005 dollars)
REVIND5 Production, other food products (billions of fixed 2005 dollars)
REVIND6 Production, beverage and tobacco products (billions of fixed 2005 dollars)
REVIND7 Production, textile mills and products, apparel, and leather (billions of fixed 2005 dollars)
REVIND8 Production, wood products (billions of fixed 2005 dollars)
REVIND9 Production, furniture and related products (billions of fixed 2005 dollars)
REVIND10 Production, paper products (billions of fixed 2005 dollars)
REVIND11 Production, printing (billions of fixed 2005 dollars)
REVIND12 Production, basic inorganic chemicals (billions of fixed 2005 dollars)
REVIND13 Production, basic organic chemicals (billions of fixed 2005 dollars)
REVIND14 Production, plastic and synthetic rubber materials (billions of fixed 2005 dollars)
REVIND15 Production, agricultural chemicals (billions of fixed 2005 dollars)
REVIND16 Production, other chemical products (billions of fixed 2005 dollars)
REVIND17 Production, pharmaceuticals and medicines (billions of fixed 2005 dollars)
REVIND18 Production, paints, coatings, and adhesives (billions of fixed 2005 dollars)
REVIND19 Production, soaps and cleaning products (billions of fixed 2005 dollars)
REVIND20 Production, other chemical products (billions of fixed 2005 dollars)
REVIND21 Production, petroleum refineries (billions of fixed 2005 dollars)
REVIND22 Production, other petroleum and coal products (billions of fixed 2005 dollars)
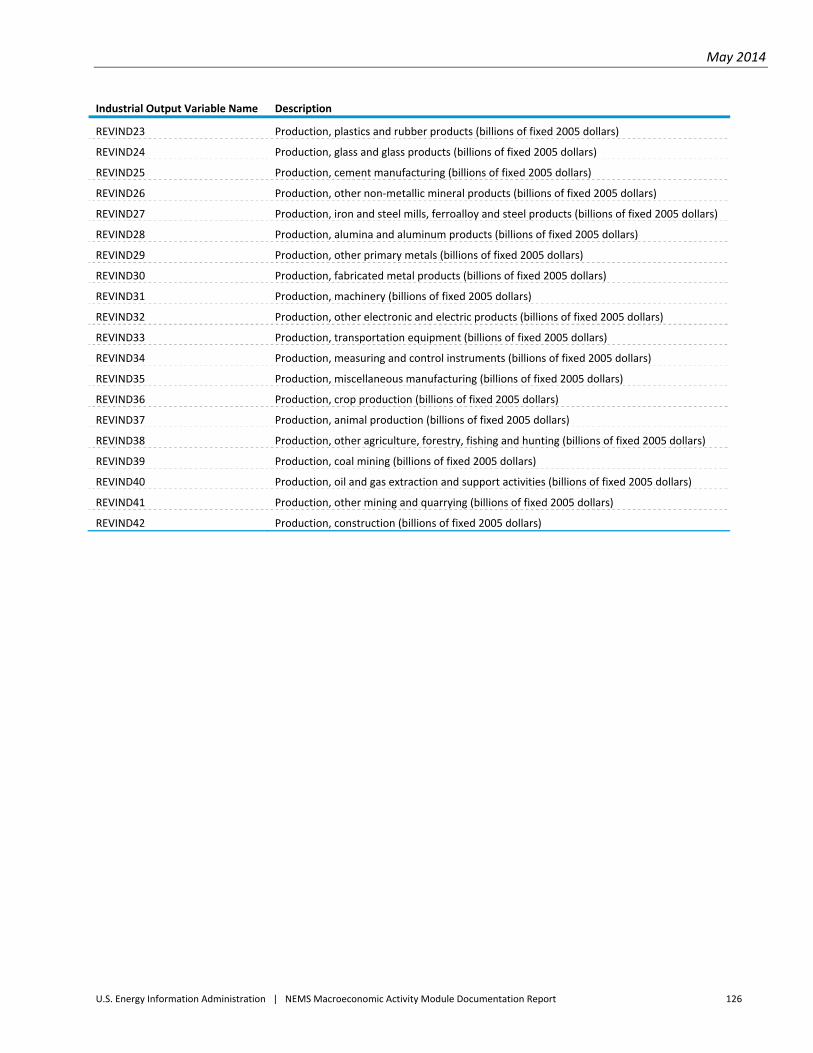
May 2014
U.S. Energy Information Administration | NEMS Macroeconomic Activity Module Documentation Report 126
Industrial Output Variable Name Description
REVIND23 Production, plastics and rubber products (billions of fixed 2005 dollars)
REVIND24 Production, glass and glass products (billions of fixed 2005 dollars)
REVIND25 Production, cement manufacturing (billions of fixed 2005 dollars)
REVIND26 Production, other non‐metallic mineral products (billions of fixed 2005 dollars)
REVIND27 Production, iron and steel mills, ferroalloy and steel products (billions of fixed 2005 dollars)
REVIND28 Production, alumina and aluminum products (billions of fixed 2005 dollars)
REVIND29 Production, other primary metals (billions of fixed 2005 dollars)
REVIND30 Production, fabricated metal products (billions of fixed 2005 dollars)
REVIND31 Production, machinery (billions of fixed 2005 dollars)
REVIND32 Production, other electronic and electric products (billions of fixed 2005 dollars)
REVIND33 Production, transportation equipment (billions of fixed 2005 dollars)
REVIND34 Production, measuring and control instruments (billions of fixed 2005 dollars)
REVIND35 Production, miscellaneous manufacturing (billions of fixed 2005 dollars)
REVIND36 Production, crop production (billions of fixed 2005 dollars)
REVIND37 Production, animal production (billions of fixed 2005 dollars)
REVIND38 Production, other agriculture, forestry, fishing and hunting (billions of fixed 2005 dollars)
REVIND39 Production, coal mining (billions of fixed 2005 dollars)
REVIND40 Production, oil and gas extraction and support activities (billions of fixed 2005 dollars)
REVIND41 Production, other mining and quarrying (billions of fixed 2005 dollars)
REVIND42 Production, construction (billions of fixed 2005 dollars)
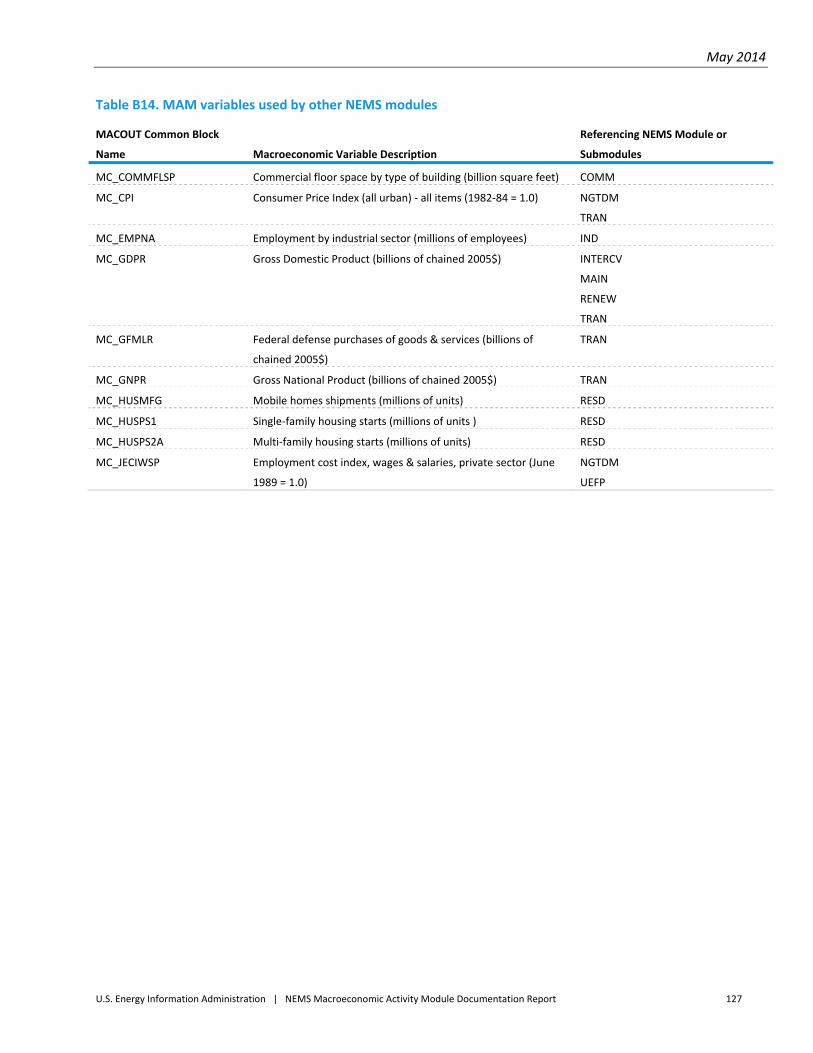
May 2014
U.S. Energy Information Administration | NEMS Macroeconomic Activity Module Documentation Report 127
Table B14. MAM variables used by other NEMS modules
MACOUT Common Block
Name Macroeconomic Variable Description
Referencing NEMS Module or
Submodules
MC_COMMFLSP Commercial floor space by type of building (billion square feet) COMM
MC_CPI Consumer Price Index (all urban) ‐ all items (1982‐84 = 1.0) NGTDM
TRAN
MC_EMPNA Employment by industrial sector (millions of employees) IND
MC_GDPR Gross Domestic Product (billions of chained 2005$) INTERCV
MAIN
RENEW
TRAN
MC_GFMLR Federal defense purchases of goods & services (billions of
chained 2005$)
TRAN
MC_GNPR Gross National Product (billions of chained 2005$) TRAN
MC_HUSMFG Mobile homes shipments (millions of units) RESD
MC_HUSPS1 Single‐family housing starts (millions of units ) RESD
MC_HUSPS2A Multi‐family housing starts (millions of units) RESD
MC_JECIWSP Employment cost index, wages & salaries, private sector (June
1989 = 1.0)
NGTDM
UEFP
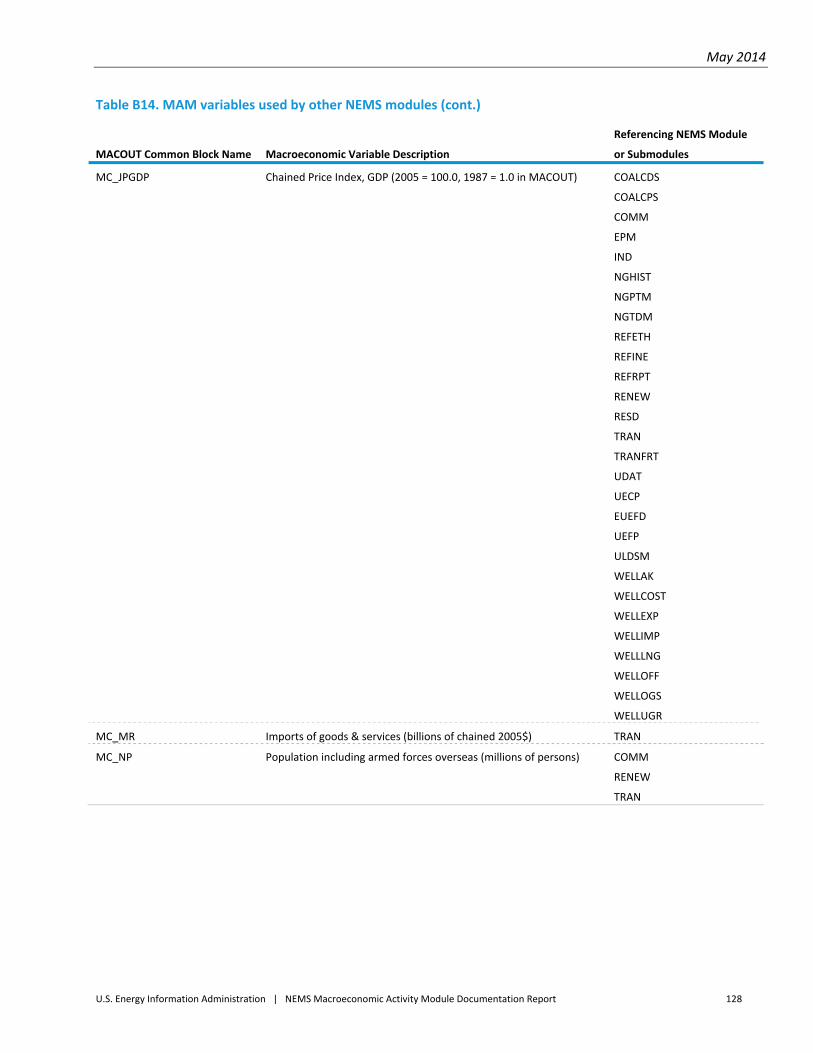
May 2014
U.S. Energy Information Administration | NEMS Macroeconomic Activity Module Documentation Report 128
Table B14. MAM variables used by other NEMS modules (cont.)
MACOUT Common Block Name Macroeconomic Variable Description
Referencing NEMS Module
or Submodules
MC_JPGDP Chained Price Index, GDP (2005 = 100.0, 1987 = 1.0 in MACOUT) COALCDS
COALCPS
COMM
EPM
IND
NGHIST
NGPTM
NGTDM
REFETH
REFINE
REFRPT
RENEW
RESD
TRAN
TRANFRT
UDAT
UECP
EUEFD
UEFP
ULDSM
WELLAK
WELLCOST
WELLEXP
WELLIMP
WELLLNG
WELLOFF
WELLOGS
WELLUGR
MC_MR Imports of goods & services (billions of chained 2005$) TRAN
MC_NP Population including armed forces overseas (millions of persons) COMM
RENEW
TRAN
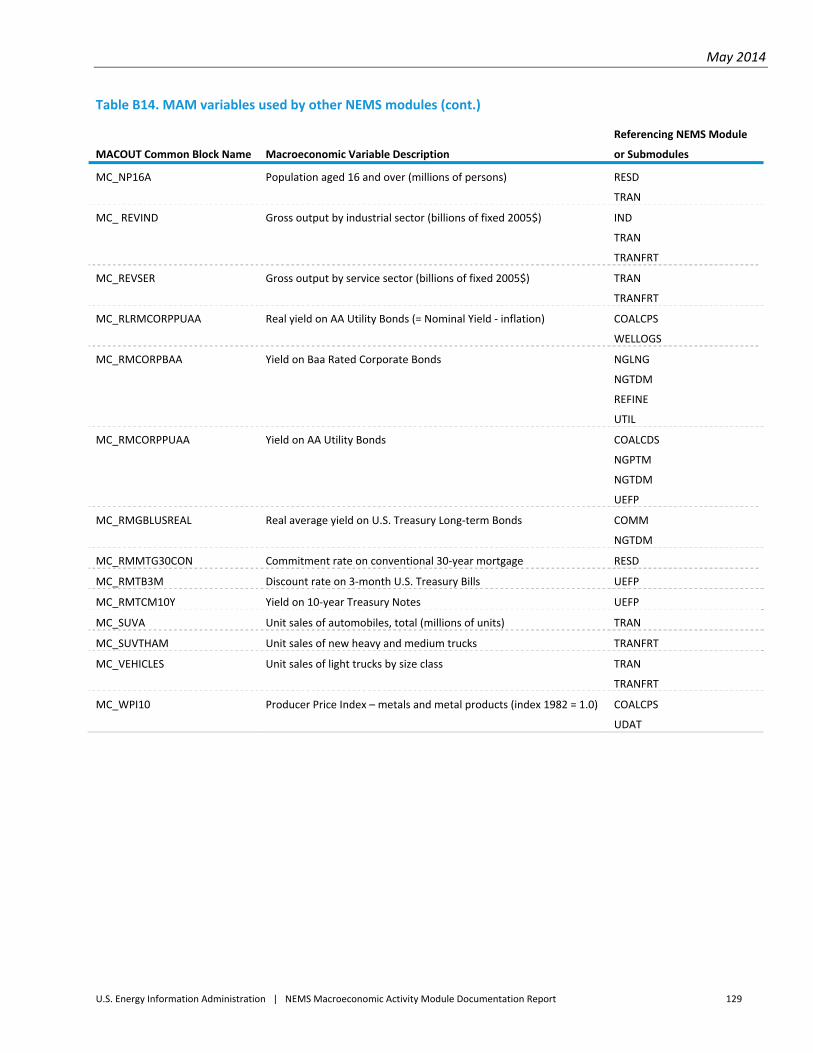
May 2014
U.S. Energy Information Administration | NEMS Macroeconomic Activity Module Documentation Report 129
Table B14. MAM variables used by other NEMS modules (cont.)
MACOUT Common Block Name Macroeconomic Variable Description
Referencing NEMS Module
or Submodules
MC_NP16A Population aged 16 and over (millions of persons) RESD
TRAN
MC_ REVIND Gross output by industrial sector (billions of fixed 2005$) IND
TRAN
TRANFRT
MC_REVSER Gross output by service sector (billions of fixed 2005$) TRAN
TRANFRT
MC_RLRMCORPPUAA Real yield on AA Utility Bonds (= Nominal Yield ‐ inflation) COALCPS
WELLOGS
MC_RMCORPBAA Yield on Baa Rated Corporate Bonds NGLNG
NGTDM
REFINE
UTIL
MC_RMCORPPUAA Yield on AA Utility Bonds COALCDS
NGPTM
NGTDM
UEFP
MC_RMGBLUSREAL Real average yield on U.S. Treasury Long‐term Bonds COMM
NGTDM
MC_RMMTG30CON Commitment rate on conventional 30‐year mortgage RESD
MC_RMTB3M Discount rate on 3‐month U.S. Treasury Bills UEFP
MC_RMTCM10Y Yield on 10‐year Treasury Notes UEFP
MC_SUVA Unit sales of automobiles, total (millions of units) TRAN
MC_SUVTHAM Unit sales of new heavy and medium trucks TRANFRT
MC_VEHICLES Unit sales of light trucks by size class TRAN
TRANFRT
MC_WPI10 Producer Price Index – metals and metal products (index 1982 = 1.0) COALCPS
UDAT

May 2014
U.S. Energy Information Administration | NEMS Macroeconomic Activity Module Documentation Report 130
Table B14. MAM variables uaed by other NEMS modules (cont.)
MACOUT Common Block Name Macroeconomic Variable Description
Referencing NEMS Module
or Submodules
MC_WPI11 Producer Price Index ‐ machinery and equipment (1982 = 1.0) UEFP
MC_WPI14 Producer Price Index ‐ transportation equipment (1982 = 1.0) COALCDS
COALCPS
MC_WPISOP3200 Producer Price Index – finished producer goods (1982 = 1.0) REFINE
MC_XGR Exports, goods (billions of chained 2005$) TRAN
MC_XR Exports of goods & services (billions of chained 2005$) TRAN
MC_YPDR Disposable personal income (billions of chained 2005$) COMM
RESD
TRAN
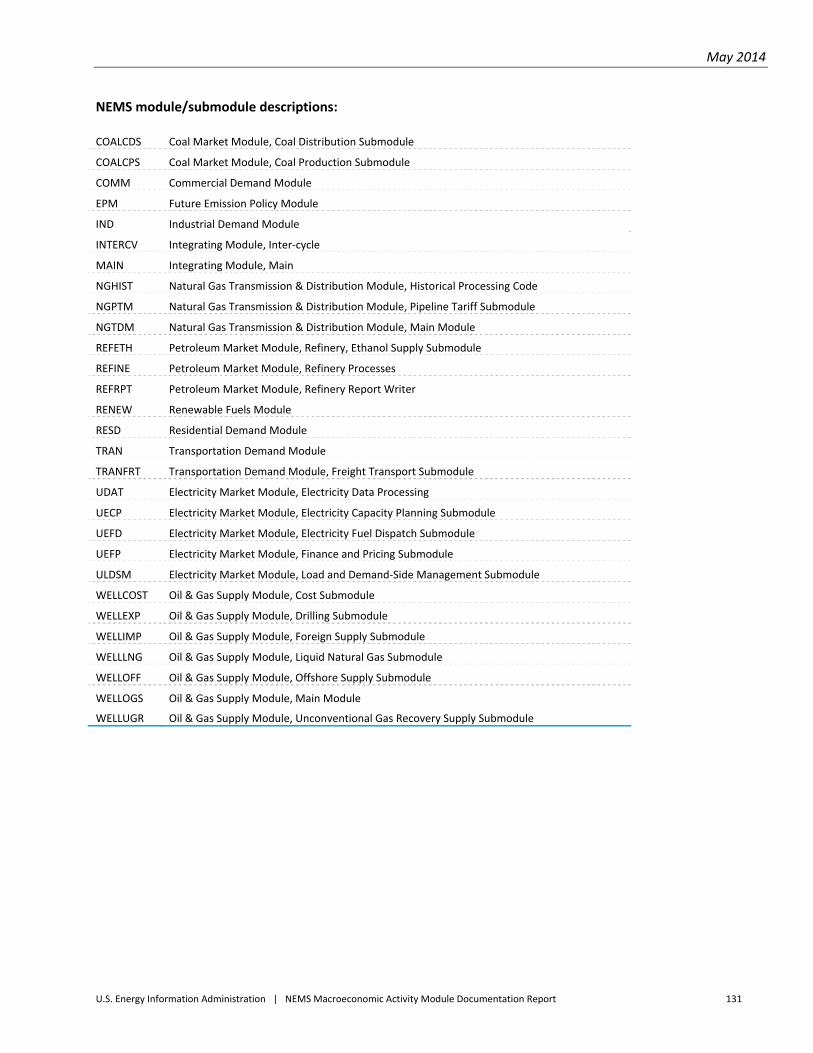
May 2014
U.S. Energy Information Administration | NEMS Macroeconomic Activity Module Documentation Report 131
NEMS module/submodule descriptions:
COALCDS Coal Market Module, Coal Distribution Submodule
COALCPS Coal Market Module, Coal Production Submodule
COMM Commercial Demand Module
EPM Future Emission Policy Module
IND Industrial Demand Module
INTERCV Integrating Module, Inter‐cycle
MAIN Integrating Module, Main
NGHIST Natural Gas Transmission & Distribution Module, Historical Processing Code
NGPTM Natural Gas Transmission & Distribution Module, Pipeline Tariff Submodule
NGTDM Natural Gas Transmission & Distribution Module, Main Module
REFETH Petroleum Market Module, Refinery, Ethanol Supply Submodule
REFINE Petroleum Market Module, Refinery Processes
REFRPT Petroleum Market Module, Refinery Report Writer
RENEW Renewable Fuels Module
RESD Residential Demand Module
TRAN Transportation Demand Module
TRANFRT Transportation Demand Module, Freight Transport Submodule
UDAT Electricity Market Module, Electricity Data Processing
UECP Electricity Market Module, Electricity Capacity Planning Submodule
UEFD Electricity Market Module, Electricity Fuel Dispatch Submodule
UEFP Electricity Market Module, Finance and Pricing Submodule
ULDSM Electricity Market Module, Load and Demand‐Side Management Submodule
WELLCOST Oil & Gas Supply Module, Cost Submodule
WELLEXP Oil & Gas Supply Module, Drilling Submodule
WELLIMP Oil & Gas Supply Module, Foreign Supply Submodule
WELLLNG Oil & Gas Supply Module, Liquid Natural Gas Submodule
WELLOFF Oil & Gas Supply Module, Offshore Supply Submodule
WELLOGS Oil & Gas Supply Module, Main Module
WELLUGR Oil & Gas Supply Module, Unconventional Gas Recovery Supply Submodule
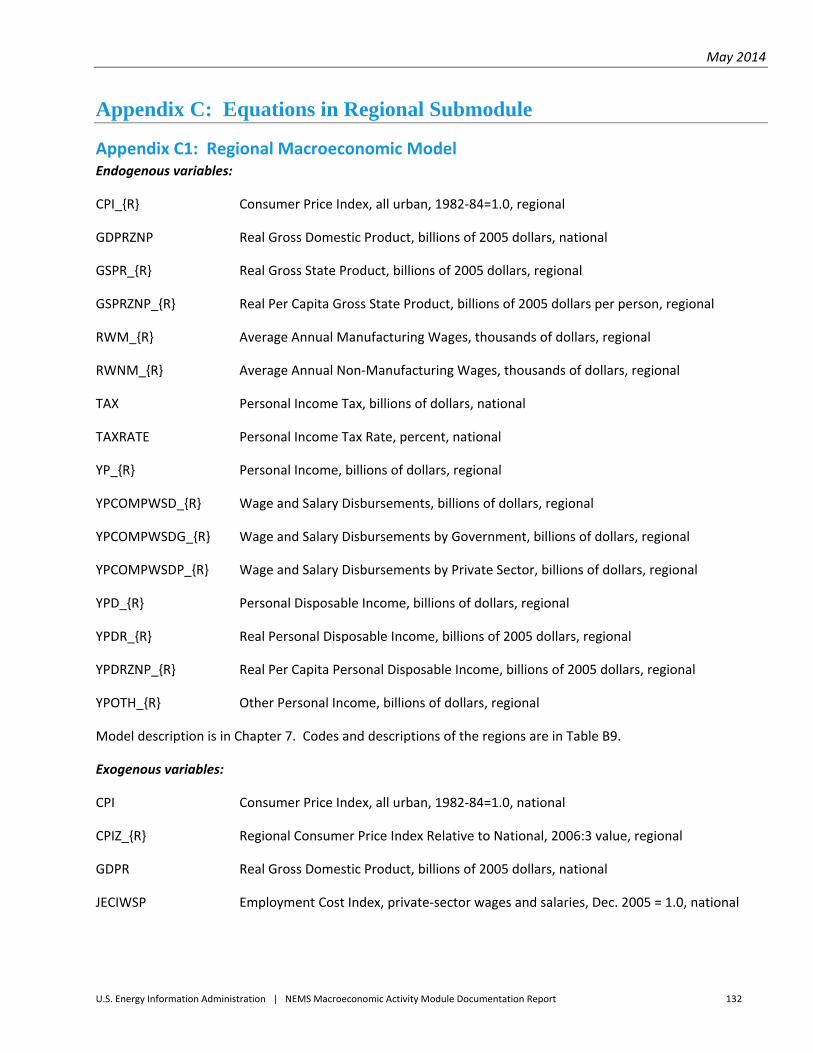
May 2014
U.S. Energy Information Administration | NEMS Macroeconomic Activity Module Documentation Report 132
Appendix C: Equations in Regional Submodule
Appendix C1: Regional Macroeconomic Model Endogenous variables:
CPI_{R} Consumer Price Index, all urban, 1982‐84=1.0, regional
GDPRZNP Real Gross Domestic Product, billions of 2005 dollars, national
GSPR_{R} Real Gross State Product, billions of 2005 dollars, regional
GSPRZNP_{R} Real Per Capita Gross State Product, billions of 2005 dollars per person, regional
RWM_{R} Average Annual Manufacturing Wages, thousands of dollars, regional
RWNM_{R} Average Annual Non‐Manufacturing Wages, thousands of dollars, regional
TAX Personal Income Tax, billions of dollars, national
TAXRATE Personal Income Tax Rate, percent, national
YP_{R} Personal Income, billions of dollars, regional
YPCOMPWSD_{R} Wage and Salary Disbursements, billions of dollars, regional
YPCOMPWSDG_{R} Wage and Salary Disbursements by Government, billions of dollars, regional
YPCOMPWSDP_{R} Wage and Salary Disbursements by Private Sector, billions of dollars, regional
YPD_{R} Personal Disposable Income, billions of dollars, regional
YPDR_{R} Real Personal Disposable Income, billions of 2005 dollars, regional
YPDRZNP_{R} Real Per Capita Personal Disposable Income, billions of 2005 dollars, regional
YPOTH_{R} Other Personal Income, billions of dollars, regional
Model description is in Chapter 7. Codes and descriptions of the regions are in Table B9.
Exogenous variables:
CPI Consumer Price Index, all urban, 1982‐84=1.0, national
CPIZ_{R} Regional Consumer Price Index Relative to National, 2006:3 value, regional
GDPR Real Gross Domestic Product, billions of 2005 dollars, national
JECIWSP Employment Cost Index, private‐sector wages and salaries, Dec. 2005 = 1.0, national
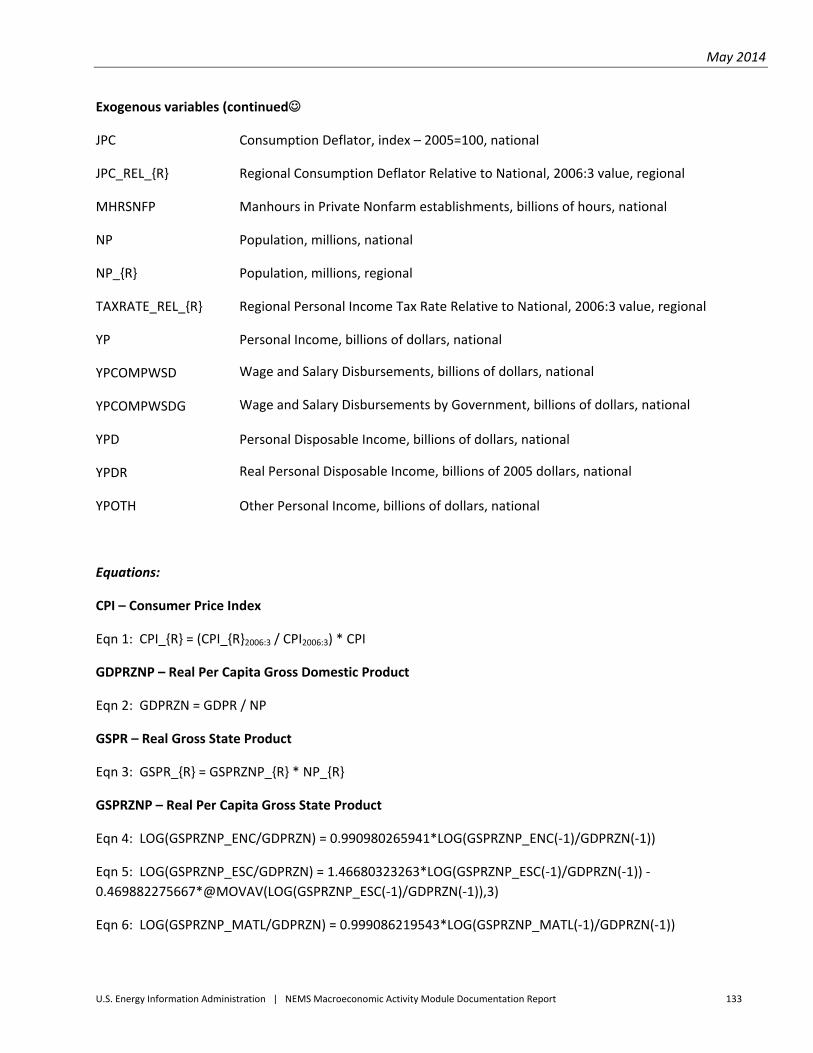
May 2014
U.S. Energy Information Administration | NEMS Macroeconomic Activity Module Documentation Report 133
Exogenous variables (continued
JPC Consumption Deflator, index – 2005=100, national
JPC_REL_{R} Regional Consumption Deflator Relative to National, 2006:3 value, regional
MHRSNFP Manhours in Private Nonfarm establishments, billions of hours, national
NP Population, millions, national
NP_{R} Population, millions, regional
TAXRATE_REL_{R} Regional Personal Income Tax Rate Relative to National, 2006:3 value, regional
YP Personal Income, billions of dollars, national
YPCOMPWSD Wage and Salary Disbursements, billions of dollars, national
YPCOMPWSDG Wage and Salary Disbursements by Government, billions of dollars, national
YPD Personal Disposable Income, billions of dollars, national
YPDR Real Personal Disposable Income, billions of 2005 dollars, national
YPOTH Other Personal Income, billions of dollars, national
Equations:
CPI – Consumer Price Index
Eqn 1: CPI_{R} = (CPI_{R}2006:3 / CPI2006:3) * CPI
GDPRZNP – Real Per Capita Gross Domestic Product
Eqn 2: GDPRZN = GDPR / NP
GSPR – Real Gross State Product
Eqn 3: GSPR_{R} = GSPRZNP_{R} * NP_{R}
GSPRZNP – Real Per Capita Gross State Product
Eqn 4: LOG(GSPRZNP_ENC/GDPRZN) = 0.990980265941*LOG(GSPRZNP_ENC(‐1)/GDPRZN(‐1))
Eqn 5: LOG(GSPRZNP_ESC/GDPRZN) = 1.46680323263*LOG(GSPRZNP_ESC(‐1)/GDPRZN(‐1)) ‐
0.469882275667*@MOVAV(LOG(GSPRZNP_ESC(‐1)/GDPRZN(‐1)),3)
Eqn 6: LOG(GSPRZNP_MATL/GDPRZN) = 0.999086219543*LOG(GSPRZNP_MATL(‐1)/GDPRZN(‐1))
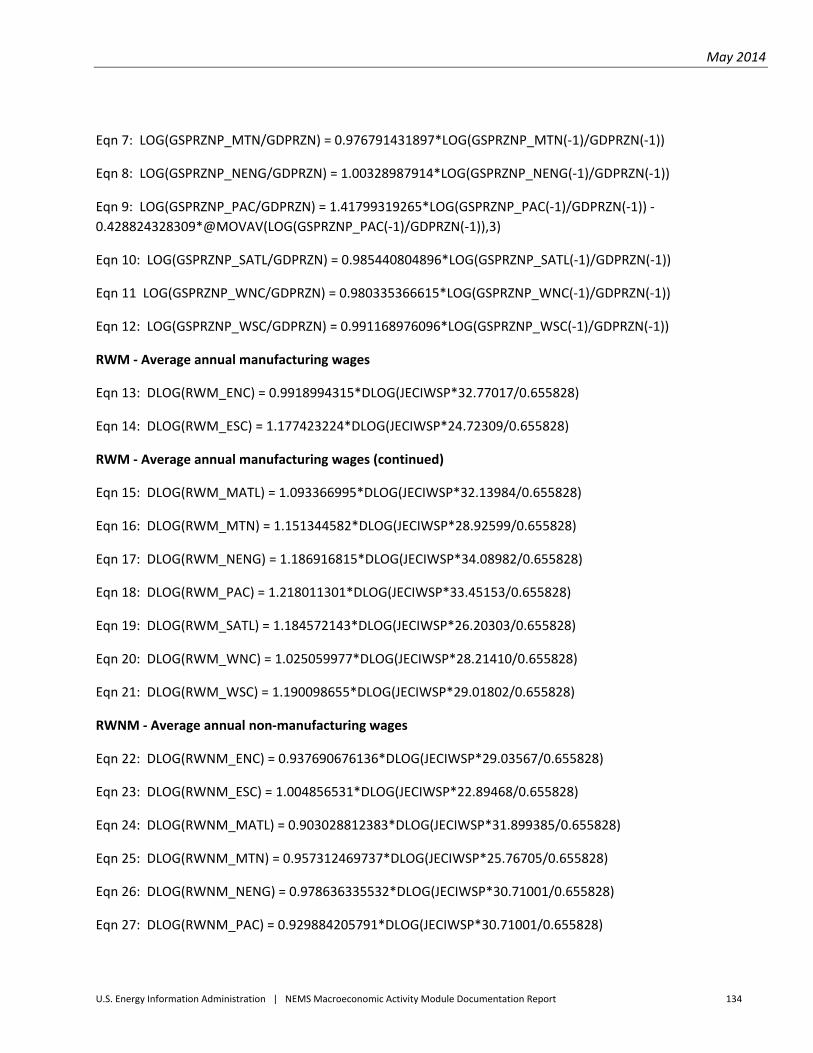
May 2014
U.S. Energy Information Administration | NEMS Macroeconomic Activity Module Documentation Report 134
Eqn 7: LOG(GSPRZNP_MTN/GDPRZN) = 0.976791431897*LOG(GSPRZNP_MTN(‐1)/GDPRZN(‐1))
Eqn 8: LOG(GSPRZNP_NENG/GDPRZN) = 1.00328987914*LOG(GSPRZNP_NENG(‐1)/GDPRZN(‐1))
Eqn 9: LOG(GSPRZNP_PAC/GDPRZN) = 1.41799319265*LOG(GSPRZNP_PAC(‐1)/GDPRZN(‐1)) ‐
0.428824328309*@MOVAV(LOG(GSPRZNP_PAC(‐1)/GDPRZN(‐1)),3)
Eqn 10: LOG(GSPRZNP_SATL/GDPRZN) = 0.985440804896*LOG(GSPRZNP_SATL(‐1)/GDPRZN(‐1))
Eqn 11 LOG(GSPRZNP_WNC/GDPRZN) = 0.980335366615*LOG(GSPRZNP_WNC(‐1)/GDPRZN(‐1))
Eqn 12: LOG(GSPRZNP_WSC/GDPRZN) = 0.991168976096*LOG(GSPRZNP_WSC(‐1)/GDPRZN(‐1))
RWM ‐ Average annual manufacturing wages
Eqn 13: DLOG(RWM_ENC) = 0.9918994315*DLOG(JECIWSP*32.77017/0.655828)
Eqn 14: DLOG(RWM_ESC) = 1.177423224*DLOG(JECIWSP*24.72309/0.655828)
RWM ‐ Average annual manufacturing wages (continued)
Eqn 15: DLOG(RWM_MATL) = 1.093366995*DLOG(JECIWSP*32.13984/0.655828)
Eqn 16: DLOG(RWM_MTN) = 1.151344582*DLOG(JECIWSP*28.92599/0.655828)
Eqn 17: DLOG(RWM_NENG) = 1.186916815*DLOG(JECIWSP*34.08982/0.655828)
Eqn 18: DLOG(RWM_PAC) = 1.218011301*DLOG(JECIWSP*33.45153/0.655828)
Eqn 19: DLOG(RWM_SATL) = 1.184572143*DLOG(JECIWSP*26.20303/0.655828)
Eqn 20: DLOG(RWM_WNC) = 1.025059977*DLOG(JECIWSP*28.21410/0.655828)
Eqn 21: DLOG(RWM_WSC) = 1.190098655*DLOG(JECIWSP*29.01802/0.655828)
RWNM ‐ Average annual non‐manufacturing wages
Eqn 22: DLOG(RWNM_ENC) = 0.937690676136*DLOG(JECIWSP*29.03567/0.655828)
Eqn 23: DLOG(RWNM_ESC) = 1.004856531*DLOG(JECIWSP*22.89468/0.655828)
Eqn 24: DLOG(RWNM_MATL) = 0.903028812383*DLOG(JECIWSP*31.899385/0.655828)
Eqn 25: DLOG(RWNM_MTN) = 0.957312469737*DLOG(JECIWSP*25.76705/0.655828)
Eqn 26: DLOG(RWNM_NENG) = 0.978636335532*DLOG(JECIWSP*30.71001/0.655828)
Eqn 27: DLOG(RWNM_PAC) = 0.929884205791*DLOG(JECIWSP*30.71001/0.655828)
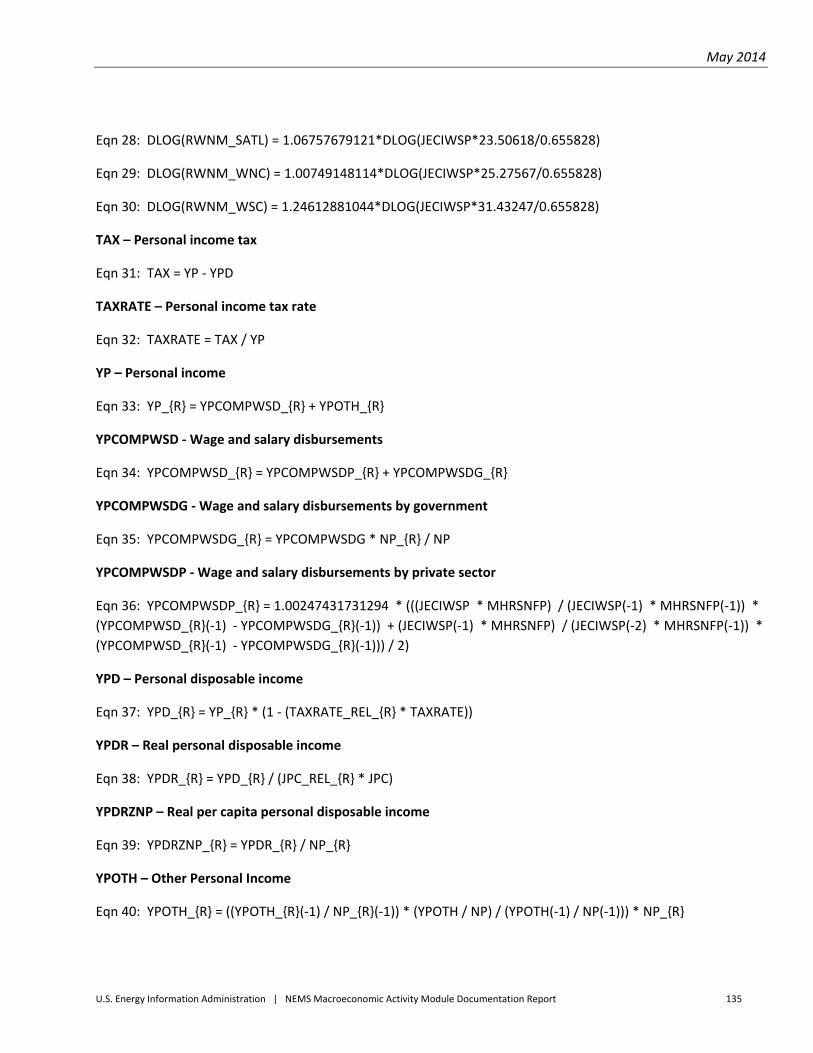
May 2014
U.S. Energy Information Administration | NEMS Macroeconomic Activity Module Documentation Report 135
Eqn 28: DLOG(RWNM_SATL) = 1.06757679121*DLOG(JECIWSP*23.50618/0.655828)
Eqn 29: DLOG(RWNM_WNC) = 1.00749148114*DLOG(JECIWSP*25.27567/0.655828)
Eqn 30: DLOG(RWNM_WSC) = 1.24612881044*DLOG(JECIWSP*31.43247/0.655828)
TAX – Personal income tax
Eqn 31: TAX = YP ‐ YPD
TAXRATE – Personal income tax rate
Eqn 32: TAXRATE = TAX / YP
YP – Personal income
Eqn 33: YP_{R} = YPCOMPWSD_{R} + YPOTH_{R}
YPCOMPWSD ‐ Wage and salary disbursements
Eqn 34: YPCOMPWSD_{R} = YPCOMPWSDP_{R} + YPCOMPWSDG_{R}
YPCOMPWSDG ‐ Wage and salary disbursements by government
Eqn 35: YPCOMPWSDG_{R} = YPCOMPWSDG * NP_{R} / NP
YPCOMPWSDP ‐ Wage and salary disbursements by private sector
Eqn 36: YPCOMPWSDP_{R} = 1.00247431731294 * (((JECIWSP * MHRSNFP) / (JECIWSP(‐1) * MHRSNFP(‐1)) *
(YPCOMPWSD_{R}(‐1) ‐ YPCOMPWSDG_{R}(‐1)) + (JECIWSP(‐1) * MHRSNFP) / (JECIWSP(‐2) * MHRSNFP(‐1)) *
(YPCOMPWSD_{R}(‐1) ‐ YPCOMPWSDG_{R}(‐1))) / 2)
YPD – Personal disposable income
Eqn 37: YPD_{R} = YP_{R} * (1 ‐ (TAXRATE_REL_{R} * TAXRATE))
YPDR – Real personal disposable income
Eqn 38: YPDR_{R} = YPD_{R} / (JPC_REL_{R} * JPC)
YPDRZNP – Real per capita personal disposable income
Eqn 39: YPDRZNP_{R} = YPDR_{R} / NP_{R}
YPOTH – Other Personal Income
Eqn 40: YPOTH_{R} = ((YPOTH_{R}(‐1) / NP_{R}(‐1)) * (YPOTH / NP) / (YPOTH(‐1) / NP(‐1))) * NP_{R}
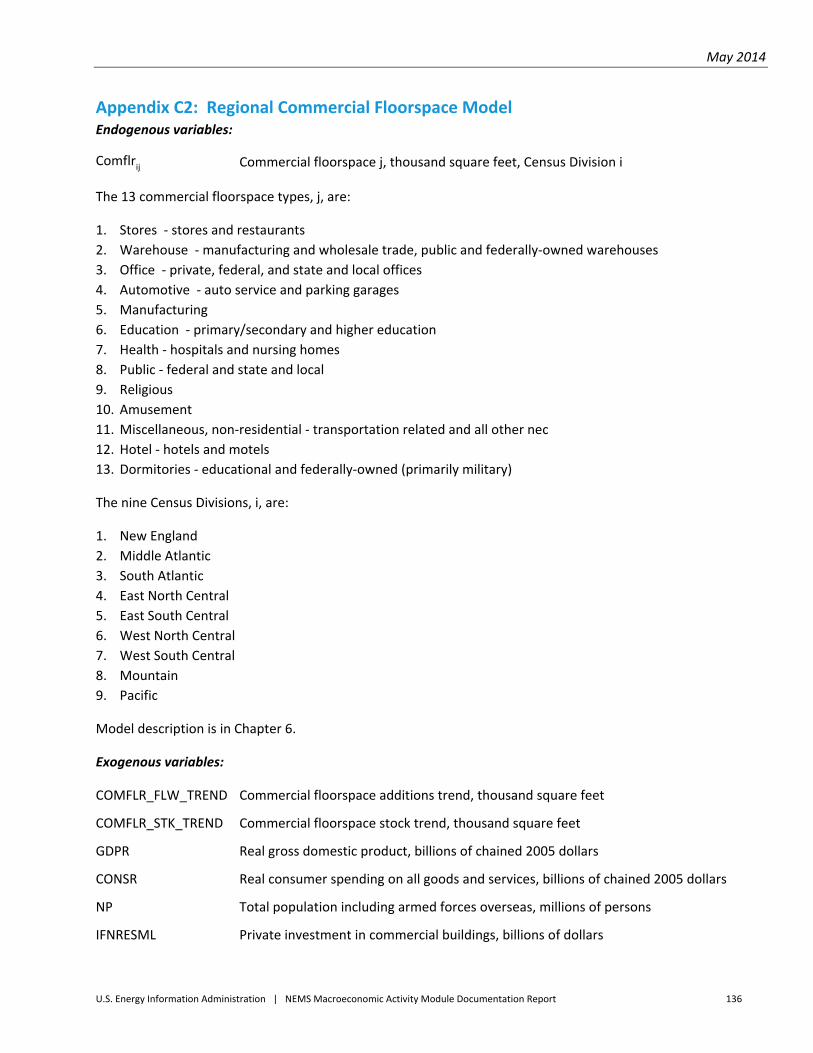
May 2014
U.S. Energy Information Administration | NEMS Macroeconomic Activity Module Documentation Report 136
Appendix C2: Regional Commercial Floorspace Model Endogenous variables:
Comflrij Commercial floorspace j, thousand square feet, Census Division i
The 13 commercial floorspace types, j, are:
1. Stores ‐ stores and restaurants
2. Warehouse ‐ manufacturing and wholesale trade, public and federally‐owned warehouses
3. Office ‐ private, federal, and state and local offices
4. Automotive ‐ auto service and parking garages
5. Manufacturing
6. Education ‐ primary/secondary and higher education
7. Health ‐ hospitals and nursing homes
8. Public ‐ federal and state and local
9. Religious
10. Amusement
11. Miscellaneous, non‐residential ‐ transportation related and all other nec
12. Hotel ‐ hotels and motels
13. Dormitories ‐ educational and federally‐owned (primarily military)
The nine Census Divisions, i, are:
1. New England
2. Middle Atlantic
3. South Atlantic
4. East North Central
5. East South Central
6. West North Central
7. West South Central
8. Mountain
9. Pacific
Model description is in Chapter 6.
Exogenous variables:
COMFLR_FLW_TREND Commercial floorspace additions trend, thousand square feet
COMFLR_STK_TREND Commercial floorspace stock trend, thousand square feet
GDPR Real gross domestic product, billions of chained 2005 dollars
CONSR Real consumer spending on all goods and services, billions of chained 2005 dollars
NP Total population including armed forces overseas, millions of persons
IFNRESML Private investment in commercial buildings, billions of dollars
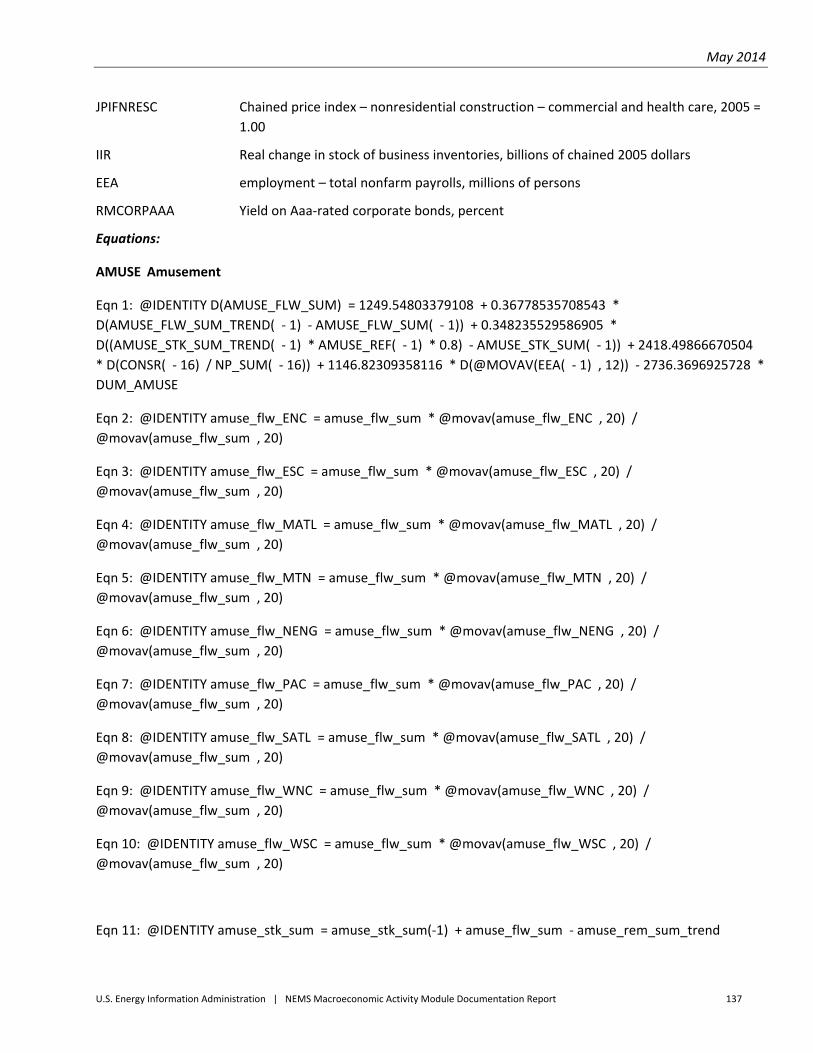
May 2014
U.S. Energy Information Administration | NEMS Macroeconomic Activity Module Documentation Report 137
JPIFNRESC Chained price index – nonresidential construction – commercial and health care, 2005 =
1.00
IIR Real change in stock of business inventories, billions of chained 2005 dollars
EEA employment – total nonfarm payrolls, millions of persons
RMCORPAAA Yield on Aaa‐rated corporate bonds, percent
Equations:
AMUSE Amusement
Eqn 1: @IDENTITY D(AMUSE_FLW_SUM) = 1249.54803379108 + 0.36778535708543 *
D(AMUSE_FLW_SUM_TREND( ‐ 1) ‐ AMUSE_FLW_SUM( ‐ 1)) + 0.348235529586905 *
D((AMUSE_STK_SUM_TREND( ‐ 1) * AMUSE_REF( ‐ 1) * 0.8) ‐ AMUSE_STK_SUM( ‐ 1)) + 2418.49866670504
* D(CONSR( ‐ 16) / NP_SUM( ‐ 16)) + 1146.82309358116 * D(@MOVAV(EEA( ‐ 1) , 12)) ‐ 2736.3696925728 *
DUM_AMUSE
Eqn 2: @IDENTITY amuse_flw_ENC = amuse_flw_sum * @movav(amuse_flw_ENC , 20) /
@movav(amuse_flw_sum , 20)
Eqn 3: @IDENTITY amuse_flw_ESC = amuse_flw_sum * @movav(amuse_flw_ESC , 20) /
@movav(amuse_flw_sum , 20)
Eqn 4: @IDENTITY amuse_flw_MATL = amuse_flw_sum * @movav(amuse_flw_MATL , 20) /
@movav(amuse_flw_sum , 20)
Eqn 5: @IDENTITY amuse_flw_MTN = amuse_flw_sum * @movav(amuse_flw_MTN , 20) /
@movav(amuse_flw_sum , 20)
Eqn 6: @IDENTITY amuse_flw_NENG = amuse_flw_sum * @movav(amuse_flw_NENG , 20) /
@movav(amuse_flw_sum , 20)
Eqn 7: @IDENTITY amuse_flw_PAC = amuse_flw_sum * @movav(amuse_flw_PAC , 20) /
@movav(amuse_flw_sum , 20)
Eqn 8: @IDENTITY amuse_flw_SATL = amuse_flw_sum * @movav(amuse_flw_SATL , 20) /
@movav(amuse_flw_sum , 20)
Eqn 9: @IDENTITY amuse_flw_WNC = amuse_flw_sum * @movav(amuse_flw_WNC , 20) /
@movav(amuse_flw_sum , 20)
Eqn 10: @IDENTITY amuse_flw_WSC = amuse_flw_sum * @movav(amuse_flw_WSC , 20) /
@movav(amuse_flw_sum , 20)
Eqn 11: @IDENTITY amuse_stk_sum = amuse_stk_sum(‐1) + amuse_flw_sum ‐ amuse_rem_sum_trend
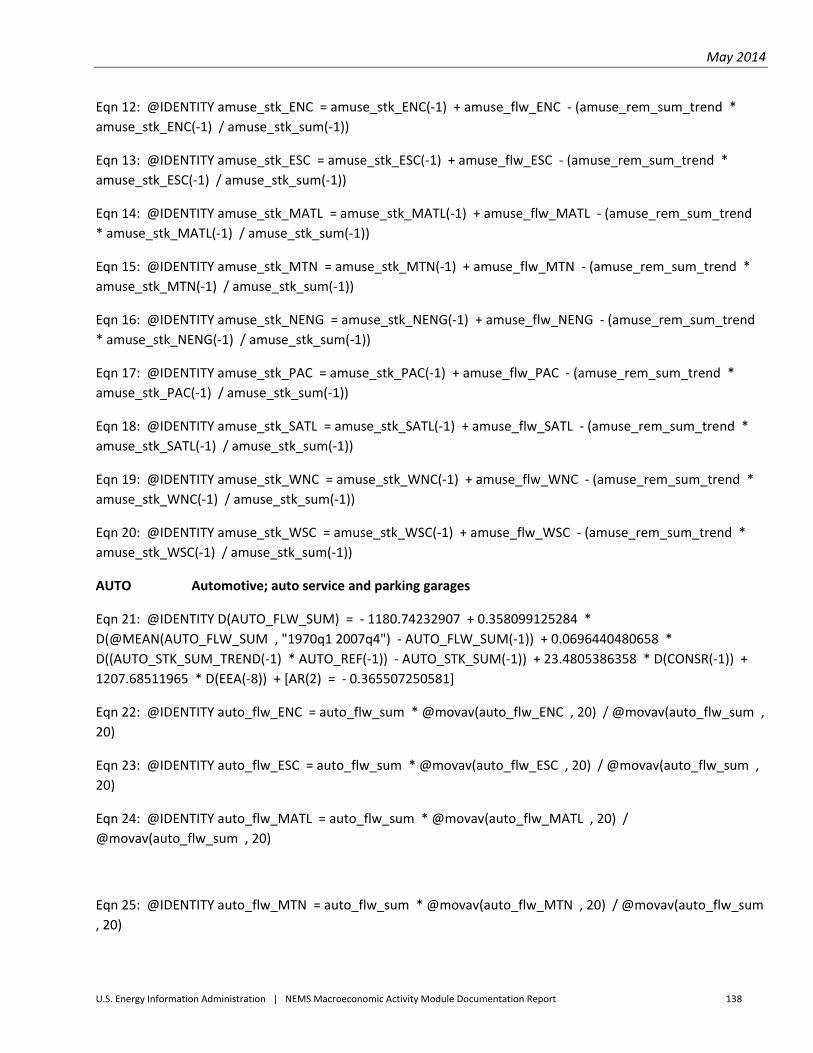
May 2014
U.S. Energy Information Administration | NEMS Macroeconomic Activity Module Documentation Report 138
Eqn 12: @IDENTITY amuse_stk_ENC = amuse_stk_ENC(‐1) + amuse_flw_ENC ‐ (amuse_rem_sum_trend *
amuse_stk_ENC(‐1) / amuse_stk_sum(‐1))
Eqn 13: @IDENTITY amuse_stk_ESC = amuse_stk_ESC(‐1) + amuse_flw_ESC ‐ (amuse_rem_sum_trend *
amuse_stk_ESC(‐1) / amuse_stk_sum(‐1))
Eqn 14: @IDENTITY amuse_stk_MATL = amuse_stk_MATL(‐1) + amuse_flw_MATL ‐ (amuse_rem_sum_trend
* amuse_stk_MATL(‐1) / amuse_stk_sum(‐1))
Eqn 15: @IDENTITY amuse_stk_MTN = amuse_stk_MTN(‐1) + amuse_flw_MTN ‐ (amuse_rem_sum_trend *
amuse_stk_MTN(‐1) / amuse_stk_sum(‐1))
Eqn 16: @IDENTITY amuse_stk_NENG = amuse_stk_NENG(‐1) + amuse_flw_NENG ‐ (amuse_rem_sum_trend
* amuse_stk_NENG(‐1) / amuse_stk_sum(‐1))
Eqn 17: @IDENTITY amuse_stk_PAC = amuse_stk_PAC(‐1) + amuse_flw_PAC ‐ (amuse_rem_sum_trend *
amuse_stk_PAC(‐1) / amuse_stk_sum(‐1))
Eqn 18: @IDENTITY amuse_stk_SATL = amuse_stk_SATL(‐1) + amuse_flw_SATL ‐ (amuse_rem_sum_trend *
amuse_stk_SATL(‐1) / amuse_stk_sum(‐1))
Eqn 19: @IDENTITY amuse_stk_WNC = amuse_stk_WNC(‐1) + amuse_flw_WNC ‐ (amuse_rem_sum_trend *
amuse_stk_WNC(‐1) / amuse_stk_sum(‐1))
Eqn 20: @IDENTITY amuse_stk_WSC = amuse_stk_WSC(‐1) + amuse_flw_WSC ‐ (amuse_rem_sum_trend *
amuse_stk_WSC(‐1) / amuse_stk_sum(‐1))
AUTO Automotive; auto service and parking garages
Eqn 21: @IDENTITY D(AUTO_FLW_SUM) = ‐ 1180.74232907 + 0.358099125284 *
D(@MEAN(AUTO_FLW_SUM , "1970q1 2007q4") ‐ AUTO_FLW_SUM(‐1)) + 0.0696440480658 *
D((AUTO_STK_SUM_TREND(‐1) * AUTO_REF(‐1)) ‐ AUTO_STK_SUM(‐1)) + 23.4805386358 * D(CONSR(‐1)) +
1207.68511965 * D(EEA(‐8)) + [AR(2) = ‐ 0.365507250581]
Eqn 22: @IDENTITY auto_flw_ENC = auto_flw_sum * @movav(auto_flw_ENC , 20) / @movav(auto_flw_sum ,
20)
Eqn 23: @IDENTITY auto_flw_ESC = auto_flw_sum * @movav(auto_flw_ESC , 20) / @movav(auto_flw_sum ,
20)
Eqn 24: @IDENTITY auto_flw_MATL = auto_flw_sum * @movav(auto_flw_MATL , 20) /
@movav(auto_flw_sum , 20)
Eqn 25: @IDENTITY auto_flw_MTN = auto_flw_sum * @movav(auto_flw_MTN , 20) / @movav(auto_flw_sum
, 20)
May 2014
U.S. Energy Information Administration | NEMS Macroeconomic Activity Module Documentation Report 139
Eqn 26: @IDENTITY auto_flw_NENG = auto_flw_sum * @movav(auto_flw_NENG , 20) /
@movav(auto_flw_sum , 20)
Eqn 27: @IDENTITY auto_flw_PAC = auto_flw_sum * @movav(auto_flw_PAC , 20) / @movav(auto_flw_sum ,
20)
Eqn 28: @IDENTITY auto_flw_SATL = auto_flw_sum * @movav(auto_flw_SATL , 20) / @movav(auto_flw_sum
, 20)
Eqn 29: @IDENTITY auto_flw_WNC = auto_flw_sum * @movav(auto_flw_WNC , 20) /
@movav(auto_flw_sum , 20)
Eqn 30: @IDENTITY auto_flw_WSC = auto_flw_sum * @movav(auto_flw_WSC , 20) / @movav(auto_flw_sum
, 20)
Eqn 31: @IDENTITY auto_stk_sum = auto_stk_sum(‐1) + auto_flw_sum ‐ auto_rem_sum_trend
Eqn 32: @IDENTITY auto_stk_ENC = auto_stk_ENC(‐1) + auto_flw_ENC ‐ (auto_rem_sum_trend *
auto_stk_ENC(‐1) / auto_stk_sum(‐1))
Eqn 33: @IDENTITY auto_stk_ESC = auto_stk_ESC(‐1) + auto_flw_ESC ‐ (auto_rem_sum_trend *
auto_stk_ESC(‐1) / auto_stk_sum(‐1))
Eqn 34: @IDENTITY auto_stk_MATL = auto_stk_MATL(‐1) + auto_flw_MATL ‐ (auto_rem_sum_trend *
auto_stk_MATL(‐1) / auto_stk_sum(‐1))
Eqn 35: @IDENTITY auto_stk_MTN = auto_stk_MTN(‐1) + auto_flw_MTN ‐ (auto_rem_sum_trend *
auto_stk_MTN(‐1) / auto_stk_sum(‐1))
Eqn 36: @IDENTITY auto_stk_NENG = auto_stk_NENG(‐1) + auto_flw_NENG ‐ (auto_rem_sum_trend *
auto_stk_NENG(‐1) / auto_stk_sum(‐1))
Eqn 37: @IDENTITY auto_stk_PAC = auto_stk_PAC(‐1) + auto_flw_PAC ‐ (auto_rem_sum_trend *
auto_stk_PAC(‐1) / auto_stk_sum(‐1))
Eqn 38: @IDENTITY auto_stk_SATL = auto_stk_SATL(‐1) + auto_flw_SATL ‐ (auto_rem_sum_trend *
auto_stk_SATL(‐1) / auto_stk_sum(‐1))
Eqn 39: @IDENTITY auto_stk_WNC = auto_stk_WNC(‐1) + auto_flw_WNC ‐ (auto_rem_sum_trend *
auto_stk_WNC(‐1) / auto_stk_sum(‐1))
Eqn 40: @IDENTITY auto_stk_WSC = auto_stk_WSC(‐1) + auto_flw_WSC ‐ (auto_rem_sum_trend *
auto_stk_WSC(‐1) / auto_stk_sum(‐1))
May 2014
U.S. Energy Information Administration | NEMS Macroeconomic Activity Module Documentation Report 140
DORM Dormitories; educational and federally‐owned (primarily military)
Eqn 41: @IDENTITY D(DORM_FLW_SUM) = ‐ 1150.03081588 ‐ 0.0266098322266 *
D(@MEAN(DORM_FLW_SUM , "1970q1 1998q4") ‐ DORM_FLW_SUM(‐1)) + 0.657369879681 *
D((DORM_STK_SUM_TREND(‐1) * DORM_REF(‐1)) ‐ DORM_STK_SUM(‐1)) + 3340.23309706 *
D(@MOVAV(GDPR(‐1) / NP_SUM(‐1) , 20)) + 1361.34672881 * D(CONSR(‐1) / NP_SUM(‐1)) ‐ 278.069722141
* D(RMCORPAAA(‐8)) + 0.00868041543129 * D(SUM_FLW_SUM(‐12))
Eqn 42: @IDENTITY dorm_flw_ENC = dorm_flw_sum * @movav(dorm_flw_ENC , 20) /
@movav(dorm_flw_sum , 20)
Eqn 43: @IDENTITY dorm_flw_ESC = dorm_flw_sum * @movav(dorm_flw_ESC , 20) /
@movav(dorm_flw_sum , 20)
Eqn 44: @IDENTITY dorm_flw_MATL = dorm_flw_sum * @movav(dorm_flw_MATL , 20) /
@movav(dorm_flw_sum , 20)
Eqn 45: @IDENTITY dorm_flw_MTN = dorm_flw_sum * @movav(dorm_flw_MTN , 20) /
@movav(dorm_flw_sum , 20)
Eqn 46: @IDENTITY dorm_flw_NENG = dorm_flw_sum * @movav(dorm_flw_NENG , 20) /
@movav(dorm_flw_sum , 20)
Eqn 47: @IDENTITY dorm_flw_PAC = dorm_flw_sum * @movav(dorm_flw_PAC , 20) /
@movav(dorm_flw_sum , 20)
Eqn 48: @IDENTITY dorm_flw_SATL = dorm_flw_sum * @movav(dorm_flw_SATL , 20) /
@movav(dorm_flw_sum , 20)
Eqn 49: @IDENTITY dorm_flw_WNC = dorm_flw_sum * @movav(dorm_flw_WNC , 20) /
@movav(dorm_flw_sum , 20)
Eqn 50: @IDENTITY dorm_flw_WSC = dorm_flw_sum * @movav(dorm_flw_WSC , 20) /
@movav(dorm_flw_sum , 20)
Eqn 51: @IDENTITY dorm_stk_sum = dorm_stk_sum(‐1) + dorm_flw_sum ‐ dorm_rem_sum_trend
Eqn 52: @IDENTITY dorm_stk_ENC = dorm_stk_ENC(‐1) + dorm_flw_ENC ‐ (dorm_rem_sum_trend *
dorm_stk_ENC(‐1) / dorm_stk_sum(‐1))
Eqn 53: @IDENTITY dorm_stk_ESC = dorm_stk_ESC(‐1) + dorm_flw_ESC ‐ (dorm_rem_sum_trend *
dorm_stk_ESC(‐1) / dorm_stk_sum(‐1))
Eqn 54: @IDENTITY dorm_stk_MATL = dorm_stk_MATL(‐1) + dorm_flw_MATL ‐ (dorm_rem_sum_trend *
dorm_stk_MATL(‐1) / dorm_stk_sum(‐1))
May 2014
U.S. Energy Information Administration | NEMS Macroeconomic Activity Module Documentation Report 141
Eqn 55: @IDENTITY dorm_stk_MTN = dorm_stk_MTN(‐1) + dorm_flw_MTN ‐ (dorm_rem_sum_trend *
dorm_stk_MTN(‐1) / dorm_stk_sum(‐1))
Eqn 56: @IDENTITY dorm_stk_NENG = dorm_stk_NENG(‐1) + dorm_flw_NENG ‐ (dorm_rem_sum_trend *
dorm_stk_NENG(‐1) / dorm_stk_sum(‐1))
Eqn 57: @IDENTITY dorm_stk_PAC = dorm_stk_PAC(‐1) + dorm_flw_PAC ‐ (dorm_rem_sum_trend *
dorm_stk_PAC(‐1) / dorm_stk_sum(‐1))
Eqn 58: @IDENTITY dorm_stk_SATL = dorm_stk_SATL(‐1) + dorm_flw_SATL ‐ (dorm_rem_sum_trend *
dorm_stk_SATL(‐1) / dorm_stk_sum(‐1))
Eqn 59: @IDENTITY dorm_stk_WNC = dorm_stk_WNC(‐1) + dorm_flw_WNC ‐ (dorm_rem_sum_trend *
dorm_stk_WNC(‐1) / dorm_stk_sum(‐1))
Eqn 60: @IDENTITY dorm_stk_WSC = dorm_stk_WSC(‐1) + dorm_flw_WSC ‐ (dorm_rem_sum_trend *
dorm_stk_WSC(‐1) / dorm_stk_sum(‐1))
EDUC Education; primary/secondary and higher education
Eqn 61: @IDENTITY D(EDUC_FLW_SUM) = ‐ 750.095462600743 + 0.516786652109556 *
D(EDUC_FLW_SUM_TREND( ‐ 1) ‐ EDUC_FLW_SUM( ‐ 1)) + 0.0357096073665155 *
D((EDUC_STK_SUM_TREND( ‐ 1) * EDUC_REF( ‐ 1) * 0.4) ‐ EDUC_STK_SUM( ‐ 1)) + 7162.40060053554 *
D(CONSR( ‐ 12) / NP_SUM( ‐ 12)) + 0.0838033448362382 * D(@MOVAV(SUM_FLW_SUM( ‐ 1) , 16)) +
[MA(2) = ‐ 0.49971690316578 , MA(4) = 0.415042138174197 , MA(6) = ‐ 0.405233004407983 , MA(8) =
0.511517911655177 , MA(10) = ‐ 0.276748459835238 , BACKCAST = 1974Q2 , ESTSMPL = "1974Q2 2012Q4"]
Eqn 62: @IDENTITY educ_flw_ENC = educ_flw_sum * @movav(educ_flw_ENC , 20) / @movav(educ_flw_sum
, 20)
Eqn 63: @IDENTITY educ_flw_ESC = educ_flw_sum * @movav(educ_flw_ESC , 20) / @movav(educ_flw_sum ,
20)
Eqn 64: @IDENTITY educ_flw_MATL = educ_flw_sum * @movav(educ_flw_MATL , 20) /
@movav(educ_flw_sum , 20)
Eqn 65: @IDENTITY educ_flw_MTN = educ_flw_sum * @movav(educ_flw_MTN , 20) /
@movav(educ_flw_sum , 20)
Eqn 66: @IDENTITY educ_flw_NENG = educ_flw_sum * @movav(educ_flw_NENG , 20) /
@movav(educ_flw_sum , 20)
Eqn 67: @IDENTITY educ_flw_PAC = educ_flw_sum * @movav(educ_flw_PAC , 20) / @movav(educ_flw_sum
, 20)
May 2014
U.S. Energy Information Administration | NEMS Macroeconomic Activity Module Documentation Report 142
Eqn 68: @IDENTITY educ_flw_SATL = educ_flw_sum * @movav(educ_flw_SATL , 20) /
@movav(educ_flw_sum , 20)
Eqn 69: @IDENTITY educ_flw_WNC = educ_flw_sum * @movav(educ_flw_WNC , 20) /
@movav(educ_flw_sum , 20)
Eqn 70: @IDENTITY educ_flw_WSC = educ_flw_sum * @movav(educ_flw_WSC , 20) /
@movav(educ_flw_sum , 20)
Eqn 71: @IDENTITY educ_stk_sum = educ_stk_sum(‐1) + educ_flw_sum ‐ educ_rem_sum_trend
Eqn 72: @IDENTITY educ_stk_ENC = educ_stk_ENC(‐1) + educ_flw_ENC ‐ (educ_rem_sum_trend *
educ_stk_ENC(‐1) / educ_stk_sum(‐1))
Eqn 73: @IDENTITY educ_stk_ESC = educ_stk_ESC(‐1) + educ_flw_ESC ‐ (educ_rem_sum_trend *
educ_stk_ESC(‐1) / educ_stk_sum(‐1))
Eqn 74: @IDENTITY educ_stk_MATL = educ_stk_MATL(‐1) + educ_flw_MATL ‐ (educ_rem_sum_trend *
educ_stk_MATL(‐1) / educ_stk_sum(‐1))
Eqn 75: @IDENTITY educ_stk_MTN = educ_stk_MTN(‐1) + educ_flw_MTN ‐ (educ_rem_sum_trend *
educ_stk_MTN(‐1) / educ_stk_sum(‐1))
Eqn 76: @IDENTITY educ_stk_NENG = educ_stk_NENG(‐1) + educ_flw_NENG ‐ (educ_rem_sum_trend *
educ_stk_NENG(‐1) / educ_stk_sum(‐1))
Eqn 77: @IDENTITY educ_stk_PAC = educ_stk_PAC(‐1) + educ_flw_PAC ‐ (educ_rem_sum_trend *
educ_stk_PAC(‐1) / educ_stk_sum(‐1))
Eqn 78: @IDENTITY educ_stk_SATL = educ_stk_SATL(‐1) + educ_flw_SATL ‐ (educ_rem_sum_trend *
educ_stk_SATL(‐1) / educ_stk_sum(‐1))
Eqn 79: @IDENTITY educ_stk_WNC = educ_stk_WNC(‐1) + educ_flw_WNC ‐ (educ_rem_sum_trend *
educ_stk_WNC(‐1) / educ_stk_sum(‐1))
Eqn 80: @IDENTITY educ_stk_WSC = educ_stk_WSC(‐1) + educ_flw_WSC ‐ (educ_rem_sum_trend *
educ_stk_WSC(‐1) / educ_stk_sum(‐1))
HEALTH Health; hospitals and nursing homes
Eqn 81: @IDENTITY D(HEALTH_FLW_SUM) = 1809.70551940143 + 0.204505742221802 *
D(HEALTH_FLW_SUM_TREND( ‐ 1) ‐ HEALTH_FLW_SUM( ‐ 1)) + 0.368881206468204 *
D((HEALTH_STK_SUM_TREND( ‐ 1) * HEALTH_REF( ‐ 1) * 0.8) ‐ HEALTH_STK_SUM( ‐ 1)) + 2045.96301055322
* D(GDPR( ‐ 5) / NP_SUM( ‐ 5)) ‐ 768.077615086163 * D(RMCORPAAA( ‐ 5)) ‐ 2710.59272450135 *
DUM_HEALTH
May 2014
U.S. Energy Information Administration | NEMS Macroeconomic Activity Module Documentation Report 143
Eqn 82: @IDENTITY health_flw_ENC = health_flw_sum * @movav(health_flw_ENC , 20) /
@movav(health_flw_sum , 20)
Eqn 83: @IDENTITY health_flw_ESC = health_flw_sum * @movav(health_flw_ESC , 20) /
@movav(health_flw_sum , 20)
Eqn 84: @IDENTITY health_flw_MATL = health_flw_sum * @movav(health_flw_MATL , 20) /
@movav(health_flw_sum , 20)
Eqn 85: @IDENTITY health_flw_MTN = health_flw_sum * @movav(health_flw_MTN , 20) /
@movav(health_flw_sum , 20)
Eqn 86: @IDENTITY health_flw_NENG = health_flw_sum * @movav(health_flw_NENG , 20) /
@movav(health_flw_sum , 20)
Eqn 87: @IDENTITY health_flw_PAC = health_flw_sum * @movav(health_flw_PAC , 20) /
@movav(health_flw_sum , 20)
Eqn 88: @IDENTITY health_flw_SATL = health_flw_sum * @movav(health_flw_SATL , 20) /
@movav(health_flw_sum , 20)
Eqn 89: @IDENTITY health_flw_WNC = health_flw_sum * @movav(health_flw_WNC , 20) /
@movav(health_flw_sum , 20)
Eqn 90: @IDENTITY health_flw_WSC = health_flw_sum * @movav(health_flw_WSC , 20) /
@movav(health_flw_sum , 20)
Eqn 91: @IDENTITY health_stk_sum = health_stk_sum(‐1) + health_flw_sum ‐ health_rem_sum_trend
Eqn 92: @IDENTITY health_stk_ENC = health_stk_ENC(‐1) + health_flw_ENC ‐ (health_rem_sum_trend *
health_stk_ENC(‐1) / health_stk_sum(‐1))
Eqn 93: @IDENTITY health_stk_ESC = health_stk_ESC(‐1) + health_flw_ESC ‐ (health_rem_sum_trend *
health_stk_ESC(‐1) / health_stk_sum(‐1))
Eqn 94: @IDENTITY health_stk_MATL = health_stk_MATL(‐1) + health_flw_MATL ‐ (health_rem_sum_trend *
health_stk_MATL(‐1) / health_stk_sum(‐1))
Eqn 95: @IDENTITY health_stk_MTN = health_stk_MTN(‐1) + health_flw_MTN ‐ (health_rem_sum_trend *
health_stk_MTN(‐1) / health_stk_sum(‐1))
Eqn 96: @IDENTITY health_stk_NENG = health_stk_NENG(‐1) + health_flw_NENG ‐ (health_rem_sum_trend *
health_stk_NENG(‐1) / health_stk_sum(‐1))
Eqn 97: @IDENTITY health_stk_PAC = health_stk_PAC(‐1) + health_flw_PAC ‐ (health_rem_sum_trend *
health_stk_PAC(‐1) / health_stk_sum(‐1))
May 2014
U.S. Energy Information Administration | NEMS Macroeconomic Activity Module Documentation Report 144
Eqn 98: @IDENTITY health_stk_SATL = health_stk_SATL(‐1) + health_flw_SATL ‐ (health_rem_sum_trend *
health_stk_SATL(‐1) / health_stk_sum(‐1))
Eqn 99: @IDENTITY health_stk_WNC = health_stk_WNC(‐1) + health_flw_WNC ‐ (health_rem_sum_trend *
health_stk_WNC(‐1) / health_stk_sum(‐1))
Eqn 100: @IDENTITY health_stk_WSC = health_stk_WSC(‐1) + health_flw_WSC ‐ (health_rem_sum_trend *
health_stk_WSC(‐1) / health_stk_sum(‐1))
HOTEL Hotel; hotels and motels
Eqn 101: @IDENTITY D(HOTEL_FLW_SUM) = ‐ 773.065882284804 + 0.386448509618015 *
D(HOTEL_FLW_SUM_TREND( ‐ 1) ‐ HOTEL_FLW_SUM( ‐ 1)) + 0.132526861509824 *
D((HOTEL_STK_SUM_TREND( ‐ 1) * HOTEL_REF( ‐ 1) * 0.8) ‐ HOTEL_STK_SUM( ‐ 1)) + 5567.08885121439 *
D(@MOVAV(GDPR( ‐ 1) / NP_SUM( ‐ 1) , 8)) + 14627.3904905518 * D(IFNRESCML( ‐ 5) / JPIFNRESC( ‐ 5)) ‐
925.307091806053 * D(RMCORPAAA( ‐ 4)) + 0.0320889017813234 * D(SUM_FLW_SUM( ‐ 5))
Eqn 102: @IDENTITY hotel_flw_ENC = hotel_flw_sum * @movav(hotel_flw_ENC , 20) /
@movav(hotel_flw_sum , 20)
Eqn 103: @IDENTITY hotel_flw_ESC = hotel_flw_sum * @movav(hotel_flw_ESC , 20) /
@movav(hotel_flw_sum , 20)
Eqn 104: @IDENTITY hotel_flw_MATL = hotel_flw_sum * @movav(hotel_flw_MATL , 20) /
@movav(hotel_flw_sum , 20)
Eqn 105: @IDENTITY hotel_flw_MTN = hotel_flw_sum * @movav(hotel_flw_MTN , 20) /
@movav(hotel_flw_sum , 20)
Eqn 106: @IDENTITY hotel_flw_NENG = hotel_flw_sum * @movav(hotel_flw_NENG , 20) /
@movav(hotel_flw_sum , 20)
Eqn 107: @IDENTITY hotel_flw_PAC = hotel_flw_sum * @movav(hotel_flw_PAC , 20) /
@movav(hotel_flw_sum , 20)
Eqn 108: @IDENTITY hotel_flw_SATL = hotel_flw_sum * @movav(hotel_flw_SATL , 20) /
@movav(hotel_flw_sum , 20)
Eqn 109: @IDENTITY hotel_flw_WNC = hotel_flw_sum * @movav(hotel_flw_WNC , 20) /
@movav(hotel_flw_sum , 20)
Eqn 110: @IDENTITY hotel_flw_WSC = hotel_flw_sum * @movav(hotel_flw_WSC , 20) /
@movav(hotel_flw_sum , 20)
Eqn 111: @IDENTITY hotel_stk_sum = hotel_stk_sum(‐1) + hotel_flw_sum ‐ hotel_rem_sum_trend
May 2014
U.S. Energy Information Administration | NEMS Macroeconomic Activity Module Documentation Report 145
Eqn 112: @IDENTITY hotel_stk_ENC = hotel_stk_ENC(‐1) + hotel_flw_ENC ‐ (hotel_rem_sum_trend *
hotel_stk_ENC(‐1) / hotel_stk_sum(‐1))
Eqn 113: @IDENTITY hotel_stk_ESC = hotel_stk_ESC(‐1) + hotel_flw_ESC ‐ (hotel_rem_sum_trend *
hotel_stk_ESC(‐1) / hotel_stk_sum(‐1))
Eqn 114: @IDENTITY hotel_stk_MATL = hotel_stk_MATL(‐1) + hotel_flw_MATL ‐ (hotel_rem_sum_trend *
hotel_stk_MATL(‐1) / hotel_stk_sum(‐1))
Eqn 115: @IDENTITY hotel_stk_MTN = hotel_stk_MTN(‐1) + hotel_flw_MTN ‐ (hotel_rem_sum_trend *
hotel_stk_MTN(‐1) / hotel_stk_sum(‐1))
Eqn 116: @IDENTITY hotel_stk_NENG = hotel_stk_NENG(‐1) + hotel_flw_NENG ‐ (hotel_rem_sum_trend *
hotel_stk_NENG(‐1) / hotel_stk_sum(‐1))
Eqn 117: @IDENTITY hotel_stk_PAC = hotel_stk_PAC(‐1) + hotel_flw_PAC ‐ (hotel_rem_sum_trend *
hotel_stk_PAC(‐1) / hotel_stk_sum(‐1))
Eqn 118: @IDENTITY hotel_stk_SATL = hotel_stk_SATL(‐1) + hotel_flw_SATL ‐ (hotel_rem_sum_trend *
hotel_stk_SATL(‐1) / hotel_stk_sum(‐1))
Eqn 119: @IDENTITY hotel_stk_WNC = hotel_stk_WNC(‐1) + hotel_flw_WNC ‐ (hotel_rem_sum_trend *
hotel_stk_WNC(‐1) / hotel_stk_sum(‐1))
Eqn 120: @IDENTITY hotel_stk_WSC = hotel_stk_WSC(‐1) + hotel_flw_WSC ‐ (hotel_rem_sum_trend *
hotel_stk_WSC(‐1) / hotel_stk_sum(‐1))
MFG Manufacturing
Eqn 121: @IDENTITY D(MFG_FLW_SUM) = ‐ 2006.08017275042 + 0.313350959394401 *
D(MFG_FLW_SUM_TREND( ‐ 1) ‐ MFG_FLW_SUM( ‐ 1)) + 0.219626957476602 * D((MFG_STK_SUM_TREND( ‐
1) * MFG_REF( ‐ 1)) ‐ MFG_STK_SUM( ‐ 1)) + 6224.59356526806 * D(CONSR( ‐ 16) / NP_SUM( ‐ 16)) +
30898.286354818 * D(IFNRESCML( ‐ 4) / JPIFNRESC( ‐ 4)) + 2410.2484323458 * D(EEA( ‐ 5))
Eqn 122: @IDENTITY mfg_flw_ENC = mfg_flw_sum * @movav(mfg_flw_ENC , 20) / @movav(mfg_flw_sum ,
20)
Eqn 123: @IDENTITY mfg_flw_ESC = mfg_flw_sum * @movav(mfg_flw_ESC , 20) / @movav(mfg_flw_sum ,
20)
Eqn 124: @IDENTITY mfg_flw_MATL = mfg_flw_sum * @movav(mfg_flw_MATL , 20) / @movav(mfg_flw_sum
, 20)
Eqn 125: @IDENTITY mfg_flw_MTN = mfg_flw_sum * @movav(mfg_flw_MTN , 20) / @movav(mfg_flw_sum ,
20)
May 2014
U.S. Energy Information Administration | NEMS Macroeconomic Activity Module Documentation Report 146
Eqn 126: @IDENTITY mfg_flw_NENG = mfg_flw_sum * @movav(mfg_flw_NENG , 20) /
@movav(mfg_flw_sum , 20)
Eqn 127: @IDENTITY mfg_flw_PAC = mfg_flw_sum * @movav(mfg_flw_PAC , 20) / @movav(mfg_flw_sum ,
20)
Eqn 128: @IDENTITY mfg_flw_SATL = mfg_flw_sum * @movav(mfg_flw_SATL , 20) / @movav(mfg_flw_sum ,
20)
Eqn 129: @IDENTITY mfg_flw_WNC = mfg_flw_sum * @movav(mfg_flw_WNC , 20) / @movav(mfg_flw_sum
, 20)
Eqn 130: @IDENTITY mfg_flw_WSC = mfg_flw_sum * @movav(mfg_flw_WSC , 20) / @movav(mfg_flw_sum ,
20)
Eqn 131: @IDENTITY mfg_stk_sum = mfg_stk_sum(‐1) + mfg_flw_sum ‐ mfg_rem_sum_trend
Eqn 132: @IDENTITY mfg_stk_ENC = mfg_stk_ENC(‐1) + mfg_flw_ENC ‐ (mfg_rem_sum_trend *
mfg_stk_ENC(‐1) / mfg_stk_sum(‐1))
Eqn 133: @IDENTITY mfg_stk_ESC = mfg_stk_ESC(‐1) + mfg_flw_ESC ‐ (mfg_rem_sum_trend * mfg_stk_ESC(‐
1) / mfg_stk_sum(‐1))
Eqn 134: @IDENTITY mfg_stk_MATL = mfg_stk_MATL(‐1) + mfg_flw_MATL ‐ (mfg_rem_sum_trend *
mfg_stk_MATL(‐1) / mfg_stk_sum(‐1))
Eqn 135: @IDENTITY mfg_stk_MTN = mfg_stk_MTN(‐1) + mfg_flw_MTN ‐ (mfg_rem_sum_trend *
mfg_stk_MTN(‐1) / mfg_stk_sum(‐1))
Eqn 136: @IDENTITY mfg_stk_NENG = mfg_stk_NENG(‐1) + mfg_flw_NENG ‐ (mfg_rem_sum_trend *
mfg_stk_NENG(‐1) / mfg_stk_sum(‐1))
Eqn 137: @IDENTITY mfg_stk_PAC = mfg_stk_PAC(‐1) + mfg_flw_PAC ‐ (mfg_rem_sum_trend *
mfg_stk_PAC(‐1) / mfg_stk_sum(‐1))
Eqn 138: @IDENTITY mfg_stk_SATL = mfg_stk_SATL(‐1) + mfg_flw_SATL ‐ (mfg_rem_sum_trend *
mfg_stk_SATL(‐1) / mfg_stk_sum(‐1))
Eqn 139: @IDENTITY mfg_stk_WNC = mfg_stk_WNC(‐1) + mfg_flw_WNC ‐ (mfg_rem_sum_trend *
mfg_stk_WNC(‐1) / mfg_stk_sum(‐1))
Eqn 140: @IDENTITY mfg_stk_WSC = mfg_stk_WSC(‐1) + mfg_flw_WSC ‐ (mfg_rem_sum_trend *
mfg_stk_WSC(‐1) / mfg_stk_sum(‐1))
May 2014
U.S. Energy Information Administration | NEMS Macroeconomic Activity Module Documentation Report 147
MISCNR Miscellaneous, non‐residential transportation related and all other nec
Eqn 141: @IDENTITY D(MISCNR_FLW_SUM) = ‐ 1322.36066084793 + 0.161933237568206 *
D(MISCNR_FLW_SUM_TREND( ‐ 1) ‐ MISCNR_FLW_SUM( ‐ 1)) + 0.7022934726766 *
D((MISCNR_STK_SUM_TREND( ‐ 1) * MISCNR_REF( ‐ 1)) ‐ MISCNR_STK_SUM( ‐ 1)) + 1488.60579225866 *
D(@MOVAV(EEA( ‐ 1) , 20)) + 3009.74914765 * DUM_MISCNR
Eqn 142: @IDENTITY miscnr_flw_ENC = miscnr_flw_sum * @movav(miscnr_flw_ENC , 20) /
@movav(miscnr_flw_sum , 20)
Eqn 143: @IDENTITY miscnr_flw_ESC = miscnr_flw_sum * @movav(miscnr_flw_ESC , 20) /
@movav(miscnr_flw_sum , 20)
Eqn 144: @IDENTITY miscnr_flw_MATL = miscnr_flw_sum * @movav(miscnr_flw_MATL , 20) /
@movav(miscnr_flw_sum , 20)
Eqn 145: @IDENTITY miscnr_flw_MTN = miscnr_flw_sum * @movav(miscnr_flw_MTN , 20) /
@movav(miscnr_flw_sum , 20)
Eqn 146: @IDENTITY miscnr_flw_NENG = miscnr_flw_sum * @movav(miscnr_flw_NENG , 20) /
@movav(miscnr_flw_sum , 20)
Eqn 147: @IDENTITY miscnr_flw_PAC = miscnr_flw_sum * @movav(miscnr_flw_PAC , 20) /
@movav(miscnr_flw_sum , 20)
Eqn 148: @IDENTITY miscnr_flw_SATL = miscnr_flw_sum * @movav(miscnr_flw_SATL , 20) /
@movav(miscnr_flw_sum , 20)
Eqn 149: @IDENTITY miscnr_flw_WNC = miscnr_flw_sum * @movav(miscnr_flw_WNC , 20) /
@movav(miscnr_flw_sum , 20)
Eqn 150: @IDENTITY miscnr_flw_WSC = miscnr_flw_sum * @movav(miscnr_flw_WSC , 20) /
@movav(miscnr_flw_sum , 20)
Eqn 151: @IDENTITY miscnr_stk_sum = miscnr_stk_sum(‐1) + miscnr_flw_sum ‐ miscnr_rem_sum_trend
Eqn 152: @IDENTITY miscnr_stk_ENC = miscnr_stk_ENC(‐1) + miscnr_flw_ENC ‐ (miscnr_rem_sum_trend *
miscnr_stk_ENC(‐1) / miscnr_stk_sum(‐1))
Eqn 153: @IDENTITY miscnr_stk_ESC = miscnr_stk_ESC(‐1) + miscnr_flw_ESC ‐ (miscnr_rem_sum_trend *
miscnr_stk_ESC(‐1) / miscnr_stk_sum(‐1))
Eqn 154: @IDENTITY miscnr_stk_MATL = miscnr_stk_MATL(‐1) + miscnr_flw_MATL ‐ (miscnr_rem_sum_trend
* miscnr_stk_MATL(‐1) / miscnr_stk_sum(‐1))
May 2014
U.S. Energy Information Administration | NEMS Macroeconomic Activity Module Documentation Report 148
Eqn 155: @IDENTITY miscnr_stk_MTN = miscnr_stk_MTN(‐1) + miscnr_flw_MTN ‐ (miscnr_rem_sum_trend *
miscnr_stk_MTN(‐1) / miscnr_stk_sum(‐1))
Eqn 156: @IDENTITY miscnr_stk_NENG = miscnr_stk_NENG(‐1) + miscnr_flw_NENG ‐ (miscnr_rem_sum_trend
* miscnr_stk_NENG(‐1) / miscnr_stk_sum(‐1))
Eqn 157: @IDENTITY miscnr_stk_PAC = miscnr_stk_PAC(‐1) + miscnr_flw_PAC ‐ (miscnr_rem_sum_trend *
miscnr_stk_PAC(‐1) / miscnr_stk_sum(‐1))
Eqn 158: @IDENTITY miscnr_stk_SATL = miscnr_stk_SATL(‐1) + miscnr_flw_SATL ‐ (miscnr_rem_sum_trend *
miscnr_stk_SATL(‐1) / miscnr_stk_sum(‐1))
Eqn 159: @IDENTITY miscnr_stk_WNC = miscnr_stk_WNC(‐1) + miscnr_flw_WNC ‐ (miscnr_rem_sum_trend *
miscnr_stk_WNC(‐1) / miscnr_stk_sum(‐1))
Eqn 160: @IDENTITY miscnr_stk_WSC = miscnr_stk_WSC(‐1) + miscnr_flw_WSC ‐ (miscnr_rem_sum_trend *
miscnr_stk_WSC(‐1) / miscnr_stk_sum(‐1))
OFFICE Office; private, federal, and state and local offices
Eqn 161: @IDENTITY D(OFFICE_FLW_SUM) = ‐ 2595.75687563459 + 0.205295625413658 *
D(OFFICE_FLW_SUM_TREND( ‐ 1) ‐ OFFICE_FLW_SUM( ‐ 1)) + 0.120417645519947 *
D((OFFICE_STK_SUM_TREND( ‐ 1) * OFFICE_REF( ‐ 1)) ‐ OFFICE_STK_SUM( ‐ 1)) + 10250.2586987342 *
D(GDPR( ‐ 8) / NP_SUM( ‐ 8)) + 177094.566675887 * D(@MOVAV(IFNRESCML( ‐ 1) / JPIFNRESC( ‐ 1) , 20)) +
1449.44151663276 * D(EEA( ‐ 20))
Eqn 162: @IDENTITY office_flw_ENC = office_flw_sum * @movav(office_flw_ENC , 20) /
@movav(office_flw_sum , 20)
Eqn 163: @IDENTITY office_flw_ESC = office_flw_sum * @movav(office_flw_ESC , 20) /
@movav(office_flw_sum , 20)
Eqn 164: @IDENTITY office_flw_MATL = office_flw_sum * @movav(office_flw_MATL , 20) /
@movav(office_flw_sum , 20)
Eqn 165: @IDENTITY office_flw_MTN = office_flw_sum * @movav(office_flw_MTN , 20) /
@movav(office_flw_sum , 20)
Eqn 166: @IDENTITY office_flw_NENG = office_flw_sum * @movav(office_flw_NENG , 20) /
@movav(office_flw_sum , 20)
Eqn 167: @IDENTITY office_flw_PAC = office_flw_sum * @movav(office_flw_PAC , 20) /
@movav(office_flw_sum , 20)
Eqn 168: @IDENTITY office_flw_SATL = office_flw_sum * @movav(office_flw_SATL , 20) /
@movav(office_flw_sum , 20)
May 2014
U.S. Energy Information Administration | NEMS Macroeconomic Activity Module Documentation Report 149
Eqn 169: @IDENTITY office_flw_WNC = office_flw_sum * @movav(office_flw_WNC , 20) /
@movav(office_flw_sum , 20)
Eqn 170: @IDENTITY office_flw_WSC = office_flw_sum * @movav(office_flw_WSC , 20) /
@movav(office_flw_sum , 20)
Eqn 171: @IDENTITY office_stk_sum = office_stk_sum(‐1) + office_flw_sum ‐ office_rem_sum_trend
Eqn 172: @IDENTITY office_stk_ENC = office_stk_ENC(‐1) + office_flw_ENC ‐ (office_rem_sum_trend *
office_stk_ENC(‐1) / office_stk_sum(‐1))
Eqn 173: @IDENTITY office_stk_ESC = office_stk_ESC(‐1) + office_flw_ESC ‐ (office_rem_sum_trend *
office_stk_ESC(‐1) / office_stk_sum(‐1))
Eqn 174: @IDENTITY office_stk_MATL = office_stk_MATL(‐1) + office_flw_MATL ‐ (office_rem_sum_trend *
office_stk_MATL(‐1) / office_stk_sum(‐1))
Eqn 175: @IDENTITY office_stk_MTN = office_stk_MTN(‐1) + office_flw_MTN ‐ (office_rem_sum_trend *
office_stk_MTN(‐1) / office_stk_sum(‐1))
Eqn 176: @IDENTITY office_stk_NENG = office_stk_NENG(‐1) + office_flw_NENG ‐ (office_rem_sum_trend *
office_stk_NENG(‐1) / office_stk_sum(‐1))
Eqn 177: @IDENTITY office_stk_PAC = office_stk_PAC(‐1) + office_flw_PAC ‐ (office_rem_sum_trend *
office_stk_PAC(‐1) / office_stk_sum(‐1))
Eqn 178: @IDENTITY office_stk_SATL = office_stk_SATL(‐1) + office_flw_SATL ‐ (office_rem_sum_trend *
office_stk_SATL(‐1) / office_stk_sum(‐1))
Eqn 179: @IDENTITY office_stk_WNC = office_stk_WNC(‐1) + office_flw_WNC ‐ (office_rem_sum_trend *
office_stk_WNC(‐1) / office_stk_sum(‐1))
Eqn 180: @IDENTITY office_stk_WSC = office_stk_WSC(‐1) + office_flw_WSC ‐ (office_rem_sum_trend *
office_stk_WSC(‐1) / office_stk_sum(‐1))
PUB Public; federal and state and local
Eqn 181: @IDENTITY D(PUB_FLW_SUM) = 528.74993098658 + 0.14006220376041 *
D(PUB_FLW_SUM_TREND( ‐ 1) ‐ PUB_FLW_SUM( ‐ 1)) + 0.585950333183542 * D((PUB_STK_SUM_TREND( ‐
1) * PUB_REF( ‐ 1) * 0.9) ‐ PUB_STK_SUM( ‐ 1)) + 529.822505160783 * D(EEA( ‐ 12)) ‐ 3224.97920992087 *
DUM_PUB
Eqn 182: @IDENTITY pub_flw_ENC = pub_flw_sum * @movav(pub_flw_ENC , 20) / @movav(pub_flw_sum ,
20)
Eqn 183: @IDENTITY pub_flw_ESC = pub_flw_sum * @movav(pub_flw_ESC , 20) / @movav(pub_flw_sum ,
20)
May 2014
U.S. Energy Information Administration | NEMS Macroeconomic Activity Module Documentation Report 150
Eqn 184: @IDENTITY pub_flw_MATL = pub_flw_sum * @movav(pub_flw_MATL , 20) / @movav(pub_flw_sum
, 20)
Eqn 185: @IDENTITY pub_flw_MTN = pub_flw_sum * @movav(pub_flw_MTN , 20) / @movav(pub_flw_sum ,
20)
Eqn 186: @IDENTITY pub_flw_NENG = pub_flw_sum * @movav(pub_flw_NENG , 20) /
@movav(pub_flw_sum , 20)
Eqn 187: @IDENTITY pub_flw_PAC = pub_flw_sum * @movav(pub_flw_PAC , 20) / @movav(pub_flw_sum ,
20)
Eqn 188: @IDENTITY pub_flw_SATL = pub_flw_sum * @movav(pub_flw_SATL , 20) / @movav(pub_flw_sum ,
20)
Eqn 189: @IDENTITY pub_flw_WNC = pub_flw_sum * @movav(pub_flw_WNC , 20) / @movav(pub_flw_sum
, 20)
Eqn 190: @IDENTITY pub_flw_WSC = pub_flw_sum * @movav(pub_flw_WSC , 20) / @movav(pub_flw_sum ,
20)
Eqn 191: @IDENTITY pub_stk_sum = pub_stk_sum(‐1) + pub_flw_sum ‐ pub_rem_sum_trend
Eqn 192: @IDENTITY pub_stk_ENC = pub_stk_ENC(‐1) + pub_flw_ENC ‐ (pub_rem_sum_trend *
pub_stk_ENC(‐1) / pub_stk_sum(‐1))
Eqn 193: @IDENTITY pub_stk_ESC = pub_stk_ESC(‐1) + pub_flw_ESC ‐ (pub_rem_sum_trend * pub_stk_ESC(‐
1) / pub_stk_sum(‐1))
Eqn 194: @IDENTITY pub_stk_MATL = pub_stk_MATL(‐1) + pub_flw_MATL ‐ (pub_rem_sum_trend *
pub_stk_MATL(‐1) / pub_stk_sum(‐1))
Eqn 195: @IDENTITY pub_stk_MTN = pub_stk_MTN(‐1) + pub_flw_MTN ‐ (pub_rem_sum_trend *
pub_stk_MTN(‐1) / pub_stk_sum(‐1))
Eqn 196: @IDENTITY pub_stk_NENG = pub_stk_NENG(‐1) + pub_flw_NENG ‐ (pub_rem_sum_trend *
pub_stk_NENG(‐1) / pub_stk_sum(‐1))
Eqn 197: @IDENTITY pub_stk_PAC = pub_stk_PAC(‐1) + pub_flw_PAC ‐ (pub_rem_sum_trend *
pub_stk_PAC(‐1) / pub_stk_sum(‐1))
Eqn 198: @IDENTITY pub_stk_SATL = pub_stk_SATL(‐1) + pub_flw_SATL ‐ (pub_rem_sum_trend *
pub_stk_SATL(‐1) / pub_stk_sum(‐1))
Eqn 199: @IDENTITY pub_stk_WNC = pub_stk_WNC(‐1) + pub_flw_WNC ‐ (pub_rem_sum_trend *
pub_stk_WNC(‐1) / pub_stk_sum(‐1))
May 2014
U.S. Energy Information Administration | NEMS Macroeconomic Activity Module Documentation Report 151
Eqn 200: @IDENTITY pub_stk_WSC = pub_stk_WSC(‐1) + pub_flw_WSC ‐ (pub_rem_sum_trend *
pub_stk_WSC(‐1) / pub_stk_sum(‐1))
REL Religious
Eqn 201: @IDENTITY D(REL_FLW_SUM) = ‐ 249.871575319052 + 0.183654300512567 *
D(REL_FLW_SUM_TREND( ‐ 1) ‐ REL_FLW_SUM( ‐ 1)) + 0.49330068831322 * D((REL_STK_SUM_TREND( ‐ 1) *
REL_REF( ‐ 1) * 0.6) ‐ REL_STK_SUM( ‐ 1)) + 1047.77036829315 * D(@MOVAV(GDPR( ‐ 1) / NP_SUM( ‐ 1) ,
5)) + 268.552641039702 * D(EEA( ‐ 12)) + [AR(4) = 0.285506223202413]
Eqn 202: @IDENTITY rel_flw_ENC = rel_flw_sum * @movav(rel_flw_ENC , 20) / @movav(rel_flw_sum , 20)
Eqn 203; @IDENTITY rel_flw_ESC = rel_flw_sum * @movav(rel_flw_ESC , 20) / @movav(rel_flw_sum , 20)
Eqn 204: @IDENTITY rel_flw_MATL = rel_flw_sum * @movav(rel_flw_MATL , 20) / @movav(rel_flw_sum ,
20)
Eqn 205: @IDENTITY rel_flw_MTN = rel_flw_sum * @movav(rel_flw_MTN , 20) / @movav(rel_flw_sum , 20)
Eqn 206: @IDENTITY rel_flw_NENG = rel_flw_sum * @movav(rel_flw_NENG , 20) / @movav(rel_flw_sum ,
20)
Eqn 207: @IDENTITY rel_flw_PAC = rel_flw_sum * @movav(rel_flw_PAC , 20) / @movav(rel_flw_sum , 20)
Eqn 208: @IDENTITY rel_flw_SATL = rel_flw_sum * @movav(rel_flw_SATL , 20) / @movav(rel_flw_sum , 20)
Eqn 209: @IDENTITY rel_flw_WNC = rel_flw_sum * @movav(rel_flw_WNC , 20) / @movav(rel_flw_sum , 20)
Eqn 210: @IDENTITY rel_flw_WSC = rel_flw_sum * @movav(rel_flw_WSC , 20) / @movav(rel_flw_sum , 20)
Eqn 211: @IDENTITY rel_stk_sum = rel_stk_sum(‐1) + rel_flw_sum ‐ rel_rem_sum_trend
Eqn 212: @IDENTITY rel_stk_ENC = rel_stk_ENC(‐1) + rel_flw_ENC ‐ (rel_rem_sum_trend * rel_stk_ENC(‐1) /
rel_stk_sum(‐1))
Eqn 213: @IDENTITY rel_stk_ESC = rel_stk_ESC(‐1) + rel_flw_ESC ‐ (rel_rem_sum_trend * rel_stk_ESC(‐1) /
rel_stk_sum(‐1))
Eqn 214: @IDENTITY rel_stk_MATL = rel_stk_MATL(‐1) + rel_flw_MATL ‐ (rel_rem_sum_trend *
rel_stk_MATL(‐1) / rel_stk_sum(‐1))
Eqn 215: @IDENTITY rel_stk_MTN = rel_stk_MTN(‐1) + rel_flw_MTN ‐ (rel_rem_sum_trend * rel_stk_MTN(‐1)
/ rel_stk_sum(‐1))
Eqn 216: @IDENTITY rel_stk_NENG = rel_stk_NENG(‐1) + rel_flw_NENG ‐ (rel_rem_sum_trend *
rel_stk_NENG(‐1) / rel_stk_sum(‐1))
May 2014
U.S. Energy Information Administration | NEMS Macroeconomic Activity Module Documentation Report 152
Eqn 217: @IDENTITY rel_stk_PAC = rel_stk_PAC(‐1) + rel_flw_PAC ‐ (rel_rem_sum_trend * rel_stk_PAC(‐1) /
rel_stk_sum(‐1))
Eqn 218: @IDENTITY rel_stk_SATL = rel_stk_SATL(‐1) + rel_flw_SATL ‐ (rel_rem_sum_trend * rel_stk_SATL(‐1)
/ rel_stk_sum(‐1))
Eqn 219: @IDENTITY rel_stk_WNC = rel_stk_WNC(‐1) + rel_flw_WNC ‐ (rel_rem_sum_trend * rel_stk_WNC(‐
1) / rel_stk_sum(‐1))
Eqn 220: @IDENTITY rel_stk_WSC = rel_stk_WSC(‐1) + rel_flw_WSC ‐ (rel_rem_sum_trend * rel_stk_WSC(‐1)
/ rel_stk_sum(‐1))
STORES Stores; stores and restaurants
Eqn 221: @IDENTITY D(STORES_FLW_SUM) = ‐ 8257.82490564547 + 0.171258137307209 *
D(STORES_FLW_SUM_TREND( ‐ 1) ‐ STORES_FLW_SUM( ‐ 1)) + 0.371734827326242 *
D((STORES_STK_SUM_TREND( ‐ 1) * STORES_REF( ‐ 1) * 0.7) ‐ STORES_STK_SUM( ‐ 1)) + 23704.8662301095
* D(@MOVAV(GDPR( ‐ 1) / NP_SUM( ‐ 1) , 12)) + 175.998360297936 * D(@MOVAV(CONSR( ‐ 1) , 20)) ‐
2755.77141249091 * DUM_STORES
Eqn 222: @IDENTITY stores_flw_ENC = stores_flw_sum * @movav(stores_flw_ENC , 20) /
@movav(stores_flw_sum , 20)
Eqn 223: @IDENTITY stores_flw_ESC = stores_flw_sum * @movav(stores_flw_ESC , 20) /
@movav(stores_flw_sum , 20)
Eqn 224: @IDENTITY stores_flw_MATL = stores_flw_sum * @movav(stores_flw_MATL , 20) /
@movav(stores_flw_sum , 20)
Eqn 225: @IDENTITY stores_flw_MTN = stores_flw_sum * @movav(stores_flw_MTN , 20) /
@movav(stores_flw_sum , 20)
Eqn 226: @IDENTITY stores_flw_NENG = stores_flw_sum * @movav(stores_flw_NENG , 20) /
@movav(stores_flw_sum , 20)
Eqn 227: @IDENTITY stores_flw_PAC = stores_flw_sum * @movav(stores_flw_PAC , 20) /
@movav(stores_flw_sum , 20)
Eqn 227: @IDENTITY stores_flw_SATL = stores_flw_sum * @movav(stores_flw_SATL , 20) /
@movav(stores_flw_sum , 20)
Eqn 228: @IDENTITY stores_flw_WNC = stores_flw_sum * @movav(stores_flw_WNC , 20) /
@movav(stores_flw_sum , 20)
Eqn 229: @IDENTITY stores_flw_WSC = stores_flw_sum * @movav(stores_flw_WSC , 20) /
@movav(stores_flw_sum , 20)
May 2014
U.S. Energy Information Administration | NEMS Macroeconomic Activity Module Documentation Report 153
Eqn 230: @IDENTITY stores_stk_sum = stores_stk_sum(‐1) + stores_flw_sum ‐ stores_rem_sum_trend
Eqn 231: @IDENTITY stores_stk_ENC = stores_stk_ENC(‐1) + stores_flw_ENC ‐ (stores_rem_sum_trend *
stores_stk_ENC(‐1) / stores_stk_sum(‐1))
Eqn 232: @IDENTITY stores_stk_ESC = stores_stk_ESC(‐1) + stores_flw_ESC ‐ (stores_rem_sum_trend *
stores_stk_ESC(‐1) / stores_stk_sum(‐1))
Eqn 233: @IDENTITY stores_stk_MATL = stores_stk_MATL(‐1) + stores_flw_MATL ‐ (stores_rem_sum_trend *
stores_stk_MATL(‐1) / stores_stk_sum(‐1))
Eqn 234: @IDENTITY stores_stk_MTN = stores_stk_MTN(‐1) + stores_flw_MTN ‐ (stores_rem_sum_trend *
stores_stk_MTN(‐1) / stores_stk_sum(‐1))
Eqn 235: @IDENTITY stores_stk_NENG = stores_stk_NENG(‐1) + stores_flw_NENG ‐ (stores_rem_sum_trend *
stores_stk_NENG(‐1) / stores_stk_sum(‐1))
Eqn 236: @IDENTITY stores_stk_PAC = stores_stk_PAC(‐1) + stores_flw_PAC ‐ (stores_rem_sum_trend *
stores_stk_PAC(‐1) / stores_stk_sum(‐1))
Eqn 237: @IDENTITY stores_stk_SATL = stores_stk_SATL(‐1) + stores_flw_SATL ‐ (stores_rem_sum_trend *
stores_stk_SATL(‐1) / stores_stk_sum(‐1))
Eqn 238: @IDENTITY stores_stk_WNC = stores_stk_WNC(‐1) + stores_flw_WNC ‐ (stores_rem_sum_trend *
stores_stk_WNC(‐1) / stores_stk_sum(‐1))
Eqn 239: @IDENTITY stores_stk_WSC = stores_stk_WSC(‐1) + stores_flw_WSC ‐ (stores_rem_sum_trend *
stores_stk_WSC(‐1) / stores_stk_sum(‐1))
WARE Warehouse; manufacturing and wholesale trade, public and federally‐owned warehouses
Eqn 240: @IDENTITY D(WARE_FLW_SUM) = ‐ 2282.90138789341 + 0.186229258601011 *
D(WARE_FLW_SUM_TREND( ‐ 1) ‐ WARE_FLW_SUM( ‐ 1)) + 0.058357987358719 *
D((WARE_STK_SUM_TREND( ‐ 1) * WARE_REF( ‐ 1) * 0.8) ‐ WARE_STK_SUM( ‐ 1)) + 4473.13743571819 *
D(GDPR( ‐ 8) / NP_SUM( ‐ 8)) + 6023.37571972253 * D(CONSR( ‐ 12) / NP_SUM( ‐ 12)) + 30.7421894568754
* D(IIR( ‐ 1)) + 2425.87590522482 * D(EEA( ‐ 4)) + 0.119444888112384 * D(SUM_FLW_SUM( ‐ 1)) + [AR(1) =
‐ 0.618850206648254 , AR(2) = ‐ 0.2884020685659 , AR(3) = ‐ 0.184144819399751]
Eqn 241: @IDENTITY ware_flw_ENC = ware_flw_sum * @movav(ware_flw_ENC , 20) /
@movav(ware_flw_sum , 20)
Eqn 242: @IDENTITY ware_flw_ESC = ware_flw_sum * @movav(ware_flw_ESC , 20) /
@movav(ware_flw_sum , 20)
Eqn 243: @IDENTITY ware_flw_MATL = ware_flw_sum * @movav(ware_flw_MATL , 20) /
@movav(ware_flw_sum , 20)
May 2014
U.S. Energy Information Administration | NEMS Macroeconomic Activity Module Documentation Report 154
Eqn 244: @IDENTITY ware_flw_MTN = ware_flw_sum * @movav(ware_flw_MTN , 20) /
@movav(ware_flw_sum , 20)
Eqn 245: @IDENTITY ware_flw_NENG = ware_flw_sum * @movav(ware_flw_NENG , 20) /
@movav(ware_flw_sum , 20)
Eqn 246: @IDENTITY ware_flw_PAC = ware_flw_sum * @movav(ware_flw_PAC , 20) /
@movav(ware_flw_sum , 20)
Eqn 247: @IDENTITY ware_flw_SATL = ware_flw_sum * @movav(ware_flw_SATL , 20) /
@movav(ware_flw_sum , 20)
Eqn 248: @IDENTITY ware_flw_WNC = ware_flw_sum * @movav(ware_flw_WNC , 20) /
@movav(ware_flw_sum , 20)
Eqn 249: @IDENTITY ware_flw_WSC = ware_flw_sum * @movav(ware_flw_WSC , 20) /
@movav(ware_flw_sum , 20)
Eqn 250: @IDENTITY ware_stk_sum = ware_stk_sum(‐1) + ware_flw_sum ‐ ware_rem_sum_trend
Eqn 251: @IDENTITY ware_stk_ENC = ware_stk_ENC(‐1) + ware_flw_ENC ‐ (ware_rem_sum_trend *
ware_stk_ENC(‐1) / ware_stk_sum(‐1))
Eqn 252: @IDENTITY ware_stk_ESC = ware_stk_ESC(‐1) + ware_flw_ESC ‐ (ware_rem_sum_trend *
ware_stk_ESC(‐1) / ware_stk_sum(‐1))
Eqn 253: @IDENTITY ware_stk_MATL = ware_stk_MATL(‐1) + ware_flw_MATL ‐ (ware_rem_sum_trend *
ware_stk_MATL(‐1) / ware_stk_sum(‐1))
Eqn 254: @IDENTITY ware_stk_MTN = ware_stk_MTN(‐1) + ware_flw_MTN ‐ (ware_rem_sum_trend *
ware_stk_MTN(‐1) / ware_stk_sum(‐1))
Eqn 255: @IDENTITY ware_stk_NENG = ware_stk_NENG(‐1) + ware_flw_NENG ‐ (ware_rem_sum_trend *
ware_stk_NENG(‐1) / ware_stk_sum(‐1))
Eqn 256: @IDENTITY ware_stk_PAC = ware_stk_PAC(‐1) + ware_flw_PAC ‐ (ware_rem_sum_trend *
ware_stk_PAC(‐1) / ware_stk_sum(‐1))
Eqn 257: @IDENTITY ware_stk_SATL = ware_stk_SATL(‐1) + ware_flw_SATL ‐ (ware_rem_sum_trend *
ware_stk_SATL(‐1) / ware_stk_sum(‐1))
Eqn 258: @IDENTITY ware_stk_WNC = ware_stk_WNC(‐1) + ware_flw_WNC ‐ (ware_rem_sum_trend *
ware_stk_WNC(‐1) / ware_stk_sum(‐1))
Eqn 259: @IDENTITY ware_stk_WSC = ware_stk_WSC(‐1) + ware_flw_WSC ‐ (ware_rem_sum_trend *
ware_stk_WSC(‐1) / ware_stk_sum(‐1))
May 2014
U.S. Energy Information Administration | NEMS Macroeconomic Activity Module Documentation Report 155
Appendix C3: Regional Industrial Output and Employment Models
Regional Industrial Output Model
Endogenous variables:
REV{I}_{R} Output in billions of real 2005 dollars for sector I, region R (e.g. REVIND1_ENC)
XREV{I}_{R} Output in billions of real 2005 dollars for sector I, region R, equation estimate (e.g.
XREVIND1_ENC)
Codes and descriptions of the sectors are presented in Table A14. Codes and descriptions of the regions are in
Table B6.
Exogenous variables:
CPI_{R} Consumer Price Index, All‐Urban for region R
EEA Employment – Total Nonfarm Payrolls
GSPR_{R} Gross State Product in billions of real 2005 dollars for region R
JPGDP Chain Price Index – Gross Domestic Product
NP_{R} Population in million for region R
RMPRIME Prime rate at commercial banks in percent per annum
RWM_{R} Annual Wage for manufacturing sectors in dollars for region R
RWNM_{R} Annual Wage for nonmanufacturing/services sectors in dollars for region R
WPI05 Producer Price Index – fuel and power
@TREND Time Trend
Equations:
Alignment process:
The alignment process takes the regional output shares of sector I computed from the equations and applied
them onto the national output of sector I. This ensures that the sum of the nine regions aligns to the national
total.
REV{I}_{R} = (XREV{I}_{R} / XREV{I}_SUM ) * REV{I}_SUM
where:
REV{I}_{R} = Output for sector I, region R
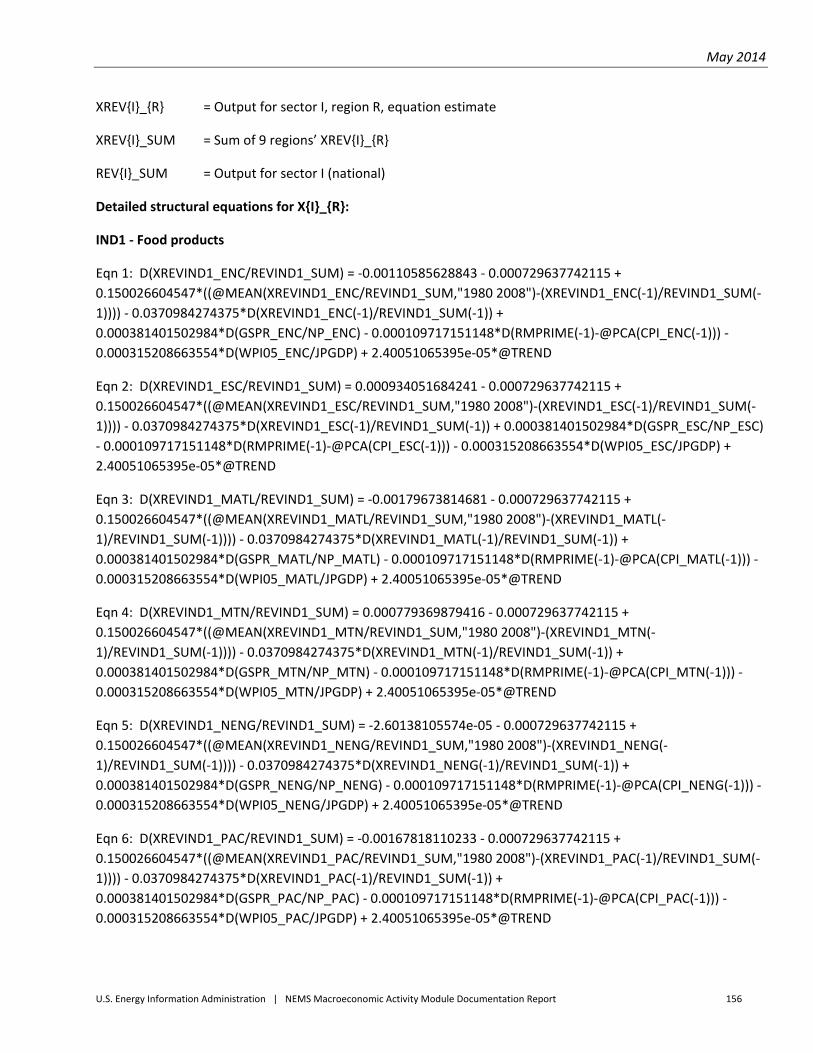
May 2014
U.S. Energy Information Administration | NEMS Macroeconomic Activity Module Documentation Report 156
XREV{I}_{R} = Output for sector I, region R, equation estimate
XREV{I}_SUM = Sum of 9 regions’ XREV{I}_{R}
REV{I}_SUM = Output for sector I (national)
Detailed structural equations for X{I}_{R}:
IND1 ‐ Food products
Eqn 1: D(XREVIND1_ENC/REVIND1_SUM) = ‐0.00110585628843 ‐ 0.000729637742115 +
0.150026604547*((@MEAN(XREVIND1_ENC/REVIND1_SUM,"1980 2008")‐(XREVIND1_ENC(‐1)/REVIND1_SUM(‐
1)))) ‐ 0.0370984274375*D(XREVIND1_ENC(‐1)/REVIND1_SUM(‐1)) +
0.000381401502984*D(GSPR_ENC/NP_ENC) ‐ 0.000109717151148*D(RMPRIME(‐1)‐@PCA(CPI_ENC(‐1))) ‐
0.000315208663554*D(WPI05_ENC/JPGDP) + 2.40051065395e‐05*@TREND
Eqn 2: D(XREVIND1_ESC/REVIND1_SUM) = 0.000934051684241 ‐ 0.000729637742115 +
0.150026604547*((@MEAN(XREVIND1_ESC/REVIND1_SUM,"1980 2008")‐(XREVIND1_ESC(‐1)/REVIND1_SUM(‐
1)))) ‐ 0.0370984274375*D(XREVIND1_ESC(‐1)/REVIND1_SUM(‐1)) + 0.000381401502984*D(GSPR_ESC/NP_ESC)
‐ 0.000109717151148*D(RMPRIME(‐1)‐@PCA(CPI_ESC(‐1))) ‐ 0.000315208663554*D(WPI05_ESC/JPGDP) +
2.40051065395e‐05*@TREND
Eqn 3: D(XREVIND1_MATL/REVIND1_SUM) = ‐0.00179673814681 ‐ 0.000729637742115 +
0.150026604547*((@MEAN(XREVIND1_MATL/REVIND1_SUM,"1980 2008")‐(XREVIND1_MATL(‐
1)/REVIND1_SUM(‐1)))) ‐ 0.0370984274375*D(XREVIND1_MATL(‐1)/REVIND1_SUM(‐1)) +
0.000381401502984*D(GSPR_MATL/NP_MATL) ‐ 0.000109717151148*D(RMPRIME(‐1)‐@PCA(CPI_MATL(‐1))) ‐
0.000315208663554*D(WPI05_MATL/JPGDP) + 2.40051065395e‐05*@TREND
Eqn 4: D(XREVIND1_MTN/REVIND1_SUM) = 0.000779369879416 ‐ 0.000729637742115 +
0.150026604547*((@MEAN(XREVIND1_MTN/REVIND1_SUM,"1980 2008")‐(XREVIND1_MTN(‐
1)/REVIND1_SUM(‐1)))) ‐ 0.0370984274375*D(XREVIND1_MTN(‐1)/REVIND1_SUM(‐1)) +
0.000381401502984*D(GSPR_MTN/NP_MTN) ‐ 0.000109717151148*D(RMPRIME(‐1)‐@PCA(CPI_MTN(‐1))) ‐
0.000315208663554*D(WPI05_MTN/JPGDP) + 2.40051065395e‐05*@TREND
Eqn 5: D(XREVIND1_NENG/REVIND1_SUM) = ‐2.60138105574e‐05 ‐ 0.000729637742115 +
0.150026604547*((@MEAN(XREVIND1_NENG/REVIND1_SUM,"1980 2008")‐(XREVIND1_NENG(‐
1)/REVIND1_SUM(‐1)))) ‐ 0.0370984274375*D(XREVIND1_NENG(‐1)/REVIND1_SUM(‐1)) +
0.000381401502984*D(GSPR_NENG/NP_NENG) ‐ 0.000109717151148*D(RMPRIME(‐1)‐@PCA(CPI_NENG(‐1))) ‐
0.000315208663554*D(WPI05_NENG/JPGDP) + 2.40051065395e‐05*@TREND
Eqn 6: D(XREVIND1_PAC/REVIND1_SUM) = ‐0.00167818110233 ‐ 0.000729637742115 +
0.150026604547*((@MEAN(XREVIND1_PAC/REVIND1_SUM,"1980 2008")‐(XREVIND1_PAC(‐1)/REVIND1_SUM(‐
1)))) ‐ 0.0370984274375*D(XREVIND1_PAC(‐1)/REVIND1_SUM(‐1)) +
0.000381401502984*D(GSPR_PAC/NP_PAC) ‐ 0.000109717151148*D(RMPRIME(‐1)‐@PCA(CPI_PAC(‐1))) ‐
0.000315208663554*D(WPI05_PAC/JPGDP) + 2.40051065395e‐05*@TREND
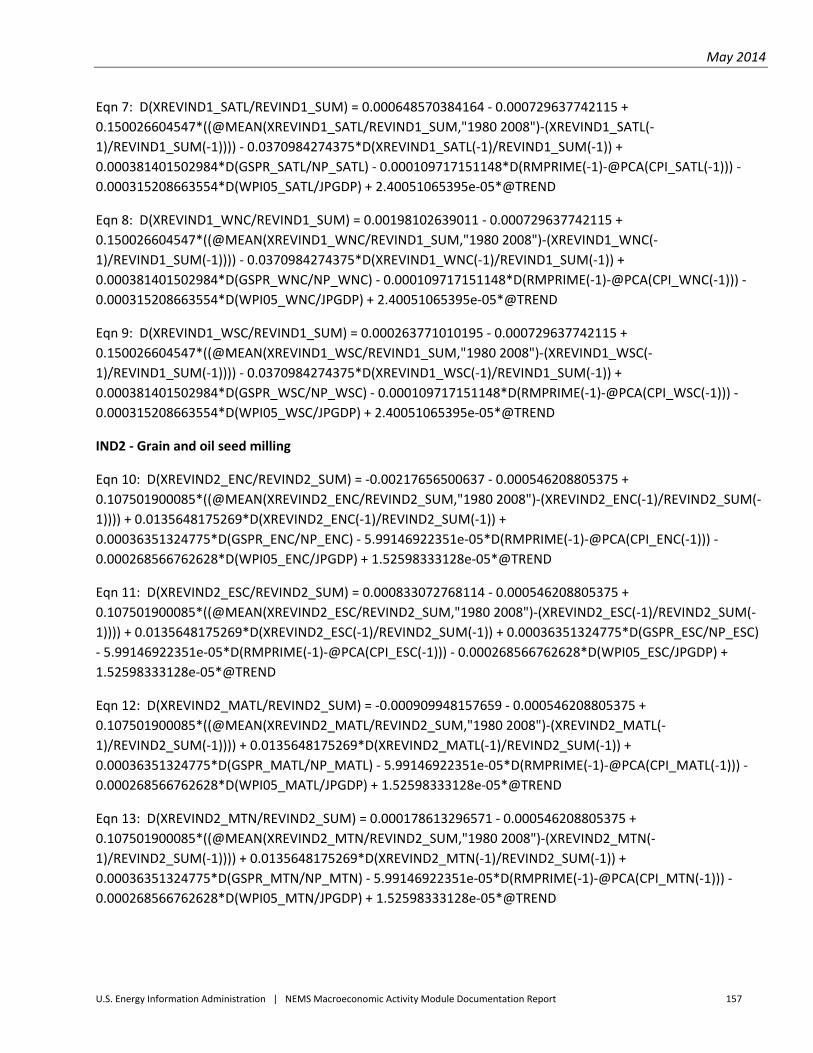
May 2014
U.S. Energy Information Administration | NEMS Macroeconomic Activity Module Documentation Report 157
Eqn 7: D(XREVIND1_SATL/REVIND1_SUM) = 0.000648570384164 ‐ 0.000729637742115 +
0.150026604547*((@MEAN(XREVIND1_SATL/REVIND1_SUM,"1980 2008")‐(XREVIND1_SATL(‐
1)/REVIND1_SUM(‐1)))) ‐ 0.0370984274375*D(XREVIND1_SATL(‐1)/REVIND1_SUM(‐1)) +
0.000381401502984*D(GSPR_SATL/NP_SATL) ‐ 0.000109717151148*D(RMPRIME(‐1)‐@PCA(CPI_SATL(‐1))) ‐
0.000315208663554*D(WPI05_SATL/JPGDP) + 2.40051065395e‐05*@TREND
Eqn 8: D(XREVIND1_WNC/REVIND1_SUM) = 0.00198102639011 ‐ 0.000729637742115 +
0.150026604547*((@MEAN(XREVIND1_WNC/REVIND1_SUM,"1980 2008")‐(XREVIND1_WNC(‐
1)/REVIND1_SUM(‐1)))) ‐ 0.0370984274375*D(XREVIND1_WNC(‐1)/REVIND1_SUM(‐1)) +
0.000381401502984*D(GSPR_WNC/NP_WNC) ‐ 0.000109717151148*D(RMPRIME(‐1)‐@PCA(CPI_WNC(‐1))) ‐
0.000315208663554*D(WPI05_WNC/JPGDP) + 2.40051065395e‐05*@TREND
Eqn 9: D(XREVIND1_WSC/REVIND1_SUM) = 0.000263771010195 ‐ 0.000729637742115 +
0.150026604547*((@MEAN(XREVIND1_WSC/REVIND1_SUM,"1980 2008")‐(XREVIND1_WSC(‐
1)/REVIND1_SUM(‐1)))) ‐ 0.0370984274375*D(XREVIND1_WSC(‐1)/REVIND1_SUM(‐1)) +
0.000381401502984*D(GSPR_WSC/NP_WSC) ‐ 0.000109717151148*D(RMPRIME(‐1)‐@PCA(CPI_WSC(‐1))) ‐
0.000315208663554*D(WPI05_WSC/JPGDP) + 2.40051065395e‐05*@TREND
IND2 ‐ Grain and oil seed milling
Eqn 10: D(XREVIND2_ENC/REVIND2_SUM) = ‐0.00217656500637 ‐ 0.000546208805375 +
0.107501900085*((@MEAN(XREVIND2_ENC/REVIND2_SUM,"1980 2008")‐(XREVIND2_ENC(‐1)/REVIND2_SUM(‐
1)))) + 0.0135648175269*D(XREVIND2_ENC(‐1)/REVIND2_SUM(‐1)) +
0.00036351324775*D(GSPR_ENC/NP_ENC) ‐ 5.99146922351e‐05*D(RMPRIME(‐1)‐@PCA(CPI_ENC(‐1))) ‐
0.000268566762628*D(WPI05_ENC/JPGDP) + 1.52598333128e‐05*@TREND
Eqn 11: D(XREVIND2_ESC/REVIND2_SUM) = 0.000833072768114 ‐ 0.000546208805375 +
0.107501900085*((@MEAN(XREVIND2_ESC/REVIND2_SUM,"1980 2008")‐(XREVIND2_ESC(‐1)/REVIND2_SUM(‐
1)))) + 0.0135648175269*D(XREVIND2_ESC(‐1)/REVIND2_SUM(‐1)) + 0.00036351324775*D(GSPR_ESC/NP_ESC)
‐ 5.99146922351e‐05*D(RMPRIME(‐1)‐@PCA(CPI_ESC(‐1))) ‐ 0.000268566762628*D(WPI05_ESC/JPGDP) +
1.52598333128e‐05*@TREND
Eqn 12: D(XREVIND2_MATL/REVIND2_SUM) = ‐0.000909948157659 ‐ 0.000546208805375 +
0.107501900085*((@MEAN(XREVIND2_MATL/REVIND2_SUM,"1980 2008")‐(XREVIND2_MATL(‐
1)/REVIND2_SUM(‐1)))) + 0.0135648175269*D(XREVIND2_MATL(‐1)/REVIND2_SUM(‐1)) +
0.00036351324775*D(GSPR_MATL/NP_MATL) ‐ 5.99146922351e‐05*D(RMPRIME(‐1)‐@PCA(CPI_MATL(‐1))) ‐
0.000268566762628*D(WPI05_MATL/JPGDP) + 1.52598333128e‐05*@TREND
Eqn 13: D(XREVIND2_MTN/REVIND2_SUM) = 0.000178613296571 ‐ 0.000546208805375 +
0.107501900085*((@MEAN(XREVIND2_MTN/REVIND2_SUM,"1980 2008")‐(XREVIND2_MTN(‐
1)/REVIND2_SUM(‐1)))) + 0.0135648175269*D(XREVIND2_MTN(‐1)/REVIND2_SUM(‐1)) +
0.00036351324775*D(GSPR_MTN/NP_MTN) ‐ 5.99146922351e‐05*D(RMPRIME(‐1)‐@PCA(CPI_MTN(‐1))) ‐
0.000268566762628*D(WPI05_MTN/JPGDP) + 1.52598333128e‐05*@TREND
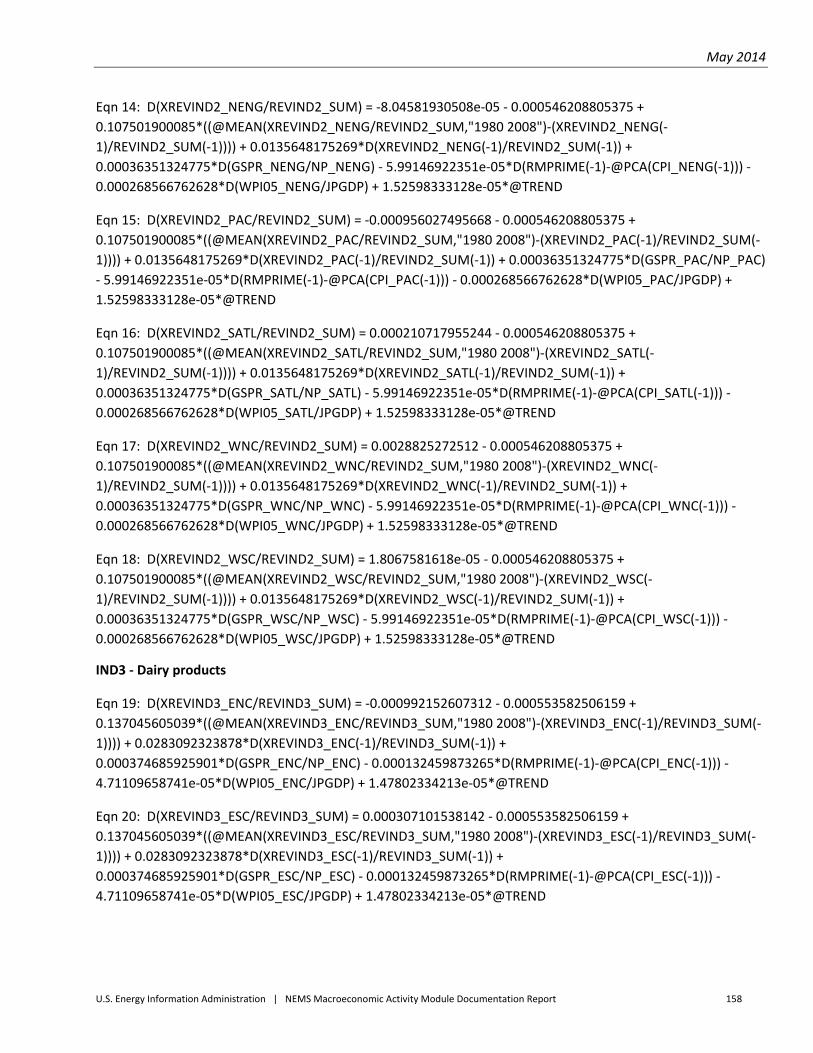
May 2014
U.S. Energy Information Administration | NEMS Macroeconomic Activity Module Documentation Report 158
Eqn 14: D(XREVIND2_NENG/REVIND2_SUM) = ‐8.04581930508e‐05 ‐ 0.000546208805375 +
0.107501900085*((@MEAN(XREVIND2_NENG/REVIND2_SUM,"1980 2008")‐(XREVIND2_NENG(‐
1)/REVIND2_SUM(‐1)))) + 0.0135648175269*D(XREVIND2_NENG(‐1)/REVIND2_SUM(‐1)) +
0.00036351324775*D(GSPR_NENG/NP_NENG) ‐ 5.99146922351e‐05*D(RMPRIME(‐1)‐@PCA(CPI_NENG(‐1))) ‐
0.000268566762628*D(WPI05_NENG/JPGDP) + 1.52598333128e‐05*@TREND
Eqn 15: D(XREVIND2_PAC/REVIND2_SUM) = ‐0.000956027495668 ‐ 0.000546208805375 +
0.107501900085*((@MEAN(XREVIND2_PAC/REVIND2_SUM,"1980 2008")‐(XREVIND2_PAC(‐1)/REVIND2_SUM(‐
1)))) + 0.0135648175269*D(XREVIND2_PAC(‐1)/REVIND2_SUM(‐1)) + 0.00036351324775*D(GSPR_PAC/NP_PAC)
‐ 5.99146922351e‐05*D(RMPRIME(‐1)‐@PCA(CPI_PAC(‐1))) ‐ 0.000268566762628*D(WPI05_PAC/JPGDP) +
1.52598333128e‐05*@TREND
Eqn 16: D(XREVIND2_SATL/REVIND2_SUM) = 0.000210717955244 ‐ 0.000546208805375 +
0.107501900085*((@MEAN(XREVIND2_SATL/REVIND2_SUM,"1980 2008")‐(XREVIND2_SATL(‐
1)/REVIND2_SUM(‐1)))) + 0.0135648175269*D(XREVIND2_SATL(‐1)/REVIND2_SUM(‐1)) +
0.00036351324775*D(GSPR_SATL/NP_SATL) ‐ 5.99146922351e‐05*D(RMPRIME(‐1)‐@PCA(CPI_SATL(‐1))) ‐
0.000268566762628*D(WPI05_SATL/JPGDP) + 1.52598333128e‐05*@TREND
Eqn 17: D(XREVIND2_WNC/REVIND2_SUM) = 0.0028825272512 ‐ 0.000546208805375 +
0.107501900085*((@MEAN(XREVIND2_WNC/REVIND2_SUM,"1980 2008")‐(XREVIND2_WNC(‐
1)/REVIND2_SUM(‐1)))) + 0.0135648175269*D(XREVIND2_WNC(‐1)/REVIND2_SUM(‐1)) +
0.00036351324775*D(GSPR_WNC/NP_WNC) ‐ 5.99146922351e‐05*D(RMPRIME(‐1)‐@PCA(CPI_WNC(‐1))) ‐
0.000268566762628*D(WPI05_WNC/JPGDP) + 1.52598333128e‐05*@TREND
Eqn 18: D(XREVIND2_WSC/REVIND2_SUM) = 1.8067581618e‐05 ‐ 0.000546208805375 +
0.107501900085*((@MEAN(XREVIND2_WSC/REVIND2_SUM,"1980 2008")‐(XREVIND2_WSC(‐
1)/REVIND2_SUM(‐1)))) + 0.0135648175269*D(XREVIND2_WSC(‐1)/REVIND2_SUM(‐1)) +
0.00036351324775*D(GSPR_WSC/NP_WSC) ‐ 5.99146922351e‐05*D(RMPRIME(‐1)‐@PCA(CPI_WSC(‐1))) ‐
0.000268566762628*D(WPI05_WSC/JPGDP) + 1.52598333128e‐05*@TREND
IND3 ‐ Dairy products
Eqn 19: D(XREVIND3_ENC/REVIND3_SUM) = ‐0.000992152607312 ‐ 0.000553582506159 +
0.137045605039*((@MEAN(XREVIND3_ENC/REVIND3_SUM,"1980 2008")‐(XREVIND3_ENC(‐1)/REVIND3_SUM(‐
1)))) + 0.0283092323878*D(XREVIND3_ENC(‐1)/REVIND3_SUM(‐1)) +
0.000374685925901*D(GSPR_ENC/NP_ENC) ‐ 0.000132459873265*D(RMPRIME(‐1)‐@PCA(CPI_ENC(‐1))) ‐
4.71109658741e‐05*D(WPI05_ENC/JPGDP) + 1.47802334213e‐05*@TREND
Eqn 20: D(XREVIND3_ESC/REVIND3_SUM) = 0.000307101538142 ‐ 0.000553582506159 +
0.137045605039*((@MEAN(XREVIND3_ESC/REVIND3_SUM,"1980 2008")‐(XREVIND3_ESC(‐1)/REVIND3_SUM(‐
1)))) + 0.0283092323878*D(XREVIND3_ESC(‐1)/REVIND3_SUM(‐1)) +
0.000374685925901*D(GSPR_ESC/NP_ESC) ‐ 0.000132459873265*D(RMPRIME(‐1)‐@PCA(CPI_ESC(‐1))) ‐
4.71109658741e‐05*D(WPI05_ESC/JPGDP) + 1.47802334213e‐05*@TREND
May 2014
U.S. Energy Information Administration | NEMS Macroeconomic Activity Module Documentation Report 159
Eqn 21: D(XREVIND3_MATL/REVIND3_SUM) = ‐0.0018423069294 ‐ 0.000553582506159 +
0.137045605039*((@MEAN(XREVIND3_MATL/REVIND3_SUM,"1980 2008")‐(XREVIND3_MATL(‐
1)/REVIND3_SUM(‐1)))) + 0.0283092323878*D(XREVIND3_MATL(‐1)/REVIND3_SUM(‐1)) +
0.000374685925901*D(GSPR_MATL/NP_MATL) ‐ 0.000132459873265*D(RMPRIME(‐1)‐@PCA(CPI_MATL(‐1))) ‐
4.71109658741e‐05*D(WPI05_MATL/JPGDP) + 1.47802334213e‐05*@TREND
Eqn 22: D(XREVIND3_MTN/REVIND3_SUM) = 0.00175916485152 ‐ 0.000553582506159 +
0.137045605039*((@MEAN(XREVIND3_MTN/REVIND3_SUM,"1980 2008")‐(XREVIND3_MTN(‐
1)/REVIND3_SUM(‐1)))) + 0.0283092323878*D(XREVIND3_MTN(‐1)/REVIND3_SUM(‐1)) +
0.000374685925901*D(GSPR_MTN/NP_MTN) ‐ 0.000132459873265*D(RMPRIME(‐1)‐@PCA(CPI_MTN(‐1))) ‐
4.71109658741e‐05*D(WPI05_MTN/JPGDP) + 1.47802334213e‐05*@TREND
Eqn 23: D(XREVIND3_NENG/REVIND3_SUM) = 7.33822611832e‐05 ‐ 0.000553582506159 +
0.137045605039*((@MEAN(XREVIND3_NENG/REVIND3_SUM,"1980 2008")‐(XREVIND3_NENG(‐
1)/REVIND3_SUM(‐1)))) + 0.0283092323878*D(XREVIND3_NENG(‐1)/REVIND3_SUM(‐1)) +
0.000374685925901*D(GSPR_NENG/NP_NENG) ‐ 0.000132459873265*D(RMPRIME(‐1)‐@PCA(CPI_NENG(‐1))) ‐
4.71109658741e‐05*D(WPI05_NENG/JPGDP) + 1.47802334213e‐05*@TREND
Eqn 24: D(XREVIND3_PAC/REVIND3_SUM) = ‐0.00152968323088 ‐ 0.000553582506159 +
0.137045605039*((@MEAN(XREVIND3_PAC/REVIND3_SUM,"1980 2008")‐(XREVIND3_PAC(‐1)/REVIND3_SUM(‐
1)))) + 0.0283092323878*D(XREVIND3_PAC(‐1)/REVIND3_SUM(‐1)) +
0.000374685925901*D(GSPR_PAC/NP_PAC) ‐ 0.000132459873265*D(RMPRIME(‐1)‐@PCA(CPI_PAC(‐1))) ‐
4.71109658741e‐05*D(WPI05_PAC/JPGDP) + 1.47802334213e‐05*@TREND
Eqn 25: D(XREVIND3_SATL/REVIND3_SUM) = 0.000431485097963 ‐ 0.000553582506159 +
0.137045605039*((@MEAN(XREVIND3_SATL/REVIND3_SUM,"1980 2008")‐(XREVIND3_SATL(‐
1)/REVIND3_SUM(‐1)))) + 0.0283092323878*D(XREVIND3_SATL(‐1)/REVIND3_SUM(‐1)) +
0.000374685925901*D(GSPR_SATL/NP_SATL) ‐ 0.000132459873265*D(RMPRIME(‐1)‐@PCA(CPI_SATL(‐1))) ‐
4.71109658741e‐05*D(WPI05_SATL/JPGDP) + 1.47802334213e‐05*@TREND
Eqn 26: D(XREVIND3_WNC/REVIND3_SUM) = 0.00154310687493 ‐ 0.000553582506159 +
0.137045605039*((@MEAN(XREVIND3_WNC/REVIND3_SUM,"1980 2008")‐(XREVIND3_WNC(‐
1)/REVIND3_SUM(‐1)))) + 0.0283092323878*D(XREVIND3_WNC(‐1)/REVIND3_SUM(‐1)) +
0.000374685925901*D(GSPR_WNC/NP_WNC) ‐ 0.000132459873265*D(RMPRIME(‐1)‐@PCA(CPI_WNC(‐1))) ‐
4.71109658741e‐05*D(WPI05_WNC/JPGDP) + 1.47802334213e‐05*@TREND
Eqn 27: D(XREVIND3_WSC/REVIND3_SUM) = 0.000249902143864 ‐ 0.000553582506159 +
0.137045605039*((@MEAN(XREVIND3_WSC/REVIND3_SUM,"1980 2008")‐(XREVIND3_WSC(‐
1)/REVIND3_SUM(‐1)))) + 0.0283092323878*D(XREVIND3_WSC(‐1)/REVIND3_SUM(‐1)) +
0.000374685925901*D(GSPR_WSC/NP_WSC) ‐ 0.000132459873265*D(RMPRIME(‐1)‐@PCA(CPI_WSC(‐1))) ‐
4.71109658741e‐05*D(WPI05_WSC/JPGDP) + 1.47802334213e‐05*@TREND
May 2014
U.S. Energy Information Administration | NEMS Macroeconomic Activity Module Documentation Report 160
IND4 – Animal slaughter and seafood products
Eqn 28: D(XREVIND4_ENC/REVIND4_SUM) = ‐0.00119527521911 ‐ 0.000645942544157 +
0.163708849289*((@MEAN(XREVIND4_ENC/REVIND4_SUM,"1980 2008")‐(XREVIND4_ENC(‐1)/REVIND4_SUM(‐
1)))) ‐ 0.0607297143439*D(XREVIND4_ENC(‐1)/REVIND4_SUM(‐1)) +
0.000372122436658*D(GSPR_ENC/NP_ENC) ‐ 9.23272665147e‐05*D(RMPRIME(‐1)‐@PCA(CPI_ENC(‐1))) ‐
0.00028699460293*D(WPI05_ENC/JPGDP) + 2.00453195185e‐05*@TREND
Eqn 29: D(XREVIND4_ESC/REVIND4_SUM) = 0.000912020708698 ‐ 0.000645942544157 +
0.163708849289*((@MEAN(XREVIND4_ESC/REVIND4_SUM,"1980 2008")‐(XREVIND4_ESC(‐1)/REVIND4_SUM(‐
1)))) ‐ 0.0607297143439*D(XREVIND4_ESC(‐1)/REVIND4_SUM(‐1)) + 0.000372122436658*D(GSPR_ESC/NP_ESC)
‐ 9.23272665147e‐05*D(RMPRIME(‐1)‐@PCA(CPI_ESC(‐1))) ‐ 0.00028699460293*D(WPI05_ESC/JPGDP) +
2.00453195185e‐05*@TREND
Eqn 30: D(XREVIND4_MATL/REVIND4_SUM) = ‐0.00108071676394 ‐ 0.000645942544157 +
0.163708849289*((@MEAN(XREVIND4_MATL/REVIND4_SUM,"1980 2008")‐(XREVIND4_MATL(‐
1)/REVIND4_SUM(‐1)))) ‐ 0.0607297143439*D(XREVIND4_MATL(‐1)/REVIND4_SUM(‐1)) +
0.000372122436658*D(GSPR_MATL/NP_MATL) ‐ 9.23272665147e‐05*D(RMPRIME(‐1)‐@PCA(CPI_MATL(‐1))) ‐
0.00028699460293*D(WPI05_MATL/JPGDP) + 2.00453195185e‐05*@TREND
Eqn 31: D(XREVIND4_MTN/REVIND4_SUM) = 0.000451670436635 ‐ 0.000645942544157 +
0.163708849289*((@MEAN(XREVIND4_MTN/REVIND4_SUM,"1980 2008")‐(XREVIND4_MTN(‐
1)/REVIND4_SUM(‐1)))) ‐ 0.0607297143439*D(XREVIND4_MTN(‐1)/REVIND4_SUM(‐1)) +
0.000372122436658*D(GSPR_MTN/NP_MTN) ‐ 9.23272665147e‐05*D(RMPRIME(‐1)‐@PCA(CPI_MTN(‐1))) ‐
0.00028699460293*D(WPI05_MTN/JPGDP) + 2.00453195185e‐05*@TREND
Eqn 32: D(XREVIND4_NENG/REVIND4_SUM) = ‐8.57918769623e‐05 ‐ 0.000645942544157 +
0.163708849289*((@MEAN(XREVIND4_NENG/REVIND4_SUM,"1980 2008")‐(XREVIND4_NENG(‐
1)/REVIND4_SUM(‐1)))) ‐ 0.0607297143439*D(XREVIND4_NENG(‐1)/REVIND4_SUM(‐1)) +
0.000372122436658*D(GSPR_NENG/NP_NENG) ‐ 9.23272665147e‐05*D(RMPRIME(‐1)‐@PCA(CPI_NENG(‐1))) ‐
0.00028699460293*D(WPI05_NENG/JPGDP) + 2.00453195185e‐05*@TREND
Eqn 33: D(XREVIND4_PAC/REVIND4_SUM) = ‐0.00154324643855 ‐ 0.000645942544157 +
0.163708849289*((@MEAN(XREVIND4_PAC/REVIND4_SUM,"1980 2008")‐(XREVIND4_PAC(‐1)/REVIND4_SUM(‐
1)))) ‐ 0.0607297143439*D(XREVIND4_PAC(‐1)/REVIND4_SUM(‐1)) +
0.000372122436658*D(GSPR_PAC/NP_PAC) ‐ 9.23272665147e‐05*D(RMPRIME(‐1)‐@PCA(CPI_PAC(‐1))) ‐
0.00028699460293*D(WPI05_PAC/JPGDP) + 2.00453195185e‐05*@TREND
Eqn 34: D(XREVIND4_SATL/REVIND4_SUM) = 0.000358786049714 ‐ 0.000645942544157 +
0.163708849289*((@MEAN(XREVIND4_SATL/REVIND4_SUM,"1980 2008")‐(XREVIND4_SATL(‐
1)/REVIND4_SUM(‐1)))) ‐ 0.0607297143439*D(XREVIND4_SATL(‐1)/REVIND4_SUM(‐1)) +
0.000372122436658*D(GSPR_SATL/NP_SATL) ‐ 9.23272665147e‐05*D(RMPRIME(‐1)‐@PCA(CPI_SATL(‐1))) ‐
0.00028699460293*D(WPI05_SATL/JPGDP) + 2.00453195185e‐05*@TREND
May 2014
U.S. Energy Information Administration | NEMS Macroeconomic Activity Module Documentation Report 161
Eqn 35: D(XREVIND4_WNC/REVIND4_SUM) = 0.00224158648956 ‐ 0.000645942544157 +
0.163708849289*((@MEAN(XREVIND4_WNC/REVIND4_SUM,"1980 2008")‐(XREVIND4_WNC(‐
1)/REVIND4_SUM(‐1)))) ‐ 0.0607297143439*D(XREVIND4_WNC(‐1)/REVIND4_SUM(‐1)) +
0.000372122436658*D(GSPR_WNC/NP_WNC) ‐ 9.23272665147e‐05*D(RMPRIME(‐1)‐@PCA(CPI_WNC(‐1))) ‐
0.00028699460293*D(WPI05_WNC/JPGDP) + 2.00453195185e‐05*@TREND
Eqn 36: D(XREVIND4_WSC/REVIND4_SUM) = ‐5.90333860425e‐05 ‐ 0.000645942544157 +
0.163708849289*((@MEAN(XREVIND4_WSC/REVIND4_SUM,"1980 2008")‐(XREVIND4_WSC(‐
1)/REVIND4_SUM(‐1)))) ‐ 0.0607297143439*D(XREVIND4_WSC(‐1)/REVIND4_SUM(‐1)) +
0.000372122436658*D(GSPR_WSC/NP_WSC) ‐ 9.23272665147e‐05*D(RMPRIME(‐1)‐@PCA(CPI_WSC(‐1))) ‐
0.00028699460293*D(WPI05_WSC/JPGDP) + 2.00453195185e‐05*@TREND
IND5 ‐ Other food products
Eqn 37: D(XREVIND5_ENC/REVIND5_SUM) = ‐0.00067570230356 ‐ 0.000557299722756 +
0.172414852567*((@MEAN(XREVIND5_ENC/REVIND5_SUM,"1980 2008")‐(XREVIND5_ENC(‐1)/REVIND5_SUM(‐
1)))) ‐ 0.00526830857584*D(XREVIND5_ENC(‐1)/REVIND5_SUM(‐1)) +
0.000285087057999*D(GSPR_ENC/NP_ENC) ‐ 0.000100240205914*D(RMPRIME(‐1)‐@PCA(CPI_ENC(‐1))) ‐
0.000178215449409*D(WPI05_ENC/JPGDP) + 1.84204911738e‐05*@TREND
Eqn 38: D(XREVIND5_ESC/REVIND5_SUM) = 0.00108962091567 ‐ 0.000557299722756 +
0.172414852567*((@MEAN(XREVIND5_ESC/REVIND5_SUM,"1980 2008")‐(XREVIND5_ESC(‐1)/REVIND5_SUM(‐
1)))) ‐ 0.00526830857584*D(XREVIND5_ESC(‐1)/REVIND5_SUM(‐1)) +
0.000285087057999*D(GSPR_ESC/NP_ESC) ‐ 0.000100240205914*D(RMPRIME(‐1)‐@PCA(CPI_ESC(‐1))) ‐
0.000178215449409*D(WPI05_ESC/JPGDP) + 1.84204911738e‐05*@TREND
Eqn 39: D(XREVIND5_MATL/REVIND5_SUM) = ‐0.00214960372686 ‐ 0.000557299722756 +
0.172414852567*((@MEAN(XREVIND5_MATL/REVIND5_SUM,"1980 2008")‐(XREVIND5_MATL(‐
1)/REVIND5_SUM(‐1)))) ‐ 0.00526830857584*D(XREVIND5_MATL(‐1)/REVIND5_SUM(‐1)) +
0.000285087057999*D(GSPR_MATL/NP_MATL) ‐ 0.000100240205914*D(RMPRIME(‐1)‐@PCA(CPI_MATL(‐1))) ‐
0.000178215449409*D(WPI05_MATL/JPGDP) + 1.84204911738e‐05*@TREND
Eqn 40: D(XREVIND5_MTN/REVIND5_SUM) = 0.000826930303356 ‐ 0.000557299722756 +
0.172414852567*((@MEAN(XREVIND5_MTN/REVIND5_SUM,"1980 2008")‐(XREVIND5_MTN(‐
1)/REVIND5_SUM(‐1)))) ‐ 0.00526830857584*D(XREVIND5_MTN(‐1)/REVIND5_SUM(‐1)) +
0.000285087057999*D(GSPR_MTN/NP_MTN) ‐ 0.000100240205914*D(RMPRIME(‐1)‐@PCA(CPI_MTN(‐1))) ‐
0.000178215449409*D(WPI05_MTN/JPGDP) + 1.84204911738e‐05*@TREND
Eqn 41: D(XREVIND5_NENG/REVIND5_SUM) = 5.16943041784e‐05 ‐ 0.000557299722756 +
0.172414852567*((@MEAN(XREVIND5_NENG/REVIND5_SUM,"1980 2008")‐(XREVIND5_NENG(‐
1)/REVIND5_SUM(‐1)))) ‐ 0.00526830857584*D(XREVIND5_NENG(‐1)/REVIND5_SUM(‐1)) +
0.000285087057999*D(GSPR_NENG/NP_NENG) ‐ 0.000100240205914*D(RMPRIME(‐1)‐@PCA(CPI_NENG(‐1))) ‐
0.000178215449409*D(WPI05_NENG/JPGDP) + 1.84204911738e‐05*@TREND
May 2014
U.S. Energy Information Administration | NEMS Macroeconomic Activity Module Documentation Report 162
Eqn 42: D(XREVIND5_PAC/REVIND5_SUM) = ‐0.00174242025067 ‐ 0.000557299722756 +
0.172414852567*((@MEAN(XREVIND5_PAC/REVIND5_SUM,"1980 2008")‐(XREVIND5_PAC(‐1)/REVIND5_SUM(‐
1)))) ‐ 0.00526830857584*D(XREVIND5_PAC(‐1)/REVIND5_SUM(‐1)) +
0.000285087057999*D(GSPR_PAC/NP_PAC) ‐ 0.000100240205914*D(RMPRIME(‐1)‐@PCA(CPI_PAC(‐1))) ‐
0.000178215449409*D(WPI05_PAC/JPGDP) + 1.84204911738e‐05*@TREND
Eqn 43: D(XREVIND5_SATL/REVIND5_SUM) = 0.000930204307453 ‐ 0.000557299722756 +
0.172414852567*((@MEAN(XREVIND5_SATL/REVIND5_SUM,"1980 2008")‐(XREVIND5_SATL(‐
1)/REVIND5_SUM(‐1)))) ‐ 0.00526830857584*D(XREVIND5_SATL(‐1)/REVIND5_SUM(‐1)) +
0.000285087057999*D(GSPR_SATL/NP_SATL) ‐ 0.000100240205914*D(RMPRIME(‐1)‐@PCA(CPI_SATL(‐1))) ‐
0.000178215449409*D(WPI05_SATL/JPGDP) + 1.84204911738e‐05*@TREND
Eqn 44: D(XREVIND5_WNC/REVIND5_SUM) = 0.00127320563005 ‐ 0.000557299722756 +
0.172414852567*((@MEAN(XREVIND5_WNC/REVIND5_SUM,"1980 2008")‐(XREVIND5_WNC(‐
1)/REVIND5_SUM(‐1)))) ‐ 0.00526830857584*D(XREVIND5_WNC(‐1)/REVIND5_SUM(‐1)) +
0.000285087057999*D(GSPR_WNC/NP_WNC) ‐ 0.000100240205914*D(RMPRIME(‐1)‐@PCA(CPI_WNC(‐1))) ‐
0.000178215449409*D(WPI05_WNC/JPGDP) + 1.84204911738e‐05*@TREND
Eqn 45: D(XREVIND5_WSC/REVIND5_SUM) = 0.000396070820388 ‐ 0.000557299722756 +
0.172414852567*((@MEAN(XREVIND5_WSC/REVIND5_SUM,"1980 2008")‐(XREVIND5_WSC(‐
1)/REVIND5_SUM(‐1)))) ‐ 0.00526830857584*D(XREVIND5_WSC(‐1)/REVIND5_SUM(‐1)) +
0.000285087057999*D(GSPR_WSC/NP_WSC) ‐ 0.000100240205914*D(RMPRIME(‐1)‐@PCA(CPI_WSC(‐1))) ‐
0.000178215449409*D(WPI05_WSC/JPGDP) + 1.84204911738e‐05*@TREND
IND6 ‐ Beverage and tobacco products
Eqn 46: D(XREVIND6_ENC/REVIND6_SUM) = ‐0.000494523960307 ‐ 0.000873734919947 +
0.208811605924*((@MEAN(XREVIND6_ENC/REVIND6_SUM,"1980 2008")‐(XREVIND6_ENC(‐1)/REVIND6_SUM(‐
1)))) + 0.340986867915*D(XREVIND6_ENC(‐1)/REVIND6_SUM(‐1)) +
0.000608672630451*D(GSPR_ENC/NP_ENC) ‐ 0.000520642330834*D(RWM_ENC(‐1)/JPGDP(‐1)) +
4.08358808325e‐05*@TREND
Eqn 47: D(XREVIND6_ESC/REVIND6_SUM) = ‐0.000667344832601 ‐ 0.000873734919947 +
0.208811605924*((@MEAN(XREVIND6_ESC/REVIND6_SUM,"1980 2008")‐(XREVIND6_ESC(‐1)/REVIND6_SUM(‐
1)))) + 0.340986867915*D(XREVIND6_ESC(‐1)/REVIND6_SUM(‐1)) + 0.000608672630451*D(GSPR_ESC/NP_ESC)
‐ 0.000520642330834*D(RWM_ESC(‐1)/JPGDP(‐1)) + 4.08358808325e‐05*@TREND
Eqn 48: D(XREVIND6_MATL/REVIND6_SUM) = ‐0.000606484446279 ‐ 0.000873734919947 +
0.208811605924*((@MEAN(XREVIND6_MATL/REVIND6_SUM,"1980 2008")‐(XREVIND6_MATL(‐
1)/REVIND6_SUM(‐1)))) + 0.340986867915*D(XREVIND6_MATL(‐1)/REVIND6_SUM(‐1)) +
0.000608672630451*D(GSPR_MATL/NP_MATL) ‐ 0.000520642330834*D(RWM_MATL(‐1)/JPGDP(‐1)) +
4.08358808325e‐05*@TREND
Eqn 49: D(XREVIND6_MTN/REVIND6_SUM) = 0.000902694438821 ‐ 0.000873734919947 +
0.208811605924*((@MEAN(XREVIND6_MTN/REVIND6_SUM,"1980 2008")‐(XREVIND6_MTN(‐
May 2014
U.S. Energy Information Administration | NEMS Macroeconomic Activity Module Documentation Report 163
1)/REVIND6_SUM(‐1)))) + 0.340986867915*D(XREVIND6_MTN(‐1)/REVIND6_SUM(‐1)) +
0.000608672630451*D(GSPR_MTN/NP_MTN) ‐ 0.000520642330834*D(RWM_MTN(‐1)/JPGDP(‐1)) +
4.08358808325e‐05*@TREND
Eqn 50: D(XREVIND6_NENG/REVIND6_SUM) = 0.00024173584458 ‐ 0.000873734919947 +
0.208811605924*((@MEAN(XREVIND6_NENG/REVIND6_SUM,"1980 2008")‐(XREVIND6_NENG(‐
1)/REVIND6_SUM(‐1)))) + 0.340986867915*D(XREVIND6_NENG(‐1)/REVIND6_SUM(‐1)) +
0.000608672630451*D(GSPR_NENG/NP_NENG) ‐ 0.000520642330834*D(RWM_NENG(‐1)/JPGDP(‐1)) +
4.08358808325e‐05*@TREND
Eqn 51: D(XREVIND6_PAC/REVIND6_SUM) = 0.00171891922912 ‐ 0.000873734919947 +
0.208811605924*((@MEAN(XREVIND6_PAC/REVIND6_SUM,"1980 2008")‐(XREVIND6_PAC(‐1)/REVIND6_SUM(‐
1)))) + 0.340986867915*D(XREVIND6_PAC(‐1)/REVIND6_SUM(‐1)) + 0.000608672630451*D(GSPR_PAC/NP_PAC)
‐ 0.000520642330834*D(RWM_PAC(‐1)/JPGDP(‐1)) + 4.08358808325e‐05*@TREND
Eqn 52: D(XREVIND6_SATL/REVIND6_SUM) = ‐0.00154483195802 ‐ 0.000873734919947 +
0.208811605924*((@MEAN(XREVIND6_SATL/REVIND6_SUM,"1980 2008")‐(XREVIND6_SATL(‐
1)/REVIND6_SUM(‐1)))) + 0.340986867915*D(XREVIND6_SATL(‐1)/REVIND6_SUM(‐1)) +
0.000608672630451*D(GSPR_SATL/NP_SATL) ‐ 0.000520642330834*D(RWM_SATL(‐1)/JPGDP(‐1)) +
4.08358808325e‐05*@TREND
Eqn 53: D(XREVIND6_WNC/REVIND6_SUM) = ‐0.000200457291275 ‐ 0.000873734919947 +
0.208811605924*((@MEAN(XREVIND6_WNC/REVIND6_SUM,"1980 2008")‐(XREVIND6_WNC(‐
1)/REVIND6_SUM(‐1)))) + 0.340986867915*D(XREVIND6_WNC(‐1)/REVIND6_SUM(‐1)) +
0.000608672630451*D(GSPR_WNC/NP_WNC) ‐ 0.000520642330834*D(RWM_WNC(‐1)/JPGDP(‐1)) +
4.08358808325e‐05*@TREND
Eqn 54: D(XREVIND6_WSC/REVIND6_SUM) = 0.000650292975965 ‐ 0.000873734919947 +
0.208811605924*((@MEAN(XREVIND6_WSC/REVIND6_SUM,"1980 2008")‐(XREVIND6_WSC(‐
1)/REVIND6_SUM(‐1)))) + 0.340986867915*D(XREVIND6_WSC(‐1)/REVIND6_SUM(‐1)) +
0.000608672630451*D(GSPR_WSC/NP_WSC) ‐ 0.000520642330834*D(RWM_WSC(‐1)/JPGDP(‐1)) +
4.08358808325e‐05*@TREND
IND7 ‐ Textile mills &products, apparel, and leather
Eqn 55: D(XREVIND7_ENC/REVIND7_SUM) = 0.001193233121 ‐ 0.000135870416102 +
0.164082174556*D(XREVIND7_ENC(‐1)/REVIND7_SUM(‐1)) + 0.000189164032098*D(GSPR_ENC/NP_ENC) +
6.20136676447e‐05*D(RMPRIME(‐1)‐@PCA(CPI_ENC(‐1)))
Eqn 56: D(XREVIND7_ESC/REVIND7_SUM) = ‐0.00039242636849 ‐ 0.000135870416102 +
0.164082174556*D(XREVIND7_ESC(‐1)/REVIND7_SUM(‐1)) + 0.000189164032098*D(GSPR_ESC/NP_ESC) +
6.20136676447e‐05*D(RMPRIME(‐1)‐@PCA(CPI_ESC(‐1)))
Eqn 57: D(XREVIND7_MATL/REVIND7_SUM) = ‐0.000996820874663 ‐ 0.000135870416102 +
0.164082174556*D(XREVIND7_MATL(‐1)/REVIND7_SUM(‐1)) + 0.000189164032098*D(GSPR_MATL/NP_MATL)
+ 6.20136676447e‐05*D(RMPRIME(‐1)‐@PCA(CPI_MATL(‐1)))
May 2014
U.S. Energy Information Administration | NEMS Macroeconomic Activity Module Documentation Report 164
Eqn 58: D(XREVIND7_MTN/REVIND7_SUM) = 9.13913556148e‐05 ‐ 0.000135870416102 + 0.164082174556*D(XREVIND7_MTN(‐1)/REVIND7_SUM(‐1)) + 0.000189164032098*D(GSPR_MTN/NP_MTN) + 6.20136676447e‐05*D(RMPRIME(‐1)‐@PCA(CPI_MTN(‐1)))
Eqn 59: D(XREVIND7_NENG/REVIND7_SUM) = ‐0.000556198527386 ‐ 0.000135870416102 +
0.164082174556*D(XREVIND7_NENG(‐1)/REVIND7_SUM(‐1)) + 0.000189164032098*D(GSPR_NENG/NP_NENG)
+ 6.20136676447e‐05*D(RMPRIME(‐1)‐@PCA(CPI_NENG(‐1)))
Eqn 60: D(XREVIND7_PAC/REVIND7_SUM) = 0.00164497673896 ‐ 0.000135870416102 +
0.164082174556*D(XREVIND7_PAC(‐1)/REVIND7_SUM(‐1)) + 0.000189164032098*D(GSPR_PAC/NP_PAC) +
6.20136676447e‐05*D(RMPRIME(‐1)‐@PCA(CPI_PAC(‐1)))
Eqn 61: D(XREVIND7_SATL/REVIND7_SUM) = ‐0.00123064898646 ‐ 0.000135870416102 +
0.164082174556*D(XREVIND7_SATL(‐1)/REVIND7_SUM(‐1)) + 0.000189164032098*D(GSPR_SATL/NP_SATL) +
6.20136676447e‐05*D(RMPRIME(‐1)‐@PCA(CPI_SATL(‐1)))
Eqn 62: D(XREVIND7_WNC/REVIND7_SUM) = ‐7.05257084589e‐05 ‐ 0.000135870416102 +
0.164082174556*D(XREVIND7_WNC(‐1)/REVIND7_SUM(‐1)) + 0.000189164032098*D(GSPR_WNC/NP_WNC) +
6.20136676447e‐05*D(RMPRIME(‐1)‐@PCA(CPI_WNC(‐1)))
Eqn 63: D(XREVIND7_WSC/REVIND7_SUM) = 0.000317019249875 ‐ 0.000135870416102 +
0.164082174556*D(XREVIND7_WSC(‐1)/REVIND7_SUM(‐1)) + 0.000189164032098*D(GSPR_WSC/NP_WSC) +
6.20136676447e‐05*D(RMPRIME(‐1)‐@PCA(CPI_WSC(‐1)))
IND8 ‐ Wood products
Eqn 73: D(XREVIND8_ENC/REVIND8_SUM) = 0.00212478144877 ‐ 7.16295983553e‐05 +
0.226267445872*((@MEAN(XREVIND8_ENC/REVIND8_SUM,"1980 2008")‐(XREVIND8_ENC(‐1)/REVIND8_SUM(‐
1)))) + 0.00074604811492*D(GSPR_ENC/NP_ENC) + 0.000187465358871*D(RMPRIME(‐1)‐@PCA(CPI_ENC(‐1))) ‐
0.0001010665724*D(RWM_ENC(‐1)/JPGDP(‐1)) ‐ 0.000146242561533*D(EEA(‐1)) ‐ 7.40166990166e‐
06*@TREND
Eqn 74: D(XREVIND8_ESC/REVIND8_SUM) = 3.0455005091e‐05 ‐ 7.16295983553e‐05 +
0.226267445872*((@MEAN(XREVIND8_ESC/REVIND8_SUM,"1980 2008")‐(XREVIND8_ESC(‐1)/REVIND8_SUM(‐
1)))) + 0.00074604811492*D(GSPR_ESC/NP_ESC) + 0.000187465358871*D(RMPRIME(‐1)‐@PCA(CPI_ESC(‐1))) ‐
0.0001010665724*D(RWM_ESC(‐1)/JPGDP(‐1)) ‐ 0.000146242561533*D(EEA(‐1)) ‐ 7.40166990166e‐
06*@TREND
Eqn 75: D(XREVIND8_MATL/REVIND8_SUM) = 0.000836119091154 ‐ 7.16295983553e‐05 + 0.226267445872*((@MEAN(XREVIND8_MATL/REVIND8_SUM,"1980 2008")‐(XREVIND8_MATL(‐1)/REVIND8_SUM(‐1)))) + 0.00074604811492*D(GSPR_MATL/NP_MATL) + 0.000187465358871*D(RMPRIME(‐1)‐@PCA(CPI_MATL(‐1))) ‐ 0.0001010665724*D(RWM_MATL(‐1)/JPGDP(‐1)) ‐ 0.000146242561533*D(EEA(‐1)) ‐ 7.40166990166e‐06*@TREND
Eqn 76: D(XREVIND8_MTN/REVIND8_SUM) = ‐0.000515679381511 ‐ 7.16295983553e‐05 +
0.226267445872*((@MEAN(XREVIND8_MTN/REVIND8_SUM,"1980 2008")‐(XREVIND8_MTN(‐
1)/REVIND8_SUM(‐1)))) + 0.00074604811492*D(GSPR_MTN/NP_MTN) + 0.000187465358871*D(RMPRIME(‐1)‐
May 2014
U.S. Energy Information Administration | NEMS Macroeconomic Activity Module Documentation Report 165
@PCA(CPI_MTN(‐1))) ‐ 0.0001010665724*D(RWM_MTN(‐1)/JPGDP(‐1)) ‐ 0.000146242561533*D(EEA(‐1)) ‐
7.40166990166e‐06*@TREND
Eqn 77: D(XREVIND8_NENG/REVIND8_SUM) = 5.84200786801e‐05 ‐ 7.16295983553e‐05 +
0.226267445872*((@MEAN(XREVIND8_NENG/REVIND8_SUM,"1980 2008")‐(XREVIND8_NENG(‐
1)/REVIND8_SUM(‐1)))) + 0.00074604811492*D(GSPR_NENG/NP_NENG) + 0.000187465358871*D(RMPRIME(‐
1)‐@PCA(CPI_NENG(‐1))) ‐ 0.0001010665724*D(RWM_NENG(‐1)/JPGDP(‐1)) ‐ 0.000146242561533*D(EEA(‐1)) ‐
7.40166990166e‐06*@TREND
Eqn 78: D(XREVIND8_PAC/REVIND8_SUM) = ‐0.00586808192802 ‐ 7.16295983553e‐05 +
0.226267445872*((@MEAN(XREVIND8_PAC/REVIND8_SUM,"1980 2008")‐(XREVIND8_PAC(‐1)/REVIND8_SUM(‐
1)))) + 0.00074604811492*D(GSPR_PAC/NP_PAC) + 0.000187465358871*D(RMPRIME(‐1)‐@PCA(CPI_PAC(‐1))) ‐
0.0001010665724*D(RWM_PAC(‐1)/JPGDP(‐1)) ‐ 0.000146242561533*D(EEA(‐1)) ‐ 7.40166990166e‐
06*@TREND
Eqn 79: D(XREVIND8_SATL/REVIND8_SUM) = 0.000912114241263 ‐ 7.16295983553e‐05 +
0.226267445872*((@MEAN(XREVIND8_SATL/REVIND8_SUM,"1980 2008")‐(XREVIND8_SATL(‐
1)/REVIND8_SUM(‐1)))) + 0.00074604811492*D(GSPR_SATL/NP_SATL) + 0.000187465358871*D(RMPRIME(‐1)‐
@PCA(CPI_SATL(‐1))) ‐ 0.0001010665724*D(RWM_SATL(‐1)/JPGDP(‐1)) ‐ 0.000146242561533*D(EEA(‐1)) ‐
7.40166990166e‐06*@TREND
Eqn 80: D(XREVIND8_WNC/REVIND8_SUM) = 0.00125213663792 ‐ 7.16295983553e‐05 +
0.226267445872*((@MEAN(XREVIND8_WNC/REVIND8_SUM,"1980 2008")‐(XREVIND8_WNC(‐
1)/REVIND8_SUM(‐1)))) + 0.00074604811492*D(GSPR_WNC/NP_WNC) + 0.000187465358871*D(RMPRIME(‐1)‐
@PCA(CPI_WNC(‐1))) ‐ 0.0001010665724*D(RWM_WNC(‐1)/JPGDP(‐1)) ‐ 0.000146242561533*D(EEA(‐1)) ‐
7.40166990166e‐06*@TREND
Eqn 81: D(XREVIND8_WSC/REVIND8_SUM) = 0.00116973480666 ‐ 7.16295983553e‐05 +
0.226267445872*((@MEAN(XREVIND8_WSC/REVIND8_SUM,"1980 2008")‐(XREVIND8_WSC(‐
1)/REVIND8_SUM(‐1)))) + 0.00074604811492*D(GSPR_WSC/NP_WSC) + 0.000187465358871*D(RMPRIME(‐1)‐
@PCA(CPI_WSC(‐1))) ‐ 0.0001010665724*D(RWM_WSC(‐1)/JPGDP(‐1)) ‐ 0.000146242561533*D(EEA(‐1)) ‐
7.40166990166e‐06*@TREND
IND9 ‐ Furniture and related products
Eqn 82: D(XREVIND9_ENC/REVIND9_SUM) = 0.00117159878111 ‐ 0.000107543506298 +
0.272717261226*((@MEAN(XREVIND9_ENC/REVIND9_SUM,"1980 2008")‐(XREVIND9_ENC(‐1)/REVIND9_SUM(‐
1)))) ‐ 0.000104028957765*D(GSPR_ENC(‐1)/NP_ENC(‐1)) + 5.05520757135e‐05*D(RMPRIME‐@PCA(CPI_ENC))
+ 0.000409980228612*D(RWM_ENC(‐1)/JPGDP(‐1)) ‐ 6.2222846888e‐05*D(EEA)
Eqn 83: D(XREVIND9_ESC/REVIND9_SUM) = ‐0.00012439458621 ‐ 0.000107543506298 +
0.272717261226*((@MEAN(XREVIND9_ESC/REVIND9_SUM,"1980 2008")‐(XREVIND9_ESC(‐1)/REVIND9_SUM(‐
1)))) ‐ 0.000104028957765*D(GSPR_ESC(‐1)/NP_ESC(‐1)) + 5.05520757135e‐05*D(RMPRIME‐@PCA(CPI_ESC)) +
0.000409980228612*D(RWM_ESC(‐1)/JPGDP(‐1)) ‐ 6.2222846888e‐05*D(EEA)
May 2014
U.S. Energy Information Administration | NEMS Macroeconomic Activity Module Documentation Report 166
Eqn 84: D(XREVIND9_MATL/REVIND9_SUM) = ‐0.000478858641507 ‐ 0.000107543506298 +
0.272717261226*((@MEAN(XREVIND9_MATL/REVIND9_SUM,"1980 2008")‐(XREVIND9_MATL(‐
1)/REVIND9_SUM(‐1)))) ‐ 0.000104028957765*D(GSPR_MATL(‐1)/NP_MATL(‐1)) + 5.05520757135e‐
05*D(RMPRIME‐@PCA(CPI_MATL)) + 0.000409980228612*D(RWM_MATL(‐1)/JPGDP(‐1)) ‐ 6.2222846888e‐
05*D(EEA)
Eqn 85: D(XREVIND9_MTN/REVIND9_SUM) = 0.00173559836262 ‐ 0.000107543506298 +
0.272717261226*((@MEAN(XREVIND9_MTN/REVIND9_SUM,"1980 2008")‐(XREVIND9_MTN(‐
1)/REVIND9_SUM(‐1)))) ‐ 0.000104028957765*D(GSPR_MTN(‐1)/NP_MTN(‐1)) + 5.05520757135e‐
05*D(RMPRIME‐@PCA(CPI_MTN)) + 0.000409980228612*D(RWM_MTN(‐1)/JPGDP(‐1)) ‐ 6.2222846888e‐
05*D(EEA)
Eqn 86: D(XREVIND9_NENG/REVIND9_SUM) = 5.69567900172e‐05 ‐ 0.000107543506298 +
0.272717261226*((@MEAN(XREVIND9_NENG/REVIND9_SUM,"1980 2008")‐(XREVIND9_NENG(‐
1)/REVIND9_SUM(‐1)))) ‐ 0.000104028957765*D(GSPR_NENG(‐1)/NP_NENG(‐1)) + 5.05520757135e‐
05*D(RMPRIME‐@PCA(CPI_NENG)) + 0.000409980228612*D(RWM_NENG(‐1)/JPGDP(‐1)) ‐ 6.2222846888e‐
05*D(EEA)
Eqn 87: D(XREVIND9_PAC/REVIND9_SUM) = ‐0.000218418375681 ‐ 0.000107543506298 +
0.272717261226*((@MEAN(XREVIND9_PAC/REVIND9_SUM,"1980 2008")‐(XREVIND9_PAC(‐1)/REVIND9_SUM(‐
1)))) ‐ 0.000104028957765*D(GSPR_PAC(‐1)/NP_PAC(‐1)) + 5.05520757135e‐05*D(RMPRIME‐@PCA(CPI_PAC)) +
0.000409980228612*D(RWM_PAC(‐1)/JPGDP(‐1)) ‐ 6.2222846888e‐05*D(EEA)
Eqn 88: D(XREVIND9_SATL/REVIND9_SUM) = ‐0.00373414258448 ‐ 0.000107543506298 +
0.272717261226*((@MEAN(XREVIND9_SATL/REVIND9_SUM,"1980 2008")‐(XREVIND9_SATL(‐
1)/REVIND9_SUM(‐1)))) ‐ 0.000104028957765*D(GSPR_SATL(‐1)/NP_SATL(‐1)) + 5.05520757135e‐
05*D(RMPRIME‐@PCA(CPI_SATL)) + 0.000409980228612*D(RWM_SATL(‐1)/JPGDP(‐1)) ‐ 6.2222846888e‐
05*D(EEA)
Eqn 89: D(XREVIND9_WNC/REVIND9_SUM) = 0.000398145631765 ‐ 0.000107543506298 +
0.272717261226*((@MEAN(XREVIND9_WNC/REVIND9_SUM,"1980 2008")‐(XREVIND9_WNC(‐
1)/REVIND9_SUM(‐1)))) ‐ 0.000104028957765*D(GSPR_WNC(‐1)/NP_WNC(‐1)) + 5.05520757135e‐
05*D(RMPRIME‐@PCA(CPI_WNC)) + 0.000409980228612*D(RWM_WNC(‐1)/JPGDP(‐1)) ‐ 6.2222846888e‐
05*D(EEA)
Eqn 90: D(XREVIND9_WSC/REVIND9_SUM) = 0.00119351462236 ‐ 0.000107543506298 +
0.272717261226*((@MEAN(XREVIND9_WSC/REVIND9_SUM,"1980 2008")‐(XREVIND9_WSC(‐
1)/REVIND9_SUM(‐1)))) ‐ 0.000104028957765*D(GSPR_WSC(‐1)/NP_WSC(‐1)) + 5.05520757135e‐
05*D(RMPRIME‐@PCA(CPI_WSC)) + 0.000409980228612*D(RWM_WSC(‐1)/JPGDP(‐1)) ‐ 6.2222846888e‐
05*D(EEA)
May 2014
U.S. Energy Information Administration | NEMS Macroeconomic Activity Module Documentation Report 167
IND10 ‐ Paper products
Eqn 91: D(XREVIND10_ENC/REVIND10_SUM) = ‐0.000694670937402 ‐ 7.04998490226e‐05 +
0.185442907638*((@MEAN(XREVIND10_ENC/REVIND10_SUM,"1980 2008")‐(XREVIND10_ENC(‐
1)/REVIND10_SUM(‐1)))) + 0.000127309497933*D(GSPR_ENC/NP_ENC) ‐ 5.97759999817e‐07*@TREND
Eqn 92: D(XREVIND10_ESC/REVIND10_SUM) = 0.00173801599893 ‐ 7.04998490226e‐05 +
0.185442907638*((@MEAN(XREVIND10_ESC/REVIND10_SUM,"1980 2008")‐(XREVIND10_ESC(‐
1)/REVIND10_SUM(‐1)))) + 0.000127309497933*D(GSPR_ESC/NP_ESC) ‐ 5.97759999817e‐07*@TREND
Eqn 93: D(XREVIND10_MATL/REVIND10_SUM) = ‐0.00145144972153 ‐ 7.04998490226e‐05 +
0.185442907638*((@MEAN(XREVIND10_MATL/REVIND10_SUM,"1980 2008")‐(XREVIND10_MATL(‐
1)/REVIND10_SUM(‐1)))) + 0.000127309497933*D(GSPR_MATL/NP_MATL) ‐ 5.97759999817e‐07*@TREND
Eqn 94: D(XREVIND10_MTN/REVIND10_SUM) = 0.00032096198278 ‐ 7.04998490226e‐05 +
0.185442907638*((@MEAN(XREVIND10_MTN/REVIND10_SUM,"1980 2008")‐(XREVIND10_MTN(‐
1)/REVIND10_SUM(‐1)))) + 0.000127309497933*D(GSPR_MTN/NP_MTN) ‐ 5.97759999817e‐07*@TREND
Eqn 95: D(XREVIND10_NENG/REVIND10_SUM) = ‐0.00215486931961 ‐ 7.04998490226e‐05 +
0.185442907638*((@MEAN(XREVIND10_NENG/REVIND10_SUM,"1980 2008")‐(XREVIND10_NENG(‐
1)/REVIND10_SUM(‐1)))) + 0.000127309497933*D(GSPR_NENG/NP_NENG) ‐ 5.97759999817e‐07*@TREND
Eqn 96: D(XREVIND10_PAC/REVIND10_SUM) = ‐0.00107438035327 ‐ 7.04998490226e‐05 +
0.185442907638*((@MEAN(XREVIND10_PAC/REVIND10_SUM,"1980 2008")‐(XREVIND10_PAC(‐
1)/REVIND10_SUM(‐1)))) + 0.000127309497933*D(GSPR_PAC/NP_PAC) ‐ 5.97759999817e‐07*@TREND
Eqn 97: D(XREVIND10_SATL/REVIND10_SUM) = 0.00157143424946 ‐ 7.04998490226e‐05 +
0.185442907638*((@MEAN(XREVIND10_SATL/REVIND10_SUM,"1980 2008")‐(XREVIND10_SATL(‐
1)/REVIND10_SUM(‐1)))) + 0.000127309497933*D(GSPR_SATL/NP_SATL) ‐ 5.97759999817e‐07*@TREND
Eqn 98: D(XREVIND10_WNC/REVIND10_SUM) = 0.000764117241075 ‐ 7.04998490226e‐05 +
0.185442907638*((@MEAN(XREVIND10_WNC/REVIND10_SUM,"1980 2008")‐(XREVIND10_WNC(‐
1)/REVIND10_SUM(‐1)))) + 0.000127309497933*D(GSPR_WNC/NP_WNC) ‐ 5.97759999817e‐07*@TREND
Eqn 99: D(XREVIND10_WSC/REVIND10_SUM) = 0.000980840859568 ‐ 7.04998490226e‐05 +
0.185442907638*((@MEAN(XREVIND10_WSC/REVIND10_SUM,"1980 2008")‐(XREVIND10_WSC(‐
1)/REVIND10_SUM(‐1)))) + 0.000127309497933*D(GSPR_WSC/NP_WSC) ‐ 5.97759999817e‐07*@TREND
IND11 ‐ Printing
Eqn 100: D(XREVIND11_ENC/REVIND11_SUM) = 0.000549151068643 ‐ 0.000121369550736 +
0.144758082788*((@MEAN(XREVIND11_ENC/REVIND11_SUM,"1980 2008")‐(XREVIND11_ENC(‐
1)/REVIND11_SUM(‐1)))) + 0.000175406665448*D(GSPR_ENC/NP_ENC) +
0.000176228536409*D(WPI05_ENC/JPGDP)
Eqn 101: D(XREVIND11_ESC/REVIND11_SUM) = 0.000663114750933 ‐ 0.000121369550736 +
0.144758082788*((@MEAN(XREVIND11_ESC/REVIND11_SUM,"1980 2008")‐(XREVIND11_ESC(‐
May 2014
U.S. Energy Information Administration | NEMS Macroeconomic Activity Module Documentation Report 168
1)/REVIND11_SUM(‐1)))) + 0.000175406665448*D(GSPR_ESC/NP_ESC) +
0.000176228536409*D(WPI05_ESC/JPGDP)
Eqn 102: D(XREVIND11_MATL/REVIND11_SUM) = ‐0.00208209256985 ‐ 0.000121369550736 +
0.144758082788*((@MEAN(XREVIND11_MATL/REVIND11_SUM,"1980 2008")‐(XREVIND11_MATL(‐
1)/REVIND11_SUM(‐1)))) + 0.000175406665448*D(GSPR_MATL/NP_MATL) +
0.000176228536409*D(WPI05_MATL/JPGDP)
Eqn 103: D(XREVIND11_MTN/REVIND11_SUM) = 0.000304262227912 ‐ 0.000121369550736 +
0.144758082788*((@MEAN(XREVIND11_MTN/REVIND11_SUM,"1980 2008")‐(XREVIND11_MTN(‐
1)/REVIND11_SUM(‐1)))) + 0.000175406665448*D(GSPR_MTN/NP_MTN) +
0.000176228536409*D(WPI05_MTN/JPGDP)
Eqn 104: D(XREVIND11_NENG/REVIND11_SUM) = ‐0.000833662492127 ‐ 0.000121369550736 +
0.144758082788*((@MEAN(XREVIND11_NENG/REVIND11_SUM,"1980 2008")‐(XREVIND11_NENG(‐
1)/REVIND11_SUM(‐1)))) + 0.000175406665448*D(GSPR_NENG/NP_NENG) +
0.000176228536409*D(WPI05_NENG/JPGDP)
Eqn 105: D(XREVIND11_PAC/REVIND11_SUM) = ‐0.00169716851541 ‐ 0.000121369550736 +
0.144758082788*((@MEAN(XREVIND11_PAC/REVIND11_SUM,"1980 2008")‐(XREVIND11_PAC(‐
1)/REVIND11_SUM(‐1)))) + 0.000175406665448*D(GSPR_PAC/NP_PAC) +
0.000176228536409*D(WPI05_PAC/JPGDP)
Eqn 106: D(XREVIND11_SATL/REVIND11_SUM) = 0.00128529775067 ‐ 0.000121369550736 +
0.144758082788*((@MEAN(XREVIND11_SATL/REVIND11_SUM,"1980 2008")‐(XREVIND11_SATL(‐
1)/REVIND11_SUM(‐1)))) + 0.000175406665448*D(GSPR_SATL/NP_SATL) +
0.000176228536409*D(WPI05_SATL/JPGDP)
Eqn 107: D(XREVIND11_WNC/REVIND11_SUM) = 0.00145831286315 ‐ 0.000121369550736 +
0.144758082788*((@MEAN(XREVIND11_WNC/REVIND11_SUM,"1980 2008")‐(XREVIND11_WNC(‐
1)/REVIND11_SUM(‐1)))) + 0.000175406665448*D(GSPR_WNC/NP_WNC) +
0.000176228536409*D(WPI05_WNC/JPGDP)
Eqn 108: D(XREVIND11_WSC/REVIND11_SUM) = 0.000352784916077 ‐ 0.000121369550736 +
0.144758082788*((@MEAN(XREVIND11_WSC/REVIND11_SUM,"1980 2008")‐(XREVIND11_WSC(‐
1)/REVIND11_SUM(‐1)))) + 0.000175406665448*D(GSPR_WSC/NP_WSC) +
0.000176228536409*D(WPI05_WSC/JPGDP)
IND12 ‐ Basic inorganic chemicals
Eqn 109: D(XREVIND12_ENC/REVIND12_SUM) = 0.00236744966704 + 2.87892871575e‐05 +
0.183848304596*((@MEAN(XREVIND12_ENC/REVIND12_SUM,"1980 2008")‐(XREVIND12_ENC(‐
1)/REVIND12_SUM(‐1)))) + 0.0905714793133*D(XREVIND12_ENC(‐1)/REVIND12_SUM(‐1)) ‐
0.00041133953751*D(RMPRIME(‐1)‐@PCA(CPI_ENC(‐1))) ‐ 0.000167846714615*D(RWM_ENC(‐1)/JPGDP(‐1)) +
0.000122516075742*D(EEA(‐1)) ‐ 0.000628134418818*D(WPI05_ENC(‐1)/JPGDP(‐1)) ‐ 3.85759080461e‐
06*@TREND
May 2014
U.S. Energy Information Administration | NEMS Macroeconomic Activity Module Documentation Report 169
Eqn 110: D(XREVIND12_ESC/REVIND12_SUM) = 0.00122507403296 + 2.87892871575e‐05 +
0.183848304596*((@MEAN(XREVIND12_ESC/REVIND1_SUM,"1980 2008")‐(XREVIND12_ESC(‐
1)/REVIND12_SUM(‐1)))) + 0.0905714793133*D(XREVIND12_ESC(‐1)/REVIND1_SUM(‐1)) ‐
0.00041133953751*D(RMPRIME(‐1)‐@PCA(CPI_ESC(‐1))) ‐ 0.000167846714615*D(RWM_ESC(‐1)/JPGDP(‐1)) +
0.000122516075742*D(EEA(‐1)) ‐ 0.000628134418818*D(WPI05_ESC(‐1)/JPGDP(‐1)) ‐ 3.85759080461e‐
06*@TREND
Eqn 111: D(XREVIND12_MATL/REVIND12_SUM) = ‐0.00351849150987 + 2.87892871575e‐05 +
0.183848304596*((@MEAN(XREVIND12_MATL/REVIND12_SUM,"1980 2008")‐(XREVIND12_MATL(‐
1)/REVIND12_SUM(‐1)))) + 0.0905714793133*D(XREVIND12_MATL(‐1)/REVIND12_SUM(‐1)) ‐
0.00041133953751*D(RMPRIME(‐1)‐@PCA(CPI_MATL(‐1))) ‐ 0.000167846714615*D(RWM_MATL(‐1)/JPGDP(‐
1)) + 0.000122516075742*D(EEA(‐1)) ‐ 0.000628134418818*D(WPI05_MATL(‐1)/JPGDP(‐1)) ‐ 3.85759080461e‐
06*@TREND
Eqn 112: D(XREVIND12_MTN/REVIND12_SUM) = 6.8293012624e‐05 + 2.87892871575e‐05 +
0.183848304596*((@MEAN(XREVIND12_MTN/REVIND12_SUM,"1980 2008")‐(XREVIND12_MTN(‐
1)/REVIND12_SUM(‐1)))) + 0.0905714793133*D(XREVIND12_MTN(‐1)/REVIND12_SUM(‐1)) ‐
0.00041133953751*D(RMPRIME(‐1)‐@PCA(CPI_MTN(‐1))) ‐ 0.000167846714615*D(RWM_MTN(‐1)/JPGDP(‐1))
+ 0.000122516075742*D(EEA(‐1)) ‐ 0.000628134418818*D(WPI05_MTN(‐1)/JPGDP(‐1)) ‐ 3.85759080461e‐
06*@TREND
Eqn 113: D(XREVIND12_NENG/REVIND12_SUM) = ‐0.00105802822968 + 2.87892871575e‐05 +
0.183848304596*((@MEAN(XREVIND12_NENG/REVIND12_SUM,"1980 2008")‐(XREVIND12_NENG(‐
1)/REVIND12_SUM(‐1)))) + 0.0905714793133*D(XREVIND12_NENG(‐1)/REVIND12_SUM(‐1)) ‐
0.00041133953751*D(RMPRIME(‐1)‐@PCA(CPI_NENG(‐1))) ‐ 0.000167846714615*D(RWM_NENG(‐1)/JPGDP(‐
1)) + 0.000122516075742*D(EEA(‐1)) ‐ 0.000628134418818*D(WPI05_NENG(‐1)/JPGDP(‐1)) ‐ 3.85759080461e‐
06*@TREND
Eqn 114: D(XREVIND12_PAC/REVIND12_SUM) = ‐0.00305474774659 + 2.87892871575e‐05 +
0.183848304596*((@MEAN(XREVIND12_PAC/REVIND12_SUM,"1980 2008")‐(XREVIND12_PAC(‐
1)/REVIND12_SUM(‐1)))) + 0.0905714793133*D(XREVIND12_PAC(‐1)/REVIND12_SUM(‐1)) ‐
0.00041133953751*D(RMPRIME(‐1)‐@PCA(CPI_PAC(‐1))) ‐ 0.000167846714615*D(RWM_PAC(‐1)/JPGDP(‐1)) +
0.000122516075742*D(EEA(‐1)) ‐ 0.000628134418818*D(WPI05_PAC(‐1)/JPGDP(‐1)) ‐ 3.85759080461e‐
06*@TREND
Eqn 115: D(XREVIND12_SATL/REVIND12_SUM) = ‐0.00233442222541 + 2.87892871575e‐05 +
0.183848304596*((@MEAN(XREVIND12_SATL/REVIND12_SUM,"1980 2008")‐(XREVIND12_SATL(‐
1)/REVIND12_SUM(‐1)))) + 0.0905714793133*D(XREVIND12_SATL(‐1)/REVIND12_SUM(‐1)) ‐
0.00041133953751*D(RMPRIME(‐1)‐@PCA(CPI_SATL(‐1))) ‐ 0.000167846714615*D(RWM_SATL(‐1)/JPGDP(‐1)) +
0.000122516075742*D(EEA(‐1)) ‐ 0.000628134418818*D(WPI05_SATL(‐1)/JPGDP(‐1)) ‐ 3.85759080461e‐
06*@TREND
May 2014
U.S. Energy Information Administration | NEMS Macroeconomic Activity Module Documentation Report 170
Eqn 116: D(XREVIND12_WNC/REVIND12_SUM) = 0.00187645653192 + 2.87892871575e‐05 +
0.183848304596*((@MEAN(XREVIND12_WNC/REVIND12_SUM,"1980 2008")‐(XREVIND12_WNC(‐
1)/REVIND12_SUM(‐1)))) + 0.0905714793133*D(XREVIND12_WNC(‐1)/REVIND12_SUM(‐1)) ‐
0.00041133953751*D(RMPRIME(‐1)‐@PCA(CPI_WNC(‐1))) ‐ 0.000167846714615*D(RWM_WNC(‐1)/JPGDP(‐1))
+ 0.000122516075742*D(EEA(‐1)) ‐ 0.000628134418818*D(WPI05_WNC(‐1)/JPGDP(‐1)) ‐ 3.85759080461e‐
06*@TREND
Eqn 117: D(XREVIND12_WSC/REVIND12_SUM) = 0.00442841646701 + 2.87892871575e‐05 +
0.183848304596*((@MEAN(XREVIND12_WSC/REVIND12_SUM,"1980 2008")‐(XREVIND12_WSC(‐
1)/REVIND12_SUM(‐1)))) + 0.0905714793133*D(XREVIND12_WSC(‐1)/REVIND12_SUM(‐1)) ‐
0.00041133953751*D(RMPRIME(‐1)‐@PCA(CPI_WSC(‐1))) ‐ 0.000167846714615*D(RWM_WSC(‐1)/JPGDP(‐1)) +
0.000122516075742*D(EEA(‐1)) ‐ 0.000628134418818*D(WPI05_WSC(‐1)/JPGDP(‐1)) ‐ 3.85759080461e‐
06*@TREND
IND13 ‐ Basic organic chemicals
Eqn 118: D(XREVIND13_ENC/REVIND13_SUM) = ‐0.00140692468511 ‐ 9.01629316391e‐05 +
0.151932176264*((@MEAN(XREVIND13_ENC/REVIND13_SUM,"1980 2008")‐(XREVIND13_ENC(‐
1)/REVIND13_SUM(‐1)))) + 0.0215934252037*D(XREVIND13_ENC(‐1)/REVIND13_SUM(‐1)) ‐
0.000138565803604*D(RMPRIME(‐1)‐@PCA(CPI_ENC(‐1))) + 5.65306151691e‐05*D(EEA(‐1)) + 4.50988203949e‐
05*D(WPI05_ENC(‐1)/JPGDP(‐1))
Eqn 119: D(XREVIND13_ESC/REVIND13_SUM) = 0.000442714559324 ‐ 9.01629316391e‐05 +
0.151932176264*((@MEAN(XREVIND13_ESC/REVIND13_SUM,"1980 2008")‐(XREVIND13_ESC(‐
1)/REVIND13_SUM(‐1)))) + 0.0215934252037*D(XREVIND13_ESC(‐1)/REVIND13_SUM(‐1)) ‐
0.000138565803604*D(RMPRIME(‐1)‐@PCA(CPI_ESC(‐1))) + 5.65306151691e‐05*D(EEA(‐1)) + 4.50988203949e‐
05*D(WPI05_ESC(‐1)/JPGDP(‐1))
Eqn 120: D(XREVIND13_MATL/REVIND13_SUM) = ‐0.00273282428289 ‐ 9.01629316391e‐05 +
0.151932176264*((@MEAN(XREVIND13_MATL/REVIND13_SUM,"1980 2008")‐(XREVIND13_MATL(‐
1)/REVIND13_SUM(‐1)))) + 0.0215934252037*D(XREVIND13_MATL(‐1)/REVIND13_SUM(‐1)) ‐
0.000138565803604*D(RMPRIME(‐1)‐@PCA(CPI_MATL(‐1))) + 5.65306151691e‐05*D(EEA(‐1)) +
4.50988203949e‐05*D(WPI05_MATL(‐1)/JPGDP(‐1))
Eqn 121: D(XREVIND13_MTN/REVIND13_SUM) = ‐2.45447699301e‐05 ‐ 9.01629316391e‐05 +
0.151932176264*((@MEAN(XREVIND13_MTN/REVIND13_SUM,"1980 2008")‐(XREVIND13_MTN(‐
1)/REVIND13_SUM(‐1)))) + 0.0215934252037*D(XREVIND13_MTN(‐1)/REVIND13_SUM(‐1)) ‐
0.000138565803604*D(RMPRIME(‐1)‐@PCA(CPI_MTN(‐1))) + 5.65306151691e‐05*D(EEA(‐1)) +
4.50988203949e‐05*D(WPI05_MTN(‐1)/JPGDP(‐1))
Eqn 122: D(XREVIND13_NENG/REVIND13_SUM) = ‐0.000174382171481 ‐ 9.01629316391e‐05 + 0.151932176264*((@MEAN(XREVIND13_NENG/REVIND13_SUM,"1980 2008")‐(XREVIND13_NENG(‐1)/REVIND13_SUM(‐1)))) + 0.0215934252037*D(XREVIND13_NENG(‐1)/REVIND13_SUM(‐1)) ‐ 0.000138565803604*D(RMPRIME(‐1)‐@PCA(CPI_NENG(‐1))) + 5.65306151691e‐05*D(EEA(‐1)) + 4.50988203949e‐05*D(WPI05_NENG(‐1)/JPGDP(‐1))
May 2014
U.S. Energy Information Administration | NEMS Macroeconomic Activity Module Documentation Report 171
Eqn 123: D(XREVIND13_PAC/REVIND13_SUM) = ‐0.00102709202541 ‐ 9.01629316391e‐05 +
0.151932176264*((@MEAN(XREVIND13_PAC/REVIND13_SUM,"1980 2008")‐(XREVIND13_PAC(‐
1)/REVIND13_SUM(‐1)))) + 0.0215934252037*D(XREVIND13_PAC(‐1)/REVIND13_SUM(‐1)) ‐
0.000138565803604*D(RMPRIME(‐1)‐@PCA(CPI_PAC(‐1))) + 5.65306151691e‐05*D(EEA(‐1)) + 4.50988203949e‐
05*D(WPI05_PAC(‐1)/JPGDP(‐1))
Eqn 124: D(XREVIND13_SATL/REVIND13_SUM) = ‐0.00433937502603 ‐ 9.01629316391e‐05 +
0.151932176264*((@MEAN(XREVIND13_SATL/REVIND13_SUM,"1980 2008")‐(XREVIND13_SATL(‐
1)/REVIND13_SUM(‐1)))) + 0.0215934252037*D(XREVIND13_SATL(‐1)/REVIND13_SUM(‐1)) ‐
0.000138565803604*D(RMPRIME(‐1)‐@PCA(CPI_SATL(‐1))) + 5.65306151691e‐05*D(EEA(‐1)) +
4.50988203949e‐05*D(WPI05_SATL(‐1)/JPGDP(‐1))
Eqn 125: D(XREVIND13_WNC/REVIND13_SUM) = 0.00336569634068 ‐ 9.01629316391e‐05 +
0.151932176264*((@MEAN(XREVIND13_WNC/REVIND13_SUM,"1980 2008")‐(XREVIND13_WNC(‐
1)/REVIND13_SUM(‐1)))) + 0.0215934252037*D(XREVIND13_WNC(‐1)/REVIND13_SUM(‐1)) ‐
0.000138565803604*D(RMPRIME(‐1)‐@PCA(CPI_WNC(‐1))) + 5.65306151691e‐05*D(EEA(‐1)) +
4.50988203949e‐05*D(WPI05_WNC(‐1)/JPGDP(‐1))
Eqn 126: D(XREVIND13_WSC/REVIND13_SUM) = 0.00589673206084 ‐ 9.01629316391e‐05 +
0.151932176264*((@MEAN(XREVIND13_WSC/REVIND13_SUM,"1980 2008")‐(XREVIND13_WSC(‐
1)/REVIND13_SUM(‐1)))) + 0.0215934252037*D(XREVIND13_WSC(‐1)/REVIND13_SUM(‐1)) ‐
0.000138565803604*D(RMPRIME(‐1)‐@PCA(CPI_WSC(‐1))) + 5.65306151691e‐05*D(EEA(‐1)) +
4.50988203949e‐05*D(WPI05_WSC(‐1)/JPGDP(‐1))
IND14 ‐ Plastic and synthetic rubber materials
Eqn 127: D(XREVIND14_ENC/REVIND14_SUM) = 0.00192419068896 ‐ 0.000105298861741 +
0.0353903871777*((@MEAN(XREVIND14_ENC/REVIND14_SUM,"1980 2008")‐(XREVIND14_ENC(‐
1)/REVIND14_SUM(‐1)))) + 0.000125818765571*D(GSPR_ENC/NP_ENC) + 7.2127233749e‐05*D(RMPRIME(‐1)‐
@PCA(CPI_ENC(‐1))) + 0.000154162338795*D(RWM_ENC(‐1)/JPGDP(‐1)) ‐ 5.07083199663e‐05*D(EEA(‐1)) ‐
0.000246654045699*D(WPI05_ENC/JPGDP)
Eqn 128: D(XREVIND14_ESC/REVIND14_SUM) = 0.0013888959314 ‐ 0.000105298861741 +
0.0353903871777*((@MEAN(XREVIND14_ESC/REVIND14_SUM,"1980 2008")‐(XREVIND14_ESC(‐
1)/REVIND14_SUM(‐1)))) + 0.000125818765571*D(GSPR_ESC/NP_ESC) + 7.2127233749e‐05*D(RMPRIME(‐1)‐
@PCA(CPI_ESC(‐1))) + 0.000154162338795*D(RWM_ESC(‐1)/JPGDP(‐1)) ‐ 5.07083199663e‐05*D(EEA(‐1)) ‐
0.000246654045699*D(WPI05_ESC/JPGDP)
Eqn 129: D(XREVIND14_MATL/REVIND14_SUM) = ‐0.00205235485856 ‐ 0.000105298861741 +
0.0353903871777*((@MEAN(XREVIND14_MATL/REVIND14_SUM,"1980 2008")‐(XREVIND14_MATL(‐
1)/REVIND14_SUM(‐1)))) + 0.000125818765571*D(GSPR_MATL/NP_MATL) + 7.2127233749e‐05*D(RMPRIME(‐
1)‐@PCA(CPI_MATL(‐1))) + 0.000154162338795*D(RWM_MATL(‐1)/JPGDP(‐1)) ‐ 5.07083199663e‐05*D(EEA(‐1))
‐ 0.000246654045699*D(WPI05_MATL/JPGDP)
May 2014
U.S. Energy Information Administration | NEMS Macroeconomic Activity Module Documentation Report 172
Eqn 130: D(XREVIND14_MTN/REVIND14_SUM) = 0.000483927495742 ‐ 0.000105298861741 +
0.0353903871777*((@MEAN(XREVIND14_MTN/REVIND14_SUM,"1980 2008")‐(XREVIND14_MTN(‐
1)/REVIND14_SUM(‐1)))) + 0.000125818765571*D(GSPR_MTN/NP_MTN) + 7.2127233749e‐05*D(RMPRIME(‐1)‐
@PCA(CPI_MTN(‐1))) + 0.000154162338795*D(RWM_MTN(‐1)/JPGDP(‐1)) ‐ 5.07083199663e‐05*D(EEA(‐1)) ‐
0.000246654045699*D(WPI05_MTN/JPGDP)
Eqn 131: D(XREVIND14_NENG/REVIND14_SUM) = 0.000118767964621 ‐ 0.000105298861741 +
0.0353903871777*((@MEAN(XREVIND14_NENG/REVIND14_SUM,"1980 2008")‐(XREVIND14_NENG(‐
1)/REVIND14_SUM(‐1)))) + 0.000125818765571*D(GSPR_NENG/NP_NENG) + 7.2127233749e‐05*D(RMPRIME(‐
1)‐@PCA(CPI_NENG(‐1))) + 0.000154162338795*D(RWM_NENG(‐1)/JPGDP(‐1)) ‐ 5.07083199663e‐05*D(EEA(‐
1)) ‐ 0.000246654045699*D(WPI05_NENG/JPGDP)
Eqn 132: D(XREVIND14_PAC/REVIND14_SUM) = 0.000385599989427 ‐ 0.000105298861741 +
0.0353903871777*((@MEAN(XREVIND14_PAC/REVIND14_SUM,"1980 2008")‐(XREVIND14_PAC(‐
1)/REVIND14_SUM(‐1)))) + 0.000125818765571*D(GSPR_PAC/NP_PAC) + 7.2127233749e‐05*D(RMPRIME(‐1)‐
@PCA(CPI_PAC(‐1))) + 0.000154162338795*D(RWM_PAC(‐1)/JPGDP(‐1)) ‐ 5.07083199663e‐05*D(EEA(‐1)) ‐
0.000246654045699*D(WPI05_PAC/JPGDP)
Eqn 133: D(XREVIND14_SATL/REVIND14_SUM) = ‐0.00725351431128 ‐ 0.000105298861741 +
0.0353903871777*((@MEAN(XREVIND14_SATL/REVIND14_SUM,"1980 2008")‐(XREVIND14_SATL(‐
1)/REVIND14_SUM(‐1)))) + 0.000125818765571*D(GSPR_SATL/NP_SATL) + 7.2127233749e‐05*D(RMPRIME(‐1)‐
@PCA(CPI_SATL(‐1))) + 0.000154162338795*D(RWM_SATL(‐1)/JPGDP(‐1)) ‐ 5.07083199663e‐05*D(EEA(‐1)) ‐
0.000246654045699*D(WPI05_SATL/JPGDP)
Eqn 134: D(XREVIND14_WNC/REVIND14_SUM) = 0.00117799352448 ‐ 0.000105298861741 +
0.0353903871777*((@MEAN(XREVIND14_WNC/REVIND14_SUM,"1980 2008")‐(XREVIND14_WNC(‐
1)/REVIND14_SUM(‐1)))) + 0.000125818765571*D(GSPR_WNC/NP_WNC) + 7.2127233749e‐05*D(RMPRIME(‐1)‐
@PCA(CPI_WNC(‐1))) + 0.000154162338795*D(RWM_WNC(‐1)/JPGDP(‐1)) ‐ 5.07083199663e‐05*D(EEA(‐1)) ‐
0.000246654045699*D(WPI05_WNC/JPGDP)
Eqn 135: D(XREVIND14_WSC/REVIND14_SUM) = 0.00382649357521 ‐ 0.000105298861741 +
0.0353903871777*((@MEAN(XREVIND14_WSC/REVIND14_SUM,"1980 2008")‐(XREVIND14_WSC(‐
1)/REVIND14_SUM(‐1)))) + 0.000125818765571*D(GSPR_WSC/NP_WSC) + 7.2127233749e‐05*D(RMPRIME(‐1)‐
@PCA(CPI_WSC(‐1))) + 0.000154162338795*D(RWM_WSC(‐1)/JPGDP(‐1)) ‐ 5.07083199663e‐05*D(EEA(‐1)) ‐
0.000246654045699*D(WPI05_WSC/JPGDP)
IND15 ‐ Agricultural chemicals
Eqn 136: D(XREVIND15_ENC/REVIND15_SUM) = 0.00159078197628 ‐ 0.000844677778847 +
0.459758926938*((@MEAN(XREVIND15_ENC/REVIND15_SUM,"1980 2008")‐(XREVIND15_ENC(‐
1)/REVIND15_SUM(‐1)))) + 0.389792738528*D(XREVIND15_ENC(‐1)/REVIND15_SUM(‐1)) ‐
0.000408552485868*D(RMPRIME(‐1)‐@PCA(CPI_ENC(‐1))) + 0.000202487825758*D(EEA(‐1)) ‐
0.00184540628989*D(WPI05_ENC(‐1)/JPGDP(‐1)) + 2.91012313741e‐05*@TREND
May 2014
U.S. Energy Information Administration | NEMS Macroeconomic Activity Module Documentation Report 173
Eqn 137: D(XREVIND15_ESC/REVIND15_SUM) = 2.13009643831e‐05 ‐ 0.000844677778847 +
0.459758926938*((@MEAN(XREVIND15_ESC/REVIND15_SUM,"1980 2008")‐(XREVIND15_ESC(‐
1)/REVIND15_SUM(‐1)))) + 0.389792738528*D(XREVIND15_ESC(‐1)/REVIND15_SUM(‐1)) ‐
0.000408552485868*D(RMPRIME(‐1)‐@PCA(CPI_ESC(‐1))) + 0.000202487825758*D(EEA(‐1)) ‐
0.00184540628989*D(WPI05_ESC(‐1)/JPGDP(‐1)) + 2.91012313741e‐05*@TREND
Eqn 138: D(XREVIND15_MATL/REVIND15_SUM) = ‐0.000322491741412 ‐ 0.000844677778847 +
0.459758926938*((@MEAN(XREVIND15_MATL/REVIND15_SUM,"1980 2008")‐(XREVIND15_MATL(‐
1)/REVIND15_SUM(‐1)))) + 0.389792738528*D(XREVIND15_MATL(‐1)/REVIND15_SUM(‐1)) ‐
0.000408552485868*D(RMPRIME(‐1)‐@PCA(CPI_MATL(‐1))) + 0.000202487825758*D(EEA(‐1)) ‐
0.00184540628989*D(WPI05_MATL(‐1)/JPGDP(‐1)) + 2.91012313741e‐05*@TREND
Eqn 139: D(XREVIND15_MTN/REVIND15_SUM) = 4.50200187219e‐05 ‐ 0.000844677778847 +
0.459758926938*((@MEAN(XREVIND15_MTN/REVIND15_SUM,"1980 2008")‐(XREVIND15_MTN(‐
1)/REVIND15_SUM(‐1)))) + 0.389792738528*D(XREVIND15_MTN(‐1)/REVIND15_SUM(‐1)) ‐
0.000408552485868*D(RMPRIME(‐1)‐@PCA(CPI_MTN(‐1))) + 0.000202487825758*D(EEA(‐1)) ‐
0.00184540628989*D(WPI05_MTN(‐1)/JPGDP(‐1)) + 2.91012313741e‐05*@TREND
Eqn 140: D(XREVIND15_NENG/REVIND15_SUM) = 8.3773482521e‐05 ‐ 0.000844677778847 +
0.459758926938*((@MEAN(XREVIND15_NENG/REVIND15_SUM,"1980 2008")‐(XREVIND15_NENG(‐
1)/REVIND15_SUM(‐1)))) + 0.389792738528*D(XREVIND15_NENG(‐1)/REVIND15_SUM(‐1)) ‐
0.000408552485868*D(RMPRIME(‐1)‐@PCA(CPI_NENG(‐1))) + 0.000202487825758*D(EEA(‐1)) ‐
0.00184540628989*D(WPI05_NENG(‐1)/JPGDP(‐1)) + 2.91012313741e‐05*@TREND
Eqn 141: D(XREVIND15_PAC/REVIND15_SUM) = 4.31905147277e‐05 ‐ 0.000844677778847 +
0.459758926938*((@MEAN(XREVIND15_PAC/REVIND15_SUM,"1980 2008")‐(XREVIND15_PAC(‐
1)/REVIND15_SUM(‐1)))) + 0.389792738528*D(XREVIND15_PAC(‐1)/REVIND15_SUM(‐1)) ‐
0.000408552485868*D(RMPRIME(‐1)‐@PCA(CPI_PAC(‐1))) + 0.000202487825758*D(EEA(‐1)) ‐
0.00184540628989*D(WPI05_PAC(‐1)/JPGDP(‐1)) + 2.91012313741e‐05*@TREND
Eqn 142: D(XREVIND15_SATL/REVIND15_SUM) = ‐0.00159973813292 ‐ 0.000844677778847 +
0.459758926938*((@MEAN(XREVIND15_SATL/REVIND15_SUM,"1980 2008")‐(XREVIND15_SATL(‐
1)/REVIND15_SUM(‐1)))) + 0.389792738528*D(XREVIND15_SATL(‐1)/REVIND15_SUM(‐1)) ‐
0.000408552485868*D(RMPRIME(‐1)‐@PCA(CPI_SATL(‐1))) + 0.000202487825758*D(EEA(‐1)) ‐
0.00184540628989*D(WPI05_SATL(‐1)/JPGDP(‐1)) + 2.91012313741e‐05*@TREND
Eqn 143: D(XREVIND15_WNC/REVIND15_SUM) = 0.000633893410178 ‐ 0.000844677778847 +
0.459758926938*((@MEAN(XREVIND15_WNC/REVIND15_SUM,"1980 2008")‐(XREVIND15_WNC(‐
1)/REVIND15_SUM(‐1)))) + 0.389792738528*D(XREVIND15_WNC(‐1)/REVIND15_SUM(‐1)) ‐
0.000408552485868*D(RMPRIME(‐1)‐@PCA(CPI_WNC(‐1))) + 0.000202487825758*D(EEA(‐1)) ‐
0.00184540628989*D(WPI05_WNC(‐1)/JPGDP(‐1)) + 2.91012313741e‐05*@TREND
Eqn 144: D(XREVIND15_WSC/REVIND15_SUM) = ‐0.000495730492477 ‐ 0.000844677778847 +
0.459758926938*((@MEAN(XREVIND15_WSC/REVIND15_SUM,"1980 2008")‐(XREVIND15_WSC(‐
1)/REVIND15_SUM(‐1)))) + 0.389792738528*D(XREVIND15_WSC(‐1)/REVIND15_SUM(‐1)) ‐
May 2014
U.S. Energy Information Administration | NEMS Macroeconomic Activity Module Documentation Report 174
0.000408552485868*D(RMPRIME(‐1)‐@PCA(CPI_WSC(‐1))) + 0.000202487825758*D(EEA(‐1)) ‐
0.00184540628989*D(WPI05_WSC(‐1)/JPGDP(‐1)) + 2.91012313741e‐05*@TREND
IND16 ‐ Other chemical products
Eqn 145: D(XREVIND16_ENC/REVIND16_SUM) = ‐0.00191165205801 ‐ 1.39579385802e‐06 +
0.193852585039*((@MEAN(XREVIND16_ENC/REVIND16_SUM,"1980 2008")‐(XREVIND16_ENC(‐
1)/REVIND16_SUM(‐1)))) + 0.0848379917612*D(XREVIND16_ENC(‐1)/REVIND16_SUM(‐1)) + 7.58367992786e‐
05*D(GSPR_ENC(‐1)/NP_ENC(‐1)) ‐ 2.61320549098e‐06*@TREND
Eqn 146: D(XREVIND16_ESC/REVIND16_SUM) = 0.000361933817279 ‐ 1.39579385802e‐06 +
0.193852585039*((@MEAN(XREVIND16_ESC/REVIND16_SUM,"1980 2008")‐(XREVIND16_ESC(‐
1)/REVIND16_SUM(‐1)))) + 0.0848379917612*D(XREVIND16_ESC(‐1)/REVIND16_SUM(‐1)) + 7.58367992786e‐
05*D(GSPR_ESC(‐1)/NP_ESC(‐1)) ‐ 2.61320549098e‐06*@TREND
Eqn 147: D(XREVIND16_MATL/REVIND16_SUM) = ‐0.00381858296744 ‐ 1.39579385802e‐06 +
0.193852585039*((@MEAN(XREVIND16_MATL/REVIND16_SUM,"1980 2008")‐(XREVIND16_MATL(‐
1)/REVIND16_SUM(‐1)))) + 0.0848379917612*D(XREVIND16_MATL(‐1)/REVIND16_SUM(‐1)) + 7.58367992786e‐
05*D(GSPR_MATL(‐1)/NP_MATL(‐1)) ‐ 2.61320549098e‐06*@TREND
Eqn 148: D(XREVIND16_MTN/REVIND16_SUM) = 0.00042947220486 ‐ 1.39579385802e‐06 +
0.193852585039*((@MEAN(XREVIND16_MTN/REVIND16_SUM,"1980 2008")‐(XREVIND16_MTN(‐
1)/REVIND16_SUM(‐1)))) + 0.0848379917612*D(XREVIND16_MTN(‐1)/REVIND16_SUM(‐1)) + 7.58367992786e‐
05*D(GSPR_MTN(‐1)/NP_MTN(‐1)) ‐ 2.61320549098e‐06*@TREND
Eqn 149: D(XREVIND16_NENG/REVIND16_SUM) = ‐0.000271782975749 ‐ 1.39579385802e‐06 +
0.193852585039*((@MEAN(XREVIND16_NENG/REVIND16_SUM,"1980 2008")‐(XREVIND16_NENG(‐
1)/REVIND16_SUM(‐1)))) + 0.0848379917612*D(XREVIND16_NENG(‐1)/REVIND16_SUM(‐1)) + 7.58367992786e‐
05*D(GSPR_NENG(‐1)/NP_NENG(‐1)) ‐ 2.61320549098e‐06*@TREND
Eqn 150: D(XREVIND16_PAC/REVIND16_SUM) = 0.00261420173225 ‐ 1.39579385802e‐06 +
0.193852585039*((@MEAN(XREVIND16_PAC/REVIND16_SUM,"1980 2008")‐(XREVIND16_PAC(‐
1)/REVIND16_SUM(‐1)))) + 0.0848379917612*D(XREVIND16_PAC(‐1)/REVIND16_SUM(‐1)) + 7.58367992786e‐
05*D(GSPR_PAC(‐1)/NP_PAC(‐1)) ‐ 2.61320549098e‐06*@TREND
Eqn 151: D(XREVIND16_SATL/REVIND16_SUM) = 0.00300658889209 ‐ 1.39579385802e‐06 +
0.193852585039*((@MEAN(XREVIND16_SATL/REVIND16_SUM,"1980 2008")‐(XREVIND16_SATL(‐
1)/REVIND16_SUM(‐1)))) + 0.0848379917612*D(XREVIND16_SATL(‐1)/REVIND16_SUM(‐1)) + 7.58367992786e‐
05*D(GSPR_SATL(‐1)/NP_SATL(‐1)) ‐ 2.61320549098e‐06*@TREND
Eqn 152: D(XREVIND16_WNC/REVIND16_SUM) = ‐0.000446173480828 ‐ 1.39579385802e‐06 +
0.193852585039*((@MEAN(XREVIND16_WNC/REVIND16_SUM,"1980 2008")‐(XREVIND16_WNC(‐
1)/REVIND16_SUM(‐1)))) + 0.0848379917612*D(XREVIND16_WNC(‐1)/REVIND16_SUM(‐1)) + 7.58367992786e‐
05*D(GSPR_WNC(‐1)/NP_WNC(‐1)) ‐ 2.61320549098e‐06*@TREND
May 2014
U.S. Energy Information Administration | NEMS Macroeconomic Activity Module Documentation Report 175
Eqn 153: D(XREVIND16_WSC/REVIND16_SUM) = 3.59948355528e‐05 ‐ 1.39579385802e‐06 +
0.193852585039*((@MEAN(XREVIND16_WSC/REVIND16_SUM,"1980 2008")‐(XREVIND16_WSC(‐
1)/REVIND16_SUM(‐1)))) + 0.0848379917612*D(XREVIND16_WSC(‐1)/REVIND16_SUM(‐1)) + 7.58367992786e‐
05*D(GSPR_WSC(‐1)/NP_WSC(‐1)) ‐ 2.61320549098e‐06*@TREND
IND17 ‐ Pharma products
Eqn 154: D(XREVIND17_ENC/REVIND17_SUM) = ‐0.00164041380697 ‐ 8.8953977777e‐06 +
0.173225342546*((@MEAN(XREVIND17_ENC/REVIND17_SUM,"1980 2008")‐(XREVIND17_ENC(‐
1)/REVIND17_SUM(‐1)))) + 0.108154627306*D(XREVIND17_ENC(‐1)/REVIND17_SUM(‐1)) + 8.40060103058e‐
05*D(GSPR_ENC(‐1)/NP_ENC(‐1)) ‐ 2.52724004839e‐06*@TREND
Eqn 155: D(XREVIND17_ESC/REVIND17_SUM) = 0.000199938823292 ‐ 8.8953977777e‐06 +
0.173225342546*((@MEAN(XREVIND17_ESC/REVIND17_SUM,"1980 2008")‐(XREVIND17_ESC(‐
1)/REVIND17_SUM(‐1)))) + 0.108154627306*D(XREVIND17_ESC(‐1)/REVIND17_SUM(‐1)) + 8.40060103058e‐
05*D(GSPR_ESC(‐1)/NP_ESC(‐1)) ‐ 2.52724004839e‐06*@TREND
Eqn 156: D(XREVIND17_MATL/REVIND17_SUM) = ‐0.00446124112311 ‐ 8.8953977777e‐06 +
0.173225342546*((@MEAN(XREVIND17_MATL/REVIND17_SUM,"1980 2008")‐(XREVIND17_MATL(‐
1)/REVIND17_SUM(‐1)))) + 0.108154627306*D(XREVIND17_MATL(‐1)/REVIND17_SUM(‐1)) + 8.40060103058e‐
05*D(GSPR_MATL(‐1)/NP_MATL(‐1)) ‐ 2.52724004839e‐06*@TREND
Eqn 157: D(XREVIND17_MTN/REVIND17_SUM) = 0.000345159510246 ‐ 8.8953977777e‐06 +
0.173225342546*((@MEAN(XREVIND17_MTN/REVIND17_SUM,"1980 2008")‐(XREVIND17_MTN(‐
1)/REVIND17_SUM(‐1)))) + 0.108154627306*D(XREVIND17_MTN(‐1)/REVIND17_SUM(‐1)) + 8.40060103058e‐
05*D(GSPR_MTN(‐1)/NP_MTN(‐1)) ‐ 2.52724004839e‐06*@TREND
Eqn 158: D(XREVIND17_NENG/REVIND17_SUM) = ‐0.000271781188473 ‐ 8.8953977777e‐06 +
0.173225342546*((@MEAN(XREVIND17_NENG/REVIND17_SUM,"1980 2008")‐(XREVIND17_NENG(‐
1)/REVIND17_SUM(‐1)))) + 0.108154627306*D(XREVIND17_NENG(‐1)/REVIND17_SUM(‐1)) + 8.40060103058e‐
05*D(GSPR_NENG(‐1)/NP_NENG(‐1)) ‐ 2.52724004839e‐06*@TREND
Eqn 159: D(XREVIND17_PAC/REVIND17_SUM) = 0.00339752387815 ‐ 8.8953977777e‐06 +
0.173225342546*((@MEAN(XREVIND17_PAC/REVIND17_SUM,"1980 2008")‐(XREVIND17_PAC(‐
1)/REVIND17_SUM(‐1)))) + 0.108154627306*D(XREVIND17_PAC(‐1)/REVIND17_SUM(‐1)) + 8.40060103058e‐
05*D(GSPR_PAC(‐1)/NP_PAC(‐1)) ‐ 2.52724004839e‐06*@TREND
Eqn 160: D(XREVIND17_SATL/REVIND17_SUM) = 0.0027395715524 ‐ 8.8953977777e‐06 +
0.173225342546*((@MEAN(XREVIND17_SATL/REVIND17_SUM,"1980 2008")‐(XREVIND17_SATL(‐
1)/REVIND17_SUM(‐1)))) + 0.108154627306*D(XREVIND17_SATL(‐1)/REVIND17_SUM(‐1)) + 8.40060103058e‐
05*D(GSPR_SATL(‐1)/NP_SATL(‐1)) ‐ 2.52724004839e‐06*@TREND
Eqn 161: D(XREVIND17_WNC/REVIND17_SUM) = ‐0.000326776599773 ‐ 8.8953977777e‐06 +
0.173225342546*((@MEAN(XREVIND17_WNC/REVIND17_SUM,"1980 2008")‐(XREVIND17_WNC(‐
1)/REVIND17_SUM(‐1)))) + 0.108154627306*D(XREVIND17_WNC(‐1)/REVIND17_SUM(‐1)) + 8.40060103058e‐
05*D(GSPR_WNC(‐1)/NP_WNC(‐1)) ‐ 2.52724004839e‐06*@TREND
May 2014
U.S. Energy Information Administration | NEMS Macroeconomic Activity Module Documentation Report 176
Eqn 162: D(XREVIND17_WSC/REVIND17_SUM) = 1.80189542507e‐05 ‐ 8.8953977777e‐06 +
0.173225342546*((@MEAN(XREVIND17_WSC/REVIND17_SUM,"1980 2008")‐(XREVIND17_WSC(‐
1)/REVIND17_SUM(‐1)))) + 0.108154627306*D(XREVIND17_WSC(‐1)/REVIND17_SUM(‐1)) + 8.40060103058e‐
05*D(GSPR_WSC(‐1)/NP_WSC(‐1)) ‐ 2.52724004839e‐06*@TREND
IND18 ‐ Paint products
Eqn 163: D(XREVIND18_ENC/REVIND18_SUM) = ‐0.00318855037047 + 1.94955071431e‐06 +
0.207862674924*((@MEAN(XREVIND18_ENC/REVIND18_SUM,"1980 2008")‐(XREVIND18_ENC(‐
1)/REVIND18_SUM(‐1)))) ‐ 0.00560286158702*D(XREVIND18_ENC(‐1)/REVIND18_SUM(‐1)) +
0.000114961069237*D(GSPR_ENC(‐1)/NP_ENC(‐1)) ‐ 4.16463224201e‐06*@TREND
Eqn 164: D(XREVIND18_ESC/REVIND18_SUM) = 0.000731698571179 + 1.94955071431e‐06 +
0.207862674924*((@MEAN(XREVIND18_ESC/REVIND18_SUM,"1980 2008")‐(XREVIND18_ESC(‐
1)/REVIND18_SUM(‐1)))) ‐ 0.00560286158702*D(XREVIND18_ESC(‐1)/REVIND18_SUM(‐1)) +
0.000114961069237*D(GSPR_ESC(‐1)/NP_ESC(‐1)) ‐ 4.16463224201e‐06*@TREND
Eqn 165: D(XREVIND18_MATL/REVIND18_SUM) = ‐0.00200260275192 + 1.94955071431e‐06 +
0.207862674924*((@MEAN(XREVIND18_MATL/REVIND18_SUM,"1980 2008")‐(XREVIND18_MATL(‐
1)/REVIND18_SUM(‐1)))) ‐ 0.00560286158702*D(XREVIND18_MATL(‐1)/REVIND18_SUM(‐1)) +
0.000114961069237*D(GSPR_MATL(‐1)/NP_MATL(‐1)) ‐ 4.16463224201e‐06*@TREND
Eqn 166: D(XREVIND18_MTN/REVIND18_SUM) = 0.000512979405287 + 1.94955071431e‐06 +
0.207862674924*((@MEAN(XREVIND18_MTN/REVIND18_SUM,"1980 2008")‐(XREVIND18_MTN(‐
1)/REVIND18_SUM(‐1)))) ‐ 0.00560286158702*D(XREVIND18_MTN(‐1)/REVIND18_SUM(‐1)) +
0.000114961069237*D(GSPR_MTN(‐1)/NP_MTN(‐1)) ‐ 4.16463224201e‐06*@TREND
Eqn 167: D(XREVIND18_NENG/REVIND18_SUM) = ‐0.000348121036827 + 1.94955071431e‐06 +
0.207862674924*((@MEAN(XREVIND18_NENG/REVIND18_SUM,"1980 2008")‐(XREVIND18_NENG(‐
1)/REVIND18_SUM(‐1)))) ‐ 0.00560286158702*D(XREVIND18_NENG(‐1)/REVIND18_SUM(‐1)) +
0.000114961069237*D(GSPR_NENG(‐1)/NP_NENG(‐1)) ‐ 4.16463224201e‐06*@TREND
Eqn 168: D(XREVIND18_PAC/REVIND18_SUM) = 0.00195454157071 + 1.94955071431e‐06 +
0.207862674924*((@MEAN(XREVIND18_PAC/REVIND18_SUM,"1980 2008")‐(XREVIND18_PAC(‐
1)/REVIND18_SUM(‐1)))) ‐ 0.00560286158702*D(XREVIND18_PAC(‐1)/REVIND18_SUM(‐1)) +
0.000114961069237*D(GSPR_PAC(‐1)/NP_PAC(‐1)) ‐ 4.16463224201e‐06*@TREND
Eqn 169: D(XREVIND18_SATL/REVIND18_SUM) = 0.00296817050939 + 1.94955071431e‐06 +
0.207862674924*((@MEAN(XREVIND18_SATL/REVIND18_SUM,"1980 2008")‐(XREVIND18_SATL(‐
1)/REVIND18_SUM(‐1)))) ‐ 0.00560286158702*D(XREVIND18_SATL(‐1)/REVIND18_SUM(‐1)) +
0.000114961069237*D(GSPR_SATL(‐1)/NP_SATL(‐1)) ‐ 4.16463224201e‐06*@TREND
Eqn 170: D(XREVIND18_WNC/REVIND18_SUM) = ‐0.000666706294465 + 1.94955071431e‐06 +
0.207862674924*((@MEAN(XREVIND18_WNC/REVIND18_SUM,"1980 2008")‐(XREVIND18_WNC(‐
1)/REVIND18_SUM(‐1)))) ‐ 0.00560286158702*D(XREVIND18_WNC(‐1)/REVIND18_SUM(‐1)) +
0.000114961069237*D(GSPR_WNC(‐1)/NP_WNC(‐1)) ‐ 4.16463224201e‐06*@TREND
May 2014
U.S. Energy Information Administration | NEMS Macroeconomic Activity Module Documentation Report 177
Eqn 171: D(XREVIND18_WSC/REVIND18_SUM) = 3.85903971134e‐05 + 1.94955071431e‐06 +
0.207862674924*((@MEAN(XREVIND18_WSC/REVIND18_SUM,"1980 2008")‐(XREVIND18_WSC(‐
1)/REVIND18_SUM(‐1)))) ‐ 0.00560286158702*D(XREVIND18_WSC(‐1)/REVIND18_SUM(‐1)) +
0.000114961069237*D(GSPR_WSC(‐1)/NP_WSC(‐1)) ‐ 4.16463224201e‐06*@TREND
IND19 ‐ Soaps and cleaning products
Eqn 172: D(XREVIND19_ENC/REVIND19_SUM) = ‐0.00245141549105 + 5.69004449993e‐08 +
0.212976522044*((@MEAN(XREVIND19_ENC/REVIND19_SUM,"1980 2008")‐(XREVIND19_ENC(‐
1)/REVIND19_SUM(‐1)))) + 0.0216135344676*D(XREVIND19_ENC(‐1)/REVIND19_SUM(‐1)) + 1.25829814113e‐
06*D(GSPR_ENC(‐1)/NP_ENC(‐1)) ‐ 4.73617724907e‐08*@TREND
Eqn 173: D(XREVIND19_ESC/REVIND19_SUM) = 0.000391407813108 + 5.69004449993e‐08 +
0.212976522044*((@MEAN(XREVIND19_ESC/REVIND19_SUM,"1980 2008")‐(XREVIND19_ESC(‐
1)/REVIND19_SUM(‐1)))) + 0.0216135344676*D(XREVIND19_ESC(‐1)/REVIND19_SUM(‐1)) + 1.25829814113e‐
06*D(GSPR_ESC(‐1)/NP_ESC(‐1)) ‐ 4.73617724907e‐08*@TREND
Eqn 174: D(XREVIND19_MATL/REVIND19_SUM) = ‐0.00308700439259 + 5.69004449993e‐08 +
0.212976522044*((@MEAN(XREVIND19_MATL/REVIND19_SUM,"1980 2008")‐(XREVIND19_MATL(‐
1)/REVIND19_SUM(‐1)))) + 0.0216135344676*D(XREVIND19_MATL(‐1)/REVIND19_SUM(‐1)) + 1.25829814113e‐
06*D(GSPR_MATL(‐1)/NP_MATL(‐1)) ‐ 4.73617724907e‐08*@TREND
Eqn 175: D(XREVIND19_MTN/REVIND19_SUM) = 0.000389871879643 + 5.69004449993e‐08 +
0.212976522044*((@MEAN(XREVIND19_MTN/REVIND19_SUM,"1980 2008")‐(XREVIND19_MTN(‐
1)/REVIND19_SUM(‐1)))) + 0.0216135344676*D(XREVIND19_MTN(‐1)/REVIND19_SUM(‐1)) + 1.25829814113e‐
06*D(GSPR_MTN(‐1)/NP_MTN(‐1)) ‐ 4.73617724907e‐08*@TREND
Eqn 176: D(XREVIND19_NENG/REVIND19_SUM) = ‐0.00018898604446 + 5.69004449993e‐08 +
0.212976522044*((@MEAN(XREVIND19_NENG/REVIND19_SUM,"1980 2008")‐(XREVIND19_NENG(‐
1)/REVIND19_SUM(‐1)))) + 0.0216135344676*D(XREVIND19_NENG(‐1)/REVIND19_SUM(‐1)) + 1.25829814113e‐
06*D(GSPR_NENG(‐1)/NP_NENG(‐1)) ‐ 4.73617724907e‐08*@TREND
Eqn 177: D(XREVIND19_PAC/REVIND19_SUM) = 0.00145992179294 + 5.69004449993e‐08 +
0.212976522044*((@MEAN(XREVIND19_PAC/REVIND19_SUM,"1980 2008")‐(XREVIND19_PAC(‐
1)/REVIND19_SUM(‐1)))) + 0.0216135344676*D(XREVIND19_PAC(‐1)/REVIND19_SUM(‐1)) + 1.25829814113e‐
06*D(GSPR_PAC(‐1)/NP_PAC(‐1)) ‐ 4.73617724907e‐08*@TREND
Eqn 178: D(XREVIND19_SATL/REVIND19_SUM) = 0.00411313409891 + 5.69004449993e‐08 +
0.212976522044*((@MEAN(XREVIND19_SATL/REVIND19_SUM,"1980 2008")‐(XREVIND19_SATL(‐
1)/REVIND19_SUM(‐1)))) + 0.0216135344676*D(XREVIND19_SATL(‐1)/REVIND19_SUM(‐1)) + 1.25829814113e‐
06*D(GSPR_SATL(‐1)/NP_SATL(‐1)) ‐ 4.73617724907e‐08*@TREND
Eqn 179: D(XREVIND19_WNC/REVIND19_SUM) = ‐0.000676189039442 + 5.69004449993e‐08 +
0.212976522044*((@MEAN(XREVIND19_WNC/REVIND19_SUM,"1980 2008")‐(XREVIND19_WNC(‐
1)/REVIND19_SUM(‐1)))) + 0.0216135344676*D(XREVIND19_WNC(‐1)/REVIND19_SUM(‐1)) + 1.25829814113e‐
06*D(GSPR_WNC(‐1)/NP_WNC(‐1)) ‐ 4.73617724907e‐08*@TREND
May 2014
U.S. Energy Information Administration | NEMS Macroeconomic Activity Module Documentation Report 178
Eqn 180: D(XREVIND19_WSC/REVIND19_SUM) = 4.925938295e‐05 + 5.69004449993e‐08 +
0.212976522044*((@MEAN(XREVIND19_WSC/REVIND19_SUM,"1980 2008")‐(XREVIND19_WSC(‐
1)/REVIND19_SUM(‐1)))) + 0.0216135344676*D(XREVIND19_WSC(‐1)/REVIND19_SUM(‐1)) + 1.25829814113e‐
06*D(GSPR_WSC(‐1)/NP_WSC(‐1)) ‐ 4.73617724907e‐08*@TREND
IND20 ‐ Other chemical products
Eqn 181: D(XREVIND20_ENC/REVIND20_SUM) = ‐0.0014709192863 + 5.4094008748e‐06 +
0.224388612535*((@MEAN(XREVIND20_ENC/REVIND20_SUM,"1980 2008")‐(XREVIND20_ENC(‐
1)/REVIND20_SUM(‐1)))) + 0.0834662701723*D(XREVIND20_ENC(‐1)/REVIND20_SUM(‐1)) + 7.61465025167e‐
05*D(GSPR_ENC(‐1)/NP_ENC(‐1)) ‐ 2.9644220758e‐06*@TREND
Eqn 182: D(XREVIND20_ESC/REVIND20_SUM) = 0.000725021883742 + 5.4094008748e‐06 +
0.224388612535*((@MEAN(XREVIND20_ESC/REVIND20_SUM,"1980 2008")‐(XREVIND20_ESC(‐
1)/REVIND20_SUM(‐1)))) + 0.0834662701723*D(XREVIND20_ESC(‐1)/REVIND20_SUM(‐1)) + 7.61465025167e‐
05*D(GSPR_ESC(‐1)/NP_ESC(‐1)) ‐ 2.9644220758e‐06*@TREND
Eqn 183: D(XREVIND20_MATL/REVIND20_SUM) = ‐0.00396426059591 + 5.4094008748e‐06 +
0.224388612535*((@MEAN(XREVIND20_MATL/REVIND20_SUM,"1980 2008")‐(XREVIND20_MATL(‐
1)/REVIND20_SUM(‐1)))) + 0.0834662701723*D(XREVIND20_MATL(‐1)/REVIND20_SUM(‐1)) + 7.61465025167e‐
05*D(GSPR_MATL(‐1)/NP_MATL(‐1)) ‐ 2.9644220758e‐06*@TREND
Eqn 184: D(XREVIND20_MTN/REVIND20_SUM) = 0.000814508439073 + 5.4094008748e‐06 +
0.224388612535*((@MEAN(XREVIND20_MTN/REVIND20_SUM,"1980 2008")‐(XREVIND20_MTN(‐
1)/REVIND20_SUM(‐1)))) + 0.0834662701723*D(XREVIND20_MTN(‐1)/REVIND20_SUM(‐1)) + 7.61465025167e‐
05*D(GSPR_MTN(‐1)/NP_MTN(‐1)) ‐ 2.9644220758e‐06*@TREND
Eqn 185: D(XREVIND20_NENG/REVIND20_SUM) = ‐0.000360360392252 + 5.4094008748e‐06 +
0.224388612535*((@MEAN(XREVIND20_NENG/REVIND20_SUM,"1980 2008")‐(XREVIND20_NENG(‐
1)/REVIND20_SUM(‐1)))) + 0.0834662701723*D(XREVIND20_NENG(‐1)/REVIND20_SUM(‐1)) + 7.61465025167e‐
05*D(GSPR_NENG(‐1)/NP_NENG(‐1)) ‐ 2.9644220758e‐06*@TREND
Eqn 186: D(XREVIND20_PAC/REVIND20_SUM) = 0.0019655514798 + 5.4094008748e‐06 +
0.224388612535*((@MEAN(XREVIND20_PAC/REVIND20_SUM,"1980 2008")‐(XREVIND20_PAC(‐
1)/REVIND20_SUM(‐1)))) + 0.0834662701723*D(XREVIND20_PAC(‐1)/REVIND20_SUM(‐1)) + 7.61465025167e‐
05*D(GSPR_PAC(‐1)/NP_PAC(‐1)) ‐ 2.9644220758e‐06*@TREND
Eqn 187: D(XREVIND20_SATL/REVIND20_SUM) = 0.00258743444103 + 5.4094008748e‐06 +
0.224388612535*((@MEAN(XREVIND20_SATL/REVIND20_SUM,"1980 2008")‐(XREVIND20_SATL(‐
1)/REVIND20_SUM(‐1)))) + 0.0834662701723*D(XREVIND20_SATL(‐1)/REVIND20_SUM(‐1)) + 7.61465025167e‐
05*D(GSPR_SATL(‐1)/NP_SATL(‐1)) ‐ 2.9644220758e‐06*@TREND
Eqn 188: D(XREVIND20_WNC/REVIND20_SUM) = ‐0.000389892573755 + 5.4094008748e‐06 +
0.224388612535*((@MEAN(XREVIND20_WNC/REVIND20_SUM,"1980 2008")‐(XREVIND20_WNC(‐
1)/REVIND20_SUM(‐1)))) + 0.0834662701723*D(XREVIND20_WNC(‐1)/REVIND20_SUM(‐1)) + 7.61465025167e‐
05*D(GSPR_WNC(‐1)/NP_WNC(‐1)) ‐ 2.9644220758e‐06*@TREND
May 2014
U.S. Energy Information Administration | NEMS Macroeconomic Activity Module Documentation Report 179
Eqn 189: D(XREVIND20_WSC/REVIND20_SUM) = 9.29166045674e‐05 + 5.4094008748e‐06 +
0.224388612535*((@MEAN(XREVIND20_WSC/REVIND20_SUM,"1980 2008")‐(XREVIND20_WSC(‐
1)/REVIND20_SUM(‐1)))) + 0.0834662701723*D(XREVIND20_WSC(‐1)/REVIND20_SUM(‐1)) + 7.61465025167e‐
05*D(GSPR_WSC(‐1)/NP_WSC(‐1)) ‐ 2.9644220758e‐06*@TREND
IND21 ‐ Petroleum refineries
Eqn 190: D(XREVIND21_ENC/REVIND21_SUM) = ‐0.00663438029735 ‐ 0.000307572738574 +
0.244804084637*((@MEAN(XREVIND21_ENC/REVIND21_SUM,"1980 2008")‐(XREVIND21_ENC(‐
1)/REVIND21_SUM(‐1)))) ‐ 0.0967976210196*D(XREVIND21_ENC(‐1)/REVIND21_SUM(‐1)) ‐
0.000143721655524*D(RMPRIME(‐1)‐@PCA(CPI_ENC(‐1))) + 6.46174435009e‐05*D(EEA(‐1)) ‐ 5.95804627082e‐
05*D(WPI05_ENC/JPGDP(‐1)) + 1.04378468165e‐05*@TREND
Eqn 191: D(XREVIND21_ESC/REVIND21_SUM) = 0.00019513791933 ‐ 0.000307572738574 +
0.244804084637*((@MEAN(XREVIND21_ESC/REVIND21_SUM,"1980 2008")‐(XREVIND21_ESC(‐
1)/REVIND21_SUM(‐1)))) ‐ 0.0967976210196*D(XREVIND21_ESC(‐1)/REVIND21_SUM(‐1)) ‐
0.000143721655524*D(RMPRIME(‐1)‐@PCA(CPI_ESC(‐1))) + 6.46174435009e‐05*D(EEA(‐1)) ‐ 5.95804627082e‐
05*D(WPI05_ESC/JPGDP(‐1)) + 1.04378468165e‐05*@TREND
Eqn 192: D(XREVIND21_MATL/REVIND21_SUM) = ‐0.00244924526474 ‐ 0.000307572738574 +
0.244804084637*((@MEAN(XREVIND21_MATL/REVIND21_SUM,"1980 2008")‐(XREVIND21_MATL(‐
1)/REVIND21_SUM(‐1)))) ‐ 0.0967976210196*D(XREVIND21_MATL(‐1)/REVIND21_SUM(‐1)) ‐
0.000143721655524*D(RMPRIME(‐1)‐@PCA(CPI_MATL(‐1))) + 6.46174435009e‐05*D(EEA(‐1)) ‐
5.95804627082e‐05*D(WPI05_MATL/JPGDP(‐1)) + 1.04378468165e‐05*@TREND
Eqn 193: D(XREVIND21_MTN/REVIND21_SUM) = 0.000471330217427 ‐ 0.000307572738574 +
0.244804084637*((@MEAN(XREVIND21_MTN/REVIND21_SUM,"1980 2008")‐(XREVIND21_MTN(‐
1)/REVIND21_SUM(‐1)))) ‐ 0.0967976210196*D(XREVIND21_MTN(‐1)/REVIND21_SUM(‐1)) ‐
0.000143721655524*D(RMPRIME(‐1)‐@PCA(CPI_MTN(‐1))) + 6.46174435009e‐05*D(EEA(‐1)) ‐
5.95804627082e‐05*D(WPI05_MTN/JPGDP(‐1)) + 1.04378468165e‐05*@TREND
Eqn 194: D(XREVIND21_NENG/REVIND21_SUM) = 4.00237196429e‐05 ‐ 0.000307572738574 +
0.244804084637*((@MEAN(XREVIND21_NENG/REVIND21_SUM,"1980 2008")‐(XREVIND21_NENG(‐
1)/REVIND21_SUM(‐1)))) ‐ 0.0967976210196*D(XREVIND21_NENG(‐1)/REVIND21_SUM(‐1)) ‐
0.000143721655524*D(RMPRIME(‐1)‐@PCA(CPI_NENG(‐1))) + 6.46174435009e‐05*D(EEA(‐1)) ‐
5.95804627082e‐05*D(WPI05_NENG/JPGDP(‐1)) + 1.04378468165e‐05*@TREND
Eqn 195: D(XREVIND21_PAC/REVIND21_SUM) = ‐0.00205878409007 ‐ 0.000307572738574 +
0.244804084637*((@MEAN(XREVIND21_PAC/REVIND21_SUM,"1980 2008")‐(XREVIND21_PAC(‐
1)/REVIND21_SUM(‐1)))) ‐ 0.0967976210196*D(XREVIND21_PAC(‐1)/REVIND21_SUM(‐1)) ‐
0.000143721655524*D(RMPRIME(‐1)‐@PCA(CPI_PAC(‐1))) + 6.46174435009e‐05*D(EEA(‐1)) ‐ 5.95804627082e‐
05*D(WPI05_PAC/JPGDP(‐1)) + 1.04378468165e‐05*@TREND
Eqn 196: D(XREVIND21_SATL/REVIND21_SUM) = ‐1.28181574717e‐05 ‐ 0.000307572738574 +
0.244804084637*((@MEAN(XREVIND21_SATL/REVIND21_SUM,"1980 2008")‐(XREVIND21_SATL(‐
May 2014
U.S. Energy Information Administration | NEMS Macroeconomic Activity Module Documentation Report 180
1)/REVIND21_SUM(‐1)))) ‐ 0.0967976210196*D(XREVIND21_SATL(‐1)/REVIND21_SUM(‐1)) ‐
0.000143721655524*D(RMPRIME(‐1)‐@PCA(CPI_SATL(‐1))) + 6.46174435009e‐05*D(EEA(‐1)) ‐
5.95804627082e‐05*D(WPI05_SATL/JPGDP(‐1)) + 1.04378468165e‐05*@TREND
Eqn 197: D(XREVIND21_WNC/REVIND21_SUM) = 6.32118801317e‐05 ‐ 0.000307572738574 +
0.244804084637*((@MEAN(XREVIND21_WNC/REVIND21_SUM,"1980 2008")‐(XREVIND21_WNC(‐
1)/REVIND21_SUM(‐1)))) ‐ 0.0967976210196*D(XREVIND21_WNC(‐1)/REVIND21_SUM(‐1)) ‐
0.000143721655524*D(RMPRIME(‐1)‐@PCA(CPI_WNC(‐1))) + 6.46174435009e‐05*D(EEA(‐1)) ‐
5.95804627082e‐05*D(WPI05_WNC/JPGDP(‐1)) + 1.04378468165e‐05*@TREND
Eqn 198: D(XREVIND21_WSC/REVIND21_SUM) = 0.0103855240731 ‐ 0.000307572738574 +
0.244804084637*((@MEAN(XREVIND21_WSC/REVIND21_SUM,"1980 2008")‐(XREVIND21_WSC(‐
1)/REVIND21_SUM(‐1)))) ‐ 0.0967976210196*D(XREVIND21_WSC(‐1)/REVIND21_SUM(‐1)) ‐
0.000143721655524*D(RMPRIME(‐1)‐@PCA(CPI_WSC(‐1))) + 6.46174435009e‐05*D(EEA(‐1)) ‐ 5.95804627082e‐
05*D(WPI05_WSC/JPGDP(‐1)) + 1.04378468165e‐05*@TREND
IND22 ‐ Other petroleum and coal products
Eqn 199: D(XREVIND22_ENC/REVIND22_SUM) = 0.000676709593912 + 0.000130082505875 +
0.430374006646*((@MEAN(XREVIND22_ENC/REVIND22_SUM,"1980 2008")‐(XREVIND22_ENC(‐
1)/REVIND22_SUM(‐1)))) + 0.182049196428*D(XREVIND22_ENC(‐1)/REVIND22_SUM(‐1)) +
0.000234089216615*D(RMPRIME‐@PCA(CPI_ENC)) ‐ 2.63352941108e‐05*D(EEA(‐1)) ‐ 2.27171378073e‐
06*@TREND
Eqn 200: D(XREVIND22_ESC/REVIND22_SUM) = ‐0.0002996670328 + 0.000130082505875 +
0.430374006646*((@MEAN(XREVIND22_ESC/REVIND22_SUM,"1980 2008")‐(XREVIND22_ESC(‐
1)/REVIND22_SUM(‐1)))) + 0.182049196428*D(XREVIND22_ESC(‐1)/REVIND22_SUM(‐1)) +
0.000234089216615*D(RMPRIME‐@PCA(CPI_ESC)) ‐ 2.63352941108e‐05*D(EEA(‐1)) ‐ 2.27171378073e‐
06*@TREND
Eqn 201: D(XREVIND22_MATL/REVIND22_SUM) = ‐0.00129051658281 + 0.000130082505875 +
0.430374006646*((@MEAN(XREVIND22_MATL/REVIND22_SUM,"1980 2008")‐(XREVIND22_MATL(‐
1)/REVIND22_SUM(‐1)))) + 0.182049196428*D(XREVIND22_MATL(‐1)/REVIND22_SUM(‐1)) +
0.000234089216615*D(RMPRIME‐@PCA(CPI_MATL)) ‐ 2.63352941108e‐05*D(EEA(‐1)) ‐ 2.27171378073e‐
06*@TREND
Eqn 202: D(XREVIND22_MTN/REVIND22_SUM) = 0.000186264277585 + 0.000130082505875 +
0.430374006646*((@MEAN(XREVIND22_MTN/REVIND22_SUM,"1980 2008")‐(XREVIND22_MTN(‐
1)/REVIND22_SUM(‐1)))) + 0.182049196428*D(XREVIND22_MTN(‐1)/REVIND22_SUM(‐1)) +
0.000234089216615*D(RMPRIME‐@PCA(CPI_MTN)) ‐ 2.63352941108e‐05*D(EEA(‐1)) ‐ 2.27171378073e‐
06*@TREND
Eqn 203: D(XREVIND22_NENG/REVIND22_SUM) = ‐0.0007844437523 + 0.000130082505875 +
0.430374006646*((@MEAN(XREVIND22_NENG/REVIND22_SUM,"1980 2008")‐(XREVIND22_NENG(‐
1)/REVIND22_SUM(‐1)))) + 0.182049196428*D(XREVIND22_NENG(‐1)/REVIND22_SUM(‐1)) +
May 2014
U.S. Energy Information Administration | NEMS Macroeconomic Activity Module Documentation Report 181
0.000234089216615*D(RMPRIME‐@PCA(CPI_NENG)) ‐ 2.63352941108e‐05*D(EEA(‐1)) ‐ 2.27171378073e‐
06*@TREND
Eqn 204: D(XREVIND22_PAC/REVIND22_SUM) = ‐0.00128651253504 + 0.000130082505875 +
0.430374006646*((@MEAN(XREVIND22_PAC/REVIND22_SUM,"1980 2008")‐(XREVIND22_PAC(‐
1)/REVIND22_SUM(‐1)))) + 0.182049196428*D(XREVIND22_PAC(‐1)/REVIND22_SUM(‐1)) +
0.000234089216615*D(RMPRIME‐@PCA(CPI_PAC)) ‐ 2.63352941108e‐05*D(EEA(‐1)) ‐ 2.27171378073e‐
06*@TREND
Eqn 205: D(XREVIND22_SATL/REVIND22_SUM) = ‐0.000305036190445 + 0.000130082505875 +
0.430374006646*((@MEAN(XREVIND22_SATL/REVIND22_SUM,"1980 2008")‐(XREVIND22_SATL(‐
1)/REVIND22_SUM(‐1)))) + 0.182049196428*D(XREVIND22_SATL(‐1)/REVIND22_SUM(‐1)) +
0.000234089216615*D(RMPRIME‐@PCA(CPI_SATL)) ‐ 2.63352941108e‐05*D(EEA(‐1)) ‐ 2.27171378073e‐
06*@TREND
Eqn 206: D(XREVIND22_WNC/REVIND22_SUM) = 0.000627857633618 + 0.000130082505875 +
0.430374006646*((@MEAN(XREVIND22_WNC/REVIND22_SUM,"1980 2008")‐(XREVIND22_WNC(‐
1)/REVIND22_SUM(‐1)))) + 0.182049196428*D(XREVIND22_WNC(‐1)/REVIND22_SUM(‐1)) +
0.000234089216615*D(RMPRIME‐@PCA(CPI_WNC)) ‐ 2.63352941108e‐05*D(EEA(‐1)) ‐ 2.27171378073e‐
06*@TREND
Eqn 207: D(XREVIND22_WSC/REVIND22_SUM) = 0.00247534458828 + 0.000130082505875 +
0.430374006646*((@MEAN(XREVIND22_WSC/REVIND22_SUM,"1980 2008")‐(XREVIND22_WSC(‐
1)/REVIND22_SUM(‐1)))) + 0.182049196428*D(XREVIND22_WSC(‐1)/REVIND22_SUM(‐1)) +
0.000234089216615*D(RMPRIME‐@PCA(CPI_WSC)) ‐ 2.63352941108e‐05*D(EEA(‐1)) ‐ 2.27171378073e‐
06*@TREND
IND23 ‐ Plastics and rubber products
Eqn 208: D(XREVIND23_ENC/REVIND23_SUM) = 0.000745521410262 ‐ 0.000468888000952 +
0.15508726883*((@MEAN(XREVIND23_ENC/REVIND23_SUM,"1980 2008")‐(XREVIND23_ENC(‐
1)/REVIND23_SUM(‐1)))) ‐ 0.00679397222859*D(XREVIND23_ENC(‐1)/REVIND23_SUM(‐1)) +
0.000666416907089*D(GSPR_ENC/NP_ENC) ‐ 0.000118750076873*D(RMPRIME‐@PCA(CPI_ENC)) ‐
0.000442755671382*D(WPI05_ENC/JPGDP(‐1))
Eqn 209: D(XREVIND23_ESC/REVIND23_SUM) = 0.000389376221189 ‐ 0.000468888000952 +
0.15508726883*((@MEAN(XREVIND23_ESC/REVIND23_SUM,"1980 2008")‐(XREVIND23_ESC(‐
1)/REVIND23_SUM(‐1)))) ‐ 0.00679397222859*D(XREVIND23_ESC(‐1)/REVIND23_SUM(‐1)) +
0.000666416907089*D(GSPR_ESC/NP_ESC) ‐ 0.000118750076873*D(RMPRIME‐@PCA(CPI_ESC)) ‐
0.000442755671382*D(WPI05_ESC/JPGDP(‐1))
Eqn 210: D(XREVIND23_MATL/REVIND23_SUM) = ‐0.00216160200147 ‐ 0.000468888000952 +
0.15508726883*((@MEAN(XREVIND23_MATL/REVIND23_SUM,"1980 2008")‐(XREVIND23_MATL(‐
1)/REVIND23_SUM(‐1)))) ‐ 0.00679397222859*D(XREVIND23_MATL(‐1)/REVIND23_SUM(‐1)) +
May 2014
U.S. Energy Information Administration | NEMS Macroeconomic Activity Module Documentation Report 182
0.000666416907089*D(GSPR_MATL/NP_MATL) ‐ 0.000118750076873*D(RMPRIME‐@PCA(CPI_MATL)) ‐
0.000442755671382*D(WPI05_MATL/JPGDP(‐1))
Eqn 211: D(XREVIND23_MTN/REVIND23_SUM) = 0.000494720619878 ‐ 0.000468888000952 +
0.15508726883*((@MEAN(XREVIND23_MTN/REVIND23_SUM,"1980 2008")‐(XREVIND23_MTN(‐
1)/REVIND23_SUM(‐1)))) ‐ 0.00679397222859*D(XREVIND23_MTN(‐1)/REVIND23_SUM(‐1)) +
0.000666416907089*D(GSPR_MTN/NP_MTN) ‐ 0.000118750076873*D(RMPRIME‐@PCA(CPI_MTN)) ‐
0.000442755671382*D(WPI05_MTN/JPGDP(‐1))
Eqn 212: D(XREVIND23_NENG/REVIND23_SUM) = ‐0.00116701258771 ‐ 0.000468888000952 +
0.15508726883*((@MEAN(XREVIND23_NENG/REVIND23_SUM,"1980 2008")‐(XREVIND23_NENG(‐
1)/REVIND23_SUM(‐1)))) ‐ 0.00679397222859*D(XREVIND23_NENG(‐1)/REVIND23_SUM(‐1)) +
0.000666416907089*D(GSPR_NENG/NP_NENG) ‐ 0.000118750076873*D(RMPRIME‐@PCA(CPI_NENG)) ‐
0.000442755671382*D(WPI05_NENG/JPGDP(‐1))
Eqn 213: D(XREVIND23_PAC/REVIND23_SUM) = ‐0.00129953720669 ‐ 0.000468888000952 +
0.15508726883*((@MEAN(XREVIND23_PAC/REVIND23_SUM,"1980 2008")‐(XREVIND23_PAC(‐
1)/REVIND23_SUM(‐1)))) ‐ 0.00679397222859*D(XREVIND23_PAC(‐1)/REVIND23_SUM(‐1)) +
0.000666416907089*D(GSPR_PAC/NP_PAC) ‐ 0.000118750076873*D(RMPRIME‐@PCA(CPI_PAC)) ‐
0.000442755671382*D(WPI05_PAC/JPGDP(‐1))
Eqn 214: D(XREVIND23_SATL/REVIND23_SUM) = 0.00153360369723 ‐ 0.000468888000952 +
0.15508726883*((@MEAN(XREVIND23_SATL/REVIND23_SUM,"1980 2008")‐(XREVIND23_SATL(‐
1)/REVIND23_SUM(‐1)))) ‐ 0.00679397222859*D(XREVIND23_SATL(‐1)/REVIND23_SUM(‐1)) +
0.000666416907089*D(GSPR_SATL/NP_SATL) ‐ 0.000118750076873*D(RMPRIME‐@PCA(CPI_SATL)) ‐
0.000442755671382*D(WPI05_SATL/JPGDP(‐1))
Eqn 215: D(XREVIND23_WNC/REVIND23_SUM) = 0.000495480997938 ‐ 0.000468888000952 +
0.15508726883*((@MEAN(XREVIND23_WNC/REVIND23_SUM,"1980 2008")‐(XREVIND23_WNC(‐
1)/REVIND23_SUM(‐1)))) ‐ 0.00679397222859*D(XREVIND23_WNC(‐1)/REVIND23_SUM(‐1)) +
0.000666416907089*D(GSPR_WNC/NP_WNC) ‐ 0.000118750076873*D(RMPRIME‐@PCA(CPI_WNC)) ‐
0.000442755671382*D(WPI05_WNC/JPGDP(‐1))
Eqn 216: D(XREVIND23_WSC/REVIND23_SUM) = 0.000969448849369 ‐ 0.000468888000952 +
0.15508726883*((@MEAN(XREVIND23_WSC/REVIND23_SUM,"1980 2008")‐(XREVIND23_WSC(‐
1)/REVIND23_SUM(‐1)))) ‐ 0.00679397222859*D(XREVIND23_WSC(‐1)/REVIND23_SUM(‐1)) +
0.000666416907089*D(GSPR_WSC/NP_WSC) ‐ 0.000118750076873*D(RMPRIME‐@PCA(CPI_WSC)) ‐
0.000442755671382*D(WPI05_WSC/JPGDP(‐1))
IND24 ‐ Glass & glass products
Eqn 226: D(XREVIND24_ENC/REVIND24_SUM) = ‐0.000284152395588 ‐ 0.000148111436893 +
0.127944511565*((@MEAN(XREVIND24_ENC/REVIND24_SUM,"1980 2008")‐(XREVIND24_ENC(‐
1)/REVIND24_SUM(‐1)))) + 0.000261979747594*D(GSPR_ENC(‐1)/NP_ENC(‐1)) ‐ 1.86288895217e‐06*@TREND
May 2014
U.S. Energy Information Administration | NEMS Macroeconomic Activity Module Documentation Report 183
Eqn 227: D(XREVIND24_ESC/REVIND24_SUM) = 0.0022039048654 ‐ 0.000148111436893 +
0.127944511565*((@MEAN(XREVIND24_ESC/REVIND24_SUM,"1980 2008")‐(XREVIND24_ESC(‐
1)/REVIND24_SUM(‐1)))) + 0.000261979747594*D(GSPR_ESC(‐1)/NP_ESC(‐1)) ‐ 1.86288895217e‐06*@TREND
Eqn 228: D(XREVIND24_MATL/REVIND24_SUM) = ‐0.00178374780911 ‐ 0.000148111436893 +
0.127944511565*((@MEAN(XREVIND24_MATL/REVIND24_SUM,"1980 2008")‐(XREVIND24_MATL(‐
1)/REVIND24_SUM(‐1)))) + 0.000261979747594*D(GSPR_MATL(‐1)/NP_MATL(‐1)) ‐ 1.86288895217e‐
06*@TREND
Eqn 229: D(XREVIND24_MTN/REVIND24_SUM) = 0.000441798960992 ‐ 0.000148111436893 +
0.127944511565*((@MEAN(XREVIND24_MTN/REVIND24_SUM,"1980 2008")‐(XREVIND24_MTN(‐
1)/REVIND24_SUM(‐1)))) + 0.000261979747594*D(GSPR_MTN(‐1)/NP_MTN(‐1)) ‐ 1.86288895217e‐06*@TREND
Eqn 230: D(XREVIND24_NENG/REVIND24_SUM) = 0.000261935752555 ‐ 0.000148111436893 + 0.127944511565*((@MEAN(XREVIND24_NENG/REVIND24_SUM,"1980 2008")‐(XREVIND24_NENG(‐1)/REVIND24_SUM(‐1)))) + 0.000261979747594*D(GSPR_NENG(‐1)/NP_NENG(‐1)) ‐ 1.86288895217e‐06*@TREND
Eqn 231: D(XREVIND24_PAC/REVIND24_SUM) = 0.00179408982442 ‐ 0.000148111436893 +
0.127944511565*((@MEAN(XREVIND24_PAC/REVIND24_SUM,"1980 2008")‐(XREVIND24_PAC(‐
1)/REVIND24_SUM(‐1)))) + 0.000261979747594*D(GSPR_PAC(‐1)/NP_PAC(‐1)) ‐ 1.86288895217e‐06*@TREND
Eqn 232: D(XREVIND24_SATL/REVIND24_SUM) = ‐0.00382948721507 ‐ 0.000148111436893 +
0.127944511565*((@MEAN(XREVIND24_SATL/REVIND24_SUM,"1980 2008")‐(XREVIND24_SATL(‐
1)/REVIND24_SUM(‐1)))) + 0.000261979747594*D(GSPR_SATL(‐1)/NP_SATL(‐1)) ‐ 1.86288895217e‐06*@TREND
Eqn 233: D(XREVIND24_WNC/REVIND24_SUM) = 0.00054068660325 ‐ 0.000148111436893 +
0.127944511565*((@MEAN(XREVIND24_WNC/REVIND24_SUM,"1980 2008")‐(XREVIND24_WNC(‐
1)/REVIND24_SUM(‐1)))) + 0.000261979747594*D(GSPR_WNC(‐1)/NP_WNC(‐1)) ‐ 1.86288895217e‐
06*@TREND
Eqn 234: D(XREVIND24_WSC/REVIND24_SUM) = 0.000654971413142 ‐ 0.000148111436893 +
0.127944511565*((@MEAN(XREVIND24_WSC/REVIND24_SUM,"1980 2008")‐(XREVIND24_WSC(‐
1)/REVIND24_SUM(‐1)))) + 0.000261979747594*D(GSPR_WSC(‐1)/NP_WSC(‐1)) ‐ 1.86288895217e‐06*@TREND
IND25 ‐ Cement manufacturing
Eqn 235: D(XREVIND25_ENC/REVIND25_SUM) = ‐0.000403129686714 ‐ 0.000122246305044 +
0.297940238145*((@MEAN(XREVIND25_ENC/REVIND25_SUM,"1980 2008")‐(XREVIND25_ENC(‐
1)/REVIND25_SUM(‐1)))) + 0.000191713576852*D(GSPR_ENC/NP_ENC) + 0.000172174143917*D(RMPRIME(‐1)‐
@PCA(CPI_ENC(‐1))) + 0.000156795020916*D(WPI05_ENC/JPGDP)
Eqn 236: D(XREVIND25_ESC/REVIND25_SUM) = 0.000251823539703 ‐ 0.000122246305044 +
0.297940238145*((@MEAN(XREVIND25_ESC/REVIND25_SUM,"1980 2008")‐(XREVIND25_ESC(‐
1)/REVIND25_SUM(‐1)))) + 0.000191713576852*D(GSPR_ESC/NP_ESC) + 0.000172174143917*D(RMPRIME(‐1)‐
@PCA(CPI_ESC(‐1))) + 0.000156795020916*D(WPI05_ESC/JPGDP)
May 2014
U.S. Energy Information Administration | NEMS Macroeconomic Activity Module Documentation Report 184
Eqn 237: D(XREVIND25_MATL/REVIND25_SUM) = ‐0.000809031168827 ‐ 0.000122246305044 +
0.297940238145*((@MEAN(XREVIND25_MATL/REVIND25_SUM,"1980 2008")‐(XREVIND25_MATL(‐
1)/REVIND25_SUM(‐1)))) + 0.000191713576852*D(GSPR_MATL/NP_MATL) +
0.000172174143917*D(RMPRIME(‐1)‐@PCA(CPI_MATL(‐1))) + 0.000156795020916*D(WPI05_MATL/JPGDP)
Eqn 238: D(XREVIND25_MTN/REVIND25_SUM) = 0.000702295522075 ‐ 0.000122246305044 +
0.297940238145*((@MEAN(XREVIND25_MTN/REVIND25_SUM,"1980 2008")‐(XREVIND25_MTN(‐
1)/REVIND25_SUM(‐1)))) + 0.000191713576852*D(GSPR_MTN/NP_MTN) + 0.000172174143917*D(RMPRIME(‐
1)‐@PCA(CPI_MTN(‐1))) + 0.000156795020916*D(WPI05_MTN/JPGDP)
Eqn 239: D(XREVIND25_NENG/REVIND25_SUM) = ‐9.00203224923e‐05 ‐ 0.000122246305044 +
0.297940238145*((@MEAN(XREVIND25_NENG/REVIND25_SUM,"1980 2008")‐(XREVIND25_NENG(‐
1)/REVIND25_SUM(‐1)))) + 0.000191713576852*D(GSPR_NENG/NP_NENG) +
0.000172174143917*D(RMPRIME(‐1)‐@PCA(CPI_NENG(‐1))) + 0.000156795020916*D(WPI05_NENG/JPGDP)
Eqn 240: D(XREVIND25_PAC/REVIND25_SUM) = 0.00242146232061 ‐ 0.000122246305044 +
0.297940238145*((@MEAN(XREVIND25_PAC/REVIND25_SUM,"1980 2008")‐(XREVIND25_PAC(‐
1)/REVIND25_SUM(‐1)))) + 0.000191713576852*D(GSPR_PAC/NP_PAC) + 0.000172174143917*D(RMPRIME(‐1)‐
@PCA(CPI_PAC(‐1))) + 0.000156795020916*D(WPI05_PAC/JPGDP)
Eqn 241: D(XREVIND25_SATL/REVIND25_SUM) = 0.00216560389503 ‐ 0.000122246305044 +
0.297940238145*((@MEAN(XREVIND25_SATL/REVIND25_SUM,"1980 2008")‐(XREVIND25_SATL(‐
1)/REVIND25_SUM(‐1)))) + 0.000191713576852*D(GSPR_SATL/NP_SATL) + 0.000172174143917*D(RMPRIME(‐
1)‐@PCA(CPI_SATL(‐1))) + 0.000156795020916*D(WPI05_SATL/JPGDP)
Eqn 242: D(XREVIND25_WNC/REVIND25_SUM) = ‐0.00733199745432 ‐ 0.000122246305044 +
0.297940238145*((@MEAN(XREVIND25_WNC/REVIND25_SUM,"1980 2008")‐(XREVIND25_WNC(‐
1)/REVIND25_SUM(‐1)))) + 0.000191713576852*D(GSPR_WNC/NP_WNC) + 0.000172174143917*D(RMPRIME(‐
1)‐@PCA(CPI_WNC(‐1))) + 0.000156795020916*D(WPI05_WNC/JPGDP)
Eqn 243: D(XREVIND25_WSC/REVIND25_SUM) = 0.00309299335494 ‐ 0.000122246305044 +
0.297940238145*((@MEAN(XREVIND25_WSC/REVIND25_SUM,"1980 2008")‐(XREVIND25_WSC(‐
1)/REVIND25_SUM(‐1)))) + 0.000191713576852*D(GSPR_WSC/NP_WSC) + 0.000172174143917*D(RMPRIME(‐
1)‐@PCA(CPI_WSC(‐1))) + 0.000156795020916*D(WPI05_WSC/JPGDP)
IND26 ‐ Other nonmetallic mineral products
Eqn 244: D(XREVIND26_ENC/REVIND26_SUM) = ‐0.00166927642583 ‐ 2.63944266578e‐05 +
0.208767459922*((@MEAN(XREVIND26_ENC/REVIND26_SUM,"1980 2008")‐(XREVIND26_ENC(‐
1)/REVIND26_SUM(‐1)))) + 5.22705745361e‐05*D(GSPR_ENC(‐1)/NP_ENC(‐1)) ‐ 5.29535242718e‐07*@TREND
Eqn 245: D(XREVIND26_ESC/REVIND26_SUM) = ‐0.000140223117013 ‐ 2.63944266578e‐05 +
0.208767459922*((@MEAN(XREVIND26_ESC/REVIND26_SUM,"1980 2008")‐(XREVIND26_ESC(‐
1)/REVIND26_SUM(‐1)))) + 5.22705745361e‐05*D(GSPR_ESC(‐1)/NP_ESC(‐1)) ‐ 5.29535242718e‐07*@TREND
D(XREVIND26_ESC/REVIND26_SUM)
May 2014
U.S. Energy Information Administration | NEMS Macroeconomic Activity Module Documentation Report 185
Eqn 246: D(XREVIND26_MATL/REVIND26_SUM) = ‐0.00132655733896 ‐ 2.63944266578e‐05 +
0.208767459922*((@MEAN(XREVIND26_MATL/REVIND26_SUM,"1980 2008")‐(XREVIND26_MATL(‐
1)/REVIND26_SUM(‐1)))) + 5.22705745361e‐05*D(GSPR_MATL(‐1)/NP_MATL(‐1)) ‐ 5.29535242718e‐
07*@TREND
Eqn 247: D(XREVIND26_MTN/REVIND26_SUM) = 0.00197361185496 ‐ 2.63944266578e‐05 +
0.208767459922*((@MEAN(XREVIND26_MTN/REVIND26_SUM,"1980 2008")‐(XREVIND26_MTN(‐
1)/REVIND26_SUM(‐1)))) + 5.22705745361e‐05*D(GSPR_MTN(‐1)/NP_MTN(‐1)) ‐ 5.29535242718e‐07*@TREND
Eqn 248: D(XREVIND26_NENG/REVIND26_SUM) = ‐0.000634004580766 ‐ 2.63944266578e‐05 +
0.208767459922*((@MEAN(XREVIND26_NENG/REVIND26_SUM,"1980 2008")‐(XREVIND26_NENG(‐
1)/REVIND26_SUM(‐1)))) + 5.22705745361e‐05*D(GSPR_NENG(‐1)/NP_NENG(‐1)) ‐ 5.29535242718e‐
07*@TREND
Eqn 249: D(XREVIND26_PAC/REVIND26_SUM) = ‐0.000237064724991 ‐ 2.63944266578e‐05 +
0.208767459922*((@MEAN(XREVIND26_PAC/REVIND26_SUM,"1980 2008")‐(XREVIND26_PAC(‐
1)/REVIND26_SUM(‐1)))) + 5.22705745361e‐05*D(GSPR_PAC(‐1)/NP_PAC(‐1)) ‐ 5.29535242718e‐07*@TREND
Eqn 250: D(XREVIND26_SATL/REVIND26_SUM) = 2.53717989313e‐05 ‐ 2.63944266578e‐05 +
0.208767459922*((@MEAN(XREVIND26_SATL/REVIND26_SUM,"1980 2008")‐(XREVIND26_SATL(‐
1)/REVIND26_SUM(‐1)))) + 5.22705745361e‐05*D(GSPR_SATL(‐1)/NP_SATL(‐1)) ‐ 5.29535242718e‐07*@TREND
Eqn 251: D(XREVIND26_WNC/REVIND26_SUM) = ‐0.000430138664768 ‐ 2.63944266578e‐05 +
0.208767459922*((@MEAN(XREVIND26_WNC/REVIND26_SUM,"1980 2008")‐(XREVIND26_WNC(‐
1)/REVIND26_SUM(‐1)))) + 5.22705745361e‐05*D(GSPR_WNC(‐1)/NP_WNC(‐1)) ‐ 5.29535242718e‐07*@TREND
Eqn 252: D(XREVIND26_WSC/REVIND26_SUM) = 0.00243828119843 ‐ 2.63944266578e‐05 +
0.208767459922*((@MEAN(XREVIND26_WSC/REVIND26_SUM,"1980 2008")‐(XREVIND26_WSC(‐
1)/REVIND26_SUM(‐1)))) + 5.22705745361e‐05*D(GSPR_WSC(‐1)/NP_WSC(‐1)) ‐ 5.29535242718e‐07*@TREND
IND27 ‐ Iron & steel mills, ferroalloy & steel products
Eqn 253: D(XREVIND27_ENC/REVIND27_SUM) = ‐0.0059691539123 ‐ 0.000345630359615 ‐
0.0373306791037*((@MEAN(XREVIND27_ENC/REVIND27_SUM,"1980 2008")‐(XREVIND27_ENC(‐
1)/REVIND27_SUM(‐1)))) ‐ 0.11089999067*D(XREVIND27_ENC(‐1)/REVIND27_SUM(‐1)) +
0.000495185732806*D(GSPR_ENC/NP_ENC) ‐ 1.72976543778e‐07*D(RWM_ENC/JPGDP) ‐ 8.45360322082e‐
05*D(WPI05_ENC/JPGDP)
Eqn 254: D(XREVIND27_ESC/REVIND27_SUM) = 0.00301370881679 ‐ 0.000345630359615 ‐
0.0373306791037*((@MEAN(XREVIND27_ESC/REVIND27_SUM,"1980 2008")‐(XREVIND27_ESC(‐
1)/REVIND27_SUM(‐1)))) ‐ 0.11089999067*D(XREVIND27_ESC(‐1)/REVIND27_SUM(‐1)) +
0.000495185732806*D(GSPR_ESC/NP_ESC) ‐ 1.72976543778e‐07*D(RWM_ESC/JPGDP) ‐ 8.45360322082e‐
05*D(WPI05_ESC/JPGDP)
Eqn 255: D(XREVIND27_MATL/REVIND27_SUM) = ‐0.00182951870345 ‐ 0.000345630359615 ‐
0.0373306791037*((@MEAN(XREVIND27_MATL/REVIND27_SUM,"1980 2008")‐(XREVIND27_MATL(‐
May 2014
U.S. Energy Information Administration | NEMS Macroeconomic Activity Module Documentation Report 186
1)/REVIND27_SUM(‐1)))) ‐ 0.11089999067*D(XREVIND27_MATL(‐1)/REVIND27_SUM(‐1)) +
0.000495185732806*D(GSPR_MATL/NP_MATL) ‐ 1.72976543778e‐07*D(RWM_MATL/JPGDP) ‐
8.45360322082e‐05*D(WPI05_MATL/JPGDP)
Eqn 256: D(XREVIND27_MTN/REVIND27_SUM) = 0.000149175907532 ‐ 0.000345630359615 ‐
0.0373306791037*((@MEAN(XREVIND27_MTN/REVIND27_SUM,"1980 2008")‐(XREVIND27_MTN(‐
1)/REVIND27_SUM(‐1)))) ‐ 0.11089999067*D(XREVIND27_MTN(‐1)/REVIND27_SUM(‐1)) +
0.000495185732806*D(GSPR_MTN/NP_MTN) ‐ 1.72976543778e‐07*D(RWM_MTN/JPGDP) ‐ 8.45360322082e‐
05*D(WPI05_MTN/JPGDP)
Eqn 257: D(XREVIND27_NENG/REVIND27_SUM) = ‐4.59818663503e‐05 ‐ 0.000345630359615 ‐
0.0373306791037*((@MEAN(XREVIND27_NENG/REVIND27_SUM,"1980 2008")‐(XREVIND27_NENG(‐
1)/REVIND27_SUM(‐1)))) ‐ 0.11089999067*D(XREVIND27_NENG(‐1)/REVIND27_SUM(‐1)) +
0.000495185732806*D(GSPR_NENG/NP_NENG) ‐ 1.72976543778e‐07*D(RWM_NENG/JPGDP) ‐
8.45360322082e‐05*D(WPI05_NENG/JPGDP)
Eqn 258: D(XREVIND27_PAC/REVIND27_SUM) = 0.000862349042486 ‐ 0.000345630359615 ‐
0.0373306791037*((@MEAN(XREVIND27_PAC/REVIND27_SUM,"1980 2008")‐(XREVIND27_PAC(‐
1)/REVIND27_SUM(‐1)))) ‐ 0.11089999067*D(XREVIND27_PAC(‐1)/REVIND27_SUM(‐1)) +
0.000495185732806*D(GSPR_PAC/NP_PAC) ‐ 1.72976543778e‐07*D(RWM_PAC/JPGDP) ‐ 8.45360322082e‐
05*D(WPI05_PAC/JPGDP)
Eqn 259: D(XREVIND27_SATL/REVIND27_SUM) = ‐0.000238742860172 ‐ 0.000345630359615 ‐
0.0373306791037*((@MEAN(XREVIND27_SATL/REVIND27_SUM,"1980 2008")‐(XREVIND27_SATL(‐
1)/REVIND27_SUM(‐1)))) ‐ 0.11089999067*D(XREVIND27_SATL(‐1)/REVIND27_SUM(‐1)) +
0.000495185732806*D(GSPR_SATL/NP_SATL) ‐ 1.72976543778e‐07*D(RWM_SATL/JPGDP) ‐ 8.45360322082e‐
05*D(WPI05_SATL/JPGDP)
Eqn 260: D(XREVIND27_WNC/REVIND27_SUM) = 2.77165643614e‐05 ‐ 0.000345630359615 ‐
0.0373306791037*((@MEAN(XREVIND27_WNC/REVIND27_SUM,"1980 2008")‐(XREVIND27_WNC(‐
1)/REVIND27_SUM(‐1)))) ‐ 0.11089999067*D(XREVIND27_WNC(‐1)/REVIND27_SUM(‐1)) +
0.000495185732806*D(GSPR_WNC/NP_WNC) ‐ 1.72976543778e‐07*D(RWM_WNC/JPGDP) ‐ 8.45360322082e‐
05*D(WPI05_WNC/JPGDP)
Eqn 261: D(XREVIND27_WSC/REVIND27_SUM) = 0.00403044701111 ‐ 0.000345630359615 ‐
0.0373306791037*((@MEAN(XREVIND27_WSC/REVIND27_SUM,"1980 2008")‐(XREVIND27_WSC(‐
1)/REVIND27_SUM(‐1)))) ‐ 0.11089999067*D(XREVIND27_WSC(‐1)/REVIND27_SUM(‐1)) +
0.000495185732806*D(GSPR_WSC/NP_WSC) ‐ 1.72976543778e‐07*D(RWM_WSC/JPGDP) ‐ 8.45360322082e‐
05*D(WPI05_WSC/JPGDP)
May 2014
U.S. Energy Information Administration | NEMS Macroeconomic Activity Module Documentation Report 187
IND28 ‐ Alumina & aluminum products
Eqn 262: D(XREVIND28_ENC/REVIND28_SUM) = ‐0.00210709174226 ‐ 0.000908158681715 +
0.379260650234*((@MEAN(XREVIND28_ENC/REVIND28_SUM,"1980 2008")‐(XREVIND28_ENC(‐
1)/REVIND28_SUM(‐1)))) ‐ 0.015867039129*D(XREVIND28_ENC(‐1)/REVIND28_SUM(‐1)) +
0.00129039210001*D(GSPR_ENC/NP_ENC) ‐ 0.000125805823201*D(RMPRIME(‐1)‐@PCA(CPI_ENC(‐1)))
Eqn 263: D(XREVIND28_ESC/REVIND28_SUM) = ‐0.00297700674374 ‐ 0.000908158681715 +
0.379260650234*((@MEAN(XREVIND28_ESC/REVIND28_SUM,"1980 2008")‐(XREVIND28_ESC(‐
1)/REVIND28_SUM(‐1)))) ‐ 0.015867039129*D(XREVIND28_ESC(‐1)/REVIND28_SUM(‐1)) +
0.00129039210001*D(GSPR_ESC/NP_ESC) ‐ 0.000125805823201*D(RMPRIME(‐1)‐@PCA(CPI_ESC(‐1)))
Eqn 264: D(XREVIND28_MATL/REVIND28_SUM) = 0.00108865384378 ‐ 0.000908158681715 +
0.379260650234*((@MEAN(XREVIND28_MATL/REVIND28_SUM,"1980 2008")‐(XREVIND28_MATL(‐
1)/REVIND28_SUM(‐1)))) ‐ 0.015867039129*D(XREVIND28_MATL(‐1)/REVIND28_SUM(‐1)) +
0.00129039210001*D(GSPR_MATL/NP_MATL) ‐ 0.000125805823201*D(RMPRIME(‐1)‐@PCA(CPI_MATL(‐1)))
Eqn 265: D(XREVIND28_MTN/REVIND28_SUM) = 0.00014281834564 ‐ 0.000908158681715 +
0.379260650234*((@MEAN(XREVIND28_MTN/REVIND28_SUM,"1980 2008")‐(XREVIND28_MTN(‐
1)/REVIND28_SUM(‐1)))) ‐ 0.015867039129*D(XREVIND28_MTN(‐1)/REVIND28_SUM(‐1)) +
0.00129039210001*D(GSPR_MTN/NP_MTN) ‐ 0.000125805823201*D(RMPRIME(‐1)‐@PCA(CPI_MTN(‐1)))
Eqn 266: D(XREVIND28_NENG/REVIND28_SUM) = ‐2.87432448527e‐05 ‐ 0.000908158681715 +
0.379260650234*((@MEAN(XREVIND28_NENG/REVIND28_SUM,"1980 2008")‐(XREVIND28_NENG(‐
1)/REVIND28_SUM(‐1)))) ‐ 0.015867039129*D(XREVIND28_NENG(‐1)/REVIND28_SUM(‐1)) +
0.00129039210001*D(GSPR_NENG/NP_NENG) ‐ 0.000125805823201*D(RMPRIME(‐1)‐@PCA(CPI_NENG(‐1)))
Eqn 267: D(XREVIND28_PAC/REVIND28_SUM) = ‐0.000653668807463 ‐ 0.000908158681715 +
0.379260650234*((@MEAN(XREVIND28_PAC/REVIND28_SUM,"1980 2008")‐(XREVIND28_PAC(‐
1)/REVIND28_SUM(‐1)))) ‐ 0.015867039129*D(XREVIND28_PAC(‐1)/REVIND28_SUM(‐1)) +
0.00129039210001*D(GSPR_PAC/NP_PAC) ‐ 0.000125805823201*D(RMPRIME(‐1)‐@PCA(CPI_PAC(‐1)))
Eqn 268: D(XREVIND28_SATL/REVIND28_SUM) = 0.00287154357356 ‐ 0.000908158681715 +
0.379260650234*((@MEAN(XREVIND28_SATL/REVIND28_SUM,"1980 2008")‐(XREVIND28_SATL(‐
1)/REVIND28_SUM(‐1)))) ‐ 0.015867039129*D(XREVIND28_SATL(‐1)/REVIND28_SUM(‐1)) +
0.00129039210001*D(GSPR_SATL/NP_SATL) ‐ 0.000125805823201*D(RMPRIME(‐1)‐@PCA(CPI_SATL(‐1)))
Eqn 269: D(XREVIND28_WNC/REVIND28_SUM) = 0.000533529373185 ‐ 0.000908158681715 +
0.379260650234*((@MEAN(XREVIND28_WNC/REVIND28_SUM,"1980 2008")‐(XREVIND28_WNC(‐
1)/REVIND28_SUM(‐1)))) ‐ 0.015867039129*D(XREVIND28_WNC(‐1)/REVIND28_SUM(‐1)) +
0.00129039210001*D(GSPR_WNC/NP_WNC) ‐ 0.000125805823201*D(RMPRIME(‐1)‐@PCA(CPI_WNC(‐1)))
Eqn 270: D(XREVIND28_WSC/REVIND28_SUM) = 0.00112996540215 ‐ 0.000908158681715 +
0.379260650234*((@MEAN(XREVIND28_WSC/REVIND28_SUM,"1980 2008")‐(XREVIND28_WSC(‐
1)/REVIND28_SUM(‐1)))) ‐ 0.015867039129*D(XREVIND28_WSC(‐1)/REVIND28_SUM(‐1)) +
0.00129039210001*D(GSPR_WSC/NP_WSC) ‐ 0.000125805823201*D(RMPRIME(‐1)‐@PCA(CPI_WSC(‐1)))
May 2014
U.S. Energy Information Administration | NEMS Macroeconomic Activity Module Documentation Report 188
IND29 ‐ Other primary metals
Eqn 271: D(XREVIND29_ENC/REVIND29_SUM) = 0.00111122172686 ‐ 0.0009821237101 +
0.271127063744*((@MEAN(XREVIND29_ENC/REVIND29_SUM,"1980 2008")‐(XREVIND29_ENC(‐
1)/REVIND29_SUM(‐1)))) + 0.139920188589*D(XREVIND29_ENC(‐1)/REVIND29_SUM(‐1)) +
0.0015746708389*D(GSPR_ENC/NP_ENC) ‐ 0.00252127525404*D(WPI05_ENC/JPGDP)
Eqn 272: D(XREVIND29_ESC/REVIND29_SUM) = 0.000720444735263 ‐ 0.0009821237101 +
0.271127063744*((@MEAN(XREVIND29_ESC/REVIND29_SUM,"1980 2008")‐(XREVIND29_ESC(‐
1)/REVIND29_SUM(‐1)))) + 0.139920188589*D(XREVIND29_ESC(‐1)/REVIND29_SUM(‐1)) +
0.0015746708389*D(GSPR_ESC/NP_ESC) ‐ 0.00252127525404*D(WPI05_ESC/JPGDP)
Eqn 273: D(XREVIND29_MATL/REVIND29_SUM) = 0.000311999246315 ‐ 0.0009821237101 +
0.271127063744*((@MEAN(XREVIND29_MATL/REVIND29_SUM,"1980 2008")‐(XREVIND29_MATL(‐
1)/REVIND29_SUM(‐1)))) + 0.139920188589*D(XREVIND29_MATL(‐1)/REVIND29_SUM(‐1)) +
0.0015746708389*D(GSPR_MATL/NP_MATL) ‐ 0.00252127525404*D(WPI05_MATL/JPGDP)
Eqn 274: D(XREVIND29_MTN/REVIND29_SUM) = ‐0.00099123107028 ‐ 0.0009821237101 +
0.271127063744*((@MEAN(XREVIND29_MTN/REVIND29_SUM,"1980 2008")‐(XREVIND29_MTN(‐
1)/REVIND29_SUM(‐1)))) + 0.139920188589*D(XREVIND29_MTN(‐1)/REVIND29_SUM(‐1)) +
0.0015746708389*D(GSPR_MTN/NP_MTN) ‐ 0.00252127525404*D(WPI05_MTN/JPGDP)
Eqn 275: D(XREVIND29_NENG/REVIND29_SUM) = ‐0.00204987232154 ‐ 0.0009821237101 +
0.271127063744*((@MEAN(XREVIND29_NENG/REVIND29_SUM,"1980 2008")‐(XREVIND29_NENG(‐
1)/REVIND29_SUM(‐1)))) + 0.139920188589*D(XREVIND29_NENG(‐1)/REVIND29_SUM(‐1)) +
0.0015746708389*D(GSPR_NENG/NP_NENG) ‐ 0.00252127525404*D(WPI05_NENG/JPGDP)
Eqn 276: D(XREVIND29_PAC/REVIND29_SUM) = ‐0.00114990106258 ‐ 0.0009821237101 +
0.271127063744*((@MEAN(XREVIND29_PAC/REVIND29_SUM,"1980 2008")‐(XREVIND29_PAC(‐
1)/REVIND29_SUM(‐1)))) + 0.139920188589*D(XREVIND29_PAC(‐1)/REVIND29_SUM(‐1)) +
0.0015746708389*D(GSPR_PAC/NP_PAC) ‐ 0.00252127525404*D(WPI05_PAC/JPGDP)
Eqn 277: D(XREVIND29_SATL/REVIND29_SUM) = 0.000447090394251 ‐ 0.0009821237101 +
0.271127063744*((@MEAN(XREVIND29_SATL/REVIND29_SUM,"1980 2008")‐(XREVIND29_SATL(‐
1)/REVIND29_SUM(‐1)))) + 0.139920188589*D(XREVIND29_SATL(‐1)/REVIND29_SUM(‐1)) +
0.0015746708389*D(GSPR_SATL/NP_SATL) ‐ 0.00252127525404*D(WPI05_SATL/JPGDP)
Eqn 278: D(XREVIND29_WNC/REVIND29_SUM) = 0.000339046917675 ‐ 0.0009821237101 +
0.271127063744*((@MEAN(XREVIND29_WNC/REVIND29_SUM,"1980 2008")‐(XREVIND29_WNC(‐
1)/REVIND29_SUM(‐1)))) + 0.139920188589*D(XREVIND29_WNC(‐1)/REVIND29_SUM(‐1)) +
0.0015746708389*D(GSPR_WNC/NP_WNC) ‐ 0.00252127525404*D(WPI05_WNC/JPGDP)
Eqn 279: D(XREVIND29_WSC/REVIND29_SUM) = 0.00126120143403 ‐ 0.0009821237101 +
0.271127063744*((@MEAN(XREVIND29_WSC/REVIND29_SUM,"1980 2008")‐(XREVIND29_WSC(‐
1)/REVIND29_SUM(‐1)))) + 0.139920188589*D(XREVIND29_WSC(‐1)/REVIND29_SUM(‐1)) +
0.0015746708389*D(GSPR_WSC/NP_WSC) ‐ 0.00252127525404*D(WPI05_WSC/JPGDP)
May 2014
U.S. Energy Information Administration | NEMS Macroeconomic Activity Module Documentation Report 189
IND30 ‐ Fabricated metal products
Eqn 280: D(XREVIND30_ENC/REVIND30_SUM) = 0.000246409325451 ‐ 0.00124821942109 +
0.364728304374*((@MEAN(XREVIND30_ENC/REVIND30_SUM,"1980 2008")‐(XREVIND30_ENC(‐
1)/REVIND30_SUM(‐1)))) + 0.325298952062*D(XREVIND30_ENC(‐1)/REVIND30_SUM(‐1)) +
0.000467747684925*D(GSPR_ENC/NP_ENC) + 0.000284692252359*D(RWM_ENC/JPGDP) ‐
0.00101883171574*D(WPI05_ENC/JPGDP) + 3.84631677657e‐05*@TREND
Eqn 281: D(XREVIND30_ESC/REVIND30_SUM) = ‐8.26006568928e‐05 ‐ 0.00124821942109 +
0.364728304374*((@MEAN(XREVIND30_ESC/REVIND30_SUM,"1980 2008")‐(XREVIND30_ESC(‐
1)/REVIND30_SUM(‐1)))) + 0.325298952062*D(XREVIND30_ESC(‐1)/REVIND30_SUM(‐1)) +
0.000467747684925*D(GSPR_ESC/NP_ESC) + 0.000284692252359*D(RWM_ESC/JPGDP) ‐
0.00101883171574*D(WPI05_ESC/JPGDP) + 3.84631677657e‐05*@TREND
Eqn 282: D(XREVIND30_MATL/REVIND30_SUM) = ‐0.000737696929615 ‐ 0.00124821942109 +
0.364728304374*((@MEAN(XREVIND30_MATL/REVIND30_SUM,"1980 2008")‐(XREVIND30_MATL(‐
1)/REVIND30_SUM(‐1)))) + 0.325298952062*D(XREVIND30_MATL(‐1)/REVIND30_SUM(‐1)) +
0.000467747684925*D(GSPR_MATL/NP_MATL) + 0.000284692252359*D(RWM_MATL/JPGDP) ‐
0.00101883171574*D(WPI05_MATL/JPGDP) + 3.84631677657e‐05*@TREND
Eqn 283: D(XREVIND30_MTN/REVIND30_SUM) = 0.000347269127537 ‐ 0.00124821942109 +
0.364728304374*((@MEAN(XREVIND30_MTN/REVIND30_SUM,"1980 2008")‐(XREVIND30_MTN(‐
1)/REVIND30_SUM(‐1)))) + 0.325298952062*D(XREVIND30_MTN(‐1)/REVIND30_SUM(‐1)) +
0.000467747684925*D(GSPR_MTN/NP_MTN) + 0.000284692252359*D(RWM_MTN/JPGDP) ‐
0.00101883171574*D(WPI05_MTN/JPGDP) + 3.84631677657e‐05*@TREND
Eqn 284: D(XREVIND30_NENG/REVIND30_SUM) = ‐0.000596684971957 ‐ 0.00124821942109 +
0.364728304374*((@MEAN(XREVIND30_NENG/REVIND30_SUM,"1980 2008")‐(XREVIND30_NENG(‐
1)/REVIND30_SUM(‐1)))) + 0.325298952062*D(XREVIND30_NENG(‐1)/REVIND30_SUM(‐1)) +
0.000467747684925*D(GSPR_NENG/NP_NENG) + 0.000284692252359*D(RWM_NENG/JPGDP) ‐
0.00101883171574*D(WPI05_NENG/JPGDP) + 3.84631677657e‐05*@TREND
Eqn 285: D(XREVIND30_PAC/REVIND30_SUM) = ‐0.00079659138608 ‐ 0.00124821942109 +
0.364728304374*((@MEAN(XREVIND30_PAC/REVIND30_SUM,"1980 2008")‐(XREVIND30_PAC(‐
1)/REVIND30_SUM(‐1)))) + 0.325298952062*D(XREVIND30_PAC(‐1)/REVIND30_SUM(‐1)) +
0.000467747684925*D(GSPR_PAC/NP_PAC) + 0.000284692252359*D(RWM_PAC/JPGDP) ‐
0.00101883171574*D(WPI05_PAC/JPGDP) + 3.84631677657e‐05*@TREND
Eqn 286: D(XREVIND30_SATL/REVIND30_SUM) = 0.000333990513184 ‐ 0.00124821942109 +
0.364728304374*((@MEAN(XREVIND30_SATL/REVIND30_SUM,"1980 2008")‐(XREVIND30_SATL(‐
1)/REVIND30_SUM(‐1)))) + 0.325298952062*D(XREVIND30_SATL(‐1)/REVIND30_SUM(‐1)) +
0.000467747684925*D(GSPR_SATL/NP_SATL) + 0.000284692252359*D(RWM_SATL/JPGDP) ‐
0.00101883171574*D(WPI05_SATL/JPGDP) + 3.84631677657e‐05*@TREND
May 2014
U.S. Energy Information Administration | NEMS Macroeconomic Activity Module Documentation Report 190
Eqn 287: D(XREVIND30_WNC/REVIND30_SUM) = ‐1.76664008289e‐05 ‐ 0.00124821942109 +
0.364728304374*((@MEAN(XREVIND30_WNC/REVIND30_SUM,"1980 2008")‐(XREVIND30_WNC(‐
1)/REVIND30_SUM(‐1)))) + 0.325298952062*D(XREVIND30_WNC(‐1)/REVIND30_SUM(‐1)) +
0.000467747684925*D(GSPR_WNC/NP_WNC) + 0.000284692252359*D(RWM_WNC/JPGDP) ‐
0.00101883171574*D(WPI05_WNC/JPGDP) + 3.84631677657e‐05*@TREND
Eqn 288: D(XREVIND30_WSC/REVIND30_SUM) = 0.0013035713792 ‐ 0.00124821942109 +
0.364728304374*((@MEAN(XREVIND30_WSC/REVIND30_SUM,"1980 2008")‐(XREVIND30_WSC(‐
1)/REVIND30_SUM(‐1)))) + 0.325298952062*D(XREVIND30_WSC(‐1)/REVIND30_SUM(‐1)) +
0.000467747684925*D(GSPR_WSC/NP_WSC) + 0.000284692252359*D(RWM_WSC/JPGDP) ‐
0.00101883171574*D(WPI05_WSC/JPGDP) + 3.84631677657e‐05*@TREND
IND31 ‐ Machinery
Eqn 289: D(XREVIND31_ENC/REVIND31_SUM) = ‐0.00235978868808 ‐ 0.000549106210408 +
0.0894851408902*((@MEAN(XREVIND31_ENC/REVIND31_SUM,"1980 2008")‐(XREVIND31_ENC(‐
1)/REVIND31_SUM(‐1)))) + 0.000806660419256*D(GSPR_ENC/NP_ENC) ‐ 0.000126806015405*D(RMPRIME(‐1)‐
@PCA(CPI_ENC(‐1))) + 0.000476545164319*D(WPI05_ENC/JPGDP)
Eqn 290: D(XREVIND31_ESC/REVIND31_SUM) = 0.000406250014401 ‐ 0.000549106210408 +
0.0894851408902*((@MEAN(XREVIND31_ESC/REVIND31_SUM,"1980 2008")‐(XREVIND31_ESC(‐
1)/REVIND31_SUM(‐1)))) + 0.000806660419256*D(GSPR_ESC/NP_ESC) ‐ 0.000126806015405*D(RMPRIME(‐1)‐
@PCA(CPI_ESC(‐1))) + 0.000476545164319*D(WPI05_ESC/JPGDP)
Eqn 291: D(XREVIND31_MATL/REVIND31_SUM) = ‐0.00272622915679 ‐ 0.000549106210408 +
0.0894851408902*((@MEAN(XREVIND31_MATL/REVIND31_SUM,"1980 2008")‐(XREVIND31_MATL(‐
1)/REVIND31_SUM(‐1)))) + 0.000806660419256*D(GSPR_MATL/NP_MATL) ‐ 0.000126806015405*D(RMPRIME(‐
1)‐@PCA(CPI_MATL(‐1))) + 0.000476545164319*D(WPI05_MATL/JPGDP)
Eqn 292: D(XREVIND31_MTN/REVIND31_SUM) = 0.000293942795578 ‐ 0.000549106210408 +
0.0894851408902*((@MEAN(XREVIND31_MTN/REVIND31_SUM,"1980 2008")‐(XREVIND31_MTN(‐
1)/REVIND31_SUM(‐1)))) + 0.000806660419256*D(GSPR_MTN/NP_MTN) ‐ 0.000126806015405*D(RMPRIME(‐
1)‐@PCA(CPI_MTN(‐1))) + 0.000476545164319*D(WPI05_MTN/JPGDP)
Eqn 293: D(XREVIND31_NENG/REVIND31_SUM) = ‐0.00116837679078 ‐ 0.000549106210408 +
0.0894851408902*((@MEAN(XREVIND31_NENG/REVIND31_SUM,"1980 2008")‐(XREVIND31_NENG(‐
1)/REVIND31_SUM(‐1)))) + 0.000806660419256*D(GSPR_NENG/NP_NENG) ‐
0.000126806015405*D(RMPRIME(‐1)‐@PCA(CPI_NENG(‐1))) + 0.000476545164319*D(WPI05_NENG/JPGDP)
Eqn 294: D(XREVIND31_PAC/REVIND31_SUM) = 0.000218620486637 ‐ 0.000549106210408 +
0.0894851408902*((@MEAN(XREVIND31_PAC/REVIND31_SUM,"1980 2008")‐(XREVIND31_PAC(‐
1)/REVIND31_SUM(‐1)))) + 0.000806660419256*D(GSPR_PAC/NP_PAC) ‐ 0.000126806015405*D(RMPRIME(‐1)‐
@PCA(CPI_PAC(‐1))) + 0.000476545164319*D(WPI05_PAC/JPGDP)
May 2014
U.S. Energy Information Administration | NEMS Macroeconomic Activity Module Documentation Report 191
Eqn 295: D(XREVIND31_SATL/REVIND31_SUM) = 0.000749939233062 ‐ 0.000549106210408 +
0.0894851408902*((@MEAN(XREVIND31_SATL/REVIND31_SUM,"1980 2008")‐(XREVIND31_SATL(‐
1)/REVIND31_SUM(‐1)))) + 0.000806660419256*D(GSPR_SATL/NP_SATL) ‐ 0.000126806015405*D(RMPRIME(‐
1)‐@PCA(CPI_SATL(‐1))) + 0.000476545164319*D(WPI05_SATL/JPGDP)
Eqn 296: D(XREVIND31_WNC/REVIND31_SUM) = 0.0010022869477 ‐ 0.000549106210408 +
0.0894851408902*((@MEAN(XREVIND31_WNC/REVIND31_SUM,"1980 2008")‐(XREVIND31_WNC(‐
1)/REVIND31_SUM(‐1)))) + 0.000806660419256*D(GSPR_WNC/NP_WNC) ‐ 0.000126806015405*D(RMPRIME(‐
1)‐@PCA(CPI_WNC(‐1))) + 0.000476545164319*D(WPI05_WNC/JPGDP)
Eqn 297: D(XREVIND31_WSC/REVIND31_SUM) = 0.00358335515827 ‐ 0.000549106210408 +
0.0894851408902*((@MEAN(XREVIND31_WSC/REVIND31_SUM,"1980 2008")‐(XREVIND31_WSC(‐
1)/REVIND31_SUM(‐1)))) + 0.000806660419256*D(GSPR_WSC/NP_WSC) ‐ 0.000126806015405*D(RMPRIME(‐
1)‐@PCA(CPI_WSC(‐1))) + 0.000476545164319*D(WPI05_WSC/JPGDP)
IND32 ‐ Other electronic & electric products
Eqn 298: D(XREVIND32_ENC/REVIND32_SUM) = 0.0013553835298 + 0.000108223262072 +
0.208014196271*((@MEAN(XREVIND32_ENC/REVIND32_SUM,"1980 2008")‐(XREVIND32_ENC(‐
1)/REVIND32_SUM(‐1)))) + 0.156365313677*D(XREVIND32_ENC(‐1)/REVIND32_SUM(‐1)) ‐
0.000157211966405*D(GSPR_ENC/NP_ENC) + 4.94234012367e‐05*D(RMPRIME‐@PCA(CPI_ENC)) +
0.000223104684592*D(WPI05_ENC/JPGDP)
Eqn 299: D(XREVIND32_ESC/REVIND32_SUM) = 0.00107074133711 + 0.000108223262072 +
0.208014196271*((@MEAN(XREVIND32_ESC/REVIND32_SUM,"1980 2008")‐(XREVIND32_ESC(‐
1)/REVIND32_SUM(‐1)))) + 0.156365313677*D(XREVIND32_ESC(‐1)/REVIND32_SUM(‐1)) ‐
0.000157211966405*D(GSPR_ESC/NP_ESC) + 4.94234012367e‐05*D(RMPRIME‐@PCA(CPI_ESC)) +
0.000223104684592*D(WPI05_ESC/JPGDP)
Eqn 300: D(XREVIND32_MATL/REVIND32_SUM) = ‐0.000668901782984 + 0.000108223262072 +
0.208014196271*((@MEAN(XREVIND32_MATL/REVIND32_SUM,"1980 2008")‐(XREVIND32_MATL(‐
1)/REVIND32_SUM(‐1)))) + 0.156365313677*D(XREVIND32_MATL(‐1)/REVIND32_SUM(‐1)) ‐
0.000157211966405*D(GSPR_MATL/NP_MATL) + 4.94234012367e‐05*D(RMPRIME‐@PCA(CPI_MATL)) +
0.000223104684592*D(WPI05_MATL/JPGDP)
Eqn 301: D(XREVIND32_MTN/REVIND32_SUM) = ‐0.000246874128922 + 0.000108223262072 +
0.208014196271*((@MEAN(XREVIND32_MTN/REVIND32_SUM,"1980 2008")‐(XREVIND32_MTN(‐
1)/REVIND32_SUM(‐1)))) + 0.156365313677*D(XREVIND32_MTN(‐1)/REVIND32_SUM(‐1)) ‐
0.000157211966405*D(GSPR_MTN/NP_MTN) + 4.94234012367e‐05*D(RMPRIME‐@PCA(CPI_MTN)) +
0.000223104684592*D(WPI05_MTN/JPGDP)
Eqn 302: D(XREVIND32_NENG/REVIND32_SUM) = ‐0.000662225818969 + 0.000108223262072 +
0.208014196271*((@MEAN(XREVIND32_NENG/REVIND32_SUM,"1980 2008")‐(XREVIND32_NENG(‐
1)/REVIND32_SUM(‐1)))) + 0.156365313677*D(XREVIND32_NENG(‐1)/REVIND32_SUM(‐1)) ‐
May 2014
U.S. Energy Information Administration | NEMS Macroeconomic Activity Module Documentation Report 192
0.000157211966405*D(GSPR_NENG/NP_NENG) + 4.94234012367e‐05*D(RMPRIME‐@PCA(CPI_NENG)) +
0.000223104684592*D(WPI05_NENG/JPGDP)
Eqn 303: D(XREVIND32_PAC/REVIND32_SUM) = ‐0.00139926560462 + 0.000108223262072 +
0.208014196271*((@MEAN(XREVIND32_PAC/REVIND32_SUM,"1980 2008")‐(XREVIND32_PAC(‐
1)/REVIND32_SUM(‐1)))) + 0.156365313677*D(XREVIND32_PAC(‐1)/REVIND32_SUM(‐1)) ‐
0.000157211966405*D(GSPR_PAC/NP_PAC) + 4.94234012367e‐05*D(RMPRIME‐@PCA(CPI_PAC)) +
0.000223104684592*D(WPI05_PAC/JPGDP)
Eqn 304: D(XREVIND32_SATL/REVIND32_SUM) = ‐0.000308772863939 + 0.000108223262072 +
0.208014196271*((@MEAN(XREVIND32_SATL/REVIND32_SUM,"1980 2008")‐(XREVIND32_SATL(‐
1)/REVIND32_SUM(‐1)))) + 0.156365313677*D(XREVIND32_SATL(‐1)/REVIND32_SUM(‐1)) ‐
0.000157211966405*D(GSPR_SATL/NP_SATL) + 4.94234012367e‐05*D(RMPRIME‐@PCA(CPI_SATL)) +
0.000223104684592*D(WPI05_SATL/JPGDP)
Eqn 305: D(XREVIND32_WNC/REVIND32_SUM) = ‐8.65281022785e‐05 + 0.000108223262072 +
0.208014196271*((@MEAN(XREVIND32_WNC/REVIND32_SUM,"1980 2008")‐(XREVIND32_WNC(‐
1)/REVIND32_SUM(‐1)))) + 0.156365313677*D(XREVIND32_WNC(‐1)/REVIND32_SUM(‐1)) ‐
0.000157211966405*D(GSPR_WNC/NP_WNC) + 4.94234012367e‐05*D(RMPRIME‐@PCA(CPI_WNC)) +
0.000223104684592*D(WPI05_WNC/JPGDP)
Eqn 306: D(XREVIND32_WSC/REVIND32_SUM) = 0.000946443434813 + 0.000108223262072 +
0.208014196271*((@MEAN(XREVIND32_WSC/REVIND32_SUM,"1980 2008")‐(XREVIND32_WSC(‐
1)/REVIND32_SUM(‐1)))) + 0.156365313677*D(XREVIND32_WSC(‐1)/REVIND32_SUM(‐1)) ‐
0.000157211966405*D(GSPR_WSC/NP_WSC) + 4.94234012367e‐05*D(RMPRIME‐@PCA(CPI_WSC)) +
0.000223104684592*D(WPI05_WSC/JPGDP)
IND33 – Transportation equipment
Eqn 307: D(XREVIND33_ENC/REVIND33_SUM) = ‐0.000696813762032 ‐ 0.000801155399957 +
0.211689689238*((@MEAN(XREVIND33_ENC/REVIND33_SUM,"1980 2008")‐(XREVIND33_ENC(‐
1)/REVIND33_SUM(‐1)))) + 0.243625144515*D(XREVIND33_ENC(‐1)/REVIND33_SUM(‐1)) ‐
0.000170784277573*D(GSPR_ENC(‐1)/NP_ENC(‐1)) ‐ 4.54801609549e‐05*D(RMPRIME‐@PCA(CPI_ENC)) +
0.000526376180366*D(RWM_ENC(‐1)/JPGDP(‐1)) + 1.39081075169e‐05*D(EEA) ‐
0.00246570199114*D(WPI05_ENC/JPGDP) + 3.20857833834e‐05*@TREND
Eqn 308: D(XREVIND33_ESC/REVIND33_SUM) = 0.00191967483105 ‐ 0.000801155399957 +
0.211689689238*((@MEAN(XREVIND33_ESC/REVIND33_SUM,"1980 2008")‐(XREVIND33_ESC(‐
1)/REVIND33_SUM(‐1)))) + 0.243625144515*D(XREVIND33_ESC(‐1)/REVIND33_SUM(‐1)) ‐
0.000170784277573*D(GSPR_ESC(‐1)/NP_ESC(‐1)) ‐ 4.54801609549e‐05*D(RMPRIME‐@PCA(CPI_ESC)) +
0.000526376180366*D(RWM_ESC(‐1)/JPGDP(‐1)) + 1.39081075169e‐05*D(EEA) ‐
0.00246570199114*D(WPI05_ESC/JPGDP) + 3.20857833834e‐05*@TREND
Eqn 309: D(XREVIND33_MATL/REVIND33_SUM) = ‐0.000490479351336 ‐ 0.000801155399957 +
0.211689689238*((@MEAN(XREVIND33_MATL/REVIND33_SUM,"1980 2008")‐(XREVIND33_MATL(‐
May 2014
U.S. Energy Information Administration | NEMS Macroeconomic Activity Module Documentation Report 193
1)/REVIND33_SUM(‐1)))) + 0.243625144515*D(XREVIND33_MATL(‐1)/REVIND33_SUM(‐1)) ‐
0.000170784277573*D(GSPR_MATL(‐1)/NP_MATL(‐1)) ‐ 4.54801609549e‐05*D(RMPRIME‐@PCA(CPI_MATL)) +
0.000526376180366*D(RWM_MATL(‐1)/JPGDP(‐1)) + 1.39081075169e‐05*D(EEA) ‐
0.00246570199114*D(WPI05_MATL/JPGDP) + 3.20857833834e‐05*@TREND
Eqn 310: D(XREVIND33_MTN/REVIND33_SUM) = 0.000250394239185 ‐ 0.000801155399957 +
0.211689689238*((@MEAN(XREVIND33_MTN/REVIND33_SUM,"1980 2008")‐(XREVIND33_MTN(‐
1)/REVIND33_SUM(‐1)))) + 0.243625144515*D(XREVIND33_MTN(‐1)/REVIND33_SUM(‐1)) ‐
0.000170784277573*D(GSPR_MTN(‐1)/NP_MTN(‐1)) ‐ 4.54801609549e‐05*D(RMPRIME‐@PCA(CPI_MTN)) +
0.000526376180366*D(RWM_MTN(‐1)/JPGDP(‐1)) + 1.39081075169e‐05*D(EEA) ‐
0.00246570199114*D(WPI05_MTN/JPGDP) + 3.20857833834e‐05*@TREND
Eqn 311: D(XREVIND33_NENG/REVIND33_SUM) = ‐0.000631708060565 ‐ 0.000801155399957 +
0.211689689238*((@MEAN(XREVIND33_NENG/REVIND33_SUM,"1980 2008")‐(XREVIND33_NENG(‐
1)/REVIND33_SUM(‐1)))) + 0.243625144515*D(XREVIND33_NENG(‐1)/REVIND33_SUM(‐1)) ‐
0.000170784277573*D(GSPR_NENG(‐1)/NP_NENG(‐1)) ‐ 4.54801609549e‐05*D(RMPRIME‐@PCA(CPI_NENG)) +
0.000526376180366*D(RWM_NENG(‐1)/JPGDP(‐1)) + 1.39081075169e‐05*D(EEA) ‐
0.00246570199114*D(WPI05_NENG/JPGDP) + 3.20857833834e‐05*@TREND
Eqn 312: D(XREVIND33_PAC/REVIND33_SUM) = ‐0.00247112523535 ‐ 0.000801155399957 +
0.211689689238*((@MEAN(XREVIND33_PAC/REVIND33_SUM,"1980 2008")‐(XREVIND33_PAC(‐
1)/REVIND33_SUM(‐1)))) + 0.243625144515*D(XREVIND33_PAC(‐1)/REVIND33_SUM(‐1)) ‐
0.000170784277573*D(GSPR_PAC(‐1)/NP_PAC(‐1)) ‐ 4.54801609549e‐05*D(RMPRIME‐@PCA(CPI_PAC)) +
0.000526376180366*D(RWM_PAC(‐1)/JPGDP(‐1)) + 1.39081075169e‐05*D(EEA) ‐
0.00246570199114*D(WPI05_PAC/JPGDP) + 3.20857833834e‐05*@TREND
Eqn 313: D(XREVIND33_SATL/REVIND33_SUM) = 0.000423556355564 ‐ 0.000801155399957 +
0.211689689238*((@MEAN(XREVIND33_SATL/REVIND33_SUM,"1980 2008")‐(XREVIND33_SATL(‐
1)/REVIND33_SUM(‐1)))) + 0.243625144515*D(XREVIND33_SATL(‐1)/REVIND33_SUM(‐1)) ‐
0.000170784277573*D(GSPR_SATL(‐1)/NP_SATL(‐1)) ‐ 4.54801609549e‐05*D(RMPRIME‐@PCA(CPI_SATL)) +
0.000526376180366*D(RWM_SATL(‐1)/JPGDP(‐1)) + 1.39081075169e‐05*D(EEA) ‐
0.00246570199114*D(WPI05_SATL/JPGDP) + 3.20857833834e‐05*@TREND
Eqn 314: D(XREVIND33_WNC/REVIND33_SUM) = 0.000213432225585 ‐ 0.000801155399957 +
0.211689689238*((@MEAN(XREVIND33_WNC/REVIND33_SUM,"1980 2008")‐(XREVIND33_WNC(‐
1)/REVIND33_SUM(‐1)))) + 0.243625144515*D(XREVIND33_WNC(‐1)/REVIND33_SUM(‐1)) ‐
0.000170784277573*D(GSPR_WNC(‐1)/NP_WNC(‐1)) ‐ 4.54801609549e‐05*D(RMPRIME‐@PCA(CPI_WNC)) +
0.000526376180366*D(RWM_WNC(‐1)/JPGDP(‐1)) + 1.39081075169e‐05*D(EEA) ‐
0.00246570199114*D(WPI05_WNC/JPGDP) + 3.20857833834e‐05*@TREND
Eqn 315: D(XREVIND33_WSC/REVIND33_SUM) = 0.0014830687579 ‐ 0.000801155399957 +
0.211689689238*((@MEAN(XREVIND33_WSC/REVIND33_SUM,"1980 2008")‐(XREVIND33_WSC(‐
1)/REVIND33_SUM(‐1)))) + 0.243625144515*D(XREVIND33_WSC(‐1)/REVIND33_SUM(‐1)) ‐
0.000170784277573*D(GSPR_WSC(‐1)/NP_WSC(‐1)) ‐ 4.54801609549e‐05*D(RMPRIME‐@PCA(CPI_WSC)) +
May 2014
U.S. Energy Information Administration | NEMS Macroeconomic Activity Module Documentation Report 194
0.000526376180366*D(RWM_WSC(‐1)/JPGDP(‐1)) + 1.39081075169e‐05*D(EEA) ‐
0.00246570199114*D(WPI05_WSC/JPGDP) + 3.20857833834e‐05*@TREND
IND34 – Measuring & control instruments
Eqn 316: D(XREVIND34_ENC/REVIND34_SUM) = ‐0.000400867723593 ‐ 0.000254807342523 +
0.31459263417*((@MEAN(XREVIND34_ENC/REVIND34_SUM,"1980 2008")‐(XREVIND34_ENC(‐
1)/REVIND34_SUM(‐1)))) + 0.000360115690959*D(GSPR_ENC(‐1)/NP_ENC(‐1))
Eqn 317: D(XREVIND34_ESC/REVIND34_SUM) = ‐0.000988253591528 ‐ 0.000254807342523 +
0.31459263417*((@MEAN(XREVIND34_ESC/REVIND34_SUM,"1980 2008")‐(XREVIND34_ESC(‐
1)/REVIND34_SUM(‐1)))) + 0.000360115690959*D(GSPR_ESC(‐1)/NP_ESC(‐1))
Eqn 318: D(XREVIND34_MATL/REVIND34_SUM) = ‐0.00119196493079 ‐ 0.000254807342523 +
0.31459263417*((@MEAN(XREVIND34_MATL/REVIND3_SUM,"1980 2008")‐(XREVIND34_MATL(‐
1)/REVIND34_SUM(‐1)))) + 0.000360115690959*D(GSPR_MATL(‐1)/NP_MATL(‐1))
Eqn 319: D(XREVIND34_MTN/REVIND34_SUM) = 0.00023410768862 ‐ 0.000254807342523 +
0.31459263417*((@MEAN(XREVIND34_MTN/REVIND34_SUM,"1980 2008")‐(XREVIND34_MTN(‐
1)/REVIND34_SUM(‐1)))) + 0.000360115690959*D(GSPR_MTN(‐1)/NP_MTN(‐1))
Eqn 320: D(XREVIND34_NENG/REVIND34_SUM) = ‐0.000380485390948 ‐ 0.000254807342523 +
0.31459263417*((@MEAN(XREVIND34_NENG/REVIND34_SUM,"1980 2008")‐(XREVIND34_NENG(‐
1)/REVIND34_SUM(‐1)))) + 0.000360115690959*D(GSPR_NENG(‐1)/NP_NENG(‐1))
Eqn 321: D(XREVIND34_PAC/REVIND34_SUM) = ‐0.000349465293104 ‐ 0.000254807342523 +
0.31459263417*((@MEAN(XREVIND34_PAC/REVIND34_SUM,"1980 2008")‐(XREVIND34_PAC(‐
1)/REVIND34_SUM(‐1)))) + 0.000360115690959*D(GSPR_PAC(‐1)/NP_PAC(‐1))
Eqn 322: D(XREVIND34_SATL/REVIND34_SUM) = 0.00122210259405 ‐ 0.000254807342523 +
0.31459263417*((@MEAN(XREVIND34_SATL/REVIND34_SUM,"1980 2008")‐(XREVIND34_SATL(‐
1)/REVIND34_SUM(‐1)))) + 0.000360115690959*D(GSPR_SATL(‐1)/NP_SATL(‐1))
Eqn 323: D(XREVIND34_WNC/REVIND34_SUM) = 0.00105752132023 ‐ 0.000254807342523 +
0.31459263417*((@MEAN(XREVIND34_WNC/REVIND34_SUM,"1980 2008")‐(XREVIND34_WNC(‐
1)/REVIND34_SUM(‐1)))) + 0.000360115690959*D(GSPR_WNC(‐1)/NP_WNC(‐1))
Eqn 324: D(XREVIND34_WSC/REVIND34_SUM) = 0.000797305327064 ‐ 0.000254807342523 +
0.31459263417*((@MEAN(XREVIND34_WSC/REVIND34_SUM,"1980 2008")‐(XREVIND34_WSC(‐
1)/REVIND34_SUM(‐1)))) + 0.000360115690959*D(GSPR_WSC(‐1)/NP_WSC(‐1))
May 2014
U.S. Energy Information Administration | NEMS Macroeconomic Activity Module Documentation Report 195
IND35 – Miscellaneous manufacturing
Eqn 325: D(XREVIND35_ENC/REVIND35_SUM) = ‐0.00184673188269 ‐ 3.40947143717E‐05 +
0.093702653873*((@MEAN(XREVIND35_ENC/REVIND35_SUM,"1980 2008")‐(XREVIND35_ENC(‐
1)/REVIND35_SUM(‐1)))) + 5.28332932347E‐05*D(GSPR_ENC/NP_ENC)
Eqn 326: D(XREVIND35_ESC/REVIND35_SUM) = ‐0.000134196552522 ‐ 3.40947143717E‐05 +
0.093702653873*((@MEAN(XREVIND35_ESC/REVIND35_SUM,"1980 2008")‐(XREVIND35_ESC(‐
1)/REVIND35_SUM(‐1)))) + 5.28332932347E‐05*D(GSPR_ESC/NP_ESC)
Eqn 327: D(XREVIND35_MATL/REVIND35_SUM) = 1.84950555003E‐05 ‐ 3.40947143717E‐05 +
0.093702653873*((@MEAN(XREVIND35_MATL/REVIND35_SUM,"1980 2008")‐(XREVIND35_MATL(‐
1)/REVIND35_SUM(‐1)))) + 5.28332932347E‐05*D(GSPR_MATL/NP_MATL)
Eqn 328: D(XREVIND35_MTN/REVIND35_SUM) = 0.00235156307639 ‐ 3.40947143717E‐05 +
0.093702653873*((@MEAN(XREVIND35_MTN/REVIND35_SUM,"1980 2008")‐(XREVIND35_MTN(‐
1)/REVIND35_SUM(‐1)))) + 5.28332932347E‐05*D(GSPR_MTN/NP_MTN)
Eqn 329: D(XREVIND35_NENG/REVIND35_SUM) = ‐0.00299012123167 ‐ 3.40947143717E‐05 +
0.093702653873*((@MEAN(XREVIND35_NENG/REVIND35_SUM,"1980 2008")‐(XREVIND35_NENG(‐
1)/REVIND35_SUM(‐1)))) + 5.28332932347E‐05*D(GSPR_NENG/NP_NENG)
Eqn 330: D(XREVIND35_PAC/REVIND35_SUM) = ‐0.000172922315942 ‐ 3.40947143717E‐05 +
0.093702653873*((@MEAN(XREVIND35_PAC/REVIND35_SUM,"1980 2008")‐(XREVIND35_PAC(‐
1)/REVIND35_SUM(‐1)))) + 5.28332932347E‐05*D(GSPR_PAC/NP_PAC)
Eqn 331: D(XREVIND35_SATL/REVIND35_SUM) = 0.00147312783118 ‐ 3.40947143717E‐05 +
0.093702653873*((@MEAN(XREVIND35_SATL/REVIND35_SUM,"1980 2008")‐(XREVIND35_SATL(‐
1)/REVIND35_SUM(‐1)))) + 5.28332932347E‐05*D(GSPR_SATL/NP_SATL)
Eqn 332: D(XREVIND35_WNC/REVIND35_SUM) = 0.00092004224573 ‐ 3.40947143717E‐05 +
0.093702653873*((@MEAN(XREVIND35_WNC/REVIND35_SUM,"1980 2008")‐(XREVIND35_WNC(‐
1)/REVIND35_SUM(‐1)))) + 5.28332932347E‐05*D(GSPR_WNC/NP_WNC)
Eqn 333: D(XREVIND35_WSC/REVIND35_SUM) = 0.000380743774027 ‐ 3.40947143717E‐05 +
0.093702653873*((@MEAN(XREVIND35_WSC/REVIND35_SUM,"1980 2008")‐(XREVIND35_WSC(‐
1)/REVIND35_SUM(‐1)))) + 5.28332932347E‐05*D(GSPR_WSC/NP_WSC)
IND36 – Crop production
Eqn 334: D(XREVIND36_ENC/REVIND36_SUM) = 0.0014352264636 ‐ 0.000275980526055 +
0.374045693877*((@MEAN(XREVIND36_ENC/REVIND36_SUM,"1980 2008")‐(XREVIND36_ENC(‐
1)/REVIND36_SUM(‐1)))) + 0.000828454157775*D(GSPR_ENC(‐1)/NP_ENC(‐1)) ‐ 1.55104716787E‐05*@TREND
Eqn 335: D(XREVIND36_ESC/REVIND36_SUM) = ‐0.00049881686011 ‐ 0.000275980526055 +
0.374045693877*((@MEAN(XREVIND36_ESC/REVIND36_SUM,"1980 2008")‐(XREVIND36_ESC(‐
1)/REVIND36_SUM(‐1)))) + 0.000828454157775*D(GSPR_ESC(‐1)/NP_ESC(‐1)) ‐ 1.55104716787E‐05*@TREND
May 2014
U.S. Energy Information Administration | NEMS Macroeconomic Activity Module Documentation Report 196
Eqn 336: D(XREVIND36_MATL/REVIND36_SUM) = 0.000487791805179 ‐ 0.000275980526055 +
0.374045693877*((@MEAN(XREVIND36_MATL/REVIND36_SUM,"1980 2008")‐(XREVIND36_MATL(‐
1)/REVIND36_SUM(‐1)))) + 0.000828454157775*D(GSPR_MATL(‐1)/NP_MATL(‐1)) ‐ 1.55104716787E‐
05*@TREND
Eqn 337: D(XREVIND36_MTN/REVIND36_SUM) = 0.00112247044747 ‐ 0.000275980526055 +
0.374045693877*((@MEAN(XREVIND36_MTN/REVIND36_SUM,"1980 2008")‐(XREVIND36_MTN(‐
1)/REVIND36_SUM(‐1)))) + 0.000828454157775*D(GSPR_MTN(‐1)/NP_MTN(‐1)) ‐ 1.55104716787E‐05*@TREND
Eqn 338: D(XREVIND36_NENG/REVIND36_SUM) = ‐3.34123369932E‐05 ‐ 0.000275980526055 +
0.374045693877*((@MEAN(XREVIND36_NENG/REVIND36_SUM,"1980 2008")‐(XREVIND36_NENG(‐
1)/REVIND36_SUM(‐1)))) + 0.000828454157775*D(GSPR_NENG(‐1)/NP_NENG(‐1)) ‐ 1.55104716787E‐
05*@TREND
Eqn 339: D(XREVIND36_PAC/REVIND36_SUM) = ‐0.00247124463989 ‐ 0.000275980526055 +
0.374045693877*((@MEAN(XREVIND36_PAC/REVIND36_SUM,"1980 2008")‐(XREVIND36_PAC(‐
1)/REVIND36_SUM(‐1)))) + 0.000828454157775*D(GSPR_PAC(‐1)/NP_PAC(‐1)) ‐ 1.55104716787E‐05*@TREND
Eqn 340: D(XREVIND36_SATL/REVIND36_SUM) = ‐0.00227015798198 ‐ 0.000275980526055 +
0.374045693877*((@MEAN(XREVIND36_SATL/REVIND36_SUM,"1980 2008")‐(XREVIND36_SATL(‐
1)/REVIND36_SUM(‐1)))) + 0.000828454157775*D(GSPR_SATL(‐1)/NP_SATL(‐1)) ‐ 1.55104716787E‐05*@TREND
Eqn 341: D(XREVIND36_WNC/REVIND36_SUM) = 0.00307653533338 ‐ 0.000275980526055 +
0.374045693877*((@MEAN(XREVIND36_WNC/REVIND36_SUM,"1980 2008")‐(XREVIND36_WNC(‐
1)/REVIND36_SUM(‐1)))) + 0.000828454157775*D(GSPR_WNC(‐1)/NP_WNC(‐1)) ‐ 1.55104716787E‐
05*@TREND
Eqn 342: D(XREVIND36_WSC/REVIND36_SUM) = ‐0.000848392230649 ‐ 0.000275980526055 +
0.374045693877*((@MEAN(XREVIND36_WSC/REVIND36_SUM,"1980 2008")‐(XREVIND36_WSC(‐
1)/REVIND36_SUM(‐1)))) + 0.000828454157775*D(GSPR_WSC(‐1)/NP_WSC(‐1)) ‐ 1.55104716787E‐05*@TREND
IND37 – Animal production
Eqn 343: D(XREVIND37_ENC/REVIND37_SUM) = 0.0015612963251 ‐ 0.00200591576688 +
0.276652852086*((@MEAN(XREVIND37_ENC/REVIND37_SUM,"1980 2008")‐(XREVIND37_ENC(‐
1)/REVIND37_SUM(‐1)))) ‐ 0.075116458925*D(XREVIND37_ENC(‐1)/REVIND37_SUM(‐1)) +
0.00255521933996*D(GSPR_ENC/NP_ENC) ‐ 0.000397191570852*D(RMPRIME‐@PCA(CPI_ENC)) ‐
0.00107724960384*D(RWNM_ENC/JPGDP) + 4.3211926773E‐05*D(EEA(‐1)) ‐
0.00256009810038*D(WPI05_ENC/JPGDP) + 4.18889128408E‐05*@TREND
Eqn 344: D(XREVIND37_ESC/REVIND37_SUM) = ‐0.000842738513318 ‐ 0.00200591576688 +
0.276652852086*((@MEAN(XREVIND37_ESC/REVIND37_SUM,"1980 2008")‐(XREVIND37_ESC(‐
1)/REVIND37_SUM(‐1)))) ‐ 0.075116458925*D(XREVIND37_ESC(‐1)/REVIND37_SUM(‐1)) +
0.00255521933996*D(GSPR_ESC/NP_ESC) ‐ 0.000397191570852*D(RMPRIME‐@PCA(CPI_ESC)) ‐
0.00107724960384*D(RWNM_ESC/JPGDP) + 4.3211926773E‐05*D(EEA(‐1)) ‐
0.00256009810038*D(WPI05_ESC/JPGDP) + 4.18889128408E‐05*@TREND
May 2014
U.S. Energy Information Administration | NEMS Macroeconomic Activity Module Documentation Report 197
Eqn 345: D(XREVIND37_MATL/REVIND37_SUM) = 0.000838887670032 ‐ 0.00200591576688 +
0.276652852086*((@MEAN(XREVIND37_MATL/REVIND37_SUM,"1980 2008")‐(XREVIND37_MATL(‐
1)/REVIND37_SUM(‐1)))) ‐ 0.075116458925*D(XREVIND37_MATL(‐1)/REVIND37_SUM(‐1)) +
0.00255521933996*D(GSPR_MATL/NP_MATL) ‐ 0.000397191570852*D(RMPRIME‐@PCA(CPI_MATL)) ‐
0.00107724960384*D(RWNM_MATL/JPGDP) + 4.3211926773E‐05*D(EEA(‐1)) ‐
0.00256009810038*D(WPI05_MATL/JPGDP) + 4.18889128408E‐05*@TREND
Eqn 346: D(XREVIND37_MTN/REVIND37_SUM) = 0.00211345708424 ‐ 0.00200591576688 +
0.276652852086*((@MEAN(XREVIND37_MTN/REVIND37_SUM,"1980 2008")‐(XREVIND37_MTN(‐
1)/REVIND37_SUM(‐1)))) ‐ 0.075116458925*D(XREVIND37_MTN(‐1)/REVIND37_SUM(‐1)) +
0.00255521933996*D(GSPR_MTN/NP_MTN) ‐ 0.000397191570852*D(RMPRIME‐@PCA(CPI_MTN)) ‐
0.00107724960384*D(RWNM_MTN/JPGDP) + 4.3211926773E‐05*D(EEA(‐1)) ‐
0.00256009810038*D(WPI05_MTN/JPGDP) + 4.18889128408E‐05*@TREND
Eqn 347: D(XREVIND37_NENG/REVIND37_SUM) = ‐0.000797584129019 ‐ 0.00200591576688 +
0.276652852086*((@MEAN(XREVIND37_NENG/REVIND37_SUM,"1980 2008")‐(XREVIND37_NENG(‐
1)/REVIND37_SUM(‐1)))) ‐ 0.075116458925*D(XREVIND37_NENG(‐1)/REVIND37_SUM(‐1)) +
0.00255521933996*D(GSPR_NENG/NP_NENG) ‐ 0.000397191570852*D(RMPRIME‐@PCA(CPI_NENG)) ‐
0.00107724960384*D(RWNM_NENG/JPGDP) + 4.3211926773E‐05*D(EEA(‐1)) ‐
0.00256009810038*D(WPI05_NENG/JPGDP) + 4.18889128408E‐05*@TREND
Eqn 348: D(XREVIND37_PAC/REVIND37_SUM) = 0.000643171467853 ‐ 0.00200591576688 +
0.276652852086*((@MEAN(XREVIND37_PAC/REVIND37_SUM,"1980 2008")‐(XREVIND37_PAC(‐
1)/REVIND37_SUM(‐1)))) ‐ 0.075116458925*D(XREVIND37_PAC(‐1)/REVIND37_SUM(‐1)) +
0.00255521933996*D(GSPR_PAC/NP_PAC) ‐ 0.000397191570852*D(RMPRIME‐@PCA(CPI_PAC)) ‐
0.00107724960384*D(RWNM_PAC/JPGDP) + 4.3211926773E‐05*D(EEA(‐1)) ‐
0.00256009810038*D(WPI05_PAC/JPGDP) + 4.18889128408E‐05*@TREND
Eqn 349: D(XREVIND37_SATL/REVIND37_SUM) = ‐0.00300659676443 ‐ 0.00200591576688 +
0.276652852086*((@MEAN(XREVIND37_SATL/REVIND37_SUM,"1980 2008")‐(XREVIND37_SATL(‐
1)/REVIND37_SUM(‐1)))) ‐ 0.075116458925*D(XREVIND37_SATL(‐1)/REVIND37_SUM(‐1)) +
0.00255521933996*D(GSPR_SATL/NP_SATL) ‐ 0.000397191570852*D(RMPRIME‐@PCA(CPI_SATL)) ‐
0.00107724960384*D(RWNM_SATL/JPGDP) + 4.3211926773E‐05*D(EEA(‐1)) ‐
0.00256009810038*D(WPI05_SATL/JPGDP) + 4.18889128408E‐05*@TREND
Eqn 350: D(XREVIND37_WNC/REVIND37_SUM) = 0.00243944391065 ‐ 0.00200591576688 +
0.276652852086*((@MEAN(XREVIND37_WNC/REVIND37_SUM,"1980 2008")‐(XREVIND37_WNC(‐
1)/REVIND37_SUM(‐1)))) ‐ 0.075116458925*D(XREVIND37_WNC(‐1)/REVIND37_SUM(‐1)) +
0.00255521933996*D(GSPR_WNC/NP_WNC) ‐ 0.000397191570852*D(RMPRIME‐@PCA(CPI_WNC)) ‐
0.00107724960384*D(RWNM_WNC/JPGDP) + 4.3211926773E‐05*D(EEA(‐1)) ‐
0.00256009810038*D(WPI05_WNC/JPGDP) + 4.18889128408E‐05*@TREND
Eqn 351: D(XREVIND37_WSC/REVIND37_SUM) = ‐0.00294933705111 ‐ 0.00200591576688 +
0.276652852086*((@MEAN(XREVIND37_WSC/REVIND37_SUM,"1980 2008")‐(XREVIND37_WSC(‐
1)/REVIND37_SUM(‐1)))) ‐ 0.075116458925*D(XREVIND37_WSC(‐1)/REVIND37_SUM(‐1)) +
May 2014
U.S. Energy Information Administration | NEMS Macroeconomic Activity Module Documentation Report 198
0.00255521933996*D(GSPR_WSC/NP_WSC) ‐ 0.000397191570852*D(RMPRIME‐@PCA(CPI_WSC)) ‐
0.00107724960384*D(RWNM_WSC/JPGDP) + 4.3211926773E‐05*D(EEA(‐1)) ‐
0.00256009810038*D(WPI05_WSC/JPGDP) + 4.18889128408E‐05*@TREND
IND38 – Other agriculture, forestry, fishing & hunting
Eqn 352: D(XREVIND38_ENC/REVIND38_SUM) = 0.0015612963251 ‐ 0.00200591576688 +
0.276652852086*((@MEAN(XREVIND38_ENC/REVIND38_SUM,"1980 2008")‐(XREVIND38_ENC(‐
1)/REVIND38_SUM(‐1)))) ‐ 0.075116458925*D(XREVIND38_ENC(‐1)/REVIND38_SUM(‐1)) +
0.00255521933996*D(GSPR_ENC/NP_ENC) ‐ 0.000397191570852*D(RMPRIME‐@PCA(CPI_ENC)) ‐
0.00107724960384*D(RWNM_ENC/JPGDP) + 4.3211926773E‐05*D(EEA(‐1)) ‐
0.00256009810038*D(WPI05_ENC/JPGDP) + 4.18889128408E‐05*@TREND
Eqn 353: D(XREVIND38_ESC/REVIND38_SUM) = ‐0.000842738513318 ‐ 0.00200591576688 +
0.276652852086*((@MEAN(XREVIND38_ESC/REVIND38_SUM,"1980 2008")‐(XREVIND38_ESC(‐
1)/REVIND38_SUM(‐1)))) ‐ 0.075116458925*D(XREVIND38_ESC(‐1)/REVIND38_SUM(‐1)) +
0.00255521933996*D(GSPR_ESC/NP_ESC) ‐ 0.000397191570852*D(RMPRIME‐@PCA(CPI_ESC)) ‐
0.00107724960384*D(RWNM_ESC/JPGDP) + 4.3211926773E‐05*D(EEA(‐1)) ‐
0.00256009810038*D(WPI05_ESC/JPGDP) + 4.18889128408E‐05*@TREND
Eqn 354: D(XREVIND38_MATL/REVIND38_SUM) = 0.000838887670032 ‐ 0.00200591576688 +
0.276652852086*((@MEAN(XREVIND38_MATL/REVIND38_SUM,"1980 2008")‐(XREVIND38_MATL(‐
1)/REVIND38_SUM(‐1)))) ‐ 0.075116458925*D(XREVIND38_MATL(‐1)/REVIND38_SUM(‐1)) +
0.00255521933996*D(GSPR_MATL/NP_MATL) ‐ 0.000397191570852*D(RMPRIME‐@PCA(CPI_MATL)) ‐
0.00107724960384*D(RWNM_MATL/JPGDP) + 4.3211926773E‐05*D(EEA(‐1)) ‐
0.00256009810038*D(WPI05_MATL/JPGDP) + 4.18889128408E‐05*@TREND
Eqn 355: D(XREVIND38_MTN/REVIND38_SUM) = 0.00211345708424 ‐ 0.00200591576688 +
0.276652852086*((@MEAN(XREVIND38_MTN/REVIND38_SUM,"1980 2008")‐(XREVIND38_MTN(‐
1)/REVIND38_SUM(‐1)))) ‐ 0.075116458925*D(XREVIND38_MTN(‐1)/REVIND38_SUM(‐1)) +
0.00255521933996*D(GSPR_MTN/NP_MTN) ‐ 0.000397191570852*D(RMPRIME‐@PCA(CPI_MTN)) ‐
0.00107724960384*D(RWNM_MTN/JPGDP) + 4.3211926773E‐05*D(EEA(‐1)) ‐
0.00256009810038*D(WPI05_MTN/JPGDP) + 4.18889128408E‐05*@TREND
Eqn 356: D(XREVIND38_NENG/REVIND38_SUM) = ‐0.000797584129019 ‐ 0.00200591576688 +
0.276652852086*((@MEAN(XREVIND38_NENG/REVIND38_SUM,"1980 2008")‐(XREVIND38_NENG(‐
1)/REVIND38_SUM(‐1)))) ‐ 0.075116458925*D(XREVIND38_NENG(‐1)/REVIND38_SUM(‐1)) +
0.00255521933996*D(GSPR_NENG/NP_NENG) ‐ 0.000397191570852*D(RMPRIME‐@PCA(CPI_NENG)) ‐
0.00107724960384*D(RWNM_NENG/JPGDP) + 4.3211926773E‐05*D(EEA(‐1)) ‐
0.00256009810038*D(WPI05_NENG/JPGDP) + 4.18889128408E‐05*@TREND
Eqn 357: D(XREVIND38_PAC/REVIND38_SUM) = 0.000643171467853 ‐ 0.00200591576688 +
0.276652852086*((@MEAN(XREVIND38_PAC/REVIND38_SUM,"1980 2008")‐(XREVIND38_PAC(‐
1)/REVIND38_SUM(‐1)))) ‐ 0.075116458925*D(XREVIND38_PAC(‐1)/REVIND38_SUM(‐1)) +
0.00255521933996*D(GSPR_PAC/NP_PAC) ‐ 0.000397191570852*D(RMPRIME‐@PCA(CPI_PAC)) ‐
May 2014
U.S. Energy Information Administration | NEMS Macroeconomic Activity Module Documentation Report 199
0.00107724960384*D(RWNM_PAC/JPGDP) + 4.3211926773E‐05*D(EEA(‐1)) ‐
0.00256009810038*D(WPI05_PAC/JPGDP) + 4.18889128408E‐05*@TREND
Eqn 358: D(XREVIND38_SATL/REVIND38_SUM) = ‐0.00300659676443 ‐ 0.00200591576688 +
0.276652852086*((@MEAN(XREVIND38_SATL/REVIND38_SUM,"1980 2008")‐(XREVIND38_SATL(‐
1)/REVIND38_SUM(‐1)))) ‐ 0.075116458925*D(XREVIND38_SATL(‐1)/REVIND38_SUM(‐1)) +
0.00255521933996*D(GSPR_SATL/NP_SATL) ‐ 0.000397191570852*D(RMPRIME‐@PCA(CPI_SATL)) ‐
0.00107724960384*D(RWNM_SATL/JPGDP) + 4.3211926773E‐05*D(EEA(‐1)) ‐
0.00256009810038*D(WPI05_SATL/JPGDP) + 4.18889128408E‐05*@TREND
Eqn 359: D(XREVIND38_WNC/REVIND38_SUM) = 0.00243944391065 ‐ 0.00200591576688 +
0.276652852086*((@MEAN(XREVIND38_WNC/REVIND38_SUM,"1980 2008")‐(XREVIND38_WNC(‐
1)/REVIND38_SUM(‐1)))) ‐ 0.075116458925*D(XREVIND38_WNC(‐1)/REVIND38_SUM(‐1)) +
0.00255521933996*D(GSPR_WNC/NP_WNC) ‐ 0.000397191570852*D(RMPRIME‐@PCA(CPI_WNC)) ‐
0.00107724960384*D(RWNM_WNC/JPGDP) + 4.3211926773E‐05*D(EEA(‐1)) ‐
0.00256009810038*D(WPI05_WNC/JPGDP) + 4.18889128408E‐05*@TREND
Eqn 360: D(XREVIND38_WSC/REVIND38_SUM) = ‐0.00294933705111 ‐ 0.00200591576688 +
0.276652852086*((@MEAN(XREVIND38_WSC/REVIND38_SUM,"1980 2008")‐(XREVIND38_WSC(‐
1)/REVIND38_SUM(‐1)))) ‐ 0.075116458925*D(XREVIND38_WSC(‐1)/REVIND38_SUM(‐1)) +
0.00255521933996*D(GSPR_WSC/NP_WSC) ‐ 0.000397191570852*D(RMPRIME‐@PCA(CPI_WSC)) ‐
0.00107724960384*D(RWNM_WSC/JPGDP) + 4.3211926773E‐05*D(EEA(‐1)) ‐
0.00256009810038*D(WPI05_WSC/JPGDP) + 4.18889128408E‐05*@TREND
IND39 – Coal mining
Eqn 361: D(XREVIND39_ENC/REVIND39_SUM) = ‐0.00111450189508 + 5.59403057588E‐05 +
0.169665496662*((@MEAN(XREVIND39_ENC/REVIND39_SUM,"1980 2008")‐(XREVIND39_ENC(‐
1)/REVIND39_SUM(‐1)))) + 0.119460589799*D(XREVIND39_ENC(‐1)/REVIND39_SUM(‐1)) + 7.21311781015E‐
05*D(GSPR_ENC(‐1)/NP_ENC(‐1)) ‐ 1.40023936274E‐05*D(RMPRIME(‐1)‐@PCA(CPI_ENC(‐1))) ‐
0.000174672617983*D(RWNM_ENC(‐1)/JPGDP(‐1)) + 1.37764063274E‐05*D(WPI05_ENC(‐1)/JPGDP(‐1))
Eqn 362: D(XREVIND39_ESC/REVIND39_SUM) = ‐0.00190828724628 + 5.59403057588E‐05 +
0.169665496662*((@MEAN(XREVIND39_ESC/REVIND39_SUM,"1980 2008")‐(XREVIND39_ESC(‐
1)/REVIND39_SUM(‐1)))) + 0.119460589799*D(XREVIND39_ESC(‐1)/REVIND39_SUM(‐1)) + 7.21311781015E‐
05*D(GSPR_ESC(‐1)/NP_ESC(‐1)) ‐ 1.40023936274E‐05*D(RMPRIME(‐1)‐@PCA(CPI_ESC(‐1))) ‐
0.000174672617983*D(RWNM_ESC(‐1)/JPGDP(‐1)) + 1.37764063274E‐05*D(WPI05_ESC(‐1)/JPGDP(‐1))
Eqn 363: D(XREVIND39_MATL/REVIND39_SUM) = 0.00024589002905 + 5.59403057588E‐05 +
0.169665496662*((@MEAN(XREVIND39_MATL/REVIND39_SUM,"1980 2008")‐(XREVIND39_MATL(‐
1)/REVIND39_SUM(‐1)))) + 0.119460589799*D(XREVIND39_MATL(‐1)/REVIND39_SUM(‐1)) + 7.21311781015E‐
05*D(GSPR_MATL(‐1)/NP_MATL(‐1)) ‐ 1.40023936274E‐05*D(RMPRIME(‐1)‐@PCA(CPI_MATL(‐1))) ‐
0.000174672617983*D(RWNM_MATL(‐1)/JPGDP(‐1)) + 1.37764063274E‐05*D(WPI05_MATL(‐1)/JPGDP(‐1))
May 2014
U.S. Energy Information Administration | NEMS Macroeconomic Activity Module Documentation Report 200
Eqn 364: D(XREVIND39_MTN/REVIND39_SUM) = 0.00438858000392 + 5.59403057588E‐05 +
0.169665496662*((@MEAN(XREVIND39_MTN/REVIND39_SUM,"1980 2008")‐(XREVIND39_MTN(‐
1)/REVIND39_SUM(‐1)))) + 0.119460589799*D(XREVIND39_MTN(‐1)/REVIND39_SUM(‐1)) + 7.21311781015E‐
05*D(GSPR_MTN(‐1)/NP_MTN(‐1)) ‐ 1.40023936274E‐05*D(RMPRIME(‐1)‐@PCA(CPI_MTN(‐1))) ‐
0.000174672617983*D(RWNM_MTN(‐1)/JPGDP(‐1)) + 1.37764063274E‐05*D(WPI05_MTN(‐1)/JPGDP(‐1))
Eqn 365: D(XREVIND39_NENG/REVIND39_SUM) = 4.23476839201E‐05 + 5.59403057588E‐05 +
0.169665496662*((@MEAN(XREVIND39_NENG/REVIND39_SUM,"1980 2008")‐(XREVIND39_NENG(‐
1)/REVIND39_SUM(‐1)))) + 0.119460589799*D(XREVIND39_NENG(‐1)/REVIND39_SUM(‐1)) + 7.21311781015E‐
05*D(GSPR_NENG(‐1)/NP_NENG(‐1)) ‐ 1.40023936274E‐05*D(RMPRIME(‐1)‐@PCA(CPI_NENG(‐1))) ‐
0.000174672617983*D(RWNM_NENG(‐1)/JPGDP(‐1)) + 1.37764063274E‐05*D(WPI05_NENG(‐1)/JPGDP(‐1))
Eqn 366: D(XREVIND39_PAC/REVIND39_SUM) = 0.000139420516822 + 5.59403057588E‐05 +
0.169665496662*((@MEAN(XREVIND39_PAC/REVIND39_SUM,"1980 2008")‐(XREVIND39_PAC(‐
1)/REVIND39_SUM(‐1)))) + 0.119460589799*D(XREVIND39_PAC(‐1)/REVIND39_SUM(‐1)) + 7.21311781015E‐
05*D(GSPR_PAC(‐1)/NP_PAC(‐1)) ‐ 1.40023936274E‐05*D(RMPRIME(‐1)‐@PCA(CPI_PAC(‐1))) ‐
0.000174672617983*D(RWNM_PAC(‐1)/JPGDP(‐1)) + 1.37764063274E‐05*D(WPI05_PAC(‐1)/JPGDP(‐1))
Eqn 367: D(XREVIND39_SATL/REVIND39_SUM) = ‐0.00134200831802 + 5.59403057588E‐05 +
0.169665496662*((@MEAN(XREVIND39_SATL/REVIND39_SUM,"1980 2008")‐(XREVIND39_SATL(‐
1)/REVIND39_SUM(‐1)))) + 0.119460589799*D(XREVIND39_SATL(‐1)/REVIND39_SUM(‐1)) + 7.21311781015E‐
05*D(GSPR_SATL(‐1)/NP_SATL(‐1)) ‐ 1.40023936274E‐05*D(RMPRIME(‐1)‐@PCA(CPI_SATL(‐1))) ‐
0.000174672617983*D(RWNM_SATL(‐1)/JPGDP(‐1)) + 1.37764063274E‐05*D(WPI05_SATL(‐1)/JPGDP(‐1))
Eqn 368: D(XREVIND39_WNC/REVIND39_SUM) = ‐0.000160938946089 + 5.59403057588E‐05 +
0.169665496662*((@MEAN(XREVIND39_WNC/REVIND39_SUM,"1980 2008")‐(XREVIND39_WNC(‐
1)/REVIND39_SUM(‐1)))) + 0.119460589799*D(XREVIND39_WNC(‐1)/REVIND39_SUM(‐1)) + 7.21311781015E‐
05*D(GSPR_WNC(‐1)/NP_WNC(‐1)) ‐ 1.40023936274E‐05*D(RMPRIME(‐1)‐@PCA(CPI_WNC(‐1))) ‐
0.000174672617983*D(RWNM_WNC(‐1)/JPGDP(‐1)) + 1.37764063274E‐05*D(WPI05_WNC(‐1)/JPGDP(‐1))
Eqn 369: D(XREVIND39_WSC/REVIND39_SUM) = ‐0.000290501828241 + 5.59403057588E‐05 +
0.169665496662*((@MEAN(XREVIND39_WSC/REVIND39_SUM,"1980 2008")‐(XREVIND39_WSC(‐
1)/REVIND39_SUM(‐1)))) + 0.119460589799*D(XREVIND39_WSC(‐1)/REVIND39_SUM(‐1)) + 7.21311781015E‐
05*D(GSPR_WSC(‐1)/NP_WSC(‐1)) ‐ 1.40023936274E‐05*D(RMPRIME(‐1)‐@PCA(CPI_WSC(‐1))) ‐
0.000174672617983*D(RWNM_WSC(‐1)/JPGDP(‐1)) + 1.37764063274E‐05*D(WPI05_WSC(‐1)/JPGDP(‐1))
IND40 – Oil & gas extraction & support activities
Eqn 370: D(XREVIND40_ENC/REVIND40_SUM) = 1.94041423358E‐05 ‐ 0.00011696467111 +
0.153610365068*((@MEAN(XREVIND40_ENC/REVIND40_SUM,"1980 2008")‐(XREVIND40_ENC(‐
1)/REVIND40_SUM(‐1)))) + 0.000513005128466*D(GSPR_ENC/NP_ENC) + 6.36378862997E‐05*D(RMPRIME‐
@PCA(CPI_ENC)) + 9.01357837062E‐05*D(RWNM_ENC/JPGDP) ‐ 0.000167770884827*D(EEA)
Eqn 371: D(XREVIND40_ESC/REVIND40_SUM) = 0.000761587113342 ‐ 0.00011696467111 +
0.153610365068*((@MEAN(XREVIND40_ESC/REVIND40_SUM,"1980 2008")‐(XREVIND40_ESC(‐
May 2014
U.S. Energy Information Administration | NEMS Macroeconomic Activity Module Documentation Report 201
1)/REVIND40_SUM(‐1)))) + 0.000513005128466*D(GSPR_ESC/NP_ESC) + 6.36378862997E‐05*D(RMPRIME‐
@PCA(CPI_ESC)) + 9.01357837062E‐05*D(RWNM_ESC/JPGDP) ‐ 0.000167770884827*D(EEA)
Eqn 372: D(XREVIND40_MATL/REVIND40_SUM) = 0.000224010728423 ‐ 0.00011696467111 +
0.153610365068*((@MEAN(XREVIND40_MATL/REVIND40_SUM,"1980 2008")‐(XREVIND40_MATL(‐
1)/REVIND40_SUM(‐1)))) + 0.000513005128466*D(GSPR_MATL/NP_MATL) + 6.36378862997E‐05*D(RMPRIME‐
@PCA(CPI_MATL)) + 9.01357837062E‐05*D(RWNM_MATL/JPGDP) ‐ 0.000167770884827*D(EEA)
Eqn 373: D(XREVIND40_MTN/REVIND40_SUM) = 0.0041688796065 ‐ 0.00011696467111 +
0.153610365068*((@MEAN(XREVIND40_MTN/REVIND40_SUM,"1980 2008")‐(XREVIND40_MTN(‐
1)/REVIND40_SUM(‐1)))) + 0.000513005128466*D(GSPR_MTN/NP_MTN) + 6.36378862997E‐05*D(RMPRIME‐
@PCA(CPI_MTN)) + 9.01357837062E‐05*D(RWNM_MTN/JPGDP) ‐ 0.000167770884827*D(EEA)
Eqn 374: D(XREVIND40_NENG/REVIND40_SUM) = ‐0.000116768759386 ‐ 0.00011696467111 +
0.153610365068*((@MEAN(XREVIND40_NENG/REVIND40_SUM,"1980 2008")‐(XREVIND40_NENG(‐
1)/REVIND40_SUM(‐1)))) + 0.000513005128466*D(GSPR_NENG/NP_NENG) + 6.36378862997E‐05*D(RMPRIME‐
@PCA(CPI_NENG)) + 9.01357837062E‐05*D(RWNM_NENG/JPGDP) ‐ 0.000167770884827*D(EEA)
Eqn 375: D(XREVIND40_PAC/REVIND40_SUM) = ‐0.00637125078255 ‐ 0.00011696467111 +
0.153610365068*((@MEAN(XREVIND40_PAC/REVIND40_SUM,"1980 2008")‐(XREVIND40_PAC(‐
1)/REVIND40_SUM(‐1)))) + 0.000513005128466*D(GSPR_PAC/NP_PAC) + 6.36378862997E‐05*D(RMPRIME‐
@PCA(CPI_PAC)) + 9.01357837062E‐05*D(RWNM_PAC/JPGDP) ‐ 0.000167770884827*D(EEA)
Eqn 376: D(XREVIND40_SATL/REVIND40_SUM) = 0.000297005797236 ‐ 0.00011696467111 +
0.153610365068*((@MEAN(XREVIND40_SATL/REVIND40_SUM,"1980 2008")‐(XREVIND40_SATL(‐
1)/REVIND40_SUM(‐1)))) + 0.000513005128466*D(GSPR_SATL/NP_SATL) + 6.36378862997E‐05*D(RMPRIME‐
@PCA(CPI_SATL)) + 9.01357837062E‐05*D(RWNM_SATL/JPGDP) ‐ 0.000167770884827*D(EEA)
Eqn 377: D(XREVIND40_WNC/REVIND40_SUM) = ‐0.000229292096961 ‐ 0.00011696467111 +
0.153610365068*((@MEAN(XREVIND40_WNC/REVIND40_SUM,"1980 2008")‐(XREVIND40_WNC(‐
1)/REVIND40_SUM(‐1)))) + 0.000513005128466*D(GSPR_WNC/NP_WNC) + 6.36378862997E‐05*D(RMPRIME‐
@PCA(CPI_WNC)) + 9.01357837062E‐05*D(RWNM_WNC/JPGDP) ‐ 0.000167770884827*D(EEA)
Eqn 378: D(XREVIND40_WSC/REVIND40_SUM) = 0.00124642425106 ‐ 0.00011696467111 +
0.153610365068*((@MEAN(XREVIND40_WSC/REVIND40_SUM,"1980 2008")‐(XREVIND40_WSC(‐
1)/REVIND40_SUM(‐1)))) + 0.000513005128466*D(GSPR_WSC/NP_WSC) + 6.36378862997E‐05*D(RMPRIME‐
@PCA(CPI_WSC)) + 9.01357837062E‐05*D(RWNM_WSC/JPGDP) ‐ 0.000167770884827*D(EEA)
IND41 – Other mining & quarrying
Eqn 379: D(XREVIND41_ENC/REVIND41_SUM) = 0.000419740658523 ‐ 7.14192871527E‐05 +
0.256781858719*((@MEAN(XREVIND41_ENC/REVIND41_SUM,"1980 2008")‐(XREVIND41_ENC(‐
1)/REVIND41_SUM(‐1)))) + 0.235776191914*D(XREVIND41_ENC(‐1)/REVIND41_SUM(‐1)) ‐
0.000125769352539*D(GSPR_ENC(‐1)/NP_ENC(‐1)) ‐ 0.000253173716317*D(RMPRIME‐@PCA(CPI_ENC)) ‐
0.000386678588048*D(RWNM_ENC(‐1)/JPGDP(‐1)) + 0.000211057627928*D(EEA)
May 2014
U.S. Energy Information Administration | NEMS Macroeconomic Activity Module Documentation Report 202
Eqn 380: D(XREVIND41_ESC/REVIND41_SUM) = 6.81463884666e‐05 ‐ 7.14192871527e‐05 +
0.256781858719*((@MEAN(XREVIND41_ESC/REVIND41_SUM,"1980 2008")‐(XREVIND41_ESC(‐
1)/REVIND41_SUM(‐1)))) + 0.235776191914*D(XREVIND41_ESC(‐1)/REVIND41_SUM(‐1)) ‐
0.000125769352539*D(GSPR_ESC(‐1)/NP_ESC(‐1)) ‐ 0.000253173716317*D(RMPRIME‐@PCA(CPI_ESC)) ‐
0.000386678588048*D(RWNM_ESC(‐1)/JPGDP(‐1)) + 0.000211057627928*D(EEA)
Eqn 381: D(XREVIND41_MATL/REVIND41_SUM) = 0.000119933509413 ‐ 7.14192871527e‐05 +
0.256781858719*((@MEAN(XREVIND41_MATL/REVIND41_SUM,"1980 2008")‐(XREVIND41_MATL(‐
1)/REVIND41_SUM(‐1)))) + 0.235776191914*D(XREVIND41_MATL(‐1)/REVIND41_SUM(‐1)) ‐
0.000125769352539*D(GSPR_MATL(‐1)/NP_MATL(‐1)) ‐ 0.000253173716317*D(RMPRIME‐@PCA(CPI_MATL)) ‐
0.000386678588048*D(RWNM_MATL(‐1)/JPGDP(‐1)) + 0.000211057627928*D(EEA)
Eqn 382: D(XREVIND41_MTN/REVIND41_SUM) = 0.00278410267666 ‐ 7.14192871527e‐05 +
0.256781858719*((@MEAN(XREVIND41_MTN/REVIND41_SUM,"1980 2008")‐(XREVIND41_MTN(‐
1)/REVIND41_SUM(‐1)))) + 0.235776191914*D(XREVIND41_MTN(‐1)/REVIND41_SUM(‐1)) ‐
0.000125769352539*D(GSPR_MTN(‐1)/NP_MTN(‐1)) ‐ 0.000253173716317*D(RMPRIME‐@PCA(CPI_MTN)) ‐
0.000386678588048*D(RWNM_MTN(‐1)/JPGDP(‐1)) + 0.000211057627928*D(EEA)
Eqn 383: D(XREVIND41_NENG/REVIND41_SUM) = 0.000165449099593 ‐ 7.14192871527e‐05 +
0.256781858719*((@MEAN(XREVIND41_NENG/REVIND41_SUM,"1980 2008")‐(XREVIND41_NENG(‐
1)/REVIND41_SUM(‐1)))) + 0.235776191914*D(XREVIND41_NENG(‐1)/REVIND41_SUM(‐1)) ‐
0.000125769352539*D(GSPR_NENG(‐1)/NP_NENG(‐1)) ‐ 0.000253173716317*D(RMPRIME‐@PCA(CPI_NENG)) ‐
0.000386678588048*D(RWNM_NENG(‐1)/JPGDP(‐1)) + 0.000211057627928*D(EEA)
Eqn 384: D(XREVIND41_PAC/REVIND41_SUM) = ‐0.00313597071539 ‐ 7.14192871527e‐05 +
0.256781858719*((@MEAN(XREVIND41_PAC/REVIND41_SUM,"1980 2008")‐(XREVIND41_PAC(‐
1)/REVIND41_SUM(‐1)))) + 0.235776191914*D(XREVIND41_PAC(‐1)/REVIND41_SUM(‐1)) ‐
0.000125769352539*D(GSPR_PAC(‐1)/NP_PAC(‐1)) ‐ 0.000253173716317*D(RMPRIME‐@PCA(CPI_PAC)) ‐
0.000386678588048*D(RWNM_PAC(‐1)/JPGDP(‐1)) + 0.000211057627928*D(EEA)
Eqn 385: D(XREVIND41_SATL/REVIND41_SUM) = 0.000586924140393 ‐ 7.14192871527e‐05 +
0.256781858719*((@MEAN(XREVIND41_SATL/REVIND41_SUM,"1980 2008")‐(XREVIND41_SATL(‐
1)/REVIND41_SUM(‐1)))) + 0.235776191914*D(XREVIND41_SATL(‐1)/REVIND41_SUM(‐1)) ‐
0.000125769352539*D(GSPR_SATL(‐1)/NP_SATL(‐1)) ‐ 0.000253173716317*D(RMPRIME‐@PCA(CPI_SATL)) ‐
0.000386678588048*D(RWNM_SATL(‐1)/JPGDP(‐1)) + 0.000211057627928*D(EEA)
Eqn 386: D(XREVIND41_WNC/REVIND41_SUM) = ‐0.000716587340873 ‐ 7.14192871527e‐05 +
0.256781858719*((@MEAN(XREVIND41_WNC/REVIND41_SUM,"1980 2008")‐(XREVIND41_WNC(‐
1)/REVIND41_SUM(‐1)))) + 0.235776191914*D(XREVIND41_WNC(‐1)/REVIND41_SUM(‐1)) ‐
0.000125769352539*D(GSPR_WNC(‐1)/NP_WNC(‐1)) ‐ 0.000253173716317*D(RMPRIME‐@PCA(CPI_WNC)) ‐
0.000386678588048*D(RWNM_WNC(‐1)/JPGDP(‐1)) + 0.000211057627928*D(EEA)
Eqn 387: D(XREVIND41_WSC/REVIND41_SUM) = ‐0.000291738416788 ‐ 7.14192871527e‐05 +
0.256781858719*((@MEAN(XREVIND41_WSC/REVIND41_SUM,"1980 2008")‐(XREVIND41_WSC(‐
1)/REVIND41_SUM(‐1)))) + 0.235776191914*D(XREVIND41_WSC(‐1)/REVIND41_SUM(‐1)) ‐
May 2014
U.S. Energy Information Administration | NEMS Macroeconomic Activity Module Documentation Report 203
0.000125769352539*D(GSPR_WSC(‐1)/NP_WSC(‐1)) ‐ 0.000253173716317*D(RMPRIME‐@PCA(CPI_WSC)) ‐
0.000386678588048*D(RWNM_WSC(‐1)/JPGDP(‐1)) + 0.000211057627928*D(EEA)
IND42 – Construction
Eqn 388: D(XREVIND42_ENC/REVIND42_SUM) = ‐0.00101519543915 ‐ 7.72769761899E‐05 +
0.144069989247*((@MEAN(XREVIND42_ENC/REVIND42_SUM,"1980 2008")‐(XREVIND42_ENC(‐
1)/REVIND42_SUM(‐1)))) + 0.495574746112*D(XREVIND42_ENC(‐1)/REVIND42_SUM(‐1)) +
0.000229870221163*D(GSPR_ENC(‐1)/NP_ENC(‐1)) ‐ 8.27773435529E‐05*D(RMPRIME‐@PCA(CPI_ENC)) ‐
4.99547023637E‐06*@TREND
Eqn 389: D(XREVIND42_ESC/REVIND42_SUM) = ‐3.69019299648E‐05 ‐ 7.72769761899E‐05 +
0.144069989247*((@MEAN(XREVIND42_ESC/REVIND42_SUM,"1980 2008")‐(XREVIND42_ESC(‐
1)/REVIND42_SUM(‐1)))) + 0.495574746112*D(XREVIND42_ESC(‐1)/REVIND42_SUM(‐1)) +
0.000229870221163*D(GSPR_ESC(‐1)/NP_ESC(‐1)) ‐ 8.27773435529E‐05*D(RMPRIME‐@PCA(CPI_ESC)) ‐
4.99547023637E‐06*@TREND
Eqn 390: D(XREVIND42_MATL/REVIND42_SUM) = ‐0.000758626505694 ‐ 7.72769761899E‐05 +
0.144069989247*((@MEAN(XREVIND42_MATL/REVIND42_SUM,"1980 2008")‐(XREVIND42_MATL(‐
1)/REVIND42_SUM(‐1)))) + 0.495574746112*D(XREVIND42_MATL(‐1)/REVIND42_SUM(‐1)) +
0.000229870221163*D(GSPR_MATL(‐1)/NP_MATL(‐1)) ‐ 8.27773435529E‐05*D(RMPRIME‐@PCA(CPI_MATL)) ‐
4.99547023637E‐06*@TREND
Eqn 391: D(XREVIND42_MTN/REVIND42_SUM) = 0.000923179537041 ‐ 7.72769761899E‐05 +
0.144069989247*((@MEAN(XREVIND42_MTN/REVIND42_SUM,"1980 2008")‐(XREVIND42_MTN(‐
1)/REVIND42_SUM(‐1)))) + 0.495574746112*D(XREVIND42_MTN(‐1)/REVIND42_SUM(‐1)) +
0.000229870221163*D(GSPR_MTN(‐1)/NP_MTN(‐1)) ‐ 8.27773435529E‐05*D(RMPRIME‐@PCA(CPI_MTN)) ‐
4.99547023637E‐06*@TREND
Eqn 392: D(XREVIND42_NENG/REVIND42_SUM) = ‐7.2529086473E‐05 ‐ 7.72769761899E‐05 +
0.144069989247*((@MEAN(XREVIND42_NENG/REVIND42_SUM,"1980 2008")‐(XREVIND42_NENG(‐
1)/REVIND42_SUM(‐1)))) + 0.495574746112*D(XREVIND42_NENG(‐1)/REVIND42_SUM(‐1)) +
0.000229870221163*D(GSPR_NENG(‐1)/NP_NENG(‐1)) ‐ 8.27773435529E‐05*D(RMPRIME‐@PCA(CPI_NENG)) ‐
4.99547023637E‐06*@TREND
Eqn 393: D(XREVIND42_PAC/REVIND42_SUM) = ‐0.000228255476646 ‐ 7.72769761899E‐05 +
0.144069989247*((@MEAN(XREVIND42_PAC/REVIND42_SUM,"1980 2008")‐(XREVIND42_PAC(‐
1)/REVIND42_SUM(‐1)))) + 0.495574746112*D(XREVIND42_PAC(‐1)/REVIND42_SUM(‐1)) +
0.000229870221163*D(GSPR_PAC(‐1)/NP_PAC(‐1)) ‐ 8.27773435529E‐05*D(RMPRIME‐@PCA(CPI_PAC)) ‐
4.99547023637E‐06*@TREND
Eqn 394: D(XREVIND42_SATL/REVIND42_SUM) = 0.000526534669948 ‐ 7.72769761899E‐05 +
0.144069989247*((@MEAN(XREVIND42_SATL/REVIND42_SUM,"1980 2008")‐(XREVIND42_SATL(‐
1)/REVIND42_SUM(‐1)))) + 0.495574746112*D(XREVIND42_SATL(‐1)/REVIND42_SUM(‐1)) +
May 2014
U.S. Energy Information Administration | NEMS Macroeconomic Activity Module Documentation Report 204
0.000229870221163*D(GSPR_SATL(‐1)/NP_SATL(‐1)) ‐ 8.27773435529E‐05*D(RMPRIME‐@PCA(CPI_SATL)) ‐
4.99547023637E‐06*@TREND
Eqn 395: D(XREVIND42_WNC/REVIND42_SUM) = 7.60363792303E‐05 ‐ 7.72769761899E‐05 +
0.144069989247*((@MEAN(XREVIND42_WNC/REVIND42_SUM,"1980 2008")‐(XREVIND42_WNC(‐
1)/REVIND42_SUM(‐1)))) + 0.495574746112*D(XREVIND42_WNC(‐1)/REVIND42_SUM(‐1)) +
0.000229870221163*D(GSPR_WNC(‐1)/NP_WNC(‐1)) ‐ 8.27773435529E‐05*D(RMPRIME‐@PCA(CPI_WNC)) ‐
4.99547023637E‐06*@TREND
Eqn 396: D(XREVIND42_WSC/REVIND42_SUM) = 0.00058575785171 ‐ 7.72769761899e‐05 +
0.144069989247*((@MEAN(XREVIND42_WSC/REVIND42_SUM,"1980 2008")‐(XREVIND42_WSC(‐
1)/REVIND42_SUM(‐1)))) + 0.495574746112*D(XREVIND42_WSC(‐1)/REVIND42_SUM(‐1)) +
0.000229870221163*D(GSPR_WSC(‐1)/NP_WSC(‐1)) ‐ 8.27773435529e‐05*D(RMPRIME‐@PCA(CPI_WSC)) ‐
4.99547023637e‐06*@TREND
SER1 ‐ Transportation & warehousing
Eqn 397: D(XREVSER1_ENC/REVSER1_SUM) = ‐5.15324267538e‐05 + 2.38162541666e‐05 +
0.113483544715*((@MEAN(XREVSER1_ENC/REVSER1_SUM,"1980 2008")‐(XREVSER1_ENC(‐1)/REVSER1_SUM(‐
1)))) ‐ 1.91519378391e‐05*D(GSPR_ENC/NP_ENC) ‐ 1.68554542891e‐05*D(RMPRIME(‐1)‐@PCA(CPI_ENC(‐1))) +
3.40410390845e‐05*D(RWNM_ENC(‐1)/JPGDP(‐1)) + 6.67665709642e‐06*D(EEA(‐1)) ‐ 2.07911467386e‐
06*@TREND
Eqn 398: D(XREVSER1_ESC/REVSER1_SUM) = 0.000528292696137 + 2.38162541666e‐05 +
0.113483544715*((@MEAN(XREVSER1_ESC/REVSER1_SUM,"1980 2008")‐(XREVSER1_ESC(‐1)/REVSER1_SUM(‐
1)))) ‐ 1.91519378391e‐05*D(GSPR_ESC/NP_ESC) ‐ 1.68554542891e‐05*D(RMPRIME(‐1)‐@PCA(CPI_ESC(‐1))) +
3.40410390845e‐05*D(RWNM_ESC(‐1)/JPGDP(‐1)) + 6.67665709642e‐06*D(EEA(‐1)) ‐ 2.07911467386e‐
06*@TREND
Eqn 399: D(XREVSER1_MATL/REVSER1_SUM) = ‐0.00186015169453 + 2.38162541666e‐05 +
0.113483544715*((@MEAN(XREVSER1_MATL/REVSER1_SUM,"1980 2008")‐(XREVSER1_MATL(‐
1)/REVSER1_SUM(‐1)))) ‐ 1.91519378391e‐05*D(GSPR_MATL/NP_MATL) ‐ 1.68554542891e‐05*D(RMPRIME(‐1)‐
@PCA(CPI_MATL(‐1))) + 3.40410390845e‐05*D(RWNM_MATL(‐1)/JPGDP(‐1)) + 6.67665709642e‐06*D(EEA(‐1)) ‐
2.07911467386e‐06*@TREND
Eqn 400: D(XREVSER1_MTN/REVSER1_SUM) = 0.000817263849308 + 2.38162541666e‐05 +
0.113483544715*((@MEAN(XREVSER1_MTN/REVSER1_SUM,"1980 2008")‐(XREVSER1_MTN(‐
1)/REVSER1_SUM(‐1)))) ‐ 1.91519378391e‐05*D(GSPR_MTN/NP_MTN) ‐ 1.68554542891e‐05*D(RMPRIME(‐1)‐
@PCA(CPI_MTN(‐1))) + 3.40410390845e‐05*D(RWNM_MTN(‐1)/JPGDP(‐1)) + 6.67665709642e‐06*D(EEA(‐1)) ‐
2.07911467386e‐06*@TREND
Eqn 401: D(XREVSER1_NENG/REVSER1_SUM) = ‐0.000270213648117 + 2.38162541666e‐05 +
0.113483544715*((@MEAN(XREVSER1_NENG/REVSER1_SUM,"1980 2008")‐(XREVSER1_NENG(‐
1)/REVSER1_SUM(‐1)))) ‐ 1.91519378391e‐05*D(GSPR_NENG/NP_NENG) ‐ 1.68554542891e‐05*D(RMPRIME(‐
May 2014
U.S. Energy Information Administration | NEMS Macroeconomic Activity Module Documentation Report 205
1)‐@PCA(CPI_NENG(‐1))) + 3.40410390845e‐05*D(RWNM_NENG(‐1)/JPGDP(‐1)) + 6.67665709642e‐06*D(EEA(‐
1)) ‐ 2.07911467386e‐06*@TREND
Eqn 402: D(XREVSER1_PAC/REVSER1_SUM) = ‐0.000929173486351 + 2.38162541666e‐05 +
0.113483544715*((@MEAN(XREVSER1_PAC/REVSER1_SUM,"1980 2008")‐(XREVSER1_PAC(‐1)/REVSER1_SUM(‐
1)))) ‐ 1.91519378391e‐05*D(GSPR_PAC/NP_PAC) ‐ 1.68554542891e‐05*D(RMPRIME(‐1)‐@PCA(CPI_PAC(‐1))) +
3.40410390845e‐05*D(RWNM_PAC(‐1)/JPGDP(‐1)) + 6.67665709642e‐06*D(EEA(‐1)) ‐ 2.07911467386e‐
06*@TREND
Eqn 403: D(XREVSER1_SATL/REVSER1_SUM) = 0.000423559233827 + 2.38162541666e‐05 +
0.113483544715*((@MEAN(XREVSER1_SATL/REVSER1_SUM,"1980 2008")‐(XREVSER1_SATL(‐
1)/REVSER1_SUM(‐1)))) ‐ 1.91519378391e‐05*D(GSPR_SATL/NP_SATL) ‐ 1.68554542891e‐05*D(RMPRIME(‐1)‐
@PCA(CPI_SATL(‐1))) + 3.40410390845e‐05*D(RWNM_SATL(‐1)/JPGDP(‐1)) + 6.67665709642e‐06*D(EEA(‐1)) ‐
2.07911467386e‐06*@TREND
Eqn 404: D(XREVSER1_WNC/REVSER1_SUM) = ‐0.000216412198867 + 2.38162541666e‐05 +
0.113483544715*((@MEAN(XREVSER1_WNC/REVSER1_SUM,"1980 2008")‐(XREVSER1_WNC(‐
1)/REVSER1_SUM(‐1)))) ‐ 1.91519378391e‐05*D(GSPR_WNC/NP_WNC) ‐ 1.68554542891e‐05*D(RMPRIME(‐1)‐
@PCA(CPI_WNC(‐1))) + 3.40410390845e‐05*D(RWNM_WNC(‐1)/JPGDP(‐1)) + 6.67665709642e‐06*D(EEA(‐1)) ‐
2.07911467386e‐06*@TREND
Eqn 405: D(XREVSER1_WSC/REVSER1_SUM) = 0.00155836767535 + 2.38162541666e‐05 +
0.113483544715*((@MEAN(XREVSER1_WSC/REVSER1_SUM,"1980 2008")‐(XREVSER1_WSC(‐
1)/REVSER1_SUM(‐1)))) ‐ 1.91519378391e‐05*D(GSPR_WSC/NP_WSC) ‐ 1.68554542891e‐05*D(RMPRIME(‐1)‐
@PCA(CPI_WSC(‐1))) + 3.40410390845e‐05*D(RWNM_WSC(‐1)/JPGDP(‐1)) + 6.67665709642e‐06*D(EEA(‐1)) ‐
2.07911467386e‐06*@TREND
SER2 ‐ Broadcasting & telecommunications
Eqn 406: D(XREVSER2_ENC/REVSER2_SUM) = ‐0.00226560311692 ‐ 0.00127531267811 +
0.150925413618*((@MEAN(XREVSER2_ENC/REVSER2_SUM,"1980 2008")‐(XREVSER2_ENC(‐1)/REVSER2_SUM(‐
1)))) ‐ 0.0108532181943*D(XREVSER2_ENC(‐1)/REVSER2_SUM(‐1)) + 0.00121487994277*D(GSPR_ENC/NP_ENC)
‐ 0.000313877646792*D(RMPRIME‐@PCA(CPI_ENC)) ‐ 0.000386385217043*D(RWNM_ENC(‐1)/JPGDP(‐1)) +
6.89771793299e‐05*D(EEA(‐1)) + 2.41850846622e‐05*@TREND
Eqn 407: D(XREVSER2_ESC/REVSER2_SUM) = ‐0.000547327763605 ‐ 0.00127531267811 +
0.150925413618*((@MEAN(XREVSER2_ESC/REVSER2_SUM,"1980 2008")‐(XREVSER2_ESC(‐1)/REVSER2_SUM(‐
1)))) ‐ 0.0108532181943*D(XREVSER2_ESC(‐1)/REVSER2_SUM(‐1)) + 0.00121487994277*D(GSPR_ESC/NP_ESC) ‐
0.000313877646792*D(RMPRIME‐@PCA(CPI_ESC)) ‐ 0.000386385217043*D(RWNM_ESC(‐1)/JPGDP(‐1)) +
6.89771793299e‐05*D(EEA(‐1)) + 2.41850846622e‐05*@TREND
Eqn 408: D(XREVSER2_MATL/REVSER2_SUM) = ‐0.000857449498751 ‐ 0.00127531267811 +
0.150925413618*((@MEAN(XREVSER2_MATL/REVSER2_SUM,"1980 2008")‐(XREVSER2_MATL(‐
1)/REVSER2_SUM(‐1)))) ‐ 0.0108532181943*D(XREVSER2_MATL(‐1)/REVSER2_SUM(‐1)) +
0.00121487994277*D(GSPR_MATL/NP_MATL) ‐ 0.000313877646792*D(RMPRIME‐@PCA(CPI_MATL)) ‐
May 2014
U.S. Energy Information Administration | NEMS Macroeconomic Activity Module Documentation Report 206
0.000386385217043*D(RWNM_MATL(‐1)/JPGDP(‐1)) + 6.89771793299e‐05*D(EEA(‐1)) + 2.41850846622e‐
05*@TREND
Eqn 409: D(XREVSER2_MTN/REVSER2_SUM) = 0.000980973848687 ‐ 0.00127531267811 +
0.150925413618*((@MEAN(XREVSER2_MTN/REVSER2_SUM,"1980 2008")‐(XREVSER2_MTN(‐
1)/REVSER2_SUM(‐1)))) ‐ 0.0108532181943*D(XREVSER2_MTN(‐1)/REVSER2_SUM(‐1)) +
0.00121487994277*D(GSPR_MTN/NP_MTN) ‐ 0.000313877646792*D(RMPRIME‐@PCA(CPI_MTN)) ‐
0.000386385217043*D(RWNM_MTN(‐1)/JPGDP(‐1)) + 6.89771793299e‐05*D(EEA(‐1)) + 2.41850846622e‐
05*@TREND
Eqn 410: D(XREVSER2_NENG/REVSER2_SUM) = ‐0.000952697044727 ‐ 0.00127531267811 +
0.150925413618*((@MEAN(XREVSER2_NENG/REVSER2_SUM,"1980 2008")‐(XREVSER2_NENG(‐
1)/REVSER2_SUM(‐1)))) ‐ 0.0108532181943*D(XREVSER2_NENG(‐1)/REVSER2_SUM(‐1)) +
0.00121487994277*D(GSPR_NENG/NP_NENG) ‐ 0.000313877646792*D(RMPRIME‐@PCA(CPI_NENG)) ‐
0.000386385217043*D(RWNM_NENG(‐1)/JPGDP(‐1)) + 6.89771793299e‐05*D(EEA(‐1)) + 2.41850846622e‐
05*@TREND
Eqn 411: D(XREVSER2_PAC/REVSER2_SUM) = 0.00118672929992 ‐ 0.00127531267811 +
0.150925413618*((@MEAN(XREVSER2_PAC/REVSER2_SUM,"1980 2008")‐(XREVSER2_PAC(‐1)/REVSER2_SUM(‐
1)))) ‐ 0.0108532181943*D(XREVSER2_PAC(‐1)/REVSER2_SUM(‐1)) + 0.00121487994277*D(GSPR_PAC/NP_PAC)
‐ 0.000313877646792*D(RMPRIME‐@PCA(CPI_PAC)) ‐ 0.000386385217043*D(RWNM_PAC(‐1)/JPGDP(‐1)) +
6.89771793299e‐05*D(EEA(‐1)) + 2.41850846622e‐05*@TREND
Eqn 412: D(XREVSER2_SATL/REVSER2_SUM) = 0.00126224348959 ‐ 0.00127531267811 +
0.150925413618*((@MEAN(XREVSER2_SATL/REVSER2_SUM,"1980 2008")‐(XREVSER2_SATL(‐
1)/REVSER2_SUM(‐1)))) ‐ 0.0108532181943*D(XREVSER2_SATL(‐1)/REVSER2_SUM(‐1)) +
0.00121487994277*D(GSPR_SATL/NP_SATL) ‐ 0.000313877646792*D(RMPRIME‐@PCA(CPI_SATL)) ‐
0.000386385217043*D(RWNM_SATL(‐1)/JPGDP(‐1)) + 6.89771793299e‐05*D(EEA(‐1)) + 2.41850846622e‐
05*@TREND
Eqn 413: D(XREVSER2_WNC/REVSER2_SUM) = ‐0.000346460647728 ‐ 0.00127531267811 +
0.150925413618*((@MEAN(XREVSER2_WNC/REVSER2_SUM,"1980 2008")‐(XREVSER2_WNC(‐
1)/REVSER2_SUM(‐1)))) ‐ 0.0108532181943*D(XREVSER2_WNC(‐1)/REVSER2_SUM(‐1)) +
0.00121487994277*D(GSPR_WNC/NP_WNC) ‐ 0.000313877646792*D(RMPRIME‐@PCA(CPI_WNC)) ‐
0.000386385217043*D(RWNM_WNC(‐1)/JPGDP(‐1)) + 6.89771793299e‐05*D(EEA(‐1)) + 2.41850846622e‐
05*@TREND
Eqn 414: D(XREVSER2_WSC/REVSER2_SUM) = 0.00153959143354 ‐ 0.00127531267811 +
0.150925413618*((@MEAN(XREVSER2_WSC/REVSER2_SUM,"1980 2008")‐(XREVSER2_WSC(‐
1)/REVSER2_SUM(‐1)))) ‐ 0.0108532181943*D(XREVSER2_WSC(‐1)/REVSER2_SUM(‐1)) +
0.00121487994277*D(GSPR_WSC/NP_WSC) ‐ 0.000313877646792*D(RMPRIME‐@PCA(CPI_WSC)) ‐
0.000386385217043*D(RWNM_WSC(‐1)/JPGDP(‐1)) + 6.89771793299e‐05*D(EEA(‐1)) + 2.41850846622e‐
05*@TREND
May 2014
U.S. Energy Information Administration | NEMS Macroeconomic Activity Module Documentation Report 207
SER3 ‐ Electric power generation & distribution
Eqn 415: D(XREVSER3_ENC/REVSER3_SUM) = ‐0.00112028453739 ‐ 0.000940375308014 +
0.182649152006*((@MEAN(XREVSER3_ENC/REVSER3_SUM,"1980 2008")‐(XREVSER3_ENC(‐1)/REVSER3_SUM(‐
1)))) ‐ 0.0452317676005*D(XREVSER3_ENC(‐1)/REVSER3_SUM(‐1)) + 0.0006289066528*D(GSPR_ENC/NP_ENC) ‐
0.000286370353416*D(RMPRIME(‐1)‐@PCA(CPI_ENC(‐1))) ‐ 0.000609424268997*D(RWNM_ENC(‐1)/JPGDP(‐1))
+ 0.000145836625441*D(EEA(‐1)) + 0.00048269936537*D(WPI05_ENC/JPGDP) + 3.06171546261e‐05*@TREND
Eqn 416: D(XREVSER3_ESC/REVSER3_SUM) = 0.000413779434267 ‐ 0.000940375308014 +
0.182649152006*((@MEAN(XREVSER3_ESC/REVSER3_SUM,"1980 2008")‐(XREVSER3_ESC(‐1)/REVSER3_SUM(‐
1)))) ‐ 0.0452317676005*D(XREVSER3_ESC(‐1)/REVSER3_SUM(‐1)) + 0.0006289066528*D(GSPR_ESC/NP_ESC) ‐
0.000286370353416*D(RMPRIME(‐1)‐@PCA(CPI_ESC(‐1))) ‐ 0.000609424268997*D(RWNM_ESC(‐1)/JPGDP(‐1))
+ 0.000145836625441*D(EEA(‐1)) + 0.00048269936537*D(WPI05_ESC/JPGDP) + 3.06171546261e‐05*@TREND
Eqn 417: D(XREVSER3_MATL/REVSER3_SUM) = ‐0.00188594648751 ‐ 0.000940375308014 +
0.182649152006*((@MEAN(XREVSER3_MATL/REVSER3_SUM,"1980 2008")‐(XREVSER3_MATL(‐
1)/REVSER3_SUM(‐1)))) ‐ 0.0452317676005*D(XREVSER3_MATL(‐1)/REVSER3_SUM(‐1)) +
0.0006289066528*D(GSPR_MATL/NP_MATL) ‐ 0.000286370353416*D(RMPRIME(‐1)‐@PCA(CPI_MATL(‐1))) ‐
0.000609424268997*D(RWNM_MATL(‐1)/JPGDP(‐1)) + 0.000145836625441*D(EEA(‐1)) +
0.00048269936537*D(WPI05_MATL/JPGDP) + 3.06171546261e‐05*@TREND
Eqn 418: D(XREVSER3_MTN/REVSER3_SUM) = 0.000516500959203 ‐ 0.000940375308014 +
0.182649152006*((@MEAN(XREVSER3_MTN/REVSER3_SUM,"1980 2008")‐(XREVSER3_MTN(‐
1)/REVSER3_SUM(‐1)))) ‐ 0.0452317676005*D(XREVSER3_MTN(‐1)/REVSER3_SUM(‐1)) +
0.0006289066528*D(GSPR_MTN/NP_MTN) ‐ 0.000286370353416*D(RMPRIME(‐1)‐@PCA(CPI_MTN(‐1))) ‐
0.000609424268997*D(RWNM_MTN(‐1)/JPGDP(‐1)) + 0.000145836625441*D(EEA(‐1)) +
0.00048269936537*D(WPI05_MTN/JPGDP) + 3.06171546261e‐05*@TREND
Eqn 419: D(XREVSER3_NENG/REVSER3_SUM) = 1.28144366606e‐05 ‐ 0.000940375308014 +
0.182649152006*((@MEAN(XREVSER3_NENG/REVSER3_SUM,"1980 2008")‐(XREVSER3_NENG(‐
1)/REVSER3_SUM(‐1)))) ‐ 0.0452317676005*D(XREVSER3_NENG(‐1)/REVSER3_SUM(‐1)) +
0.0006289066528*D(GSPR_NENG/NP_NENG) ‐ 0.000286370353416*D(RMPRIME(‐1)‐@PCA(CPI_NENG(‐1))) ‐
0.000609424268997*D(RWNM_NENG(‐1)/JPGDP(‐1)) + 0.000145836625441*D(EEA(‐1)) +
0.00048269936537*D(WPI05_NENG/JPGDP) + 3.06171546261e‐05*@TREND
Eqn 420: D(XREVSER3_PAC/REVSER3_SUM) = ‐0.000162295955676 ‐ 0.000940375308014 +
0.182649152006*((@MEAN(XREVSER3_PAC/REVSER3_SUM,"1980 2008")‐(XREVSER3_PAC(‐1)/REVSER3_SUM(‐
1)))) ‐ 0.0452317676005*D(XREVSER3_PAC(‐1)/REVSER3_SUM(‐1)) + 0.0006289066528*D(GSPR_PAC/NP_PAC) ‐
0.000286370353416*D(RMPRIME(‐1)‐@PCA(CPI_PAC(‐1))) ‐ 0.000609424268997*D(RWNM_PAC(‐1)/JPGDP(‐1))
+ 0.000145836625441*D(EEA(‐1)) + 0.00048269936537*D(WPI05_PAC/JPGDP) + 3.06171546261e‐05*@TREND
Eqn 421: D(XREVSER3_SATL/REVSER3_SUM) = 0.000993590339467 ‐ 0.000940375308014 +
0.182649152006*((@MEAN(XREVSER3_SATL/REVSER3_SUM,"1980 2008")‐(XREVSER3_SATL(‐
1)/REVSER3_SUM(‐1)))) ‐ 0.0452317676005*D(XREVSER3_SATL(‐1)/REVSER3_SUM(‐1)) +
0.0006289066528*D(GSPR_SATL/NP_SATL) ‐ 0.000286370353416*D(RMPRIME(‐1)‐@PCA(CPI_SATL(‐1))) ‐
May 2014
U.S. Energy Information Administration | NEMS Macroeconomic Activity Module Documentation Report 208
0.000609424268997*D(RWNM_SATL(‐1)/JPGDP(‐1)) + 0.000145836625441*D(EEA(‐1)) +
0.00048269936537*D(WPI05_SATL/JPGDP) + 3.06171546261e‐05*@TREND
Eqn 422: D(XREVSER3_WNC/REVSER3_SUM) = ‐0.000130419486189 ‐ 0.000940375308014 +
0.182649152006*((@MEAN(XREVSER3_WNC/REVSER3_SUM,"1980 2008")‐(XREVSER3_WNC(‐
1)/REVSER3_SUM(‐1)))) ‐ 0.0452317676005*D(XREVSER3_WNC(‐1)/REVSER3_SUM(‐1)) +
0.0006289066528*D(GSPR_WNC/NP_WNC) ‐ 0.000286370353416*D(RMPRIME(‐1)‐@PCA(CPI_WNC(‐1))) ‐
0.000609424268997*D(RWNM_WNC(‐1)/JPGDP(‐1)) + 0.000145836625441*D(EEA(‐1)) +
0.00048269936537*D(WPI05_WNC/JPGDP) + 3.06171546261e‐05*@TREND
Eqn 423: D(XREVSER3_WSC/REVSER3_SUM) = 0.00136226129717 ‐ 0.000940375308014 +
0.182649152006*((@MEAN(XREVSER3_WSC/REVSER3_SUM,"1980 2008")‐(XREVSER3_WSC(‐
1)/REVSER3_SUM(‐1)))) ‐ 0.0452317676005*D(XREVSER3_WSC(‐1)/REVSER3_SUM(‐1)) +
0.0006289066528*D(GSPR_WSC/NP_WSC) ‐ 0.000286370353416*D(RMPRIME(‐1)‐@PCA(CPI_WSC(‐1))) ‐
0.000609424268997*D(RWNM_WSC(‐1)/JPGDP(‐1)) + 0.000145836625441*D(EEA(‐1)) +
0.00048269936537*D(WPI05_WSC/JPGDP) + 3.06171546261e‐05*@TREND
SER4 ‐ Natural gas distribution
Eqn 424: D(XREVSER4_ENC/REVSER4_SUM) = ‐0.00179194456629 ‐ 0.000804751201163 +
0.366890416548*((@MEAN(XREVSER4_ENC/REVSER4_SUM,"1980 2008")‐(XREVSER4_ENC(‐1)/REVSER4_SUM(‐
1)))) + 0.164510037556*D(XREVSER4_ENC(‐1)/REVSER4_SUM(‐1)) ‐ 0.000468371433749*D(RMPRIME(‐1)‐
@PCA(CPI_ENC(‐1))) + 0.000183070584545*D(EEA(‐1)) ‐ 0.000602180741314*D(WPI05_ENC(‐1)/JPGDP(‐1)) +
2.68514824841e‐05*@TREND
Eqn 425: D(XREVSER4_ESC/REVSER4_SUM) = ‐0.000135205328971 ‐ 0.000804751201163 +
0.366890416548*((@MEAN(XREVSER4_ESC/REVSER4_SUM,"1980 2008")‐(XREVSER4_ESC(‐1)/REVSER4_SUM(‐
1)))) + 0.164510037556*D(XREVSER4_ESC(‐1)/REVSER4_SUM(‐1)) ‐ 0.000468371433749*D(RMPRIME(‐1)‐
@PCA(CPI_ESC(‐1))) + 0.000183070584545*D(EEA(‐1)) ‐ 0.000602180741314*D(WPI05_ESC(‐1)/JPGDP(‐1)) +
2.68514824841e‐05*@TREND
Eqn 426: D(XREVSER4_MATL/REVSER4_SUM) = ‐0.00165174507021 ‐ 0.000804751201163 +
0.366890416548*((@MEAN(XREVSER4_MATL/REVSER4_SUM,"1980 2008")‐(XREVSER4_MATL(‐
1)/REVSER4_SUM(‐1)))) + 0.164510037556*D(XREVSER4_MATL(‐1)/REVSER4_SUM(‐1)) ‐
0.000468371433749*D(RMPRIME(‐1)‐@PCA(CPI_MATL(‐1))) + 0.000183070584545*D(EEA(‐1)) ‐
0.000602180741314*D(WPI05_MATL(‐1)/JPGDP(‐1)) + 2.68514824841e‐05*@TREND
Eqn 427: D(XREVSER4_MTN/REVSER4_SUM) = 0.00170248570657 ‐ 0.000804751201163 +
0.366890416548*((@MEAN(XREVSER4_MTN/REVSER4_SUM,"1980 2008")‐(XREVSER4_MTN(‐
1)/REVSER4_SUM(‐1)))) + 0.164510037556*D(XREVSER4_MTN(‐1)/REVSER4_SUM(‐1)) ‐
0.000468371433749*D(RMPRIME(‐1)‐@PCA(CPI_MTN(‐1))) + 0.000183070584545*D(EEA(‐1)) ‐
0.000602180741314*D(WPI05_MTN(‐1)/JPGDP(‐1)) + 2.68514824841e‐05*@TREND
Eqn 428: D(XREVSER4_NENG/REVSER4_SUM) = 0.000624033342274 ‐ 0.000804751201163 +
0.366890416548*((@MEAN(XREVSER4_NENG/REVSER4_SUM,"1980 2008")‐(XREVSER4_NENG(‐
May 2014
U.S. Energy Information Administration | NEMS Macroeconomic Activity Module Documentation Report 209
1)/REVSER4_SUM(‐1)))) + 0.164510037556*D(XREVSER4_NENG(‐1)/REVSER4_SUM(‐1)) ‐
0.000468371433749*D(RMPRIME(‐1)‐@PCA(CPI_NENG(‐1))) + 0.000183070584545*D(EEA(‐1)) ‐
0.000602180741314*D(WPI05_NENG(‐1)/JPGDP(‐1)) + 2.68514824841e‐05*@TREND
Eqn 429: D(XREVSER4_PAC/REVSER4_SUM) = 0.000466287085129 ‐ 0.000804751201163 +
0.366890416548*((@MEAN(XREVSER4_PAC/REVSER4_SUM,"1980 2008")‐(XREVSER4_PAC(‐1)/REVSER4_SUM(‐
1)))) + 0.164510037556*D(XREVSER4_PAC(‐1)/REVSER4_SUM(‐1)) ‐ 0.000468371433749*D(RMPRIME(‐1)‐
@PCA(CPI_PAC(‐1))) + 0.000183070584545*D(EEA(‐1)) ‐ 0.000602180741314*D(WPI05_PAC(‐1)/JPGDP(‐1)) +
2.68514824841e‐05*@TREND
Eqn 430: D(XREVSER4_SATL/REVSER4_SUM) = 0.00111391529051 ‐ 0.000804751201163 +
0.366890416548*((@MEAN(XREVSER4_SATL/REVSER4_SUM,"1980 2008")‐(XREVSER4_SATL(‐
1)/REVSER4_SUM(‐1)))) + 0.164510037556*D(XREVSER4_SATL(‐1)/REVSER4_SUM(‐1)) ‐
0.000468371433749*D(RMPRIME(‐1)‐@PCA(CPI_SATL(‐1))) + 0.000183070584545*D(EEA(‐1)) ‐
0.000602180741314*D(WPI05_SATL(‐1)/JPGDP(‐1)) + 2.68514824841e‐05*@TREND
Eqn 431: D(XREVSER4_WNC/REVSER4_SUM) = ‐0.00135438086334 ‐ 0.000804751201163 +
0.366890416548*((@MEAN(XREVSER4_WNC/REVSER4_SUM,"1980 2008")‐(XREVSER4_WNC(‐
1)/REVSER4_SUM(‐1)))) + 0.164510037556*D(XREVSER4_WNC(‐1)/REVSER4_SUM(‐1)) ‐
0.000468371433749*D(RMPRIME(‐1)‐@PCA(CPI_WNC(‐1))) + 0.000183070584545*D(EEA(‐1)) ‐
0.000602180741314*D(WPI05_WNC(‐1)/JPGDP(‐1)) + 2.68514824841e‐05*@TREND
Eqn 432: D(XREVSER4_WSC/REVSER4_SUM) = 0.00102655440434 ‐ 0.000804751201163 +
0.366890416548*((@MEAN(XREVSER4_WSC/REVSER4_SUM,"1980 2008")‐(XREVSER4_WSC(‐
1)/REVSER4_SUM(‐1)))) + 0.164510037556*D(XREVSER4_WSC(‐1)/REVSER4_SUM(‐1)) ‐
0.000468371433749*D(RMPRIME(‐1)‐@PCA(CPI_WSC(‐1))) + 0.000183070584545*D(EEA(‐1)) ‐
0.000602180741314*D(WPI05_WSC(‐1)/JPGDP(‐1)) + 2.68514824841e‐05*@TREND
SER5 ‐ Water, sewage & related systems
Eqn 433: D(XREVSER5_ENC/REVSER5_SUM) = ‐0.000427631678883 ‐ 0.000731109541024 +
0.376899096239*((@MEAN(XREVSER5_ENC/REVSER5_SUM,"1980 2008")‐(XREVSER5_ENC(‐1)/REVSER5_SUM(‐
1)))) + 0.152863351585*D(XREVSER5_ENC(‐1)/REVSER5_SUM(‐1)) +
0.000414347702436*D(GSPR_ENC/NP_ENC) ‐ 0.000203165009092*D(RMPRIME(‐1)‐@PCA(CPI_ENC(‐1))) ‐
0.000471708316739*D(RWNM_ENC(‐1)/JPGDP(‐1)) + 0.000124525990941*D(EEA(‐1)) + 7.45535475481e‐
05*D(WPI05_ENC/JPGDP) + 2.62062312104e‐05*@TREND
Eqn 434: D(XREVSER5_ESC/REVSER5_SUM) = 0.0001791021097 ‐ 0.000731109541024 +
0.376899096239*((@MEAN(XREVSER5_ESC/REVSER5_SUM,"1980 2008")‐(XREVSER5_ESC(‐1)/REVSER5_SUM(‐
1)))) + 0.152863351585*D(XREVSER5_ESC(‐1)/REVSER5_SUM(‐1)) + 0.000414347702436*D(GSPR_ESC/NP_ESC)
‐ 0.000203165009092*D(RMPRIME(‐1)‐@PCA(CPI_ESC(‐1))) ‐ 0.000471708316739*D(RWNM_ESC(‐1)/JPGDP(‐1))
+ 0.000124525990941*D(EEA(‐1)) + 7.45535475481e‐05*D(WPI05_ESC/JPGDP) + 2.62062312104e‐05*@TREND
Eqn 435: D(XREVSER5_MATL/REVSER5_SUM) = ‐0.00141470256694 ‐ 0.000731109541024 +
0.376899096239*((@MEAN(XREVSER5_MATL/REVSER5_SUM,"1980 2008")‐(XREVSER5_MATL(‐
May 2014
U.S. Energy Information Administration | NEMS Macroeconomic Activity Module Documentation Report 210
1)/REVSER5_SUM(‐1)))) + 0.152863351585*D(XREVSER5_MATL(‐1)/REVSER5_SUM(‐1)) +
0.000414347702436*D(GSPR_MATL/NP_MATL) ‐ 0.000203165009092*D(RMPRIME(‐1)‐@PCA(CPI_MATL(‐1))) ‐
0.000471708316739*D(RWNM_MATL(‐1)/JPGDP(‐1)) + 0.000124525990941*D(EEA(‐1)) + 7.45535475481e‐
05*D(WPI05_MATL/JPGDP) + 2.62062312104e‐05*@TREND
Eqn 436: D(XREVSER5_MTN/REVSER5_SUM) = 0.000588894844402 ‐ 0.000731109541024 +
0.376899096239*((@MEAN(XREVSER5_MTN/REVSER5_SUM,"1980 2008")‐(XREVSER5_MTN(‐
1)/REVSER5_SUM(‐1)))) + 0.152863351585*D(XREVSER5_MTN(‐1)/REVSER5_SUM(‐1)) +
0.000414347702436*D(GSPR_MTN/NP_MTN) ‐ 0.000203165009092*D(RMPRIME(‐1)‐@PCA(CPI_MTN(‐1))) ‐
0.000471708316739*D(RWNM_MTN(‐1)/JPGDP(‐1)) + 0.000124525990941*D(EEA(‐1)) + 7.45535475481e‐
05*D(WPI05_MTN/JPGDP) + 2.62062312104e‐05*@TREND
Eqn 437: D(XREVSER5_NENG/REVSER5_SUM) = ‐0.000837084769969 ‐ 0.000731109541024 +
0.376899096239*((@MEAN(XREVSER5_NENG/REVSER5_SUM,"1980 2008")‐(XREVSER5_NENG(‐
1)/REVSER5_SUM(‐1)))) + 0.152863351585*D(XREVSER5_NENG(‐1)/REVSER5_SUM(‐1)) +
0.000414347702436*D(GSPR_NENG/NP_NENG) ‐ 0.000203165009092*D(RMPRIME(‐1)‐@PCA(CPI_NENG(‐1))) ‐
0.000471708316739*D(RWNM_NENG(‐1)/JPGDP(‐1)) + 0.000124525990941*D(EEA(‐1)) + 7.45535475481e‐
05*D(WPI05_NENG/JPGDP) + 2.62062312104e‐05*@TREND
Eqn 438: D(XREVSER5_PAC/REVSER5_SUM) = ‐0.0026156711351 ‐ 0.000731109541024 +
0.376899096239*((@MEAN(XREVSER5_PAC/REVSER5_SUM,"1980 2008")‐(XREVSER5_PAC(‐1)/REVSER5_SUM(‐
1)))) + 0.152863351585*D(XREVSER5_PAC(‐1)/REVSER5_SUM(‐1)) + 0.000414347702436*D(GSPR_PAC/NP_PAC)
‐ 0.000203165009092*D(RMPRIME(‐1)‐@PCA(CPI_PAC(‐1))) ‐ 0.000471708316739*D(RWNM_PAC(‐1)/JPGDP(‐
1)) + 0.000124525990941*D(EEA(‐1)) + 7.45535475481e‐05*D(WPI05_PAC/JPGDP) + 2.62062312104e‐
05*@TREND
Eqn 439: D(XREVSER5_SATL/REVSER5_SUM) = 0.000977748050322 ‐ 0.000731109541024 +
0.376899096239*((@MEAN(XREVSER5_SATL/REVSER5_SUM,"1980 2008")‐(XREVSER5_SATL(‐
1)/REVSER5_SUM(‐1)))) + 0.152863351585*D(XREVSER5_SATL(‐1)/REVSER5_SUM(‐1)) +
0.000414347702436*D(GSPR_SATL/NP_SATL) ‐ 0.000203165009092*D(RMPRIME(‐1)‐@PCA(CPI_SATL(‐1))) ‐
0.000471708316739*D(RWNM_SATL(‐1)/JPGDP(‐1)) + 0.000124525990941*D(EEA(‐1)) + 7.45535475481e‐
05*D(WPI05_SATL/JPGDP) + 2.62062312104e‐05*@TREND
Eqn 440: D(XREVSER5_WNC/REVSER5_SUM) = ‐0.000240473523891 ‐ 0.000731109541024 +
0.376899096239*((@MEAN(XREVSER5_WNC/REVSER5_SUM,"1980 2008")‐(XREVSER5_WNC(‐
1)/REVSER5_SUM(‐1)))) + 0.152863351585*D(XREVSER5_WNC(‐1)/REVSER5_SUM(‐1)) +
0.000414347702436*D(GSPR_WNC/NP_WNC) ‐ 0.000203165009092*D(RMPRIME(‐1)‐@PCA(CPI_WNC(‐1))) ‐
0.000471708316739*D(RWNM_WNC(‐1)/JPGDP(‐1)) + 0.000124525990941*D(EEA(‐1)) + 7.45535475481e‐
05*D(WPI05_WNC/JPGDP) + 2.62062312104e‐05*@TREND
Eqn 441: D(XREVSER5_WSC/REVSER5_SUM) = 0.00378981867036 ‐ 0.000731109541024 +
0.376899096239*((@MEAN(XREVSER5_WSC/REVSER5_SUM,"1980 2008")‐(XREVSER5_WSC(‐
1)/REVSER5_SUM(‐1)))) + 0.152863351585*D(XREVSER5_WSC(‐1)/REVSER5_SUM(‐1)) +
0.000414347702436*D(GSPR_WSC/NP_WSC) ‐ 0.000203165009092*D(RMPRIME(‐1)‐@PCA(CPI_WSC(‐1))) ‐
May 2014
U.S. Energy Information Administration | NEMS Macroeconomic Activity Module Documentation Report 211
0.000471708316739*D(RWNM_WSC(‐1)/JPGDP(‐1)) + 0.000124525990941*D(EEA(‐1)) + 7.45535475481e‐
05*D(WPI05_WSC/JPGDP) + 2.62062312104e‐05*@TREND
SER6 ‐ Wholesale trade
Eqn 442: D(XREVSER6_ENC/REVSER6_SUM) = ‐0.00161196807814 ‐ 0.000249121882469 +
0.0785978562074*((@MEAN(XREVSER6_ENC/REVSER6_SUM,"1980 2008")‐(XREVSER6_ENC(‐
1)/REVSER6_SUM(‐1)))) + 0.000349273482735*D(GSPR_ENC(‐1)/NP_ENC(‐1)) ‐ 1.13098074725e‐
05*D(RMPRIME‐@PCA(CPI_ENC))
Eqn 443: D(XREVSER6_ESC/REVSER6_SUM) = 0.00021667035002 ‐ 0.000249121882469 +
0.0785978562074*((@MEAN(XREVSER6_ESC/REVSER6_SUM,"1980 2008")‐(XREVSER6_ESC(‐1)/REVSER6_SUM(‐
1)))) + 0.000349273482735*D(GSPR_ESC(‐1)/NP_ESC(‐1)) ‐ 1.13098074725e‐05*D(RMPRIME‐@PCA(CPI_ESC))
Eqn 444: D(XREVSER6_MATL/REVSER6_SUM) = ‐0.00155199212979 ‐ 0.000249121882469 +
0.0785978562074*((@MEAN(XREVSER6_MATL/REVSER6_SUM,"1980 2008")‐(XREVSER6_MATL(‐
1)/REVSER6_SUM(‐1)))) + 0.000349273482735*D(GSPR_MATL(‐1)/NP_MATL(‐1)) ‐ 1.13098074725e‐
05*D(RMPRIME‐@PCA(CPI_MATL))
Eqn 445: D(XREVSER6_MTN/REVSER6_SUM) = 0.000646507914307 ‐ 0.000249121882469 +
0.0785978562074*((@MEAN(XREVSER6_MTN/REVSER6_SUM,"1980 2008")‐(XREVSER6_MTN(‐
1)/REVSER6_SUM(‐1)))) + 0.000349273482735*D(GSPR_MTN(‐1)/NP_MTN(‐1)) ‐ 1.13098074725e‐
05*D(RMPRIME‐@PCA(CPI_MTN))
Eqn 446: D(XREVSER6_NENG/REVSER6_SUM) = ‐0.000123859286717 ‐ 0.000249121882469 +
0.0785978562074*((@MEAN(XREVSER6_NENG/REVSER6_SUM,"1980 2008")‐(XREVSER6_NENG(‐
1)/REVSER6_SUM(‐1)))) + 0.000349273482735*D(GSPR_NENG(‐1)/NP_NENG(‐1)) ‐ 1.13098074725e‐
05*D(RMPRIME‐@PCA(CPI_NENG))
Eqn 447: D(XREVSER6_PAC/REVSER6_SUM) = 0.000110382004137 ‐ 0.000249121882469 +
0.0785978562074*((@MEAN(XREVSER6_PAC/REVSER6_SUM,"1980 2008")‐(XREVSER6_PAC(‐
1)/REVSER6_SUM(‐1)))) + 0.000349273482735*D(GSPR_PAC(‐1)/NP_PAC(‐1)) ‐ 1.13098074725e‐
05*D(RMPRIME‐@PCA(CPI_PAC))
Eqn 448: D(XREVSER6_SATL/REVSER6_SUM) = 0.000887756654055 ‐ 0.000249121882469 +
0.0785978562074*((@MEAN(XREVSER6_SATL/REVSER6_SUM,"1980 2008")‐(XREVSER6_SATL(‐
1)/REVSER6_SUM(‐1)))) + 0.000349273482735*D(GSPR_SATL(‐1)/NP_SATL(‐1)) ‐ 1.13098074725e‐
05*D(RMPRIME‐@PCA(CPI_SATL))
Eqn 449: D(XREVSER6_WNC/REVSER6_SUM) = ‐9.35159752903e‐05 ‐ 0.000249121882469 +
0.0785978562074*((@MEAN(XREVSER6_WNC/REVSER6_SUM,"1980 2008")‐(XREVSER6_WNC(‐
1)/REVSER6_SUM(‐1)))) + 0.000349273482735*D(GSPR_WNC(‐1)/NP_WNC(‐1)) ‐ 1.13098074725e‐
05*D(RMPRIME‐@PCA(CPI_WNC))
Eqn 450: D(XREVSER6_WSC/REVSER6_SUM) = 0.00152001854742 ‐ 0.000249121882469 +
0.0785978562074*((@MEAN(XREVSER6_WSC/REVSER6_SUM,"1980 2008")‐(XREVSER6_WSC(‐
May 2014
U.S. Energy Information Administration | NEMS Macroeconomic Activity Module Documentation Report 212
1)/REVSER6_SUM(‐1)))) + 0.000349273482735*D(GSPR_WSC(‐1)/NP_WSC(‐1)) ‐ 1.13098074725e‐
05*D(RMPRIME‐@PCA(CPI_WSC))
SER7 ‐ Retail trade
Eqn 451: D(XREVSER7_ENC/REVSER7_SUM) = ‐0.000785792232488 ‐ 7.48135474618e‐05 +
0.121077343189*((@MEAN(XREVSER7_ENC/REVSER7_SUM,"1980 2008")‐(XREVSER7_ENC(‐1)/REVSER7_SUM(‐
1)))) + 0.400425227891*D(XREVSER7_ENC(‐1)/REVSER7_SUM(‐1)) + 0.000155797728793*D(GSPR_ENC(‐
1)/NP_ENC(‐1)) ‐ 3.82493277982e‐05*D(RMPRIME(‐1)‐@PCA(CPI_ENC(‐1))) ‐ 1.70609762411e‐06*@TREND
Eqn 452: D(XREVSER7_ESC/REVSER7_SUM) = 0.000207673164553 ‐ 7.48135474618e‐05 +
0.121077343189*((@MEAN(XREVSER7_ESC/REVSER7_SUM,"1980 2008")‐(XREVSER7_ESC(‐1)/REVSER7_SUM(‐
1)))) + 0.400425227891*D(XREVSER7_ESC(‐1)/REVSER7_SUM(‐1)) + 0.000155797728793*D(GSPR_ESC(‐
1)/NP_ESC(‐1)) ‐ 3.82493277982e‐05*D(RMPRIME(‐1)‐@PCA(CPI_ESC(‐1))) ‐ 1.70609762411e‐06*@TREND
Eqn 453: D(XREVSER7_MATL/REVSER7_SUM) = ‐0.000727650651773 ‐ 7.48135474618e‐05 + 0.121077343189*((@MEAN(XREVSER7_MATL/REVSER7_SUM,"1980 2008")‐(XREVSER7_MATL(‐1)/REVSER7_SUM(‐1)))) + 0.400425227891*D(XREVSER7_MATL(‐1)/REVSER7_SUM(‐1)) + 0.000155797728793*D(GSPR_MATL(‐1)/NP_MATL(‐1)) ‐ 3.82493277982e‐05*D(RMPRIME(‐1)‐@PCA(CPI_MATL(‐1))) ‐ 1.70609762411e‐06*@TREND
Eqn 454: D(XREVSER7_MTN/REVSER7_SUM) = 0.000776259717459 ‐ 7.48135474618e‐05 +
0.121077343189*((@MEAN(XREVSER7_MTN/REVSER7_SUM,"1980 2008")‐(XREVSER7_MTN(‐
1)/REVSER7_SUM(‐1)))) + 0.400425227891*D(XREVSER7_MTN(‐1)/REVSER7_SUM(‐1)) +
0.000155797728793*D(GSPR_MTN(‐1)/NP_MTN(‐1)) ‐ 3.82493277982e‐05*D(RMPRIME(‐1)‐@PCA(CPI_MTN(‐
1))) ‐ 1.70609762411e‐06*@TREND
Eqn 455: D(XREVSER7_NENG/REVSER7_SUM) = ‐0.000239249008469 ‐ 7.48135474618e‐05 +
0.121077343189*((@MEAN(XREVSER7_NENG/REVSER7_SUM,"1980 2008")‐(XREVSER7_NENG(‐
1)/REVSER7_SUM(‐1)))) + 0.400425227891*D(XREVSER7_NENG(‐1)/REVSER7_SUM(‐1)) +
0.000155797728793*D(GSPR_NENG(‐1)/NP_NENG(‐1)) ‐ 3.82493277982e‐05*D(RMPRIME(‐1)‐
@PCA(CPI_NENG(‐1))) ‐ 1.70609762411e‐06*@TREND
Eqn 456: D(XREVSER7_PAC/REVSER7_SUM) = ‐0.00013187127596 ‐ 7.48135474618e‐05 +
0.121077343189*((@MEAN(XREVSER7_PAC/REVSER7_SUM,"1980 2008")‐(XREVSER7_PAC(‐1)/REVSER7_SUM(‐
1)))) + 0.400425227891*D(XREVSER7_PAC(‐1)/REVSER7_SUM(‐1)) + 0.000155797728793*D(GSPR_PAC(‐
1)/NP_PAC(‐1)) ‐ 3.82493277982e‐05*D(RMPRIME(‐1)‐@PCA(CPI_PAC(‐1))) ‐ 1.70609762411e‐06*@TREND
Eqn 457: D(XREVSER7_SATL/REVSER7_SUM) = 0.000470291272334 ‐ 7.48135474618e‐05 +
0.121077343189*((@MEAN(XREVSER7_SATL/REVSER7_SUM,"1980 2008")‐(XREVSER7_SATL(‐
1)/REVSER7_SUM(‐1)))) + 0.400425227891*D(XREVSER7_SATL(‐1)/REVSER7_SUM(‐1)) +
0.000155797728793*D(GSPR_SATL(‐1)/NP_SATL(‐1)) ‐ 3.82493277982e‐05*D(RMPRIME(‐1)‐@PCA(CPI_SATL(‐
1))) ‐ 1.70609762411e‐06*@TREND
Eqn 458: D(XREVSER7_WNC/REVSER7_SUM) = ‐1.40916529344e‐05 ‐ 7.48135474618e‐05 +
0.121077343189*((@MEAN(XREVSER7_WNC/REVSER7_SUM,"1980 2008")‐(XREVSER7_WNC(‐
May 2014
U.S. Energy Information Administration | NEMS Macroeconomic Activity Module Documentation Report 213
1)/REVSER7_SUM(‐1)))) + 0.400425227891*D(XREVSER7_WNC(‐1)/REVSER7_SUM(‐1)) +
0.000155797728793*D(GSPR_WNC(‐1)/NP_WNC(‐1)) ‐ 3.82493277982e‐05*D(RMPRIME(‐1)‐@PCA(CPI_WNC(‐
1))) ‐ 1.70609762411e‐06*@TREND
Eqn 459: D(XREVSER7_WSC/REVSER7_SUM) = 0.000444430667278 ‐ 7.48135474618e‐05 +
0.121077343189*((@MEAN(XREVSER7_WSC/REVSER7_SUM,"1980 2008")‐(XREVSER7_WSC(‐
1)/REVSER7_SUM(‐1)))) + 0.400425227891*D(XREVSER7_WSC(‐1)/REVSER7_SUM(‐1)) +
0.000155797728793*D(GSPR_WSC(‐1)/NP_WSC(‐1)) ‐ 3.82493277982e‐05*D(RMPRIME(‐1)‐@PCA(CPI_WSC(‐
1))) ‐ 1.70609762411e‐06*@TREND
SER8 ‐ Finance & insurance, real estate
Eqn 460: D(XREVSER8_ENC/REVSER8_SUM) = ‐2.49324802174e‐05 + 0.000209747218414 +
0.262296647726*((@MEAN(XREVSER8_ENC/REVSER8_SUM,"1980 2008")‐(XREVSER8_ENC(‐1)/REVSER8_SUM(‐
1)))) + 0.313546253815*D(XREVSER8_ENC(‐1)/REVSER8_SUM(‐1)) ‐ 9.97480131073e‐05*D(GSPR_ENC(‐
1)/NP_ENC(‐1)) + 4.70944853863e‐06*D(RMPRIME‐@PCA(CPI_ENC)) ‐ 6.91706947201e‐06*@TREND
Eqn 461: D(XREVSER8_ESC/REVSER8_SUM) = ‐8.3680983303e‐05 + 0.000209747218414 +
0.262296647726*((@MEAN(XREVSER8_ESC/REVSER8_SUM,"1980 2008")‐(XREVSER8_ESC(‐1)/REVSER8_SUM(‐
1)))) + 0.313546253815*D(XREVSER8_ESC(‐1)/REVSER8_SUM(‐1)) ‐ 9.97480131073e‐05*D(GSPR_ESC(‐
1)/NP_ESC(‐1)) + 4.70944853863e‐06*D(RMPRIME‐@PCA(CPI_ESC)) ‐ 6.91706947201e‐06*@TREND
Eqn 462: D(XREVSER8_MATL/REVSER8_SUM) = 0.000719572614918 + 0.000209747218414 +
0.262296647726*((@MEAN(XREVSER8_MATL/REVSER8_SUM,"1980 2008")‐(XREVSER8_MATL(‐
1)/REVSER8_SUM(‐1)))) + 0.313546253815*D(XREVSER8_MATL(‐1)/REVSER8_SUM(‐1)) ‐ 9.97480131073e‐
05*D(GSPR_MATL(‐1)/NP_MATL(‐1)) + 4.70944853863e‐06*D(RMPRIME‐@PCA(CPI_MATL)) ‐ 6.91706947201e‐
06*@TREND
Eqn 463: D(XREVSER8_MTN/REVSER8_SUM) = 0.000564095048447 + 0.000209747218414 +
0.262296647726*((@MEAN(XREVSER8_MTN/REVSER8_SUM,"1980 2008")‐(XREVSER8_MTN(‐
1)/REVSER8_SUM(‐1)))) + 0.313546253815*D(XREVSER8_MTN(‐1)/REVSER8_SUM(‐1)) ‐ 9.97480131073e‐
05*D(GSPR_MTN(‐1)/NP_MTN(‐1)) + 4.70944853863e‐06*D(RMPRIME‐@PCA(CPI_MTN)) ‐ 6.91706947201e‐
06*@TREND
Eqn 464: D(XREVSER8_NENG/REVSER8_SUM) = 0.000329048821864 + 0.000209747218414 +
0.262296647726*((@MEAN(XREVSER8_NENG/REVSER8_SUM,"1980 2008")‐(XREVSER8_NENG(‐
1)/REVSER8_SUM(‐1)))) + 0.313546253815*D(XREVSER8_NENG(‐1)/REVSER8_SUM(‐1)) ‐ 9.97480131073e‐
05*D(GSPR_NENG(‐1)/NP_NENG(‐1)) + 4.70944853863e‐06*D(RMPRIME‐@PCA(CPI_NENG)) ‐ 6.91706947201e‐
06*@TREND
Eqn 465: D(XREVSER8_PAC/REVSER8_SUM) = ‐0.00152141522904 + 0.000209747218414 +
0.262296647726*((@MEAN(XREVSER8_PAC/REVSER8_SUM,"1980 2008")‐(XREVSER8_PAC(‐1)/REVSER8_SUM(‐
1)))) + 0.313546253815*D(XREVSER8_PAC(‐1)/REVSER8_SUM(‐1)) ‐ 9.97480131073e‐05*D(GSPR_PAC(‐
1)/NP_PAC(‐1)) + 4.70944853863e‐06*D(RMPRIME‐@PCA(CPI_PAC)) ‐ 6.91706947201e‐06*@TREND
May 2014
U.S. Energy Information Administration | NEMS Macroeconomic Activity Module Documentation Report 214
Eqn 466: D(XREVSER8_SATL/REVSER8_SUM) = ‐5.39319879865e‐05 + 0.000209747218414 +
0.262296647726*((@MEAN(XREVSER8_SATL/REVSER8_SUM,"1980 2008")‐(XREVSER8_SATL(‐
1)/REVSER8_SUM(‐1)))) + 0.313546253815*D(XREVSER8_SATL(‐1)/REVSER8_SUM(‐1)) ‐ 9.97480131073e‐
05*D(GSPR_SATL(‐1)/NP_SATL(‐1)) + 4.70944853863e‐06*D(RMPRIME‐@PCA(CPI_SATL)) ‐ 6.91706947201e‐
06*@TREND
Eqn 467: D(XREVSER8_WNC/REVSER8_SUM) = ‐4.68524640257e‐05 + 0.000209747218414 +
0.262296647726*((@MEAN(XREVSER8_WNC/REVSER8_SUM,"1980 2008")‐(XREVSER8_WNC(‐
1)/REVSER8_SUM(‐1)))) + 0.313546253815*D(XREVSER8_WNC(‐1)/REVSER8_SUM(‐1)) ‐ 9.97480131073e‐
05*D(GSPR_WNC(‐1)/NP_WNC(‐1)) + 4.70944853863e‐06*D(RMPRIME‐@PCA(CPI_WNC)) ‐ 6.91706947201e‐
06*@TREND
Eqn 468: D(XREVSER8_WSC/REVSER8_SUM) = 0.000118096659348 + 0.000209747218414 +
0.262296647726*((@MEAN(XREVSER8_WSC/REVSER8_SUM,"1980 2008")‐(XREVSER8_WSC(‐
1)/REVSER8_SUM(‐1)))) + 0.313546253815*D(XREVSER8_WSC(‐1)/REVSER8_SUM(‐1)) ‐ 9.97480131073e‐
05*D(GSPR_WSC(‐1)/NP_WSC(‐1)) + 4.70944853863e‐06*D(RMPRIME‐@PCA(CPI_WSC)) ‐ 6.91706947201e‐
06*@TREND
SER9 ‐ Other services
Eqn 469: D(XREVSER9_ENC/REVSER9_SUM) = ‐0.000373852575234 ‐ 7.52681135849e‐05 +
0.161044038522*((@MEAN(XREVSER9_ENC/REVSER9_SUM,"1980 2008")‐(XREVSER9_ENC(‐1)/REVSER9_SUM(‐
1)))) + 0.12842862627*D(XREVSER9_ENC(‐1)/REVSER9_SUM(‐1)) + 9.69057277439e‐05*D(GSPR_ENC(‐
1)/NP_ENC(‐1)) ‐ 4.214987283e‐05*D(RMPRIME(‐1)‐@PCA(CPI_ENC(‐1))) + 1.32865046849e‐
05*D(RWNM_ENC(‐1)/JPGDP(‐1))
Eqn 470: D(XREVSER9_ESC/REVSER9_SUM) = 2.22086968859e‐05 ‐ 7.52681135849e‐05 +
0.161044038522*((@MEAN(XREVSER9_ESC/REVSER9_SUM,"1980 2008")‐(XREVSER9_ESC(‐1)/REVSER9_SUM(‐
1)))) + 0.12842862627*D(XREVSER9_ESC(‐1)/REVSER9_SUM(‐1)) + 9.69057277439e‐05*D(GSPR_ESC(‐
1)/NP_ESC(‐1)) ‐ 4.214987283e‐05*D(RMPRIME(‐1)‐@PCA(CPI_ESC(‐1))) + 1.32865046849e‐05*D(RWNM_ESC(‐
1)/JPGDP(‐1))
Eqn 471: D(XREVSER9_MATL/REVSER9_SUM) = ‐0.00166494441864 ‐ 7.52681135849e‐05 +
0.161044038522*((@MEAN(XREVSER9_MATL/REVSER9_SUM,"1980 2008")‐(XREVSER9_MATL(‐
1)/REVSER9_SUM(‐1)))) + 0.12842862627*D(XREVSER9_MATL(‐1)/REVSER9_SUM(‐1)) + 9.69057277439e‐
05*D(GSPR_MATL(‐1)/NP_MATL(‐1)) ‐ 4.214987283e‐05*D(RMPRIME(‐1)‐@PCA(CPI_MATL(‐1))) +
1.32865046849e‐05*D(RWNM_MATL(‐1)/JPGDP(‐1))
Eqn 472: D(XREVSER9_MTN/REVSER9_SUM) = 0.000833521864331 ‐ 7.52681135849e‐05 +
0.161044038522*((@MEAN(XREVSER9_MTN/REVSER9_SUM,"1980 2008")‐(XREVSER9_MTN(‐
1)/REVSER9_SUM(‐1)))) + 0.12842862627*D(XREVSER9_MTN(‐1)/REVSER9_SUM(‐1)) + 9.69057277439e‐
05*D(GSPR_MTN(‐1)/NP_MTN(‐1)) ‐ 4.214987283e‐05*D(RMPRIME(‐1)‐@PCA(CPI_MTN(‐1))) +
1.32865046849e‐05*D(RWNM_MTN(‐1)/JPGDP(‐1))
May 2014
U.S. Energy Information Administration | NEMS Macroeconomic Activity Module Documentation Report 215
Eqn 473: D(XREVSER9_NENG/REVSER9_SUM) = ‐0.00011007715905 ‐ 7.52681135849e‐05 +
0.161044038522*((@MEAN(XREVSER9_NENG/REVSER9_SUM,"1980 2008")‐(XREVSER9_NENG(‐
1)/REVSER9_SUM(‐1)))) + 0.12842862627*D(XREVSER9_NENG(‐1)/REVSER9_SUM(‐1)) + 9.69057277439e‐
05*D(GSPR_NENG(‐1)/NP_NENG(‐1)) ‐ 4.214987283e‐05*D(RMPRIME(‐1)‐@PCA(CPI_NENG(‐1))) +
1.32865046849e‐05*D(RWNM_NENG(‐1)/JPGDP(‐1))
Eqn 474: D(XREVSER9_PAC/REVSER9_SUM) = ‐0.000728889588617 ‐ 7.52681135849e‐05 +
0.161044038522*((@MEAN(XREVSER9_PAC/REVSER9_SUM,"1980 2008")‐(XREVSER9_PAC(‐1)/REVSER9_SUM(‐
1)))) + 0.12842862627*D(XREVSER9_PAC(‐1)/REVSER9_SUM(‐1)) + 9.69057277439e‐05*D(GSPR_PAC(‐
1)/NP_PAC(‐1)) ‐ 4.214987283e‐05*D(RMPRIME(‐1)‐@PCA(CPI_PAC(‐1))) + 1.32865046849e‐05*D(RWNM_PAC(‐
1)/JPGDP(‐1))
Eqn 475: D(XREVSER9_SATL/REVSER9_SUM) = 0.00158200329855 ‐ 7.52681135849e‐05 +
0.161044038522*((@MEAN(XREVSER9_SATL/REVSER9_SUM,"1980 2008")‐(XREVSER9_SATL(‐
1)/REVSER9_SUM(‐1)))) + 0.12842862627*D(XREVSER9_SATL(‐1)/REVSER9_SUM(‐1)) + 9.69057277439e‐
05*D(GSPR_SATL(‐1)/NP_SATL(‐1)) ‐ 4.214987283e‐05*D(RMPRIME(‐1)‐@PCA(CPI_SATL(‐1))) +
1.32865046849e‐05*D(RWNM_SATL(‐1)/JPGDP(‐1))
Eqn 476: D(XREVSER9_WNC/REVSER9_SUM) = ‐4.93519822403e‐05 ‐ 7.52681135849e‐05 +
0.161044038522*((@MEAN(XREVSER9_WNC/REVSER9_SUM,"1980 2008")‐(XREVSER9_WNC(‐
1)/REVSER9_SUM(‐1)))) + 0.12842862627*D(XREVSER9_WNC(‐1)/REVSER9_SUM(‐1)) + 9.69057277439e‐
05*D(GSPR_WNC(‐1)/NP_WNC(‐1)) ‐ 4.214987283e‐05*D(RMPRIME(‐1)‐@PCA(CPI_WNC(‐1))) +
1.32865046849e‐05*D(RWNM_WNC(‐1)/JPGDP(‐1))
Eqn 477: D(XREVSER9_WSC/REVSER9_SUM) = 0.000489381864005 ‐ 7.52681135849e‐05 +
0.161044038522*((@MEAN(XREVSER9_WSC/REVSER9_SUM,"1980 2008")‐(XREVSER9_WSC(‐
1)/REVSER9_SUM(‐1)))) + 0.12842862627*D(XREVSER9_WSC(‐1)/REVSER9_SUM(‐1)) + 9.69057277439e‐
05*D(GSPR_WSC(‐1)/NP_WSC(‐1)) ‐ 4.214987283e‐05*D(RMPRIME(‐1)‐@PCA(CPI_WSC(‐1))) + 1.32865046849e‐
05*D(RWNM_WSC(‐1)/JPGDP(‐1))
SER10 ‐ Public administration
Eqn 478: D(XREVSER10_ENC/REVSER10_SUM) = ‐0.000731507697188 ‐ 0.000254087972578 +
0.000325206281558*D(GSPR_ENC(‐1)/NP_ENC(‐1)) + 3.91645238978e‐05*D(RWNM_ENC(‐1)/JPGDP(‐1))
Eqn 479: D(XREVSER10_ESC/REVSER10_SUM) = 4.32629643069e‐06 ‐ 0.000254087972578 +
0.000325206281558*D(GSPR_ESC(‐1)/NP_ESC(‐1)) + 3.91645238978e‐05*D(RWNM_ESC(‐1)/JPGDP(‐1))
Eqn 480: D(XREVSER10_MATL/REVSER10_SUM) = ‐0.000944837965542 ‐ 0.000254087972578 +
0.000325206281558*D(GSPR_MATL(‐1)/NP_MATL(‐1)) + 3.91645238978e‐05*D(RWNM_MATL(‐1)/JPGDP(‐1))
Eqn 481: D(XREVSER10_MTN/REVSER10_SUM) = 0.000468725933721 ‐ 0.000254087972578 +
0.000325206281558*D(GSPR_MTN(‐1)/NP_MTN(‐1)) + 3.91645238978e‐05*D(RWNM_MTN(‐1)/JPGDP(‐1))
Eqn 482: D(XREVSER10_NENG/REVSER10_SUM) = ‐0.00021294831901 ‐ 0.000254087972578 +
0.000325206281558*D(GSPR_NENG(‐1)/NP_NENG(‐1)) + 3.91645238978e‐05*D(RWNM_NENG(‐1)/JPGDP(‐1))
May 2014
U.S. Energy Information Administration | NEMS Macroeconomic Activity Module Documentation Report 216
Eqn 483: D(XREVSER10_PAC/REVSER10_SUM) = 4.28114804651e‐06 ‐ 0.000254087972578 +
0.000325206281558*D(GSPR_PAC(‐1)/NP_PAC(‐1)) + 3.91645238978e‐05*D(RWNM_PAC(‐1)/JPGDP(‐1))
Eqn 484: D(XREVSER10_SATL/REVSER10_SUM) = 0.000960474961443 ‐ 0.000254087972578 +
0.000325206281558*D(GSPR_SATL(‐1)/NP_SATL(‐1)) + 3.91645238978e‐05*D(RWNM_SATL(‐1)/JPGDP(‐1))
Eqn 485: D(XREVSER10_WNC/REVSER10_SUM) = ‐0.000138281846301 ‐ 0.000254087972578 +
0.000325206281558*D(GSPR_WNC(‐1)/NP_WNC(‐1)) + 3.91645238978e‐05*D(RWNM_WNC(‐1)/JPGDP(‐1))
Eqn 486: D(XREVSER10_WSC/REVSER10_SUM) = 0.000589767488401 ‐ 0.000254087972578 +
0.000325206281558*D(GSPR_WSC(‐1)/NP_WSC(‐1)) + 3.91645238978e‐05*D(RWNM_WSC(‐1)/JPGDP(‐1))
Regional employment model
Endogenous variables:
EMP{I}_{R} Employment in millions for sector I, region R (e.g. EMPIND1_ENC)
XEMP{I}_{R} Employment in millions for sector I, region R, equation estimate (e.g. XEMPIND1_ENC)
Codes and descriptions of the sectors are presented in Table A14. Codes and descriptions of the regions are in
Table B6.
Exogenous variables:
GSPR_{R} Gross State Product in billions of real 2005 dollars for region R
HPMD Average weekly hours in durable manufacturing
HPMF Average weekly hours in manufacturing
HPMN Average weekly hours in nondurable manufacturing
HRNFPRI Average workweek for nonfarm business
JPGDP Chained price index – gross domestic product
JQPCMHMD Output per hour in durable manufacturing
JQPCMHMN Output per hour in nondurable manufacturing
JWSSNF Total compensation in nonfarm business
REV{I}_{R} Output in billions of real 2005 dollars for sector I, region R
May 2014
U.S. Energy Information Administration | NEMS Macroeconomic Activity Module Documentation Report 217
RUC Civilian unemployment rate
SP500 S&P 500 index of common stocks
UTLB00004 Factory operating rate
WPI01 Producer price index – farm products
WPI0574_(R) Producer price index – residual petroleum fuels
WPI057_{R} Producer price index – refined petroleum products
WPI05_{R} Producer price index – fuels, related products and power
WPI06 Producer price index – chemicals and allied products
WPI09 Producer price index – pulp, paper and allied products
WPI11 Producer price index – machinery and equipment
WPI12 Producer price index – furniture and household durables
WPISOP3000 Producer price index – finished goods
@TREND Time Trend
Equations:
Alignment process:
The alignment process takes the regional employment shares of sector I computed from the equations and
applied them onto the national employment of sector I. This ensures that the sum of the nine regions aligns to
the national total.
EMP{I}_{R} = (XEMP{I}_{R} / XEMP{I}_SUM ) * EMP{I}_SUM
where:
EMP{I}_{R} Employment for sector I, region R
XEMP{I}_{R} Employment for sector I, region R, equation estimate
XEMP{I}_SUM Sum of 9 regions’ XEMP{I}_{R}
EMP{I}_SUM Employment for sector I (national)
May 2014
U.S. Energy Information Administration | NEMS Macroeconomic Activity Module Documentation Report 218
Detailed structural equations for XEMP{I}_{R}:
IND1 ‐ Food products
Eqn 1: DLOG(XEMPIND1_ENC/(REVIND1_ENC_0/(JQPCMHMN*HPMN))) = 0.00301825869573 +
0.00924848844763 + 0.605979019646*DLOG(@MOVAV(REVIND1_ENC_0(‐1),2)/REVIND1_ENC_0) ‐
0.803785514866*DLOG(@MOVAV(JQPCMHMN(‐1)*HPMN(‐1),2)/(JQPCMHMN*HPMN))
Eqn 2: DLOG(XEMPIND1_ESC/(REVIND1_ESC_0/(JQPCMHMN*HPMN))) = ‐0.00650880418327 +
0.00924848844763 + 0.605979019646*DLOG(@MOVAV(REVIND1_ESC_0(‐1),2)/REVIND1_ESC_0) ‐
0.803785514866*DLOG(@MOVAV(JQPCMHMN(‐1)*HPMN(‐1),2)/(JQPCMHMN*HPMN))
Eqn 3: DLOG(XEMPIND1_MATL/(REVIND1_MATL_0/(JQPCMHMN*HPMN))) = 0.00606008668689 +
0.00924848844763 + 0.605979019646*DLOG(@MOVAV(REVIND1_MATL_0(‐1),2)/REVIND1_MATL_0) ‐
0.803785514866*DLOG(@MOVAV(JQPCMHMN(‐1)*HPMN(‐1),2)/(JQPCMHMN*HPMN))
Eqn 4: DLOG(XEMPIND1_MTN/(REVIND1_MTN_0/(JQPCMHMN*HPMN))) = ‐0.00321513955344 +
0.00924848844763 + 0.605979019646*DLOG(@MOVAV(REVIND1_MTN_0(‐1),2)/REVIND1_MTN_0) ‐
0.803785514866*DLOG(@MOVAV(JQPCMHMN(‐1)*HPMN(‐1),2)/(JQPCMHMN*HPMN))
Eqn 5: DLOG(XEMPIND1_NENG/(REVIND1_NENG_0/(JQPCMHMN*HPMN))) = 0.000905422590084 +
0.00924848844763 + 0.605979019646*DLOG(@MOVAV(REVIND1_NENG_0(‐1),2)/REVIND1_NENG_0) ‐
0.803785514866*DLOG(@MOVAV(JQPCMHMN(‐1)*HPMN(‐1),2)/(JQPCMHMN*HPMN))
Eqn 6: DLOG(XEMPIND1_PAC/(REVIND1_PAC_0/(JQPCMHMN*HPMN))) = 0.0037587224941 +
0.00924848844763 + 0.605979019646*DLOG(@MOVAV(REVIND1_PAC_0(‐1),2)/REVIND1_PAC_0) ‐
0.803785514866*DLOG(@MOVAV(JQPCMHMN(‐1)*HPMN(‐1),2)/(JQPCMHMN*HPMN))
Eqn 7: DLOG(XEMPIND1_SATL/(REVIND1_SATL_0/(JQPCMHMN*HPMN))) = ‐0.000924221647361 +
0.00924848844763 + 0.605979019646*DLOG(@MOVAV(REVIND1_SATL_0(‐1),2)/REVIND1_SATL_0) ‐
0.803785514866*DLOG(@MOVAV(JQPCMHMN(‐1)*HPMN(‐1),2)/(JQPCMHMN*HPMN))
Eqn 8: DLOG(XEMPIND1_WNC/(REVIND1_WNC_0/(JQPCMHMN*HPMN))) = ‐0.0038515526579 +
0.00924848844763 + 0.605979019646*DLOG(@MOVAV(REVIND1_WNC_0(‐1),2)/REVIND1_WNC_0) ‐
0.803785514866*DLOG(@MOVAV(JQPCMHMN(‐1)*HPMN(‐1),2)/(JQPCMHMN*HPMN))
Eqn 9: DLOG(XEMPIND1_WSC/(REVIND1_WSC_0/(JQPCMHMN*HPMN))) = 0.000757227575175 +
0.00924848844763 + 0.605979019646*DLOG(@MOVAV(REVIND1_WSC_0(‐1),2)/REVIND1_WSC_0) ‐
0.803785514866*DLOG(@MOVAV(JQPCMHMN(‐1)*HPMN(‐1),2)/(JQPCMHMN*HPMN))
IND2 ‐ Beverage and tobacco products
Eqn 10: DLOG(XEMPIND1_WSC/(REVIND1_WSC_0/(JQPCMHMN*HPMN))) = 0.000757227575175 +
0.00924848844763 + 0.605979019646*DLOG(@MOVAV(REVIND1_WSC_0(‐1),2)/REVIND1_WSC_0) ‐
0.803785514866*DLOG(@MOVAV(JQPCMHMN(‐1)*HPMN(‐1),2)/(JQPCMHMN*HPMN))
May 2014
U.S. Energy Information Administration | NEMS Macroeconomic Activity Module Documentation Report 219
Eqn 11: DLOG(XEMPIND2_ESC/(REVIND6_ESC_0/(JQPCMHMN*HPMN))) = ‐0.00118311403626 +
0.0365780381027 + 0.625881611273*DLOG(@MOVAV(REVIND6_ESC_0(‐1),2)/REVIND6_ESC_0) ‐
0.0808348540577*DLOG(XEMPIND2_ESC(‐1)/(REVIND2_ESC_0(‐1)/(JQPCMHMN(‐1)*HPMN(‐1))))
Eqn 12: DLOG(XEMPIND2_MATL/(REVIND6_MATL_0/(JQPCMHMN*HPMN))) = ‐0.00303486379533 +
0.0365780381027 + 0.625881611273*DLOG(@MOVAV(REVIND6_MATL_0(‐1),2)/REVIND6_MATL_0) ‐
0.0808348540577*DLOG(XEMPIND2_MATL(‐1)/(REVIND2_MATL_0(‐1)/(JQPCMHMN(‐1)*HPMN(‐1))))
Eqn 13: DLOG(XEMPIND2_MTN/(REVIND6_MTN_0/(JQPCMHMN*HPMN))) = 0.000227565342868 +
0.0365780381027 + 0.625881611273*DLOG(@MOVAV(REVIND6_MTN_0(‐1),2)/REVIND6_MTN_0) ‐
0.0808348540577*DLOG(XEMPIND2_MTN(‐1)/(REVIND2_MTN_0(‐1)/(JQPCMHMN(‐1)*HPMN(‐1))))
Eqn 14: DLOG(XEMPIND2_NENG/(REVIND6_NENG_0/(JQPCMHMN*HPMN))) = ‐0.000950614178295 +
0.0365780381027 + 0.625881611273*DLOG(@MOVAV(REVIND6_NENG_0(‐1),2)/REVIND6_NENG_0) ‐
0.0808348540577*DLOG(XEMPIND2_NENG(‐1)/(REVIND2_NENG_0(‐1)/(JQPCMHMN(‐1)*HPMN(‐1))))
Eqn 15: DLOG(XEMPIND2_PAC/(REVIND6_PAC_0/(JQPCMHMN*HPMN))) = 0.0239022044145 +
0.0365780381027 + 0.625881611273*DLOG(@MOVAV(REVIND6_PAC_0(‐1),2)/REVIND6_PAC_0) ‐
0.0808348540577*DLOG(XEMPIND2_PAC(‐1)/(REVIND2_PAC_0(‐1)/(JQPCMHMN(‐1)*HPMN(‐1))))
Eqn 16: DLOG(XEMPIND2_SATL/(REVIND6_SATL_0/(JQPCMHMN*HPMN))) = ‐0.0123883188354 +
0.0365780381027 + 0.625881611273*DLOG(@MOVAV(REVIND6_SATL_0(‐1),2)/REVIND6_SATL_0) ‐
0.0808348540577*DLOG(XEMPIND2_SATL(‐1)/(REVIND2_SATL_0(‐1)/(JQPCMHMN(‐1)*HPMN(‐1))))
Eqn 17: DLOG(XEMPIND2_WNC/(REVIND6_WNC_0/(JQPCMHMN*HPMN))) = ‐0.00429463920014 +
0.0365780381027 + 0.625881611273*DLOG(@MOVAV(REVIND6_WNC_0(‐1),2)/REVIND6_WNC_0) ‐
0.0808348540577*DLOG(XEMPIND2_WNC(‐1)/(REVIND2_WNC_0(‐1)/(JQPCMHMN(‐1)*HPMN(‐1))))
Eqn 18: DLOG(XEMPIND2_WSC/(REVIND6_WSC_0/(JQPCMHMN*HPMN))) = ‐0.00215757496023 +
0.0365780381027 + 0.625881611273*DLOG(@MOVAV(REVIND6_WSC_0(‐1),2)/REVIND6_WSC_0) ‐
0.0808348540577*DLOG(XEMPIND2_WSC(‐1)/(REVIND2_WSC_0(‐1)/(JQPCMHMN(‐1)*HPMN(‐1))))
IND3 ‐ Textile mills & products, apparel, and leather
Eqn 19: DLOG(XEMPIND3_ENC/(REVIND7_ENC_0/(JQPCMHMN*HPMN))) = ‐0.011340471253 ‐
0.00250696950888 + 0.581755368445*DLOG(@MOVAV(REVIND7_ENC_0(‐1),2)/REVIND7_ENC_0) ‐
0.875505178802*DLOG(@MOVAV(JQPCMHMN(‐1)*HPMN(‐1),2)/(JQPCMHMN*HPMN)) +
0.0251614536886*DLOG(WPI05_ENC/JPGDP)
Eqn 20: DLOG(XEMPIND3_ESC/(REVIND7_ESC_0/(JQPCMHMN*HPMN))) = ‐0.00796677381496 ‐
0.00250696950888 + 0.581755368445*DLOG(@MOVAV(REVIND7_ESC_0(‐1),2)/REVIND7_ESC_0) ‐
0.875505178802*DLOG(@MOVAV(JQPCMHMN(‐1)*HPMN(‐1),2)/(JQPCMHMN*HPMN)) +
0.0251614536886*DLOG(WPI05_ESC/JPGDP)
May 2014
U.S. Energy Information Administration | NEMS Macroeconomic Activity Module Documentation Report 220
Eqn 21: DLOG(XEMPIND3_MATL/(REVIND7_MATL_0/(JQPCMHMN*HPMN))) = ‐0.00859261232101 ‐
0.00250696950888 + 0.581755368445*DLOG(@MOVAV(REVIND7_MATL_0(‐1),2)/REVIND7_MATL_0) ‐
0.875505178802*DLOG(@MOVAV(JQPCMHMN(‐1)*HPMN(‐1),2)/(JQPCMHMN*HPMN)) +
0.0251614536886*DLOG(WPI05_MATL/JPGDP)
Eqn 22: DLOG(XEMPIND3_MTN/(REVIND7_MTN_0/(JQPCMHMN*HPMN))) = 0.00628679571555 ‐
0.00250696950888 + 0.581755368445*DLOG(@MOVAV(REVIND7_MTN_0(‐1),2)/REVIND7_MTN_0) ‐
0.875505178802*DLOG(@MOVAV(JQPCMHMN(‐1)*HPMN(‐1),2)/(JQPCMHMN*HPMN)) +
0.0251614536886*DLOG(WPI05_MTN/JPGDP)
Eqn 23: DLOG(XEMPIND3_NENG/(REVIND7_NENG_0/(JQPCMHMN*HPMN))) = 0.000996544942895 ‐
0.00250696950888 + 0.581755368445*DLOG(@MOVAV(REVIND7_NENG_0(‐1),2)/REVIND7_NENG_0) ‐
0.875505178802*DLOG(@MOVAV(JQPCMHMN(‐1)*HPMN(‐1),2)/(JQPCMHMN*HPMN)) +
0.0251614536886*DLOG(WPI05_NENG/JPGDP)
Eqn 24: DLOG(XEMPIND3_PAC/(REVIND7_PAC_0/(JQPCMHMN*HPMN))) = ‐0.00653564781797 ‐
0.00250696950888 + 0.581755368445*DLOG(@MOVAV(REVIND7_PAC_0(‐1),2)/REVIND7_PAC_0) ‐
0.875505178802*DLOG(@MOVAV(JQPCMHMN(‐1)*HPMN(‐1),2)/(JQPCMHMN*HPMN)) +
0.0251614536886*DLOG(WPI05_PAC/JPGDP)
Eqn 25: DLOG(XEMPIND3_SATL/(REVIND7_SATL_0/(JQPCMHMN*HPMN))) = ‐0.0199312582754 ‐
0.00250696950888 + 0.581755368445*DLOG(@MOVAV(REVIND7_SATL_0(‐1),2)/REVIND7_SATL_0) ‐
0.875505178802*DLOG(@MOVAV(JQPCMHMN(‐1)*HPMN(‐1),2)/(JQPCMHMN*HPMN)) +
0.0251614536886*DLOG(WPI05_SATL/JPGDP)
Eqn 26: DLOG(XEMPIND3_WNC/(REVIND7_WNC_0/(JQPCMHMN*HPMN))) = 0.042552223373 ‐
0.00250696950888 + 0.581755368445*DLOG(@MOVAV(REVIND7_WNC_0(‐1),2)/REVIND7_WNC_0) ‐
0.875505178802*DLOG(@MOVAV(JQPCMHMN(‐1)*HPMN(‐1),2)/(JQPCMHMN*HPMN)) +
0.0251614536886*DLOG(WPI05_WNC/JPGDP)
Eqn 27: DLOG(XEMPIND3_WSC/(REVIND7_WSC_0/(JQPCMHMN*HPMN))) = 0.00453119945086 ‐
0.00250696950888 + 0.581755368445*DLOG(@MOVAV(REVIND7_WSC_0(‐1),2)/REVIND7_WSC_0) ‐
0.875505178802*DLOG(@MOVAV(JQPCMHMN(‐1)*HPMN(‐1),2)/(JQPCMHMN*HPMN)) +
0.0251614536886*DLOG(WPI05_WSC/JPGDP)
IND4 ‐ Wood products
Eqn 37: DLOG(XEMPIND4_ENC/(REVIND8_ENC_0/(JQPCMHMN*HPMN))) = ‐0.0107884035903 +
0.0682142900156 + 0.445106126624*DLOG(@MOVAV(REVIND8_ENC_0(‐1),2)/REVIND8_ENC_0) ‐
0.802466672474*DLOG(@MOVAV(JQPCMHMN(‐1)*HPMN(‐1),2)/(JQPCMHMN*HPMN)) ‐
0.0028400057926*@TREND
Eqn 38: DLOG(XEMPIND4_ESC/(REVIND8_ESC_0/(JQPCMHMN*HPMN))) = 0.00217457165326 +
0.0682142900156 + 0.445106126624*DLOG(@MOVAV(REVIND8_ESC_0(‐1),2)/REVIND8_ESC_0) ‐
0.802466672474*DLOG(@MOVAV(JQPCMHMN(‐1)*HPMN(‐1),2)/(JQPCMHMN*HPMN)) ‐
0.0028400057926*@TREND
May 2014
U.S. Energy Information Administration | NEMS Macroeconomic Activity Module Documentation Report 221
Eqn 39: DLOG(XEMPIND4_MATL/(REVIND8_MATL_0/(JQPCMHMN*HPMN))) = ‐0.00283891973748 +
0.0682142900156 + 0.445106126624*DLOG(@MOVAV(REVIND8_MATL_0(‐1),2)/REVIND8_MATL_0) ‐
0.802466672474*DLOG(@MOVAV(JQPCMHMN(‐1)*HPMN(‐1),2)/(JQPCMHMN*HPMN)) ‐
0.0028400057926*@TREND
Eqn 40: DLOG(XEMPIND4_MTN/(REVIND8_MTN_0/(JQPCMHMN*HPMN))) = 0.00437395044683 +
0.0682142900156 + 0.445106126624*DLOG(@MOVAV(REVIND8_MTN_0(‐1),2)/REVIND8_MTN_0) ‐
0.802466672474*DLOG(@MOVAV(JQPCMHMN(‐1)*HPMN(‐1),2)/(JQPCMHMN*HPMN)) ‐
0.0028400057926*@TREND
Eqn 41: DLOG(XEMPIND4_NENG/(REVIND8_NENG_0/(JQPCMHMN*HPMN))) = ‐0.00683746787868 +
0.0682142900156 + 0.445106126624*DLOG(@MOVAV(REVIND8_NENG_0(‐1),2)/REVIND8_NENG_0) ‐
0.802466672474*DLOG(@MOVAV(JQPCMHMN(‐1)*HPMN(‐1),2)/(JQPCMHMN*HPMN)) ‐
0.0028400057926*@TREND
Eqn 42: DLOG(XEMPIND4_PAC/(REVIND8_PAC_0/(JQPCMHMN*HPMN))) = 0.0117562841068 +
0.0682142900156 + 0.445106126624*DLOG(@MOVAV(REVIND8_PAC_0(‐1),2)/REVIND8_PAC_0) ‐
0.802466672474*DLOG(@MOVAV(JQPCMHMN(‐1)*HPMN(‐1),2)/(JQPCMHMN*HPMN)) ‐
0.0028400057926*@TREND
Eqn 43: DLOG(XEMPIND4_SATL/(REVIND8_SATL_0/(JQPCMHMN*HPMN))) = 0.000328291483084 +
0.0682142900156 + 0.445106126624*DLOG(@MOVAV(REVIND8_SATL_0(‐1),2)/REVIND8_SATL_0) ‐
0.802466672474*DLOG(@MOVAV(JQPCMHMN(‐1)*HPMN(‐1),2)/(JQPCMHMN*HPMN)) ‐
0.0028400057926*@TREND
Eqn 44: DLOG(XEMPIND4_WNC/(REVIND8_WNC_0/(JQPCMHMN*HPMN))) = 0.00313244448712 +
0.0682142900156 + 0.445106126624*DLOG(@MOVAV(REVIND8_WNC_0(‐1),2)/REVIND8_WNC_0) ‐
0.802466672474*DLOG(@MOVAV(JQPCMHMN(‐1)*HPMN(‐1),2)/(JQPCMHMN*HPMN)) ‐
0.0028400057926*@TREND
Eqn 45: DLOG(XEMPIND4_WSC/(REVIND8_WSC_0/(JQPCMHMN*HPMN))) = ‐0.00130075097065 +
0.0682142900156 + 0.445106126624*DLOG(@MOVAV(REVIND8_WSC_0(‐1),2)/REVIND8_WSC_0) ‐
0.802466672474*DLOG(@MOVAV(JQPCMHMN(‐1)*HPMN(‐1),2)/(JQPCMHMN*HPMN)) ‐
0.0028400057926*@TREND
IND5 ‐ Furniture and related products
Eqn 46: DLOG(XEMPIND5_ENC/(REVIND9_ENC_0/(JQPCMHMN*HPMN))) = 0.00172678729365 +
0.0104628468049 + 0.435670217653*DLOG(@MOVAV(REVIND9_ENC_0(‐1),2)/REVIND9_ENC_0) ‐
0.535270771824*DLOG(@MOVAV(JQPCMHMN(‐1)*HPMN(‐1),2)/(JQPCMHMN*HPMN)) ‐
0.0291733104742*DLOG(WPI05_ENC(‐1)/JPGDP(‐1)) + 0.897457276276*DLOG(WPI12(‐1)/JPGDP(‐1))
Eqn 47: DLOG(XEMPIND5_ESC/(REVIND9_ESC_0/(JQPCMHMN*HPMN))) = ‐0.00220980227043 +
0.0104628468049 + 0.435670217653*DLOG(@MOVAV(REVIND9_ESC_0(‐1),2)/REVIND9_ESC_0) ‐
0.535270771824*DLOG(@MOVAV(JQPCMHMN(‐1)*HPMN(‐1),2)/(JQPCMHMN*HPMN)) ‐
0.0291733104742*DLOG(WPI05_ESC(‐1)/JPGDP(‐1)) + 0.897457276276*DLOG(WPI12(‐1)/JPGDP(‐1))
May 2014
U.S. Energy Information Administration | NEMS Macroeconomic Activity Module Documentation Report 222
Eqn 48: DLOG(XEMPIND5_MATL/(REVIND9_MATL_0/(JQPCMHMN*HPMN))) = 0.00163759656971 +
0.0104628468049 + 0.435670217653*DLOG(@MOVAV(REVIND9_MATL_0(‐1),2)/REVIND9_MATL_0) ‐
0.535270771824*DLOG(@MOVAV(JQPCMHMN(‐1)*HPMN(‐1),2)/(JQPCMHMN*HPMN)) ‐
0.0291733104742*DLOG(WPI05_MATL(‐1)/JPGDP(‐1)) + 0.897457276276*DLOG(WPI12(‐1)/JPGDP(‐1))
Eqn 49: DLOG(XEMPIND5_MTN/(REVIND9_MTN_0/(JQPCMHMN*HPMN))) = ‐0.0173211620486 +
0.0104628468049 + 0.435670217653*DLOG(@MOVAV(REVIND9_MTN_0(‐1),2)/REVIND9_MTN_0) ‐
0.535270771824*DLOG(@MOVAV(JQPCMHMN(‐1)*HPMN(‐1),2)/(JQPCMHMN*HPMN)) ‐
0.0291733104742*DLOG(WPI05_MTN(‐1)/JPGDP(‐1)) + 0.897457276276*DLOG(WPI12(‐1)/JPGDP(‐1))
Eqn 50: DLOG(XEMPIND5_NENG/(REVIND9_NENG_0/(JQPCMHMN*HPMN))) = 0.00472368079693 +
0.0104628468049 + 0.435670217653*DLOG(@MOVAV(REVIND9_NENG_0(‐1),2)/REVIND9_NENG_0) ‐
0.535270771824*DLOG(@MOVAV(JQPCMHMN(‐1)*HPMN(‐1),2)/(JQPCMHMN*HPMN)) ‐
0.0291733104742*DLOG(WPI05_NENG(‐1)/JPGDP(‐1)) + 0.897457276276*DLOG(WPI12(‐1)/JPGDP(‐1))
Eqn 51: DLOG(XEMPIND5_PAC/(REVIND9_PAC_0/(JQPCMHMN*HPMN))) = ‐0.00194401389101 +
0.0104628468049 + 0.435670217653*DLOG(@MOVAV(REVIND9_PAC_0(‐1),2)/REVIND9_PAC_0) ‐
0.535270771824*DLOG(@MOVAV(JQPCMHMN(‐1)*HPMN(‐1),2)/(JQPCMHMN*HPMN)) ‐
0.0291733104742*DLOG(WPI05_PAC(‐1)/JPGDP(‐1)) + 0.897457276276*DLOG(WPI12(‐1)/JPGDP(‐1))
Eqn 52: DLOG(XEMPIND5_SATL/(REVIND9_SATL_0/(JQPCMHMN*HPMN))) = 0.00171058313517 +
0.0104628468049 + 0.435670217653*DLOG(@MOVAV(REVIND9_SATL_0(‐1),2)/REVIND9_SATL_0) ‐
0.535270771824*DLOG(@MOVAV(JQPCMHMN(‐1)*HPMN(‐1),2)/(JQPCMHMN*HPMN)) ‐
0.0291733104742*DLOG(WPI05_SATL(‐1)/JPGDP(‐1)) + 0.897457276276*DLOG(WPI12(‐1)/JPGDP(‐1))
Eqn 53: DLOG(XEMPIND5_WNC/(REVIND9_WNC_0/(JQPCMHMN*HPMN))) = 0.011510970198 +
0.0104628468049 + 0.435670217653*DLOG(@MOVAV(REVIND9_WNC_0(‐1),2)/REVIND9_WNC_0) ‐
0.535270771824*DLOG(@MOVAV(JQPCMHMN(‐1)*HPMN(‐1),2)/(JQPCMHMN*HPMN)) ‐
0.0291733104742*DLOG(WPI05_WNC(‐1)/JPGDP(‐1)) + 0.897457276276*DLOG(WPI12(‐1)/JPGDP(‐1))
Eqn 54: DLOG(XEMPIND5_WSC/(REVIND9_WSC_0/(JQPCMHMN*HPMN))) = 0.000165360216641 +
0.0104628468049 + 0.435670217653*DLOG(@MOVAV(REVIND9_WSC_0(‐1),2)/REVIND9_WSC_0) ‐
0.535270771824*DLOG(@MOVAV(JQPCMHMN(‐1)*HPMN(‐1),2)/(JQPCMHMN*HPMN)) ‐
0.0291733104742*DLOG(WPI05_WSC(‐1)/JPGDP(‐1)) + 0.897457276276*DLOG(WPI12(‐1)/JPGDP(‐1))
IND6 ‐ Paper products
Eqn 55: DLOG(XEMPIND6_ENC/(REVIND10_ENC_0/(JQPCMHMN*HPMN))) = 0.00064413996903 +
0.00994832740615 + 0.537568273116*DLOG(@MOVAV(REVIND10_ENC_0(‐1),2)/REVIND10_ENC_0) ‐
0.718035213842*DLOG(@MOVAV(JQPCMHMN(‐1)*HPMN(‐1),2)/(JQPCMHMN*HPMN))
Eqn 56: DLOG(XEMPIND6_ESC/(REVIND10_ESC_0/(JQPCMHMN*HPMN))) = ‐0.0104957993997 +
0.00994832740615 + 0.537568273116*DLOG(@MOVAV(REVIND10_ESC_0(‐1),2)/REVIND10_ESC_0) ‐
0.718035213842*DLOG(@MOVAV(JQPCMHMN(‐1)*HPMN(‐1),2)/(JQPCMHMN*HPMN))
May 2014
U.S. Energy Information Administration | NEMS Macroeconomic Activity Module Documentation Report 223
Eqn 57: DLOG(XEMPIND6_MATL/(REVIND10_MATL_0/(JQPCMHMN*HPMN))) = 0.00388417746118 +
0.00994832740615 + 0.537568273116*DLOG(@MOVAV(REVIND10_MATL_0(‐1),2)/REVIND10_MATL_0) ‐
0.718035213842*DLOG(@MOVAV(JQPCMHMN(‐1)*HPMN(‐1),2)/(JQPCMHMN*HPMN))
Eqn 58: DLOG(XEMPIND6_MTN/(REVIND10_MTN_0/(JQPCMHMN*HPMN))) = 0.0038865602095 +
0.00994832740615 + 0.537568273116*DLOG(@MOVAV(REVIND10_MTN_0(‐1),2)/REVIND10_MTN_0) ‐
0.718035213842*DLOG(@MOVAV(JQPCMHMN(‐1)*HPMN(‐1),2)/(JQPCMHMN*HPMN))
Eqn 59: DLOG(XEMPIND6_NENG/(REVIND10_NENG_0/(JQPCMHMN*HPMN))) = 0.0151777772177 +
0.00994832740615 + 0.537568273116*DLOG(@MOVAV(REVIND10_NENG_0(‐1),2)/REVIND10_NENG_0) ‐
0.718035213842*DLOG(@MOVAV(JQPCMHMN(‐1)*HPMN(‐1),2)/(JQPCMHMN*HPMN))
Eqn 60: DLOG(XEMPIND6_PAC/(REVIND10_PAC_0/(JQPCMHMN*HPMN))) = 0.00301189538609 +
0.00994832740615 + 0.537568273116*DLOG(@MOVAV(REVIND10_PAC_0(‐1),2)/REVIND10_PAC_0) ‐
0.718035213842*DLOG(@MOVAV(JQPCMHMN(‐1)*HPMN(‐1),2)/(JQPCMHMN*HPMN))
Eqn 61: DLOG(XEMPIND6_SATL/(REVIND10_SATL_0/(JQPCMHMN*HPMN))) = ‐0.00468284424092 +
0.00994832740615 + 0.537568273116*DLOG(@MOVAV(REVIND10_SATL_0(‐1),2)/REVIND10_SATL_0) ‐
0.718035213842*DLOG(@MOVAV(JQPCMHMN(‐1)*HPMN(‐1),2)/(JQPCMHMN*HPMN))
Eqn 62: DLOG(XEMPIND6_WNC/(REVIND10_WNC_0/(JQPCMHMN*HPMN))) = ‐0.00789978554562 +
0.00994832740615 + 0.537568273116*DLOG(@MOVAV(REVIND10_WNC_0(‐1),2)/REVIND10_WNC_0) ‐
0.718035213842*DLOG(@MOVAV(JQPCMHMN(‐1)*HPMN(‐1),2)/(JQPCMHMN*HPMN))
Eqn 63: DLOG(XEMPIND6_WSC/(REVIND10_WSC_0/(JQPCMHMN*HPMN))) = ‐0.0035261210573 +
0.00994832740615 + 0.537568273116*DLOG(@MOVAV(REVIND10_WSC_0(‐1),2)/REVIND10_WSC_0) ‐
0.718035213842*DLOG(@MOVAV(JQPCMHMN(‐1)*HPMN(‐1),2)/(JQPCMHMN*HPMN))
IND7 ‐ Printing
Eqn 64: DLOG(XEMPIND7_ENC/(REVIND11_ENC_0/(JQPCMHMN*HPMN))) = ‐0.00313566169572 +
0.0246578251215 + 0.408601112431*DLOG(@MOVAV(REVIND11_ENC_0(‐1),2)/REVIND11_ENC_0) ‐
0.435008875422*DLOG(@MOVAV(JQPCMHMN(‐1)*HPMN(‐1),2)/(JQPCMHMN*HPMN)) ‐
0.0242511021908*DLOG(WPI05_ENC(‐1)/JPGDP(‐1)) ‐ 0.148128234825*DLOG(WPI09(‐1)/JPGDP(‐1))
Eqn 65: DLOG(XEMPIND7_ESC/(REVIND11_ESC_0/(JQPCMHMN*HPMN))) = ‐0.0119518573293 +
0.0246578251215 + 0.408601112431*DLOG(@MOVAV(REVIND11_ESC_0(‐1),2)/REVIND11_ESC_0) ‐
0.435008875422*DLOG(@MOVAV(JQPCMHMN(‐1)*HPMN(‐1),2)/(JQPCMHMN*HPMN)) ‐
0.0242511021908*DLOG(WPI05_ESC(‐1)/JPGDP(‐1)) ‐ 0.148128234825*DLOG(WPI09(‐1)/JPGDP(‐1))
Eqn 66: DLOG(XEMPIND7_MATL/(REVIND11_MATL_0/(JQPCMHMN*HPMN))) = 0.00548168670939 +
0.0246578251215 + 0.408601112431*DLOG(@MOVAV(REVIND11_MATL_0(‐1),2)/REVIND11_MATL_0) ‐
0.435008875422*DLOG(@MOVAV(JQPCMHMN(‐1)*HPMN(‐1),2)/(JQPCMHMN*HPMN)) ‐
0.0242511021908*DLOG(WPI05_MATL(‐1)/JPGDP(‐1)) ‐ 0.148128234825*DLOG(WPI09(‐1)/JPGDP(‐1))
May 2014
U.S. Energy Information Administration | NEMS Macroeconomic Activity Module Documentation Report 224
Eqn 67: DLOG(XEMPIND7_MTN/(REVIND11_MTN_0/(JQPCMHMN*HPMN))) = ‐0.00286084088391 +
0.0246578251215 + 0.408601112431*DLOG(@MOVAV(REVIND11_MTN_0(‐1),2)/REVIND11_MTN_0) ‐
0.435008875422*DLOG(@MOVAV(JQPCMHMN(‐1)*HPMN(‐1),2)/(JQPCMHMN*HPMN)) ‐
0.0242511021908*DLOG(WPI05_MTN(‐1)/JPGDP(‐1)) ‐ 0.148128234825*DLOG(WPI09(‐1)/JPGDP(‐1))
Eqn 68: DLOG(XEMPIND7_NENG/(REVIND11_NENG_0/(JQPCMHMN*HPMN))) = 0.00610868036533 +
0.0246578251215 + 0.408601112431*DLOG(@MOVAV(REVIND11_NENG_0(‐1),2)/REVIND11_NENG_0) ‐
0.435008875422*DLOG(@MOVAV(JQPCMHMN(‐1)*HPMN(‐1),2)/(JQPCMHMN*HPMN)) ‐
0.0242511021908*DLOG(WPI05_NENG(‐1)/JPGDP(‐1)) ‐ 0.148128234825*DLOG(WPI09(‐1)/JPGDP(‐1))
Eqn 69: DLOG(XEMPIND7_PAC/(REVIND11_PAC_0/(JQPCMHMN*HPMN))) = 0.00653740940886 +
0.0246578251215 + 0.408601112431*DLOG(@MOVAV(REVIND11_PAC_0(‐1),2)/REVIND11_PAC_0) ‐
0.435008875422*DLOG(@MOVAV(JQPCMHMN(‐1)*HPMN(‐1),2)/(JQPCMHMN*HPMN)) ‐
0.0242511021908*DLOG(WPI05_PAC(‐1)/JPGDP(‐1)) ‐ 0.148128234825*DLOG(WPI09(‐1)/JPGDP(‐1))
Eqn 70: DLOG(XEMPIND7_SATL/(REVIND11_SATL_0/(JQPCMHMN*HPMN))) = ‐0.00438989648531 +
0.0246578251215 + 0.408601112431*DLOG(@MOVAV(REVIND11_SATL_0(‐1),2)/REVIND11_SATL_0) ‐
0.435008875422*DLOG(@MOVAV(JQPCMHMN(‐1)*HPMN(‐1),2)/(JQPCMHMN*HPMN)) ‐
0.0242511021908*DLOG(WPI05_SATL(‐1)/JPGDP(‐1)) ‐ 0.148128234825*DLOG(WPI09(‐1)/JPGDP(‐1))
Eqn 71: DLOG(XEMPIND7_WNC/(REVIND11_WNC_0/(JQPCMHMN*HPMN))) = 0.000239176859707 +
0.0246578251215 + 0.408601112431*DLOG(@MOVAV(REVIND11_WNC_0(‐1),2)/REVIND11_WNC_0) ‐
0.435008875422*DLOG(@MOVAV(JQPCMHMN(‐1)*HPMN(‐1),2)/(JQPCMHMN*HPMN)) ‐
0.0242511021908*DLOG(WPI05_WNC(‐1)/JPGDP(‐1)) ‐ 0.148128234825*DLOG(WPI09(‐1)/JPGDP(‐1))
Eqn 72: DLOG(XEMPIND7_WSC/(REVIND11_WSC_0/(JQPCMHMN*HPMN))) = 0.003971303051 +
0.0246578251215 + 0.408601112431*DLOG(@MOVAV(REVIND11_WSC_0(‐1),2)/REVIND11_WSC_0) ‐
0.435008875422*DLOG(@MOVAV(JQPCMHMN(‐1)*HPMN(‐1),2)/(JQPCMHMN*HPMN)) ‐
0.0242511021908*DLOG(WPI05_WSC(‐1)/JPGDP(‐1)) ‐ 0.148128234825*DLOG(WPI09(‐1)/JPGDP(‐1))
IND8 ‐ Basic inorganic chemicals
Eqn 73: DLOG(XEMPIND8_ENC/(REVIND12_ENC_0/(JQPCMHMN*HPMN))) = ‐0.00435638674894 ‐
0.0210148544911 + 0.607407197828*DLOG(@MOVAV(REVIND12_ENC_0(‐1),2)/REVIND12_ENC_0) ‐
1.15056984939*DLOG(@MOVAV(JQPCMHMN(‐1)*HPMN(‐1),2)/(JQPCMHMN*HPMN)) ‐
0.0978587827633*DLOG(SP500/GSPR_ENC) + 0.00106358832346*@TREND
Eqn 74: DLOG(XEMPIND8_ESC/(REVIND12_ESC_0/(JQPCMHMN*HPMN))) = 0.00624911652774 ‐
0.0210148544911 + 0.607407197828*DLOG(@MOVAV(REVIND12_ESC_0(‐1),2)/REVIND12_ESC_0) ‐
1.15056984939*DLOG(@MOVAV(JQPCMHMN(‐1)*HPMN(‐1),2)/(JQPCMHMN*HPMN)) ‐
0.0978587827633*DLOG(SP500/GSPR_ESC) + 0.00106358832346*@TREND
Eqn 75: DLOG(XEMPIND8_MATL/(REVIND12_MATL_0/(JQPCMHMN*HPMN))) = ‐0.00534915755854 ‐
0.0210148544911 + 0.607407197828*DLOG(@MOVAV(REVIND12_MATL_0(‐1),2)/REVIND12_MATL_0) ‐
1.15056984939*DLOG(@MOVAV(JQPCMHMN(‐1)*HPMN(‐1),2)/(JQPCMHMN*HPMN)) ‐
0.0978587827633*DLOG(SP500/GSPR_MATL) + 0.00106358832346*@TREND
May 2014
U.S. Energy Information Administration | NEMS Macroeconomic Activity Module Documentation Report 225
Eqn 76: DLOG(XEMPIND8_MTN/(REVIND12_MTN_0/(JQPCMHMN*HPMN))) = 0.0408900185608 ‐
0.0210148544911 + 0.607407197828*DLOG(@MOVAV(REVIND12_MTN_0(‐1),2)/REVIND12_MTN_0) ‐
1.15056984939*DLOG(@MOVAV(JQPCMHMN(‐1)*HPMN(‐1),2)/(JQPCMHMN*HPMN)) ‐
0.0978587827633*DLOG(SP500/GSPR_MTN) + 0.00106358832346*@TREND
Eqn 77: DLOG(XEMPIND8_NENG/(REVIND12_NENG_0/(JQPCMHMN*HPMN))) = 0.0517013806133 ‐
0.0210148544911 + 0.607407197828*DLOG(@MOVAV(REVIND12_NENG_0(‐1),2)/REVIND12_NENG_0) ‐
1.15056984939*DLOG(@MOVAV(JQPCMHMN(‐1)*HPMN(‐1),2)/(JQPCMHMN*HPMN)) ‐
0.0978587827633*DLOG(SP500/GSPR_NENG) + 0.00106358832346*@TREND
Eqn 78: DLOG(XEMPIND8_PAC/(REVIND12_PAC_0/(JQPCMHMN*HPMN))) = ‐0.00697907620045 ‐
0.0210148544911 + 0.607407197828*DLOG(@MOVAV(REVIND12_PAC_0(‐1),2)/REVIND12_PAC_0) ‐
1.15056984939*DLOG(@MOVAV(JQPCMHMN(‐1)*HPMN(‐1),2)/(JQPCMHMN*HPMN)) ‐
0.0978587827633*DLOG(SP500/GSPR_PAC) + 0.00106358832346*@TREND
Eqn 79: DLOG(XEMPIND8_SATL/(REVIND12_SATL_0/(JQPCMHMN*HPMN))) = 0.0130179045728 ‐
0.0210148544911 + 0.607407197828*DLOG(@MOVAV(REVIND12_SATL_0(‐1),2)/REVIND12_SATL_0) ‐
1.15056984939*DLOG(@MOVAV(JQPCMHMN(‐1)*HPMN(‐1),2)/(JQPCMHMN*HPMN)) ‐
0.0978587827633*DLOG(SP500/GSPR_SATL) + 0.00106358832346*@TREND
Eqn 80: DLOG(XEMPIND8_WNC/(REVIND12_WNC_0/(JQPCMHMN*HPMN))) = ‐0.0823083408487 ‐
0.0210148544911 + 0.607407197828*DLOG(@MOVAV(REVIND12_WNC_0(‐1),2)/REVIND12_WNC_0) ‐
1.15056984939*DLOG(@MOVAV(JQPCMHMN(‐1)*HPMN(‐1),2)/(JQPCMHMN*HPMN)) ‐
0.0978587827633*DLOG(SP500/GSPR_WNC) + 0.00106358832346*@TREND
Eqn 81: DLOG(XEMPIND8_WSC/(REVIND12_WSC_0/(JQPCMHMN*HPMN))) = ‐0.012865458918 ‐
0.0210148544911 + 0.607407197828*DLOG(@MOVAV(REVIND12_WSC_0(‐1),2)/REVIND12_WSC_0) ‐
1.15056984939*DLOG(@MOVAV(JQPCMHMN(‐1)*HPMN(‐1),2)/(JQPCMHMN*HPMN)) ‐
0.0978587827633*DLOG(SP500/GSPR_WSC) + 0.00106358832346*@TREND
IND9 ‐ Basic organic chemicals
Eqn 82: DLOG(XEMPIND9_ENC/(REVIND13_ENC_0/(JQPCMHMN*HPMN))) = ‐0.0192601097653 +
0.019414763664 + 0.615643962595*DLOG(@MOVAV(REVIND13_ENC_0(‐1),2)/REVIND13_ENC_0) ‐
0.00453597522916*D(UTLB00004(‐1)) ‐ 0.00680630129738*DLOG(JWSSNF(‐1)/WPI05_ENC(‐1))
Eqn 83: DLOG(XEMPIND9_ESC/(REVIND13_ESC_0/(JQPCMHMN*HPMN))) = 0.00456469173754 +
0.019414763664 + 0.615643962595*DLOG(@MOVAV(REVIND13_ESC_0(‐1),2)/REVIND13_ESC_0) ‐
0.00453597522916*D(UTLB00004(‐1)) ‐ 0.00680630129738*DLOG(JWSSNF(‐1)/WPI05_ESC(‐1))
Eqn 84: DLOG(XEMPIND9_MATL/(REVIND13_MATL_0/(JQPCMHMN*HPMN))) = ‐0.023474013876 +
0.019414763664 + 0.615643962595*DLOG(@MOVAV(REVIND13_MATL_0(‐1),2)/REVIND13_MATL_0) ‐
0.00453597522916*D(UTLB00004(‐1)) ‐ 0.00680630129738*DLOG(JWSSNF(‐1)/WPI05_MATL(‐1))
May 2014
U.S. Energy Information Administration | NEMS Macroeconomic Activity Module Documentation Report 226
Eqn 85: DLOG(XEMPIND9_MTN/(REVIND13_MTN_0/(JQPCMHMN*HPMN))) = 0.0259587165007 +
0.019414763664 + 0.615643962595*DLOG(@MOVAV(REVIND13_MTN_0(‐1),2)/REVIND13_MTN_0) ‐
0.00453597522916*D(UTLB00004(‐1)) ‐ 0.00680630129738*DLOG(JWSSNF(‐1)/WPI05_MTN(‐1))
Eqn 86: DLOG(XEMPIND9_NENG/(REVIND13_NENG_0/(JQPCMHMN*HPMN))) = 0.0355558710363 +
0.019414763664 + 0.615643962595*DLOG(@MOVAV(REVIND13_NENG_0(‐1),2)/REVIND13_NENG_0) ‐
0.00453597522916*D(UTLB00004(‐1)) ‐ 0.00680630129738*DLOG(JWSSNF(‐1)/WPI05_NENG(‐1))
Eqn 87: DLOG(XEMPIND9_PAC/(REVIND13_PAC_0/(JQPCMHMN*HPMN))) = 0.0537584530384 +
0.019414763664 + 0.615643962595*DLOG(@MOVAV(REVIND13_PAC_0(‐1),2)/REVIND13_PAC_0) ‐
0.00453597522916*D(UTLB00004(‐1)) ‐ 0.00680630129738*DLOG(JWSSNF(‐1)/WPI05_PAC(‐1))
Eqn 88: DLOG(XEMPIND9_SATL/(REVIND13_SATL_0/(JQPCMHMN*HPMN))) = 0.00698011062668 +
0.019414763664 + 0.615643962595*DLOG(@MOVAV(REVIND13_SATL_0(‐1),2)/REVIND13_SATL_0) ‐
0.00453597522916*D(UTLB00004(‐1)) ‐ 0.00680630129738*DLOG(JWSSNF(‐1)/WPI05_SATL(‐1))
Eqn 89: DLOG(XEMPIND9_WNC/(REVIND13_WNC_0/(JQPCMHMN*HPMN))) = ‐0.04595179953 +
0.019414763664 + 0.615643962595*DLOG(@MOVAV(REVIND13_WNC_0(‐1),2)/REVIND13_WNC_0) ‐
0.00453597522916*D(UTLB00004(‐1)) ‐ 0.00680630129738*DLOG(JWSSNF(‐1)/WPI05_WNC(‐1))
Eqn 90: DLOG(XEMPIND9_WSC/(REVIND13_WSC_0/(JQPCMHMN*HPMN))) = ‐0.0381319197683 +
0.019414763664 + 0.615643962595*DLOG(@MOVAV(REVIND13_WSC_0(‐1),2)/REVIND13_WSC_0) ‐
0.00453597522916*D(UTLB00004(‐1)) ‐ 0.00680630129738*DLOG(JWSSNF(‐1)/WPI05_WSC(‐1))
IND10 ‐ Plastic and synthetic rubber materials
Eqn 91: DLOG(XEMPIND10_ENC/(REVIND14_ENC_0/(JQPCMHMN*HPMN))) = 0.00800463777298 +
0.00644695704211 + 0.517654178296*DLOG(@MOVAV(REVIND14_ENC_0(‐1),2)/REVIND14_ENC_0) +
0.0319045507036*DLOG(JWSSNF(‐1)/WPI05_ENC(‐1))
Eqn 92: DLOG(XEMPIND10_ESC/(REVIND14_ESC_0/(JQPCMHMN*HPMN))) = ‐0.00737909848445 +
0.00644695704211 + 0.517654178296*DLOG(@MOVAV(REVIND14_ESC_0(‐1),2)/REVIND14_ESC_0) +
0.0319045507036*DLOG(JWSSNF(‐1)/WPI05_ESC(‐1))
Eqn 93: DLOG(XEMPIND10_MATL/(REVIND14_MATL_0/(JQPCMHMN*HPMN))) = 0.000430011678103 +
0.00644695704211 + 0.517654178296*DLOG(@MOVAV(REVIND14_MATL_0(‐1),2)/REVIND14_MATL_0) +
0.0319045507036*DLOG(JWSSNF(‐1)/WPI05_MATL(‐1))
Eqn 94: DLOG(XEMPIND10_MTN/(REVIND14_MTN_0/(JQPCMHMN*HPMN))) = 0.0547044107523 +
0.00644695704211 + 0.517654178296*DLOG(@MOVAV(REVIND14_MTN_0(‐1),2)/REVIND14_MTN_0) +
0.0319045507036*DLOG(JWSSNF(‐1)/WPI05_MTN(‐1))
Eqn 95: DLOG(XEMPIND10_NENG/(REVIND14_NENG_0/(JQPCMHMN*HPMN))) = 0.0131949889323 +
0.00644695704211 + 0.517654178296*DLOG(@MOVAV(REVIND14_NENG_0(‐1),2)/REVIND14_NENG_0) +
0.0319045507036*DLOG(JWSSNF(‐1)/WPI05_NENG(‐1))
May 2014
U.S. Energy Information Administration | NEMS Macroeconomic Activity Module Documentation Report 227
Eqn 96: DLOG(XEMPIND10_PAC/(REVIND14_PAC_0/(JQPCMHMN*HPMN))) = 0.00796337505763 +
0.00644695704211 + 0.517654178296*DLOG(@MOVAV(REVIND14_PAC_0(‐1),2)/REVIND14_PAC_0) +
0.0319045507036*DLOG(JWSSNF(‐1)/WPI05_PAC(‐1))
Eqn 97: DLOG(XEMPIND10_SATL/(REVIND14_SATL_0/(JQPCMHMN*HPMN))) = ‐0.0062442729184 +
0.00644695704211 + 0.517654178296*DLOG(@MOVAV(REVIND14_SATL_0(‐1),2)/REVIND14_SATL_0) +
0.0319045507036*DLOG(JWSSNF(‐1)/WPI05_SATL(‐1))
Eqn 98: DLOG(XEMPIND10_WNC/(REVIND14_WNC_0/(JQPCMHMN*HPMN))) = ‐0.0216671072521 +
0.00644695704211 + 0.517654178296*DLOG(@MOVAV(REVIND14_WNC_0(‐1),2)/REVIND14_WNC_0) +
0.0319045507036*DLOG(JWSSNF(‐1)/WPI05_WNC(‐1))
Eqn 99: DLOG(XEMPIND10_WSC/(REVIND14_WSC_0/(JQPCMHMN*HPMN))) = ‐0.0490069455384 +
0.00644695704211 + 0.517654178296*DLOG(@MOVAV(REVIND14_WSC_0(‐1),2)/REVIND14_WSC_0) +
0.0319045507036*DLOG(JWSSNF(‐1)/WPI05_WSC(‐1))
IND11 ‐ Agricultural chemicals
Eqn 100: DLOG(XEMPIND11_ENC/(REVIND15_ENC_0/(JQPCMHMN*HPMN))) = ‐0.00467448372606 +
0.0125515657477 + 0.61382706722*DLOG(@MOVAV(REVIND15_ENC_0(‐1),2)/REVIND15_ENC_0)
Eqn 101: DLOG(XEMPIND11_ESC/(REVIND15_ESC_0/(JQPCMHMN*HPMN))) = ‐0.0214937665726 +
0.0125515657477 + 0.61382706722*DLOG(@MOVAV(REVIND15_ESC_0(‐1),2)/REVIND15_ESC_0)
Eqn 102: DLOG(XEMPIND11_MATL/(REVIND15_MATL_0/(JQPCMHMN*HPMN))) = 0.012828750799 +
0.0125515657477 + 0.61382706722*DLOG(@MOVAV(REVIND15_MATL_0(‐1),2)/REVIND15_MATL_0)
Eqn 103: DLOG(XEMPIND11_MTN/(REVIND15_MTN_0/(JQPCMHMN*HPMN))) = 0.0219665032806 +
0.0125515657477 + 0.61382706722*DLOG(@MOVAV(REVIND15_MTN_0(‐1),2)/REVIND15_MTN_0)
Eqn 104: DLOG(XEMPIND11_NENG/(REVIND15_NENG_0/(JQPCMHMN*HPMN))) = 0.0125777913548 +
0.0125515657477 + 0.61382706722*DLOG(@MOVAV(REVIND15_NENG_0(‐1),2)/REVIND15_NENG_0)
Eqn 105: DLOG(XEMPIND11_PAC/(REVIND15_PAC_0/(JQPCMHMN*HPMN))) = ‐0.0183844926992 +
0.0125515657477 + 0.61382706722*DLOG(@MOVAV(REVIND15_PAC_0(‐1),2)/REVIND15_PAC_0)
Eqn 106: DLOG(XEMPIND11_SATL/(REVIND15_SATL_0/(JQPCMHMN*HPMN))) = ‐0.00623234700077 +
0.0125515657477 + 0.61382706722*DLOG(@MOVAV(REVIND15_SATL_0(‐1),2)/REVIND15_SATL_0)
Eqn 107: DLOG(XEMPIND11_WNC/(REVIND15_WNC_0/(JQPCMHMN*HPMN))) = 0.00269489420768 +
0.0125515657477 + 0.61382706722*DLOG(@MOVAV(REVIND15_WNC_0(‐1),2)/REVIND15_WNC_0)
Eqn 108: DLOG(XEMPIND11_WSC/(REVIND15_WSC_0/(JQPCMHMN*HPMN))) = 0.000717150356547 +
0.0125515657477 + 0.61382706722*DLOG(@MOVAV(REVIND15_WSC_0(‐1),2)/REVIND15_WSC_0)
May 2014
U.S. Energy Information Administration | NEMS Macroeconomic Activity Module Documentation Report 228
IND12 ‐ Other chemical products
Eqn 109: DLOG(XEMPIND12_ENC/(REVIND16_ENC_0/(JQPCMHMN*HPMN))) = ‐0.00230418445071 +
0.0086213418239 + 0.613027514623*DLOG(@MOVAV(REVIND16_ENC_0(‐1),2)/REVIND16_ENC_0) ‐
0.359183888556*DLOG(WPI06(‐1)/JPGDP(‐1))
Eqn 110: DLOG(XEMPIND12_ESC/(REVIND16_ESC_0/(JQPCMHMN*HPMN))) = 0.00319470401041 +
0.0086213418239 + 0.613027514623*DLOG(@MOVAV(REVIND16_ESC_0(‐1),2)/REVIND16_ESC_0) ‐
0.359183888556*DLOG(WPI06(‐1)/JPGDP(‐1))
Eqn 111: DLOG(XEMPIND12_MATL/(REVIND16_MATL_0/(JQPCMHMN*HPMN))) = ‐0.00831980042003 +
0.0086213418239 + 0.613027514623*DLOG(@MOVAV(REVIND16_MATL_0(‐1),2)/REVIND16_MATL_0) ‐
0.359183888556*DLOG(WPI06(‐1)/JPGDP(‐1))
Eqn 112: DLOG(XEMPIND12_MTN/(REVIND16_MTN_0/(JQPCMHMN*HPMN))) = ‐0.00914344171136 +
0.0086213418239 + 0.613027514623*DLOG(@MOVAV(REVIND16_MTN_0(‐1),2)/REVIND16_MTN_0) ‐
0.359183888556*DLOG(WPI06(‐1)/JPGDP(‐1))
Eqn 113: DLOG(XEMPIND12_NENG/(REVIND16_NENG_0/(JQPCMHMN*HPMN))) = 0.0122865087835 +
0.0086213418239 + 0.613027514623*DLOG(@MOVAV(REVIND16_NENG_0(‐1),2)/REVIND16_NENG_0) ‐
0.359183888556*DLOG(WPI06(‐1)/JPGDP(‐1))
Eqn 114: DLOG(XEMPIND12_PAC/(REVIND16_PAC_0/(JQPCMHMN*HPMN))) = ‐0.0124472623732 +
0.0086213418239 + 0.613027514623*DLOG(@MOVAV(REVIND16_PAC_0(‐1),2)/REVIND16_PAC_0) ‐
0.359183888556*DLOG(WPI06(‐1)/JPGDP(‐1))
Eqn 115: DLOG(XEMPIND12_SATL/(REVIND16_SATL_0/(JQPCMHMN*HPMN))) = ‐0.0033287936204 +
0.0086213418239 + 0.613027514623*DLOG(@MOVAV(REVIND16_SATL_0(‐1),2)/REVIND16_SATL_0) ‐
0.359183888556*DLOG(WPI06(‐1)/JPGDP(‐1))
Eqn 116: DLOG(XEMPIND12_WNC/(REVIND16_WNC_0/(JQPCMHMN*HPMN))) = 0.00997894662549 +
0.0086213418239 + 0.613027514623*DLOG(@MOVAV(REVIND16_WNC_0(‐1),2)/REVIND16_WNC_0) ‐
0.359183888556*DLOG(WPI06(‐1)/JPGDP(‐1))
Eqn 117: DLOG(XEMPIND12_WSC/(REVIND16_WSC_0/(JQPCMHMN*HPMN))) = 0.0100833231562 +
0.0086213418239 + 0.613027514623*DLOG(@MOVAV(REVIND16_WSC_0(‐1),2)/REVIND16_WSC_0) ‐
0.359183888556*DLOG(WPI06(‐1)/JPGDP(‐1))
IND13 ‐ Petroleum refineries
Eqn 118: DLOG(XEMPIND13_ENC/(REVIND21_ENC_0/(JQPCMHMN*HPMN))) = ‐0.0228387938425 +
0.0299134339701 + 0.37796469282*DLOG(@MOVAV(REVIND21_ENC_0(‐1),2)/REVIND21_ENC_0) +
0.019669760093*DLOG(JWSSNF(‐1)/WPI05_ENC(‐1)) + 0.0566931437317*DLOG(WPI057_ENC(‐1)/JPGDP(‐1))
Eqn 119: DLOG(XEMPIND13_ESC/(REVIND21_ESC_0/(JQPCMHMN*HPMN))) = 0.0634833223372 +
0.0299134339701 + 0.37796469282*DLOG(@MOVAV(REVIND21_ESC_0(‐1),2)/REVIND21_ESC_0) +
0.019669760093*DLOG(JWSSNF(‐1)/WPI05_ESC(‐1)) + 0.0566931437317*DLOG(WPI057_ESC(‐1)/JPGDP(‐1))
May 2014
U.S. Energy Information Administration | NEMS Macroeconomic Activity Module Documentation Report 229
Eqn 120: DLOG(XEMPIND13_MATL/(REVIND21_MATL_0/(JQPCMHMN*HPMN))) = ‐0.0493846403008 +
0.0299134339701 + 0.37796469282*DLOG(@MOVAV(REVIND21_MATL_0(‐1),2)/REVIND21_MATL_0) +
0.019669760093*DLOG(JWSSNF(‐1)/WPI05_MATL(‐1)) + 0.0566931437317*DLOG(WPI057_MATL(‐1)/JPGDP(‐1))
Eqn 121: DLOG(XEMPIND13_MTN/(REVIND21_MTN_0/(JQPCMHMN*HPMN))) = ‐0.00276599446048 +
0.0299134339701 + 0.37796469282*DLOG(@MOVAV(REVIND21_MTN_0(‐1),2)/REVIND21_MTN_0) +
0.019669760093*DLOG(JWSSNF(‐1)/WPI05_MTN(‐1)) + 0.0566931437317*DLOG(WPI057_MTN(‐1)/JPGDP(‐1))
Eqn 122: DLOG(XEMPIND13_NENG/(REVIND21_NENG_0/(JQPCMHMN*HPMN))) = ‐0.122923469132 +
0.0299134339701 + 0.37796469282*DLOG(@MOVAV(REVIND21_NENG_0(‐1),2)/REVIND21_NENG_0) +
0.019669760093*DLOG(JWSSNF(‐1)/WPI05_NENG(‐1)) + 0.0566931437317*DLOG(WPI057_NENG(‐1)/JPGDP(‐
1))
Eqn 123: DLOG(XEMPIND13_PAC/(REVIND21_PAC_0/(JQPCMHMN*HPMN))) = ‐0.0341563390844 +
0.0299134339701 + 0.37796469282*DLOG(@MOVAV(REVIND21_PAC_0(‐1),2)/REVIND21_PAC_0) +
0.019669760093*DLOG(JWSSNF(‐1)/WPI05_PAC(‐1)) + 0.0566931437317*DLOG(WPI057_PAC(‐1)/JPGDP(‐1))
Eqn 124: DLOG(XEMPIND13_SATL/(REVIND21_SATL_0/(JQPCMHMN*HPMN))) = 0.241934396971 +
0.0299134339701 + 0.37796469282*DLOG(@MOVAV(REVIND21_SATL_0(‐1),2)/REVIND21_SATL_0) +
0.019669760093*DLOG(JWSSNF(‐1)/WPI05_SATL(‐1)) + 0.0566931437317*DLOG(WPI057_SATL(‐1)/JPGDP(‐1))
Eqn 125: DLOG(XEMPIND13_WNC/(REVIND21_WNC_0/(JQPCMHMN*HPMN))) = ‐0.0315989184206 +
0.0299134339701 + 0.37796469282*DLOG(@MOVAV(REVIND21_WNC_0(‐1),2)/REVIND21_WNC_0) +
0.019669760093*DLOG(JWSSNF(‐1)/WPI05_WNC(‐1)) + 0.0566931437317*DLOG(WPI057_WNC(‐1)/JPGDP(‐1))
Eqn 126: DLOG(XEMPIND13_WSC/(REVIND21_WSC_0/(JQPCMHMN*HPMN))) = ‐0.0417495640672 +
0.0299134339701 + 0.37796469282*DLOG(@MOVAV(REVIND21_WSC_0(‐1),2)/REVIND21_WSC_0) +
0.019669760093*DLOG(JWSSNF(‐1)/WPI05_WSC(‐1)) + 0.0566931437317*DLOG(WPI057_WSC(‐1)/JPGDP(‐1))
IND14 ‐ Other petroleum and coal products
Eqn 127: DLOG(XEMPIND14_ENC/(REVIND22_ENC_0/(JQPCMHMN*HPMN))) = ‐0.0218407162492 +
0.0226276920785 + 0.659769821295*DLOG(@MOVAV(REVIND22_ENC_0(‐1),2)/REVIND22_ENC_0) +
0.0960348284926*DLOG(JWSSNF/WPI05_ENC) + 0.0715636227923*DLOG(WPI0574_ENC/JPGDP)
Eqn 128: DLOG(XEMPIND14_ESC/(REVIND22_ESC_0/(JQPCMHMN*HPMN))) = 0.0198594996478 +
0.0226276920785 + 0.659769821295*DLOG(@MOVAV(REVIND22_ESC_0(‐1),2)/REVIND22_ESC_0) +
0.0960348284926*DLOG(JWSSNF/WPI05_ESC) + 0.0715636227923*DLOG(WPI0574_ESC/JPGDP)
Eqn 129: DLOG(XEMPIND14_MATL/(REVIND22_MATL_0/(JQPCMHMN*HPMN))) = ‐0.00265741442357 +
0.0226276920785 + 0.659769821295*DLOG(@MOVAV(REVIND22_MATL_0(‐1),2)/REVIND22_MATL_0) +
0.0960348284926*DLOG(JWSSNF/WPI05_MATL) + 0.0715636227923*DLOG(WPI0574_MATL/JPGDP)
Eqn 130: DLOG(XEMPIND14_MTN/(REVIND22_MTN_0/(JQPCMHMN*HPMN))) = ‐0.0502263213116 +
0.0226276920785 + 0.659769821295*DLOG(@MOVAV(REVIND22_MTN_0(‐1),2)/REVIND22_MTN_0) +
0.0960348284926*DLOG(JWSSNF/WPI05_MTN) + 0.0715636227923*DLOG(WPI0574_MTN/JPGDP)
May 2014
U.S. Energy Information Administration | NEMS Macroeconomic Activity Module Documentation Report 230
Eqn 131: DLOG(XEMPIND14_NENG/(REVIND22_NENG_0/(JQPCMHMN*HPMN))) = 0.0152909190421 +
0.0226276920785 + 0.659769821295*DLOG(@MOVAV(REVIND22_NENG_0(‐1),2)/REVIND22_NENG_0) +
0.0960348284926*DLOG(JWSSNF/WPI05_NENG) + 0.0715636227923*DLOG(WPI0574_NENG/JPGDP)
Eqn 132: DLOG(XEMPIND14_PAC/(REVIND22_PAC_0/(JQPCMHMN*HPMN))) = 0.0116835820798 +
0.0226276920785 + 0.659769821295*DLOG(@MOVAV(REVIND22_PAC_0(‐1),2)/REVIND22_PAC_0) +
0.0960348284926*DLOG(JWSSNF/WPI05_PAC) + 0.0715636227923*DLOG(WPI0574_PAC/JPGDP)
Eqn 133: DLOG(XEMPIND14_SATL/(REVIND22_SATL_0/(JQPCMHMN*HPMN))) = 0.0451346756399 +
0.0226276920785 + 0.659769821295*DLOG(@MOVAV(REVIND22_SATL_0(‐1),2)/REVIND22_SATL_0) +
0.0960348284926*DLOG(JWSSNF/WPI05_SATL) + 0.0715636227923*DLOG(WPI0574_SATL/JPGDP)
Eqn 134: DLOG(XEMPIND14_WNC/(REVIND22_WNC_0/(JQPCMHMN*HPMN))) = 0.000911061796796 +
0.0226276920785 + 0.659769821295*DLOG(@MOVAV(REVIND22_WNC_0(‐1),2)/REVIND22_WNC_0) +
0.0960348284926*DLOG(JWSSNF/WPI05_WNC) + 0.0715636227923*DLOG(WPI0574_WNC/JPGDP)
Eqn 135: DLOG(XEMPIND14_WSC/(REVIND22_WSC_0/(JQPCMHMN*HPMN))) = ‐0.0181552862219 +
0.0226276920785 + 0.659769821295*DLOG(@MOVAV(REVIND22_WSC_0(‐1),2)/REVIND22_WSC_0) +
0.0960348284926*DLOG(JWSSNF/WPI05_WSC) + 0.0715636227923*DLOG(WPI0574_WSC/JPGDP)
IND15 ‐ Plastics and rubber products
Eqn 136: DLOG(XEMPIND15_ENC/(REVIND23_ENC_0/(JQPCMHMN*HPMN))) = ‐0.00127517597898 +
0.00420678439131 + 0.454879809021*DLOG(@MOVAV(REVIND23_ENC_0(‐1),2)/REVIND23_ENC_0) ‐
0.501479249916*DLOG(@MOVAV(JQPCMHMN(‐1)*HPMN(‐1),2)/(JQPCMHMN*HPMN)) ‐
0.0447497505742*DLOG(WPI05_ENC(‐1)/JPGDP(‐1)) + [AR(1)=0.235331971474]
Eqn 137: DLOG(XEMPIND15_ESC/(REVIND23_ESC_0/(JQPCMHMN*HPMN))) = ‐0.0016921662826 +
0.00420678439131 + 0.454879809021*DLOG(@MOVAV(REVIND23_ESC_0(‐1),2)/REVIND23_ESC_0) ‐
0.501479249916*DLOG(@MOVAV(JQPCMHMN(‐1)*HPMN(‐1),2)/(JQPCMHMN*HPMN)) ‐
0.0447497505742*DLOG(WPI05_ESC(‐1)/JPGDP(‐1)) + [AR(1)=0.235331971474]
Eqn 138: DLOG(XEMPIND15_MATL/(REVIND23_MATL_0/(JQPCMHMN*HPMN))) = 0.00567479244892 +
0.00420678439131 + 0.454879809021*DLOG(@MOVAV(REVIND23_MATL_0(‐1),2)/REVIND23_MATL_0) ‐
0.501479249916*DLOG(@MOVAV(JQPCMHMN(‐1)*HPMN(‐1),2)/(JQPCMHMN*HPMN)) ‐
0.0447497505742*DLOG(WPI05_MATL(‐1)/JPGDP(‐1)) + [AR(1)=0.235331971474]
Eqn 139: DLOG(XEMPIND15_MTN/(REVIND23_MTN_0/(JQPCMHMN*HPMN))) = ‐0.00855642377283 +
0.00420678439131 + 0.454879809021*DLOG(@MOVAV(REVIND23_MTN_0(‐1),2)/REVIND23_MTN_0) ‐
0.501479249916*DLOG(@MOVAV(JQPCMHMN(‐1)*HPMN(‐1),2)/(JQPCMHMN*HPMN)) ‐
0.0447497505742*DLOG(WPI05_MTN(‐1)/JPGDP(‐1)) + [AR(1)=0.235331971474]
Eqn 140: DLOG(XEMPIND15_NENG/(REVIND23_NENG_0/(JQPCMHMN*HPMN))) = 0.00229241580841 +
0.00420678439131 + 0.454879809021*DLOG(@MOVAV(REVIND23_NENG_0(‐1),2)/REVIND23_NENG_0) ‐
0.501479249916*DLOG(@MOVAV(JQPCMHMN(‐1)*HPMN(‐1),2)/(JQPCMHMN*HPMN)) ‐
0.0447497505742*DLOG(WPI05_NENG(‐1)/JPGDP(‐1)) + [AR(1)=0.235331971474]
May 2014
U.S. Energy Information Administration | NEMS Macroeconomic Activity Module Documentation Report 231
Eqn 141: DLOG(XEMPIND15_PAC/(REVIND23_PAC_0/(JQPCMHMN*HPMN))) = 0.00979440887916 +
0.00420678439131 + 0.454879809021*DLOG(@MOVAV(REVIND23_PAC_0(‐1),2)/REVIND23_PAC_0) ‐
0.501479249916*DLOG(@MOVAV(JQPCMHMN(‐1)*HPMN(‐1),2)/(JQPCMHMN*HPMN)) ‐
0.0447497505742*DLOG(WPI05_PAC(‐1)/JPGDP(‐1)) + [AR(1)=0.235331971474]
Eqn 142: DLOG(XEMPIND15_SATL/(REVIND23_SATL_0/(JQPCMHMN*HPMN))) = ‐0.00248756890711 +
0.00420678439131 + 0.454879809021*DLOG(@MOVAV(REVIND23_SATL_0(‐1),2)/REVIND23_SATL_0) ‐
0.501479249916*DLOG(@MOVAV(JQPCMHMN(‐1)*HPMN(‐1),2)/(JQPCMHMN*HPMN)) ‐
0.0447497505742*DLOG(WPI05_SATL(‐1)/JPGDP(‐1)) + [AR(1)=0.235331971474]
Eqn 143: DLOG(XEMPIND15_WNC/(REVIND23_WNC_0/(JQPCMHMN*HPMN))) = ‐0.00463006538449 +
0.00420678439131 + 0.454879809021*DLOG(@MOVAV(REVIND23_WNC_0(‐1),2)/REVIND23_WNC_0) ‐
0.501479249916*DLOG(@MOVAV(JQPCMHMN(‐1)*HPMN(‐1),2)/(JQPCMHMN*HPMN)) ‐
0.0447497505742*DLOG(WPI05_WNC(‐1)/JPGDP(‐1)) + [AR(1)=0.235331971474]
Eqn 144: DLOG(XEMPIND15_WSC/(REVIND23_WSC_0/(JQPCMHMN*HPMN))) = 0.000879783189519 + 0.00420678439131 + 0.454879809021*DLOG(@MOVAV(REVIND23_WSC_0(‐1),2)/REVIND23_WSC_0) ‐ 0.501479249916*DLOG(@MOVAV(JQPCMHMN(‐1)*HPMN(‐1),2)/(JQPCMHMN*HPMN)) ‐ 0.0447497505742*DLOG(WPI05_WSC(‐1)/JPGDP(‐1)) + [AR(1)=0.235331971474]
IND16 ‐ Glass & glass products
Eqn 154: DLOG(XEMPIND16_ENC/(REVIND24_ENC_0/(JQPCMHMD*HPMD))) = 0.00791595829595 +
0.0098177869496 + 0.487962767463*DLOG(@MOVAV(REVIND24_ENC_0(‐1),2)/REVIND24_ENC_0) +
0.0134217751406*D(UTLB00004) + [AR(1)=0.179304685309]
Eqn 155: DLOG(XEMPIND16_ESC/(REVIND24_ESC_0/(JQPCMHMD*HPMD))) = ‐0.0080885575736 +
0.0098177869496 + 0.487962767463*DLOG(@MOVAV(REVIND24_ESC_0(‐1),2)/REVIND24_ESC_0) +
0.0134217751406*D(UTLB00004) + [AR(1)=0.179304685309]
Eqn 156: DLOG(XEMPIND16_MATL/(REVIND24_MATL_0/(JQPCMHMD*HPMD))) = 0.00503742114112 +
0.0098177869496 + 0.487962767463*DLOG(@MOVAV(REVIND24_MATL_0(‐1),2)/REVIND24_MATL_0) +
0.0134217751406*D(UTLB00004) + [AR(1)=0.179304685309]
Eqn 157: DLOG(XEMPIND16_MTN/(REVIND24_MTN_0/(JQPCMHMD*HPMD))) = ‐0.0453654217746 +
0.0098177869496 + 0.487962767463*DLOG(@MOVAV(REVIND24_MTN_0(‐1),2)/REVIND24_MTN_0) +
0.0134217751406*D(UTLB00004) + [AR(1)=0.179304685309]
Eqn 158: DLOG(XEMPIND16_NENG/(REVIND24_NENG_0/(JQPCMHMD*HPMD))) = ‐0.00705393370936 +
0.0098177869496 + 0.487962767463*DLOG(@MOVAV(REVIND24_NENG_0(‐1),2)/REVIND24_NENG_0) +
0.0134217751406*D(UTLB00004) + [AR(1)=0.179304685309]
Eqn 159: DLOG(XEMPIND16_PAC/(REVIND24_PAC_0/(JQPCMHMD*HPMD))) = 0.00390842593149 +
0.0098177869496 + 0.487962767463*DLOG(@MOVAV(REVIND24_PAC_0(‐1),2)/REVIND24_PAC_0) +
0.0134217751406*D(UTLB00004) + [AR(1)=0.179304685309]
May 2014
U.S. Energy Information Administration | NEMS Macroeconomic Activity Module Documentation Report 232
Eqn 160: DLOG(XEMPIND16_SATL/(REVIND24_SATL_0/(JQPCMHMD*HPMD))) = 0.0161090127123 +
0.0098177869496 + 0.487962767463*DLOG(@MOVAV(REVIND24_SATL_0(‐1),2)/REVIND24_SATL_0) +
0.0134217751406*D(UTLB00004) + [AR(1)=0.179304685309]
Eqn 161: DLOG(XEMPIND16_WNC/(REVIND24_WNC_0/(JQPCMHMD*HPMD))) = 0.0204470600653 +
0.0098177869496 + 0.487962767463*DLOG(@MOVAV(REVIND24_WNC_0(‐1),2)/REVIND24_WNC_0) +
0.0134217751406*D(UTLB00004) + [AR(1)=0.179304685309]
Eqn 162: DLOG(XEMPIND16_WSC/(REVIND24_WSC_0/(JQPCMHMD*HPMD))) = 0.00709003491145 +
0.0098177869496 + 0.487962767463*DLOG(@MOVAV(REVIND24_WSC_0(‐1),2)/REVIND24_WSC_0) +
0.0134217751406*D(UTLB00004) + [AR(1)=0.179304685309]
IND17 ‐ Cement manufacturing
Eqn 163: DLOG(XEMPIND17_ENC/(REVIND25_ENC_0/(JQPCMHMD*HPMD))) = ‐0.0202970709889 +
0.0503056547985 + 0.331848369494*DLOG(@MOVAV(REVIND25_ENC_0(‐1),2)/REVIND25_ENC_0) ‐
0.619910369098*DLOG(@MOVAV(JQPCMHMD(‐1)*HPMD(‐1),2)/(JQPCMHMD*HPMD)) ‐
0.136008008304*DLOG(WPI05_ENC(‐1)/JPGDP(‐1)) + [AR(1)=0.0526802279087]
Eqn 164: DLOG(XEMPIND17_ESC/(REVIND25_ESC_0/(JQPCMHMD*HPMD))) = ‐0.0116727079401 + 0.0503056547985 + 0.331848369494*DLOG(@MOVAV(REVIND25_ESC_0(‐1),2)/REVIND25_ESC_0) ‐ 0.619910369098*DLOG(@MOVAV(JQPCMHMD(‐1)*HPMD(‐1),2)/(JQPCMHMD*HPMD)) ‐ 0.136008008304*DLOG(WPI05_ESC(‐1)/JPGDP(‐1)) + [AR(1)=0.0526802279087]
Eqn 165: DLOG(XEMPIND17_MATL/(REVIND25_MATL_0/(JQPCMHMD*HPMD))) = ‐0.0260177723736 +
0.0503056547985 + 0.331848369494*DLOG(@MOVAV(REVIND25_MATL_0(‐1),2)/REVIND25_MATL_0) ‐
0.619910369098*DLOG(@MOVAV(JQPCMHMD(‐1)*HPMD(‐1),2)/(JQPCMHMD*HPMD)) ‐
0.136008008304*DLOG(WPI05_MATL(‐1)/JPGDP(‐1)) + [AR(1)=0.0526802279087]
Eqn 166: DLOG(XEMPIND17_MTN/(REVIND25_MTN_0/(JQPCMHMD*HPMD))) = 0.01440876499 +
0.0503056547985 + 0.331848369494*DLOG(@MOVAV(REVIND25_MTN_0(‐1),2)/REVIND25_MTN_0) ‐
0.619910369098*DLOG(@MOVAV(JQPCMHMD(‐1)*HPMD(‐1),2)/(JQPCMHMD*HPMD)) ‐
0.136008008304*DLOG(WPI05_MTN(‐1)/JPGDP(‐1)) + [AR(1)=0.0526802279087]
Eqn 167: DLOG(XEMPIND17_NENG/(REVIND25_NENG_0/(JQPCMHMD*HPMD))) = 0.0867715565807 +
0.0503056547985 + 0.331848369494*DLOG(@MOVAV(REVIND25_NENG_0(‐1),2)/REVIND25_NENG_0) ‐
0.619910369098*DLOG(@MOVAV(JQPCMHMD(‐1)*HPMD(‐1),2)/(JQPCMHMD*HPMD)) ‐
0.136008008304*DLOG(WPI05_NENG(‐1)/JPGDP(‐1)) + [AR(1)=0.0526802279087]
Eqn 168: DLOG(XEMPIND17_PAC/(REVIND25_PAC_0/(JQPCMHMD*HPMD))) = ‐0.0353916012396 +
0.0503056547985 + 0.331848369494*DLOG(@MOVAV(REVIND25_PAC_0(‐1),2)/REVIND25_PAC_0) ‐
0.619910369098*DLOG(@MOVAV(JQPCMHMD(‐1)*HPMD(‐1),2)/(JQPCMHMD*HPMD)) ‐
0.136008008304*DLOG(WPI05_PAC(‐1)/JPGDP(‐1)) + [AR(1)=0.0526802279087]
Eqn 169: DLOG(XEMPIND17_SATL/(REVIND25_SATL_0/(JQPCMHMD*HPMD))) = ‐0.00533204702633 +
0.0503056547985 + 0.331848369494*DLOG(@MOVAV(REVIND25_SATL_0(‐1),2)/REVIND25_SATL_0) ‐
May 2014
U.S. Energy Information Administration | NEMS Macroeconomic Activity Module Documentation Report 233
0.619910369098*DLOG(@MOVAV(JQPCMHMD(‐1)*HPMD(‐1),2)/(JQPCMHMD*HPMD)) ‐
0.136008008304*DLOG(WPI05_SATL(‐1)/JPGDP(‐1)) + [AR(1)=0.0526802279087]
Eqn 170: DLOG(XEMPIND17_WNC/(REVIND25_WNC_0/(JQPCMHMD*HPMD))) = 0.0237513721648 +
0.0503056547985 + 0.331848369494*DLOG(@MOVAV(REVIND25_WNC_0(‐1),2)/REVIND25_WNC_0) ‐
0.619910369098*DLOG(@MOVAV(JQPCMHMD(‐1)*HPMD(‐1),2)/(JQPCMHMD*HPMD)) ‐
0.136008008304*DLOG(WPI05_WNC(‐1)/JPGDP(‐1)) + [AR(1)=0.0526802279087]
Eqn 171: DLOG(XEMPIND17_WSC/(REVIND25_WSC_0/(JQPCMHMD*HPMD))) = ‐0.026220494167 +
0.0503056547985 + 0.331848369494*DLOG(@MOVAV(REVIND25_WSC_0(‐1),2)/REVIND25_WSC_0) ‐
0.619910369098*DLOG(@MOVAV(JQPCMHMD(‐1)*HPMD(‐1),2)/(JQPCMHMD*HPMD)) ‐
0.136008008304*DLOG(WPI05_WSC(‐1)/JPGDP(‐1)) + [AR(1)=0.0526802279087]
IND18 ‐ Other nonmetallic mineral products
Eqn 172: DLOG(XEMPIND18_ENC/(REVIND26_ENC_0/(JQPCMHMD*HPMD))) = ‐0.0022426882943 +
0.0389022937171 + 0.519040990667*DLOG(@MOVAV(REVIND26_ENC_0(‐1),2)/REVIND26_ENC_0) ‐
0.612862772687*DLOG(@MOVAV(JQPCMHMD(‐1)*HPMD(‐1),2)/(JQPCMHMD*HPMD)) +
[AR(1)=0.0692051602377]
Eqn 173: DLOG(XEMPIND18_ESC/(REVIND26_ESC_0/(JQPCMHMD*HPMD))) = ‐0.000717269142973 +
0.0389022937171 + 0.519040990667*DLOG(@MOVAV(REVIND26_ESC_0(‐1),2)/REVIND26_ESC_0) ‐
0.612862772687*DLOG(@MOVAV(JQPCMHMD(‐1)*HPMD(‐1),2)/(JQPCMHMD*HPMD)) +
[AR(1)=0.0692051602377]
Eqn 174: DLOG(XEMPIND18_MATL/(REVIND26_MATL_0/(JQPCMHMD*HPMD))) = ‐0.000703695974392 +
0.0389022937171 + 0.519040990667*DLOG(@MOVAV(REVIND26_MATL_0(‐1),2)/REVIND26_MATL_0) ‐
0.612862772687*DLOG(@MOVAV(JQPCMHMD(‐1)*HPMD(‐1),2)/(JQPCMHMD*HPMD)) +
[AR(1)=0.0692051602377]
Eqn 175: DLOG(XEMPIND18_MTN/(REVIND26_MTN_0/(JQPCMHMD*HPMD))) = ‐0.0102036280168 +
0.0389022937171 + 0.519040990667*DLOG(@MOVAV(REVIND26_MTN_0(‐1),2)/REVIND26_MTN_0) ‐
0.612862772687*DLOG(@MOVAV(JQPCMHMD(‐1)*HPMD(‐1),2)/(JQPCMHMD*HPMD)) +
[AR(1)=0.0692051602377]
Eqn 176: DLOG(XEMPIND18_NENG/(REVIND26_NENG_0/(JQPCMHMD*HPMD))) = 0.00953027783338 +
0.0389022937171 + 0.519040990667*DLOG(@MOVAV(REVIND26_NENG_0(‐1),2)/REVIND26_NENG_0) ‐
0.612862772687*DLOG(@MOVAV(JQPCMHMD(‐1)*HPMD(‐1),2)/(JQPCMHMD*HPMD)) +
[AR(1)=0.0692051602377]
Eqn 177: DLOG(XEMPIND18_PAC/(REVIND26_PAC_0/(JQPCMHMD*HPMD))) = 0.00378269954236 +
0.0389022937171 + 0.519040990667*DLOG(@MOVAV(REVIND26_PAC_0(‐1),2)/REVIND26_PAC_0) ‐
0.612862772687*DLOG(@MOVAV(JQPCMHMD(‐1)*HPMD(‐1),2)/(JQPCMHMD*HPMD)) +
[AR(1)=0.0692051602377]
May 2014
U.S. Energy Information Administration | NEMS Macroeconomic Activity Module Documentation Report 234
Eqn 178: DLOG(XEMPIND18_SATL/(REVIND26_SATL_0/(JQPCMHMD*HPMD))) = 0.00106727722287 +
0.0389022937171 + 0.519040990667*DLOG(@MOVAV(REVIND26_SATL_0(‐1),2)/REVIND26_SATL_0) ‐
0.612862772687*DLOG(@MOVAV(JQPCMHMD(‐1)*HPMD(‐1),2)/(JQPCMHMD*HPMD)) +
[AR(1)=0.0692051602377]
Eqn 179: DLOG(XEMPIND18_WNC/(REVIND26_WNC_0/(JQPCMHMD*HPMD))) = 0.00326096970352 + 0.0389022937171 + 0.519040990667*DLOG(@MOVAV(REVIND26_WNC_0(‐1),2)/REVIND26_WNC_0) ‐ 0.612862772687*DLOG(@MOVAV(JQPCMHMD(‐1)*HPMD(‐1),2)/(JQPCMHMD*HPMD)) + [AR(1)=0.0692051602377]
Eqn 180: DLOG(XEMPIND18_WSC/(REVIND26_WSC_0/(JQPCMHMD*HPMD))) = ‐0.00377394287369 + 0.0389022937171 + 0.519040990667*DLOG(@MOVAV(REVIND26_WSC_0(‐1),2)/REVIND26_WSC_0) ‐ 0.612862772687*DLOG(@MOVAV(JQPCMHMD(‐1)*HPMD(‐1),2)/(JQPCMHMD*HPMD)) + [AR(1)=0.0692051602377]
IND19 ‐ Iron & steel mills, ferroalloy & steel products
Eqn 181: DLOG(XEMPIND19_ENC/(REVIND27_ENC_0/(JQPCMHMD*HPMD))) = ‐0.00448887154683 +
0.0127753219411 + 0.609058970056*DLOG(@MOVAV(REVIND27_ENC_0(‐1),2)/REVIND27_ENC_0) ‐
0.848608842313*DLOG(@MOVAV(JQPCMHMD(‐1)*HPMD(‐1),2)/(JQPCMHMD*HPMD)) + [AR(1)=‐
0.183657186798]
Eqn 182: DLOG(XEMPIND19_ESC/(REVIND27_ESC_0/(JQPCMHMD*HPMD))) = ‐0.000202386061244 +
0.0127753219411 + 0.609058970056*DLOG(@MOVAV(REVIND27_ESC_0(‐1),2)/REVIND27_ESC_0) ‐
0.848608842313*DLOG(@MOVAV(JQPCMHMD(‐1)*HPMD(‐1),2)/(JQPCMHMD*HPMD)) + [AR(1)=‐
0.183657186798]
Eqn 183: DLOG(XEMPIND19_MATL/(REVIND27_MATL_0/(JQPCMHMD*HPMD))) = ‐0.00795366995675 +
0.0127753219411 + 0.609058970056*DLOG(@MOVAV(REVIND27_MATL_0(‐1),2)/REVIND27_MATL_0) ‐
0.848608842313*DLOG(@MOVAV(JQPCMHMD(‐1)*HPMD(‐1),2)/(JQPCMHMD*HPMD)) + [AR(1)=‐
0.183657186798]
Eqn 184: DLOG(XEMPIND19_MTN/(REVIND27_MTN_0/(JQPCMHMD*HPMD))) = ‐0.0682976496353 +
0.0127753219411 + 0.609058970056*DLOG(@MOVAV(REVIND27_MTN_0(‐1),2)/REVIND27_MTN_0) ‐
0.848608842313*DLOG(@MOVAV(JQPCMHMD(‐1)*HPMD(‐1),2)/(JQPCMHMD*HPMD)) + [AR(1)=‐
0.183657186798]
Eqn 185: DLOG(XEMPIND19_NENG/(REVIND27_NENG_0/(JQPCMHMD*HPMD))) = 0.0148983771019 +
0.0127753219411 + 0.609058970056*DLOG(@MOVAV(REVIND27_NENG_0(‐1),2)/REVIND27_NENG_0) ‐
0.848608842313*DLOG(@MOVAV(JQPCMHMD(‐1)*HPMD(‐1),2)/(JQPCMHMD*HPMD)) + [AR(1)=‐
0.183657186798]
Eqn 186: DLOG(XEMPIND19_PAC/(REVIND27_PAC_0/(JQPCMHMD*HPMD))) = ‐0.00896344496048 +
0.0127753219411 + 0.609058970056*DLOG(@MOVAV(REVIND27_PAC_0(‐1),2)/REVIND27_PAC_0) ‐
0.848608842313*DLOG(@MOVAV(JQPCMHMD(‐1)*HPMD(‐1),2)/(JQPCMHMD*HPMD)) + [AR(1)=‐
0.183657186798]
May 2014
U.S. Energy Information Administration | NEMS Macroeconomic Activity Module Documentation Report 235
Eqn 187: DLOG(XEMPIND19_SATL/(REVIND27_SATL_0/(JQPCMHMD*HPMD))) = 0.0128029941552 +
0.0127753219411 + 0.609058970056*DLOG(@MOVAV(REVIND27_SATL_0(‐1),2)/REVIND27_SATL_0) ‐
0.848608842313*DLOG(@MOVAV(JQPCMHMD(‐1)*HPMD(‐1),2)/(JQPCMHMD*HPMD)) + [AR(1)=‐
0.183657186798]
Eqn 188: DLOG(XEMPIND19_WNC/(REVIND27_WNC_0/(JQPCMHMD*HPMD))) = 0.0751981470009 +
0.0127753219411 + 0.609058970056*DLOG(@MOVAV(REVIND27_WNC_0(‐1),2)/REVIND27_WNC_0) ‐
0.848608842313*DLOG(@MOVAV(JQPCMHMD(‐1)*HPMD(‐1),2)/(JQPCMHMD*HPMD)) + [AR(1)=‐
0.183657186798]
Eqn 189: DLOG(XEMPIND19_WSC/(REVIND27_WSC_0/(JQPCMHMD*HPMD))) = ‐0.0129934960973 +
0.0127753219411 + 0.609058970056*DLOG(@MOVAV(REVIND27_WSC_0(‐1),2)/REVIND27_WSC_0) ‐
0.848608842313*DLOG(@MOVAV(JQPCMHMD(‐1)*HPMD(‐1),2)/(JQPCMHMD*HPMD)) + [AR(1)=‐
0.183657186798]
IND20 ‐ Alumina & aluminum products
Eqn 190: DLOG(XEMPIND20_ENC/(REVIND28_ENC_0/(JQPCMHMD*HPMD))) = 0.00520822075512 +
0.0210472188053 + 0.30801916627*DLOG(@MOVAV(REVIND28_ENC_0(‐1),2)/REVIND28_ENC_0) +
0.00573009909*D(UTLB00004(‐1)) + [AR(1)=‐0.253008090875]
Eqn 191: DLOG(XEMPIND20_ESC/(REVIND28_ESC_0/(JQPCMHMD*HPMD))) = 0.00657437710158 +
0.0210472188053 + 0.30801916627*DLOG(@MOVAV(REVIND28_ESC_0(‐1),2)/REVIND28_ESC_0) +
0.00573009909*D(UTLB00004(‐1)) + [AR(1)=‐0.253008090875]
Eqn 192: DLOG(XEMPIND20_MATL/(REVIND28_MATL_0/(JQPCMHMD*HPMD))) = ‐0.00211415046294 +
0.0210472188053 + 0.30801916627*DLOG(@MOVAV(REVIND28_MATL_0(‐1),2)/REVIND28_MATL_0) +
0.00573009909*D(UTLB00004(‐1)) + [AR(1)=‐0.253008090875]
Eqn 193: DLOG(XEMPIND20_MTN/(REVIND28_MTN_0/(JQPCMHMD*HPMD))) = ‐0.00890206708793 +
0.0210472188053 + 0.30801916627*DLOG(@MOVAV(REVIND28_MTN_0(‐1),2)/REVIND28_MTN_0) +
0.00573009909*D(UTLB00004(‐1)) + [AR(1)=‐0.253008090875]
Eqn 194: DLOG(XEMPIND20_NENG/(REVIND28_NENG_0/(JQPCMHMD*HPMD))) = ‐0.0075619273917 +
0.0210472188053 + 0.30801916627*DLOG(@MOVAV(REVIND28_NENG_0(‐1),2)/REVIND28_NENG_0) +
0.00573009909*D(UTLB00004(‐1)) + [AR(1)=‐0.253008090875]
Eqn 195: DLOG(XEMPIND20_PAC/(REVIND28_PAC_0/(JQPCMHMD*HPMD))) = ‐0.0223015730463 +
0.0210472188053 + 0.30801916627*DLOG(@MOVAV(REVIND28_PAC_0(‐1),2)/REVIND28_PAC_0) +
0.00573009909*D(UTLB00004(‐1)) + [AR(1)=‐0.253008090875]
Eqn 196: DLOG(XEMPIND20_SATL/(REVIND28_SATL_0/(JQPCMHMD*HPMD))) = ‐0.0129671081011 +
0.0210472188053 + 0.30801916627*DLOG(@MOVAV(REVIND28_SATL_0(‐1),2)/REVIND28_SATL_0) +
0.00573009909*D(UTLB00004(‐1)) + [AR(1)=‐0.253008090875]
May 2014
U.S. Energy Information Administration | NEMS Macroeconomic Activity Module Documentation Report 236
Eqn 197: DLOG(XEMPIND20_WNC/(REVIND28_WNC_0/(JQPCMHMD*HPMD))) = 0.0476550091256 +
0.0210472188053 + 0.30801916627*DLOG(@MOVAV(REVIND28_WNC_0(‐1),2)/REVIND28_WNC_0) +
0.00573009909*D(UTLB00004(‐1)) + [AR(1)=‐0.253008090875]
Eqn 198: DLOG(XEMPIND20_WSC/(REVIND28_WSC_0/(JQPCMHMD*HPMD))) = ‐0.00559078089226 +
0.0210472188053 + 0.30801916627*DLOG(@MOVAV(REVIND28_WSC_0(‐1),2)/REVIND28_WSC_0) +
0.00573009909*D(UTLB00004(‐1)) + [AR(1)=‐0.253008090875]
IND21 ‐ Other primary metals
Eqn 199: DLOG(XEMPIND21_ENC/(REVIND29_ENC_0/(JQPCMHMD*HPMD))) = ‐0.0189190859675 +
0.0248601864376 + 0.649751816595*DLOG(@MOVAV(REVIND29_ENC_0(‐1),2)/REVIND29_ENC_0) ‐
1.0295425418*DLOG(@MOVAV(JQPCMHMD(‐1)*HPMD(‐1),2)/(JQPCMHMD*HPMD)) +
[AR(1)=0.334095540659]
Eqn 200: DLOG(XEMPIND21_ESC/(REVIND29_ESC_0/(JQPCMHMD*HPMD))) = ‐0.0069742081073 +
0.0248601864376 + 0.649751816595*DLOG(@MOVAV(REVIND29_ESC_0(‐1),2)/REVIND29_ESC_0) ‐
1.0295425418*DLOG(@MOVAV(JQPCMHMD(‐1)*HPMD(‐1),2)/(JQPCMHMD*HPMD)) +
[AR(1)=0.334095540659]
Eqn 201: DLOG(XEMPIND21_MATL/(REVIND29_MATL_0/(JQPCMHMD*HPMD))) = ‐0.00401492594374 +
0.0248601864376 + 0.649751816595*DLOG(@MOVAV(REVIND29_MATL_0(‐1),2)/REVIND29_MATL_0) ‐
1.0295425418*DLOG(@MOVAV(JQPCMHMD(‐1)*HPMD(‐1),2)/(JQPCMHMD*HPMD)) +
[AR(1)=0.334095540659]
Eqn 202: DLOG(XEMPIND21_MTN/(REVIND29_MTN_0/(JQPCMHMD*HPMD))) = 0.0127762924215 +
0.0248601864376 + 0.649751816595*DLOG(@MOVAV(REVIND29_MTN_0(‐1),2)/REVIND29_MTN_0) ‐
1.0295425418*DLOG(@MOVAV(JQPCMHMD(‐1)*HPMD(‐1),2)/(JQPCMHMD*HPMD)) +
[AR(1)=0.334095540659]
Eqn 203: DLOG(XEMPIND21_NENG/(REVIND29_NENG_0/(JQPCMHMD*HPMD))) = 0.02278518168 +
0.0248601864376 + 0.649751816595*DLOG(@MOVAV(REVIND29_NENG_0(‐1),2)/REVIND29_NENG_0) ‐
1.0295425418*DLOG(@MOVAV(JQPCMHMD(‐1)*HPMD(‐1),2)/(JQPCMHMD*HPMD)) +
[AR(1)=0.334095540659]
Eqn 204: DLOG(XEMPIND21_PAC/(REVIND29_PAC_0/(JQPCMHMD*HPMD))) = 0.0242271668159 +
0.0248601864376 + 0.649751816595*DLOG(@MOVAV(REVIND29_PAC_0(‐1),2)/REVIND29_PAC_0) ‐
1.0295425418*DLOG(@MOVAV(JQPCMHMD(‐1)*HPMD(‐1),2)/(JQPCMHMD*HPMD)) +
[AR(1)=0.334095540659]
Eqn 205: DLOG(XEMPIND21_SATL/(REVIND29_SATL_0/(JQPCMHMD*HPMD))) = ‐0.00647286046893 +
0.0248601864376 + 0.649751816595*DLOG(@MOVAV(REVIND29_SATL_0(‐1),2)/REVIND29_SATL_0) ‐
1.0295425418*DLOG(@MOVAV(JQPCMHMD(‐1)*HPMD(‐1),2)/(JQPCMHMD*HPMD)) +
[AR(1)=0.334095540659]
May 2014
U.S. Energy Information Administration | NEMS Macroeconomic Activity Module Documentation Report 237
Eqn 206: DLOG(XEMPIND21_WNC/(REVIND29_WNC_0/(JQPCMHMD*HPMD))) = ‐0.0106307160914 +
0.0248601864376 + 0.649751816595*DLOG(@MOVAV(REVIND29_WNC_0(‐1),2)/REVIND29_WNC_0) ‐
1.0295425418*DLOG(@MOVAV(JQPCMHMD(‐1)*HPMD(‐1),2)/(JQPCMHMD*HPMD)) +
[AR(1)=0.334095540659]
Eqn 207: DLOG(XEMPIND21_WSC/(REVIND29_WSC_0/(JQPCMHMD*HPMD))) = ‐0.0127768443385 +
0.0248601864376 + 0.649751816595*DLOG(@MOVAV(REVIND29_WSC_0(‐1),2)/REVIND29_WSC_0) ‐
1.0295425418*DLOG(@MOVAV(JQPCMHMD(‐1)*HPMD(‐1),2)/(JQPCMHMD*HPMD)) +
[AR(1)=0.334095540659]
IND22 ‐ Fabricated metal products
Eqn 208: DLOG(XEMPIND22_ENC/(REVIND30_ENC_0/(JQPCMHMD*HPMD))) = ‐0.0049206285285 +
0.0266474676779 + 0.315069471348*DLOG(@MOVAV(REVIND30_ENC_0(‐1),2)/REVIND30_ENC_0) ‐
0.449971168083*DLOG(@MOVAV(JQPCMHMD(‐1)*HPMD(‐1),2)/(JQPCMHMD*HPMD)) ‐
0.031558151693*DLOG(WPI05_ENC(‐1)/JPGDP(‐1))
Eqn 209: DLOG(XEMPIND22_ESC/(REVIND30_ESC_0/(JQPCMHMD*HPMD))) = 4.39122635691e‐05 +
0.0266474676779 + 0.315069471348*DLOG(@MOVAV(REVIND30_ESC_0(‐1),2)/REVIND30_ESC_0) ‐
0.449971168083*DLOG(@MOVAV(JQPCMHMD(‐1)*HPMD(‐1),2)/(JQPCMHMD*HPMD)) ‐
0.031558151693*DLOG(WPI05_ESC(‐1)/JPGDP(‐1))
Eqn 210: DLOG(XEMPIND22_MATL/(REVIND30_MATL_0/(JQPCMHMD*HPMD))) = ‐0.000612535095663 +
0.0266474676779 + 0.315069471348*DLOG(@MOVAV(REVIND30_MATL_0(‐1),2)/REVIND30_MATL_0) ‐
0.449971168083*DLOG(@MOVAV(JQPCMHMD(‐1)*HPMD(‐1),2)/(JQPCMHMD*HPMD)) ‐
0.031558151693*DLOG(WPI05_MATL(‐1)/JPGDP(‐1))
Eqn 211: DLOG(XEMPIND22_MTN/(REVIND30_MTN_0/(JQPCMHMD*HPMD))) = 0.000437625356866 +
0.0266474676779 + 0.315069471348*DLOG(@MOVAV(REVIND30_MTN_0(‐1),2)/REVIND30_MTN_0) ‐
0.449971168083*DLOG(@MOVAV(JQPCMHMD(‐1)*HPMD(‐1),2)/(JQPCMHMD*HPMD)) ‐
0.031558151693*DLOG(WPI05_MTN(‐1)/JPGDP(‐1))
Eqn 212: DLOG(XEMPIND22_NENG/(REVIND30_NENG_0/(JQPCMHMD*HPMD))) = ‐0.00042602526223 +
0.0266474676779 + 0.315069471348*DLOG(@MOVAV(REVIND30_NENG_0(‐1),2)/REVIND30_NENG_0) ‐
0.449971168083*DLOG(@MOVAV(JQPCMHMD(‐1)*HPMD(‐1),2)/(JQPCMHMD*HPMD)) ‐
0.031558151693*DLOG(WPI05_NENG(‐1)/JPGDP(‐1))
Eqn 213: DLOG(XEMPIND22_PAC/(REVIND30_PAC_0/(JQPCMHMD*HPMD))) = 0.00564908084758 +
0.0266474676779 + 0.315069471348*DLOG(@MOVAV(REVIND30_PAC_0(‐1),2)/REVIND30_PAC_0) ‐
0.449971168083*DLOG(@MOVAV(JQPCMHMD(‐1)*HPMD(‐1),2)/(JQPCMHMD*HPMD)) ‐
0.031558151693*DLOG(WPI05_PAC(‐1)/JPGDP(‐1))
Eqn 214: DLOG(XEMPIND22_SATL/(REVIND30_SATL_0/(JQPCMHMD*HPMD))) = 0.00176714807496 +
0.0266474676779 + 0.315069471348*DLOG(@MOVAV(REVIND30_SATL_0(‐1),2)/REVIND30_SATL_0) ‐
0.449971168083*DLOG(@MOVAV(JQPCMHMD(‐1)*HPMD(‐1),2)/(JQPCMHMD*HPMD)) ‐
0.031558151693*DLOG(WPI05_SATL(‐1)/JPGDP(‐1))
May 2014
U.S. Energy Information Administration | NEMS Macroeconomic Activity Module Documentation Report 238
Eqn 215: DLOG(XEMPIND22_WNC/(REVIND30_WNC_0/(JQPCMHMD*HPMD))) = 0.00162277466309 +
0.0266474676779 + 0.315069471348*DLOG(@MOVAV(REVIND30_WNC_0(‐1),2)/REVIND30_WNC_0) ‐
0.449971168083*DLOG(@MOVAV(JQPCMHMD(‐1)*HPMD(‐1),2)/(JQPCMHMD*HPMD)) ‐
0.031558151693*DLOG(WPI05_WNC(‐1)/JPGDP(‐1))
Eqn 216: DLOG(XEMPIND22_WSC/(REVIND30_WSC_0/(JQPCMHMD*HPMD))) = ‐0.00356135231967 +
0.0266474676779 + 0.315069471348*DLOG(@MOVAV(REVIND30_WSC_0(‐1),2)/REVIND30_WSC_0) ‐
0.449971168083*DLOG(@MOVAV(JQPCMHMD(‐1)*HPMD(‐1),2)/(JQPCMHMD*HPMD)) ‐
0.031558151693*DLOG(WPI05_WSC(‐1)/JPGDP(‐1))
IND23 ‐ Machinery
Eqn 217: DLOG(XEMPIND23_ENC/(REVIND31_ENC_0/(JQPCMHMD*HPMD))) = ‐0.00350700297546 ‐
0.0193190143437 + 0.512143962091*DLOG(@MOVAV(REVIND31_ENC_0(‐1),2)/REVIND31_ENC_0) ‐
0.720721738121*DLOG(@MOVAV(JQPCMHMD(‐1)*HPMD(‐1),2)/(JQPCMHMD*HPMD)) ‐
2.06864274101*DLOG(WPI11(‐1)/JPGDP(‐1))
Eqn 218: DLOG(XEMPIND23_ESC/(REVIND31_ESC_0/(JQPCMHMD*HPMD))) = ‐0.00065007386518 ‐
0.0193190143437 + 0.512143962091*DLOG(@MOVAV(REVIND31_ESC_0(‐1),2)/REVIND31_ESC_0) ‐
0.720721738121*DLOG(@MOVAV(JQPCMHMD(‐1)*HPMD(‐1),2)/(JQPCMHMD*HPMD)) ‐
2.06864274101*DLOG(WPI11(‐1)/JPGDP(‐1))
Eqn 219: DLOG(XEMPIND23_MATL/(REVIND31_MATL_0/(JQPCMHMD*HPMD))) = 0.00731342701174 ‐
0.0193190143437 + 0.512143962091*DLOG(@MOVAV(REVIND31_MATL_0(‐1),2)/REVIND31_MATL_0) ‐
0.720721738121*DLOG(@MOVAV(JQPCMHMD(‐1)*HPMD(‐1),2)/(JQPCMHMD*HPMD)) ‐
2.06864274101*DLOG(WPI11(‐1)/JPGDP(‐1))
Eqn 220: DLOG(XEMPIND23_MTN/(REVIND31_MTN_0/(JQPCMHMD*HPMD))) = ‐0.0010182122624 ‐
0.0193190143437 + 0.512143962091*DLOG(@MOVAV(REVIND31_MTN_0(‐1),2)/REVIND31_MTN_0) ‐
0.720721738121*DLOG(@MOVAV(JQPCMHMD(‐1)*HPMD(‐1),2)/(JQPCMHMD*HPMD)) ‐
2.06864274101*DLOG(WPI11(‐1)/JPGDP(‐1))
Eqn 221: DLOG(XEMPIND23_NENG/(REVIND31_NENG_0/(JQPCMHMD*HPMD))) = 0.00890302016647 ‐
0.0193190143437 + 0.512143962091*DLOG(@MOVAV(REVIND31_NENG_0(‐1),2)/REVIND31_NENG_0) ‐
0.720721738121*DLOG(@MOVAV(JQPCMHMD(‐1)*HPMD(‐1),2)/(JQPCMHMD*HPMD)) ‐
2.06864274101*DLOG(WPI11(‐1)/JPGDP(‐1))
Eqn 222: DLOG(XEMPIND23_PAC/(REVIND31_PAC_0/(JQPCMHMD*HPMD))) = ‐0.0010065197406 ‐
0.0193190143437 + 0.512143962091*DLOG(@MOVAV(REVIND31_PAC_0(‐1),2)/REVIND31_PAC_0) ‐
0.720721738121*DLOG(@MOVAV(JQPCMHMD(‐1)*HPMD(‐1),2)/(JQPCMHMD*HPMD)) ‐
2.06864274101*DLOG(WPI11(‐1)/JPGDP(‐1))
Eqn 223: DLOG(XEMPIND23_SATL/(REVIND31_SATL_0/(JQPCMHMD*HPMD))) = ‐0.0016893722742 ‐
0.0193190143437 + 0.512143962091*DLOG(@MOVAV(REVIND31_SATL_0(‐1),2)/REVIND31_SATL_0) ‐
0.720721738121*DLOG(@MOVAV(JQPCMHMD(‐1)*HPMD(‐1),2)/(JQPCMHMD*HPMD)) ‐
2.06864274101*DLOG(WPI11(‐1)/JPGDP(‐1))
May 2014
U.S. Energy Information Administration | NEMS Macroeconomic Activity Module Documentation Report 239
Eqn 224: DLOG(XEMPIND23_WNC/(REVIND31_WNC_0/(JQPCMHMD*HPMD))) = 0.00204985155991 ‐
0.0193190143437 + 0.512143962091*DLOG(@MOVAV(REVIND31_WNC_0(‐1),2)/REVIND31_WNC_0) ‐
0.720721738121*DLOG(@MOVAV(JQPCMHMD(‐1)*HPMD(‐1),2)/(JQPCMHMD*HPMD)) ‐
2.06864274101*DLOG(WPI11(‐1)/JPGDP(‐1))
Eqn 225: DLOG(XEMPIND23_WSC/(REVIND31_WSC_0/(JQPCMHMD*HPMD))) = ‐0.0103951176203 ‐
0.0193190143437 + 0.512143962091*DLOG(@MOVAV(REVIND31_WSC_0(‐1),2)/REVIND31_WSC_0) ‐
0.720721738121*DLOG(@MOVAV(JQPCMHMD(‐1)*HPMD(‐1),2)/(JQPCMHMD*HPMD)) ‐
2.06864274101*DLOG(WPI11(‐1)/JPGDP(‐1))
IND24 ‐ Other electronic & electric products
Eqn 226: DLOG(XEMPIND24_ENC/(REVIND32_ENC_0/(JQPCMHMD*HPMD))) = ‐0.0240162189353 ‐
0.00154784778086 + 0.563335102738*DLOG(@MOVAV(REVIND32_ENC_0(‐1),2)/REVIND32_ENC_0) ‐
0.655554744741*DLOG(@MOVAV(JQPCMHMD(‐1)*HPMD(‐1),2)/(JQPCMHMD*HPMD))
Eqn 227: DLOG(XEMPIND24_ESC/(REVIND32_ESC_0/(JQPCMHMD*HPMD))) = ‐0.03745319521 ‐
0.00154784778086 + 0.563335102738*DLOG(@MOVAV(REVIND32_ESC_0(‐1),2)/REVIND32_ESC_0) ‐
0.655554744741*DLOG(@MOVAV(JQPCMHMD(‐1)*HPMD(‐1),2)/(JQPCMHMD*HPMD))
Eqn 228: DLOG(XEMPIND24_MATL/(REVIND32_MATL_0/(JQPCMHMD*HPMD))) = 0.0087011240834 ‐
0.00154784778086 + 0.563335102738*DLOG(@MOVAV(REVIND32_MATL_0(‐1),2)/REVIND32_MATL_0) ‐
0.655554744741*DLOG(@MOVAV(JQPCMHMD(‐1)*HPMD(‐1),2)/(JQPCMHMD*HPMD))
Eqn 229: DLOG(XEMPIND24_MTN/(REVIND32_MTN_0/(JQPCMHMD*HPMD))) = 0.0208561574618 ‐
0.00154784778086 + 0.563335102738*DLOG(@MOVAV(REVIND32_MTN_0(‐1),2)/REVIND32_MTN_0) ‐
0.655554744741*DLOG(@MOVAV(JQPCMHMD(‐1)*HPMD(‐1),2)/(JQPCMHMD*HPMD))
Eqn :230 DLOG(XEMPIND24_NENG/(REVIND32_NENG_0/(JQPCMHMD*HPMD))) = 0.000112785392711 ‐
0.00154784778086 + 0.563335102738*DLOG(@MOVAV(REVIND32_NENG_0(‐1),2)/REVIND32_NENG_0) ‐
0.655554744741*DLOG(@MOVAV(JQPCMHMD(‐1)*HPMD(‐1),2)/(JQPCMHMD*HPMD))
Eqn 231: DLOG(XEMPIND24_PAC/(REVIND32_PAC_0/(JQPCMHMD*HPMD))) = 0.0139491988581 ‐
0.00154784778086 + 0.563335102738*DLOG(@MOVAV(REVIND32_PAC_0(‐1),2)/REVIND32_PAC_0) ‐
0.655554744741*DLOG(@MOVAV(JQPCMHMD(‐1)*HPMD(‐1),2)/(JQPCMHMD*HPMD))
Eqn 232: DLOG(XEMPIND24_SATL/(REVIND32_SATL_0/(JQPCMHMD*HPMD))) = 0.00850666017553 ‐
0.00154784778086 + 0.563335102738*DLOG(@MOVAV(REVIND32_SATL_0(‐1),2)/REVIND32_SATL_0) ‐
0.655554744741*DLOG(@MOVAV(JQPCMHMD(‐1)*HPMD(‐1),2)/(JQPCMHMD*HPMD))
Eqn 233: DLOG(XEMPIND24_WNC/(REVIND32_WNC_0/(JQPCMHMD*HPMD))) = 0.00965024954015 ‐
0.00154784778086 + 0.563335102738*DLOG(@MOVAV(REVIND32_WNC_0(‐1),2)/REVIND32_WNC_0) ‐
0.655554744741*DLOG(@MOVAV(JQPCMHMD(‐1)*HPMD(‐1),2)/(JQPCMHMD*HPMD))
May 2014
U.S. Energy Information Administration | NEMS Macroeconomic Activity Module Documentation Report 240
Eqn 234: DLOG(XEMPIND24_WSC/(REVIND32_WSC_0/(JQPCMHMD*HPMD))) = ‐0.000306761366391 ‐
0.00154784778086 + 0.563335102738*DLOG(@MOVAV(REVIND32_WSC_0(‐1),2)/REVIND32_WSC_0) ‐
0.655554744741*DLOG(@MOVAV(JQPCMHMD(‐1)*HPMD(‐1),2)/(JQPCMHMD*HPMD))
IND25 ‐ Transportation equipment
Eqn 235: DLOG(XEMPIND25_ENC/(REVIND33_ENC_0/(JQPCMHMD*HPMD))) = ‐0.00840898053802 +
0.0238634005542 + 0.470712659822*DLOG(@MOVAV(REVIND33_ENC_0(‐1),2)/REVIND33_ENC_0) ‐
0.659969415986*DLOG(@MOVAV(JQPCMHMD(‐1)*HPMD(‐1),2)/(JQPCMHMD*HPMD)) ‐
0.546871675987*DLOG(JWSSNF(‐1)/JPGDP(‐1))
Eqn 236: DLOG(XEMPIND25_ESC/(REVIND33_ESC_0/(JQPCMHMD*HPMD))) = 0.00278752129296 +
0.0238634005542 + 0.470712659822*DLOG(@MOVAV(REVIND33_ESC_0(‐1),2)/REVIND33_ESC_0) ‐
0.659969415986*DLOG(@MOVAV(JQPCMHMD(‐1)*HPMD(‐1),2)/(JQPCMHMD*HPMD)) ‐
0.546871675987*DLOG(JWSSNF(‐1)/JPGDP(‐1))
Eqn 237: DLOG(XEMPIND25_MATL/(REVIND33_MATL_0/(JQPCMHMD*HPMD))) = ‐0.0068421191003 +
0.0238634005542 + 0.470712659822*DLOG(@MOVAV(REVIND33_MATL_0(‐1),2)/REVIND33_MATL_0) ‐
0.659969415986*DLOG(@MOVAV(JQPCMHMD(‐1)*HPMD(‐1),2)/(JQPCMHMD*HPMD)) ‐
0.546871675987*DLOG(JWSSNF(‐1)/JPGDP(‐1))
Eqn 238: DLOG(XEMPIND25_MTN/(REVIND33_MTN_0/(JQPCMHMD*HPMD))) = 0.00277933714267 +
0.0238634005542 + 0.470712659822*DLOG(@MOVAV(REVIND33_MTN_0(‐1),2)/REVIND33_MTN_0) ‐
0.659969415986*DLOG(@MOVAV(JQPCMHMD(‐1)*HPMD(‐1),2)/(JQPCMHMD*HPMD)) ‐
0.546871675987*DLOG(JWSSNF(‐1)/JPGDP(‐1))
Eqn 239: DLOG(XEMPIND25_NENG/(REVIND33_NENG_0/(JQPCMHMD*HPMD))) = 0.0046269991998 +
0.0238634005542 + 0.470712659822*DLOG(@MOVAV(REVIND33_NENG_0(‐1),2)/REVIND33_NENG_0) ‐
0.659969415986*DLOG(@MOVAV(JQPCMHMD(‐1)*HPMD(‐1),2)/(JQPCMHMD*HPMD)) ‐
0.546871675987*DLOG(JWSSNF(‐1)/JPGDP(‐1))
Eqn 240: DLOG(XEMPIND25_PAC/(REVIND33_PAC_0/(JQPCMHMD*HPMD))) = 0.0109389187025 +
0.0238634005542 + 0.470712659822*DLOG(@MOVAV(REVIND33_PAC_0(‐1),2)/REVIND33_PAC_0) ‐
0.659969415986*DLOG(@MOVAV(JQPCMHMD(‐1)*HPMD(‐1),2)/(JQPCMHMD*HPMD)) ‐
0.546871675987*DLOG(JWSSNF(‐1)/JPGDP(‐1))
Eqn 241: DLOG(XEMPIND25_SATL/(REVIND33_SATL_0/(JQPCMHMD*HPMD))) = 0.00941986334247 +
0.0238634005542 + 0.470712659822*DLOG(@MOVAV(REVIND33_SATL_0(‐1),2)/REVIND33_SATL_0) ‐
0.659969415986*DLOG(@MOVAV(JQPCMHMD(‐1)*HPMD(‐1),2)/(JQPCMHMD*HPMD)) ‐
0.546871675987*DLOG(JWSSNF(‐1)/JPGDP(‐1))
Eqn 242: DLOG(XEMPIND25_WNC/(REVIND33_WNC_0/(JQPCMHMD*HPMD))) = 0.00220897096921 +
0.0238634005542 + 0.470712659822*DLOG(@MOVAV(REVIND33_WNC_0(‐1),2)/REVIND33_WNC_0) ‐
0.659969415986*DLOG(@MOVAV(JQPCMHMD(‐1)*HPMD(‐1),2)/(JQPCMHMD*HPMD)) ‐
0.546871675987*DLOG(JWSSNF(‐1)/JPGDP(‐1))
May 2014
U.S. Energy Information Administration | NEMS Macroeconomic Activity Module Documentation Report 241
Eqn 243: DLOG(XEMPIND25_WSC/(REVIND33_WSC_0/(JQPCMHMD*HPMD))) = ‐0.0175105110113 +
0.0238634005542 + 0.470712659822*DLOG(@MOVAV(REVIND33_WSC_0(‐1),2)/REVIND33_WSC_0) ‐
0.659969415986*DLOG(@MOVAV(JQPCMHMD(‐1)*HPMD(‐1),2)/(JQPCMHMD*HPMD)) ‐
0.546871675987*DLOG(JWSSNF(‐1)/JPGDP(‐1))
IND26 ‐ Measuring & control instruments
Eqn 244: DLOG(XEMPIND26_ENC/(REVIND34_ENC_0/(JQPCMHMD*HPMD))) = ‐0.0116057852138 +
0.0171324656966 + 0.37205669516*DLOG(@MOVAV(REVIND34_ENC_0(‐1),2)/REVIND34_ENC_0) ‐
0.237098732601*DLOG(WPI05_ENC(‐1)/JPGDP(‐1))
Eqn 245: DLOG(XEMPIND26_ESC/(REVIND34_ESC_0/(JQPCMHMD*HPMD))) = ‐0.00107823040745 +
0.0171324656966 + 0.37205669516*DLOG(@MOVAV(REVIND34_ESC_0(‐1),2)/REVIND34_ESC_0) ‐
0.237098732601*DLOG(WPI05_ESC(‐1)/JPGDP(‐1))
Eqn 246: DLOG(XEMPIND26_MATL/(REVIND34_MATL_0/(JQPCMHMD*HPMD))) = ‐0.000484321759556 +
0.0171324656966 + 0.37205669516*DLOG(@MOVAV(REVIND34_MATL_0(‐1),2)/REVIND34_MATL_0) ‐
0.237098732601*DLOG(WPI05_MATL(‐1)/JPGDP(‐1))
Eqn 247: DLOG(XEMPIND26_MTN/(REVIND34_MTN_0/(JQPCMHMD*HPMD))) = 0.0169872522191 +
0.0171324656966 + 0.37205669516*DLOG(@MOVAV(REVIND34_MTN_0(‐1),2)/REVIND34_MTN_0) ‐
0.237098732601*DLOG(WPI05_MTN(‐1)/JPGDP(‐1))
Eqn 248: DLOG(XEMPIND26_NENG/(REVIND34_NENG_0/(JQPCMHMD*HPMD))) = 0.000754064966346 +
0.0171324656966 + 0.37205669516*DLOG(@MOVAV(REVIND34_NENG_0(‐1),2)/REVIND34_NENG_0) ‐
0.237098732601*DLOG(WPI05_NENG(‐1)/JPGDP(‐1))
Eqn 249: DLOG(XEMPIND26_PAC/(REVIND34_PAC_0/(JQPCMHMD*HPMD))) = 0.00705911972594 +
0.0171324656966 + 0.37205669516*DLOG(@MOVAV(REVIND34_PAC_0(‐1),2)/REVIND34_PAC_0) ‐
0.237098732601*DLOG(WPI05_PAC(‐1)/JPGDP(‐1))
Eqn 250: DLOG(XEMPIND26_SATL/(REVIND34_SATL_0/(JQPCMHMD*HPMD))) = ‐0.00267185554863 +
0.0171324656966 + 0.37205669516*DLOG(@MOVAV(REVIND34_SATL_0(‐1),2)/REVIND34_SATL_0) ‐
0.237098732601*DLOG(WPI05_SATL(‐1)/JPGDP(‐1))
Eqn 251: DLOG(XEMPIND26_WNC/(REVIND34_WNC_0/(JQPCMHMD*HPMD))) = ‐0.0119854126578 +
0.0171324656966 + 0.37205669516*DLOG(@MOVAV(REVIND34_WNC_0(‐1),2)/REVIND34_WNC_0) ‐
0.237098732601*DLOG(WPI05_WNC(‐1)/JPGDP(‐1))
Eqn 252: DLOG(XEMPIND26_WSC/(REVIND34_WSC_0/(JQPCMHMD*HPMD))) = 0.0030251686759 +
0.0171324656966 + 0.37205669516*DLOG(@MOVAV(REVIND34_WSC_0(‐1),2)/REVIND34_WSC_0) ‐
0.237098732601*DLOG(WPI05_WSC(‐1)/JPGDP(‐1))
IND27 ‐ Miscellaneous manufacturing
Eqn 253: DLOG(XEMPIND27_ENC/(REVIND35_ENC_0/(JQPCMHMD*HPMD))) = 0.00911133521771 +
0.00130413195984 + 0.721063518218*DLOG(@MOVAV(REVIND35_ENC_0(‐1),2)/REVIND35_ENC_0) ‐
May 2014
U.S. Energy Information Administration | NEMS Macroeconomic Activity Module Documentation Report 242
0.739180303802*DLOG(@MOVAV(JQPCMHMD(‐1)*HPMD(‐1),2)/(JQPCMHMD*HPMD)) ‐
0.0138176184145*DLOG(WPI05_ENC(‐1)/JPGDP(‐1)) + [AR(1)=0.51554011012]
Eqn 254: DLOG(XEMPIND27_ESC/(REVIND35_ESC_0/(JQPCMHMD*HPMD))) = 0.00146014344831 + 0.00130413195984 + 0.721063518218*DLOG(@MOVAV(REVIND35_ESC_0(‐1),2)/REVIND35_ESC_0) ‐ 0.739180303802*DLOG(@MOVAV(JQPCMHMD(‐1)*HPMD(‐1),2)/(JQPCMHMD*HPMD)) ‐ 0.0138176184145*DLOG(WPI05_ESC(‐1)/JPGDP(‐1)) + [AR(1)=0.51554011012]
Eqn 255: DLOG(XEMPIND27_MATL/(REVIND35_MATL_0/(JQPCMHMD*HPMD))) = ‐0.0122983056545 +
0.00130413195984 + 0.721063518218*DLOG(@MOVAV(REVIND35_MATL_0(‐1),2)/REVIND35_MATL_0) ‐
0.739180303802*DLOG(@MOVAV(JQPCMHMD(‐1)*HPMD(‐1),2)/(JQPCMHMD*HPMD)) ‐
0.0138176184145*DLOG(WPI05_MATL(‐1)/JPGDP(‐1)) + [AR(1)=0.51554011012]
Eqn 256: DLOG(XEMPIND27_MTN/(REVIND35_MTN_0/(JQPCMHMD*HPMD))) = ‐0.00842919623472 +
0.00130413195984 + 0.721063518218*DLOG(@MOVAV(REVIND35_MTN_0(‐1),2)/REVIND35_MTN_0) ‐
0.739180303802*DLOG(@MOVAV(JQPCMHMD(‐1)*HPMD(‐1),2)/(JQPCMHMD*HPMD)) ‐
0.0138176184145*DLOG(WPI05_MTN(‐1)/JPGDP(‐1)) + [AR(1)=0.51554011012]
Eqn 257: DLOG(XEMPIND27_NENG/(REVIND35_NENG_0/(JQPCMHMD*HPMD))) = 0.0124578997914 +
0.00130413195984 + 0.721063518218*DLOG(@MOVAV(REVIND35_NENG_0(‐1),2)/REVIND35_NENG_0) ‐
0.739180303802*DLOG(@MOVAV(JQPCMHMD(‐1)*HPMD(‐1),2)/(JQPCMHMD*HPMD)) ‐
0.0138176184145*DLOG(WPI05_NENG(‐1)/JPGDP(‐1)) + [AR(1)=0.51554011012]
Eqn 258: DLOG(XEMPIND27_PAC/(REVIND35_PAC_0/(JQPCMHMD*HPMD))) = 0.0158350883878 +
0.00130413195984 + 0.721063518218*DLOG(@MOVAV(REVIND35_PAC_0(‐1),2)/REVIND35_PAC_0) ‐
0.739180303802*DLOG(@MOVAV(JQPCMHMD(‐1)*HPMD(‐1),2)/(JQPCMHMD*HPMD)) ‐
0.0138176184145*DLOG(WPI05_PAC(‐1)/JPGDP(‐1)) + [AR(1)=0.51554011012]
Eqn 259: DLOG(XEMPIND27_SATL/(REVIND35_SATL_0/(JQPCMHMD*HPMD))) = ‐0.0055442178643 +
0.00130413195984 + 0.721063518218*DLOG(@MOVAV(REVIND35_SATL_0(‐1),2)/REVIND35_SATL_0) ‐
0.739180303802*DLOG(@MOVAV(JQPCMHMD(‐1)*HPMD(‐1),2)/(JQPCMHMD*HPMD)) ‐
0.0138176184145*DLOG(WPI05_SATL(‐1)/JPGDP(‐1)) + [AR(1)=0.51554011012]
Eqn 260: DLOG(XEMPIND27_WNC/(REVIND35_WNC_0/(JQPCMHMD*HPMD))) = ‐0.0029552395447 +
0.00130413195984 + 0.721063518218*DLOG(@MOVAV(REVIND35_WNC_0(‐1),2)/REVIND35_WNC_0) ‐
0.739180303802*DLOG(@MOVAV(JQPCMHMD(‐1)*HPMD(‐1),2)/(JQPCMHMD*HPMD)) ‐
0.0138176184145*DLOG(WPI05_WNC(‐1)/JPGDP(‐1)) + [AR(1)=0.51554011012]
Eqn 261: DLOG(XEMPIND27_WSC/(REVIND35_WSC_0/(JQPCMHMD*HPMD))) = ‐0.00963750754703 +
0.00130413195984 + 0.721063518218*DLOG(@MOVAV(REVIND35_WSC_0(‐1),2)/REVIND35_WSC_0) ‐
0.739180303802*DLOG(@MOVAV(JQPCMHMD(‐1)*HPMD(‐1),2)/(JQPCMHMD*HPMD)) ‐
0.0138176184145*DLOG(WPI05_WSC(‐1)/JPGDP(‐1)) + [AR(1)=0.51554011012]
May 2014
U.S. Energy Information Administration | NEMS Macroeconomic Activity Module Documentation Report 243
IND28 ‐ Crop production
Eqn 262: DLOG(XEMPIND28_ENC/(REVIND36_ENC_0/(JQPCMHM*HPMF))) = ‐0.00965142564074 +
0.0772812931044 + 0.603475013899*DLOG(@MOVAV(REVIND36_ENC_0(‐1),2)/REVIND36_ENC_0) +
0.251694151591*DLOG(WPI01/JPGDP) ‐ 0.00294382948291*@TREND + [AR(1)=‐0.269408249905]
Eqn 263: DLOG(XEMPIND28_ESC/(REVIND36_ESC_0/(JQPCMHM*HPMF))) = 0.0163102060392 +
0.0772812931044 + 0.603475013899*DLOG(@MOVAV(REVIND36_ESC_0(‐1),2)/REVIND36_ESC_0) +
0.251694151591*DLOG(WPI01/JPGDP) ‐ 0.00294382948291*@TREND + [AR(1)=‐0.269408249905]
Eqn 264: DLOG(XEMPIND28_MATL/(REVIND36_MATL_0/(JQPCMHM*HPMF))) = ‐0.00780302174798 +
0.0772812931044 + 0.603475013899*DLOG(@MOVAV(REVIND36_MATL_0(‐1),2)/REVIND36_MATL_0) +
0.251694151591*DLOG(WPI01/JPGDP) ‐ 0.00294382948291*@TREND + [AR(1)=‐0.269408249905]
Eqn 265: DLOG(XEMPIND28_MTN/(REVIND36_MTN_0/(JQPCMHM*HPMF))) = ‐0.0190815962205 +
0.0772812931044 + 0.603475013899*DLOG(@MOVAV(REVIND36_MTN_0(‐1),2)/REVIND36_MTN_0) +
0.251694151591*DLOG(WPI01/JPGDP) ‐ 0.00294382948291*@TREND + [AR(1)=‐0.269408249905]
Eqn 266: DLOG(XEMPIND28_NENG/(REVIND36_NENG_0/(JQPCMHM*HPMF))) = ‐0.0133969141472 +
0.0772812931044 + 0.603475013899*DLOG(@MOVAV(REVIND36_NENG_0(‐1),2)/REVIND36_NENG_0) +
0.251694151591*DLOG(WPI01/JPGDP) ‐ 0.00294382948291*@TREND + [AR(1)=‐0.269408249905]
Eqn 267: DLOG(XEMPIND28_PAC/(REVIND36_PAC_0/(JQPCMHM*HPMF))) = 0.00228034171779 +
0.0772812931044 + 0.603475013899*DLOG(@MOVAV(REVIND36_PAC_0(‐1),2)/REVIND36_PAC_0) +
0.251694151591*DLOG(WPI01/JPGDP) ‐ 0.00294382948291*@TREND + [AR(1)=‐0.269408249905]
Eqn 268: DLOG(XEMPIND28_SATL/(REVIND36_SATL_0/(JQPCMHM*HPMF))) = 0.0197818703749 +
0.0772812931044 + 0.603475013899*DLOG(@MOVAV(REVIND36_SATL_0(‐1),2)/REVIND36_SATL_0) +
0.251694151591*DLOG(WPI01/JPGDP) ‐ 0.00294382948291*@TREND + [AR(1)=‐0.269408249905]
Eqn 269: DLOG(XEMPIND28_WNC/(REVIND36_WNC_0/(JQPCMHM*HPMF))) = 0.0027838004179 +
0.0772812931044 + 0.603475013899*DLOG(@MOVAV(REVIND36_WNC_0(‐1),2)/REVIND36_WNC_0) +
0.251694151591*DLOG(WPI01/JPGDP) ‐ 0.00294382948291*@TREND + [AR(1)=‐0.269408249905]
Eqn 270: DLOG(XEMPIND28_WSC/(REVIND36_WSC_0/(JQPCMHM*HPMF))) = 0.00877673920673 +
0.0772812931044 + 0.603475013899*DLOG(@MOVAV(REVIND36_WSC_0(‐1),2)/REVIND36_WSC_0) +
0.251694151591*DLOG(WPI01/JPGDP) ‐ 0.00294382948291*@TREND + [AR(1)=‐0.269408249905]
IND29 ‐ Other agriculture, forestry, fishing & hunting
Eqn 271: DLOG(XEMPIND29_ENC/((REVIND37_ENC_0+REVIND38_ENC_0)/(JQPCMHNF*HPMD))) =
0.00294777421783 + 0.0105782875472 + 0.588550169431*DLOG(@MOVAV((REVIND37_ENC_0(‐
1)+REVIND38_ENC_0(‐1)),2)/(REVIND37_ENC_0+REVIND38_ENC_0)) ‐
1.64515002464*DLOG(@MOVAV(JQPCMHNF(‐1)*HPMD(‐1),2)/(JQPCMHNF*HPMD)) ‐ 7.96955252809e‐
05*@TREND
May 2014
U.S. Energy Information Administration | NEMS Macroeconomic Activity Module Documentation Report 244
Eqn 272: DLOG(XEMPIND29_ESC/((REVIND37_ESC_0+REVIND38_ESC_0)/(JQPCMHNF*HPMD))) = 0.00264313373041 + 0.0105782875472 + 0.588550169431*DLOG(@MOVAV((REVIND37_ESC_0(‐1)+REVIND38_ESC_0(‐1)),2)/(REVIND37_ESC_0+REVIND38_ESC_0)) ‐ 1.64515002464*DLOG(@MOVAV(JQPCMHNF(‐1)*HPMD(‐1),2)/(JQPCMHNF*HPMD)) ‐ 7.96955252809e‐05*@TREND
Eqn 273: DLOG(XEMPIND29_MATL/((REVIND37_MATL_0+REVIND38_MATL_0)/(JQPCMHNF*HPMD))) = ‐
0.00240474373118 + 0.0105782875472 + 0.588550169431*DLOG(@MOVAV((REVIND37_MATL_0(‐
1)+REVIND38_MATL_0(‐1)),2)/(REVIND37_MATL_0+REVIND38_MATL_0)) ‐
1.64515002464*DLOG(@MOVAV(JQPCMHNF(‐1)*HPMD(‐1),2)/(JQPCMHNF*HPMD)) ‐ 7.96955252809e‐
05*@TREND
Eqn 274: DLOG(XEMPIND29_MTN/((REVIND37_MTN_0+REVIND38_MTN_0)/(JQPCMHNF*HPMD))) = ‐
0.0118564834527 + 0.0105782875472 + 0.588550169431*DLOG(@MOVAV((REVIND37_MTN_0(‐
1)+REVIND38_MTN_0(‐1)),2)/(REVIND37_MTN_0+REVIND38_MTN_0)) ‐
1.64515002464*DLOG(@MOVAV(JQPCMHNF(‐1)*HPMD(‐1),2)/(JQPCMHNF*HPMD)) ‐ 7.96955252809e‐
05*@TREND
Eqn 275: DLOG(XEMPIND29_NENG/((REVIND37_NENG_0+REVIND38_NENG_0)/(JQPCMHNF*HPMD))) =
0.00933816198414 + 0.0105782875472 + 0.588550169431*DLOG(@MOVAV((REVIND37_NENG_0(‐
1)+REVIND38_NENG_0(‐1)),2)/(REVIND37_NENG_0+REVIND38_NENG_0)) ‐
1.64515002464*DLOG(@MOVAV(JQPCMHNF(‐1)*HPMD(‐1),2)/(JQPCMHNF*HPMD)) ‐ 7.96955252809e‐
05*@TREND
Eqn 276: DLOG(XEMPIND29_PAC/((REVIND37_PAC_0+REVIND38_PAC_0)/(JQPCMHNF*HPMD))) = ‐
0.00665702035632 + 0.0105782875472 + 0.588550169431*DLOG(@MOVAV((REVIND37_PAC_0(‐
1)+REVIND38_PAC_0(‐1)),2)/(REVIND37_PAC_0+REVIND38_PAC_0)) ‐
1.64515002464*DLOG(@MOVAV(JQPCMHNF(‐1)*HPMD(‐1),2)/(JQPCMHNF*HPMD)) ‐ 7.96955252809e‐
05*@TREND
Eqn 277: DLOG(XEMPIND29_SATL/((REVIND37_SATL_0+REVIND38_SATL_0)/(JQPCMHNF*HPMD))) =
0.00178637634278 + 0.0105782875472 + 0.588550169431*DLOG(@MOVAV((REVIND37_SATL_0(‐
1)+REVIND38_SATL_0(‐1)),2)/(REVIND37_SATL_0+REVIND38_SATL_0)) ‐
1.64515002464*DLOG(@MOVAV(JQPCMHNF(‐1)*HPMD(‐1),2)/(JQPCMHNF*HPMD)) ‐ 7.96955252809e‐
05*@TREND
Eqn 278: DLOG(XEMPIND29_WNC/((REVIND37_WNC_0+REVIND38_WNC_0)/(JQPCMHNF*HPMD))) = ‐
0.00303755132474 + 0.0105782875472 + 0.588550169431*DLOG(@MOVAV((REVIND37_WNC_0(‐
1)+REVIND38_WNC_0(‐1)),2)/(REVIND37_WNC_0+REVIND38_WNC_0)) ‐
1.64515002464*DLOG(@MOVAV(JQPCMHNF(‐1)*HPMD(‐1),2)/(JQPCMHNF*HPMD)) ‐ 7.96955252809e‐
05*@TREND
Eqn 279: DLOG(XEMPIND29_WSC/((REVIND37_WSC_0+REVIND38_WSC_0)/(JQPCMHNF*HPMD))) =
0.00724035258982 + 0.0105782875472 + 0.588550169431*DLOG(@MOVAV((REVIND37_WSC_0(‐
1)+REVIND38_WSC_0(‐1)),2)/(REVIND37_WSC_0+REVIND38_WSC_0)) ‐
May 2014
U.S. Energy Information Administration | NEMS Macroeconomic Activity Module Documentation Report 245
1.64515002464*DLOG(@MOVAV(JQPCMHNF(‐1)*HPMD(‐1),2)/(JQPCMHNF*HPMD)) ‐ 7.96955252809e‐
05*@TREND
IND30 ‐ Coal mining
Eqn 280: DLOG(XEMPIND30_ENC/(REVIND39_ENC_0/(JQPCMHM*HPMF))) = 0.00532939253962 ‐
0.0838502265263 ‐ 0.292484154393*DLOG(@MOVAV(JQPCMHM(‐1)*HPMF(‐1),2)/(JQPCMHM*HPMF)) +
0.00483125911223*@TREND + [AR(1)=‐0.0215259701578]
Eqn 281: DLOG(XEMPIND30_ESC/(REVIND39_ESC_0/(JQPCMHM*HPMF))) = ‐6.40518863245e‐05 ‐
0.0838502265263 ‐ 0.292484154393*DLOG(@MOVAV(JQPCMHM(‐1)*HPMF(‐1),2)/(JQPCMHM*HPMF)) +
0.00483125911223*@TREND + [AR(1)=‐0.0215259701578]
Eqn 282: DLOG(XEMPIND30_MATL/(REVIND39_MATL_0/(JQPCMHM*HPMF))) = ‐0.0185880194124 ‐
0.0838502265263 ‐ 0.292484154393*DLOG(@MOVAV(JQPCMHM(‐1)*HPMF(‐1),2)/(JQPCMHM*HPMF)) +
0.00483125911223*@TREND + [AR(1)=‐0.0215259701578]
Eqn 283: DLOG(XEMPIND30_MTN/(REVIND39_MTN_0/(JQPCMHM*HPMF))) = ‐0.0230346649205 ‐
0.0838502265263 ‐ 0.292484154393*DLOG(@MOVAV(JQPCMHM(‐1)*HPMF(‐1),2)/(JQPCMHM*HPMF)) +
0.00483125911223*@TREND + [AR(1)=‐0.0215259701578]
Eqn 284: DLOG(XEMPIND30_NENG/(REVIND39_NENG_0/(JQPCMHM*HPMF))) = ‐0.0379948191367 ‐
0.0838502265263 ‐ 0.292484154393*DLOG(@MOVAV(JQPCMHM(‐1)*HPMF(‐1),2)/(JQPCMHM*HPMF)) +
0.00483125911223*@TREND + [AR(1)=‐0.0215259701578]
Eqn 285: DLOG(XEMPIND30_PAC/(REVIND39_PAC_0/(JQPCMHM*HPMF))) = ‐0.0311618500807 ‐
0.0838502265263 ‐ 0.292484154393*DLOG(@MOVAV(JQPCMHM(‐1)*HPMF(‐1),2)/(JQPCMHM*HPMF)) +
0.00483125911223*@TREND + [AR(1)=‐0.0215259701578]
Eqn 286: DLOG(XEMPIND30_SATL/(REVIND39_SATL_0/(JQPCMHM*HPMF))) = ‐0.0014235114473 ‐
0.0838502265263 ‐ 0.292484154393*DLOG(@MOVAV(JQPCMHM(‐1)*HPMF(‐1),2)/(JQPCMHM*HPMF)) +
0.00483125911223*@TREND + [AR(1)=‐0.0215259701578]
Eqn 287: DLOG(XEMPIND30_WNC/(REVIND39_WNC_0/(JQPCMHM*HPMF))) = 0.0915492408124 ‐
0.0838502265263 ‐ 0.292484154393*DLOG(@MOVAV(JQPCMHM(‐1)*HPMF(‐1),2)/(JQPCMHM*HPMF)) +
0.00483125911223*@TREND + [AR(1)=‐0.0215259701578]
Eqn 288: DLOG(XEMPIND30_WSC/(REVIND39_WSC_0/(JQPCMHM*HPMF))) = 0.015388283532 ‐
0.0838502265263 ‐ 0.292484154393*DLOG(@MOVAV(JQPCMHM(‐1)*HPMF(‐1),2)/(JQPCMHM*HPMF)) +
0.00483125911223*@TREND + [AR(1)=‐0.0215259701578]
IND31 ‐ Oil & gas extraction & support activities
Eqn 289: DLOG(XEMPIND31_ENC/(REVIND40_ENC_0/(JQPCMHM*HPMF))) = ‐0.0360660372119 +
0.0637433723842 + 0.46030902263*DLOG(@MOVAV(REVIND40_ENC_0(‐1),2)/REVIND40_ENC_0) ‐
0.417768860936*DLOG(@MOVAV(JQPCMHM(‐1)*HPMF(‐1),2)/(JQPCMHM*HPMF))
May 2014
U.S. Energy Information Administration | NEMS Macroeconomic Activity Module Documentation Report 246
Eqn 290: DLOG(XEMPIND31_ESC/(REVIND40_ESC_0/(JQPCMHM*HPMF))) = ‐0.0520937869274 +
0.0637433723842 + 0.46030902263*DLOG(@MOVAV(REVIND40_ESC_0(‐1),2)/REVIND40_ESC_0) ‐
0.417768860936*DLOG(@MOVAV(JQPCMHM(‐1)*HPMF(‐1),2)/(JQPCMHM*HPMF))
Eqn 291: DLOG(XEMPIND31_MATL/(REVIND40_MATL_0/(JQPCMHM*HPMF))) = ‐0.0197759552819 + 0.0637433723842 + 0.46030902263*DLOG(@MOVAV(REVIND40_MATL_0(‐1),2)/REVIND40_MATL_0) ‐ 0.417768860936*DLOG(@MOVAV(JQPCMHM(‐1)*HPMF(‐1),2)/(JQPCMHM*HPMF))
Eqn 292: DLOG(XEMPIND31_MTN/(REVIND40_MTN_0/(JQPCMHM*HPMF))) = ‐0.0322852989806 +
0.0637433723842 + 0.46030902263*DLOG(@MOVAV(REVIND40_MTN_0(‐1),2)/REVIND40_MTN_0) ‐
0.417768860936*DLOG(@MOVAV(JQPCMHM(‐1)*HPMF(‐1),2)/(JQPCMHM*HPMF))
Eqn 293: DLOG(XEMPIND31_NENG/(REVIND40_NENG_0/(JQPCMHM*HPMF))) = 0.208618234544 +
0.0637433723842 + 0.46030902263*DLOG(@MOVAV(REVIND40_NENG_0(‐1),2)/REVIND40_NENG_0) ‐
0.417768860936*DLOG(@MOVAV(JQPCMHM(‐1)*HPMF(‐1),2)/(JQPCMHM*HPMF))
Eqn 294: DLOG(XEMPIND31_PAC/(REVIND40_PAC_0/(JQPCMHM*HPMF))) = ‐0.0189954700971 +
0.0637433723842 + 0.46030902263*DLOG(@MOVAV(REVIND40_PAC_0(‐1),2)/REVIND40_PAC_0) ‐
0.417768860936*DLOG(@MOVAV(JQPCMHM(‐1)*HPMF(‐1),2)/(JQPCMHM*HPMF))
Eqn 295: DLOG(XEMPIND31_SATL/(REVIND40_SATL_0/(JQPCMHM*HPMF))) = ‐0.02146607764 +
0.0637433723842 + 0.46030902263*DLOG(@MOVAV(REVIND40_SATL_0(‐1),2)/REVIND40_SATL_0) ‐
0.417768860936*DLOG(@MOVAV(JQPCMHM(‐1)*HPMF(‐1),2)/(JQPCMHM*HPMF))
Eqn 296: DLOG(XEMPIND31_WNC/(REVIND40_WNC_0/(JQPCMHM*HPMF))) = ‐0.00504035784991 +
0.0637433723842 + 0.46030902263*DLOG(@MOVAV(REVIND40_WNC_0(‐1),2)/REVIND40_WNC_0) ‐
0.417768860936*DLOG(@MOVAV(JQPCMHM(‐1)*HPMF(‐1),2)/(JQPCMHM*HPMF))
Eqn 297: DLOG(XEMPIND31_WSC/(REVIND40_WSC_0/(JQPCMHM*HPMF))) = ‐0.0228952505552 +
0.0637433723842 + 0.46030902263*DLOG(@MOVAV(REVIND40_WSC_0(‐1),2)/REVIND40_WSC_0) ‐
0.417768860936*DLOG(@MOVAV(JQPCMHM(‐1)*HPMF(‐1),2)/(JQPCMHM*HPMF))
IND32 ‐ Other mining & quarrying
Eqn 298: DLOG(XEMPIND32_ENC/(REVIND41_ENC_0/(JQPCMHM*HPMF))) = ‐0.050218493796 +
0.0427252043944 + 0.366130860328*DLOG(@MOVAV(REVIND41_ENC_0(‐1),2)/REVIND41_ENC_0) ‐
0.239953005961*DLOG(XEMPIND32_ENC(‐1)/(REVIND33_ENC_0(‐1)/(JQPCMHM(‐1)*HPMF(‐1)))) ‐
0.0134051177633*D(RUC)
Eqn 299: DLOG(XEMPIND32_ESC/(REVIND41_ESC_0/(JQPCMHM*HPMF))) = ‐0.0121503521912 +
0.0427252043944 + 0.366130860328*DLOG(@MOVAV(REVIND41_ESC_0(‐1),2)/REVIND41_ESC_0) ‐
0.239953005961*DLOG(XEMPIND32_ESC(‐1)/(REVIND33_ESC_0(‐1)/(JQPCMHM(‐1)*HPMF(‐1)))) ‐
0.0134051177633*D(RUC)
Eqn 300: DLOG(XEMPIND32_MATL/(REVIND41_MATL_0/(JQPCMHM*HPMF))) = 0.0222487965194 +
0.0427252043944 + 0.366130860328*DLOG(@MOVAV(REVIND41_MATL_0(‐1),2)/REVIND41_MATL_0) ‐
May 2014
U.S. Energy Information Administration | NEMS Macroeconomic Activity Module Documentation Report 247
0.239953005961*DLOG(XEMPIND32_MATL(‐1)/(REVIND33_MATL_0(‐1)/(JQPCMHM(‐1)*HPMF(‐1)))) ‐
0.0134051177633*D(RUC)
Eqn 301: DLOG(XEMPIND32_MTN/(REVIND41_MTN_0/(JQPCMHM*HPMF))) = ‐0.0279869094729 +
0.0427252043944 + 0.366130860328*DLOG(@MOVAV(REVIND41_MTN_0(‐1),2)/REVIND41_MTN_0) ‐
0.239953005961*DLOG(XEMPIND32_MTN(‐1)/(REVIND33_MTN_0(‐1)/(JQPCMHM(‐1)*HPMF(‐1)))) ‐
0.0134051177633*D(RUC)
Eqn 302: DLOG(XEMPIND32_NENG/(REVIND41_NENG_0/(JQPCMHM*HPMF))) = 0.0565957326871 +
0.0427252043944 + 0.366130860328*DLOG(@MOVAV(REVIND41_NENG_0(‐1),2)/REVIND41_NENG_0) ‐
0.239953005961*DLOG(XEMPIND32_NENG(‐1)/(REVIND33_NENG_0(‐1)/(JQPCMHM(‐1)*HPMF(‐1)))) ‐
0.0134051177633*D(RUC)
Eqn 303: DLOG(XEMPIND32_PAC/(REVIND41_PAC_0/(JQPCMHM*HPMF))) = 0.000332091316832 +
0.0427252043944 + 0.366130860328*DLOG(@MOVAV(REVIND41_PAC_0(‐1),2)/REVIND41_PAC_0) ‐
0.239953005961*DLOG(XEMPIND32_PAC(‐1)/(REVIND33_PAC_0(‐1)/(JQPCMHM(‐1)*HPMF(‐1)))) ‐
0.0134051177633*D(RUC)
Eqn 304: DLOG(XEMPIND32_SATL/(REVIND41_SATL_0/(JQPCMHM*HPMF))) = ‐0.00836648328732 +
0.0427252043944 + 0.366130860328*DLOG(@MOVAV(REVIND41_SATL_0(‐1),2)/REVIND41_SATL_0) ‐
0.239953005961*DLOG(XEMPIND32_SATL(‐1)/(REVIND33_SATL_0(‐1)/(JQPCMHM(‐1)*HPMF(‐1)))) ‐
0.0134051177633*D(RUC)
Eqn 305: DLOG(XEMPIND32_WNC/(REVIND41_WNC_0/(JQPCMHM*HPMF))) = 0.0277415884877 +
0.0427252043944 + 0.366130860328*DLOG(@MOVAV(REVIND41_WNC_0(‐1),2)/REVIND41_WNC_0) ‐
0.239953005961*DLOG(XEMPIND32_WNC(‐1)/(REVIND33_WNC_0(‐1)/(JQPCMHM(‐1)*HPMF(‐1)))) ‐
0.0134051177633*D(RUC)
Eqn 306: DLOG(XEMPIND32_WSC/(REVIND41_WSC_0/(JQPCMHM*HPMF))) = ‐0.00819597026361 +
0.0427252043944 + 0.366130860328*DLOG(@MOVAV(REVIND41_WSC_0(‐1),2)/REVIND41_WSC_0) ‐
0.239953005961*DLOG(XEMPIND32_WSC(‐1)/(REVIND33_WSC_0(‐1)/(JQPCMHM(‐1)*HPMF(‐1)))) ‐
0.0134051177633*D(RUC)
IND33 ‐ Construction
Eqn 307: DLOG(XEMPIND33_ENC/(REVIND42_ENC_0/(JQPCMHNF*HRNFPRI))) = ‐0.00343660756475 +
0.0377348027109 + 0.419124861037*DLOG(@MOVAV(REVIND42_ENC_0(‐1),2)/REVIND42_ENC_0) ‐
0.0640423518266*DLOG(WPI05_ENC(‐1)/JPGDP(‐1)) ‐ 0.000394784279039*@TREND
Eqn 308: DLOG(XEMPIND33_ESC/(REVIND42_ESC_0/(JQPCMHNF*HRNFPRI))) = 0.000572850367498 +
0.0377348027109 + 0.419124861037*DLOG(@MOVAV(REVIND42_ESC_0(‐1),2)/REVIND42_ESC_0) ‐
0.0640423518266*DLOG(WPI05_ESC(‐1)/JPGDP(‐1)) ‐ 0.000394784279039*@TREND
Eqn 309: DLOG(XEMPIND33_MATL/(REVIND42_MATL_0/(JQPCMHNF*HRNFPRI))) = 0.00624450316814 +
0.0377348027109 + 0.419124861037*DLOG(@MOVAV(REVIND42_MATL_0(‐1),2)/REVIND42_MATL_0) ‐
0.0640423518266*DLOG(WPI05_MATL(‐1)/JPGDP(‐1)) ‐ 0.000394784279039*@TREND
May 2014
U.S. Energy Information Administration | NEMS Macroeconomic Activity Module Documentation Report 248
Eqn 310: DLOG(XEMPIND33_MTN/(REVIND42_MTN_0/(JQPCMHNF*HRNFPRI))) = ‐0.00829528950344 +
0.0377348027109 + 0.419124861037*DLOG(@MOVAV(REVIND42_MTN_0(‐1),2)/REVIND42_MTN_0) ‐
0.0640423518266*DLOG(WPI05_MTN(‐1)/JPGDP(‐1)) ‐ 0.000394784279039*@TREND
Eqn 311: DLOG(XEMPIND33_NENG/(REVIND42_NENG_0/(JQPCMHNF*HRNFPRI))) = 0.00630773740474 +
0.0377348027109 + 0.419124861037*DLOG(@MOVAV(REVIND42_NENG_0(‐1),2)/REVIND42_NENG_0) ‐
0.0640423518266*DLOG(WPI05_NENG(‐1)/JPGDP(‐1)) ‐ 0.000394784279039*@TREND
Eqn 312: DLOG(XEMPIND33_PAC/(REVIND42_PAC_0/(JQPCMHNF*HRNFPRI))) = ‐0.000481836437765 +
0.0377348027109 + 0.419124861037*DLOG(@MOVAV(REVIND42_PAC_0(‐1),2)/REVIND42_PAC_0) ‐
0.0640423518266*DLOG(WPI05_PAC(‐1)/JPGDP(‐1)) ‐ 0.000394784279039*@TREND
Eqn 313: DLOG(XEMPIND33_SATL/(REVIND42_SATL_0/(JQPCMHNF*HRNFPRI))) = ‐0.00160780383665 +
0.0377348027109 + 0.419124861037*DLOG(@MOVAV(REVIND42_SATL_0(‐1),2)/REVIND42_SATL_0) ‐
0.0640423518266*DLOG(WPI05_SATL(‐1)/JPGDP(‐1)) ‐ 0.000394784279039*@TREND
Eqn 314: DLOG(XEMPIND33_WNC/(REVIND42_WNC_0/(JQPCMHNF*HRNFPRI))) = ‐0.00270585840563 +
0.0377348027109 + 0.419124861037*DLOG(@MOVAV(REVIND42_WNC_0(‐1),2)/REVIND42_WNC_0) ‐
0.0640423518266*DLOG(WPI05_WNC(‐1)/JPGDP(‐1)) ‐ 0.000394784279039*@TREND
Eqn 315: DLOG(XEMPIND33_WSC/(REVIND42_WSC_0/(JQPCMHNF*HRNFPRI))) = 0.00340230480787 +
0.0377348027109 + 0.419124861037*DLOG(@MOVAV(REVIND42_WSC_0(‐1),2)/REVIND42_WSC_0) ‐
0.0640423518266*DLOG(WPI05_WSC(‐1)/JPGDP(‐1)) ‐ 0.000394784279039*@TREND
SER1 ‐ Transportation & warehousing
Eqn 316: DLOG(XEMPSER1_ENC/(REVSER1_ENC_0/(JQPCMHNF*HRNFPRI))) = 0.000864508580542 +
0.0469931523451 ‐ 1.11291347443*DLOG(@MOVAV(JQPCMHNF(‐1)*HRNFPRI(‐1),2)) ‐
0.0514264490169*DLOG(SP500/GSPR_ENC)
Eqn 317: DLOG(XEMPSER1_ESC/(REVSER1_ESC_0/(JQPCMHNF*HRNFPRI))) = ‐0.00475321258275 +
0.0469931523451 ‐ 1.11291347443*DLOG(@MOVAV(JQPCMHNF(‐1)*HRNFPRI(‐1),2)) ‐
0.0514264490169*DLOG(SP500/GSPR_ESC)
Eqn 318: DLOG(XEMPSER1_MATL/(REVSER1_MATL_0/(JQPCMHNF*HRNFPRI))) = 0.00620707969882 +
0.0469931523451 ‐ 1.11291347443*DLOG(@MOVAV(JQPCMHNF(‐1)*HRNFPRI(‐1),2)) ‐
0.0514264490169*DLOG(SP500/GSPR_MATL)
Eqn 319: DLOG(XEMPSER1_MTN/(REVSER1_MTN_0/(JQPCMHNF*HRNFPRI))) = ‐0.000602187793189 +
0.0469931523451 ‐ 1.11291347443*DLOG(@MOVAV(JQPCMHNF(‐1)*HRNFPRI(‐1),2)) ‐
0.0514264490169*DLOG(SP500/GSPR_MTN)
Eqn 320: DLOG(XEMPSER1_NENG/(REVSER1_NENG_0/(JQPCMHNF*HRNFPRI))) = 0.00503023799 +
0.0469931523451 ‐ 1.11291347443*DLOG(@MOVAV(JQPCMHNF(‐1)*HRNFPRI(‐1),2)) ‐
0.0514264490169*DLOG(SP500/GSPR_NENG)
May 2014
U.S. Energy Information Administration | NEMS Macroeconomic Activity Module Documentation Report 249
Eqn 321: DLOG(XEMPSER1_PAC/(REVSER1_PAC_0/(JQPCMHNF*HRNFPRI))) = 0.000806379427231 +
0.0469931523451 ‐ 1.11291347443*DLOG(@MOVAV(JQPCMHNF(‐1)*HRNFPRI(‐1),2)) ‐
0.0514264490169*DLOG(SP500/GSPR_PAC)
Eqn 322: DLOG(XEMPSER1_SATL/(REVSER1_SATL_0/(JQPCMHNF*HRNFPRI))) = ‐0.00230225174352 +
0.0469931523451 ‐ 1.11291347443*DLOG(@MOVAV(JQPCMHNF(‐1)*HRNFPRI(‐1),2)) ‐
0.0514264490169*DLOG(SP500/GSPR_SATL)
Eqn 323: DLOG(XEMPSER1_WNC/(REVSER1_WNC_0/(JQPCMHNF*HRNFPRI))) = ‐0.00133163196147 +
0.0469931523451 ‐ 1.11291347443*DLOG(@MOVAV(JQPCMHNF(‐1)*HRNFPRI(‐1),2)) ‐
0.0514264490169*DLOG(SP500/GSPR_WNC)
Eqn 324: DLOG(XEMPSER1_WSC/(REVSER1_WSC_0/(JQPCMHNF*HRNFPRI))) = ‐0.00391892161566 +
0.0469931523451 ‐ 1.11291347443*DLOG(@MOVAV(JQPCMHNF(‐1)*HRNFPRI(‐1),2)) ‐
0.0514264490169*DLOG(SP500/GSPR_WSC)
SER2 ‐ Broadcasting & telecommunications
Eqn 325: DLOG(XEMPSER2_ENC/(REVSER2_ENC_0/(JQPCMHNF*HRNFPRI))) = 0.00718542743431 ‐
0.0308449189194 + 0.460220961871*DLOG(@MOVAV(REVSER2_ENC_0(‐1),2)/REVSER2_ENC_0) ‐
0.189023140263*DLOG(@MOVAV(JQPCMHNF(‐1)*HRNFPRI(‐1),2)/(JQPCMHNF*HRNFPRI)) +
0.0938455061833*DLOG(SP500/GSPR_ENC)
Eqn 326: DLOG(XEMPSER2_ESC/(REVSER2_ESC_0/(JQPCMHNF*HRNFPRI))) = 0.0165379577903 ‐
0.0308449189194 + 0.460220961871*DLOG(@MOVAV(REVSER2_ESC_0(‐1),2)/REVSER2_ESC_0) ‐
0.189023140263*DLOG(@MOVAV(JQPCMHNF(‐1)*HRNFPRI(‐1),2)/(JQPCMHNF*HRNFPRI)) +
0.0938455061833*DLOG(SP500/GSPR_ESC)
Eqn 327: DLOG(XEMPSER2_MATL/(REVSER2_MATL_0/(JQPCMHNF*HRNFPRI))) = ‐0.0146547348162 ‐
0.0308449189194 + 0.460220961871*DLOG(@MOVAV(REVSER2_MATL_0(‐1),2)/REVSER2_MATL_0) ‐
0.189023140263*DLOG(@MOVAV(JQPCMHNF(‐1)*HRNFPRI(‐1),2)/(JQPCMHNF*HRNFPRI)) +
0.0938455061833*DLOG(SP500/GSPR_MATL)
Eqn 328: DLOG(XEMPSER2_MTN/(REVSER2_MTN_0/(JQPCMHNF*HRNFPRI))) = ‐0.00179885633084 ‐
0.0308449189194 + 0.460220961871*DLOG(@MOVAV(REVSER2_MTN_0(‐1),2)/REVSER2_MTN_0) ‐
0.189023140263*DLOG(@MOVAV(JQPCMHNF(‐1)*HRNFPRI(‐1),2)/(JQPCMHNF*HRNFPRI)) +
0.0938455061833*DLOG(SP500/GSPR_MTN)
Eqn 329: DLOG(XEMPSER2_NENG/(REVSER2_NENG_0/(JQPCMHNF*HRNFPRI))) = 0.00823157449895 ‐
0.0308449189194 + 0.460220961871*DLOG(@MOVAV(REVSER2_NENG_0(‐1),2)/REVSER2_NENG_0) ‐
0.189023140263*DLOG(@MOVAV(JQPCMHNF(‐1)*HRNFPRI(‐1),2)/(JQPCMHNF*HRNFPRI)) +
0.0938455061833*DLOG(SP500/GSPR_NENG)
Eqn 330: DLOG(XEMPSER2_PAC/(REVSER2_PAC_0/(JQPCMHNF*HRNFPRI))) = ‐0.0116906845264 ‐
0.0308449189194 + 0.460220961871*DLOG(@MOVAV(REVSER2_PAC_0(‐1),2)/REVSER2_PAC_0) ‐
May 2014
U.S. Energy Information Administration | NEMS Macroeconomic Activity Module Documentation Report 250
0.189023140263*DLOG(@MOVAV(JQPCMHNF(‐1)*HRNFPRI(‐1),2)/(JQPCMHNF*HRNFPRI)) +
0.0938455061833*DLOG(SP500/GSPR_PAC)
Eqn 331: DLOG(XEMPSER2_SATL/(REVSER2_SATL_0/(JQPCMHNF*HRNFPRI))) = ‐0.00189908226136 ‐
0.0308449189194 + 0.460220961871*DLOG(@MOVAV(REVSER2_SATL_0(‐1),2)/REVSER2_SATL_0) ‐
0.189023140263*DLOG(@MOVAV(JQPCMHNF(‐1)*HRNFPRI(‐1),2)/(JQPCMHNF*HRNFPRI)) +
0.0938455061833*DLOG(SP500/GSPR_SATL)
Eqn 332: DLOG(XEMPSER2_WNC/(REVSER2_WNC_0/(JQPCMHNF*HRNFPRI))) = 0.00187346147253 ‐
0.0308449189194 + 0.460220961871*DLOG(@MOVAV(REVSER2_WNC_0(‐1),2)/REVSER2_WNC_0) ‐
0.189023140263*DLOG(@MOVAV(JQPCMHNF(‐1)*HRNFPRI(‐1),2)/(JQPCMHNF*HRNFPRI)) +
0.0938455061833*DLOG(SP500/GSPR_WNC)
Eqn 333: DLOG(XEMPSER2_WSC/(REVSER2_WSC_0/(JQPCMHNF*HRNFPRI))) = ‐0.00378506326132 ‐
0.0308449189194 + 0.460220961871*DLOG(@MOVAV(REVSER2_WSC_0(‐1),2)/REVSER2_WSC_0) ‐
0.189023140263*DLOG(@MOVAV(JQPCMHNF(‐1)*HRNFPRI(‐1),2)/(JQPCMHNF*HRNFPRI)) +
0.0938455061833*DLOG(SP500/GSPR_WSC)
SER3 ‐ Electric power generation & distribution
Eqn 334: DLOG(XEMPSER3_ENC/(REVSER3_ENC_0/(JQPCMHNF*HRNFPRI))) = ‐0.00148685020279 +
0.00709421030242 + 0.639759638317*DLOG(@MOVAV(REVSER3_ENC_0(‐1),2)/REVSER3_ENC_0)
Eqn 335: DLOG(XEMPSER3_ESC/(REVSER3_ESC_0/(JQPCMHNF*HRNFPRI))) = ‐0.000606249981639 +
0.00709421030242 + 0.639759638317*DLOG(@MOVAV(REVSER3_ESC_0(‐1),2)/REVSER3_ESC_0)
Eqn 336: DLOG(XEMPSER3_MATL/(REVSER3_MATL_0/(JQPCMHNF*HRNFPRI))) = ‐0.00310441907958 +
0.00709421030242 + 0.639759638317*DLOG(@MOVAV(REVSER3_MATL_0(‐1),2)/REVSER3_MATL_0)
Eqn 337: DLOG(XEMPSER3_MTN/(REVSER3_MTN_0/(JQPCMHNF*HRNFPRI))) = 0.00423116279204 +
0.00709421030242 + 0.639759638317*DLOG(@MOVAV(REVSER3_MTN_0(‐1),2)/REVSER3_MTN_0)
Eqn 338: DLOG(XEMPSER3_NENG/(REVSER3_NENG_0/(JQPCMHNF*HRNFPRI))) = ‐0.0144716322308 +
0.00709421030242 + 0.639759638317*DLOG(@MOVAV(REVSER3_NENG_0(‐1),2)/REVSER3_NENG_0)
Eqn 339: DLOG(XEMPSER3_PAC/(REVSER3_PAC_0/(JQPCMHNF*HRNFPRI))) = 0.0135458437523 +
0.00709421030242 + 0.639759638317*DLOG(@MOVAV(REVSER3_PAC_0(‐1),2)/REVSER3_PAC_0)
Eqn 340: DLOG(XEMPSER3_SATL/(REVSER3_SATL_0/(JQPCMHNF*HRNFPRI))) = ‐0.00644717236346 +
0.00709421030242 + 0.639759638317*DLOG(@MOVAV(REVSER3_SATL_0(‐1),2)/REVSER3_SATL_0)
Eqn 341: DLOG(XEMPSER3_WNC/(REVSER3_WNC_0/(JQPCMHNF*HRNFPRI))) = 0.00936010852461 +
0.00709421030242 + 0.639759638317*DLOG(@MOVAV(REVSER3_WNC_0(‐1),2)/REVSER3_WNC_0)
Eqn 342: DLOG(XEMPSER3_WSC/(REVSER3_WSC_0/(JQPCMHNF*HRNFPRI))) = ‐0.00102079121065 +
0.00709421030242 + 0.639759638317*DLOG(@MOVAV(REVSER3_WSC_0(‐1),2)/REVSER3_WSC_0)
May 2014
U.S. Energy Information Administration | NEMS Macroeconomic Activity Module Documentation Report 251
SER4 ‐ Natural gas distribution
Eqn 343: DLOG(XEMPSER4_ENC/(REVSER4_ENC_0/(JQPCMHNF*HRNFPRI))) = 0.00024251657917 ‐
0.00679210610579 + 0.109540719909*DLOG(@MOVAV(REVSER4_ENC_0(‐1),2)/REVSER4_ENC_0) ‐
0.114760779436*DLOG(@MOVAV(JQPCMHNF(‐1)*HRNFPRI(‐1),2)/(JQPCMHNF*HRNFPRI))
Eqn 344: DLOG(XEMPSER4_ESC/(REVSER4_ESC_0/(JQPCMHNF*HRNFPRI))) = 0.00876340301429 ‐
0.00679210610579 + 0.109540719909*DLOG(@MOVAV(REVSER4_ESC_0(‐1),2)/REVSER4_ESC_0) ‐
0.114760779436*DLOG(@MOVAV(JQPCMHNF(‐1)*HRNFPRI(‐1),2)/(JQPCMHNF*HRNFPRI))
Eqn 345: DLOG(XEMPSER4_MATL/(REVSER4_MATL_0/(JQPCMHNF*HRNFPRI))) = 0.0454206869556 ‐
0.00679210610579 + 0.109540719909*DLOG(@MOVAV(REVSER4_MATL_0(‐1),2)/REVSER4_MATL_0) ‐
0.114760779436*DLOG(@MOVAV(JQPCMHNF(‐1)*HRNFPRI(‐1),2)/(JQPCMHNF*HRNFPRI))
Eqn 346: DLOG(XEMPSER4_MTN/(REVSER4_MTN_0/(JQPCMHNF*HRNFPRI))) = 0.0211769193808 ‐
0.00679210610579 + 0.109540719909*DLOG(@MOVAV(REVSER4_MTN_0(‐1),2)/REVSER4_MTN_0) ‐
0.114760779436*DLOG(@MOVAV(JQPCMHNF(‐1)*HRNFPRI(‐1),2)/(JQPCMHNF*HRNFPRI))
Eqn 347: DLOG(XEMPSER4_NENG/(REVSER4_NENG_0/(JQPCMHNF*HRNFPRI))) = 0.0138079546452 ‐
0.00679210610579 + 0.109540719909*DLOG(@MOVAV(REVSER4_NENG_0(‐1),2)/REVSER4_NENG_0) ‐
0.114760779436*DLOG(@MOVAV(JQPCMHNF(‐1)*HRNFPRI(‐1),2)/(JQPCMHNF*HRNFPRI))
Eqn 348: DLOG(XEMPSER4_PAC/(REVSER4_PAC_0/(JQPCMHNF*HRNFPRI))) = ‐0.122991036516 ‐
0.00679210610579 + 0.109540719909*DLOG(@MOVAV(REVSER4_PAC_0(‐1),2)/REVSER4_PAC_0) ‐
0.114760779436*DLOG(@MOVAV(JQPCMHNF(‐1)*HRNFPRI(‐1),2)/(JQPCMHNF*HRNFPRI))
Eqn 349: DLOG(XEMPSER4_SATL/(REVSER4_SATL_0/(JQPCMHNF*HRNFPRI))) = 0.00156280352274 ‐
0.00679210610579 + 0.109540719909*DLOG(@MOVAV(REVSER4_SATL_0(‐1),2)/REVSER4_SATL_0) ‐
0.114760779436*DLOG(@MOVAV(JQPCMHNF(‐1)*HRNFPRI(‐1),2)/(JQPCMHNF*HRNFPRI))
Eqn 350: DLOG(XEMPSER4_WNC/(REVSER4_WNC_0/(JQPCMHNF*HRNFPRI))) = 0.03164688019 ‐
0.00679210610579 + 0.109540719909*DLOG(@MOVAV(REVSER4_WNC_0(‐1),2)/REVSER4_WNC_0) ‐
0.114760779436*DLOG(@MOVAV(JQPCMHNF(‐1)*HRNFPRI(‐1),2)/(JQPCMHNF*HRNFPRI))
Eqn 351: DLOG(XEMPSER4_WSC/(REVSER4_WSC_0/(JQPCMHNF*HRNFPRI))) = 0.000369872228203 ‐
0.00679210610579 + 0.109540719909*DLOG(@MOVAV(REVSER4_WSC_0(‐1),2)/REVSER4_WSC_0) ‐
0.114760779436*DLOG(@MOVAV(JQPCMHNF(‐1)*HRNFPRI(‐1),2)/(JQPCMHNF*HRNFPRI))
SER5 ‐ Water, sewage & related systems
Eqn 352: DLOG(XEMPSER5_ENC/(REVSER5_ENC_0/(JQPCMHNF*HRNFPRI))) = 0.00418206238538 +
0.038119392189 + 0.333880735563*DLOG(@MOVAV(REVSER5_ENC_0(‐1),2)/REVSER5_ENC_0) +
0.00791980153373*DLOG(WPI05_ENC(‐1)/JPGDP(‐1))
Eqn 353: DLOG(XEMPSER5_ESC/(REVSER5_ESC_0/(JQPCMHNF*HRNFPRI))) = 0.049212595602 +
0.038119392189 + 0.333880735563*DLOG(@MOVAV(REVSER5_ESC_0(‐1),2)/REVSER5_ESC_0) +
0.00791980153373*DLOG(WPI05_ESC(‐1)/JPGDP(‐1))
May 2014
U.S. Energy Information Administration | NEMS Macroeconomic Activity Module Documentation Report 252
Eqn 354: DLOG(XEMPSER5_MATL/(REVSER5_MATL_0/(JQPCMHNF*HRNFPRI))) = 0.0010565174786 +
0.038119392189 + 0.333880735563*DLOG(@MOVAV(REVSER5_MATL_0(‐1),2)/REVSER5_MATL_0) +
0.00791980153373*DLOG(WPI05_MATL(‐1)/JPGDP(‐1))
Eqn 355: DLOG(XEMPSER5_MTN/(REVSER5_MTN_0/(JQPCMHNF*HRNFPRI))) = ‐0.0277342129188 +
0.038119392189 + 0.333880735563*DLOG(@MOVAV(REVSER5_MTN_0(‐1),2)/REVSER5_MTN_0) +
0.00791980153373*DLOG(WPI05_MTN(‐1)/JPGDP(‐1))
Eqn 356: DLOG(XEMPSER5_NENG/(REVSER5_NENG_0/(JQPCMHNF*HRNFPRI))) = 0.0107139445997 +
0.038119392189 + 0.333880735563*DLOG(@MOVAV(REVSER5_NENG_0(‐1),2)/REVSER5_NENG_0) +
0.00791980153373*DLOG(WPI05_NENG(‐1)/JPGDP(‐1))
Eqn 357: DLOG(XEMPSER5_PAC/(REVSER5_PAC_0/(JQPCMHNF*HRNFPRI))) = ‐0.0557765003333 +
0.038119392189 + 0.333880735563*DLOG(@MOVAV(REVSER5_PAC_0(‐1),2)/REVSER5_PAC_0) +
0.00791980153373*DLOG(WPI05_PAC(‐1)/JPGDP(‐1))
Eqn 358: DLOG(XEMPSER5_SATL/(REVSER5_SATL_0/(JQPCMHNF*HRNFPRI))) = 0.00176408773977 +
0.038119392189 + 0.333880735563*DLOG(@MOVAV(REVSER5_SATL_0(‐1),2)/REVSER5_SATL_0) +
0.00791980153373*DLOG(WPI05_SATL(‐1)/JPGDP(‐1))
Eqn 359: DLOG(XEMPSER5_WNC/(REVSER5_WNC_0/(JQPCMHNF*HRNFPRI))) = 0.0117915539618 +
0.038119392189 + 0.333880735563*DLOG(@MOVAV(REVSER5_WNC_0(‐1),2)/REVSER5_WNC_0) +
0.00791980153373*DLOG(WPI05_WNC(‐1)/JPGDP(‐1))
Eqn 360: DLOG(XEMPSER5_WSC/(REVSER5_WSC_0/(JQPCMHNF*HRNFPRI))) = 0.00478995148476 +
0.038119392189 + 0.333880735563*DLOG(@MOVAV(REVSER5_WSC_0(‐1),2)/REVSER5_WSC_0) +
0.00791980153373*DLOG(WPI05_WSC(‐1)/JPGDP(‐1))
SER6 ‐ Wholesale trade
Eqn 361: DLOG(XEMPSER6_ENC/(REVSER6_ENC_0/(JQPCMHNF*HRNFPRI))) = 0.00189983523539 ‐
0.0564010509387 + 0.403202715826*DLOG(@MOVAV(REVSER6_ENC_0(‐1),2)/REVSER6_ENC_0) +
0.114047872501*DLOG(@MOVAV(JQPCMHNF(‐1)*HRNFPRI(‐1),2)/(JQPCMHNF*HRNFPRI)) ‐
0.883224794164*DLOG(WPISOP3000/JPGDP) + 0.00195477002302*@TREND
Eqn 362: DLOG(XEMPSER6_ESC/(REVSER6_ESC_0/(JQPCMHNF*HRNFPRI))) = ‐0.00177813156434 ‐
0.0564010509387 + 0.403202715826*DLOG(@MOVAV(REVSER6_ESC_0(‐1),2)/REVSER6_ESC_0) +
0.114047872501*DLOG(@MOVAV(JQPCMHNF(‐1)*HRNFPRI(‐1),2)/(JQPCMHNF*HRNFPRI)) ‐
0.883224794164*DLOG(WPISOP3000/JPGDP) + 0.00195477002302*@TREND
Eqn 363: DLOG(XEMPSER6_MATL/(REVSER6_MATL_0/(JQPCMHNF*HRNFPRI))) = 0.00242015446502 ‐
0.0564010509387 + 0.403202715826*DLOG(@MOVAV(REVSER6_MATL_0(‐1),2)/REVSER6_MATL_0) +
0.114047872501*DLOG(@MOVAV(JQPCMHNF(‐1)*HRNFPRI(‐1),2)/(JQPCMHNF*HRNFPRI)) ‐
0.883224794164*DLOG(WPISOP3000/JPGDP) + 0.00195477002302*@TREND
May 2014
U.S. Energy Information Administration | NEMS Macroeconomic Activity Module Documentation Report 253
Eqn 364: DLOG(XEMPSER6_MTN/(REVSER6_MTN_0/(JQPCMHNF*HRNFPRI))) = ‐0.00287027595194 ‐
0.0564010509387 + 0.403202715826*DLOG(@MOVAV(REVSER6_MTN_0(‐1),2)/REVSER6_MTN_0) +
0.114047872501*DLOG(@MOVAV(JQPCMHNF(‐1)*HRNFPRI(‐1),2)/(JQPCMHNF*HRNFPRI)) ‐
0.883224794164*DLOG(WPISOP3000/JPGDP) + 0.00195477002302*@TREND
Eqn 365: DLOG(XEMPSER6_NENG/(REVSER6_NENG_0/(JQPCMHNF*HRNFPRI))) = ‐0.000372510088363 ‐
0.0564010509387 + 0.403202715826*DLOG(@MOVAV(REVSER6_NENG_0(‐1),2)/REVSER6_NENG_0) +
0.114047872501*DLOG(@MOVAV(JQPCMHNF(‐1)*HRNFPRI(‐1),2)/(JQPCMHNF*HRNFPRI)) ‐
0.883224794164*DLOG(WPISOP3000/JPGDP) + 0.00195477002302*@TREND
Eqn 366: DLOG(XEMPSER6_PAC/(REVSER6_PAC_0/(JQPCMHNF*HRNFPRI))) = 0.00284533028198 ‐
0.0564010509387 + 0.403202715826*DLOG(@MOVAV(REVSER6_PAC_0(‐1),2)/REVSER6_PAC_0) +
0.114047872501*DLOG(@MOVAV(JQPCMHNF(‐1)*HRNFPRI(‐1),2)/(JQPCMHNF*HRNFPRI)) ‐
0.883224794164*DLOG(WPISOP3000/JPGDP) + 0.00195477002302*@TREND
Eqn 367: DLOG(XEMPSER6_SATL/(REVSER6_SATL_0/(JQPCMHNF*HRNFPRI))) = ‐0.000403207501416 ‐
0.0564010509387 + 0.403202715826*DLOG(@MOVAV(REVSER6_SATL_0(‐1),2)/REVSER6_SATL_0) +
0.114047872501*DLOG(@MOVAV(JQPCMHNF(‐1)*HRNFPRI(‐1),2)/(JQPCMHNF*HRNFPRI)) ‐
0.883224794164*DLOG(WPISOP3000/JPGDP) + 0.00195477002302*@TREND
Eqn 368: DLOG(XEMPSER6_WNC/(REVSER6_WNC_0/(JQPCMHNF*HRNFPRI))) = 0.00159933798457 ‐
0.0564010509387 + 0.403202715826*DLOG(@MOVAV(REVSER6_WNC_0(‐1),2)/REVSER6_WNC_0) +
0.114047872501*DLOG(@MOVAV(JQPCMHNF(‐1)*HRNFPRI(‐1),2)/(JQPCMHNF*HRNFPRI)) ‐
0.883224794164*DLOG(WPISOP3000/JPGDP) + 0.00195477002302*@TREND
Eqn 369: DLOG(XEMPSER6_WSC/(REVSER6_WSC_0/(JQPCMHNF*HRNFPRI))) = ‐0.00334053286091 ‐
0.0564010509387 + 0.403202715826*DLOG(@MOVAV(REVSER6_WSC_0(‐1),2)/REVSER6_WSC_0) +
0.114047872501*DLOG(@MOVAV(JQPCMHNF(‐1)*HRNFPRI(‐1),2)/(JQPCMHNF*HRNFPRI)) ‐
0.883224794164*DLOG(WPISOP3000/JPGDP) + 0.00195477002302*@TREND
SER7 ‐ Retail trade
Eqn 370: DLOG(XEMPSER7_ENC/(REVSER7_ENC_0/(JQPCMHNF*HRNFPRI))) = ‐0.00390922924395 +
0.00837575333089 + 0.377976047017*DLOG(@MOVAV(REVSER7_ENC_0(‐1),2)/REVSER7_ENC_0) ‐
0.464055169982*DLOG(@MOVAV(JQPCMHNF(‐1)*HRNFPRI(‐1),2)/(JQPCMHNF*HRNFPRI)) +
[AR(1)=0.698158177587]
Eqn 371: DLOG(XEMPSER7_ESC/(REVSER7_ESC_0/(JQPCMHNF*HRNFPRI))) = 0.000590997510794 +
0.00837575333089 + 0.377976047017*DLOG(@MOVAV(REVSER7_ESC_0(‐1),2)/REVSER7_ESC_0) ‐
0.464055169982*DLOG(@MOVAV(JQPCMHNF(‐1)*HRNFPRI(‐1),2)/(JQPCMHNF*HRNFPRI)) +
[AR(1)=0.698158177587]
Eqn 372: DLOG(XEMPSER7_MATL/(REVSER7_MATL_0/(JQPCMHNF*HRNFPRI))) = 0.00184657682482 +
0.00837575333089 + 0.377976047017*DLOG(@MOVAV(REVSER7_MATL_0(‐1),2)/REVSER7_MATL_0) ‐
0.464055169982*DLOG(@MOVAV(JQPCMHNF(‐1)*HRNFPRI(‐1),2)/(JQPCMHNF*HRNFPRI)) +
[AR(1)=0.698158177587]
May 2014
U.S. Energy Information Administration | NEMS Macroeconomic Activity Module Documentation Report 254
Eqn 373: DLOG(XEMPSER7_MTN/(REVSER7_MTN_0/(JQPCMHNF*HRNFPRI))) = 0.000445815483594 +
0.00837575333089 + 0.377976047017*DLOG(@MOVAV(REVSER7_MTN_0(‐1),2)/REVSER7_MTN_0) ‐
0.464055169982*DLOG(@MOVAV(JQPCMHNF(‐1)*HRNFPRI(‐1),2)/(JQPCMHNF*HRNFPRI)) +
[AR(1)=0.698158177587]
Eqn 374: DLOG(XEMPSER7_NENG/(REVSER7_NENG_0/(JQPCMHNF*HRNFPRI))) = ‐0.00014758314604 +
0.00837575333089 + 0.377976047017*DLOG(@MOVAV(REVSER7_NENG_0(‐1),2)/REVSER7_NENG_0) ‐
0.464055169982*DLOG(@MOVAV(JQPCMHNF(‐1)*HRNFPRI(‐1),2)/(JQPCMHNF*HRNFPRI)) +
[AR(1)=0.698158177587]
Eqn 375: DLOG(XEMPSER7_PAC/(REVSER7_PAC_0/(JQPCMHNF*HRNFPRI))) = 0.00224022819274 +
0.00837575333089 + 0.377976047017*DLOG(@MOVAV(REVSER7_PAC_0(‐1),2)/REVSER7_PAC_0) ‐
0.464055169982*DLOG(@MOVAV(JQPCMHNF(‐1)*HRNFPRI(‐1),2)/(JQPCMHNF*HRNFPRI)) +
[AR(1)=0.698158177587]
Eqn 376: DLOG(XEMPSER7_SATL/(REVSER7_SATL_0/(JQPCMHNF*HRNFPRI))) = 0.00207031793708 +
0.00837575333089 + 0.377976047017*DLOG(@MOVAV(REVSER7_SATL_0(‐1),2)/REVSER7_SATL_0) ‐
0.464055169982*DLOG(@MOVAV(JQPCMHNF(‐1)*HRNFPRI(‐1),2)/(JQPCMHNF*HRNFPRI)) +
[AR(1)=0.698158177587]
Eqn 377: DLOG(XEMPSER7_WNC/(REVSER7_WNC_0/(JQPCMHNF*HRNFPRI))) = ‐0.0014554442896 +
0.00837575333089 + 0.377976047017*DLOG(@MOVAV(REVSER7_WNC_0(‐1),2)/REVSER7_WNC_0) ‐
0.464055169982*DLOG(@MOVAV(JQPCMHNF(‐1)*HRNFPRI(‐1),2)/(JQPCMHNF*HRNFPRI)) +
[AR(1)=0.698158177587]
Eqn 378: DLOG(XEMPSER7_WSC/(REVSER7_WSC_0/(JQPCMHNF*HRNFPRI))) = ‐0.00168167926944 +
0.00837575333089 + 0.377976047017*DLOG(@MOVAV(REVSER7_WSC_0(‐1),2)/REVSER7_WSC_0) ‐
0.464055169982*DLOG(@MOVAV(JQPCMHNF(‐1)*HRNFPRI(‐1),2)/(JQPCMHNF*HRNFPRI)) +
[AR(1)=0.698158177587]
SER8 ‐ Finance & insurance, real estate
Eqn 379: DLOG(XEMPSER8_ENC/(REVSER8_ENC_0/(JQPCMHNF*HRNFPRI))) = ‐0.00845838909401 +
0.00568587260999 + 0.336694251475*DLOG(@MOVAV(REVSER8_ENC_0(‐1),2)/REVSER8_ENC_0) ‐
1.19467360408*DLOG(@MOVAV(JQPCMHNF(‐1)*HRNFPRI(‐1),2)/(JQPCMHNF*HRNFPRI)) ‐
0.528625557851*DLOG(WPISOP3000/JPGDP) ‐ 0.000624221655467*@TREND + [AR(1)=‐0.349716791972]
Eqn 380: DLOG(XEMPSER8_ESC/(REVSER8_ESC_0/(JQPCMHNF*HRNFPRI))) = 0.00666931256972 +
0.00568587260999 + 0.336694251475*DLOG(@MOVAV(REVSER8_ESC_0(‐1),2)/REVSER8_ESC_0) ‐
1.19467360408*DLOG(@MOVAV(JQPCMHNF(‐1)*HRNFPRI(‐1),2)/(JQPCMHNF*HRNFPRI)) ‐
0.528625557851*DLOG(WPISOP3000/JPGDP) ‐ 0.000624221655467*@TREND + [AR(1)=‐0.349716791972]
Eqn 381: DLOG(XEMPSER8_MATL/(REVSER8_MATL_0/(JQPCMHNF*HRNFPRI))) = ‐0.0132206724635 +
0.00568587260999 + 0.336694251475*DLOG(@MOVAV(REVSER8_MATL_0(‐1),2)/REVSER8_MATL_0) ‐
1.19467360408*DLOG(@MOVAV(JQPCMHNF(‐1)*HRNFPRI(‐1),2)/(JQPCMHNF*HRNFPRI)) ‐
0.528625557851*DLOG(WPISOP3000/JPGDP) ‐ 0.000624221655467*@TREND + [AR(1)=‐0.349716791972]
May 2014
U.S. Energy Information Administration | NEMS Macroeconomic Activity Module Documentation Report 255
Eqn 382: DLOG(XEMPSER8_MTN/(REVSER8_MTN_0/(JQPCMHNF*HRNFPRI))) = 0.0069480345021 +
0.00568587260999 + 0.336694251475*DLOG(@MOVAV(REVSER8_MTN_0(‐1),2)/REVSER8_MTN_0) ‐
1.19467360408*DLOG(@MOVAV(JQPCMHNF(‐1)*HRNFPRI(‐1),2)/(JQPCMHNF*HRNFPRI)) ‐
0.528625557851*DLOG(WPISOP3000/JPGDP) ‐ 0.000624221655467*@TREND + [AR(1)=‐0.349716791972]
Eqn 383: DLOG(XEMPSER8_NENG/(REVSER8_NENG_0/(JQPCMHNF*HRNFPRI))) = ‐0.0119128720461 +
0.00568587260999 + 0.336694251475*DLOG(@MOVAV(REVSER8_NENG_0(‐1),2)/REVSER8_NENG_0) ‐
1.19467360408*DLOG(@MOVAV(JQPCMHNF(‐1)*HRNFPRI(‐1),2)/(JQPCMHNF*HRNFPRI)) ‐
0.528625557851*DLOG(WPISOP3000/JPGDP) ‐ 0.000624221655467*@TREND + [AR(1)=‐0.349716791972]
Eqn 384: DLOG(XEMPSER8_PAC/(REVSER8_PAC_0/(JQPCMHNF*HRNFPRI))) = 0.00172697244062 +
0.00568587260999 + 0.336694251475*DLOG(@MOVAV(REVSER8_PAC_0(‐1),2)/REVSER8_PAC_0) ‐
1.19467360408*DLOG(@MOVAV(JQPCMHNF(‐1)*HRNFPRI(‐1),2)/(JQPCMHNF*HRNFPRI)) ‐
0.528625557851*DLOG(WPISOP3000/JPGDP) ‐ 0.000624221655467*@TREND + [AR(1)=‐0.349716791972]
Eqn 385: DLOG(XEMPSER8_SATL/(REVSER8_SATL_0/(JQPCMHNF*HRNFPRI))) = 0.00551031511881 +
0.00568587260999 + 0.336694251475*DLOG(@MOVAV(REVSER8_SATL_0(‐1),2)/REVSER8_SATL_0) ‐
1.19467360408*DLOG(@MOVAV(JQPCMHNF(‐1)*HRNFPRI(‐1),2)/(JQPCMHNF*HRNFPRI)) ‐
0.528625557851*DLOG(WPISOP3000/JPGDP) ‐ 0.000624221655467*@TREND + [AR(1)=‐0.349716791972]
Eqn 386: DLOG(XEMPSER8_WNC/(REVSER8_WNC_0/(JQPCMHNF*HRNFPRI))) = 0.0060518207136 +
0.00568587260999 + 0.336694251475*DLOG(@MOVAV(REVSER8_WNC_0(‐1),2)/REVSER8_WNC_0) ‐
1.19467360408*DLOG(@MOVAV(JQPCMHNF(‐1)*HRNFPRI(‐1),2)/(JQPCMHNF*HRNFPRI)) ‐
0.528625557851*DLOG(WPISOP3000/JPGDP) ‐ 0.000624221655467*@TREND + [AR(1)=‐0.349716791972]
Eqn 387: DLOG(XEMPSER8_WSC/(REVSER8_WSC_0/(JQPCMHNF*HRNFPRI))) = 0.00668547825875 +
0.00568587260999 + 0.336694251475*DLOG(@MOVAV(REVSER8_WSC_0(‐1),2)/REVSER8_WSC_0) ‐
1.19467360408*DLOG(@MOVAV(JQPCMHNF(‐1)*HRNFPRI(‐1),2)/(JQPCMHNF*HRNFPRI)) ‐
0.528625557851*DLOG(WPISOP3000/JPGDP) ‐ 0.000624221655467*@TREND + [AR(1)=‐0.349716791972]
SER9 ‐ Other services
Eqn 388: DLOG(XEMPSER9_ENC/(REVSER9_ENC_0/(JQPCMHNF*HRNFPRI))) = ‐0.00200000326021 +
0.0252503008616 ‐ 0.0334517049212*DLOG(WPI05_ENC(‐1)/JPGDP(‐1)) ‐ 0.000482077069826*@TREND
Eqn 389: DLOG(XEMPSER9_ESC/(REVSER9_ESC_0/(JQPCMHNF*HRNFPRI))) = 0.00227796769694 +
0.0252503008616 ‐ 0.0334517049212*DLOG(WPI05_ESC(‐1)/JPGDP(‐1)) ‐ 0.000482077069826*@TREND
Eqn 390: DLOG(XEMPSER9_MATL/(REVSER9_MATL_0/(JQPCMHNF*HRNFPRI))) = 0.0037424344561 +
0.0252503008616 ‐ 0.0334517049212*DLOG(WPI05_MATL(‐1)/JPGDP(‐1)) ‐ 0.000482077069826*@TREND
Eqn 391: DLOG(XEMPSER9_MTN/(REVSER9_MTN_0/(JQPCMHNF*HRNFPRI))) = ‐0.0031923085586 +
0.0252503008616 ‐ 0.0334517049212*DLOG(WPI05_MTN(‐1)/JPGDP(‐1)) ‐ 0.000482077069826*@TREND
Eqn 392: DLOG(XEMPSER9_NENG/(REVSER9_NENG_0/(JQPCMHNF*HRNFPRI))) = ‐0.00397579553099 +
0.0252503008616 ‐ 0.0334517049212*DLOG(WPI05_NENG(‐1)/JPGDP(‐1)) ‐ 0.000482077069826*@TREND
May 2014
U.S. Energy Information Administration | NEMS Macroeconomic Activity Module Documentation Report 256
Eqn 393: DLOG(XEMPSER9_PAC/(REVSER9_PAC_0/(JQPCMHNF*HRNFPRI))) = 0.00348142393627 +
0.0252503008616 ‐ 0.0334517049212*DLOG(WPI05_PAC(‐1)/JPGDP(‐1)) ‐ 0.000482077069826*@TREND
Eqn 394: DLOG(XEMPSER9_SATL/(REVSER9_SATL_0/(JQPCMHNF*HRNFPRI))) = ‐0.00276324057544 +
0.0252503008616 ‐ 0.0334517049212*DLOG(WPI05_SATL(‐1)/JPGDP(‐1)) ‐ 0.000482077069826*@TREND
Eqn 395: DLOG(XEMPSER9_WNC/(REVSER9_WNC_0/(JQPCMHNF*HRNFPRI))) = ‐0.00137838392339 +
0.0252503008616 ‐ 0.0334517049212*DLOG(WPI05_WNC(‐1)/JPGDP(‐1)) ‐ 0.000482077069826*@TREND
Eqn 396: DLOG(XEMPSER9_WSC/(REVSER9_WSC_0/(JQPCMHNF*HRNFPRI))) = 0.00380790575933 +
0.0252503008616 ‐ 0.0334517049212*DLOG(WPI05_WSC(‐1)/JPGDP(‐1)) ‐ 0.000482077069826*@TREND
SER10 ‐ Federal government
Eqn 397: DLOG(XEMPSER10_ENC/(REVSER10_ENC_0/(JQPCMHNF*HRNFPRI))) = 0.00437155930612 +
0.00100315503694 + 0.797824555722*DLOG(@MOVAV(REVSER10_ENC_0(‐1),2)/REVSER10_ENC_0)
Eqn 398: DLOG(XEMPSER10_ESC/(REVSER10_ESC_0/(JQPCMHNF*HRNFPRI))) = ‐7.50650790565e‐05 +
0.00100315503694 + 0.797824555722*DLOG(@MOVAV(REVSER10_ESC_0(‐1),2)/REVSER10_ESC_0)
Eqn 399: DLOG(XEMPSER10_MATL/(REVSER10_MATL_0/(JQPCMHNF*HRNFPRI))) = 0.000731142597938 +
0.00100315503694 + 0.797824555722*DLOG(@MOVAV(REVSER10_MATL_0(‐1),2)/REVSER10_MATL_0)
Eqn 400: DLOG(XEMPSER10_MTN/(REVSER10_MTN_0/(JQPCMHNF*HRNFPRI))) = 0.000228349695277 +
0.00100315503694 + 0.797824555722*DLOG(@MOVAV(REVSER10_MTN_0(‐1),2)/REVSER10_MTN_0)
Eqn 401: DLOG(XEMPSER10_NENG/(REVSER10_NENG_0/(JQPCMHNF*HRNFPRI))) = 0.000302620181183 +
0.00100315503694 + 0.797824555722*DLOG(@MOVAV(REVSER10_NENG_0(‐1),2)/REVSER10_NENG_0)
Eqn 402: DLOG(XEMPSER10_PAC/(REVSER10_PAC_0/(JQPCMHNF*HRNFPRI))) = ‐0.00664743578615 +
0.00100315503694 + 0.797824555722*DLOG(@MOVAV(REVSER10_PAC_0(‐1),2)/REVSER10_PAC_0)
Eqn 403: DLOG(XEMPSER10_SATL/(REVSER10_SATL_0/(JQPCMHNF*HRNFPRI))) = 7.272930683e‐05 +
0.00100315503694 + 0.797824555722*DLOG(@MOVAV(REVSER10_SATL_0(‐1),2)/REVSER10_SATL_0)
Eqn :404 DLOG(XEMPSER10_WNC/(REVSER10_WNC_0/(JQPCMHNF*HRNFPRI))) = 0.0021546145864 +
0.00100315503694 + 0.797824555722*DLOG(@MOVAV(REVSER10_WNC_0(‐1),2)/REVSER10_WNC_0)
Eqn 405: DLOG(XEMPSER10_WSC/(REVSER10_WSC_0/(JQPCMHNF*HRNFPRI))) = ‐0.00113851480854 +
0.00100315503694 + 0.797824555722*DLOG(@MOVAV(REVSER10_WSC_0(‐1),2)/REVSER10_WSC_0)
SER11 ‐ State and local government
Eqn 406: DLOG(XEMPSER11_ENC/(REVSER10_ENC_0/(JQPCMHNF*HRNFPRI))) = ‐0.000174203369438 +
0.03426612965 + 0.456926154752*DLOG(@MOVAV(REVSER10_ENC_0(‐1),2)/REVSER10_ENC_0) ‐
0.0312012874573*DLOG(WPI05_ENC(‐1)/JPGDP(‐1)) ‐ 0.000801321569354*@TREND
May 2014
U.S. Energy Information Administration | NEMS Macroeconomic Activity Module Documentation Report 257
Eqn 407: DLOG(XEMPSER11_ESC/(REVSER10_ESC_0/(JQPCMHNF*HRNFPRI))) = 0.00115896122546 +
0.03426612965 + 0.456926154752*DLOG(@MOVAV(REVSER10_ESC_0(‐1),2)/REVSER10_ESC_0) ‐
0.0312012874573*DLOG(WPI05_ESC(‐1)/JPGDP(‐1)) ‐ 0.000801321569354*@TREND
Eqn 408: DLOG(XEMPSER11_MATL/(REVSER10_MATL_0/(JQPCMHNF*HRNFPRI))) = 0.000619434044914 + 0.03426612965 + 0.456926154752*DLOG(@MOVAV(REVSER10_MATL_0(‐1),2)/REVSER10_MATL_0) ‐ 0.0312012874573*DLOG(WPI05_MATL(‐1)/JPGDP(‐1)) ‐ 0.000801321569354*@TREND
Eqn 409: DLOG(XEMPSER11_MTN/(REVSER10_MTN_0/(JQPCMHNF*HRNFPRI))) = 0.000774070864859 +
0.03426612965 + 0.456926154752*DLOG(@MOVAV(REVSER10_MTN_0(‐1),2)/REVSER10_MTN_0) ‐
0.0312012874573*DLOG(WPI05_MTN(‐1)/JPGDP(‐1)) ‐ 0.000801321569354*@TREND
Eqn 410: DLOG(XEMPSER11_NENG/(REVSER10_NENG_0/(JQPCMHNF*HRNFPRI))) = 0.00124158749467 +
0.03426612965 + 0.456926154752*DLOG(@MOVAV(REVSER10_NENG_0(‐1),2)/REVSER10_NENG_0) ‐
0.0312012874573*DLOG(WPI05_NENG(‐1)/JPGDP(‐1)) ‐ 0.000801321569354*@TREND
Eqn 411: DLOG(XEMPSER11_PAC/(REVSER10_PAC_0/(JQPCMHNF*HRNFPRI))) = ‐0.000479309193183 +
0.03426612965 + 0.456926154752*DLOG(@MOVAV(REVSER10_PAC_0(‐1),2)/REVSER10_PAC_0) ‐
0.0312012874573*DLOG(WPI05_PAC(‐1)/JPGDP(‐1)) ‐ 0.000801321569354*@TREND
Eqn 412: DLOG(XEMPSER11_SATL/(REVSER10_SATL_0/(JQPCMHNF*HRNFPRI))) = ‐0.00275119107066 +
0.03426612965 + 0.456926154752*DLOG(@MOVAV(REVSER10_SATL_0(‐1),2)/REVSER10_SATL_0) ‐
0.0312012874573*DLOG(WPI05_SATL(‐1)/JPGDP(‐1)) ‐ 0.000801321569354*@TREND
Eqn 413: DLOG(XEMPSER11_WNC/(REVSER10_WNC_0/(JQPCMHNF*HRNFPRI))) = 0.00039381003021 +
0.03426612965 + 0.456926154752*DLOG(@MOVAV(REVSER10_WNC_0(‐1),2)/REVSER10_WNC_0) ‐
0.0312012874573*DLOG(WPI05_WNC(‐1)/JPGDP(‐1)) ‐ 0.000801321569354*@TREND
Eqn 414: DLOG(XEMPSER11_WSC/(REVSER10_WSC_0/(JQPCMHNF*HRNFPRI))) = ‐0.000783160026824 +
0.03426612965 + 0.456926154752*DLOG(@MOVAV(REVSER10_WSC_0(‐1),2)/REVSER10_WSC_0) ‐
0.0312012874573*DLOG(WPI05_WSC(‐1)/JPGDP(‐1)) ‐ 0.000801321569354*@TREND
Related Documents