Aalto University School of Electrical Engineering Master’s Programme in Automation and Electrical Engineering Stanislav Kalabin Machine learning solutions for maintenance of power plants Master’s Thesis Espoo, May 27, 2018 Supervisor: Valeriy Vyatkin, Professor Thesis advisors: Markku Muilu, M.Sc. (Tech.); Pekka Mild, D.Sc. (Tech.)

Welcome message from author
This document is posted to help you gain knowledge. Please leave a comment to let me know what you think about it! Share it to your friends and learn new things together.
Transcript

Aalto University
School of Electrical Engineering
Master’s Programme in Automation and Electrical Engineering
Stanislav Kalabin
Machine learning solutions for maintenance of
power plants
Master’s Thesis
Espoo, May 27, 2018
Supervisor: Valeriy Vyatkin, Professor
Thesis advisors: Markku Muilu, M.Sc. (Tech.); Pekka Mild, D.Sc. (Tech.)
ii
Abstract
Author: Stanislav Kalabin
Title of the thesis: Machine learning solutions for maintenance of power plants
Number of pages: 66+7 Date: 27.05.18
Major: Electrical power and energy engineering
Supervisor: Valeriy Vyatkin
Thesis advisors: Markku Muilu, Pekka Mild
The primary goal of this work is to present analysis of current market for predictive
maintenance software solutions applicable to a generic coal/gas-fired thermal power
plant, as well as to present a brief discussion on the related developments of the near
future. This type of solutions is in essence an advanced condition monitoring
technique, that is used to continuously monitor entire plants and detect sensor reading
deviations via correlative calculations. This approach allows for malfunction
forecasting well in advance to a malfunction itself and any possible unforeseen
consequences.
Predictive maintenance software solutions employ primitive artificial intelligence in the
form of machine learning (ML) algorithms to provide early detection of signal
deviation. Before analyzing existing ML based solutions, structure and theory behind
the processes of coal/gas driven power plants is going to be discussed to emphasize
the necessity of predictive maintenance for optimal and reliable operation. Subjects to
be discussed are: basic theory (thermodynamics and electrodynamics), primary
machinery types, automation systems and data transmission, typical faults and
condition monitoring techniques that are also often used in tandem with ML.
Additionally, the basic theory on the main machine learning techniques related to
malfunction prediction is going to be briefly presented.
Keywords: predictive maintenance, machine learning, power plant processes.
Publishing language: English
iii
Contents
Abstract...................................................................................................................................................................... ii
Abbreviations .......................................................................................................................................................... v
List of tables and figures ....................................................................................................................................vi
1. Introduction ................................................................................................................................................... 1
2. Thermodynamic processes. ..................................................................................................................... 3
2.1. Enthalpy ........................................................................................................................ 4
2.2. Cycles............................................................................................................................. 6
2.2.1. Carnot ............................................................................................................................................ 6
2.2.2. Rankine ........................................................................................................................................ 7
2.2.3. Brayton ......................................................................................................................................... 8
2.2.4. Cycle improvements ................................................................................................................ 9
2.3. Boiler ........................................................................................................................... 11
2.4. Turbine ........................................................................................................................ 12
2.4.1. Steam .......................................................................................................................................... 13
2.4.2. Gas ................................................................................................................................................ 13
2.5. Condenser and water processing ................................................................................ 14
2.6. Flue gas purification .................................................................................................... 15
2.6.1. Fly ash ......................................................................................................................................... 15
2.6.2. Desulphurization ................................................................................................................... 16
2.7. Fuel supply and conditioning ...................................................................................... 17
2.7.1. Conveyors ................................................................................................................................. 18
2.7.2. Coal processing ....................................................................................................................... 18
2.8. Fluid control ................................................................................................................ 19
2.8.1. Pumps and fans ...................................................................................................................... 19
2.8.2. Valves .......................................................................................................................................... 19
3. Electrodynamic processes ..................................................................................................................... 21
3.1. Basics ........................................................................................................................... 21
3.2. Generator/Motor ........................................................................................................ 22
3.3. Transformation ........................................................................................................... 25
3.3.1. Transformer ............................................................................................................................. 25
3.3.2. Frequency converter ............................................................................................................ 26
4. Condition monitoring and automation ............................................................................................ 27

iv
4.1. Weaknesses ................................................................................................................. 27
4.2. Monitoring techniques ................................................................................................ 29
4.3. Automation ................................................................................................................. 30
4.3.1. Hardware and software ...................................................................................................... 31
4.3.2. Data transmission protocols ............................................................................................. 32
5. Machine learning ....................................................................................................................................... 35
5.1. Regression ................................................................................................................... 36
5.2. Classification and kernel trick ..................................................................................... 37
5.3. Clustering and unsupervised learning ......................................................................... 38
5.4. Artificial neural network ............................................................................................. 39
6. “Industry 4.0” .............................................................................................................................................. 41
6.1. Maintpartner INtelligence (Remote Access Tool) ....................................................... 41
6.2. NEC SIAT (Invariant Analyzer) ..................................................................................... 43
6.3. Avantis PRiSM (Predictive Asset Analytics) ................................................................. 44
6.4. Uptake ......................................................................................................................... 45
6.5. Siemens Plant Monitor and MindSphere. ................................................................... 47
6.6. GE SmartSignal and Predix .......................................................................................... 48
6.7. ABB Ability, IBM Watson and MS Azure ..................................................................... 50
6.7.1. IBM Watson .............................................................................................................................. 51
6.7.2. Microsoft Azure ...................................................................................................................... 51
6.8. C3 IoT Platform............................................................................................................ 52
6.9. Seeq ............................................................................................................................. 53
6.10. SAP PM and Service ................................................................................................. 54
7. Comparison and conclusion ................................................................................................................. 56
8. Appendices .................................................................................................................................................. 59
9. References .................................................................................................................................................... 61

v
Abbreviations
AI – Artificial Intelligence
ANN – Artificial Neural Network
API – Application Programming Interface
CCGT – Combined Cycle Gas Turbine
CFB – Circulating Fluidized Bed
CHP – Combined Heat and Power
CM – Condition Monitoring
CPU – Central Processing Unit
DH – District Heating
EMF – ElectroMotive Force
GT – Gas Turbine
I/O – Input/Output
IoT – Internet of Things
IP – Intermediate Pressure
HP – High Pressure
LP – Low Pressure
LV – Low Voltage
ML – Machine Learning
MV – Medium Voltage
PD – Partial Discharge
PLC – Programmable Logic Controller
PM – Predictive Maintenance
PP – Power Plant
PWM - Pulse Width Modulation
rpm – revolutions per minute
RTU – Remote Terminal Unit
TG – Turbo-Generator
UI – User Interface
VFD - Variable Frequency Drive

vi
List of tables and figures
Figure 1 Damavand CCGT plant, 3000MW, Iran [7] ..................................................................... 3
Figure 2 Simplified schematic of the process on a CCGT plant [9] ................................................ 4
Figure 3 Piston in a cylinder [10] ................................................................................................... 4
Figure 4 Carnot cycle, Ts diagram (4.1) and simplified schematic (4.2) [12] ................................... 6
Figure 5 Rankine cycle TS diagram (5.1) and schematic (5.2) [15, p.41].......................................... 7
Figure 6 Brayton cycle TS diagram (6.1) [16] and schematic of an open cycle (6.2) [17] ................. 8
Figure 7 closed Brayton cycle [17] ................................................................................................. 9
Figure 8 Reheat cycle schematic (8.1) and Ts diagram (8.2) [12, pp.259-260] ................................. 9
Figure 9 Standard double reheat layout [19] ................................................................................. 10 Figure 10 schematic of a GT with regeneration, reheat and intercooling (10.1) and Ts diagram
(10.2) [12, p.355] .......................................................................................................................... 10
Figure 11 Generic pulverized coal-fired boiler [26] ...................................................................... 11
Figure 12 A CFB based system (Foster Wheeler Pyropower, Inc.) [24] ........................................ 12
Figure 13 Turbine types: impulse (upper) and reaction (lower) [28].......................................... 12 Figure 14 GE STF-D200, up to 300MW of output power. HP, IP and LP (left to right) turbine
stages are clearly visible. Courtesy of GE ...................................................................................... 13 Figure 15 SGT-8000H heavy duty GT, 450MW of rated power output and efficiency of 61% in
CCGT, compressor turbine stages with 4 variable vane stages can be seen on the left, 4 GT stages
are on the right and combustion system in between. Courtesy of SIEMENS AG ......................... 14
Figure 16 Condenser schematic [25, p.224] .................................................................................. 15
Figure 17 ESP filter principle [32]................................................................................................ 15
Figure 18 Bag filter schematics [33] ............................................................................................. 16
Figure 19 Wet scrubbing facility schematics [35] .......................................................................... 17
Figure 20 Belt (upper) and auger (lower) type conveyors [8, pp.146-147] ..................................... 18
Figure 21 Sludge removal elevator, Suomenojan PP..................................................................... 18
Figure 22 Coal mill [24, p.267] .................................................................................................... 18
Figure 23 Centrifugal pump [37] ................................................................................................. 19
Figure 24 Automatic recirculation valve, courtesy of SchuF Group. ............................................ 20
Figure 25 three-phase current. [38] .............................................................................................. 21
Figure 26 Transformer, simplified schematic, 1-phase [39, p. 51] ................................................. 22
Figure 27 600MW TG stator winding with water-cooled windings [41, p. 21] .............................. 23
Figure 28 a. Not yet wound 320MW TG rotor, b. Same rotor with winding in place ................... 23
Figure 29 A cross-section of a typical induction motor, courtesy of ABB .................................... 24 Figure 30 A modern LV/MV 3-phase transformer (up to 4MVA), Siemens GEAFOL Neo,
courtesy of Siemens AG ............................................................................................................... 25 Figure 31 ABB ACS550, modern compact wall-mounted VFD for drive control of up to 315kW,
courtesy of ABB ........................................................................................................................... 26 Figure 32 GT flue gas temperature measurement (wired sensors can be seen mounted radially on
the outer rim), Suomenojan PP .................................................................................................... 29
Figure 33 Search coil installation [61]. ......................................................................................... 30
Figure 34 Example of automation communication hardware arrangement, ABB Symphony Plus 31 Figure 35 Example of an automation system UI: boiler, DH and steam TG, Suomenojan PP
(Metso DNA system) ................................................................................................................... 32
vii
Figure 36 Basic schematic of a secure internet connection [66] .................................................... 34
Figure 37 Linear regression (upper) and MSE optimization (lower) [68, p. 107] ........................... 36
Figure 38 a graphical representation of the SVM algorithm [70] .................................................. 37
Figure 39 simple graphical representation of ANN [74] ............................................................... 39
Figure 40 UI of Remote Access Tool .......................................................................................... 42
Figure 41 Invariant Analyzer UI on a tablet [81] .......................................................................... 43
Figure 42 PRiSM UI [84] ............................................................................................................. 45
Figure 43 Uptake UI ................................................................................................................... 46
Figure 44 Plant Monitor UI opened inside T3000 app [87]. ......................................................... 47
Figure 45 Mindsphere UI as presented in the whitepaper, courtesy of Siemens AG. .................... 48
Figure 46 GE Predix APM UI, Courtesy of GE .......................................................................... 49 Figure 47 ABB Ellipse APM UI dashboard (left) and transformer Duval triangles (right), courtesy
of ABB ......................................................................................................................................... 50
Figure 48 C3IoT PM UI, courtesy of C3 Inc. .............................................................................. 53
Figure 49 Seeq Workbench UI, courtesy of Seeq Corporation ..................................................... 54
Figure 50 SAP PM and Service UI, courtesy of SAP ................................................................... 55 Figure 51 Google Glass (upper, courtesy of Google Inc.), Microsoft Hololens (lower, courtesy of
Microsoft) [119, 120] .................................................................................................................... 57
Figure 52 Electricity consumption in China (calculated and estimated) [2] ................................... 59 Figure 53 Hysteresis loop examples of ferrite (iron-based) and NdFeB (neodymium) magnets,
displaying nonlinearity between magnetic field strength H and magnetic flux density B [39, p.20]. 60 Figure 54 Example of a steam temperature-entropy diagram, beyond the right edge of the bell is
the superheated dry steam region, left – liquid water, above the bell and upper right region is
supercritical. ................................................................................................................................. 60
Table 1 Comparable feature overview for the solutions analyzed ................................................. 56
Table 2 Worldwide electricity generation, exempt [1] ................................................................... 59

1
1. Introduction
Electricity generation across the world grows every year, thus increasing already significant
numbers even beyond. This is imposed by various activities in human societies especially in
the rapidly developing countries – e.g. China or India in recent years. (Table 2, Appendix).
[1]
As for the reasons behind that: generation rates are intertwined with the consumption rates
and are mostly industrial manufacturing-driven, i.e. the more production takes place in a
country, the higher the required electricity supply. Next in magnitude is the residential
sector, i.e. the more population there is to use basic home appliances, street lighting and
district heating, the higher the total consumption. (e.g. Chinese consumption rates for
different sectors, fig. 51, Appendix). [2]
Obviously, immense numbers of terawatt-hours of electricity required by countless
consumers are supposed to have sources. And, indeed, various methods to convert energy
into versatile electricity have been discovered over the history of mankind - from
harnessing the kinetic energy of motion with a generator to converting the energy of
sunlight with solar panels. These methods in turn have evolved into different PP types
employed to generate electricity on the commercial level. The plant types have the main
structural differences mostly dependent on the type of energy source used: fossil (gas/coal),
nuclear fuel, wind etc. [3,4]
Nevertheless, disregarding the type, these plants have one quality in common - nearly
unfathomable level of sophistication. Countless elements are intertwined into a complex
interdependent combination: heavy rotating machinery, multilevel monitoring and
controlling electronics unified with computer networks, high pressure and high
temperature withstanding routings and mechanisms. Sophisticated appliances might fail
under constant heavy load due to various reasons, be it a manufacturing imperfection of
even a single important element in the system, loads exceeded over nominal values or just
plain pre-estimated wear, not to mention the human factor (poor maintenance or
operation). Independently of the cause, final consequence is always the same – critical
malfunction of a device, rendering it inoperable. Additionally, apart from a single
breakdown the malfunctioning device may cause an outage of a branch of a system or an
entire system (thus upsetting the stability of local electrical network), make the working
environment hazardous for the operating personnel, incur heavy financial losses for the
operating company or even lead to catastrophic events, if the PP in question is nuclear. [5]
Existence of various techniques makes it possible to prevent any of these consequences by
addressing the core cause – the original malfunction itself. All such techniques are a part of
an important subject of CM, role of which became prominent for the majority of energy
companies since the beginning of 1990. CM can be divided into two major parts: offline –
a machine is shut down for a scheduled thorough inspection or repair to be conducted, and
online – a machine is running normally while being monitored. Further on, online methods
are currently comprised of different techniques of monitoring each machine or part of a PP

2
system with a myriad of various sensors dotting every important device. This sensor-based
monitoring became incredibly reliable and irreplaceable with the advancement in
technological development – the further the advancement, the more compact, accurate and
cheap sensors become and thus the more ways to easily monitor a machine with a constant
access to its exact current status without the need to shut it down or run the checks
manually with an external apparatus. Furthermore, advancement of computer technologies
also brought the possibility of synergy between computers and various sensor data that has
never been available before, e.g. computers equipped with ML based software are able not
only to monitor the current state of different parts of a system and alarm when something
is wrong, but also can predict failures long before they happen by detecting early systematic
deviations from normal measurement values. [6]
The main focus for this thesis is going to be the subjects of a generic thermal power plant
(coal/gas-fired only, excluding nuclear PPs) processes and suitable predictive maintenance
ML based software solutions. More precisely: basics of PP processes and their structure is
going to be presented in the beginning to demonstrate the necessity and reasoning for CM
and it is going to be followed by a brief discussion on the CM techniques (also often used
in conjunction with ML methods) themselves, monitoring and control systems, as well as
on the basics of ML. Next, a research is going to be conducted into the current state of the
PM software market (on the global scale) with comparison and estimation of the trends for
future developments. Solutions to be studied mostly belong to the “energy applications”
group (i.e. designed for use on PPs), but some solutions are designed for industrial use
(application on various factories). Nevertheless, they still are going to be analyzed and
listed, for the technology applied is similar as is the functionality.
3
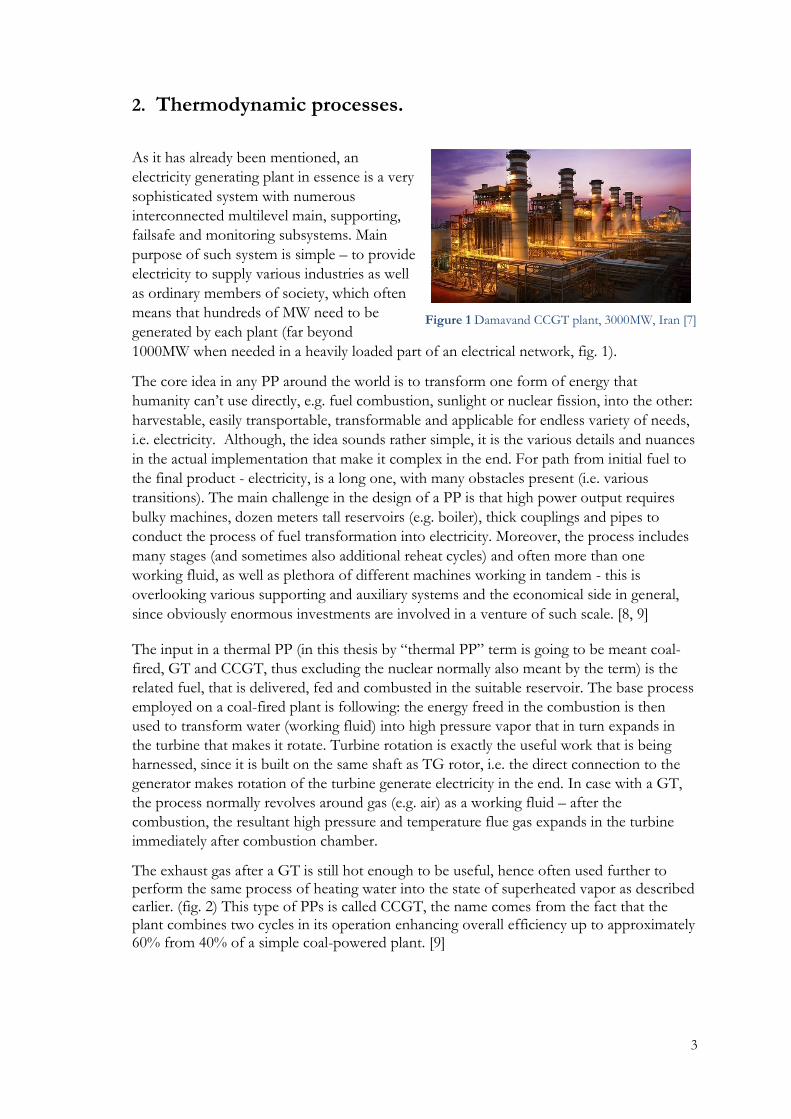
Figure 1 Damavand CCGT plant, 3000MW, Iran [7]
2. Thermodynamic processes.
As it has already been mentioned, an
electricity generating plant in essence is a very
sophisticated system with numerous
interconnected multilevel main, supporting,
failsafe and monitoring subsystems. Main
purpose of such system is simple – to provide
electricity to supply various industries as well
as ordinary members of society, which often
means that hundreds of MW need to be
generated by each plant (far beyond
1000MW when needed in a heavily loaded part of an electrical network, fig. 1).
The core idea in any PP around the world is to transform one form of energy that
humanity can’t use directly, e.g. fuel combustion, sunlight or nuclear fission, into the other:
harvestable, easily transportable, transformable and applicable for endless variety of needs,
i.e. electricity. Although, the idea sounds rather simple, it is the various details and nuances
in the actual implementation that make it complex in the end. For path from initial fuel to
the final product - electricity, is a long one, with many obstacles present (i.e. various
transitions). The main challenge in the design of a PP is that high power output requires
bulky machines, dozen meters tall reservoirs (e.g. boiler), thick couplings and pipes to
conduct the process of fuel transformation into electricity. Moreover, the process includes
many stages (and sometimes also additional reheat cycles) and often more than one
working fluid, as well as plethora of different machines working in tandem - this is
overlooking various supporting and auxiliary systems and the economical side in general,
since obviously enormous investments are involved in a venture of such scale. [8, 9]
The input in a thermal PP (in this thesis by “thermal PP” term is going to be meant coal-
fired, GT and CCGT, thus excluding the nuclear normally also meant by the term) is the
related fuel, that is delivered, fed and combusted in the suitable reservoir. The base process
employed on a coal-fired plant is following: the energy freed in the combustion is then
used to transform water (working fluid) into high pressure vapor that in turn expands in
the turbine that makes it rotate. Turbine rotation is exactly the useful work that is being
harnessed, since it is built on the same shaft as TG rotor, i.e. the direct connection to the
generator makes rotation of the turbine generate electricity in the end. In case with a GT,
the process normally revolves around gas (e.g. air) as a working fluid – after the
combustion, the resultant high pressure and temperature flue gas expands in the turbine
immediately after combustion chamber.
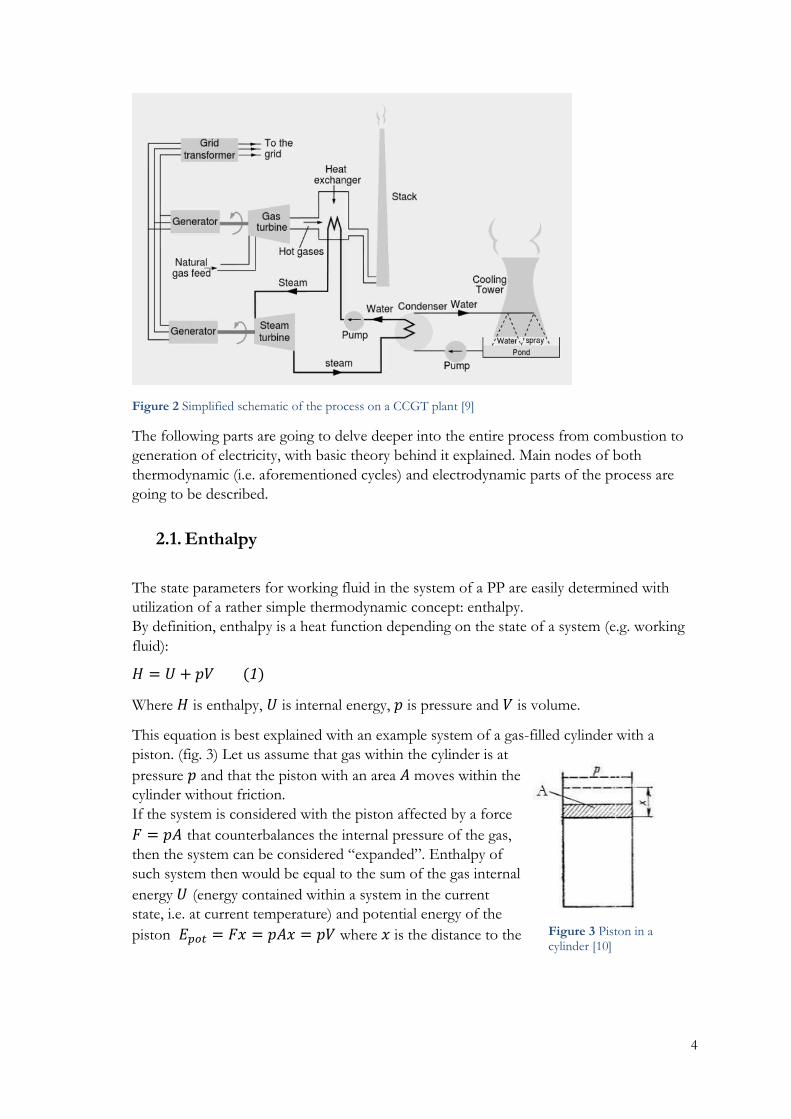
The exhaust gas after a GT is still hot enough to be useful, hence often used further to perform the same process of heating water into the state of superheated vapor as described earlier. (fig. 2) This type of PPs is called CCGT, the name comes from the fact that the plant combines two cycles in its operation enhancing overall efficiency up to approximately 60% from 40% of a simple coal-powered plant. [9]
4
Figure 2 Simplified schematic of the process on a CCGT plant [9]
The following parts are going to delve deeper into the entire process from combustion to
generation of electricity, with basic theory behind it explained. Main nodes of both
thermodynamic (i.e. aforementioned cycles) and electrodynamic parts of the process are
going to be described.
2.1. Enthalpy
The state parameters for working fluid in the system of a PP are easily determined with
utilization of a rather simple thermodynamic concept: enthalpy.
By definition, enthalpy is a heat function depending on the state of a system (e.g. working
fluid):
𝐻 = 𝑈 + 𝑝𝑉 (1)
Where 𝐻 is enthalpy, 𝑈 is internal energy, 𝑝 is pressure and 𝑉 is volume.
This equation is best explained with an example system of a gas-filled cylinder with a
piston. (fig. 3) Let us assume that gas within the cylinder is at
pressure 𝑝 and that the piston with an area 𝐴 moves within the
cylinder without friction.
If the system is considered with the piston affected by a force
𝐹 = 𝑝𝐴 that counterbalances the internal pressure of the gas,
then the system can be considered “expanded”. Enthalpy of
such system then would be equal to the sum of the gas internal
energy 𝑈 (energy contained within a system in the current
state, i.e. at current temperature) and potential energy of the
piston 𝐸𝑝𝑜𝑡 = 𝐹𝑥 = 𝑝𝐴𝑥 = 𝑝𝑉 where 𝑥 is the distance to the Figure 3 Piston in a cylinder [10]

5
point of equilibrium travelled by the piston when the force is applied.
Therefore, enthalpy is the sum of internal energy of a system and the work required to
introduce an object of volume 𝑉 into the system being at pressure 𝑝 and in equilibrium
with the object. Thus, enthalpy depends not only on temperature (via internal energy) but
also on pressure, which makes it especially useful in the working fluid state calculations.
Total enthalpy of a complex system containing 𝑁 independent parts would equal a sum of
enthalpies of all parts (additive property): [10]
𝐻𝑡𝑜𝑡 = ∑ 𝐻𝑖
𝑁
𝑖=1
= 𝐻1 + 𝐻2 + ⋯ + 𝐻𝑁 (2)
Furthermore, when the fluid is known, so-called “specific enthalpy” can be used, the
enthalpy per unit mass, that is usually denoted with a lowercase ℎ, yielding similar yet more
versatile version of formula (1):
ℎ = 𝑢 + 𝑝𝑣 (3)
It is more versatile in the sense that it can be used to calculate changes in heat/work on the
mass flow basis (�̇�, kg/s), when combined with the first law of thermodynamics1, and
depending on the type of energy primarily involved in the operation of a part (e.g. boiler,
turbine, pump etc.) of the system in question,
Work:
�̇� = �̇� ∗ 𝑤 = �̇�∆ℎ = �̇�(ℎ2 − ℎ1) (4)
or heat:
�̇� = �̇� ∗ 𝑞 = �̇�∆ℎ = �̇�(ℎ2 − ℎ1) (5)
In either case, the known enthalpy change with known mass flow yields the magnitude and
direction of energy flow (e.g. power produced by a turbine or amount of heat flow
consumed in the process of steam superheating) in the part of the process. Thus, making
the flow rate the one of the most important quantities to be measured along with pressure
and temperature.
Summarizing the aforementioned formulas and the concept itself: one can use changes in
enthalpy levels to design or analyze thermodynamic systems of any complexity. Also, basic
analysis can be performed even by hand, given the existence of vast amount of accurate
data accumulated in the form of tables sorted by temperature and pressure of a fluid in
question (e.g. VDI Heat Atlas [11]) and additional tools as e.g. temperature-specific entropy
(Ts) diagram (Fig. 53, Appendix) with distinctive fluid state variations. In the end, these
known enthalpy changes let one define the amounts of work/heat to be consumed or
produced by any part of a thermodynamic system. [12, pp.62, 68-72]
1 thermodynamic variation of the law of conservation, stating that energy can on only be transformed but
neither destroyed nor created: ΔU=Q-W, i.e. change of internal energy of a system is equal to the difference between heat introduced into and work done by the system. [12, p.60]

6
2.2. Cycles
The basic theoretical postulates above serve as a good backbone for another concept, that
is closer to the practical implementations in reality: thermodynamic cycles. While there is
plenty of different cycles (apart from mentioned here, e.g. Otto and Diesel cycles employed
in combustion engines), suitable for various uses, those affiliated with PP processes the
most are going to be discussed.
2.2.1. Carnot
The most basic cycle, which serves mostly as an
idealistic one to compare the rest to: Carnot cycle (fig.
4). It is idealistic, because while it has the highest
possible efficiency of all cycles, it includes conditions
that are either impossible or just not feasible to
implement. In the cycle 1-2 is isothermal2 heating of the
working fluid (feedwater) in the boiler, 2-3 is adiabatic3
expansion in the turbine of a generator, 3-4 is
isothermal condensation (steam-to-water) in the
condenser and 4-1 is adiabatic compression via a pump.
All of the processes in the cycle are also assumed to be
reversible: nearly infinitely gradual i.e. excluding any
rapid changes for the system to stay in the constant
state of equilibrium, where real thermodynamic processes are often in equilibrium only at
the endpoints [14, pp. 60-61]. Efficiency of the cycle is:
𝜂 = 1 −𝑇𝑚𝑖𝑛
𝑇𝑚𝑎𝑥 (6)
Which basically means that efficiency is higher when the temperature difference is higher
(between the minimum temperature in the cycle and the maximum). Also, it can be noted,
that the lower temperature and pressure values are at the condenser, the more work is
produced by the turbine during the process of expansion. While simple in theory, this cycle
has severe limitations impossible to overcome in practice, main of which is the regions of
operation of the cycle. Namely, the expansion 2-3 and the compression 4-1 that happen to
be mostly in the “wet steam region”4. For both the turbine and the compressor (pump) it
would be mechanically difficult to manage moist steam, for particles of liquid water would
greatly reduce the lifespan of both due to damage incurred to moving parts given high
levels of pressure and temperature. Not only that, but also idealistic processes would
2 water-to-steam transformation, no temperature change 3 without heat transfer with outer environment, hence lossless, ideal process 4 fig. 5.1, inner area inside the bell is the “wet steam region”, fig. 54 (Appendix) – percentage of steam
dryness, i.e. “quality of steam” can be seen.
Figure 4 Carnot cycle, Ts diagram (4.1) and simplified schematic (4.2) [12]

7
require machines not feasible to build to achieve performance even somewhat close to the
desired, e.g. 4-1 would be realized with enormous compressor (pump) that would virtually
devour most of the energy produced by the turbine in 2-3. [12, pp. 251-253; 15, pp. 44-45]
2.2.2. Rankine
Because the Carnot cycle imposes challenges that are impossible to solve in reality, when
steam is the working fluid in question, a modified version of the cycle is commonly
employed on PPs – Rankine cycle (fig. 5). Main difference from Carnot is that previously
purely idealistic assumptions have been altered to more realistic ones (fig. 5.1): heating 4-5-
6-1 and condensation 2-3 are now isobaric (pressure is kept constant). Ideal Rankine model
still contains adiabatic processes: expansion 1-2s and compression 3-4s (although now
realistically irreversible). Nevertheless, given that these processes are taken to the
“superheated steam” and “subcooled5 liquid” regions respectively, it doesn’t render them
impossible for implementation, because in this cycle the turbine handles only dry6 steam
and the pump compresses only pure water, and both are possible to design to be durable
and reliable. The only difference in reality from theoretical “adiabatic” in this case is that
both processes are slightly less efficient: less work 𝑊𝑇 produced by the turbine and more
work 𝑊𝑇 consumed by the pump. Additionally, boiler now contains several heat exchangers,
each with its own separate function to transfer the working fluid from one state to another:
Superheater, Evaporator and Economizer (to be described in the later chapter).
The heat 𝑄1 is introduced into the exchangers via flue gas from burning the fuel (e.g. coal
powder) in the furnace, that usually is also a part of a boiler. The rest of main elements of
the cycle is identical to those in the Carnot cycle and only the points of operations in each
node are different with highest temperature of up to 565⁰C (limited only by metallurgical
considerations, i.e. infeasibility to use stronger but too exotic and expensive alloys). [12,
pp.253-255; 14, pp.39-49]
5 i.e. under the boiling point. 6 must be above 85% dry, if less: condensation on the turbine blades will cause increased wear due to
formation of droplets that damage the turbine at high rotation rates.
Figure 5 Rankine cycle TS diagram (5.1) and schematic (5.2) [15, p.41]
8
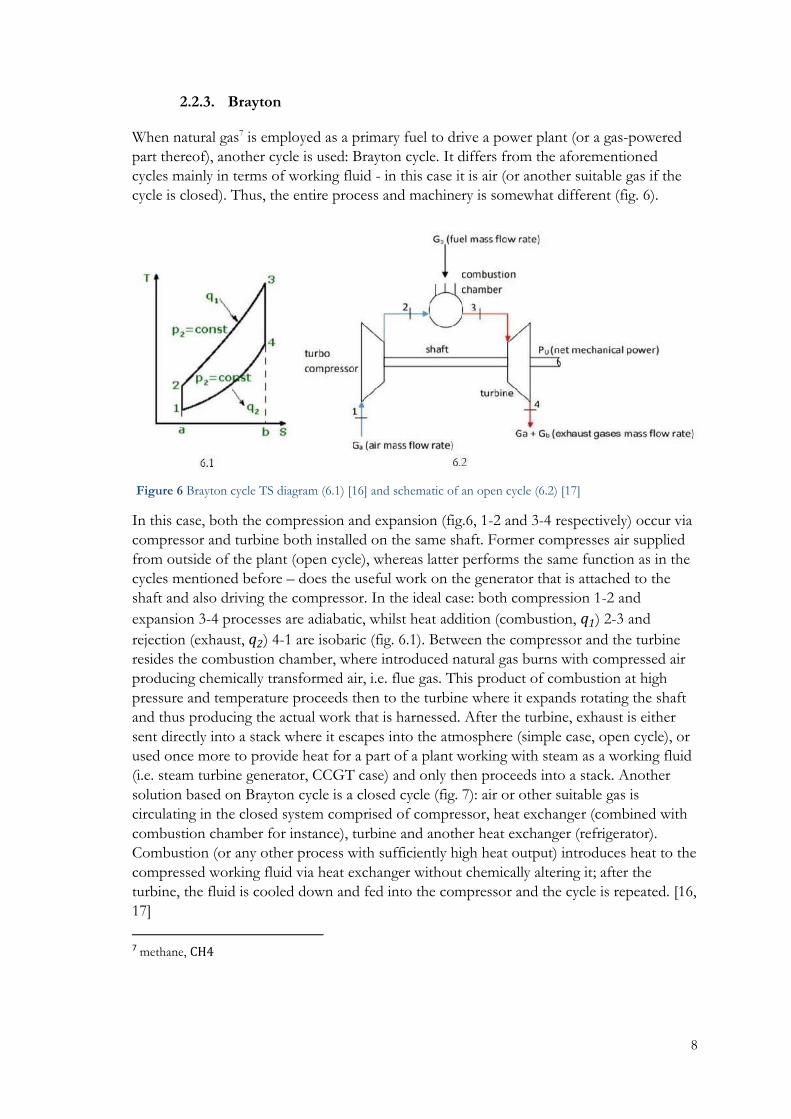
2.2.3. Brayton
When natural gas7 is employed as a primary fuel to drive a power plant (or a gas-powered
part thereof), another cycle is used: Brayton cycle. It differs from the aforementioned
cycles mainly in terms of working fluid - in this case it is air (or another suitable gas if the
cycle is closed). Thus, the entire process and machinery is somewhat different (fig. 6).
In this case, both the compression and expansion (fig.6, 1-2 and 3-4 respectively) occur via
compressor and turbine both installed on the same shaft. Former compresses air supplied
from outside of the plant (open cycle), whereas latter performs the same function as in the
cycles mentioned before – does the useful work on the generator that is attached to the
shaft and also driving the compressor. In the ideal case: both compression 1-2 and
expansion 3-4 processes are adiabatic, whilst heat addition (combustion, 𝑞1) 2-3 and
rejection (exhaust, 𝑞2) 4-1 are isobaric (fig. 6.1). Between the compressor and the turbine
resides the combustion chamber, where introduced natural gas burns with compressed air
producing chemically transformed air, i.e. flue gas. This product of combustion at high
pressure and temperature proceeds then to the turbine where it expands rotating the shaft
and thus producing the actual work that is harnessed. After the turbine, exhaust is either
sent directly into a stack where it escapes into the atmosphere (simple case, open cycle), or
used once more to provide heat for a part of a plant working with steam as a working fluid
(i.e. steam turbine generator, CCGT case) and only then proceeds into a stack. Another
solution based on Brayton cycle is a closed cycle (fig. 7): air or other suitable gas is
circulating in the closed system comprised of compressor, heat exchanger (combined with
combustion chamber for instance), turbine and another heat exchanger (refrigerator).
Combustion (or any other process with sufficiently high heat output) introduces heat to the
compressed working fluid via heat exchanger without chemically altering it; after the
turbine, the fluid is cooled down and fed into the compressor and the cycle is repeated. [16,
17]
7 methane, CH4
Figure 6 Brayton cycle TS diagram (6.1) [16] and schematic of an open cycle (6.2) [17]
9
Figure 7 closed Brayton cycle [17]
Closed cycle is not employed in reality due to technical
constraints imposed by the need of enormous heat
exchangers (“refrigerator” unit also requiring vast mass
flow of coolant) and overall high pressure in the system
making it infeasible to design such a plant. [8, pp.268-
271] Although, according to [18], closed cycle GT plants
have future not only in the form of small experimental
2MW plants but can actually find a niche as a
supplementary efficiency-increasing solution,
complementing e.g. nuclear PPs, concentrated solar and
other electricity generating facilities with a high
temperature source of waste heat.
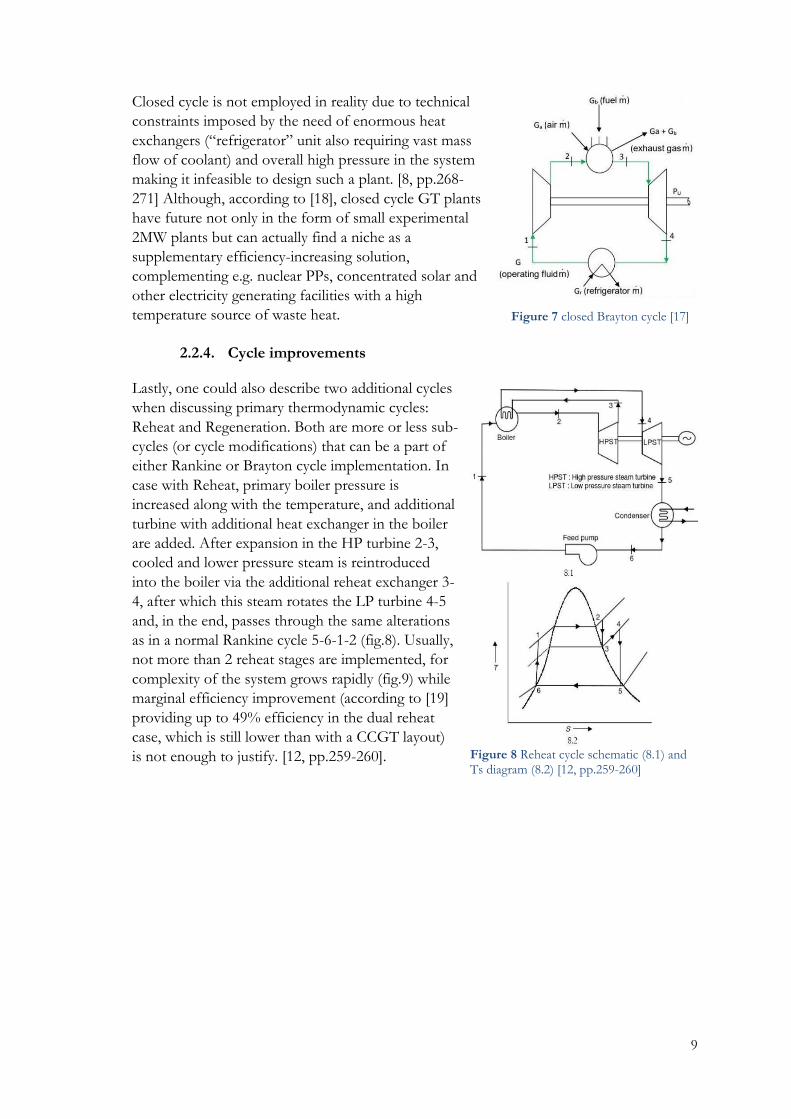
2.2.4. Cycle improvements
Lastly, one could also describe two additional cycles
when discussing primary thermodynamic cycles:
Reheat and Regeneration. Both are more or less sub-
cycles (or cycle modifications) that can be a part of
either Rankine or Brayton cycle implementation. In
case with Reheat, primary boiler pressure is
increased along with the temperature, and additional
turbine with additional heat exchanger in the boiler
are added. After expansion in the HP turbine 2-3,
cooled and lower pressure steam is reintroduced
into the boiler via the additional reheat exchanger 3-
4, after which this steam rotates the LP turbine 4-5
and, in the end, passes through the same alterations
as in a normal Rankine cycle 5-6-1-2 (fig.8). Usually,
not more than 2 reheat stages are implemented, for
complexity of the system grows rapidly (fig.9) while
marginal efficiency improvement (according to [19]
providing up to 49% efficiency in the dual reheat
case, which is still lower than with a CCGT layout)
is not enough to justify. [12, pp.259-260].
Figure 8 Reheat cycle schematic (8.1) and Ts diagram (8.2) [12, pp.259-260]
10
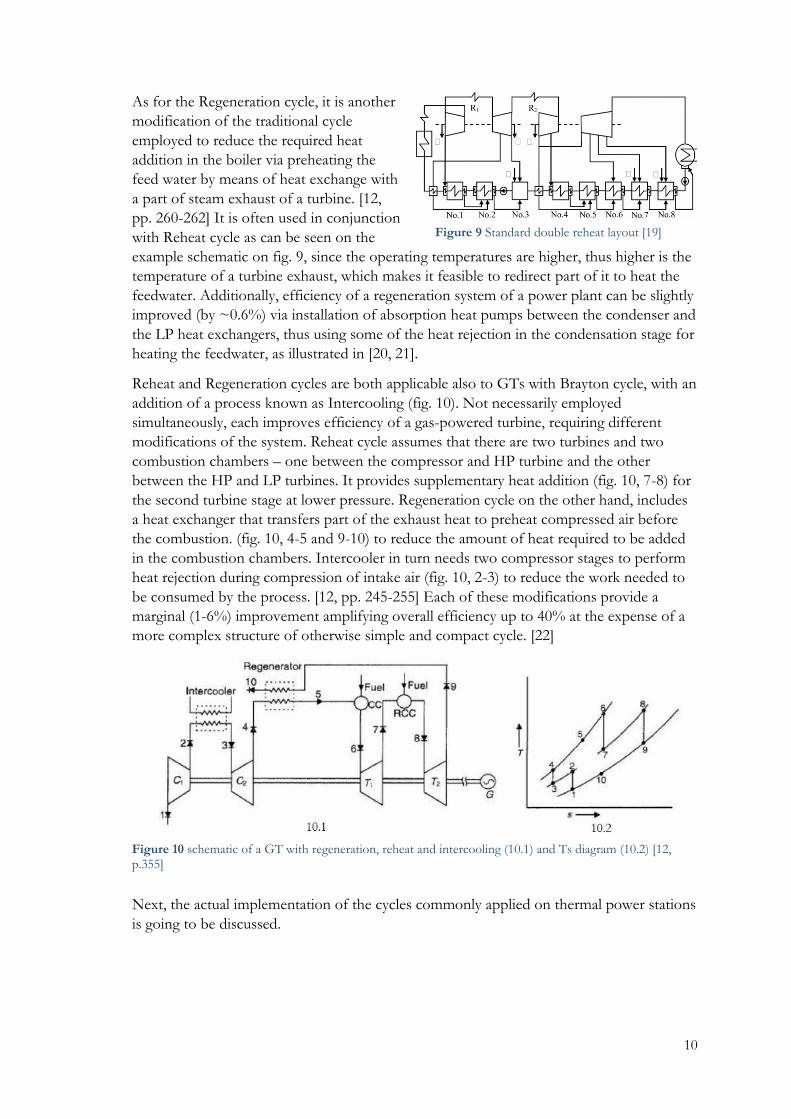
Figure 10 schematic of a GT with regeneration, reheat and intercooling (10.1) and Ts diagram (10.2) [12, p.355]
As for the Regeneration cycle, it is another
modification of the traditional cycle
employed to reduce the required heat
addition in the boiler via preheating the
feed water by means of heat exchange with
a part of steam exhaust of a turbine. [12,
pp. 260-262] It is often used in conjunction
with Reheat cycle as can be seen on the
example schematic on fig. 9, since the operating temperatures are higher, thus higher is the
temperature of a turbine exhaust, which makes it feasible to redirect part of it to heat the
feedwater. Additionally, efficiency of a regeneration system of a power plant can be slightly
improved (by ~0.6%) via installation of absorption heat pumps between the condenser and
the LP heat exchangers, thus using some of the heat rejection in the condensation stage for
heating the feedwater, as illustrated in [20, 21].
Reheat and Regeneration cycles are both applicable also to GTs with Brayton cycle, with an
addition of a process known as Intercooling (fig. 10). Not necessarily employed
simultaneously, each improves efficiency of a gas-powered turbine, requiring different
modifications of the system. Reheat cycle assumes that there are two turbines and two
combustion chambers – one between the compressor and HP turbine and the other
between the HP and LP turbines. It provides supplementary heat addition (fig. 10, 7-8) for
the second turbine stage at lower pressure. Regeneration cycle on the other hand, includes
a heat exchanger that transfers part of the exhaust heat to preheat compressed air before
the combustion. (fig. 10, 4-5 and 9-10) to reduce the amount of heat required to be added
in the combustion chambers. Intercooler in turn needs two compressor stages to perform
heat rejection during compression of intake air (fig. 10, 2-3) to reduce the work needed to
be consumed by the process. [12, pp. 245-255] Each of these modifications provide a
marginal (1-6%) improvement amplifying overall efficiency up to 40% at the expense of a
more complex structure of otherwise simple and compact cycle. [22]
Next, the actual implementation of the cycles commonly applied on thermal power stations
is going to be discussed.
Figure 9 Standard double reheat layout [19]
11
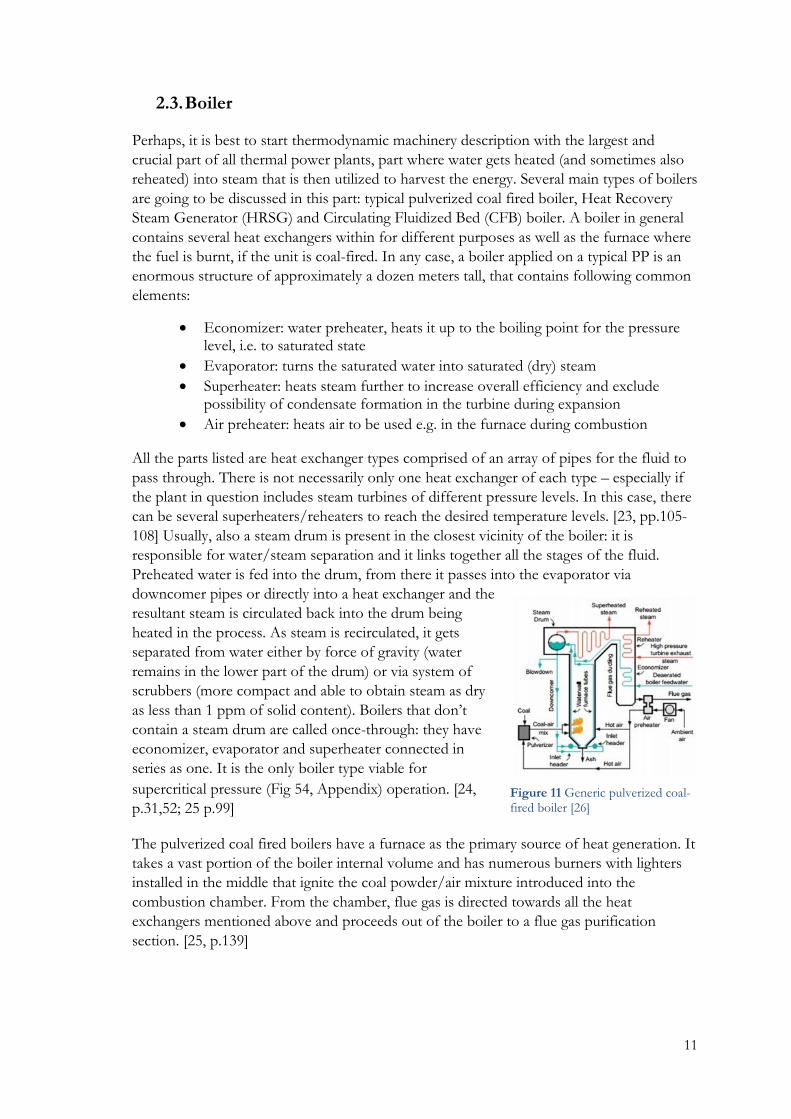
2.3. Boiler
Perhaps, it is best to start thermodynamic machinery description with the largest and
crucial part of all thermal power plants, part where water gets heated (and sometimes also
reheated) into steam that is then utilized to harvest the energy. Several main types of boilers
are going to be discussed in this part: typical pulverized coal fired boiler, Heat Recovery
Steam Generator (HRSG) and Circulating Fluidized Bed (CFB) boiler. A boiler in general
contains several heat exchangers within for different purposes as well as the furnace where
the fuel is burnt, if the unit is coal-fired. In any case, a boiler applied on a typical PP is an
enormous structure of approximately a dozen meters tall, that contains following common
elements:
• Economizer: water preheater, heats it up to the boiling point for the pressure level, i.e. to saturated state
• Evaporator: turns the saturated water into saturated (dry) steam
• Superheater: heats steam further to increase overall efficiency and exclude possibility of condensate formation in the turbine during expansion
• Air preheater: heats air to be used e.g. in the furnace during combustion
All the parts listed are heat exchanger types comprised of an array of pipes for the fluid to
pass through. There is not necessarily only one heat exchanger of each type – especially if
the plant in question includes steam turbines of different pressure levels. In this case, there
can be several superheaters/reheaters to reach the desired temperature levels. [23, pp.105-
108] Usually, also a steam drum is present in the closest vicinity of the boiler: it is
responsible for water/steam separation and it links together all the stages of the fluid.
Preheated water is fed into the drum, from there it passes into the evaporator via
downcomer pipes or directly into a heat exchanger and the
resultant steam is circulated back into the drum being
heated in the process. As steam is recirculated, it gets
separated from water either by force of gravity (water
remains in the lower part of the drum) or via system of
scrubbers (more compact and able to obtain steam as dry
as less than 1 ppm of solid content). Boilers that don’t
contain a steam drum are called once-through: they have
economizer, evaporator and superheater connected in
series as one. It is the only boiler type viable for
supercritical pressure (Fig 54, Appendix) operation. [24,
p.31,52; 25 p.99]
The pulverized coal fired boilers have a furnace as the primary source of heat generation. It
takes a vast portion of the boiler internal volume and has numerous burners with lighters
installed in the middle that ignite the coal powder/air mixture introduced into the
combustion chamber. From the chamber, flue gas is directed towards all the heat
exchangers mentioned above and proceeds out of the boiler to a flue gas purification
section. [25, p.139]
Figure 11 Generic pulverized coal-fired boiler [26]

12
CFB boilers differ mainly in the structure of the furnace: lower part is now filled with a
layer of solid particles (commonly limestone, CaCO3) of relatively small size. These
particles are lifted along with fuel particles by the hot combustion air supplied from the
nozzles located in the bottom of the boiler. Flue gas formed in the combustion then passes
through normal heat exchangers and additionally a classification stage with cyclone in
between to separate unburnt particles and return them back to the combustion chamber.
(fig.11) This approach enables solid non-pulverized (crushed to sizes of 2-25mm) coal fuel
to be used, at the same time absorbing most sulfur content in the flue gas (approximately
90%). Also, a lower quality fuel can be used (e.g. lignite, the lower energy content cheaper
coal) but at the expense of more
logistics related difficulties caused by
the vast amount of fuel needed to be
supplied on a daily basis. This boiler
has simplified flue gas purification
requirements (only fly ash removal is
needed) and therefore the system is
more compact, but at the same time
it has more complex structure of the
boiler compartment, has to withstand
more stress during operation and
needs more electricity for the
more powerful fan to fluidize the
bed. [24, pp 99-108, 27]
HRSGs on the other hand are installations that are used as to recover the outlet heat of a
GT in CCGT plants. Structurally, it is similar to the standard boiler type, with the only
difference of lacking a combustion chamber – air enters the boiler already combusted in
the form of hot flue gas. This type of boiler can also contain heat exchangers for more than
one pressure level and reheat stage to increase the overall efficiency. [23, p.192-194]
2.4. Turbine
In this part, another vital element of a thermodynamic cycle of a PP is
going to be discussed: the turbine, also called a prime mover,
responsible for production of useful work transformed into electricity.
Basically, turbines exist in the two main forms: impulse and reaction.
(Fig. 13, 1 = nozzles, 2 = turbine, 3 = fluid stream, 4 = direction of
turbine motion) The impulse type employs nozzles as a part of
immobile housing of the turbine - these nozzles direct streams of
working fluid onto the blades the turbine is comprised of thus giving
it the impulse and setting it in motion. The reaction type on the other
hand has nozzles as a part of the turbine itself, i.e. mounted on the
rotor and creating rotation through reaction force (or “thrust”). In
case with PP turbines, the main difference is in terms of the shape of
Figure 13 Turbine types: impulse (upper) and reaction (lower) [28]
Figure 12 A CFB based system (Foster Wheeler Pyropower, Inc.) [24]

13
Figure SEQ Figure \* ARABIC 4 schematic representation of operation of impulse (top) and reaction (bottom) turbines.
Figure SEQ Figure \* ARABIC 4 schematic representation of operation of impulse (top) and reaction (bottom) turbines.
the turbine blades: impulse turbines have the “bucket” shaped blades directed towards
static nozzles. Actual change of pressure, i.e. fluid expansion, occurs only where it leaves
the static nozzle in this case, the blades are rotated by the impulse translated from velocity
of fluid particles affecting the blade surface. Reaction turbines have the blades shaped more
closely to nozzles and the stream is directed via static vanes installed just before the
turbine, the fluid creates reaction force through the converging nozzle-shaped blades and
the fluid expansion occurs at the rotating blades as the fluid passes through. Nevertheless,
in reality such strict division is somewhat absent, since reaction-based force still takes place
in the motion of an impulse turbine although low in magnitude, and vice versa: there is
some impulse-based interaction in a reaction turbine as well. Moreover, PP turbines
contain a plethora of turbine stages, often with a mixture of both blade types to reach
maximum efficiency. [28]
2.4.1. Steam
Steam turbines are divided into extraction (condensing) and back-pressure turbines (non-
condensing). The former is used mainly on PPs with a sole purpose of electricity
generation, in this case steam exits the turbine as exhausted (pressure below atmospheric)
and cooled as possible and then condensed immediately with a large supply of external
cooling water. The latter, back-pressure turbines, are in turn used on more multifunctional
plants where heat co-generation is as important as electricity generation, for steam
processed in the turbine returns with enough energy content to use it for district heat
production. [29]
2.4.2. Gas
GTs are usually considered to be comprised of several modules (not limited to 1 per type):
GT itself, combustion chamber and compressor. Since all of these modules are contained
within the common casing and around the common shaft (sometimes twin- or triple-spool
shaft when several pressure level turbines and compressors are present), the entire system
is regarded to as GT for simplicity. This also explains why simple Brayton cycle GT
installations are so compact – all the main nodes of the cycle are within the same shell just
a few dozen meters long and few meters tall (excluding the air intake filtration module),
especially opposed to innumerous variety of heavy spacious auxiliary machinery in the coal-
Figure 14 GE STF-D200, up to 300MW of output power. HP, IP and LP (left to right) turbine stages are clearly visible. Courtesy of GE
14
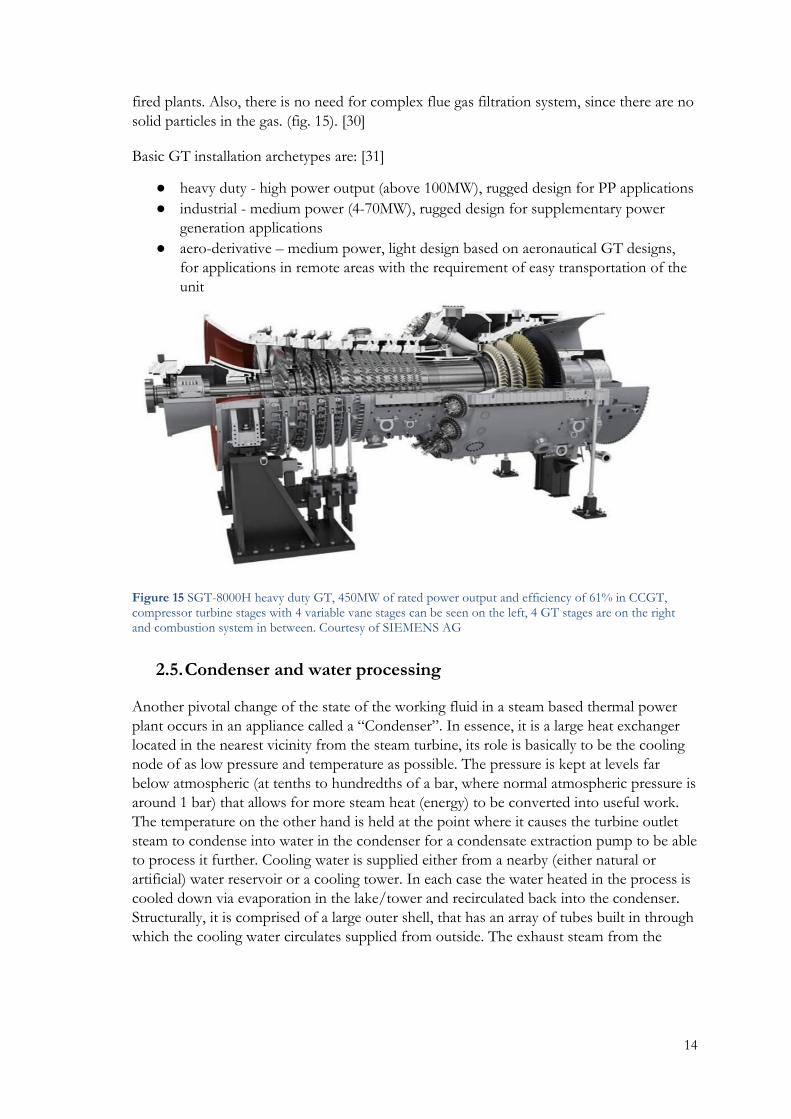
fired plants. Also, there is no need for complex flue gas filtration system, since there are no
solid particles in the gas. (fig. 15). [30]
Basic GT installation archetypes are: [31]
● heavy duty - high power output (above 100MW), rugged design for PP applications
● industrial - medium power (4-70MW), rugged design for supplementary power
generation applications
● aero-derivative – medium power, light design based on aeronautical GT designs,
for applications in remote areas with the requirement of easy transportation of the
unit
Figure 15 SGT-8000H heavy duty GT, 450MW of rated power output and efficiency of 61% in CCGT, compressor turbine stages with 4 variable vane stages can be seen on the left, 4 GT stages are on the right and combustion system in between. Courtesy of SIEMENS AG
2.5. Condenser and water processing
Another pivotal change of the state of the working fluid in a steam based thermal power
plant occurs in an appliance called a “Condenser”. In essence, it is a large heat exchanger
located in the nearest vicinity from the steam turbine, its role is basically to be the cooling
node of as low pressure and temperature as possible. The pressure is kept at levels far
below atmospheric (at tenths to hundredths of a bar, where normal atmospheric pressure is
around 1 bar) that allows for more steam heat (energy) to be converted into useful work.
The temperature on the other hand is held at the point where it causes the turbine outlet
steam to condense into water in the condenser for a condensate extraction pump to be able
to process it further. Cooling water is supplied either from a nearby (either natural or
artificial) water reservoir or a cooling tower. In each case the water heated in the process is
cooled down via evaporation in the lake/tower and recirculated back into the condenser.
Structurally, it is comprised of a large outer shell, that has an array of tubes built in through
which the cooling water circulates supplied from outside. The exhaust steam from the

15
turbine passes through these tubes and has the temperature dropped enough to start to
condense. Condensate in turn is gathered at the
lowest point of the condenser, i.e. “hot well”,
where it is suctioned by a condensate extraction
pump to be processed further and in the end to
be returned to the boiler. (Fig. 16) The top side
of the shell of the condenser includes apart from
the turbine exhaust steam intake also a vacuum
steam ejector system intake, responsible for the
low pressure in this part of the system. [25,
pp.223-225]
Condensate extracted from the condenser proceeds to the feedwater tank, that can also be
combined with a deaerator. The main purpose of the device is to remove oxygen and other
gases (e.g. carbon dioxide) from the condensate, preheat water before the boiler (e.g. using
heat from steam between HP and IP). This, as well as additional forms of treatment, are
performed to condition the water before it gets processed in the boiler to avoid damage
caused by impurities in the working fluid and reach optimal operating point. Additionally,
for the same reasons, water in the cycle is constantly monitored in a local laboratory and
when it is required to add water, the water from outside gets processed through multiple
filtering/conditioning stages before the feedwater tank. [25, p.224,240]
2.6. Flue gas purification
Exhaust gas purification is conducted in the manner suitable for fuel combustion technique
applied on the station: pulverized coal boilers require both fly ash removal and
desulphurization stages, CFB boilers need only fly ash removal, GTs in turn need nothing
except accurate combustion control and steam injection for NOx8 emission reduction.
2.6.1. Fly ash
Both pulverized coal-fired and CFB boilers have one purification requirement in common -
the flue gas has solid particles to be removed before it can be either
processed further (at desulphurization facility, pulverized coal) or
directly fed into the stack (CFB). These filtering devices can be
split into two major categories: Electrostatic precipitators
(electrical filter) and Baghouses (cloth filter).
The first type uses a phenomenon of static electricity
where the basic idea is “opposite charges get attracted to
each other”. This idea is realized with two electrodes that
produce high-voltage electric field (Fig. 17). First electrode is
8 nitrogen oxides, NO1 and NO2, the toxic components of exhaust gas
Figure 17 ESP filter principle [32]
Figure 16 Condenser schematic [25, p.224]

16
negatively charged, and it passes this charge onto the solid particles in the flue gas
introduced into the filter. Then, the gas with negatively charged particles gets in between of
surfaces of the positively charged electrode that electrostatically attracts the solid particles
of fly ash. The electrode is to be cleaned at known intervals for the ash to get detached, e.g.
with vibration, to be then collected at the bottom of the structure and in the end - disposed
of. Electrodes can be of different shapes, be it plates or thin vertical rods. This type of
filter can be 99% efficient at securing fly ash content in the flue gas, although
approximately 2-4% of electrical output of a PP might be used to energize it. [32]
The other type of such filter, the “Bag filter”, employs
numerous long bags made from high temperature
withstanding fabric (Fig. 18). These bags are hanged
within the body of the filter (several meters tall) on the
cage-like frames and a fan forces the flue gas to pass
through the bags, leaving most solid particles stuck in
the fabric. Akin to the electrodes of the previously
described filter type, the bags require periodic cleaning
by various methods: with vibration (“shaker”), air flow
being momentarily reversed (“reverse air”), or with
compressed air jets (“pulse jet”). The type of cleaning
defines some slight structural differences, e.g. first
two types are built in separate compartments because the cleaning sequence requires the
flow of flue gas to be stopped, hence the compartments get cleaned in turns, whilst the
pulse jet baghouse can operate during cleaning without stopping any compartments.
In the end, bag filters don’t need same high-power supply as electrostatic precipitators, also
they are more compact, nevertheless, the filtering cloth of the bags deteriorate over use and
thus bags require replacement roughly every 15 months. Because of this the electrostatic
precipitators are mainly used in larger coal-fired PPs, where there is flue gas flow vast
enough to justify the high electricity consumption. Baghouses on the other hand are
normally employed on smaller facilities where there is either no electricity production or
relatively low levels thereof, making it reasonable to use a more maintenance-demanding
solution whilst saving in the energy consumption department. [33, 34]
2.6.2. Desulphurization
Flue gas of a coal-fired PP normally contains significant amount of sulfuric chemical
compounds (and other pollutants), amongst which SO2 is the main culprit in acid rains and
overall toxic pollution. Therefore, there is a necessity of sulfur dioxide removal from
exhaust and with this idea in mind various techniques are applied. In a CFB boiler SO2 is
captured and removed during combustion process in a reaction with the limestone, while
the more common pulverized coal PP requires a separate facility for this with the main part
of it being the scrubber. There are many different types of scrubbers, but this subchapter
will be focused only on the most common ones: wet and spray dry scrubbers.
Figure 18 Bag filter schematics [33]
17
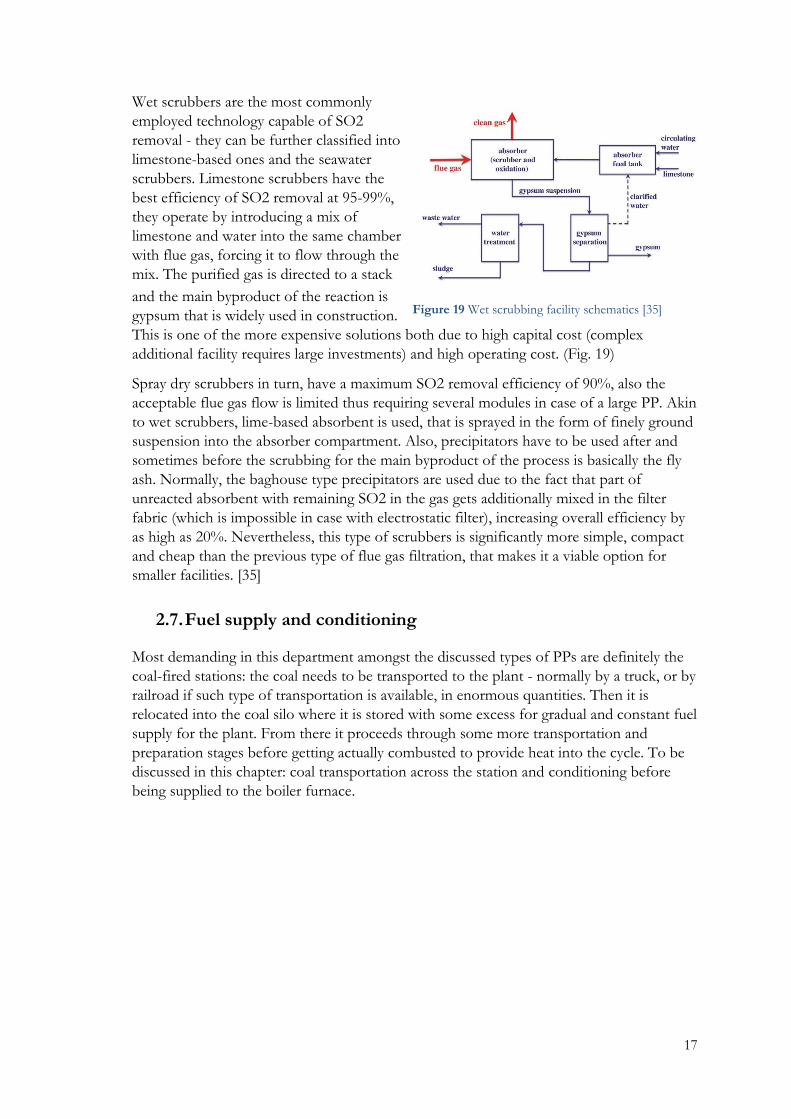
Wet scrubbers are the most commonly
employed technology capable of SO2
removal - they can be further classified into
limestone-based ones and the seawater
scrubbers. Limestone scrubbers have the
best efficiency of SO2 removal at 95-99%,
they operate by introducing a mix of
limestone and water into the same chamber
with flue gas, forcing it to flow through the
mix. The purified gas is directed to a stack
and the main byproduct of the reaction is
gypsum that is widely used in construction.
This is one of the more expensive solutions both due to high capital cost (complex
additional facility requires large investments) and high operating cost. (Fig. 19)
Spray dry scrubbers in turn, have a maximum SO2 removal efficiency of 90%, also the
acceptable flue gas flow is limited thus requiring several modules in case of a large PP. Akin
to wet scrubbers, lime-based absorbent is used, that is sprayed in the form of finely ground
suspension into the absorber compartment. Also, precipitators have to be used after and
sometimes before the scrubbing for the main byproduct of the process is basically the fly
ash. Normally, the baghouse type precipitators are used due to the fact that part of
unreacted absorbent with remaining SO2 in the gas gets additionally mixed in the filter
fabric (which is impossible in case with electrostatic filter), increasing overall efficiency by
as high as 20%. Nevertheless, this type of scrubbers is significantly more simple, compact
and cheap than the previous type of flue gas filtration, that makes it a viable option for
smaller facilities. [35]
2.7. Fuel supply and conditioning
Most demanding in this department amongst the discussed types of PPs are definitely the
coal-fired stations: the coal needs to be transported to the plant - normally by a truck, or by
railroad if such type of transportation is available, in enormous quantities. Then it is
relocated into the coal silo where it is stored with some excess for gradual and constant fuel
supply for the plant. From there it proceeds through some more transportation and
preparation stages before getting actually combusted to provide heat into the cycle. To be
discussed in this chapter: coal transportation across the station and conditioning before
being supplied to the boiler furnace.
Figure 19 Wet scrubbing facility schematics [35]

18
2.7.1. Conveyors
One of the main means of coal transportation within the plant for
extended distances (above 50m) is a belt conveyor (Fig. 20), that is
simple in terms of its operation, reliable and easy to maintain. It
consists of the rubber belt with a metal fabric core that is looped
around numerous pulleys which enable the belt to roll. One of the
pulleys is powered by an electrical motor, others remain passive.
Normally, conveyor belts are not designed to be completely
shielded from all directions to provide easier maintenance access,
at the same time this open design imposes a hazard of accidental
interaction with the moving parts. Hence, an emergency stoppage
thread is stretched along the hazardous end of the operating machinery.
Screw (auger) conveyors (Fig. 20) on the other hand are most suitable in short distance
(less than 50m) applications to transport solid matter of varying degrees of fineness from
powder/ash to relatively coarse coal. The main element of such
apparatus is a rotating spiral-shaped core that has the spiral surface
pushing the matter needed to be transported usually in a horizontal or
slightly inclined direction. The spiral is also energized by an electric
motor and has a completely closed design since the main element
rotates within a tube.
Additionally, exist the bucket type elevators where numerous buckets
are connected by chain and driven by an electric motor on one end.
Equivalently structured elevators are used e.g. for sludge transportation
or vertical coal transportation in confined spaces. (Fig. 21). [8, pp. 146-
147]
2.7.2. Coal processing
First, the raw coal is normally crushed into smaller
pieces by a crusher (unless the coal is delivered
already preprocessed) – a crude mechanism driven
by an electrical motor, for equalizing and reducing
the size of particles transported further on. Then,
coal mills (also “pulverizers”) are used to grind coal
further into dried homogenous powder that is used
as a main fuel on a pulverized coal fired PPs
(otherwise, the crushed coal can be supplied to a
CFB boiler directly). Basically, the overall structure
of PP coal pulverizers is somewhat reminiscent of a
CFB boiler, with only difference that the hot air9
9 (boiler primary air kept at 100°C to dry the coal from any possible moisture content)
Figure 21 Sludge removal elevator, Suomenojan PP.
Figure 22 Coal mill [24, p.267]
Figure 20 Belt (upper) and auger (lower) type conveyors [8, pp.146-147]
19
supplied to the bottom of a mill fluidizes coal only for the classification purpose. Such
approach allows the fine enough powder to be separated from yet coarse coal that needs to
be ground more. Other than air circulation system, the mill consists of the coal supply
channel from the top of the mill, that leads directly to the surface where it is ground by
rolling elements (Fig. 22), the hot air lifts the ground coal and then it passes through
rotating separator screen if the powder is fine enough, if not, it is returned back to the
rolling elements. The power for grinding (as for the hot air circulation fans) elements is
supplied by electrical motors of suitable output, which are normally connected through a
reduction gear to provide higher torque (i.e. force applied to the rotating axis) at the
expense of rotational speed. [36; 24, p.265-268]
2.8. Fluid control
Working fluid be it air, water or steam also needs control and direction for a cycle to
perform well. Primary fluid control machinery and mechanisms are going to be described
in this chapter.
2.8.1. Pumps and fans
Pressure of a working fluid is reached via pumps (for liquid fluid) or compressors
(gaseous), while having the similar purpose, both differ greatly in the structure department.
Fans on the other hand are used to create an airflow, where pressure induced is of lesser
importance, but not the volume of air that needs to be displaced, e.g. boiler furnace air
supply. Compressor basics have already been described in the GT section above, whilst the
pump and fan principles for the majority of PP applications are going to be described in
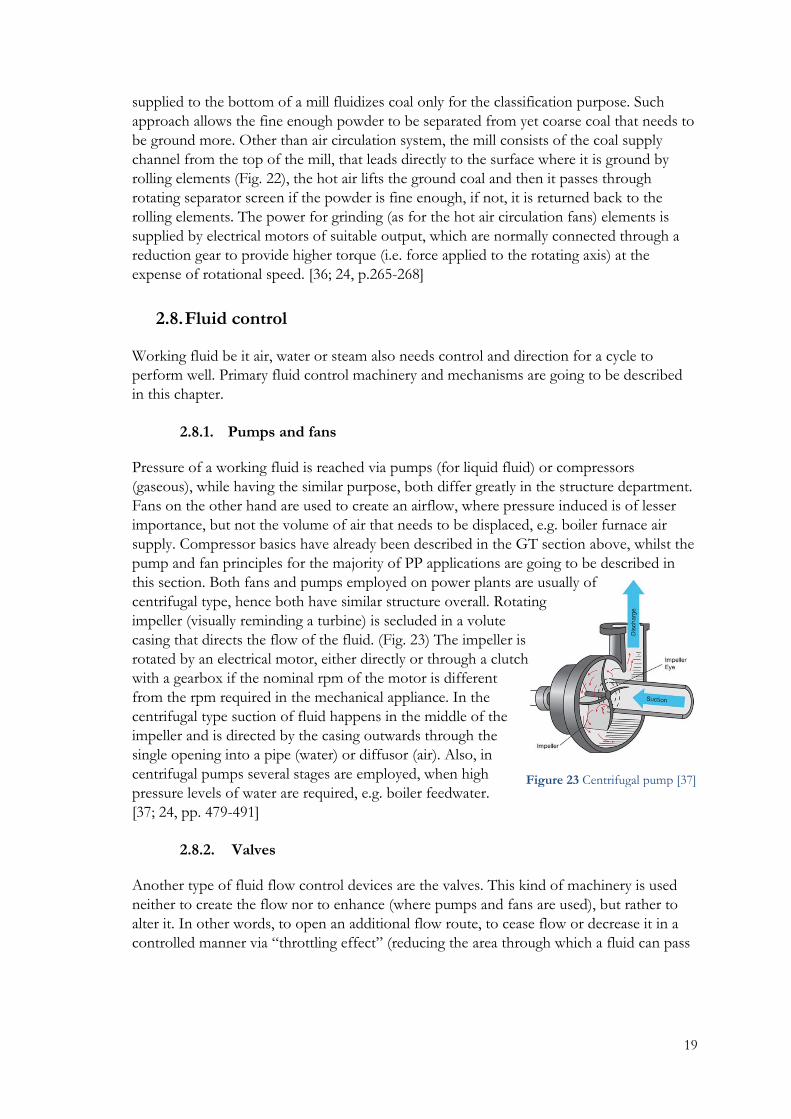
this section. Both fans and pumps employed on power plants are usually of
centrifugal type, hence both have similar structure overall. Rotating
impeller (visually reminding a turbine) is secluded in a volute
casing that directs the flow of the fluid. (Fig. 23) The impeller is
rotated by an electrical motor, either directly or through a clutch
with a gearbox if the nominal rpm of the motor is different
from the rpm required in the mechanical appliance. In the
centrifugal type suction of fluid happens in the middle of the
impeller and is directed by the casing outwards through the
single opening into a pipe (water) or diffusor (air). Also, in
centrifugal pumps several stages are employed, when high
pressure levels of water are required, e.g. boiler feedwater.
[37; 24, pp. 479-491]
2.8.2. Valves
Another type of fluid flow control devices are the valves. This kind of machinery is used
neither to create the flow nor to enhance (where pumps and fans are used), but rather to
alter it. In other words, to open an additional flow route, to cease flow or decrease it in a
controlled manner via “throttling effect” (reducing the area through which a fluid can pass
Figure 23 Centrifugal pump [37]

20
thus also reducing the flow rate). Thus, it is possible not only to cut the fluid off from
admission into a part of a system, but also to redirect it, for when piping is designed
accordingly, a valve can:
• open a controllable bypass path around a part of a system that needs to be either
temporarily disconnected or its through-flow to be reduced
• prevent a backflow (water) that would damage a centrifugal pump (non-return
valve or check valve)
• open a controllable recirculation path that would e.g. once again prevent centrifugal
pump damage in case of the need to reduce the flow rate after the pump output,
since they are also very susceptible to flow rates below nominal. (Fig. 24)
Depending on the function and placement, valves vary across the
range from being slow-acting and precise, hand or actuator (e.g.
electrical motor) driven heavy duty mechanisms as in case with
district heating water routes to light quick (quarter-turn) hand-
operated valves.
Structurally, all valves have some form of a mobile obstacle that is
capable of completely obstructing the flow-through. This obstacle
can be a shifting/rotating plate (gate/butterfly types respectively),
moving plug (globe type) or a screw (needle type). [24, pp. 380-386]
Figure 24 Automatic recirculation valve, courtesy of SchuF Group.
21
3. Electrodynamic processes Various electrical machinery and subsystems are just as important, for it is the electricity
that needs to be produced in the end (apart from heat) by generators, it is electrical motors
that drive numerous mechanical rotating nodes in every cycle (fans, pumps and actuators,
to name the few). Not to mention different automated control measures that are possible
only with the application of electrically powered circuits. This part is going to discuss the
electrodynamic basics that is employed in the operation of the systems mentioned above,
as well as main electrical machinery types.
3.1. Basics
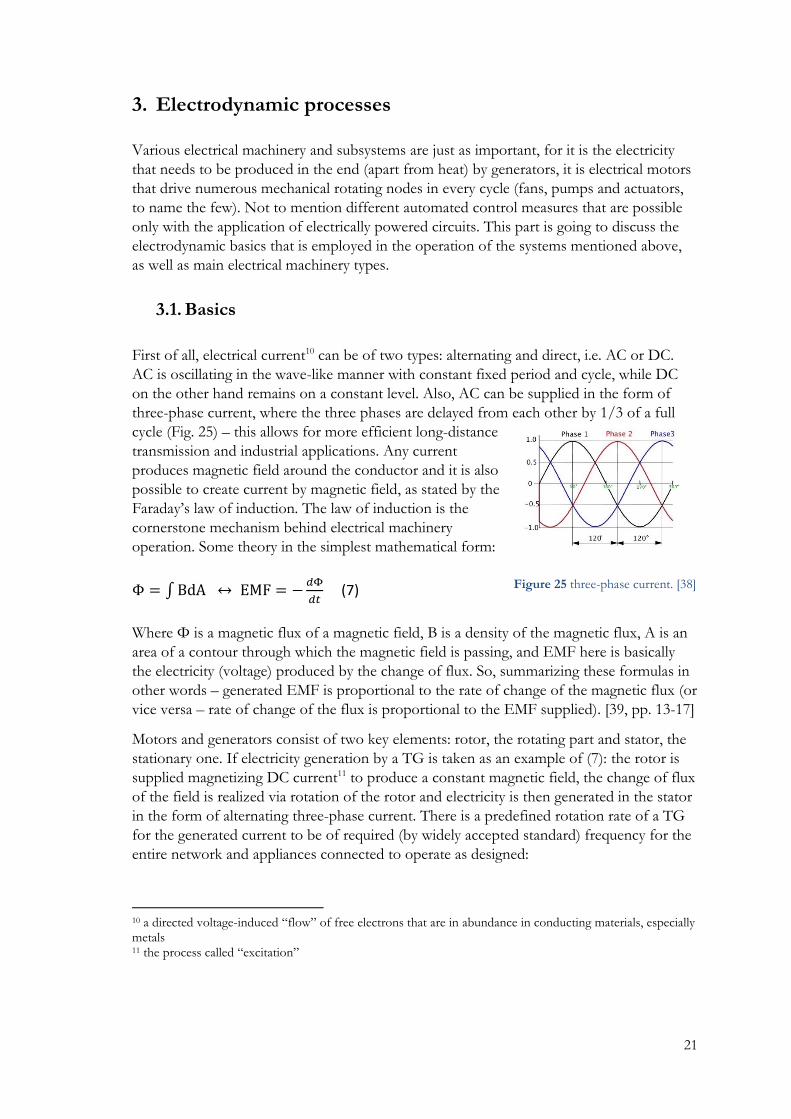
First of all, electrical current10 can be of two types: alternating and direct, i.e. AC or DC.
AC is oscillating in the wave-like manner with constant fixed period and cycle, while DC
on the other hand remains on a constant level. Also, AC can be supplied in the form of
three-phase current, where the three phases are delayed from each other by 1/3 of a full
cycle (Fig. 25) – this allows for more efficient long-distance
transmission and industrial applications. Any current
produces magnetic field around the conductor and it is also
possible to create current by magnetic field, as stated by the
Faraday’s law of induction. The law of induction is the
cornerstone mechanism behind electrical machinery
operation. Some theory in the simplest mathematical form:
Φ = ∫ BdA ↔ EMF = −𝑑Φ
𝑑𝑡 (7)
Where Φ is a magnetic flux of a magnetic field, B is a density of the magnetic flux, A is an
area of a contour through which the magnetic field is passing, and EMF here is basically
the electricity (voltage) produced by the change of flux. So, summarizing these formulas in
other words – generated EMF is proportional to the rate of change of the magnetic flux (or
vice versa – rate of change of the flux is proportional to the EMF supplied). [39, pp. 13-17]
Motors and generators consist of two key elements: rotor, the rotating part and stator, the
stationary one. If electricity generation by a TG is taken as an example of (7): the rotor is
supplied magnetizing DC current11 to produce a constant magnetic field, the change of flux
of the field is realized via rotation of the rotor and electricity is then generated in the stator
in the form of alternating three-phase current. There is a predefined rotation rate of a TG
for the generated current to be of required (by widely accepted standard) frequency for the
entire network and appliances connected to operate as designed:
10 a directed voltage-induced “flow” of free electrons that are in abundance in conducting materials, especially metals 11 the process called “excitation”
Figure 25 three-phase current. [38]
22
n =𝑓
𝑝∗ 60 =
50𝐻𝑧
1∗ 60
𝑠
𝑚𝑖𝑛 = 3000𝑟𝑝𝑚 (8)
where f is the network (and stator current) frequency, normally 50Hz (Hz = 1/s) in
Europe, p is the amount of magnetic pole pairs of the rotor, normally for TGs it equals 1
(2 poles) and the fraction is then multiplied by 60 to convert 1/s to 1/min = rpm.
The same theory can be applied to a common electrical motor, only the other way around:
the stator is supplied AC current, that causes the magnetized rotor to spin, where amount
of pole pairs and the frequency of supplied current define the speed of rotation. The dual-
application nature of the induction law also yields the capability of a motor to be a
generator and vice versa.
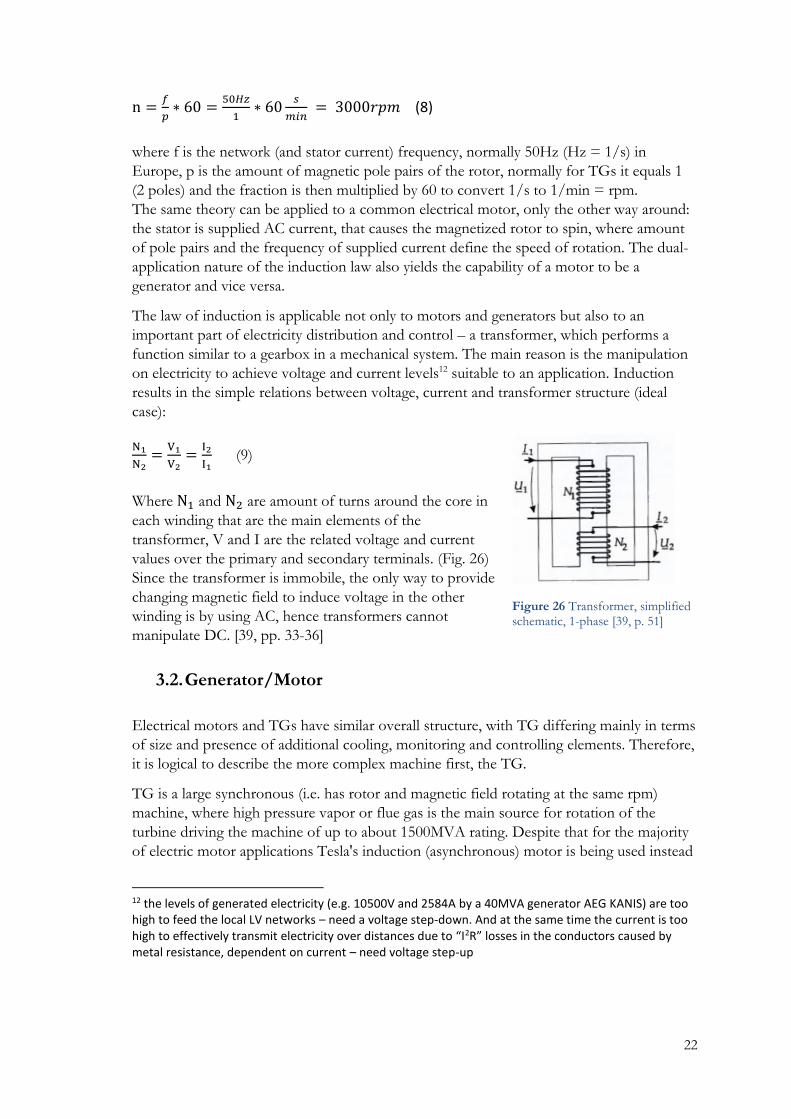
The law of induction is applicable not only to motors and generators but also to an
important part of electricity distribution and control – a transformer, which performs a
function similar to a gearbox in a mechanical system. The main reason is the manipulation
on electricity to achieve voltage and current levels12 suitable to an application. Induction
results in the simple relations between voltage, current and transformer structure (ideal
case):
N1
N2=
V1
V2=
I2
I1 (9)
Where N1 and N2 are amount of turns around the core in
each winding that are the main elements of the
transformer, V and I are the related voltage and current
values over the primary and secondary terminals. (Fig. 26)
Since the transformer is immobile, the only way to provide
changing magnetic field to induce voltage in the other
winding is by using AC, hence transformers cannot
manipulate DC. [39, pp. 33-36]
3.2. Generator/Motor
Electrical motors and TGs have similar overall structure, with TG differing mainly in terms
of size and presence of additional cooling, monitoring and controlling elements. Therefore,
it is logical to describe the more complex machine first, the TG.
TG is a large synchronous (i.e. has rotor and magnetic field rotating at the same rpm)
machine, where high pressure vapor or flue gas is the main source for rotation of the
turbine driving the machine of up to about 1500MVA rating. Despite that for the majority
of electric motor applications Tesla's induction (asynchronous) motor is being used instead
12 the levels of generated electricity (e.g. 10500V and 2584A by a 40MVA generator AEG KANIS) are too high to feed the local LV networks – need a voltage step-down. And at the same time the current is too high to effectively transmit electricity over distances due to “I2R” losses in the conductors caused by metal resistance, dependent on current – need voltage step-up
Figure 26 Transformer, simplified schematic, 1-phase [39, p. 51]

23
of synchronous motors, synchronous generators are still universally used for electricity
generation across the world.
Stator of a TG is made of steel laminated core that is uniformly
slotted with open slots, which itself is the framework for the
three-phase AC winding (armature winding, fig. 27).
Laminations of the winding are insulated, and the thickness of
insulation and the type of steel are chosen to make hysteresis
losses and eddy current13 as low as possible. Modern generators
are usually equipped with a winding which is of double-layer lap
type - shape reminiscent of a hexagonal lattice. [42]
The majority of TGs is designed as two-pole, because higher
rpm (at lower pole count, since according to (8): n~1/𝑝)
allows for better turbine technical and economical
characteristics, with the exception of slower four-pole TGs that are designed for some
nuclear power plants. TG rotors are typically manufactured out of solid high-quality steel
forging, the diameter of an active part of the rotor can't
exceed 1.2-1.5m because of mechanical loads caused by
great centrifugal force at the usual rate of rotation of 3000
rpm (8). That is why the rotor of a high-power rating
machine is designed to be rather long, where its length is
limited by flexibility and deflection of the rotor. The
magnitude of vibration during rotation is connected to
these characteristics too, thus the longest possible length of
the rotor to be reliable is approximately 8.5m. So, in the
end, maximum dimensions of the rotor are limited by
capabilities of modern metallurgy. Winding of a TG rotor
(field winding, fig. 28) is made in the form of concentric
coils and is fixed in slots with non-magnetic metal
(duralumin etc.) wedges, which have enough durability and
able to withstand quite large centrifugal forces. [43, pp. 83-
90; 44]
As already mentioned in connection to (7), DC current needs to be supplied to the rotor
for the TG to actually generate electricity. It can be supplied from one of few sources:
● DC power generator installed on the same shaft with TG
● External rectifier that uses a part of the stator output current (solid-state, i.e.
without moving parts)
● Brushless excitation with rectifying system mounted on the shaft next to the rotor
13 hysteresis losses are caused by specific behavior of magnetic parameters of ferromagnetic materials (e.g. iron) during current fluctuations (Fig 53, Appendix), eddy current losses - by parasitic current in unwanted direction present e.g. in large conductors
Figure 28 a. Not yet wound 320MW TG rotor, b. Same rotor with winding in place
Figure 27 600MW TG stator winding with water-cooled windings [41, p. 21]

24
First two sources require a commutator in the form of slip rings and carbon brushes, the
last one just has simply more complex structure with the purpose to eliminate the necessity
of a commutator. [41,42]
The cooling system is also a very important element of any large generator, because
overheating is a big problem in a several meters long constantly working rapid rotation
machine. In TGs of various power-output ratings different types of cooling are used: in
low power smaller (less than 30MW) generators it is a closed air cooling system; in larger
more powerful generators hydrogen is used instead of air as a more efficient solution, it is
over-pressurized by about 0.05 atm to prevent air from getting inside the hull and forming
a dangerous mix. In generators of more than 150MW output hydrogen in the system is
over-pressurized to 3-5 atm, and in all aforementioned cases multi-flow radial cooling is
used, basically a direct cooling of rotor where air or hydrogen is in the closed loop with
cooling chamber and it passes stator core and the gap between stator and rotor. In larger
more than 300MW more efficient methods are applied – direct cooling of winding
conductors with water or hydrogen via the use of hollowed conductors or conductors with
ventilation channels respectively. [44]
On the other hand, structure of a traditional motor is much simpler, even when it performs
e.g. a demanding function of driving a powerful district heating pump. If TGs are usually
synchronous machines, apparatuses devised with a motoring function in mind, on the
contrary often are asynchronous, i.e. have a rotor spinning at the slightly slower rate than
the “synchronous speed” – stator magnetic field rotation rate (and when generating, rotor
is rotating slightly faster than the field induced in the stator). These motors are called
“induction motors” and this type is mostly represented with “squirrel-cage” rotor type
motors, when industrial application is in question. “Induction” part comes from the fact
that the rotor current is induced by the stator via electromagnetic induction14 rather than
from direct feeding from elsewhere: this means that there is no necessity for commutation
with slip rings and brushes, thus simplifying construction. “Squirrel cage” is a suitable name
due to the rotor core structure, that is basically a short-circuited cage frame installed on the
shaft (with laminated steel in the frame). Overall structure provides admirable reliability
and easy maintenance, thus making this type of
motor a welcome choice for driving the majority of
mechanisms around a PP of variable sizes, e.g. fans,
motors, pumps transportation conveyors etc. The
cooling requirements are quite simpler than those of
a TG, usually realized with a fan attached to the
opposite end of the motor shaft to direct the air
flow onto the hull. Same as monitoring devices -
normally only a temperature sensor is present by
default on larger machines. [41, 42]
14 current is induced via this difference between the mechanical rpm of the rotor and rpm of the stator field, i.e. this difference (called “slip”) is present also during steady state operation – for it satisfies the change of flux condition of the induction law.
Figure 29 A cross-section of a typical induction motor, courtesy of ABB
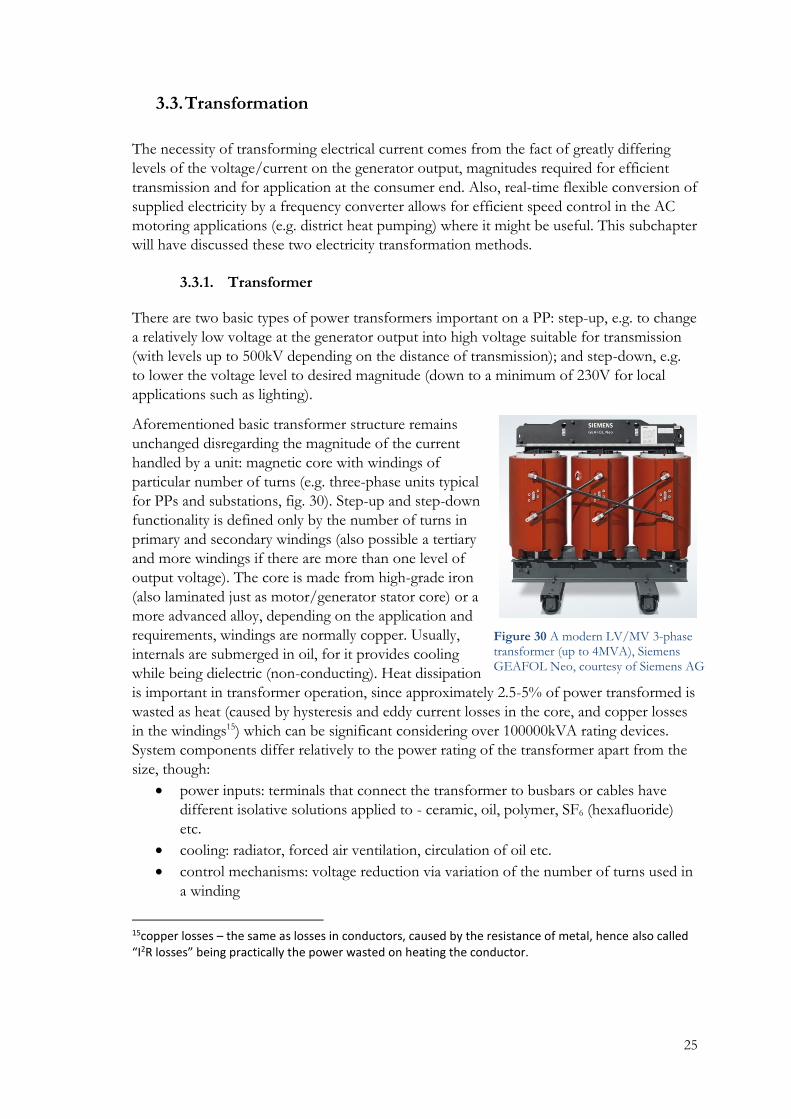
25
3.3. Transformation
The necessity of transforming electrical current comes from the fact of greatly differing
levels of the voltage/current on the generator output, magnitudes required for efficient
transmission and for application at the consumer end. Also, real-time flexible conversion of
supplied electricity by a frequency converter allows for efficient speed control in the AC
motoring applications (e.g. district heat pumping) where it might be useful. This subchapter
will have discussed these two electricity transformation methods.
3.3.1. Transformer
There are two basic types of power transformers important on a PP: step-up, e.g. to change
a relatively low voltage at the generator output into high voltage suitable for transmission
(with levels up to 500kV depending on the distance of transmission); and step-down, e.g.
to lower the voltage level to desired magnitude (down to a minimum of 230V for local
applications such as lighting).
Aforementioned basic transformer structure remains
unchanged disregarding the magnitude of the current
handled by a unit: magnetic core with windings of
particular number of turns (e.g. three-phase units typical
for PPs and substations, fig. 30). Step-up and step-down
functionality is defined only by the number of turns in
primary and secondary windings (also possible a tertiary
and more windings if there are more than one level of
output voltage). The core is made from high-grade iron
(also laminated just as motor/generator stator core) or a
more advanced alloy, depending on the application and
requirements, windings are normally copper. Usually,
internals are submerged in oil, for it provides cooling
while being dielectric (non-conducting). Heat dissipation
is important in transformer operation, since approximately 2.5-5% of power transformed is
wasted as heat (caused by hysteresis and eddy current losses in the core, and copper losses
in the windings15) which can be significant considering over 100000kVA rating devices.
System components differ relatively to the power rating of the transformer apart from the
size, though:
• power inputs: terminals that connect the transformer to busbars or cables have
different isolative solutions applied to - ceramic, oil, polymer, SF6 (hexafluoride)
etc.
• cooling: radiator, forced air ventilation, circulation of oil etc.
• control mechanisms: voltage reduction via variation of the number of turns used in
a winding
15copper losses – the same as losses in conductors, caused by the resistance of metal, hence also called “I2R losses” being practically the power wasted on heating the conductor.
Figure 30 A modern LV/MV 3-phase transformer (up to 4MVA), Siemens GEAFOL Neo, courtesy of Siemens AG

26
• additional equipment: gas relay (malfunction causes gas to form from degrading oil,
the relay shuts down the faulty machine in case there is this gas detected),
temperature indicator, oil level indicator etc. [41,42,35]
3.3.2. Frequency converter
Often also called “Variable Frequency Drive” (VFD), this type of device mainly serves as
an accurate speed controller, as it has already been mentioned. Apart from the simple
function of variating rpm of a motor, it has other useful functions:
• gradual smooth starting and controlled braking, contrary to the full-blown on/off
that loads a motor significantly reducing its lifespan
• efficient power supply at other than nominal speeds, granting economic benefit
during operation if compared to operation without VFD
• speed stabilization during load fluctuations
• drive diagnostics (also the motor and its power feed diagnostics) and flexible
adjustments
Structurally, a variable frequency controller consists of several major parts: a rectifier, DC
bus and a Pulse Width Modulation (PWM)-controlled inverter. Rectifier, normally in the
form of diode/thyristor (electronic components allowing current to pass only in one
direction) bridge that converts AC to DC with some ripple present. DC bus contains
additional components to eliminate ripple, thus provides filtering function. PWM-section
of the converter is normally a transistor-based16 bridge that produces pulses of required
frequency and magnitude thus producing fully controlled AC current that in turn drives the
motor. All of this is complemented by sophisticated electronic
measurement and control devices that are responsible for the
converter output control, taking into account feedback from the
motor itself and the preset program or command fed.
The output control schemes are following:
• Scalar control: V/Hz, “Volts per Hertz”, simple linear
frequency control suitable for non-demanding applications
where some inaccuracy is acceptable
• Vector control: provides control over magnetization
current in the rotor thus yielding very accurate rpm
regulation, albeit requiring sophisticated hardware and
software. Can be used with sensors for improved accuracy.
• Direct Torque Control, another type of efficient vector
control with torque control in mind, slightly more simple
and quicker to respond, although less accurate if used
sensor-less (without rpm measurement)
[43, 44]
16 transistors are switch-type components that have the current pass-through on/off function controlled by applying low voltage over its terminals
Figure 31 ABB ACS550, modern compact wall-mounted VFD for drive control of up to 315kW, courtesy of ABB
27
4. Condition monitoring and automation
All of the previous chapters described the structure, main components and basic theory
behind PP operation. One could notice - it is not necessarily each component is the culprit
of overall complexity and fault sensitivity, but all of the components required to be
working constantly and in tandem at high loads. Just one malfunction in any of the main
sections of a cycle and the entire system needs to be abruptly disabled both for the safety
of environment and operating personnel, as well as for preservation of the cycle elements
still retaining integrity and functionality. With this in mind, majority of the vital
components is duplicated for failsafe and load equalizing reasons – feedwater pump,
district heating pump, air and flue gas fans, piping etc. Whilst more expensive, large and
sophisticated components (e.g. boiler) are not duplicated, but there are often additional TG
units (or entire cycles) built for a PP to have some extra capacity: these normally can have
load transferred to them in case of emergency so that the PP is never rendered completely
powerless
Next are going to be discussed: vulnerabilities, the most common and effective methods to
monitor them and prevent malfunctions, as well as automation systems allowing for user-
friendly monitoring over an entire power plant from one place.
4.1. Weaknesses
This chapter will include common malfunctions for each node in the cycle. Most parts
share similar vulnerabilities based on the structural rigidity depending on the strength of
material used, where the most differences come from the type of stress that given part has
to withstand. Some weaknesses for majority of functionally similar nodes are basically the
same:
• excessive thermal and mechanical stress of heat exchangers – the effect can be
reduced with higher quality materials and accurate control
• corrosion of heat exchangers due to impurity of water – prevented by water
chemistry processing (control and filtering), higher quality materials and coatings
[49]
• bearing wear of rotating machinery of any size and function – lessened by oil
supply systems and timely maintenance.
• any other sort of pre-estimated end of lifecycle/functional effectiveness, e.g.
clogging (BH) or electrode wear (ESP) in filtering devices – solved by timely
maintenance or replacement
The more specific common vulnerabilities/malfunctions and their solutions are going to be
briefly discussed further in this chapter.
Any type of boiler being a vast structure made of metal, is mainly susceptible to the damage
of the material that internals are comprised of. Apart from the obvious thermal stress from
high temperatures and pressures, there is also a common problem of ash fouling/slagging
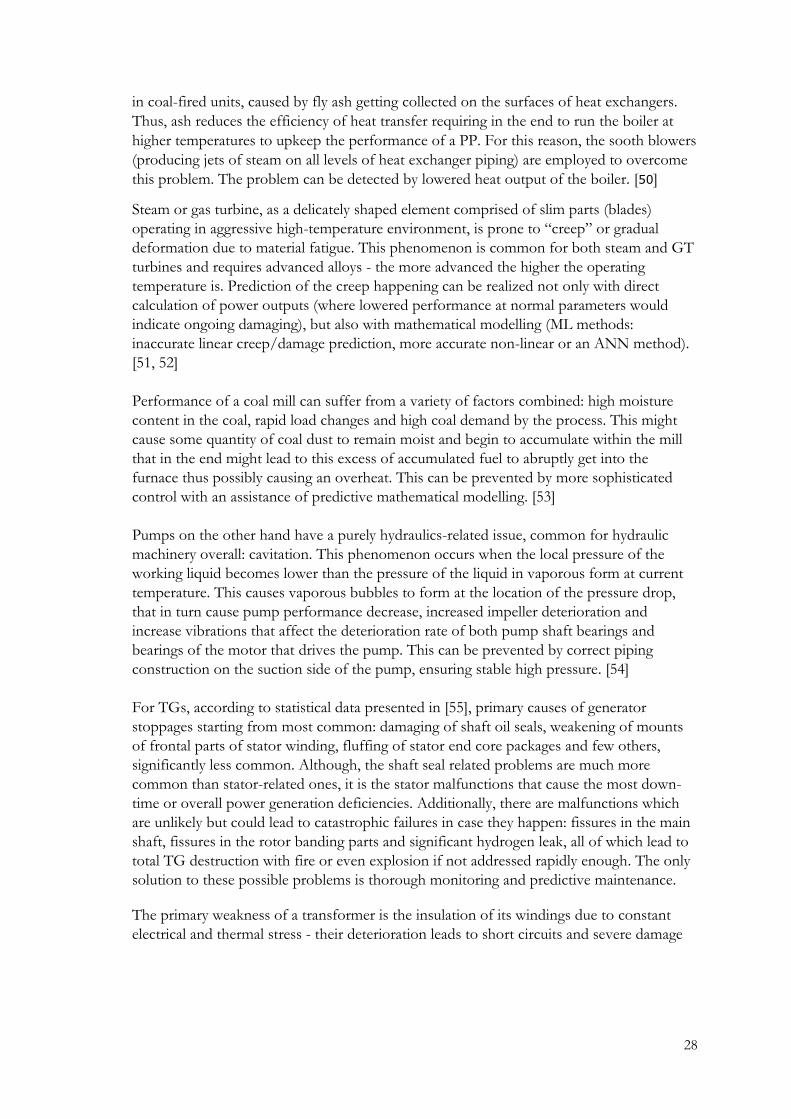
28
in coal-fired units, caused by fly ash getting collected on the surfaces of heat exchangers.
Thus, ash reduces the efficiency of heat transfer requiring in the end to run the boiler at
higher temperatures to upkeep the performance of a PP. For this reason, the sooth blowers
(producing jets of steam on all levels of heat exchanger piping) are employed to overcome
this problem. The problem can be detected by lowered heat output of the boiler. [50]
Steam or gas turbine, as a delicately shaped element comprised of slim parts (blades)
operating in aggressive high-temperature environment, is prone to “creep” or gradual
deformation due to material fatigue. This phenomenon is common for both steam and GT
turbines and requires advanced alloys - the more advanced the higher the operating
temperature is. Prediction of the creep happening can be realized not only with direct
calculation of power outputs (where lowered performance at normal parameters would
indicate ongoing damaging), but also with mathematical modelling (ML methods:
inaccurate linear creep/damage prediction, more accurate non-linear or an ANN method).
[51, 52]
Performance of a coal mill can suffer from a variety of factors combined: high moisture
content in the coal, rapid load changes and high coal demand by the process. This might
cause some quantity of coal dust to remain moist and begin to accumulate within the mill
that in the end might lead to this excess of accumulated fuel to abruptly get into the
furnace thus possibly causing an overheat. This can be prevented by more sophisticated
control with an assistance of predictive mathematical modelling. [53]
Pumps on the other hand have a purely hydraulics-related issue, common for hydraulic
machinery overall: cavitation. This phenomenon occurs when the local pressure of the
working liquid becomes lower than the pressure of the liquid in vaporous form at current
temperature. This causes vaporous bubbles to form at the location of the pressure drop,
that in turn cause pump performance decrease, increased impeller deterioration and
increase vibrations that affect the deterioration rate of both pump shaft bearings and
bearings of the motor that drives the pump. This can be prevented by correct piping
construction on the suction side of the pump, ensuring stable high pressure. [54]
For TGs, according to statistical data presented in [55], primary causes of generator
stoppages starting from most common: damaging of shaft oil seals, weakening of mounts
of frontal parts of stator winding, fluffing of stator end core packages and few others,
significantly less common. Although, the shaft seal related problems are much more
common than stator-related ones, it is the stator malfunctions that cause the most down-
time or overall power generation deficiencies. Additionally, there are malfunctions which
are unlikely but could lead to catastrophic failures in case they happen: fissures in the main
shaft, fissures in the rotor banding parts and significant hydrogen leak, all of which lead to
total TG destruction with fire or even explosion if not addressed rapidly enough. The only
solution to these possible problems is thorough monitoring and predictive maintenance.
The primary weakness of a transformer is the insulation of its windings due to constant
electrical and thermal stress - their deterioration leads to short circuits and severe damage

29
with performance drop. For this reason, the most important transformers may not only
their I/O electrical parameters monitored but also the composition of the gas produced by
the oil heated to temperatures beyond nominal. The gas analysis can also be bolstered with
an AI technique (ANN) as presented in [56] to point at the type of fault present within
(overheating, arcing, etc.) by detecting particular chemicals in the gas associated with
known fault.
4.2. Monitoring techniques
Nevertheless, most of these primary failsafe measures do not remove the necessity of
monitoring the status of each component and working fluids. Such monitoring is realized
with the help of countless sensors of various types installed in important spots, often
duplicated so that the more important the measurement is, the more duplicates are
installed, e.g. TGs having numerous temperature and pressure sensors at each step to
provide the most accurate and backed-up measurement possible.
Perhaps, temperature measurement is the most useful, versatile
and thus common, for it can quickly indicate overheat or other
deviation from normal operating temperature due to wear or
even electrical malfunction/overload. Temperature is measured
off basically every but the smallest machines (coolant bulk
temperature, hull temperature), mechanisms (e.g. bearings) and
piping sections (to monitor the working fluid). In a more
important machinery, there can be numerous temperature
sensors measuring basically the same temperature, e.g. GT
exhaust temperature (Fig. 32). [57]
When working fluid is in question, an equally important status
parameter is the pressure. Often located after pumps, along
the piping, in a manner that there are numerous
measurements in the same part of the cycle. Just as temperature sensors, they are used to
monitor pressure of all fluids in all parts of the cycle: steam, feedwater, district heat water,
coolants, lubricants, intake air and flue gas. Pressure levels can indicate the health of pumps
and integrity state of the piping, and can be used for other calculations.
Another fluid related measurement is the flow rate monitoring in the feedwater, coolant
water and fuel supply department. As it has already been mentioned in the beginning of the
theoretical chapters, flow rate is a crucial quantity, that can be used to instantly define the
heat transfer between two known points, knowing other parameters (pressure and
temperature). [58]
Another technique employed on modern PPs is monitoring the chemical compositions of
substances. This is done to ensure the quality of the feedwater supply, i.e. absence of
unwanted particles in the fluid from various parts of the cycle that might cause erosion of
heat exchanger conductive surfaces. Additionally, TG lubrication oil can be monitored for
Figure 32 GT flue gas temperature measurement (wired sensors can be seen mounted radially on the outer rim), Suomenojan PP
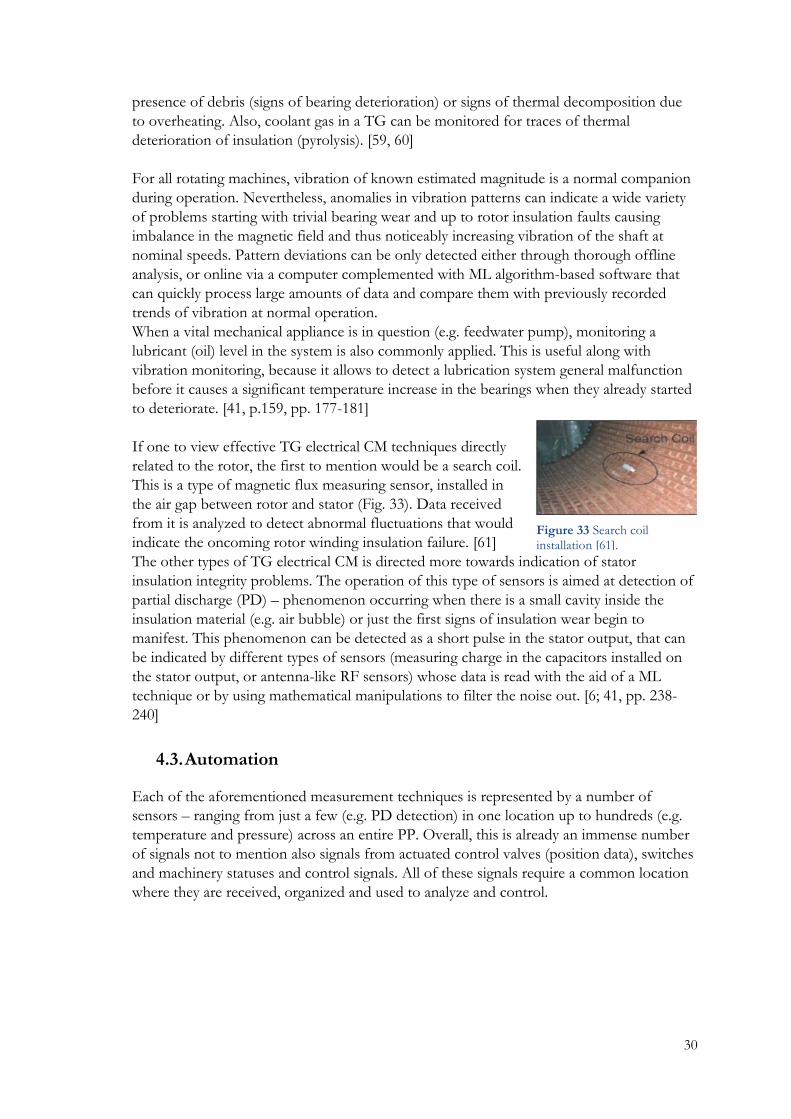
30
presence of debris (signs of bearing deterioration) or signs of thermal decomposition due
to overheating. Also, coolant gas in a TG can be monitored for traces of thermal
deterioration of insulation (pyrolysis). [59, 60]
For all rotating machines, vibration of known estimated magnitude is a normal companion
during operation. Nevertheless, anomalies in vibration patterns can indicate a wide variety
of problems starting with trivial bearing wear and up to rotor insulation faults causing
imbalance in the magnetic field and thus noticeably increasing vibration of the shaft at
nominal speeds. Pattern deviations can be only detected either through thorough offline
analysis, or online via a computer complemented with ML algorithm-based software that
can quickly process large amounts of data and compare them with previously recorded
trends of vibration at normal operation.
When a vital mechanical appliance is in question (e.g. feedwater pump), monitoring a
lubricant (oil) level in the system is also commonly applied. This is useful along with
vibration monitoring, because it allows to detect a lubrication system general malfunction
before it causes a significant temperature increase in the bearings when they already started
to deteriorate. [41, p.159, pp. 177-181]
If one to view effective TG electrical CM techniques directly
related to the rotor, the first to mention would be a search coil.
This is a type of magnetic flux measuring sensor, installed in
the air gap between rotor and stator (Fig. 33). Data received
from it is analyzed to detect abnormal fluctuations that would
indicate the oncoming rotor winding insulation failure. [61]
The other types of TG electrical CM is directed more towards indication of stator
insulation integrity problems. The operation of this type of sensors is aimed at detection of
partial discharge (PD) – phenomenon occurring when there is a small cavity inside the
insulation material (e.g. air bubble) or just the first signs of insulation wear begin to
manifest. This phenomenon can be detected as a short pulse in the stator output, that can
be indicated by different types of sensors (measuring charge in the capacitors installed on
the stator output, or antenna-like RF sensors) whose data is read with the aid of a ML
technique or by using mathematical manipulations to filter the noise out. [6; 41, pp. 238-
240]
4.3. Automation
Each of the aforementioned measurement techniques is represented by a number of
sensors – ranging from just a few (e.g. PD detection) in one location up to hundreds (e.g.
temperature and pressure) across an entire PP. Overall, this is already an immense number
of signals not to mention also signals from actuated control valves (position data), switches
and machinery statuses and control signals. All of these signals require a common location
where they are received, organized and used to analyze and control.
Figure 33 Search coil installation [61].
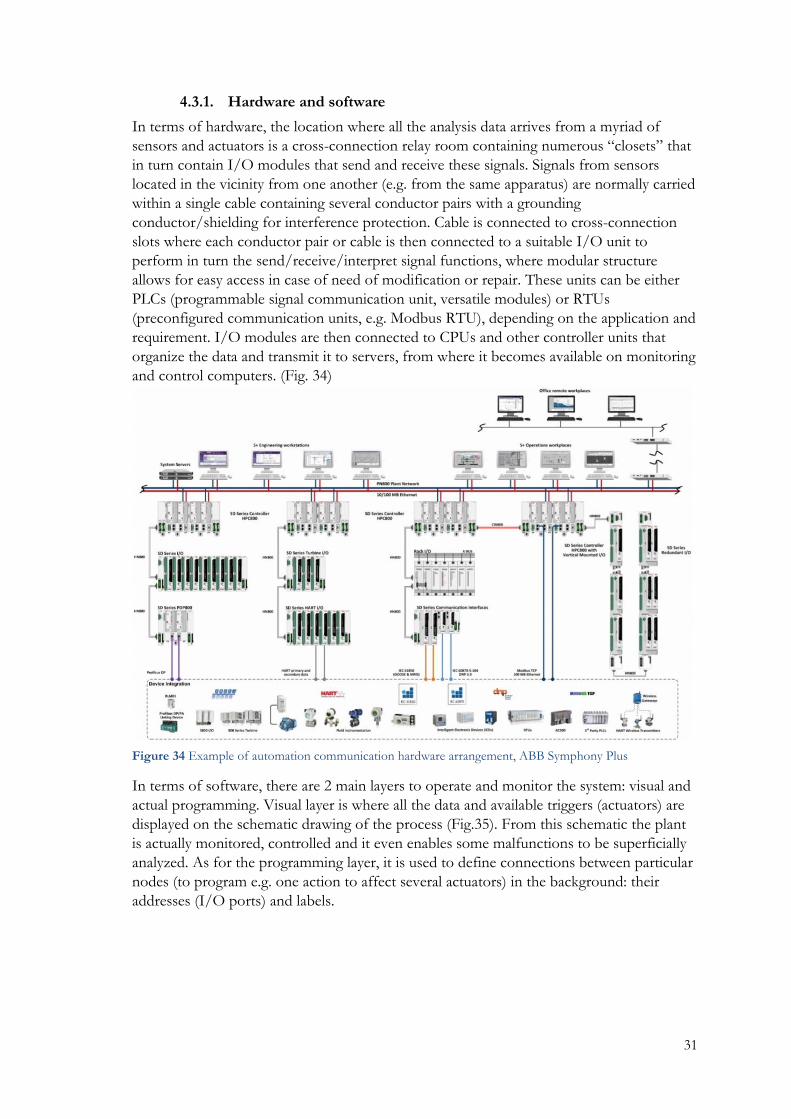
31
4.3.1. Hardware and software
In terms of hardware, the location where all the analysis data arrives from a myriad of
sensors and actuators is a cross-connection relay room containing numerous “closets” that
in turn contain I/O modules that send and receive these signals. Signals from sensors
located in the vicinity from one another (e.g. from the same apparatus) are normally carried
within a single cable containing several conductor pairs with a grounding
conductor/shielding for interference protection. Cable is connected to cross-connection
slots where each conductor pair or cable is then connected to a suitable I/O unit to
perform in turn the send/receive/interpret signal functions, where modular structure
allows for easy access in case of need of modification or repair. These units can be either
PLCs (programmable signal communication unit, versatile modules) or RTUs
(preconfigured communication units, e.g. Modbus RTU), depending on the application and
requirement. I/O modules are then connected to CPUs and other controller units that
organize the data and transmit it to servers, from where it becomes available on monitoring
and control computers. (Fig. 34)
Figure 34 Example of automation communication hardware arrangement, ABB Symphony Plus
In terms of software, there are 2 main layers to operate and monitor the system: visual and
actual programming. Visual layer is where all the data and available triggers (actuators) are
displayed on the schematic drawing of the process (Fig.35). From this schematic the plant
is actually monitored, controlled and it even enables some malfunctions to be superficially
analyzed. As for the programming layer, it is used to define connections between particular
nodes (to program e.g. one action to affect several actuators) in the background: their
addresses (I/O ports) and labels.
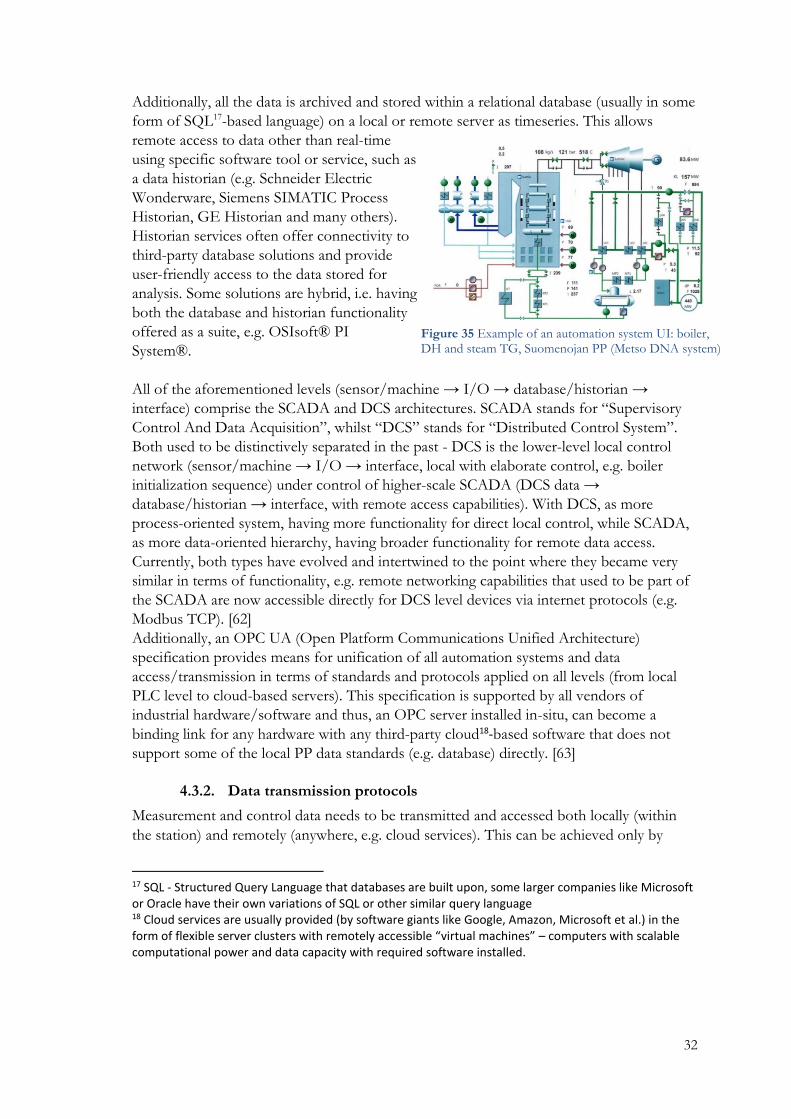
32
Additionally, all the data is archived and stored within a relational database (usually in some
form of SQL17-based language) on a local or remote server as timeseries. This allows
remote access to data other than real-time
using specific software tool or service, such as
a data historian (e.g. Schneider Electric
Wonderware, Siemens SIMATIC Process
Historian, GE Historian and many others).
Historian services often offer connectivity to
third-party database solutions and provide
user-friendly access to the data stored for
analysis. Some solutions are hybrid, i.e. having
both the database and historian functionality
offered as a suite, e.g. OSIsoft® PI
System®.
All of the aforementioned levels (sensor/machine → I/O → database/historian →
interface) comprise the SCADA and DCS architectures. SCADA stands for “Supervisory
Control And Data Acquisition”, whilst “DCS” stands for “Distributed Control System”.
Both used to be distinctively separated in the past - DCS is the lower-level local control
network (sensor/machine → I/O → interface, local with elaborate control, e.g. boiler
initialization sequence) under control of higher-scale SCADA (DCS data →
database/historian → interface, with remote access capabilities). With DCS, as more
process-oriented system, having more functionality for direct local control, while SCADA,
as more data-oriented hierarchy, having broader functionality for remote data access.
Currently, both types have evolved and intertwined to the point where they became very
similar in terms of functionality, e.g. remote networking capabilities that used to be part of
the SCADA are now accessible directly for DCS level devices via internet protocols (e.g.
Modbus TCP). [62]
Additionally, an OPC UA (Open Platform Communications Unified Architecture)
specification provides means for unification of all automation systems and data
access/transmission in terms of standards and protocols applied on all levels (from local
PLC level to cloud-based servers). This specification is supported by all vendors of
industrial hardware/software and thus, an OPC server installed in-situ, can become a
binding link for any hardware with any third-party cloud18-based software that does not
support some of the local PP data standards (e.g. database) directly. [63]
4.3.2. Data transmission protocols
Measurement and control data needs to be transmitted and accessed both locally (within
the station) and remotely (anywhere, e.g. cloud services). This can be achieved only by
17 SQL - Structured Query Language that databases are built upon, some larger companies like Microsoft or Oracle have their own variations of SQL or other similar query language 18 Cloud services are usually provided (by software giants like Google, Amazon, Microsoft et al.) in the form of flexible server clusters with remotely accessible “virtual machines” – computers with scalable computational power and data capacity with required software installed.
Figure 35 Example of an automation system UI: boiler, DH and steam TG, Suomenojan PP (Metso DNA system)

33
adopting widely spread transmission protocols that allow data transmission between
different devices produced by different manufacturers. These protocols are numerous,
both proprietary and open, for local network and distant long transmission via internet, few
of the most common of each type are going to be briefly described.
There are different sets of commonly used protocols depending on the type of
transmission, but first, some of the most common protocols that local measurement and
control signal transmission can be realized with: [64]
• DC 4-20mA analog signal, “current loop” - perhaps, the most simple and
widespread type of sensor connection, that is realized by using one pair of
conductors. Sensor either adjusts resistance according to measurement value, thus
altering the current in the energized loop (passive sensor, loop energized
@24VDC) or forms the current signal (active, i.e. with external voltage supply)
itself.
• HART (Highway Addressable Remote Transducer) protocol – physically akin to
the previous connection, only now implying additional capability of signal
frequency modulation of the current signal with modulating fluctuations of 0.5mA
in magnitude, (when several devices are connected in “Multi-drop” mode, current
becomes locked at 4mA), available to the sensor/device, thus allowing several
devices installed on one line and signal becoming in essence digital. In the digital
mode, devices in the network obey the master/slave19(single device connection
allows also continuous signal broadcasting) communication order. Protocol (just as
other smart digital protocols) allows for error checking - in case of weak/distorted
transmission errors are detected, and “resend” operation is imposed.
• Modbus is another master/slave series communication protocol widely used for
connecting many devices with PLCs, differs from HART in the fact that analog
inputs are separate (and converted) with transmission between slave and master
being purely digital. Simple overall, versatile (supporting single- and multi-pair
twisted pair shielded cables) and robust, albeit relatively slow compared to more
modern protocols. Original Modbus (not the modern Modbus TCP internet-
adapted variation), supports only one master device and very strict master/slave
order – slaves cannot inform/interrupt master device even in case of malfunction
or other exceptional state.
• Profibus (PROcess FIeld BUS) – protocol similar to Modbus (digital, master/slave,
widely available), but more modern (original Modbus has been developed in the
1970s, Profibus has been devised in the 1990s), supporting much higher
transmission rates, multiple master devices and is suitable for use in hazardous (e.g.
explosive) environments. It supports only the multi-pair shielded or optical cables,
has more complex hierarchy both physically and communication-wise than the
Modbus.
19 communication order, where “Slave” devices are polled by the “Master” unit, i.e. slave sends data only when requested by the master.

34
Remote communication protocols used for data transfer across long distances, e.g. via
internet, are usually built onto the TCP/IP - Transmission Control Protocol/Internet
Protocol - two layers of protocols commonly used for all kinds of networking and distant
data transmission. TCP/IP protocols basically organize transmission in a vast worldwide
network that is internet. Additionally, in the era of cloud-computing when local data is
often continuously sent to remote servers, there is a need to provide secure encrypted (Fig.
36) connection to avoid unwanted access especially when a functionality of remote control
is present. With this in mind, several security transmission protocols are used for industrial
data-transfer, the two most common ones being:
• SSL (Socket Security Layer) and TSL (Transport Layer Security) that has evolved
from it, are widely used key-exchange protocol that excludes unauthorized access
and ensures integrity of data transferred. The data is encrypted, and encryption keys
are automatically generated every connection, the encryption algorithm and keys are
defined before any portion of data is sent. Whenever the secure connection is
requested from a server supporting SSL/TLS, a digital certificate signed by a
certificate authority is sent, that ensures the genuineness of the server and the
encryption method. [65]
• SSH (Secure Shell) is another secure protocol, similar to SSL/TLS, with main
difference being expanded functionality, e.g. capability of direct remote control
over the server via login. There are no certificates of SSH verifying such
connections. [66]
Figure 36 Basic schematic of a secure internet connection [66]

35
5. Machine learning
Today, when computer and information technologies have evolved to the point that we
can simulate entire virtual worlds on a single compact machine and then send the data to
another machine within adequate time frame. Definitely, such computational power and
network bandwidth can be of most usefulness in the field of electricity generation (and
industrial applications overall) with vast arrays of signals required to be processed
continuously. Moreover, the need especially persists since standard automation systems use
human personnel to operate and monitor processes – whilst there is no problem with
operating a plant, continuously monitoring thousands signals from a myriad of sensors is
physically impossible no matter how large the number of personnel is. Also, value limits at
which a signal makes the automation to produce an alarm are usually set in the nearly-
critical region, for otherwise alarms would flood the control monitors at each minor
fluctuation. This meaning that often when the automation system has produced an alarm, it
is possible that significant damage has already been done.
This is where advanced computer technologies bolstered by AI methods and Internet of
Things20 solutions have become extremely useful. Whilst the subject of AI is rather broad,
including e.g. image recognition, voice processing and other forms of imitation of human
intelligence, a separate form of machine intelligence is discussed in regard to predictive
maintenance: machine learning. ML enables a computer to be capable of data analysis and
decision making based on learned data examples, e.g. whether a slight departure from
normal readings is a momentary consequence of another change in a process, a single
chaotic fluctuation in the sensor data (either can be ignored) or it is a systematic deviation
signaling of oncoming failure that needs to be reported urgently.
Not only does this approach allow to warn in advance about a deviation that might have
gone unnoticed otherwise, but it also does so for a constant flow of intertwined data that
would be impossible to process in this manner with any other method efficiently. This
constant vast flow of various sensor readings is commonly addressed to as “big data”. The
concept of big data has imposed challenges that would have been impossible to overcome
in the past: amount of data needed to be gathered, transmitted and processed is enormous.
In case with PPs the data requires entire server networks for it to be successfully
manipulated even now, while in the past there was no feasible solution for this at all.
Vast computational power is required because AI techniques used for analyzing the data in
essence are mathematical models consisting of myriads of interconnected mathematical
functions. These functions are able to classify the input data or use it to predict expected
values, correlate values to each other and detect abnormalities. But to do this efficiently,
such model needs to be “trained”, or in other words needs to optimize itself (or “learn”)
using an example set of data, in order to accurately detect the “abnormal” values. The area
of ML optimization is actually the one where the main differences and challenges lie, and it
is going to be discussed in this chapter along with the basics of learning algorithms.
[67; 68, pp. 2-5]
20 new trend in the current age of smart computerized devices meaning the network of such devices communicating with each other and user, locally and over internet. [67]
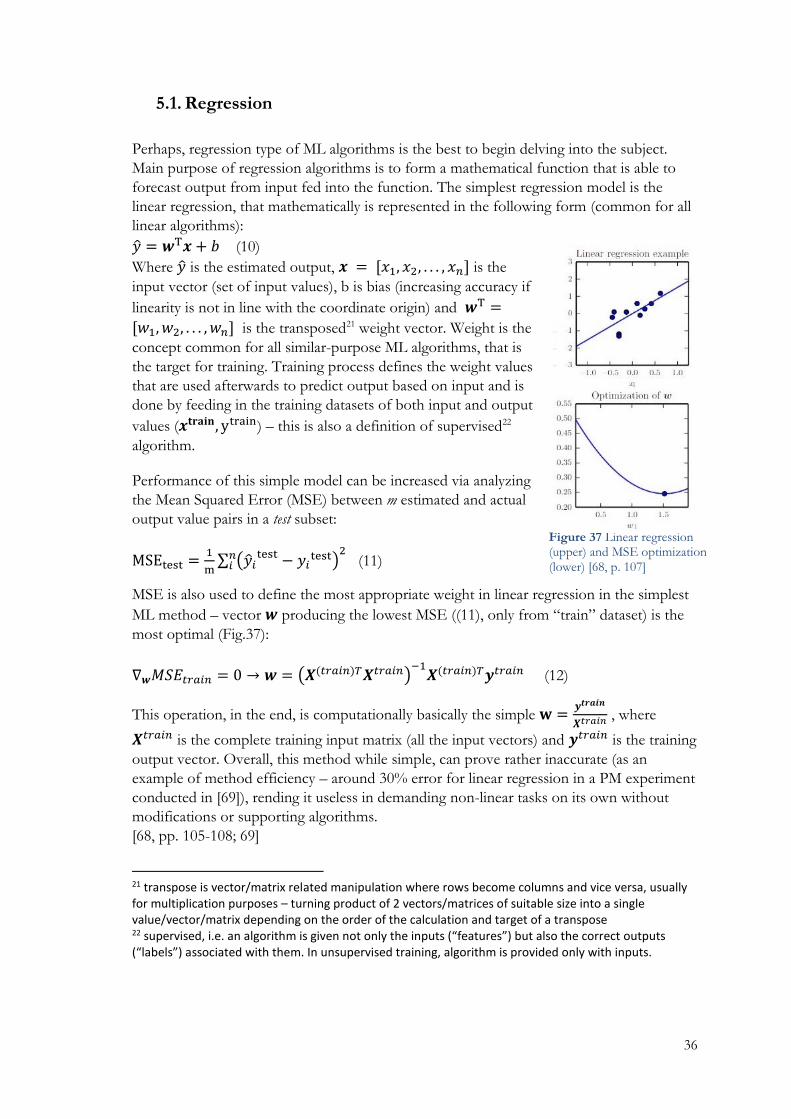
36
5.1. Regression
Perhaps, regression type of ML algorithms is the best to begin delving into the subject.
Main purpose of regression algorithms is to form a mathematical function that is able to
forecast output from input fed into the function. The simplest regression model is the
linear regression, that mathematically is represented in the following form (common for all
linear algorithms):
�̂� = 𝒘T𝒙 + 𝑏 (10)
Where �̂� is the estimated output, 𝒙 = [𝑥1, 𝑥2, . . . , 𝑥𝑛] is the
input vector (set of input values), b is bias (increasing accuracy if
linearity is not in line with the coordinate origin) and 𝒘T =
[𝑤1, 𝑤2, . . . , 𝑤𝑛] is the transposed21 weight vector. Weight is the
concept common for all similar-purpose ML algorithms, that is
the target for training. Training process defines the weight values
that are used afterwards to predict output based on input and is
done by feeding in the training datasets of both input and output
values (𝒙𝐭𝐫𝐚𝐢𝐧, ytrain) – this is also a definition of supervised22
algorithm.
Performance of this simple model can be increased via analyzing
the Mean Squared Error (MSE) between m estimated and actual
output value pairs in a test subset:
MSEtest =1
m∑ (�̂�𝑖
test − 𝑦𝑖test)
2𝑛𝑖 (11)
MSE is also used to define the most appropriate weight in linear regression in the simplest
ML method – vector 𝒘 producing the lowest MSE ((11), only from “train” dataset) is the
most optimal (Fig.37):
∇𝒘𝑀𝑆𝐸𝑡𝑟𝑎𝑖𝑛 = 0 → 𝒘 = (𝑿(𝑡𝑟𝑎𝑖𝑛)𝑇𝑿𝑡𝑟𝑎𝑖𝑛)−1
𝑿(𝑡𝑟𝑎𝑖𝑛)𝑇𝒚𝑡𝑟𝑎𝑖𝑛 (12)
This operation, in the end, is computationally basically the simple 𝐰 =𝒚𝒕𝒓𝒂𝒊𝒏
𝑿𝑡𝑟𝑎𝑖𝑛 , where
𝑿𝑡𝑟𝑎𝑖𝑛 is the complete training input matrix (all the input vectors) and 𝒚𝑡𝑟𝑎𝑖𝑛 is the training
output vector. Overall, this method while simple, can prove rather inaccurate (as an
example of method efficiency – around 30% error for linear regression in a PM experiment
conducted in [69]), rending it useless in demanding non-linear tasks on its own without
modifications or supporting algorithms.
[68, pp. 105-108; 69]
21 transpose is vector/matrix related manipulation where rows become columns and vice versa, usually for multiplication purposes – turning product of 2 vectors/matrices of suitable size into a single value/vector/matrix depending on the order of the calculation and target of a transpose 22 supervised, i.e. an algorithm is given not only the inputs (“features”) but also the correct outputs (“labels”) associated with them. In unsupervised training, algorithm is provided only with inputs.
Figure 37 Linear regression (upper) and MSE optimization (lower) [68, p. 107]
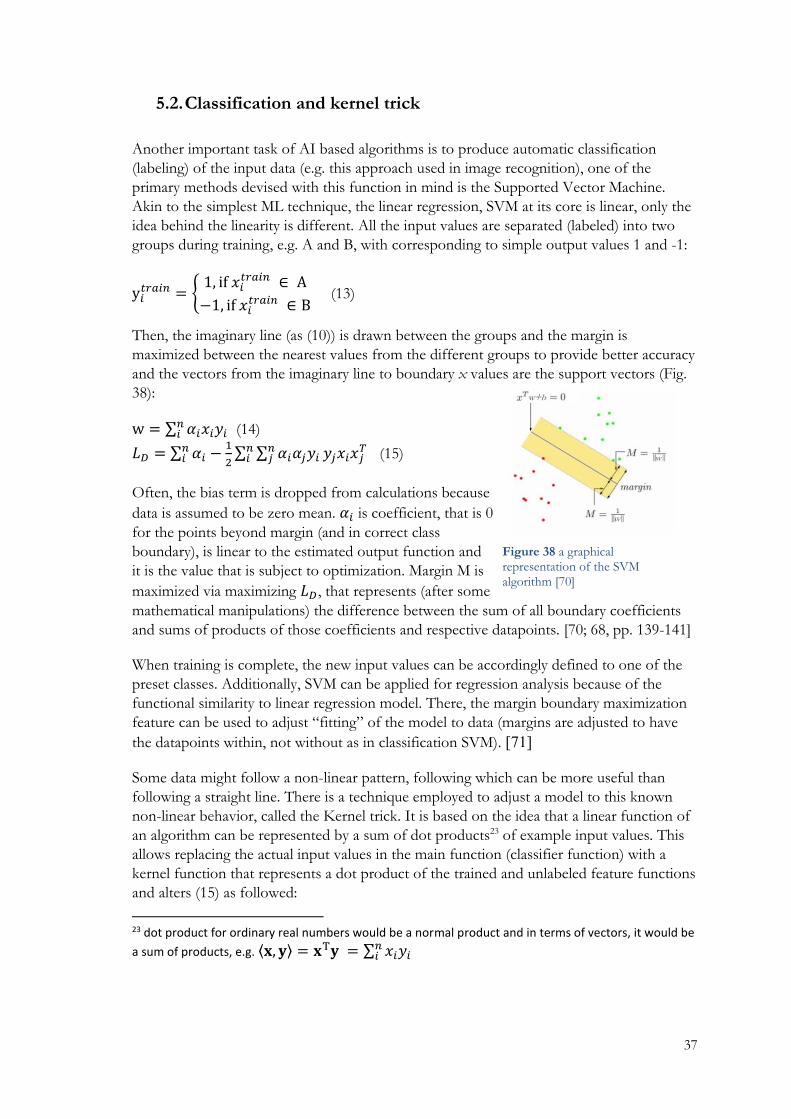
37
5.2. Classification and kernel trick
Another important task of AI based algorithms is to produce automatic classification
(labeling) of the input data (e.g. this approach used in image recognition), one of the
primary methods devised with this function in mind is the Supported Vector Machine.
Akin to the simplest ML technique, the linear regression, SVM at its core is linear, only the
idea behind the linearity is different. All the input values are separated (labeled) into two
groups during training, e.g. A and B, with corresponding to simple output values 1 and -1:
y𝑖𝑡𝑟𝑎𝑖𝑛 = {
1, if 𝑥𝑖𝑡𝑟𝑎𝑖𝑛 ∈ A
−1, if 𝑥𝑖𝑡𝑟𝑎𝑖𝑛 ∈ B
(13)
Then, the imaginary line (as (10)) is drawn between the groups and the margin is
maximized between the nearest values from the different groups to provide better accuracy
and the vectors from the imaginary line to boundary x values are the support vectors (Fig.
38):
w = ∑ 𝛼𝑖𝑥𝑖𝑦𝑖𝑛𝑖 (14)
𝐿𝐷 = ∑ 𝛼𝑖𝑛𝑖 −
1
2∑ ∑ 𝛼𝑖𝛼𝑗𝑦𝑖
𝑛𝑗 𝑦𝑗𝑥𝑖𝑥𝑗
𝑇𝑛𝑖 (15)
Often, the bias term is dropped from calculations because
data is assumed to be zero mean. 𝛼𝑖 is coefficient, that is 0
for the points beyond margin (and in correct class
boundary), is linear to the estimated output function and
it is the value that is subject to optimization. Margin M is
maximized via maximizing 𝐿𝐷, that represents (after some
mathematical manipulations) the difference between the sum of all boundary coefficients
and sums of products of those coefficients and respective datapoints. [70; 68, pp. 139-141]
When training is complete, the new input values can be accordingly defined to one of the
preset classes. Additionally, SVM can be applied for regression analysis because of the
functional similarity to linear regression model. There, the margin boundary maximization
feature can be used to adjust “fitting” of the model to data (margins are adjusted to have
the datapoints within, not without as in classification SVM). [71]
Some data might follow a non-linear pattern, following which can be more useful than
following a straight line. There is a technique employed to adjust a model to this known
non-linear behavior, called the Kernel trick. It is based on the idea that a linear function of
an algorithm can be represented by a sum of dot products23 of example input values. This
allows replacing the actual input values in the main function (classifier function) with a
kernel function that represents a dot product of the trained and unlabeled feature functions
and alters (15) as followed:
23 dot product for ordinary real numbers would be a normal product and in terms of vectors, it would be
a sum of products, e.g. ⟨𝐱, 𝐲⟩ = 𝐱T𝐲 = ∑ 𝑥𝑖𝑦𝑖𝑛𝑖
Figure 38 a graphical representation of the SVM algorithm [70]
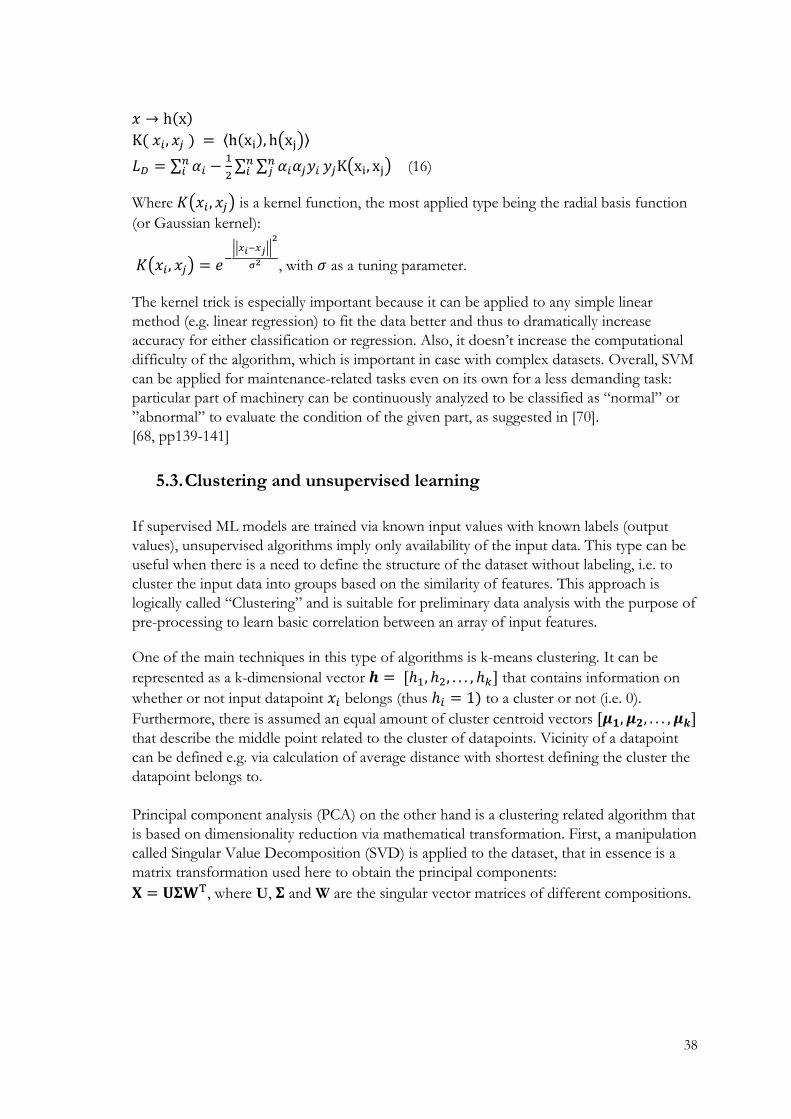
38
𝑥 → h(x)
K( 𝑥𝑖, 𝑥𝑗 ) = ⟨h(xi), h(xj)⟩
𝐿𝐷 = ∑ 𝛼𝑖𝑛𝑖 −
1
2∑ ∑ 𝛼𝑖𝛼𝑗𝑦𝑖
𝑛𝑗 𝑦𝑗K(xi, xj)
𝑛𝑖 (16)
Where 𝐾(𝑥𝑖 , 𝑥𝑗) is a kernel function, the most applied type being the radial basis function
(or Gaussian kernel):
𝐾(𝑥𝑖, 𝑥𝑗) = 𝑒−
||𝑥𝑖−𝑥𝑗||2
σ2 , with 𝜎 as a tuning parameter.
The kernel trick is especially important because it can be applied to any simple linear
method (e.g. linear regression) to fit the data better and thus to dramatically increase
accuracy for either classification or regression. Also, it doesn’t increase the computational
difficulty of the algorithm, which is important in case with complex datasets. Overall, SVM
can be applied for maintenance-related tasks even on its own for a less demanding task:
particular part of machinery can be continuously analyzed to be classified as “normal” or
”abnormal” to evaluate the condition of the given part, as suggested in [70].
[68, pp139-141]
5.3. Clustering and unsupervised learning
If supervised ML models are trained via known input values with known labels (output
values), unsupervised algorithms imply only availability of the input data. This type can be
useful when there is a need to define the structure of the dataset without labeling, i.e. to
cluster the input data into groups based on the similarity of features. This approach is
logically called “Clustering” and is suitable for preliminary data analysis with the purpose of
pre-processing to learn basic correlation between an array of input features.
One of the main techniques in this type of algorithms is k-means clustering. It can be
represented as a k-dimensional vector 𝒉 = [ℎ1, ℎ2, . . . , ℎ𝑘] that contains information on
whether or not input datapoint 𝑥𝑖 belongs (thus ℎ𝑖 = 1) to a cluster or not (i.e. 0).
Furthermore, there is assumed an equal amount of cluster centroid vectors [𝝁𝟏, 𝝁𝟐, . . . , 𝝁𝒌] that describe the middle point related to the cluster of datapoints. Vicinity of a datapoint
can be defined e.g. via calculation of average distance with shortest defining the cluster the
datapoint belongs to.
Principal component analysis (PCA) on the other hand is a clustering related algorithm that
is based on dimensionality reduction via mathematical transformation. First, a manipulation
called Singular Value Decomposition (SVD) is applied to the dataset, that in essence is a
matrix transformation used here to obtain the principal components:
𝐗 = 𝐔𝚺𝐖T, where U, 𝚺 and W are the singular vector matrices of different compositions.
39
The main goal is to perform transformation z = 𝐖T𝒙, where values z are mutually
independent, and to produce matrix Z of lesser dimension, absent of linear correlations,
that aims at hidden factor of data variation removal.
Both methods can be used in conjunction for data structuring, or each can bolster some
other algorithm. According to [72], k-means clustering with prior PCA can be effectively
used for abnormal behavior detection. A state-of-the-art method of advanced Kernel
Spectral Clustering method has been devised in [73] based on spectral analysis of vibration
data from accelerometers – it allows for predicting deterioration of various parts of
modelled machinery, also with including the possibility of adjustment for either soft
clustering (overlapping clusters) that could point at “probability of maintenance”, whilst
hard clustering (clusters are strictly separated) can determine data anomalies and thus
malfunctions.
[68, pp. 145-148]
5.4. Artificial neural network
One of main AI model types for complex applications is called “Artificial Neural Network”
– it is a combined method capable to be devised for both classification and regression
purposes, with linear or non-linear data behavior. It usually doesn’t require a supporting
algorithm for increased functionality and/or accuracy, as often is the case with simpler
models required to operate complex data. The name implies that it has a sequential layered
model structure that is reminiscent of that of a human brain (Fig. 39).
Each “neuron” in the model, i.e. a mathematical
function, is connected to other ones with a weight
value, that defines how closely input values are
connected to each node of next layer in a chain
fashion (e.g. 3-layer function):
𝐟(𝐱) = 𝐟(𝟏) (𝐟(𝟐)(𝐟(𝟑)(𝐱)))
𝐲 = 𝐟(𝐱; 𝛉)
Where 𝛉 is the set of parameters defining model behavior, that includes weight and
possible bias (e.g. if linear behavior is considered: 𝐟(𝐱; 𝛉) = 𝒘T𝒙 + 𝑏)
There can be a plethora of layers: input, output and numerous “hidden layers” in between -
in this case an ANN is called “Deep feedforward network”, and this is one of the most
useful types for commercial applications. Hidden layers are exactly the bulk of the entire
ANN model defining the relation between the input and output data and correlation
thereof. “Deep” in the name comes from the “depth” of the model, i.e. numerous layers it
consists of (generally, more than 3), feedforward stands for the direction of propagation of
the calculation to produce output values.
Figure 39 simple graphical representation of ANN [74]

40
This model can be trained in a number of ways, the more basic (yet still noticeably more
elaborate than previous ML techniques for simpler models) one is following. Firstly, initial
values x𝑖 are fed into the ANN to receive some output values y�̂�. This output is used to
calculate the error (e.g. MSE) between the model estimated output values y�̂� and the
desired (known) output y𝑖 . Afterwards, the known output y is fed into the network in the
opposite direction (back-propagation) to define the gradient of the cost function (i.e.
derivative or change rate of error function against the known x𝑖) that is used in optimizing
the weight values in the way that the gradient is at minimum (Stochastic gradient descent
algorithm), thus producing output estimation with the lowest error possible.
All in all, this approach can be used to define connections between input values and
predict/determine possible output values. ANN models can be very complex, at the same
time, increased complexity grants more flexibility and accuracy for the end result. They can
be employed across variety of applications: from image and pattern recognition to steam
turbine monitoring or general PP performance monitoring.
[74; 75; 68, pp. 164-174]

41
6. “Industry 4.0”
The idea of programmable computers with some sort of intelligence is older than 150 years
(Ada Lovelace) and the AI techniques have been in development for many decades as well.
Today, the technological advancement reached the point where it is feasible to widely apply
various forms of AI not only for experimental purposes on supercomputers (e.g. IBM
Deep Blue c.1997) but for basically any application where quick computerized analytical
decision could be useful: from a simple image processing on a smartphone to the
aforementioned industrial sensor data flow analysis. [68, pp. 1-2]
With this purpose in mind, numerous ML based big data analysis systems have already
been developed, offered and deployed worldwide. Usually, these solutions are more than
just software: they include a business model that in turn contains numerous aspects related
to implementation of the software in question for a customer in a mutually profitable
manner. Business model most notably includes:
• strategy - the purpose of the solution and goals of the company
• value statement - both for the customer and the company
• operating model – a bridging component between the purpose and
implementation
• implementation – from commissioning to day-to-day use [76, 77]
The latter two points are the most important in regard to this thesis for they contain the
main differences in the “Industry 4.0” solutions, or in other words in smart AI based IoT
automation designed to be used practically everywhere from manufacturing plants to PPs
and smart grids24. Overall, the main technological aspects in terms of product structure,
operating model, implementation, main technology used in such solutions are to be
analyzed for the sake of comparison in the following sections.
6.1. Maintpartner INtelligence® (Remote Access Tool)
The first PM solution to be listed is the INtelligence of Maintpartner Oy, a Finnish
maintenance company headquartered in Helsinki. The INtelligence team running the
solution is responsible for realization of distribution, deployment and active application of
the AI based software with Remote Access Tool (RAT, fig. 40) being a visual interface.
Whilst the software updates/tweaks and data processing are provided by partner
companies.
24 likely the future of current electrical grids, where even private consumer can not only consume electricity, but also generate on their own e.g. with a solar panel and feed it into AI-controlled smart grid that is able to quickly adjust load balance and isolate anomalies. [78]

42
INtelligence represents an entire package of services provided to a customer where at the
core is an industrial signal processing software suitable for both industrial (i.e.
manufacturing) and energy applications. The package includes:
• ML analysis software with the cloud service that provides worldwide availability of
the process analysis
• data integration with support of various protocols and databases (e.g. SFTP, OPC
UA, SQL etc.)
• continuous support after deployment
Additionally:
• a separate module for optimization via mathematically calculated optimal points of
operation for maximum efficiency
• a web-based app is currently in development – for secure access to the data from
any device connected to the internet
Figure 40 UI of Remote Access Tool
The operating model is following:
1) Process model definition, data overview, data connection establishing (2-4 weeks)
2) Data de-noising, unsupervised ML, model tuning (1-2 weeks)
3) Model validation and retuning, local RAT users training (1-2 months)
4) Model handed over to the customer, nevertheless its performance still monitored,
model training continues (1-2 months)
5) “Software as a service” (SaaS, subscription business model) with updates,
INtelligence team support, monthly review (continuous operation)
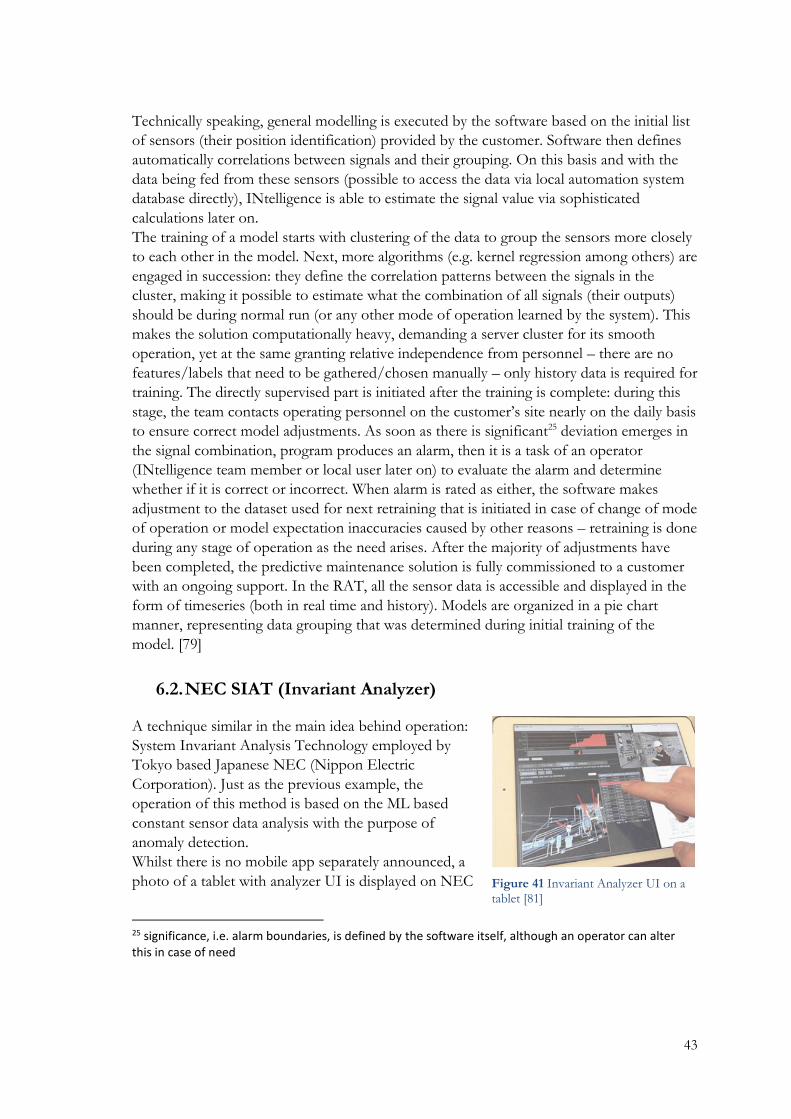
43
Technically speaking, general modelling is executed by the software based on the initial list
of sensors (their position identification) provided by the customer. Software then defines
automatically correlations between signals and their grouping. On this basis and with the
data being fed from these sensors (possible to access the data via local automation system
database directly), INtelligence is able to estimate the signal value via sophisticated
calculations later on.
The training of a model starts with clustering of the data to group the sensors more closely
to each other in the model. Next, more algorithms (e.g. kernel regression among others) are
engaged in succession: they define the correlation patterns between the signals in the
cluster, making it possible to estimate what the combination of all signals (their outputs)
should be during normal run (or any other mode of operation learned by the system). This
makes the solution computationally heavy, demanding a server cluster for its smooth
operation, yet at the same granting relative independence from personnel – there are no
features/labels that need to be gathered/chosen manually – only history data is required for
training. The directly supervised part is initiated after the training is complete: during this
stage, the team contacts operating personnel on the customer’s site nearly on the daily basis
to ensure correct model adjustments. As soon as there is significant25 deviation emerges in
the signal combination, program produces an alarm, then it is a task of an operator
(INtelligence team member or local user later on) to evaluate the alarm and determine
whether if it is correct or incorrect. When alarm is rated as either, the software makes
adjustment to the dataset used for next retraining that is initiated in case of change of mode
of operation or model expectation inaccuracies caused by other reasons – retraining is done
during any stage of operation as the need arises. After the majority of adjustments have
been completed, the predictive maintenance solution is fully commissioned to a customer
with an ongoing support. In the RAT, all the sensor data is accessible and displayed in the
form of timeseries (both in real time and history). Models are organized in a pie chart
manner, representing data grouping that was determined during initial training of the
model. [79]
6.2. NEC SIAT (Invariant Analyzer)
A technique similar in the main idea behind operation:
System Invariant Analysis Technology employed by
Tokyo based Japanese NEC (Nippon Electric
Corporation). Just as the previous example, the
operation of this method is based on the ML based
constant sensor data analysis with the purpose of
anomaly detection.
Whilst there is no mobile app separately announced, a
photo of a tablet with analyzer UI is displayed on NEC
25 significance, i.e. alarm boundaries, is defined by the software itself, although an operator can alter this in case of need
Figure 41 Invariant Analyzer UI on a tablet [81]
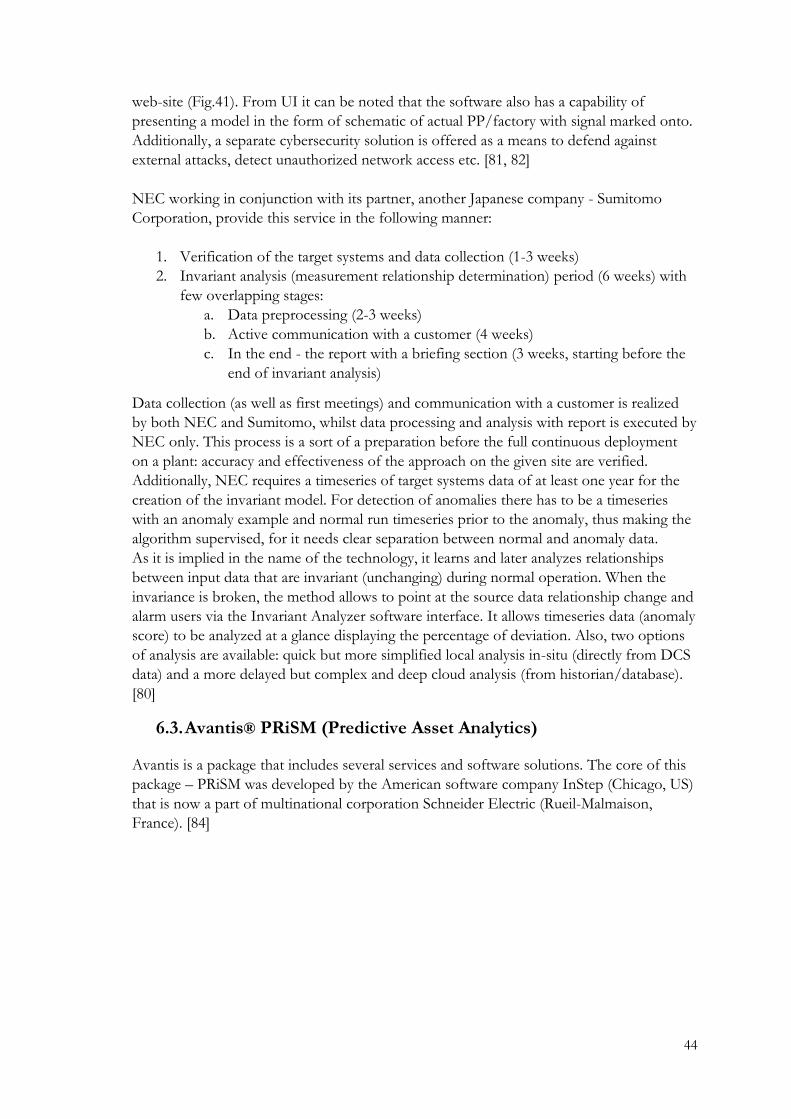
44
web-site (Fig.41). From UI it can be noted that the software also has a capability of
presenting a model in the form of schematic of actual PP/factory with signal marked onto.
Additionally, a separate cybersecurity solution is offered as a means to defend against
external attacks, detect unauthorized network access etc. [81, 82]
NEC working in conjunction with its partner, another Japanese company - Sumitomo
Corporation, provide this service in the following manner:
1. Verification of the target systems and data collection (1-3 weeks)
2. Invariant analysis (measurement relationship determination) period (6 weeks) with
few overlapping stages:
a. Data preprocessing (2-3 weeks)
b. Active communication with a customer (4 weeks)
c. In the end - the report with a briefing section (3 weeks, starting before the
end of invariant analysis)
Data collection (as well as first meetings) and communication with a customer is realized
by both NEC and Sumitomo, whilst data processing and analysis with report is executed by
NEC only. This process is a sort of a preparation before the full continuous deployment
on a plant: accuracy and effectiveness of the approach on the given site are verified.
Additionally, NEC requires a timeseries of target systems data of at least one year for the
creation of the invariant model. For detection of anomalies there has to be a timeseries
with an anomaly example and normal run timeseries prior to the anomaly, thus making the
algorithm supervised, for it needs clear separation between normal and anomaly data.
As it is implied in the name of the technology, it learns and later analyzes relationships
between input data that are invariant (unchanging) during normal operation. When the
invariance is broken, the method allows to point at the source data relationship change and
alarm users via the Invariant Analyzer software interface. It allows timeseries data (anomaly
score) to be analyzed at a glance displaying the percentage of deviation. Also, two options
of analysis are available: quick but more simplified local analysis in-situ (directly from DCS
data) and a more delayed but complex and deep cloud analysis (from historian/database).
[80]
6.3. Avantis® PRiSM (Predictive Asset Analytics)
Avantis is a package that includes several services and software solutions. The core of this
package – PRiSM was developed by the American software company InStep (Chicago, US)
that is now a part of multinational corporation Schneider Electric (Rueil-Malmaison,
France). [84]
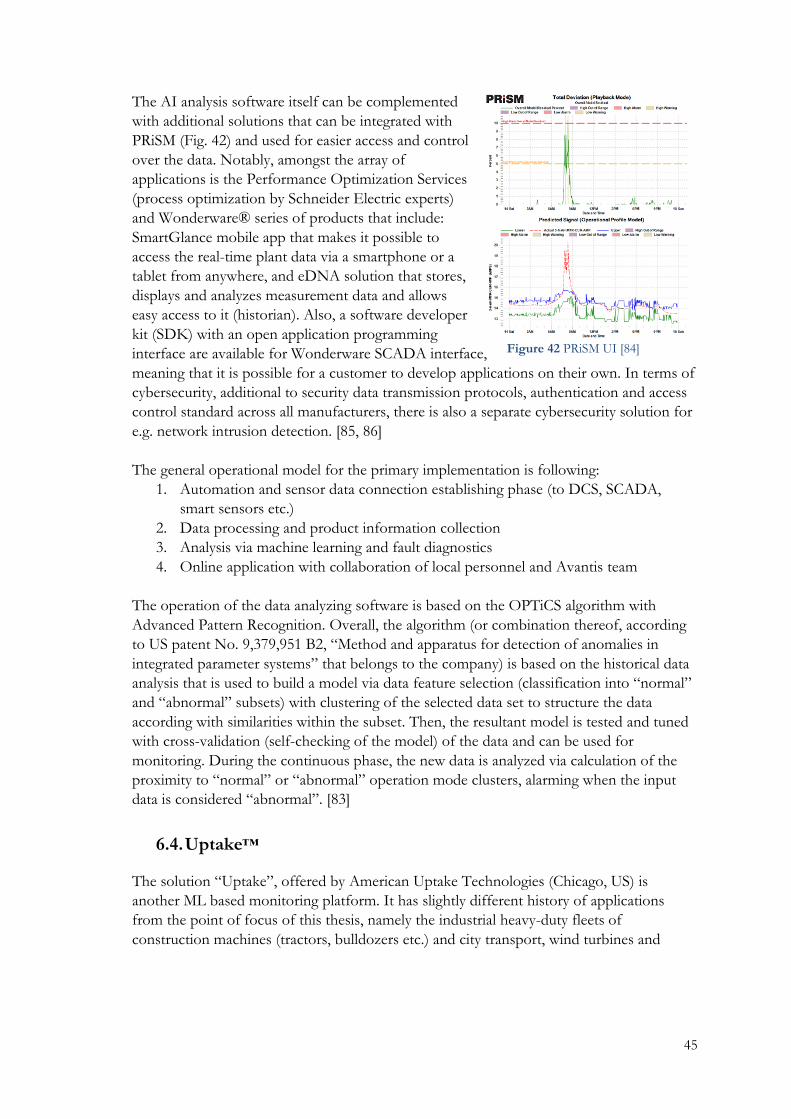
45
The AI analysis software itself can be complemented
with additional solutions that can be integrated with
PRiSM (Fig. 42) and used for easier access and control
over the data. Notably, amongst the array of
applications is the Performance Optimization Services
(process optimization by Schneider Electric experts)
and Wonderware® series of products that include:
SmartGlance mobile app that makes it possible to
access the real-time plant data via a smartphone or a
tablet from anywhere, and eDNA solution that stores,
displays and analyzes measurement data and allows
easy access to it (historian). Also, a software developer
kit (SDK) with an open application programming
interface are available for Wonderware SCADA interface,
meaning that it is possible for a customer to develop applications on their own. In terms of
cybersecurity, additional to security data transmission protocols, authentication and access
control standard across all manufacturers, there is also a separate cybersecurity solution for
e.g. network intrusion detection. [85, 86]
The general operational model for the primary implementation is following:
1. Automation and sensor data connection establishing phase (to DCS, SCADA,
smart sensors etc.)
2. Data processing and product information collection
3. Analysis via machine learning and fault diagnostics
4. Online application with collaboration of local personnel and Avantis team
The operation of the data analyzing software is based on the OPTiCS algorithm with
Advanced Pattern Recognition. Overall, the algorithm (or combination thereof, according
to US patent No. 9,379,951 B2, “Method and apparatus for detection of anomalies in
integrated parameter systems” that belongs to the company) is based on the historical data
analysis that is used to build a model via data feature selection (classification into “normal”
and “abnormal” subsets) with clustering of the selected data set to structure the data
according with similarities within the subset. Then, the resultant model is tested and tuned
with cross-validation (self-checking of the model) of the data and can be used for
monitoring. During the continuous phase, the new data is analyzed via calculation of the
proximity to “normal” or “abnormal” operation mode clusters, alarming when the input
data is considered “abnormal”. [83]
6.4. Uptake™
The solution “Uptake”, offered by American Uptake Technologies (Chicago, US) is
another ML based monitoring platform. It has slightly different history of applications
from the point of focus of this thesis, namely the industrial heavy-duty fleets of
construction machines (tractors, bulldozers etc.) and city transport, wind turbines and
Figure 42 PRiSM UI [84]
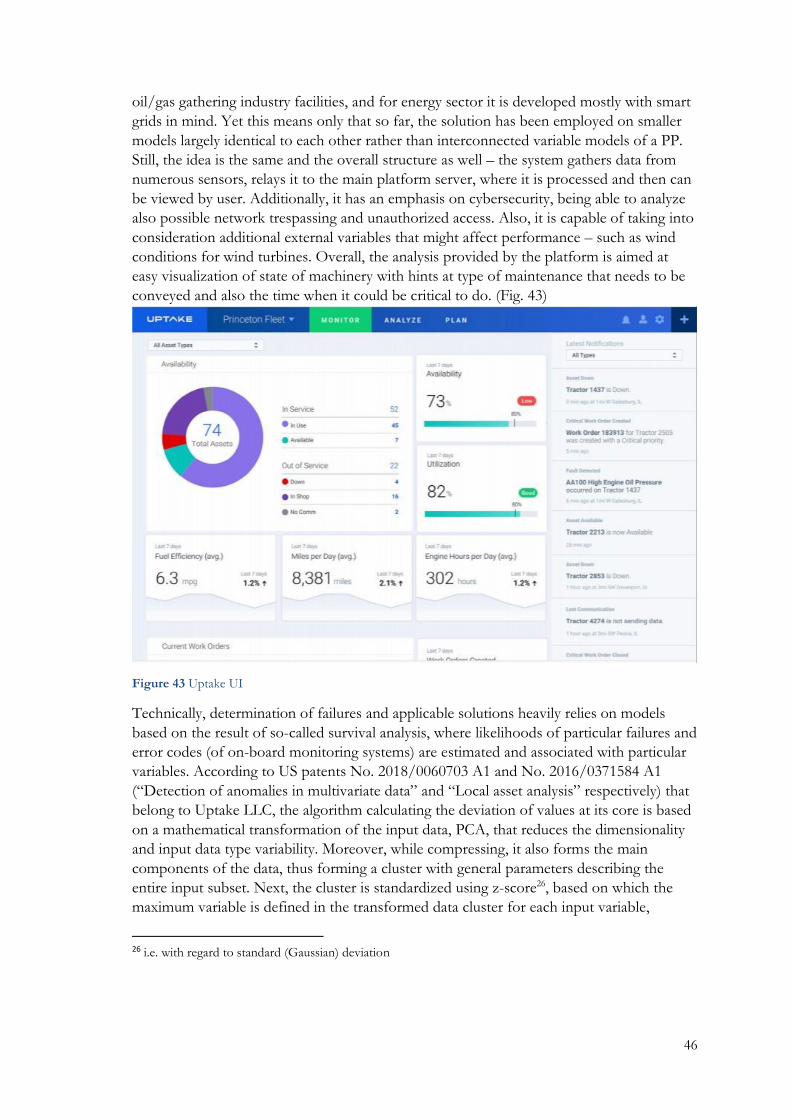
46
oil/gas gathering industry facilities, and for energy sector it is developed mostly with smart
grids in mind. Yet this means only that so far, the solution has been employed on smaller
models largely identical to each other rather than interconnected variable models of a PP.
Still, the idea is the same and the overall structure as well – the system gathers data from
numerous sensors, relays it to the main platform server, where it is processed and then can
be viewed by user. Additionally, it has an emphasis on cybersecurity, being able to analyze
also possible network trespassing and unauthorized access. Also, it is capable of taking into
consideration additional external variables that might affect performance – such as wind
conditions for wind turbines. Overall, the analysis provided by the platform is aimed at
easy visualization of state of machinery with hints at type of maintenance that needs to be
conveyed and also the time when it could be critical to do. (Fig. 43)
Figure 43 Uptake UI
Technically, determination of failures and applicable solutions heavily relies on models
based on the result of so-called survival analysis, where likelihoods of particular failures and
error codes (of on-board monitoring systems) are estimated and associated with particular
variables. According to US patents No. 2018/0060703 A1 and No. 2016/0371584 A1
(“Detection of anomalies in multivariate data” and “Local asset analysis” respectively) that
belong to Uptake LLC, the algorithm calculating the deviation of values at its core is based
on a mathematical transformation of the input data, PCA, that reduces the dimensionality
and input data type variability. Moreover, while compressing, it also forms the main
components of the data, thus forming a cluster with general parameters describing the
entire input subset. Next, the cluster is standardized using z-score26, based on which the
maximum variable is defined in the transformed data cluster for each input variable,
26 i.e. with regard to standard (Gaussian) deviation
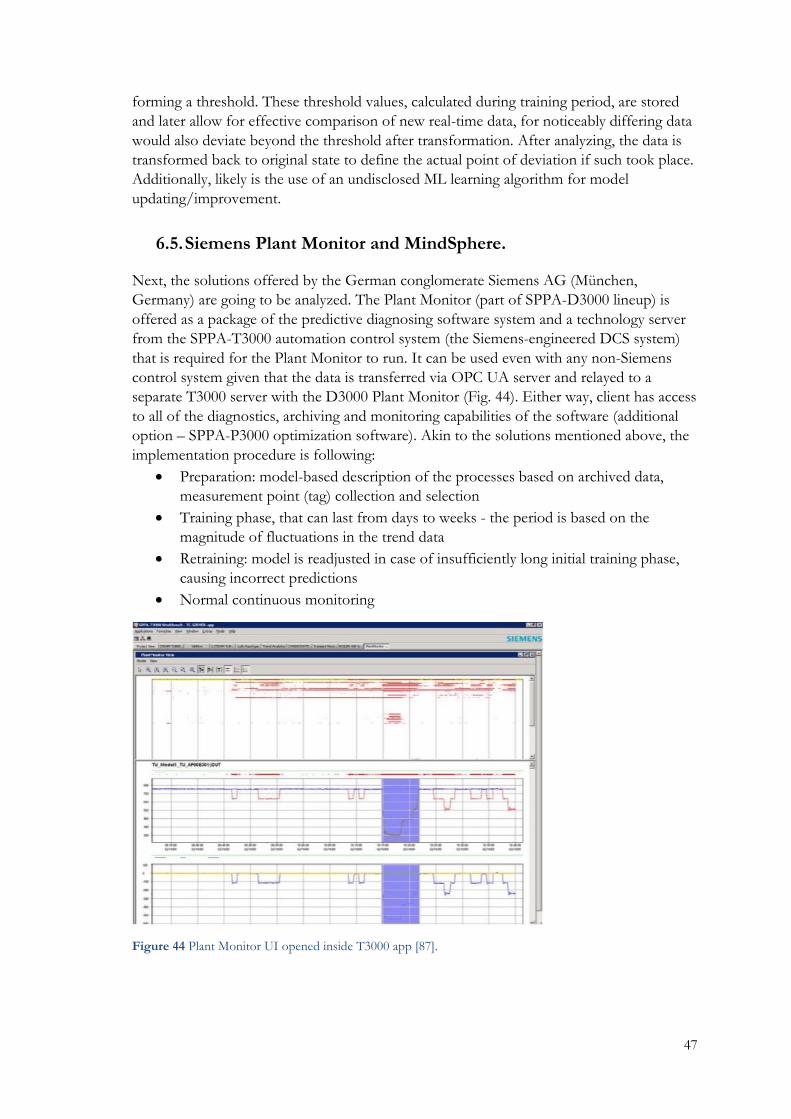
47
forming a threshold. These threshold values, calculated during training period, are stored
and later allow for effective comparison of new real-time data, for noticeably differing data
would also deviate beyond the threshold after transformation. After analyzing, the data is
transformed back to original state to define the actual point of deviation if such took place.
Additionally, likely is the use of an undisclosed ML learning algorithm for model
updating/improvement.
6.5. Siemens Plant Monitor and MindSphere.
Next, the solutions offered by the German conglomerate Siemens AG (München,
Germany) are going to be analyzed. The Plant Monitor (part of SPPA-D3000 lineup) is
offered as a package of the predictive diagnosing software system and a technology server
from the SPPA-T3000 automation control system (the Siemens-engineered DCS system)
that is required for the Plant Monitor to run. It can be used even with any non-Siemens
control system given that the data is transferred via OPC UA server and relayed to a
separate T3000 server with the D3000 Plant Monitor (Fig. 44). Either way, client has access
to all of the diagnostics, archiving and monitoring capabilities of the software (additional
option – SPPA-P3000 optimization software). Akin to the solutions mentioned above, the
implementation procedure is following:
• Preparation: model-based description of the processes based on archived data,
measurement point (tag) collection and selection
• Training phase, that can last from days to weeks - the period is based on the
magnitude of fluctuations in the trend data
• Retraining: model is readjusted in case of insufficiently long initial training phase,
causing incorrect predictions
• Normal continuous monitoring
Figure 44 Plant Monitor UI opened inside T3000 app [87].

48
Technically, this diagnostics system uses a deep learning ANN algorithm (ANN is briefly
mentioned in the technical description manual, also several ANN and deep learning patents
are assigned to Siemens, [88]), likely modified with e.g. radial basis function for improved
non-linear capabilities. The goal is exactly the same: to detect early deviations, only
approach is different, since ANN is basically a complex model with interconnected hidden
layers, where the previously described systems mainly used different algorithms in
conjunction to form a model. Unlike most other systems, that are more of a “black box”27
type, plant monitor actually requires tags to be chosen and selected, thus including some
actual human-driven modelling. The training process can be easily adjusted any time with a
possibility of choosing an exact training period, data sets and even removal of an already
added abnormal data in the set. Similar flexibility is available also during operation, the
model can be adjusted and retrained at any time, same variables can be used for several
models and overall a model can be trained for modes of operation other than normal and
make adjustments taking into account known aging of particular elements. [87]
While the Plant Monitor is mostly based on the older technology software that is in the
possession of Siemens AG, there is a more modern solution available: MindSphere (Fig. 45,
created in collaboration with SAP that is going to be discussed later in the chapter, [92]). It
is a versatile IoT cloud platform suitable for various needs that includes different modules
(MindSphere Apps, including third-party [90]), with offered open API for custom apps and
extensive cybersecurity measures
with additional data encryption,
firewalls and virtual private network
access (although, these are industry-
standard measures, there is no
separate network-security
Mindsphere App mentioned). These
modules provide a wide diversity of
functionality, e.g. continuous access
to online CM data anywhere via a
smartphone app, with trend
prediction and anomaly detection
capabilities (likely also based on
ANN) for separate signals. [89, 91]
6.6. GE SmartSignal and Predix
The SmartSignal is a software solution developed and offered by another large company,
American General Electric (Boston, US). Currently, the software is closely tied to the GE
Predix cloud platform, that is a data transmission, storage and management system with
analytical functionality, similarly to the Siemens MindSphere. If used with Predix,
27 a system where exact internal functions/technologies are beyond the scope of interest, and only I/O of the system is taken into consideration, thus assuming the system to be a plain black box with known inputs and outputs
Figure 45 Mindsphere UI as presented in the whitepaper, courtesy of Siemens AG.

49
SmartSignal is offered as a part of the Asset Performance Management (Fig. 46) package -
the package that is responsible for analyzing and displaying measurements along with
predicted values in the Predix platform. Predix is available with an SDK for custom app
development, with an optimization package called Operations Performance Management
(OPM) and in terms of cybersecurity, Predix is built around the standard practices of data
encryption, security protocols, authentication control etc. If SmartSignal is employed
separately – it is realized with supporting database server hardware in situ, although lacking
the cloud-based easy access and data management functionality to some extent, as well as
the integration with other GE Predix products (mostly revolving about process
management and additional optimization functionality). [94, 95, 96]
Figure 46 GE Predix APM UI, Courtesy of GE
In any case, SmartSignal is capable of processing signals incoming from database of any
manufacturer supporting SQL or an OPC UA system. Overall reliability predictive
functionality is based on the idea of determining the similarity of the current state of the
model (i.e. a large machine with multitude of sensor data) to the previously determined
one. The main learning algorithm used (according to US patent No. 7,509,235 B2
belonging to GE) is somewhat different in terms of the main idea: being dubbed
“Evolutionary” or “genetic programming” for similarity to evolutionary processes in the
nature. Input parameters are grouped into a set of “individuals”, also called
“chromosomes” or, in other words, vectors with weight and similarity data corresponding
to a model. Chromosomes comprise “population” and the best gets selected in the
population replacing the worst, i.e. less fitting model parameters akin to natural selection in
the process of evolution. “Fitness” is defined during via classification into “true positive”
or “false positive” by an additional fuzzified28 model evaluation algorithm. This algorithm
likely has kernel-based non-linear capabilities because of the gaussian basis function
mentioned in the patent and also provides classification based on the weights between the
input data calculated during initial clustering. Thus, the algorithm creates the model created
28 Fuzzy meaning that traditional Boolean true/false are replaced with a wider variety of conditions, e.g. “completely true”, “somewhat false”, “quite true” etc.
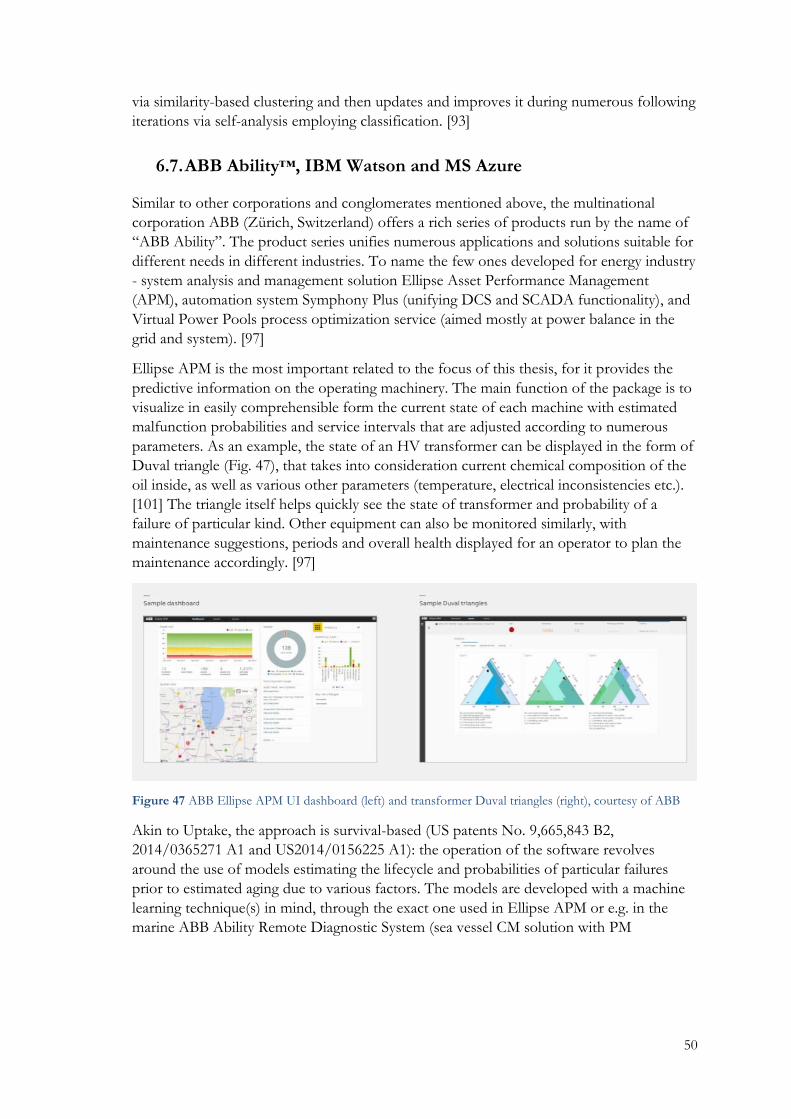
50
via similarity-based clustering and then updates and improves it during numerous following
iterations via self-analysis employing classification. [93]
6.7. ABB Ability™, IBM Watson and MS Azure
Similar to other corporations and conglomerates mentioned above, the multinational
corporation ABB (Zürich, Switzerland) offers a rich series of products run by the name of
“ABB Ability”. The product series unifies numerous applications and solutions suitable for
different needs in different industries. To name the few ones developed for energy industry
- system analysis and management solution Ellipse Asset Performance Management
(APM), automation system Symphony Plus (unifying DCS and SCADA functionality), and
Virtual Power Pools process optimization service (aimed mostly at power balance in the
grid and system). [97]
Ellipse APM is the most important related to the focus of this thesis, for it provides the
predictive information on the operating machinery. The main function of the package is to
visualize in easily comprehensible form the current state of each machine with estimated
malfunction probabilities and service intervals that are adjusted according to numerous
parameters. As an example, the state of an HV transformer can be displayed in the form of
Duval triangle (Fig. 47), that takes into consideration current chemical composition of the
oil inside, as well as various other parameters (temperature, electrical inconsistencies etc.).
[101] The triangle itself helps quickly see the state of transformer and probability of a
failure of particular kind. Other equipment can also be monitored similarly, with
maintenance suggestions, periods and overall health displayed for an operator to plan the
maintenance accordingly. [97]
Figure 47 ABB Ellipse APM UI dashboard (left) and transformer Duval triangles (right), courtesy of ABB
Akin to Uptake, the approach is survival-based (US patents No. 9,665,843 B2,
2014/0365271 A1 and US2014/0156225 A1): the operation of the software revolves
around the use of models estimating the lifecycle and probabilities of particular failures
prior to estimated aging due to various factors. The models are developed with a machine
learning technique(s) in mind, through the exact one used in Ellipse APM or e.g. in the
marine ABB Ability Remote Diagnostic System (sea vessel CM solution with PM

51
functionality) is undisclosed and the suitable patents are described in the way to support
any of the openly available ML techniques (ANN, SVM, regression etc.).
Ellipse can be installed in situ, or in the cloud that is provided by Microsoft Azure service.
Also, other cloud-dependent solutions of ABB are powered by the Azure platform.
Moreover, another collaboration of ABB with IBM on the integration of the IBM Watson
AI in ABB Ability, implies the wide adoption of it across many ABB solutions in the near
future, e.g. for predictive maintenance, manufacturing defect detection and performance
optimization. Thus, ABB has outsourced some of its services to third-party suppliers to
focus more on the own product development and support, also making the overall solution
structure somewhat simpler. As for the cyber security, it is mentioned extensively
throughout various ABB product brochures, yet there appears to be no separate
application/service for it, rather the security measures are built-in by default in the form of
protocols and structure or in the form of additional network intrusion detection options
for the Symphony Plus system. [98, 99, 100]
6.7.1. IBM Watson
Watson AI platform by American IBM (Armonk, US) is likely to be utilized to drive the AI
based functionality of many ABB’s applications. Watson is positioned as a flexible solution
capable of fitting any need from arbitrary pattern recognition to predictive maintenance of
any machine [102]. Whilst IBM has ready Watson IoT solution of their own, Watson can
still be employed as a versatile platform for any need by any company or even a regular
user - devised as an AI based algorithm for some particular function requiring machine
analytical capabilities not available to a human mind.
IBM Watson is based on a concept of a supercomputer that evolved and was bolstered
with additional functionality over decades. Initially, it was developed as an ANN-based
question-and-answer machine to be used in a word analogy quiz television show called
“Jeopardy!” against human players. [103] Later on, abilities of the AI algorithm proved to
be so useful that gradually Watson has turned into a widely accessible pattern recognition
cloud-based software platform with various preset applications added. Today, the advanced
deep learning ANN algorithm of the AI solution is capable of, but not limited to: image
pattern recognition (e.g. applicable for manufacturing defect detection) and regression
analysis (useful in predictive maintenance) [104, 105]
6.7.2. Microsoft Azure
Azure by American Microsoft Corporation (Redmond, US) is a cloud platform widely used
by various businesses across the globe. Offered on a Platform as a Service model (PaaS,
platform subscription model) it is a flexible tool granting remote computing power in the
form of cloud-based Windows or Linux virtual machines and access to them. Any kind of
proprietary software (i.e. ABB Ability products in this case, or any other) can be deployed
on Azure servers, hence some CM software offering companies like ABB rely upon
Microsoft’s services to provide cloud computing for own software solutions. [106]
Whilst offering a myriad of various cloud-related computing and networking services,
Microsoft Azure platform also has analytics solution with ML capabilities of its own. It

52
allows to use any algorithm suitable for one’s needs (from linear regression and ANN to
decision trees and many other techniques that have been left out of scope of this thesis) for
any kind of data analysis. Moreover, Azure includes IoT package of applications called
Azure IoT Suite, that has predictive maintenance preconfigured solution suitable for
machinery monitoring and expected lifecycle analysis to be performed (although,
showcased only with an example of an aircraft engine and the regression model derived
from it). Also, this package also includes “Connected factory” solution, that allows for
monitoring the state, performance and overall efficiency of a facility (showcased an
example of a machinery part manufacturing plant). [107, 108]
6.8. C3 IoT Platform™
American C3 Inc. (Redwood City, US) offers a C3 Type System™, an abstract layer that
unifies a cloud-based data storage and an analysis platform and numerous applications and
services - the C3 IoT Platform. Overall, the product structure is clear and contains
services/tools for various needs, distinctively divided into groups, e.g. C3 Predictive
Maintenance™, C3 Sensor Health™, C3 Fraud Detection™ (finance application) and so
forth. Any of these products can be evaluated in the form of a trial organized as a scalable
6 to 12 weeks long project (6-week long implementation as an example) costing $100000 to
$500000 depending on the length and complexity:
1. “Discovery kick-off” along with design phase: week 1 and 2
2. Data integration phase: week 2 and 3
3. Analytics and machine learning (model training): weeks 2 to 5
4. Validation and tuning: weeks 4 to 6
5. UI configuration: week 5 and 6
6. Demo and review: week 6
After this trial, the product can be put to use immediately as a PaaS or/and SaaS
(depending on the products chosen). Additionally, a team of up to 6 specialists from C3
IoT can be assigned to the facility for a period for up to 3 years to train 50 to 200 of the
local personnel to be capable to develop and operate locally needed software solutions
(ML/IoT) independently from C3, also providing an integrated development environment.
[109]
The more related to the scope of this thesis products are going to be analyzed, namely the
C3 Predictive Maintenance with the C3 IoT Platform (including C3 Data Lake cloud
service). The cloud server functionality is based on the Amazon Web Services platform
(according to the c.2017 product overview), and lately the company turned also to the
aforementioned MS Azure service [110]. Apart from the cloud, IoT Platform package also
contains different data processing solutions, e.g. an integrator for easy data mapping and
transformation to other data systems via XML29, a data explorer om the form of visual
interface to analyze measurement data, an AI design tool for additional data manipulations,
29 eXtensible Markup Language, a specific versatile data structure language, used e.g. in a configuration file parameter list
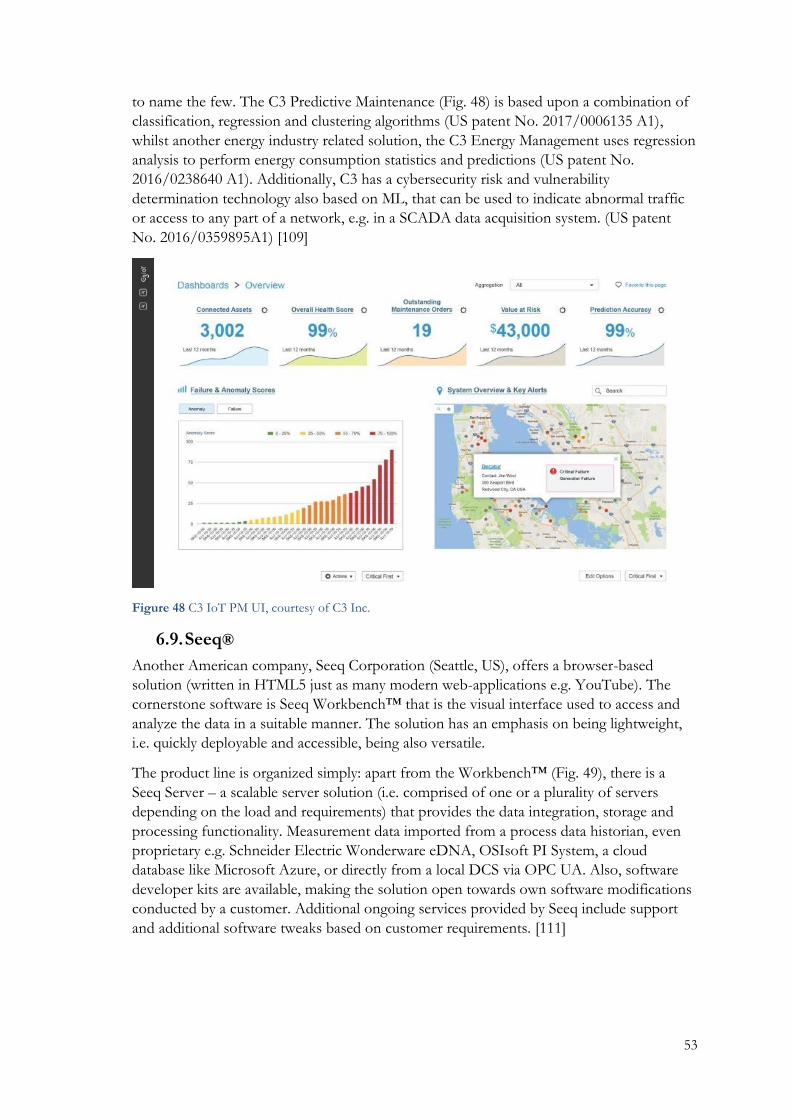
53
to name the few. The C3 Predictive Maintenance (Fig. 48) is based upon a combination of
classification, regression and clustering algorithms (US patent No. 2017/0006135 A1),
whilst another energy industry related solution, the C3 Energy Management uses regression
analysis to perform energy consumption statistics and predictions (US patent No.
2016/0238640 A1). Additionally, C3 has a cybersecurity risk and vulnerability
determination technology also based on ML, that can be used to indicate abnormal traffic
or access to any part of a network, e.g. in a SCADA data acquisition system. (US patent
No. 2016/0359895A1) [109]
Figure 48 C3 IoT PM UI, courtesy of C3 Inc.
6.9. Seeq®
Another American company, Seeq Corporation (Seattle, US), offers a browser-based
solution (written in HTML5 just as many modern web-applications e.g. YouTube). The
cornerstone software is Seeq Workbench™ that is the visual interface used to access and
analyze the data in a suitable manner. The solution has an emphasis on being lightweight,
i.e. quickly deployable and accessible, being also versatile.
The product line is organized simply: apart from the Workbench™ (Fig. 49), there is a
Seeq Server – a scalable server solution (i.e. comprised of one or a plurality of servers
depending on the load and requirements) that provides the data integration, storage and
processing functionality. Measurement data imported from a process data historian, even
proprietary e.g. Schneider Electric Wonderware eDNA, OSIsoft PI System, a cloud
database like Microsoft Azure, or directly from a local DCS via OPC UA. Also, software
developer kits are available, making the solution open towards own software modifications
conducted by a customer. Additional ongoing services provided by Seeq include support
and additional software tweaks based on customer requirements. [111]

54
Figure 49 Seeq Workbench UI, courtesy of Seeq Corporation
In terms of the predictive functionality, the software includes numerous algorithms suitable
for different approaches and data types. The ML techniques supported include pattern
recognition and regression amongst else. Exact algorithms used, and training times of the
models are undisclosed, but certainly they belong/similar to the widely known and used
(not patented) techniques. Given the nature of the solution, i.e. the ability to connect to any
data timeseries without importing, the analysis is likely fast but superficial and might be
somewhat inaccurate in some circumstances. Additionally, the software has extensive 2-D
visualization capabilities, applicable to any timeseries data in the form of scatter plots,
histograms etc., also any portion of data can be easily exported in the form of a
PowerPoint, Excel file or even as a direct internet link. [110]
6.10. SAP® PM and Service
A variety of all kinds of enterprise-oriented solutions are offered by a multinational
software corporation SAP SE (Walldorf, Germany), amongst which is the SAP Leonardo
line of solution packages. Whilst being suitable to a multitude of industries, Leonardo
includes also the IoT functionality especially suitable for PP PM in the form of a built-in
machine learning realized within the Predictive Maintenance and Service (Fig. 50) solution.
Additionally, SAP offers additional security packages (e.g. Cloud App Security) and SDK
packages for capability of designing own compatible applications to use with various
services of the company.

55
Figure 50 SAP PM and Service UI, courtesy of SAP
Akin to other larger companies, SAP also offers a variety of services capable of working in
tandem, to build a robust interconnected network of services:
• SAP Cloud Platform – cloud service that Leonardo is based on, running upon
Amazon, MS Azure and Google Cloud
• SAP HANA - a database with built-in ML analytical functionality
• SAP Fiori – a mobile service with various apps for easy data access
[113, 114, 115]
SAP product structure is rather complex in that it has a myriad of services both aimed at
enterprise application in general and suitable to industrial/utility applications. Some of
these products enhance management and scheduling of all kinds of operations, others aim
at change forecasting and data organization via ML algorithms on the software change and
(e.g. applying methods such as ANN: US 2014/0201115 A1 or regression: US
2016/0062876 A1), additionally SAP possesses a patent engineered for parallel use of
several ML models at once, that can be deployed for various applications (EP 3 029 614
A1). As a result, e.g. the SAP Predictive Maintenance and Service has the R packages with
different anomaly detection algorithms (PCA, multivariate autoregression or SVM),
lifecycle estimation or failure prediction via classification. [113]

56
7. Comparison and conclusion
The variety of PM solutions presented in the previous chapter makes it clear that both
demand and development grow rapidly for such solutions at the moment. The core
elements of a CM ML product are common for all the cases:
• a server (or likely a server cluster) either local or remote (cloud) to provide raw
storage and computational power for the data and processing algorithm(s)
• the ML based software with a graphical user interface for convenient interaction
with the data analyzed
• a database (historian), either separate (e.g. from local automation system) and/or on
the remote servers
• a data integrator of sorts to transform data from original format to a CM software
native format – can be contained within a database if the database type is fully
supported, can be separate (e.g. OPC Server), and/or can be in the form of simple
transitional software scripts on the AI analysis side.
Additionally, all solutions have support for widely accepted standards as OPC UA
certification with included transmission protocols, all possess security-related features via
secure transmission protocols and strict authentication control. The differences between all
of the previously described solutions are going to be presented in the form of table:
1. IN
tellig
ence
2. SIA
T
3. P
RiS
M
4. U
pta
ke
5. Sie
men
s
6. G
E
7. A
BB
8. C
3 I
oT
9. See
q
10. SA
P
A family of products available N N Y N Y Y Y N N Y Several algorithms employed Y Y Y Y N Y Y Y Y Y Deep learning ANN N N N N Y N Y30 N N Y31 Lifecycle estimation (Asset health) N N N Y N Y Y N N Y Tablet/phone application N32 N Y N Y33 Y34 N N N Y Custom applications (Open API) N N Y N Y Y N35 Y Y Y Additional security solution N Y N Y N N Y36 Y N Y Optimization option Y N Y N Y Y Y37 N N N38 Table 1 Comparable feature overview for the solutions analyzed
30 at the moment, the direct application for PP process analysis is undisclosed 31 application of ANN is likely to be tangentially related to PP processes 32 web-based application is planned for release in the future 33 third party, access to the predictive analysis is unclear 34 access only to process data, not the predictive analysis [116] 35 mentioned for other product, unrelated to PPs 36 exists as an additional network intrusion monitoring option for Symphony Plus 37 more of a smart grid-oriented solution rather than PP performance optimizing one 38 existing optimization solutions seem to be unrelated to PPs directly [117]

57
From the Table 1 it can be seen that the extent of functionality offered largely depends on
the size and focus of a company. Large corporations (especially the enterprise software-
oriented SAP) are capable of enormous investments in research and development of a
myriad of software solutions simultaneously, having access to the long experience
accumulated during their history, thousands of patents claimed via purchases of smaller
companies or by own research specialists. Because of this, corporations have entire suites
of solutions for various needs that can be ordered in the form of an entire array consisting
of tightly interconnected services, e.g. AI analytics solution itself, a cloud service, a
database-historian service, various asset management optimizing solutions with access to
additional customizable applications etc. Smaller companies, on the contrary, focus on
offering only the predictive maintenance and remote support services, yet still supporting
primary third-party solutions (databases and cloud services).
As for the future of the AI market, one can say assuredly that it is going to expand more
not only in the power generation industry, but rather in every possible industry around the
world that has any sort of machinery-based processes and assets employed. It is the
indisputable benefits of having abnormal deviations detected much prior to the point
where they lead to critical malfunctions or even cause an alarm produced by the standard
monitoring systems. Moreover, these benefits come at a very modest price (compared to
operating costs and especially to multimillion losses caused by an unplanned stoppage of a
crucial machine) of a service subscription monthly fees varying from several thousand up
to several dozen thousand euros per month, depending on the complexity of the facility
and amount of additional options (in case with an availability of suites and additional
solutions, e.g. pricing of somewhat related product series from SAP [118] – basic limited
package would cost 1500€/mon, whilst far more advanced one is already 15000€/mon).
Such low pricing is easily justified by the fact that usually these AI solutions are normally
run on a rented server cluster, thus often lacking any additional installations in situ - since
the data analyzed comes from the monitoring systems originally installed when a PP was
built, and UI software can reside within a laptop computer.
Furthermore, current developments in the field of
augmented reality imply the next step for the
industrial maintenance. Augmented reality is a form
of projecting digital images onto a picture that a
human user perceives, realized with the help of
“smart glasses”. There are the two largest and
longest-running projects: Google Glass and
Microsoft Hololens (Fig. 51). The Google Glass is
based on the idea of having a small transparent
screen installed on the right upper corner of the
user’s field of view without obstructing it. [119] On
the other hand, MS Hololense is capable of 3D
projections on the entire lower area of the field of
view of a user, for it covers both eyes. [120] Both
Figure 51 Google Glass (upper, courtesy of Google Inc.), Microsoft Hololens (lower, courtesy of Microsoft) [119, 120]
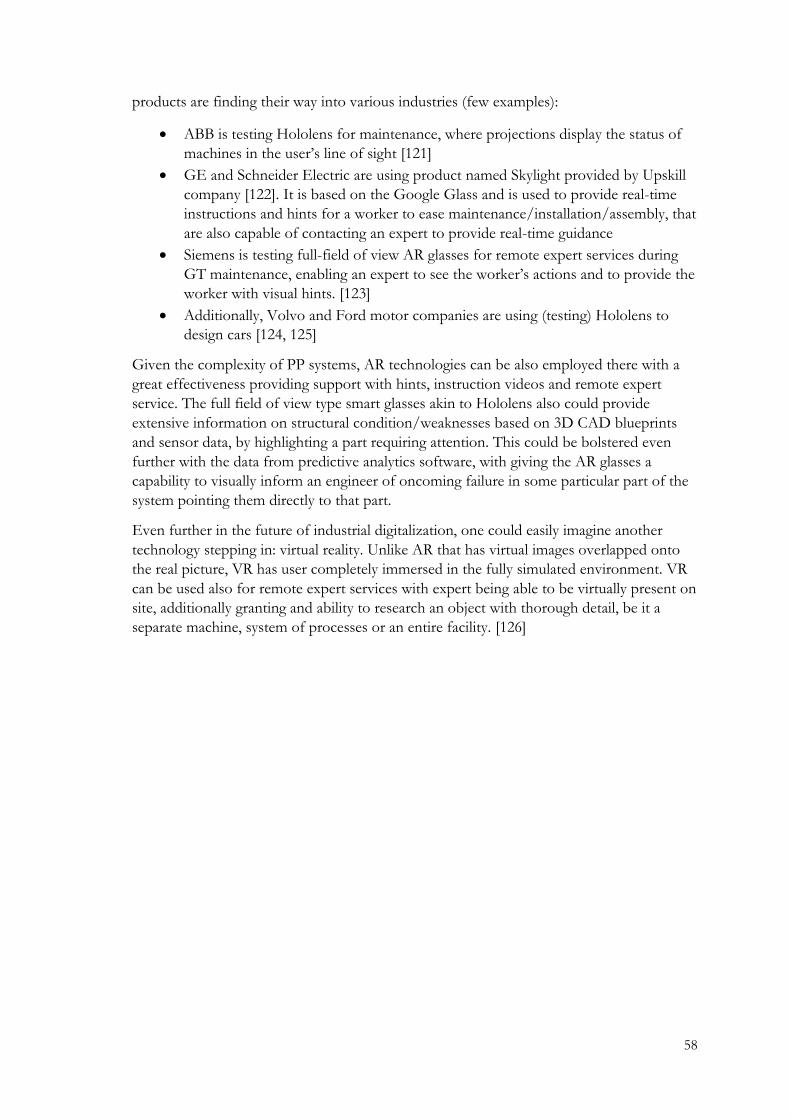
58
products are finding their way into various industries (few examples):
• ABB is testing Hololens for maintenance, where projections display the status of
machines in the user’s line of sight [121]
• GE and Schneider Electric are using product named Skylight provided by Upskill
company [122]. It is based on the Google Glass and is used to provide real-time
instructions and hints for a worker to ease maintenance/installation/assembly, that
are also capable of contacting an expert to provide real-time guidance
• Siemens is testing full-field of view AR glasses for remote expert services during
GT maintenance, enabling an expert to see the worker’s actions and to provide the
worker with visual hints. [123]
• Additionally, Volvo and Ford motor companies are using (testing) Hololens to
design cars [124, 125]
Given the complexity of PP systems, AR technologies can be also employed there with a
great effectiveness providing support with hints, instruction videos and remote expert
service. The full field of view type smart glasses akin to Hololens also could provide
extensive information on structural condition/weaknesses based on 3D CAD blueprints
and sensor data, by highlighting a part requiring attention. This could be bolstered even
further with the data from predictive analytics software, with giving the AR glasses a
capability to visually inform an engineer of oncoming failure in some particular part of the
system pointing them directly to that part.
Even further in the future of industrial digitalization, one could easily imagine another
technology stepping in: virtual reality. Unlike AR that has virtual images overlapped onto
the real picture, VR has user completely immersed in the fully simulated environment. VR
can be used also for remote expert services with expert being able to be virtually present on
site, additionally granting and ability to research an object with thorough detail, be it a
separate machine, system of processes or an entire facility. [126]

59
8. Appendix
Growth rate per y. Share
2012 2013 2014 2015 2016 2016 2005-15 2016
Total World 22797.
3 23402.
9 23844.
0 24215.
5 24816.
4 2.2% 2.8% 100.0
%
of which: OECD 10939.
9 10929.
3 10875.
5 10911.
5 10939.
2 ♦ 0.2% 44.1%
Non-OECD 11857.
4 12473.
6 12968.
5 13304.
0 13877.
2 4.0% 5.5% 55.9%
European Union # 3295.7 3267.3 3185.3 3234.3 3247.3 0.1% -0.3% 13.1%
CIS 1523.7 1509.0 1515.3 1499.9 1527.8 1.6% 0.9% 6.2%
Table 2 Worldwide electricity generation, exempt [1]
Figure 52 Electricity consumption in China (calculated and estimated) [2]
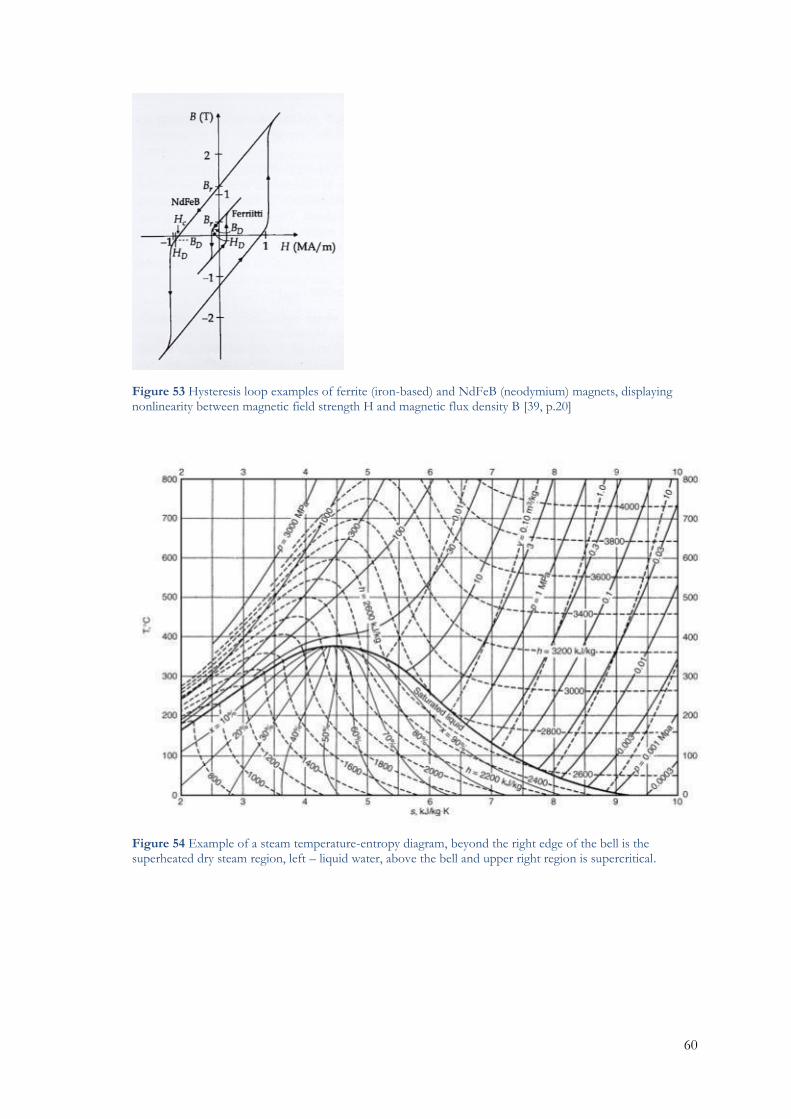
60
Figure 53 Hysteresis loop examples of ferrite (iron-based) and NdFeB (neodymium) magnets, displaying nonlinearity between magnetic field strength H and magnetic flux density B [39, p.20]
Figure 54 Example of a steam temperature-entropy diagram, beyond the right edge of the bell is the superheated dry steam region, left – liquid water, above the bell and upper right region is supercritical.

61
9. References
[1] BP, statistical research, https://www.bp.com/en/global/corporate/energy-
economics/statistical-review-of-world-energy.html
[2] US EIA, tables, https://www.eia.gov/outlooks/ieo/ieo_tables.php
[3] Web-article, PP types, https://www.electrical4u.com/power-plants-types-of-power-
plant/
[4] Zactruba, J., Scudder, R., 2010, Compare the efficiency of different power plants, Bright Hub
Engineering
[5] Smith, J., 1986, Plant condition monitoring.
[6] Han, Y. & Song, Y.H. 2003, Condition monitoring techniques for electrical equipment-a literature
survey, Power Delivery, IEEE Transactions on, vol. 18, no. 1, pp. 4-13.
[7] Web-article, Iran electricity generation investment,
http://www.presstv.com/Detail/2015/05/26/412919/iran-power-generation-electricity-
investment
[8] Raja, A.K., Srivastava, A.P. & Dwivedi, M. (eds) 2006, Power Plant Engineering, 1st edn,
New Age International Pvt. Ltd., Publishers.
[9] B. M. Weedy ... [et Al.]. 2012, Electric Power Systems in, 5th ed. edn, John Wiley & Sons
Inc, GB, pp. 1-10.
[10] Bolgarskiy, A., Muhachev, G., Stchukin, V., 1975, Thermodynamics and heat transmission
(Болгарский, A., Мухачев, Г., Щукин, В., 1975, Термодинамика и теплопередача), pp 27-31
[11] Gesellschaft, V. 2010, VDI Heat Atlas, Springer Berlin Heidelberg.
[12] Singh, O. 2008, Applied Thermodynamics, New Age International, Daryaganj.
[13] Picture, Ts diagram,
https://engineering.stackexchange.com/questions/11588/compressing-saturated-
steam/11595
[14] Poirier, B. 2014, Conceptual Guide to Thermodynamics, John Wiley & Sons, Incorporated,
New York, UNITED KINGDOM.
[15] Nag, P.K. 2014, Power Plant Engineering,4e: McGraw Hill Education (India) Private
Limited.
[16] Aleksandrov, A., 2004, Thermal energy installations thermodynamic cycle basics (Александров,
А., 2004, Термодинамические основы циклов теплоэнергетических установок), ch.8.1
[17] Valentini, A., Gas turbine power plants, pp 7-9.
[18] Olumayegun, O., Wang, M. & Kelsall, G. 2016, Closed-cycle gas turbine for power generation:
A state-of-the-art review.
[19] G. Zhongde, Z. Shufang, M. Yingcheng, L. Xiang & Z. Hekai 2010, The Pure Heat
Conversion Coefficient Analysis Method for Thermal System in Supercritical Pressure Power Unit with
Double Reheat Cycles, 2010 International Conference on Digital Manufacturing &
Automation, pp. 745.
[20] S. V. Skubienko, I. V. Yanchenko & A. Y. Babushkin, 2016, Using an absorption heat
pump in the regeneration system of turbine model K-300-240-2 manufactured by Kharkov turbo generator
plant (KhTGP), 2016 2nd International Conference on Industrial Engineering, Applications
and Manufacturing (ICIEAM), pp. 1.

62
[21] Hanfei, T. 2013, Thermal‐economic analysis of a transcritical Rankine power cycle with reheat
enhancement for a low‐grade heat source, International Journal of Energy Research, vol. 37, no. 8,
pp. 857-867.
[22] Langston, L., Opdyke, G., 1997, Introduction to Gas Turbines for Non-engineers, Global Gas
Turbine News,Volume 37: 1997, No. 2
[23] Khartchenko, N.V. & Kharchenko, V.M. 2013, Advanced Energy Systems, Second
Edition, Taylor & Francis.
[24] Woodruff, E.B., Lammers, H.B. & Lammers, T.F. 1998, Steam-plant
Operation, McGraw-Hill.
[25] M. M El-Wakil, 1984, Powerplant technology, McGraw-Hill
[26] Picture, boiler http://machineryequipmentonline.com/electrical-power-
generation/coal-fired-power-plantsboiler-technology/
[27] Ametistov, E., 2004, Basics of modern power engineering (Аметистов, Е., 2004, Основы
современной энергетики), ch. 11.4
[28] Web-article, Turbine types, https://www.turbinegenerator.org/steam/types-steam-
turbines/
[29] Necker, N., 2016, Q&A – What is a Back Pressure Turbine and what is a Condensing
Turbine?, iniped.com
[30] Soares, C., 2007, Gas Turbines, Butterworth-Heinemann
[31] Manufacturer’s webpage, GTs,
https://www.siemens.com/global/en/home/products/energy/power-generation/gas-
turbines.html#!/
[32] Hanania, J., Stenhouse, K., Donev, J., Electrostatic precipitator, Energy Education
[33] Thermodyne Engineering Systems article, 2017, What is Bag Filter?,
http://www.thermodyneboilers.com/what-is-bag-filter/
[34] Norton, J.W., 1989, Environmental Balance: Baghouses vs Precipitators, Pollution engineering
Magazine
[35] Poullikkas, A. 2015, Review of Design, Operating, and Financial Considerations in Flue Gas
Desulfurization Systems, Energy Technology & Policy, vol. 2, no. 1, pp. 92-103.
[36] Ataş, S., Tekir, U., Paksoy, M.A., Çelik, A., Çam, M. & Sevgel, T. 2014, Numerical and
experimental analysis of pulverized coal mill classifier performance in the Soma B Power Plant.
[37] Web-article, VFD and pump, http://www.oempanels.com/vfd-variable-frequency-
drive-and-centrifugal-pump
[38] Picture, 3-phase current, https://www.quora.com/What-exactly-does-a-3-phase-
supply-mean
[39] Niemenmaa, A., Luomi, J., 2011, Electromechanics and applications (Sähkömekaniikka ja
sähkökäytöt)
[40] Picture, Salient/non-salient pole rotors,
http://electricalengineeringdesigns.blogspot.fi/2012/06/poles-and-frequency-of-
alternating.html
[41] Tavner, P., Ran, L., Penman, J. & Sedding, H., Condition Monitoring of Rotating Electrical
Machines, Institution of Engineering and Technology
[42] Klempner, G. & Kerszenbaum, I. 2004, Operation and maintenance of large turbo-generators,
John Wiley & Sons, pp. 17-22.
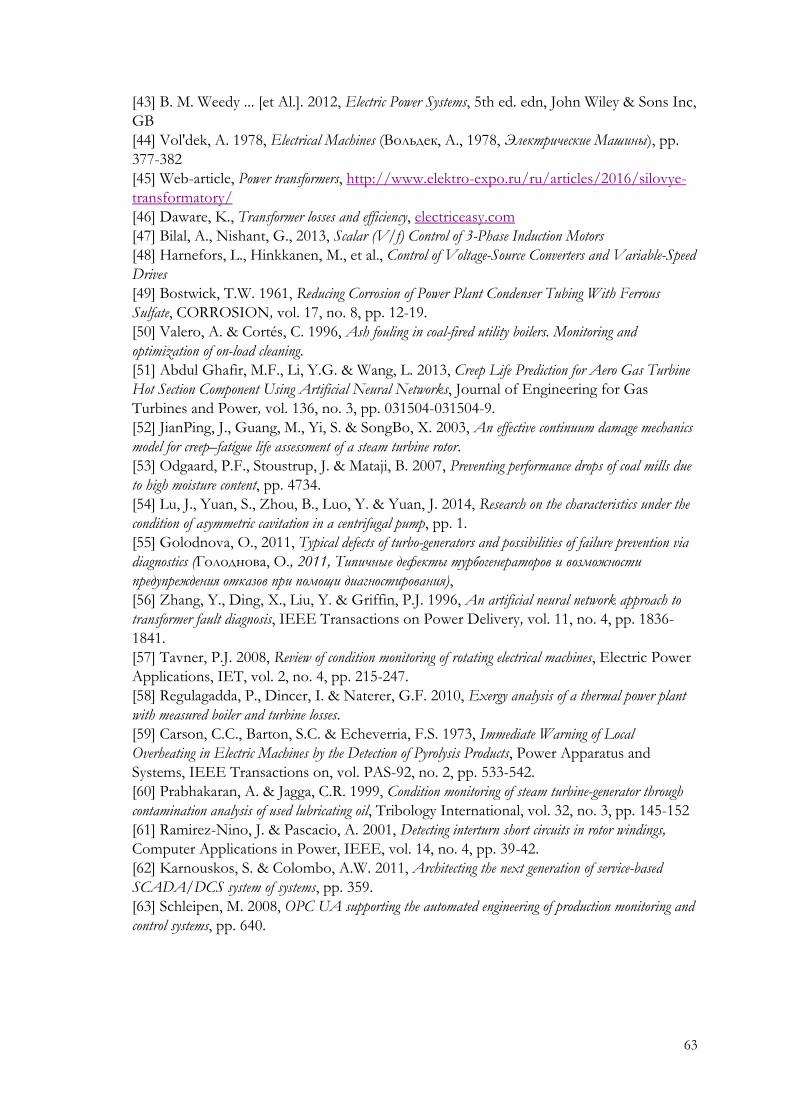
63
[43] B. M. Weedy ... [et Al.]. 2012, Electric Power Systems, 5th ed. edn, John Wiley & Sons Inc,
GB
[44] Vol'dek, A. 1978, Electrical Machines (Вольдек, А., 1978, Электрические Машины), pp.
377-382
[45] Web-article, Power transformers, http://www.elektro-expo.ru/ru/articles/2016/silovye-
transformatory/
[46] Daware, K., Transformer losses and efficiency, electriceasy.com
[47] Bilal, A., Nishant, G., 2013, Scalar (V/f) Control of 3-Phase Induction Motors
[48] Harnefors, L., Hinkkanen, M., et al., Control of Voltage-Source Converters and Variable-Speed
Drives
[49] Bostwick, T.W. 1961, Reducing Corrosion of Power Plant Condenser Tubing With Ferrous
Sulfate, CORROSION, vol. 17, no. 8, pp. 12-19.
[50] Valero, A. & Cortés, C. 1996, Ash fouling in coal-fired utility boilers. Monitoring and
optimization of on-load cleaning.
[51] Abdul Ghafir, M.F., Li, Y.G. & Wang, L. 2013, Creep Life Prediction for Aero Gas Turbine
Hot Section Component Using Artificial Neural Networks, Journal of Engineering for Gas
Turbines and Power, vol. 136, no. 3, pp. 031504-031504-9.
[52] JianPing, J., Guang, M., Yi, S. & SongBo, X. 2003, An effective continuum damage mechanics
model for creep–fatigue life assessment of a steam turbine rotor.
[53] Odgaard, P.F., Stoustrup, J. & Mataji, B. 2007, Preventing performance drops of coal mills due
to high moisture content, pp. 4734.
[54] Lu, J., Yuan, S., Zhou, B., Luo, Y. & Yuan, J. 2014, Research on the characteristics under the
condition of asymmetric cavitation in a centrifugal pump, pp. 1.
[55] Golodnova, O., 2011, Typical defects of turbo-generators and possibilities of failure prevention via
diagnostics (Голоднова, О., 2011, Типичные дефекты турбогенераторов и возможности
предупреждения отказов при помощи диагностирования),
[56] Zhang, Y., Ding, X., Liu, Y. & Griffin, P.J. 1996, An artificial neural network approach to
transformer fault diagnosis, IEEE Transactions on Power Delivery, vol. 11, no. 4, pp. 1836-
1841.
[57] Tavner, P.J. 2008, Review of condition monitoring of rotating electrical machines, Electric Power
Applications, IET, vol. 2, no. 4, pp. 215-247.
[58] Regulagadda, P., Dincer, I. & Naterer, G.F. 2010, Exergy analysis of a thermal power plant
with measured boiler and turbine losses.
[59] Carson, C.C., Barton, S.C. & Echeverria, F.S. 1973, Immediate Warning of Local
Overheating in Electric Machines by the Detection of Pyrolysis Products, Power Apparatus and
Systems, IEEE Transactions on, vol. PAS-92, no. 2, pp. 533-542.
[60] Prabhakaran, A. & Jagga, C.R. 1999, Condition monitoring of steam turbine-generator through
contamination analysis of used lubricating oil, Tribology International, vol. 32, no. 3, pp. 145-152
[61] Ramirez-Nino, J. & Pascacio, A. 2001, Detecting interturn short circuits in rotor windings,
Computer Applications in Power, IEEE, vol. 14, no. 4, pp. 39-42.
[62] Karnouskos, S. & Colombo, A.W. 2011, Architecting the next generation of service-based
SCADA/DCS system of systems, pp. 359.
[63] Schleipen, M. 2008, OPC UA supporting the automated engineering of production monitoring and
control systems, pp. 640.

64
[64] Park, J., Mackay, S. & Wright, E. Practical Data Communications for Instrumentation and
Control, Elsevier.
[65] Canetti, R. & Krawczyk, H. 2001, Analysis of Key-Exchange Protocols and Their Use for
Building Secure Channels, Advances in Cryptology EUROCRYPT 2001, ed. B. Pfitzmann,
Springer Berlin Heidelberg, Berlin, Heidelberg, pp. 453.
[66] Villanueva, J.C., 2016, SSL vs SSH - A Not-So-Technical Comparison, jscape.com
[67] Mattern, F. & Floerkemeier, C. 2010, From the Internet of Computers to the Internet of Things
in From Active Data Management to Event-Based Systems and More: Papers in Honor of
Alejandro Buchmann on the Occasion of His 60th Birthday, eds. K. Sachs, I. Petrov & P.
Guerrero, Springer Berlin Heidelberg, Berlin, Heidelberg, pp. 242-259.
[68] Goodfellow, I., Bengio, Y. & Courville, A. 2016, Deep Learning, MIT Press.
[69] Perera, S., Alwis, R. & Penchikala, S. 2017, Machine Learning Techniques for Predictive
Maintenance.
[70] Susto, G.A., Schirru, A., Pampuri, S., Pagano, D., McLoone, S. & Beghi, A. 2013, A
predictive maintenance system for integral type faults based on support vector machines: An application to
ion implantation, pp. 195.
[71] Smola, A.J., Schölkopf, B., 2003, A Tutorial on Support Vector Regression
[72] Amruthnath, N. & Gupta, T. 2018, Fault class prediction in unsupervised learning using model-
based clustering approach, pp. 5.
[73] Langone, R., Alzate, C., De Ketelaere, B. & Suykens, J.A.K. 2013, Kernel spectral
clustering for predicting maintenance of industrial machines, pp. 39.
[74] Dhini, A., Kusumoputro, B. & Surjandari, I. 2017, Neural network based system for detecting
and diagnosing faults in steam turbine of thermal power plant, pp. 149.
[75] Deshpande, P., Warke, N., Khandare, P. & Deshpande, V. 2012, Thermal power plant
analysis using artificial neural network, pp. 1.
[76] Web-article, Business model, https://www.kom-dir.ru/article/1811-biznes-model
[77] Web-article, Operating models,
http://www.ey.com/Publication/vwLUAssets/Operating-models/$FILE/Operating-
models.pdf
[78] Farhangi, H. 2010, The path of the smart grid, IEEE Power and Energy Magazine, vol. 8,
no. 1, pp. 18-28.
[79] Maintpartner internal presentation data.
[80] ASAKURA, T. & OCHIAI, K., Quality Control in Manufacturing Plants Using a Factor
Analysis Engine.
[81] NEC website, IA launch announcement
https://www.nec.com/en/press/201804/global_20180423_01.html
[82] NEC website, Cybersecurity app,
https://www.nec.com/en/global/solutions/cybersecurity/solutions/index.html?
[83] Schneider electric presentation, Predictive Asset Analytics, http://software.schneider-
electric.com/pdf/brochure/avantis-prism-predictive-asset-analytics-software/
[84] Web-news, Instep acquisition,
http://www.pandct.com/media/shownews.asp?ID=41809
[85] Schneider electric website, Wonderware SCADA toolkits,
https://www.wonderware.com/hmi-scada/toolkits/

65
[86] Schneider electric website, Cybersecurity, http://software.schneider-
electric.com/services/security-and-compliance-services/cyber-security-services/
[87] Siemens website, D3000 manual,
https://www.energy.siemens.com/mx/pool/hq/automation/automation-control-
pg/sppa-d3000/Plant_Monitor/plant-monitor_model-based-monitoring_early-fault-
detection_technical-description_sppa-d3000.pdf
[88] Google Patents web-archive, Siemens ANN patents,
https://patents.google.com/?q=artificial+neural+network&assignee=siemens&oq=sieme
ns+artificial+neural+network
[89] Siemens website, Mindsphere,
https://www.siemens.com/global/en/home/products/software/mindsphere.html
[90] Product website, Example of a third party app for Mindsphere,
https://atos.net/en/solutions/industry-4-0-the-industrial-internet-of-things/atos-apps-
siemens-mindsphere#mobile-plant-dashboard
[91] Siemens website, Mindsphere, Cybersecurity,
https://www.siemens.com/innovation/en/home/pictures-of-the-future/digitalization-
and-software/cybersecurity-industrial-security-services.html
[92] Web-article, Mindsphere created with SAP,
https://www.sap.com/assetdetail/2016/08/6cc1ef0c-817c-0010-82c7-eda71af511fa.html
[93] GE website, SmartSignal, https://www.ge.com/digital/sites/default/files/smartsignal-
datasheet.pdf
[94] GE website, Predix SDK, https://www.ge.com/digital/predix/application-
development-environments
[95] GE website, Predix, https://www.predix.com/sites/default/files/predix-the-industrial-
internet-platform-from-ge-digital-brief.pdf
[96] GE website, Predix OPM, https://www.ge.com/digital/predix-operations-
performance-management
[97] ABB website, Ability Ellipse, http://new.abb.com/enterprise-software/asset-
optimization-management/asset-health-center
[98] Web-news article, ABB + Watson: http://www.itpro.co.uk/strategy/28560/abb-and-
ibm-to-integrate-watson-ai-into-industrial-machinery
[99] Web-news article, ABB + Azure: https://news.microsoft.com/2016/10/03/abb-and-
microsoft-partner-to-drive-digital-industrial-transformation/
[100] ABB website, Cyber security: Symphony plus, https://search-
ext.abb.com/library/Download.aspx?DocumentID=3BUS095402&LanguageCode=en&D
ocumentPartId=&Action=Launch
[101] Zhang, Y., Ding, X., Liu, Y. & Griffin, P.J. 1996, An artificial neural network approach to
transformer fault diagnosis, IEEE Transactions on Power Delivery, vol. 11, no. 4, pp. 1836-1841.
[102] Web-news article, IBM vs cybercrime, http://www.itpro.co.uk/security/28112/ibm-
unleashes-watson-on-cybercriminals)
[103] Web-article, IBM Watson,
https://researcher.watson.ibm.com/researcher/view_group.php?id=2099
[104] Web-article, Watson for everyone, https://www.ibm.com/blogs/watson/2018/03/deep-
learning-service-ibm-makes-advanced-ai-accessible-users-everywhere/
66
[105] Google Patents web-archive, IBM ANN patents,
https://patents.google.com/?q=artificial+neural+network&assignee=ibm&oq=ibm+artifi
cial+neural+network
[106] Microsoft website, Azure, https://docs.microsoft.com/en-us/azure/cloud-
services/cloud-services-choose-me
[107] Microsoft website, Azure ML options with comparison, https://docs.microsoft.com/en-
us/azure/machine-learning/studio/algorithm-choice
[108] Microsoft website, Azure IoT PM example, https://docs.microsoft.com/en-
us/azure/iot-accelerators/iot-accelerators-predictive-overview [109] C3IoT website, product description document, https://test-c3-
iot.pantheonsite.io/wp-content/uploads/C3IoT_Products_and_Services_overview.pdf
[110] Web-news article, Microsoft and C3IoT, https://news.microsoft.com/2018/04/10/c3-
iot-and-microsoft-announce-strategic-partnership-to-accelerate-ai-in-the-enterprise/
[111] Seeq website, product overview, https://www.seeq.com/product/overview
[112] OSIsoft website, Collaboration with Seeq article,
https://partners.osisoft.com/solutions/solution/109/seeq-workbench
[113] SAP website, SAP PM service,
https://help.sap.com/viewer/65d8e649645d486780080063acab34d5/1.0.5/en-US/
[114] Web-news article, SAP adds multi-cloud support, https://www.zdnet.com/article/saps-
cloud-platform-adds-multi-cloud-support-business-semantics/
[115] SAP website, Leondardo,
https://eaexplorer.hana.ondemand.com/_item.html?id=13741#!/facet/141
[116] GE website, 3rd party mobile app, https://www.ge.com/digital/products/mobile-
industrial-internet-apps
[117] SAP website, Process optimization, https://www.sap.com/community/topic/process-
optimization.html
[118] SAP website, suite pricing example,
https://cloudplatform.sap.com/content/dam/website/skywalker/en_us/PDFs/SAP_CP_
Pricing_PDF_2_21.pdf
[119] Google website, Google Glass, https://developers.google.com/glass/
[120] Microsoft website, Microsoft Hololens, https://www.microsoft.com/en-us/hololens
[121] Web news article, ABB and AR, https://www.abb-
conversations.com/2017/01/augmented-reality-in-drives-service-of-the-future/
[122] Upskill website, Skylight description and users, https://upskill.io/skylight/
[123] Siemens website, Siemens AR project, https://www.siemens.com/customer-
magazine/en/home/energy/fossil-power-generation/virtual-collaboration-on-gas-turbine-
maintenance.html
[124] Volvo website, Volvo and AR,
https://www.volvocars.com/uk/about/humanmade/projects/hololens
[125] Web news article, Ford and AR,
https://www.theverge.com/2017/9/21/16343354/microsoft-hololens-ford-augmented-
reality
[126] Presentation slides, AR/VR future, http://www.plm-
europe.org/admin/presentations/2017/1991_PLMEurope_24.10.17-16-00_KILIAN-
KNOLL_SPLMM_virtual_reality.pdf
Related Documents