Machine Learning in Practice Lecture 8 Carolyn Penstein Rosé Language Technologies Institute/ Human-Computer Interaction Institute

Machine Learning in Practice Lecture 8
Dec 30, 2015
Machine Learning in Practice Lecture 8. Carolyn Penstein Ros é Language Technologies Institute/ Human-Computer Interaction Institute. Plan for the Day. Announcements Should be finalizing plans for term project Weka helpful hints Spam Dataset Overcoming some limits of Linear Functions - PowerPoint PPT Presentation
Welcome message from author
This document is posted to help you gain knowledge. Please leave a comment to let me know what you think about it! Share it to your friends and learn new things together.
Transcript

Machine Learning in PracticeLecture 8
Carolyn Penstein Rosé
Language Technologies Institute/ Human-Computer Interaction
Institute

Plan for the Day Announcements
Should be finalizing plans for term project Weka helpful hints Spam Dataset Overcoming some limits of Linear
Functions Discussing ordinal attributes in light of
linear functions

Weka Helpful Hints

Feature Selection Feature
selection algorithms pick out a subset of the features that work best Usually they
evaluate each feature in isolation
* Click here to start setting up feature selection

Feature Selection Feature
selection algorithms pick out a subset of the features that work best Usually they
evaluate each feature in isolation
* Now click here

Feature Selection
* Now click here.
Feature Selection

Feature Selection
* Now pick your baseclassifier just like before

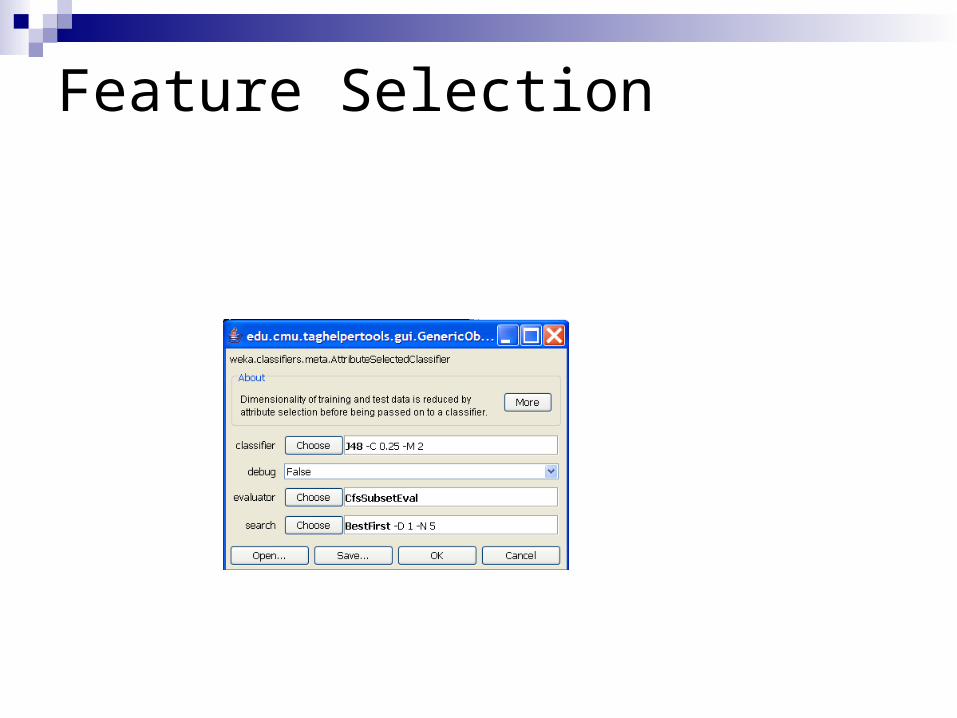
Feature Selection
* Finally you will configurethe feature selection

Setting Up Feature Selection
* First click here.

Setting Up Feature Selection
* Select CHiSquaredAttributeEval

Setting Up Feature Selection
* Now click here.
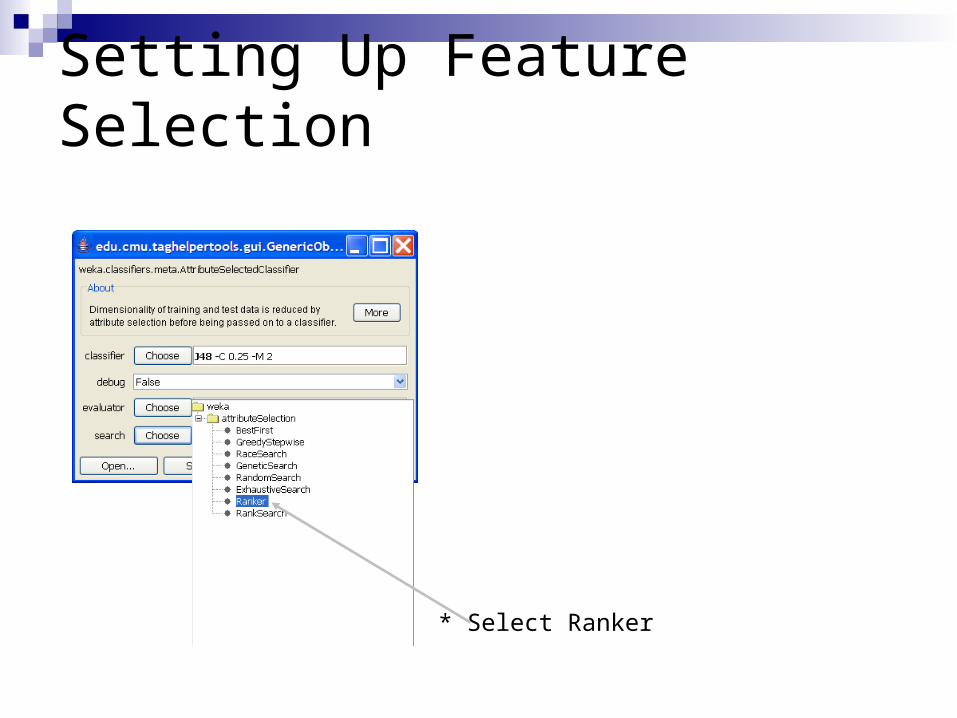
Setting Up Feature Selection
* Select Ranker

Setting Up Feature Selection
* Now click here
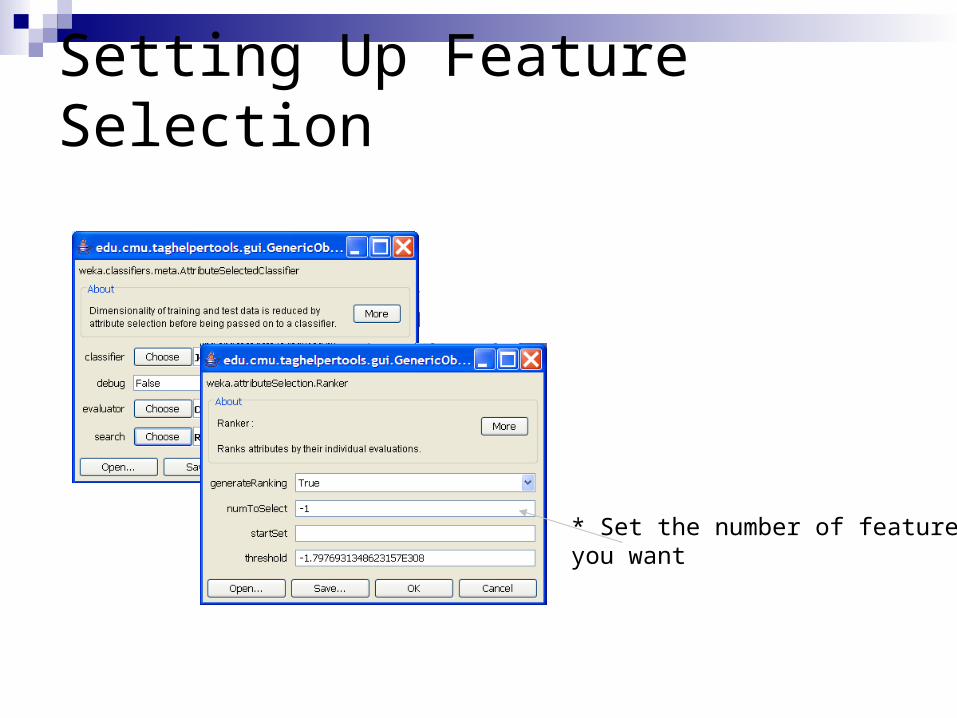
Setting Up Feature Selection
* Set the number of featuresyou want

Setting Up Feature Selection The number you pick
should not be larger than the number of features available
The number should not be larger than the number of coded examples you have

Examining Which Features are Most Predictive
You can find a ranked list of features in the Performance Report if you use feature selection
* Predictiveness score
* Frequency

Spam Data Set

Spam Data Set
Word frequencies
Runs of $, !, Capitalization
All numeric Spam versus
NotSpam
* Which algorithm will work best?

Spam Data Set Decision Trees (.85 Kappa) SMO (linear function) (.79 Kappa) Naïve Bayes (.6 Kappa)
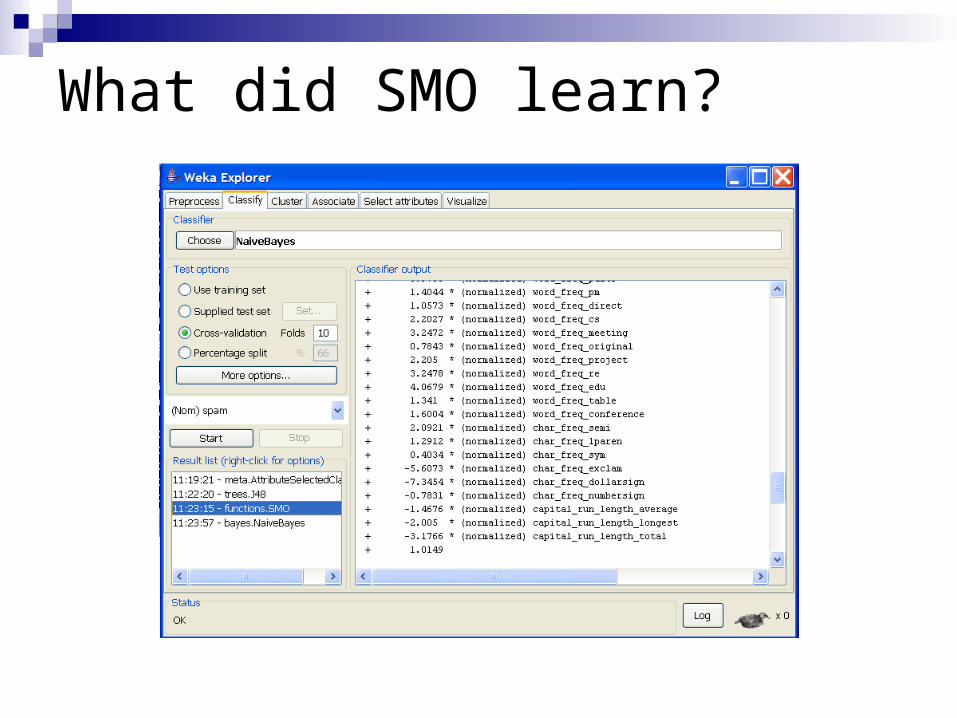
What did SMO learn?
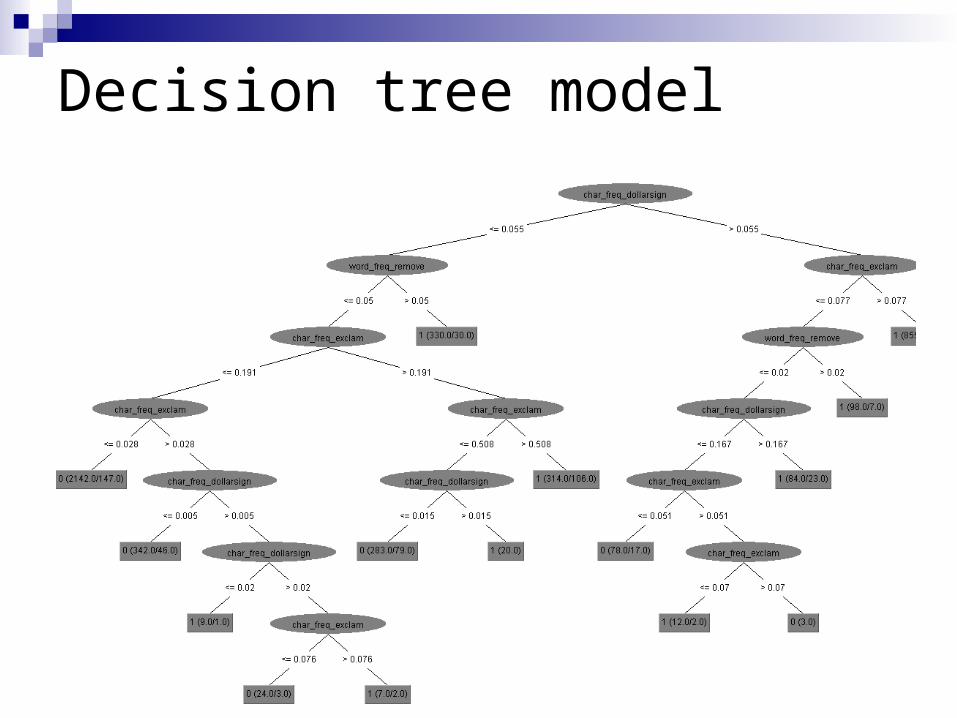
Decision tree model

More on Linear Functions… exploring the idea of nonlinearity

Limits of linear functions
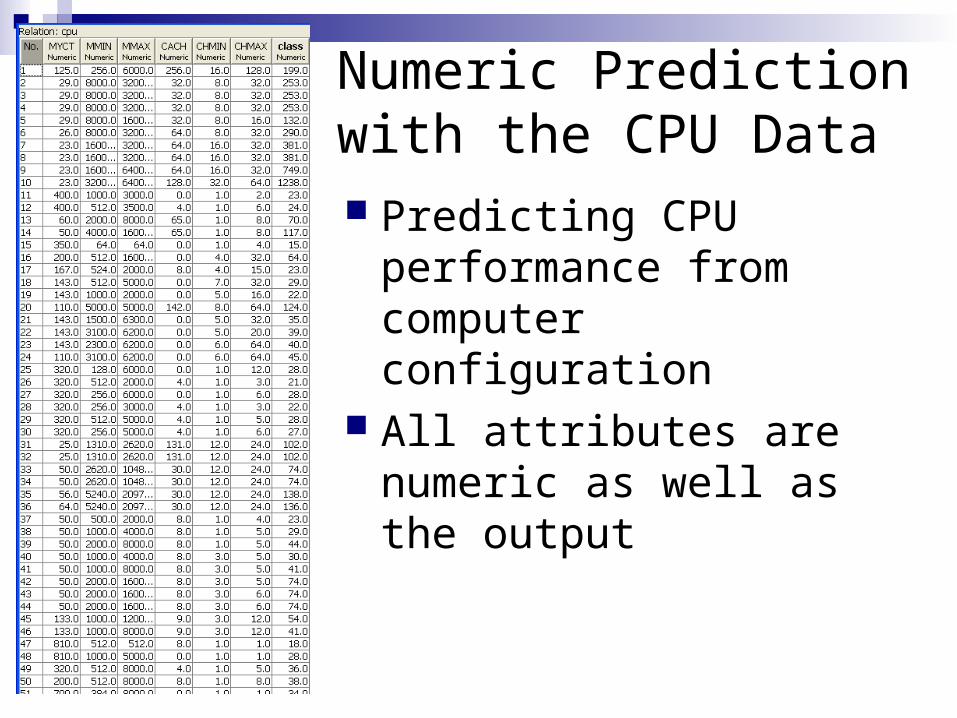
Numeric Prediction with the CPU Data Predicting CPU
performance from computer configuration
All attributes are numeric as well as the output
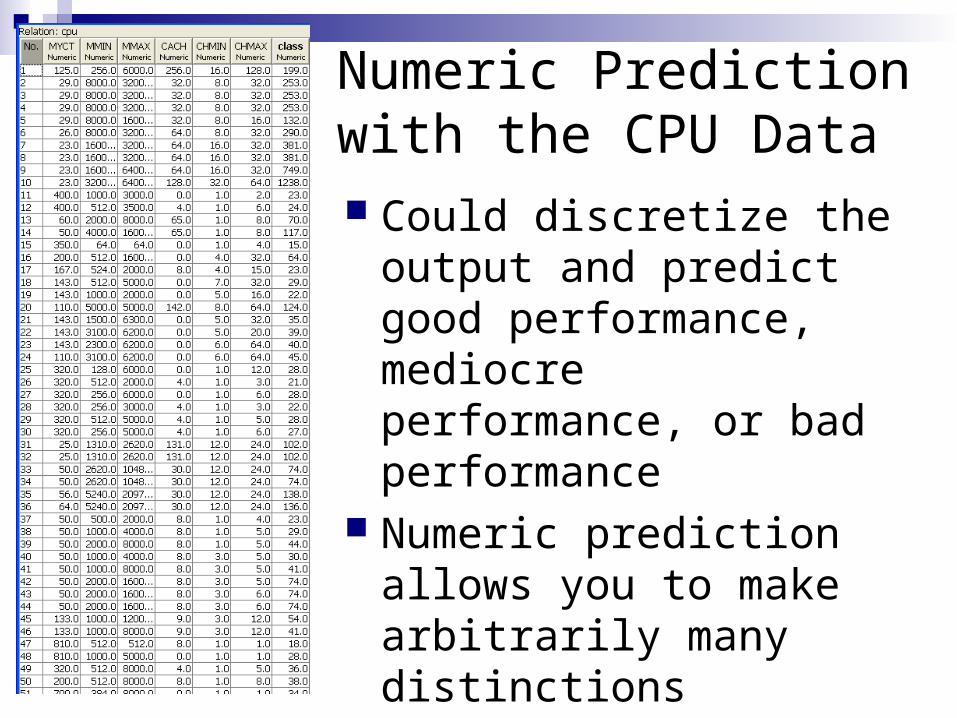
Numeric Prediction with the CPU Data Could discretize the output
and predict good performance, mediocre performance, or bad performance
Numeric prediction allows you to make arbitrarily many distinctions
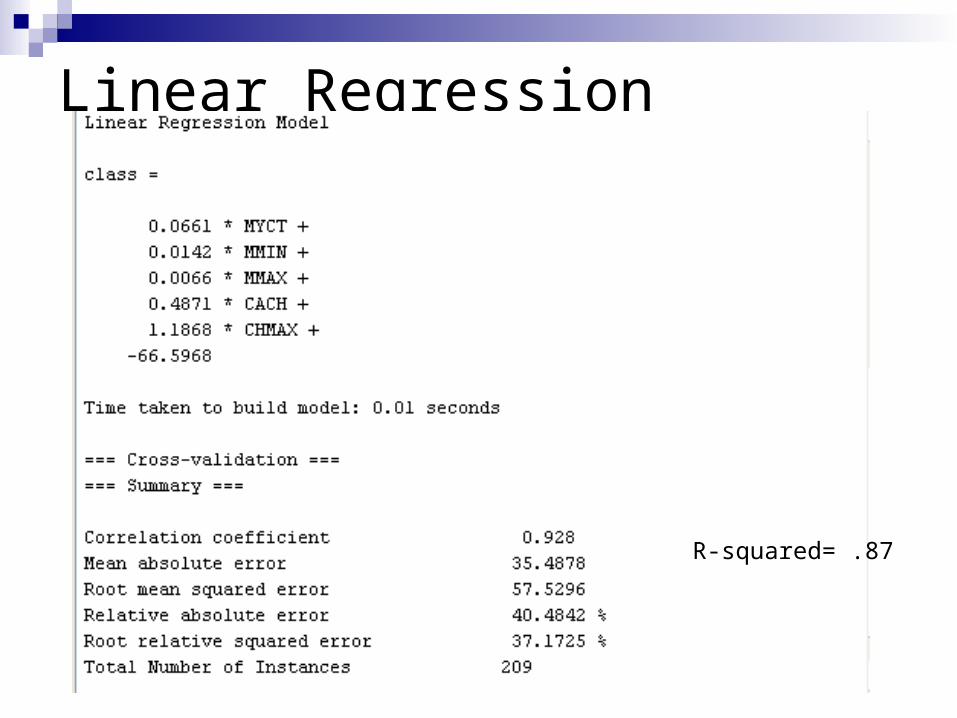
Linear Regression
R-squared= .87
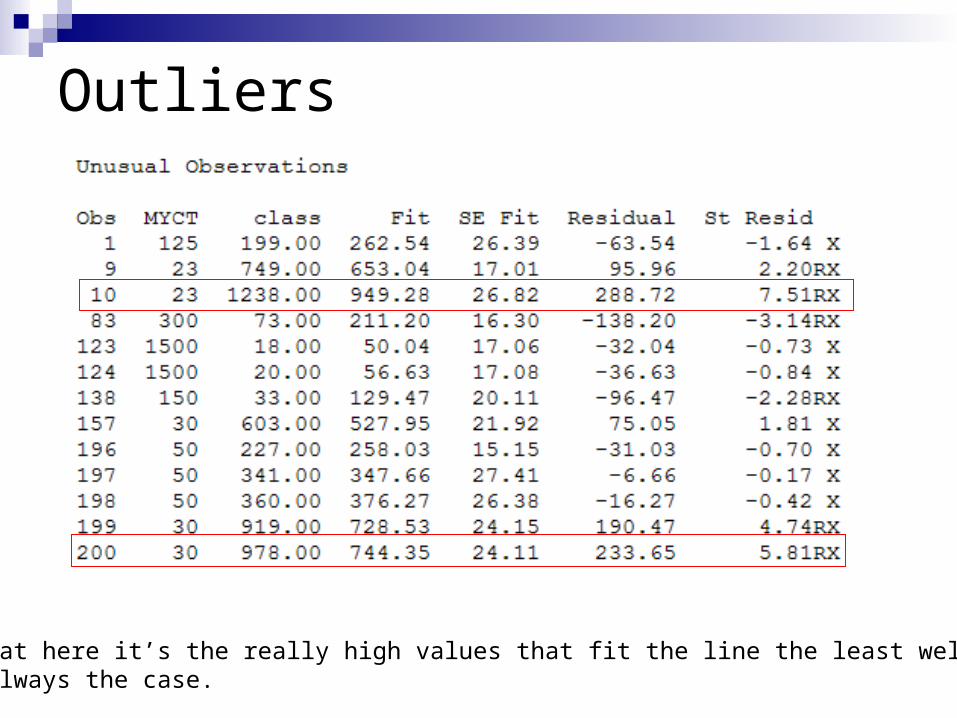
Outliers
** Notice that here it’s the really high values that fit the line the least well. That’s not always the case.
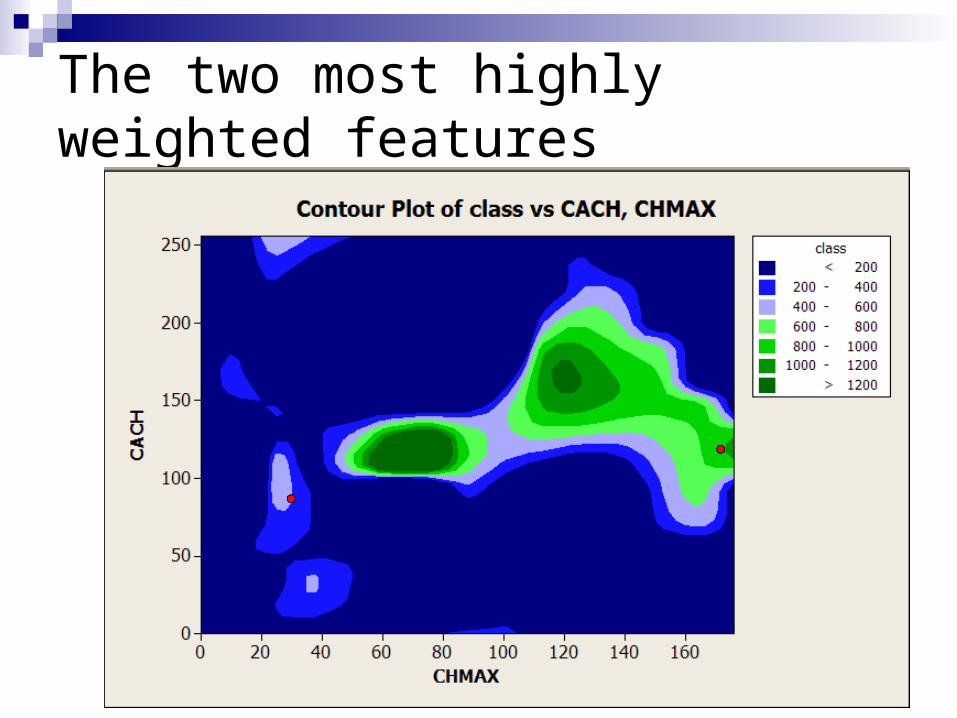
The two most highly weighted features

Exploring the Attribute Space
* Identify outliers with respect to typical attribute values.

The two most highly weighted features
Within 1 standard deviation
of the mean value

Trees for Numeric Prediction
Looks like we may need a representation that allows for a nonlinear solution
Regression trees can handle a combination of numeric and nominal attributes
M5P: computes a linear regression function at each leaf node of the treeLook at CPU performance data and compare a
simple linear regression (R = .93) with M5P (R = .98)
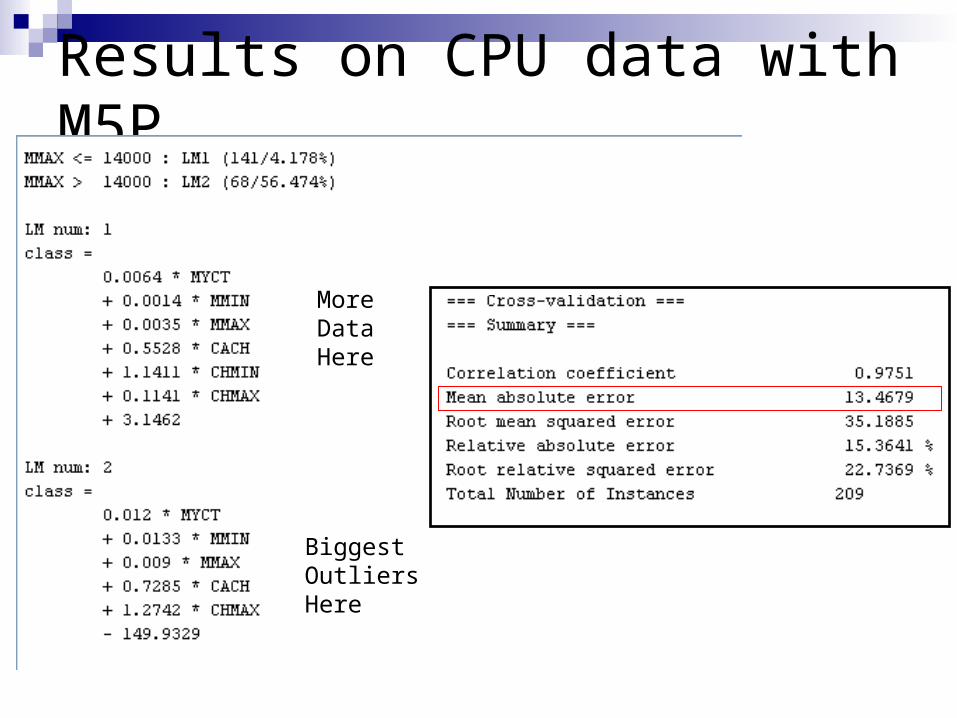
Results on CPU data with M5P
MoreData Here
BiggestOutliersHere

Results with M5P
MoreData Here
BiggestOutliersHere

Multi-Layer Networks can learn arbitrarily complex functions
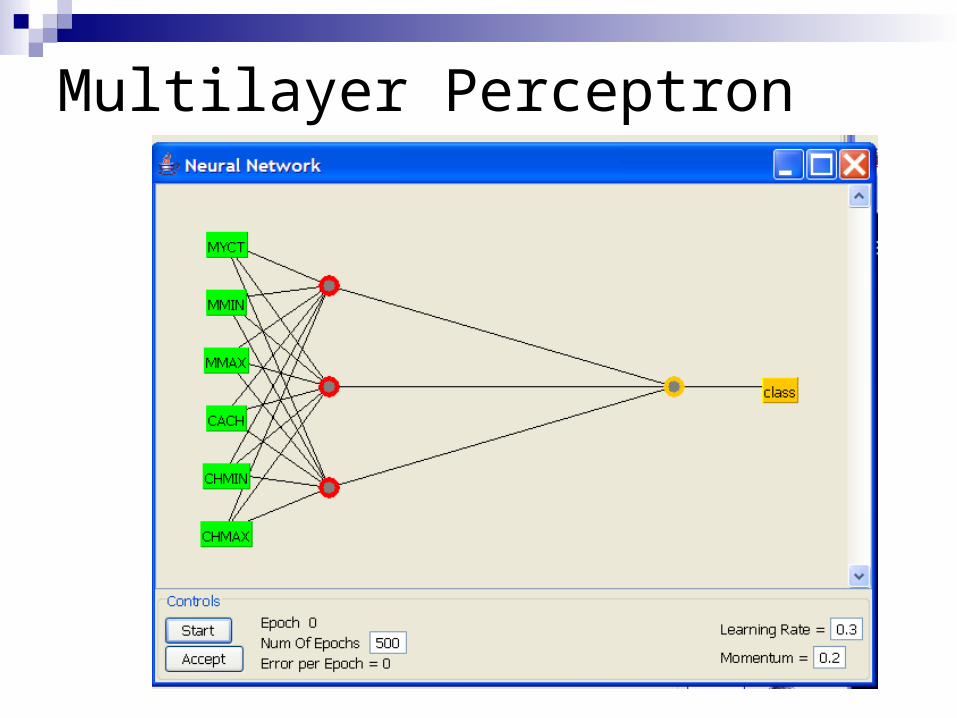
Multilayer Perceptron

Best Results So Far

Forcing a Linear Function
Note that it weights the featuresdifferently than the linear regression
Partly because of normalization
Regression trees split on MMAXNN emphasizes MMIN

Review of Ordinal Attributes

Feature Space Design for Linear Functions
Often features will be numeric Continuous values May be more likely to generalize properly
with discretized valuesWe discussed the fact that you lose ordering
and distanceWith respect to linear functions, it may be more
important that you lose the ability to think in terms of ranges
Explicitly coding ranges allows for a simple form of nonlinearity

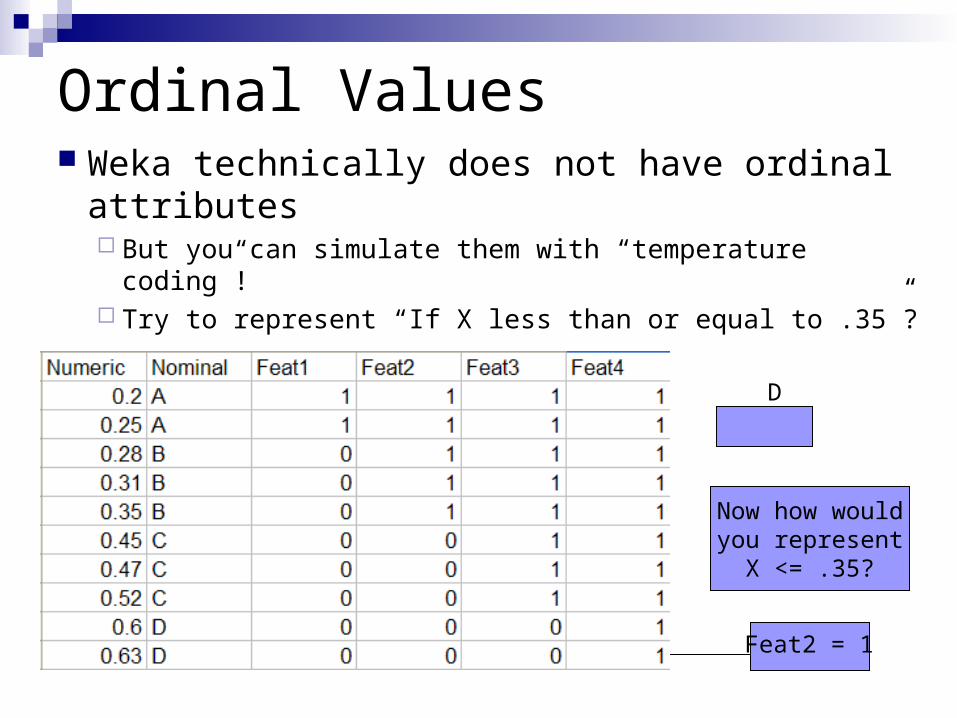
Ordinal Values Weka technically does not have ordinal
attributes But you can simulate them with “temperature coding”! Try to represent “If X less than or equal to .35”?
.2 .25 .28 .31 .35 .45 .47 .52 .6 .63
A B C D
A
A or B
A or B or C
A or B or C or D

Ordinal Values Weka technically does not have ordinal
attributes But you can simulate them with “temperature coding”! Try to represent “If X less than or equal to .35”?
.2 .25 .28 .31 .35 .45 .47 .52 .6 .63
A B C D
A
A or B
A or B or C
A or B or C or D

Ordinal Values Weka technically does not have ordinal
attributes But you can simulate them with “temperature coding”! Try to represent “If X less than or equal to .35”?
.2 .25 .28 .31 .35 .45 .47 .52 .6 .63
A B C D
A
A or B
A or B or C
A or B or C or D
Now how wouldyou represent
X <= .35?
Ordinal Values Weka technically does not have ordinal
attributes But you can simulate them with “temperature coding”! Try to represent “If X less than or equal to .35”?
.2 .25 .28 .31 .35 .45 .47 .52 .6 .63
A B C D
A
A or B
A or B or C
A or B or C or D
Now how wouldyou represent
X <= .35?
Feat2 = 1
Take Home Message Linear functions cannot learn interactions
between attributes If you need to account for interactions:
Multiple layersTree-like representationsAttributes that represent rangesLater in the semester we’ll talk about other
approaches
Related Documents