UHI Thesis - pdf download summary Increasing understanding of a data poor species to improve resource management megrim Lepidorhombus whiffiagonis in the northern North Sea Macdonald, Paul DOCTOR OF PHILOSOPHY (AWARDED BY OU/ABERDEEN) Award date: 2014 Awarding institution: The University of Edinburgh Link URL to thesis in UHI Research Database General rights and useage policy Copyright,IP and moral rights for the publications made accessible in the UHI Research Database are retained by the author, users must recognise and abide by the legal requirements associated with these rights. This copy has been supplied on the understanding that it is copyright material and that no quotation from the thesis may be published without proper acknowledgement, or without prior permission from the author. Users may download and print one copy of any thesis from the UHI Research Database for the not-for-profit purpose of private study or research on the condition that: 1) The full text is not changed in any way 2) If citing, a bibliographic link is made to the metadata record on the the UHI Research Database 3) You may not further distribute the material or use it for any profit-making activity or commercial gain 4) You may freely distribute the URL identifying the publication in the UHI Research Database Take down policy If you believe that any data within this document represents a breach of copyright, confidence or data protection please contact us at [email protected] providing details; we will remove access to the work immediately and investigate your claim. Download date: 16. Apr. 2022

Welcome message from author
This document is posted to help you gain knowledge. Please leave a comment to let me know what you think about it! Share it to your friends and learn new things together.
Transcript
UHI Thesis - pdf download summary
Increasing understanding of a data poor species to improve resourcemanagement
megrim Lepidorhombus whiffiagonis in the northern North Sea
Macdonald, Paul
DOCTOR OF PHILOSOPHY (AWARDED BY OU/ABERDEEN)
Award date:2014
Awarding institution:The University of Edinburgh
Link URL to thesis in UHI Research Database
General rights and useage policyCopyright,IP and moral rights for the publications made accessible in the UHI Research Database are retainedby the author, users must recognise and abide by the legal requirements associated with these rights. This copyhas been supplied on the understanding that it is copyright material and that no quotation from the thesis may bepublished without proper acknowledgement, or without prior permission from the author.
Users may download and print one copy of any thesis from the UHI Research Database for the not-for-profitpurpose of private study or research on the condition that:
1) The full text is not changed in any way2) If citing, a bibliographic link is made to the metadata record on the the UHI Research Database3) You may not further distribute the material or use it for any profit-making activity or commercial gain4) You may freely distribute the URL identifying the publication in the UHI Research DatabaseTake down policyIf you believe that any data within this document represents a breach of copyright, confidence or data protection please contact us [email protected] providing details; we will remove access to the work immediately and investigate your claim.
Download date: 16. Apr. 2022
Increasing understanding of a data poor species
to improve resource management: megrim
(Lepidorhombus whiffiagonis) in the northern
North Sea
A thesis presented for the degree of Doctor of Philosophy at the University of Aberdeen
Paul Macdonald
B.Sc. (Hons.) University of Aberdeen, Aberdeen, UK
M.Sc. University of Aberdeen, Aberdeen, UK
School of Biological Sciences, University of Aberdeen
and
Marine Science Department, NAFC Marine Centre
2014
2
DECLARATION
I hereby declare that this thesis is the record of my own original work. No part of it has
been presented or accepted in any previous application for a degree. The vast majority
of the laboratory work, field work, data analyses and writing were the result of my own
work with the following exceptions: fishers’ diary data used in Chapter 2 was
transcribed by Dr. Ian Napier and Leslie Tait; time series analysis described in Chapter
2 was carried out by Dr. I. R. Cleasby; genetic and subsequent statistical analyses
described in Chapter 5 were contracted to the Laboratory of Genetics of Natural
Resources, Department of Functional Biology, University of Oviedo; the logistic
regression model analysis described in Chapter 6 was undertaken with the help of Dr I.
R. Cleasby.
Work from Chapter 2 was published jointly with Dr C. H. Angus (NAFC Marine
Centre, Shetland), Dr Ian R. Cleasby (NAFC Marine Centre, Shetland) and Dr C. T.
Marshall (University of Aberdeen, Aberdeen) in “Fishers’ knowledge as an indicator of
spatial and temporal trends in abundance of commercial fish species: megrim
(Lepidorhombus whiffiagonis) in the northern North Sea”, in Marine Policy 2014, 45,
228-239.
Work from Chapter 3 was published jointly with Dr C. H. Angus (NAFC Marine
Centre, Shetland) and Dr C. T. Marshall (University of Aberdeen, Aberdeen) in “Spatial
variation in life history characteristics of common megrim (Lepidorhombus
whiffiagonis) on the Northern Shelf”, Journal of Sea Research 2013, 75, 62-68.
Data collected during work from Chapter 3 was published in “A rare occurrence of
reversal in the common megrim, Lepidorhombus whiffiagonis (Pleuronectiformes:
3
Scophthalmidae), in the northern North Sea”, Journal of Fish Biology 2013, 83, 691-
694.
Work from Chapter 5 was published jointly with Dr C. H. Angus (NAFC Marine
Centre, Shetland), Dr Ian R. Cleasby (NAFC Marine Centre, Shetland) and Dr C. T.
Marshall (University of Aberdeen, Aberdeen) in “The contribution of quota to the
discards problem: a case study on the complexity of common megrim Lepidorhombus
whiffiagonis discarding in the northern North Sea”, ICES Journal of Marine Science
2014, In Press.
Paul Macdonald
4
ABSTRACT
Prior to 2010, megrim in the northern North Sea was not considered in the annual stock
assessment for the species on the Northern Shelf. The underlying aim of this study was
to fill some of the current knowledge gaps in megrim biology and ecology in the
northern North Sea, providing improved scientific information that is intended to assist
in the development of an informed assessment of the stock in future years.
In recent years, greater utilisation of fishers’ knowledge has been advocated as a
potentially valuable source of ecological data in the assessment and management
process. In this study, changes in the distribution and relative abundance of common
megrim Lepidorhombus whiffiagonis in the North Sea were investigated by comparing
three data sources: fishers’ knowledge collected through a structured questionnaire; a
vessel’s haul-by-haul catch data from the personal diaries of a single skipper over a 10-
year time-series, and catch rates from fishery-independent surveys (IBTS Q1 and Q3).
Trends in the distribution and relative abundance of megrim were broadly comparable
between the three data sources. Results suggest that, in the northern North Sea, fishers’
knowledge and catch data can provide valid data sources which can contribute to the
assessment and management process. A structured approach consisting of a formal
agreement, full transparency and commitment between all stakeholders is needed to
provide and utilize the necessary data required to provide the most effective and
inclusive approach to resource management.
Management unit recommendations for megrim on the Northern Shelf have varied in
recent years, primarily due to a lack of biological and fishery data. A number of life
history characteristics of the common megrim Lepidorhombus whiffiagonis (Walbaum)
5
were compared between the northern North Sea and Rockall, the latitudinal extremes of
the species’ distribution on the Northern Shelf. Reproductive timing, sex ratio, maturity
and growth were different between the two study areas. Reproductive timing in the
northern North Sea was more protracted than at Rockall and other areas. There were
differences in sex ratio between the study areas and female megrim in the northern
North Sea exhibited different growth rates and larger size at maturity than at Rockall.
The results support the recent changes to the definition of the Northern Shelf stocks
which recommend that the northern North Sea be treated separately to Rockall.
An estimation of the potential and relative fecundity of L. whiffiagonis was presented
for the first time. Potential fecundity was relatively high, increasing considerably more
per cm length than that of similarly sized flatfishes in the North Atlantic. L. whiffiagonis
was also found to have a considerably different potential fecundity to L. boscii,
suggesting that changes in the current management approach are required if
reproductive potential is to be considered for Lepidorhombus species.
The stock structure of megrim on the Northern Shelf has not previously been
investigated in great detail. Genetic analyses of adult megrims captured on the Northern
Shelf were used to determine whether there was evidence of separate populations on the
northern Shelf, the geographic distributions of any separate populations and whether the
evidence from this genetic study supports the management units implemented in 2011.
Results suggest that a west-east spatial genetic differentiation of megrim occurs across
the Northern Shelf. However, despite this, there are no absolute barriers between the
areas and migrants occur across the region. This study provides the first genetic
comparison of megrim populations across the Northern Shelf.
6
From the early 2000s discarding and high-grading of megrim in the northern North Sea
have been ubiquitous, primarily in response to what fishermen perceived as restrictive
quotas. Market-driven discarding is also common as the soft flesh of megrim bruises
relatively easily in the trawl cod-end, reducing its commercial value. Temporal variation
in megrim discarding in the mixed demersal fishery in the northern North Sea prior to,
and following recent quota increases was investigated. Furthermore, logistic regression
models were applied to investigate the effects of a range of explanatory factors on the
probability of individual fish being discarded. Results indicate that discarding has
declined from an average of 54% of the total catch in 2009 to 20% in 2012. The
decrease in overall discards was primarily as a result of a decrease in the proportion of
small discards from 0.39 (± 0.02 s.e.) in 2009 to 0.10 (± 0.01s.e.) in 2012. Model
outputs also suggest that the likelihood of a fish being discarded decreases significantly
(P<0.001) with increasing quota. The current megrim TAC does little to regulate fishing
mortality and serves only to regulate landings. Additionally, the proposed reform of the
CFP, including the move towards a discards ban and the implementation of maximum
sustainable yield, raises a number of concerns that need to be addressed if the northern
North Sea mixed demersal fishery is to be managed sustainably and remain
economically viable in the future.

7
ACKNOWLEDGEMENTS
I would like to thank:
My supervisors Dr C. Tara Marshall and Dr Chevonne H. Angus for their guidance
throughout the duration of this project. I also thank Prof. David Gray and Dr Martin
Robinson for supporting this research.
NAFC Marine Centre, Seafish, Shetland Islands Council and the Scottish Fishermen’s
Trust for funding this work. The EU COST action FRESH for providing funding to
allow me to undertake fish fecundity training in Vigo, Spain.
Numerous staff at NAFC Marine Centre for assisting in the collection and processing of
biological data. Special thanks are due to Leanna Henderson for reading what seemed
like an endless supply of otoliths.
Numerous staff at Marine Scotland, including Kenny Coull, Barry O’Neill, Keith
Summerbell, Jim Mair and Craig Davis, for providing assistance and access to research
vessels for sampling.
Dr Ian Cleasby and Dr Alan Badroun for guidance and numerous discussions on
statistical methodology.
Dr Fran Saborido-Rey and research and technical staff at the Institute of Marine
Research, Vigo for their scientific expertise and guidance and for making my visit to
Vigo possible.
All of the members of the Shetland Fishermen’s Association who provided access to
vessels and assisted in the collection of fishery data.
My wonderful wife Vikki and our two children David and Naomi who cheerfully put up
with my long absences at sea to collect data and supported me throughout this study.
This thesis is dedicated in loving memory of my mother Murdina Macdonald (1949-
1998) who encouraged me to get ‘off the deck’ and into the lab.
8
Table of Contents
DECLARATION………………….……..………….….………………………………..2
ABSTRACT………………………….……….…………………………………………4
ACKNOWLDEGEMENTS……….…………..………………………..………………..7
CHAPTER 1 .................................................................................................................. 11 1.1 Management of fish stocks............................................................................................................. 12
1.1.1 Management of fish stocks in EU waters................................................................................ 13 1.1.2 Assessing fish stocks in EU waters ......................................................................................... 14
1.2 Megrim fishery & management .................................................................................................... 18 1.2.1 Megrim resource management ................................................................................................ 19 1.2.2 Management of megrim in the northern North Sea ................................................................ 22 1.2.3 Trends in landings in the northern North Sea ......................................................................... 24
1.3 Current knowledge ......................................................................................................................... 27 1.4 Aims of the study ............................................................................................................................ 30
CHAPTER 2 .................................................................................................................. 34 2.1 Introduction .................................................................................................................................... 35 2.2 Materials & methods ...................................................................................................................... 39
2.2.1 Fishers’ knowledge questionnaire........................................................................................... 41 2.2.2 Fisher’s catch data .................................................................................................................. 43 2.2.3 NSIBTS Survey data ............................................................................................................... 44
2.3 Results ............................................................................................................................................. 48 2.3.1 Fishers’ knowledge questionnaire........................................................................................... 48 2.3.1 Fishers’ catch data .................................................................................................................. 53 2.3.2 Trends in survey data .............................................................................................................. 54 2.3.1 Comparison of survey and diary data ..................................................................................... 60
2.4 Discussion ........................................................................................................................................ 64 2.5 Conclusions ..................................................................................................................................... 73
CHAPTER 3 .................................................................................................................. 74 3.1 Introduction .................................................................................................................................... 75 3.2 Materials & Methods ..................................................................................................................... 79
3.2.1 Sampling ................................................................................................................................. 79 3.2.1 Spawning pattern .................................................................................................................... 80 3.2.1 Sex ratio .................................................................................................................................. 84 3.2.2 Maturity .................................................................................................................................. 85 3.2.3 Growth .................................................................................................................................... 86
3.3 Results ............................................................................................................................................. 87 3.3.1 Spawning pattern .................................................................................................................... 87 3.3.1 Sex ratio .................................................................................................................................. 88 3.3.1 Maturity .................................................................................................................................. 91 3.3.1 Growth .................................................................................................................................... 94
3.4 Discussion ........................................................................................................................................ 97 3.5 Conclusions ................................................................................................................................... 103
CHAPTER 4 ................................................................................................................ 104 4.1 Introduction .................................................................................................................................. 105 4.2 Materials & methods .................................................................................................................... 108
4.2.1 Sample collection .................................................................................................................. 108 4.2.2 Maturity stage determination ................................................................................................ 108 4.2.3 L. whiffiagonis fecundity estimation ..................................................................................... 109
9
4.2.4 Reproductive potential of L. whiffiagonis relative to North Atlantic flatfish........................ 113 4.3 Results ........................................................................................................................................... 114
4.3.1 Fecundity of L. whiffiagonis ................................................................................................. 114 4.3.1 Fecundity of L. whiffiagonis relative to North Atlantic flatfish ............................................ 118
4.4 Discussion ...................................................................................................................................... 125 4.5 Conclusions ................................................................................................................................... 131
CHAPTER 5 ................................................................................................................ 132 5.1 Introduction .................................................................................................................................. 133 5.2 Materials & methods .................................................................................................................... 136
5.2.1 Genetic analyses ................................................................................................................... 137 5.2.2 Statistical analyses ................................................................................................................ 140
5.3 Results ........................................................................................................................................... 142 5.3.1 Mitochondrial D-loop ........................................................................................................... 142 5.3.1 Microsatellites....................................................................................................................... 144 5.3.1 Population structuring ........................................................................................................... 146
5.4 Discussion ...................................................................................................................................... 153 5.5 Conclusions ................................................................................................................................... 156
CHAPTER 6 ................................................................................................................ 158 6.1 Introduction .................................................................................................................................. 159 6.2 Materials & methods .................................................................................................................... 163
6.2.1 Recent changes in megrim TAC ........................................................................................... 163 6.2.1 Observer sampling ................................................................................................................ 164 6.2.1 Data analysis ......................................................................................................................... 165
6.3 Results ........................................................................................................................................... 170 6.3.1 Temporal variation in discarding .......................................................................................... 170 6.3.1 Logistic regression models ................................................................................................... 173
6.4 Discussion ...................................................................................................................................... 183 6.5 Conclusions ................................................................................................................................... 189
CHAPTER 7 ................................................................................................................ 190 7.1 Introduction .................................................................................................................................. 191 7.2 Ecological implications ................................................................................................................ 192 7.3 Management implications ............................................................................................................ 193 7.4 Limitations of the study ............................................................................................................... 196 7.5 Future work .................................................................................................................................. 198
REFERENCES ............................................................................................................ 200
APPENDIX 1: Macdonald, P., Angus, C. H., and Marshall, C. T., 2013. Spatial
variation in life history characteristics of common megrim
(Lepidorhombus whiffiagonis) on the Northern Shelf”, Journal of Sea
Research, 75: 62-68.
APPENDIX 2: Macdonald, P., 2013. A rare occurrence of reversal in the common
megrim, Lepidorhombus whiffiagonis (Pleuronectiformes:
Scophthalmidae), in the northern North Sea. Journal of Fish Biology,
83: 691-694.
APPENDIX 3: Macdonald, P., Angus, C. H., Cleasby, I. R. and Marshall, C. T., 2014.
Fishers’ knowledge as an indicator of spatial and temporal trends in
abundance of commercial fish species: megrim (Lepidorhombus
whiffiagonis) in the northern North Sea. Marine Policy, 45: 228-239.

10
APPENDIX 4: Macdonald, P., Angus, C. H., Cleasby, I. R. and Marshall, C. T., 2014.
The contribution of quota to the discards problem: a case study on the
complexity of common megrim Lepidorhombus whiffiagonis discarding
in the northern North Sea. ICES Journal of Marine Science, In Press.

11
CHAPTER 1
GENERAL INTRODUCTION
12
1.1 Management of fish stocks
Jennings et al. (2001) suggest that the objectives of fisheries management can be
grouped into four broad categories; biological, economic, social and political.
Economic, social and political objectives of resource use can often be conflicting e.g.
ensuring biomass yield is sustainable while striving to maximise economic yield and
increase employment (Hilborn, 2007). This can result in weaknesses in fisheries
management and subsequent overexploitation of stocks. Equally, limitations in the
understanding of the biological characteristics of commercial fisheries can lead to
mismanagement, overexploitation and an ensuing collapse of stocks.
A primary aim of fisheries management is to attain the maximum sustainable yield
(MSY) of a population, thus allowing a stock to be harvested to its full potential while
ensuring it does not collapse. In order to achieve an estimation of MSY, a
comprehensive understanding of the population dynamics of the stock is required (Zabel
et al., 2003). Fish populations are affected by three dynamic functions: recruitment,
individual growth rate and mortality (Jennings et al., 2001). Recruitment refers to the
number of individuals entering the exploitable population. The measurement of the size
of an individual in relation to age is important if a population or spawning stock
biomass estimate is to be made. Mortality, which can be divided into natural mortality
(including old age and predation) and fishing mortality, refers to the number of
individuals being removed from the population. With an understanding of these key
elements, biomass estimates can be made. Over time the harvestable surplus, or the
biomass that can be removed from the population while maintaining the long term
stability of the population, can be determined. This in turn allows managers to make
13
informed decisions and set realistic total allowable catch (TAC) limits that are
consistent with the overarching goal of achieving MSY (Churchill and Owen, 2010).
1.1.1 Management of fish stocks in EU waters
The mechanism by which fish stocks in EU waters are managed is known as the
Common Fisheries Policy (CFP). It has been widely accused of having failed, in its
present state, to achieve effective management of fisheries (Churchill and Owen, 2010).
In 2009 the Scottish Government stated that the CFP has been over-extended beyond its
original limits and has failed on a number of issues including supporting biological and
ecological sustainability, matching fishing capacity with fishing opportunities,
establishing fair and clear levels of compliance across the EU and engaging with
industry to improve fisheries policies (Anon, 2009b). Despite this, Fernandes and Cook
(2013) reported that the majority of assessed stocks in the northeast Atlantic are now
being fished sustainably. They demonstrate that, in many cases, increasing biomass
corresponds with decreasing fishing effort, a measure introduced within the last reform
of the CFP in 2002. Furthermore, Cardinale et al. (2011) argue that key stocks,
accounting for more than 90% of total allowable catches of commercial species, are
being exploited sustainably. They further argue that fishing mortality for many stocks
has declined in the past 10 years. In 2009 the EU commission launched a review on the
way fisheries in EU waters are managed.
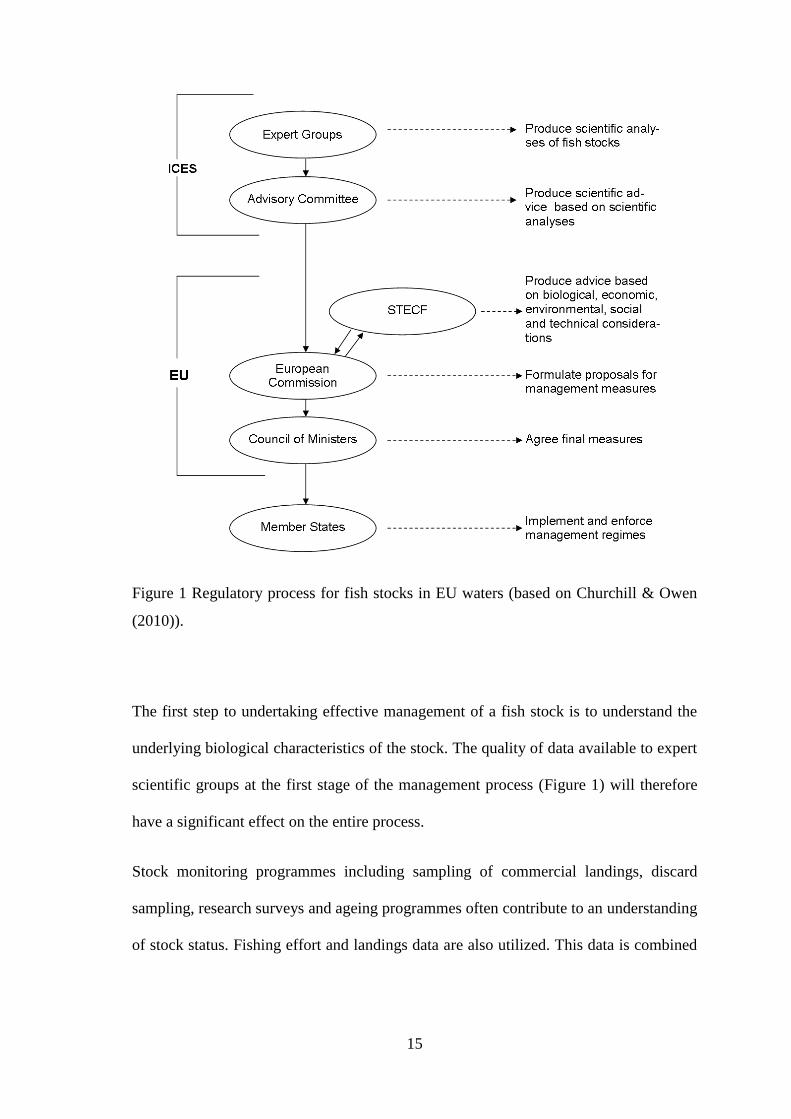
A basic overview of the regulatory process is outlined in (Figure 1). The process
originates with advice from expert working and study groups within the
intergovernmental science organisation ICES (International Council for the Exploration
of the Seas). One of the principal aims of the expert groups is to provide unbiased and
non-political advice on the status of the exploitable resources in EU waters. These
14
scientific analyses then undertake a peer review process through the Advisory
Committee (ACOM). Advice on finfish and shellfish stocks in EU waters are then
provided to the European Commission where, following consultation with the
Scientific, Technical and Economic Committee for Fisheries (STECF), measures are
recommended with the aim of maintaining the long term sustainable exploitation of
stocks. Draft regulations are then put before the Council of Ministers for all
participating nations to agree to the measures. At this stage a number of other lobbying
organisations as well as countries out with the EU with an interest in specific stocks also
contribute to the process. Regional Advisory Councils (RACs), first created in 2004, are
stakeholder–led organisations that also engage with the Commission and other parties.
They provide fisheries managers with an insight into issues affecting their respective
fleets and meet together regularly to argue out differences and discuss common interests
and problems (Anon, 2009c). Individual member states are responsible for the
implementation and enforcement of regulations within their jurisdiction.
1.1.2 Assessing fish stocks in EU waters
ICES provide advice on fish stocks in accordance with a number of international
policies and agreements including an ecosystem approach to management of the marine
environment (FAO, 2001), a precautionary approach to resource management (UN,
1995) and an MSY approach to the use of marine resources (UN, 2002). The advice is
therefore formulated and presented in the context of ensuring the long-term viability of
fish stocks while achieving the highest possible sustainable yield (ICES, 2013d). In
2013 ICES provided scientific advice on the status of 390 stocks (including both fish
and shellfish). The quality and type of advice provided for each stock varies, often
depending on the data available.
15
Figure 1 Regulatory process for fish stocks in EU waters (based on Churchill & Owen
(2010)).
The first step to undertaking effective management of a fish stock is to understand the
underlying biological characteristics of the stock. The quality of data available to expert
scientific groups at the first stage of the management process (Figure 1) will therefore
have a significant effect on the entire process.
Stock monitoring programmes including sampling of commercial landings, discard
sampling, research surveys and ageing programmes often contribute to an understanding
of stock status. Fishing effort and landings data are also utilized. This data is combined
16
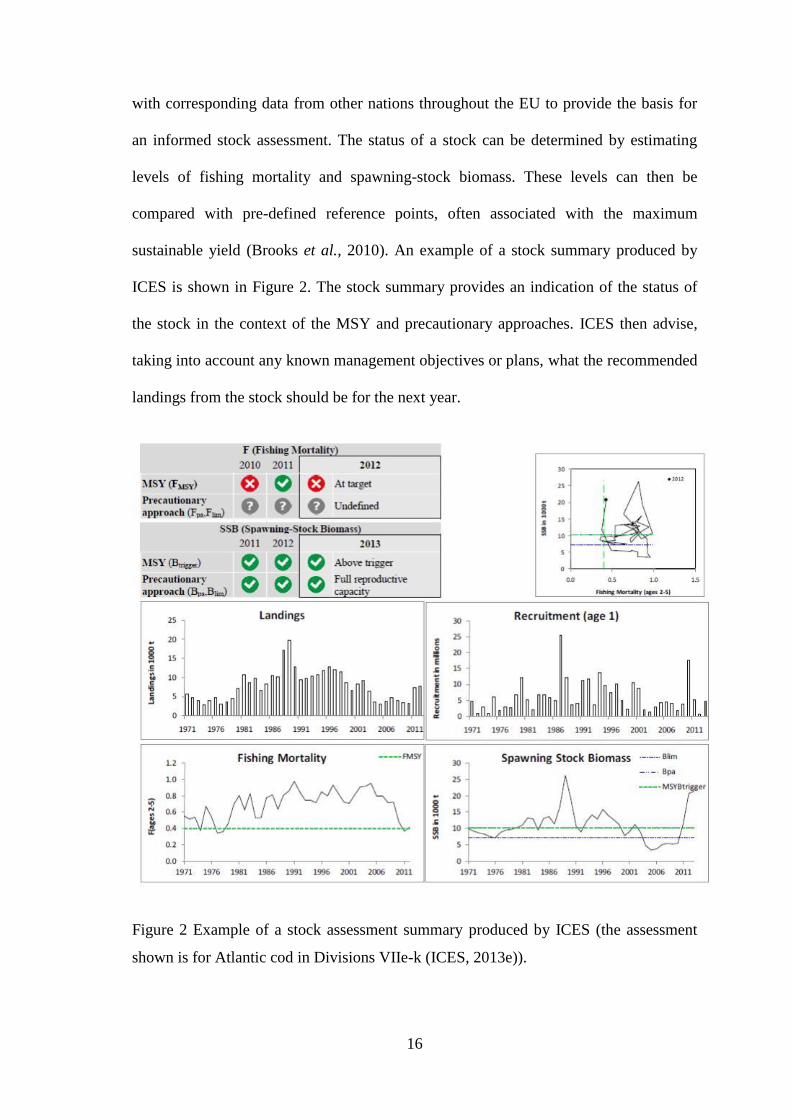
with corresponding data from other nations throughout the EU to provide the basis for
an informed stock assessment. The status of a stock can be determined by estimating
levels of fishing mortality and spawning-stock biomass. These levels can then be
compared with pre-defined reference points, often associated with the maximum
sustainable yield (Brooks et al., 2010). An example of a stock summary produced by
ICES is shown in Figure 2. The stock summary provides an indication of the status of
the stock in the context of the MSY and precautionary approaches. ICES then advise,
taking into account any known management objectives or plans, what the recommended
landings from the stock should be for the next year.
Figure 2 Example of a stock assessment summary produced by ICES (the assessment
shown is for Atlantic cod in Divisions VIIe-k (ICES, 2013e)).
17
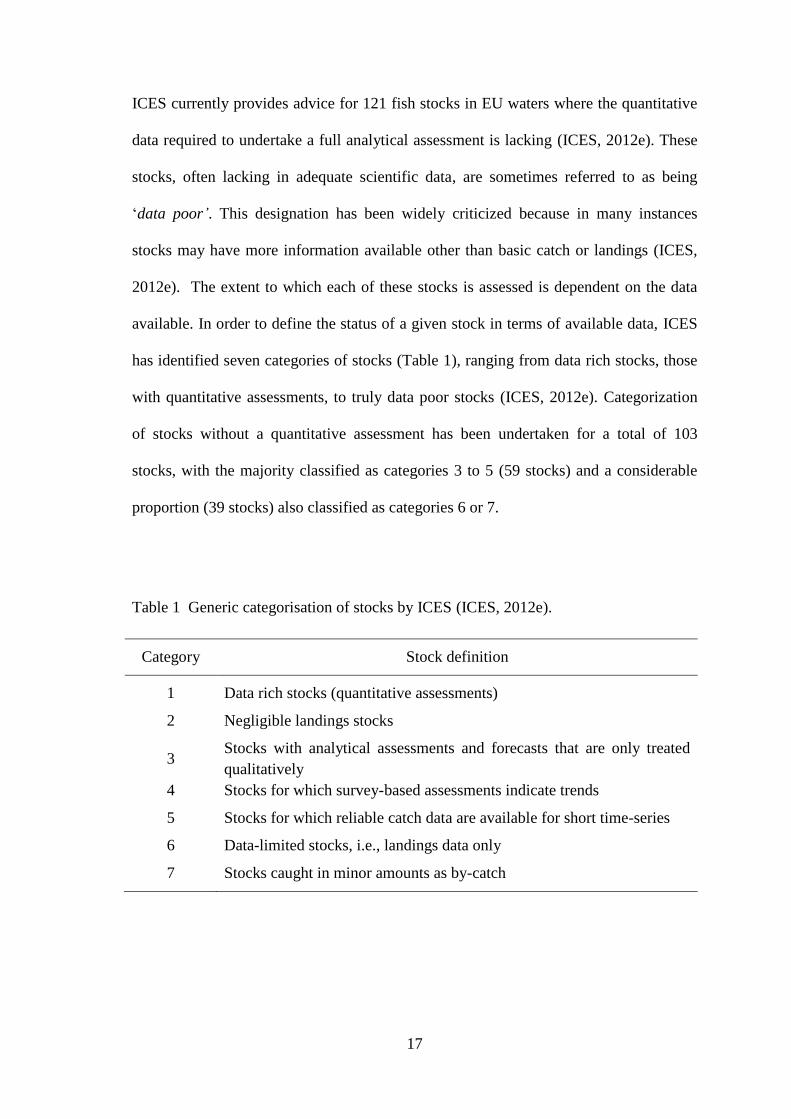
ICES currently provides advice for 121 fish stocks in EU waters where the quantitative
data required to undertake a full analytical assessment is lacking (ICES, 2012e). These
stocks, often lacking in adequate scientific data, are sometimes referred to as being
‘data poor’. This designation has been widely criticized because in many instances
stocks may have more information available other than basic catch or landings (ICES,
2012e). The extent to which each of these stocks is assessed is dependent on the data
available. In order to define the status of a given stock in terms of available data, ICES
has identified seven categories of stocks (Table 1), ranging from data rich stocks, those
with quantitative assessments, to truly data poor stocks (ICES, 2012e). Categorization
of stocks without a quantitative assessment has been undertaken for a total of 103
stocks, with the majority classified as categories 3 to 5 (59 stocks) and a considerable
proportion (39 stocks) also classified as categories 6 or 7.
Table 1 Generic categorisation of stocks by ICES (ICES, 2012e).
Category Stock definition
1 Data rich stocks (quantitative assessments)
2 Negligible landings stocks
3 Stocks with analytical assessments and forecasts that are only treated
qualitatively
4 Stocks for which survey-based assessments indicate trends
5 Stocks for which reliable catch data are available for short time-series
6 Data-limited stocks, i.e., landings data only
7 Stocks caught in minor amounts as by-catch
18
In Scottish waters, 14 of the 20 most important commercial whitefish species by value
have no biological reference points defined and no analytical assessment (Napier,
2012). These include high value species such as anglerfish (Lophius spp.), ling (Molva
molva), lemon sole (Microstomus kitt) and halibut (Hippoglossus hippoglossus). Despite
this, in many instances a lack of data is not what precludes an analytical assessment but
rather, in the case of anglerfish, issues such as uncertainly over age estimation/growth
parameters (ICES, 2013f). For species such as lemon sole, development of methods to
derive quantitative advice for data-limited stocks (ICES, 2013b) currently preclude an
analytical assessment. Megrim, the focus species of this study, is the second most
valuable species landed by Scottish vessels (worth £6.4 million per year) that, until
recently, was lacking reference points and an analytical assessment (ICES, 2012f).
1.2 Megrim fishery & management
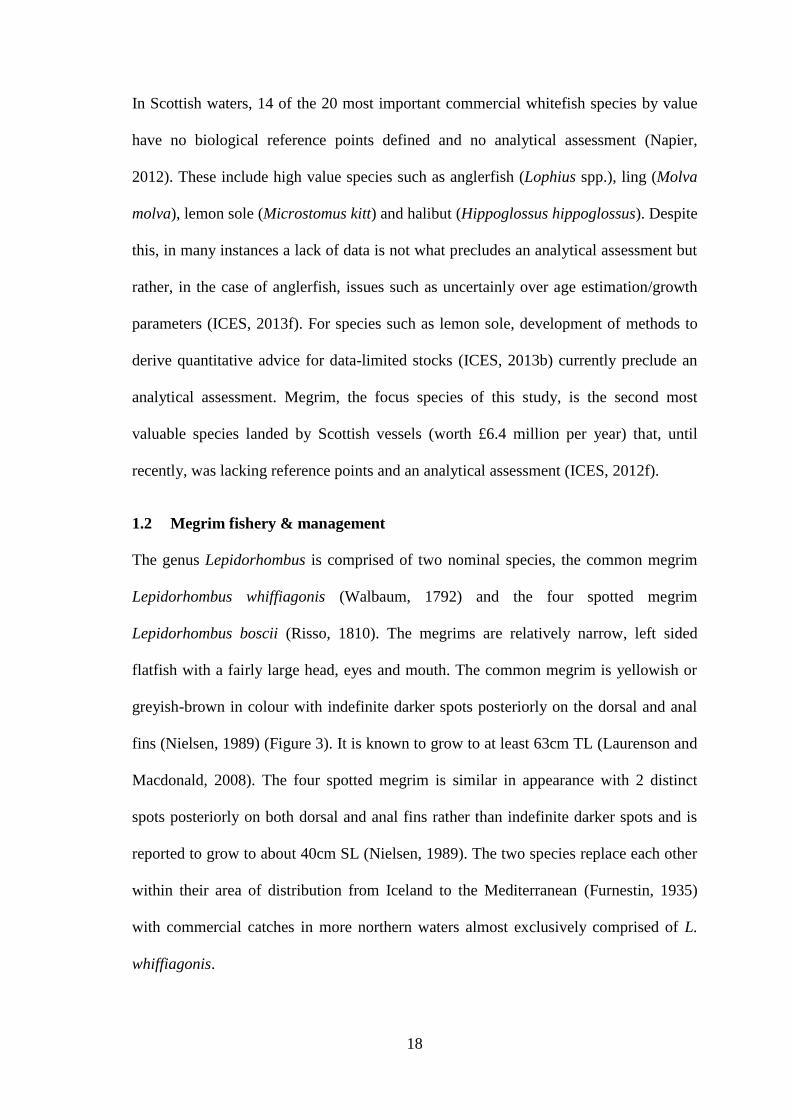
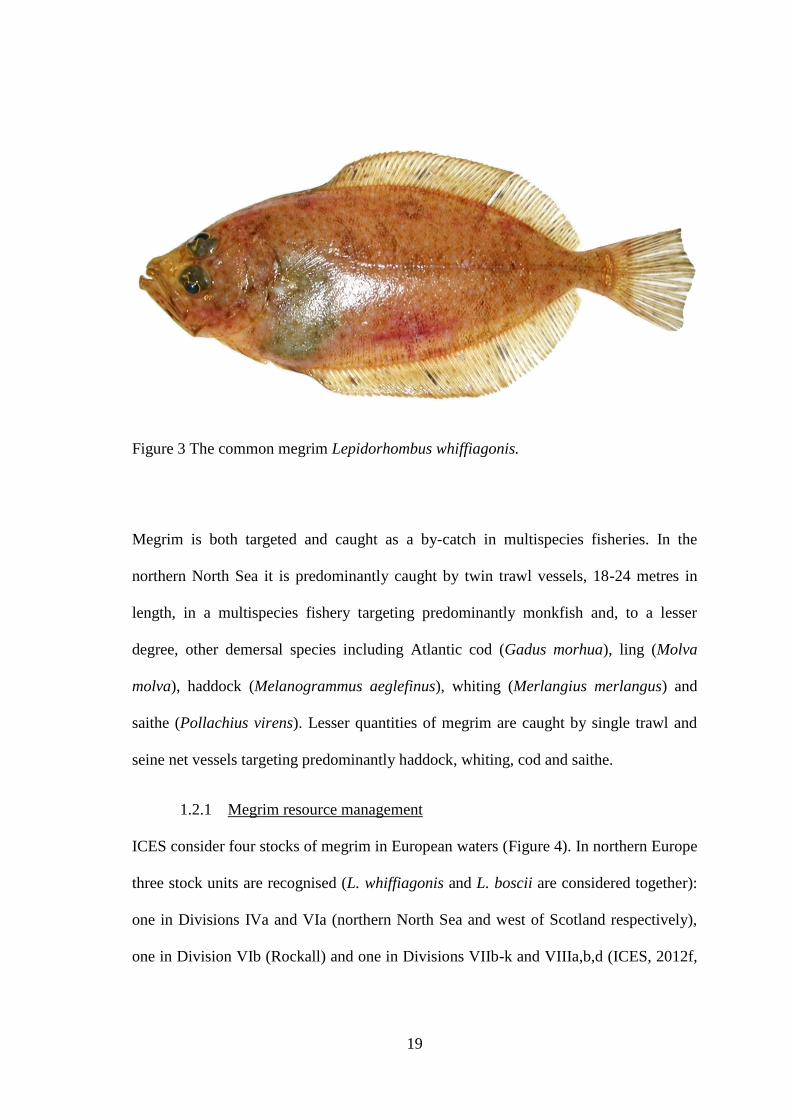
The genus Lepidorhombus is comprised of two nominal species, the common megrim
Lepidorhombus whiffiagonis (Walbaum, 1792) and the four spotted megrim
Lepidorhombus boscii (Risso, 1810). The megrims are relatively narrow, left sided
flatfish with a fairly large head, eyes and mouth. The common megrim is yellowish or
greyish-brown in colour with indefinite darker spots posteriorly on the dorsal and anal
fins (Nielsen, 1989) (Figure 3). It is known to grow to at least 63cm TL (Laurenson and
Macdonald, 2008). The four spotted megrim is similar in appearance with 2 distinct
spots posteriorly on both dorsal and anal fins rather than indefinite darker spots and is
reported to grow to about 40cm SL (Nielsen, 1989). The two species replace each other
within their area of distribution from Iceland to the Mediterranean (Furnestin, 1935)
with commercial catches in more northern waters almost exclusively comprised of L.
whiffiagonis.
19
Figure 3 The common megrim Lepidorhombus whiffiagonis.
Megrim is both targeted and caught as a by-catch in multispecies fisheries. In the
northern North Sea it is predominantly caught by twin trawl vessels, 18-24 metres in
length, in a multispecies fishery targeting predominantly monkfish and, to a lesser
degree, other demersal species including Atlantic cod (Gadus morhua), ling (Molva
molva), haddock (Melanogrammus aeglefinus), whiting (Merlangius merlangus) and
saithe (Pollachius virens). Lesser quantities of megrim are caught by single trawl and
seine net vessels targeting predominantly haddock, whiting, cod and saithe.
1.2.1 Megrim resource management
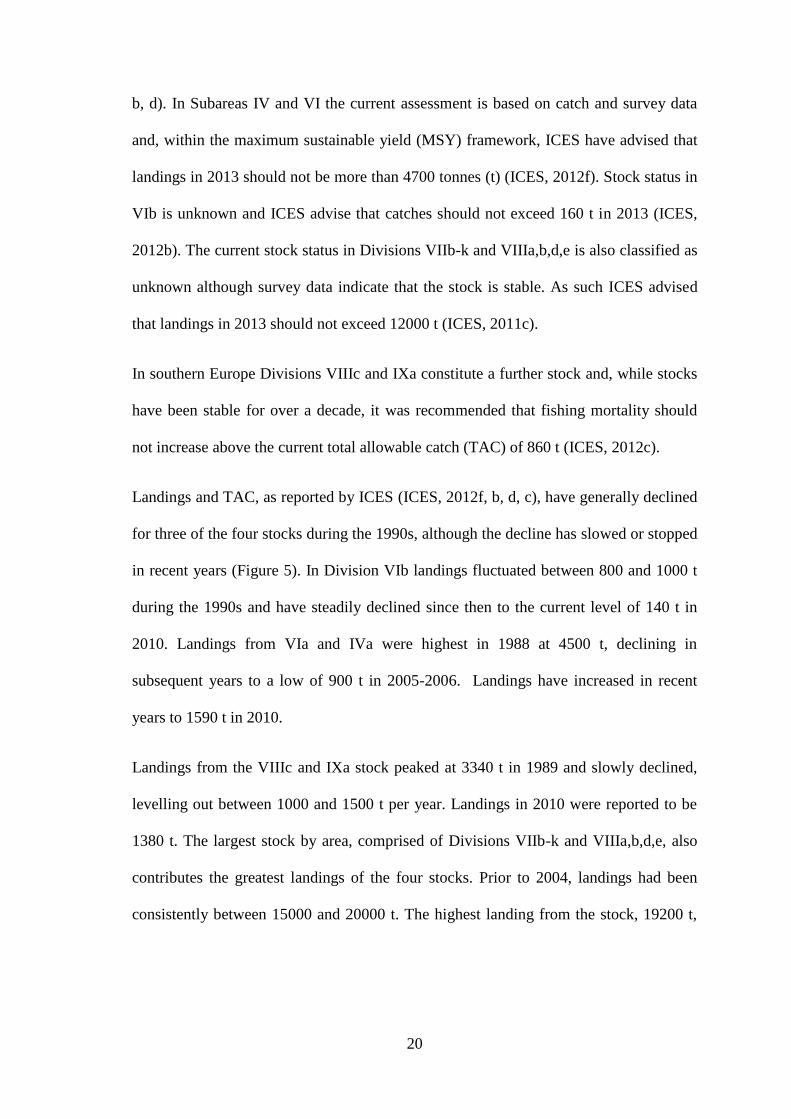
ICES consider four stocks of megrim in European waters (Figure 4). In northern Europe
three stock units are recognised (L. whiffiagonis and L. boscii are considered together):
one in Divisions IVa and VIa (northern North Sea and west of Scotland respectively),
one in Division VIb (Rockall) and one in Divisions VIIb-k and VIIIa,b,d (ICES, 2012f,
20
b, d). In Subareas IV and VI the current assessment is based on catch and survey data
and, within the maximum sustainable yield (MSY) framework, ICES have advised that
landings in 2013 should not be more than 4700 tonnes (t) (ICES, 2012f). Stock status in
VIb is unknown and ICES advise that catches should not exceed 160 t in 2013 (ICES,
2012b). The current stock status in Divisions VIIb-k and VIIIa,b,d,e is also classified as
unknown although survey data indicate that the stock is stable. As such ICES advised
that landings in 2013 should not exceed 12000 t (ICES, 2011c).
In southern Europe Divisions VIIIc and IXa constitute a further stock and, while stocks
have been stable for over a decade, it was recommended that fishing mortality should
not increase above the current total allowable catch (TAC) of 860 t (ICES, 2012c).
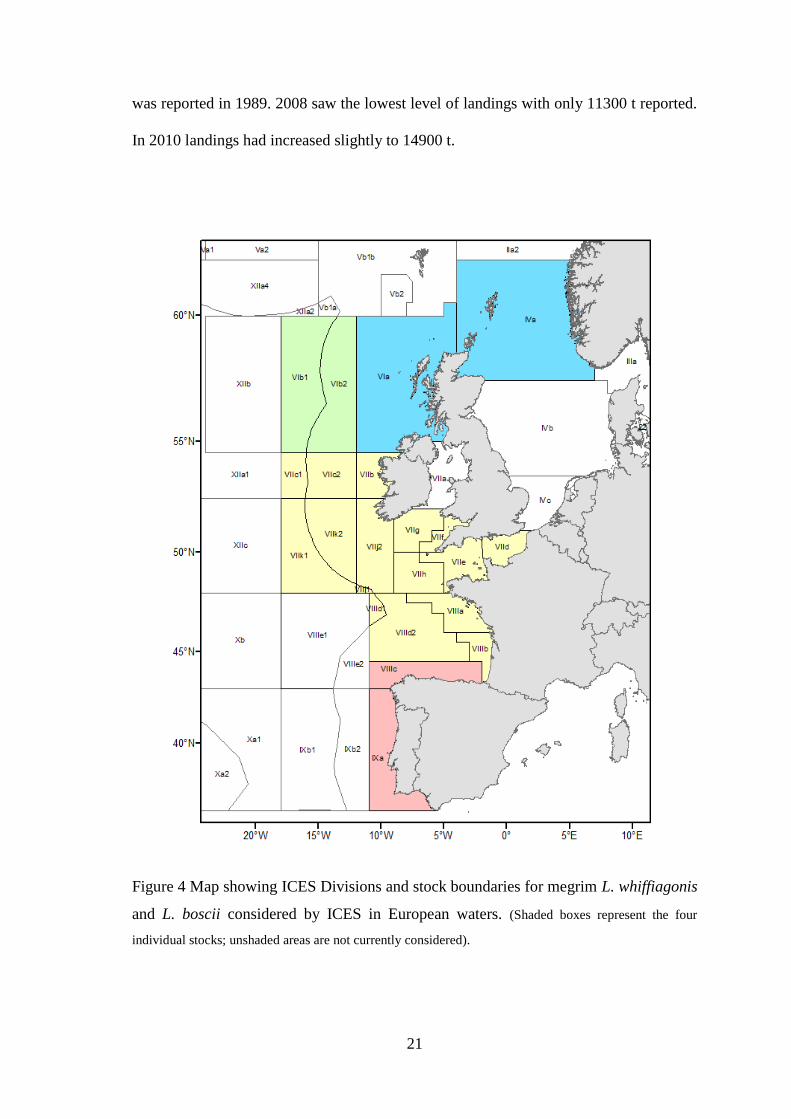
Landings and TAC, as reported by ICES (ICES, 2012f, b, d, c), have generally declined
for three of the four stocks during the 1990s, although the decline has slowed or stopped
in recent years (Figure 5). In Division VIb landings fluctuated between 800 and 1000 t
during the 1990s and have steadily declined since then to the current level of 140 t in
2010. Landings from VIa and IVa were highest in 1988 at 4500 t, declining in
subsequent years to a low of 900 t in 2005-2006. Landings have increased in recent
years to 1590 t in 2010.
Landings from the VIIIc and IXa stock peaked at 3340 t in 1989 and slowly declined,
levelling out between 1000 and 1500 t per year. Landings in 2010 were reported to be
1380 t. The largest stock by area, comprised of Divisions VIIb-k and VIIIa,b,d,e, also
contributes the greatest landings of the four stocks. Prior to 2004, landings had been
consistently between 15000 and 20000 t. The highest landing from the stock, 19200 t,
21
was reported in 1989. 2008 saw the lowest level of landings with only 11300 t reported.
In 2010 landings had increased slightly to 14900 t.
Figure 4 Map showing ICES Divisions and stock boundaries for megrim L. whiffiagonis
and L. boscii considered by ICES in European waters. (Shaded boxes represent the four
individual stocks; unshaded areas are not currently considered).
22
Figure 5 Trends in TAC, landings and ICES advice for megrim stocks considered by
ICES in European waters (ICES, 2012f, b, d, c). n.b. The graphs for IV and VI illustrate catch
and TAC data as provided by ICES and are not representative of current stock boundaries. Before 2011
ICES advice was provided for megrim in IV and VI combined and is not therefore included here. ICES
provide TAC and landings for VIa and VIb combined.
1.2.2 Management of megrim in the northern North Sea
Scientific advice for megrim on the Northern Shelf (northern North Sea, west of
Scotland and Rockall) has developed in recent years as more data has become available
and methodologies to utilize the data have developed. Prior to 1998 megrim in IVa was
not considered by ICES and no advice on TAC was provided. Between 1999 and 2008
TAC in IVa was set using average catches from previous years although no advice on
23
the status of the stock was available. Advice was provided for Rockall (VIb) and the
west of Scotland (VIa) during this period. In 2009 and 2010 qualitative advice was
produced for all three areas on the Northern Shelf (IVa, VIa and VIb) collectively,
primarily based on survey trends (ICES, 2010). ICES noted that advice on the status of
megrim in the northern North Sea (IVa) was provided for the first time in 2009, as
fishery independent data had become available for the area. ICES also noted that advice
was provided for northern North Sea (IVa) because the spatial distribution of landings
data and survey catches provide evidence to suggest that the megrim population is
contiguous between the northern North Sea (IVa) and west of Scotland (VIa) (ICES,
2009).
In 2011 management advice was updated further and megrim in the northern North Sea
(IVa) and west of Scotland (VIa) were considered together while Rockall (VIb) was
considered separately. This was due to a recommendation, following a benchmarking
exercise, that megrim in the northern North Sea (IVa) and west of Scotland (VIa)
comprised one continuous stock while megrim at Rockall (VIb) comprised a separate
stock (ICES, 2011d). Furthermore, quantitative management advice was produced by
ICES for the northern North Sea (IVa) and west of Scotland (VIa) stock for the first
time in 2011. The most recent stock assessment in 2013 recommends that following the
ICES MSY approach implies a fishing mortality at FMSY = 0.33, resulting in catches of
no more than 7000 tonnes in 2014 (ICES, 2013c). Based on this level of fishing
mortality there is a 1% probability of the stock biomass falling below sustainable levels.
Due to poor cohort tracking in recent years, a Bayesian state-space biomass dynamic
model (non-equilibrium surplus production method) utilizing indices from fishery-
independent surveys and landings and discard data is used to assess the stock (ICES,
24
2012f). Imprecise and missing age data currently prevents an age-based assessment of
the stock. ICES have recommended that, due to evidence of depth-dependent
differences in growth (Gerritsen et al., 2010), sampling for ages takes place across the
full distribution of the fishery (ICES, 2011d). Given the type and quality of data
currently available and utilized, ICES have classified megrim in IVa as a Category 3
stock (Table 1).
1.2.3 Trends in landings in the northern North Sea
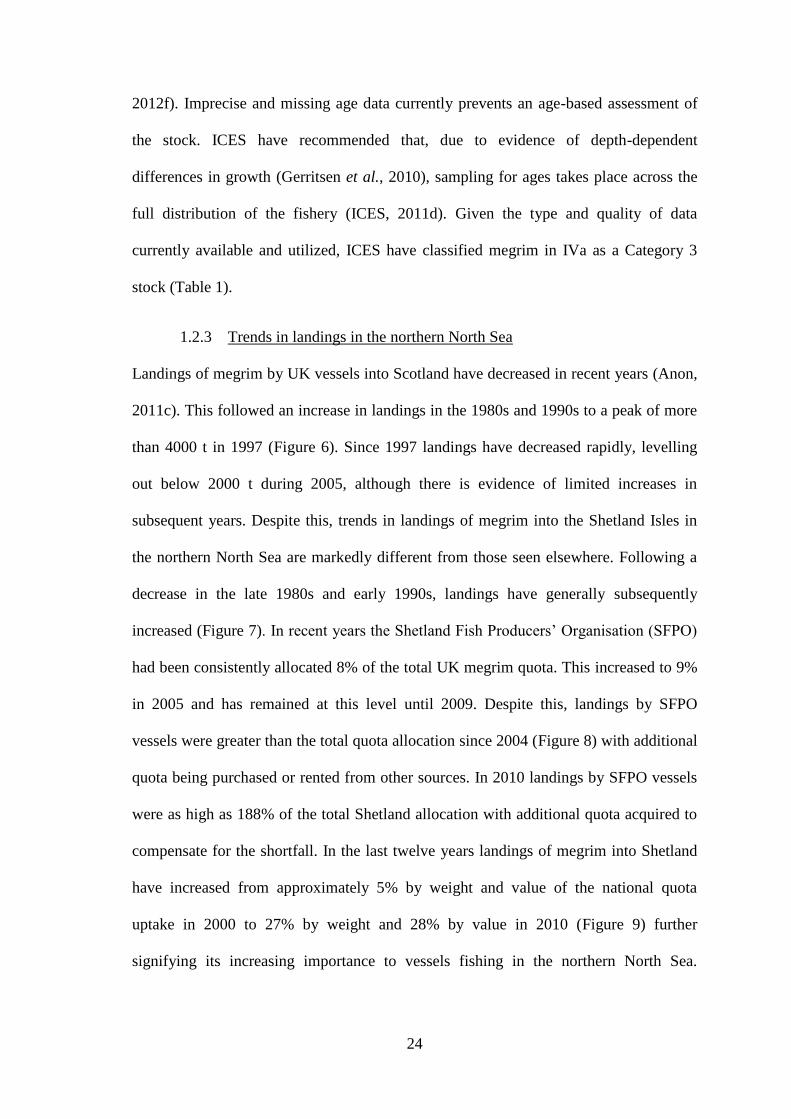
Landings of megrim by UK vessels into Scotland have decreased in recent years (Anon,
2011c). This followed an increase in landings in the 1980s and 1990s to a peak of more
than 4000 t in 1997 (Figure 6). Since 1997 landings have decreased rapidly, levelling
out below 2000 t during 2005, although there is evidence of limited increases in
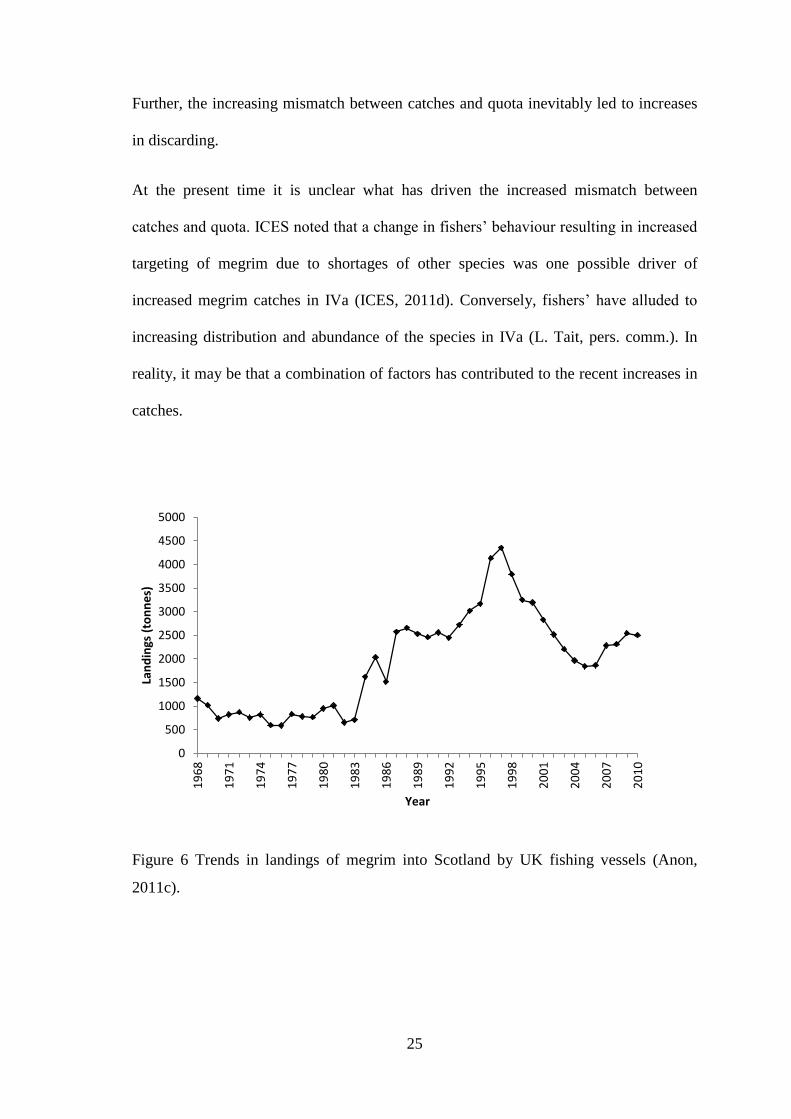
subsequent years. Despite this, trends in landings of megrim into the Shetland Isles in
the northern North Sea are markedly different from those seen elsewhere. Following a
decrease in the late 1980s and early 1990s, landings have generally subsequently
increased (Figure 7). In recent years the Shetland Fish Producers’ Organisation (SFPO)
had been consistently allocated 8% of the total UK megrim quota. This increased to 9%
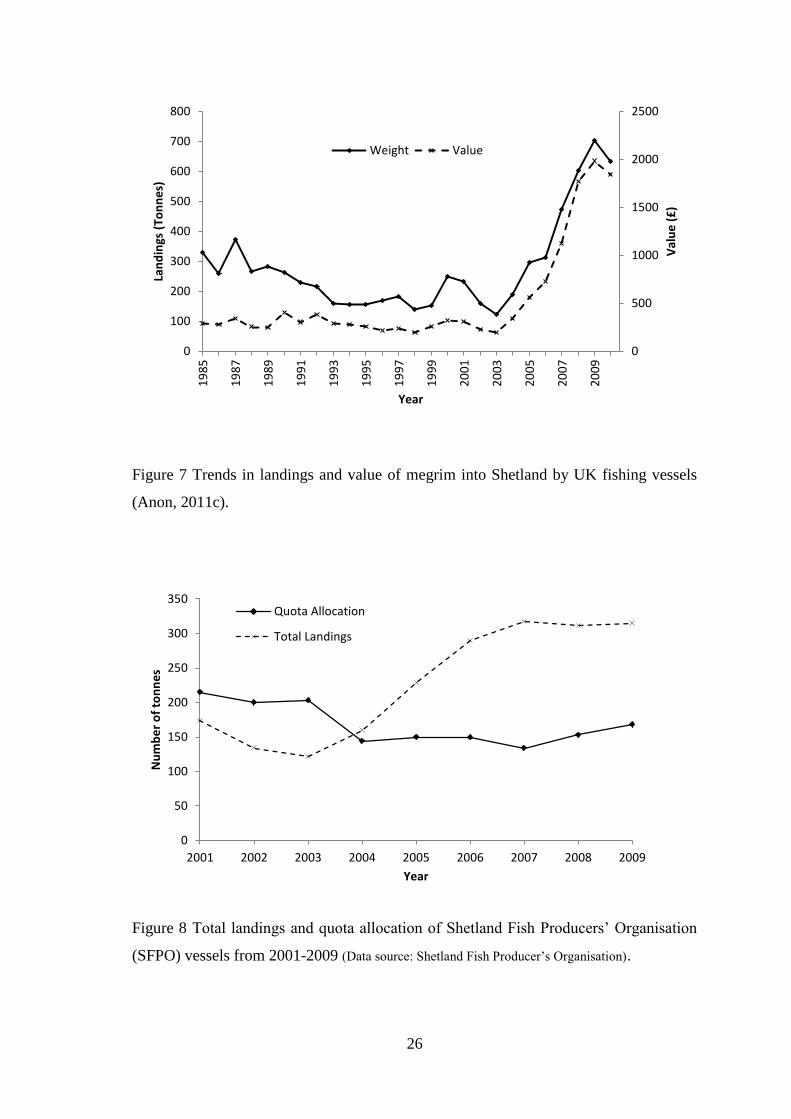
in 2005 and has remained at this level until 2009. Despite this, landings by SFPO
vessels were greater than the total quota allocation since 2004 (Figure 8) with additional
quota being purchased or rented from other sources. In 2010 landings by SFPO vessels
were as high as 188% of the total Shetland allocation with additional quota acquired to
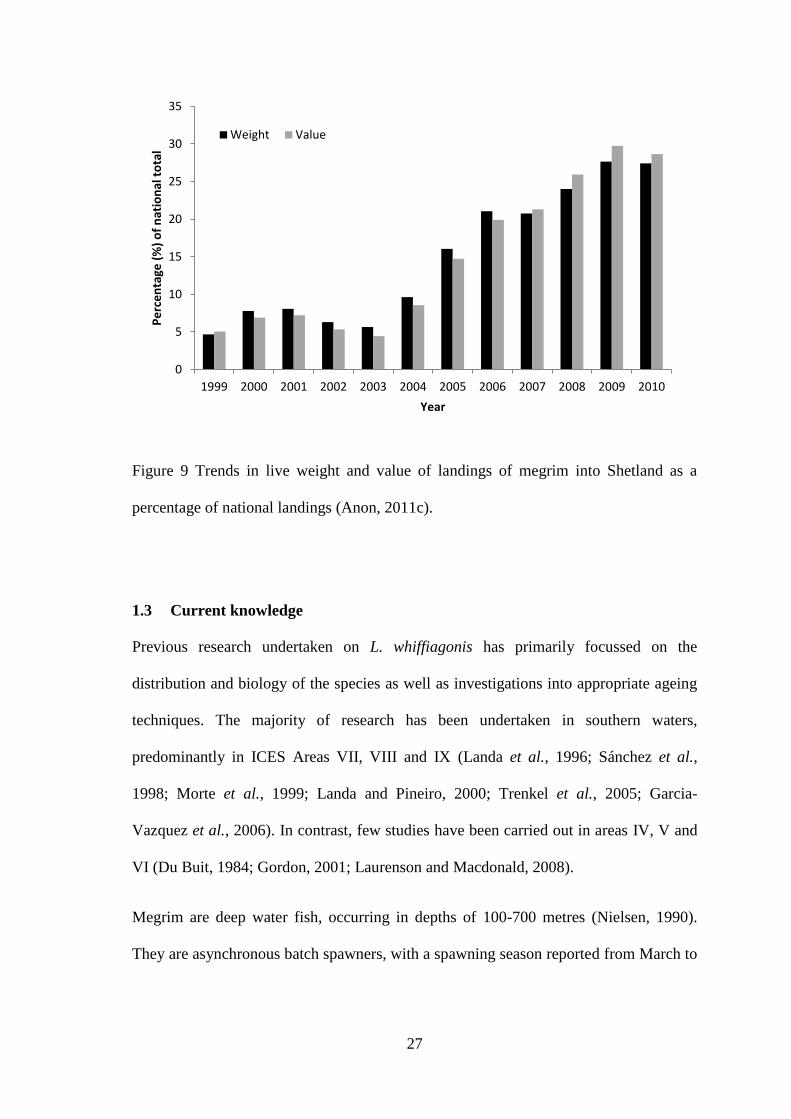
compensate for the shortfall. In the last twelve years landings of megrim into Shetland
have increased from approximately 5% by weight and value of the national quota
uptake in 2000 to 27% by weight and 28% by value in 2010 (Figure 9) further
signifying its increasing importance to vessels fishing in the northern North Sea.
25
Further, the increasing mismatch between catches and quota inevitably led to increases
in discarding.
At the present time it is unclear what has driven the increased mismatch between
catches and quota. ICES noted that a change in fishers’ behaviour resulting in increased
targeting of megrim due to shortages of other species was one possible driver of
increased megrim catches in IVa (ICES, 2011d). Conversely, fishers’ have alluded to
increasing distribution and abundance of the species in IVa (L. Tait, pers. comm.). In
reality, it may be that a combination of factors has contributed to the recent increases in
catches.
Figure 6 Trends in landings of megrim into Scotland by UK fishing vessels (Anon,
2011c).
0
500
1000
1500
2000
2500
3000
3500
4000
4500
5000
19
68
19
71
19
74
19
77
19
80
19
83
19
86
19
89
19
92
19
95
19
98
20
01
20
04
20
07
20
10
Lan
din
gs (
ton
ne
s)
Year
26
Figure 7 Trends in landings and value of megrim into Shetland by UK fishing vessels
(Anon, 2011c).
Figure 8 Total landings and quota allocation of Shetland Fish Producers’ Organisation
(SFPO) vessels from 2001-2009 (Data source: Shetland Fish Producer’s Organisation).
0
500
1000
1500
2000
2500
0
100
200
300
400
500
600
700
800
19
85
19
87
19
89
19
91
19
93
19
95
19
97
19
99
20
01
20
03
20
05
20
07
20
09
Val
ue
(£
)
Lan
din
gs (
Ton
ne
s)
Year
Weight Value
0
50
100
150
200
250
300
350
2001 2002 2003 2004 2005 2006 2007 2008 2009
Nu
mb
er
of
ton
ne
s
Year
Quota Allocation
Total Landings
27
Figure 9 Trends in live weight and value of landings of megrim into Shetland as a
percentage of national landings (Anon, 2011c).
1.3 Current knowledge
Previous research undertaken on L. whiffiagonis has primarily focussed on the
distribution and biology of the species as well as investigations into appropriate ageing
techniques. The majority of research has been undertaken in southern waters,
predominantly in ICES Areas VII, VIII and IX (Landa et al., 1996; Sánchez et al.,
1998; Morte et al., 1999; Landa and Pineiro, 2000; Trenkel et al., 2005; Garcia-
Vazquez et al., 2006). In contrast, few studies have been carried out in areas IV, V and
VI (Du Buit, 1984; Gordon, 2001; Laurenson and Macdonald, 2008).
Megrim are deep water fish, occurring in depths of 100-700 metres (Nielsen, 1990).
They are asynchronous batch spawners, with a spawning season reported from March to
0
5
10
15
20
25
30
35
1999 2000 2001 2002 2003 2004 2005 2006 2007 2008 2009 2010
Pe
rce
nta
ge (
%)
of
nat
ion
al t
ota
l
Year
Weight Value
28
April on the Northern Shelf (ICES Subareas IV and VI) (Gordon, 2001). There is a
significant difference in length at maturity between the sexes on the Northern shelf
(ICES Subarea IV and VI) (Gordon, 2001). There are suggestions that the timing of
spawning affects the vulnerability of megrims to trawl capture as Irish commercial fleet
landings data exhibit temporal trends with a peak in landings in May or June each year.
Juveniles are more stenobathic than adults (Sánchez et al., 1998) preferring to inhabit
depths between 150 and 280 metres (Landa et al., 1996). Poulard et al. (1991) found
greater numbers of females than males in depths up to 150m while there were greater
numbers of males in depths greater than 150m. Gerritsen et al. (2010) also noted that
female megrim dominated shallower catches west of Ireland with males more common
in deeper water. It has also been suggested that there may be seasonal migrations to
deeper waters (Gordon, 2001). Conversely, Sanchez et al. (1998) reported that there is
no evidence of geographical migrations.
Differences in growth rates have been noted between study areas. Landa et al. (1996)
reported that growth in area VIIIc was higher than other areas in VII and VIII.
Furthermore, Gerritsen et al. (2010) reported evidence of depth-dependent differences
in growth of megrim off the west coast of Ireland. A number of studies carried out
across the species’ range indicate that in all areas; 1) females attain higher length and
age than males; 2) the sex ratio is highly skewed towards females; 3) there is faster
growth in females than males (Landa et al., 1996; Gordon, 2001); and 4) from 4 years
on, males show higher mortality rates than females (Sánchez et al., 1998). These studies
report that there is consequently a predominance of females in the larger sized
individuals of the population across the species’ range (Sánchez et al., 1998; Gordon,
2001).
29
The main contributors to the diet are mysids, natantids and teleosts (Morte et al., 1999)
with the number of prey items per stomach decreasing from small to large fish while
average prey weight per stomach increases from small to large fish. Diet has also been
reported to change with growth (Morte et al., 1999). Trenkel et al (2005), studying
predator-prey relationships in the Celtic Sea, have suggested that megrims exhibit
seasonal and temporal patterns in prey selection.
Studies in the northern Spanish shelf waters (ICES Divisions VIIIc and IXa) indicate
that the main factor affecting abundance is recruitment strength (Sánchez et al., 1998),
with low levels of recruitment of L. whiffiagonis in the 1990s being the principal cause
of low numbers of this species in these waters. Gordon (2001) reported evidence of
density-dependent growth in megrim to the west of Scotland (VIa) and Ireland (VIIb).
A number of studies have been carried out considering appropriate ageing techniques
for megrim. Methods trialled include age estimation using dorsal rays (Anon, 1997) and
back-calculation using otoliths (Landa and Pineiro, 2000; Gordon, 2001). These studies
have shown that direct reading of otoliths is possibly the most simple and effective
method for accurate ageing. It was also noted that ageing was more straightforward in
smaller fish as annual hyaline rings were easily identifiable (Landa and Pineiro, 2000).
Larger fish were more difficult to age as a result of smaller distances between the rings.
Prior to the current study, knowledge of the biology, ecology and fishery of L.
whiffiagonis was limited on the Northern Shelf, and was especially lacking in the
northern North Sea. The increasing commercial importance of L. whiffiagonis in the
northern North Sea, coupled with a lack of knowledge on the biology, ecology and
fishery in the area, highlights the need for a focussed study to fill a number of
30
knowledge gaps that may assist with the assessment and management of the species in
the area.
1.4 Aims of the study
The primary focus area of the study was the northern North Sea, specifically ICES
Division IVa (Figure 10). The Shetland Isles, situated within Division IVa, are ideally
situated for the implementation of fisheries targeting the species in the rich and
abundant waters that surround them. In hydrographical terms, the northern North Sea is
a complex area where a number of significant oceanic forces compete to determine
conditions (Turrell et al., 1996). Along the edge of the continental slope, the slope
current provides an input of warm, saline, nutrient rich water to the west of the Orkney
and Shetland Islands (Maravelias, 1997). The east Shetland Atlantic inflow and Fair Isle
currents also contribute to the inflow of Atlantic water, with typical temperature values
around 12°C, into the northern North Sea (Turrell, 1992). As such, the waters around
Shetland accommodate a significant biomass of commercially important fish species
that contribute to a number of locally and nationally important fisheries.
Prior to 2010, megrim in the northern North Sea was not considered in the annual stock
assessment for the species on the Northern Shelf. The underlying aim of this study was
therefore to fill some of the current knowledge gaps in megrim biology and ecology in
the northern North Sea, providing improved scientific information that will assist in the
on-going assessment of the stock in future years.
One of the issues that led to the current project being undertaken was the perceived
increases in megrim abundance in the northern North Sea related by fishermen in recent
years. This reportedly led to increased discarding as quota levels did not reflect
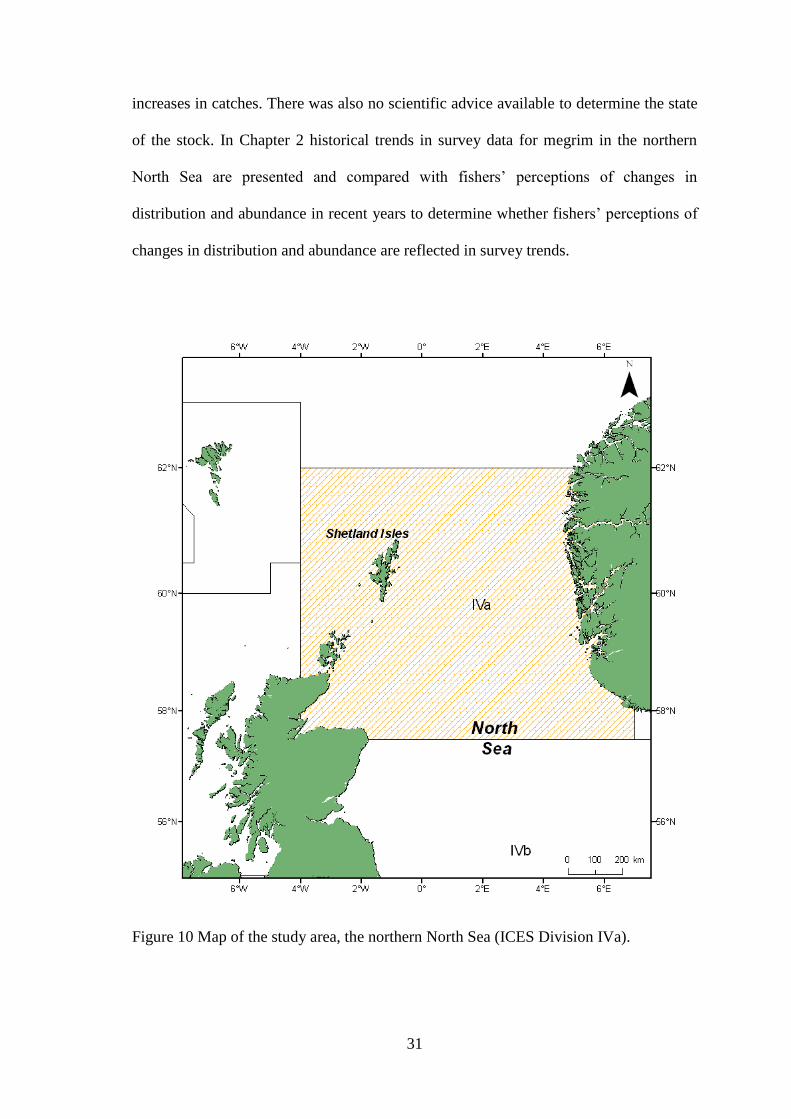
31
increases in catches. There was also no scientific advice available to determine the state
of the stock. In Chapter 2 historical trends in survey data for megrim in the northern
North Sea are presented and compared with fishers’ perceptions of changes in
distribution and abundance in recent years to determine whether fishers’ perceptions of
changes in distribution and abundance are reflected in survey trends.
Figure 10 Map of the study area, the northern North Sea (ICES Division IVa).
32
The primary aim of Chapter 3 is to compare life history characteristics of megrim
between the longitudinal extremes of the Northern Shelf, specifically Rockall (VIb) and
the northern North Sea (IVa). In light of recent changes to megrim stock boundaries on
the Northern Shelf, life history characteristics including reproductive timing, sex ratio,
growth and maturity are compared between the two areas to determine whether
differences exist between populations on the Shelf.
Chapter 4 focuses on providing an estimation of the reproductive potential of megrim in
the northern North Sea. Fecundity estimations are made by investigating the
relationship between oocyte density and oocyte diameter in developing female gonads.
Potential fecundity (Fp, number of oocytes) and relative fecundity (RFp, oocytes / g fish)
are estimated for each sample. Oocyte density and potential fecundity models are fitted
and potential fecundity of L. whiffiagonis is compared with that of a number of North
Atlantic flatfish species.
A number of methodologies exist to differentiate between fish populations. Given the
recent changes to management boundaries for megrim on the Northern Shelf, the aim of
Chapter 5 is to determine, based on the genetic analysis of adult megrims captured on
the Northern Shelf, if there was evidence of separate populations on the northern Shelf,
the geographic distributions of any separate populations and whether the evidence from
this genetic study supports the management units implemented in 2011.
Since the current study began in 2010 the total allowable catch (TAC) of megrim has
increased in the northern North Sea. The aim of Chapter 6 is to investigate recent
changes in discard rates of megrim in the mixed demersal fishery in the northern North
Sea (ICES Division IVa). A logistic regression model is applied to investigate the

33
effects of a range of explanatory factors on discard rates. Discard rates are compared
over a five year period from 2008 to 2012 to determine the effect of quota increases on
overall and individual vessel discarding patterns. Changes in the composition of
discards are also investigated by determining how the proportion of small and bruised
discards in the total catch varies over the study period.
Finally, Chapter 7 discusses how the results of the current study can assist in the
improvement of resource management for the species in the northern North Sea.
34
CHAPTER 2
FISHERS’ KNOWLEDGE AS AN INDICATOR OF SPATIAL
AND TEMPORAL TRENDS IN DISTRIBUTION AND
ABUNDANCE OF COMMON MEGRIM LEPIDORHOMBUS
WHIFFIAGONIS IN THE NORTHERN NORTH SEA
35
2.1 Introduction
In 2011 the European Commission reported that analytical assessments are not
available for 62% of fish stocks in European waters due to a lack of biological and
ecological information about individual stocks, coupled with inaccurate or
missing age catch data (Anon, 2011e). It is widely recognised that if this scenario
is to improve new strategies are required to monitor and manage these common
marine resources (Berkes, 2006; Costello et al., 2012). In recent years one
alternative source of information on fish stocks that has been widely advocated is
fishers’ local knowledge (Wilson et al., 2006; Johnson and van Densen, 2007;
Graham et al., 2011). Fishers, as a result of their extensive interaction with their
surrounding environment and other fishers, often recognise long-term trends in
fish populations and ecosystems and may be effective at tracking trends in fish
stocks (Drew, 2005). The majority of fishers are known to keep accurate records
of catch composition and effort patterns, consequently gathering long-term
distribution and abundance data for individual fish species that may extend
beyond the chronological limit of scientifically collected data. Indeed, fishers
often feel that their extensive knowledge and understanding of fisheries should be
taken into consideration during the process of managing fish stocks. Johnson and
van Densen (2007) (2009)suggest that a two-way flow between fishers and
scientists can improve management by incorporating and utilizing all available
knowledge. Carr and Heyman (2012) also suggest that fishers’ knowledge can
improve management in data-poor fisheries. However, the use of fishers’
knowledge may have inherent problems due to what is seen as a professional asset
being distributed to science and management (Maurstad, 2002).
36
A number of studies have been undertaken to examine the feasibility of applying
fishers’ knowledge in fisheries management. Foster and Vincent (2010) utilized
fishers’ extensive knowledge to assist in recommending management measures
for an unsustainable tropical shrimp fishery. Similarly, Zukowski et al. (2011)
noted that, in the Australian Murray crayfish (Euastacus armatus) fishery, local
fishers’ knowledge could detect population changes at an early stage, allowing
adaptive management. Furthermore, Lorance et al. (2011) were able to identify
regional management issues and solutions in a number of European deep-water
fisheries using stakeholder knowledge collected through a structured
questionnaire. The relevance and validity of fishers’ knowledge has also been
examined in relation to ecosystem studies. Bergmann et al. (2004) reported that
fishers in the Irish Sea were able to provide biological observations that were
useful in supplementing knowledge of essential fish habitats. A similar study in
the eastern English Channel noted that fishers’ perceptions of ecosystem changes
were consistent with scientific data (Rochet et al., 2008).
Fishers’ knowledge can generally be categorised as being quantitative or
qualitative. Quantitative information can be in the form numerical data derived
from self-sampling the catch while qualitative data tends to be more concerned
with fishers’ perceptions on the status of stocks or resources. As such, the use of
fishers’ knowledge may have limitations, because the mechanisms by which
stocks are assessed in European waters are almost exclusively quantitative (ICES,
2013d). The process of incorporating quantitative fishers’ data into a quantitative
assessment is generally more attainable. Conversely, utilizing fishers’ qualitative
data in the assessment process remains difficult and a key obstacle to progress
(Graham et al., 2011). In many instances qualitative data may be referred to by
37
managers when considering the quantitative advice provided by scientific bodies.
Despite this there is currently no mechanism to incorporate qualitative data into
the assessment and management process.
In northern Europe the common megrim, Lepidorhombus whiffiagonis, is a
commercially important flatfish with a distribution extending from the
Mediterranean Sea to Iceland (Nielsen, 1989). The International Council for the
Exploration of the Seas (ICES) considers two stock units of megrim on the
Northern Shelf (L. whiffiagonis and Lepidorhombus boscii are considered
together): one in Divisions IVa and VIa (northern North Sea and west of Scotland
respectively) and one in Subarea VIb (Rockall) (ICES, 2011b, c). Quantitative
management advice was produced by ICES for the northern North Sea (IVa) and
west of Scotland (VIa) stock for the first time in 2011 (ICES, 2011b). The megrim
stock at Rockall (VIb) is currently classified as being data limited (ICES, 2013a).
In recent years the commercial relevance of megrim, especially in the northern
North Sea, has increased significantly and it is currently one of the most important
species by value landed into Scotland (Anon, 2012).
Megrim have a depth range of 50-850m, although they are reportedly more
common in depths around 200m (Fernandes, 2008). Historically, catches in IVa
have been predominantly from the habitat along the continental shelf edge. In
recent years however, fishermen engaging in the multispecies demersal fishery in
the northern North Sea have reported changes in the distribution and abundance of
megrim in the area, especially in the waters around the Shetland Isles (Laurenson
and Macdonald, 2008). The distribution of the species is currently perceived by
many fishermen to have increased, spreading further east and south of the
Shetland Isles into the northern North Sea. Fishermen have also reported an
38
increase in abundance of the species throughout its distribution in IVa from the
mid-2000s (Laurenson and Macdonald, 2008). These perceived changes were not
reported in the stock assessment process until megrim in IVa were first considered
in 2009 (ICES, 2009). The lack of increase in quota in the second half of the
2000s led fishermen to argue that quota limits were overly restrictive and did not
reflect perceived changes in distribution and abundance of the species in the
recent past. A recent study reported that discarding of megrim by vessels engaged
in the mixed demersal fishery around the Shetland Isles has been as high as 70%
(Laurenson and Macdonald, 2008), largely due to quota restrictions.
Quantitative management advice produced by ICES for megrim in Divisions IVa
and VIa is currently provided by a Bayesian state-space biomass dynamic model
utilizing indices from fishery-independent surveys, landings data and discards
estimates (ICES, 2012f). One of the fishery independent survey indices utilized in
the assessment is the biannual North Sea International Bottom Trawl Survey
(NSIBTS) (ICES, 2012a). In the northern North Sea the survey is undertaken
during the first and third quarters by eight participant countries. The main
objective of the NSIBTS is to provide recruitment indices of a defined list of
commercially important fish species. Further to this, the survey also allows
changes in the stock size of a number of commercial fish species to be monitored.
However, one of the disadvantages inherent with the use of survey data is limited
spatial and temporal resolution. In the case of the NSIBTS, distribution and
abundance estimates are limited to a biannual ‘snapshot’. NSIBTS sampling can
be limited to as little as one sample per ICES statistical rectangle, with each
rectangle representing approximately 110 km2. In contrast, fishers’ sample
fishing grounds on a regular basis, thereby collecting temporally resolved data on
39
fish abundance and distribution. Therefore, accessing fishers’ knowledge has the
potential to provide increased spatial and temporal resolution that can, if provided
in an appropriate format, be utilized within the assessment process. This may not
necessarily change the outputs of an assessment but may validate fishery-
independent survey trends and provide fishers’ with the opportunity to be actively
engaged in the provision of data for improved resource management. This could,
for other species, also help avoid the scenario seen with megrim in IVa in recent
years where increases in abundance and distribution were reported by fishers’ a
number of year before being quantified and considered in the assessment process.
The aim of this study was to determine whether Scottish fishing skippers’
perceptions about, and personal catch data on, megrim distribution and relative
abundance in the northern North Sea in recent years was consistent with trends in
a fishery-independent survey index estimated from the biannual NSIBTS. Fishing
skippers’ perceptions about distribution and relative abundance were quantified
through a structured questionnaire. An individual vessel’s catch data was
transcribed from haul specific catch diaries over a 10-year period. Time-series
analysis was undertaken on NSIBTS data from 1971-2010 for the Quarter 1
survey and 1991-2009 for Quarter 3. The applicability of fishers’ local ecological
knowledge as a means to improving fisheries management is discussed.
2.2 Materials & methods
The study was undertaken in the northern North Sea (ICES Division IVa). ICES
Division IVa extends from latitudes 57°30’N to 62°00’N and from longitudes
004°00’W to 007°00’E. It extends from the edge of the continental shelf north-
west of the Shetland Isles into the fjords along the coast of Norway in the east,
40
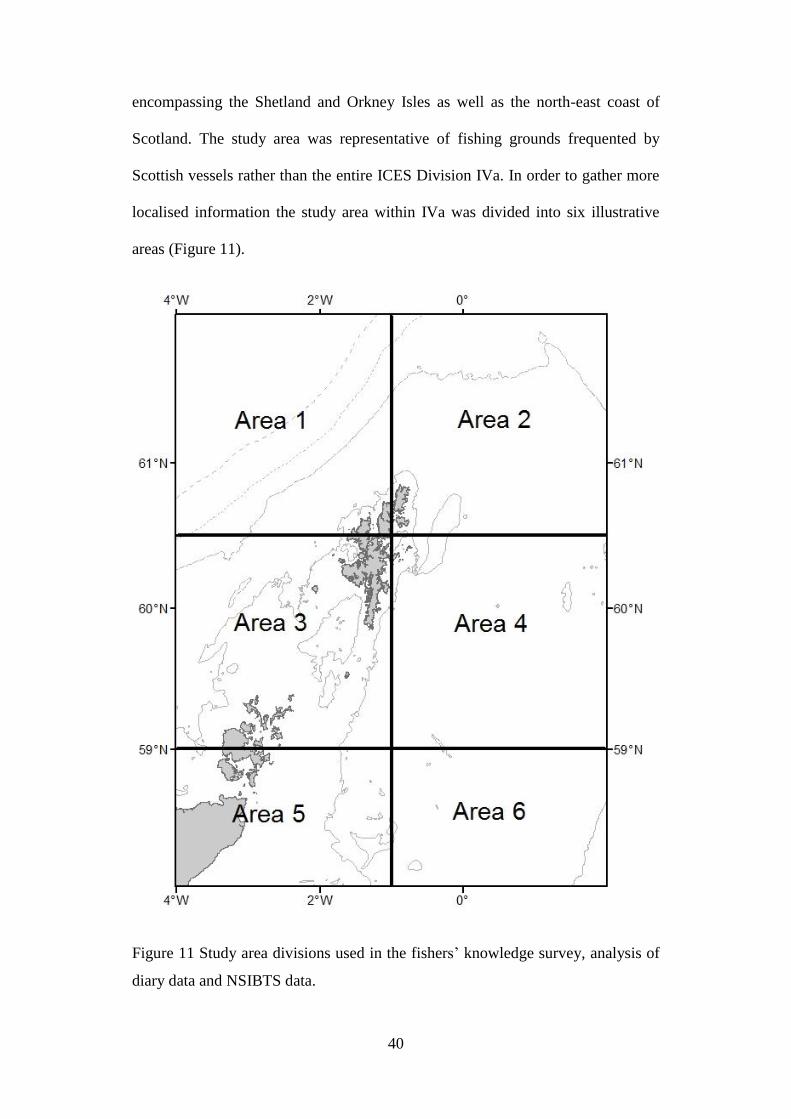
encompassing the Shetland and Orkney Isles as well as the north-east coast of
Scotland. The study area was representative of fishing grounds frequented by
Scottish vessels rather than the entire ICES Division IVa. In order to gather more
localised information the study area within IVa was divided into six illustrative
areas (Figure 11).
Figure 11 Study area divisions used in the fishers’ knowledge survey, analysis of
diary data and NSIBTS data.
41
2.2.1 Fishers’ knowledge questionnaire
In order to gather fishers’ knowledge, a questionnaire, comprising three sections,
was constructed (Table 2). Section 1 (vessel descriptors) was structured to gather
information on the survey participant, including information on the experience of
the skipper, the vessel, gear type, fishing grounds and target species. Section 2
(fishing tactics) was designed to investigate fishing tactics employed by individual
skippers. Finally, section 3 (megrim) was designed to gather skippers’ knowledge
on changes in megrim distribution and abundance in the Northern North Sea. A
section was provided at the end of the questionnaire for skippers to add
comments.
A copy of the questionnaire, a covering letter and return envelope were mailed in
May 2010 to 261 individual skippers who fished in the mixed species demersal
fishery in the northern North Sea. The mailing list included all Scottish vessels
fishing in the northern North Sea irrespective of whether they targeted megrim
consistently, seasonally, or not at all. Skippers’ contact details were provided by
the Scottish Fishermen’s Federation.
All questions were provided with multiple choice answers consisting of between
three and five response options. Responses were designed using a Likert-type
scale (Likert, 1932). The Likert scale is a one-dimensional scale from which
respondents choose the option which best fits with their views. Questionnaire
responses were ranked on a numerical scale for further analysis. Data were
analysed using the Kruskal–Wallis one-way analysis of variance by ranks to
investigate differences between scores within categories i.e. questions. The
Mann–Whitney U test was used to determine whether significant differences
existed in scores between categories.

42
Table 2 Questions and response options for fishers’ knowledge questionnaire.
Question Responses
VESSEL DESCRIPTORS
How long have you been the skipper of this vessel?
Less than 1 year
Between 1 & 5 years
Between 6 & 10 years
More than 10 years
What size is your vessel?
Under 10 metres
10-12 metres
12-15 metres
15-25 metres
Over 25 metres
What type of gear do you fish with for the majority of
the year?
Seine net
Single rig otter trawl
Twin rig otter trawl
Other
How long does a typical fishing trip last?
Less than 1 day
2-5 days
6-7 days
More than 7 days
How important are each of the following species
(monkfish, haddock, cod, whiting, megrim, saithe,
ling) to your annual catch?
Very important
Important
Less important
Not important
FISHING TACTICS
How often do you fish in each of the six illustrative
areas?
Very often
Often
Not often
Never
What influence does available quota have on your
choice of fishing grounds?
Absolutely determines where I fish Plays an important role in determining
where I fish
Is part of a wider process to determine
where to fish
Doesn’t affect where I choose to fish
What influence did quota have on your choice of
fishing grounds when you first became a fishing
skipper?
Absolutely determined where I fished Played an important role in determining
where I fished
Was part of a wider process to determine
where to fish
Didn’t affect where I chose to fish
MEGRIM
How often is megrim one of your main target
species?
Throughout the year
Seasonally
Rarely or never
Do you believe the quantity of megrim in the
northern North Sea in recent years has:
Increased
Decreased
Stayed the same
43
Table 2 (cont.).
Do you believe the spread of megrim in the northern
North Sea in recent years has:
Increased
Decreased
Stayed the same
In general terms, what would you expect the catch per
unit effort of megrim to be in each of the 6 areas at
present?
Very high
High
Average
Low
Don’t know
In general terms, what do you believe the catch per
unit effort for megrim was in each of the 6 areas
when you first became a fishing skipper?
Very high
High
Average
Low
Don’t know
Do you believe catches of megrim in the northern
North Sea in recent years have generally:
Increased
Decreased
Stayed the same
If you answered ‘increased’ above, how significant do
you think each of the following factors have been to
the recent increases in megrim catches (very
significant, significant, less significant, not
significant, don’t know)?
Available quota
Changes in fishing grounds
Changes in target species
Greater numbers of megrim on the
grounds
Changes to fishing gear
Presence of megrim in areas not
previously seen
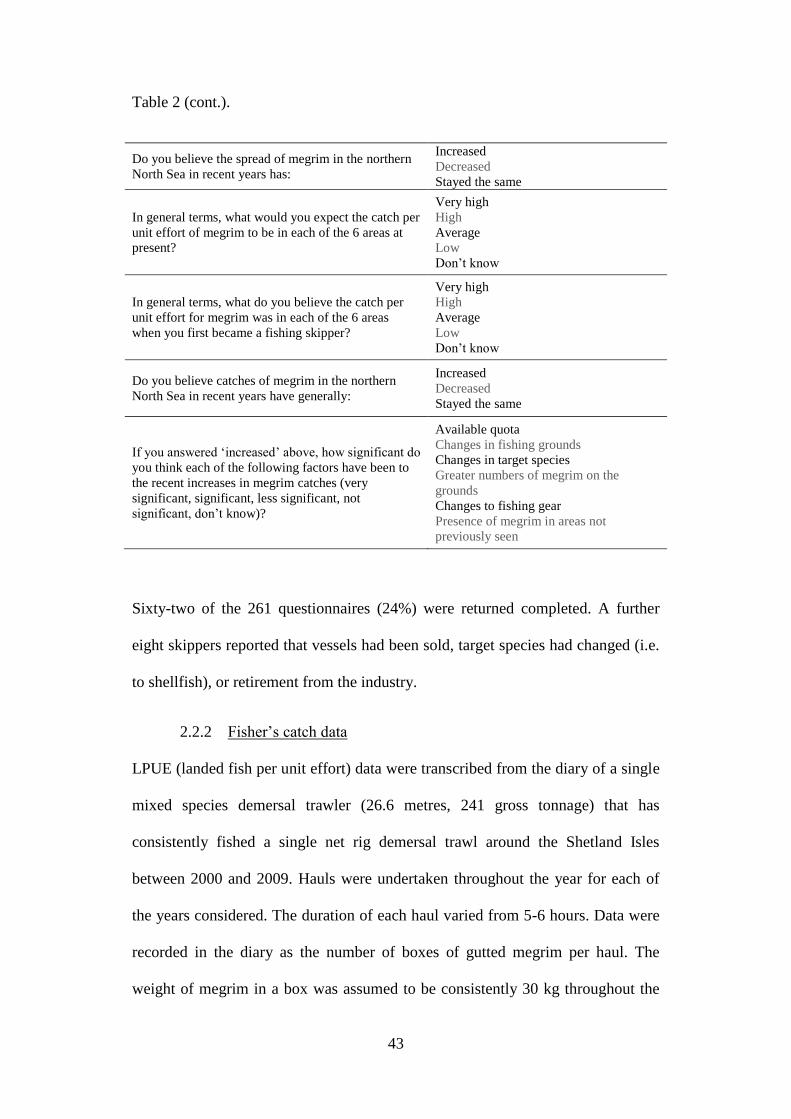
Sixty-two of the 261 questionnaires (24%) were returned completed. A further
eight skippers reported that vessels had been sold, target species had changed (i.e.
to shellfish), or retirement from the industry.
2.2.2 Fisher’s catch data
LPUE (landed fish per unit effort) data were transcribed from the diary of a single
mixed species demersal trawler (26.6 metres, 241 gross tonnage) that has
consistently fished a single net rig demersal trawl around the Shetland Isles
between 2000 and 2009. Hauls were undertaken throughout the year for each of
the years considered. The duration of each haul varied from 5-6 hours. Data were
recorded in the diary as the number of boxes of gutted megrim per haul. The
weight of megrim in a box was assumed to be consistently 30 kg throughout the
44
study. For the purpose of the analysis undertaken here, LPUE was converted from
boxes per haul to kg/hour. LPUE was calculated and averaged for each Area
(Figure 11) over each year of the study. Data for each Area were analysed using
the Kruskal-Wallis one-way analysis of variance by ranks to investigate
differences between categories, i.e., years. The vessel fished a standard single
trawl with 120 mm codend. The main target species over the study period were
cod, haddock whiting and saithe, with megrim predominantly a by-catch species.
2.2.3 NSIBTS Survey data
Survey data were downloaded from the ICES DATRAS (DAtabase of TRAwl
Surveys: http://datras.ices.dk) database in October 2010. Data were selected from
the NSIBTS Quarter 1 (Q1) and Quarter 3 (Q3) surveys. Due to the spatial
coverage of the survey, data were considered for the period 1977 to 2010. Q3 data
were available and downloaded for the period 1991 to 2009. Q3 data for 2010
were not included as the fishers’ questionnaire was undertaken prior to this.
Over the survey period the majority of tows were undertaken using the GOV
(Grande Ouverture Verticale) trawl. Data for Q1 were collected using a GOV
trawl by all participating nations from 1985 to 2010. Prior to 1985 a number of
different trawls were used by different nations and, although designs may be
similar, catchability may have varied between trawls. Data for Q3 were collected
using the GOV trawl by all participating nations from 1998 to 2010. Prior to 1998
RV Scotia deployed the Aberdeen trawl and prior to 1992 a number of different
trawls were deployed by different nations. The use of time series data was
intended to provide comparisons between the three data sources (NSIBTS,
fishers’ diary data and fishers’ questionnaire) for the period between 2000 and
2010, during which time the survey trawls deployed by each nation were
45
standardised. Extended time series for Q1 (1977 to 2010) and Q3 (1991 to 2009)
are also provided to give a historical overview of changes in distribution and
abundance of the species in the six areas.
Following extraction from the DATRAS database, catch per unit effort (CPUE)
data were recorded for individual ICES statistical rectangles for each Quarter of
each year of the survey. In many instances an individual statistical rectangle was
sampled on more than one occasion in a given Quarter. When this occurred, the
mean CPUE was calculated and used.
Data were converted into shapefiles using ArcMap 10 GIS software in preparation
for visual analysis. Maps showing survey CPUE for each of the statistical
rectangles sampled in the study area were produced for each of the years that
survey data were available.
For the purpose of comparing temporal trends in survey distribution and relative
abundance with fishers’ perceptions, the time-series data within each of the six
areas represented in Figure 11 were analysed. CPUE data from individual ICES
rectangles were grouped within each of the six areas for each year and, as the
grouped data were not normally distributed, the median annual values were used
in the analyses. Analyses were undertaken on data from Areas 1-4 while the data
available for Areas 5 & 6 were unsuitable to carry out analyses due to annual
median values of zero for every year of the time-series.
Prior to analysis the time-series data from each area were inspected for auto-
correlation using the autocorrelation (ACF) and partial autocorrelation (PACF)
function. Plots of each time-series were also used to determine whether the time-
series was stationary. A time-series is said to be stationary when its joint
46
probability distribution does not change when shifted in time (Shumway and
Stoffer, 2006). As a result, parameters such as the mean and variance of the series
do not change over time. There was strong evidence of non-stationarity in both
Areas 1 and 2 so ARIMA (auto-regressive integrated moving average) models
were fitted to these time-series’. An ARIMA (p, d, q) model has three components
p, d and q which correspond to the order of the autoregressive, integrated and
moving average component of the model respectively. Integration is used in time-
series modelling to transform a non-stationary time-series into a stationary one by
differencing it, i.e., subtracting previous values from the current value
(conceptually similar to a log or sqrt transformation). Stationarity of the time-
series is an important assumption of traditional ARMA models, hence the need for
integration. Differencing ensures that the models are stationary (constant mean
and variance) prior to analysis and is essential in order for ARIMA model
assumptions to be met. Differencing does not remove the trend from the time-
series and it can still be identified (Shumway and Stoffer, 2006). Subsequent
analyses were undertaken on the differenced data. For Areas 1 and 2 a first order
integration appeared to give stationary time-series. Inspection of the ACF and
PACF plots for these integrated time-series suggested that an order 1 moving
average process was suitable to model the auto-correlation in both cases.
Therefore, ARIMA (0,1,1) models were fitted to the time-series from Area 1 and
area 2 using the R package ‘TSA’ (Chan, 2010). Other possible ARIMA
structures were tested, but the original (0,1,1) model was retained as it had the
lowest AIC score. To estimate the trend in the time-series, each year in the study
was numbered sequentially and included as a covariate within the ARIMA model
(Shumway and Stoffer, 2006).
47
Due to the large number of zeros in the Area 3 & 4 time-series it was judged that
ARIMA models would not be appropriate for these areas. Instead a zero-inflated
poisson hurdle model was fitted to the raw data to account for the number of
zeroes in the Area 3 and 4 time-series. Zero-inflated hurdle models are mixture
models that use a binomial probability model to assess whether a count has a zero
or a positive value. If the value is positive then a hurdle is crossed and the
distribution of positive values is fitted to a zero-truncated count model. Hurdle
model results were compared to the results of a standard poisson model (no
hurdle) using the waldtest procedure (likelihood ratio tests), with the hurdle
models judged a better fit. To estimate the trend in these time-series a data vector
was created that numbered each year sequentially and included this as a predictor
in the hurdle model. To account for the time-series nature of the data a Newey-
West estimator using the R package ‘sandwich’ (Zeileis, 2004; Zeileis, 2006) was
used. The Newey-West estimator is a type of sandwich estimator that can be used
to account for auto-correlation within a time-series. Here, a Newey-West
estimator with a lag of 1 was specified for both time-series based on PACF plots.
The Newey-West estimator also has the additional advantage that it will account
for any heteroscedasticity in both time-series, which could influence the standard
error estimates from the model (Cleasby and Nakagawa, 2011). It was specified
that both time-series should be pre-whitened when using the Newey-West
estimator using the in-built functions in the ‘sandwich’ package. Pre-whitening
involves filtering the data to generate a white noise process, which was necessary
because the original time-series’ were non-stationary (Cryer and Chan, 2008). The
pre-whitening step improves the sandwich estimator by reducing its bias (Zeileis,
2004). The use of the Newey-West estimator did not remove the auto-correlation
48
but allowed it to be accounted for in the model and ensured that the estimate of
any underlying trend was more robust. The auto-correlation component also
accounted for the fact that results from adjacent time periods may not be
independent. If auto-correlation was not included, the standard errors in the model
would be narrower than they should be (so there would be more chance of finding
a significant result incorrectly). All data analysis was undertaken in R statistical
software package (R Development Core Team, 2008).
Finally, a Spearman rank-order correlation test was used to determine how well
the fisher’s average annual catch data and median annual NSIBTS survey data
(both Q1 and Q3) correlated in each of the illustrative sample Areas where data
were available.
2.3 Results
2.3.1 Fishers’ knowledge questionnaire
2.3.1.1 Vessel descriptors
The largest percentage of respondents (87% of 62 responses) was skippers having
more than ten years of experience in the industry. Respondents were
predominantly fishing with vessels in the size range 15-25 metres (79% of 62
responses) with a further 16% of returns from vessels greater than 25 metres. The
returns by gear type were highest for twin trawl vessels (52% of 62 responses)
while 24% were from single trawl vessels, 15% from seine net vessels and the
remaining 9% from vessels fishing with pair trawls. The length of fishing trips
undertaken by respondents was predominantly 6-7 days (45% of 62 responses)
while 34% undertook trips lasting more than 7 days. The largest single group of
49
respondents (37% of 62 responses) were skippers with more than 10 years of
experience fishing twin trawl gear with vessels in the size range 15-25 metres.
Megrim was not considered to be the most commercially important species to
fishers. The relative importance of the seven main commercial demersal species
(monkfish, haddock, cod, whiting, megrim, saithe and ling) was significantly
different (Kruskal-Wallis H=35.25, df = 6, P<0.001) across vessels with monkfish
and haddock reported as being the most important species commercially, followed
by cod. Whiting, megrim and saithe were considered less commercially important
and ling was the species having the least commercial importance.
2.3.1.2 Fishing tactics
Skippers were asked to report how much time they spent fishing in each of the six
areas shown in Figure 11. There was a significant difference in the amount of time
spent fishing in the six areas (Kruskal-Wallis H=26.96, df = 5, P<0.001) with
respondents spending more time fishing in Areas 2, 3 and 4 than in Areas 1, 5 and
6.
Respondents we asked to compare what effect the quota system has on their
choice of fishing grounds at present, compared with when they first became a
fishing skipper. Available quota was found to play a significantly greater role in
determining where vessels fish presently than it did in the past (Mann-Whitney U
= 2251.5, P<0.001) with 85% of the 61 respondents reporting that availability of
quota plays an important or essential role in determining where they choose to
fish now. Conversely, 85% of 61 respondents reported that quota had little effect
on where they chose to fish when they first became skippers.
50
2.3.1.3 Megrim
Respondents consisted of a varied group of vessels with respect to the targeting of
megrim. 23% of the 61 respondents targeted the species throughout the year, 38%
on a seasonal basis and 39% rarely or never.
72% of 61 respondents believed that the overall distribution of megrim in the
northern North Sea has increased in recent years. 23% believed it has stayed the
same and 4% believed it has decreased. Skippers had similar views on changes in
the abundance of megrim in the recent past with 69% of the 61 respondents
reporting an increase in abundance, 26% reporting no change in abundance and
5% an overall decrease.
Skippers’ expectations of megrim CPUE at present and when first becoming a
fishing skipper are outlined in Figure 12. There was a significant difference in the
current megrim CPUE expectation between each of the six areas highlighted in
(Kruskal-Wallis H=120.87, df = 5, P<0.001). 80% of the 58 respondents expect
megrim CPUE to be ‘Very high’ or ‘High’ in Area 2 at present. The expectation
for ‘Very high’ and ‘High’ CPUE in Areas 1, 3 and 4 were 48%, 60% and 32%
respectively. Many of the skippers reported that they were unaware of what the
megrim CPUE would be in Areas 5 and 6 both presently (31% and 46%
respectively) and when first becoming skippers (41% and 44% respectively)
although CPUE was typically ranked as ‘low’ for those that did respond.
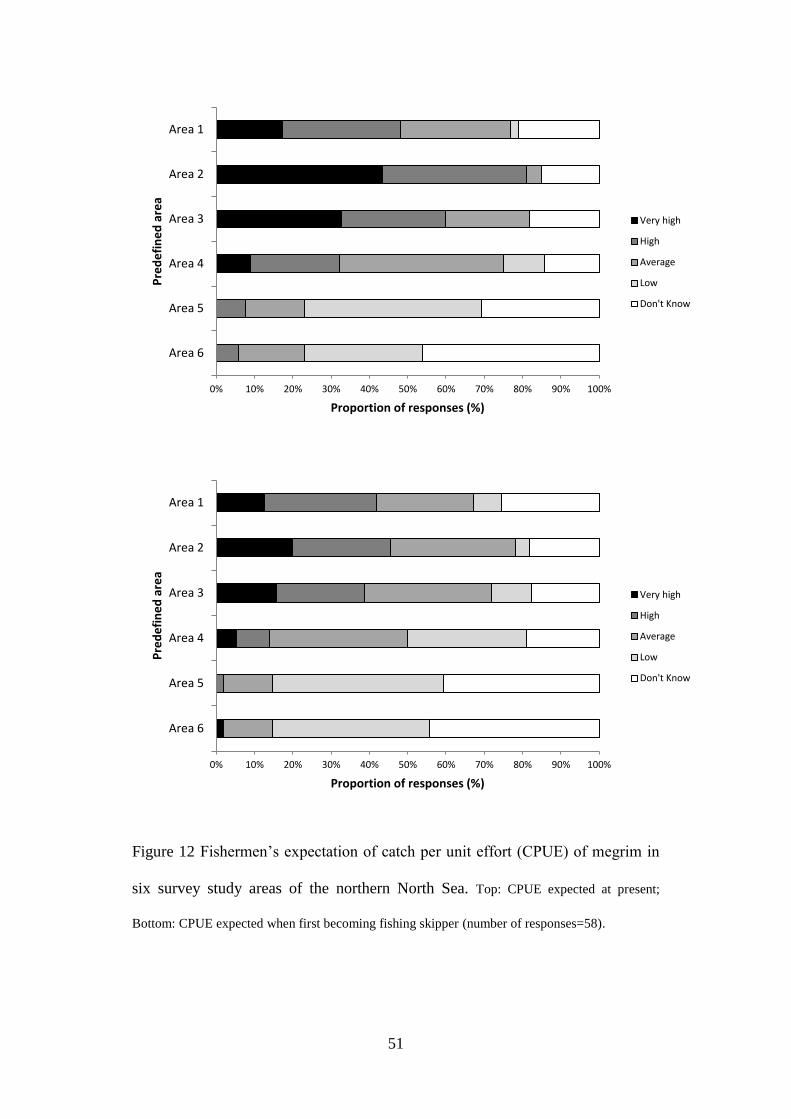
51
Figure 12 Fishermen’s expectation of catch per unit effort (CPUE) of megrim in
six survey study areas of the northern North Sea. Top: CPUE expected at present;
Bottom: CPUE expected when first becoming fishing skipper (number of responses=58).
0% 10% 20% 30% 40% 50% 60% 70% 80% 90% 100%
Area 6
Area 5
Area 4
Area 3
Area 2
Area 1
Proportion of responses (%)
Pre
de
fin
ed
are
a
Very high
High
Average
Low
Don't Know
0% 10% 20% 30% 40% 50% 60% 70% 80% 90% 100%
Area 6
Area 5
Area 4
Area 3
Area 2
Area 1
Proportion of responses (%)
Pre
de
fin
ed
are
a
Very high
High
Average
Low
Don't Know
52
There was also a significant difference in the perceived CPUE of megrim between
the six areas when fishermen first became skippers (Kruskal-Wallis H=89.34, df =
5, P<0.001). 46% of the 58 respondents expected megrim CPUE to be ‘Very high’
or ‘High’ in Area 2 when first becoming fishing skippers. The expectation for
‘Very high’ and ‘High’ CPUE in Areas 1, 3 and 4 were 42%, 39% and 14%
respectively. There was no significant change perceived in CPUE in Area 1
(Mann-Whitney U = 1775.5, P>0.05), Area 5 (Mann-Whitney U = 1241.0,
P>0.05) and Area 6 (Mann-Whitney U = 801.5, P>0.05) between the present and
when respondents first became skippers. Furthermore, respondents reported an
increase in megrim CPUE at present compared with when they first became
skippers for Area 2 (Mann-Whitney U = 1653.5, P<0.001), Area 3 (Mann-
Whitney U = 1873.0, P<0.01) and Area 4 (Mann-Whitney U = 2086.0, P<0.01).
Respondents were asked how they perceived general trends in overall catches of
megrim in the northern North Sea. 72% of the 60 respondents reported that overall
catches are generally increasing, 20% reported that they are neither increasing nor
decreasing and 8% reported a decrease. Those that perceived an increase were
asked to further elaborate on what they felt were the apparent causes of the
increase. There was a significant difference in the perceived effects of the
different factors on megrim catches (Kruskal-Wallis H = 33.83, df = 5, P<0.001)
with the most significant factors affecting the increase in catches reported as
‘megrim in areas not previously seen’ and ‘more megrim on the grounds’ (Figure
13). Available quota was seen as the next most important factor contributing to
increased catches followed by changes in fishing grounds and changes in target
species. Changes in fishing gear were reported as the least significant of the six
factors contributing to increased catches.
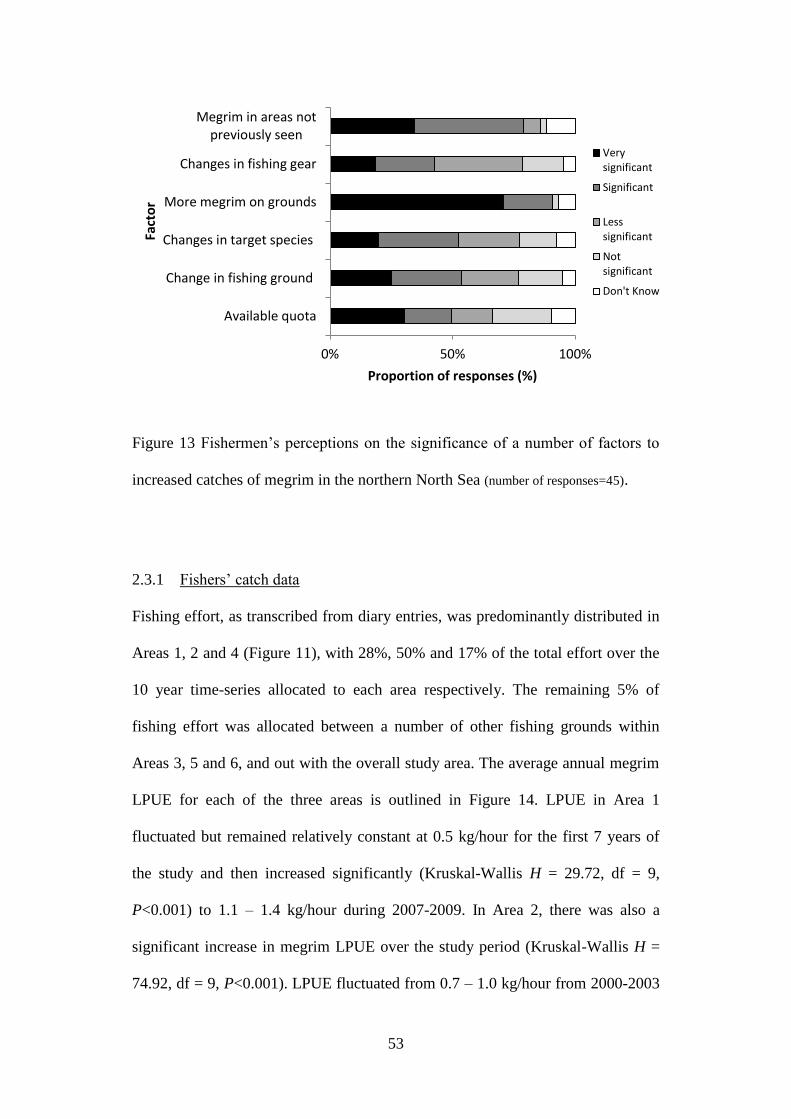
53
Figure 13 Fishermen’s perceptions on the significance of a number of factors to
increased catches of megrim in the northern North Sea (number of responses=45).
2.3.1 Fishers’ catch data
Fishing effort, as transcribed from diary entries, was predominantly distributed in
Areas 1, 2 and 4 (Figure 11), with 28%, 50% and 17% of the total effort over the
10 year time-series allocated to each area respectively. The remaining 5% of
fishing effort was allocated between a number of other fishing grounds within
Areas 3, 5 and 6, and out with the overall study area. The average annual megrim
LPUE for each of the three areas is outlined in Figure 14. LPUE in Area 1
fluctuated but remained relatively constant at 0.5 kg/hour for the first 7 years of
the study and then increased significantly (Kruskal-Wallis H = 29.72, df = 9,
P<0.001) to 1.1 – 1.4 kg/hour during 2007-2009. In Area 2, there was also a
significant increase in megrim LPUE over the study period (Kruskal-Wallis H =
74.92, df = 9, P<0.001). LPUE fluctuated from 0.7 – 1.0 kg/hour from 2000-2003
0% 50% 100%
Available quota
Change in fishing ground
Changes in target species
More megrim on grounds
Changes in fishing gear
Megrim in areas notpreviously seen
Proportion of responses (%)
Fact
or
Verysignificant
Significant
Lesssignificant
Notsignificant
Don't Know
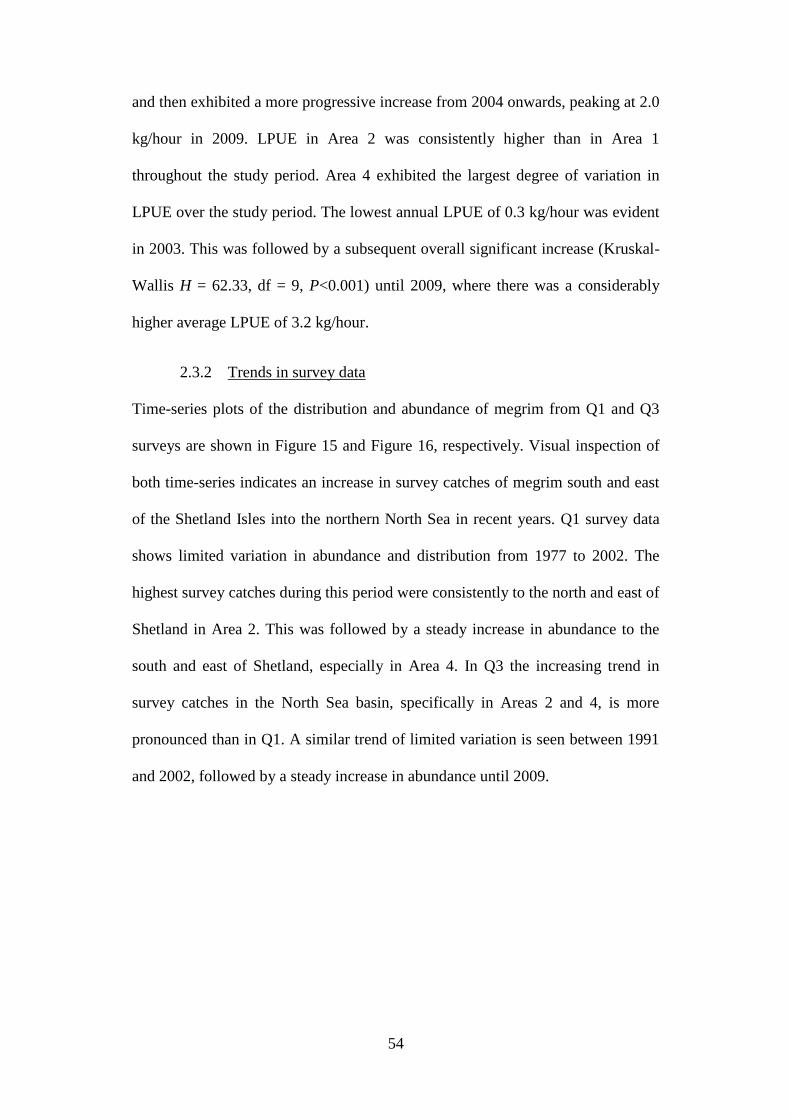
54
and then exhibited a more progressive increase from 2004 onwards, peaking at 2.0
kg/hour in 2009. LPUE in Area 2 was consistently higher than in Area 1
throughout the study period. Area 4 exhibited the largest degree of variation in
LPUE over the study period. The lowest annual LPUE of 0.3 kg/hour was evident
in 2003. This was followed by a subsequent overall significant increase (Kruskal-
Wallis H = 62.33, df = 9, P<0.001) until 2009, where there was a considerably
higher average LPUE of 3.2 kg/hour.
2.3.2 Trends in survey data
Time-series plots of the distribution and abundance of megrim from Q1 and Q3
surveys are shown in Figure 15 and Figure 16, respectively. Visual inspection of
both time-series indicates an increase in survey catches of megrim south and east
of the Shetland Isles into the northern North Sea in recent years. Q1 survey data
shows limited variation in abundance and distribution from 1977 to 2002. The
highest survey catches during this period were consistently to the north and east of
Shetland in Area 2. This was followed by a steady increase in abundance to the
south and east of Shetland, especially in Area 4. In Q3 the increasing trend in
survey catches in the North Sea basin, specifically in Areas 2 and 4, is more
pronounced than in Q1. A similar trend of limited variation is seen between 1991
and 2002, followed by a steady increase in abundance until 2009.
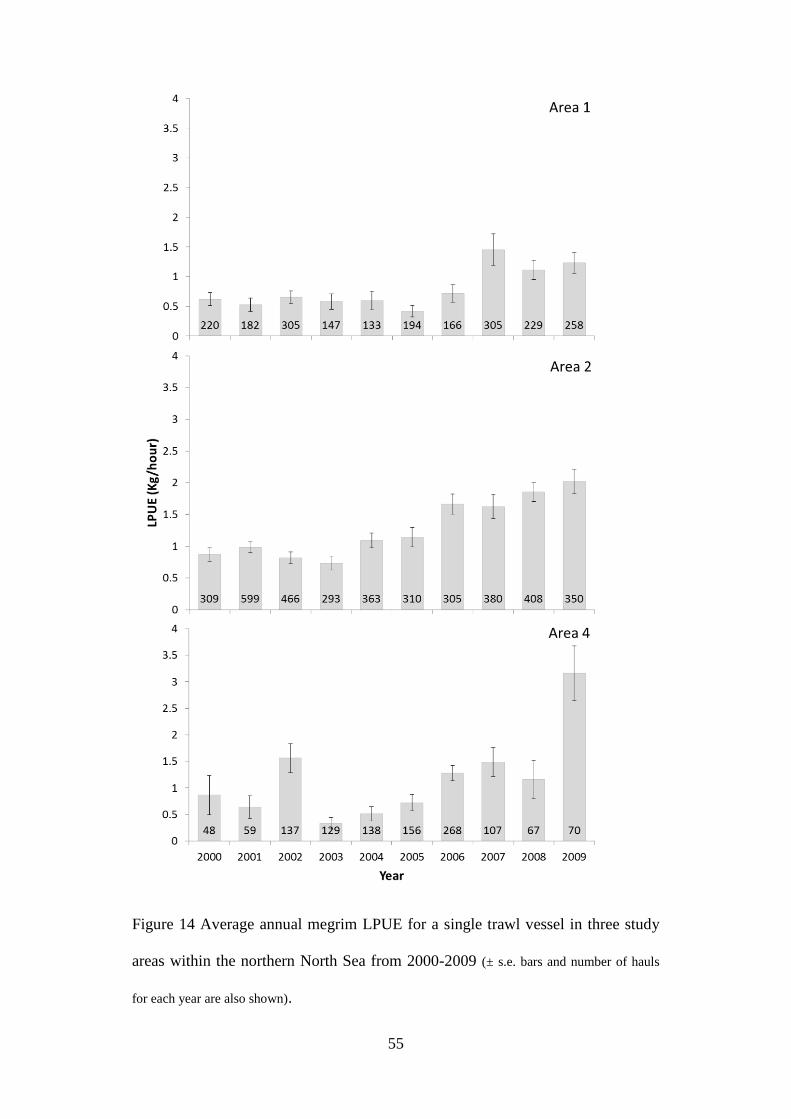
55
Figure 14 Average annual megrim LPUE for a single trawl vessel in three study
areas within the northern North Sea from 2000-2009 (± s.e. bars and number of hauls
for each year are also shown).
56
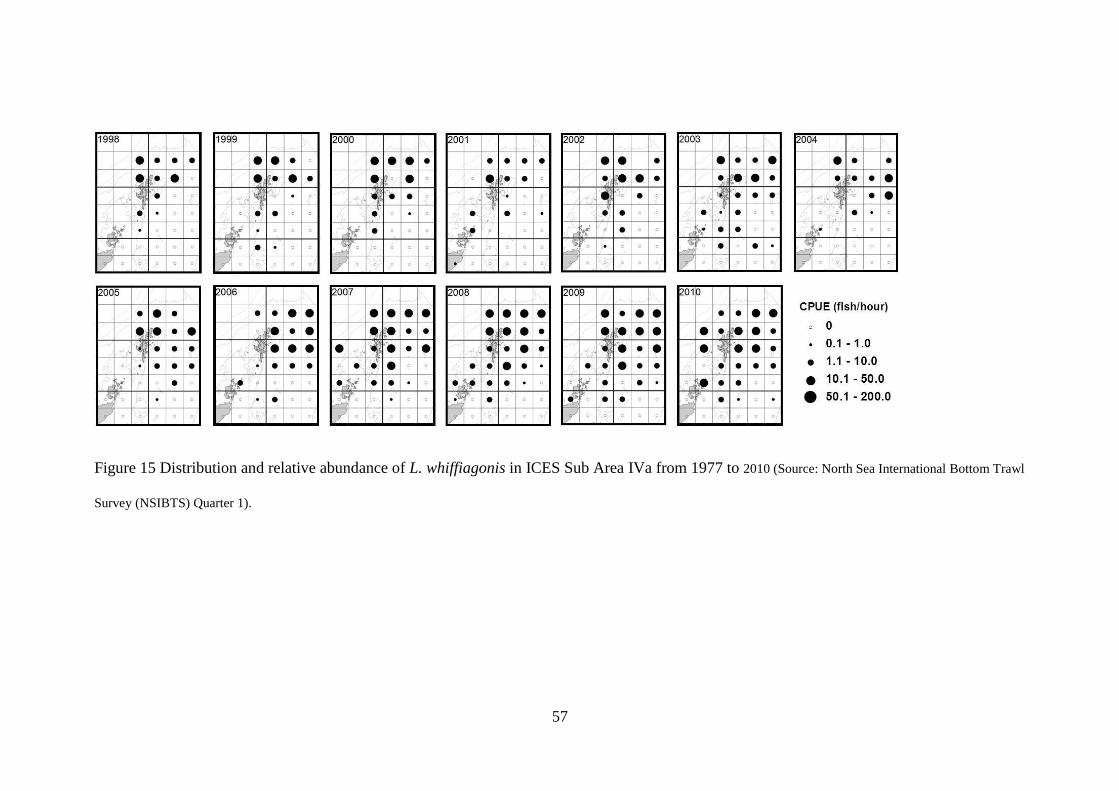
57
Figure 15 Distribution and relative abundance of L. whiffiagonis in ICES Sub Area IVa from 1977 to 2010 (Source: North Sea International Bottom Trawl
Survey (NSIBTS) Quarter 1).
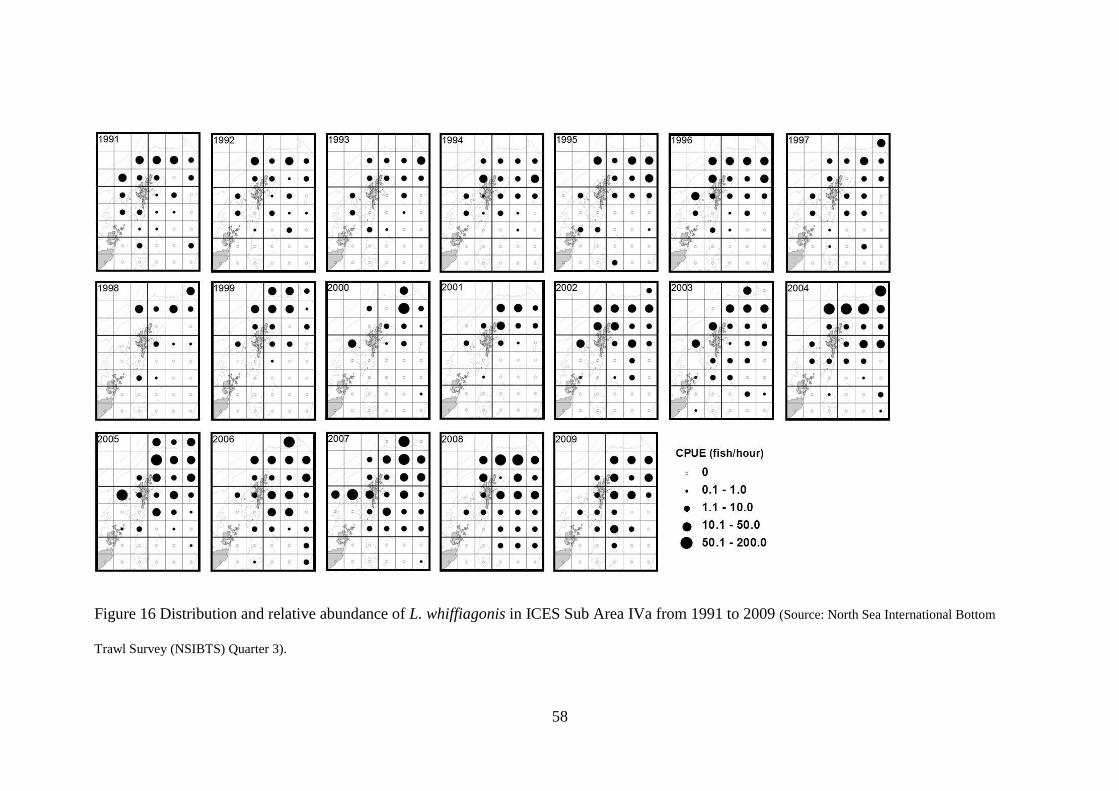
58
Figure 16 Distribution and relative abundance of L. whiffiagonis in ICES Sub Area IVa from 1991 to 2009 (Source: North Sea International Bottom
Trawl Survey (NSIBTS) Quarter 3).
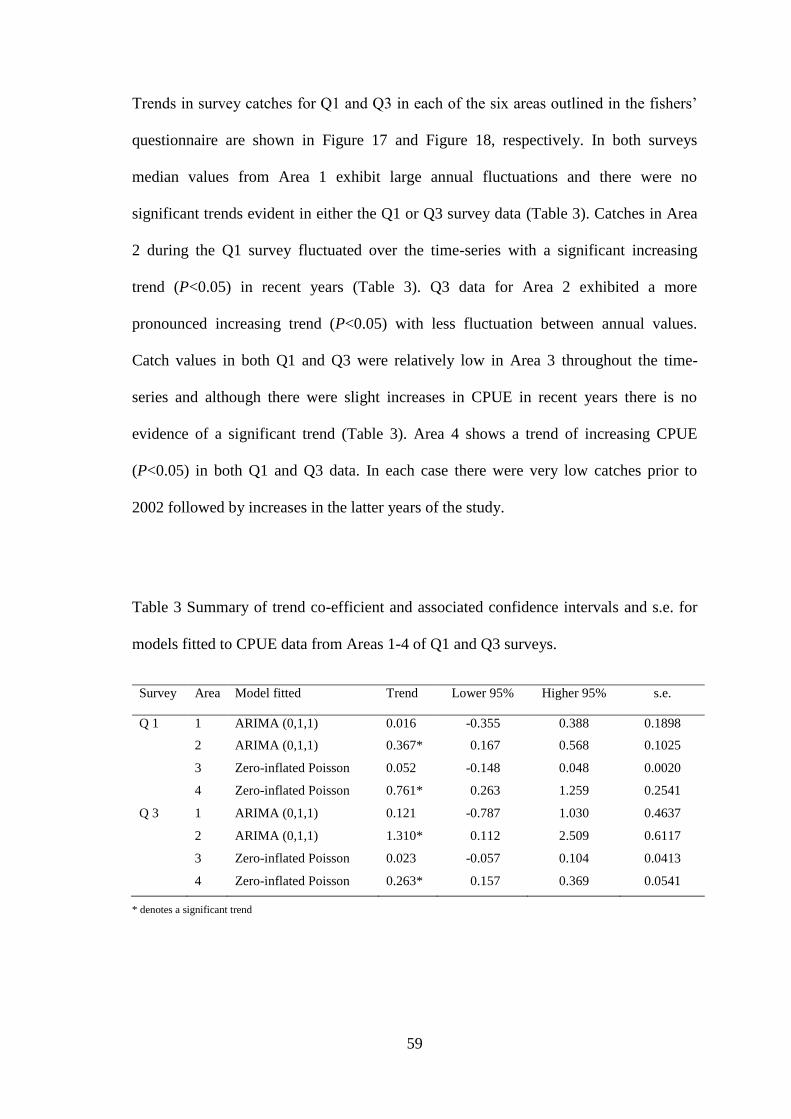
59
Trends in survey catches for Q1 and Q3 in each of the six areas outlined in the fishers’
questionnaire are shown in Figure 17 and Figure 18, respectively. In both surveys
median values from Area 1 exhibit large annual fluctuations and there were no
significant trends evident in either the Q1 or Q3 survey data (Table 3). Catches in Area
2 during the Q1 survey fluctuated over the time-series with a significant increasing
trend (P<0.05) in recent years (Table 3). Q3 data for Area 2 exhibited a more
pronounced increasing trend (P<0.05) with less fluctuation between annual values.
Catch values in both Q1 and Q3 were relatively low in Area 3 throughout the time-
series and although there were slight increases in CPUE in recent years there is no
evidence of a significant trend (Table 3). Area 4 shows a trend of increasing CPUE
(P<0.05) in both Q1 and Q3 data. In each case there were very low catches prior to
2002 followed by increases in the latter years of the study.
Table 3 Summary of trend co-efficient and associated confidence intervals and s.e. for
models fitted to CPUE data from Areas 1-4 of Q1 and Q3 surveys.
Survey Area Model fitted Trend
co-
efficient
Lower 95%
CI
Higher 95%
CI
s.e.
Q 1 1 ARIMA (0,1,1) 0.016 -0.355 0.388 0.1898
2 ARIMA (0,1,1) 0.367* 0.167 0.568 0.1025
3 Zero-inflated Poisson
Hurdle
0.052 -0.148 0.048 0.0020
4 Zero-inflated Poisson
Hurdle
0.761* 0.263 1.259 0.2541
Q 3 1 ARIMA (0,1,1) 0.121 -0.787 1.030 0.4637
2 ARIMA (0,1,1) 1.310* 0.112 2.509 0.6117
3 Zero-inflated Poisson
Hurdle
0.023 -0.057 0.104 0.0413
4 Zero-inflated Poisson
Hurdle
0.263* 0.157 0.369 0.0541
* denotes a significant trend
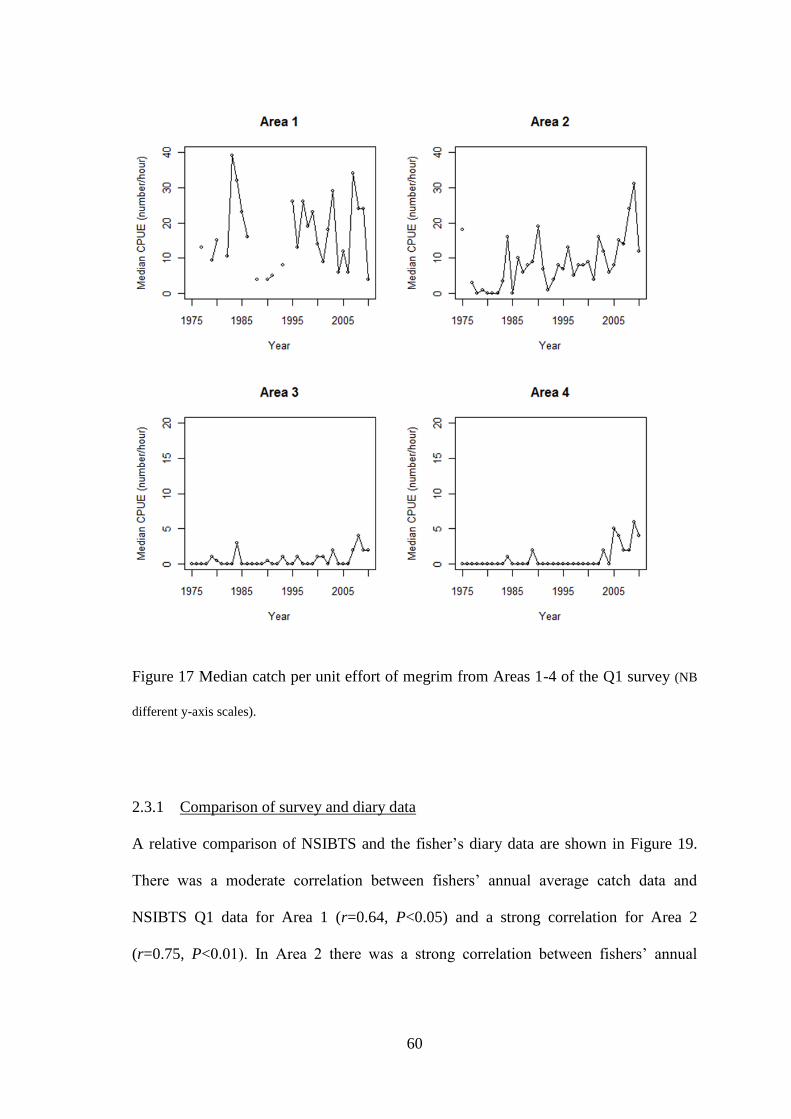
60
Figure 17 Median catch per unit effort of megrim from Areas 1-4 of the Q1 survey (NB
different y-axis scales).
2.3.1 Comparison of survey and diary data
A relative comparison of NSIBTS and the fisher’s diary data are shown in Figure 19.
There was a moderate correlation between fishers’ annual average catch data and
NSIBTS Q1 data for Area 1 (r=0.64, P<0.05) and a strong correlation for Area 2
(r=0.75, P<0.01). In Area 2 there was a strong correlation between fishers’ annual
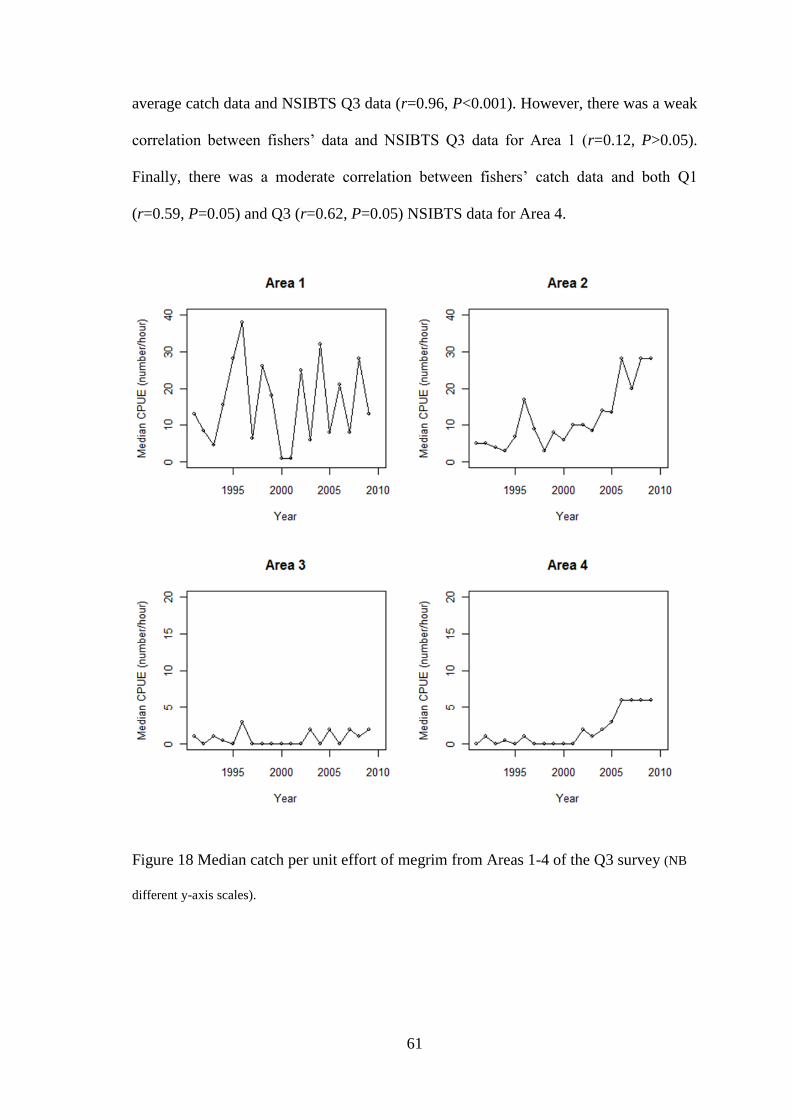
61
average catch data and NSIBTS Q3 data (r=0.96, P<0.001). However, there was a weak
correlation between fishers’ data and NSIBTS Q3 data for Area 1 (r=0.12, P>0.05).
Finally, there was a moderate correlation between fishers’ catch data and both Q1
(r=0.59, P=0.05) and Q3 (r=0.62, P=0.05) NSIBTS data for Area 4.
Figure 18 Median catch per unit effort of megrim from Areas 1-4 of the Q3 survey (NB
different y-axis scales).
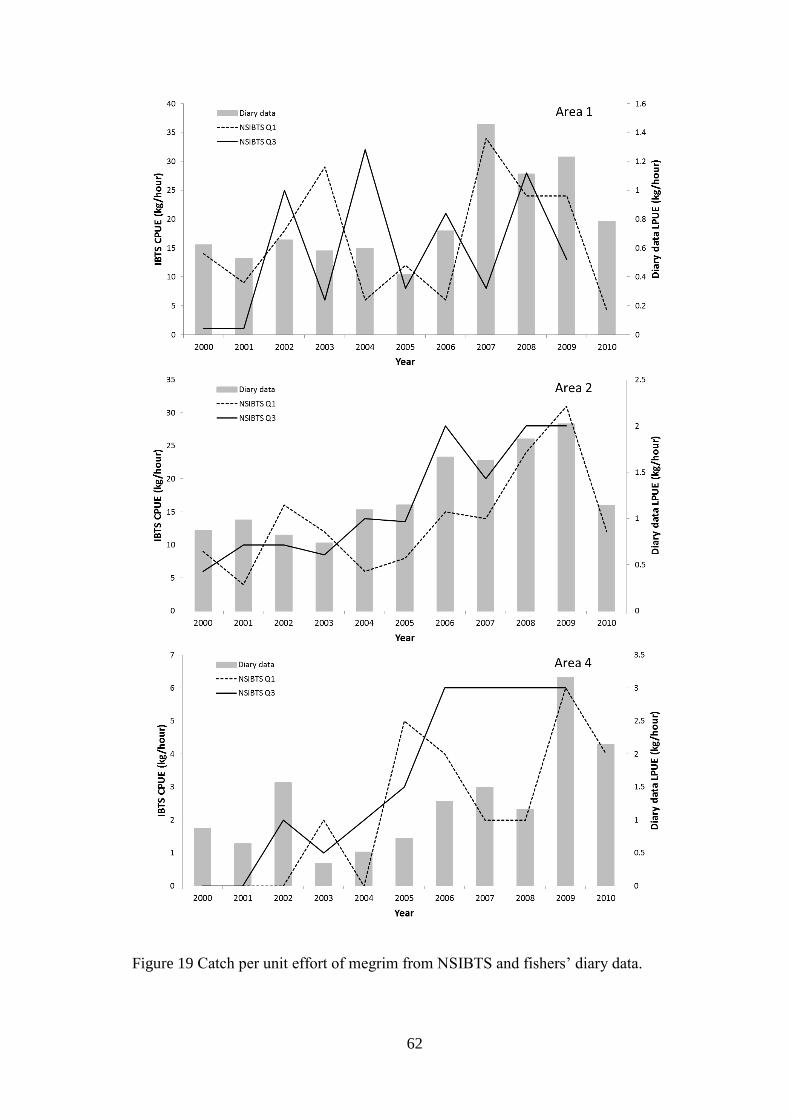
62
Figure 19 Catch per unit effort of megrim from NSIBTS and fishers’ diary data.
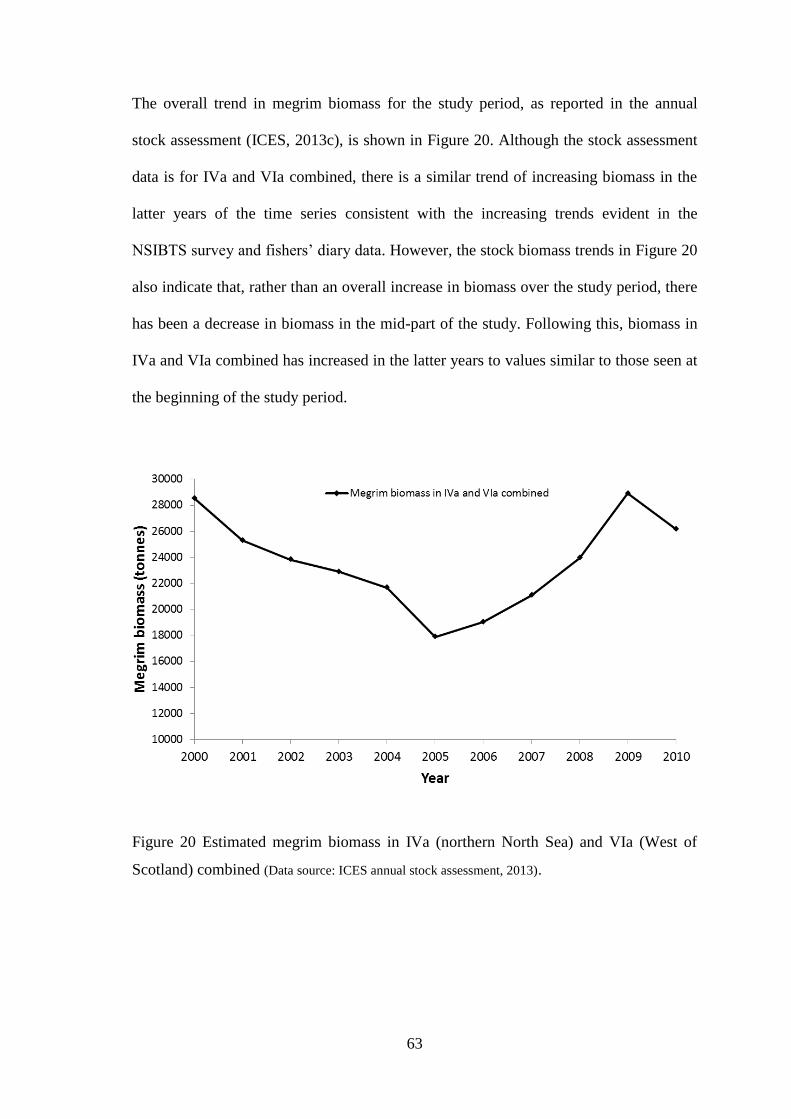
63
The overall trend in megrim biomass for the study period, as reported in the annual
stock assessment (ICES, 2013c), is shown in Figure 20. Although the stock assessment
data is for IVa and VIa combined, there is a similar trend of increasing biomass in the
latter years of the time series consistent with the increasing trends evident in the
NSIBTS survey and fishers’ diary data. However, the stock biomass trends in Figure 20
also indicate that, rather than an overall increase in biomass over the study period, there
has been a decrease in biomass in the mid-part of the study. Following this, biomass in
IVa and VIa combined has increased in the latter years to values similar to those seen at
the beginning of the study period.
Figure 20 Estimated megrim biomass in IVa (northern North Sea) and VIa (West of
Scotland) combined (Data source: ICES annual stock assessment, 2013).
64
2.4 Discussion
The results of this study indicate that fishers’ perceptions of changes in relative
abundance of megrim in the northern North Sea are broadly consistent with spatial and
temporal trends evident in survey data. However, the extent to which the different data
sources agreed varied between Areas. NSIBTS survey data showed an increase in
abundance to the east of Shetland in Areas 2 and 4 and this was consistent with fishers’
perceptions of increased abundance in these areas. The ten year time-series of catch
rates from diary data has also highlighted significant increases in relative abundances of
megrim in Areas 2 and 4.
There was a significant increase in catches reported from diary data in Area 1 in the
latter years of the study, albeit to a lesser degree than Areas 2 and 4. However, there
was no significant increase evident in Area 1 in either the fishers’ questionnaire or the
NSIBTS survey data. Perceived increases in abundance highlighted by the fishers’
questionnaire and catch data in Area 3 were also less pronounced in the survey data,
with the time-series only showing a slight increase in more recent years. The differences
between fishers’ perceptions, catch data and survey abundance in Areas 1 and 3 may be
due to spatial differences between survey stations and commercially important grounds.
Catches of megrim west of Shetland are known to be higher in the deeper water along
the shelf edge (Gordon, 2001). The proportion of Area 3 that includes shelf edge fishing
grounds is markedly less than Area 1, and, while fishers’ catches of megrim are greater
along the shelf edge, the survey data is more representative of the entire area. It is
therefore probable that increased catches along the shelf edge may not necessarily be
representative of abundance within the entire area.
65
Trends in survey data, fishers’ perceptions and diary data suggest an increase in
abundance in the northern North Sea basin in recent years, although these increases are
more pronounced east of the Shetland Isles. Fishers’ have also noted that, in recent
years, megrim have been captured in shallower water than previously expected (A.
Johnson, 2010, pers. comm.). Density-dependent dispersal, driven by factors such as
competition and population size, into less favourable environments (Begon et al., 1996)
is one factor that may have led to changes in megrim distribution and greater relative
abundance in the shallower water of the North Sea basin. Increases in abundance in
recent years are evident in both the Q1 and Q3 NSIBTS data series, highlighting the fact
that the increases have not been on a seasonal basis i.e. migration of fish to spawning or
feeding grounds.
Differing trends were evident between the quantitative data sources (fishers’ diary data
and NSIBTS survey data) examined in this study and the megrim biomass estimates
from the annual stock assessment. The stock assessment data incorporates all of IVa and
VIa. Trends in the assessment data highlight a decrease in biomass towards the mid-
point of the study (2004 to 2006), followed by an increase to original biomass values
towards the end of the study period (2010). This trend was not evident in the North Sea
(IVa) diary and survey data, where abundance levels were relatively low at the start of
the time series and increased during the latter stages. The decrease in estimated stock
biomass in the first half of the study period could possibly be driven by decreasing
biomass in VIa coupled with consistently low biomass in IVa, resulting in the low
overall biomass estimates evident between 2004 and 2006. Furthermore, it is unclear
whether the increase in megrim biomass evident in the latter years is synonymous with
66
increases across both IVa and VIa or whether they are driven solely by increases in
abundance in IVa.
The proportion of respondents to the fishers’ knowledge survey (24%) was relatively
good, especially in comparison to similar surveys sent to fishermen. For example,
respondents to the annual Fishers’ North Sea Stock Survey (an annual survey of Fishers'
perceptions of the state of fish stocks in the North Sea) from Scottish fishing skippers,
are typically less than 12% (I. Napier, pers. comm.). In this survey fishermen are asked
to record their perceptions of how the abundance, size range, discards and recruitment
of eight commercially important species have changed from the previous year. The
megrim survey undertaken in the present study was sent out to all members of the
Scottish Fishermen’s Federation fishing within the whitefish fishery in the North Sea,
irrespective of whether megrim was one of their target species. The proportion of
respondents from fishers targeting megrim was therefore relatively higher than the 24%
overall response and possibly highlights the importance of this issue to these fishers.
Skippers that declined to respond may have done so for a number of reasons including;
megrim not being an important species to them (i.e. Nephrops norvegicus trawlers),
fishing in areas with low megrim abundance, or concentrating effort on other species
such as haddock. There may also be a proportion that were not willing, or had no desire,
to engage in the survey. However, there is no reason to suggest that their perceptions of
megrim distribution and abundance would be different to those that did respond. The
majority of respondents were skippers with more than 10 years’ experience and, given
the fact that the greatest changes in abundance occurred in the previous 10 years, the
majority of skippers have experienced most, if not all, of these increases first hand.
67
Achieving a 100% response to questionnaires is highly unlikely. However, the process
of assessing fishers’ knowledge could be enhanced by employing methodologies that
result in improved coverage. This could be achieved by visiting vessels that do not
respond to postal invitations to complete questionnaires and interviewing skippers. This
may assist in providing a balanced view over an entire fleet by including responses from
those who may only have a limited interest in the species or subject in question.
One of the issues inherent with the use of fishers’ knowledge questionnaires is the
difficulty in incorporating what is essentially qualitative data within an assessment
process that is reliant on quantitative data. As was evident in this study, questionnaire
data in the format used here is not directly comparable with survey data or fishers’ diary
data. As such, the use of questionnaire data has limitations within the current
assessment process and its use may be limited to validating qualitative data trends at the
management level.
The fishers’ general perceptions on the distribution and abundance of megrim were
validated by fishers’ diary data. The diary data presented here represents a unique data
set with a consistent haul-by-haul account of LPUE over a ten year period. However,
one limitation of the diary data presented here is that it is restricted to a description of
the LPUE rather than the total catch. Discarding of megrim has reportedly been more
pronounced in the northern North Sea during the mid-to-late 2000s (Laurenson and
Macdonald, 2008). As such, there is the potential for the total CPUE to be
underestimated in the data presented here due to the absence of any discards from the
dataset. However, the issue of discarding has been more pronounced for vessels such as
those targeting anglerfish with twin trawls. Megrim has been a species of lesser
commercial significance for the sampled vessel here, with catches predominantly
68
incidental. Therefore, the diary data presented here provides a useful ‘background’
overview of trends in abundance over the study period as the vessel was not consistently
targeting areas of high megrim abundance.
One of the issues inherent with the use of fishers’ historical data is the lack of
consistency in the quantity and quality of data collected across vessels. Many of the
vessels within the local Fishermen’s Association maintain a regular diary although, for
the purposes of this study, only one vessel had the necessary spatial and temporal
resolution to estimate catch trends by fishing location on a haul by haul basis. Further,
extracting catch data from vessel diaries is time consuming and often references to
locally named fishing grounds must be translated on a haul by haul basis to a format
consistent with scientific data sources, i.e., an ICES statistical rectangle. While fishers
may collect long term data sets in a methodical manner, data may not be in a suitable
format for collation and analyses. As such, if fishers’ catch data is to be considered
within a scientific data collection framework, there would be a requirement for it to be
collected in a standardised format suitable for scientific analysis. Such attempts have
been made at this in the past for both monkfish and megrim by introducing tally book
schemes (Dobby et al., 2008; Laurenson and Macdonald, 2008). However one of the
problems inherent with these voluntary schemes is the drop-off in participants over
time, which can result if fishers’ do not see direct benefits from the scheme (ICES,
2007) in terms of utilization of the data and incorporation into the management process.
In recent years modern methods of tracking vessels with vessel monitoring systems
(VMS) have allowed for a more streamlined approach to monitoring trends in vessel
movement. Currently all European fishing vessels exceeding 15m are required to
transmit vessel position, course and speed for monitoring and enforcement purposes
69
(EC, 2003). Vessels are also required to complete daily retained catch weights in
logbooks (EEC, 1983). Routine VMS data can then be linked to catch data to provide
spatially resolved catch and effort data (Gerritsen and Lordan, 2011). However, the use
of VMS is not universal and, where the system is available, historical data is currently
limited as it has only been in operation in recent years. Further advances in electronic
logbook technology have also resulted in the production of software that allows the user
to input biological and ecological data that can be stored and accessed for subsequent
analysis (A. Barkai, pers. comm.).
A number of novel initiatives between fishermen and scientists have proven to be
beneficial. For example, the northern Gulf of St. Lawrence sentinel fishery program
enables fishermen to receive training in the collection of data and undertake
standardised sampling to collect data on a predetermined range of species (Gillis, 2002).
The data collected is relayed to fishermen’s association offices and subsequently
utilized in assessments on a number of stocks including Atlantic cod (Gadus morhua),
turbot (Scophthalmus maximus) and Atlantic halibut (Hippoglossus hippoglossus).
However, sentinel surveys could be portrayed as being excessively costly and
substantial funding is required to implement them effectively.
Fishers’ whole catch data has the potential to inform and improve current assessment
methodologies for data limited stocks at a fraction of the cost. The benefits of such data
go beyond the ability to provide trends in distribution and abundance and may also
provide opportunities for ‘fine tuning’ of existing assessments. This is especially true in
the case of megrim in Divisions IVa and VIa where fishers’ whole catch data, inclusive
of discards, has the potential to assist in the current assessment, which presently uses
estimates of discard rates (ICES, 2012f). Due to missing discards data, the current
70
assessment is made on the assumption that discard rates have decreased from 30% in
1985 to 15% in 2012. However, discard rates in the northern North Sea in recent years
were reportedly much higher in recent years, peaking at 70% for some vessels in 2009
(Laurenson and Macdonald, 2008). It should be noted that the vessels sampled during
that study were limited to those in the Shetland Fishermen’s Producer Organisation and
it may be that quota limitations as experienced by that PO were an artefact of the overall
quota availability. Irrespective of this, it is clear that fishers’ whole catch data has the
potential to provide more accurate estimates of fishing mortality and remove some of
the current uncertainty.
The possible effects of changes in technical regulations, fishers’ behaviour and quota
availability need to be considered if trends in diary derived CPUE are to be utilized
effectively. In the case of the present study the regulation for the cod-end mesh size
increased from 100mm to 120mm during 2002 and for the remainder of the time series.
This change in mesh size may have had an effect on the diary derived data, possibly
reducing CPUE due to increased selectivity. There is therefore a possibility that the
increases in CPUE evident in the diary data would have been more pronounced with the
original 100mm mesh size. However, this does not detract from the trends evident in the
data for each area, as the annual increases take place following the changes in mesh
size. The vessel selected for the current study undertook fishing in similar locations
around Shetland throughout the duration of the study, consistently fishing within the
three predefined Areas. Furthermore, as megrim was predominantly a by-catch species,
changes in the availability of quota was never an issue for the vessel. The skipper of the
vessel responded to the fishers’ questionnaire and noted, ‘We as a single trawler hardly
ever bother [targeting megrim] because we don't have a big enough quota since we
71
haven't ever targeted them’. This vessel regularly targeted the same species (primarily
haddock) and, according to the spatial distribution of effort shown here, fished in the
same areas over the study period.
If fishers’ perceptions and data are consistent with trends of abundance and distribution
within scientific data then, due to the time required for scientific data to feed through
the assessment process, information from fishers’ may act as an early indicator of
changes within stocks of fished species. This ‘early indication’ has been one of the aims
of the Fishers’ North Sea Stock Survey and agreement exists between fishers’
perceptions and survey trends for a number of the species surveyed. Furthermore, the
questionnaire, while not necessarily directly suitable for incorporation into the
assessment process, does allow fishers to provide opinions that can be considered at the
management level. This would enable a process whereby fishers’ and scientists’
perceptions of trends in stocks could be considered by managers to see if a consensus
exists and, if a consensus did not exist, then pre-determined guidelines could be
implemented to undertake a more precautionary approach to changes in TAC. For
example, if fishers and scientists both reported increases or decreases in a species’
abundance, then there would be a greater degree of confidence in decisions made by
managers to significantly alter TAC. However, if a consensus did not exist then
managers could provide a more cautious approach to the regulation of TAC until further
evidence was available in future years. This approach would require an honest
evaluation of stocks by fishers and an acceptance of a potential scenario of TAC
decreasing on the basis of the information they provide.
There is considerable potential for the use of fishers’ knowledge and data in the
assessment and management process in the demersal fishery in the northern North Sea.
72
To facilitate this, the North Sea Stock Survey, in its current form, could be adapted to
include other species of commercial importance, with the resulting species-specific
knowledge considered benchmarking exercises by appropriate ICES working groups
and at the management level. There is also potential for such a scheme to be expanded
to include the utilization of electronic logbooks with the capability of storing biological
and ecological data. Furthermore, a standardised approach to the collection and
utilization of fishers’ data can be achieved if all stakeholders engage in dialogue to
produce a scientifically robust methodology for the collection of whole catch and
distribution and abundance data, consistent with previous tally book schemes. The
success of such a scheme would require a formal commitment from all stakeholders to
avoid the subsequent drop off seen in past schemes. An example of one such successful
scheme is the Eastern Pacific Ocean skipjack tuna Katsuwonus pelamis fishery, where
logbook records are mandatory for the international purse-seine tuna fleet (Trigueros-
Salmeron and Ortega-Garcia, 2001). In a recent study, logbook records were used to
determine the most productive areas within the fishery as well as long-term spatial and
seasonal trends in catches and relative abundance from 1970-1995 (Trigueros-Salmeron
and Ortega-Garcia, 2001). Participation in a tally book scheme could be further
encouraged by ensuring that the resulting data is utilized in the assessment process and
the use of the data is reported back to fishers. Additional incentives have also been
recognised as an important element to be considered in the collection of fishery-
dependent data (Lordan et al., 2011). These could be facilitated through the provision of
additional effort or quota.
There is a need to ensure that all relevant sources of data are considered if global
fisheries are to be assessed and managed robustly and sustainably. The initiatives
73
outlined above have the potential to engage all stakeholders in the production of a
robust, structured methodology for collection and utilization of fishers’ knowledge and
data and also to ensure that necessary feedback exists between stakeholders. An
inclusive approach would also serve to instil a greater degree of confidence in the data
provided by fishers and its subsequent use within the management process. Further, a
structured approach, integrating fishers’ knowledge and data, allows for all stakeholders
to participate and contribute in the management process and, by ensuring that all
available knowledge of a given resource is utilized, provides the most inclusive
approach to resource management.
2.5 Conclusions
The results of this study have shown that trends in the distribution and relative
abundance of megrim were broadly comparable between the three data sources, fishers’
knowledge, fishers’ data and survey data. The utilization of fishers’ knowledge and
whole catch data therefore has the potential to assist in the assessment and management
of fish stocks by providing spatially and temporally detailed data on fish distribution
and abundance, as well as providing data on key components of assessments such as
discards data. A structured approach to fisheries assessment and management requires
full transparency and a formal agreement and commitment between all stakeholders to
provide and utilize the necessary data required to provide the most effective approach to
resource management.

74
CHAPTER 3
SPATIAL VARIATION IN LIFE HISTORY CHARACTERISITCS
OF COMMON MEGRIM LEPIDORHOMBUS WHIFFIAGONIS ON
THE NORTHERN SHELF
75
3.1 Introduction
The definition of what constitutes a stock has been evolving throughout the history of
fisheries research with varying definitions proposed by numerous authors (e.g. (Booke,
1981; Ihssen et al., 1981; Larkin, 1992)). In recent years a newer, less restrictive
definition proposed by Hilborn and Walters (1992) states that, ‘in the simplest terms, a
fish stock is identified as an arbitrary group of fish that is large enough to be self-
producing and that contain similar life history characteristics’.
A number of methods currently exist to assist in the determination of fish stock
structure. These include the use of techniques such as morphometric studies, genetic
markers, parasites as biological tags and physical tagging (Cadrin et al., 2005; Abaunza
et al., 2008b). Comparisons of life history parameters are also known to be useful for
distinguishing between fish stocks as they are representative phenotypic expressions of
genotypic and environmental interactions (Begg, 2005). Swain et al (2005) noted that
the use of life history parameters has been underrepresented as means of distinguishing
putative stocks. They further state that ‘observed environmental effects on life history
traits have contributed unduly to the relatively infrequent application of life history
traits to stock identification’.
Life history traits that are frequently compared across populations include reproductive
timing, effort, fecundity and egg size, growth and age at maturity. Age and growth
characteristics are the most frequently used parameters to identify fish stocks (Begg,
2005). Geographic variation in age and size composition may suggest independence of
recruitment or other factors as a basis of stock discrimination (Begg and Waldman,
1999). However, as with other life history parameters, determining whether variation is
due to environmental factors or exploitation is inherently difficult (Serchuk et al.,
76
1994). Methodologies for comparing growth curves between supposed fish stocks are
wide and varied (Haddon, 2001), although Beverton and Holt’s application (Beverton
and Holt, 1957) of the von Bertalanffy growth function (Von Bertalanffy, 1938) is the
most commonly used in fisheries science (Begg, 2005).
The underpinning biological definition of a fish stock is that it is a reproductively
isolated self-reproducing unit (Begg, 2005). As such, the location and timing of
reproduction is often population-specific (Dodson, 1997). The extent to which
reproductive parameters have been utilized to differentiate between stocks is wide and
varied and includes comparisons of reproductive biology (Finucane et al., 1986),
reproductive strategies and fecundity (Nissling and Dahlman, 2010). Such parameters
provide insight into the mechanisms that maintain stock integrity as well as measuring
the productivity and discreteness of fish stocks (Begg, 2005).
Age at maturity is also a useful trait to consider as a life history metric of stock
identification due to its close correspondence with individual fitness and population
growth rate (Swain et al., 2005). Further, Hutchings (2002) hypothesised that the age at
which a fish matures reflects an evolutionary compromise between the costs and
benefits to fitness of reproducing earlier or later in life. Age at maturity is known to be
responsive to selection (Cole, 1954) and exhibits a phenotypic plasticity in response to
external factors such as predation (Belk, 1995) and exploitation (Rochet, 1998).
Therefore, stocks of a given species in different geographical locations may exhibit
differing ages at maturity.
Numerous studies have utilized comparisons of one or more life history characteristics
as an initial basis to differentiate between populations and recognise discrete stock
77
units. Begg et al., (1999) noted that life history differences were generally maintained
between stocks of Atlantic cod (Gadus morhua), haddock (Melanogrammus aeglefinus)
and yellowtail flounder (Limanda ferruginea). Abaunza et al., (2008a) reported
differences in life history parameters such as length and age at first maturity, growth
and reproductive biology as the basis for the initial recognition of stock management
units in Atlantic horse mackerel Trachurus trachurus in the northeast Atlantic and
Mediterranean Sea. Comparisons of life history characteristics such as growth and age
at sex change between locations were used to determine stock structure of the blue
threadfin Eleutheronema tetradactylum across northern Australia (Ballagh et al., 2012).
Knowledge on the stock structure of megrim on the Northern Shelf (northern North Sea,
west of Scotland and Rockall) has gradually developed in recent years. Prior to 1998
megrim in IVa was not considered by ICES and no advice was provided. Between 1999
and 2008 TAC in IVa was set using average catches from previous years although no
advice on the status of the stock was available. Advice was provided for Rockall (VIb)
and the west of Scotland (VIa) during this period. In 2009 and 2010 qualitative advice
was produced for all three areas on the Northern Shelf (IVa, VIa and VIb) collectively,
primarily based on survey trends (ICES, 2010). ICES noted that advice on the status of
megrim in the northern North Sea (IVa) was provided for the first time in 2009, as
fishery independent data had become available for the area. ICES also noted that advice
was provided for northern North Sea (IVa) because the spatial distribution of landings
data and survey catches provide evidence to suggest that the megrim population is
contiguous between the northern North Sea (IVa) and west of Scotland (VIa) (ICES,
2009).
78
In 2011 management advice was updated further and megrim in the northern North Sea
(IVa) and west of Scotland (VIa) were considered together as a single stock while
Rockall (VIb) was considered separately. This was due to a recommendation, following
a benchmarking exercise, that megrim in the northern North Sea (IVa) and west of
Scotland (VIa) comprised one continuous stock while megrim at Rockall (VIb)
comprised a separate stock (ICES, 2011d).
Despite the recent changes to the definition of megrim stocks on the Northern Shelf,
preliminary biological data collected in ICES Area IV suggest that there may be
differences in biological parameters, including both growth and reproduction, when
compared to the adjacent area VI (west of Scotland) and also areas further south. The
spawning season is typically from March to April in Area VI (Gordon, 2001) while in
Area IV it has been reported to last through the summer months (Laurenson and
Macdonald, 2008). Although limited data is available on megrim reproduction in IV, the
annual reproductive cycle, including timing and location of spawning are unknown.
Further, length at first maturity (L50%) has previously been estimated for Rockall and the
west of Scotland (Gordon, 2001) but is unknown in the northern North Sea.
The aim of this study was to determine whether differences in life history parameters
exist between populations of L. whiffiagonis along the longitudinal extremes of its
distribution on the Northern Shelf and whether the evidence from this study supports the
management units implemented in 2011. Life history characteristics including
reproductive timing, sex ratio, growth and maturation were compared between megrim
survey catches from Rockall (VIb) and commercial catches from the northern North Sea
(IVa).
79
3.2 Materials & Methods
3.2.1 Sampling
The study area (Figure 21) covered ICES Subdivisions VIb (Rockall) and IVa (northern
North Sea). Data collection in the northern North Sea was primarily undertaken on
commercial vessels executing the mixed demersal fishery. One observer trip per month,
lasting up to 7 days, was undertaken for a one year period from May 2010 to April
2011. In order to maximise coverage, data was collected from the two types of fishing
vessel that predominantly target megrim, twin trawl and Scottish seine. Vessels fished
nets with 120mm mesh in the wings and 120mm mesh in the cod-end. Twin trawl tows
normally lasted for six hours with up to four tows in any 24-hour period. Scottish seine
tows lasted for two hours during daylight with 4-8 hauls/day depending on the season.
The towing speed was approximately 3 knots for both types of vessel. All fishing was
undertaken in depths between 88 and 200 m. Data for Rockall was collected during the
annual Anglerfish survey (co-ordinated by Marine Scotland Science (MSS)) during
April/May 2009 and 2010. The survey design was stratified i.e. a greater number of
tows were undertaken in areas where anglerfish abundance was perceived to be higher.
Trawling took place during daylight hours on the RV Scotia using MSS’s Jackson 575
Monk Survey single trawl with 120mm mesh in the wings and 100mm mesh in the cod-
end. The survey trawl was designed to be typical of that used by the Scottish fleet
targeting the west coast anglerfish fishery (Fernandes, 2008). Tows were undertaken in
depths ranging from 130 to 680 m and lasted for 1 hour each (from the time the gear
was on the seabed to when it was hauled). The distribution of sampling at Rockall and
the northern North Sea is shown in Figure 21.
80
Sagittal otoliths were removed from a length-stratified sub-sample each month and
stored dry in 5 ml plastic vials. Otoliths were read whole immersed in water under
reflected light at 20 x magnification to determine the age of individual fish. Age
determination followed best practise protocols recommended by Egan et al. (2004).
3.2.1 Spawning pattern
In both areas all megrim were measured to the nearest cm and maturity stage was
determined macroscopically using the standardized maturity scale proposed by Brown-
Peterson et al. (2011). The maturity scale is outlined in Table 4. The spawning period in
the northern North Sea was determined by calculating the frequency of male and female
fish at each stage of maturity for each month. Visual assessment of gonads allowed for
the distinction between immature and maturing/regenerating individuals. A sub-sample
≤ 2g of reproductive tissue was removed from 3 gonads per cm, across the entire length
range, and stored in a fixative for histological analysis. Differences in spawning period
between the North Sea and Rockall were determined by comparing the frequency of
female fish at each stage of maturity during April and May. Only adult fish were
included in the analysis for both areas.
A small section, approximately 10mm3, was dissected from each preserved gonad
sample and placed in individual tissue cassettes. Tissue cassettes were stored in
formalin until processing. Tissues were processed using a Shandon Citadel 1000 tissue
processor with sixty samples processed during each 17 hour cycle. The tissue
processing protocol is outlined in Table 5 and is based on optimum processing times for
megrim reproductive tissue calculated at Instituto de Investigaciones Marinas, Vigo. In
order to produce optimum results and reduce the likelihood of artefacts, solutions in the
tissue processor were replaced following 10-15 complete rotations.
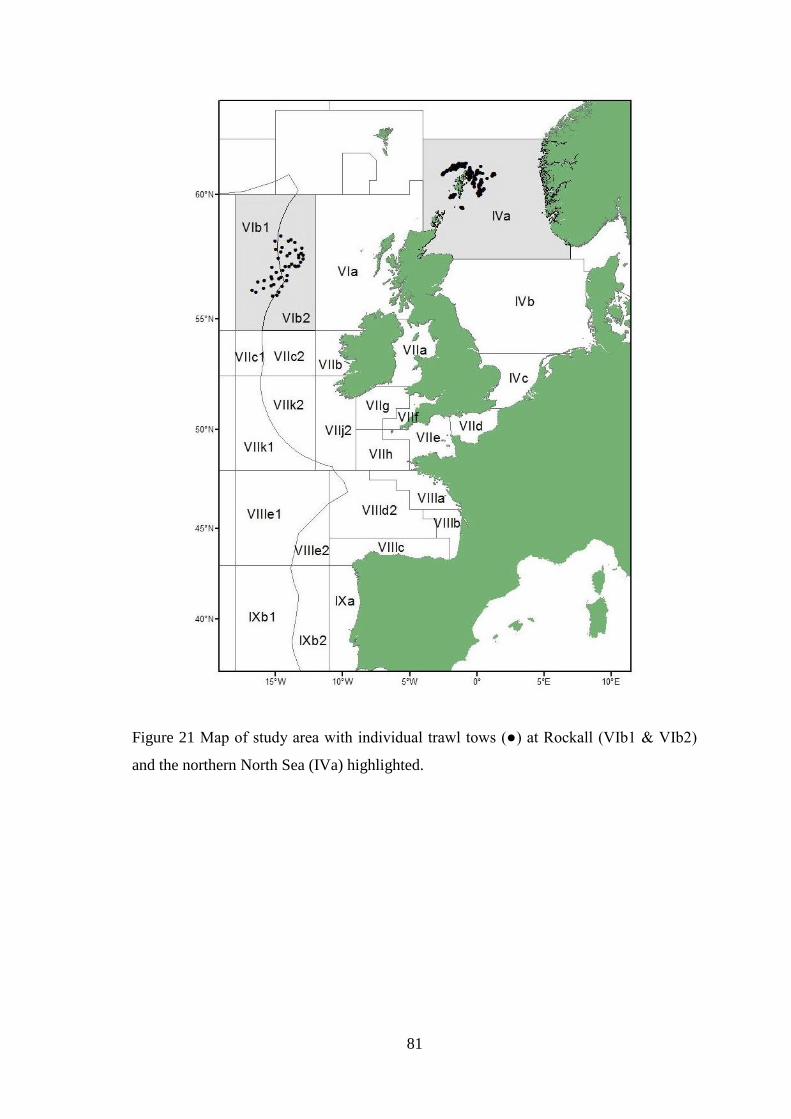
81
Figure 21 Map of study area with individual trawl tows (●) at Rockall (VIb1 & VIb2)
and the northern North Sea (IVa) highlighted.
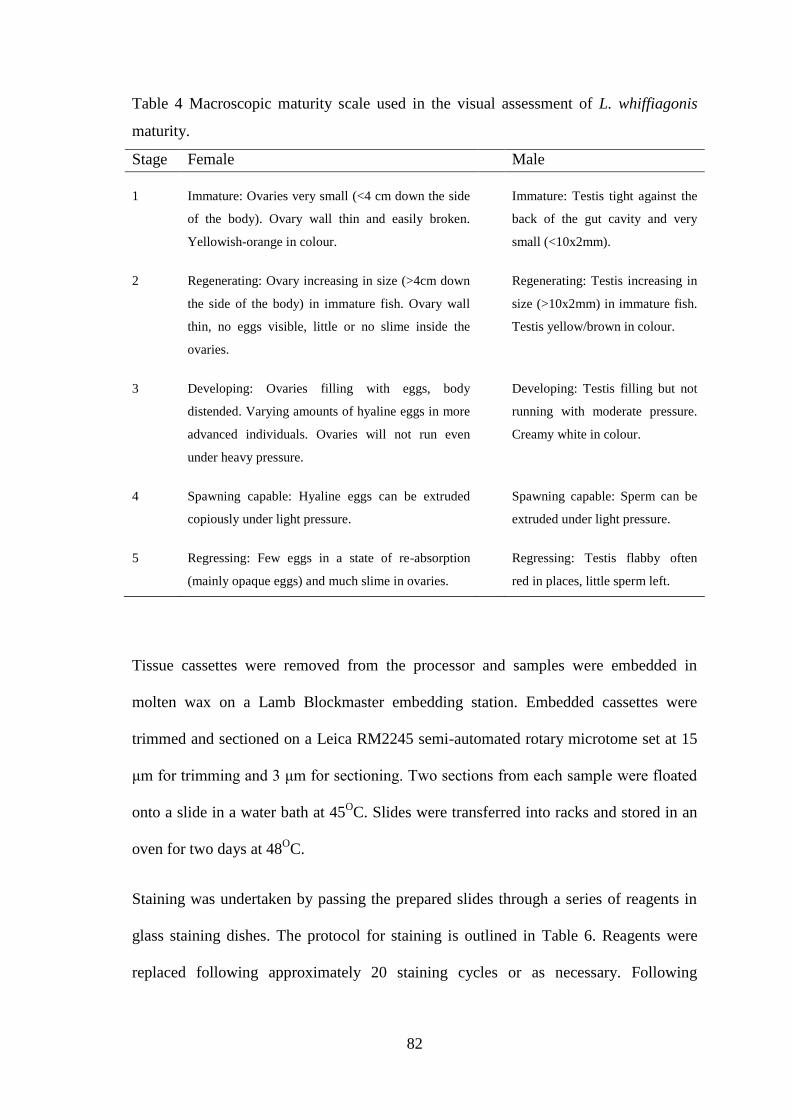
82
Table 4 Macroscopic maturity scale used in the visual assessment of L. whiffiagonis
maturity.
Stage Female Male
1 Immature: Ovaries very small (<4 cm down the side
of the body). Ovary wall thin and easily broken.
Yellowish-orange in colour.
Immature: Testis tight against the
back of the gut cavity and very
small (<10x2mm).
2 Regenerating: Ovary increasing in size (>4cm down
the side of the body) in immature fish. Ovary wall
thin, no eggs visible, little or no slime inside the
ovaries.
Regenerating: Testis increasing in
size (>10x2mm) in immature fish.
Testis yellow/brown in colour.
3 Developing: Ovaries filling with eggs, body
distended. Varying amounts of hyaline eggs in more
advanced individuals. Ovaries will not run even
under heavy pressure.
Developing: Testis filling but not
running with moderate pressure.
Creamy white in colour.
4 Spawning capable: Hyaline eggs can be extruded
copiously under light pressure.
Spawning capable: Sperm can be
extruded under light pressure.
5 Regressing: Few eggs in a state of re-absorption
(mainly opaque eggs) and much slime in ovaries.
Regressing: Testis flabby often
red in places, little sperm left.
Tissue cassettes were removed from the processor and samples were embedded in
molten wax on a Lamb Blockmaster embedding station. Embedded cassettes were
trimmed and sectioned on a Leica RM2245 semi-automated rotary microtome set at 15
μm for trimming and 3 μm for sectioning. Two sections from each sample were floated
onto a slide in a water bath at 45OC. Slides were transferred into racks and stored in an
oven for two days at 48OC.
Staining was undertaken by passing the prepared slides through a series of reagents in
glass staining dishes. The protocol for staining is outlined in Table 6. Reagents were
replaced following approximately 20 staining cycles or as necessary. Following
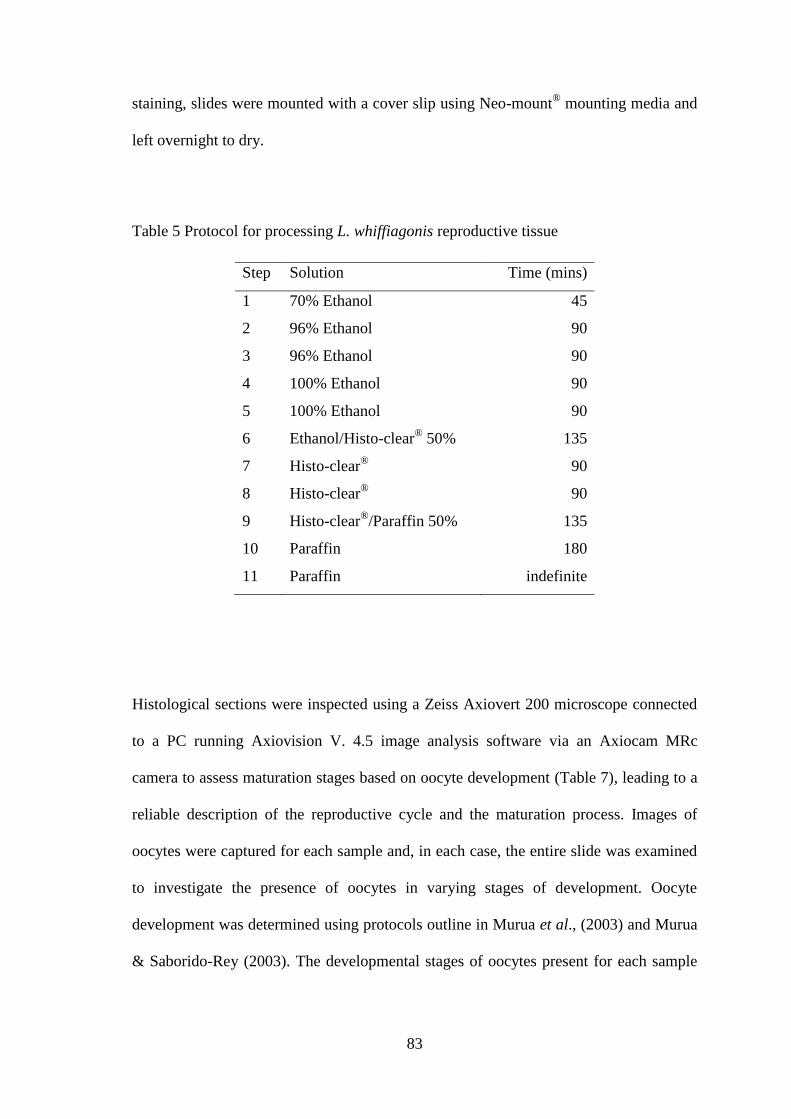
83
staining, slides were mounted with a cover slip using Neo-mount® mounting media and
left overnight to dry.
Table 5 Protocol for processing L. whiffiagonis reproductive tissue
Step Solution Time (mins)
1 70% Ethanol 45
2 96% Ethanol 90
3 96% Ethanol 90
4 100% Ethanol 90
5 100% Ethanol 90
6 Ethanol/Histo-clear® 50% 135
7 Histo-clear®
90
8 Histo-clear®
90
9 Histo-clear®/Paraffin 50% 135
10 Paraffin 180
11 Paraffin indefinite
Histological sections were inspected using a Zeiss Axiovert 200 microscope connected
to a PC running Axiovision V. 4.5 image analysis software via an Axiocam MRc
camera to assess maturation stages based on oocyte development (Table 7), leading to a
reliable description of the reproductive cycle and the maturation process. Images of
oocytes were captured for each sample and, in each case, the entire slide was examined
to investigate the presence of oocytes in varying stages of development. Oocyte
development was determined using protocols outline in Murua et al., (2003) and Murua
& Saborido-Rey (2003). The developmental stages of oocytes present for each sample
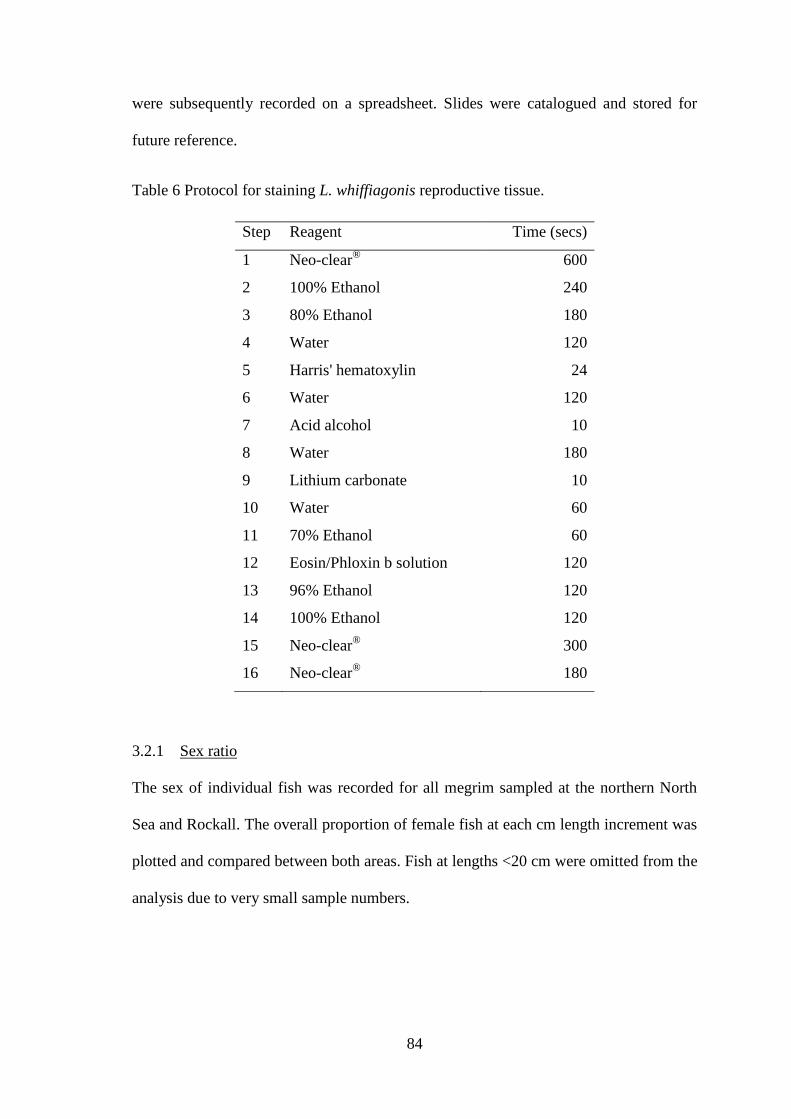
84
were subsequently recorded on a spreadsheet. Slides were catalogued and stored for
future reference.
Table 6 Protocol for staining L. whiffiagonis reproductive tissue.
Step Reagent Time (secs)
1 Neo-clear®
600
2 100% Ethanol 240
3 80% Ethanol 180
4 Water 120
5 Harris' hematoxylin 24
6 Water 120
7 Acid alcohol 10
8 Water 180
9 Lithium carbonate 10
10 Water 60
11 70% Ethanol 60
12 Eosin/Phloxin b solution 120
13 96% Ethanol 120
14 100% Ethanol 120
15 Neo-clear®
300
16 Neo-clear®
180
3.2.1 Sex ratio
The sex of individual fish was recorded for all megrim sampled at the northern North
Sea and Rockall. The overall proportion of female fish at each cm length increment was
plotted and compared between both areas. Fish at lengths <20 cm were omitted from the
analysis due to very small sample numbers.
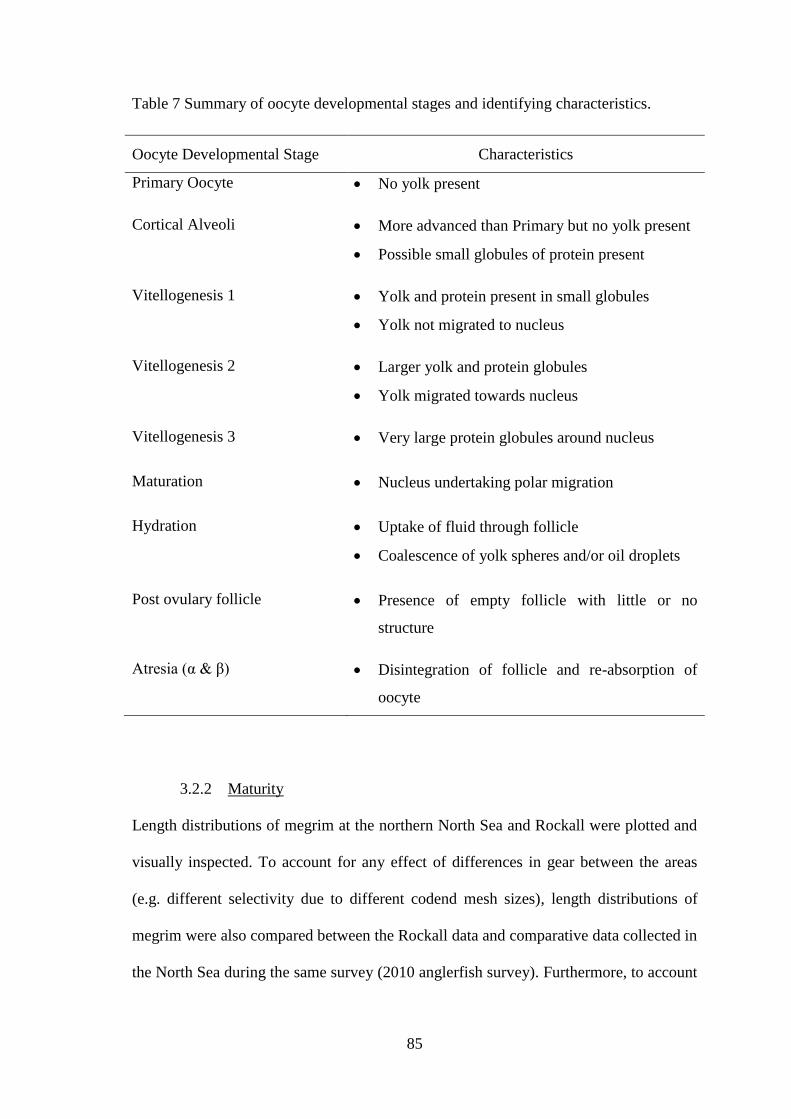
85
Table 7 Summary of oocyte developmental stages and identifying characteristics.
Oocyte Developmental Stage Characteristics
Primary Oocyte No yolk present
Cortical Alveoli More advanced than Primary but no yolk present
Possible small globules of protein present
Vitellogenesis 1 Yolk and protein present in small globules
Yolk not migrated to nucleus
Vitellogenesis 2 Larger yolk and protein globules
Yolk migrated towards nucleus
Vitellogenesis 3 Very large protein globules around nucleus
Maturation Nucleus undertaking polar migration
Hydration Uptake of fluid through follicle
Coalescence of yolk spheres and/or oil droplets
Post ovulary follicle Presence of empty follicle with little or no
structure
Atresia (α & β) Disintegration of follicle and re-absorption of
oocyte
3.2.2 Maturity
Length distributions of megrim at the northern North Sea and Rockall were plotted and
visually inspected. To account for any effect of differences in gear between the areas
(e.g. different selectivity due to different codend mesh sizes), length distributions of
megrim were also compared between the Rockall data and comparative data collected in
the North Sea during the same survey (2010 anglerfish survey). Furthermore, to account
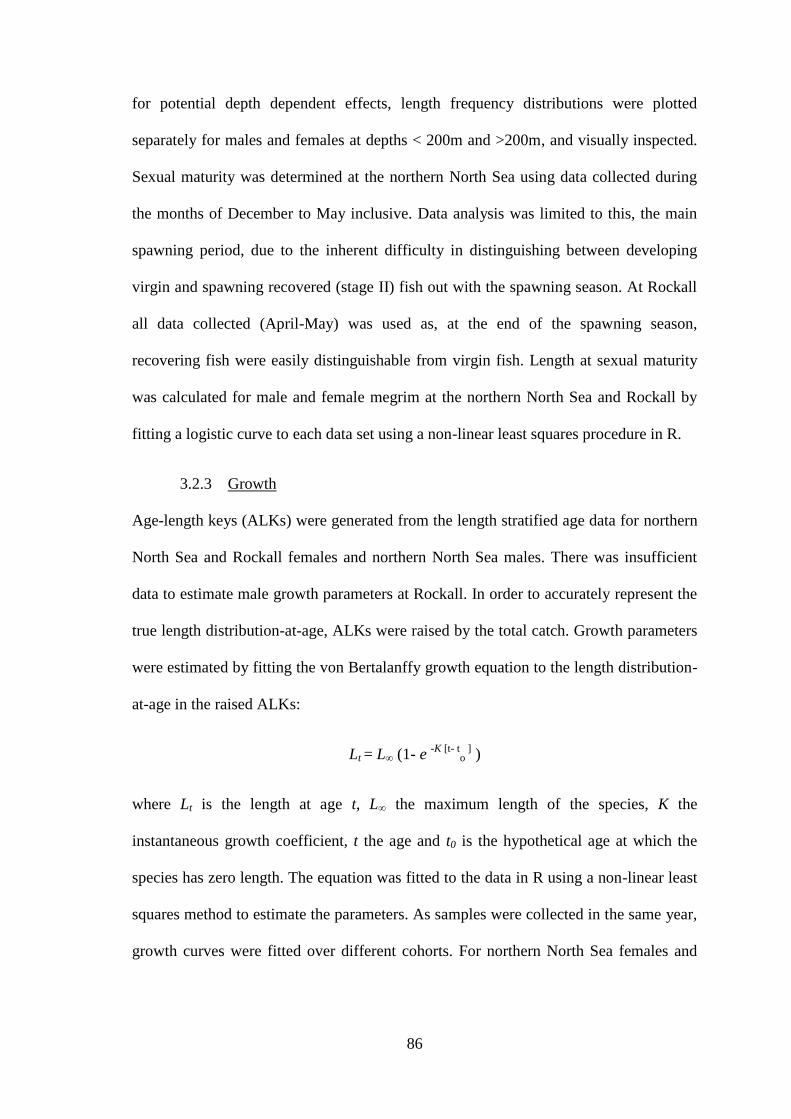
86
for potential depth dependent effects, length frequency distributions were plotted
separately for males and females at depths < 200m and >200m, and visually inspected.
Sexual maturity was determined at the northern North Sea using data collected during
the months of December to May inclusive. Data analysis was limited to this, the main
spawning period, due to the inherent difficulty in distinguishing between developing
virgin and spawning recovered (stage II) fish out with the spawning season. At Rockall
all data collected (April-May) was used as, at the end of the spawning season,
recovering fish were easily distinguishable from virgin fish. Length at sexual maturity
was calculated for male and female megrim at the northern North Sea and Rockall by
fitting a logistic curve to each data set using a non-linear least squares procedure in R.
3.2.3 Growth
Age-length keys (ALKs) were generated from the length stratified age data for northern
North Sea and Rockall females and northern North Sea males. There was insufficient
data to estimate male growth parameters at Rockall. In order to accurately represent the
true length distribution-at-age, ALKs were raised by the total catch. Growth parameters
were estimated by fitting the von Bertalanffy growth equation to the length distribution-
at-age in the raised ALKs:
Lt = L∞ (1- e -K [t- t
o ] )
where Lt is the length at age t, L∞ the maximum length of the species, K the
instantaneous growth coefficient, t the age and t0 is the hypothetical age at which the
species has zero length. The equation was fitted to the data in R using a non-linear least
squares method to estimate the parameters. As samples were collected in the same year,
growth curves were fitted over different cohorts. For northern North Sea females and
87
males, all estimated parameters (L∞, K, and t0) had p-values <0.05. For Rockall females,
the parameters L∞ and t0 had p-values <0.05 while K had a p-value = 1. This suggested
that growth of Rockall females follows a linear trend. A linear model was subsequently
fitted to the Rockall female data.
Furthermore, to investigate possible depth dependent differences in length at age that
may produce bias in the Rockall growth equation, raised ALKs were produced to
compare depths <200m and >200m at Rockall with the North Sea (all sampling in the
North Sea was at depths <200m).
3.3 Results
3.3.1 Spawning pattern
Spawning capable fish were evident in the northern North Sea from February to August.
Monthly frequencies of female and male maturity stages are shown in Figure 22 and
monthly sample sizes are shown in Table 8. Gonads began to develop during the winter
months, from November onwards. The first evidence of females becoming ‘spawning
capable’ (Table 4) was during January. The percentage of females spawning increased
during February and March, peaking in March. The prevalence of spawning females
then decreased in subsequent months although there was evidence of females still
developing and spawning through July. There were few developing or spawning
capable fish evident in August, indicating the end of the spawning season. During
September and October there was a two month inactive period where all mature fish
were regenerating. The reproductive timing of males and the proportions in each
maturity stage followed a similar pattern to females except during January and
February. During these months males were mostly spawning capable and therefore
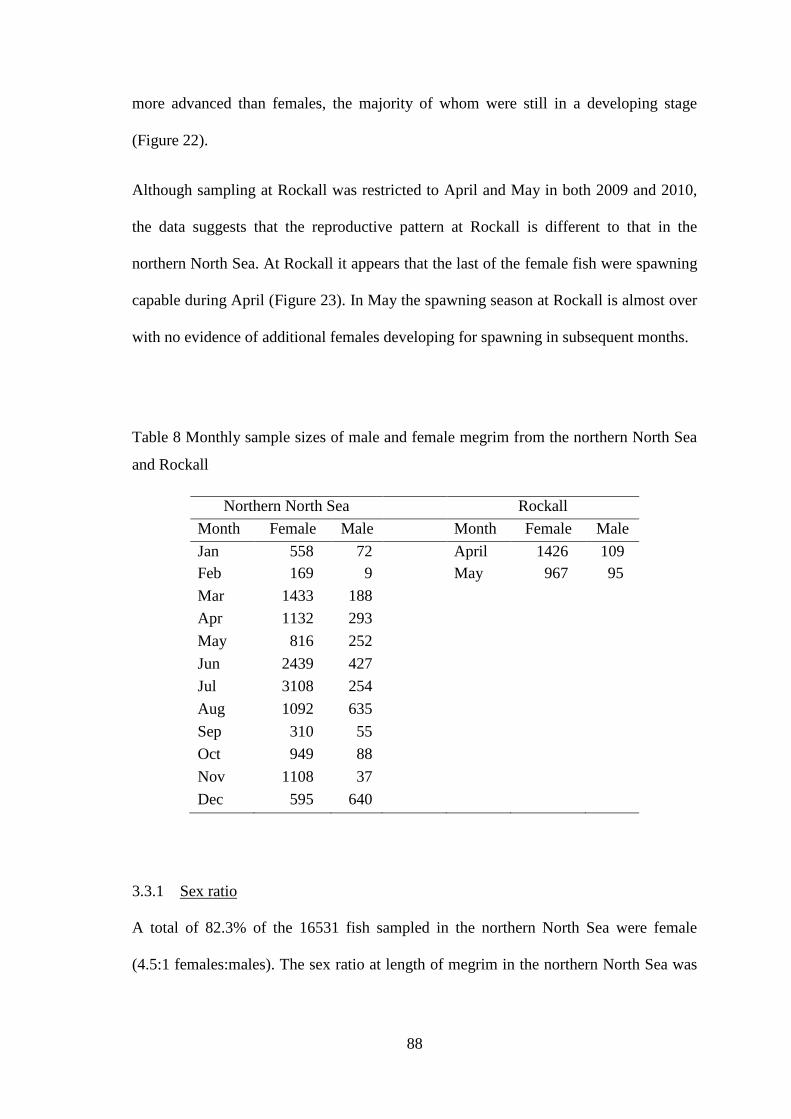
88
more advanced than females, the majority of whom were still in a developing stage
(Figure 22).
Although sampling at Rockall was restricted to April and May in both 2009 and 2010,
the data suggests that the reproductive pattern at Rockall is different to that in the
northern North Sea. At Rockall it appears that the last of the female fish were spawning
capable during April (Figure 23). In May the spawning season at Rockall is almost over
with no evidence of additional females developing for spawning in subsequent months.
Table 8 Monthly sample sizes of male and female megrim from the northern North Sea
and Rockall
Northern North Sea Rockall
Month Female Male Month Female Male
Jan 558 72 April 1426 109
Feb 169 9 May 967 95
Mar 1433 188
Apr 1132 293
May 816 252
Jun 2439 427
Jul 3108 254
Aug 1092 635
Sep 310 55
Oct 949 88
Nov 1108 37
Dec 595 640
3.3.1 Sex ratio
A total of 82.3% of the 16531 fish sampled in the northern North Sea were female
(4.5:1 females:males). The sex ratio at length of megrim in the northern North Sea was
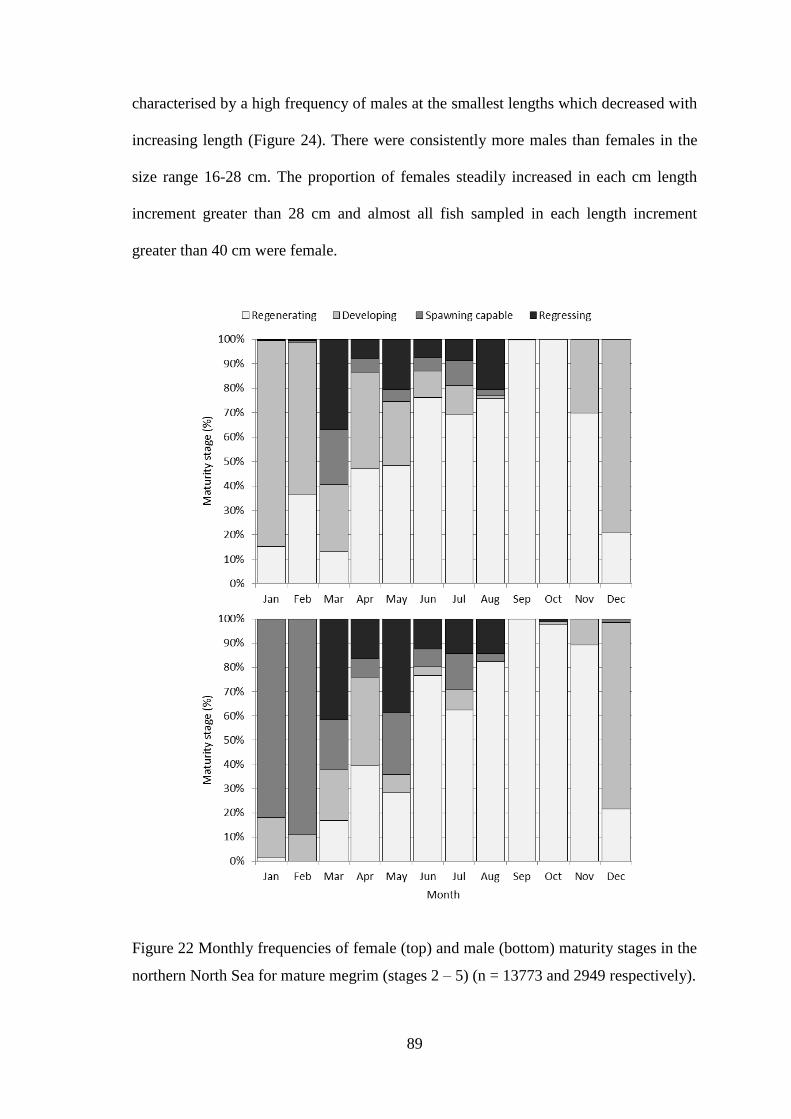
89
characterised by a high frequency of males at the smallest lengths which decreased with
increasing length (Figure 24). There were consistently more males than females in the
size range 16-28 cm. The proportion of females steadily increased in each cm length
increment greater than 28 cm and almost all fish sampled in each length increment
greater than 40 cm were female.
Figure 22 Monthly frequencies of female (top) and male (bottom) maturity stages in the
northern North Sea for mature megrim (stages 2 – 5) (n = 13773 and 2949 respectively).
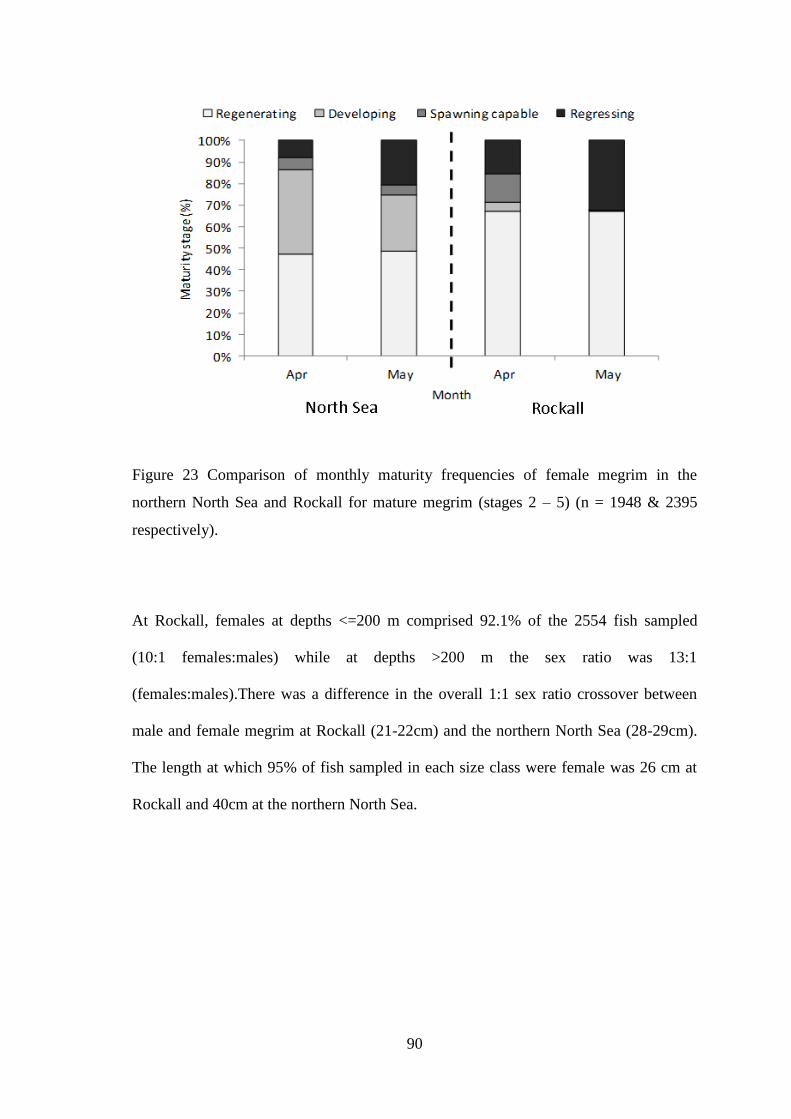
90
Figure 23 Comparison of monthly maturity frequencies of female megrim in the
northern North Sea and Rockall for mature megrim (stages 2 – 5) (n = 1948 & 2395
respectively).
At Rockall, females at depths <=200 m comprised 92.1% of the 2554 fish sampled
(10:1 females:males) while at depths >200 m the sex ratio was 13:1
(females:males).There was a difference in the overall 1:1 sex ratio crossover between
male and female megrim at Rockall (21-22cm) and the northern North Sea (28-29cm).
The length at which 95% of fish sampled in each size class were female was 26 cm at
Rockall and 40cm at the northern North Sea.
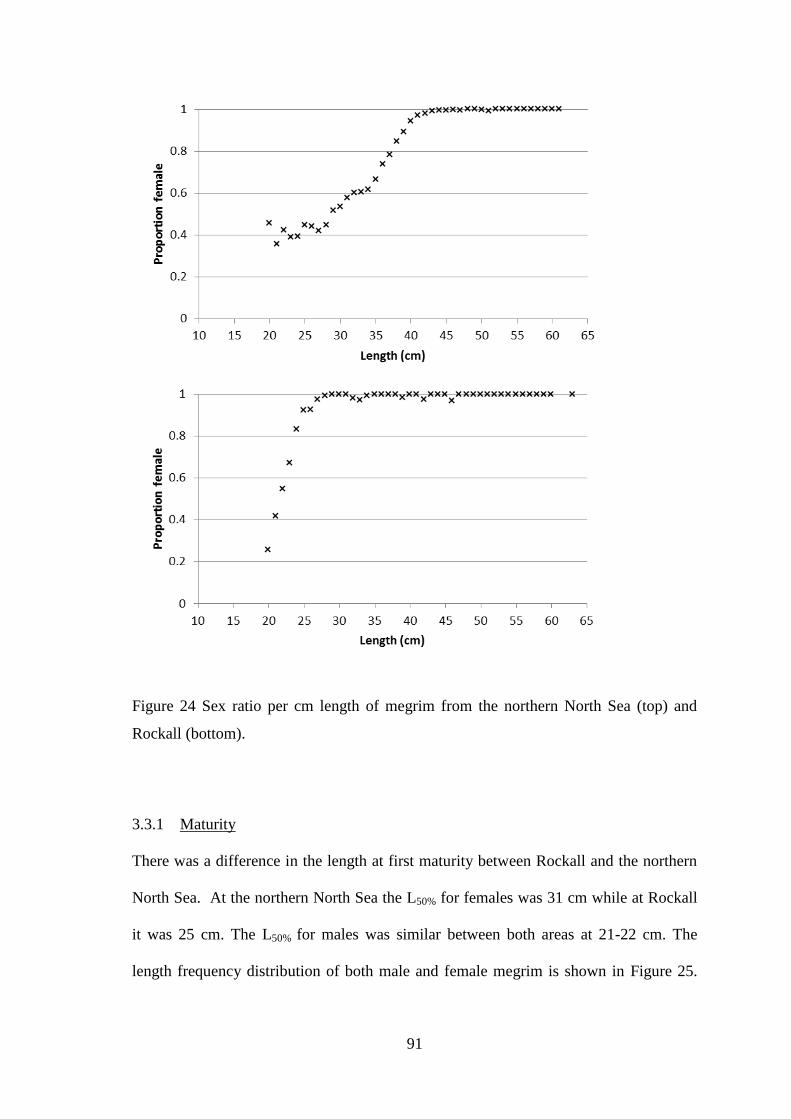
91
Figure 24 Sex ratio per cm length of megrim from the northern North Sea (top) and
Rockall (bottom).
3.3.1 Maturity
There was a difference in the length at first maturity between Rockall and the northern
North Sea. At the northern North Sea the L50% for females was 31 cm while at Rockall
it was 25 cm. The L50% for males was similar between both areas at 21-22 cm. The
length frequency distribution of both male and female megrim is shown in Figure 25.
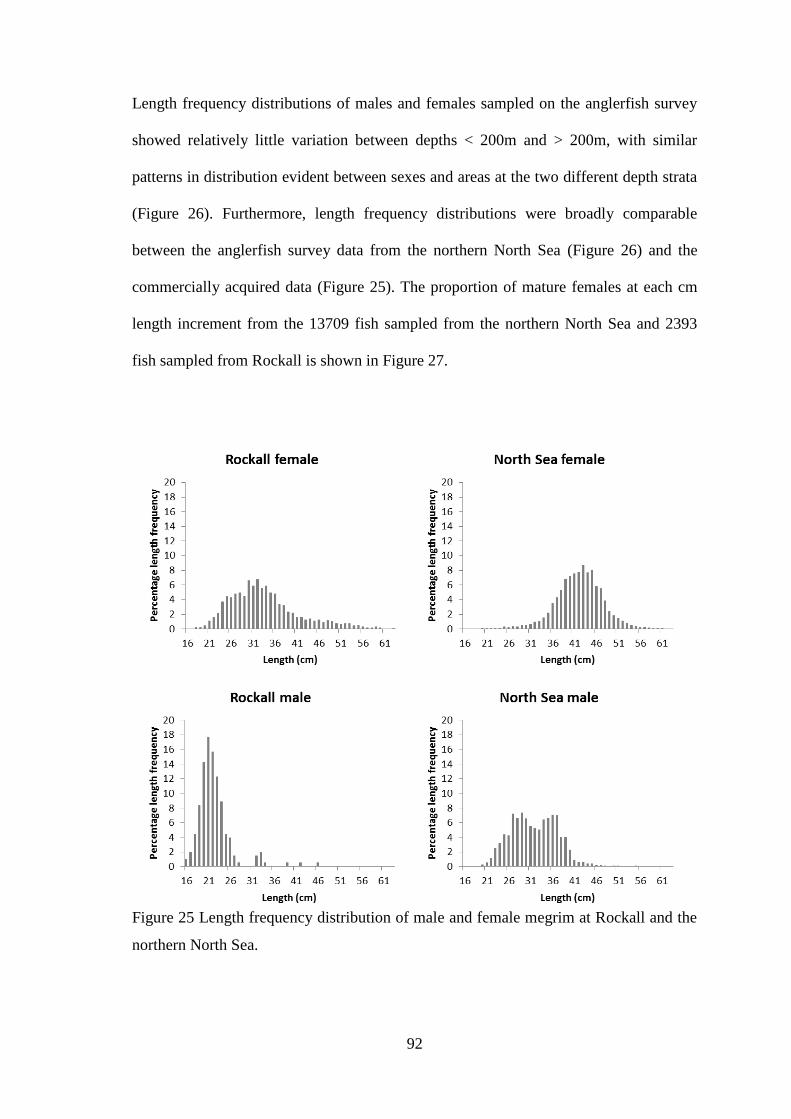
92
Length frequency distributions of males and females sampled on the anglerfish survey
showed relatively little variation between depths < 200m and > 200m, with similar
patterns in distribution evident between sexes and areas at the two different depth strata
(Figure 26). Furthermore, length frequency distributions were broadly comparable
between the anglerfish survey data from the northern North Sea (Figure 26) and the
commercially acquired data (Figure 25). The proportion of mature females at each cm
length increment from the 13709 fish sampled from the northern North Sea and 2393
fish sampled from Rockall is shown in Figure 27.
Figure 25 Length frequency distribution of male and female megrim at Rockall and the
northern North Sea.
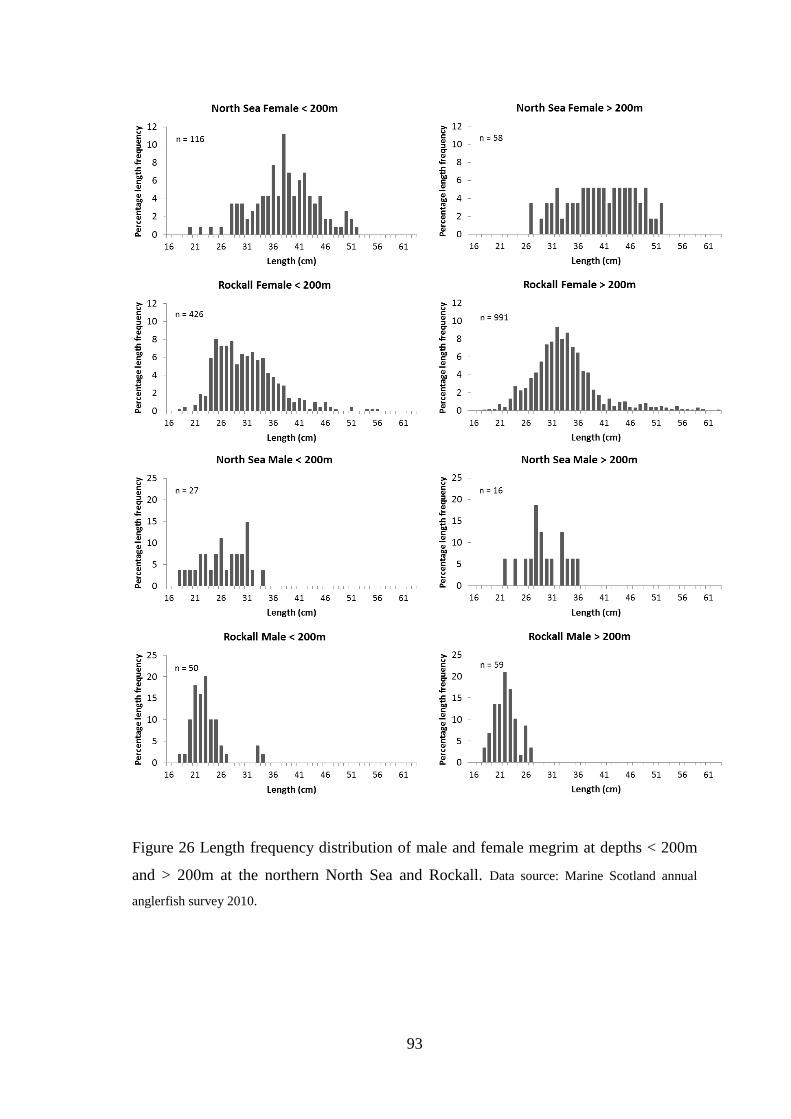
93
Figure 26 Length frequency distribution of male and female megrim at depths < 200m
and > 200m at the northern North Sea and Rockall. Data source: Marine Scotland annual
anglerfish survey 2010.
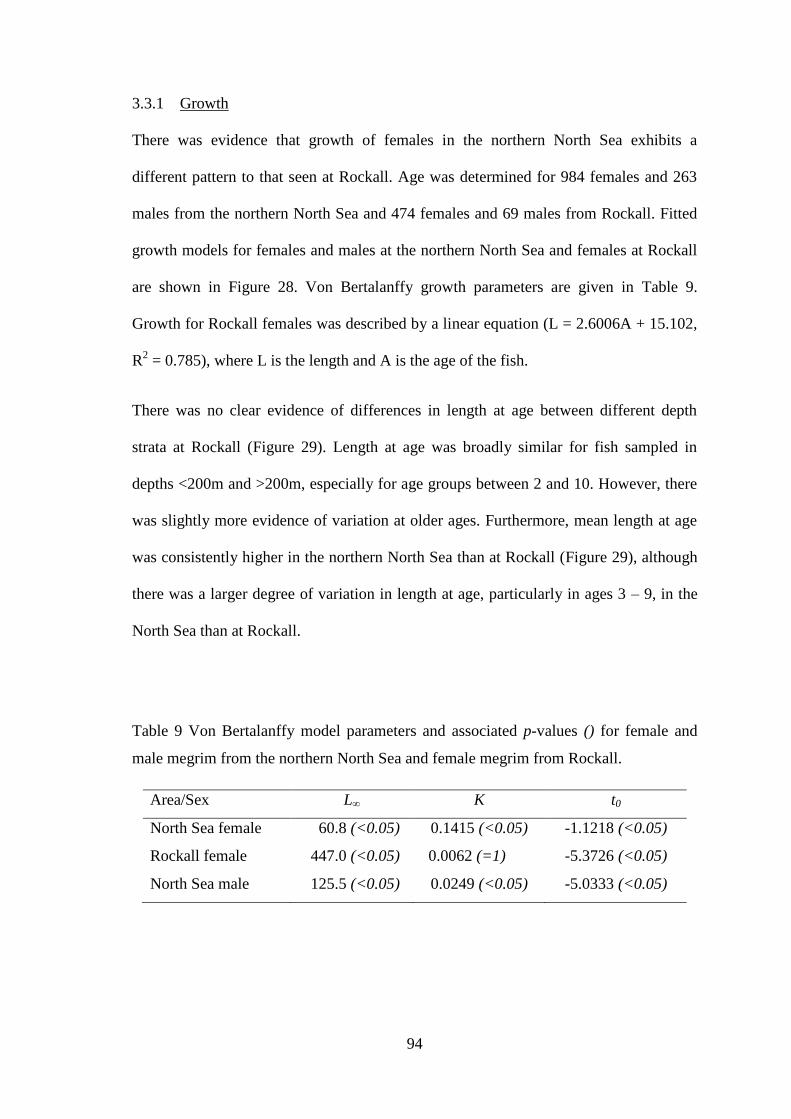
94
3.3.1 Growth
There was evidence that growth of females in the northern North Sea exhibits a
different pattern to that seen at Rockall. Age was determined for 984 females and 263
males from the northern North Sea and 474 females and 69 males from Rockall. Fitted
growth models for females and males at the northern North Sea and females at Rockall
are shown in Figure 28. Von Bertalanffy growth parameters are given in Table 9.
Growth for Rockall females was described by a linear equation (L = 2.6006A + 15.102,
R2 = 0.785), where L is the length and A is the age of the fish.
There was no clear evidence of differences in length at age between different depth
strata at Rockall (Figure 29). Length at age was broadly similar for fish sampled in
depths <200m and >200m, especially for age groups between 2 and 10. However, there
was slightly more evidence of variation at older ages. Furthermore, mean length at age
was consistently higher in the northern North Sea than at Rockall (Figure 29), although
there was a larger degree of variation in length at age, particularly in ages 3 – 9, in the
North Sea than at Rockall.
Table 9 Von Bertalanffy model parameters and associated p-values () for female and
male megrim from the northern North Sea and female megrim from Rockall.
Area/Sex L∞ K t0
North Sea female 60.8 (<0.05) 0.1415 (<0.05) -1.1218 (<0.05)
Rockall female 447.0 (<0.05) 0.0062 (=1) -5.3726 (<0.05)
North Sea male 125.5 (<0.05) 0.0249 (<0.05) -5.0333 (<0.05)
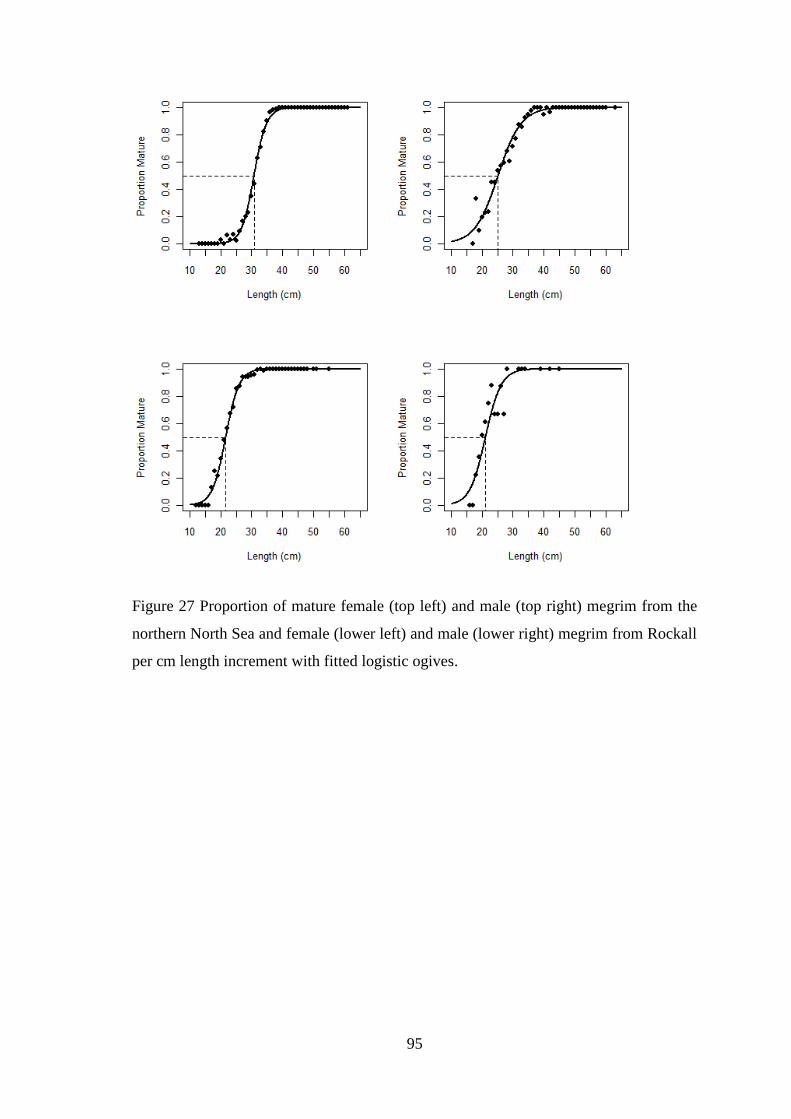
95
Figure 27 Proportion of mature female (top left) and male (top right) megrim from the
northern North Sea and female (lower left) and male (lower right) megrim from Rockall
per cm length increment with fitted logistic ogives.
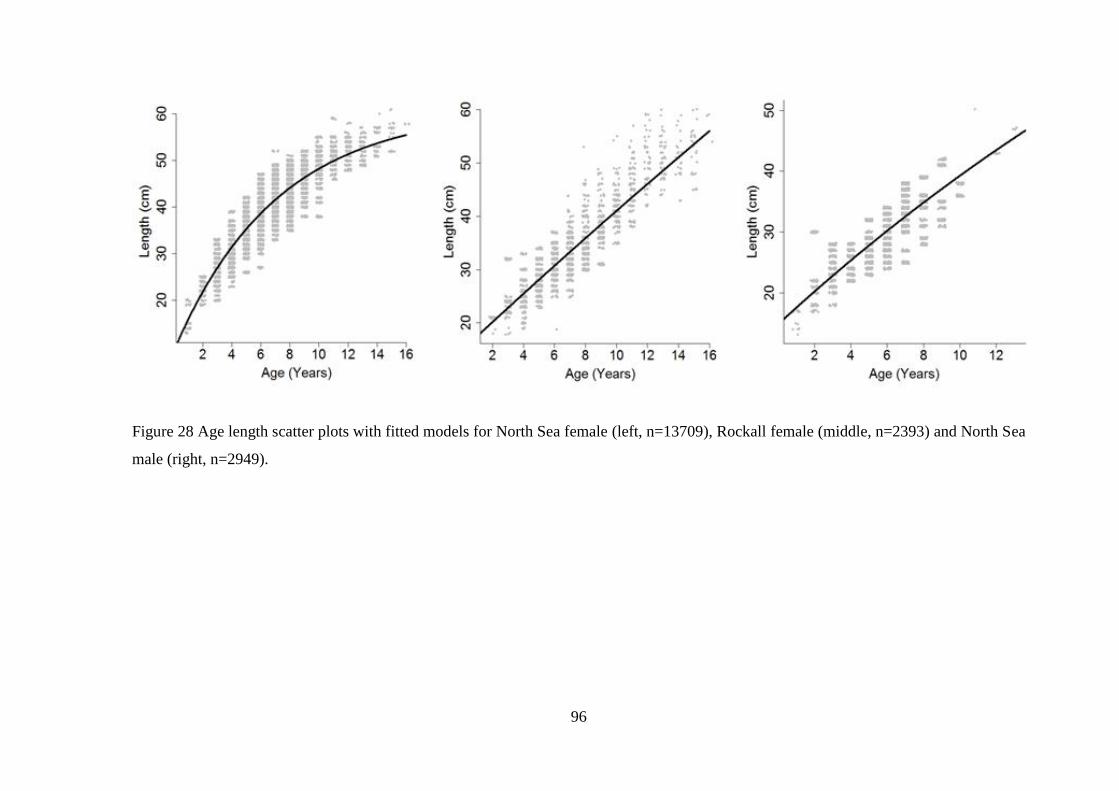
96
Figure 28 Age length scatter plots with fitted models for North Sea female (left, n=13709), Rockall female (middle, n=2393) and North Sea
male (right, n=2949).
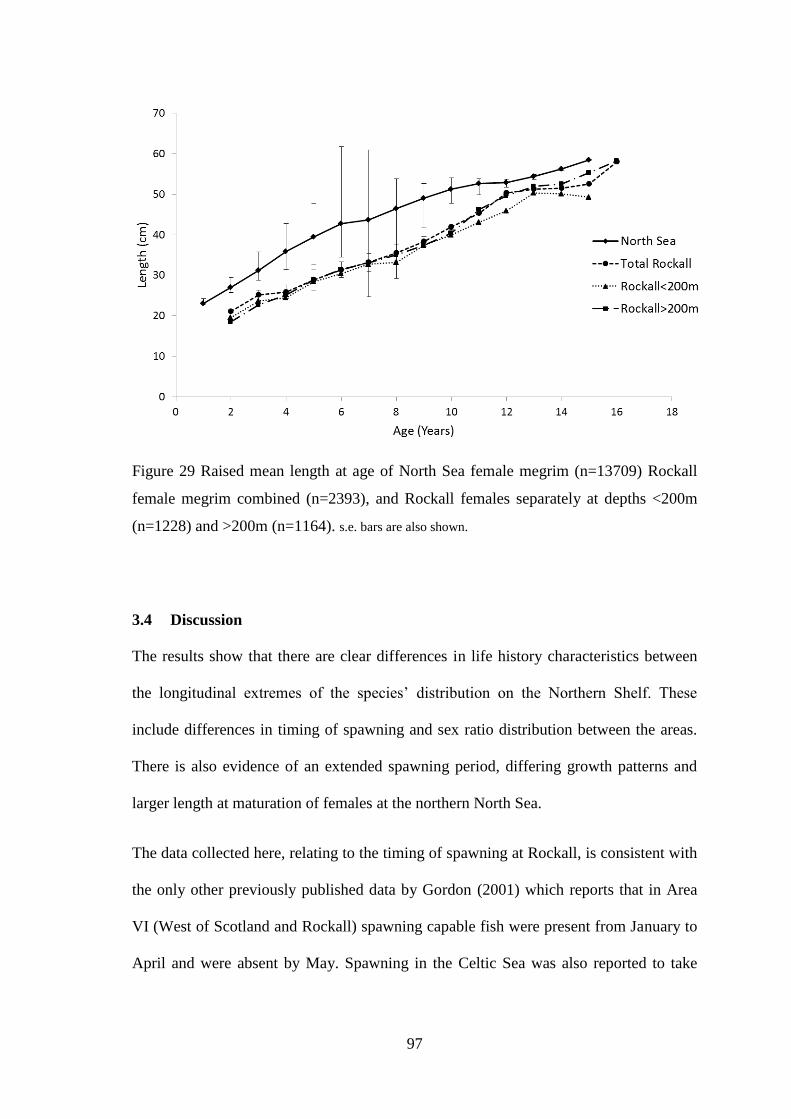
97
Figure 29 Raised mean length at age of North Sea female megrim (n=13709) Rockall
female megrim combined (n=2393), and Rockall females separately at depths <200m
(n=1228) and >200m (n=1164). s.e. bars are also shown.
3.4 Discussion
The results show that there are clear differences in life history characteristics between
the longitudinal extremes of the species’ distribution on the Northern Shelf. These
include differences in timing of spawning and sex ratio distribution between the areas.
There is also evidence of an extended spawning period, differing growth patterns and
larger length at maturation of females at the northern North Sea.
The data collected here, relating to the timing of spawning at Rockall, is consistent with
the only other previously published data by Gordon (2001) which reports that in Area
VI (West of Scotland and Rockall) spawning capable fish were present from January to
April and were absent by May. Spawning in the Celtic Sea was also reported to take
98
place between January and April (Aubin-Ottenheimer, 1987). In this study we found
spawning capable megrim present at the northern North Sea into August. Similarly,
Laurenson & Macdonald (2008) noted that the spawning season for megrim in IVa
continued into August with very few fish still spawning capable in September.
Differences in the spawning pattern reported here between the northern North Sea and
Rockall may be indicative of differences in spawning strategy between the two areas. In
the northern North Sea the presence of spawning capable fish in samples through to
August and September is evidence of a different spawning strategy compared to other
areas of the species’ distribution. Gordon (2001) reported that the spawning season
along the shelf edge on the west coast of Scotland, including the shelf edge along the
western edge of IVa, was similar to that at Rockall. The study did not however, include
individuals from within the North Sea basin. It would therefore be beneficial to
ascertain whether any spatial differences exist in spawning pattern within IVa i.e. east
of Shetland (within the North Sea basin) and west of Shetland, towards and along the
shelf edge. Further work is also required to determine what underlying mechanisms
contribute to the protracted spawning season in the northern North Sea.
Length distributions of megrim differed between males and females at both the northern
North Sea and Rockall. The size distribution of males evident at Rockall is similar to
those seen in other areas (Poulard et al., 1993; Gerritsen et al., 2010) while the size
distribution of males that we report for the northern North Sea is larger than that
reported for any other area. The comparison of length distributions from survey data
collected using standardised gear removed any potential bias associated with different
gear selectivity. The differences in length frequency evident between the Rockall survey
data and North Sea commercial catch data were also evident in the standardised survey
99
data when depth was taken into consideration. However, it should be noted that, in some
cases, sample numbers were quite low. Gerristen et al. (2010) reported that males to the
west of Ireland rarely grow larger than 35 cm. In this study northern North Sea males at
35 cm comprised 33% of the total catch at length, while 23% of all males were at sizes
larger than 35 cm. Poulard et al. (1993) found greater numbers of females than males in
depths up to 150m while the trend reversed in depths greater than 150m in the Celtic
Sea and Bay of Biscay. Gerristen et al. (2010) also noted that sex ratio was depth-
dependent to the west of Ireland, with females dominating shallower water catches and
males more common in deeper water. The results of this study show that this was not
the case at Rockall, with a larger proportion of females in deeper water (>200m) than in
shallower water. There were variations in length distribution corresponding to the
differences in sex ratio between the northern North Sea and Rockall and these together
suggests that there are significant differences in population structure between these
areas. While it is clear that the ratio and size of males in the northern North Sea is
greater than other areas, it is unclear what biological and/or ecological factors are
driving this difference.
The difference in female L50% maturities between our two study areas correlates with
the variation in growth patterns evident between the areas. Differences in female growth
rates are known to exist throughout the distribution range of L. whiffiagonis. For
example Landa et al. (1996) reported that growth in area VIIIc (southern Bay of Biscay)
was higher than other areas in VIII (Bay of Biscay) and VII (west of Ireland and
southwest United Kingdom). A number of studies indicate that in all areas there is also
a prevalence of sexual dimorphism, with female megrim attaining a greater length and
age than males (Moguedet and Perez, 1988; Landa et al., 1996; Gordon, 2001; Gerritsen
100
et al., 2010). However, the degree of sexual dimorphism evident in the northern North
Sea is markedly less than that seen in other areas, including Rockall. In many flatfish
species females are typically larger than males, often by several orders of magnitude, as
this typically increases the fecundity of the individual females (Parker, 1992). Studies
on maturation of plaice (Rijnsdorp and Ibelings, 1989) and dab (Lozan, 1992) suggest
that sexual dimorphism in flatfish is the result of a combination of earlier reproduction
in males and reduced surplus energy acquisition above a certain size. Rijnsdorp and
Witthames (2005) noted that this hypothesis predicts that the largest flatfish will exhibit
the greatest degree of sexual dimorphism.
Gerritsen et al. (2010) reported that mean length at age decreased for female megrim to
the west of Ireland with increasing depth. However, depth-dependent differences in
length at age at Rockall were not evident in the data collected in this study. There were
some small differences between the two depth ranges evident at older ages although this
may have been an artefact caused by lower sample numbers at these ages. This suggests
that the ALK used in this study were representative of overall growth rates at Rockall
and suitable for direct comparison with the North Sea. The results of the study by
Gerritsen et al. (2010) suggest that depth-dependent differences in length at age exist
over relatively small depth increments, i.e. 50-100m. If these differences are consistent,
this implies that fish living in a particular depth stratum stay within that stratum over
their lifetime.
Differences in the trawls deployed at the northern North Sea and Rockall may have
contributed to a small amount of the variation seen between the areas. The survey net
used at Rockall, designed to be representative of the nets deployed when targeting
anglerfish, had 100mm mesh in the codend which would be expected to retain smaller
101
fish compared with the 120mm mesh deployed in commercial nets in the northern North
Sea. This will have had an effect on the size selection of the smallest fish sampled in
each of the areas, with an expectancy of a greater proportion of smaller fish retained at
Rockall. This may have produced an element of bias in the ALKs, although this would
be limited to the youngest age groups. A bigger mesh size would possibly lead to fish at
the youngest ages appearing to be larger. This may have been the case here, with the
youngest fish (age 1 and 2) captured in the 120mm mesh codend in the North Sea
having a smaller mean length at age than Rockall. Despite this, mean length at age was
consistently higher at the North Sea for all ages, suggesting that the difference in growth
between the areas evident in this study is due to factors other than differences in gear
selectivity.
The hydrography of the northern North Sea and Rockall are known to be very different
(Turrell, 1992; Turrell et al., 1996; Maravelias, 1997; Howell et al., 2009) and the
resulting variation in water inflows, current patterns and nutrient availabilities could
result in very different productivities between the two areas. These environmental
differences may be one of the factors driving the variation in growth patterns seen
between northern North Sea and Rockall females. Northern North Sea females exhibit
rapid growth rates prior to maturity with growth slowing after maturity. This trend is
similar to that seen in other species in the North Sea such as haddock (Baudron et al.,
2011). Haddock are also known to exhibit slower growth rates and a smaller maximum
size at Rockall than their neighbouring Atlantic populations (ICES, 2011a). In contrast,
the linear growth rates exhibited by female megrim at Rockall are indicative of a
different growth pattern, with a steady growth rate before and after maturity. It is also
important to note that although the von Bertalanffy growth model fitted well to North
102
Sea males, the unrealistically high Linf is more indicative of linear growth. This suggests
that male growth in the northern North Sea may exhibit a similar growth pattern to that
of females at Rockall. The variation in male and female growth patterns within the
North Sea suggest that factors other than environmental variables may be contributing
to these differences.
Detailed knowledge of the habitats, biodiversity and ecosystem functioning in offshore
areas such as the Rockall Plateau is currently limited (Hughes and Narayanaswamy,
2013). Despite this, Steele et al. (1971) noted that the plateau is highly productive due
to upwelling. A recent study comparing demersal fish diversity of Rockall and the west
coast shelf noted that the fish assemblage at Rockall was a less diverse, impoverished
subset of the north-west European shelf sea fish assemblage (Neat and Campbell, 2011).
Although the Bank supports large fish stocks and has a long history of commercial
exploitation (Newton et al., 2008), many species such as cod and saithe are almost
exclusively represented as adults, with very little evidence of juvenile fish (Neat and
Campbell, 2011). Neat and Campbell (2011) hypothesize that some of the differences
evident between Rockall and the west coast shelf may be the consequence of the
relatively small area of the Rockall plateau and its isolation by depth, distance and
ocean current system.
While there is evidence of differences in life history characteristics of megrim between
the two longitudinal extremes on the Northern Shelf, it is also important to recognise
that the study undertaken here did not include the ICES Area that separates them along
the west of Scotland (IVa). The results presented here may therefore be two extremes of
a graduated change in life history characteristics across the longitudinal distribution of
the species, rather than evidence of discrete stock units. A comparison between the

103
results of the present study and the work previously undertaken at the west of Scotland
by Gordon (2001) were considered but, due to the temporal differences between the
collection of the datasets, it was deemed inappropriate. Life history traits are known to
have the potential to alter in response to factors such as changes in fishing pressure
(Rochet, 1998) and environmental changes (Jobling, 1995). As such, contrasting
datasets collected ten year apart may have the potential to produce bias in any
comparisons. It would therefore be beneficial to undertake further analysis at the west
of Scotland to ascertain whether the variation in life history characteristics is due to a
natural gradual change in these parameters across the Shelf or whether there is evidence
of discrete stock units.
3.5 Conclusions
The results of this study indicate that there are significant differences in the life history
characteristics of the megrim populations at the northern North Sea and Rockall. These
differences include length distributions, growth rates, length at maturity of females, sex
ratios and the timing and duration of the spawning season. The most recent Northern
Shelf stock structure for megrim that has been recommended by ICES is that IVa
(northern North Sea) and VIa (West of Scotland) comprises one stock and VIb
(Rockall) is a separate stock. These results support the northern North Sea being treated
separately to Rockall. However, given the variation found between the results from the
North Sea presented here and previous studies covering the West of Scotland, further
work is needed in order to investigate possible spatial differences between megrim in
IVa and VIa.
104
CHAPTER 4
POTENTIAL AND RELATIVE FECUNDITY OF
LEPIDORHOMBUS WHIFFIAGONIS IN COMPARISON WITH
OTHER NORTH ATLANTIC FLATFISH SPECIES
105
4.1 Introduction
Stock reproductive potential (SRP) describes a fish stock’s ability to produce eggs that
will eventually recruit to the adult population and the fishery (Trippel, 1999).
Historically, there has been an erroneous assumption that spawning stock biomass
(SSB) is directly proportional to SRP (Marshall et al., 1998), potentially leading to
over-optimistic assessments of stock status (Marshall et al., 2006). In recent years,
studies describing SRP of commercially important species such as Atlantic cod Gadus
morhua (Marshall et al., 1998; Marteinsdottir et al., 2000) and haddock
Melanogrammus aeglefinus (Alonso-Fernandez et al., 2009) have reported that factors
such as age, length and condition of the spawning stock may have a significant effect on
SRP. Other factors influencing SRP include resource availability, environmental
variability and evolutionary factors (Lambert, 2008). SRP has also been linked with
recruitment variation, suggesting that it is an important component of stock dynamics
that is not well estimated using SSB (Rickman et al., 2000).
In order to estimate SRP, reproductive potential must be quantified at the individual-
level. Fecundity, defined as the number of developed oocytes produced prior to the
onset of spawning in a given spawning season, provides an estimation of the
reproductive rate of an individual. In fish species it is typically described as the standing
stock of advanced yolked oocytes (Rijnsdorp and Witthames, 2005), uncorrected for
atretic losses (Murua and Saborido-Ray, 2003).
To date, the majority of studies on fecundity have been undertaken on gadoid species
such as Atlantic cod (Gadus morhua) and haddock (Melanogrammus aeglefinus)
(Rickman et al., 2000), with fewer studies undertaken on fecundity in flatfishes. Within
the Pleuronectiformes reproductive strategies include two types of oogenesis,
106
discontinuous and continuous. Discontinuous oogenesis (‘determinate’ fecundity)
allows for fecundity to be measured relatively easily as there is a clear separation of the
oocytes recruited for spawning in the upcoming season (Pavlov et al., 2009). It is more
difficult to make an accurate assessment of fish exhibiting continuous oogenesis
(‘indeterminate’ fecundity) due to the constant recruitment of oocytes from the reserve
fund. Determinate fecundity is further distinguished into synchronous and asynchronous
development of vitellogenic oocytes (Pavlov et al., 2009). For species with synchronous
development, all oocytes are of a similar developmental stage throughout vitellogenesis.
In asynchronous development, a number of batches of vitellogenic cells are present in
the ovary and are released as batches during the spawning season. The majority of
flatfish species are batch spawners, releasing several successive batches of eggs during
the spawning season (Gibson, 2005).
Historically, potential fecundity (FP) (the determination of the number of vitellogenic
oocytes) was ascertained by the volumetric or gravimetric method (Bagenal and Braum,
1978). The gravimetric method determines fecundity as the product of gonad weight
(GW in g) and oocyte density (OG in oocytes/g). The volumetric method is similar to
the gravimetric method but uses gonad and sample volume instead of weight (Murua et
al., 2003). These methods are straightforward to use and relatively inexpensive although
the work is time-consuming and tedious. In recent years however, new methodologies
have been developed to measure OG (the number of vitellogenic oocytes per gram of
ovary) using image analysis (Thorsen and Kjesbu, 2001). Image analysis automatically
measures the mean oocyte diameter (OD in µm) of a sample allowing for calibration
curves to be generated estimating OG and subsequently FP. This methodology is known
107
as auto-diametric. Other similar methodologies, based on image analysis, have been
developed by Friedland et al., (2005) and Klibansky & Juanes, (2008).
L. whiffiagonis is a determinate, asynchronous batch spawner (Nielsen, 1989). It is
known to exhibit spatial variation in growth rates on the Northern Shelf (Macdonald et
al., 2013). To date, there have been no previous studies on the species’ fecundity. The
utilization of an appropriate fecundity predictor such as length or age is required in
order to estimate SRP for the species.
The current stock assessment method for megrim in IVa is an age-aggregated surplus
production model. The assessment methodology does not take population structure into
account, resulting in an underlying erroneous assumption that, when projecting future
estimates of biomass, every tonne of spawning stock biomass within the population has
the same reproductive potential. This is a limitation of the current assessment which can
only be addressed if the size structure and associated reproductive potential of the stock
is considered. Quantifying the population structure and associated reproductive
potential of megrim in the northern North Sea would therefore go some way to
providing a more accurate assessment of the stock.
The aim of this study was to investigate the reproductive potential of L. whiffiagonis in
the northern North Sea. Fecundity estimations were made by modelling OG and
subsequently FP. A number of different types of model exist for describing FP. In many
instances the relationship is described by univariate regression, relating FP to total
length (LT), e.g. Horwood (1993), Alonso-Fernandez et al. (2009). In this study FP was
modelled with LT as the independent explanatory variable in order to determine whether
LT was an appropriate predictor of FP for this species. Furthermore the resultant best fit
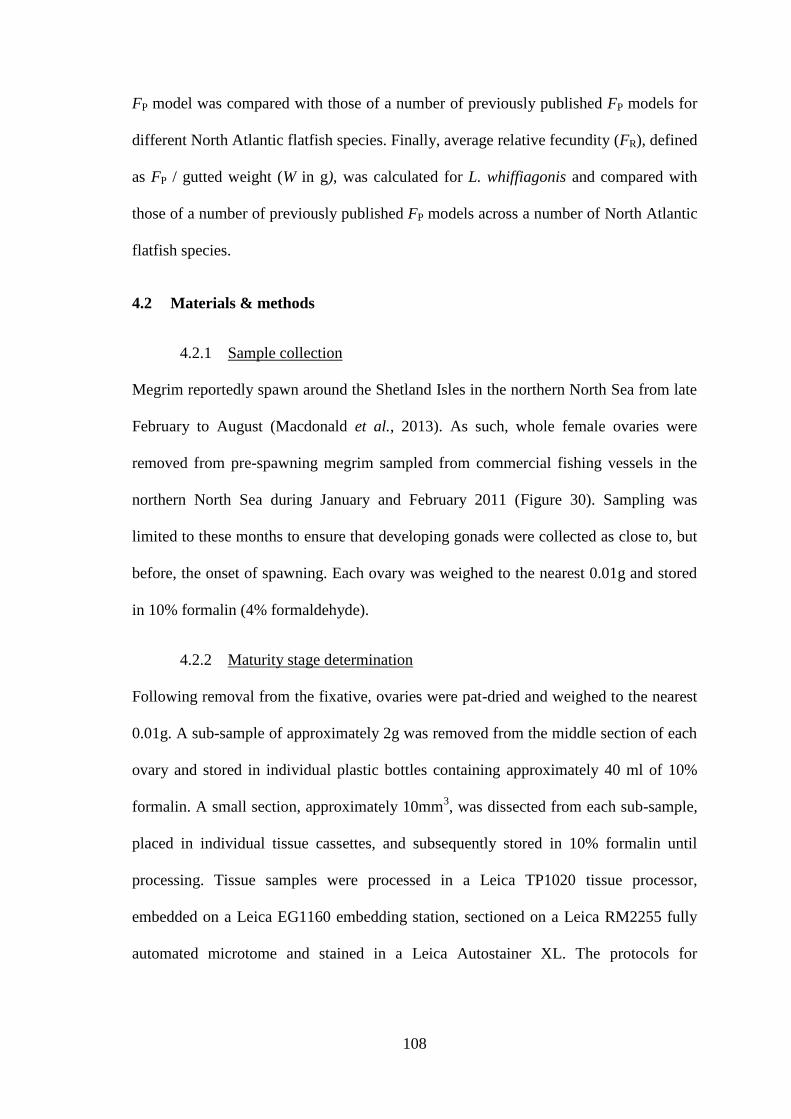
108
FP model was compared with those of a number of previously published FP models for
different North Atlantic flatfish species. Finally, average relative fecundity (FR), defined
as FP / gutted weight (W in g), was calculated for L. whiffiagonis and compared with
those of a number of previously published FP models across a number of North Atlantic
flatfish species.
4.2 Materials & methods
4.2.1 Sample collection
Megrim reportedly spawn around the Shetland Isles in the northern North Sea from late
February to August (Macdonald et al., 2013). As such, whole female ovaries were
removed from pre-spawning megrim sampled from commercial fishing vessels in the
northern North Sea during January and February 2011 (Figure 30). Sampling was
limited to these months to ensure that developing gonads were collected as close to, but
before, the onset of spawning. Each ovary was weighed to the nearest 0.01g and stored
in 10% formalin (4% formaldehyde).
4.2.2 Maturity stage determination
Following removal from the fixative, ovaries were pat-dried and weighed to the nearest
0.01g. A sub-sample of approximately 2g was removed from the middle section of each
ovary and stored in individual plastic bottles containing approximately 40 ml of 10%
formalin. A small section, approximately 10mm3, was dissected from each sub-sample,
placed in individual tissue cassettes, and subsequently stored in 10% formalin until
processing. Tissue samples were processed in a Leica TP1020 tissue processor,
embedded on a Leica EG1160 embedding station, sectioned on a Leica RM2255 fully
automated microtome and stained in a Leica Autostainer XL. The protocols for
109
histological processing of fecundity samples are outlined in Chapter 3. Histological
sections were examined under a light microscope and samples exhibiting hydrated
oocytes or post ovulatory follicles were not included in the fecundity estimation
analysis.
4.2.3 L. whiffiagonis fecundity estimation
A total of 29 ovary samples, 24 from January and 5 from February were selected to
produce OG and FP models. Samples were selected from individuals ranging in size
from 30 – 55 cm. The mean size at maturity for females in the northern North Sea is 31
cm (see Chapter 3). A 50 µg sample of reproductive tissue was removed from each
sample deemed appropriate for fecundity estimation and stained in Rose of Bengal dye
solution in 10% formalin. Samples were stored in the solution for two days, allowing
the dye to penetrate the oocytes. Oocytes from individual samples were selected for size
by washing through a sieve battery (800 µm, 450 µm, and 100 µm) with distilled water.
This procedure separated oocytes into three size classes, enabling more concise
measurement and enumeration of oocytes. Separated samples were pipetted into vials
and stored in a dye/formalin solution until microscopic image analysis.
4.2.3.1 Image analysis
Prior to image analysis each sample was rinsed with distilled water until excess dye was
removed. The contents of each vial were individually pipetted onto a watch glass
prepared with distilled water and placed under a stereo microscope for analysis. Oocytes
were counted and measured using a computer-aided image analysis system. This
procedure used a semi-automatic routine developed at IIM-CSIC, Vigo for fecundity
studies, combining different morphological and segmentation algorithms. Image
analysis Image-Pro Plus v.4.5.1. in combination with a MZ95 Leica Microscope and
110
Olympus SZH camera and Q-Imaging MicroPublisher 3.3 RTV software were used to
record images of each ovarian subsample (∼200–300 oocytes). Microscope light
settings for measurements were determined using best fit to enhance feature and
increase the contrast using gamma correction (a non-linear operation used to code and
decode luminance in the image).
After the colour scale was changed to a grey scale, a threshold value for black and white
(255 refers to black and 0 to white) was fixed for each image of selected oocytes. A
contouring algorithm was applied to eliminate edges from the oocytes. The system was
length-calibrated (µm units) and the measurements were performed on grey scale
images saved in TIFF file format (Figure 31).
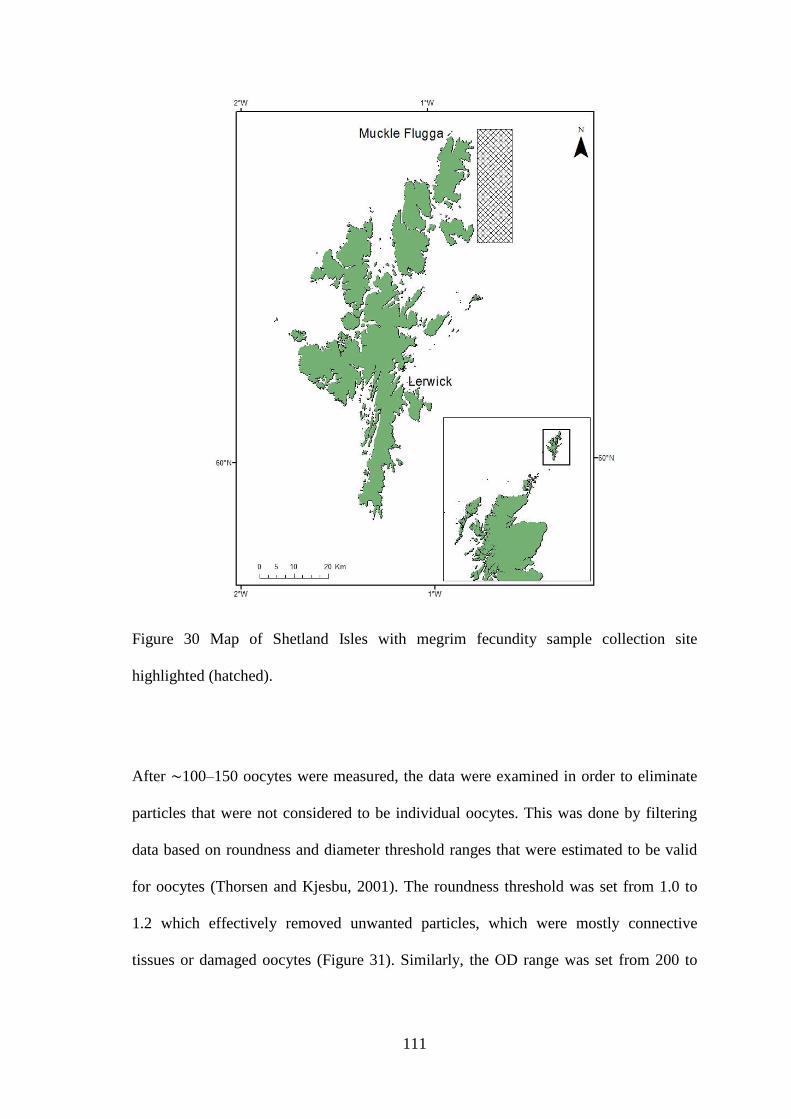
111
Figure 30 Map of Shetland Isles with megrim fecundity sample collection site
highlighted (hatched).
After ∼100–150 oocytes were measured, the data were examined in order to eliminate
particles that were not considered to be individual oocytes. This was done by filtering
data based on roundness and diameter threshold ranges that were estimated to be valid
for oocytes (Thorsen and Kjesbu, 2001). The roundness threshold was set from 1.0 to
1.2 which effectively removed unwanted particles, which were mostly connective
tissues or damaged oocytes (Figure 31). Similarly, the OD range was set from 200 to
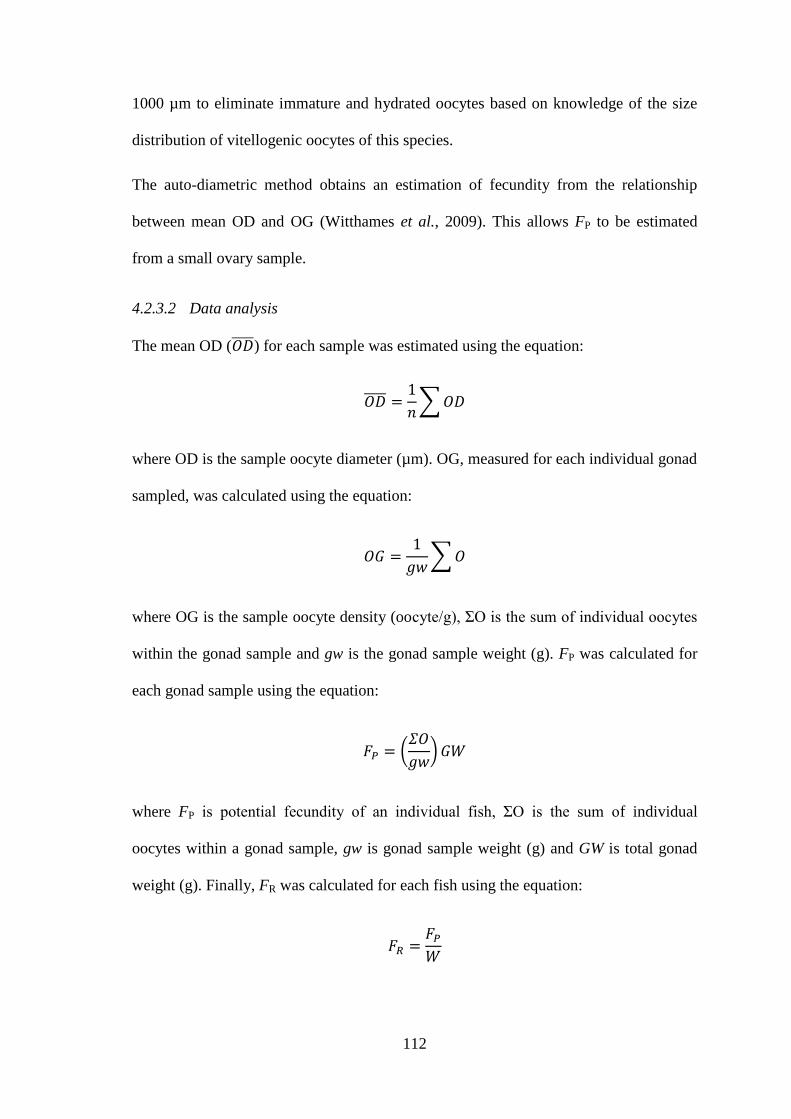
112
1000 µm to eliminate immature and hydrated oocytes based on knowledge of the size
distribution of vitellogenic oocytes of this species.
The auto-diametric method obtains an estimation of fecundity from the relationship
between mean OD and OG (Witthames et al., 2009). This allows FP to be estimated
from a small ovary sample.
4.2.3.2 Data analysis
The mean OD ( ) for each sample was estimated using the equation:
∑
where OD is the sample oocyte diameter (µm). OG, measured for each individual gonad
sampled, was calculated using the equation:
∑
where OG is the sample oocyte density (oocyte/g), ΣO is the sum of individual oocytes
within the gonad sample and gw is the gonad sample weight (g). FP was calculated for
each gonad sample using the equation:
(
)
where FP is potential fecundity of an individual fish, ΣO is the sum of individual
oocytes within a gonad sample, gw is gonad sample weight (g) and GW is total gonad
weight (g). Finally, FR was calculated for each fish using the equation:
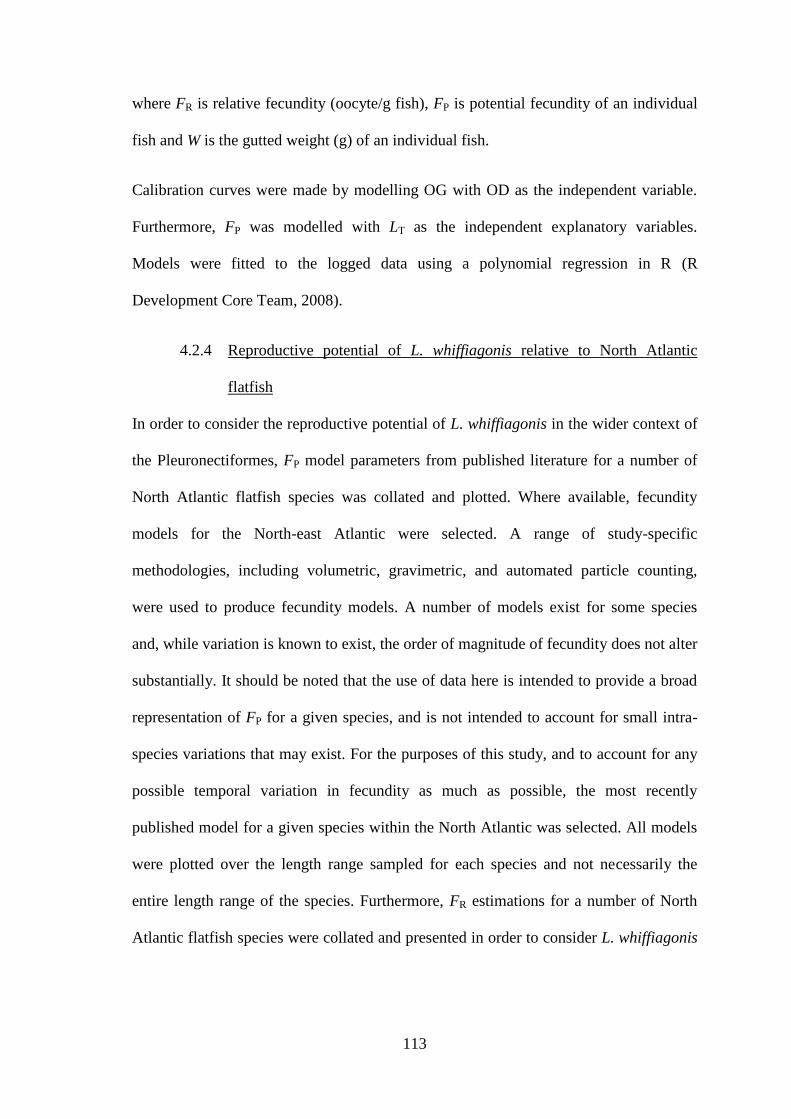
113
where FR is relative fecundity (oocyte/g fish), FP is potential fecundity of an individual
fish and W is the gutted weight (g) of an individual fish.
Calibration curves were made by modelling OG with OD as the independent variable.
Furthermore, FP was modelled with LT as the independent explanatory variables.
Models were fitted to the logged data using a polynomial regression in R (R
Development Core Team, 2008).
4.2.4 Reproductive potential of L. whiffiagonis relative to North Atlantic
flatfish
In order to consider the reproductive potential of L. whiffiagonis in the wider context of
the Pleuronectiformes, FP model parameters from published literature for a number of
North Atlantic flatfish species was collated and plotted. Where available, fecundity
models for the North-east Atlantic were selected. A range of study-specific
methodologies, including volumetric, gravimetric, and automated particle counting,
were used to produce fecundity models. A number of models exist for some species
and, while variation is known to exist, the order of magnitude of fecundity does not alter
substantially. It should be noted that the use of data here is intended to provide a broad
representation of FP for a given species, and is not intended to account for small intra-
species variations that may exist. For the purposes of this study, and to account for any
possible temporal variation in fecundity as much as possible, the most recently
published model for a given species within the North Atlantic was selected. All models
were plotted over the length range sampled for each species and not necessarily the
entire length range of the species. Furthermore, FR estimations for a number of North
Atlantic flatfish species were collated and presented in order to consider L. whiffiagonis
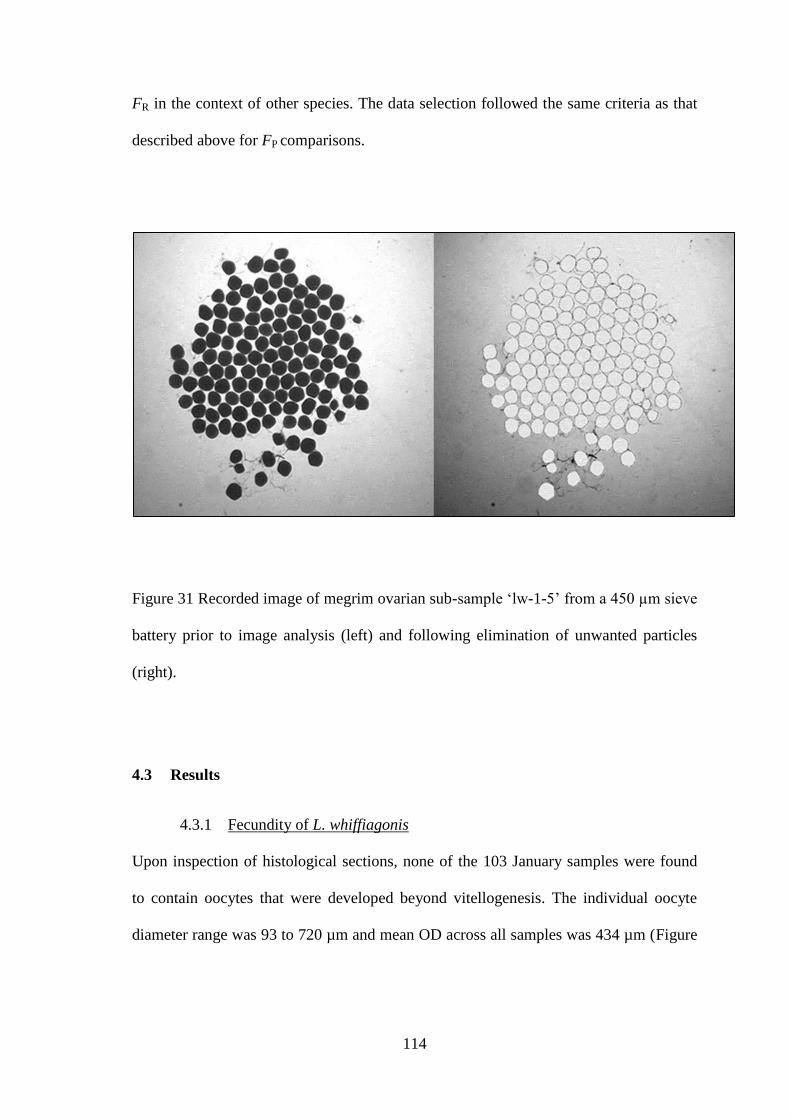
114
FR in the context of other species. The data selection followed the same criteria as that
described above for FP comparisons.
Figure 31 Recorded image of megrim ovarian sub-sample ‘lw-1-5’ from a 450 µm sieve
battery prior to image analysis (left) and following elimination of unwanted particles
(right).
4.3 Results
4.3.1 Fecundity of L. whiffiagonis
Upon inspection of histological sections, none of the 103 January samples were found
to contain oocytes that were developed beyond vitellogenesis. The individual oocyte
diameter range was 93 to 720 µm and mean OD across all samples was 434 µm (Figure
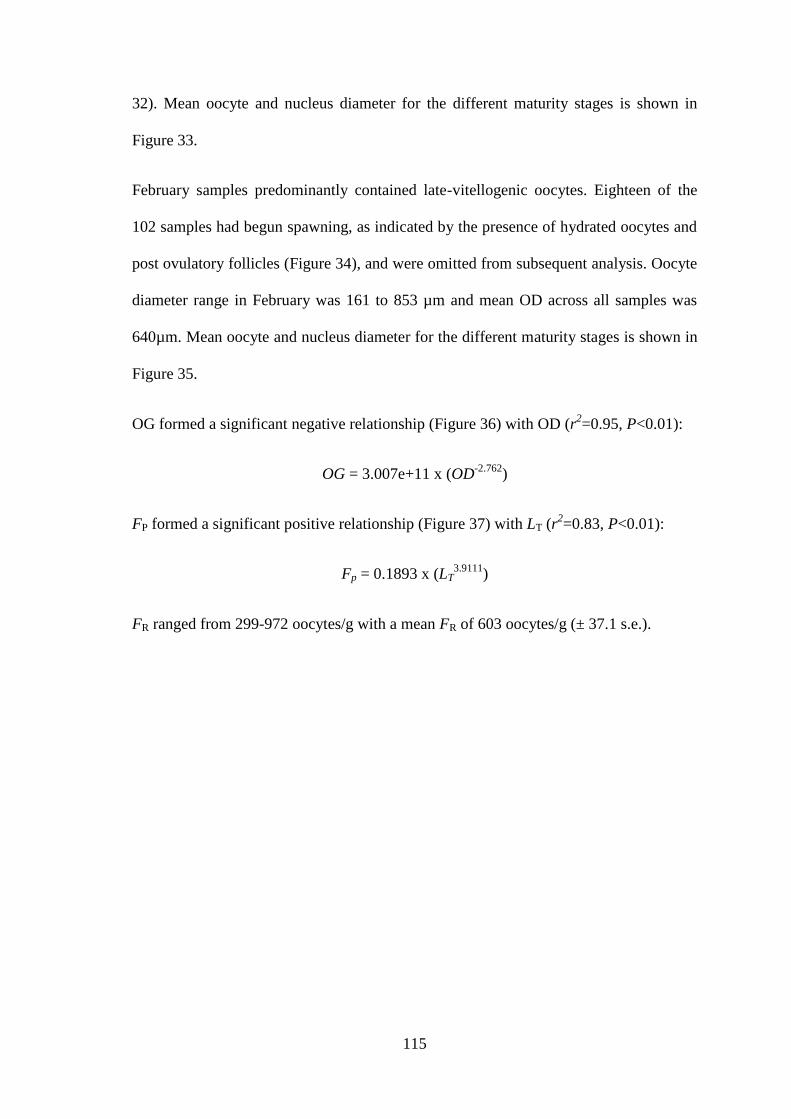
115
32). Mean oocyte and nucleus diameter for the different maturity stages is shown in
Figure 33.
February samples predominantly contained late-vitellogenic oocytes. Eighteen of the
102 samples had begun spawning, as indicated by the presence of hydrated oocytes and
post ovulatory follicles (Figure 34), and were omitted from subsequent analysis. Oocyte
diameter range in February was 161 to 853 µm and mean OD across all samples was
640µm. Mean oocyte and nucleus diameter for the different maturity stages is shown in
Figure 35.
OG formed a significant negative relationship (Figure 36) with OD (r2=0.95, P<0.01):
OG = 3.007e+11 x (OD-2.762
)
FP formed a significant positive relationship (Figure 37) with LT (r2=0.83, P<0.01):
Fp = 0.1893 x (LT3.9111
)
FR ranged from 299-972 oocytes/g with a mean FR of 603 oocytes/g (± 37.1 s.e.).
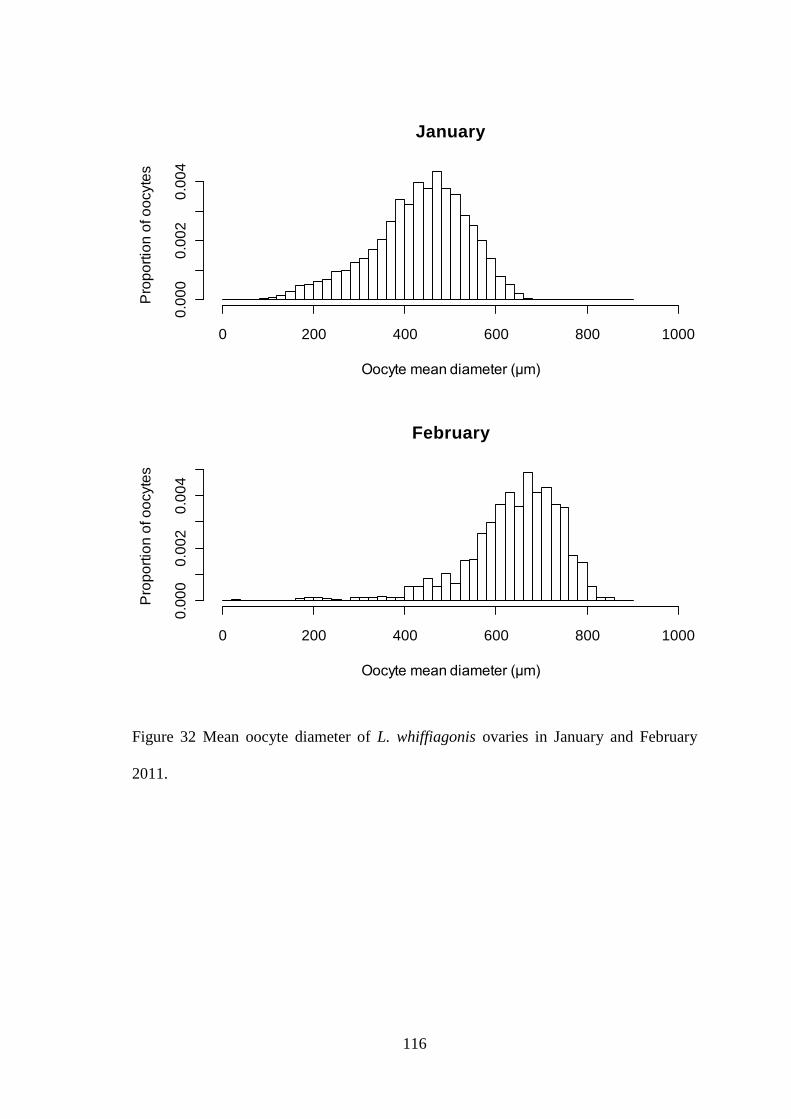
116
Figure 32 Mean oocyte diameter of L. whiffiagonis ovaries in January and February
2011.
January
Oocyte mean diameter (µm)
Pro
po
rtio
n o
f o
ocyte
s
0 200 400 600 800 1000
0.0
00
0.0
02
0.0
04
February
Oocyte mean diameter (µm)
Pro
po
rtio
n o
f o
ocyte
s
0 200 400 600 800 1000
0.0
00
0.0
02
0.0
04
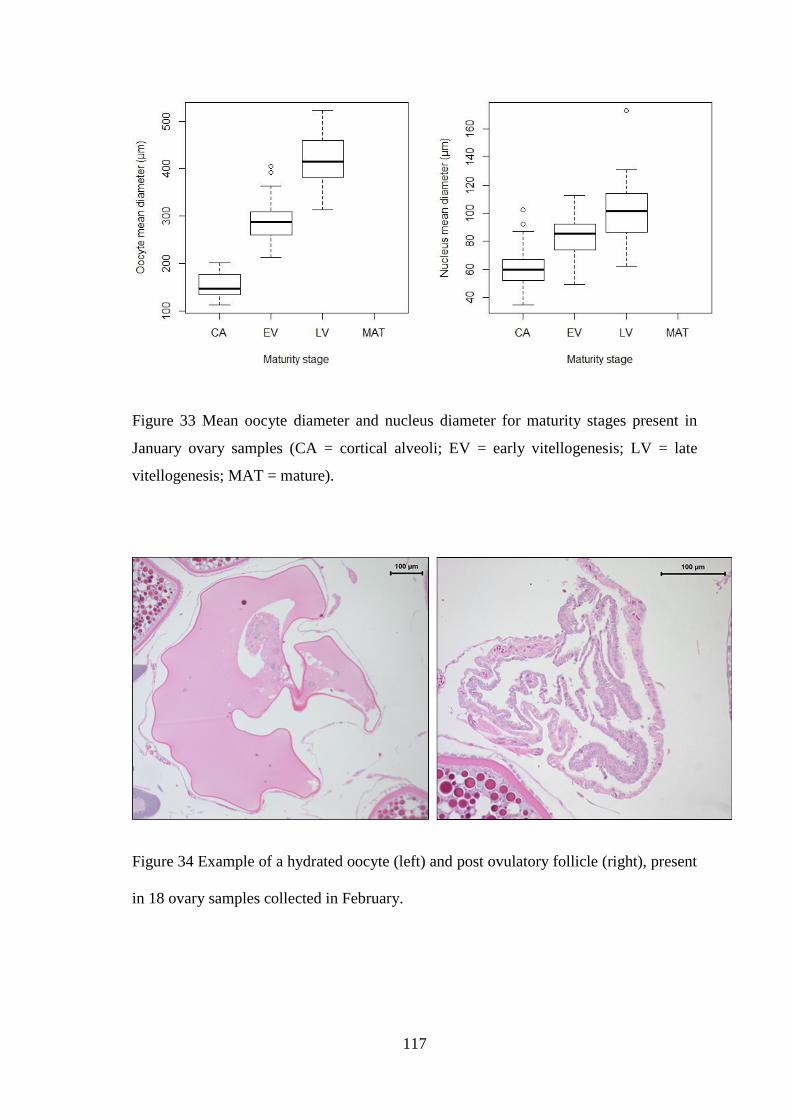
117
Figure 33 Mean oocyte diameter and nucleus diameter for maturity stages present in
January ovary samples (CA = cortical alveoli; EV = early vitellogenesis; LV = late
vitellogenesis; MAT = mature).
Figure 34 Example of a hydrated oocyte (left) and post ovulatory follicle (right), present
in 18 ovary samples collected in February.
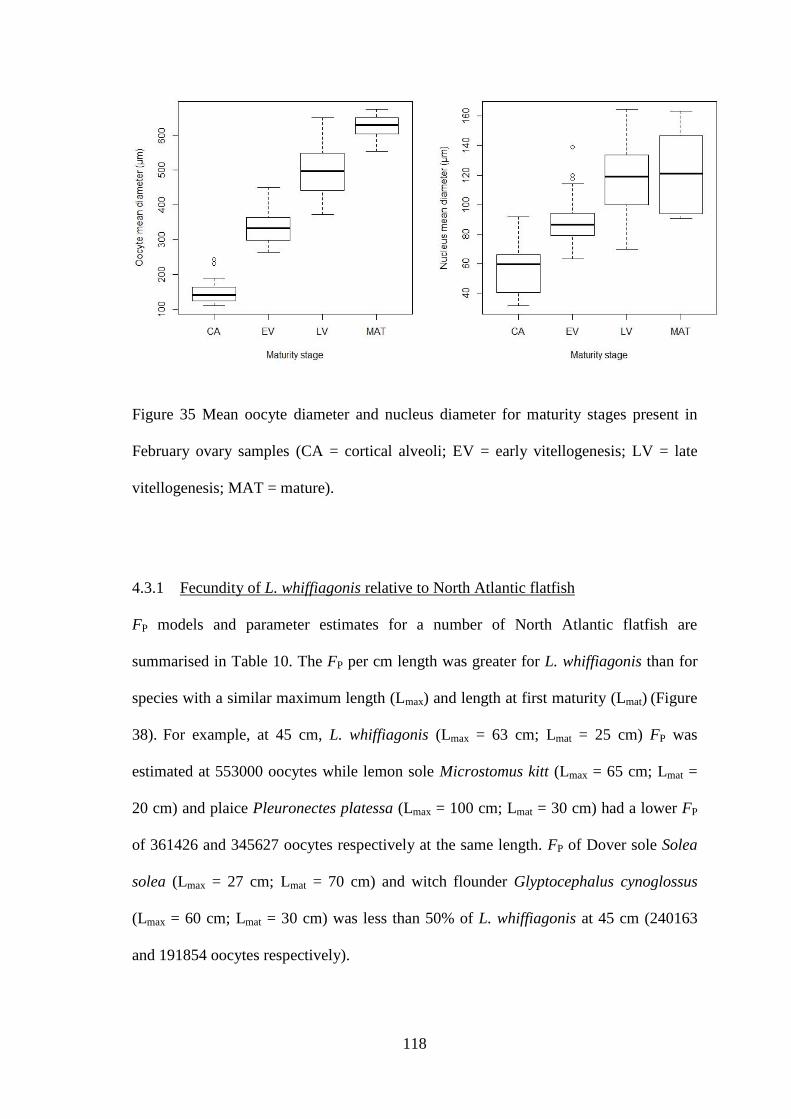
118
Figure 35 Mean oocyte diameter and nucleus diameter for maturity stages present in
February ovary samples (CA = cortical alveoli; EV = early vitellogenesis; LV = late
vitellogenesis; MAT = mature).
4.3.1 Fecundity of L. whiffiagonis relative to North Atlantic flatfish
FP models and parameter estimates for a number of North Atlantic flatfish are
summarised in Table 10. The FP per cm length was greater for L. whiffiagonis than for
species with a similar maximum length (Lmax) and length at first maturity (Lmat) (Figure
38). For example, at 45 cm, L. whiffiagonis (Lmax = 63 cm; Lmat = 25 cm) FP was
estimated at 553000 oocytes while lemon sole Microstomus kitt (Lmax = 65 cm; Lmat =
20 cm) and plaice Pleuronectes platessa (Lmax = 100 cm; Lmat = 30 cm) had a lower FP
of 361426 and 345627 oocytes respectively at the same length. FP of Dover sole Solea
solea (Lmax = 27 cm; Lmat = 70 cm) and witch flounder Glyptocephalus cynoglossus
(Lmax = 60 cm; Lmat = 30 cm) was less than 50% of L. whiffiagonis at 45 cm (240163
and 191854 oocytes respectively).
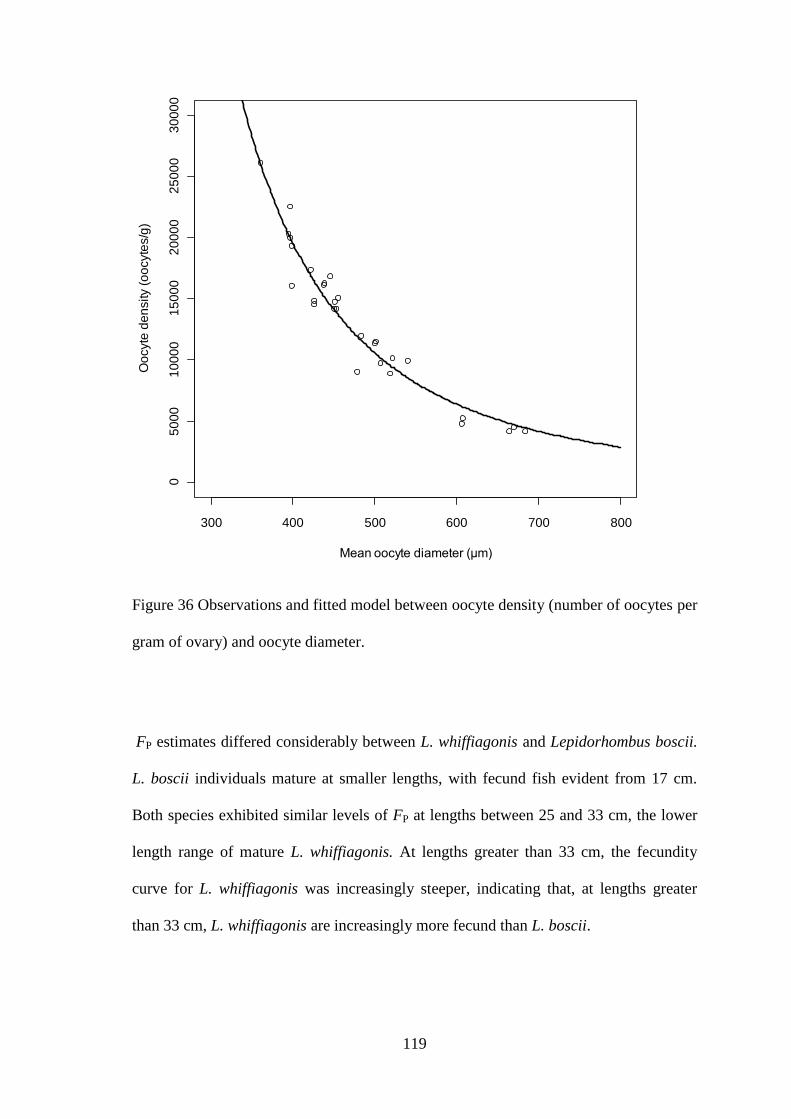
119
Figure 36 Observations and fitted model between oocyte density (number of oocytes per
gram of ovary) and oocyte diameter.
FP estimates differed considerably between L. whiffiagonis and Lepidorhombus boscii.
L. boscii individuals mature at smaller lengths, with fecund fish evident from 17 cm.
Both species exhibited similar levels of FP at lengths between 25 and 33 cm, the lower
length range of mature L. whiffiagonis. At lengths greater than 33 cm, the fecundity
curve for L. whiffiagonis was increasingly steeper, indicating that, at lengths greater
than 33 cm, L. whiffiagonis are increasingly more fecund than L. boscii.
300 400 500 600 700 800
05
00
01
00
00
15
00
02
00
00
25
00
03
00
00
Mean oocyte diameter (µm)
Oo
cyte
de
nsity (
oo
cyte
s/g
)
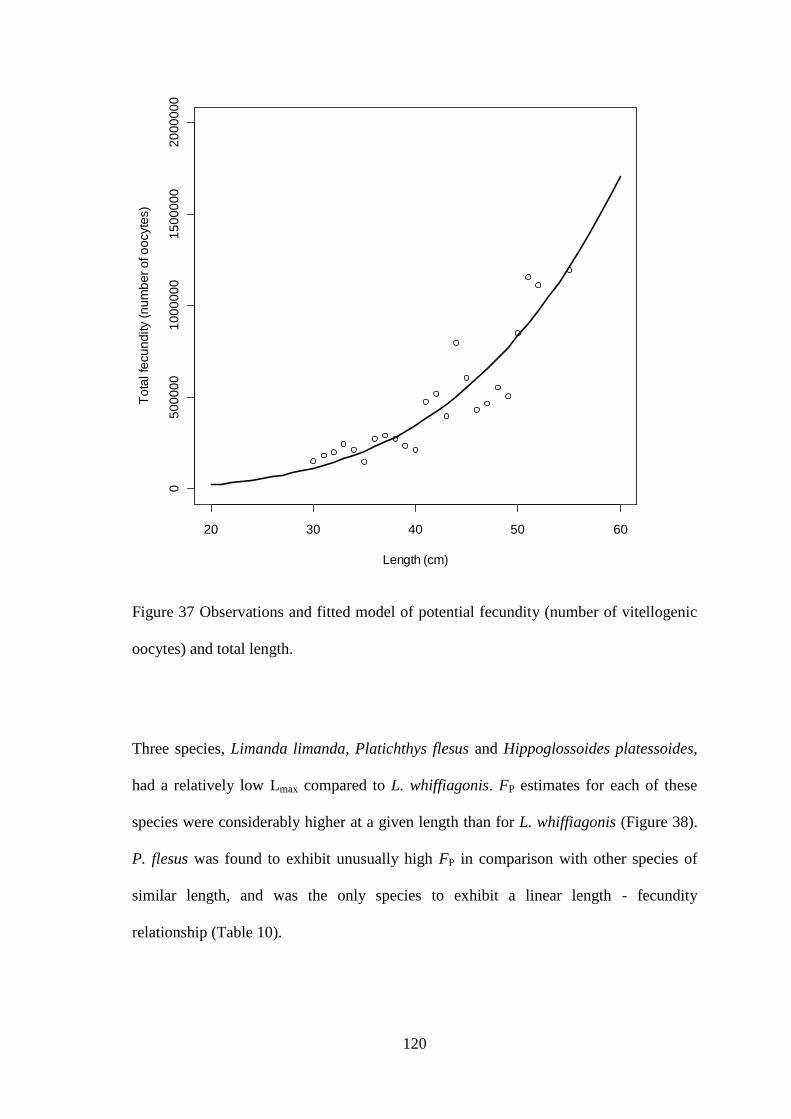
120
Figure 37 Observations and fitted model of potential fecundity (number of vitellogenic
oocytes) and total length.
Three species, Limanda limanda, Platichthys flesus and Hippoglossoides platessoides,
had a relatively low Lmax compared to L. whiffiagonis. FP estimates for each of these
species were considerably higher at a given length than for L. whiffiagonis (Figure 38).
P. flesus was found to exhibit unusually high FP in comparison with other species of
similar length, and was the only species to exhibit a linear length - fecundity
relationship (Table 10).
20 30 40 50 60
05
00
00
01
00
00
00
15
00
00
02
00
00
00
Length (cm)
To
tal fe
cu
nd
ity (
nu
mb
er
of o
ocyte
s)
121
There was extensive variation in fecundity across the larger flatfish species in the North
Atlantic (Figure 38). Of the species considered here, Turbot Scophthalmus maximus
exhibited the largest cm incremental increase in fecundity and the largest overall
fecundity count of over 8 million oocytes for the largest fish sampled. Conversely,
Greenland halibut Reinhardtius hippoglossoides exhibited relatively low fecundity of
less than 100000 oocytes for the largest fish. The largest flatfish species, Hippoglossus
hippoglossus, exhibited the greatest range in size of mature fish as well as the largest
range in fecundity, from 650000 at 120 cm to 5.8 million at 220 cm.
FR estimates for a number of North Atlantic flatfish are summarised in Table 11. The
range of species considered for FR is less than for FP because FR models were not
available for a number of the species. The species with the greatest FR range was G.
cynoglossus (283-7079 oocytes/g) while R. hippoglossoides exhibited the lowest range
(4-20 oocytes/g). Mean FR was generally highest in species with the lowest Lmax and
decreased in species with a higher Lmax. The exception to this was S. maximus which
exhibited a similar FR to the smaller flatfish species. There was a weak linear
relationship between FR and Lmax for all the species considered (Figure 39):
(FR=-11.278 x Lmax + 1562, r2=0.52)
However, there was a strong linear relationship when S. maximus was removed from the
analysis:
(FR=-16.136 x Lmax + 1781.5, r2=0.90)
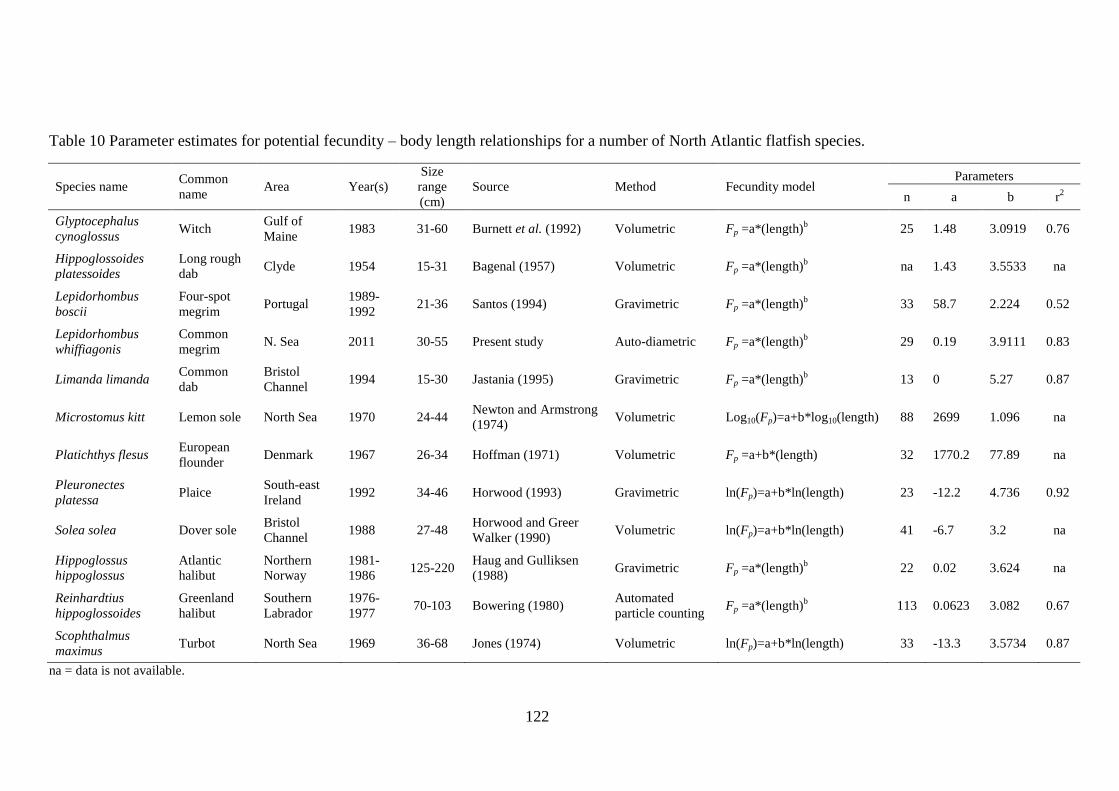
122
Table 10 Parameter estimates for potential fecundity – body length relationships for a number of North Atlantic flatfish species.
Species name Common
name Area Year(s)
Size
range
(cm)
Source Method Fecundity model Parameters
n a b r2
Glyptocephalus
cynoglossus Witch
Gulf of
Maine 1983 31-60 Burnett et al. (1992) Volumetric Fp =a*(length)
b 25 1.48 3.0919 0.76
Hippoglossoides
platessoides
Long rough
dab Clyde 1954 15-31 Bagenal (1957) Volumetric Fp =a*(length)
b na 1.43 3.5533 na
Lepidorhombus
boscii
Four-spot
megrim Portugal
1989-
1992 21-36 Santos (1994) Gravimetric Fp =a*(length)
b 33 58.7 2.224 0.52
Lepidorhombus
whiffiagonis
Common
megrim N. Sea 2011 30-55 Present study Auto-diametric Fp =a*(length)
b 29 0.19 3.9111 0.83
Limanda limanda Common
dab
Bristol
Channel 1994 15-30 Jastania (1995) Gravimetric Fp =a*(length)
b 13 0 5.27 0.87
Microstomus kitt Lemon sole North Sea 1970 24-44 Newton and Armstrong
(1974) Volumetric Log10(Fp)=a+b*log10(length) 88 2699 1.096 na
Platichthys flesus European
flounder Denmark 1967 26-34 Hoffman (1971) Volumetric Fp =a+b*(length) 32 1770.2 77.89 na
Pleuronectes
platessa Plaice
South-east
Ireland 1992 34-46 Horwood (1993) Gravimetric ln(Fp)=a+b*ln(length) 23 -12.2 4.736 0.92
Solea solea Dover sole Bristol
Channel 1988 27-48
Horwood and Greer
Walker (1990) Volumetric ln(Fp)=a+b*ln(length) 41 -6.7 3.2 na
Hippoglossus
hippoglossus
Atlantic
halibut
Northern
Norway
1981-
1986 125-220
Haug and Gulliksen
(1988) Gravimetric Fp =a*(length)
b 22 0.02 3.624 na
Reinhardtius
hippoglossoides
Greenland
halibut
Southern
Labrador
1976-
1977 70-103 Bowering (1980)
Automated
particle counting Fp =a*(length)
b 113 0.0623 3.082 0.67
Scophthalmus
maximus Turbot North Sea 1969 36-68 Jones (1974) Volumetric ln(Fp)=a+b*ln(length) 33 -13.3 3.5734 0.87
na = data is not available.
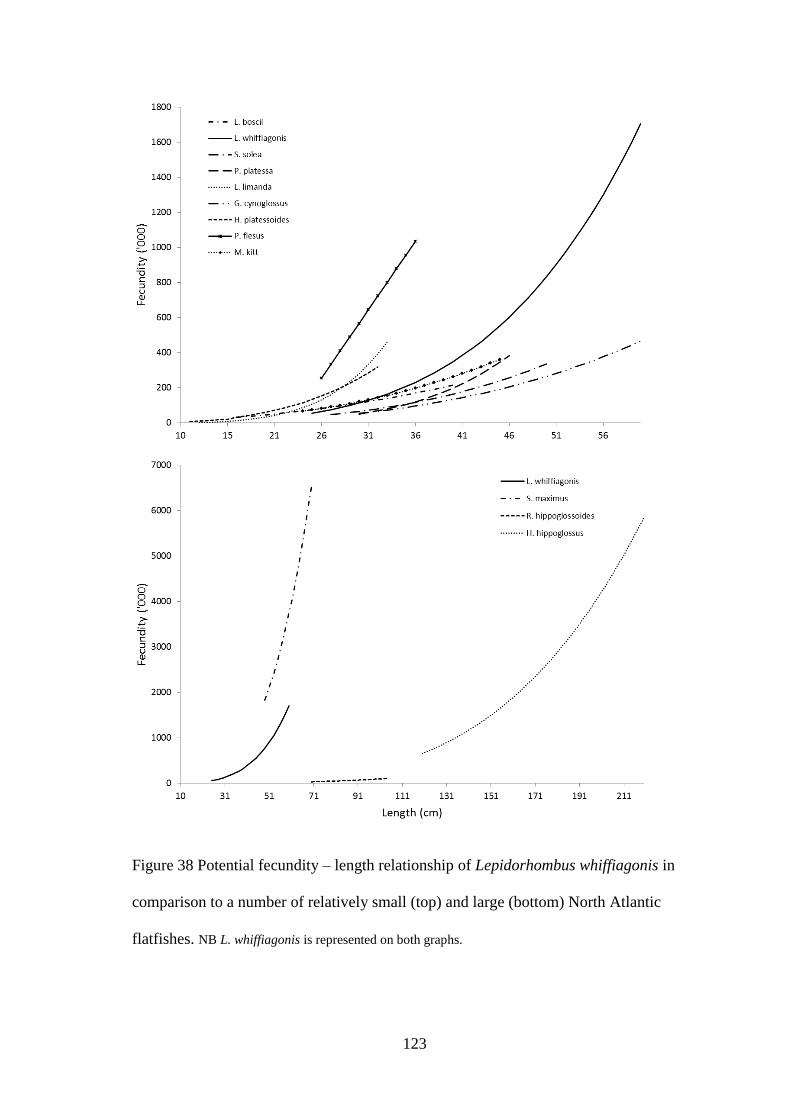
123
Figure 38 Potential fecundity – length relationship of Lepidorhombus whiffiagonis in
comparison to a number of relatively small (top) and large (bottom) North Atlantic
flatfishes. NB L. whiffiagonis is represented on both graphs.
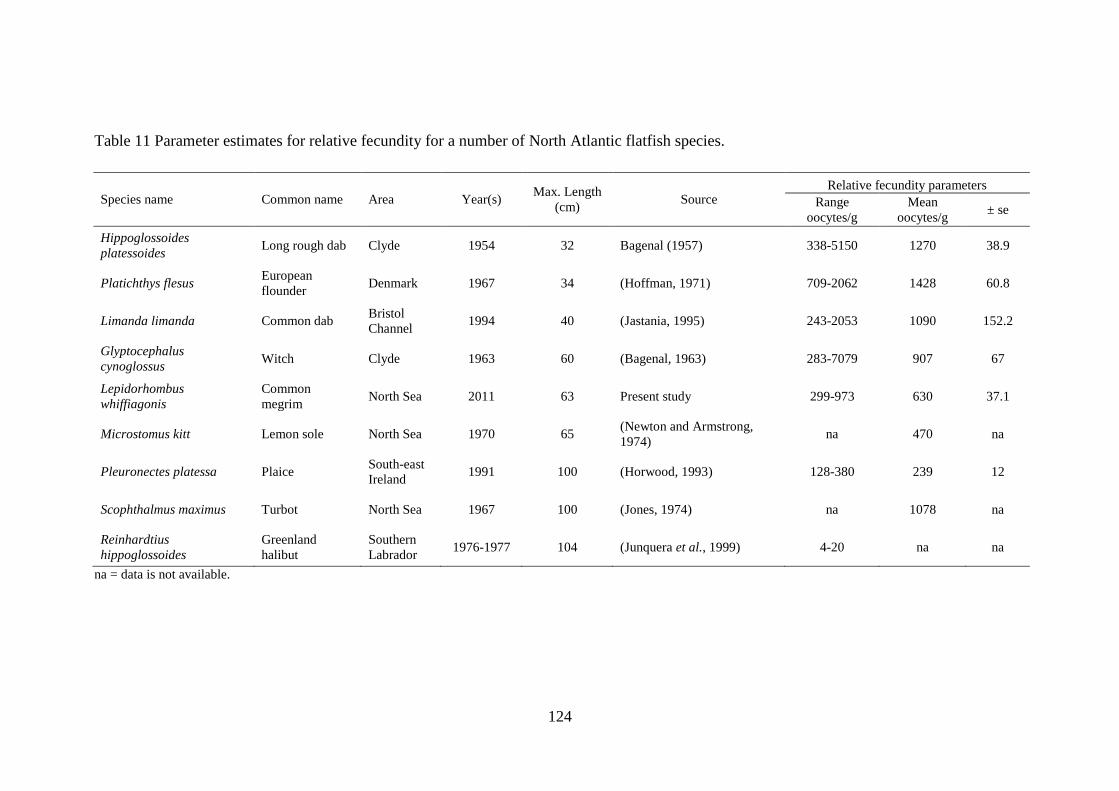
124
Table 11 Parameter estimates for relative fecundity for a number of North Atlantic flatfish species.
Species name Common name Area Year(s) Max. Length
(cm) Source
Relative fecundity parameters
Range
oocytes/g
Mean
oocytes/g ± se
Hippoglossoides
platessoides Long rough dab Clyde 1954 32 Bagenal (1957) 338-5150 1270 38.9
Platichthys flesus European
flounder Denmark 1967 34 (Hoffman, 1971) 709-2062 1428 60.8
Limanda limanda Common dab Bristol
Channel 1994 40 (Jastania, 1995) 243-2053 1090 152.2
Glyptocephalus
cynoglossus Witch Clyde 1963 60 (Bagenal, 1963) 283-7079 907 67
Lepidorhombus
whiffiagonis
Common
megrim North Sea 2011 63 Present study 299-973 630 37.1
Microstomus kitt Lemon sole North Sea 1970 65 (Newton and Armstrong,
1974) na 470 na
Pleuronectes platessa Plaice South-east
Ireland 1991 100 (Horwood, 1993) 128-380 239 12
Scophthalmus maximus Turbot North Sea 1967 100 (Jones, 1974) na 1078 na
Reinhardtius
hippoglossoides
Greenland
halibut
Southern
Labrador 1976-1977 104 (Junquera et al., 1999) 4-20 na na
na = data is not available.
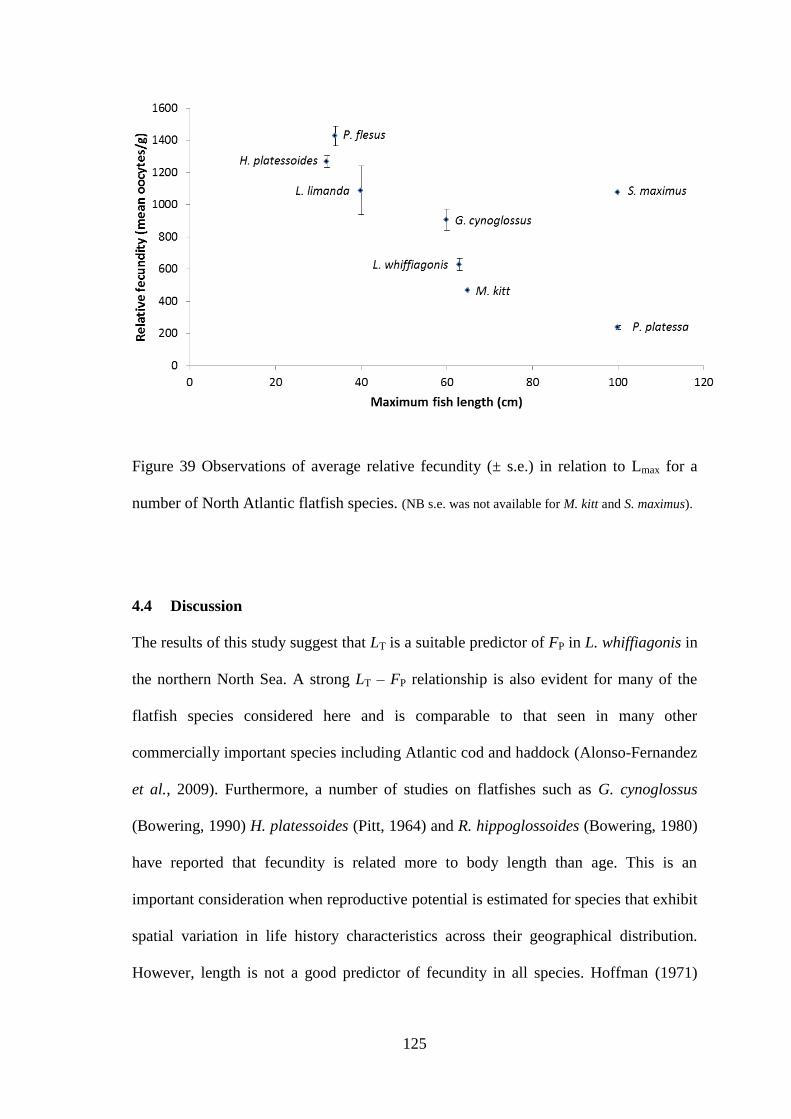
125
Figure 39 Observations of average relative fecundity (± s.e.) in relation to Lmax for a
number of North Atlantic flatfish species. (NB s.e. was not available for M. kitt and S. maximus).
4.4 Discussion
The results of this study suggest that LT is a suitable predictor of FP in L. whiffiagonis in
the northern North Sea. A strong LT – FP relationship is also evident for many of the
flatfish species considered here and is comparable to that seen in many other
commercially important species including Atlantic cod and haddock (Alonso-Fernandez
et al., 2009). Furthermore, a number of studies on flatfishes such as G. cynoglossus
(Bowering, 1990) H. platessoides (Pitt, 1964) and R. hippoglossoides (Bowering, 1980)
have reported that fecundity is related more to body length than age. This is an
important consideration when reproductive potential is estimated for species that exhibit
spatial variation in life history characteristics across their geographical distribution.
However, length is not a good predictor of fecundity in all species. Hoffman (1971)
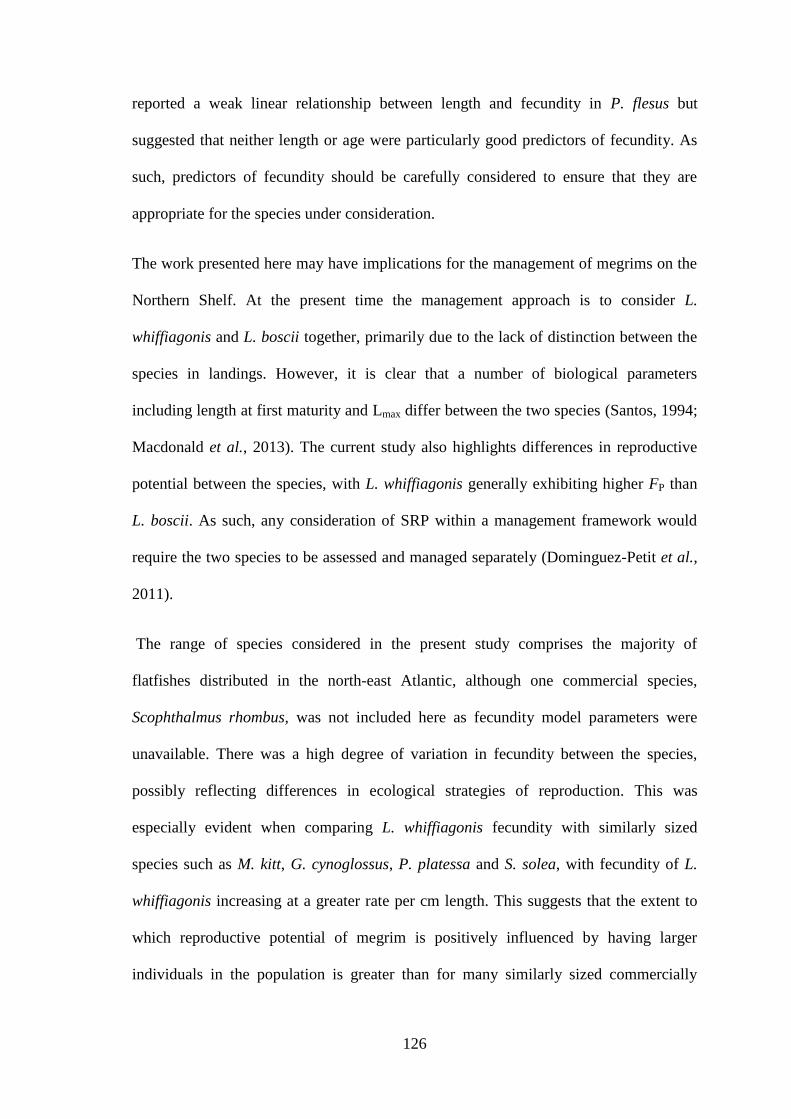
126
reported a weak linear relationship between length and fecundity in P. flesus but
suggested that neither length or age were particularly good predictors of fecundity. As
such, predictors of fecundity should be carefully considered to ensure that they are
appropriate for the species under consideration.
The work presented here may have implications for the management of megrims on the
Northern Shelf. At the present time the management approach is to consider L.
whiffiagonis and L. boscii together, primarily due to the lack of distinction between the
species in landings. However, it is clear that a number of biological parameters
including length at first maturity and Lmax differ between the two species (Santos, 1994;
Macdonald et al., 2013). The current study also highlights differences in reproductive
potential between the species, with L. whiffiagonis generally exhibiting higher FP than
L. boscii. As such, any consideration of SRP within a management framework would
require the two species to be assessed and managed separately (Dominguez-Petit et al.,
2011).
The range of species considered in the present study comprises the majority of
flatfishes distributed in the north-east Atlantic, although one commercial species,
Scophthalmus rhombus, was not included here as fecundity model parameters were
unavailable. There was a high degree of variation in fecundity between the species,
possibly reflecting differences in ecological strategies of reproduction. This was
especially evident when comparing L. whiffiagonis fecundity with similarly sized
species such as M. kitt, G. cynoglossus, P. platessa and S. solea, with fecundity of L.
whiffiagonis increasing at a greater rate per cm length. This suggests that the extent to
which reproductive potential of megrim is positively influenced by having larger
individuals in the population is greater than for many similarly sized commercially
127
important species. However, it is important to note that the size range of mature
individuals is limited for a number of the species considered here. Therefore, while
models may reflect FP for the majority of individuals within a given population, they do
not necessarily reflect FP across the entire population. In the present study interspecific
variation in FP tended to increase with increasing length and the addition of data at the
largest lengths may alter FP models significantly. This highlights the need for data
across the entire length range of a species in order to get a more accurate estimate of
fecundity.
There was considerable variation in FP for the larger species considered here. S.
maximus had the greatest FP / cm length with Jones (1974) reporting FP of 6.5 million at
70 cm. In contrast, the considerably lower FP of R. hippoglossoides, 0.1 million at 104
cm, (Bowering, 1980) suggests differences in reproductive strategies between the
species. This was further evident with the consideration of FR. The relationship between
FR and Lmax evident from this study indicates that FR generally decreases with
increasing Lmax. This may be due to the relative effect of body size i.e. smaller
individuals produce smaller eggs. However, this does not hold true for all species and
the relatively high FR of S. maximus suggests that, as with FP, this species may be
employing a different reproductive strategy to other similarly sized flatfishes. Mean egg
size in S. maximus (Lmax = 100cm) has been reported as 0.9 – 1.1 mm (McEvoy and
McEvoy, 1991) while egg size in R. hippoglossoides (Lmax = 104cm) is considerably
higher at 3.3 – 4.2 mm (Stene et al., 1999). Duarte and Alcaraz (1989) reported that
differences in the allocation of reproductive effort between fecundity and egg size in
teleosts was dependent on the habitats they occupy. Rijnsdorp and Witthames (2005)
reported that egg size is also correlated with a number of ecological traits that may
128
affect feeding success, while Bagenal (1971) hypothesized that egg size is linked to the
availability of food. Therefore, differences in FP / egg size relationships may be due to
the interaction of a number of ecological factors that vary across species. Furthermore,
higher FR in smaller fish may be an evolutionary adaptation due to body size. Species
with a smaller Lmax may, due to their small body size, be exposed to a higher risk of
predation and mortality. One adaptation to this may be to adapt a strategy of producing
greater numbers of eggs to compensate for higher levels of mortality.
The species considered in this study are found in a wide variety of habitats. For
example, the highly fecund S. maximus frequents sandy and stony bottom and has a
somewhat limited depth range of 20-70 m, while the relatively less fecund R.
hippoglossoides is found in colder waters at 3-5oC and is often caught pelagically
(Whitehead et al., 1989). Differences in habitat and resulting environments may account
for some of the variation in fecundity noted between species. Johnson and Barnett
(1975) reported that average fecundity was lower in less productive environments with
low food availability and higher in more productive areas. They further hypothesized
that in areas of low food density, natural selection favours mechanisms such as larger
egg size and lower fecundity. Miller and Kendall (2009) further suggest that, in areas of
high productivity, the danger of starving may be less while the danger of predation may
be greater. In this scenario, selection may favour smaller egg size and higher fecundity
with increased numbers of eggs and larvae overwhelming or saturating prey so that
some survive.
Factors such as extensive fishing pressure are known to have an effect on the
reproductive potential of a fish stock (Scott et al., 1999). If stock sizes are larger,
smaller first time spawning fish only make up a small fraction of the spawning stock
129
biomass (Trippel and Mork, 2003). If larger, more fecund individuals are systematically
removed from the population, a scenario common encountered in overfished stocks, the
remaining population will have a greater proportion of smaller less fecund individuals.
This has the potential to drastically reduce the reproductive potential of a stock. Scott et
al. (1999) noted that, if the effects of the loss of larger, more fecund individuals is not
considered, the potential number of recruits produced by populations under high levels
of fishing mortality could be overestimated by as much as 60%. In addition to this, long
term shifts in size and age at maturity are evident in heavily exploited stocks, causing
higher growth rates and earlier maturation (Trippel and Mork, 2003). This further
highlights the need to consider SRP within the assessment process and the utility of
trends in SRP as an indicator of the health of a stock.
The estimates of FP and FR compared in this study were produced by a number of
different methodologies. As such, variation in the degree of precision of FP and FR
estimates may arise from differences between the methodologies and care should be
taken in the interpretation of results. Murua et al. (2003) detailed the advantages,
disadvantages and ease of use associated with each of the methodologies reported here.
They further conclude that no single method is appropriate to estimate the annual egg
production across all commercially important fish species. As such, a careful review of
the reproductive biology of the respective species is required prior to the selection of an
appropriate methodology (Murua et al., 2003).
The auto-diametric method utilized in this study to estimate FP and FR in megrim is
currently recognised as the most efficient method for estimating these parameters
(Murua et al., 2003). Despite this, there are potential factors that may affect the
accuracy and precision of this method of fecundity estimation. The application of the
130
auto-diametric method is based on estimations made from a relatively small sample
removed from the mid-section of the ovary. Subsequent estimates of fecundity are made
on the assumption that the size and condition of oocytes in this region of the ovary is
representative of the entire ovary. In order to determine whether this is the case, further
work is required to determine whether oocyte diameter and development stage is
consistent throughout the ovary at any given stage of development. This would assist in
determining the accuracy of this method and highlight potential bias that may exist in
fecundity estimations.
There is extensive evidence that fecundity in some flatfish species varies throughout
their distribution range while others remain fairly constant. Rijnsdorp & Witthames
(2005) concluded that fecundity in P. platessa is fairly constant over the species’ range
with the exception of the Baltic and the Barents Sea. Conversely, fecundity in S. solea
was found to increase significantly with latitude from 200 000 eggs / 35 cm female off
Portugal to 450 000 eggs / 35 cm female in the south-eastern North Sea (Witthames et
al., 1995). Rideout & Morgan (2007) reported that fecundity differed spatially and
temporally for yellowtail flounder (Limanda ferruginea) and G. cynoglossus and
temporally for H. platessoides. Bowering (1980) hypothesized that spatial differences in
fecundity of R. hippoglossoides between the southern Gulf of St Lawrence and
Labrador may be due to variation in size at maturity. The high incidence of intraspecific
temporal and spatial variability suggests that fecundity estimates utilized in stock
reproductive potential assessments should be updated regularly (Rideout and Morgan,
2010).
Although simple univariate regression models may describe intra-annual FP
relationships adequately, it has been suggested that their use may be unsatisfactory in
131
year-dependent models due to inter-annual variation (DeMartini, 1991). Thorsen et al.
(2006) reported that, for north-east Arctic cod Gadus morhua L., the inclusion of
Fulton’s condition factor (K) and OD as independent predictors in FP models produced
considerably higher r2 values than univariate regressions. Similarly, fecundity models of
Scotian Shelf haddock (Blanchard et al., 2003) and Atlantic cod (Marteinsdottir and
Begg, 2002) were improved with the inclusion of variables such as age and K. As such
there is a need to account for spatial and temporal variation in fecundity by considering
as many independent predictors as possible. This would allow for the fine tuning of
species-specific fecundity models and ensure that the most accurate and recent estimates
of reproductive potential are being considered.
4.5 Conclusions
Fecundity of L. whiffiagonis was relatively high, increasing considerably more per cm
length than that of similarly sized flatfishes in the North Atlantic. L. whiffiagonis was
also found to have a considerably different FP to L. boscii, suggesting that changes in
the current management approach are required if reproductive potential is to be
considered for Lepidorhombus species. Further work is required to determine whether
spatial and temporal variation in FP and FR exists in L. whiffiagonis populations on the
Northern Shelf.
132
CHAPTER 5
ASSESSMENT OF THE POPULATION STRUCTURE OF
COMMON MEGRIM LEPIDORHOMBUS WHIFFIAGONIS ON
THE NORTHERN SHELF USING GENETIC MARKERS
133
5.1 Introduction
The genus Lepidorhombus is comprised of two nominal species, the common megrim
Lepidorhombus whiffiagonis (Walbaum, 1792) and the four spotted megrim
Lepidorhombus boscii (Risso, 1810). The two species replace each other within their
area of distribution from Iceland to the Mediterranean (Furnestin, 1935) with
commercial catches in northern waters almost exclusively comprised of L. whiffiagonis.
ICES currently consider four stocks of megrim in European waters (Figure 4). In
northern Europe three stock units are recognised (L. whiffiagonis and L. boscii are
considered together): one in Divisions IVa and VIa (northern North Sea and West of
Scotland respectively), one in Division VIb (Rockall) and one in Divisions VIIb-k and
VIIIa,b,d (ICES, 2012f, b, d).
In recent years the high value of megrim has resulted in the species becoming an
increasingly important component of the catch to Scottish demersal vessels (who have
more than 75% of the available TAC on the Northern Shelf). However, in the mid-
2000s the megrim total allowable catch (TAC) in IVa was reduced following an overall
decrease in landings on the Northern Shelf (Rockall, West of Scotland and northern
North Sea). An increase in megrim biomass in the late 2000s led to increased catches
and, coupled with the decrease in TAC, resulted in discarding levels as high as 70% of
the total catch in IVa (Laurenson and Macdonald, 2008).
The need for scientific research was identified and subsequent projects have gone some
way to addressing the lack of knowledge on the species in the northern North Sea and,
to a lesser extent, the West of Scotland and Rockall (Laurenson and Macdonald, 2008;
Macdonald et al., 2013).
134
The stock structure of megrim on the Northern Shelf has not previously been
investigated in great detail. A benchmarking exercise undertaken by ICES in 2011
concluded that two management units should be considered on the Northern Shelf; one
consisting of Divisions IVa and VIa and the other in Division IVb.(ICES, 2011f). Prior
to this, IVa and VIa were considered as two separate management units. The rationale
behind combining IVa and VIa was that there was no evidence of separate populations
in the two areas.
The definition of what constitutes a stock has been evolving throughout the history of
fisheries research with varying definitions proposed by numerous authors (e.g. (Booke,
1981; Ihssen et al., 1981; Larkin, 1992)). In recent years a newer, less restrictive
definition proposed by Hilborn and Walters (1992) states that, ‘in the simplest terms, a
fish stock is identified as an arbitrary group of fish that is large enough to be self-
producing and that contain similar life history characteristics’.
A number of methods currently exist to assist in the determination of fish stock
structure. These include the use of techniques such as morphometric studies,
comparisons of life history characteristics, parasites as biological tags and physical
tagging (Cadrin et al., 2005; Abaunza et al., 2008b). The use of genetics has also been
advocated in stock identification (Begg and Waldman, 1999).
Genetic differences between individuals, stocks and populations provide a basis for
ascertaining the degree of reproductive isolation between them. A number of techniques
exist to assist in the identification of stocks using genetic comparisons. The three
primary methodologies utilized in genetic identification of fish stocks are; protein
variation, mitochondrial DNA (mtDNA) and nuclear DNA (nDNA) (Begg and
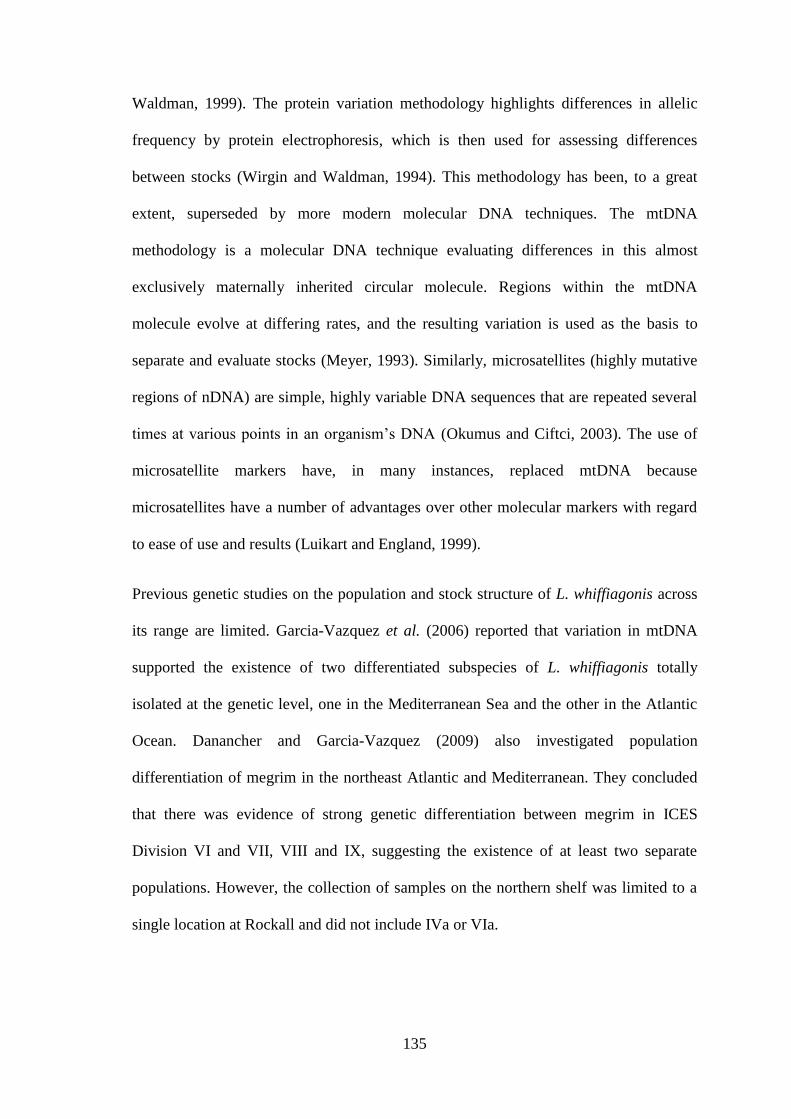
135
Waldman, 1999). The protein variation methodology highlights differences in allelic
frequency by protein electrophoresis, which is then used for assessing differences
between stocks (Wirgin and Waldman, 1994). This methodology has been, to a great
extent, superseded by more modern molecular DNA techniques. The mtDNA
methodology is a molecular DNA technique evaluating differences in this almost
exclusively maternally inherited circular molecule. Regions within the mtDNA
molecule evolve at differing rates, and the resulting variation is used as the basis to
separate and evaluate stocks (Meyer, 1993). Similarly, microsatellites (highly mutative
regions of nDNA) are simple, highly variable DNA sequences that are repeated several
times at various points in an organism’s DNA (Okumus and Ciftci, 2003). The use of
microsatellite markers have, in many instances, replaced mtDNA because
microsatellites have a number of advantages over other molecular markers with regard
to ease of use and results (Luikart and England, 1999).
Previous genetic studies on the population and stock structure of L. whiffiagonis across
its range are limited. Garcia-Vazquez et al. (2006) reported that variation in mtDNA
supported the existence of two differentiated subspecies of L. whiffiagonis totally
isolated at the genetic level, one in the Mediterranean Sea and the other in the Atlantic
Ocean. Danancher and Garcia-Vazquez (2009) also investigated population
differentiation of megrim in the northeast Atlantic and Mediterranean. They concluded
that there was evidence of strong genetic differentiation between megrim in ICES
Division VI and VII, VIII and IX, suggesting the existence of at least two separate
populations. However, the collection of samples on the northern shelf was limited to a
single location at Rockall and did not include IVa or VIa.
136
In light of the recent changes in megrim management boundaries and the lack of stock
structure studies on the Northern Shelf (IVa, VIa, VIb), this study provides the first
genetic comparison of megrim populations from the three Divisions. The aims of this
study were to determine, based on the genetic analysis of adult megrims captured on the
Northern Shelf, if there was evidence of separate populations on the northern Shelf, the
geographic distributions of any separate populations and whether the evidence from this
genetic study supports the management units implemented in 2011.
5.2 Materials & methods
A total of 270 adult L. whiffiagonis individuals were sampled across the Northern Shelf
(Figure 40) during the annual anglerfish survey undertaken by Marine Scotland in
April/May 2011. Thirty samples were collected at each of the sampling stations across
the three ICES Divisions. A section of muscle or gill tissue was removed from each
individual and stored in 90% ethanol. The Laboratory of Genetics of Natural Resources
at the University of Oviedo were contracted to undertake genetic and statistical
analyses.
137
Figure 40 Location of Rockall (R), West of Scotland (WS) and North Sea (NS) megrim
samples on the Northern Shelf.
5.2.1 Genetic analyses
Total genomic DNA was extracted from each piece of tissue (gill or muscle, approx. 1
cm3) employing the resin Chelex, following the standard protocol described by Estoup
et al. (1996).
5.2.1.1 Mitochondrial D-loop
The mitochondrial D-loop region was amplified as described in Campo and Garcia-
Vazquez (2010), employing the primers:
D-loopDF: 5′-GTCGCCACCATTAACTTATGC-3′
138
D-loopDR: 5′-CCCAAACTCCCAAAGCTAAG-3′
PCR amplifications were undertaken in a GeneAmpPCR System 2720 (Applied
Biosystems) with the following thermocycler conditions: an initial denaturing step at
95°C for 5 minutes followed by 35 cycles of: 94°C for 30 seconds, annealing at 60°C
for 30 seconds, and 72°C for 30 seconds, plus a final extension at 72°C for 15 min. The
reactions were carried out in a total volume of 30 μL containing 11.85 μL of bidistilled
water, 3 μL of 25 mM MgCl2, 3 μL of a dNTP's mixture at 2.5 mM, 6 μL of 5x
Promega Buffer, 1.5 μL of each primer at 20 μM, 0.15 μL of Promega GoTaq
Polymerase at 5 U/μL and 3 μL of template DNA. Five μL of each 30 μL PCR product
were loaded in 2% agarose gels and stained with 2 μL of 10mg/mL ethidium bromide.
Quantification of DNA concentration was performed by comparison with a DNA mass
ladder (Invitrogen) loaded in agarose gels. According to the brightness of each
individual’s band, the same concentration of PCR amplification product (approx. 50
ng/μL of PCR product) was sent to MACROGEN (www.macrogen.com) for
sequencing. Raw D-loop sequences were edited with the software BioEdit (Hall, 1999);
(www.mbio.ncsu.edu/ bioedit/bioedit.html). Sequences were aligned with the
application ClustalW, included in BioEdit, and the species was confirmed with the
software BlastN from the NCBI (www.ncbi.nlm.nih.gov/blast/Blast.cgi?PAGE=
Nucleotides) based on their highest identity with reference Lepidorhombus whiffiagonis
sequences included in the reference database GenBank
(www.ncbi.nlm.nih.gov/genbank/).
5.2.1.2 Microsatellites
Seven microsatellites specific for megrim species (Danancher and Garcia-Vazquez,
2009) were amplified in the samples: Lepi-P3, Lepi-P8, Lepi-P21, Lepi-P29, Lepi-P34,
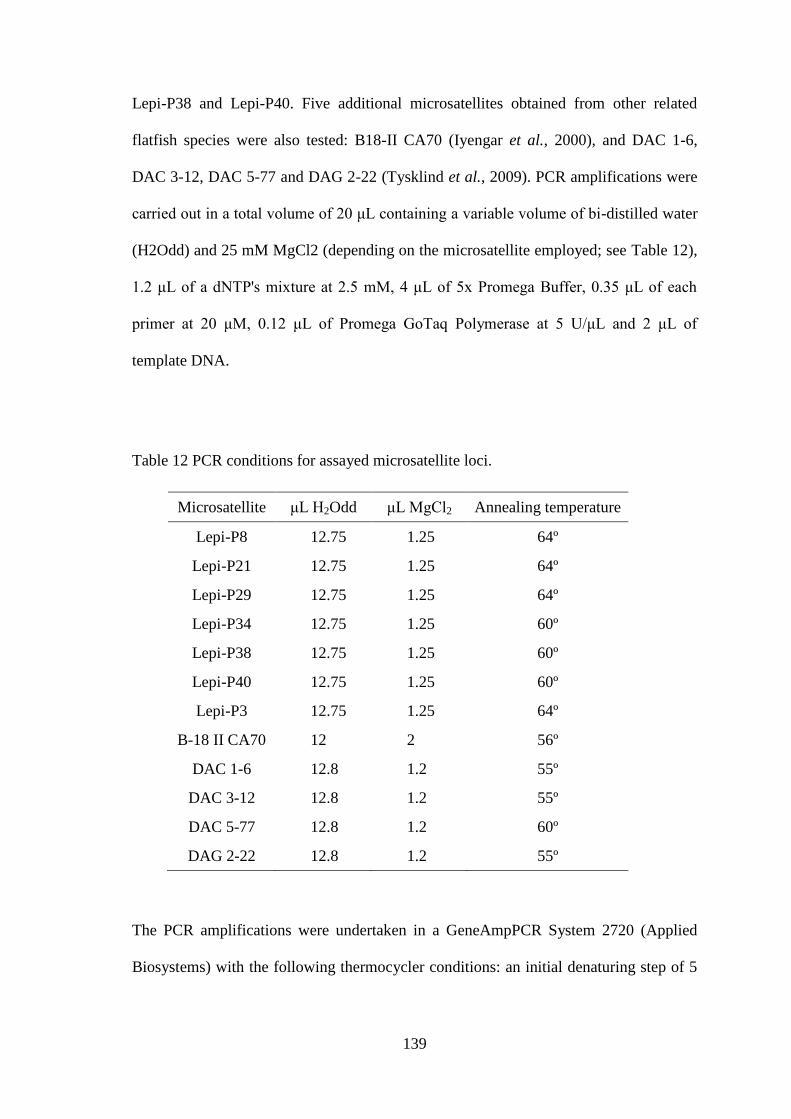
139
Lepi-P38 and Lepi-P40. Five additional microsatellites obtained from other related
flatfish species were also tested: B18-II CA70 (Iyengar et al., 2000), and DAC 1-6,
DAC 3-12, DAC 5-77 and DAG 2-22 (Tysklind et al., 2009). PCR amplifications were
carried out in a total volume of 20 μL containing a variable volume of bi-distilled water
(H2Odd) and 25 mM MgCl2 (depending on the microsatellite employed; see Table 12),
1.2 μL of a dNTP's mixture at 2.5 mM, 4 μL of 5x Promega Buffer, 0.35 μL of each
primer at 20 μM, 0.12 μL of Promega GoTaq Polymerase at 5 U/μL and 2 μL of
template DNA.
Table 12 PCR conditions for assayed microsatellite loci.
Microsatellite μL H2Odd μL MgCl2 Annealing temperature
Lepi-P8 12.75 1.25 64º
Lepi-P21 12.75 1.25 64º
Lepi-P29 12.75 1.25 64º
Lepi-P34 12.75 1.25 60º
Lepi-P38 12.75 1.25 60º
Lepi-P40 12.75 1.25 60º
Lepi-P3 12.75 1.25 64º
B-18 II CA70 12 2 56º
DAC 1-6 12.8 1.2 55º
DAC 3-12 12.8 1.2 55º
DAC 5-77 12.8 1.2 60º
DAG 2-22 12.8 1.2 55º
The PCR amplifications were undertaken in a GeneAmpPCR System 2720 (Applied
Biosystems) with the following thermocycler conditions: an initial denaturing step of 5
140
minutes at 94°C followed by 40 cycles of 30 seconds at 94°C, 30 seconds at the
corresponding annealing temperature (Table 12) and 30 seconds at 72°C, and a final
extension of 20 minutes at 72°C for the microsatellites Lepi-P3, Lepi-P8, Lepi- P21,
Lepi-P29, Lepi-P34, Lepi-P38 and Lepi-P40 as described in Danancher and Garcia-
Vazquez (2009). For the remaining microsatellites (B18-II CA70, DAC 1-6, DAC 3-12,
DAC 5-77 and DAG 2-22), the PCR conditions were an initial denaturing step of 5
minutes at 94°C followed by 40 cycles of 30 seconds at 95°C, 45 seconds at annealing
temperature (Table 12), 1 minute at 72°C, and a final extension of 20 minutes at 72°C,
similar to those described in both Iyengar et al. (2000) and Tysklind et al. (2009).
Microsatellites yielding clear amplification products and variability within the
populations analysed were chosen to complete the final microsatellite panel. They were
split into two different sets, according to their allelic ranges, for analytical purposes.
Labelled primers were ordered, with the forward primer of each pair within each set
labelled with different fluorochromes. PCR products were separated using capillary
electrophoresis on an ABI PRISM® 3100 Genetic Analyzer (Applied Biosystems,
Foster City, CA, USA) at the Scientific and Technical Services at the University of
Oviedo (Spain). Allele sizes were determined employing the Peak Scanner software V
1.0 (Applied Biosystems, Foster City, CA, USA).
5.2.2 Statistical analyses
Mitochondrial D-loop sequences were analyzed with the program DnaSP v.5 (Librado
and Rozas, 2009) for the following parameters: Number of nucleotide sites per sequence
(base length); number of polymorphic sites; singletons (unique haplotypes); number of
parsimony informative sites within the polymorphic sites; number of haplotypes;
haplotype diversity; nucleotide diversity; and the average number of nucleotide
141
differences. In addition, Fu and Li’s D, Fu and Li’s F, Fu’s Fs and Tajima’s D tests
were undertaken to estimate demographic expansion (neutrality test). Significant values
are signals of population expansion as explained in Table 13.
The microsatellite dataset was tested for the presence of null alleles (one or more alleles
might fail to amplify during PCR), stuttering (slight artefacts occurred in the allele sizes
during PCR) and large allele dropout (large alleles that do not amplify as efficiently as
small alleles) with the software Micro Checker v.2.2.3 (van Oosterhout et al., 2004).
Allele frequencies, allelic richness, genetic diversity, observed and expected
heterozygosities, test of departure from Hardy-Weinberg equilibrium and estimations of
genetic diversities (parameters of population variation like number of alleles per locus,
heterozygosity observed and expected under equilibrium conditions, allele richness and
others), population differentiation (FST) and deviations from the equilibrium due to
non-random mating (or inbreeding) (FIS) were calculated using the software FSTAT
v.2.9.3.2 (Goudet, 1995).
The number of different genetic units occurring in the areas sampled was determined
with the STRUCTURE v.2.3.3 software package (Pritchard et al., 2000). This allows
for the estimation of the number of genetic units (K) among a dataset of microsatellite
genotypes based on a Bayesian algorithm, independent of locality information. The
STRUCTURE software also provides the estimation of the membership fraction of each
individual into each of the K inferred clusters (Q), and therefore allows for
identification of individuals with mixed membership. Twelve independent runs were
performed using an admixture model (each individuals draws some fraction of its
genome from each of the K populations) between K=1 and K=9, with a burn-in period
142
of 30,000 steps followed by 300,000 Markov Chain Monte Carlo (MCMC) to ensure
convergence. The true (or best fit) number of genetic units can be set employing
methodology outlined in (Evanno et al., 2005). The rate of change of the likelihood
function obtained from the STRUCTURE software (ΔK) is plotted against the different
K values tested, and the one exhibiting the maximum peak in the plot is the best fit.
Monmonier's maximum difference algorithm (Manni et al., 2004) was used to identify
and quantify spatial genetic discontinuities, using the program BARRIER v.2.2. The
geographical coordinates of each sample were connected by Delauney triangulation
with the pairwise FST genetic matrix generated from the above cited program FSTAT.
Putative spatial genetic boundaries were identified across the studied marine area
(Manni et al., 2004).
5.3 Results
5.3.1 Mitochondrial D-loop
All of the 270 individuals sampled were successfully amplified. After editing the raw
chromatograms a total of 262 individuals (88 Rockall, 87 West of Scotland and 87
North Sea individuals) yielded clear sequences for further analyses.
All sequences were aligned and checked and re-edited if necessary with the program
ClustalW in BioEdit. Once edited, sequences were uploaded to BlastN
(www.ncbi.nlm.nih.gov/blast/Blast.cgi?PAGE=Nucleotides) for species confirmation.
All individuals were identified as Lepidorhombus whiffiagonis with identities higher
than 99%.
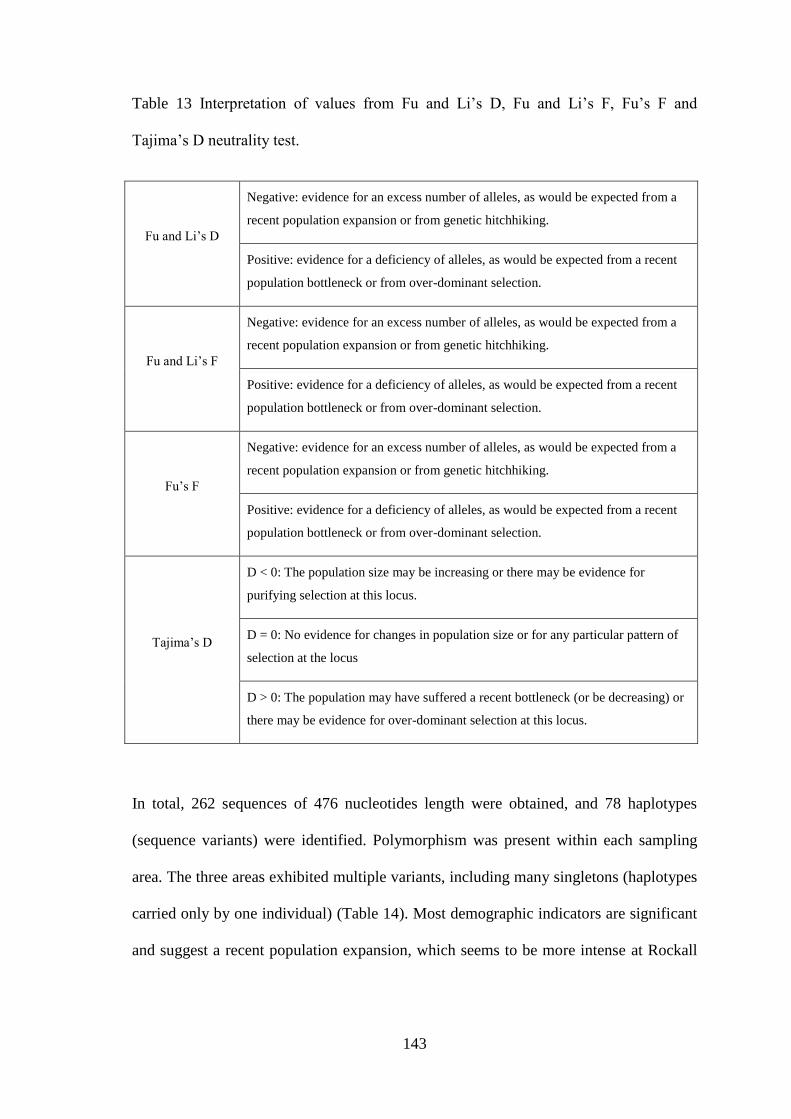
143
Table 13 Interpretation of values from Fu and Li’s D, Fu and Li’s F, Fu’s F and
Tajima’s D neutrality test.
Fu and Li’s D
Negative: evidence for an excess number of alleles, as would be expected from a
recent population expansion or from genetic hitchhiking.
Positive: evidence for a deficiency of alleles, as would be expected from a recent
population bottleneck or from over-dominant selection.
Fu and Li’s F
Negative: evidence for an excess number of alleles, as would be expected from a
recent population expansion or from genetic hitchhiking.
Positive: evidence for a deficiency of alleles, as would be expected from a recent
population bottleneck or from over-dominant selection.
Fu’s F
Negative: evidence for an excess number of alleles, as would be expected from a
recent population expansion or from genetic hitchhiking.
Positive: evidence for a deficiency of alleles, as would be expected from a recent
population bottleneck or from over-dominant selection.
Tajima’s D
D < 0: The population size may be increasing or there may be evidence for
purifying selection at this locus.
D = 0: No evidence for changes in population size or for any particular pattern of
selection at the locus
D > 0: The population may have suffered a recent bottleneck (or be decreasing) or
there may be evidence for over-dominant selection at this locus.
In total, 262 sequences of 476 nucleotides length were obtained, and 78 haplotypes
(sequence variants) were identified. Polymorphism was present within each sampling
area. The three areas exhibited multiple variants, including many singletons (haplotypes
carried only by one individual) (Table 14). Most demographic indicators are significant
and suggest a recent population expansion, which seems to be more intense at Rockall

144
and the North Sea than at the West of Scotland. Although the West of Scotland is in the
centre of the studied region, it contains less variants (less haplotypes), less singletons
and in general is less variable than the other two zones.
5.3.1 Microsatellites
Eleven microsatellites yielded clear band patterns. PCR amplifications products from
DAG 2-22 were not clear and were discarded at this point.
The final panel of microsatellites was composed of: Lepi-P3, Lepi-P8, Lepi-P21, Lepi-
P29, Lepi-P34, Lepi-P38, Lepi-P40 (Danancher and Garcia-Vazquez, 2009), B18-II
CA70 (Iyengar et al., 2000), DAC 1-6, DAC 3-12 and DAC 5-77 (Tysklind et al.,
2009). Two different microsatellite sets were arranged with different dyes, according to
their allelic ranges, and processed simultaneously in a DNA analyser (Table 15). Some
failures at PCR amplification appeared when using the new labelled primers. PCR
amplification conditions were subsequently modified and are shown in Table 16.
Following amplification, chromatograms enabled the individuals sampled to be
genotyped. The genetic variability found for each microsatellite in each area is
summarized in Table 17. Basic variation such as number of alleles of each locus and
allelic richness differed among microsatellites and was generally higher for Lepi-P8 and
DAC 5-77. These two loci can be considered a priori as being more informative.
Estimates of FIS, a measure of inbreeding within areas, were low and not significant for
any area. This indicates that the studied populations have sufficient variability and do
not exhibit significant reduction in genetic variability.
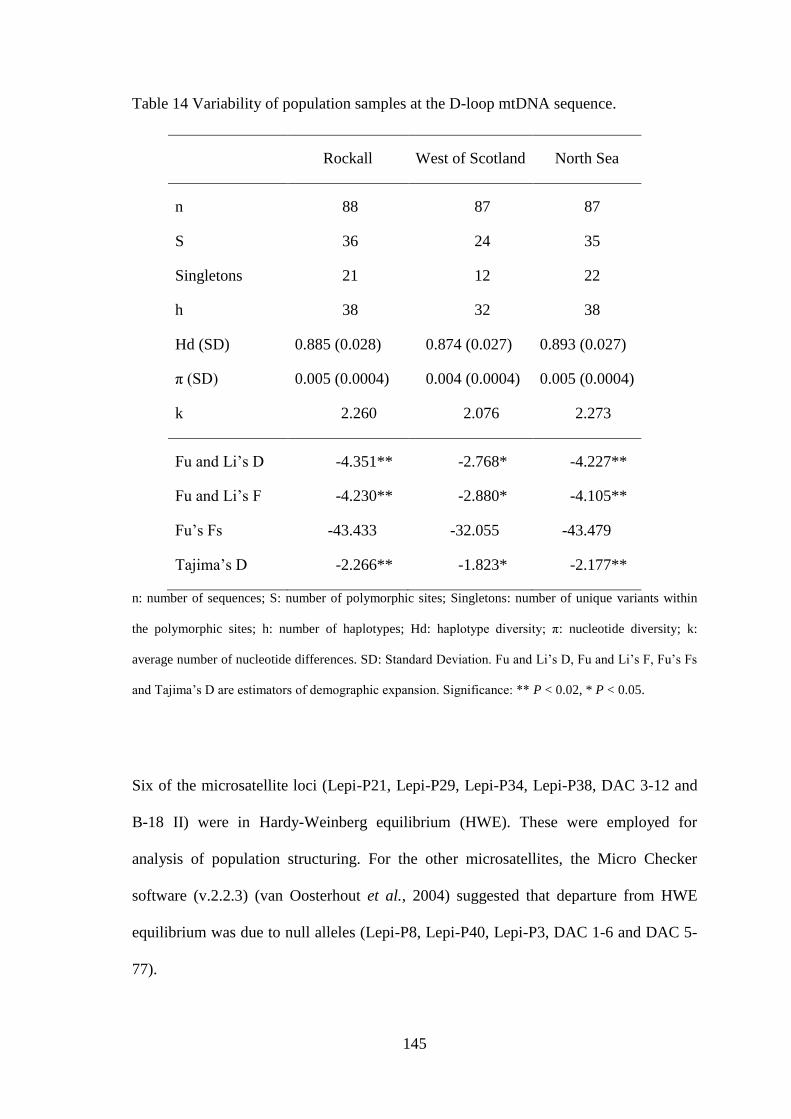
145
Table 14 Variability of population samples at the D-loop mtDNA sequence.
Rockall West of Scotland North Sea
n 88 87 87
S 36 24 35
Singletons 21 12 22
h 38 32 38
Hd (SD) 0.885 (0.028) 0.874 (0.027) 0.893 (0.027)
π (SD) 0.005 (0.0004) 0.004 (0.0004) 0.005 (0.0004)
k 2.260 2.076 2.273
Fu and Li’s D -4.351** -2.768* -4.227**
Fu and Li’s F -4.230** -2.880* -4.105**
Fu’s Fs -43.433 -32.055 -43.479
Tajima’s D -2.266** -1.823* -2.177**
n: number of sequences; S: number of polymorphic sites; Singletons: number of unique variants within
the polymorphic sites; h: number of haplotypes; Hd: haplotype diversity; π: nucleotide diversity; k:
average number of nucleotide differences. SD: Standard Deviation. Fu and Li’s D, Fu and Li’s F, Fu’s Fs
and Tajima’s D are estimators of demographic expansion. Significance: ** P < 0.02, * P < 0.05.
Six of the microsatellite loci (Lepi-P21, Lepi-P29, Lepi-P34, Lepi-P38, DAC 3-12 and
B-18 II) were in Hardy-Weinberg equilibrium (HWE). These were employed for
analysis of population structuring. For the other microsatellites, the Micro Checker
software (v.2.2.3) (van Oosterhout et al., 2004) suggested that departure from HWE
equilibrium was due to null alleles (Lepi-P8, Lepi-P40, Lepi-P3, DAC 1-6 and DAC 5-
77).
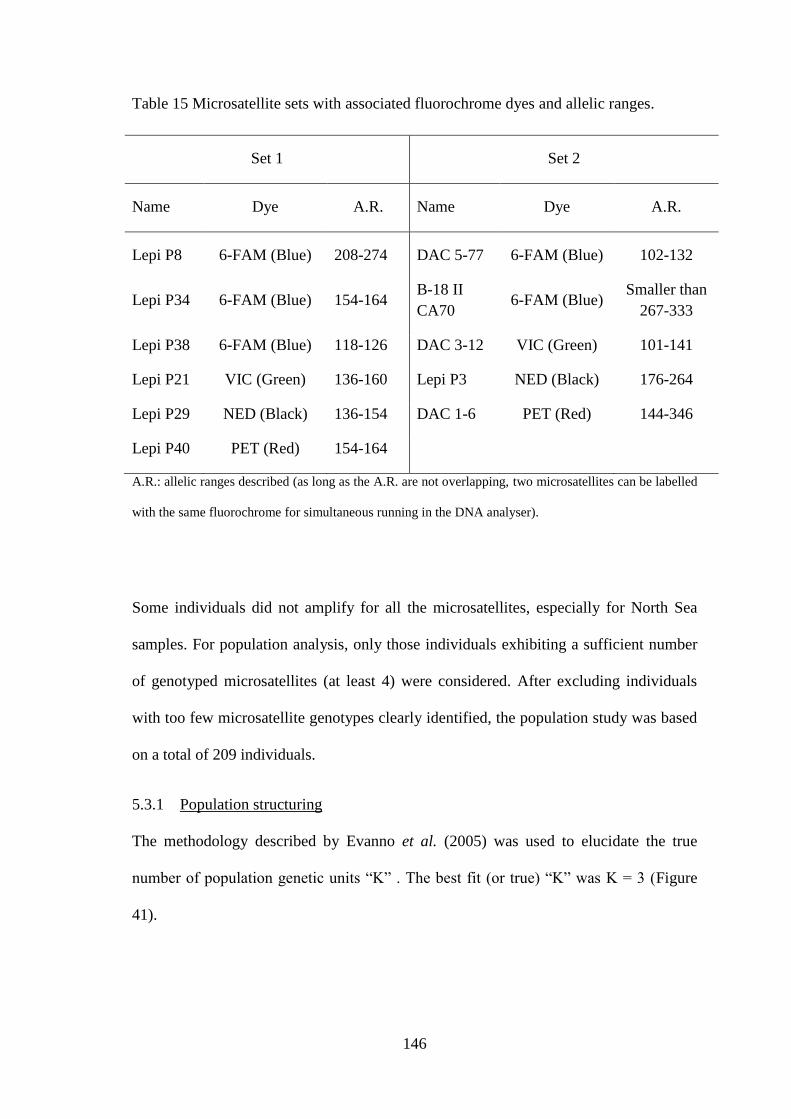
146
Table 15 Microsatellite sets with associated fluorochrome dyes and allelic ranges.
Set 1 Set 2
Name Dye A.R. Name Dye A.R.
Lepi P8 6-FAM (Blue) 208-274 DAC 5-77 6-FAM (Blue) 102-132
Lepi P34 6-FAM (Blue) 154-164 B-18 II
CA70 6-FAM (Blue)
Smaller than
267-333
Lepi P38 6-FAM (Blue) 118-126 DAC 3-12 VIC (Green) 101-141
Lepi P21 VIC (Green) 136-160 Lepi P3 NED (Black) 176-264
Lepi P29 NED (Black) 136-154 DAC 1-6 PET (Red) 144-346
Lepi P40 PET (Red) 154-164
A.R.: allelic ranges described (as long as the A.R. are not overlapping, two microsatellites can be labelled
with the same fluorochrome for simultaneous running in the DNA analyser).
Some individuals did not amplify for all the microsatellites, especially for North Sea
samples. For population analysis, only those individuals exhibiting a sufficient number
of genotyped microsatellites (at least 4) were considered. After excluding individuals
with too few microsatellite genotypes clearly identified, the population study was based
on a total of 209 individuals.
5.3.1 Population structuring
The methodology described by Evanno et al. (2005) was used to elucidate the true
number of population genetic units “K” . The best fit (or true) “K” was K = 3 (Figure
41).
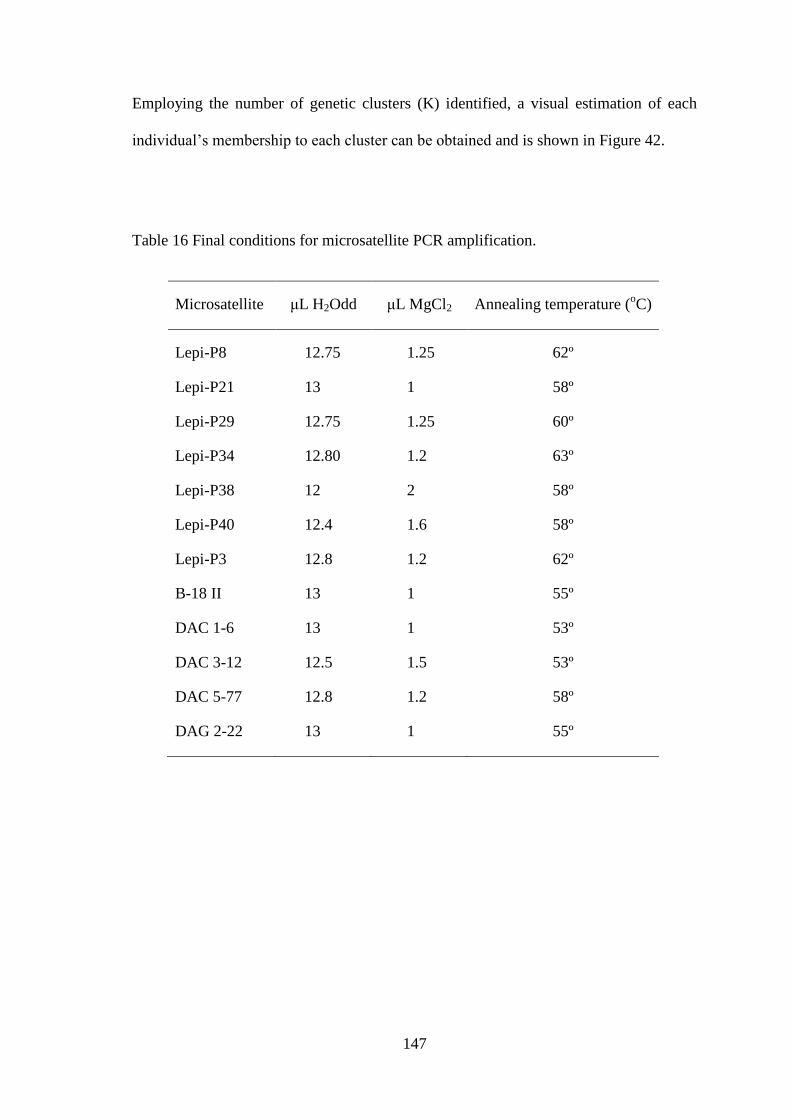
147
Employing the number of genetic clusters (K) identified, a visual estimation of each
individual’s membership to each cluster can be obtained and is shown in Figure 42.
Table 16 Final conditions for microsatellite PCR amplification.
Microsatellite μL H2Odd μL MgCl2 Annealing temperature (oC)
Lepi-P8 12.75 1.25 62º
Lepi-P21 13 1 58º
Lepi-P29 12.75 1.25 60º
Lepi-P34 12.80 1.2 63º
Lepi-P38 12 2 58º
Lepi-P40 12.4 1.6 58º
Lepi-P3 12.8 1.2 62º
B-18 II 13 1 55º
DAC 1-6 13 1 53º
DAC 3-12 12.5 1.5 53º
DAC 5-77 12.8 1.2 58º
DAG 2-22 13 1 55º
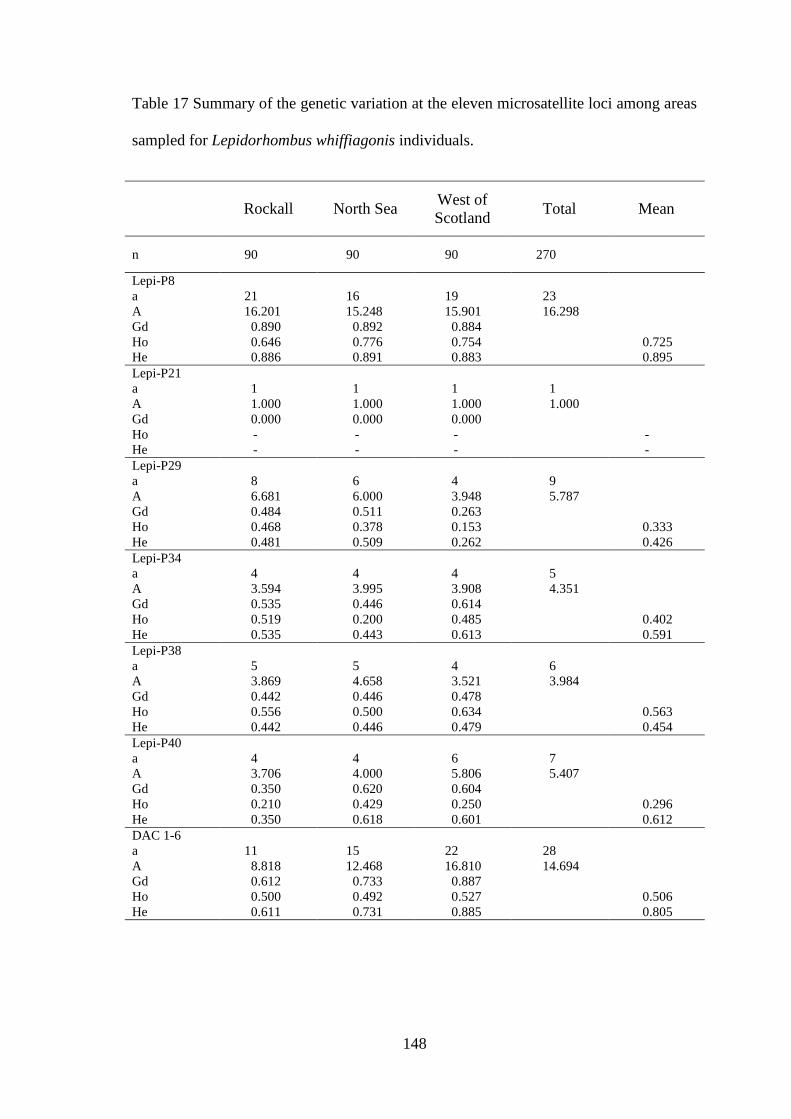
148
Table 17 Summary of the genetic variation at the eleven microsatellite loci among areas
sampled for Lepidorhombus whiffiagonis individuals.
Rockall North Sea West of
Scotland Total Mean
n 90 90 90 270
Lepi-P8
a 21 16 19 23
A 16.201 15.248 15.901 16.298
Gd 0.890 0.892 0.884
Ho 0.646 0.776 0.754 0.725
He 0.886 0.891 0.883 0.895
Lepi-P21
a 1 1 1 1
A 1.000 1.000 1.000 1.000
Gd 0.000 0.000 0.000
Ho - - - -
He - - - -
Lepi-P29
a 8 6 4 9
A 6.681 6.000 3.948 5.787
Gd 0.484 0.511 0.263
Ho 0.468 0.378 0.153 0.333
He 0.481 0.509 0.262 0.426
Lepi-P34
a 4 4 4 5
A 3.594 3.995 3.908 4.351
Gd 0.535 0.446 0.614
Ho 0.519 0.200 0.485 0.402
He 0.535 0.443 0.613 0.591
Lepi-P38
a 5 5 4 6
A 3.869 4.658 3.521 3.984
Gd 0.442 0.446 0.478
Ho 0.556 0.500 0.634 0.563
He 0.442 0.446 0.479 0.454
Lepi-P40
a 4 4 6 7
A 3.706 4.000 5.806 5.407
Gd 0.350 0.620 0.604
Ho 0.210 0.429 0.250 0.296
He 0.350 0.618 0.601 0.612
DAC 1-6
a 11 15 22 28
A 8.818 12.468 16.810 14.694
Gd 0.612 0.733 0.887
Ho 0.500 0.492 0.527 0.506
He 0.611 0.731 0.885 0.805
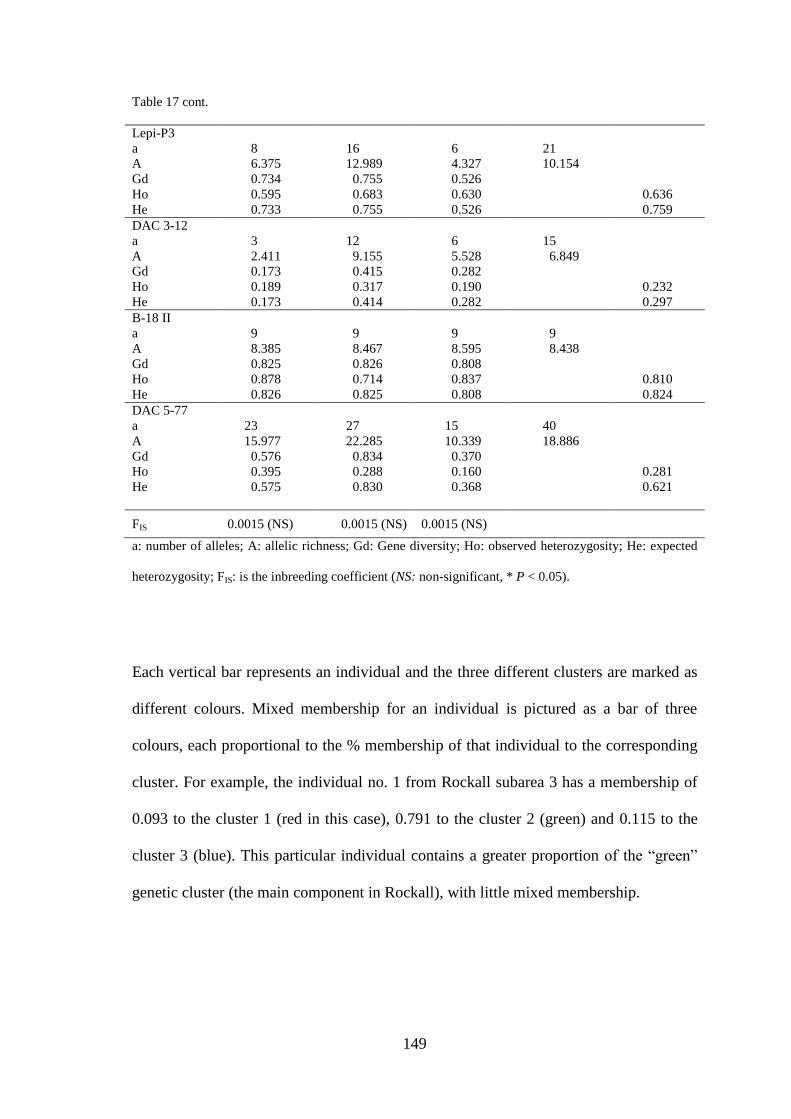
149
Table 17 cont.
Lepi-P3
a 8 16 6 21
A 6.375 12.989 4.327 10.154
Gd 0.734 0.755 0.526
Ho 0.595 0.683 0.630 0.636
He 0.733 0.755 0.526 0.759
DAC 3-12
a 3 12 6 15
A 2.411 9.155 5.528 6.849
Gd 0.173 0.415 0.282
Ho 0.189 0.317 0.190 0.232
He 0.173 0.414 0.282 0.297
B-18 II
a 9 9 9 9
A 8.385 8.467 8.595 8.438
Gd 0.825 0.826 0.808
Ho 0.878 0.714 0.837 0.810
He 0.826 0.825 0.808 0.824
DAC 5-77
a 23 27 15 40
A 15.977 22.285 10.339 18.886
Gd 0.576 0.834 0.370
Ho 0.395 0.288 0.160 0.281
He 0.575 0.830 0.368 0.621
FIS 0.0015 (NS) 0.0015 (NS) 0.0015 (NS)
a: number of alleles; A: allelic richness; Gd: Gene diversity; Ho: observed heterozygosity; He: expected
heterozygosity; FIS: is the inbreeding coefficient (NS: non-significant, * P < 0.05).
Each vertical bar represents an individual and the three different clusters are marked as
different colours. Mixed membership for an individual is pictured as a bar of three
colours, each proportional to the % membership of that individual to the corresponding
cluster. For example, the individual no. 1 from Rockall subarea 3 has a membership of
0.093 to the cluster 1 (red in this case), 0.791 to the cluster 2 (green) and 0.115 to the
cluster 3 (blue). This particular individual contains a greater proportion of the “green”
genetic cluster (the main component in Rockall), with little mixed membership.
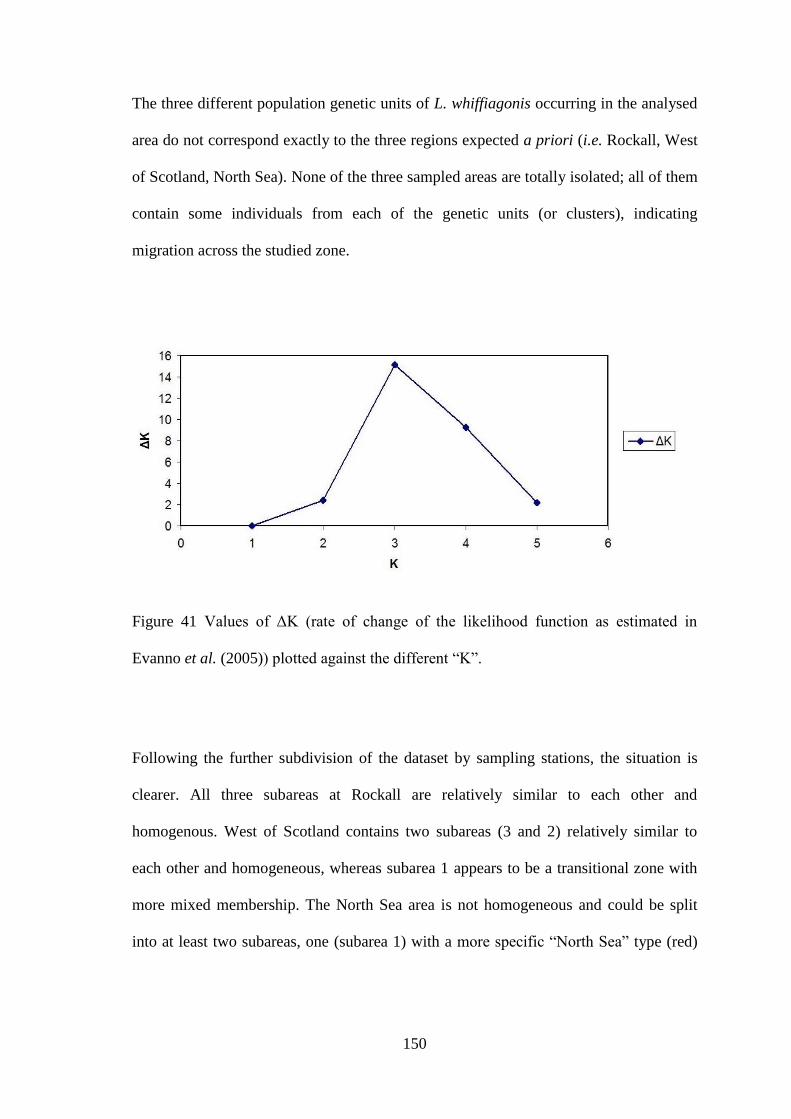
150
The three different population genetic units of L. whiffiagonis occurring in the analysed
area do not correspond exactly to the three regions expected a priori (i.e. Rockall, West
of Scotland, North Sea). None of the three sampled areas are totally isolated; all of them
contain some individuals from each of the genetic units (or clusters), indicating
migration across the studied zone.
Figure 41 Values of ΔK (rate of change of the likelihood function as estimated in
Evanno et al. (2005)) plotted against the different “K”.
Following the further subdivision of the dataset by sampling stations, the situation is
clearer. All three subareas at Rockall are relatively similar to each other and
homogenous. West of Scotland contains two subareas (3 and 2) relatively similar to
each other and homogeneous, whereas subarea 1 appears to be a transitional zone with
more mixed membership. The North Sea area is not homogeneous and could be split
into at least two subareas, one (subarea 1) with a more specific “North Sea” type (red)
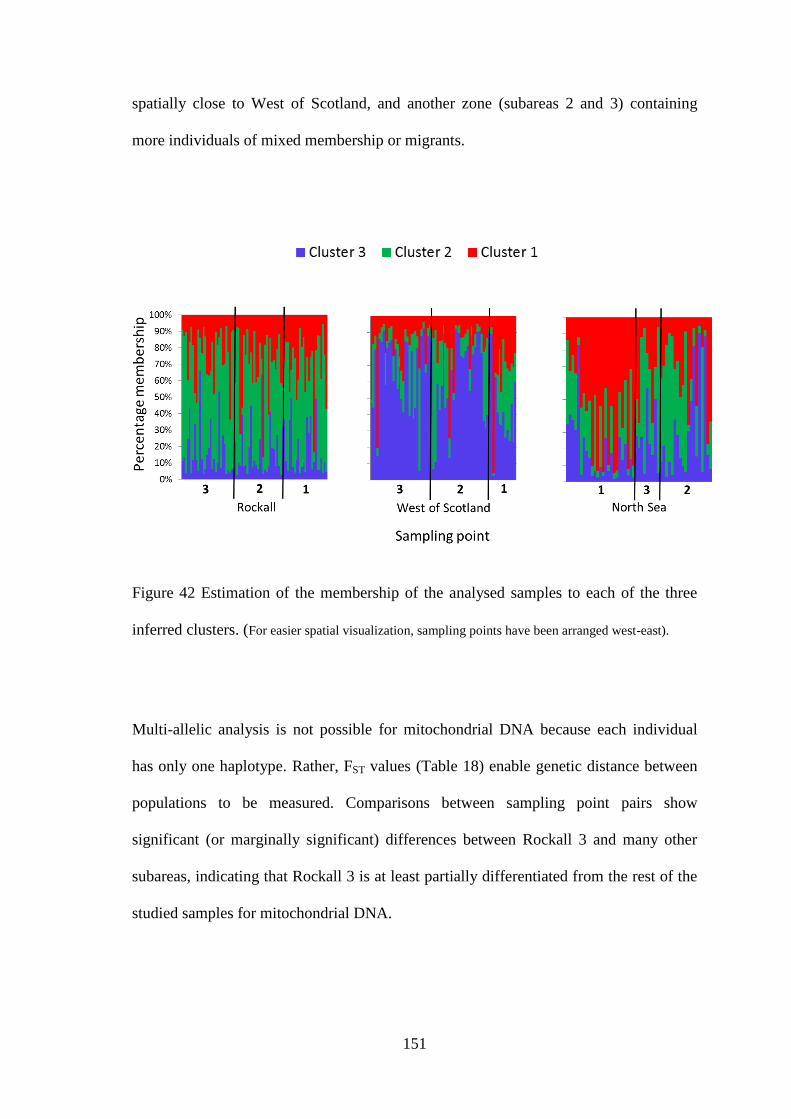
151
spatially close to West of Scotland, and another zone (subareas 2 and 3) containing
more individuals of mixed membership or migrants.
Figure 42 Estimation of the membership of the analysed samples to each of the three
inferred clusters. (For easier spatial visualization, sampling points have been arranged west-east).
Multi-allelic analysis is not possible for mitochondrial DNA because each individual
has only one haplotype. Rather, FST values (Table 18) enable genetic distance between
populations to be measured. Comparisons between sampling point pairs show
significant (or marginally significant) differences between Rockall 3 and many other
subareas, indicating that Rockall 3 is at least partially differentiated from the rest of the
studied samples for mitochondrial DNA.
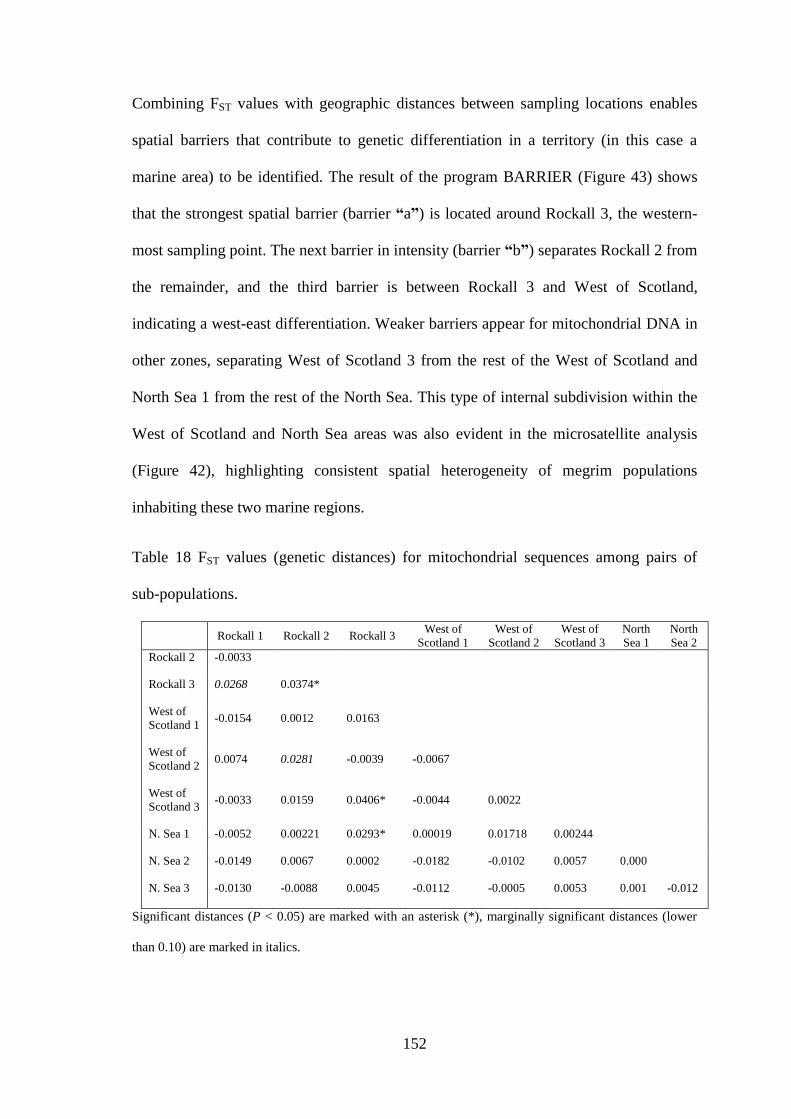
152
Combining FST values with geographic distances between sampling locations enables
spatial barriers that contribute to genetic differentiation in a territory (in this case a
marine area) to be identified. The result of the program BARRIER (Figure 43) shows
that the strongest spatial barrier (barrier “a”) is located around Rockall 3, the western-
most sampling point. The next barrier in intensity (barrier “b”) separates Rockall 2 from
the remainder, and the third barrier is between Rockall 3 and West of Scotland,
indicating a west-east differentiation. Weaker barriers appear for mitochondrial DNA in
other zones, separating West of Scotland 3 from the rest of the West of Scotland and
North Sea 1 from the rest of the North Sea. This type of internal subdivision within the
West of Scotland and North Sea areas was also evident in the microsatellite analysis
(Figure 42), highlighting consistent spatial heterogeneity of megrim populations
inhabiting these two marine regions.
Table 18 FST values (genetic distances) for mitochondrial sequences among pairs of
sub-populations.
Rockall 1 Rockall 2 Rockall 3
West of
Scotland 1
West of
Scotland 2
West of
Scotland 3
North
Sea 1
North
Sea 2
Rockall 2 -0.0033
Rockall 3 0.0268 0.0374*
West of
Scotland 1 -0.0154 0.0012 0.0163
West of
Scotland 2 0.0074 0.0281 -0.0039 -0.0067
West of
Scotland 3 -0.0033 0.0159 0.0406* -0.0044 0.0022
N. Sea 1 -0.0052 0.00221 0.0293* 0.00019 0.01718 0.00244
N. Sea 2 -0.0149 0.0067 0.0002 -0.0182 -0.0102 0.0057 0.000
N. Sea 3 -0.0130 -0.0088 0.0045 -0.0112 -0.0005 0.0053 0.001 -0.012
Significant distances (P < 0.05) are marked with an asterisk (*), marginally significant distances (lower
than 0.10) are marked in italics.
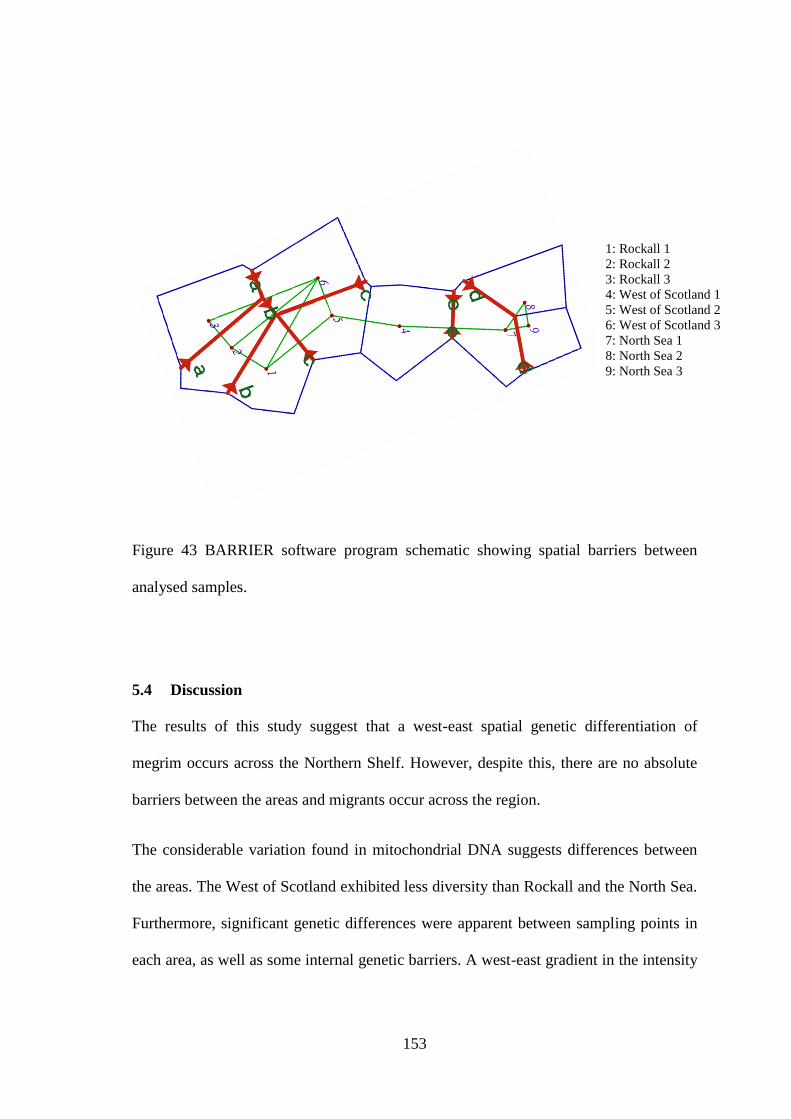
153
Figure 43 BARRIER software program schematic showing spatial barriers between
analysed samples.
5.4 Discussion
The results of this study suggest that a west-east spatial genetic differentiation of
megrim occurs across the Northern Shelf. However, despite this, there are no absolute
barriers between the areas and migrants occur across the region.
The considerable variation found in mitochondrial DNA suggests differences between
the areas. The West of Scotland exhibited less diversity than Rockall and the North Sea.
Furthermore, significant genetic differences were apparent between sampling points in
each area, as well as some internal genetic barriers. A west-east gradient in the intensity
1: Rockall 1
2: Rockall 2
3: Rockall 3
4: West of Scotland 1
5: West of Scotland 2
6: West of Scotland 3
7: North Sea 1
8: North Sea 2
9: North Sea 3
154
of barriers suggests spatial differentiation of megrim populations for this maternally
inherited DNA. This suggests that the three areas are internally heterogeneous,
containing subtly differentiated sub-populations.
Nuclear hyper-variable microsatellite loci analysis confirmed the west-east population
subdivision detected from mitochondrial DNA variation and allowed for the
identification of finer spatial structuring. Three areas of at least partially differentiated
genetic identity were recognised: Rockall; the southern half of VIa (West of Scotland 2
& 3); and the north-west of IVa (North Sea 1). The remaining sampling points would
represent transitional areas (West of Scotland 1) or zones receiving migrants from other
areas (North Sea 2 & 3). Spatial population structuring suggests the need of at least
partially separated management of megrim at Rockall, the southern half of VIa (West of
Scotland), and the north-west of IVa (North Sea). As such, the results of this study
broadly support the recent changes in megrim stock structure, i.e. one stock consisting
of Divisions IVa (northern North Sea) and VIa (West of Scotland). However, it is
unclear whether differences in population genetic units between the south of VIa (West
of Scotland), and the north of IVa (northern North Sea) are indicative of population
differentiation or simply extremes of a gradient across a single population. Little is
known about the existence of megrim migrations to spawning and/or feeding grounds
although Gordon (2001) reported that spawning fish were evident across the species’
range on the Northern Shelf. This suggests that the species may be relatively sedentary,
undertaking limited or no migrations or aggregations for spawning or feeding. This may
in turn result in localised mixing throughout the species’ range along the shelf edge,
resulting in limited localised genetic variation but more extensive variation between the
155
extremes of the population. However, if this is the case, it is unclear what mechanisms
enable mixing of the Rockall population with those along the shelf edge.
A recent study comparing life history characteristics of L. whiffiagonis between the
northern North Sea and Rockall reported significant variation in a number of life history
parameters including spawning season, growth, sex ratio and maturity (Macdonald et
al., 2013), suggesting that variation between the areas is both genotypic and phenotypic.
Additional studies of growth, spawning and juvenile production are required to
determine if this apparent genetic differentiation is coupled with other biological
characteristics of importance for fisheries management across the entire Northern Shelf.
An ideal scenario would allow for a multi-disciplinary approach to megrim stock
identification. Such an approach would allow for the assessment of stock structure using
a range of methodologies including genetic markers, morphometry, biological tags and
life history traits (Abaunza et al., 2008b).
Casselman et al. (1981) stated that the collection and analysis of data for stock
identification purposes should be undertaken during the spawning season in order to
maximise stock discreteness as this reduces the effect of stock mixing which may occur
at other times of the year. The current study was undertaken towards the end of the
spawning season at Rockall and the northern North Sea (Macdonald et al., 2013) and
therefore enhances the likelihood of any stock discreteness that may exist.
Danancher and Garcia-Vazquez (2009) reported that there was evidence of two separate
stocks of L. whiffiagonis in the Atlantic Ocean; one consisting of fish in VI (although
their study was limited to 42 samples from Rockall) and a further one in VIII (Bay of
Biscay) and IX (Iberian Peninsula). They also noted that the areas sampled between
156
them (VII and VIII) provided a less clear picture of stock definition, similar to the
results of the study undertaken here. Given the continuation of the species’ habitat and
range along the continental shelf edge, there is a likelihood of localised genetic mixing
and, as such, the presence of clearly defined stocks boundaries may not exist. Indeed, it
may be the case that the megrim population structure in the Atlantic Ocean is best
described as being a metapopulation or a collection of localised interacting sub-
populations. If this is indeed the case then assigning accurate stock boundaries for the
species may prove difficult and any management boundaries specified may in effect be
limited to segregating the metapopulation into smaller, more manageable units rather
than discerning between sub-populations. Further work, directly comparing the results
of this study and that of Danancher and Garcia-Vazquez (2009), would provide a
genetic overview of L. whiffiagonis population structure across its range in the Atlantic
Ocean.
5.5 Conclusions
There is evidence that a west-east spatial genetic differentiation of megrim occurs
across the Northern Shelf. The results of this study broadly support the recent changes
in megrim stock structure, i.e. one stock consisting of Divisions IVa (northern North
Sea) and VIa (West of Scotland). Differences in population genetic units between the
south of VIa (West of Scotland), and the north of IVa (northern North Sea) may be
indicative of further population differentiation. However, it is unclear whether
differences in population genetic units between the south of VIa (West of Scotland), and
the north of IVa (northern North Sea) are indicative of population differentiation or
simply extremes of a gradient across a single population.

157
158
CHAPTER 6
THE CONTRIBUTION OF QUOTA TO THE DISCARDS
PROBLEM: A CASE STUDY ON THE COMPLEXITY OF
COMMON MEGRIM LEPIDORHOMBUS WHIFFIAGONIS
DISCARDING IN THE NORTHERN NORTH SEA
159
6.1 Introduction
The United Nations Food and Agricultural Organisation (FAO) defines discards as the
proportion of the total organic material of animal origin in the catch which is thrown
away or dumped at sea for whatever reason (Kelleher, 2005). In EU waters the
proportion of the catch discarded within demersal fisheries is typically between 20%
and 60% by weight, and is largely fishery- and area-dependent (Anon, 2007). In the
North Sea total annual discards during the period 1992-2001 were estimated at 500,000
to 800,000 tonnes per year (Kelleher, 2005).
In 2007 the EU introduced a policy designed to reduce discards in European fisheries
(Anon, 2007). This has resulted in the introduction of management measures such as the
prohibition of high grading in the North Sea (Anon, 2009a). Under this regulation, there
is a requirement for any quota species caught in the North Sea to be landed.
Furthermore, voluntary schemes such as the North Sea catch quota management system
(Anon, 2011b) enable the operation of a fully documented fishery with the use of
remote electronic monitoring. The scheme was initially intended to reduce cod discards
by ensuring that all cod catches above the minimum landing size were landed. However,
the scheme is not currently in operation across the entire demersal fleet (Anon, 2011b).
At present, outright discard bans in the EU are found predominantly in single-species
fisheries as they do not have many of the inherent complications of demersal mixed-
species fisheries (Anon, 2007). Additional management measures have been proposed
under the CFP to reduce by-catch and eliminate discards. These include measures such
as mechanisms for flexibility and transfer of quotas, encouragement to develop and use
selective gears, real-time closures, an obligation to switch fishing grounds, fees on
unwanted by-catches and expropriation of unwanted by-catches (Anon, 2007). The
160
implementation of these approaches has been undertaken to different degrees and has
had varying success. The European Commission is further proposing to introduce an
overall ban on discarding with a gradual approach: pelagic species in 2015 and demersal
species beginning in 2016 (Anon, 2011a).
One of the contributing factors to discarding is high grading, the process by which
individual fish are preferentially retained over others to maximise economic returns.
Less valuable by-catch species, as well as species with no economic value (often
referred to as ‘trash species’ (Jennings et al., 2001)), are returned to the sea. The
situation becomes further complicated by having quotas for individual species. This can
exacerbate high-grading as the most valuable proportion of the target species, often the
larger individuals in the catch, are retained while smaller and/or damaged individuals,
although above the minimum size, are discarded. Market influences also affect
discarding as fishermen will often discard a greater proportion of the catch when market
prices are low and conserve quota for periods of higher prices, where possible. This
enables fishermen to obtain maximum returns for their quota. To try to quantify the
importance of the various factors that contribute to fishermen’s decision-making
process in relation to discarding, Gillis et al., (1995) devised a model of discarding
within each fishing trip, taking each of the factors that affect discarding into account.
Their model suggested that high-grading should be more common towards the end of a
fishing trip although it may be common at the beginning of a trip when the probability
of a vessel’s quota being filled is high. It also suggested that high-grading increases
with overall fish availability. However, this model was applied to a scenario where
quotas are specified for a given trip, and may not necessarily hold true for other quota
structures such as monthly allocations. Furthermore, Feekings et al. (2012) reported that
161
the interaction of a multitude of highly species-specific factors were influential in
affecting fishermen’s decisions to discard. They investigated the effects of 11 variables
affecting discards within a demersal trawl fishery and recommended that an
understanding of the factors that influence discarding is essential for the future
management of fish stocks.
In the mixed demersal fishery of the North Sea, the total allowable catch (TAC) system,
which is in fact a Total Allowable Landings (TAL) system, is a significant contributor
to discarding (Rijnsdorp et al., 2007). For a given species, the TAC is the total
allowable catch available to an individual country. Quota refers to the proportion of the
TAC that is available to an individual business. As such, quota availability is not only
affected by available TAC, but also by associated flexibilities such as trading or
swapping quota between POs. The composition and quantity of target species often
differ between vessels depending on available quota and, when fishermen target
grounds where certain species are abundant, quotas can be exhausted in a relatively
short time. This has been especially evident with the common megrim Lepidorhombus
whiffiagonis, a species that has been the subject of discarding and high grading in recent
years (Laurenson and Macdonald, 2008). Individuals deemed to be too small, although
often considerably larger than the minimum landing size, can often be discarded (L.
Tait, pers. comm.). The selectivity criteria for categorizing a megrim as a small discard
is highly subjective and may vary across vessels, depending on a number of factors such
as market prices and available quota (Laurenson and Macdonald, 2008).
Another important factor contributing to the high grading of megrim is it’s
susceptibility to bruising, with damaged individuals less desirable to buyers. This is
primarily as a result of damage to the delicate muscle tissue by abrasion with other
162
‘rough’ species such as anglerfish (Lophius spp.) and grey gurnards (Eutrigla
gurnardus) in the codend. Anecdotal evidence suggests that bruising is also more
prevalent during periods of rough weather as the fishing gear tends to be less stable,
causing abrasion between the codend and the fish (A. Johnson, pers. comm.). This can
contribute to higher discard levels, especially during periods when market prices are
less favourable and TAC is restricted (Laurenson and Macdonald, 2008). The extent to
which bruising occurs in megrim is not evident in any of the other species caught in the
mixed fishery and there is currently no accounting for what proportion of megrim
discards are bruised fish. Indeed, ICES (2012f) reported that there is a general paucity
of megrim discard data in ICES Divisions IVa and VIa.
Given the anecdotal data alluding to the extensive and complex discarding patterns of
this species in the northern North Sea, the aims of this study were:
1. To investigate temporal variation in discarding of megrim in the mixed demersal
fishery in the northern North Sea (ICES Division IVa) from data collected
during observer trips on commercial fishing vessels at the Shetland Isles.
Discard rates were calculated for these vessels and compared over a five year
period from 2008 to 2012. Changes in the composition of megrim discards were
investigated by determining the extent to which the proportion of small and
bruised discards within the total catch varied over the study period.
2. To apply a logistic regression model to the data collected during observer trips
to investigate the effects of the explanatory variables quota, fish length, fish sex
and wind strength on the probability of a fish being classed as a discard from
2008 to 2012. Furthermore, in order to account for the two sub-components of
163
the discarded portion of the catch, additional models were applied to investigate
the effects of explanatory variables on the probability of a fish being classed as a
small or bruised discard.
The relevance of a megrim TAC in the current mixed demersal fishery in the northern
North Sea as well as the consequences of a complete discard ban within the reformed
Common Fisheries Policy (CFP) was also discussed.
6.2 Materials & methods
6.2.1 Recent changes in megrim TAC
The International Council for the Exploration of the Seas (ICES) considers four stocks
of megrim in European waters. In northern Europe three stock units are recognised (L.
whiffiagonis and Lepidorhombus boscii are considered together): one in ICES Divisions
IVa and VIa (northern North Sea and west of Scotland respectively), one in Division
VIb (Rockall) and one in Divisions VIIb-k and VIIIa,b,d,e (ICES, 2011b, c). In southern
Europe Divisions VIIIc and IXa constitute a further stock where L. whiffiagonis are
considered separately to L. boscii. This study was undertaken in Division IVa.
Anecdotal evidence from fishermen working in the mixed demersal fishery in IVa
suggests that megrim have increased in numbers from the late 2000s (Macdonald, P.,
unpublished data). This perception has been verified by an annual fishery-independent
survey, undertaken by Marine Scotland, which has also reported an increase in relative
biomass in recent years (ICES, 2011b). However, in the mid-2000s the megrim TAC in
IVa was reduced following an overall decrease in landings on the Northern Shelf
(Rockall, West of Scotland and northern North Sea). The increase in megrim biomass in
the late 2000s correlated with increased catches and, coupled with the decrease in TAC,
164
resulted in discarding levels as high as 70% of the total catch (Laurenson and
Macdonald, 2008). This is considerably higher than estimates of megrim discards from
neighbouring stocks such as ICES Divisions VIIb-k and VIIIa,b,d, where discarding in
recent years was estimated at 25% of the total catch (ICES, 2011e). In 2008 the megrim
TAC allocation for ICES areas IV and IIa combined was 1,590 tonnes. There has
recently been recognition of the increasing biomass in the northern North Sea and
subsequent annual TAC levels increased to 1,750 tonnes in 2010 and 1,845 tonnes in
2011 (ICES, 2011b). ICES also recommended that the TAC for 2012 should remain the
same as for 2011 (ICES, 2011b).
The Shetland Fish Producers’ Organisation (SFPO) is allocated approximately 10% of
the total UK annual megrim TAC allocation for IVa. Quota allocation and uptake for
vessels in the SFPO are shown in Figure 44. Prior to 2004 the annual quota allocation
was consistently higher than landings. In subsequent years landings increased
considerably while quota allocation remained relatively constant. The catch-quota
mismatch was addressed through the renting of additional quota from other Producer
Organisations. During the period of the current study (2008-2012) quota allocation has
risen year on year, decreasing the mismatch between quota allocation and landings.
6.2.1 Observer sampling
On board sampling was undertaken on eight vessels (6 twin trawl and 2 Scottish seine)
from the demersal fleet based in the Shetland Islands, Scotland and working in the
mixed demersal fishery in ICES Division IVa (Figure 45). Twin trawl and Scottish
seine are the two types of fishing gear predominantly used to catch megrim in this area.
To ensure that sampling was representative of the variation within the fleet, vessels
were randomly selected from a pre-defined list. The main target species for each of the
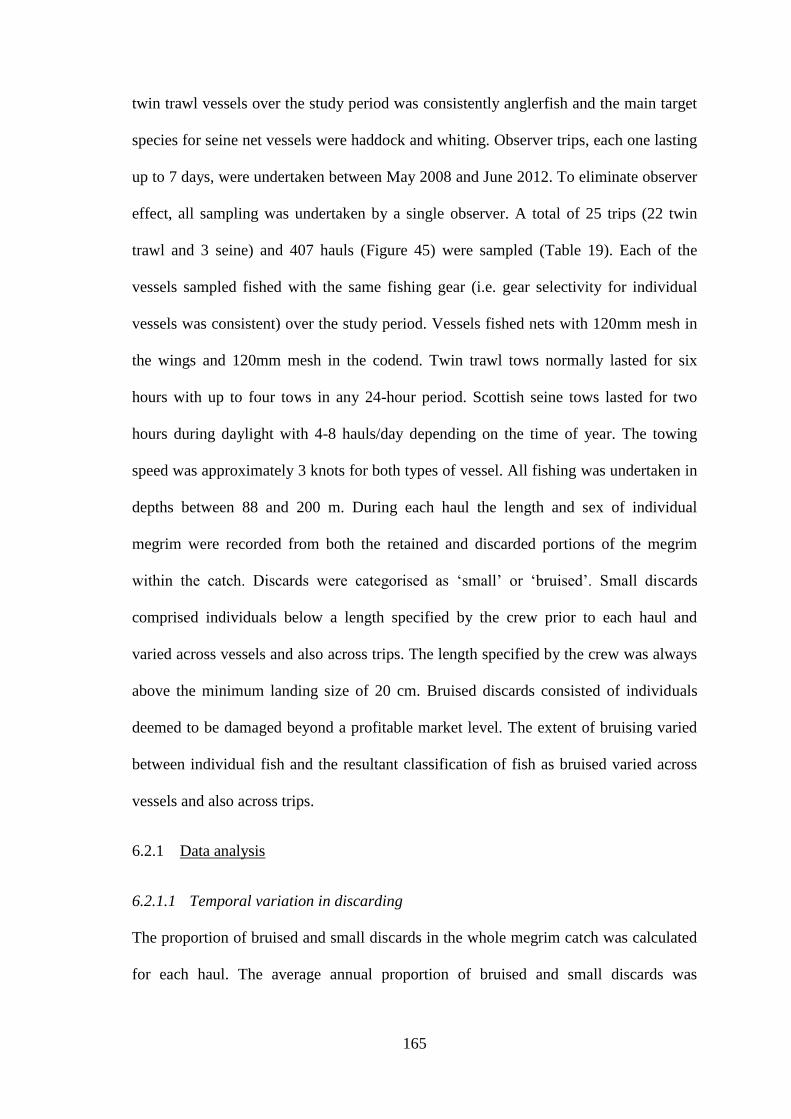
165
twin trawl vessels over the study period was consistently anglerfish and the main target
species for seine net vessels were haddock and whiting. Observer trips, each one lasting
up to 7 days, were undertaken between May 2008 and June 2012. To eliminate observer
effect, all sampling was undertaken by a single observer. A total of 25 trips (22 twin
trawl and 3 seine) and 407 hauls (Figure 45) were sampled (Table 19). Each of the
vessels sampled fished with the same fishing gear (i.e. gear selectivity for individual
vessels was consistent) over the study period. Vessels fished nets with 120mm mesh in
the wings and 120mm mesh in the codend. Twin trawl tows normally lasted for six
hours with up to four tows in any 24-hour period. Scottish seine tows lasted for two
hours during daylight with 4-8 hauls/day depending on the time of year. The towing
speed was approximately 3 knots for both types of vessel. All fishing was undertaken in
depths between 88 and 200 m. During each haul the length and sex of individual
megrim were recorded from both the retained and discarded portions of the megrim
within the catch. Discards were categorised as ‘small’ or ‘bruised’. Small discards
comprised individuals below a length specified by the crew prior to each haul and
varied across vessels and also across trips. The length specified by the crew was always
above the minimum landing size of 20 cm. Bruised discards consisted of individuals
deemed to be damaged beyond a profitable market level. The extent of bruising varied
between individual fish and the resultant classification of fish as bruised varied across
vessels and also across trips.
6.2.1 Data analysis
6.2.1.1 Temporal variation in discarding
The proportion of bruised and small discards in the whole megrim catch was calculated
for each haul. The average annual proportion of bruised and small discards was
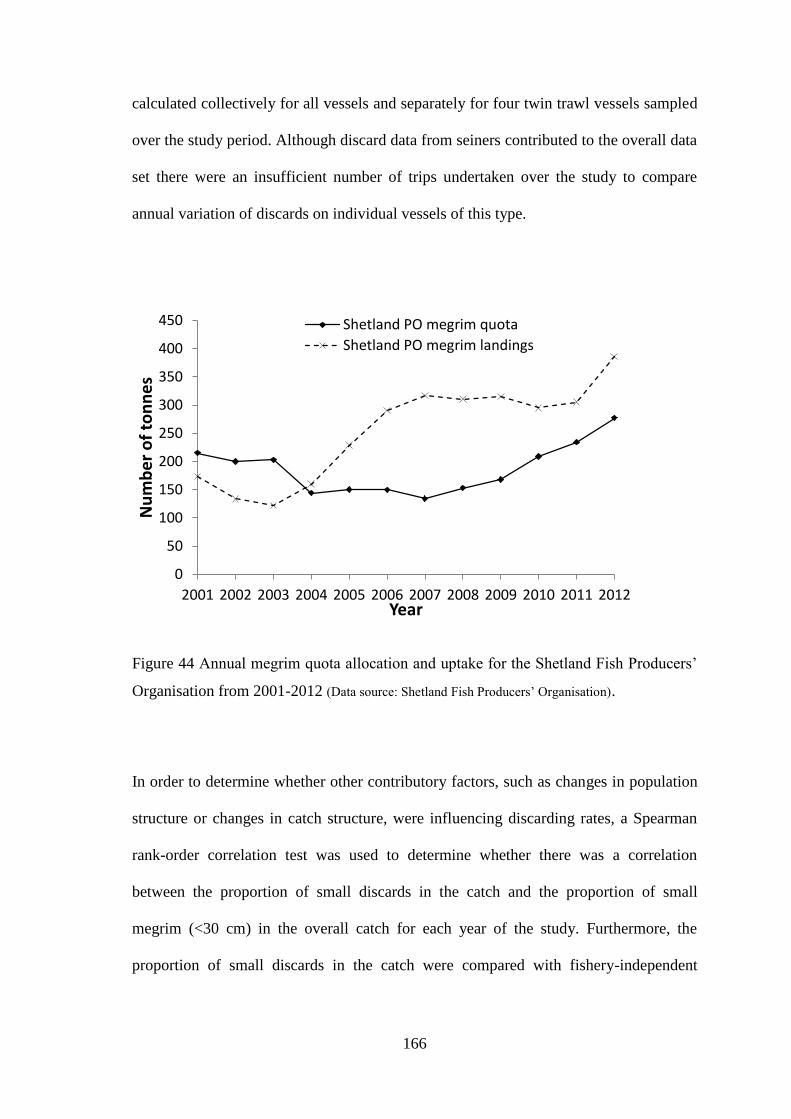
166
calculated collectively for all vessels and separately for four twin trawl vessels sampled
over the study period. Although discard data from seiners contributed to the overall data
set there were an insufficient number of trips undertaken over the study to compare
annual variation of discards on individual vessels of this type.
Figure 44 Annual megrim quota allocation and uptake for the Shetland Fish Producers’
Organisation from 2001-2012 (Data source: Shetland Fish Producers’ Organisation).
In order to determine whether other contributory factors, such as changes in population
structure or changes in catch structure, were influencing discarding rates, a Spearman
rank-order correlation test was used to determine whether there was a correlation
between the proportion of small discards in the catch and the proportion of small
megrim (<30 cm) in the overall catch for each year of the study. Furthermore, the
proportion of small discards in the catch were compared with fishery-independent
0
50
100
150
200
250
300
350
400
450
2001 2002 2003 2004 2005 2006 2007 2008 2009 2010 2011 2012
Nu
mb
er
of
ton
ne
s
Year
Shetland PO megrim quota
Shetland PO megrim landings
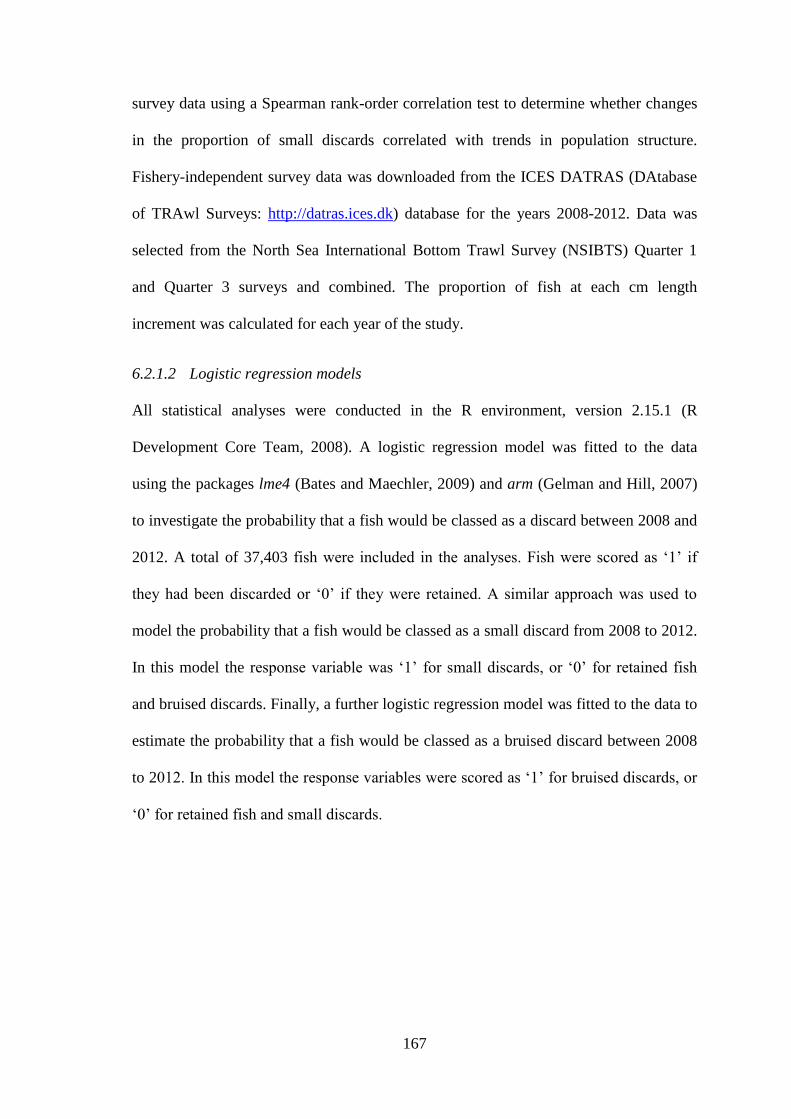
167
survey data using a Spearman rank-order correlation test to determine whether changes
in the proportion of small discards correlated with trends in population structure.
Fishery-independent survey data was downloaded from the ICES DATRAS (DAtabase
of TRAwl Surveys: http://datras.ices.dk) database for the years 2008-2012. Data was
selected from the North Sea International Bottom Trawl Survey (NSIBTS) Quarter 1
and Quarter 3 surveys and combined. The proportion of fish at each cm length
increment was calculated for each year of the study.
6.2.1.2 Logistic regression models
All statistical analyses were conducted in the R environment, version 2.15.1 (R
Development Core Team, 2008). A logistic regression model was fitted to the data
using the packages lme4 (Bates and Maechler, 2009) and arm (Gelman and Hill, 2007)
to investigate the probability that a fish would be classed as a discard between 2008 and
2012. A total of 37,403 fish were included in the analyses. Fish were scored as ‘1’ if
they had been discarded or ‘0’ if they were retained. A similar approach was used to
model the probability that a fish would be classed as a small discard from 2008 to 2012.
In this model the response variable was ‘1’ for small discards, or ‘0’ for retained fish
and bruised discards. Finally, a further logistic regression model was fitted to the data to
estimate the probability that a fish would be classed as a bruised discard between 2008
to 2012. In this model the response variables were scored as ‘1’ for bruised discards, or
‘0’ for retained fish and small discards.
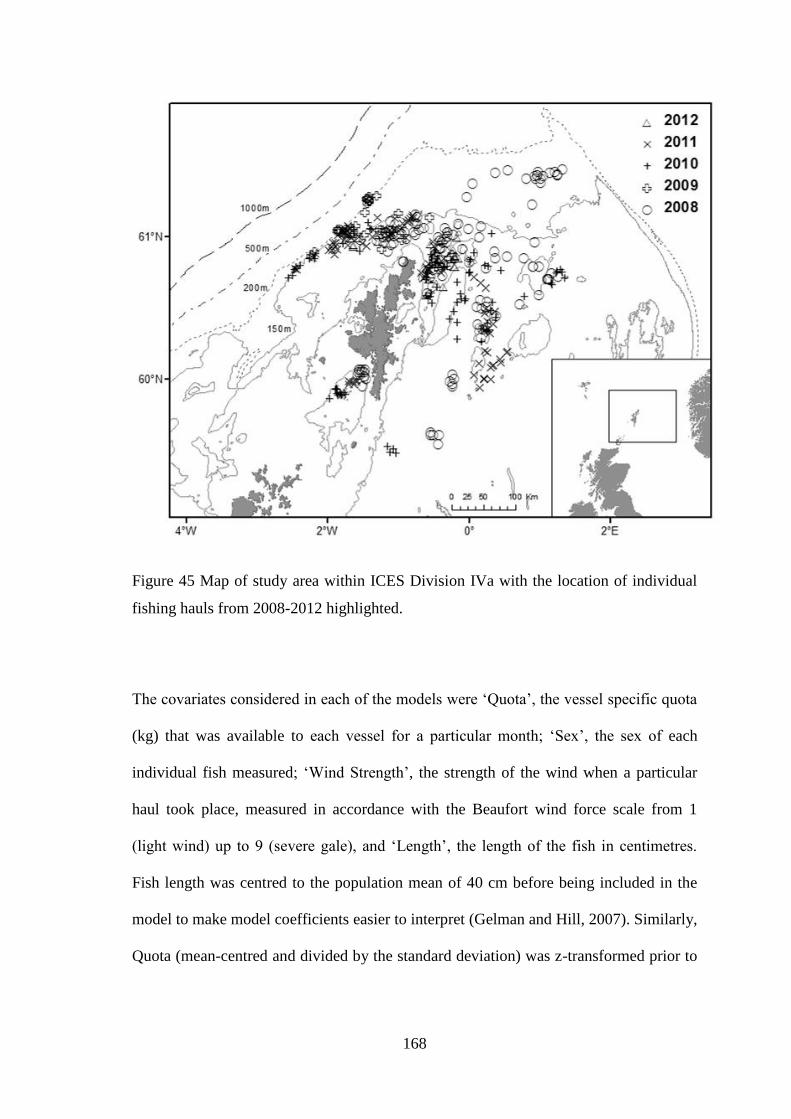
168
Figure 45 Map of study area within ICES Division IVa with the location of individual
fishing hauls from 2008-2012 highlighted.
The covariates considered in each of the models were ‘Quota’, the vessel specific quota
(kg) that was available to each vessel for a particular month; ‘Sex’, the sex of each
individual fish measured; ‘Wind Strength’, the strength of the wind when a particular
haul took place, measured in accordance with the Beaufort wind force scale from 1
(light wind) up to 9 (severe gale), and ‘Length’, the length of the fish in centimetres.
Fish length was centred to the population mean of 40 cm before being included in the
model to make model coefficients easier to interpret (Gelman and Hill, 2007). Similarly,
Quota (mean-centred and divided by the standard deviation) was z-transformed prior to
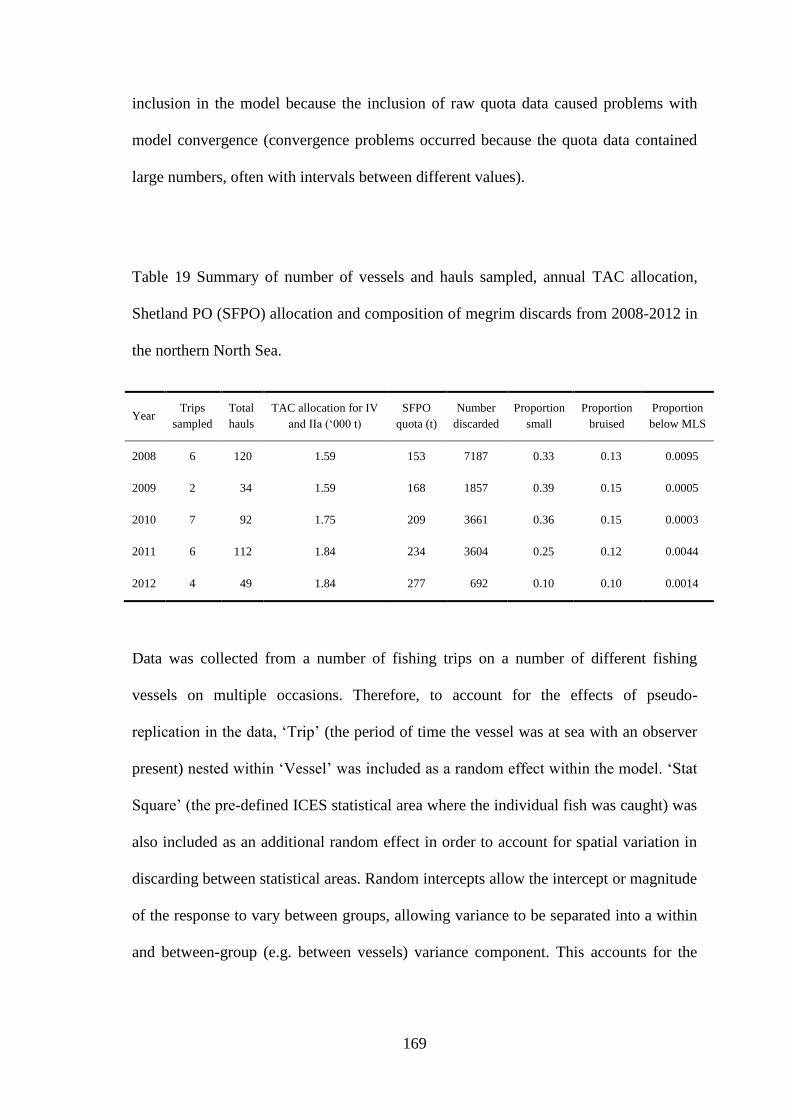
169
inclusion in the model because the inclusion of raw quota data caused problems with
model convergence (convergence problems occurred because the quota data contained
large numbers, often with intervals between different values).
Table 19 Summary of number of vessels and hauls sampled, annual TAC allocation,
Shetland PO (SFPO) allocation and composition of megrim discards from 2008-2012 in
the northern North Sea.
Year Trips
sampled
Total
hauls
TAC allocation for IV
and IIa (‘000 t)
SFPO
quota (t)
Number
discarded
Proportion
small
Proportion
bruised
Proportion
below MLS
2008 6 120 1.59 153 7187 0.33 0.13 0.0095
2009 2 34 1.59 168 1857 0.39 0.15 0.0005
2010 7 92 1.75 209 3661 0.36 0.15 0.0003
2011 6 112 1.84 234 3604 0.25 0.12 0.0044
2012 4 49 1.84 277 692 0.10 0.10 0.0014
Data was collected from a number of fishing trips on a number of different fishing
vessels on multiple occasions. Therefore, to account for the effects of pseudo-
replication in the data, ‘Trip’ (the period of time the vessel was at sea with an observer
present) nested within ‘Vessel’ was included as a random effect within the model. ‘Stat
Square’ (the pre-defined ICES statistical area where the individual fish was caught) was
also included as an additional random effect in order to account for spatial variation in
discarding between statistical areas. Random intercepts allow the intercept or magnitude
of the response to vary between groups, allowing variance to be separated into a within
and between-group (e.g. between vessels) variance component. This accounts for the
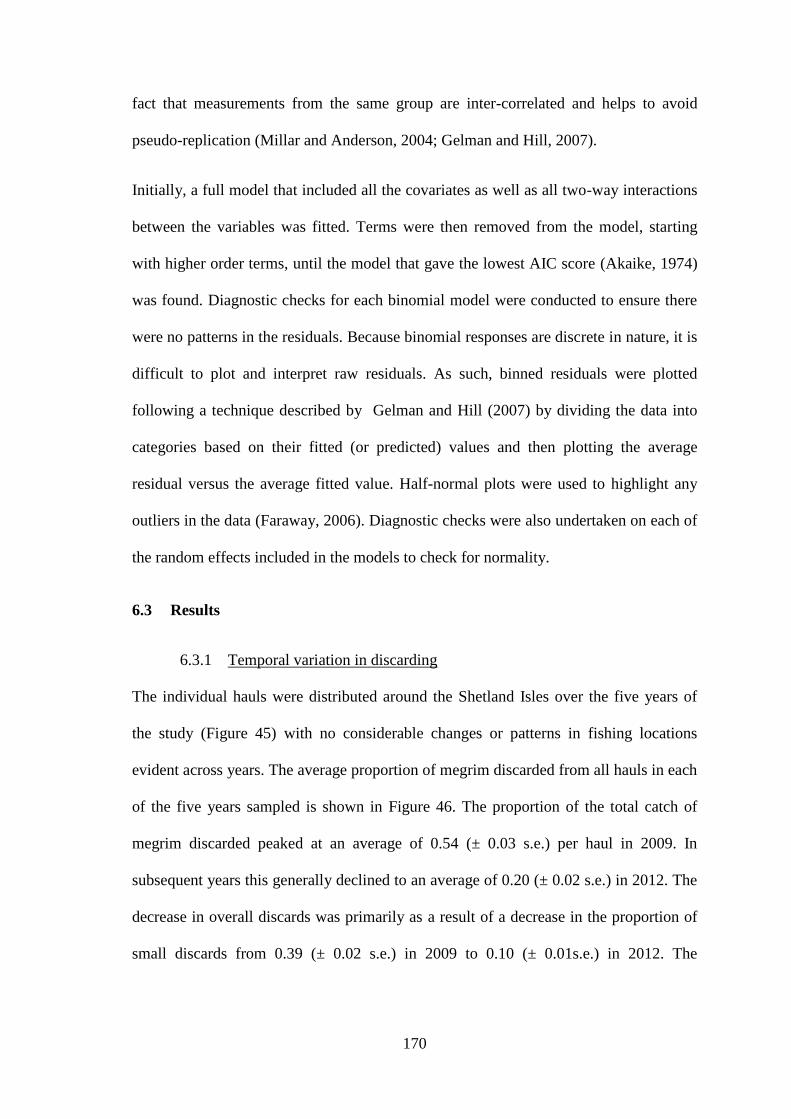
170
fact that measurements from the same group are inter-correlated and helps to avoid
pseudo-replication (Millar and Anderson, 2004; Gelman and Hill, 2007).
Initially, a full model that included all the covariates as well as all two-way interactions
between the variables was fitted. Terms were then removed from the model, starting
with higher order terms, until the model that gave the lowest AIC score (Akaike, 1974)
was found. Diagnostic checks for each binomial model were conducted to ensure there
were no patterns in the residuals. Because binomial responses are discrete in nature, it is
difficult to plot and interpret raw residuals. As such, binned residuals were plotted
following a technique described by Gelman and Hill (2007) by dividing the data into
categories based on their fitted (or predicted) values and then plotting the average
residual versus the average fitted value. Half-normal plots were used to highlight any
outliers in the data (Faraway, 2006). Diagnostic checks were also undertaken on each of
the random effects included in the models to check for normality.
6.3 Results
6.3.1 Temporal variation in discarding
The individual hauls were distributed around the Shetland Isles over the five years of
the study (Figure 45) with no considerable changes or patterns in fishing locations
evident across years. The average proportion of megrim discarded from all hauls in each
of the five years sampled is shown in Figure 46. The proportion of the total catch of
megrim discarded peaked at an average of 0.54 (± 0.03 s.e.) per haul in 2009. In
subsequent years this generally declined to an average of 0.20 (± 0.02 s.e.) in 2012. The
decrease in overall discards was primarily as a result of a decrease in the proportion of
small discards from 0.39 (± 0.02 s.e.) in 2009 to 0.10 (± 0.01s.e.) in 2012. The
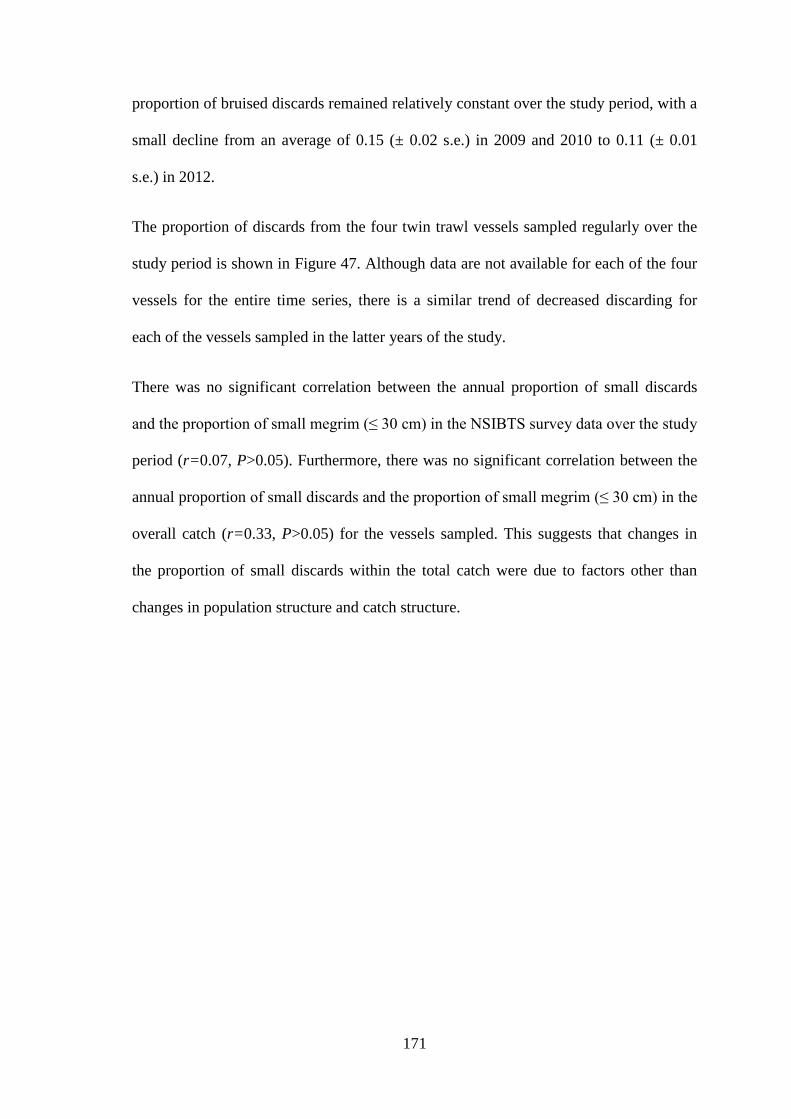
171
proportion of bruised discards remained relatively constant over the study period, with a
small decline from an average of 0.15 (± 0.02 s.e.) in 2009 and 2010 to 0.11 (± 0.01
s.e.) in 2012.
The proportion of discards from the four twin trawl vessels sampled regularly over the
study period is shown in Figure 47. Although data are not available for each of the four
vessels for the entire time series, there is a similar trend of decreased discarding for
each of the vessels sampled in the latter years of the study.
There was no significant correlation between the annual proportion of small discards
and the proportion of small megrim (≤ 30 cm) in the NSIBTS survey data over the study
period (r=0.07, P>0.05). Furthermore, there was no significant correlation between the
annual proportion of small discards and the proportion of small megrim (≤ 30 cm) in the
overall catch (r=0.33, P>0.05) for the vessels sampled. This suggests that changes in
the proportion of small discards within the total catch were due to factors other than
changes in population structure and catch structure.
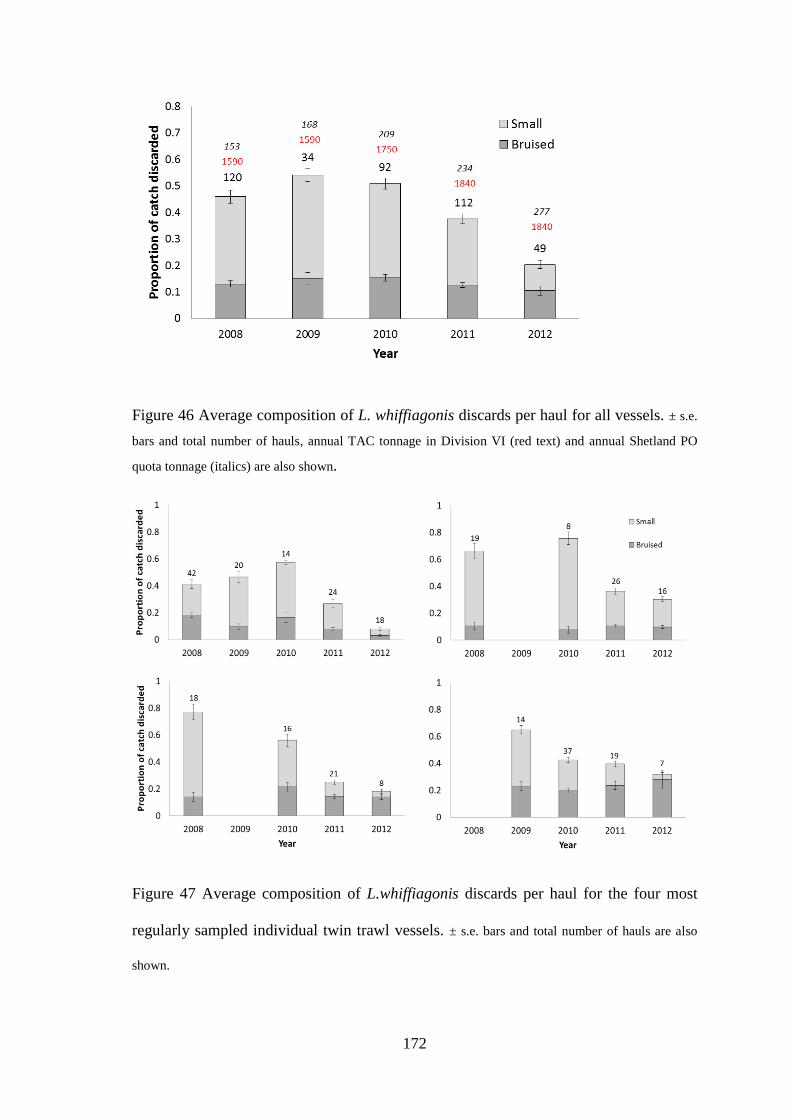
172
Figure 46 Average composition of L. whiffiagonis discards per haul for all vessels. ± s.e.
bars and total number of hauls, annual TAC tonnage in Division VI (red text) and annual Shetland PO
quota tonnage (italics) are also shown.
Figure 47 Average composition of L.whiffiagonis discards per haul for the four most
regularly sampled individual twin trawl vessels. ± s.e. bars and total number of hauls are also
shown.
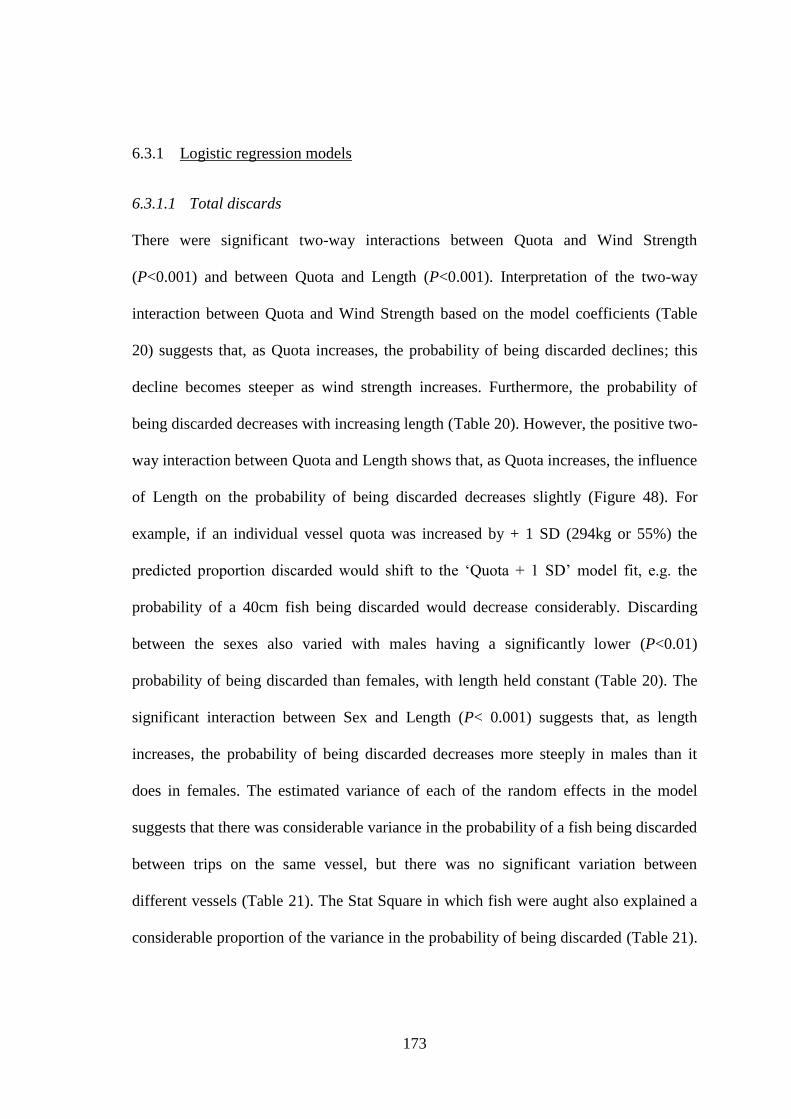
173
6.3.1 Logistic regression models
6.3.1.1 Total discards
There were significant two-way interactions between Quota and Wind Strength
(P<0.001) and between Quota and Length (P<0.001). Interpretation of the two-way
interaction between Quota and Wind Strength based on the model coefficients (Table
20) suggests that, as Quota increases, the probability of being discarded declines; this
decline becomes steeper as wind strength increases. Furthermore, the probability of
being discarded decreases with increasing length (Table 20). However, the positive two-
way interaction between Quota and Length shows that, as Quota increases, the influence
of Length on the probability of being discarded decreases slightly (Figure 48). For
example, if an individual vessel quota was increased by + 1 SD (294kg or 55%) the
predicted proportion discarded would shift to the ‘Quota + 1 SD’ model fit, e.g. the
probability of a 40cm fish being discarded would decrease considerably. Discarding
between the sexes also varied with males having a significantly lower (P<0.01)
probability of being discarded than females, with length held constant (Table 20). The
significant interaction between Sex and Length (P< 0.001) suggests that, as length
increases, the probability of being discarded decreases more steeply in males than it
does in females. The estimated variance of each of the random effects in the model
suggests that there was considerable variance in the probability of a fish being discarded
between trips on the same vessel, but there was no significant variation between
different vessels (Table 21). The Stat Square in which fish were aught also explained a
considerable proportion of the variance in the probability of being discarded (Table 21).
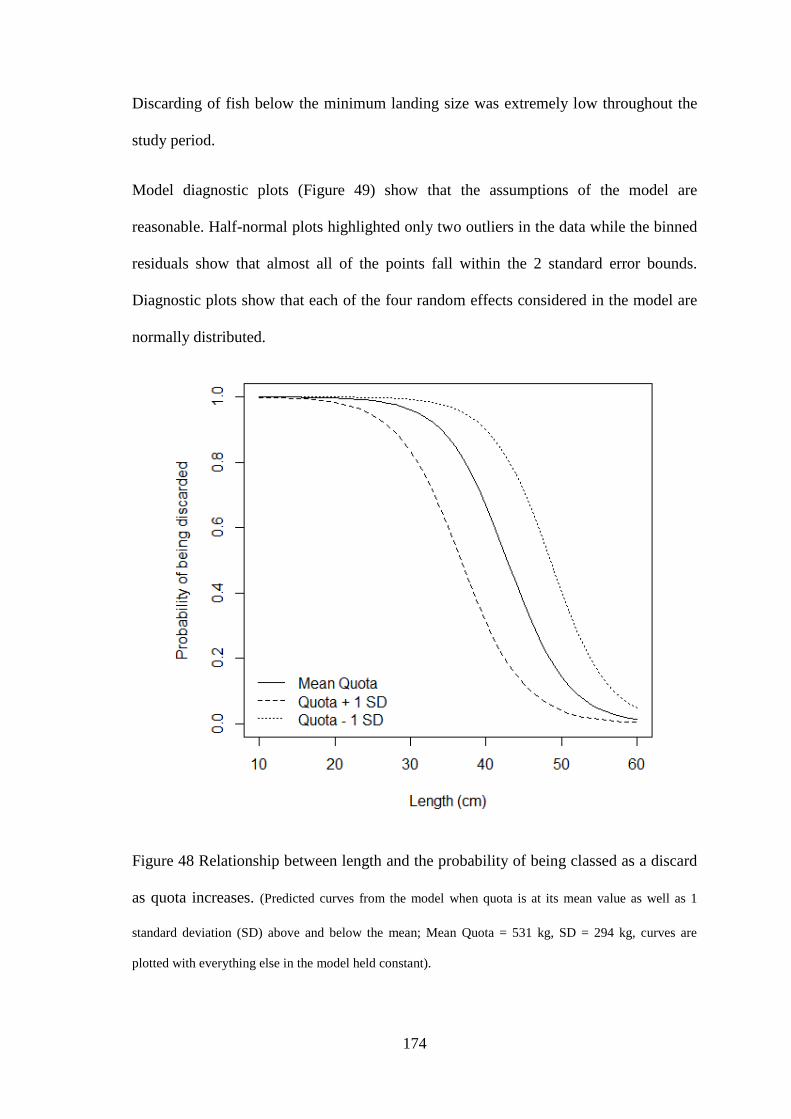
174
Discarding of fish below the minimum landing size was extremely low throughout the
study period.
Model diagnostic plots (Figure 49) show that the assumptions of the model are
reasonable. Half-normal plots highlighted only two outliers in the data while the binned
residuals show that almost all of the points fall within the 2 standard error bounds.
Diagnostic plots show that each of the four random effects considered in the model are
normally distributed.
Figure 48 Relationship between length and the probability of being classed as a discard
as quota increases. (Predicted curves from the model when quota is at its mean value as well as 1
standard deviation (SD) above and below the mean; Mean Quota = 531 kg, SD = 294 kg, curves are
plotted with everything else in the model held constant).
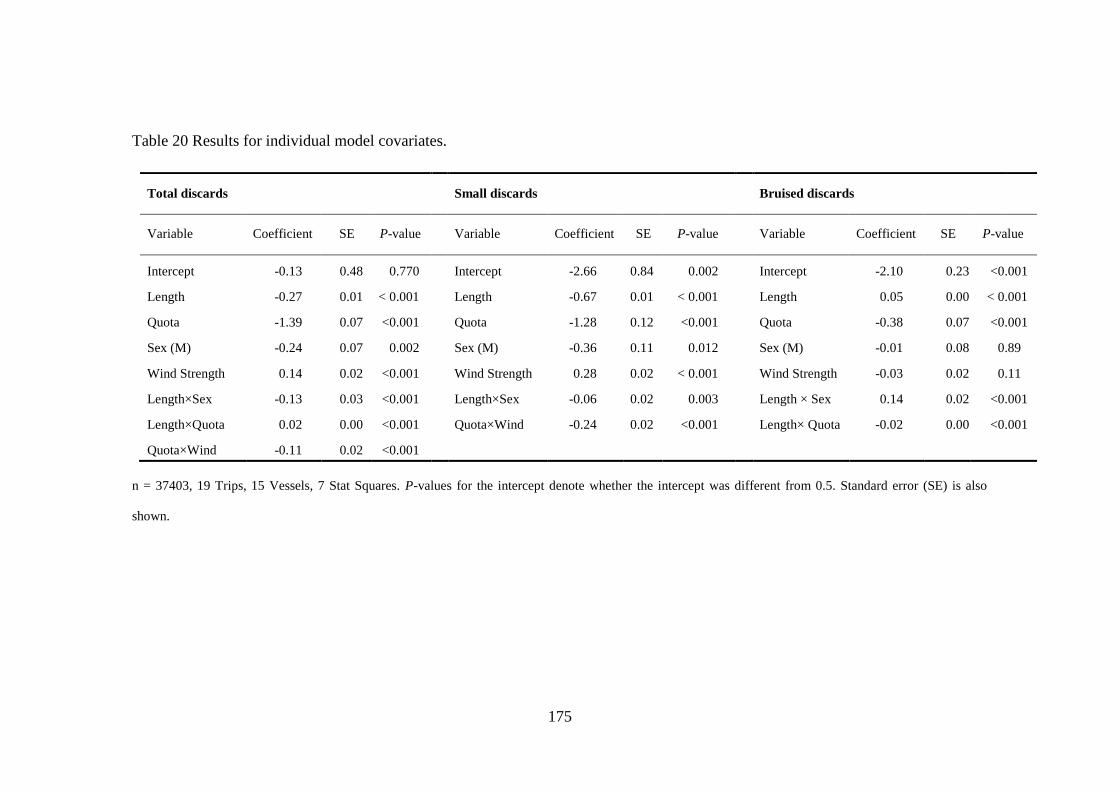
175
Table 20 Results for individual model covariates.
Total discards Small discards Bruised discards
Variable Coefficient SE P-value Variable Coefficient SE P-value Variable Coefficient SE P-value
Intercept -0.13 0.48 0.770 Intercept -2.66 0.84 0.002 Intercept -2.10 0.23 <0.001
Length -0.27 0.01 < 0.001 Length -0.67 0.01 < 0.001 Length 0.05 0.00 < 0.001
Quota -1.39 0.07 <0.001 Quota -1.28 0.12 <0.001 Quota -0.38 0.07 <0.001
Sex (M) -0.24 0.07 0.002 Sex (M) -0.36 0.11 0.012 Sex (M) -0.01 0.08 0.89
Wind Strength 0.14 0.02 <0.001 Wind Strength 0.28 0.02 < 0.001 Wind Strength -0.03 0.02 0.11
Length×Sex -0.13 0.03 <0.001 Length×Sex -0.06 0.02 0.003 Length × Sex 0.14 0.02 <0.001
Length×Quota 0.02 0.00 <0.001 Quota×Wind -0.24 0.02 <0.001 Length× Quota -0.02 0.00 <0.001
Quota×Wind -0.11 0.02 <0.001
n = 37403, 19 Trips, 15 Vessels, 7 Stat Squares. P-values for the intercept denote whether the intercept was different from 0.5. Standard error (SE) is also
shown.
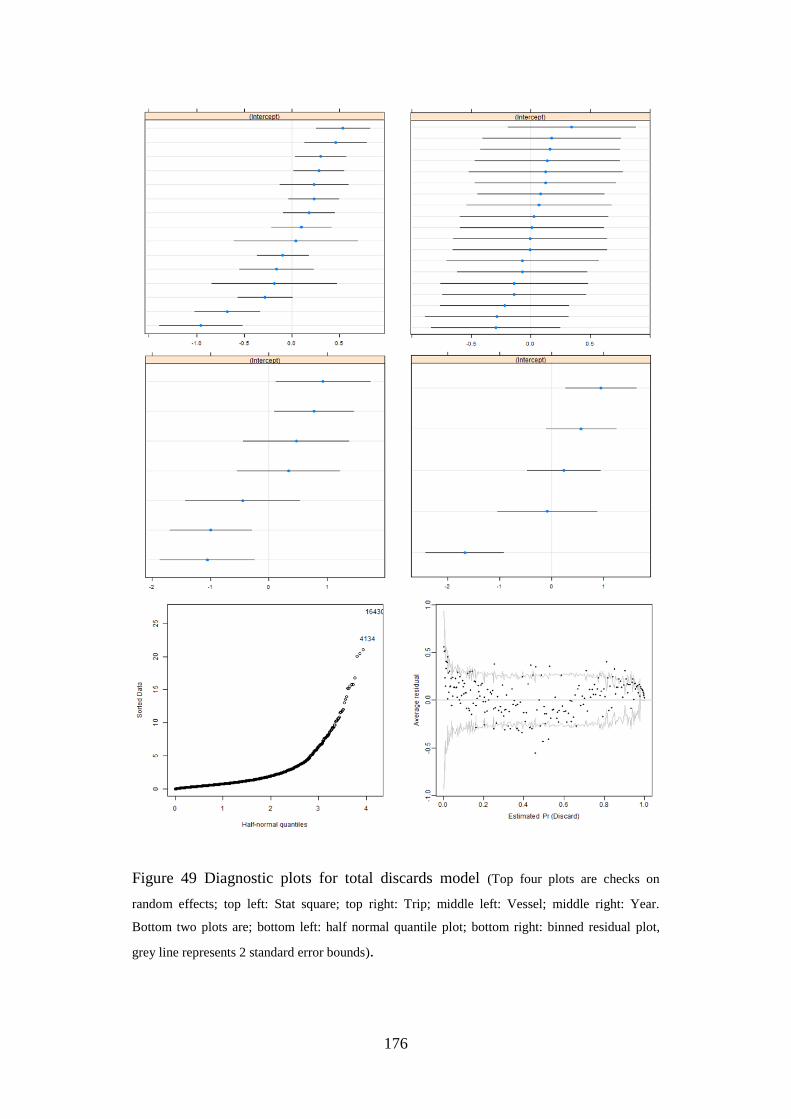
176
Figure 49 Diagnostic plots for total discards model (Top four plots are checks on
random effects; top left: Stat square; top right: Trip; middle left: Vessel; middle right: Year.
Bottom two plots are; bottom left: half normal quantile plot; bottom right: binned residual plot,
grey line represents 2 standard error bounds).
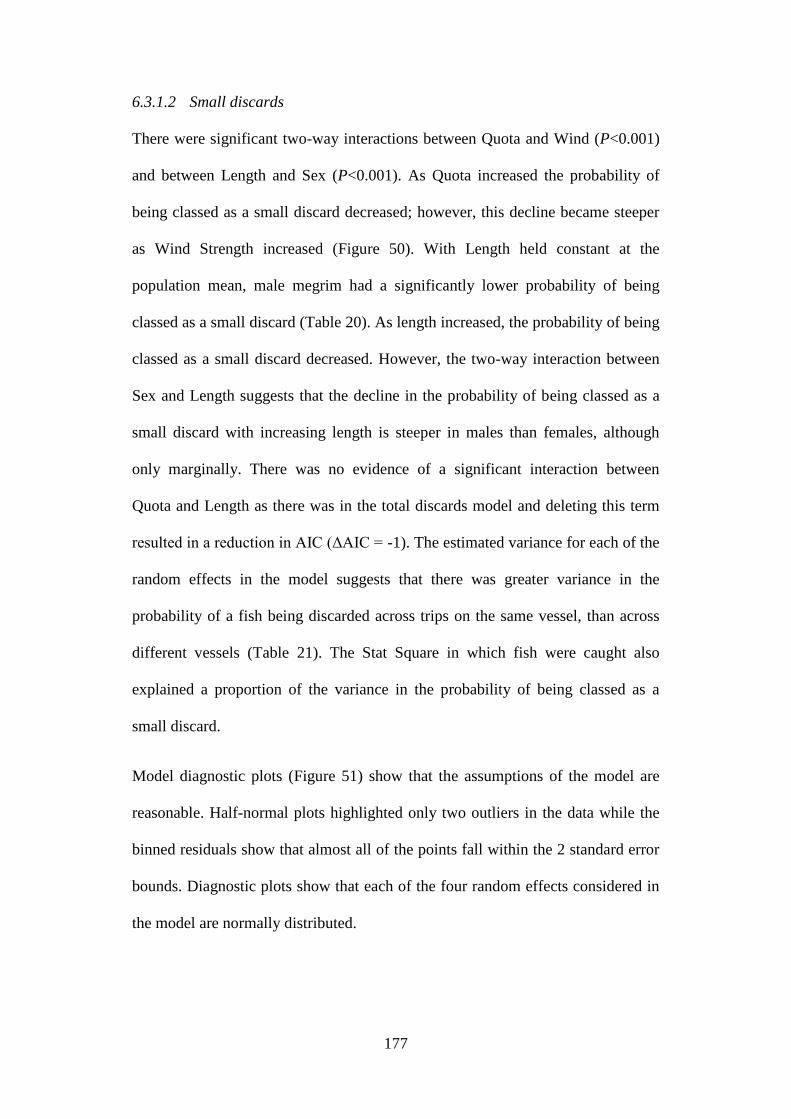
177
6.3.1.2 Small discards
There were significant two-way interactions between Quota and Wind (P<0.001)
and between Length and Sex (P<0.001). As Quota increased the probability of
being classed as a small discard decreased; however, this decline became steeper
as Wind Strength increased (Figure 50). With Length held constant at the
population mean, male megrim had a significantly lower probability of being
classed as a small discard (Table 20). As length increased, the probability of being
classed as a small discard decreased. However, the two-way interaction between
Sex and Length suggests that the decline in the probability of being classed as a
small discard with increasing length is steeper in males than females, although
only marginally. There was no evidence of a significant interaction between
Quota and Length as there was in the total discards model and deleting this term
resulted in a reduction in AIC (ΔAIC = -1). The estimated variance for each of the
random effects in the model suggests that there was greater variance in the
probability of a fish being discarded across trips on the same vessel, than across
different vessels (Table 21). The Stat Square in which fish were caught also
explained a proportion of the variance in the probability of being classed as a
small discard.
Model diagnostic plots (Figure 51) show that the assumptions of the model are
reasonable. Half-normal plots highlighted only two outliers in the data while the
binned residuals show that almost all of the points fall within the 2 standard error
bounds. Diagnostic plots show that each of the four random effects considered in
the model are normally distributed.
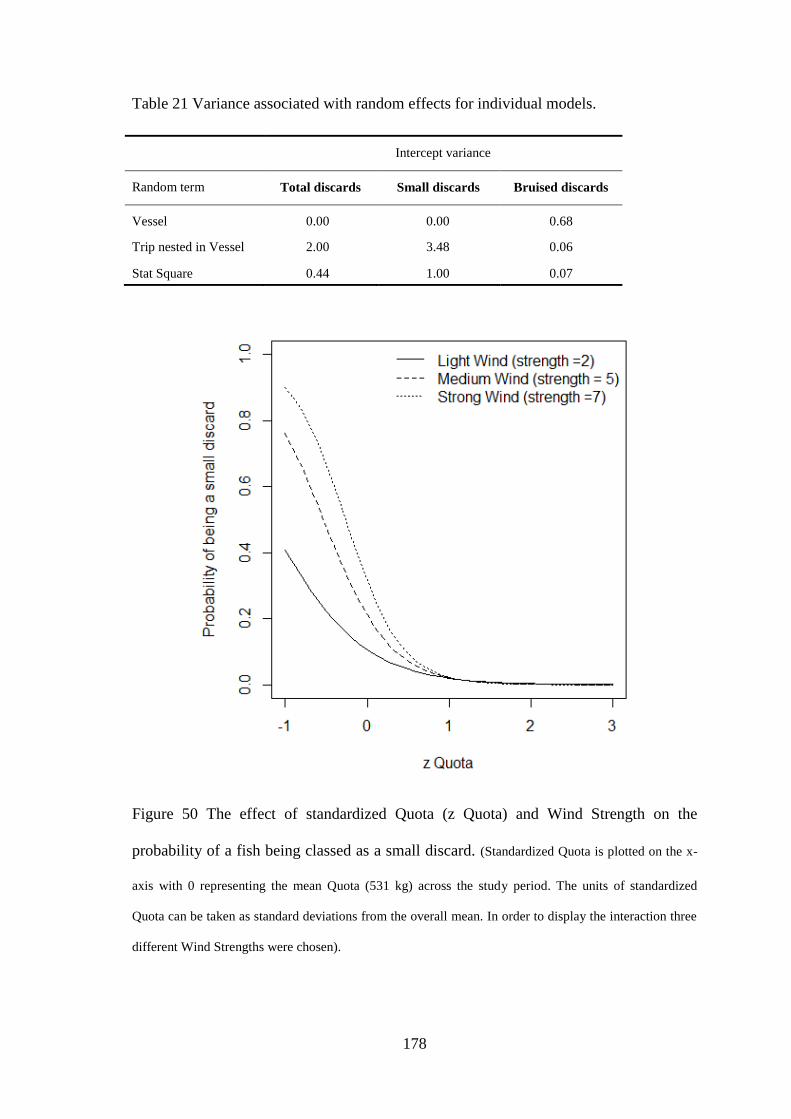
178
Table 21 Variance associated with random effects for individual models.
Intercept variance
Random term Total discards Small discards Bruised discards
Vessel 0.00 0.00 0.68
Trip nested in Vessel 2.00 3.48 0.06
Stat Square 0.44 1.00 0.07
Figure 50 The effect of standardized Quota (z Quota) and Wind Strength on the
probability of a fish being classed as a small discard. (Standardized Quota is plotted on the x-
axis with 0 representing the mean Quota (531 kg) across the study period. The units of standardized
Quota can be taken as standard deviations from the overall mean. In order to display the interaction three
different Wind Strengths were chosen).
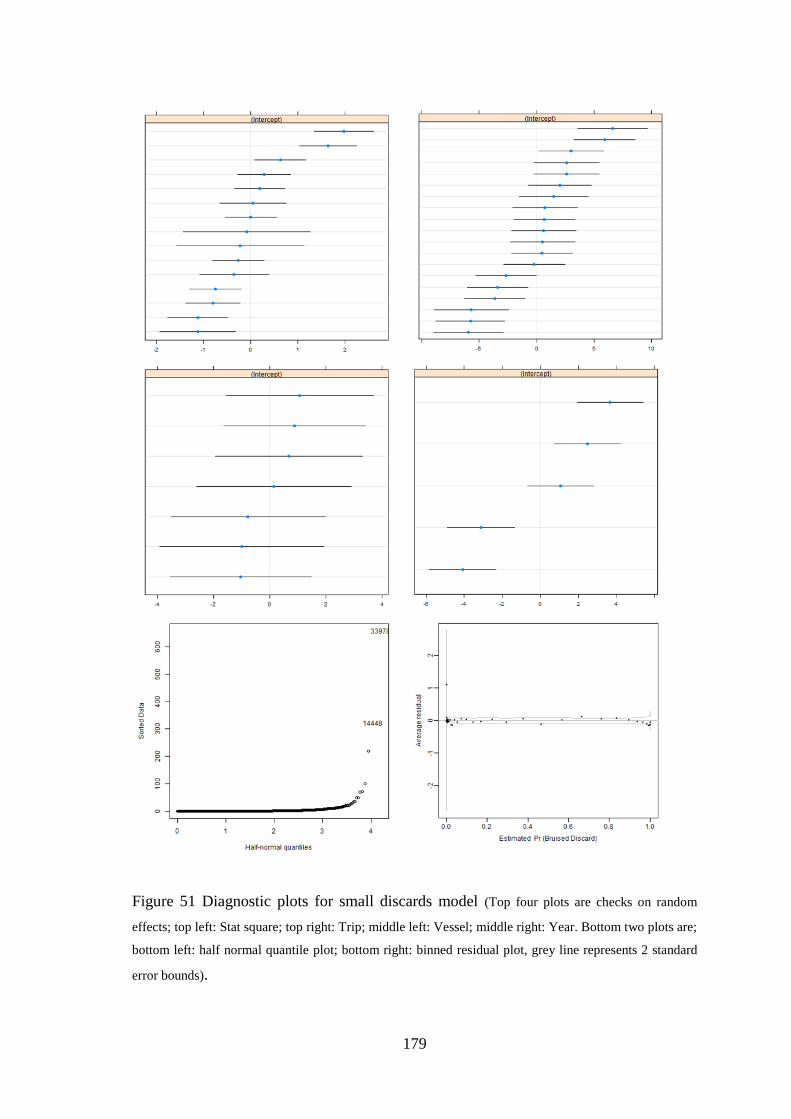
179
Figure 51 Diagnostic plots for small discards model (Top four plots are checks on random
effects; top left: Stat square; top right: Trip; middle left: Vessel; middle right: Year. Bottom two plots are;
bottom left: half normal quantile plot; bottom right: binned residual plot, grey line represents 2 standard
error bounds).
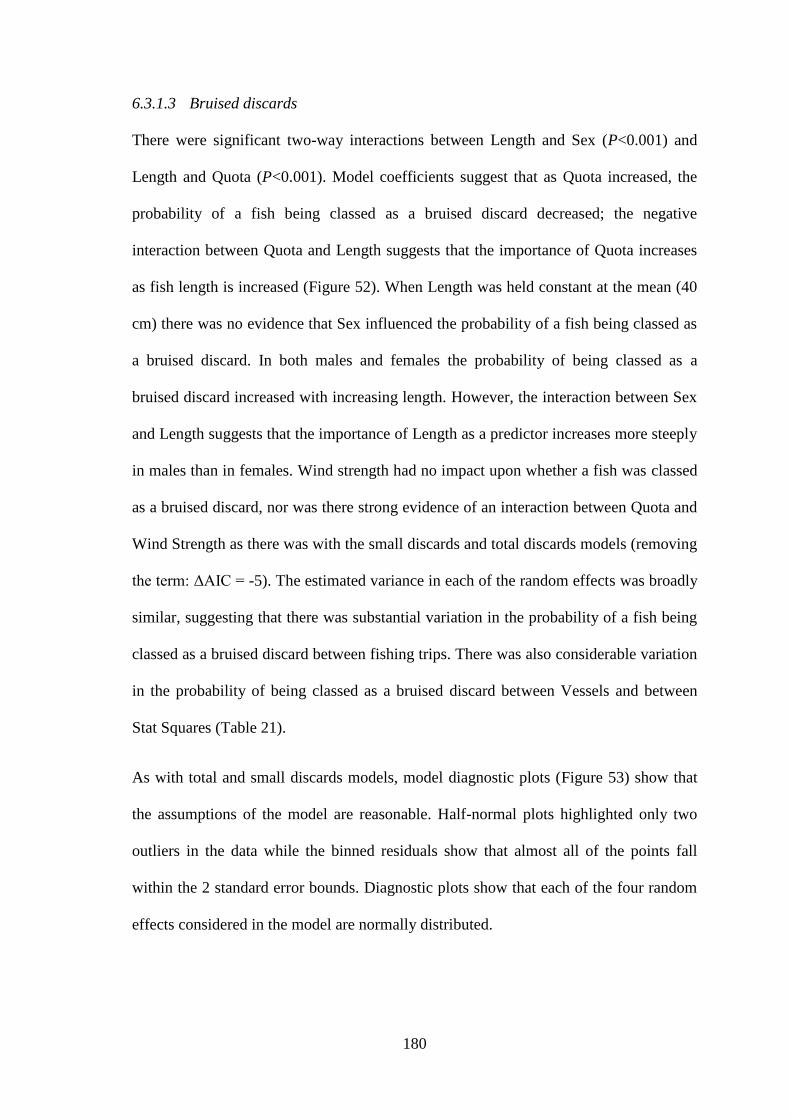
180
6.3.1.3 Bruised discards
There were significant two-way interactions between Length and Sex (P<0.001) and
Length and Quota (P<0.001). Model coefficients suggest that as Quota increased, the
probability of a fish being classed as a bruised discard decreased; the negative
interaction between Quota and Length suggests that the importance of Quota increases
as fish length is increased (Figure 52). When Length was held constant at the mean (40
cm) there was no evidence that Sex influenced the probability of a fish being classed as
a bruised discard. In both males and females the probability of being classed as a
bruised discard increased with increasing length. However, the interaction between Sex
and Length suggests that the importance of Length as a predictor increases more steeply
in males than in females. Wind strength had no impact upon whether a fish was classed
as a bruised discard, nor was there strong evidence of an interaction between Quota and
Wind Strength as there was with the small discards and total discards models (removing
the term: ΔAIC = -5). The estimated variance in each of the random effects was broadly
similar, suggesting that there was substantial variation in the probability of a fish being
classed as a bruised discard between fishing trips. There was also considerable variation
in the probability of being classed as a bruised discard between Vessels and between
Stat Squares (Table 21).
As with total and small discards models, model diagnostic plots (Figure 53) show that
the assumptions of the model are reasonable. Half-normal plots highlighted only two
outliers in the data while the binned residuals show that almost all of the points fall
within the 2 standard error bounds. Diagnostic plots show that each of the four random
effects considered in the model are normally distributed.
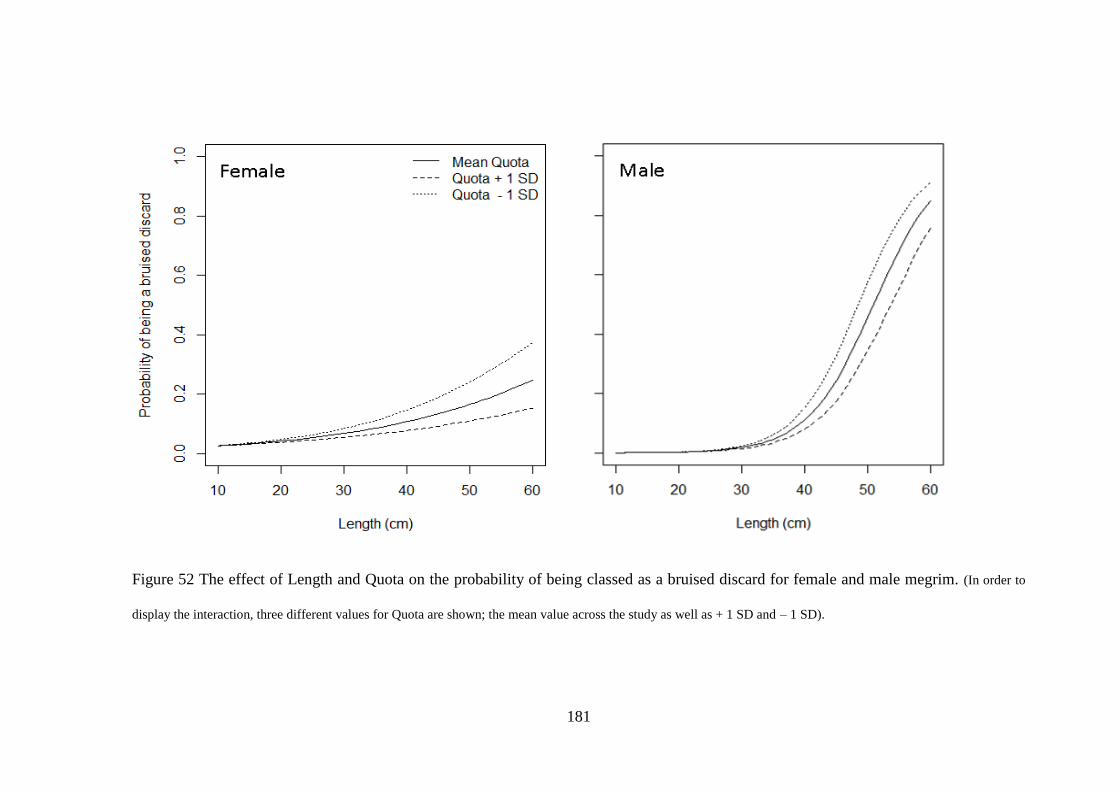
181
Figure 52 The effect of Length and Quota on the probability of being classed as a bruised discard for female and male megrim. (In order to
display the interaction, three different values for Quota are shown; the mean value across the study as well as + 1 SD and – 1 SD).
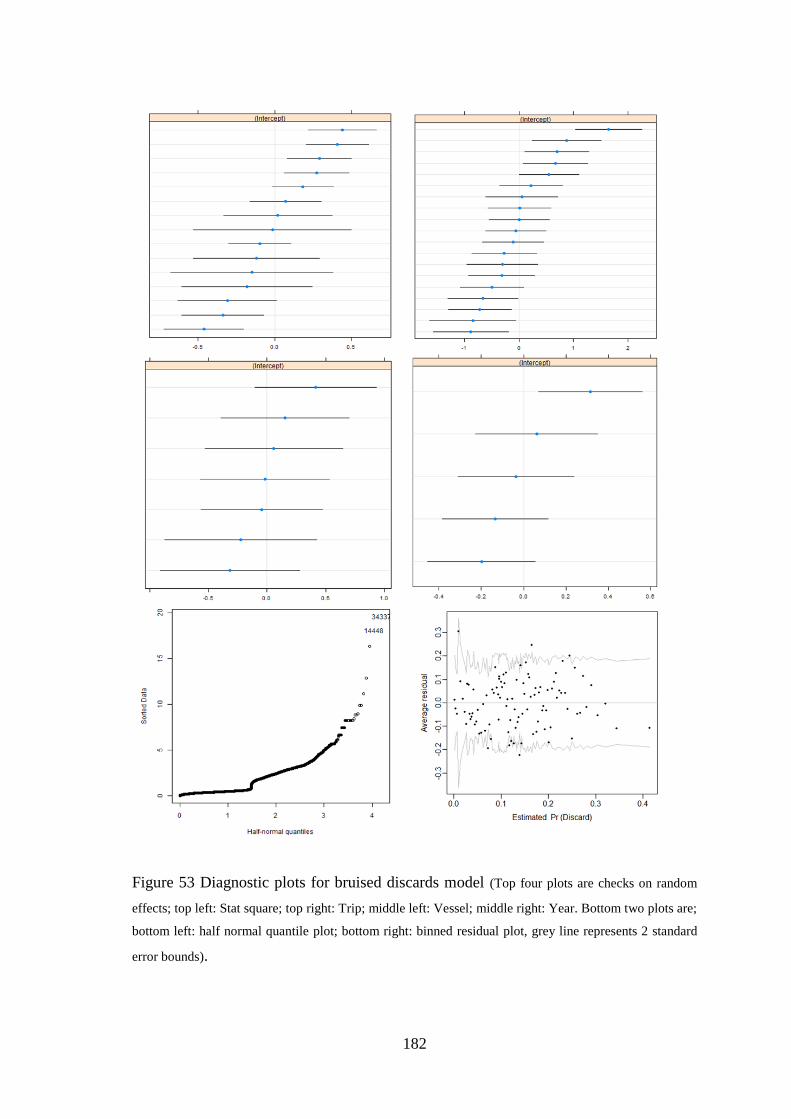
182
Figure 53 Diagnostic plots for bruised discards model (Top four plots are checks on random
effects; top left: Stat square; top right: Trip; middle left: Vessel; middle right: Year. Bottom two plots are;
bottom left: half normal quantile plot; bottom right: binned residual plot, grey line represents 2 standard
error bounds).
183
6.4 Discussion
The results of this study demonstrate that, from 2008 to 2012, increases in vessel
specific quota have resulted in a significant decrease in discarding of megrim for the
vessels sampled here. There have also been significant changes in discarding patterns,
notably a decrease in the average size discarded. The added complexity in megrim
discarding due to the presence and magnitude of bruised individuals in the catch is also
evident. Furthermore, high grading of megrim has been prevalent over the study period,
despite the introduction of the high grading ban in 2009 (Anon, 2009a). This suggests
that, for the vessels sampled here, the ban has been disregarded to a great extent.
However, it is important to note that the results of this study are indicative of the
situation within the Shetland PO and do not necessarily apply to the entire Scottish fleet.
Fernandes et al. (2011) noted that discarding generally falls into two categories:
regulatory (fish below the minimum landing size and discarding due to quota or other
management restrictions) and discretionary (i.e. unregulated species with no minimum
landing size or quota where catch selection behaviour such as high-grading is intended
to maximise profits). The extent to which the two categories affect discard rates varies
between fisheries, species and areas. In the case of North Sea megrim, discarding
appears to be primarily driven by regulatory restrictions.
The decrease in discarding of small megrim evident here corresponds with recent
increases in TAC and suggests that the extent to which discarding of small megrim
greater than the minimum landing size is undertaken is largely regulatory i.e. driven by
the available TAC. However, despite the decrease in the minimum retained size in
recent years, there is still a substantial proportion of the catch greater than the minimum
landing size discarded. Catchpole et al. (2005) noted that, while quotas are a driver of
184
discards in the North Sea, other factors, in combination, contribute more to the total
quantity of discards. It has also been suggested that there is evidence that many
fishermen land all the marketable fish they catch and that discards are mostly juvenile
fish, although this is probably species-dependent. The results of this study indicate that,
in the case of North Sea megrim, discards are predominantly above the minimum
landing size. Indeed, catches of undersized megrim were almost negligible throughout
the study, indicating that the majority of fish below minimum landing size are not being
retained in the gear. Further, given the fact that discarding is still at an average of 20%
by number of the total catch in 2012, high-grading is still an issue despite the recent
increases in TAC. This suggests that the current levels of TAC are still restrictive and/or
there is limited market demand for smaller individuals.
The probability of a fish being classed as a bruised discard decreased significantly with
increasing quota, albeit to a lesser extent than small discards. This implies that factors
other than available TAC may influence the decision to discard these individuals. It may
be expected that an increase in TAC would provide more opportunity to land fish that
would otherwise be deemed to be of lesser commercial value, such as bruised
individuals. However, retention of bruised fish can become problematic irrespective of
TAC restraints as the relative returns can be uneconomical. Market prices achieved for
bruised megrim can often be less than 50% of the price of the smallest grade of
undamaged fish, irrespective of the size of the bruised fish (Shetland Seafood Auction,
pers. comm.). This suggests that within TAC restraints landing smaller individuals will
be of more economic value than landing bruised fish, corresponding with the results of
this study. This also creates a potential dilemma, given the current drive to ban
discarding, of low value, inferior fish being landed and using up what may be perceived
185
as a limited TAC. In the past, discarding of bruised megrim has been as high as 30% of
the total catch of megrim from a trip (Laurenson and Macdonald, 2008) and, as such, a
discard ban may have the potential to significantly reduce the overall value of the
species to fishermen.
A number of studies have highlighted the significance of market prices as a driver in
discarding (Clucas, 1996; Depestele et al., 2011). As megrim prices typically increase
threefold between the smallest and largest grades (Shetland Seafood Auctions, pers.
comm.), market prices may also influence the minimum size at which megrim will be
retained. This may have been what was driving high-grading in the beginning of the
study when quota was limited. It is also important to note that market prices for megrim
can fluctuate significantly, with prices for the largest grades during stagnant price
periods decreasing to similar prices received for the smallest grades during periods of
increased prices. Unfortunately, the frequency of sampling undertaken for this study
was not sufficient to carry out an extensive intra-annual study of discarding patterns and
additional work is required in order to investigate this further.
A further notable finding of the study was the interaction of wind strength and quota on
the discarding of small megrim. An increase in the probability of small megrim being
discarded with increasing wind strength suggests that selection practises are influenced
by weather. This may be a result of the crew selecting and processing less of the lower
value small individuals during less favourable conditions. Model outputs suggest that
this is further exacerbated as quota becomes more restricted. Conversely, similar
patterns of increased bruised discards in the catch during higher wind strengths were not
evident, despite the anecdotal evidence to the contrary. This may suggest that factors
other than wind strength have an effect on bruising. As such, further work is required to
186
investigate the possible interaction between the proportion of bruised discards in the
catch and other variables such as catch volume and composition.
Given the considerable proportion of bruised megrim discarded from the total catch (11-
15%), it may be beneficial for fishermen to investigate potential methodologies for
reducing flesh damage during fishing operations. One obvious approach would be to
reduce the duration of standard tows, thus decreasing the time the fish are in the codend.
This would also reduce the quantity of fish in the codend, ensuring that delicate species
such as megrim are impacted less by ‘rough’ species. However, the current duration of
tows is possibly adapted to the optimum for the main target species, anglerfish, which is
a relatively robust fish and is not subject to the same levels of damage in the codend.
Furthermore, a reduction in tow duration would result in more of the fishermen’s time,
within a limited effort system, spent hauling and shooting the gear. Given the financial
implications of this, it may be that fishermen are opting to accept the loss of bruised fish
in a species such as megrim in order to maximise their returns for the principal species,
in this case anglerfish. This is a further example of the inherent complexities associated
with mixed-species demersal fisheries.
It is unclear what was driving the significant between sexes difference in discarding of
small fish. Differences in overall discarding between the sexes were primarily driven by
significant differences in discarding between the sexes for small discards, where the
proportion of each sex is highly skewed towards males. Despite this, selection of the
retained and discarded portions of the catch is almost exclusively undertaken by length
and not by sex. As such, any differences in discarding due to sex would be expected to
be arbitrary. The results shown here are in keeping with other flatfish species where the
landed part of the catch is typically more biased towards females while the discarded
187
portion of the catch may contain disproportionately more males (Kell and Bromley,
2004). This has the potential to cause distortion in the stock assessment process,
especially as many assessments utilize catch data and do not consider discards.
Therefore, the introduction of a discard ban or catch quota management system has the
potential to provide more accurate data for the assessment process.
For a number of species, total fishing mortality, including the discarded portion of the
catch, is accounted for in the assessment and management process (Fernandes et al.,
2011). Quantitative management advice was produced by ICES for the northern North
Sea (IVa) and west of Scotland (VIa) stock for the first time in 2011. The most recent
stock assessment in 2013 includes estimates of both F and Fmsy (ICES, 2013c).
However, for some species, incomplete or missing data sets prevent an accurate
estimate of fishing mortality. This lack of data restricts the ability to undertake accurate
assessments and may ultimately lead to mismanagement of the stock. Further, ICES
have proposed that a Precautionary Buffer consisting of a 20% reduction to catch advice
should be applied when stock reference points are unknown (ICES, 2012g). In the
mixed demersal fishery in the northern North Sea, where stock reference points for
many of the less significant commercial species are unknown, this may have the effect
of considerably reducing TAL but it is unclear how the approach will reduce total
catches and lead to improved management. Indeed, in the absence of effort restrictions
it may be that the Precautionary Buffer approach does little to improve the management
of the stock but will rather lead to increased discarding and continued or increased
uncertainty of fishing mortality.
The utilization of fishing effort in the mixed species demersal fishery in the northern
North Sea is primarily driven by available TAC for the principal target species.
188
Therefore, given the scenario of limited TAC for an abundant species in the target
assemblage and adequate TAC for the principal targeted species, discarding of the
secondary species will persist as fishing for the target species continues. This is indeed
the case in the northern North Sea where megrim catches are typically a byproduct of
the effort expended targeting anglerfish. This scenario serves to question the validity
and efficacy of a TAC (which only accounts for landings) for a predominantly bycatch
species such as megrim. In this instance the TAC system does little to regulate fishing
mortality, and simply determines the amount of fish that is accounted for in landings.
This is one of the major shortcomings of the CFP which it is anticipated will be
amended in the CFP reform (Anon, 2011f).
Under the proposed reform of the CFP it is anticipated that a number of legislative
measures will be implemented with the aim of improving management of fish stocks in
EU waters. These include a discards ban, a bid to manage stocks according to maximum
sustainable yield (MSY) and the regionalisation of fisheries management (Anon,
2011f). While the need for measures to improve resource management is widely
accepted, there have been concerns among fishermen about the practical
implementation of various aspects of the reformed CFP (L. Tait, pers. comm.). Gear
innovation has also been advocated as an important aspect of the MSY approach, with
the aim of developing fishing gear that has improved selectivity (Anon, 2011d) and
allows over-exploited or undesirable species to escape. While this has proven successful
for some species and fisheries, there are examples where species selection, in terms of
selecting for all desirable species, has proven difficult (Kynoch et al., 2011).
Given the complex nature of mixed fisheries, the implementation of an ecosystem-based
approach, incorporating multispecies modelling, has been developed and advocated as a
189
means to account for direct and indirect ecological interactions among species and their
environment (Latour et al., 2003). Hollowed et al. (2000) noted that multispecies
interactions need to be placed within the context of numerous other factors and
processes influencing the system and that many current models only address a subset of
these factors. The move towards an ecosystem approach within the northern North Sea
mixed fishery is, while desirable, potentially a long way off due to a lack of information
on rudimentary factors such as the ecology of many of the key species that make up the
fishery.
6.5 Conclusions
Levels of megrim discarding by Shetland PO vessels in the northern North Sea have
decreased significantly in recent years, primarily as a result of an increase in vessel
specific quota. However, high-grading of smaller fish greater than the minimum landing
size continues, albeit to a lesser extent. Bruised fish continue to be discarded at similar
levels to previous years due to their limited economic value. The results of this study
also indicate that discarding of megrim may continue for vessels in this PO in future
years under the current TAC. The current megrim TAC does little to regulate fishing
mortality in the mixed demersal fishery and serves only to regulate landings.
Furthermore, the proposed reform of the CFP, including the move towards the
implementation of MSY, raises a number of concerns that need to be addressed if the
fishery is to be managed sustainably and continue to be economically viable in the
future.

190
CHAPTER 7
GENERAL DISCUSSION
191
7.1 Introduction
The overall aim of this research project was to assist in the resource management of the
common megrim L. whiffiagonis in the northern North Sea, which was deemed to be a
‘data poor’ species at the inception of the current study. The study has filled a number
of knowledge gaps in the biology, ecology and fishery of L. whiffiagonis in the northern
North Sea and, in a wider context, on the Northern Shelf. The research undertaken here
has provided up-to-date information on key life history parameters such as growth,
maturity and reproduction and has further highlighted differences that exist in these
parameters across the Northern Shelf. Furthermore, genetic analyses have highlighted
spatial population differentiation across the Shelf. The results of the study have also
highlighted the effects of restrictive quota on discarding and the subsequent resource
waste that occurs. Furthermore, the study has highlighted the potential for the utilisation
of fishers’ data to assist in the long term monitoring of stocks and assist in the
prevention of widespread discarding that has been an unwelcome by-product of the
Common Fisheries Policy.
The scope of the research undertaken within the current study has, for some elements,
increased beyond the original study area. The original remit for the study was to
determine the biology, ecology and fishery of L. whiffiagonis in the northern North Sea.
However, given the lack of knowledge on some aspects of the stock structure and
ecology of the species on the Northern Shelf, it was perhaps inevitable that some
aspects of the current study would require increased spatial coverage. It is also
indicative of the nature of assessing the biology and ecology of exploitable local fish
populations, as there is a requirement to put them into greater context in relation to
neighbouring populations.
192
The results of the present study have a number of ecological and management
implications which are discussed here. Finally, the benefits and limitations of the study
are discussed and an overview provided of the potential future research required in
order to build upon the work undertaken.
7.2 Ecological implications
Prior to this study, knowledge of the ecology and biology of megrim in the northern
North Sea was lacking. The present work has allowed for a number of life history
characteristics of megrim to be put into context in relation to neighbouring populations
and, while there are differences evident in a number of life history parameters, it is
unclear whether these differences are simply due to environmental variation across a
gradient or whether there is evidence of individual stock components. This was also
evident in the genetic study undertaken here which, despite evidence of genetic mixing
across the Northern Shelf, highlighted evidence of spatial variation across the Shelf. In
many instances it is difficult to disentangle spatial variation in fish populations and
determine whether the main driver is reproductive isolation of biological units,
environmental variation or a combination of both.
Ormseth and Norcross (2009) noted that different life history strategies are known to
result from environmental and genetic influences on life history characteristics and that
the environment can influence the expression of particular traits. It is therefore
necessary to account for variation in life history parameters within and across
populations as these may have significant effects on the structure of populations.
Accounting for differences in life history parameters within a stock assessment
framework is important and results of the current study suggest that variation in growth
and maturity across the Northern Shelf is such that the faster growth rates and greater
193
L50 maturity in the northern North Sea may need to be taken into consideration within
the assessment process.
Given the variation in size at first maturity that was found in this study between the
northern North Sea and Rockall it would be beneficial to extend the examination of
reproductive potential to include the west of Scotland (VIa). This would enable a
comparison between the three areas and allow for an investigation of the effects of
differences in growth and maturity on reproductive potential between the areas.
Variation in reproductive potential is known to exist between fish populations and
fecundity is known to vary spatially and temporally for fish species in response to
environmental variation and fishing (Wright, 2013). Flatfish populations are known to
show latitudinal trends in potential fecundity, for example McElroy et al. (2013)
reported this among three stocks of winter flounder Pseudopleuronectes americanus,
suggesting environmental variation as the likely driver. Rideout and Morgan (2007) also
noted that spatial and temporal variation existed in fecundity in yellowtail flounder
Limanda ferruginea and witch flounder Glyptocephalus cynoglossus.
7.3 Management implications
The present study has also highlighted the potential for the use of fishers’ ecological
knowledge and data within fisheries management. From an ecological perspective, the
use of such data can also provide real-time monitoring of trends in fish abundance and
distribution. Furthermore, Bergmann et al., (2004) noted that fishers’ knowledge was
useful for identifying essential fish habitats. The utilization of such knowledge has the
potential to extend further and, with the long-term collection and analysis of whole
catch data, may also provide insight into spatial and temporal changes in ecosystem
structure.
194
Given the nature of the data generated, the utilization of such an approach would be
limited to the management level. This would enable a process whereby fishers’ and
scientists’ perceptions of trends in stocks could be considered by managers to see if a
consensus exists and, if a consensus did not exist, then pre-determined guidelines could
be implemented to undertake a more precautionary approach to changes in TAC. For
example, if fishers and scientists both reported increases or decreases in a species’
abundance, then there would be a greater degree of confidence in decisions made by
managers to significantly alter TAC. However, if a consensus did not exist then
managers could provide a more cautious approach to the regulation of TAC until further
evidence was available in future years. This approach would require an honest
evaluation of stocks by fishers and an acceptance of a potential scenario of stocks and
TAC decreasing on the basis of the information they provide. If successful, it would
allow fishers to actively contribute to the management of fish stocks and enable them to
play an important role in resource management.
Prior to the current study and the Scottish Industry/ Science Partnership (SISP) study on
megrim (Laurenson and Macdonald, 2008), fishers regarded the assessment and
management of megrim in IVa as inadequate. This was primarily due to megrim in IVa
being historically overlooked within the scientific advice system. It was evident from
the fishers’ knowledge questionnaire and the fisher’s diary data that there was an
increase in abundance, and subsequent catches, of megrim in the northern North Sea.
However, as the species in IVa was not considered in the assessment process until 2009,
there was no mechanism in place to evaluate the status of the stock and respond to
changes in abundance. Furthermore, because TAC prior to 2009 was set to reflect recent
landings, the issue of discarding exacerbated the problem because there was no
195
accounting for the scale of the discarding during that time. Also, the TAC in IVa did not
begin to increase year on year from 2007, despite the positive signal from fishery
independent surveys from 2005.
The CPUE/quota mismatch evident with the Shetland PO vessels led to significant
discarding, as was reported for the early period of the current study. Despite this, the
assessment and management of megrim in IVa has improved significantly since the
inception of the current study in 2008. The assessment for megrim in IVa has gone from
non-existent to the provision of a quantitative assessment that includes biomass and
fishing mortality estimates in a relatively short time.
In terms of resource management, where there is a lag between changes in abundance
and scientific advice, there is the potential for significant waste due to discarding. This
poses an important ethical dilemma and also has the potential to reinforce any mistrust
between industry and science. There is therefore a requirement to ensure that the
scientific assessment and subsequent management processes work in a timely manner to
provide appropriate advice. Furthermore, increased communication and collaboration
between science and industry will allow for early indicators of changes in distribution
and abundance to be identified and appropriate action to be taken.
The issue of discarding at sea may become a thing of the past if reforms to the Common
Fisheries Policy, including a discard ban, are adopted (Anon, 2011a). In its current
form, the reform of the CFP would require fishers to land all regulated species. Such an
approach is widely welcomed by all stakeholders as a means to end the wasteful
practise of discarding, although there is a degree of uncertainty as to how the ban would
be implemented. There is some concern from industry that such an approach may be
196
difficult to implement (L. Tait, Shetland Fishermen’s Association, pers comm). For
example, the proposal for the implementation of MSY in mixed demersal fisheries
states that ‘it should be the most vulnerable stock that determines the limits of
exploitation for all other fish taken in the same fishery’ (Anon, 2011d). In the northern
North Sea a number of species, including megrim, could act as so called ‘choke’-species
(the species that determines the limits of exploitation for all other fish) within the mixed
fishery, especially if a discard ban is implemented. Furthermore, catches of hake
(Merluccius merluccius), despite its historical insignificance in the northern North Sea,
have been reportedly increasing in the area with some vessels catching their annual
quota in a single haul (L. Tait, pers. comm.). As such, natural fluctuations in species
abundance have the potential to make the implementation of a multispecies MSY
approach difficult, especially if scientific data and single species assessments are
limited for many species.
7.4 Limitations of the study
The work undertaken in this thesis was initiated following a requirement to fill a
number of knowledge gaps that existed for megrim in the northern North Sea. As such,
given the timescale and logistics, the focus area for the study was IVa. Given the initial
constraints, the main limitations of the study were:
Firstly, a greater number of observer trips undertaken in the northern North Sea in 2009
would have been beneficial for the discards study. However, the transition from the
preliminary study undertaken in 2008 (Laurenson and Macdonald, 2008) and the
commencement of the current study in 2010 did not allow for considerable observer
sampling in 2009. This did not affect the outcomes of the study although greater
coverage during this time would have allowed a more comprehensive time series of
197
data. Inclusion of observer data from other sources such as the routine Marine Scotland
observer program may have benefited this study although attempts to acquire this data
proved difficult.
Secondly, the study would have benefited from greater spatial coverage of life history
characteristics at the West of Scotland and reproductive potential at Rockall and the
West of Scotland. This would have provided up-to-date parameters and would have
allowed for greater comparisons of growth, maturity, reproductive timing and
reproductive potential across the entire Northern Shelf. However, the focus for the
present study was the northern North Sea and it was logistically impractical to
undertake observer trips on vessels fishing at the west of Scotland due to the location of
their home ports on the Scottish mainland.
Finally, the fishers’ knowledge questionnaire was a first attempt at collating fishers’
opinions on megrim distribution and abundance in the northern North Sea. While the
questions posed within the survey were appropriate for collating and analysing general
trends in megrim distribution and abundance, a greater proportion of respondents would
have been more desirable. However, the response rate was relatively good for the
blanket postage method used. Any future attempts at collating this type of information
may benefit from a mixture of phone interviews and direct contact with fishers’ to
undertake interviews. However, undertaking face-to-face interviews with complete
coverage of the entire fleet may prove difficult due to the geographic spread of vessels
and home ports.
Despite these limitations the study has delivered each of the proposed outcomes
established at its inception. Furthermore, it is hoped that the relevant ICES Working

198
Group will be able to consider the findings of this study when undertaking stock
assessments.
7.5 Future work
While this study has added to the understanding of the biology, ecology and fishery of
L. whiffiagonis in the northern North Sea, there are still a number of knowledge gaps to
be filled in order to gain a greater understanding of the stock structure, biology and
ecology of the species across its range on the Northern Shelf. These include extending
the assessment of life history parameters to the area west of Scotland (ICES Division
VIa), comparing reproductive potential across the Northern Shelf, determining the
impacts of a future discard ban on the megrim fishery, and further utilizing fishers’
knowledge within the assessment process.
An assessment of the life history parameters of megrim at the west of Scotland would
allow for a these characteristics to be compared across the species’ range on the
Northern Shelf. The current study compared and highlighted differences at the extremes
of the species’ range on the Northern Shelf and determining life history characteristics
within the connecting area would help determine if these differences occur across a
natural gradient or whether they are more indicative of reproductively isolated
populations.
The reproductive potential of megrim in the northern North Sea was determined and
there is potential for this to be expanded and compared across the Northern Shelf. Given
the variation in other life history parameters such as growth and maturity across the
Shelf, there may also be significant variation in reproductive potential.

199
Another key element of understanding the ecology of a species is to recognise the
various stages of the life cycle. To date, nothing is known of the location of nursery
grounds for megrim on the Northern Shelf and indeed, little has been published
regarding juvenile habitat for the species across its range. As such, a future study aimed
at recognising juvenile habitat would provide an understanding of this key element of
the life cycle and ecology of the species.
With the implementation of a discard ban approaching, there is an opportunity to
determine the effect of such a ban on a species that has complex discarding patterns,
such as megrim. As such, a focussed study could monitor the impact of a discard ban to
determine the fate of previously discarded fish (both bruised and small) and the
economic effect in terms of value of the catch of these additional fish in the market
system.
There is also a significant opportunity to establish protocols to incorporate fishers’
knowledge and data within the assessment process. Such a project could be an
additional source of data and could assist with the assessment process.

200
REFERENCES
201
Abaunza, P., Gordo, L. S., Santamaría, M. T. G., Iversen, S. A., Murta, A. G., and
Gallo, E. 2008a. Life history parameters as basis for the initial recognition of stock
management units in horse mackerel (Trachurus trachurus). Fisheries Research, 89(2):
167-180.
Abaunza, P., Murta, A. G., Campbell, N., Cimmaruta, R., Comesa˜na, A. S., Dahle, G.,
García Santamaría, M. T., Gordo, L. S., Iversen, S. A., MacKenzie, K., Magoulas, A.,
Mattiucci, S., Molloy, J., Nascetti, G., Pinto, A. L., Quinta, R., Ramos, P., Sanjuan, A.,
Santos, A. T., Stransky, C., and Zimmermann, C. 2008b. Stock identity of horse
mackerel (Trachurus trachurus) in the Northeast Atlantic and Mediterranean Sea:
integrating the results from different stock identification approaches. Fisheries
Research, 89: 196-209.
Akaike, H. 1974. A new look at the statistical model identification. IEEE Transactions
on Automatic Control, 19: 716-723.
Alonso-Fernandez, A., Vallejo, A. C., Saborido-Rey, F., Murua, H., and Trippel, E. A.
2009. Fecundity estimation of Atlantic cod (Gadus morhua) and haddock
(Melanogrammus aeglefinus) of Georges Bank: Application of the autodiametric
method. Fisheries Research, 99(1): 47-54.
Anon. 1997. Draft report of workshop on megrim otolith and fin ray age reading held
in Vigo, Spain. 19-23 May 1997. Unpublished: 40pp.
Anon. 2007. A policy to reduce unwanted by-catches and eliminate discards in
European fisheries. Commission of the European Communities, COM (2007) 136
Final. 28 March 2007.
Anon. 2009a. Council regulation (EC) No 43/2009 (Annex III). Official Journal of the
European Union L 22/1, 16th January 2009, 205pp.
Anon. 2009b. "The Scottish Goverment's response to the European Commission's green
paper on reform of the common fisheries policy." The Scottish Government,
Edinburgh: 43 pp.
Anon. 2009c. The Common Fisheries Policy: A user's guide. Office for Official
Publications of the European Communities, Luxembourg: 40.
Anon. 2011a. CFP reform - the discard ban. European Commission, Brussels, Belgium:
3pp. Retrieved from http://ec.europa.eu/fisheries/reform/docs/discards_en.pdf. 18
March 2012.
Anon. 2011b. Impact assessment of discard reducing policies Studies in the field of the
Common Fisheries Policy and Maritime Affairs, Lot 4: Impact assessment studies
related to the CFP. Commission of the European Communities, June 2011
Anon. 2011c. Scottish Sea Fisheries Statistics 2010. Scottish Government, Edinburgh.
202
Anon. 2011d. CFP reform - Maximum Sustainable Yield. European Commission,
Brussels, Belgium: 3pp. Retrieved from
http://ec.europa.eu/fisheries/reform/docs/msy_en.pdf. 18 March 2012.
Anon. 2011e. "State of European fish stocks in 2011. European Commission Seminar,
Brussels, Belgium, 8 September 2011."
Anon. 2011f. Proposal for a regulation of the European Parliment and of the Council on
the Common Fisheries Policy. Commission of the European Communities, COM
(2011) 425 Final. 13 July 2011.
Anon. 2012. "Scottish Sea Fisheries Statistics." Scottish Government, Edinburgh: 1-42.
Aubin-Ottenheimer, G. 1987. Bilan des connaissances sur la cardine (Lepidhorhombus
whiffiagonis). Etude du stock de mer Celtique. Revue des Travaux de l'Institut des
Peches Maritimes, 49(3 & 4): 205-214.
Bagenal, T. B. 1957. The breeding and fecundity of the Long Rough Dab
Hippoglossoides platessoides (Fabr.) and the associated cycle in condition. Journal of
the Marine Biological Association of the United Kingdom, 36(2): 339-375.
Bagenal, T. B. 1963. The fecundity of witches in the Firth of Clyde. Journal of the
Marine Biological Association of the United Kingdom 43: 401-407.
Bagenal, T. B. 1971. The interrelation of the size of fish eggs, the date of spawning and
the production cycle. Journal of Fish Biology, 3: 207-219.
Bagenal, T. B., and Braum, E. 1978. Eggs and early life history. In Methods for
Assessment of Fish Production in Fresh Waters. Blackwell, Oxford 165–201.
Ballagh, A. C., Welch, D. J., Newman, S. J., Allsop, Q., and Stapley, J. M. 2012. Stock
structure of the blue threadfin (Eleutheronema tetradactylum) across northern Australia
derived from life-history characteristics. Fisheries Research, 121–122(0): 63-72.
Bates, D. M., and Maechler, M. 2009. lme4: Linear mixed-effect models using S4
classes. R package version 0.999375-32.
Baudron, A. R., Needle, C. L., and Marshall, C. T. 2011. Implications of a warming
North Sea for the growth of haddock Melanogrammus aeglefinus. Journal of Fish
Biology, 78: 1874-1889.
Begg, G. A., and Waldman, J. R. 1999. An holistic approach to fish stock
identification. Fisheries Research, 43: 35-44.
Begg, G. A., Hare, J. A., and Sheehan, D. D. 1999. The role of life history parameters
as indicators of stock structure. Fisheries Research, 43: 141-163.
Begg, G. A. 2005. "Life History Parameters." Stock Identification Methods:
Applications in Fishery Science, Cadrin, S. X., Friedland, K. D., and Waldman, J. R.,
eds., Elsevier, London: 119-150.
203
Begon, M., Harper, J. L., and Townsend, C. R. 1996. Ecology: Individuals, Populations
and Communities. Blackwell Science, Oxford 1068.
Belk, M. C. 1995. Variation in growth and age at maturity in bluegill sunfish-genetic or
environmental effects. Journal of Fish Biology, 47: 237-247.
Bergmann, M., Hinz, H., Blyth, R. E., Kaiser, M. J., Rogers, S. I., and Armstrong, M.
2004. Using knowledge from fishers and fisheries scientists to identify possible
groundfish essential fish habitats. Fisheries Research, 66(2-3): 373-379.
Berkes, F. 2006. From Community-Based Resource Management to Complex Systems:
The Scale Issue and Marine Commons. Ecology and Society, 11(1): 45.
Beverton, R. J. H., and Holt, S. J. 1957. On the dynamics of exploited fish populations.
Fisheries Investigation Series II London, 19: 553 pp.
Blanchard, J. L., Frank, K. T., and Simon, J. E. 2003. Effects of condition on fecundity
and total egg production of eastern Scotian Shelf haddock (Melanogrammus
aeglefinus). Canadian Journal of Fisheries and Aquatic Sciences, 60: 321-332.
Booke, H. E. 1981. The conundrum of the stock concept-are nature and nurture
definable in fishery science? Canadian Journal of Fisheries and Aquatic Science, 38:
1479-1480.
Bowering, W. R. 1980. Fecundity of Greenland Halibut, Reinhardtius hippoglossoides
(Walbaum), from Southern Labrador and Southeastern Gulf of St. Lawrence. Journal of
Northwest Atlantic Fisheries Science, 1: 39-43.
Bowering, W. R. 1990. Spawning of witch flounder (Glyptocephalus cynoglossus L.) in
the Newfoundland-Labrador area of the northwest Atlantic as a function of depth and
water temperature. Fisheries Research, 9(1): 23-39.
Brooks, E. N., Powers, J. E., and Cortes, E. 2010. Analytical reference points for age-
structured models: application to data-poor fisheries. ICES Journal of Marine Science,
67(1): 165-175.
Brown-Peterson, N. J., Wyanski, D. M., Saborido-Rey, F., Macewicz, B. J., and
Lowerre-Barbieri, S. K. 2011. A Standardized Terminology for Describing
Reproductive Development in Fishes. Marine and Coastal Fisheries, 3(1): 52-70.
Burnett, J., Ross, M. R., and Clark, S. H. 1992. Several Biological Aspects of the Witch
Flounder (Glyptocephalus cynoglossus (L.)) in the Gulf of Maine-Georges Bank
Region. Journal of Northwest Atlantic Fisheries Science, 12: 15-25.
Cadrin, S. X., Friedland, K. D., and Waldman, J. R. 2005. Stock Identification
Methods: Applications in Fishery Science. Elsevier, London.
Campo, D., and Garcia-Vazquez, E. 2010. Evolutionary history of the four-spotted
megrim (Lepidorhombus boscii) and speciation time within the genus based on
mitochondrial genes analysis. Journal of Sea Research, 64: 360-368.
204
Cardinale, M., Doerner, H., Abella, A., Andersen, J., Casey, J. M., Doering, R.,
Kirkegaard, E., Simmonds, E. J., and Stransky, C. 2011. Fishery reform: Many stocks
secure. Nature, 476: 0-1.
Carr, L. M., and Heyman, W. D. 2012. “It’s about seeing what’s actually out there”:
Quantifying fishers’ ecological knowledge and biases in a small-scale commercial
fishery as a path towards co-Management. Ocean & Coastal Management, 69: 118-132.
Casselman, J. M., Collins, J. J., Crossman, E. J., Ihssen, P. E., and Spangler, G. R. 1981.
Lake whitefish (Coregonus clupeaformis) stocks of the Ontario waters of Lake Huron.
Canadian Journal of Fisheries and Aquatic Science, 38: 1772-1789.
Catchpole, T. L., Frid, C. L. J., and Gray, T. S. 2005. Discards in North Sea fisheries:
causes, consequences and solutions. Marine Policy, 29: 421-430.
Chan, K.-S. 2010. TSA: Time Series Analysis. R package version 0.98.
http://CRAN.R-project.org/package=TSA Date accessed: 22 Nov. 2010.
Churchill, R., and Owen, D. 2010. The EC Common Fisheries Policy. Oxford
University Press, Oxford 640.
Cleasby, I. R., and Nakagawa, S. 2011. Neglected biological patterns in the residuals: a
behavioural ecologist's guide to co-operating with heteroscedasticity. Behavioral
Ecology & Sociobiology, 65: 2361-2372.
Clucas, I. J. 1996. "Reduction of fish wastage - an introduction." Report on the
Technical Consultation on Reduction of Wastage in Fisheries, Clucas, I. J. and James,
D., eds., FAO, Rome.
Cole, L. C. 1954. The population consequences of life history phenomena. Quarterly
Review of Biology, 29: 103-137.
Costello, C., Ovando, D., Hilborn, R., Gaines, S. D., Deschenes, O., and Lester, S. E.
2012. Status and solutions for the world's unassessed fisheries. Science, 338: 517-520.
Cryer, J. D., and Chan, K.-S. 2008. Time Series Analysis With Applications in R.
Springer, New York.
Danancher, D., and Garcia-Vazquez, E. 2009. Population differentiation in megrim
(Lepidorhombus whiffiagonis) and four spotted megrim (Lepidorhombus boscii) across
Atlantic and Mediterranean waters and implications for wild stock management.
Marine Biology, 156(9): 1869-1880.
DeMartini, E. E. 1991. Annual variations in fecundity, egg size, and the gonadal and
somatic conditions of queenfish Seriphus politus (Sciaenidae). Fishery Bulletin, 89: 9-
18.
Depestele, J., Vandemaele, S., Vanhee, W., Polet, H., Torreele, E., Leirs, H., and Vincx,
M. 2011. Quantifying causes of discard variability: an indispensable assistance to
205
discard estimation and a paramount need for policy measures. ICES Journal of Marine
Science: Journal du Conseil, 68(8): 1719-1725.
Dobby, H., Allan, L., Harding, M., Laurenson, C. H., and McLay, H. A. 2008.
Improving the quality of information on Scottish anglerfish fisheries: making use of
fishers' data. ICES Journal of Marine Science, 65(7): 1334-1345.
Dodson, J. J. 1997. "Fish migration: an evolutionary perspective." Behavioural
Ecology of Teleost Fishes, Godin, J.-G. J., ed., Oxford University Press, New York: 10-
36.
Dominguez-Petit, R., Macdonald, P., Coma, R., Saborido-Rey, F., and Saínza, M. 2011.
Reproductive potential of Lepidorhombus boscii and Lepidorhombus whiffiagonis:
Implications for management. 8th International Flatfish Symposium. 5-10 November
2011. IJmuiden (The Netherlands).
Drew, J. A. 2005. Use of Traditional Ecological Knowledge in Marine Conservation.
Conservation Biology, 19(4): 1286-1293.
Du Buit, M. H. 1984. The Feeding-Habits of Megrim (Lepidorhombus-Whiffiagonis W)
in Northern and Western Scotland. Journal du Conseil permanent International pour l'
Exploration de la Mer 41(2): 194-198.
Duarte, C. M., and Alcaraz, M. 1989. To produce many small or few large eggs: a size-
independent reproductive tactic of fish. Oecologia, 80: 401-401.
EC. 2003. Commission Regulation (EC) No.2244/2003 of 18 December 2003 laying
down detailed provisions regarding satellite-based Vessel Monitoring Systems. Official
Journal of the European Union, L 333: 17-27.
EEC. 1983. Commission Regulation (EEC) No 2807/83 of 22 September 1983 laying
down detailed rules for recording information on Member States' catches of fish.
Official Journal of the European Union, L 276: 1-18.
Egan, A., Etherton, M., Gomez de Segura, A., Iriondo, A., Marcal, A., Power, A.,
Quincoces, I., Santurtun, M., Vingaard Larsen, P., and Warne, S. 2004. "Workshop on
Megrim Otolith Age Readings." AZTI, Sukarrieta, Spain: 116.
Estoup, A., Largiadèr, C. R., Perrot, E., and Chourrout, D. 1996. Rapid one-tube DNA
extraction for reliable PCR detection of fish polymorphic marker and transgenes.
Molecular Marine Biology and Biotechnology, 5: 295-298.
Evanno, G., Regnaut, S., and Goudet, J. 2005. Detecting the number of clusters of
individuals using the software STRUCTURE: a simulation study. Molecular Ecology,
14: 2611-2620.
FAO. 2001. Reykjavik Conference on Responsible Fisheries in the Marine Ecosystem.
United Nations Food and Agricultural Organisation, Iceland, 1-4th October 2001.
206
Faraway, J. J. 2006. Extending the Linear Model with R: Generalized Linear, Mixed
Effects and Nonparametric Regression Models. Chapman & Hall/CRC, Boca Raton
312.
Feekings, J., Bartolino, V., Madsen, N., and Catchpole, T. 2012. Fishery discards:
factors affecting their variability within a demersal trawl fishery. PLoS ONE, 7(4):
e36409. doi:10.1371/journal.pone.0036409.
Fernandes, P. G. 2008. "An index of the abundance of megrim on the European
northern shelf:2005-2007." Working Documents of the Working Group on the
Assessment of Northern Shelf Demersal Stocks (WGNSDS) 2008, ICES WGNSDS: 38-
47.
Fernandes, P. G., and Cook, R. M. 2013. Reversal of fish stock decline in the northeast
Atlantic. Current Biology, 23(15): 1432-1437.
Fernandes, P. G., Coull, K., Davis, C., Clark, P., Catarino, R., Bailey, N., Fryer, R., and
Pout, A. 2011. Observations of discards in the Scottish mixed demersal trawl fishery.
ICES Journal of Marine Science: Journal du Conseil, 68(8): 1734-1742.
Finucane, J. H., Collins, L. A., Brusher, H. A., and Saloman, C. H. 1986. Reproductive
biology of king mackerel, Scomberomorus cavalla, from the southeastern Unites states.
Fishery Bulletin, 84(4): 841-850.
Foster, S. J., and Vincent, A. C. J. 2010. Tropical shrimp trawl fisheries: Fishers’
knowledge of and attitudes about a doomed fishery. Marine Policy, 34(3): 437-446.
Friedland, K. D., Ama-Abasi, D. D., Manning, M., Clarke, L., Kligys, G., and
Chambers, R. C. 2005. Automated egg counting and sizing from scanned images: rapid
sample processing and large data volumes for fecundity estimates. Journal of Sea
Research, 54: 307-316.
Furnestin, J. 1935. La cardine (Lepidorhombus megastoma DONOVAN =
Lepidorhombus whiff WALBAUN). Re'sume' des connaissances acquises sur la biologie
de ce poisson. Revue des Travaux de l'Institut des Peches Maritimes, 8(2): 203-249.
Garcia-Vazquez, E., Izquierdo, J. I., and Perez, J. 2006. Genetic variation at ribosomal
genes supports the existence of two different European subspecies in the megrim
Lepidorhombus whiffiagonis. Journal of Sea Research, 56(1): 59-64.
Gelman, A., and Hill, J. 2007. Data analysis using regression and
multilevel/hierarchical models. Cambridge University Press, New York.
Gerritsen, H., and Lordan, C. 2011. Integrating vessel monitoring systems (VMS) data
with daily catch data from logbooks to explore the spatial distribution of catch and
effort at high resolution. ICES Journal of Marine Science, 68(1): 245-252.
Gerritsen, H. D., McGrath, D., Lordan, C., and Harlay, X. 2010. Differences in habitat
selection of male and female megrim (Lepidorhombus whiffiagonis, Walbaum) to the
207
west of Ireland. A result of differences in life-history strategies between the sexes?
Journal of Sea Research, 64: 487-493.
Gibson, R. N. 2005. Flatfishes: Biology and Exploitation. Blackwell Science Ltd,
Oxford 391.
Gillis, D. J. 2002. "Workshop on the Groundifsh Sentinel Program." Fisheries Research
Branch, Department of Fisheries and Oceans, Ottowa: 95.
Gillis, D. M., Pikitch, E. K., and Peterman, R. M. 1995. Dynamic discarding decisions:
foraging theory for high-grading in a trawl fishery. Behavioral Ecology, 6(2): 146-154.
Gordon, J. D. M. 2001. "Distribution and biology of anglerfish and megrim in waters to
the west of Scotland." European Commission - DGXIV, No. Study Contract 98/096
106.
Goudet, J. 1995. FSTAT Version 1.2: a computer program to calculate F-statistics.
Journal of Heredity, 86: 485-486.
Graham, N., Grainger, R., Karp, W. A., MacLennan, D. N., MacMullen, P., and
Nedreaas, K. 2011. An introduction to the proceedings and a synthesis of the 2010
ICES Symposium on Fishery-Dependent Information. ICES Journal of Marine Science:
Journal du Conseil, 68(8): 1593-1597.
Haddon, M. 2001. Modelling and quantitative methods in fisheries. Chapman &
Hall/CRC. ISBN 1-58488-177-1. 406pp.
Hall, T. A. 1999. BioEdit: a user-friendly biological sequence alignment editor and
analysis program for Windows 95/98/NT. Nucleic Acids Symposium Series, 41: 95-98.
Haug, T., and Gulliksen, B. 1988. Fecundity and oocyte sizes in ovaries of female
Atlantic Halibut, Hippoglossus hippoglossus (L.). Sarsia, 73: 259-261.
Hilborn, R. 2007. Defining success in fisheries and conflicts in objectives. Marine
Policy, 31: 153-158.
Hilborn, R., and Walters, C. J. 1992. Quantitative Fisheries Stock Assessment. Choice,
Dynamics and Uncertainty. Chapman & Hall, New York.
Hoffman, E. 1971. The fecundity of the flounder (Platichthys flesus L.) in a Danish
fjord. ICES CM 1971/F:24, 10pp.
Hollowed, A. B., Bax, N., Beamish, R., Collie, J. S., Fogarty, M., Livingston, P., Pope,
J., and Rice, J. C. 2000. Are multispecies models an improvement on single-species
models for measuring fishing impacts on marine ecosystems? ICES Journal of Marine
Science, 57: 707-719.
Horwood, J. W. 1993. Fecundity and biomass of plaice (Pleuronectes platessa L.) in
the northern Celtic Sea. ICES Journal of Marine Science, 50: 315-323.
208
Horwood, J. W., and Greer Walker, M. 1990. Determinacy of fecundity in sole (Solea
solea) from the Bristol Channel. Journal of the Marine Biological Association of the
United Kingdom, 70: 803-813.
Howell, K. L., Davies, J. S., Jacobs, C., and Narayanaswamy, B. E. 2009. "Broadscale
survey of the habitats of Rockall Bank and mapping of Annex I 'Reef' habitat." JNCC
Report 422.
Hughes, D. J., and Narayanaswamy, B. E. 2013. Impacts of climate change on deep-sea
habitats. Marine Climate Change Impacts Partnership: Science review, In Press.
Hutchings, J. A. 2002. "Life histories of fish." Handbook of Fish and Fisheries. Vol 1.
Fish Biology, Hart, P. J. B. and Reynolds, J. D., eds., Blackwell, Oxford: 149-174.
ICES. 2007. Report of the workshop on using fishers to sample catches (WKUFS).
ICES CM 2007/ACFM:24: 1-48.
ICES. 2009. "Megrim (Lepidorhombus spp) in Subarea IV (North Sea) and VI (West of
Scotland and Rockall)." ICES Advice 2009, Book 5: 163-168.
ICES. 2010. Megrim (Lepidorhombus spp) in Subarea IV (North Sea) and VI (West of
Scotland and Rockall). ICES Advice 2010, Book 5, pp. 166-173.
ICES. 2011a. Haddock in Division VIb (Rockall). ICES Advice 2011, The Celtic Sea
and West of Scotland.
ICES. 2011b. Megrim (Lepidorhombus spp) in Divisions IVa and VIa. ICES Advice
2011, The Celtic Sea and West of Scotland.
ICES. 2011c. Megrim (Lepidorhombus spp) in ICES Division VIb (Rockall). ICES
Advice 2011, The Celtic Sea and West of Scotland.
ICES. 2011d. Report of the Benchmark Workshop on Flatfish (WKFLAT). ICES
Advisory Committee, ICES CM 2011/ACOM:39, 257 pp.
ICES. 2011e. Megrim (Lepidorhombus whiffiagonis) in Divisions VIIb-k and VIIIa,b,d.
ICES Advice 2011 - The Celtic Sea and West of Scotland.
ICES. 2011f. Report of the Working Group on the Celtic Seas Ecoregion (WGCSE),
11–19 May 2011, Copenhagen, Denmark. ICES CM 2011/ACOM:12.
ICES. 2012a. "International Bottom Trawl Survey.
http://datras.ices.dk/Home/Descriptions.aspx Date accessed: 15 Sept 2012." ICES.
ICES. 2012b. Megrim (Lepidorhombus spp) in ICES Division VIb (Rockall). Book 5,
Celtic Sea and West of Scotland. 6 pp
ICES. 2012c. Megrim (Lepidorhombus whiffiagonis) in Divisions VIIIc and IXa. Book
7, ICES Advice 2012, 7 pp.
209
ICES. 2012d. Megrim (Lepidorhombus whiffiagonis) in Divisions VIIb-k and VIII a, b,
d. Book 5, The Celtic Sea and West of Scotland. 8 pp.
ICES. 2012e. Report of the workshop on the development of assessments based on
LIFE history traits and exploitation characteristics (WKLIFE). ICES Advisory
Committee, ICES CM 2012/AOCM:36.
ICES. 2012f. Megrim (Lepidorhombus spp) in Divisions IVa and VIa. ICES Advice
2012, Book 5, The Celtic Sea and West of Scotland. 1-9.
ICES. 2012g. ICES' Implementation of RGLIFE advice on Data Limited Stocks (DLS).
ICES CM 2012/ACOM:68.
ICES. 2013a. Megrim (Lepidorhombus spp.) in ICES Division VIb (Rockall). ICES
Advice 2013, Book 5, 6pp.
ICES. 2013b. Lemon sole in Subarea IV and Divisions IIIa and VIId. Book 6, ICES
Advice, 2013, 5pp.
ICES. 2013c. Megrim (Lepidorhombus spp) in Divisions IVa and VIa. ICES Advice
2013, Book 5, The Celtic Sea and West of Scotland.
ICES. 2013d. Advice basis June 2013. ICES Advice 2013, Book 1: 1-20.
ICES. 2013e. Cod in Divisions VIIe-k (Celtic Sea cod). Book 5, ICES Advice, 9pp.
ICES. 2013f. Anglerfish (Lophius piscatorius and L. budgassa) in Division IIIa and
Subareas IV and VI. Book 5, ICES Advice 2013, 17pp.
Ihssen, P. E., Booke, H. E., Casselman, J. M., McGlade, J. M., Payne, N. R., and Utter,
F. M. 1981. Stock identification: materials and methods. Canadian Journal of Fisheries
and Aquatic Science, 38: 1838-1855.
Iyengar, A., Piyapattanakorn, S., Heipel, D. A., Stone, D. M., Howell, B. R., Child, A.
R., and MacLean, N. 2000. A suite of highly polymorphic microsatellite markers in
turbot (Scophthalmus maximus L.) with potential for use across several flatfish species.
Molecular Ecology, 9: 365-378.
Jastania, H. A. 1995. Fecundity of Limanda limanda in Oxwich Bay, South Wales, UK.
JKAU: Mar. Sci., 6: 69-77.
Jennings, S., Kaiser, M. J., and Reynolds, J. D. 2001. Marine Fisheries Ecology.
Blackwell Publishing, Oxford 417.
Jobling, M. 1995. Environmental Biology of Fishes. Chapman & Hall, London.
Johnson, R. K., and Barnett, M. A. 1975. An inverse correlation between meristic
characters and food supply in midwater fishes: evidence and possible explanations.
U.S. Fisheries Bulletin, 73: 284-298.
210
Johnson, T. R. 2009. Cooperative research and knowledge flow in the marine
commons: Lessons from the Northeast United States. International Journal of the
Commons. North America, 4, nov. 2009. Available at:
<http://www.thecommonsjournal.org/index.php/ijc/article/view/110/110>. Date
accessed: 16 Nov. 2011.
Johnson, T. R., and van Densen, W. L. T. 2007. Benefits and organisation of
cooperative research for fisheries management. ICES Journal of Marine Science, 64:
834-840.
Jones, A. 1974. Sexual maturity, fecundity and growth of the turbot Scophthalmus
maximus L. Journal of the Marine Biological Association of the United Kingdom, 54:
109-125.
Junquera, S., Roman, E., Paz, X., and Ramilo, G. 1999. Changes in Greenland halibut
growth, condition and fecundity in the Northwest Atlantic (Flemish Pass, Felmish Cap
and Southern Grand Bank). Journal of Northwest Atlantic Fishery Science, 25: 17-28.
Kell, L. T., and Bromley, P. J. 2004. Implications for current management advice for
North Sea plaice (Pleuronectes platessa L.): Part II. Increased biological realism in
recruitment, growth, density-dependent sexual maturation and the impact of sexual
dimorphism and fishery discards. Journal of Sea Research, 51(3-4): 301-312.
Kelleher, K. 2005. Discards in the world’s marine fisheries. An update. FAO Fisheries
Technical Paper. No. 470. Rome, FAO. 131p.
Klibansky, N., and Juanes, F. 2008. Procedures for efficiently producing high-quality
fecundity data on a small budget. Fisheries Research, 89: 84-89.
Kynoch, R. J., O’Neill, F. G., and Fryer, R. J. 2011. Test of 300 and 600mm netting in
the forward sections of a Scottish whitefish trawl. Fisheries Research, 108(2–3): 277-
282.
Lambert, Y. 2008. Why should we closely monitor fecundity in marine fish
populations? Journal of Northwest Atlantic Fisheries Science, 41: 93-106.
Landa, J., and Pineiro, C. 2000. Megrim (Lepidorhombus whiffiagonis) growth in the
North-eastern Atlantic based on back-calculation of otolith rings. ICES Journal of
Marine science, 57(4): 1077-1090.
Landa, J., Pineiro, C., and Perez, N. 1996. Megrim (Lepidorhombus whiffiagonis)
growth patterns in the northeast Atlantic. Fisheries Research, 26(3-4): 279-294.
Larkin, P. A. 1992. "The stock concept and management of Pacific salmon." The Stock
Concept in Pacific Salmon, Simon, R. C. and Larkin, P. A., eds., H.R. MacMillan
Lectures in Fisheries, University of British Columbia, Vancouver BC: 11-15.
Latour, R. J., Brush, M. J., and Bonzek, C. F. 2003. Toward Ecosystem-Based
Fisheries Management: Strategies for Multispecies Modeling and Associated Data
Requirements. Fisheries 28: 10-22.
211
Laurenson, C. H., and Macdonald, P. 2008. "Collection of fisheries and biological data
on megrim in ICES sub-area IVa." Scottish Industry / Science Partnership (SISP)
Report No 05/08: 44.
Librado, P., and Rozas, J. 2009. DnaSP v5: A software for comprehensive analysis of
DNA polymorphism data. Bioinformatics, 25: 1451-1452.
Likert, R. 1932. A technique for the measurement of attitudes. Archives of
Psychology, 140: 52.
Lorance, P., Agnarsson, S., Damalas, D., des Clers, S., Figueiredo, I., Gil, J., and
Trenkel, V. M. 2011. Using qualitative and quantitative stakeholder knowledge:
examples from European deep-water fisheries. ICES Journal of Marine Science:
Journal du Conseil, 68(8): 1815-1824.
Lordan, C., Ó Cuaig, M., Graham, N., and Rihan, D. 2011. The ups and downs of
working with industry to collect fishery-dependent data: the Irish experience. ICES
Journal of Marine Science: Journal du Conseil, 68(8): 1670-1678.
Lozan, J. L. 1992. Sexual differences in food intake, digestive tract size, and growth
performance of the dab, Limanda limanda L. Netherlands Journal of Sea Research, 29:
223-227.
Luikart, G., and England, P. R. 1999. Statistical analysis of microsatellite DNA data.
Trends in Ecology and Evolutionary Applications, 14: 253-256.
Macdonald, P., Angus (nee Laurenson), C. H., and Marshall, C. T. 2013. Spatial
variation in life history characteristics of common megrim (Lepidorhombus
whiffiagonis) on the Northern Shelf. Journal of Sea Research, 75: 62-68.
Manni, F., Guerard, E., and Heyer, E. 2004. Geographic patterns of (genetic,
morphologic, linguistic) variation: How barriers can be detected by using Monmonier's
algorithm. Human Biology, 76: 173-190.
Maravelias, C. D. 1997. "North Sea herring (Clupea harengus, L.) distribution in
relation to environment: Analysis of acoustic survey data (1992-95)." University of
Aberdeen, Aberdeen: 242.
Marshall, C. T., Kjesbu, O. S., Yaragina, N. A., Solemdal, P., and Ulltang, Ø. 1998. Is
spawner biomass a sensetive measure of the reproductive and recruitment potential of
Northeast Arctic cod? Canadian Journal of Fisheries and Aquatic Science, 55: 1766-
1783.
Marshall, C. T., Needle, C. L., Thorsen, A., Kjesbu, O. S., and Yaragina, N. A. 2006.
Systematic bias in estimates of reproductive potential of an Atlantic cod (Gadus
morhua) stock: implications for stock-recruitment theory and management. Canadian
Journal of Fisheries and Aquatic Science, 63: 980-994.
Marteinsdottir, G., and Begg, G. A. 2002. Essential relationships in corporating the
influence of age, size and condition on variables required for estimation of reproductive
212
potential in Atlantic cod Gadus morhua. Marine Ecology Progress Series, 235: 235-
256.
Marteinsdottir, G., Gudmundsdottir, A., Thorsteinsson, V., and Stefansson, G. 2000.
Spatial variation in abundance, size composition and viable egg production of spawning
cod (Gadus morhua L.) in Icelandic waters. ICES Journal of Marine Science: Journal
du Conseil, 57(4): 824-830.
Maurstad, A. 2002. Fishing in murky waters--ethics and politics of research on fisher
knowledge. Marine Policy, 26(3): 159-166.
McElroy, W. D., Wuenschel, M. J., Press, Y. K., Towle, E. K., and McBride, R. S.
2013. Differences in female individual reproductive potential among three stocks of
winter flounder, Pseudopleuronectes americanus. Journal of Sea Research, 75(0): 52-
61.
McEvoy, L. A., and McEvoy, J. 1991. Size fluctuation in the eggs and newly hatched
larvae of captive turbot (Scophthalmus Maximus). Journal of the Marine Biological
Association of the United Kingdom, 71: 679-690.
Meyer, A. 1993. "Evolution of mitochondrial DNA in fishes." Biochemistry and
Molecular Biology of Fishes, Hochachka, P. W. and Mommsen, T. P., eds., Elsevier,
Amsterdam: 1-38.
Millar, R. B., and Anderson, M. J. 2004. Remedies for pseudoreplication. Fisheries
Research, 70: 397-407.
Miller, B., and Kendall, A. W. 2009. Early Life History of Marine Fishes. University
of California Press, California.
Moguedet, P. H., and Perez, N. 1988. Estimation of megrim (Lepidorhombus
whiffiagonis) growth parameters, for males and females, from the ICES Division VII:
fitting to the V. Bertalanffy model using, resampling techniques, as well as several
adjustable central values (mean, median and mode length at age). ICES CM 1988/G:9,
18 pp.
Morte, S., Redon, M. J., and Sanz-Brau, A. 1999. Feeding ecology of two megrims
Lepidorhombus boscii and Lepidorhombus whiffiagonis in the western Mediterranean
(Gulf of Valencia, Spain). Journal of the Marine Biological Association of the United
Kingdom, 79(1): 161-169.
Murua, H., and Saborido-Ray, F. 2003. Female reproductive strategies of marine fish
species of the North Atlantic. Journal of Northwest Atlantic Fisheries Science, 33: 23-
31.
Murua, H., Kraus, G., Saborido-Ray, F., Witthames, P. R., Thorsen, A., and Junquera,
S. 2003. Procedures to estimate fecundity of marine fish species in relation to their
reproductive strategy. Journal of Northwest Atlantic Fisheries Science, 33: 33-54.
213
Napier, I. R. 2012. Data deficient stocks in Scotland. NAFC Marine Centre Report:
6pp.
Neat, F., and Campbell, N. 2011. Demersal fish diversity of the isolated Rockall
plateau compared with the adjacent west coast shelf of Scotland. Biological Journal of
the Linnean Society, 104: 138-147.
Newton, A. W., and Armstrong, D. W. 1974. A note on the fecundity of lemon sole.
ICES CM 1974/F:34, 7pp.
Newton, A. W., Peach, K. J., Coull, K. A., Gault, M., and Needle, C. L. 2008. Rockall
and the Scottish haddock fishery. Fisheries Research, 94(2): 133-140.
Nielsen, J. G. 1990. Scophthalmidae. p. 1026. In J.C. Quero, J.C. Hureau, C. Karrer, A.
Post and L. Saldanha (eds.) Check-list of the fishes of the eastern tropical Atlantic
(CLOFETA). JNICT, Lisbon; SEI, Paris; and UNESCO, Paris. Vol. 2.
Nielsen, J. G. 1989. "Scophthalmidae." Fishes of the North-eastern Atlantic and the
Mediterranean (FNAM), Whitehead, P. J. P., Bauchot, M.-L., Hureau, J.-C., Nielsen, J.,
and Tortonese, E., eds., Springer-Verlag, Berlin, Unesco, Paris: 1286-1293.
Nissling, A., and Dahlman, G. 2010. Fecundity of flounder, Pleuronectes flesus, in the
Baltic Sea — Reproductive strategies in two sympatric populations. Journal of Sea
Research, 64(3): 190-198.
Okumus, I., and Ciftci, Y. 2003. Fish population genetics and molecular markers: II -
molecular markers and their applications in fisheries and aquaculture Turkish Journal of
Fisheries and Aquatic Sciences, 3: 51-79.
Ormseth, O. A., and Norcross, B. L. 2009. Causes and consequences of life-history
variation in North American stocks of Pacific cod. ICES Journal of Marine Science, 66:
349-357.
Parker, G. A. 1992. The evolution of sexual size dimorphism in fish. Journal of Fish
Biology, 41(sB): 1-20.
Pavlov, D. A., Emel'yanove, N. G., and Novikov, G. G. 2009. "Reproductive
dynamics." Fish Reproductive Biology: Implications for Assessment and Management,
Jakobsen, T., Fogarty, M. J., Megrey, B. A., and Moksness, E., eds., Wiley-Blackwell,
Oxford: 429.
Pitt, T. K. 1964. Fecundity of American plaice (Hippoglossoides platessoides (Fabr.)
from Grand Bank and Newfoundland areas. Journal of the Fisheries Research Board of
Canada, 21: 597-612.
Poulard, J. C., Peronnet, I., and Rivoalen, J. J. 1991. Depth and spatial distributions of
Lepidorhombus whiffiagonis (Walbaum, 1792) by age group in Celtic Sea and Bay of
Biscay. ICES CM 1983/G:43, 11pp.
214
Poulard, J. C., Peronnet, I., and Rivoalen, J. J. 1993. Depth and spatial distributions of
Lepidorhombus whiffiagonis (Walbaum, 1792) by age group in Celtic Sea and Bay of
Biscay. ICES Statutory Meeting, 1993. G:43 Poster: 11pp.
Pritchard, J. K., Stephens, M., and Donnelly, P. 2000. Inferences of population
structure using multilocus genotype data. Genetics, 155: 945-959.
R Development Core Team. 2008. R: A language and environment for statistical
computing. R Foundation for Statistical Computing, Vienna, Austria. ISBN 3-900051-
07-0, URL http://www.R-project.org. Date accessed: 27 Jun 2008.
Rickman, S. J., Dulvy, N. K., Jennings, S., and Reynolds, J. D. 2000. Recruitment
variation related to fecundity in marine fishes. Canadian Journal of Fisheries and
Aquatic Science, 57: 116-124.
Rideout, R. M., and Morgan, M. J. 2007. Major changes in fecundity and the effect on
population egg production for three species of north-west Atlantic flatfishes. Journal of
Fish Biology, 70: 1759-1779.
Rideout, R. M., and Morgan, M. J. 2010. Relationships between maternal body size,
condition and potential fecundity of four north-west Atlantic demersal fishes. Journal
of Fish Biology, 76: 1379-1395.
Rijnsdorp, A. D., and Ibelings, B. 1989. Sexual dimorphism in the energetics of
reproduction and growth of North Sea plaice, Pleuronectes platessa L. Journal of Fish
Biology, 35(3): 401-415.
Rijnsdorp, A. D., Daan, N., Dekker, W., Poos, J. J., and Van Densen, W. L. T. 2007.
Sustainable use of flatfish resources: Addressing the credibility crisis in mixed fisheries
management. Journal of Sea Research, 57(2-3): 114-125.
Rijnsdorp, A. D., and Witthames, P. R. 2005. "Ecology of reproduction." Flatfishes:
Biology and Exploitation, Gibson, R. N., ed., Blackwell Science, Oxford: 391.
Rochet, M.-J., Prigent, M., Bertrand, J. A., Carpentier, A., Coppin, F., Delpech, J.-P.,
Fontenelle, G., Foucher, E., Mahé, K., Rostiaux, E., and Trenkel, V. M. 2008.
Ecosystem trends: evidence for agreement between fishers' perceptions and scientific
information. ICES Journal of Marine Science: Journal du Conseil, 65(6): 1057-1068.
Rochet, M. J. 1998. Short-term effects of fishing on life history traits of fishes. ICES
Journal of Marine Science, 55: 371-391.
Sánchez, F., Perez, N., and Landa, J. 1998. Distribution and abundance of megrim
(Lepidorhombus boscii and Lepidorhombus whiffiagonis) on the northern Spanish shelf.
ICES Journal of Marine Science, 55(3): 494-514.
Santos, P. T. 1994. Growth and reproduction of the population of the four-spot megrim
(Lepidorhombus boscii Risso) off the Portuguese coast. Netherlands Journal of Sea
Research, 32(3-4): 379-383.
215
Scott, B., Marteinsdottir, G., and Wright, P. J. 1999. Potential effects of maternal
factors on spawning stock–recruitment relationships under varying fishing pressure.
Canadian Journal of Fisheries and Aquatic Science, 56: 1882-1890.
Serchuk, F. M., Grosslein, M. D., Lough, R. G., Mountain, D. G., and O'Brien, L. 1994.
Fishery and environmental factors affecting trends and fluctuations in the Georges Bank
and Gulf of Maine Atlantic cod stocks: an overview. ICES Marine Science
Symposium, 198: 77-109.
Shumway, R. H., and Stoffer, D. S. 2006. Time-series analysis and its applications with
R examples. Springer, New York.
Steele, J. H., Baird, I. E., and Johnson, R. 1971. Evidence of upwelling on Rockall
Bank. Deep Sea Research and Oceanographic Abstracts, 18: 261-268.
Stene, A., Gundersen, A. C., Albert, O. T., Nedreaas, K. H., and Solemdal, P. 1999.
Early development of Northeast Arctic Greenland halibut (Reinhardtius
hippoglossoides). Journal of Northwest Atlantic Fisheries Science, 25: 171-177.
Swain, D. P., Hutchings, J. A., and Foote, C. J. 2005. "Environmental and genetic
influences on stock identification characters." Stock Identification Methods:
Applications in Fisheries Science, Cadrin, S. X., Friedland, K. D., and Waldman, J. R.,
eds., Elsevier, London: 45-88.
Thorsen, A., and Kjesbu, O. S. 2001. A rapid method for estimation of oocyte size and
potential fecundity in Atlantic cod using a computer-aided particle analysis system.
Journal of Sea Research, 46(3-4): 295-308.
Thorsen, A., Marshall, C. T., and Kjesbu, O. S. 2006. Comparison of various potential
fecundity models for north-east Arctic cod Gadus morhua, L. using oocyte diameter as
a standardizing factor. Journal of Fish Biology, 69: 1709-1730.
Trenkel, V. M., Pinnegar, J. K., Dawson, W. A., du Buit, M. H., and Tidd, A. N. 2005.
Spatial and temporal structure of predator-prey relationships in the Celtic Sea fish
community. Marine Ecology-Progress Series, 299: 257-268.
Trigueros-Salmeron, J. A., and Ortega-Garcia, S. 2001. Spatial and seasonal variation
of relative abundance of the skipjack tuna Katsuwonus pelamis (Linnaeus, 1758) in the
Eastern Pacific Ocean (EPO) during 1970–1995. Fisheries Research, 49(3): 227-232.
Trippel, E. A. 1999. Estimation of stock reproductive potential: History and challenges
for Canadian gadoid stock assessments. Journal of Northwest Atlantic Fishery Science,
25: 61-81.
Trippel, E. A., and Mork, J. 2003. Correlation analysis of fisheries-induced adaptive
change. In Dieckmann U, Godø OR, Heino M, Mork J (eds) Fisheries-induced
Adaptive Change, Cambridge University Press, Cambridge.
216
Turrell, W. R. 1992. New hypotheses concerning the circulation of the northern North
Sea and its relation to North Sea fish stock recruitment. ICES J. Mar. Sci., 49(1): 107-
123.
Turrell, W. R., Slesser, G., Payne, R., Adams, R. D., and Gillibrand, P. A. 1996.
Hydrography of the East Shetland Basin in relation to decadal North Sea variability.
ICES Journal of Marine Science, 53(6): 899-916.
Tysklind, N., Taylor, M. I., Lyons, B. P., McCarthy, I. D., and Carvalho, G. R. 2009.
Development of 30 microsatellite markers for dab (Limanda limanda L.): a key UK
marine biomonitoring species. Molecular Ecology Resources, 9: 951-955.
UN. 1995. United Nations Conference on Straddling Fish Stocks and Highly Migratory
Fish Stocks.
http://www.un.org/Depts/los/convention_agreements/convention_overview_fish_stocks.
htm.
UN. 2002. World Summit on Sustainable Development (WSSD), Johannesburg, South
Africa. http://www.un.org/jsummit/html/documents/summit_docs.html.
van Oosterhout, C., Hutchinson, W. F., Wills, D. P. M., and Shipley, P. 2004. Micro-
checker: software for identifying and correcting genotyping errors in microsatellite data.
Molecular Ecology Notes, 4: 535-538.
Von Bertalanffy, L. 1938. A quantitative theory of organic growth. Human Biology,
10: 181-213.
Whitehead, P. J. P., Bauchot, M.-L., Hureau, J.-C., Nielsen, J., and Tortonese, E. 1989.
Fishes of the North-eastern Atlantic and the Mediterranean (FNAM). Springer-Verlag,
Berlin.
Wilson, D. C., Raakjær, J., and Degnbol, P. 2006. Local ecological knowledge and
practical fisheries management in the tropics: A policy brief. Marine Policy, 30(6):
794-801.
Wirgin, I. I., and Waldman, J. R. 1994. What DNA can do for you. Fisheries, 19: 16-
27.
Witthames, P. R., Greer Walker, M., Dinis, M. T., and Whiting, C. L. 1995. The
geographic variation in the potential annual fecundity of Dover sole Solea solea (L.)
from European shelf waters during 1991. Netherlands Journal of Sea Research, 34: 45-
58.
Witthames, P. R., Thorsen, A., Murua, H., Saborido-Rey, F., Greenwood, L. N.,
Dominguez, R., Korta, M., and Kjesbu, O. S. 2009. Advances in methods for
determining fecundity: application of the new methods to some marine fishes. Fishery
Bulletin, 107: 148-164.
Wright, P. J. 2013. Methodological challenges to examining the causes of variation in
stock reproductive potential. Fisheries Research, 138(0): 14-22.

217
Zabel, R. W., Harvey, C. J., Katz, S. L., Good, T. P., and Levin, P. S. 2003.
Ecologically Sustainable Yield. American Scientist, 91: 150-157.
Zeileis, A. 2004. Econometric Computing with HC and HAC Covariance Matrix
Estimators. Journal of Statistical Software, 11: 1-17.
Zeileis, A. 2006. Object-oriented Computation of Sandwich Estimators. Journal of
Statistical Software, 16: 1-16.
Zukowski, S., Curtis, A., and Watts, R. J. 2011. Using fisher local ecological
knowledge to improve management: The Murray crayfish in Australia. Fisheries
Research, 110(1): 120-127.
Related Documents