Nucleic Acids Research, 2014 1 doi: 10.1093/nar/gku855 ABC: a systematic microsecond molecular dynamics study of tetranucleotide sequence effects in B-DNA Marco Pasi 1 , John H. Maddocks 1,* , David Beveridge 2 , Thomas C. Bishop 3 , David A. Case 4 , Thomas Cheatham, III 5 , Pablo D. Dans 6,7,8 , B. Jayaram 9 , Filip Lankas 10 , Charles Laughton 11 , Jonathan Mitchell 1 , Roman Osman 12 , Modesto Orozco 6,7,8 , Alberto P ´ erez 6,7,8 , Daiva Petkeviˇ ci¯ ut˙ e 1 , Nada Spackova 13 , Jiri Sponer 13,14 , Krystyna Zakrzewska 15 and Richard Lavery 15 1 Section de Math ´ ematiques, Swiss Federal Institute of Technology (EPFL), CH-1015 Lausanne, Switzerland, 2 Department of Chemistry, Wesleyan University, Middletown, CT 06459, USA, 3 Departments of Chemistry and Physics, Louisiana Tech University, Ruston, LA71270, USA, 4 BioMaPS Institute and Deptartment of Chemistry and Chemical Biology, Rutgers University, 610 Taylor Road, Piscataway, NJ 08854-8087, USA, 5 Department of Medicinal Chemistry, University of Utah, Skaggs 307, Salt Lake City, UT 84112, USA, 6 Joint BSC-CRG-IRB Program on Computational Biology, Institute of Research in Biomedicine, Parc Cient´ ıfic de Barcelona, Josep Samitier 1-5, Barcelona 08028, Spain, 7 Barcelona Supercomputing Centre, Jordi Girona 31, Edifici Torre Girona, Barcelona 08034, Spain, 8 Departament de Bioqu´ ımica, Facultat de Biolog´ ıa, Avgda Diagonal 647, Barcelona 08028, Spain, 9 Department of Chemistry, Indian Instituteof Technology, Hauz Khas, New Delhi 110016, India, 10 Institute of Organic Chemistry and Biochemistry, Academy of Sciences of the Czech Republic, Flemingovo nam. 2, 166 10 Praha 6, Czech Republic, 11 School of Pharmacy and Centre for Biomolecular Sciences, University of Nottingham, NG7 2RD, UK, 12 Department of Structural and Chemical Biology, Mount Sinai School of Medicine, New York, NY 10029, USA, 13 Institute of Biophysics, Academy of Sciences of the Czech Republic, Kralovopolska 135, 612 65 Brno, Czech Republic, 14 CEITEC––Central European Institute of Technology, Masaryk University, Campus Bohunice, Kamenice 5, 625 00 Brno, Czech Republic and 15 Bases Mol ´ eculaires et Structurales des Syst ` emes Infectieux, CNRS UMR 5086/Universit´ e Lyon I, IBCP, 7 Passage du Vercors, 69367 Lyon, France Received July 25, 2014; Revised September 07, 2014; Accepted September 9, 2014 ABSTRACT We present the results of microsecond molecular dy- namics simulations carried out by the ABC group of laboratories on a set of B-DNA oligomers containing the 136 distinct tetranucleotide base sequences. We demonstrate that the resulting trajectories have ex- tensively sampled the conformational space acces- sible to B-DNA at room temperature. We confirm that base sequence effects depend strongly not only on the specific base pair step, but also on the specific base pairs that flank each step. Beyond sequence effects on average helical parameters and conforma- tional fluctuations, we also identify tetranucleotide sequences that oscillate between several distinct conformational substates. By analyzing the confor- mation of the phosphodiester backbones, it is pos- sible to understand for which sequences these sub- states will arise, and what impact they will have on specific helical parameters. INTRODUCTION Once the first single crystal structure of a DNA oligomer was obtained (1,2), it became clear that base sequence could have a significant impact on structure, even within a sin- gle conformational family, such as B-DNA. This finding was of major interest since DNA cannot express its genetic message, be replicated, repaired or packaged within the cell without interacting with proteins. Sequence-dependent conformational variations can be expected to play a signif- icant role in how proteins interact with the double helix, and notably in determining how specifically binding pro- teins recognize their target sites (3–7). Such ‘indirect recog- nition’ processes have now been confirmed in a wide vari- ety of protein–DNA interactions. Similar effects can be ex- pected to play a role in drug–DNA interactions (which in- clude many important anticancer agents) (8) and may also * To whom correspondence should be addressed. Tel: +41 21 693 27 62; Fax: +41 21 693 55 30; Email: john.maddocks@epfl.ch Correspondence may also be addressed to Richard Lavery. Tel: +33 4 72 72 26 37; Fax +33 4 72 72 26 04; Email: [email protected] C The Author(s) 2014. Published by Oxford University Press on behalf of Nucleic Acids Research. This is an Open Access article distributed under the terms of the Creative Commons Attribution License (http://creativecommons.org/licenses/by/4.0/), which permits unrestricted reuse, distribution, and reproduction in any medium, provided the original work is properly cited. Nucleic Acids Research Advance Access published September 26, 2014 by Pablo D. Dans on September 29, 2014 http://nar.oxfordjournals.org/ Downloaded from

Welcome message from author
This document is posted to help you gain knowledge. Please leave a comment to let me know what you think about it! Share it to your friends and learn new things together.
Transcript
Nucleic Acids Research, 2014 1doi: 10.1093/nar/gku855
�ABC: a systematic microsecond molecular dynamicsstudy of tetranucleotide sequence effects in B-DNAMarco Pasi1, John H. Maddocks1,*, David Beveridge2, Thomas C. Bishop3, David A. Case4,Thomas Cheatham, III5, Pablo D. Dans6,7,8, B. Jayaram9, Filip Lankas10, Charles Laughton11,Jonathan Mitchell1, Roman Osman12, Modesto Orozco6,7,8, Alberto Perez6,7,8,Daiva Petkeviciute1, Nada Spackova13, Jiri Sponer13,14, Krystyna Zakrzewska15 andRichard Lavery15
1Section de Mathematiques, Swiss Federal Institute of Technology (EPFL), CH-1015 Lausanne, Switzerland,2Department of Chemistry, Wesleyan University, Middletown, CT 06459, USA, 3Departments of Chemistry andPhysics, Louisiana Tech University, Ruston, LA 71270, USA, 4BioMaPS Institute and Deptartment of Chemistry andChemical Biology, Rutgers University, 610 Taylor Road, Piscataway, NJ 08854-8087, USA, 5Department of MedicinalChemistry, University of Utah, Skaggs 307, Salt Lake City, UT 84112, USA, 6Joint BSC-CRG-IRB Program onComputational Biology, Institute of Research in Biomedicine, Parc Cientıfic de Barcelona, Josep Samitier 1-5,Barcelona 08028, Spain, 7Barcelona Supercomputing Centre, Jordi Girona 31, Edifici Torre Girona, Barcelona08034, Spain, 8Departament de Bioquımica, Facultat de Biologıa, Avgda Diagonal 647, Barcelona 08028, Spain,9Department of Chemistry, Indian Institute of Technology, Hauz Khas, New Delhi 110016, India, 10Institute of OrganicChemistry and Biochemistry, Academy of Sciences of the Czech Republic, Flemingovo nam. 2, 166 10 Praha 6,Czech Republic, 11School of Pharmacy and Centre for Biomolecular Sciences, University of Nottingham, NG7 2RD,UK, 12Department of Structural and Chemical Biology, Mount Sinai School of Medicine, New York, NY 10029, USA,13Institute of Biophysics, Academy of Sciences of the Czech Republic, Kralovopolska 135, 612 65 Brno, CzechRepublic, 14CEITEC––Central European Institute of Technology, Masaryk University, Campus Bohunice, Kamenice 5,625 00 Brno, Czech Republic and 15Bases Moleculaires et Structurales des Systemes Infectieux, CNRS UMR5086/Universite Lyon I, IBCP, 7 Passage du Vercors, 69367 Lyon, France
Received July 25, 2014; Revised September 07, 2014; Accepted September 9, 2014
ABSTRACT
We present the results of microsecond molecular dy-namics simulations carried out by the ABC group oflaboratories on a set of B-DNA oligomers containingthe 136 distinct tetranucleotide base sequences. Wedemonstrate that the resulting trajectories have ex-tensively sampled the conformational space acces-sible to B-DNA at room temperature. We confirm thatbase sequence effects depend strongly not only onthe specific base pair step, but also on the specificbase pairs that flank each step. Beyond sequenceeffects on average helical parameters and conforma-tional fluctuations, we also identify tetranucleotidesequences that oscillate between several distinctconformational substates. By analyzing the confor-mation of the phosphodiester backbones, it is pos-sible to understand for which sequences these sub-
states will arise, and what impact they will have onspecific helical parameters.
INTRODUCTION
Once the first single crystal structure of a DNA oligomerwas obtained (1,2), it became clear that base sequence couldhave a significant impact on structure, even within a sin-gle conformational family, such as B-DNA. This findingwas of major interest since DNA cannot express its geneticmessage, be replicated, repaired or packaged within thecell without interacting with proteins. Sequence-dependentconformational variations can be expected to play a signif-icant role in how proteins interact with the double helix,and notably in determining how specifically binding pro-teins recognize their target sites (3–7). Such ‘indirect recog-nition’ processes have now been confirmed in a wide vari-ety of protein–DNA interactions. Similar effects can be ex-pected to play a role in drug–DNA interactions (which in-clude many important anticancer agents) (8) and may also
*To whom correspondence should be addressed. Tel: +41 21 693 27 62; Fax: +41 21 693 55 30; Email: [email protected] may also be addressed to Richard Lavery. Tel: +33 4 72 72 26 37; Fax +33 4 72 72 26 04; Email: [email protected]
C© The Author(s) 2014. Published by Oxford University Press on behalf of Nucleic Acids Research.This is an Open Access article distributed under the terms of the Creative Commons Attribution License (http://creativecommons.org/licenses/by/4.0/), whichpermits unrestricted reuse, distribution, and reproduction in any medium, provided the original work is properly cited.
Nucleic Acids Research Advance Access published September 26, 2014 by Pablo D
. Dans on Septem
ber 29, 2014http://nar.oxfordjournals.org/
Dow
nloaded from

2 Nucleic Acids Research, 2014
be important in designing superstructures built from DNAin the field now known as DNA origami (9,10).
Accumulated structural data on DNA oligomers haveshown that some sequences have markedly different be-haviors from others, but unfortunately there are still notenough experimental data on isolated, unmodified B-DNAoligomers to be able to generate a complete picture ofsequence-dependent effects. It has, however, become clearthat individual dinucleotide steps can have different con-formational statistics as a function of their tetranucleotidesequence contexts (i.e. their 5′ and 3′ flanking base pairs).As previously explained (11), this does not imply that thesequence dependence of a coarse-grain model of the con-formational free energy of an oligomer need depend uponmore than the overlapping dinucleotide sequence context,and such models can be rather accurate (12). However, itdoes mean that the conformational characteristics of the 10distinct dinucleotide steps embedded in all possible flankingbase pairs, i.e. the conformational statistics of at least the136 distinct tetranucleotides (AAAA, AAAT, AAAC, etc.),must be examined. Interrogating the Nucleic Acid Database(13) for isolated, unmodified B-DNA crystal structures re-solved to at least 2.5 A shows that while some tetranu-cleotides are strongly represented (e.g. CGAA, GAAT, etc.),in only a very few cases are there enough data to guaranteethe statistical significance of any derived average value (14),and half of the tetranucleotides are completely absent (datafrom May 2014).
Given this state of affairs, a group of laboratories cametogether in 2002 with the aim of using molecular simula-tions to create a balanced structural database at the tetranu-cleotide level that would provide a guide to sequence ef-fects both on the structure and on the dynamic propertiesof the B-DNA double helix. This group, termed the As-cona B-DNA Consortium (or ABC for short), began by de-signing an approach for studying the 136 distinct tetranu-cleotides with the least possible computational cost. Theanswer was to design oligomers of the type gc-CD-ABCD-ABCD-ABCD-gc, each containing 3.5 tetranucleotide re-peats (shown in italics) placed between GC termini (shownin lower case, chosen to reduce ‘fraying’), leading to a to-tal of 18 base pairs. This choice meant that all tetranu-cleotides could be packed into only 39 oligomers (since, inthe best cases, one oligomer would contain four differenttetranucleotides: ABCD, BCDA, CDAB, and DABC). In ad-dition, the repeating sequences made it possible to test forconvergence by comparing multiple instances of equivalenttetranucleotides within a single oligomer.
The ABC laboratories have already completed two se-ries of computations using the AMBER suite of programs(15,16) to model DNA oligomers in their natural aque-ous environment (explicitly representing water moleculesand sufficient ions to reach a physiological salt concentra-tion). The first series (17,18), limited to 15 ns trajectoriesfor each oligomer, showed surprisingly important sequence-dependent changes in structure, but also detected problemswith the force field that led to the accumulation of un-usual backbone conformations and increasing helical de-formations. This problem was solved by a limited modifica-tion of the backbone parameters (19) leading to improvedagreement with experiment (20–23) and a second series of
simulations with 50–100 ns trajectories for each oligomer.This study brought to light the existence of oscillations be-tween conformational substates for certain tetranucleotides,where significant changes in helical parameters were cou-pled to changes in backbone torsions (24) (see also (14)).Given the timescale of these oscillations, it became clearthat longer trajectories were necessary to correctly sam-ple the large conformational space available to B-DNA atroom temperature. The availability of better computationalresources made this aim possible, and we are now able topresent the results of simulations that have been extendedto at least one microsecond for each of the 39 oligomers.Even with today’s computational facilities, this represents asignificant investment leading to a total of roughly 60 �s oftrajectories and 9 Tb of data, including more than 35 mil-lion conformational snapshots.
As part of the ABC project, we have also developed tools(notably Curves+ and Canal) for analyzing not only indi-vidual nucleic acid structures, but also long molecular dy-namics trajectories (25,26). Several refinements have beenmade to these tools as a result of the study presented hereand these are discussed in the Materials and Methods sec-tion. A further development involves analyzing ion distribu-tions using curvilinear helicoidal coordinates (27). Its appli-cation to the present set of trajectories will be the subject ofa separate publication.
The results from this new series of simulations represent asignificant step toward the main ABC goal, namely under-standing base-sequence effects on B-DNA. First, the tra-jectories sample the B-DNA conformational basin muchmore thoroughly than any previous work. They confirmthat many sequences occupy more than one conformationalsubstate at room temperature, and that these substates canhave dramatically different helical parameters. They showthat base sequence modifies DNA fluctuations, but in a se-lective manner, often affecting only one, or a small subset, ofhelical parameters. Lastly, building on recent work studyingthe conformational behavior of specifically the CpG din-ucleotide step (28), they provide better understanding ofthe mechanisms that lead to multiple substates and clar-ify in which cases substates will arise. Taken together, thesemicrosecond trajectories not only provide insight into theconformational mechanics of B-DNA, but also constitutea valuable resource for developing coarse-grain models ofdouble-helical DNA.
MATERIALS AND METHODS
The results discussed in this article are based on molecu-lar dynamics trajectories for 39 double-stranded B-DNAoligomers, each containing 18 base pairs. The sequence ofeach oligomer is constructed in the same way: 5′-gc-CD-ABCD-ABCD-ABCD-gc-3′, where upper case letters indi-cate sequences that vary between oligomers and lower caseletters indicate fixed sequences (dashes have been added forclarity). Every oligomer contains a four base pair sequence,ABCD, that is repeated three and a half times. This sequenceis used as the name for each oligomer. The full list of the39 oligomers is given in Supplementary Table S1. Takentogether, these oligomers contain all 136 distinct tetranu-cleotide sequences as shown in the table.
by Pablo D. D
ans on September 29, 2014
http://nar.oxfordjournals.org/D
ownloaded from
Nucleic Acids Research, 2014 3
Molecular dynamics simulations on the oligomers werecarried out with periodic boundary conditions within atruncated octahedral cell using the AMBER suite of pro-grams (15,16) with the parmbsc0 modifications (19) to theparm99 force field (16,29), Dang parameters (30) for theions and SPC/E water (31). Each oligomer was neutralizedwith 34 potassium ions and then an appropriate number ofK+Cl− ion pairs were added to reach a salt concentrationof 150 mM. Ions were initially placed at random within thesimulation cell, but at least 5 A from DNA and at least 3.5A from one another. The complex was then solvated witha layer of water at least 10 A thick. A typical simulationinvolved ∼11 500 water molecules and 37 000 atoms in to-tal. Electrostatic interactions were treated using the parti-cle mesh Ewald method (32) with a real-space cutoff of 9 Aand cubic B-spline interpolation onto the charge grid with aspacing of 1 A. Lennard–Jones interactions were truncatedat 9 A and the pair list was built with a buffer region and atriggered list update whenever a particle moved more than0.5 A from the previous update.
During the preceding ABC project, at least 50 ns trajec-tories were obtained for each of the 39 oligomers (24). Thisinvolved constructing each oligomer in a canonical B-DNAconformation, equilibrating the system by energy minimiza-tion of the solvent, and then of the solute and solvent to-gether, followed by a slow thermalization, following the pro-tocol described earlier (17,18,24). Simulations were carriedout using an NPT ensemble, using the Berendsen algorithm(33) to control temperature and pressure, with a couplingconstant of 5 ps for both parameters. All chemical bonds in-volving hydrogen atoms were restrained using SHAKE (34),allowing for stable simulations with a 2 fs time step. Centerof mass motion was removed every 5000 steps to avoid ki-netic energy building up in translational motion (35) and tokeep the solute centered in the simulation cell. The end ofthe 50 ns simulations was used as the starting point for thecurrent ABC project where each trajectory was extended to1 �s. In the present work, we treat the first 100 ns of the tra-jectories as an extended equilibration period and analyzeonly the remaining 900 ns of simulation. Conformationalsnapshots were saved from each trajectory at 1 ps intervals,leading to a database of 35 million snapshots which repre-sents 9 Tb of data including solvent and 300 Gb if the watermolecules are removed.
The first stage of conformational analysis was performedusing Curves+ (25), which provides a full set of helical,backbone and groove geometry parameters. Curves+ usesthe commonly agreed ‘Tsukuba’ reference frame to describeeach base (36) and respects the Cambridge convention forthe names and signs of all helical parameters (37). Parame-ters are grouped into five sets: (i) intra-base pair, or intra-BPfor short (shear, stretch, stagger, buckle, propeller, opening);(ii) BP-axis (Xdisp, Ydisp, inclination and tip); (iii) inter-BP(shift, slide, rise, tilt, roll, twist); (iv) backbone (in the 5′→3′direction for each nucleotide, � P-O5′, � O5′-C5′, � C5′-C4′, � C4′-C3′, � C3′-O3′, � O3′-P, the glycosidic angle C1′-N1/N9 and the sugar pucker phase and amplitude); (v)groove (minor and major groove widths and depths). Notethat the rise and twist discussed in this article are the param-eters derived from the matrix transformation between twobase pair reference frames. Curves+ also calculates these pa-
rameters as a translation and a rotation around the helicalaxis, but, in the case of B-DNA, the difference between thetwo sets of parameters is not significant. The reader is re-ferred to a previous publication for further details (25) (and,notably, to Supplementary Figure S1 of the correspondingsupplementary material which illustrates all the helical pa-rameters).
We also remark that when we consider the conformationor the dynamics of a given sequence fragment, we only dis-cuss the conformational parameters connected with the cen-ter of the fragment. Thus, if the fragment contains an oddnumber of base pairs, we discuss the central base pair interms of intra-BP, BP-axis and groove dimensions, as wellas those parts of the backbone directly associated with thisbase pair (glycosidic torsions and sugar pucker). If the frag-ment contains an even number of base pairs, we discuss thecentral base pair step in terms of the inter-BP parametersand the backbone torsions integral to the base pair step (inthe 5′-3′ direction for each strand: �, � , �, � and � ). AllCurves+ parameters are output in a file containing a sin-gle record for each snapshot in each oligomer. These fileswere then analyzed with the program Canal to obtain sta-tistical data on all parameters, as well as time series, pa-rameter distributions (in the form of histograms) and tosearch for correlations between parameters. Canal is usedhere to analyze individual trajectories and to make cumu-lative analyses over many trajectories. The present versionsof Curves+, Canal and other related software are availableat http://bisi.ibcp.fr/tools/curves plus/.
Note that earlier versions of Canal calculated cross-correlations using standard algorithms for linear variables.These can be applied to angles if their range is small. How-ever, for long simulations of DNA it is necessary to use for-mulae adapted to circular variables for backbone dihedrals(and, for security, rotational helical parameters). There ex-ist a number of methods to estimate circular correlation (seefor example (38–40), and references therein). Since we needto discriminate positive and negative correlation, and re-quire values that are consistent with the Pearson correla-tion coefficients used for linear variables, we have excludedrank-based approaches. We chose the T-linear associationmeasure ρT proposed by Fisher (38) that is robust and canbe coded as a single pass algorithm (in common with theother analyses in Canal), which is essential for treating longtrajectories. For these calculations, linear variables x, mea-sured in angstroms, are converted to angles θx = tan−1 x
5 ,where, as discussed for example in (11), 5 A is an appro-priate length scaling between angular and linear variables.Circular–circular and circular–linear correlation measurescalculated in this way are very close to the Pearson correla-tion coefficient when its use is justified for angular variables,namely when the angles are distributed over a narrow range.
Remarks on nomenclature and Watson–Crick symmetry
Following the conventions established in our prior work(17,18,24), sequence fragments in double-stranded DNAare always written in the 5′-3′ direction as a simple string ofletters (e.g. the tetranucleotide ACGT, or the dinucleotidestep CG) along one of the two backbones, which we des-ignate as the Watson strand. As we assume canonical base
by Pablo D. D
ans on September 29, 2014
http://nar.oxfordjournals.org/D
ownloaded from
4 Nucleic Acids Research, 2014
pairing throughout, the sequence along the Crick strand isimmediately implied, and is again always given in the (anti-parallel) 5′-3′ direction. Note that for the Curves+ (25) he-lical parameters adopted here, and for any configuration,changing the choice of the Watson strand re-orders the vari-ables and switches the signs of four helical variables: shift,tilt, shear and buckle, while leaving the other eight intra-and inter-helical parameters unchanged. We exploit thispoint later. If we want to refer to dinucleotide step helicalparameters within a longer sequence, we use an underlineto indicate the step in question (e.g. ACGT). The letter R isused to indicate a purine, i.e. adenine A or guanine G, whileY indicates a pyrimidine, cytosine C or thymine T, and Xindicates either R or Y, i.e. any of the four possible bases.When we refer to the base pairs flanking a dinucleotide step,we separate them by two dots (e.g. R..Y).
Note that there are three distinct dinucleotide stepsin the pyrimidine/purine sequence alphabet, namely twoself-symmetric steps YR and RY, and the non-symmetricRR/YY step. Similarly with the full (A,T,C,G) base al-phabet, there are 10 distinct dinucleotide steps, four self-symmetric steps (AT, TA, CG, and GC) and six pairs ofnon-symmetric steps (AA/TT, GG/CC, AG/CT, GA/TC,GT/AC, and TG/CA). Following our previous work, wechoose to label the 10 distinct steps as AA, AT, TA, GG,GC, CG, GA, AG, GT, and TG (by convention using the la-bel with the most purines, and, if this is balanced, by choos-ing G in preference to A). Note that the choice of namesfor the six non-symmetric dinucleotides privileges one of thetwo junction backbones, which we will accordingly describeas the Watson backbone.
The analogous counts for tetranucleotides are slightly lessfamiliar. With a purine/pyrimidine alphabet there are 10physically distinct tetranucleotides, four self-symmetric (e.g.YRYR) and six non-symmetric pairs (e.g. RRYR/YRYY).With the full (A,T,C,G) alphabet there are 136 distincttetranucleotides, 16 self-symmetric and 120 non-symmetricpairs. The choice of naming of the non-symmetric pairs isdetailed in Supplementary Table S1. These tetranucleotidescan also be grouped in terms of their central dinucleotidesteps. For each of the four self-symmetric dinucleotide steps,there are 10 distinct choices of the flanking base pairs (fourof the form R..R and three of the R..Y and Y..R forms).For each of the six non-symmetric dinucleotide steps, thereare 16 choices of flanking base pairs (four in each of theR..R, R..Y, Y..R, and Y..Y families). In the following, un-less otherwise indicated, information on the 136 distincttetranucleotides is always extracted from the centermost oc-currence of each tetranucleotide in the relevant oligomersimulation (e.g. TACG refers to positions 8, 9, 10 and 11 ofoligomer 5′-gc-GTACGTACGTACGT-gc-3′, and so on).
RESULTS AND DISCUSSION
Convergence and sequence-averaged conformations
We begin by discussing the convergence of the microsecondsimulations. As explained above, the initial design of theABC oligomers was chosen so that the 136 distinct tetranu-cleotide sequences could be packed into a minimum num-ber of oligomers. This choice has the additional advantagethat each tetranucleotide occurs several times within each
oligomer and thus differences between the average confor-mations of the repeating sequence elements can be used asa test for conformational convergence. The results shown inSupplementary Figures S1 and S2 compare the helical andbackbone parameters for two tetranucleotides with identi-cal sequences near the center of the oligomers (positions 6–9and 10–13). The differences between the average parame-ters vary between oligomers, but even in the worst cases arewithin 0.25 A for translational helical parameters, within 2◦for rotational helical parameters, and within 5◦ for back-bone dihedrals and sugar puckers and, in most cases, theyare less than half these values.
Next we consider the time convergence of the simulations.Supplementary Figures S3 and S4 present the results for twooligomers by comparing average helical and backbone pa-rameters calculated for the first or second half of a trajec-tory with those calculated over the full trajectory. The re-sults again show good convergence with small differencesbetween the average parameters. The worst cases show dif-ferences limited to less than 0.1 A for translational helicalparameters, less than 2◦ for rotational helical parameters,and 3◦ for backbone dihedrals and sugar puckers, with theexception of � (C3′-O3′) and � (O3′-P) which can, in rarecases, reach 8◦ (see the discussion below). We remark inpassing that a preliminary analysis of ion distributions fortwo of this set of ABC trajectories also shows that these dis-tributions are stabilized within the microsecond timescale(27).
These results suggest that the microsecond trajectoriesare well converged with respect to the conformational spaceaccessible to B-DNA oligomers at room temperature. Asdiscussed below, this timescale allows for significant con-formational fluctuations in both helical and backbone pa-rameters, including the temporary loss of base pairing, par-ticularly for the two or three base pairs at the ends of theoligomers, but also (transiently) for the more central basepairs. As we will discuss below, many of the oligomers ex-hibit multiple conformational substates involving specificconformational transitions. However, if we average over allthe 39 oligomers, the overall structure resembles what is ex-pected for a canonical B-DNA double helix as shown in Ta-ble 1 (where the results are averaged over the central basepair steps of the 136 distinct tetranucleotide sequences).These results are also very similar to the averages obtainedfrom our earlier work with 50 ns trajectories (24). The av-erage B-DNA structure shows relatively little deformationwith respect to planar Watson–Crick base pairs, apart froman 11◦ propeller twist. The base pairs are on average inclinedby 7◦ to the helical axis, shifted 1.5 A toward the minorgroove and show a small negative slide and positive roll.We remark that the average helical twist (32.5◦), althoughimproved by the BSC0 corrections to the force field (19), is1◦–2◦ lower than the estimated average solution value.
Concerning conformational fluctuations, the columnsminimum, maximum and range (the translational or angu-lar extent covered by each parameter) of Table 1 show theimpressive flexibility of DNA on the microsecond timescale.Note that, to avoid unrealistic values for the inter-BP pa-rameters, we have filtered the snapshots to remove any suchparameters involving base pairs with one or more brokenWatson–Crick hydrogen bonds (i.e. with a distance between
by Pablo D. D
ans on September 29, 2014
http://nar.oxfordjournals.org/D
ownloaded from
Nucleic Acids Research, 2014 5
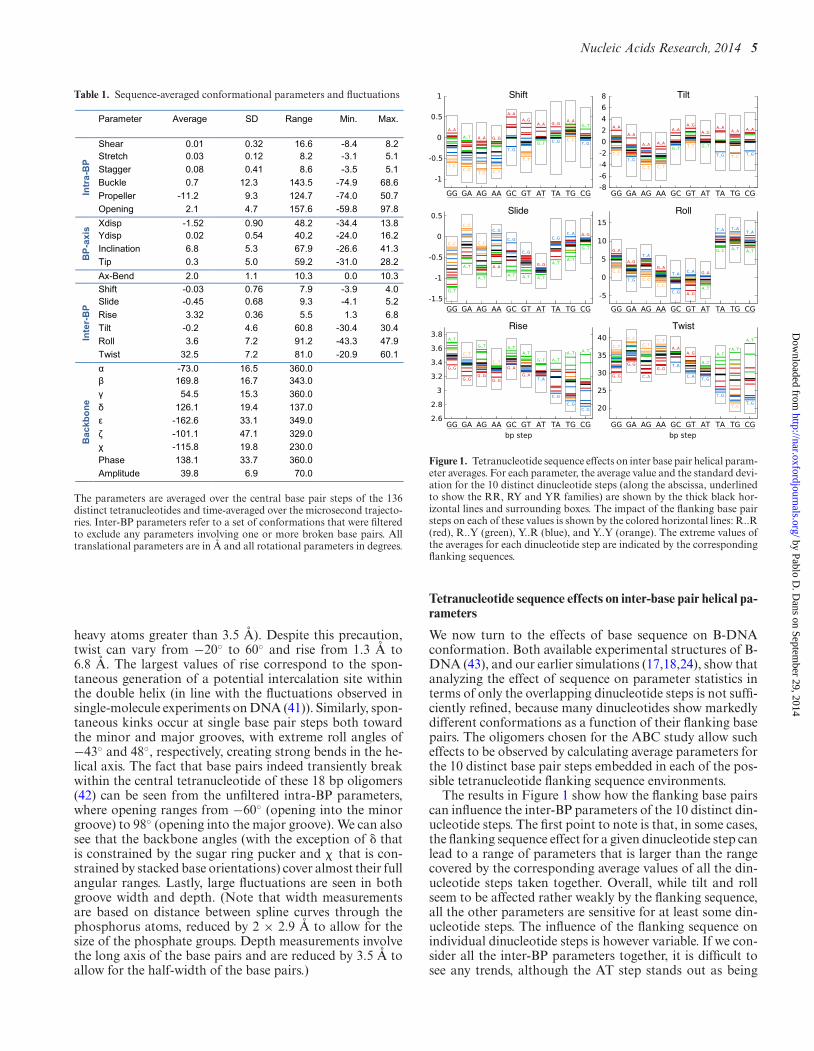
Table 1. Sequence-averaged conformational parameters and fluctuations
Parameter Average SD Range Min. Max.
Intra-BP
Shear 0.01 0.32 16.6 -8.4 8.2Stretch 0.03 0.12 8.2 -3.1 5.1Stagger 0.08 0.41 8.6 -3.5 5.1Buckle 0.7 12.3 143.5 -74.9 68.6Propeller -11.2 9.3 124.7 -74.0 50.7Opening 2.1 4.7 157.6 -59.8 97.8
BP-axis
Xdisp -1.52 0.90 48.2 -34.4 13.8Ydisp 0.02 0.54 40.2 -24.0 16.2Inclination 6.8 5.3 67.9 -26.6 41.3Tip 0.3 5.0 59.2 -31.0 28.2Ax-Bend 2.0 1.1 10.3 0.0 10.3
Inter-BP
Shift -0.03 0.76 7.9 -3.9 4.0Slide -0.45 0.68 9.3 -4.1 5.2Rise 3.32 0.36 5.5 1.3 6.8Tilt -0.2 4.6 60.8 -30.4 30.4Roll 3.6 7.2 91.2 -43.3 47.9Twist 32.5 7.2 81.0 -20.9 60.1
Backbone
α -73.0 16.5 360.0β 169.8 16.7 343.0γ 54.5 15.3 360.0δ 126.1 19.4 137.0ε -162.6 33.1 349.0ζ -101.1 47.1 329.0χ -115.8 19.8 230.0Phase 138.1 33.7 360.0Amplitude 39.8 6.9 70.0
The parameters are averaged over the central base pair steps of the 136distinct tetranucleotides and time-averaged over the microsecond trajecto-ries. Inter-BP parameters refer to a set of conformations that were filteredto exclude any parameters involving one or more broken base pairs. Alltranslational parameters are in A and all rotational parameters in degrees.
heavy atoms greater than 3.5 A). Despite this precaution,twist can vary from −20◦ to 60◦ and rise from 1.3 A to6.8 A. The largest values of rise correspond to the spon-taneous generation of a potential intercalation site withinthe double helix (in line with the fluctuations observed insingle-molecule experiments on DNA (41)). Similarly, spon-taneous kinks occur at single base pair steps both towardthe minor and major grooves, with extreme roll angles of−43◦ and 48◦, respectively, creating strong bends in the he-lical axis. The fact that base pairs indeed transiently breakwithin the central tetranucleotide of these 18 bp oligomers(42) can be seen from the unfiltered intra-BP parameters,where opening ranges from −60◦ (opening into the minorgroove) to 98◦ (opening into the major groove). We can alsosee that the backbone angles (with the exception of � thatis constrained by the sugar ring pucker and that is con-strained by stacked base orientations) cover almost their fullangular ranges. Lastly, large fluctuations are seen in bothgroove width and depth. (Note that width measurementsare based on distance between spline curves through thephosphorus atoms, reduced by 2 × 2.9 A to allow for thesize of the phosphate groups. Depth measurements involvethe long axis of the base pairs and are reduced by 3.5 A toallow for the half-width of the base pairs.)
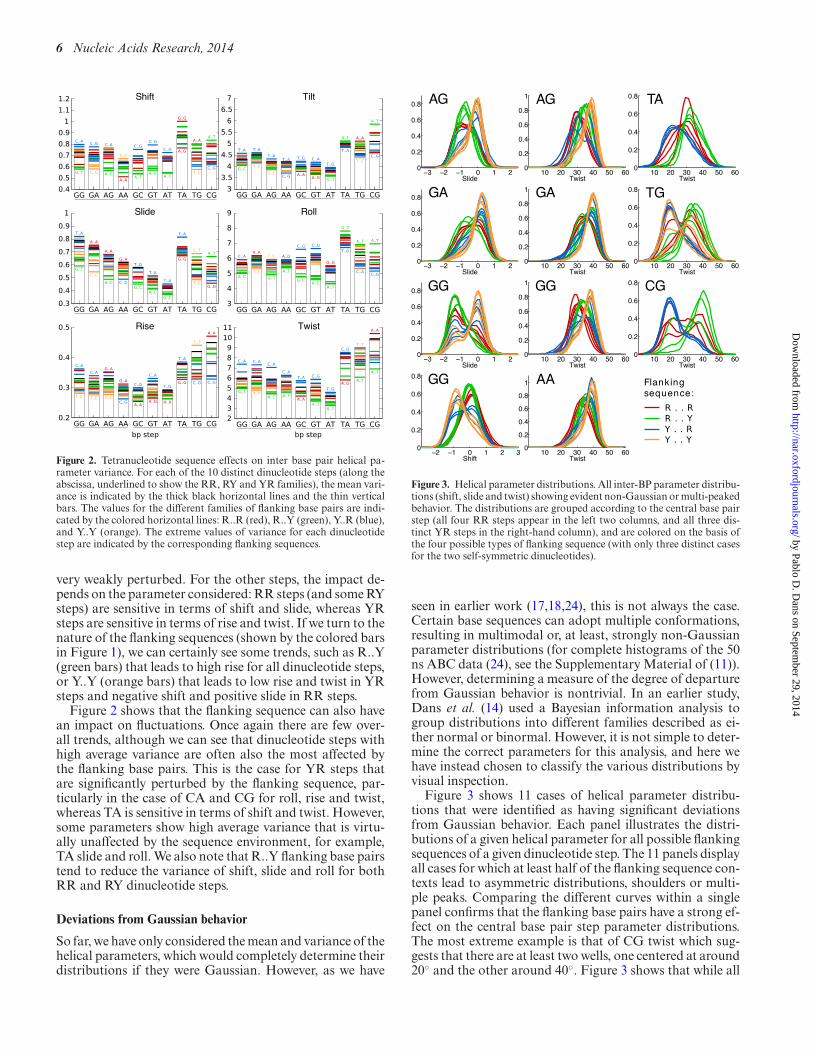
Figure 1. Tetranucleotide sequence effects on inter base pair helical param-eter averages. For each parameter, the average value and the standard devi-ation for the 10 distinct dinucleotide steps (along the abscissa, underlinedto show the RR, RY and YR families) are shown by the thick black hor-izontal lines and surrounding boxes. The impact of the flanking base pairsteps on each of these values is shown by the colored horizontal lines: R..R(red), R..Y (green), Y..R (blue), and Y..Y (orange). The extreme values ofthe averages for each dinucleotide step are indicated by the correspondingflanking sequences.
Tetranucleotide sequence effects on inter-base pair helical pa-rameters
We now turn to the effects of base sequence on B-DNAconformation. Both available experimental structures of B-DNA (43), and our earlier simulations (17,18,24), show thatanalyzing the effect of sequence on parameter statistics interms of only the overlapping dinucleotide steps is not suffi-ciently refined, because many dinucleotides show markedlydifferent conformations as a function of their flanking basepairs. The oligomers chosen for the ABC study allow sucheffects to be observed by calculating average parameters forthe 10 distinct base pair steps embedded in each of the pos-sible tetranucleotide flanking sequence environments.
The results in Figure 1 show how the flanking base pairscan influence the inter-BP parameters of the 10 distinct din-ucleotide steps. The first point to note is that, in some cases,the flanking sequence effect for a given dinucleotide step canlead to a range of parameters that is larger than the rangecovered by the corresponding average values of all the din-ucleotide steps taken together. Overall, while tilt and rollseem to be affected rather weakly by the flanking sequence,all the other parameters are sensitive for at least some din-ucleotide steps. The influence of the flanking sequence onindividual dinucleotide steps is however variable. If we con-sider all the inter-BP parameters together, it is difficult tosee any trends, although the AT step stands out as being
by Pablo D. D
ans on September 29, 2014
http://nar.oxfordjournals.org/D
ownloaded from
6 Nucleic Acids Research, 2014
Figure 2. Tetranucleotide sequence effects on inter base pair helical pa-rameter variance. For each of the 10 distinct dinucleotide steps (along theabscissa, underlined to show the RR, RY and YR families), the mean vari-ance is indicated by the thick black horizontal lines and the thin verticalbars. The values for the different families of flanking base pairs are indi-cated by the colored horizontal lines: R..R (red), R..Y (green), Y..R (blue),and Y..Y (orange). The extreme values of variance for each dinucleotidestep are indicated by the corresponding flanking sequences.
very weakly perturbed. For the other steps, the impact de-pends on the parameter considered: RR steps (and some RYsteps) are sensitive in terms of shift and slide, whereas YRsteps are sensitive in terms of rise and twist. If we turn to thenature of the flanking sequences (shown by the colored barsin Figure 1), we can certainly see some trends, such as R..Y(green bars) that leads to high rise for all dinucleotide steps,or Y..Y (orange bars) that leads to low rise and twist in YRsteps and negative shift and positive slide in RR steps.
Figure 2 shows that the flanking sequence can also havean impact on fluctuations. Once again there are few over-all trends, although we can see that dinucleotide steps withhigh average variance are often also the most affected bythe flanking base pairs. This is the case for YR steps thatare significantly perturbed by the flanking sequence, par-ticularly in the case of CA and CG for roll, rise and twist,whereas TA is sensitive in terms of shift and twist. However,some parameters show high average variance that is virtu-ally unaffected by the sequence environment, for example,TA slide and roll. We also note that R..Y flanking base pairstend to reduce the variance of shift, slide and roll for bothRR and RY dinucleotide steps.
Deviations from Gaussian behavior
So far, we have only considered the mean and variance of thehelical parameters, which would completely determine theirdistributions if they were Gaussian. However, as we have
Figure 3. Helical parameter distributions. All inter-BP parameter distribu-tions (shift, slide and twist) showing evident non-Gaussian or multi-peakedbehavior. The distributions are grouped according to the central base pairstep (all four RR steps appear in the left two columns, and all three dis-tinct YR steps in the right-hand column), and are colored on the basis ofthe four possible types of flanking sequence (with only three distinct casesfor the two self-symmetric dinucleotides).
seen in earlier work (17,18,24), this is not always the case.Certain base sequences can adopt multiple conformations,resulting in multimodal or, at least, strongly non-Gaussianparameter distributions (for complete histograms of the 50ns ABC data (24), see the Supplementary Material of (11)).However, determining a measure of the degree of departurefrom Gaussian behavior is nontrivial. In an earlier study,Dans et al. (14) used a Bayesian information analysis togroup distributions into different families described as ei-ther normal or binormal. However, it is not simple to deter-mine the correct parameters for this analysis, and here wehave instead chosen to classify the various distributions byvisual inspection.
Figure 3 shows 11 cases of helical parameter distribu-tions that were identified as having significant deviationsfrom Gaussian behavior. Each panel illustrates the distri-butions of a given helical parameter for all possible flankingsequences of a given dinucleotide step. The 11 panels displayall cases for which at least half of the flanking sequence con-texts lead to asymmetric distributions, shoulders or multi-ple peaks. Comparing the different curves within a singlepanel confirms that the flanking base pairs have a strong ef-fect on the central base pair step parameter distributions.The most extreme example is that of CG twist which sug-gests that there are at least two wells, one centered at around20◦ and the other around 40◦. Figure 3 shows that while all
by Pablo D. D
ans on September 29, 2014
http://nar.oxfordjournals.org/D
ownloaded from

Nucleic Acids Research, 2014 7
CG twist distributions sample both wells, the relative pop-ulation of the two states is strongly affected by the flankingsequence. In particular Y..R flanking sequences (plotted inblue) lead CG steps to prefer low-twist values, while R..Yflanking sequences (green) favor high twists, and R..R se-quences (red) leave the CG step free to sample both stateswith more uniform frequencies (see also (28)). Similar be-haviors can be observed in the other panels of Figure 3 forthe twist, shift and slide distributions of the other indicatedcentral dinucleotide steps.
It should be stressed that each distribution plotted in Fig-ure 3 concerns the inter-BP parameters of a single base pairstep (within a single tetranucleotide fragment of a givenoligomer); therefore, their non-Gaussian, or multi-peaked,character reflects the existence of multiple substates and nota sequence-averaged behavior. This behavior is thereforedistinct from the well-known property of certain base pairsteps (notably YR steps, see, for example (44,45)) to adoptdifferent conformations within different sequence contexts.Several examples of the underlying conformational transi-tions we observe are illustrated with helical parameter timeseries in Supplementary Figure S5. It is interesting to notethat our finding has found experimental support in recenthigh-resolution X-ray structures that indeed reveal multipleconformations of the B-DNA oligomer CCAGGCCTGGwithin a single crystal involving both the backbone and he-lical parameters (notably slide) (46).
The conclusions of our analysis are summarized in Fig-ure 4 and can be compared with the results of Danset al. (14) in Supplementary Figure S6. The results are: (i)strongly non-Gaussian distributions do not arise at all inRY steps, and are restricted to shift for GG steps, slide forall RR steps, and twist for all RR and YR steps. The otherthree inter-BP, as well as all intra-BP, parameters do not sig-nificantly deviate from Gaussian behavior in any sequencecontext; (ii) only GG slide and CG twist show clear mul-tiple peaks. We remark that while our analysis has identi-fied tetranucleotide fragments whose central base pair stepsinterconvert between multiple conformational substates, itcertainly does not rule out the possibility that other frag-ments can also have multiple substates, but with popula-tions that are difficult to distinguish using only helical pa-rameter distributions.
Tetranucleotide sequence effects on backbone conformations
We can now turn to an analysis of DNA backbone param-eters and, in particular, to the � (C3′-O3′) and � (O3′-P) di-hedrals that have already been shown to play an importantrole in defining B-DNA conformational substates (24,47–49). The reason for this is that backbone dihedrals prefer-ably occupy distinct conformations, gauche+ (g+), gauche−(g–) or trans (t), which represent minima of the correspond-ing torsional energy. In the case of � and � , which lie onthe 3′-side of each deoxyribose sugar, transitions tend tobe coupled and favor the combinations (� = t)/(� = g–),known as BI and characteristic of canonical B-DNA, or (�= g–)/(� = t), known as BII. The base stacking preferencesof a given dinucleotide step can favor a BI/BII transition,leading to a discrete conformational substate reflected notonly in the phosphodiester backbone, but also in the local
Figure 4. Non-Gaussian and multi-peaked helical parameter distributions.(a) Probability distributions of the inter-BP parameters for the centralbase pair step of the 136 distinct tetranucleotide sequences were inspectedfor visible deviations from Gaussian behavior. Helical parameters classedas ‘Multi-peaked’ (red) have two distinct peaks in their distributions formost flanking sequences. Monomodal distributions with obvious devia-tions from normality (such as pronounced shoulders or asymmetry) formost flanking sequences are classed as ‘Non-Gaussian’ (orange). The re-sults are grouped on the basis of the purine/pyrimidine family of the din-ucleotide step. Examples of parameter distributions (see also Figure 3) areshown for the twist of AGCA ((b), multi-peaked) and the shift of TGGT((c), non-Gaussian).
Figure 5. Sequence dependence of BII backbone conformations. The per-centage occurrence of BII backbone states for the phosphodiester junctionof each of the 10 distinct base pair steps is shown. For each step, the resultsfor the Watson and Crick strands are plotted as colored bars on the left andright of the vertical black line (for self-complementary steps, GC, AT, TAand CG, the two strands are indistinguishable and only one column of re-sults is plotted). Each bar refers to one of the 136 distinct tetranucleotidefragments, colored according to its sequence on the Watson strand.
helical parameters. In fact, not only the nature of the dinu-cleotide steps, but also the nature of their flanking sequencesstrongly influence the proportion of neighboring BI and BIIconformations. This is illustrated in Figure 5 (see also Sup-
by Pablo D. D
ans on September 29, 2014
http://nar.oxfordjournals.org/D
ownloaded from
8 Nucleic Acids Research, 2014
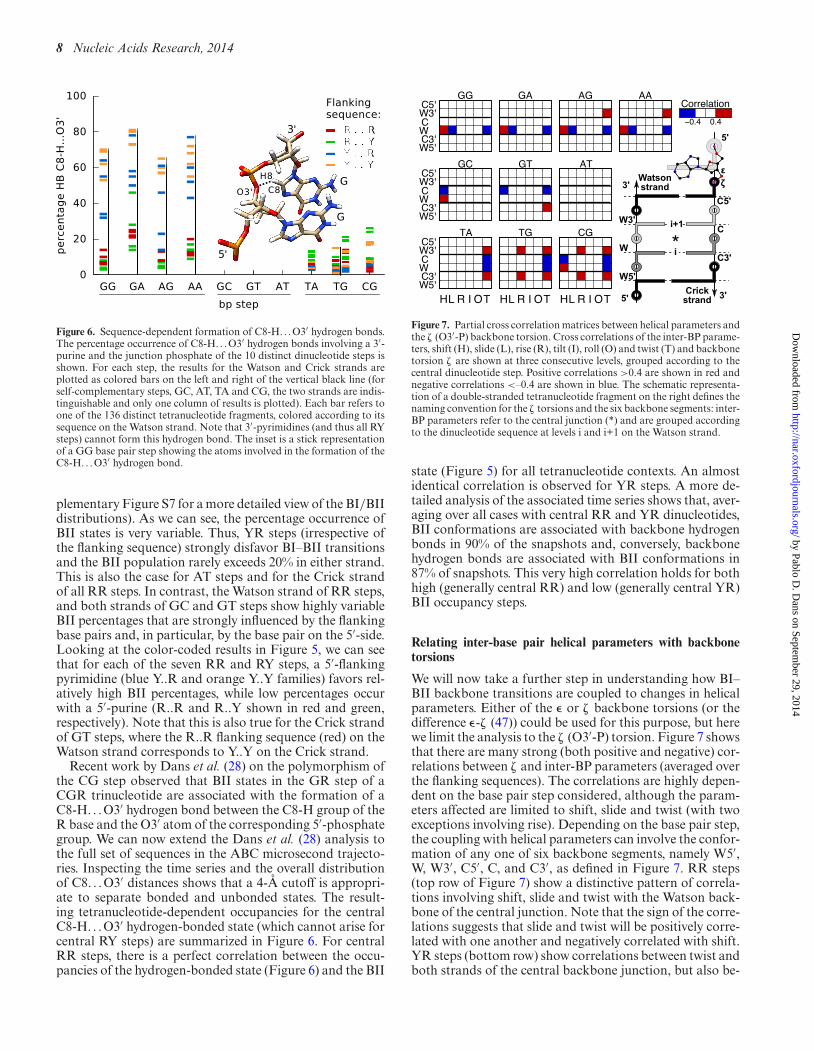
Figure 6. Sequence-dependent formation of C8-H. . . O3′ hydrogen bonds.The percentage occurrence of C8-H. . . O3′ hydrogen bonds involving a 3′-purine and the junction phosphate of the 10 distinct dinucleotide steps isshown. For each step, the results for the Watson and Crick strands areplotted as colored bars on the left and right of the vertical black line (forself-complementary steps, GC, AT, TA and CG, the two strands are indis-tinguishable and only one column of results is plotted). Each bar refers toone of the 136 distinct tetranucleotide fragments, colored according to itssequence on the Watson strand. Note that 3′-pyrimidines (and thus all RYsteps) cannot form this hydrogen bond. The inset is a stick representationof a GG base pair step showing the atoms involved in the formation of theC8-H. . . O3′ hydrogen bond.
plementary Figure S7 for a more detailed view of the BI/BIIdistributions). As we can see, the percentage occurrence ofBII states is very variable. Thus, YR steps (irrespective ofthe flanking sequence) strongly disfavor BI–BII transitionsand the BII population rarely exceeds 20% in either strand.This is also the case for AT steps and for the Crick strandof all RR steps. In contrast, the Watson strand of RR steps,and both strands of GC and GT steps show highly variableBII percentages that are strongly influenced by the flankingbase pairs and, in particular, by the base pair on the 5′-side.Looking at the color-coded results in Figure 5, we can seethat for each of the seven RR and RY steps, a 5′-flankingpyrimidine (blue Y..R and orange Y..Y families) favors rel-atively high BII percentages, while low percentages occurwith a 5′-purine (R..R and R..Y shown in red and green,respectively). Note that this is also true for the Crick strandof GT steps, where the R..R flanking sequence (red) on theWatson strand corresponds to Y..Y on the Crick strand.
Recent work by Dans et al. (28) on the polymorphism ofthe CG step observed that BII states in the GR step of aCGR trinucleotide are associated with the formation of aC8-H. . .O3′ hydrogen bond between the C8-H group of theR base and the O3′ atom of the corresponding 5′-phosphategroup. We can now extend the Dans et al. (28) analysis tothe full set of sequences in the ABC microsecond trajecto-ries. Inspecting the time series and the overall distributionof C8. . .O3′ distances shows that a 4-A cutoff is appropri-ate to separate bonded and unbonded states. The result-ing tetranucleotide-dependent occupancies for the centralC8-H. . .O3′ hydrogen-bonded state (which cannot arise forcentral RY steps) are summarized in Figure 6. For centralRR steps, there is a perfect correlation between the occu-pancies of the hydrogen-bonded state (Figure 6) and the BII
Figure 7. Partial cross correlation matrices between helical parameters andthe � (O3′-P) backbone torsion. Cross correlations of the inter-BP parame-ters, shift (H), slide (L), rise (R), tilt (I), roll (O) and twist (T) and backbonetorsion � are shown at three consecutive levels, grouped according to thecentral dinucleotide step. Positive correlations >0.4 are shown in red andnegative correlations <–0.4 are shown in blue. The schematic representa-tion of a double-stranded tetranucleotide fragment on the right defines thenaming convention for the � torsions and the six backbone segments: inter-BP parameters refer to the central junction (*) and are grouped accordingto the dinucleotide sequence at levels i and i+1 on the Watson strand.
state (Figure 5) for all tetranucleotide contexts. An almostidentical correlation is observed for YR steps. A more de-tailed analysis of the associated time series shows that, aver-aging over all cases with central RR and YR dinucleotides,BII conformations are associated with backbone hydrogenbonds in 90% of the snapshots and, conversely, backbonehydrogen bonds are associated with BII conformations in87% of snapshots. This very high correlation holds for bothhigh (generally central RR) and low (generally central YR)BII occupancy steps.
Relating inter-base pair helical parameters with backbonetorsions
We will now take a further step in understanding how BI–BII backbone transitions are coupled to changes in helicalparameters. Either of the � or � backbone torsions (or thedifference �-� (47)) could be used for this purpose, but herewe limit the analysis to the � (O3′-P) torsion. Figure 7 showsthat there are many strong (both positive and negative) cor-relations between � and inter-BP parameters (averaged overthe flanking sequences). The correlations are highly depen-dent on the base pair step considered, although the param-eters affected are limited to shift, slide and twist (with twoexceptions involving rise). Depending on the base pair step,the coupling with helical parameters can involve the confor-mation of any one of six backbone segments, namely W5′,W, W3′, C5′, C, and C3′, as defined in Figure 7. RR steps(top row of Figure 7) show a distinctive pattern of correla-tions involving shift, slide and twist with the Watson back-bone of the central junction. Note that the sign of the corre-lations suggests that slide and twist will be positively corre-lated with one another and negatively correlated with shift.YR steps (bottom row) show correlations between twist andboth strands of the central backbone junction, but also be-
by Pablo D. D
ans on September 29, 2014
http://nar.oxfordjournals.org/D
ownloaded from

Nucleic Acids Research, 2014 9
tween rise and twist and the 3′-junctions in both strands(W3′ and C3′). RY steps (middle row) have more heteroge-neous properties, but it is notable that AT steps, whose con-formations were the least influenced by the flanking basepairs (see Figure 1), are also the only steps that show nostrong correlation with backbone conformations.
An overview of sequence-dependent effects on B-DNA con-formation
In light of what we have seen in terms of non-Gaussianparameter distributions, backbone substates and the linkbetween backbone and helical parameters, we can now at-tempt to build a concise description of how base sequence islinked to B-DNA conformation. Given that non-Gaussianparameter distributions are limited to the inter-BP param-eters shift, slide and twist and that these parameters alsoshow the highest correlations with the backbone confor-mations, we can start by representing the ensemble of theconformations observed for a set of all 136 distinct tetranu-cleotide sequences as a probability density plot in the spaceof these three parameters. As discussed in the methodologysection, the sign of four helical variables (shift, tilt, shearand buckle) depends on the choice of the naming conven-tion that sets the ‘Watson’ strand in each dinucleotide. Sincethe sign of shift is important in the analysis that follows, wewill use the average shift of the central dinucleotide of eachtetranucleotide to guide our choice of names used for eachof the distinct cases. By identifying the dinucleotides thathave negative average shift (GG, GA, AG, AA, GT, CA),we define a direction in which all non-self-complementarytetranucleotides are read. Note that self-complementarydinucleotides (AT, TA, CG, GC) have average shift valuesclose to zero due to their inherent symmetry. The results pre-sented in Figure 8 (3-dimensional probability densities) andSupplementary Figure S8 (2-dimensional projections of theresults in Figure 8) respect this convention.
The isodensity surfaces in Figure 8a show that there arethree distinct regions of high density (i.e. peaks of the prob-ability distribution) that differ primarily in terms of theirhelical twist, and reflect the existence of three distinct con-formational substates. The most populated (large orange)state is centered at the most canonical values of twist andshift, for B-DNA, but has negative values of slide. The sec-ond (small orange) state is centered at higher twist (approx-imately +5◦) and has negative shift with slide close to zero.The last (small blue) state occurs at very low twist (approx-imately −15◦) and has shift close to zero with a small nega-tive slide. In fact, these three states can also be distinguishedin terms of base sequence at the purine–pyrimidine level, asshown in Figure 8b. While the most populated state involvesall base pair steps, the high and low-twist regions are mainlyoccupied by RR and YR steps, respectively, and correspondto the highest probability densities for these two sequencefamilies. These observations are compatible with the datashown in Figure 3.
Comparison of these results with the backbone-helicalparameter correlation analysis presented earlier allows us toshed light on how the populations of the three B-DNA con-formational substates are linked to backbone conformationand, because of their high correlation, also to the formation
Figure 8. Probability density as a function of shift, slide and twist. (a)Probability density isosurfaces (generated from uniform bin histograms)shown at four evenly spaced levels as a function of the inter-BP parame-ters shift, slide and twist averaged over all tetranucleotides. The surfacesenclose the most densely populated region of this conformational space,i.e. the peaks of the distribution (namely, 15%, 30%, 45% and 60% of themaximum density). (b) Same as (a), but dividing the probability densityinto RR (red), RY (green) and YR (blue) sequences for the correspondingbase pair step (see the main text for the precise definition of the RY and YRgroups). In this case, only the two innermost isodensity surfaces are shownfor each sequence group. (c) RR steps are further subdivided according tothe BI/BII conformational state of the Watson backbone in the base pairstep. (d) YR steps are further subdivided according to the conformationalstate of the 3′-junctions: BI3′ indicates that both 3′-junctions (W3′ and C3′in Figure 7) are in the BI state, and BII3′ indicates that at least one of thesejunctions is in the BII state.
of the C8-H. . .O3′ hydrogen bond in RR steps. First, notethat the transition to the high-twist state for RR steps in-volves coupled changes in shift and slide, and these threeparameters have indeed been shown to strongly correlatewith the backbone torsion � of the Watson strand of RRsteps. The isodensity surface shown in Figure 8c confirmsthat BI–BII transitions in the Watson strand of RR steps areindeed concerted with the changes in shift, slide and twistand lead to two substates with clearly distinguished proba-bility density clouds corresponding to the high-twist (BII)and intermediate-twist (BI) states.
Populating the low-twist state for YR steps is similarlycoupled to BI–BII transitions, but in this case the transi-tions concern the two 3′-flanking junctions (denoted as W3′and C3′ in Figure 7), a behavior already observed in the par-ticular case of CG steps in the Dickerson dodecamer (22).The low-twist state is occupied when either or both of thesejunctions are in the BII state as shown in Figure 8d. In con-trast to the high-twist state seen with RR steps, the low-twist state does not involve significant changes in shift orslide, in agreement with the absence of cross correlationsbetween the backbone and these variables for YR steps (seeFigure 7). Note that although the twist of YR steps is alsocorrelated with the backbone conformation of these steps,this may be due mainly to the negative correlation of BI/BIIstates typically seen at adjacent steps within a given back-bone. Note also that, at least for TG and CG steps, tran-
by Pablo D. D
ans on September 29, 2014
http://nar.oxfordjournals.org/D
ownloaded from

10 Nucleic Acids Research, 2014
sitions to the low-twist state are correlated with significantreductions in rise as expected from the results in Figure 7.
Lastly, RY steps, which show the sparsest correlationswith the backbones (see Figure 7) and do not exhibit non-Gaussian behavior (see Figure 4), are largely restricted tothe single canonical probability density region with inter-mediate twist values (see Figure 8b).
We have identified three conformational states of B-DNAthat differ in particular with respect to their values of shift,slide and twist, and their backbone conformations, as wellas clear-cut dinucleotide preferences for occupying just oneor two of these states. Furthermore, while RR steps arelargely restricted to the high- and intermediate-twist states,we do observe YR steps also occupying twist values above35◦ with significant probability (see Figure 3, right column,and the BI3′ probability in Figure 8d and SupplementaryFigure S8d). This observation suggests that some flankingsequences induce an exceptional behavior in TG and espe-cially CG steps, which deserves further investigation. Fi-nally, we remark that defining the number of states is ul-timately a subjective decision, and our results do not ex-clude the existence of finer subdivisions, e.g. multiple sub-states within the intermediate-twist basin.
Given that we generally observe anticorrelation betweenthe BI/BII states (within a given strand), and also the twist,of adjacent base pair steps, we can expect to see somestructural coupling beyond the dinucleotide level. We canmake two preliminary steps in this direction. First, for trin-ucleotides, we note that Figure 5 shows high BII occupan-cies for RR and RY steps when these steps are preceded bya pyrimidine (i.e. YRR or YRY). Indeed, backbones withat least 30% of BII belong to the second junction of thebimodal YRX trinucleotides (see Figure 8d) in all but onecase.
Second, by combining the individual tendencies of threeoverlapping dinucleotides, we can predict some tetranu-cleotide structural properties shown in Figure 3. As an ex-ample, consider the TG twist distributions (third column,second panel from the top in Figure 3), and, in particu-lar, the YTGR tetranucleotides (blue curves). The final GRstep can populate the high-twist RR state, as can the firstYT step (which is RR on the Crick strand): the presenceof two flanking RR, potentially high-twist, steps then ex-plains the observed preference for low twist of the cen-tral TG step. Furthermore, high twist in the two flankingsteps correlates with BII backbone states on the Watsonstrand for the GR step, and on the Crick strand for theYT step. These backbones correspond to the W3′ and C3′backbones with respect to the TG step, explaining the cor-relation we observe between TG twist and the backbonestate of the flanking steps. On the other hand, RTGR andYTGY tetranucleotides (red and orange curves) have flank-ing RR and RY steps. Since RY steps mainly populate theintermediate-twist state, we observe weaker selectivity forthe low-twist state of TG (and more pronounced polymor-phism) in both RTGR and YTGY. Correspondingly, RTGYtetranucleotides, with two flanking RY steps, show high se-lectivity for the intermediate-twist state of TG.
CONCLUSION
The results of well-converged, microsecond-scale molecu-lar dynamics trajectories on 39 oligomers enable us to for-mulate a clearer view of how base sequence influences thestructure and dynamics of double-helical B-DNA. First, itis shown that B-DNA undergoes very large fluctuations onthis timescale, including the transitory formation of sharpkinks toward the major and minor grooves, the sponta-neous creation of short lived, potential intercalation sitesand transient base pair opening, not only at the ends ofthe oligomers, but also in their centers. Second, it is shownthat average base pair step helical parameters and theirfluctuations can be influenced more strongly by the basepairs flanking the step (i.e. the tetranucleotide sequence)than by the nature of the base pair step itself. Third, manytetranucleotide sequences exhibit oscillations between mul-tiple conformational substates. These substates are notablycharacterized by multimodal distributions of the helical pa-rameters shift, slide and twist. The existence of these sub-states is linked to BI/BII transitions in the phosphodi-ester backbones. We also observe that within RR and YRsteps a BII backbone conformation is highly correlated withthe formation of base-phosphate (C8-H. . .O3′) hydrogenbonds.
Putting these observations together starts to provide aclearer overview of the conformational space occupied byB-DNA as a function of its base sequence. This space canbe divided into three main regions in terms of shift, slide andtwist. The first region is characteristic of canonical B-DNAand can be occupied by all sequences. The second is char-acterized by higher twist and negative shift and is largelyrestricted to purine–purine (RR) steps. The last region ischaracterized by very low twist and negative slide and ismainly populated by pyrimidine–purine (YR) steps. Thusboth RR and YR steps can occupy two distinct conforma-tional regions and can also exhibit multimodal behavior ina single sequence context. In addition, because YR stepsare sensitive to the state of neighboring 3′ backbones fur-ther coupling beyond the dinucleotide sequence may occurin longer fragments, e.g. in YRX trinucleotides.
Analysis of our data set is a significant step towardachieving a comprehensive view of the sequence-dependentbehavior of B-DNA and constitutes a valuable resource forthe further development of coarse-grain models of DNA.By carrying out microsecond simulations we are approach-ing biologically relevant timescales. These results constitutea more thorough sampling of conformational space, for abroader range of sequences, than has been possible before.Most importantly, we begin to see that the surprisingly largeimpact of base sequence on the double helix can be under-stood in relatively simple terms.
SUPPLEMENTARY DATA
Supplementary Data are available at NAR Online.
FUNDING
Swiss National Science Foundation [2000020 143613/1 toJ.H.M.]; NSF XSEDE [MCA01S027 to T.E.C.III]; NIH
by Pablo D. D
ans on September 29, 2014
http://nar.oxfordjournals.org/D
ownloaded from
Nucleic Acids Research, 2014 11
[R-01 GM-081411 to T.E.C.III]; Grant Agency of theCzech Republic [14-21893S to F.L.]; Spanish MINECO[BIO2012-32868 to M.O.]; European Research Council [toM.O.]; ICREA Academia Fellow [to M.O.]; Czech ScienceFoundation [P208/11/1822 to J.S.]; CEITEC, EuropeanRegional Development Fund [CZ.1.05/1.1.00/02.0068 toJ.S.]; Centre National de la Recherche Scientifique andthe Agence Nationale de la Recherche Project CHROME[ANR-12 BSV5-0017-01 to R.L., K.Z.]. Funding for openaccess charge: Swiss National Science Foundation [2000020143613/1].Conflict of interest statement. None declared.
REFERENCES1. Wing,R., Drew,H., Takano,T., Broka,C., Tanaka,S., Itakura,K. and
Dickerson,R.E. (1980) Crystal structure analysis of a complete turnof B-DNA. Nature, 287, 755–758.
2. Drew,H.R., Wing,R.M., Takano,T., Broka,C., Tanaka,S., Itakura,K.and Dickerson,R.E. (1981) Structure of a B-DNA dodecamer:conformation and dynamics. Proc. Natl Acad. Sci. U.S.A., 78,2179–2183.
3. Juo,Z.S., Chiu,T.K., Leiberman,P.M., Baikalov,I., Berk,A.J. andDickerson,R.E. (1996) How proteins recognize the TATA box. J.Mol. Biol., 261, 239–254.
4. Dickerson,R.E. and Chiu,T.K. (1997) Helix bending as a factor inprotein/DNA recognition. Biopolymers, 44, 361–403.
5. Paillard,G. and Lavery,R. (2004) Analyzing protein-DNArecognition mechanisms. Structure, 12, 113–122.
6. Locasale,J.W., Napoli,A.A., Chen,S., Berman,H.M. andLawson,C.L. (2009) Signatures of protein-DNA recognition in freeDNA binding sites. J. Mol. Biol., 386, 1054–1065.
7. Rohs,R., West,S.M., Sosinsky,A., Liu,P., Mann,R.S. and Honig,B.(2009) The role of DNA shape in protein–DNA recognition. Nature,461, 1248–1253.
8. Strekowski,L. and Wilson,B. (2007) Noncovalent interactions withDNA: an overview. Mutat. Res., 623, 3–13.
9. Rothemund,P.W. (2006) Folding DNA to create nanoscale shapes andpatterns. Nature, 440, 297–302.
10. Castro,C.E., Kilchherr,F., Kim,D.N., Shiao,E.L., Wauer,T.,Wortmann,P., Bathe,M. and Dietz,H. (2011) A primer to scaffoldedDNA origami. Nat. Methods, 8, 221–229.
11. Gonzalez,O., Petkeviciute,D. and Maddocks,J.H. (2013) Asequence-dependent rigid-base model of DNA. J. Chem. Phys., 138,055102.
12. Petkeviciute,D., Pasi,M., Gonzalez,O. and Maddocks,J.H. (2014)cgDNA: a software package for the prediction of sequence-dependentcoarse-grain free energies of B-form DNA. Nucleic Acids Res.,doi:10.1093/nar/gku825.
13. Berman,H.M., Battistuz,T., Bhat,T.N., Bluhm,W.F., Bourne,P.E.,Burkhardt,K., Feng,Z., Gilliland,G.L., Iype,L., Shri,J. et al. (2002)The Protein Data Bank. Acta Crystallogr. D Biol. Crystallogr., 58,899–907.
14. Dans,P.D., Perez,A., Faustino,I., Lavery,R. and Orozco,M. (2012)Exploring polymorphisms in B-DNA helical conformations. NucleicAcids Res., 40, 10668–10678.
15. Pearlman,D.A., Case,D.A., Caldwell,J.W., Ross,W.S., Cheatham,T.E.III, DeBolt,S., Ferguson,D., Seibel,G. and Kollman,P. (1995)AMBER, a package of computer programs for applying molecularmechanics, normal mode analysis, molecular dynamics and freeenergy calculations to simulate the structural and energetic propertiesof molecules. Comput. Phys. Commun., 91, 1–41.
16. Case,D.A., Cheatham,T.E., Darden,T., Gohlke,H., Luo,R.,Merz,K.M., Onufriev,A., Simmerling,C., Wang,B. and Woods,R.J.(2005) The Amber biomolecular simulation programs. J. Comput.Chem., 26, 1668–1688.
17. Beveridge,D.L., Barreiro,G., Byun,K.S., Case,D.A., Cheatham,T.E.,Dixit,S.B., Giudice,E., Lankas,F., Lavery,R., Maddocks,J.H. et al.(2004) Molecular dynamics simulations of the 136 uniquetetranucleotide sequences of DNA oligonucleotides. I. Researchdesign and results on d(CpG) steps. Biophys. J., 87, 3799–3813.
18. Dixit,S.B., Beveridge,D.L., Case,D.A., Cheatham,T.E., Giudice,E.,Lankas,F., Lavery,R., Maddocks,J.H., Osman,R., Sklenar,H. et al.(2005) Molecular dynamics simulations of the 136 uniquetetranucleotide sequences of DNA oligonucleotides. II: sequencecontext effects on the dynamical structures of the 10 uniquedinucleotide steps. Biophys. J., 89, 3721–3740.
19. Perez,A., Luque,F.J. and Orozco,M. (2007) Dynamics of B-DNA onthe microsecond time scale. J. Am. Chem. Soc., 129, 14739–14745.
20. Perez,A., Lankas,F., Luque,F.J. and Orozco,M. (2008) Towards amolecular dynamics consensus view of B-DNA flexibility. NucleicAcids Res., 36, 2379–2394.
21. Orozco,M., Noy,A. and Perez,A. (2008) Recent advances in the studyof nucleic acid flexibility by molecular dynamics. Curr. Opin. Struct.Biol., 18, 185–193.
22. Drsata,T., Perez,A., Orozco,M., Morozov,A.V., Sponer,J. andLankas,F. (2013) Structure, stiffness and substates of theDickerson-Drew dodecamer. J. Chem. Theory Comput., 9, 707–721.
23. Perez,A., Luque,F.J. and Orozco,M. (2012) Frontiers in moleculardynamics simulations of DNA. Acc. Chem. Res., 45, 196–205.
24. Lavery,R., Zakrzewska,K., Beveridge,D., Bishop,T.C., Case,D.A.,Cheatham,T., Dixit,S., Jayaram,B., Lankas,F., Laughton,C. et al.(2010) A systematic molecular dynamics study of nearest-neighboreffects on base pair and base pair step conformations and fluctuationsin B-DNA. Nucleic Acids Res., 38, 299–313.
25. Lavery,R., Moakher,M., Maddocks,J.H., Petkeviciute,D. andZakrzewska,K. (2009) Conformational analysis of nucleic acidsrevisited: Curves+. Nucleic Acids Res., 37, 5917–5929.
26. Blanchet,C., Pasi,M., Zakrzewska,K. and Lavery,R. (2011)CURVES+ web server for analyzing and visualizing the helical,backbone and groove parameters of nucleic acid structures. NucleicAcids Res., 39, W68–W73.
27. Lavery,R., Maddocks,J.H., Pasi,M. and Zakrzewska,K. (2014)Analyzing ion distributions around DNA. Nucleic Acids Res., 42,8138–8149.
28. Dans,P.D., Faustino,I., Battistini,F., Zakrzewska,K., Lavery,R. andOrozco,M. (2014) Unraveling the sequence-dependent polymorphicbehavior of d(CpG) steps in B-DNA. Nucleic Acids Res.,doi:10.1093/nar/gku809.
29. Cheatham,T.E. III, Cieplak,P. and Kollman,P.A. (1999) A modifiedversion of the Cornell et al. force field with improved sugar puckerphases and helical repeat. J. Biomol. Struct. Dyn., 16, 845–862.
30. Dang,L.X. (1995) Mechanism and thermodynamics of ion selectivityin aqueous solutions of 18-crown-6 ether: a molecular dynamicsstudy. J. Am. Chem. Soc., 117, 6954–6960.
31. Berendsen,H.J.C., Grigera,J.R. and Straatsma,T.P. (1987) The missingterm in effective pair potentials. J. Phys. Chem., 91, 6269–6271.
32. Essmann,U., Perera,L., Berkowitz,M.L., Darden,T., Lee,H. andPedersen,L.G. (1995) A smooth particle mesh Ewald method. J.Chem. Phys., 103, 8577–8593.
33. Berendsen,H.J., Postma,J.P.M., van Gunsteren,W.F., DiNola,A. andHaak,J.R. (1984) Molecular dynamics with coupling to an externalbath. J. Chem. Phys., 81, 3684–3690.
34. Ryckaert,J.-P., Ciccotti,G. and Berendsen,H.J. (1977) Numericalintegration of the cartesian equations of motion of a system withconstraints: molecular dynamics of n-alkanes. J. Comput. Phys., 23,327–341.
35. Harvey,S.C., Tan,R.K.-Z. and Cheatham,T.E. (1998) The flying icecube: velocity rescaling in molecular dynamics leads to violation ofenergy equipartition. J. Comput. Chem., 19, 726–740.
36. Olson,W.K., Bansal,M., Burley,S.K., Dickerson,R.E., Gerstein,M.,Harvey,S.C., Heinemann,U., Lu,X.J., Neidle,S., Shakked,Z. et al.(2001) A standard reference frame for the description of nucleic acidbase-pair geometry. J. Mol. Biol., 313, 229–237.
37. Dickerson,R.E. (1989) Definitions and nomenclature of nucleic acidstructure components. Nucleic Acids Res., 17, 1797–1803.
38. Fisher,N.I. (1993) Statistical Analysis of Circular Data. CambridgeUniversity Press, Cambridge, UK.
39. Zar,J.H. (1999) Biostatistical Analysis. Prentice Hall, Upper SaddleRiver, NJ.
40. Jammalamadaka,S.R. (2001) Topics in Circular Statistics. WorldScientific, River Edge, NJ.
41. Leger,J.F., Robert,J., Bourdieu,L., Chatenay,D. and Marko,J.F.(1998) RecA binding to a single double-stranded DNA molecule: a
by Pablo D. D
ans on September 29, 2014
http://nar.oxfordjournals.org/D
ownloaded from
12 Nucleic Acids Research, 2014
possible role of DNA conformational fluctuations. Proc. Natl Acad.Sci. U.S.A., 95, 12295–12299.
42. Lankas,F., Gonzalez,O., Heffler,L.M., Stoll,G., Moakher,M. andMaddocks,J.H. (2009) On the parameterization of rigid base andbasepair models of DNA from molecular dynamics simulations.Phys. Chem. Chem. Phys., 11, 10565–10588.
43. Yanagi,K., Prive,G.G. and Dickerson,R.E. (1991) Analysis of localhelix geometry in three B-DNA decamers and eight dodecamers. J.Mol. Biol., 217, 201–214.
44. Mack,D.R., Chiu,T.K. and Dickerson,R.E. (2001) Intrinsic bendingand deformability at the T-A step of CCTTTAAAGG: a comparativeanalysis of T-A and A-T steps within A-tracts. J. Mol. Biol., 312,1037–1049.
45. Okonogi,T.M., Alley,S.C., Reese,A.W., Hopkins,P.B. andRobinson,B.H. (2002) Sequence-dependent dynamics of duplex
DNA: the applicability of a dinucleotide model. Biophys. J., 83,3446–3459.
46. Maehigashi,T., Hsiao,C., Woods,K.K., Moulaei,T., Hud,N.V. andWilliams,L.D. (2012) B-DNA structure is intrinsically polymorphic:even at the level of base pair positions. Nucleic Acids Res., 40,3714–3722.
47. Hartmann,B., Piazzola,D. and Lavery,R. (1993) BI-BII transitions inB-DNA. Nucleic Acids Res., 21, 561–568.
48. Djuranovic,D. and Hartmann,B. (2004) DNA fine structure anddynamics in crystals and in solution: the impact of BI/BII backboneconformations. Biopolymers, 73, 356–368.
49. Heddi,B., Foloppe,N., Bouchemal,N., Hantz,E. and Hartmann,B.(2006) Quantification of DNA BI/BII backbone states in solution.Implications for DNA overall structure and recognition. J. Am.Chem. Soc., 128, 9170–9177.
by Pablo D. D
ans on September 29, 2014
http://nar.oxfordjournals.org/D
ownloaded from
Related Documents