38 th Floor, One Corporate Centre Julia Vargas corner Meralco Avenue Ortigas Center, Pasig 1605 Tel: +63 (2) 667-7332 / +63(2) 755-2332 May 14, 2012 MA. CONCEPCION M. MAGDARAOG Market Regulatory Services Group Philippine Dealing & Exchange Corp. 37/F, Tower 1, The Enterprise Center 6766 Ayala Ave. cor. Paseo de Roxas Makati City Dear Ms. Magdaraog: In compliance with the disclosure requirements of the PSE, we submit the attached Energy Development Corporation (Consolidated) Quarterly Report for the period ended March 31, 2012 (SEC Form 17-Q)

Welcome message from author
This document is posted to help you gain knowledge. Please leave a comment to let me know what you think about it! Share it to your friends and learn new things together.
Transcript

38th
Floor, One Corporate Centre Julia Vargas corner Meralco Avenue Ortigas Center, Pasig 1605 Tel: +63 (2) 667-7332 / +63(2) 755-2332 Fax: +63 (2) 982-2141
May 14, 2012
MA. CONCEPCION M. MAGDARAOG
Market Regulatory Services Group
Philippine Dealing & Exchange Corp.
37/F, Tower 1, The Enterprise Center
6766 Ayala Ave. cor. Paseo de Roxas
Makati City
Dear Ms. Magdaraog:
In compliance with the disclosure requirements of the PSE, we submit the attached
Energy Development Corporation (Consolidated) Quarterly Report for the period ended
March 31, 2012 (SEC Form 17-Q)

SEC Form 17Q – 1Q 2012
SEC Number 66381
File Number _____
ENERGY DEVELOPMENT CORPORATION
(Company’s full Name)
One Corporate Centre Julia Vargas cor. Meralco Ave., Ortigas Center, Pasig City
(Company’s Address)
(632) 755-2332
(Telephone Number)
March 31, 2012
(Quarter Ending)
SEC FORM 17-Q
(Form Type)


SEC Form 17Q – 1Q 2012
PART 1 FINANCIAL INFORMATION
ITEM 1. FINANCIAL STATEMENTS
Our unaudited consolidated financial statements for the quarter ended March 31, 2012
have been prepared in accordance with Philippine Financial Reporting Standards (PFRS)
and are filed as Annex I of this report.
ITEM 2. MANAGEMENT’S DISCUSSION AND ANALYSIS OF FINANCIAL CONDITION AND RESULTS OF OPERATIONS (“MD & A”) The following is a discussion and analysis of the Company’s consolidated financial
performance for the quarter ended March 31, 2012. The prime objective of this MD&A
is to help the readers understand the dynamics of our Company’s business and the key
factors underlying our financial results. Hence, our MD&A is comprised of a discussion of
our core business and an analysis of the results of operations. This section also focuses on
key statistics from the unaudited financial statements and pertains to risks and uncertainties
relating to the geothermal power industry in the Philippines where we operate up to the
stated reporting period. However, our MD&A should not be considered all inclusive, as it
excludes unknown risks, uncertainties and changes that may occur in the general economic,
political and environment condition after the stated reporting date.
Our MD&A should be read in conjunction with our unaudited consolidated financial
statements and the accompanying notes. All financial information is reported in Philippine
Pesos (PhP) unless otherwise stated.
Any references in this MD&A to “we”, “us”, “our”, “Company” means the Energy
Development Corporation and its subsidiaries.
Additional information about the Company can be found on our corporate website
www.energy.com.ph.

SEC Form 17Q – 1Q 2012 4
The following is a summary of the key sections of this MD&A:
OVERVIEW OF OUR BUSINESS ..............................................................................................5 Principal Products or Services ........................................................................................................ 5
Percentage of sales or revenues contributed by foreign sales ......................................................... 5
Distribution methods of products or services ................................................................................. 6
Competition..................................................................................................................................... 6
Dependence on one or a few major customers and identity of any such major customers ............ 7
KEY PERFORMANCE INDICATORS ......................................................................................8
FINANCIAL HIGHLIGHTS .........................................................................................................9
RESULTS OF OPERATIONS ...................................................................................................10
Net Income ....................................................................................................................................13 CAPITAL AND LIQUIDITY RESOURCES ............................................................................14 FINANCIAL POSITION ............................................................................................................15
Horizontal and Vertical Analysis of Material Changes as of March 31, 2012 and December
31, 2011..................................................................................................................................... 15
Horizontal and Vertical Analysis of Material Changes as of March 31, 2012 and 2011. ........ 19
CASH FLOW ...............................................................................................................................24 DISCUSSION ON THE SUBSIDIARIES .................................................................................25
FG Hydro .................................................................................................................................. 25 Green Core Geothermal Inc. ..................................................................................................... 26
Bac-Man Geothermal Inc. ......................................................................................................... 27
FOREIGN EXCHANGE AND INTEREST RATE EXPOSURE ...........................................28 OTHER MATTERS ....................................................................................................................28
MAJOR STOCKHOLDERS ......................................................................................................29 BOARD OF DIRECTORS ..........................................................................................................30
OFFICERS ...................................................................................................................................30

SEC Form 17Q – 1Q 2012 5
OVERVIEW OF OUR BUSINESS
Principal Products or Services
As of March 31, 2012, the Company operates twelve geothermal steam fields in the five
geothermal service contract areas where it is principally involved in:
i. the production of geothermal steam for sale to National Power Corporation (NPC)
pursuant to Steam Sales Agreements (SSAs) and
ii. the generation and sale of electricity through Company-owned geothermal power plants
to NPC and privately-owned distribution utilities (DUs), pursuant to Power Purchase
Agreements (PPAs) and Electricity Sales Agreements (ESAs), respectively.
Starting September 3, 2010, on account of the extended waiver, the Company ceased billing to
NPC after Bacman Geothermal Inc’s (BGI) successful acquisition of the plants from NPC.
Through its 60% equity interest in First Gen Hydro Power Corporation (FG Hydro), the
Company indirectly operates the 120 MW Pantabangan and 12 MW Masiway Hydroelectric
Power Plants, located in Pantabangan, Nueva Ecija Province, Central Luzon. The power plants
supply electricity into the Luzon grid to service the consumption of its customers which include
the Wholesale Electricity Spot Market (WESM), distribution utilities covered by bilateral
contract quantities (BCQ) and the National Grid Corporation of the Philippines (NGCP) for
ancillary services.
For the Company’s third business segment, Energy Development Corporation (EDC) provides
drilling services to the Lihir Gold Limited in Papua New Guinea.
The Company has evolved into being the country’s premier pure renewable energy play,
possessing interests in geothermal energy and hydro power. For geothermal energy, its expertise
spans the entire geothermal value chain, i.e., from geothermal energy exploration and
development, reservoir engineering and management, engineering design and construction,
environmental management and energy research and development. With FG Hydro, the
Company has not only acquired expertise in hydropower operation and maintenance, but also the
capability to sell power on a merchant basis.
Percentage of sales or revenues contributed by foreign sales
The Company generated P167.6 million from the contract it entered into with Lihir Gold Limited
(LGL) in Papua, New Guinea. This represents 2.2% of the Company’s P7,704.3 million gross
revenues for the first quarter of 2012. For the fifth consecutive time, the Company’s contract
with LGL was once again renewed and extended up to December 31, 2012.
SEC Form 17Q – 1Q 2012 6
Distribution methods of products or services
The Company’s 1,866.4 GWh total sales volume comprised of 1,627.1 GWh coming from
electricity production in Leyte, Mindanao, Tongonan I and Palinpinon geothermal power plants;
148.9 GWh in Bac-Man geothermal power plants (BMGPP) and 90.4 GWh from FG Hydro’s
Pantabangan-Masiway hydro power plants. About 60.0% or 1,119.2 GWh generated by Leyte
and Mindanao was sold to NPC. The 1,627.1 GWh generated by Tongonan I, Palinpinon I and II
was sold to electric cooperatives and industrial customers in the Visayas region and the
Wholesale Electricity Spot Market (WESM). BGI purchased 148.9 GWh to serve its contractual
obligations to BATELEC and Linde Philippines. Electricity production of about 90.4 GWh, by
FG Hydro’s power plants, was sold to the distribution utility clients comprised of electric
cooperatives in the province of Nueva Ecija, the WESM and NGCP for ancillary services.
The electricity generated by the Company’s geothermal power plants is transmitted to customers
i.e., distribution utilities, electric cooperatives or bulk power customers by the NGCP through its
high voltage backbone system.
FG Hydro generated 90.4 GWh of electricity as of first quarter of 2012, of which 68% or
61.1 GWh was delivered to its contracted customers and 32% or 14.8 GWh was sold to the
WESM.
Competition
The Company competes with other energy sources used for the production of power, particularly
coal, gas and oil, substantially all of which is imported.
Under the Company’s Geothermal Renewable Energy Service Contracts (GRESCs), it has long-
term exclusive rights to explore, develop, and utilize geothermal steam resources in specific
areas. Substantially all of the Company’s power capacity is sold through various offtake
agreements, such as PPAs for the supply of electricity to NPC and ESAs with DUs. Since most
these agreements provide for take-or-pay quantities, the Company is not subject to direct
competition. Furthermore, the supply of steam is location-specific, such that each power plant
can only source its fuel from a dedicated nearby steam field.
On May 5, 2010, BGI, the Company’s wholly-owned subsidiary through EDC Geothermal
Corporation, submitted the winning bid of US$28.25 million for PSALM’s auction of the 150
MW BMGPP located in the towns of Bacon, Sorsogon Province and Manito, Albay Province.
The power plants were turned over to BGI in September 2010, and are currently under
rehabilitation to restore capacity and reliability.
The only other Philippine company engaged in the production of steam is Chevron Geothermal
Philippines Holdings. Aboitiz Power Corporation, a power distribution and generation company,
successfully bid for the 747 MW Tiwi-Makban geothermal power plant. Multinationals that
currently operate in the Philippines include Korea Electric Power Corporation, Marubeni,
CalEnergy, Tokyo Electric Power Company, AES and Sumitomo.

SEC Form 17Q – 1Q 2012 7
Dependence on one or a few major customers and identity of any such major customers
Close to 43.0% of the Company’s total revenues are derived from existing long-term PPAs with
NPC.
Concessions and government share payments
The five geothermal service contract areas where the EDC’s geothermal production steam fields
are located are:
• Tongonan Geothermal Project (expiring in 2031)
• Southern Negros Geothermal Project (expiring in 2031)
• Bacon-Manito Geothermal Project (expiring in 2031)
• Mt. Apo Geothermal Project (expiring in 2042)
Northern Negros Geothermal Project (expiring in 2044)
The Company also holds service contracts for the following prospect areas:
Geothermal Resource
1. Mt Cabalian Geothermal Project (expiring by 2034)
2. Mt. Labo Geothermal Project (with a five-year pre-development period expiring in 2015,
25-year contract period expiring in 2035)
3. Mainit Geothermal Project (with a five-year pre-development period expiring in 2015,
25-year contract period expiring in 2035)
Wind Resource
1. Burgos Wind Project (WESC assigned by EDC to EDC Burgos Wind Power
Corporation)
Under DOE Certificate of Registration No. WESC 2009-09-004 (pre-development stage
expiring in 2012, 25-year contract period expiring in 2034)
2. Pagudpud Wind Project,
Under DOE Certificate of Registration No. WESC 2010-02-040 (pre-development stage
expiring in 2013, 25-year contract period expiring in 2035)
3. Camiguin Wind Project,
Under DOE Certificate of Registration No. WESC 2010-02-041 (pre-development stage
expiring in 2013, 25-year contract period expiring in 2035)

SEC Form 17Q – 1Q 2012 8
KEY PERFORMANCE INDICATORS
The top five (5) key performance indicators are set forth below:
Ratio
Mar – 12
Mar – 11
Current Ratio 1.89:1 2.44:1
Debt-to-Equity Ratio 1.63:1 1.75:1
Net Debt-to-Equity Ratio 1.21:1 1.10:1
Return on Assets (%) 2.45 2.28
Return on Equity (%) 7.48 6.67
Current Ratio – Total current assets divided by total current liabilities
This ratio is a rough indication of a company’s ability to pay its short-term obligations.
Generally, a current ratio above 1.00 is indicative of a company’s greater capability to settle
its current obligations.
Debt-to-Equity Ratio – Total interest-bearing debts divided by stockholders’ equity
This ratio expresses the relationship between capital contributed by the creditors and the
owners. The higher the ratio, the greater the risk being assumed by the creditors. A lower
ratio generally indicates greater long-term financial safety.
Net-Debt-to-Equity Ratio – Total interest-bearing debts less cash & cash equivalents
divided by stockholders’ equity
This ratio measures the company’s financial leverage and stability. A negative net debt-to-equity
ratio means that the total of cash and cash equivalents exceeds interest-bearing
liabilities.
Return on Assets – Net income (annual basis) divided by total assets (average)
This ratio indicates how profitable a company is relative to its total assets. This also gives an
idea as to how efficient management is at using its assets to generate earnings.
Return on Equity – Net income (annual basis) divided by total stockholders’ equity (average)
This ratio reveals how much profit a company earned in comparison to the total amount of
shareholder equity found on the balance sheet. A business that has a high return on equity is
more likely to be one that is capable of internally generating cash. For the most part, the
company’s return on equity is compared with an industry average. The company is
considered superior if its return on equity is greater than the industry average.

SEC Form 17Q – 1Q 2012 9
OPERATING REVENUES AND EXPENSES
FINANCIAL HIGHLIGHTS
The recurring net income generated in the first quarter of 2012 increased by 126.1% or
P1,557.1 million to P2,792.2 million from the P1,235.1 million posted during the same
period in 2011. This was mainly due to P642.5 million Green Core Geothermal Inc’s
(GCGI) higher revenues from Tongonan I and Palinpinon power plants as per GCGI’s
agreed contracts that became effective in mid-2011; and FG Hydro’s P596.9 million
revenues from contingency and dispatchable reserves.
Recurring net income attributable to equity holders of the parent was posted at
P2,344.5 million, up by 102.8%, as compared to the P1,155.9 billion for the first quarter
of 2011.
Net income is equivalent to 40.8% of total revenues in 2012 as compared to the 24.5%
from the same period in 2011. It increased by 115.4% or P1,686.1 million to
P3,146.9 million as of March 31, 2012 from P1,460.8 million during the same period in
2011.
Factors contributing to these were the following:
P1,738.6 million increase in sale of electricity due to fresh contribution of BGI’s
revenues, increase in GCGI’s sales and FG Hydro’s revenues from contingency and
dispatchable reserves; and
P149.4 million Foreign exchange gains due to appreciation of the peso against the US
dollar.
Net income attributable to equity holders of the parent at P2,699.3 million for the first
quarter of 2012, increased by 95.3% as compared to the P1,381.8 million during the same
period in 2011.
Cash and cash equivalents increased by 5.0% or P630.0 million to P13,123.4 million as
of March 31, 2012 from the P12,493.4 million December 31, 2011 balance. The increase
was mainly accounted for by the P798.9 million regular long-term debt servicing offset
by the P132.7 million dividend received from FG Hydro.

SEC Form 17Q – 1Q 2012 10
RESULTS OF OPERATIONS
The following table details the results of operations for EDC for the first quarter of
2012 and 2011.
INCOME STATEMENT
Horizontal Analysis of Material Changes as of March 31, 2012 and 2011
Favorable (Unfavorable) Variance
(Amounts in PHP millions) March 2012 March 2011 Amount % 2012 2011
REVENUES
Sale of electricity 7,536.8 5,798.2 1,738.6 30.0% 97.8% 97.4%
Revenue from drilling services 167.6 154.6 13.0 8.4% 2.2% 2.6%
7,704.4 5,952.8 1,751.6 29.4% 100.0% 100.0%
COST OF SALES AND SERVICES*
Cost of sales of electricity and steam (2,741.3) (2,762.7) 21.4 -0.8% -35.6% -46.4%
Cost of drilling services (95.4) (108.3) 12.9 -11.9% -1.2% -1.8%
(2,836.7) (2,871.0) 34.3 -1.2% -36.8% -48.2%
GENERAL AND ADMINISTRATIVE EXPENSES* (919.6) (888.9) (30.7) 3.5% -11.9% -14.9%
FINANCIAL INCOME (EXPENSE)
Interest income 93.9 123.9 (30.0) -24.2% 1.2% 2.1%
Interest expense (1,015.4) (1,038.9) 23.5 -2.3% -13.2% -17.5%
(921.5) (915.0) (6.5) 0.7% -12.0% -15.4%
OTHER INCOME (CHARGES)
Foreign exchange gains (losses), net 338.0 188.6 149.4 79.2% 4.4% 3.2%
Derivatives gains (losses), net - 37.6 (37.6) -100.0% 0.0% 0.6%
Miscellaneous, net* 59.3 30.7 28.6 93.2% 0.8% 0.5%
397.3 256.9 140.4 54.7% 5.2% 4.3%
INCOME BEFORE INCOME TAX 3,423.9 1,534.8 1,889.1 123.1% 44.4% 25.8%
BENEFIT FROM (PROVISION FOR) INCOME TAX
Current (187.9) (168.4) (19.5) 11.6% -2.4% -2.8%
Deferred (89.1) 94.4 (183.5) -194.4% -1.2% 1.6%
(277.0) (74.0) (203.0) 274.3% -3.6% -1.2%
NET INCOME 3,146.9 1,460.8 1,686.1 115.4% 40.8% 24.5%
Net income (loss) attributable to:
Equity holders of the Parent Company 2,699.3 1,381.8 1,317.5 95.3% 35.0% 23.2%
Non-controlling interest 447.6 79.0 368.6 466.6% 5.8% 1.3%
EBITDA 4,863.2 3,166.7 1,696.5 53.6% 63.1% 53.2%
RECURRING NET INCOME 2,792.2 1,235.1 1,557.1 126.1% 36.2% 20.7%
Recurring net income attributable to:
Equity holders of the Parent Company 2,344.5 1,155.9 1,188.6 102.8% 30.4% 19.4%
Non-controlling interest 447.7 79.2 368.5 465.3% 5.8% 1.3%
HORIZONTAL ANALYSIS VERTICAL ANALYSIS
*New presentation based on SRC Rule 68 issued by Philippine SEC last October 20, 2011 – As amended effective for audited financial statements covering periods ending December 31, 2011 and onwards, and for interim financial statements starting the first quarter of 2012, and
thereafter.

SEC Form 17Q – 1Q 2012 11
YTD March 31, 2012 vs. YTD March 31, 2011
Revenues
Total revenues for the period ended March 31, 2012 increased by 29.4% or P1,751.6 million to
P7,704.4 million from P5,952.8 million in 2011.
Sale of Electricity
Revenues from sale of electricity increased by 30.0% or P1,738.6 million to
P7,536.8 million in the first quarter of 2012 from P5,798.2 million during the same
period in 2011. The increase in revenue was primarily due to the following:
P738.9 million fresh contribution of BGI’s revenues coming from its PSAs with
BATELEC and Linde Philippines;
P642.5 million GCGI’s higher revenues from Tongonan I and Palinpinon power
plants as per agreed contracts that became effective in mid-2011; and
P596.9 million FG Hydro’s revenues from contingency and dispatchable reserves.
Revenue from Drilling Services
Revenue from drilling services increased by 8.4% or P13.0 million to P167.6 million in
the first quarter of 2012 from P154.6 million during the same period in 2011. The
favorable variance was attributed to higher dollar revenues in 2012 as there was 15 non-
revenue days reported in 2011 for the repair of Rig 11. Total dollar revenues as of
March 2012 was US$3.9 million against the US$3.5 million as of March 2011.
This was offset by lower average exchange rate by P0.952/US$1 (YTD March
2012=P42.832/US$1 vs. YTD March 2011=P43.784/US$1) due to the appreciation of the
peso against the US dollar.
Cost of Sales and Services
Cost of sales and services decreased by 1.2% or P34.3 million to P2,836.7 million in the first
quarter of 2012 from P2,871.0 million during the same period in 2011. Cost of drilling services
decreased by 11.9% or P12.9 million to P95.4 million in the first quarter of 2012 from
P108.3 million during the same period in 2011 mainly due to the repair of Rig 11 undertaken in
the first quarter of 2011. Total cost of sales of electricity and steam includes replacement power
cost amounting to P706.5 million.
Financial Income (Expenses)
Interest income decreased by 24.2% or P30.0 million to P93.9 million in the first quarter of 2012
from P123.9 million during the same period in 2011 due to lower monthly average investible
funds cushioned by higher weighted average interest rates on peso placements.

SEC Form 17Q – 1Q 2012 12
Other Income (Charges)
Other income–net increased by 54.7% or P140.4 million to P397.3 million in the first quarter of
2012 from P256.9 million during the same period in 2011.
Foreign Exchange Gains (Losses) - net
Net foreign exchange gains increased by P149.4 million, or 79.2%, to P338.0 million
from P188.6 million in 2011. The favorable variance was brought about by appreciation
of the peso against the US dollar.
The comparative foreign exchange rates against the USD were as follows:
JPY:US$ PHP:US$
December 31, 2010 81.659 43.840
March 31, 2011 82.871 43.390
December 31, 2011 77.912 43.840
March 31, 2012 82.420 42.920
Derivatives Gain (Loss) - Net
Derivative gain - net decreased by 100% from the P37.6 million balance in
March 31, 2011. The derivative gain pertained to various swap transactions for US dollar
and Japanese yen currencies entered into with various banks in February 2011, maturing
in March 2011 and April 2011.
Miscellaneous – Net
Miscellaneous income increased by 93.5% or P28.7 million to P59.4 million in the first
quarter of 2012 from P30.7 million during the same period in 2011. This was mainly
caused by P63.6 million reversal of NNGP power plant impairment.
Provision for Income Tax
Current tax expense increased by P19.5 million, or 11.6%, to P187.9 million from P168.4 million
during the same period in 2011. The unfavorable variance was on account of the following:
P31.0 million increase caused by taxable income in 2012 for the drilling operations in
Lihir, Papua, New Guinea versus taxable loss (NOLCO) in 2011; and
P43.7 million Fresh contribution of income taxes from BGI’s taxable income in 2012.
These were offset by P55.3 million lower taxable income on steam and electricity operations
mainly contributed by the absence of NNGP's revenues in 2012 coupled with higher finance cost
on new loans.

SEC Form 17Q – 1Q 2012 13
Net Income
As a result of the foregoing, the Company’s net income increased by 115.4% or P1,686.1 million
to P3,146.9 million in 2012 from P1,460.8 million in 2011.
Net income is equivalent to 40.8% of total revenues in 2012 as compared to the 24.5% in 2011.
Net income attributable to equity holders of the parent at P2,699.3 million for the first quarter of
2012, increased by 95.3% as compared to the P1,381.8 million during the same period in 2011.

SEC Form 17Q – 1Q 2012 14
CAPITAL AND LIQUIDITY RESOURCES
As of the quarter ended
(in millions of pesos)
Q1
2012
Q1
2011 YoY change
Balance Sheet Data
Total Assets …………………………… 92,151.1 95,326.7 3.3%
Total Liabilities………………………... 61,340.2 64,642.0 5.1%
Total Stockholder’s Equity …………… 30,810.9 30,684.7 0.4%
The Company’s assets as of March 31, 2012 amounted to P92,151.1 million, 3.3% higher as
compared to the P95,326.7 million level as of March 31, 2011.
SEC Form 17Q – 1Q 2012 15
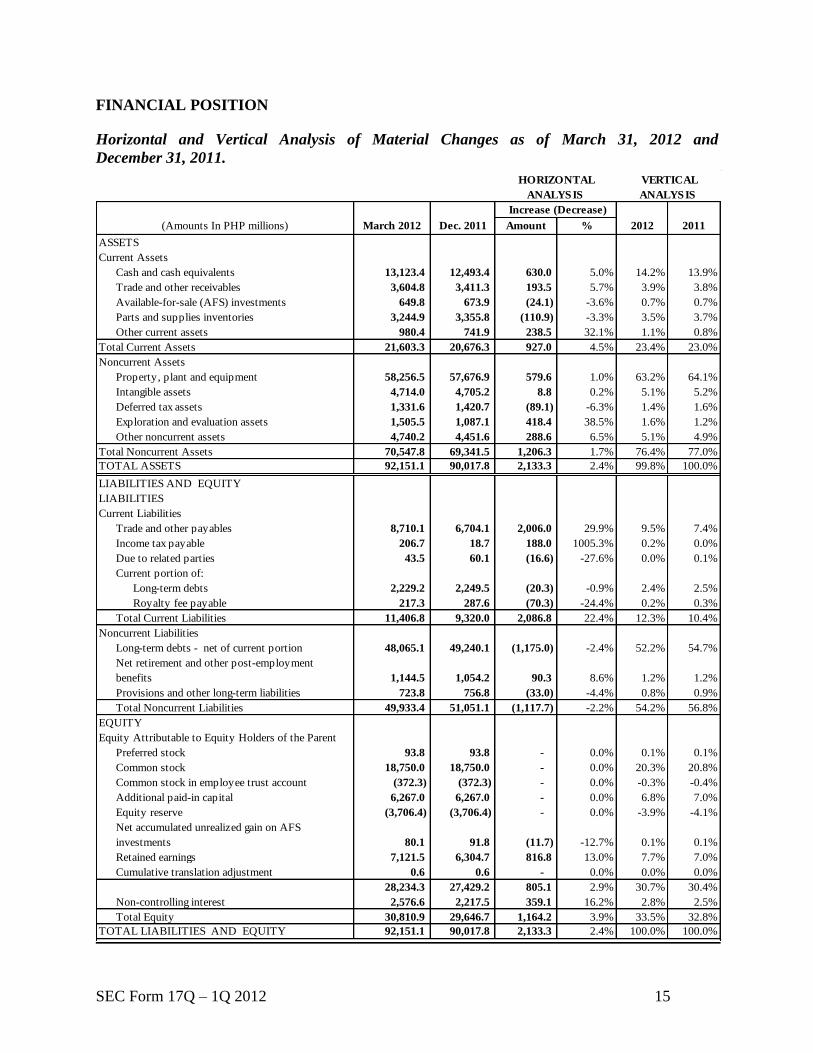
FINANCIAL POSITION
Horizontal and Vertical Analysis of Material Changes as of March 31, 2012 and
December 31, 2011.
(Amounts In PHP millions) March 2012 Dec. 2011 Amount % 2012 2011
ASSETS
Current Assets
Cash and cash equivalents 13,123.4 12,493.4 630.0 5.0% 14.2% 13.9%
Trade and other receivables 3,604.8 3,411.3 193.5 5.7% 3.9% 3.8%
Available-for-sale (AFS) investments 649.8 673.9 (24.1) -3.6% 0.7% 0.7%
Parts and supplies inventories 3,244.9 3,355.8 (110.9) -3.3% 3.5% 3.7%
Other current assets 980.4 741.9 238.5 32.1% 1.1% 0.8%
Total Current Assets 21,603.3 20,676.3 927.0 4.5% 23.4% 23.0%
Noncurrent Assets
Property, plant and equipment 58,256.5 57,676.9 579.6 1.0% 63.2% 64.1%
Intangible assets 4,714.0 4,705.2 8.8 0.2% 5.1% 5.2%
Deferred tax assets 1,331.6 1,420.7 (89.1) -6.3% 1.4% 1.6%
Exploration and evaluation assets 1,505.5 1,087.1 418.4 38.5% 1.6% 1.2%
Other noncurrent assets 4,740.2 4,451.6 288.6 6.5% 5.1% 4.9%
Total Noncurrent Assets 70,547.8 69,341.5 1,206.3 1.7% 76.4% 77.0%
TOTAL ASSETS 92,151.1 90,017.8 2,133.3 2.4% 99.8% 100.0%
LIABILITIES AND EQUITY
LIABILITIES
Current Liabilities
Trade and other payables 8,710.1 6,704.1 2,006.0 29.9% 9.5% 7.4%
Income tax payable 206.7 18.7 188.0 1005.3% 0.2% 0.0%
Due to related parties 43.5 60.1 (16.6) -27.6% 0.0% 0.1%
Current portion of:
Long-term debts 2,229.2 2,249.5 (20.3) -0.9% 2.4% 2.5%
Royalty fee payable 217.3 287.6 (70.3) -24.4% 0.2% 0.3%
Total Current Liabilities 11,406.8 9,320.0 2,086.8 22.4% 12.3% 10.4%
Noncurrent Liabilities
Long-term debts - net of current portion 48,065.1 49,240.1 (1,175.0) -2.4% 52.2% 54.7%
Net retirement and other post-employment
benefits 1,144.5 1,054.2 90.3 8.6% 1.2% 1.2%
Provisions and other long-term liabilities 723.8 756.8 (33.0) -4.4% 0.8% 0.9%
Total Noncurrent Liabilities 49,933.4 51,051.1 (1,117.7) -2.2% 54.2% 56.8%
EQUITY
Equity Attributable to Equity Holders of the Parent
Preferred stock 93.8 93.8 - 0.0% 0.1% 0.1%
Common stock 18,750.0 18,750.0 - 0.0% 20.3% 20.8%
Common stock in employee trust account (372.3) (372.3) - 0.0% -0.3% -0.4%
Additional paid-in capital 6,267.0 6,267.0 - 0.0% 6.8% 7.0%
Equity reserve (3,706.4) (3,706.4) - 0.0% -3.9% -4.1%
Net accumulated unrealized gain on AFS
investments 80.1 91.8 (11.7) -12.7% 0.1% 0.1%
Retained earnings 7,121.5 6,304.7 816.8 13.0% 7.7% 7.0%
Cumulative translation adjustment 0.6 0.6 - 0.0% 0.0% 0.0%
28,234.3 27,429.2 805.1 2.9% 30.7% 30.4%
Non-controlling interest 2,576.6 2,217.5 359.1 16.2% 2.8% 2.5%
Total Equity 30,810.9 29,646.7 1,164.2 3.9% 33.5% 32.8%
TOTAL LIABILITIES AND EQUITY 92,151.1 90,017.8 2,133.3 2.4% 100.0% 100.0%
HORIZONTAL
ANALYSIS
VERTICAL
ANALYSIS
Increase (Decrease)

SEC Form 17Q – 1Q 2012 16
Assets
Cash and Cash Equivalents
The 5.0% or P630.0 million increase to P13,123.4 million as of March 31, 2012 from the
P12,493.4 million December 31, 2011 balance was mainly due to P798.9 million regular
long-term debt servicing offset by the P132.7 million dividend received from FG Hydro.
Trade and Other Receivables
Trade and other receivables increased by 5.7% or P193.5 million to P3,604.8 million as of
March 31, 2012 from the P3,411.3 million balance as of December 31, 2011 mainly due to
BGI revenues coming from BATELEC and Linde.
Other Current Assets
This account increased by 32.1% or P238.5 million to P980.4 million as of March 31, 2012
from the P741.9 million balance in December 2011 primarily due to the P118.6 million
increase in withholding tax certificates and P97.3 million increase in prepaid expenses.
Property, plant and equipment
This account increased by 1.0% or P579.6 million to P58,256.5 million as of March 31, 2012
from the balance of P57,676.9 million as of December 31, 2011. Testing and commissioning
revenues generated by Bac-man Unit 2 for the period was netted off in this account as
required by PAS 16.
Deferred Tax Assets
This account decreased by 6.3% or P89.1 million to P1,331.6 million as of
March 31, 2012 from the P1,420.7 million balance as of December 31, 2011 mainly due to
the lower recognition of deferred tax assets on unrealized forex gains on translation of long-
term foreign loans and GCGI’s application of NOLCO to its taxable income for the period.
Exploration and Evaluation Assets
This account increased by 38.5% or P418.4 million to P1,505.5 million as of March 31, 2012
from the balance of P1,087.1 million as of December 31, 2011 mainly due to the
expenditures for the exploration activities in Bacman Rangas/Kayabon and Tanawon areas.
Other Noncurrent Assets
This account increased by 6.5% or P288.6 million to P4,740.2 million as of March 31, 2012
from the P4,451.6 million balance as of December 31. 2011 mainly due to the increase in
Input VAT.

SEC Form 17Q – 1Q 2012 17
Liabilities
Trade and other payables
This account increased by 29.9% or P2,006.0 million to P8,710.1 million as of
March 31, 2012 from the P6,704.1 million balance as of December 31. 2011 due to the
P1,882.5 million accrual of cash dividend declared on March 13, 2012.
Income Tax payable
This account increased by 1005.3% or P188.0 million, to P206.7 million as of
March 31, 2012 from the P18.7 million balance as of December 31, 2011 arising from the
Parent Company’s taxable income for the period and the testing and commissioning revenues
generated by Bac-man Unit 2 for the period.
Due to related parties
This account decreased by 27.6% or P16.6 million to P43.5 million as of March 31, 2012
from the P60.1 million balance as of December 31, 2011 mainly due to partial settlement of
liabilities by the Parent Company.
Royalty fee payable - current portion
Royalty fee payable decreased by 24.4% or P70.3 million, to P217.3 million as of
March 31, 2012 from the P287.6 million balance at year-end 2011 was due to the payment of
royalty fee for the period.
Net retirement and other post-employment benefits
This account increased by 8.6% or P90.3 million to P1,144.5 million as of March 31, 2012
from the P1,054.2 million balance as of December 31, 2011 due to the accrual of retirement
benefits for the period.
Net accumulated unrealized gain on AFS investments
This account decreased by 12.7% or P11.7 million to P80.1 million as of March 31, 2012
from P91.8 million as of December 31, 2011 mainly due to the decrease in fair value of the
investments for the period.
Retained Earnings
Retained Earnings increased by 13.0% or P816.8 million, to P7,121.5 million as of
March 31, 2012 from P6,304.7 million as of December 31, 2011 mainly due to the
P2,699.3 million net income for the first quarter of 2012 offset by the P1,882.5 million
payment of cash dividend.

SEC Form 17Q – 1Q 2012 18
Non-controlling Interest
Non-controlling Interest increased by 16.2% or P359.1 million to P2,576.6 million as of
March 31, 2012 from P2,217.5 million balance as of December 31, 2011 mainly due to the
P447.6 million net income for the first quarter of 2012 offset by the P88.5 million payment of
cash dividend.

SEC Form 17Q – 1Q 2012 19
Horizontal and Vertical Analysis of Material Changes as of March 31, 2012 and 2011.
BALANCE SHEET
Analysis of Material Changes as of March 31, 2012 and 2011
(Amounts In PHP millions) March 2012 March 2011 Amount % 2012 2011
ASSETS
Current Assets
Cash and cash equivalents 13,123.4 19,814.6 (6,691.2) -33.8% 14.2% 20.8%
Trade and other receivables 3,604.8 2,922.3 682.5 23.4% 3.9% 3.1%
Available-for-sale (AFS) investments 649.8 690.3 (40.5) -5.9% 0.7% 0.7%
Parts and supplies inventories 3,244.9 2,717.2 527.7 19.4% 3.5% 2.9%
Derivative assets - 11.8 (11.8) -100.0% 0.0% 0.0%
Other current assets 980.4 853.6 126.8 14.9% 1.1% 0.9%
Total Current Assets 21,603.3 27,009.8 (5,406.5) -20.0% 23.4% 28.3%
Noncurrent Assets
Property, plant and equipment 58,256.5 58,084.8 171.7 0.3% 63.2% 60.9%
Intangible assets 4,714.0 4,519.0 195.0 4.3% 5.1% 4.7%
Deferred tax assets 1,331.6 987.9 343.7 34.8% 1.4% 1.0%
Exploration and evaluation assets 1,505.5 1,201.5 304.0 25.3% 1.6% 1.3%
Other noncurrent assets 4,740.2 3,523.8 1,216.4 34.5% 5.1% 3.7%
Total Noncurrent Assets 70,547.8 68,317.0 2,230.8 3.3% 76.4% 71.7%
TOTAL ASSETS 92,151.1 95,326.8 (3,175.7) -3.3% 99.8% 100.0%
LIABILITIES AND EQUITY
LIABILITIES
Current Liabilities
Loan payable - 90.0 (90.0) -100.0% 0.0% 0.1%
Trade and other payables 8,710.1 8,232.5 477.6 5.8% 9.5% 8.6%
Income tax payable 206.7 239.7 (33.0) -13.8% 0.2% 0.3%
Due to related parties 43.5 251.4 (207.9) -82.7% 0.0% 0.3%
Derivative liabilities - 3.6 (3.6) -100.0% 0.0% 0.0%
Current portion of:
Long-term debts 2,229.2 1,970.0 259.2 13.2% 2.4% 2.1%
Royalty fee payable 217.3 277.5 (60.2) -21.7% 0.2% 0.3%
Total Current Liabilities 11,406.8 11,064.7 342.1 3.1% 12.3% 11.6%
Noncurrent Liabilities
Long-term debts - net of current portion 48,065.1 51,487.2 (3,422.1) -6.6% 52.2% 54.0%
Royalty fee payable - net of current portion - 217.8 (217.8) -100.0% 0.0% 0.2%
Net retirement and other post-employment benefits 1,144.5 1,298.6 (154.1) -11.9% 1.2% 1.4%
Provisions and other long-term liabilities 723.8 573.8 150.0 26.1% 0.8% 0.7%
Total Noncurrent Liabilities 49,933.4 53,577.4 (3,644.0) -6.8% 54.2% 56.3%
EQUITY
Equity Attributable to Equity Holders of the Parent
Preferred stock 93.8 93.8 - 0.0% 0.1% 0.1%
Common stock 18,750.0 18,750.0 - 0.0% 20.3% 19.7%
Common stock in employee trust account (372.3) (377.5) 5.2 -1.4% -0.3% -0.4%
Additional paid-in capital 6,267.0 6,266.3 0.7 0.0% 6.8% 6.6%
Equity reserve (3,706.4) (3,706.4) - 0.0% -3.9% -3.9%
Net accumulated unrealized gain on AFS investments 80.1 110.3 (30.2) -27.4% 0.1% 0.1%
Retained earnings 7,121.5 7,898.8 (777.3) -9.8% 7.7% 8.3%
Cumulative translation adjustment 0.6 1.4 (0.8) -57.1% 0.0% 0.0%
28,234.3 29,036.7 (802.4) -2.8% 30.7% 30.4%
Non-controlling Interest 2,576.6 1,648.0 928.6 56.3% 2.8% 1.7%
Total Equity 30,810.9 30,684.7 126.2 0.4% 33.5% 32.1%
TOTAL LIABILITIES AND EQUITY 92,151.1 95,326.8 (3,175.7) -3.3% 100.0% 100.0%
HORIZONTAL
ANALYSIS
VERTICAL
ANALYSIS
Increase

SEC Form 17Q – 1Q 2012 20
Assets
Cash and Cash Equivalents
This account decreased by 33.8% or P6,691.2 million to P13,123.4 million as of
March 31, 2012 from the P19,814.6 million balance as of March 31, 2011 primarily due to
the following:
P5,215.2 million pre payment of OECF 9th, 18th, 19th and 21st Yen and regular debt
servicing in 2011;
P798.9 million settlement of regular long-term debt servicing in 2012;
P3,007.5 million cash dividends paid by the parent company in 2011; and
P175.0 million payment of short-term borrowings.
These were offset by the P3,262.5 million proceeds from IFC 2.
Trade and Other Receivables
This account increased by 23.4% or P682.5 million to P3,604.8 million as of March 31, 2012
from the P2,922.3 million balance as of March 31, 2011. The increase is mainly due to the
BGI revenues coming from BATELEC and Linde and GCGI’s higher revenues.
Available-For-Sale (AFS) Investments
AFS Investments decreased by 5.9% or P40.5 million to P649.8 million as of March 31, 2012
from the P690.3 million balance as of March 31, 2011 due to foreign exchange losses
sustained in translating the placements to the continued appreciation of the Peso versus the
US Dollar exchange rate.
Parts and Supplies Inventories
This account increased by 19.4% or P527.7 million to P3,244.9 million balance as of
March 31, 2012 from the P2,717.2 million balance for the same period in 2011 due to the
increase , net of withdrawals, on various materials and supplies for drilling, maintenance and
rehabilitation activities in 2011.
Derivative assets
The derivative assets P11.8 million balance as of March 31, 2011 pertains to the fair value of
the outstanding foreign currency forward and foreign exchange swap contracts.
Other Current Assets
Other current assets increased by 14.9% or P126.8 million to P980.4 million as of
March 31, 2012 from the P853.6 million posted for the same period in 2011 is attributable to
the P248.7 million increase in prepaid expenses offset by P115.6 million decrease in
withholding taxes.
SEC Form 17Q – 1Q 2012 21
Deferred Tax Assets
This account increased by 34.8% or P343.7 million to P1,331.6 million as of March 31, 2012
from the balance of P987.9 million as of March 31, 2011 mainly due to the recognition of
deferred tax assets on the provision for full impairment of NNGP’s assets amounting to
P4,998.6 million and unrealized forex loss on dollar denominated loans in 2011.
Exploration and Evaluation Assets
This account increased by 25.3% or P304.0 million to P1,505.5 million as of March 31, 2012
from the balance of P1,201.5 million as of March 31, 2011 primarily due to the expenses of
Mindanao, Bacman Rangas/Kayabon, and Tanawon areas.
Other Noncurrent Assets
This account increased by 34.5% or P1,216.4 million, to P4,740.2 million as of
March 31, 2012 from the P3,523.8 million as of March 31, 2011 mainly due to the
P934.4 million increase in input VAT and P579.8 million increase long term receivables.
These were offset by the increase in allowance for doubtful accounts of P298.3 million.
Liabilities
Loan payable
This account decreased by 100.0%, or P90.0 million as of March 31, 2012 due to the
settlement of the loan.
Trade and other payables
This account increased by 5.8%, or P477.6 million, to P8,710.1 million as of March 31, 2012
from the balance of P8,232.5 million in the same period of 2011 mainly due to the
P654.7 million increase in accounts payable and offset by the P232.2 million decrease in
accrued interest and guarantee fee and other payables.
Income tax payable
Income tax payable decreased by 13.8% or P33.0 million to P206.7 million as of
March 31, 2012 from P239.7 million for the same period in 2011 mainly due to the
application of withholding tax certificates in the payment of income tax due for the 4th qtr of
2010 and 1st qtr. to 3rd qtr of 2011.

SEC Form 17Q – 1Q 2012 22
Due to related parties
This account decreased by 82.7% or P207.9 million to P43.5 million as of March 31, 2012
from the balance of P251.4 million as of March 31, 2011 primarily due to the settlement of
advances from First Gen of P235.0 million offset by increase in consultancy fee of
P28.6 million.
Derivative liabilities
The P3.6 million balance as of March 31, 2011 pertains to the fair value of the outstanding
foreign currency forward and foreign exchange swap contracts with various counterparties.
Long-term debts (current portion)
This account increased by 13.2% or P259.2 million to P2,229.2 million as of March 31, 2012
from the balance of P1,970.0 million as of March 31, 2011 mainly due to the P687.5 million
reclassification of the current portion of maturing IFC, FRCN and PNB debt obligation in
2012. These were offset by the P402.6 million settlement maturing debt obligation and
prepayment of current portion of OECF 9th, 18th, 19th and 21st Yen loan in 2011.
Royalty fee payable (current portion )
This account decreased by 21.7 % or P60.2 million to P217.3 million as of March 31, 2012
from the balance of P277.5 million as of March 31, 2011 mainly due to P80.3 million
payment to DOE and LGU’s offset by P20.1 million accretion on Day 1 gain recognized
from April 1, 2011 to March 31, 2012.
Long-term debt (net of current portion)
Long-term debts, consisting of JPY, US$ and PHP loans, decreased by 6.6% or
P3,422.1 million to P48,065.1 million as of March 31, 2012 from P51,487.2 million as of
March 31, 2011 due to the following:
Settlement of P4,260.6 million OECF 21st Yen loan and P128.0 million OECF 8th, 9th,
18th and 19th Yen loan,
P1,532.2 million and P496.8 million reclassification to current portion of obligation
due in 2012 of FRCN and IFC Loan, respectively.
These were offset by P3,262.5 million proceeds from of IFC loan 2.
Royalty fee payable (net of current portion )
This account decreased by 100.0% or P217.8 million as of March 31, 2012 primarily due to
the reclassification to current portion of outstanding royalty fees payable to 2012.

SEC Form 17Q – 1Q 2012 23
Net retirement and other post-retirement benefits
This account decreased by 11.9% or P154.1 million to P1,144.5 million as of March 31, 2012
from P1,298.6 million balance as of March 31, 2011 mainly due to contribution to the fund in
2011 offset by the accrual of retirement benefits for the period.
Provisions and other long-term liabilities
This account increased by 26.1% or P150.0 million to P723.8 million as of March 31, 2012
from P573.8 million balance as of March 31, 2011 mainly due to the P64.4 million asset
retirement obligation recognized in 2011, P28.7 million accretion for the period and
P54.1 million accrual of sick leave and vacation leave for the period net of payment of the
10 days monetized vacation leave.
Net accumulated unrealized gain on AFS investments
This account decreased by 27.4% or P30.2 million to P80.1 million as of March 31, 2012
from P110.3 million as of March 31, 2011 mainly due to the decrease in fair value of the
investments for the period.
Retained Earnings
Retained Earnings decreased by 9.8% or P777.3 million to P7,121.5 million as of
March 31, 2012 from P7,898.8 million balance as of March 31, 2011 mainly due to the net
loss of P1,548.9 million posted from March 31, 2011 to December 31, 2011 and
P1,882.5 million payment of cash dividend for the year offset by P2,699.3 million net income
for the first quarter of 2012.
Non-controlling Interest
Non-controlling Interest increased by 56.3% or P928.6 million to P2,576.6 million as of
March 31, 2012 from P1,648.0 million balance as of March 31, 2011 mainly due to the net
income of P703.1 million posted from March 31, 2011 to December 31, 2011 and
P447.6 million net income for the first quarter of 2012. This was offset by P88.5 million
payment of cash dividend this year.

SEC Form 17Q – 1Q 2012 24
CASH FLOW
March 31, 2012 vs. March 31, 2011
Net cash flows from operating activities increased by 1.0% or P35.8 million to P3,593.6 million
in the first quarter of 2012 from P3,557.9 million during the same period in 2011 mainly due to
the P704.4 million improved cash generation from operations due to increased revenues and
P80.0 million decrease in retirement and other post-retirement benefits paid. These were offset
by the P715.1 million increase in interest and financing charges paid and P33.5 million increase
in withholding tax certificates.
Net cash flows used in investing activities decreased by 10.4% or P236.9 million to
P2,042.0 million in March 2012 as compared to the P2,278.9 million during the same period in
2011 primarily due to the decrease in acquisition of property, plant and equipment by
P689.2 million. This was offset by the P416.5 million increase in exploration and evaluation
assets.
The movement of P13,536.1 million, to P927.9 million on net cash flows used in financing
activities in March 2012 from the P12,608.2 million net cash flows from financing activities
during the same period in 2011 was mainly due to the P13,350 million proceeds from the
US$300M notes in 2011.

SEC Form 17Q – 1Q 2012 25
DISCUSSION ON THE SUBSIDIARIES
FG Hydro
(Amounts in PHP millions)
As of and for the periods ended
March 31
2012 2011
Operating revenues 1,411.1 517.2
Operating expenses 198.5 225.4
Other expenses – net 93.6 100.7
Income before tax 1,119.0 191.1
Provision for (benefit from) income tax - -
Net income 1,119.0 191.1
Total current assets 3,414.0 1,822.2
Total noncurrent assets 7,156.1 7,364.3
Total current liabilities 650.4 491.9
Total noncurrent liabilities 4,219.2 4,574.6
Total equity 5,700.5 4,120.0
FG Hydro generated revenues of P1,411.1 million for the period ended March 31, 2012, almost thrice the
revenues of P517.2 million for the same period in 2011. The favorable variance was mainly on account of
revenues earned from sale of electricity, as ancillary services to National Grid Corporation of the
Philippines (“NGCP”), amounting to P596.9 million, and the temporary assumption of BGI’s Power
Supply Agreements (PSAs) with Batangas Electric Cooperative II (“BATELEC II”) 48MW and Linde
Philippines 6MW amounting to P288.7 million. There were no revenues from the said entities for the
same period in 2011.
The favorable variance in operating expenses is mainly on account of lower depreciation, operations and
maintenance expenses and taxes and licenses in 2012. Higher interest income from short-term deposits of
P16.8 million in 2012 versus P9.1 million in 2011 further contributed to the favorable variance. Overall,
FG Hydro posted a net income of P1,119.0 million for the period ended March 31, 2012, P927.9 million
or 485.6% higher than the P191.1 million reported income for the same period in 2011.
Total assets as of March 31, 2012 stood at P10,570.1 million, P1,383.6 million or 15.1% higher than the
2011 level of P9,186.5 million. The favorable variance was mainly due to higher cash and accounts
receivable trade balances in 2012. As compared with the same period in 2011, there were no electricity
sales for ancillary services yet.
As of March 31, 2012, total liabilities stood at P4,869.6 million, P196.9 million or 3.9% lower than the
2011 level of P5,066.5 million. The decrease in liabilities was mainly due to the continuous pay-out of the
scheduled semi-annual loan repayments.
Total equity as of March 31, 2012 of P5,700.5 million is P1,580.5 million or 38.4% higher compared to
the March 31, 2011 level of P4,120.0 million.

SEC Form 17Q – 1Q 2012 26
Green Core Geothermal Inc.
(Amounts in PHP millions)
As of and for the periods ended
March 31 2012 2011
Revenues 2,365.4 1,814.7 Operating expenses* (1,901.8) (2,072.5) Other income (charges) - net 23.9 (107.9) Income (loss) before income tax 487.5 (365.7) Benefit from (provision for) income tax –
deferred (48.6) 36.6
Net income (loss) 438.9 (329.1)
Total Current Assets 1,729.2 1,249.4 Total Non-Current Assets 9,963.7 9,727.0 Total Liabilities 2,442.0 7,593.6 Total Equity 9,250.9 3,382.8
*Includes Cost of Sale of Electricity and General and Administrative Expenses
GCGI’s revenues increased by 30.3% or P550.7 million, to P2,365.4 million for the three-month period
ended March 31, 2012 from P1,814.7 million for the same period in 2011 due to higher revenues from the
sale of electricity as per agreed contracts that became effective in mid-2011.
Operating expenses decreased by 8.2% or P170.7 million, to P1,901.8 million in 2012 from
P2,072.5 million in 2011 due to lower cost of steam by an average of P0.19/kWh (P88.0 million). The
decrease is also due to lower operations & maintenance of P84.2 million and purchased services &
utilities of P28.8 million offset by higher general & administrative expenses of P29.8 million.
This period’s other income of P23.9 million consisted mainly of foreign exchange gains and the absence
in 2012 of interest expense.
Provision for income tax - deferred of P48.6 million in 2012 was a reversal of P36.6 million benefit from
income tax - deferred in 2011.
Total current assets increased by 38.4% or P479.8 million, to P1,729.2 million in 2012 from
P1,249.4 million in 2011 largely due to higher trade & other receivables of P301.1 million and other
current assets of P175.5 million.
Total noncurrent assets increased by 2.4% or P236.7 million, to P9,963.7 million in 2012 from
P9,727.0 million in 2011 due to higher property, plant and equipment of P190.8 million and other
noncurrent assets of P91.5 million reduced by lower deferred tax asset of P45.6 million.
Total liabilities decreased by 67.8% or P5,151.6 million, to P2,442.0 million in 2012 from
P7,593.6 million in 2011 while total equity increased by 173.5% or P5,868.1 million, to P9,250.9 million
in 2012 from P3,382.8 million in 2011 due mainly to the conversion of the P5,452.5 million advances
from EDC to equity coupled with the net income for the period April 1, 2011 to March 31, 2012
amoutning to P415.6 million.

SEC Form 17Q – 1Q 2012 27
Bac-Man Geothermal Inc.
(Amounts in PHP millions)
As of and for the periods ended
March 2012
March 2011
(Restated)
Revenues 738,935.3 –
Expenses (716,913.3) (2,135.8)
Other income 834.5 691.8
Operating income (loss) 22,856.5 (1,444.0)
Benefit from (provision for) income tax (36,208.1) 145.7
Net loss (13,351.6) (1,298.3)
Total Current Assets 484.9 134.4
Total Non-Current Assets 3,449.5 1,733.2
Total Current Liabilities 821.5 1,901.1
Total Equity 3,112.9 (33.5) *BGI was incorporated in the Philippines on April 7, 2010.
As of March 31, 2012, BGI has yet to start commercial operations.
Revenues earned result from electricity sales for the period pursuant to the signed PSAs with BATELEC
and Linde Philippines effective December 26, 2011.
The increase in expenses pertains primarily due to the cost of replacement power amounting to
P706.5 million.
The increase in current assets by 260.7% or P=350.5 million is due mainly to the increase in trade and
other receivables amounting to P=360.7 million partially offset by issuances of parts and supplies
inventories amounting to P=17.9 million.
Non-current asset increased by 99.0% or P=1,716.2 million resulting mainly from capitalized costs for the
on-going rehabilitation of the power plants of P=1,529.0 million. Testing and commissioning revenues
generated by Bac-man Unit 2 for the period was netted off in this account as required by PAS 16.
The decrease in liabilities and corresponding increase in equity results from the conversion of payables to
related parties into equity as capital infusion in December 2011.

SEC Form 17Q – 1Q 2012 28
Commitments that will have an impact on the issuer’s liquidity
As of March 31, 2012, the company has unserved purchase orders and awarded contracts for the
purchase of various capital goods in the total amount of P155.7 million.
Other than these, we are not aware of any other material commitments that should impact the
Company’s liquidity.
Legal proceedings
There are no other material changes in the contingent liabilities since the last annual balance
sheet date.
FOREIGN EXCHANGE AND INTEREST RATE EXPOSURE
The Company has P=20,126.42 million in long-term US dollar denominated loans as of
March 31, 2012 which is 44.01% of the total company’s long-term loans.
OTHER MATTERS
CASH DIVIDEND
On March 13 2012, the BOD of the Parent Company approved the following cash dividends
in favor of all stockholders of record as of March 28, 2012 and payable on or before
April 24, 2012:
cash dividend of P=0.0008 per share on the preferred shares
regular cash dividend of P=0.10 per share on the common shares.

SEC Form 17Q – 1Q 2012 29
MAJOR STOCKHOLDERS
As of March 31, 2012, the total number of stockholders was 702 and price was P6.00 per share.
The public float level was at 52.79% (or 9,897,713,964 common shares).
List of Top 20 Stockholders as of March 31, 2012
Rank Name Nationality
Number of Shares
% Preferred Common Total
1
Red Vulcan Holdings
Corporation Filipino 9,375,000,000 7,500,000,000 16,875,000,000 60.00
2 PCD Nominee Corporation Foreign - 6,736,468,952 6,736,468,952 23.95
3 PCD Nominee Corporation Filipino - 3,147,041,711 3,147,041,711 11.19
4 First Gen Corporation Filipino - 991,782,700 991,782,700 3.53
5
Northern Terracotta Power
Corporation Filipino - 324,522,900 324,522,900 1.15
6 Federico R. Lopez Filipino - 6,092,501 6,092,501 0.02
7 Ernesto B. Rufino, Jr. Filipino - 5,694,700 5,694,700 0.02
8 Peter D. Garrucho, Jr. Filipino - 5,670,000 5,670,000 0.02
9 Benjamin K. Liboro Filipino - 3,525,500 3,525,500 0.01
10 Arthur A. De Guia Filipino - 2,200,000 2,200,000 0.01
11 CROSLO Holdings Corporation Filipino - 1,600,000 1,600,000 0.01
12 Hi-Light Corporation Filipino - 1,577,500 1,577,500 0.01
13 Mapazon Corporation Filipino - 1,470,000 1,470,000 0.01
14 Ronaldo C. Sabella Filipino - 1,100,000 1,100,000 0.00
15 ALG Holdings Corporation Filipino - 875,000 875,000 0.00
16 Raul I. Macatangay Filipino - 725,000 725,000 0.00
17 Rosalind Camara Filipino - 663,750 663,750 0.00
18 Rodolfo R. Waga, Jr. Filipino - 658,750 658,750 0.00
19 Emelita D. Sabella Filipino - 521,000 521,000 0.00
20
Rodolfo R. Waga, Jr. &/or Grace
B. Waga Filipino - 501,200 501,200 0.00

SEC Form 17Q – 1Q 2012 30
BOARD OF DIRECTORS
As of March 31, 2012, the members of Board of Directors of EDC are as follows:
Oscar M. Lopez Chairman Emeritus
Federico R. Lopez Chairman and Chief Executive Officer
Peter D. Garrucho, Jr. Director
Elpidio L. Ibañez Director
Ernesto B. Pantangco Director and Executive Vice President
Francis Giles B. Puno Director
Richard B. Tantoco Director, President and Chief Operating Officer
Jonathan C. Russell Director
Edgar O. Chua Independent Director
Francis Ed. Lim Independent Director
Arturo T. Valdez Independent Director
OFFICERS
As of March 31, 2012, the officers of EDC are as follows:
Name Position
Federico R. Lopez Chief Executive Officer
Richard B. Tantoco President and Chief Operating Officer
Ernesto B. Pantangco Executive Vice President
Agnes C. de Jesus Senior Vice President for Environment and
External Relations, and Compliance Officer
Nestor H. Vasay Senior Vice President, Chief Financial
Officer and Treasurer
Marcelino M. Tongco Senior Vice President
Manuel S. Ogena Senior Vice President for Technical Services
Dominic M. Camu Senior Vice President for Power Generation
Danilo C. Catigtig Senior Vice President for Strategic Initiatives
Office
Ernesto G. Espinosa Vice President for Human Resource
Management
Vincent Martin C. Villegas Vice President for Business Development
Erwin O. Avante Vice President for Corporate Finance
Rico G. Bersamin Vice President for Steam Field Operations
Ferdinand B. Poblete Vice President, Chief Information Officer
Ariel Arman V. Lapus Vice President/Project Development Officer
of EDC International
Ellsworth R. Lucero Vice President - Power
Dwight A. Maxino Vice President - So. Negros Geothermal

SEC Form 17Q – 1Q 2012 31
Name Position
Project
Manuel C. Paete Vice President - Leyte Geothermal Project
Liberato S. Virata Vice President - Bacon-Manito Geothermal
Project
Wilfredo A. Malonzo Vice President for Supply Chain
Management
Maribel A. Manlapaz Comptroller
Teodorico Jose R. Delfin Corporate Secretary
Ana Maria A. Katigbak-Lim Assistant Corporate Secretary
Glenn L. Tee Senior Manager, Internal Audit
Erudito S. Recio Senior Manager, Investor Relations


Annex I
Energy Development Corporation and Subsidiaries A Subsidiary of Red Vulcan Holdings Corporation
Unaudited Interim Condensed Consolidated Financial Statements March 31, 2012 and 2011 (With Comparative Figures as of December 31, 2011 )
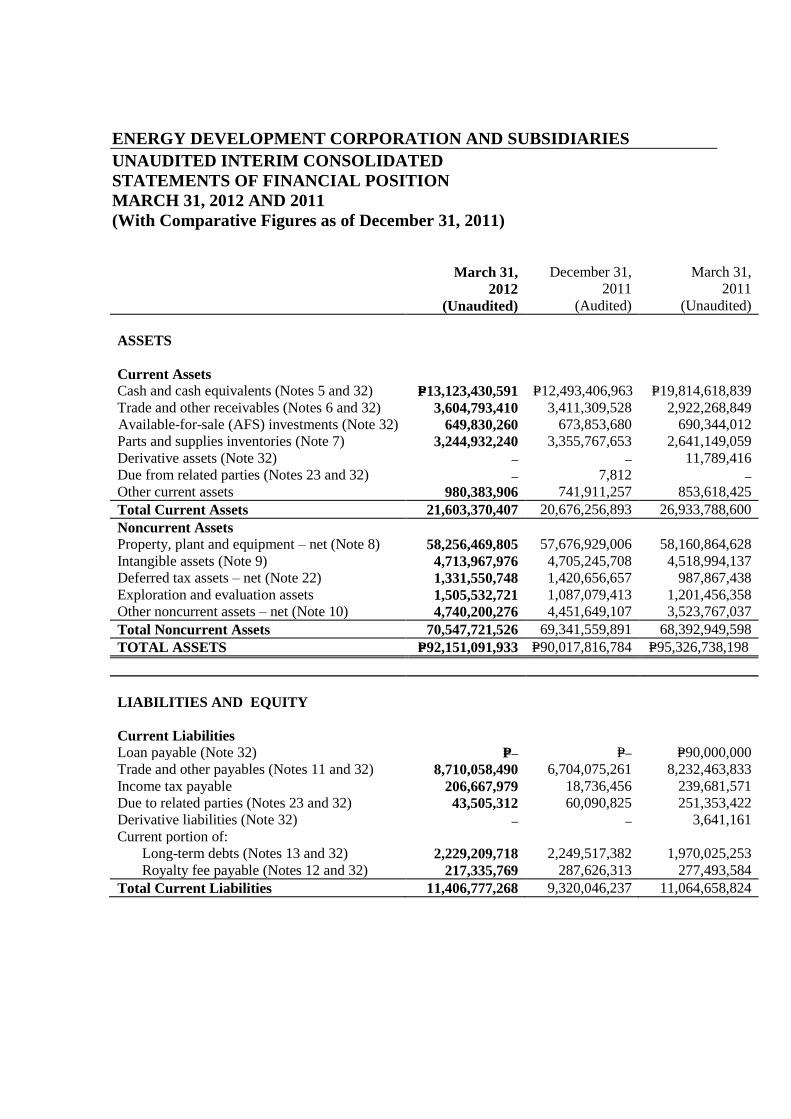
ENERGY DEVELOPMENT CORPORATION AND SUBSIDIARIES
UNAUDITED INTERIM CONSOLIDATED
STATEMENTS OF FINANCIAL POSITION
MARCH 31, 2012 AND 2011
(With Comparative Figures as of December 31, 2011)
March 31,
2012
(Unaudited)
December 31,
2011
(Audited)
March 31,
2011
(Unaudited)
ASSETS
Current Assets
Cash and cash equivalents (Notes 5 and 32) P=13,123,430,591 P=12,493,406,963 P=19,814,618,839
Trade and other receivables (Notes 6 and 32) 3,604,793,410 3,411,309,528 2,922,268,849
Available-for-sale (AFS) investments (Note 32) 649,830,260 673,853,680 690,344,012
Parts and supplies inventories (Note 7) 3,244,932,240 3,355,767,653 2,641,149,059
Derivative assets (Note 32) – – 11,789,416
Due from related parties (Notes 23 and 32) – 7,812 – Other current assets 980,383,906 741,911,257 853,618,425
Total Current Assets 21,603,370,407 20,676,256,893 26,933,788,600
Noncurrent Assets
Property, plant and equipment – net (Note 8) 58,256,469,805 57,676,929,006 58,160,864,628
Intangible assets (Note 9) 4,713,967,976 4,705,245,708 4,518,994,137
Deferred tax assets – net (Note 22) 1,331,550,748 1,420,656,657 987,867,438
Exploration and evaluation assets 1,505,532,721 1,087,079,413 1,201,456,358
Other noncurrent assets – net (Note 10) 4,740,200,276 4,451,649,107 3,523,767,037
Total Noncurrent Assets 70,547,721,526 69,341,559,891 68,392,949,598
TOTAL ASSETS P=92,151,091,933 P=90,017,816,784 P=95,326,738,198
LIABILITIES AND EQUITY
Current Liabilities
Loan payable (Note 32) P=– P=– P=90,000,000
Trade and other payables (Notes 11 and 32) 8,710,058,490 6,704,075,261 8,232,463,833
Income tax payable 206,667,979 18,736,456 239,681,571
Due to related parties (Notes 23 and 32) 43,505,312 60,090,825 251,353,422
Derivative liabilities (Note 32) – – 3,641,161
Current portion of:
Long-term debts (Notes 13 and 32) 2,229,209,718 2,249,517,382 1,970,025,253
Royalty fee payable (Notes 12 and 32) 217,335,769 287,626,313 277,493,584
Total Current Liabilities 11,406,777,268 9,320,046,237 11,064,658,824

March 31,
2012
(Unaudited)
December 31,
2011
(Audited)
March 31,
2011
(Unaudited)
Noncurrent Liabilities
Long-term debts - net of current portion
(Notes 13 and 32) 48,065,147,168 49,240,054,073 51,487,181,072
Royalty fee payable - net of current
portion (Notes 12 and 32) – – 217,825,561
Net retirement and other post-
employment benefits 1,144,547,300 1,054,237,256 1,298,609,476
Provisions and other long-term
liabilities (Note 8) 723,793,331 756,877,725 573,836,850
Total Noncurrent Liabilities 49,933,487,799 51,051,169,054 53,577,452,959
Total Liabilities 61,340,265,067 60,371,215,291 64,642,111,783
Equity (Note 14)
Attributable to Equity Holders of the
Parent Company:
Preferred stock 93,750,000 93,750,000 93,750,000
Common stock 18,750,000,000 18,750,000,000 18,750,000,000
Common shares in employee trust
account (372,272,723) (372,272,723) (377,483,019)
Additional paid-in capital 6,266,966,828 6,266,966,828 6,266,341,978
Equity reserve (3,706,430,769) (3,706,430,769) (3,706,430,769)
Net accumulated unrealized gain on
AFS investments 80,075,239 91,758,915 110,290,794
Cumulative translation adjustment 633,539 592,534 1,370,000
Retained earnings 7,121,471,769 6,304,695,114 7,898,784,383
28,234,193,883 27,429,059,899 29,036,623,367
Non-controlling interest 2,576,632,983 2,217,541,594 1,648,003,048
Total Equity 30,810,826,866 29,646,601,493 30,684,626,415
TOTAL LIABILITIES AND
EQUITY P=92,151,091,933 P=90,017,816,784 P=95,326,738,198
See accompanying Notes to Unaudited Interim Condensed Consolidated Financial Statements.

ENERGY DEVELOPMENT CORPORATION AND SUBSIDIARIES
UNAUDITED INTERIM CONSOLIDATED STATEMENTS OF INCOME
FOR THE PERIODS ENDED MARCH 31, 2012 AND 2011
2012 2011
REVENUES (Note 4)
Sale of electricity P=7,536,756,442 P=5,798,160,507
Revenue from drilling services 167,581,380 154,616,637
7,704,337,822 5,952,777,144
COSTS OF SALES AND SERVICES
Costs of sales of electricity and steam (Note 15) (2,741,304,687) (2,762,726,562)
Cost of drilling services (Note 16) (95,439,340) (108,323,427)
(2,836,744,027) (2,871,049,989)
GENERAL AND ADMINISTRATIVE
EXPENSES (Note 17)
(919,583,173)
(888,899,817)
FINANCIAL INCOME (EXPENSES)
Interest income (Notes 4 and 20) 93,870,182 123,917,688
Interest expense (Notes 4 and 19) (1,015,345,353) (1,038,921,265)
(921,475,171) (915,003,577)
OTHER INCOME (CHARGES) (Note 4)
Foreign exchange gains - net (Note 18) 337,953,506 188,561,127
Derivatives gain (loss) – net – 37,553,046
Miscellaneous – net 59,407,284 30,702,512
397,360,790 256,816,685
INCOME BEFORE INCOME TAX 3,423,896,241 1,534,640,446
PROVISION FOR INCOME TAX
Current (187,931,523) (168,434,061)
Deferred (89,105,910) 94,387,514
(277,037,433) (74,046,547)
NET INCOME P=3,146,858,808 P=1,460,593,899
Net income attributable to:
Equity Holders of the Parent Company P=2,699,276,655 P=1,381,680,572
Non-controlling interest 447,582,153 78,913,327
P=3,146,858,808 P=1,460,593,899
Basic/Diluted Earnings Per Share for Net
Income Attributable to Equity Holders of
the Parent Company (Note 21) P=0.144 P=0.073
See accompanying Notes to Unaudited Interim Condensed Consolidated Financial Statements.
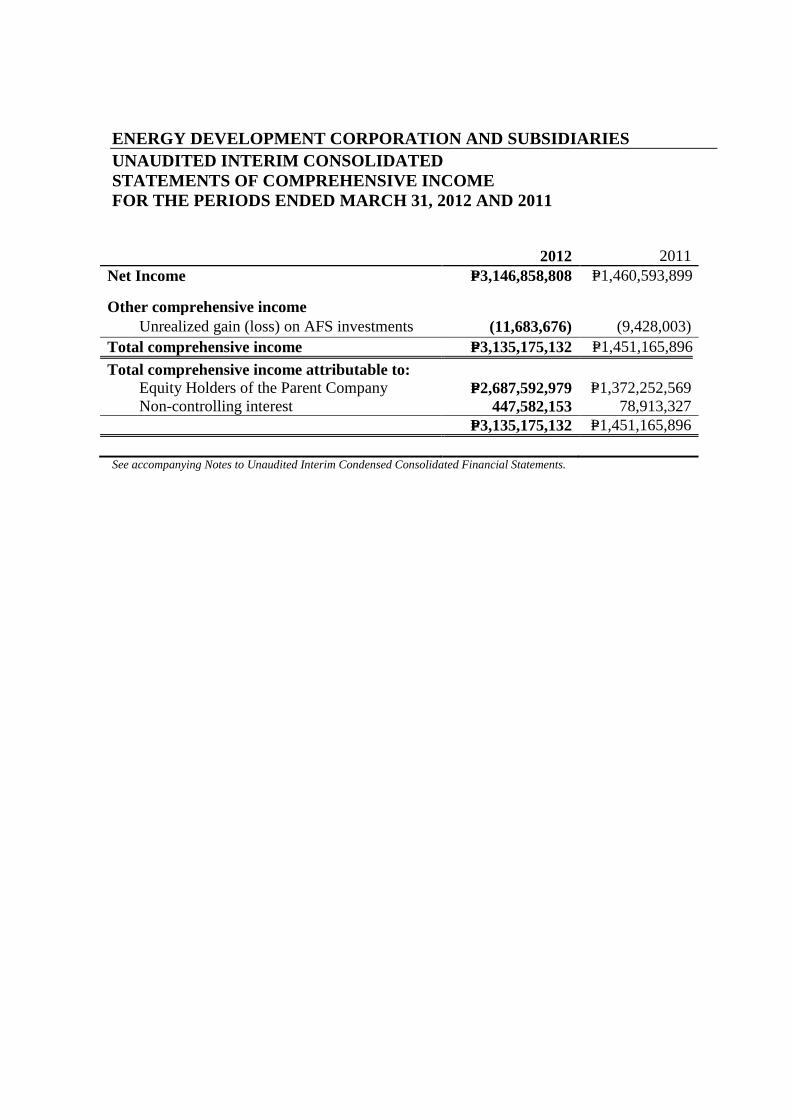
ENERGY DEVELOPMENT CORPORATION AND SUBSIDIARIES
UNAUDITED INTERIM CONSOLIDATED
STATEMENTS OF COMPREHENSIVE INCOME
FOR THE PERIODS ENDED MARCH 31, 2012 AND 2011
2012 2011
Net Income P=3,146,858,808 P=1,460,593,899
Other comprehensive income
Unrealized gain (loss) on AFS investments (11,683,676) (9,428,003)
Total comprehensive income P=3,135,175,132 P=1,451,165,896
Total comprehensive income attributable to:
Equity Holders of the Parent Company P=2,687,592,979 P=1,372,252,569
Non-controlling interest 447,582,153 78,913,327
P=3,135,175,132 P=1,451,165,896
See accompanying Notes to Unaudited Interim Condensed Consolidated Financial Statements.

ENERGY DEVELOPMENT CORPORATION AND SUBSIDIARIES
UNAUDITED INTERIM CONSOLIDATED STATEMENTS OF CHANGES IN EQUITY
FOR THE PERIODS ENDED MARCH 31, 2012 AND 2011
Equity Attributable to Equity Holders of the Parent Company
Preferred
Stock
Common
Stock
Common
Shares in
Employee
Trust Account
Additional
Paid-in
Capital
Equity
Reserve
Net
Accumulated
Unrealized
Gain on AFS
Investments
Retained
Earnings Subtotal
Non-controlling
Interest Total Equity
Cumulative
Translation
Adjustment
Balances, December 31, 2010, as
previously reported P=93,750,000 P=18,750,000,000 (P=379,219,785) P=6,266,099,283 (P=3,706,430,769) P=119,718,797
P=1,370,000 P=9,524,603,810 P=30,669,891,336 P=1,569,089,721 P=32,238,981,057
Total comprehensive income:
Net income – – – – – – – 1,381,680,572 1,381,680,572 78,913,327 1,460,593,899
Changes in fair value of AFS investments recognized in equity
–
–
–
–
– (9,428,003)
–
– (9,428,003)
– (9,428,003)
– – – – – (9,428,003) – 1,381,680,572 1,372,252,569 78,913,327 1,451,165,896
Cash dividend (Note 28) – – – – – – – (3,007,500,000) (3,007,500,000) (3,007,500,000) Share-based payment – – 1,736,766 464,953 – – – – 2,201,719 – 2,201,719
Deferred tax effect of share-based payment – – – (222,257) – – – – (222,257) – (222,257)
Balances, March 31, 2011 P=93,750,000 P=18,750,000,000 (P=377,483,019) P=6,266,341,979 (P=3,706,430,769) P=110,290,794 P=1,370,000 P=7,898,784,382 P=29,036,623,367 P=1,648,003,048 P=30,684,626,415
Balances, December 31, 2011 P=93,750,000 P=18,750,000,000 (P=372,272,723) P=6,266,966,828 (P=3,706,430,769) P=91,758,915 P=592,534 P=6,304,695,114 P=27,429,059,899 P=2,217,541,594 P=29,646,601,493
Total comprehensive income:
Net income – – – – – – – 2,699,276,655 2,699,276,655 447,582,153 3,146,858,808
Changes in fair value of AFS
investments recognized in equity
–
–
–
–
– (11,683,676)
–
– (11,683,676)
– (11,683,676) Cumulative translation adjustment – – – – – – 41,005 – 41,005 – 41,005
– – – – – (11,683,676) 41,005 2,699,276,655 2,687,633,984 447,582,153 3,135,216,137
Cash dividend (Note 28) – – – – – – – (1,882,500,000) (1,882,500,000) (88,490,764) (1,970,990,764)
Balances, March 31, 2012 P=93,750,000 P=18,750,000,000 (P=372,272,723) P=6,266,966,828 (P=3,706,430,769) P=80,075,239 P=633,539 P=7,121,471,769 P=28,234,193,883 P=2,576,632,983 P=30,810,826,866
See accompanying Notes to Unaudited Interim Condensed Consolidated Financial Statements.

ENERGY DEVELOPMENT CORPORATION AND SUBSIDIARIES
UNAUDITED INTERIM CONSOLIDATED STATEMENTS OF CASH FLOWS
FOR THE PERIODS ENDED MARCH 31, 2012 AND 2011
2012 2011
CASH FLOWS FROM OPERATING ACTIVITIES
Income before income tax P=3,423,896,241
P=1,534,640,446
Adjustments for:
Interest expense 1,015,345,353
1,038,921,265
Depreciation and amortization 897,498,991
906,034,567
Unrealized foreign exchange losses (gains) (439,037,300)
(179,415,157)
Interest income (93,870,182)
(123,917,688)
Provision for retirement and post-employment benefits 90,297,471
70,459,883
Recovery of impairment of property plant and
equipment (66,321,901)
–
Provision for share-based benefit cost –
2,201,719
Provision for doubtful accounts 1,003,830
Loss on retirement of property, plant and equipment (1,122,882)
207,660
Profit on storehouse items - inventory variations –
(3,926,511)
Operating income before working capital changes 4,827,689,621
3,245,206,184
Decrease (increase) in:
Trade and other receivables (144,522,954)
1,296,889,303
Parts and supplies inventories 110,835,413
(59,779,721)
Other current assets (204,971,055)
(1,669,438)
Due to related party 7,812
– Increase (decrease) in:
Trade and other payables 435,577,892
(204,340,380)
Due to related parties (57,150,511)
(19,044,294)
Royalty fee payable (74,987,732) (69,140,651)
Cash generated from operations 4,892,478,486
4,188,121,003
Interest and financing charges paid (1,265,347,644)
(550,254,169)
Income tax paid (33,501,594)
– Retirement and other post-retirement benefits paid 12,573
(80,000,000)
Net cash flows from operating activities 3,593,641,821 3,557,866,834

2012 2011
CASH FLOWS FROM INVESTING ACTIVITIES
Acquisition of property, plant and equipment (1,416,845,788)
(2,106,030,465)
Proceeds from sale of property and equipment 71,863,569
Interest received 45,189,497
129,296,048
Decrease (increase) in:
Exploration and evaluation assets (418,453,308)
(2,044,119)
Other noncurrent assets (323,791,575)
(300,127,644)
Net cash flows from (used in) investing activities (2,042,037,605) (2,278,906,180)
CASH FLOWS FROM FINANCING ACTIVITIES
Proceeds from:
Long-term debts –
13,350,000,000
Payments of:
Short-term loans –
(85,000,000)
Long-term debts (798,852,453)
(618,105,082)
Cash dividends (88,490,765)
–
Increase in other long-term liabilities (40,508,508)
(38,664,359)
Net cash flows (used in) financing activities (927,851,726) 12,608,230,559
NET INCREASE IN CASH AND CASH EQUIVALENTS 623,752,490
13,887,191,213
EFFECT OF FOREIGN EXCHANGE RATE CHANGES
ON CASH AND CASH EQUIVALENTS 6,271,137
(230,497,506)
CASH AND CASH EQUIVALENTS AT BEGINNING OF
PERIOD 12,493,406,964 6,157,925,132
CASH AND CASH EQUIVALENTS AT END OF
PERIOD P=13,123,430,591 P=19,814,618,839
See accompanying Notes to Unaudited Interim Condensed Consolidated Financial Statements.

ENERGY DEVELOPMENT (EDC) CORPORATION AND SUBSIDIARIES A Subsidiary of Red Vulcan Holdings Corporation
SELECTED NOTES TO THE UNAUDITED INTERIM CONDENSED
CONSOLIDATED FINANCIAL STATEMENTS
1. Corporate Information
Energy Development Corporation [formerly Energy Development (EDC) Corporation] (the
“Parent Company” or “EDC”) is a subsidiary of Red Vulcan Holdings Corporation (Red Vulcan).
The Parent Company and its subsidiaries (collectively hereinafter referred to as the “Company”),
were separately incorporated and registered with the Philippine Securities and Exchange
Commission (SEC) except for Energy Development (EDC) Corporation Chile Limitada
(EDC Chile Limitada) which was incorporated in Santiago, Chile. Below are the Parent
Company’s ownership interests in its subsidiaries:
Percentage of Ownership
2012 2011
Direct Indirect Direct Indirect
EDC Geothermal Corp. [Formerly First Luzon
Geothermal Energy Corporation] (EGC) 100.00%
– 100.00%
–
Green Core Geothermal Inc. (GCGI) – 100.00% – 100.00%
Bac-Man Geothermal Inc. (BGI)***
– 100.00% – 100.00%
Unified Leyte Geothermal Energy Inc.
(ULGEI)***
– 100.00% – 100.00%
Southern Negros Geothermal, Inc. (SNGI)**
– 100.00% – –
EDC Mindanao Geothermal Inc. (EMGI)**
– 100.00% – –
Bac-Man Energy Development Corporation
(BEDC)**
–
100.00% – –
Kayabon Geothermal, Inc. (KGI)**
– 100.00% – –
EDC Chile Limitada***
99.99% 0.01% 99.99% 0.01%
EDC Drillco Corporation (EDC Drillco)****
100.00% – 100.00% –
First Gen Hydro Power Corporation (FG Hydro) 60.00% – 60.00% –
EDC Wind Energy Holdings, Inc. (EWEHI)***
100.00% – 100.00% –
EDC Burgos Wind Power Corporation
(EBWPC)***
33.33%
66.67%
– 33.33%
66.67%
–
EDC Pagudpud Wind Power Corporation*
(EPWPC)* –
100.00% –
–
EHIL**
100.00% – – –
EDC HKL**
– 100.00% – –
EDC Chile Holdings SPA* 100.00% – – –
EDC Geotermica Chile* 100.00% – – –
EDC Peru Holdings S.A.C. * 100.00% – – –
EDC Geotermica Peru S.A.C. * 100.00% – – –
* Incorporated in 2012 and has not yet started commercial operations.
**Incorporated in 2011 and has not yet started commercial operations.
***Incorporated in 2010 and has not yet started commercial operations.
****Incorporated in 2009 and has not yet started commercial operations.

- 2 -
History of Ownership
Beginning December 13, 2006, the common shares of EDC were listed and traded on the
Philippine Stock Exchange (PSE). Up to November 2007, EDC was controlled by the Philippine
National Oil Company (PNOC), a government-owned and controlled corporation, and the
PNOC EDC Retirement Fund.
On November 29, 2007, PNOC and PNOC EDC Retirement Fund sold their combined interests in
EDC to Red Vulcan (a Philippine corporation). Red Vulcan was then a wholly owned subsidiary
of First Gen Corporation (First Gen, a publicly listed Philippine corporation) through Prime
Terracota Holdings Corporation (Prime Terracota). First Gen’s indirect interest in EDC consists
of 6.0 billion common shares and 7.5 billion preferred shares. Control was then established
through First Gen’s 60% indirect voting interest in EDC. Meanwhile, First Philippine Holdings
Corporation (First Holdings) directly owns 66.2% of the common shares of First Gen.
Accordingly, First Holdings became then the ultimate parent of the Company.
On May 12, 2009, First Gen’s indirect voting interest in Red Vulcan was reduced to 45% with the
balance taken up by Lopez Inc. Retirement Fund (40%) and Quialex Realty Corporation (15%)
through the issuance of preferred shares by Prime Terracota. As a result of this transaction, Prime
Terracota replaced First Holdings as the ultimate parent of EDC effective May 12, 2009.
Nature of Operations
The Parent Company operates 12 geothermal projects in five geothermal service contract areas,
namely Tongonan Geothermal Project (TGP), Southern Negros Geothermal Project (SNGP),
Bacon-Manito Geothermal Project (BMGP), Mt. Apo Geothermal Project (MGP) and Northern
Negros Geothermal Project (NNGP) under the Geothermal Service Contracts (GSCs) entered into
with the Department of Energy (DOE) pursuant to the provisions of Presidential Decree (P.D.)
1442. These GSCs were replaced by Geothermal Renewable Energy Service Contracts (GRESCs)
on October 23, 2009.
Geothermal steam produced is delivered to the company-owned power plants to produce
electricity. EDC sells power to National Power Corporation (NPC), privately-owned distribution
utilities (DUs) and large industrial customers, pursuant to Power Purchase Agreements (PPAs) and
Power Supply Agreements (PSAs). Separately, it also has drilling activities in Papua New
Guinea.
Change in Corporate Name
On the July 29, 2010 annual stockholders meeting, the stockholders approved the amendment of
the Parent Company’s name from Energy Development (EDC) Corporation to Energy
Development Corporation. The Philippine SEC approved the change of the Parent Company’s
name on November 5, 2010.
Subsidiaries
On October 20 and November 17, 2008, in line with its objective of focusing on renewable
energy, the Parent Company acquired a total of 60% interest in FG Hydro from First Gen. FG
Hydro operates the 132 Megawatt (MW) Pantabangan and Masiway Hydro-Electric Power Plants
(PAHEP/MAHEP) located in Nueva Ecija, Philippines. FG Hydro buys from and sells electricity
to the Wholesale Electricity Spot Market (WESM) and to various DUs under the Transition Power
Supply Contracts (TPSCs).
EGC is a special-purpose company incorporated on April 9, 2008 to participate in the bid for
another local power plant. The bid was won by and awarded to another local entity. Thereafter,
there has been no business activity yet as far as EGC is concerned other than being the investment

- 3 -
holding company of its wholly owned subsidiaries, namely GCGI, BGI, ULGEI, SNGI, EMGI,
BEDC and KGI. EGC also has a 0.01% stake in EDC Chile Limitada.
On March 8, 2011, the Philippine SEC approved the change of First Luzon Geothermal Energy
Corporation’s corporate name to EGC.
GCGI was incorporated on June 22, 2009 with primary activities on power generation,
transmission, distribution, and other energy related businesses. GCGI is currently operating the
192.5 MW Palinpinon and 112.5 MW Tongonan 1 geothermal power plants in Negros Oriental
and Leyte, respectively, following its successful acquisition from the Power Sector Assets and
Liabilities Management Corporation (PSALM) in 2009.
EDC Drillco is a company incorporated on September 28, 2009 to act as an independent service
contractor, consultant, specialized technical adviser for well construction and drilling, and other
allied activities.
BGI was incorporated on April 7, 2010 primarily to carry on the general business of generating,
transmitting, and/or distributing energy. BGI has successfully acquired the 150 MW Bac-Man
Geothermal Power Plants (BMGPP) from PSALM in 2010. BMGPP is currently under
rehabilitation to restore its capacity and reliability.
EWEHI is a holding company incorporated on April 15, 2010.
EBWPC is a company incorporated on April 13, 2010 to carry on the general business of
generating, transmitting, and/or distributing energy.
ULGEI is a company incorporated on June 23, 2010 to carry on the general business of generating,
transmitting, and/or distributing energy.
EDC Chile Limitada is a limited liability company incorporated on February 11, 2010 in
Santiago, Chile with the purpose of exploring, evaluating and extracting any mineral or substance
to generate geothermal energy. On January 10, 2012, the Chilean Ministry of Energy awarded to
EDC the geothermal exploration concession of Newen, while San Rafael and Batea geothermal
exploration concessions were awarded on January 19, 2012 (see Note 44).
On February 4, 2011, the Philippine SEC approved the incorporation of SNGI and EMGI, wholly
owned subsidiaries of EGC, to carry on the general business of generating, transmitting, and/or
distributing energy derived from any and all forms, types and kinds of energy sources for lighting
and power purposes and whole-selling the electric power to power corporations, public electric
utilities and electric cooperatives.
EHIL is an investment holding company of international subsidiaries incorporated on
August 17, 2011 in British Virgin Islands. EDC HKL, a wholly owned subsidiary of EHIL, was
incorporated on November 22, 2011 in Hong Kong and will serve as a holding company.
EDC Chile Holdings SPA and EDC Peru Holdings S.A.C. are wholly owned subsidiaries of EDC
HKL and are the Holding companies of EDC Geotermica Chile and EDC Geotermica Peru S.A.C.,
respectively.
On September 22 and 28, 2011, the Philippine SEC approved the incorporation of BEDC and
KGI, wholly owned subsidiaries of EGC, to carry on the general business of generating,
transmitting, and/or distributing energy derived from any and all forms, types and kinds of energy

- 4 -
sources for lighting and power purposes and whole-selling the electric power to power
corporations, public electric utilities and electric cooperatives.
Corporate Address
In November 2011, the Parent Company changed its address to One Corporate Centre, Julia
Vargas Avenue corner Meralco Avenue, Ortigas Centre, Pasig City from Merritt Road, Fort
Bonifacio, Taguig City.
Authorization for Issuance of the Interim Consolidated Financial Statements
The consolidated financial statements were reviewed and approved by the Audit and Governance
Committee on May 9, 2012.
2. Basis of Preparation
The unaudited interim condensed consolidated financial statements have been prepared in
accordance with Philippine Financial Reporting Standards (PFRS) Philippine Accounting
Standard (PAS) 34, “Interim Financial Reporting.” Accordingly, the unaudited interim condensed
consolidated financial statements do not include all of the information and footnotes required in
the annual consolidated financial statements, and should be read in conjunction with the
Company’s annual consolidated financial statements as at December 31, 2011.
The unaudited interim condensed consolidated financial statements have been prepared on a
historical cost basis, except for parts and supplies inventories that have been measured at lower of
cost or net realizable value and derivative instruments and AFS investments that have been
measured at fair value. The unaudited interim condensed consolidated financial statements are
presented in Philippine peso (Peso), which is the Parent Company’s functional currency. All
values are rounded to the nearest peso, except when otherwise indicated.
Changes in Accounting Policies
The accounting policies adopted are consistent with those of the previous financial year except for
the following:
Voluntary Change in Accounting Policy
Prior to 2011, the Company accounted for rig consumables as direct expense upon purchase since
these are primarily intended for immediate use. Over the years, the Company has accumulated a
large stock of unused rig consumables. As a result, starting January 1, 2011, the Company
adopted the policy of recognizing rig consumables as inventories.
Philippine Accounting Standard (PAS) 8, Accounting Policies, Changes in Accounting Estimates
and Errors, requires retrospective application for a change in accounting policy, except when it is
impracticable to determine period-specific effects. If retrospective application is impracticable,
the entity shall apply the new accounting policy at the beginning of the earliest period for which
retrospective application is practicable. Because prior to January 1, 2011, the Company does not
monitor the unused portion of rig consumable, management determined that it is impracticable to
establish the balance of rig consumables in prior years. Accordingly, the effect of the voluntary
change in accounting policy was presented as an adjustment to the opening balance of 2011
retained earnings.
As at January 1, 2011, the voluntary change in accounting policy resulted to an increase in parts
and supplies inventories, retained earnings and deferred tax liability amounting to P=172.3 million,

- 5 -
P=155.1 million and P=17.2 million, respectively (see Notes 10 and 31). The current year effect of
the voluntary change in accounting policy resulted to an increase in parts and supplies inventories
and net income amounting to P=19.66 million and P=17.69 million, respectively, and decrease in loss
per share by P=0.001 per share for the year ended December 31, 2011.
3. Significant Accounting Policies
The accounting policies adopted in the preparation of the unaudited interim condensed
consolidated financial statements are consistent with those followed in the preparation of the
Company’s annual consolidated financial statements as of and for the year ended December 31,
2011, except for the adoption of the following new and amended accounting standards that
became effective beginning January 1, 2012.
PAS 12, Income Taxes – Recovery of Underlying Assets
The amendment clarified the determination of deferred tax on investment property measured
at fair value. The amendment introduces a rebuttable presumption that deferred tax on
investment property measured using the fair value model in PAS 40, Investment Property,
should be determined on the basis that its carrying amount will be recovered through sale.
Furthermore, it introduces the requirement that deferred tax on non-depreciable assets that are
measured using the revaluation model in PAS 16, Property, Plant and Equipment, always be
measured on a sale basis of the asset. The amendment becomes effective for annual periods
beginning on or after January 1, 2012.
PFRS 7, Financial Instruments: Disclosures – Enhanced Derecognition Disclosure
Requirements
The amendment requires additional disclosure about financial assets that have been transferred
but not derecognized to enable the user of the Company’s financial statements to understand
the relationship with those assets that have not been derecognized and their associated
liabilities. In addition, the amendment requires disclosures about continuing involvement in
derecognized assets to enable the user to evaluate the nature of, and risks associated with, the
entity’s continuing involvement in those derecognized assets. The amendment becomes
effective for annual periods beginning on or after July 1, 2011. The amendment affects
disclosures only and has no impact on the Company’s financial position or performance.
Improvements to PFRS (issued in May 2010)
The International Accounting Standards Board (IASB) issued omnibus amendments to the
following standards, primarily with a view of removing inconsistencies and clarify wording. The
adoption of the following amendments resulted in changes to accounting policies but did not have
significant impact on the financial position and performance of the Company.
PFRS 3, Business Combinations
PFRS 7, Financial Instruments: Disclosures
PAS 1, Presentation of Financial Statements
PAS 27, Consolidated and Separate Financial Statements

- 6 -
4. Segment Revenue and Segment Results for Operating Segments
The Company’s operating businesses are organized and managed separately according to the
nature of the products and services provided, with each segment representing a strategic business
unit that offers different products and serves different markets.
The Company’s identified operating segments below are consistent with the segments reported to
the BOD, which is the Chief Operating Decision Maker (CODM) of the Company.
a. Electricity segment - These are EDC’s power plants covered mainly by: (1) long-term PPAs
with NPC; (2) FG Hydro’s spot sales to and buying from the WESM and with various DUs
covered by TPSCs; and (3) GCGI’s sales to various NPC-assigned and new customers covered
by Power Supply Contracts and Power Supply Agreements, respectively.
b. Steam segment - These relate to sale of steam to NPC plants covered by SSAs.
c. All other segments - These relate to segment performing drilling services for Lihir Gold Ltd.
and construction services accounted for under IFRIC 12 up to October 22, 2009
The Company has one geographical segment since it derives principally all its revenues from
domestic operations. Revenue from drilling services outside the Philippines is not material.
Management monitors the operating results of the business segments separately for the purpose of
making decisions about resources to be allocated and of assessing performance. Finance costs,
finance income, income taxes and other charges and income are managed on a group basis.
All of the Company’s operations are in the Philippines and revenues generated are from domestic
operations except for revenue from drilling services, included in “All Other Segments” category,
which is from foreign services rendered to Lihir Gold Ltd.
Segment performance is evaluated based on net income (loss) for the period and earnings before
interest, taxes, and depreciation and amortization (EBITDA). Net income (loss) for the period is
measured consistent with consolidated net income (loss) in the unaudited interim condensed
consolidated financial statements. EBITDA is calculated as total revenues minus total operating
expenses except non-cash items such as depreciation and amortization, impairment loss on
property, plant and equipment, and loss on disposal of property, plant and equipment of a
subsidiary among others.
NPC is the main customer for the electricity segment which comprised 43.92% of the total
electricity revenue for the period ended March 21, 2012 and the only external customer for the
steam segment, particularly for the BMGPP in 2010. Following the acquisition by BGI of these
power plants in September 2010 and the subsequent major rehabilitation of these assets, the Parent
Company ceased to bill NPC.
Financial information on the operating segments are summarized as follows:

- 7 -
Electricity Steam All Other Segments Eliminations Total
Period Ended March 31, 2012 Segment revenue from external
customers P=7,536,756,442 P=– P=167,581,380
P=– P= 7,704,337,822
Intersegment revenue 288,710,110 1,572,812,063 – (1,861,522,173) –
Total segment revenue 7,825,466,552 1,572,812,063 167,581,380 (1,861,522,173) 7,704,337,822
Segment expenses (4,564,250,912) (924,479,585) (101,722,915) 1,861,522,173 (3,728,931,239)
Segment results P=3,261,215,640 P=648,332,478 P=65,858,465 P=– 3,975,406,583
Unallocated segment expenses (27,395,961)
Unallocated interest income 93,870,182
Unallocated interest expense (1,015,345,353)
Unallocated other income - net 397,360,790
Unallocated income taxes (277,037,433)
Net income P=3,146,858,808
EBITDA P= 4,052,442,062 P=767,473,079 P=70,598,554 P=– P= 4,890,513,695
Unallocated expenses
(27,345,633)
P=4,863,168,062
Electricity Steam All Other Segments Eliminations Total
Period Ended March 31, 2011 Segment revenue from external
customers P=5,798,160,507 P=– P=154,616,637
P=– P=5,952,777,144
Intersegment revenue 91,806,053 1,660,839,611 – (1,752,645,664) –
Total segment revenue 5,889,966,560 1,660,839,611 154,616,637 (1,752,645,664) 5,952,777,144 Segment expenses (4,213,935,041) (1,169,430,414) (116,574,555) 1,752,645,664 (3,747,294,346)
Segment results P=1,676,031,519 P=491,409,197 P=38,042,082 P=– 2,205,482,798
Unallocated segment expenses (12,655,460) Unallocated interest income 123,917,688
Unallocated interest expense (1,038,921,265)
Unallocated other income - net 256,816,685 Unallocated income taxes (80,277,300)
Net income P=1,454,363,146
EBITDA P=2,494,844,455 P=682,332,853 P=2,121,254 P=– P=3,179,298,562
Unallocated expenses
(12,647,397)
P=3,166,651,165
Electricity Steam All Others Eliminations Total
As of and for the period ended
March 31, 2012
Segment assets P=41,495,715,327 P=13,295,301,762 P=2,449,721,508 P=– P=57,240,738,597
Unallocated corporate assets 34,910,353,336
Total assets – P=92,151,091,933
Segment liabilities P=37,645,794,821 P=20,829,624,307 P=1,751,294,773 P=– P=60,226,713,901
Unallocated corporate liabilities 1,113,551,165
Total liabilities P= 61,340,265,066
Capital expenditure P=608,829,626 P=615,488,858 P=116,673,629 P=– P=1,340,992,113
Unallocated capital expenditure 75,853,674
Total capital expenditure P=1,416,845,787
Depreciation and amortization (P=786,504,936) (P=106,203,638) (P=4,740,088) P=– (P=897,448,662)
Unallocated depreciation and
amortization
(50,328)
Total depreciation and amortization (P=897,498,990)
Other non-cash items (P=57,092,381) (P=47,753,184) P=788 P=– (P=104,844,777)
Unallocated non-cash items 383,890,800
Total other non-cash items (P=279,046,023)

- 8 -
Electricity Steam All Others Eliminations Total
As of and for the year ended December 31, 2011
Segment assets P=59,324,793,038 P=12,376,428,799 P=4,066,696,844 P=– P=75,767,918,681
Unallocated corporate assets 14,249,898,103
Total assets P=90,017,816,784
Segment liabilities P=36,727,310,548 P=20,589,217,647 P=1,774,574,665 P=– P=59,091,102,860
Unallocated corporate liabilities 1,280,112,431
Total liabilities P=60,371,215,291
Capital expenditure P=4,711,615,736 P=3,832,071,716 P=158,656,411 P=– P=8,702,343,863
Unallocated capital expenditure 596,087,898
Total capital expenditure P=9,298,431,761
Depreciation and amortization (P=3,035,691,787) (P=386,991,348) (P=18,973,159) P=– (P=3,441,656,294)
Unallocated depreciation and
amortization
(218,203)
Total depreciation and amortization (P=3,441,874,497)
Impairment loss P=4,998,608,008 P=– P=– P=– P=4,998,608,008
Other non-cash items (P=305,215,436) (P=340,416,065) (P=198,180) P=– (P=645,829,681)
Unallocated non-cash items 23,722,640
Total other non-cash items (P=622,107,041)
Electricity Steam All Others Eliminations Total
As of and for the period ended March 31, 2011
Segment assets P=61,597,449,482 P=9,618,650,230 P=1,480,493,610 P=– P=72,696,593,322
Unallocated corporate assets 22,630,144,876
Total assets P=95,326,738,198
Segment liabilities P=29,949,753,553 P=15,116,620,550 P=1,410,603,574 P=– P=46,476,977,677
Unallocated corporate liabilities 18,165,134,106
Total liabilities P=64,642,111,783
Capital expenditure P=1,102,774,920 P=912,609,564 P=25,210,223 P=– P=2,040,594,707
Unallocated capital expenditure 65,435,758
Total capital expenditure P=2,106,030,465
Depreciation and amortization (P=808,953,941) (P=93,202,110) (P=3,870,453) P=– (P=906,026,504)
Unallocated depreciation and
amortization
(8,063)
Total depreciation and amortization (P=906,034,567)
Impairment loss P=– P=– P=– P=– P=–
Other non-cash items (P=59,413,749) (P=78,269,018) (P=167,375) P=– (P=137,850,142)
Unallocated non-cash items 179,415,157
Total other non-cash items P=41,565,015
The following table shows the Company’s reconciliation of EBITDA to the consolidated net income
for the periods ended March 31, 2012 and 2011.
2012 2011
EBITDA P=4,863,168,062 P=3,166,651,165
Add (Deduct):
Depreciation and amortization (897,498,991) (906,034,567)
Net reduction in allowance (provision) for doubtful accounts (1,252,950) (106,846,824)
Reduction in allowance for/write-off of (provision for)
impairment of parts and supplies inventories (16,405,499) 39,057,564
Interest income 93,870,182 123,917,688
Interest expense (1,015,345,353) (1,038,921,265)

- 9 -
2012 2011
Foreign exchange gains (losses) – net 337,953,506 188,561,127
Derivatives gain (loss) – net – 37,553,046
Provision for income tax (277,037,433) (80,277,300)
Miscellaneous – net 59,407,284 30,702,512
Consolidated net income P=3,146,858,808 P=1,454,363,146
The Parent Company has intersegment revenue from/to GCGI for the sale of steam/electricity.
Intersegment revenues are all eliminated in consolidation. Segment information is measured in
conformity with the accounting policies adopted for preparing and presenting the consolidated
financial statements. Intersegment revenue are made at normal commercial terms and conditions.
Unallocated expenses pertain to expenses of the corporate, technical and administrative support
groups while unallocated corporate assets and liabilities which include among others certain cash
and cash equivalents, property, plant and equipment, parts and supplies inventories, trade and other
payables and retirement and post-retirement benefits, pertain to the Head Office and are managed
on a group basis.
5. Cash and Cash Equivalents
This account consists of the following:
March 31,
2012
(Unaudited)
December 31,
2011
(Audited)
March 31,
2011
(Unaudited)
Cash on hand and in banks P=935,915,921 P=692,764,092 P=6,045,602,577
Cash equivalents 12,187,514,670 11,800,642,871 13,769,016,262
P=13,123,430,591 P=12,493,406,963 P=19,814,618,839
Cash in banks earns interest at the respective bank deposit rates. Cash equivalents consist of
money market placements, which are made for varying periods of up to three months depending
on the immediate cash requirements of the Company.
6. Trade and Other Receivables
This account consists of the following:
March 31,
2012
(Unaudited)
December 31,
2011
(Audited)
March 31,
2011
(Unaudited)
Trade P=3,580,890,393 P=3,336,433,682 P=2,887,790,210
Others:
Non-trade accounts receivable 43,962,775 99,398,810 49,750,536
Loans and notes receivables 62,531,897 59,331,933 61,134,558
Advances to employees 39,669,975 37,934,595 37,937,045
Employee receivables 8,411,600 8,896,656 11,871,083
Claims receivable 133,972 153,322 133,971
154,710,219 205,715,316 160,827,193
3,735,600,612 3,542,148,998 3,048,617,403
Less allowance for doubtful accounts 130,807,202 130,839,470 126,348,554
P=3,604,793,410 P=3,411,309,528 P=2,922,268,849

- 10 -
Trade receivables are noninterest-bearing and are generally collectible in 30 to 60 days.
Majority of the Company’s trade receivables are collectible from NPC. All revenues from sale of
steam and majority of the revenues from sale of electricity were derived from NPC.
March 31,
2012
(Unaudited)
December 31,
2011
(Audited)
March 31,
2011
(Unaudited)
Balance at beginning of year P=130,839,470 P=30,606,792 P=
Provision for doubtful accounts (Note 25) – 100,232,678 – Reversal of provision for doubtful account (32,268) – –
Balance at end of year P=130,807,202 P=130,839,470 P=126,348,554
7. Parts and Supplies Inventories
March 31,
2012
(Unaudited)
December 31,
2011
(Audited)
March 31,
2011
(Unaudited)
On hand:
Drilling tubular products and equipment spares
P=1,712,077,488 P=1,648,876,310
877,612,431
Power plant spares 699,558,748 718,777,618 686,567,074
Pump, production/steam gathering system, steam
turbine, valves and valve spares
328,760,120 305,461,738
289,300,841
Chemical, chemical products, gases and catalyst
96,620,860 113,397,104
299,237,727
Heavy equipment spares 90,157,585 90,293,956 51,862,247
Electrical, cable, wire product and compressor
spares
91,004,229 83,543,105
62,641,357
Measuring instruments, indicators and tools, safety
equipment and supplies
37,352,294 28,640,098
32,916,255
Automotive, mechanical, bearing, seals, v-belt,
gasket, tires and batteries
47,377,955 39,385,963
28,807,947
Construction and hardware supplies, stationeries
and office supplies, hoses, communication
and other spares and supplies
68,761,305 20,268,296
11,755,922
3,171,670,584 3,048,644,188 2,340,701,801
In transit 73,261,656 307,123,465 300,447,258
P=3,244,932,240 P=3,355,767,653 P=2,641,149,059
Inventories in transit include items not yet received but ownership or title to the goods has already
passed to the Company.
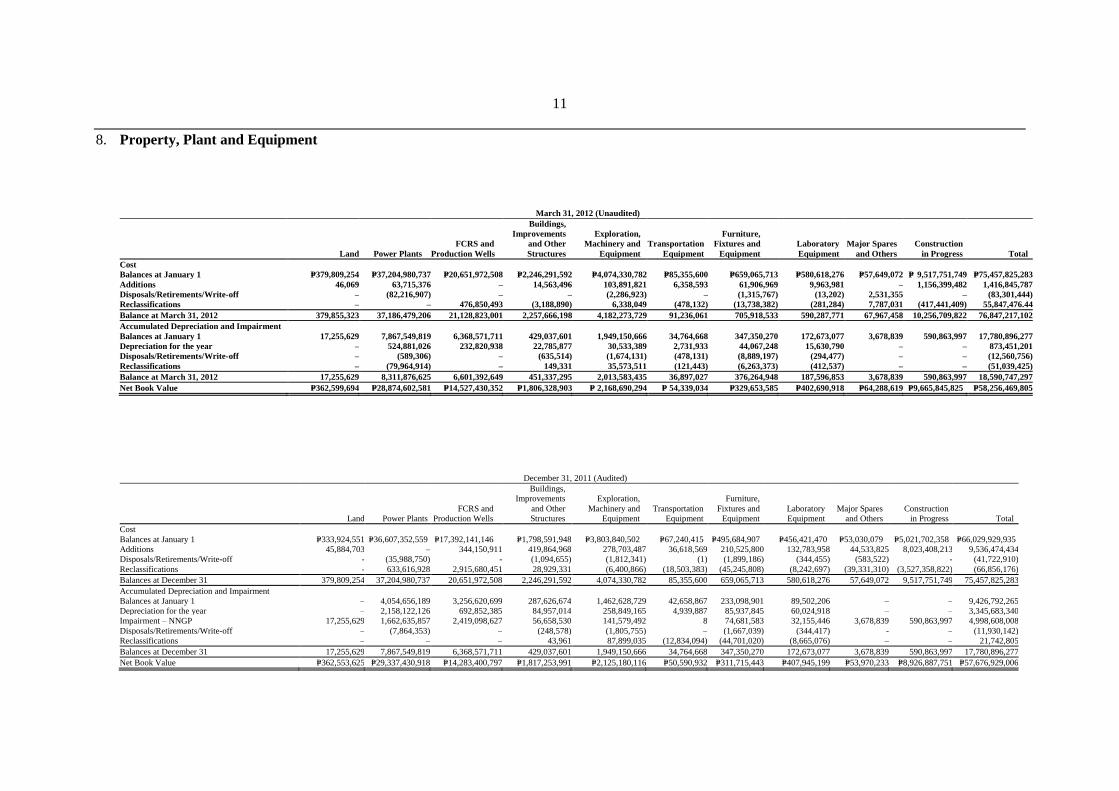
11
8. Property, Plant and Equipment
March 31, 2012 (Unaudited)
Land Power Plants
FCRS and
Production Wells
Buildings,
Improvements
and Other
Structures
Exploration,
Machinery and
Equipment
Transportation
Equipment
Furniture,
Fixtures and
Equipment
Laboratory
Equipment
Major Spares
and Others
Construction
in Progress Total
Cost
Balances at January 1 P=379,809,254 P=37,204,980,737 P=20,651,972,508 P=2,246,291,592 P=4,074,330,782 P=85,355,600 P=659,065,713 P=580,618,276 P=57,649,072 P= 9,517,751,749 P=75,457,825,283
Additions 46,069 63,715,376 – 14,563,496 103,891,821 6,358,593 61,906,969 9,963,981 – 1,156,399,482 1,416,845,787
Disposals/Retirements/Write-off – (82,216,907) – – (2,286,923) – (1,315,767) (13,202) 2,531,355 – (83,301,444)
Reclassifications – – 476,850,493 (3,188,890) 6,338,049 (478,132) (13,738,382) (281,284) 7,787,031 (417,441,409) 55,847,476.44
Balance at March 31, 2012 379,855,323 37,186,479,206 21,128,823,001 2,257,666,198 4,182,273,729 91,236,061 705,918,533 590,287,771 67,967,458 10,256,709,822 76,847,217,102
Accumulated Depreciation and Impairment
Balances at January 1 17,255,629 7,867,549,819 6,368,571,711 429,037,601 1,949,150,666 34,764,668 347,350,270 172,673,077 3,678,839 590,863,997 17,780,896,277
Depreciation for the year – 524,881,026 232,820,938 22,785,877 30,533,389 2,731,933 44,067,248 15,630,790 – – 873,451,201
Disposals/Retirements/Write-off – (589,306) – (635,514) (1,674,131) (478,131) (8,889,197) (294,477) – – (12,560,756)
Reclassifications – (79,964,914) – 149,331 35,573,511 (121,443) (6,263,373) (412,537) – – (51,039,425)
Balance at March 31, 2012 17,255,629 8,311,876,625 6,601,392,649 451,337,295 2,013,583,435 36,897,027 376,264,948 187,596,853 3,678,839 590,863,997 18,590,747,297
Net Book Value P=362,599,694 P=28,874,602,581 P=14,527,430,352 P=1,806,328,903 P= 2,168,690,294 P= 54,339,034 P=329,653,585 P=402,690,918 P=64,288,619 P=9,665,845,825 P=58,256,469,805
December 31, 2011 (Audited)
Land Power Plants
FCRS and
Production Wells
Buildings,
Improvements
and Other
Structures
Exploration,
Machinery and
Equipment
Transportation
Equipment
Furniture,
Fixtures and
Equipment
Laboratory
Equipment
Major Spares
and Others
Construction
in Progress Total
Cost
Balances at January 1 P=333,924,551 P=36,607,352,559 P=17,392,141,146 P=1,798,591,948 P=3,803,840,502 P=67,240,415 P=495,684,907 P=456,421,470 P=53,030,079 P=5,021,702,358 P=66,029,929,935
Additions 45,884,703 – 344,150,911 419,864,968 278,703,487 36,618,569 210,525,800 132,783,958 44,533,825 8,023,408,213 9,536,474,434
Disposals/Retirements/Write-off - (35,988,750) - (1,094,655) (1,812,341) (1) (1,899,186) (344,455) (583,522) - (41,722,910)
Reclassifications - 633,616,928 2,915,680,451 28,929,331 (6,400,866) (18,503,383) (45,245,808) (8,242,697) (39,331,310) (3,527,358,822) (66,856,176)
Balances at December 31 379,809,254 37,204,980,737 20,651,972,508 2,246,291,592 4,074,330,782 85,355,600 659,065,713 580,618,276 57,649,072 9,517,751,749 75,457,825,283
Accumulated Depreciation and Impairment
Balances at January 1 – 4,054,656,189 3,256,620,699 287,626,674 1,462,628,729 42,658,867 233,098,901 89,502,206 – – 9,426,792,265
Depreciation for the year – 2,158,122,126 692,852,385 84,957,014 258,849,165 4,939,887 85,937,845 60,024,918 – – 3,345,683,340
Impairment – NNGP 17,255,629 1,662,635,857 2,419,098,627 56,658,530 141,579,492 8 74,681,583 32,155,446 3,678,839 590,863,997 4,998,608,008
Disposals/Retirements/Write-off – (7,864,353) – (248,578) (1,805,755) – (1,667,039) (344,417) - – (11,930,142)
Reclassifications – – – 43,961 87,899,035 (12,834,094) (44,701,020) (8,665,076) – – 21,742,805
Balances at December 31 17,255,629 7,867,549,819 6,368,571,711 429,037,601 1,949,150,666 34,764,668 347,350,270 172,673,077 3,678,839 590,863,997 17,780,896,277
Net Book Value P=362,553,625 P=29,337,430,918 P=14,283,400,797 P=1,817,253,991 P=2,125,180,116 P=50,590,932 P=311,715,443 P=407,945,199 P=53,970,233 P=8,926,887,751 P=57,676,929,006

12
March 31, 2011 (Unaudited)
Land Power Plants
FCRS and
Production Wells
Buildings,
Improvements
and Other
Structures
Exploration,
Machinery and
Equipment
Transportation
Equipment
Furniture,
Fixtures and
Equipment
Laboratory
Equipment
Major Spares
and Others
Construction
in Progress Total
Cost
Balances at January 1 P=333,924,551 P=36,607,352,559 P=17,392,141,146 P=1,798,591,947 P=3,803,840,502 P=67,240,415 P=495,684,907 P=456,421,470 P=53,030,079 P=5,097,727,288 P=66,105,954,864
Additions 40,121,285 261,371 – 13,497,880 49,377,301 15,425,418 6,623,952 41,237,370 – 1,939,485,888 2,106,030,465
Disposals/Retirements/Write-off – – – (1,705,554) (3,120,271) (4,055,609) (10,499,892) (1,433,168) 3,009,451 – (17,805,043)
Reclassifications – 454,450,823 307,742,309 4,599,864 29,120 – 309,152 – – (482,497,695) 284,633,573
Balances at March 31, 2011 374,045,836 37,062,064,753 17,699,883,455 1,814,984,137 3,850,126,652 78,610,224 492,118,119 496,225,672 56,039,530 6,554,715,481 68,478,813,859
Accumulated Depreciation and Impairment
Balances at January 1 – 4,054,656,188 3,256,620,699 287,626,673 1,462,628,729 42,658,867 233,098,900 89,502,206 – – 9,426,792,262
Depreciation for the year – 553,216,554 192,673,616 25,302,147 74,766,797 2,587,646 19,760,051 13,679,967 – – 881,986,778
Disposals/Retirements/Write-off – – – (926,227) (3,111,807) (4,055,603) (8,599,554) (904,192) – – (17,597,383)
Reclassifications – – – (224,954) 30,077,561 (71,589) (2,913,898) (99,546) – – 26,767,574
Balances at March 31, 2011 – 4,607,872,742 3,449,294,315 311,777,639 1,564,361,280 41,119,321 241,345,499 102,178,435 – – 10,317,949,231
Net Book Value P=374,045,836 P=32,454,192,011 P=14,250,589,140 P=1,503,206,498 P=2,285,765,372 P=37,490,903 P=250,772,620 P=394,047,237 P=56,039,530 P=6,554,715,481 P=58,160,864,628

13
Details of depreciation and amortization charges recognized in the statements of income are shown
below:
March 31,
2012
(Unaudited)
December 31,
2011
(Audited)
March 31,
2011
(Unaudited)
Property, plant and equipment P=873,451,201 P=3,345,683,340 P=881,986,778
Water rights 24,047,789 96,191,157 24,047,789
P=897,498,990 P=3,441,874,497 P=906,034,567
March 31,
2012
(Unaudited)
December 31,
2011
(Audited)
March 31,
2011
(Unaudited)
Costs of sales of electricity and steam (Note 15) P=815,022,773 P=3,173,306,732 P=846,143,688
Cost of drilling services (Note 16) 289,417 1,110,041 289,417
General and administrative (Note 17) 82,186,800 267,457,724 59,601,462
P=897,498,990 P=3,441,874,497 P=906,034,567
The asset retirement obligation pertains to the net present value of the estimated dismantling and
restoration costs of steam field facilities of the Parent Company at the end of the contract period. As
of March 31, 2012, the net book value of the asset retirement under the property, plant and equipment
amounted to P=307.71 million and the asset retirement obligations under noncurrent liabilities
amounted to P=414.20 million.
9. Goodwill and Intangible Assets
March 31, 2012 (Audited)
Goodwill Water Rights
Other
Intangible Asset Total
Cost
Balances at January 1 P=2,535,051,530 P=2,404,778,918 P=258,394,938 P=5,198,225,386
Additions – – 32,770,058 32,770,058
Balances at December 31 2,535,051,530 2,404,778,918 291,164,996 5,230,995,444
Accumulated Amortization
Balances at January 1 – 492,979,679 – 492,979,679
Amortization (Notes 12,
23, 24 and 25)
–
24,047,789
– 24,047,789
Balances at December 31 – 517,027,468 – 517,027,468
Net Book Value P=2,535,051,530 P= 1,887,751,450 P=291,164,996 P=4,713,967,976
December 31, 2011 (Audited)
Goodwill Water Rights
Other
Intangible Asset Total
Cost
Balances at January 1 P=2,535,051,530 P=2,404,778,918 P=– P=4,939,830,448
Additions – – 258,394,939 258,394,939
Balances at December 31 2,535,051,530 2,404,778,918 258,394,938 5,198,225,387

14
Goodwill Water Rights
Other
Intangible Asset Total
Accumulated Amortization
Balances at January 1 – 396,788,522 – 396,788,522
Amortization (Notes 12, 23,
24 and 25)
–
96,191,157
–
96,191,157
Balances at December 31 – 492,979,679 – 492,979,679
Net Book Value P=2,535,051,530 P=1,911,799,239 P=258,394,938 P=4,705,245,708
March 31, 2011 (Unaudited)
Goodwill Water Rights Total
Cost
Balances at January 1, 2011 and March 31, 2011 2,535,051,530 2,404,778,918 4,939,830,448
Accumulated Amortization
Balances at January 1, 2011 – 396,788,522 396,788,522
Amortization (Note 8) – 24,047,789 24,047,789
Balances at March 31, 2011 – 420,836,311 420,836,311
Net Book Value P=2,535,051,530 P=1,983,942,607 P=4,518,994,137
10. Other Noncurrent Assets
March 31,
2012
(Unaudited)
December 31,
2011
(Audited)
March 31,
2011
(Unaudited)
Tax credit certificates P=1,338,884,446 P=1,338,884,447 P=1,338,884,446
Long-term receivables 627,406,762 81,561,056 47,592,135
Input VAT 3,005,218,719 3,270,286,773 2,070,849,704
Prepaid expenses 17,015,460 12,246,824 26,591,467
Special deposits and funds 127,196,462 123,278,392 99,205,177
AFS investment 20,603,788 20,443,924 20,059,151
Others 27,600,873 27,670,094 46,047,058
5,163,926,510 4,874,371,510 3,649,229,138
Less allowance for doubtful
accounts
423,726,234 422,722,403
125,462,101
P= 4,740,200,276 P=4,451,649,107 P=3,523,767,037
11. Trade and Other Payables
March 31,
2012
(Unaudited)
December 31,
2011
(Audited)
March 31,
2011
(Unaudited)
Accounts payable:
Third parties
P=7,105,889,950 P=5,101,846,237
P=6,547,333,299
Related parties 162,656,196 145,143,240 66,490,715
Accrued interest and guarantee fees 1,144,578,826 1,047,605,943 1,276,554,336
Withholding and other taxes payable 191,707,169 328,466,441 143,493,967
Deferred credits 23,253,658 22,095,129 16,081,114
SSS and other contributions payable 1,804,807 1,893,569 2,110,019
Other payables 80,167,884 57,024,702 180,400,383
P=8,710,058,490 P=6,704,075,261 P=8,232,463,833

15
Accounts payable - trade are noninterest-bearing and are normally settled on a 30 to 60 days
payment term.
The accrued interest represents interest accrual on outstanding loans reckoning from the last
payment date up to the financial reporting date. Guarantee fees are accruals of amounts due to the
Philippine Government reckoning from the last payment date up to the financial reporting date.
12. Royalty Fee Payable
March 31,
2012
(Unaudited)
December 31,
2011
(Audited)
March 31,
2011
(Unaudited)
Due to DOE and LGU P=217,335,769 P=287,626,313 P=495,319,145
Less current portion (217,335,769) 287,626,313 277,493,584
Noncurrent portion P=– P=– P=217,825,561
13. Long-term Debts
March 31,
2012
(Unaudited)
December 31,
2011
(Audited)
March 31,
2011
(Unaudited)
Total Dollar-denominated debt P=20,126,419,273 P=13,003,311,706 P=20,259,768,324
Total Japanese Yen-denominated
debt – 20,252,444 4,545,174,289
Total Peso-denominated debt 30,167,937,613 38,466,007,305 28,652,263,712
50,294,356,886 51,489,571,455 53,457,206,325
Less current portion (2,229,209,718) (2,249,517,382) (1,970,025,253)
Noncurrent portion 48,065,147,168 P=49,240,054,073 P=51,487,181,072
The Company’s foreign-currency denominated long-term debts were translated into Philippine
pesos based on the prevailing foreign exchange rates at the date of the unaudited interim
consolidated statement of financial position (USD1=JPY82.420: USD1=PHP42.920 on
March 31, 2012, US$1= JP¥77.912; US$1=P=43.840 as of December 31, 2011 and
USD1=JPY82.871: USD1=PHP43.390 on March 31, 2011).
14. Equity
As required under the Philippine Constitution, the Parent Company is subject to the nationality
requirement that at least 60% of its capital stock must be owned by Filipino citizens since the
Parent Company is engaged in the exploration and exploitation of the country’s energy resources.
The Parent Company is compliant with the said nationality requirement.
Beginning December 13, 2006, the 15.0 billion common shares of EDC were listed and traded on
the Philippine Stock Exchange (PSE) at an Initial Public Offering (IPO) price of P=3.20 per share.
After the initial IPO, there are no subsequent listings of shares by the Parent Company.
The common shares are majority held by Filipino citizens, with Red Vulcan holding six billion
shares or an equivalent of 40% interest.
The ownership of the Parent Company’s preferred shares is limited to Filipino citizens. The
preferred shares have voting rights and subject to 8% cumulative interest. Red Vulcan holds the
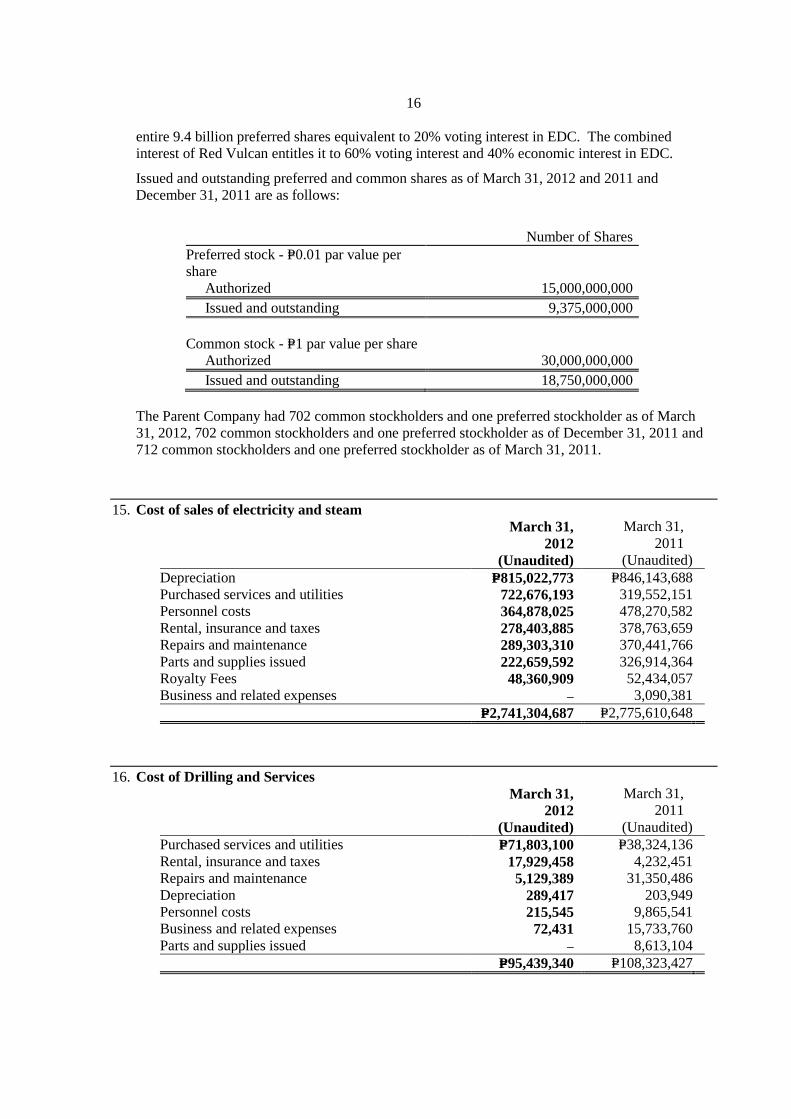
16
entire 9.4 billion preferred shares equivalent to 20% voting interest in EDC. The combined
interest of Red Vulcan entitles it to 60% voting interest and 40% economic interest in EDC.
Issued and outstanding preferred and common shares as of March 31, 2012 and 2011 and
December 31, 2011 are as follows:
Number of Shares
Preferred stock - P=0.01 par value per
share
Authorized 15,000,000,000
Issued and outstanding 9,375,000,000
Common stock - P=1 par value per share
Authorized 30,000,000,000
Issued and outstanding 18,750,000,000
The Parent Company had 702 common stockholders and one preferred stockholder as of March
31, 2012, 702 common stockholders and one preferred stockholder as of December 31, 2011 and
712 common stockholders and one preferred stockholder as of March 31, 2011.
15. Cost of sales of electricity and steam
March 31,
2012
(Unaudited)
March 31,
2011
(Unaudited)
Depreciation P=815,022,773 P=846,143,688
Purchased services and utilities 722,676,193 319,552,151
Personnel costs 364,878,025 478,270,582
Rental, insurance and taxes 278,403,885 378,763,659
Repairs and maintenance 289,303,310 370,441,766
Parts and supplies issued 222,659,592 326,914,364
Royalty Fees 48,360,909 52,434,057
Business and related expenses – 3,090,381
P=2,741,304,687 P=2,775,610,648
16. Cost of Drilling and Services
March 31,
2012
(Unaudited)
March 31,
2011
(Unaudited)
Purchased services and utilities P=71,803,100 P=38,324,136
Rental, insurance and taxes 17,929,458 4,232,451
Repairs and maintenance 5,129,389 31,350,486
Depreciation 289,417 203,949
Personnel costs 215,545 9,865,541
Business and related expenses 72,431 15,733,760
Parts and supplies issued – 8,613,104
P=95,439,340 P=108,323,427
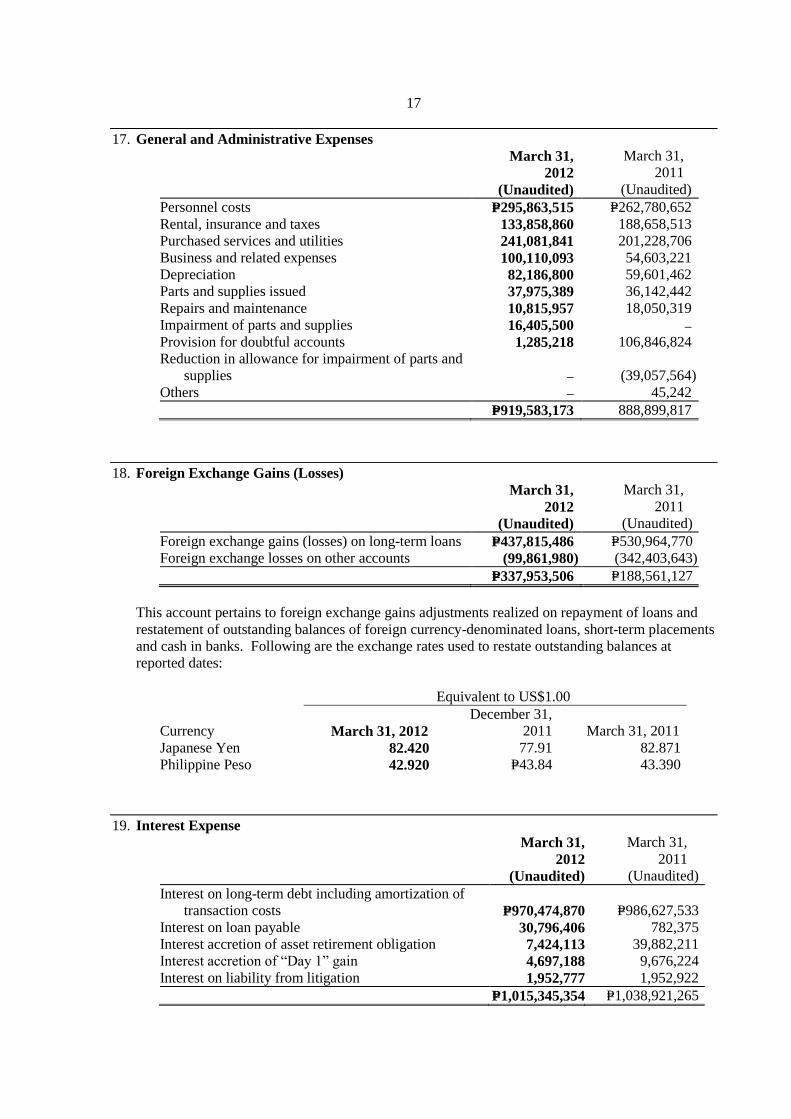
17
17. General and Administrative Expenses
March 31,
2012
(Unaudited)
March 31,
2011
(Unaudited)
Personnel costs P=295,863,515 P=262,780,652
Rental, insurance and taxes 133,858,860 188,658,513
Purchased services and utilities 241,081,841 201,228,706
Business and related expenses 100,110,093 54,603,221
Depreciation 82,186,800 59,601,462
Parts and supplies issued 37,975,389 36,142,442
Repairs and maintenance 10,815,957 18,050,319
Impairment of parts and supplies 16,405,500 – Provision for doubtful accounts 1,285,218 106,846,824
Reduction in allowance for impairment of parts and
supplies – (39,057,564)
Others – 45,242
P=919,583,173 888,899,817
18. Foreign Exchange Gains (Losses)
March 31,
2012
(Unaudited)
March 31,
2011
(Unaudited)
Foreign exchange gains (losses) on long-term loans P=437,815,486 P=530,964,770
Foreign exchange losses on other accounts (99,861,980) (342,403,643)
P=337,953,506 P=188,561,127
This account pertains to foreign exchange gains adjustments realized on repayment of loans and
restatement of outstanding balances of foreign currency-denominated loans, short-term placements
and cash in banks. Following are the exchange rates used to restate outstanding balances at
reported dates:
Equivalent to US$1.00
Currency March 31, 2012
December 31,
2011 March 31, 2011
Japanese Yen 82.420 77.91 82.871
Philippine Peso 42.920 P=43.84 43.390
19. Interest Expense
March 31,
2012
(Unaudited)
March 31,
2011
(Unaudited)
Interest on long-term debt including amortization of
transaction costs P=970,474,870 P=986,627,533
Interest on loan payable 30,796,406 782,375
Interest accretion of asset retirement obligation 7,424,113 39,882,211
Interest accretion of “Day 1” gain 4,697,188 9,676,224
Interest on liability from litigation 1,952,777 1,952,922
P=1,015,345,354 P=1,038,921,265

18
20. Interest Income
March 31,
2012
(Unaudited)
March 31,
2011
(Unaudited)
Interest on placements P=74,015,100 P=104,916,197
Interest on savings/current accounts 236,813 4,020,311
Interest on overdue accounts/others 992,881 14,981,180
ROP Bonds - Discount Amortization 18,357,534 –
Amortization of day 1 loss 267,854 –
P=93,870,182 P=123,917,688
21. Earnings Per Share (EPS)
The EPS amounts were computed as follows:
March 31,
2012
(Unaudited)
March 31,
2011
(Unaudited)
(a) Net income attributable to equity shareholders
of the parent P=2,699,276,655 P=1,381,680,572
Less dividends on preferred shares 7,500,000 7,500,000
(b) Net income attributable to common
shareholders of the parent P=2,691,776,655 P=1,374,180,572
(c) Weighted average numbers
of shares for EPS 18,750,000,000 18,750,000,000
Basic/diluted EPS (b/c) P=0.144 P=0.073
The Company does not have dilutive common stock equivalents.
22. Income Tax
The deferred tax assets and liabilities are presented in the unaudited interim condensed
consolidated statement of financial position as follows:
March 31, 2012
(Unaudited)
December 31,
2011
(Audited)
March 31, 2011
(Unaudited)
Deferred tax assets-net P=1,331,550,748 P=1,420,656,657 P=987,867,438
Deferred tax liabilities-net – – –
P=1,331,550,748 P=1,420,656,657 P=987,867,438

19
23. Related Party Transactions
Parties are considered to be related if one party has the ability, directly or indirectly, to control the
other party or exercise significant influence over the other party in making financial and operating
decisions. Parties are also considered to be related if they are subject to common control or
common significant influence.
The following are the transactions that the Company had with related parties for the periods ended
March 31, 2012 and 2011.
a. First Balfour, Inc. (First Balfour)
Following the usual bidding process in 2010, the Company awarded to First Balfour
procurement contracts amounting to P=217.67 million for various works such as Palinpinon 1
zero condensate disposal system, Civil, Structural and Mechanical/ Piping Works in Leyte and
Bac-Man and refurbishment of BGI’s geothermal power plants.
First Balfour is a wholly owned subsidiary of First Holdings.
b. First Gen
First Gen provides financial consultancy, business development and other related services to
the Parent Company under a consultancy agreement beginning September 1, 2008. Such
agreement is for a period of three years up to August 31, 2011. Under the terms of the
agreement, billings for consultancy services shall be P=8.7 million per month plus applicable
taxes. This was increased to P=11.8 million effective September 2009 to cover the cost of
additional officers and staff assigned to the Parent Company. The consultancy agreement was
subsequently extended for another 16 months, from September 1, 2011 to December 31, 2012.
Total consultancy services were included in the “Costs of sales of electricity and steam” under
“Purchased services and utilities” account.
c. IFC
On May 20, 2011, the Company signed a 15-year US$75.0 million loan facility with IFC, a
shareholder of the Company. IFC has approximately 5% ownership interest in the Company.
The loan was drawn in Peso on September 30, 2011, amounting to P=3,262.5 million. As of
March 31, 2012, the outstanding balance of the loan amounting to P=3,197.50 million is
included under the “Long-term debts” account in the parent company statements of financial
position.
On November 27, 2008, the Company entered into a loan agreement with IFC for
US$100.0 million or its Peso equivalent of P=4.10 billion. On January 7, 2009, the Company
opted to draw the loan in Peso and received the proceeds amounting to P=4,048.75 million, net
of P=51.25 million front-end fees. As of March 31, 2012, the outstanding loan amounted to P=
3,873.34 million net of unamortized transaction costs of P=55.69and included under the “Long-
term debts” account in the parent company statements of financial position.
The loan is payable in 24 equal semi-annual installments after a three-year grace period from
the date of the loan agreement at an interest rate of 7.4% per annum for the first five years
subject to repricing for another five to 10 years. Under the loan agreement, the Company is
restricted from creating liens and is subject to certain financial covenants.Other Related
Parties.

20
d. Other Related Parties
In the ordinary course of business, the Company avails of or grants advances from/to its
related parties for working capital requirements. Such advances are payable/collectible within
12 months and are non-interest bearing.
Bauang Private Power Corporation is a subsidiary of First Private Power Corporation, an
associate of First Gen. First Gas Holdings Corporation and First Gas Power Corporation are
subsidiaries of First Gen. First Holdings, parent company of First Gen, is an associate of
Lopez Holdings Corporation.
Bayan Telecommunications Inc. (Bayantel) is 97.3%-owned by Bayantel Holdings on which
Lopez Holdings Corporation has 47.3% ownership.
Sky Cable Corporation (Sky Cable) is 80.72%-owned by ABS-CBN Corp. on which Lopez
Holdings Corporation has 57.3% interest.
First Philippine Realty Corp. (FPRC), formerly known as INAEC Development Corp, is a
wholly owned subsidiary of First Holdings.
Thermaprime Well Services, Inc. (Thermaprime) is a subsidiary of First Balfour, a wholly
owned subsidiary of First Holdings. Thermaprime provides drilling services such as, but not
limited to, rig operations, rig maintenance, well design and engineering.
First Gen Energy Solutions (First GES) is a wholly owned subsidiary of First Gen.
e. Following are the amounts of transactions for the periods ended March 31, 2012 and 2011 and
outstanding balances as of March 31, 2012 and 2011 and December 31, 2010:
Transactions for the
period ended March 31
Net amount Due from (to)
Related Parties
Related Party Nature of Transaction 2012 2011 March 31, 2012
(Unaudited)
December 31, 2011
(Audited)
March 31, 2011
(Unaudited)
Due from related
parties
First Gen Interest-free advances P=– P=– P=– P=3,437 P=
First Gen Northern
Energy Corp.
Interest-free advances
– – – 2,511 –
First GES Interest-free advances – – – 1,864 –
P=– P=– P=– P=7,812 P=–
Due to related
parties
First Gen
Interest-bearing
advances (payment) P=–
Consultancy fee 40,397,647 38,731,765 40,397,647 53,863,530 11,800,000
Interest-free advances 3,817,931 3,543,566 3,095,058 6,061,620 238,065,454 First Gas Holdings
Corporation
Interest-free advances
– 231,300 1,431,150 First Gas Power
Corporation
Interest-free advances
– 11,433 12,607 165,675 56,818
Lopez Group Foundation, Inc.
Interest-free advances
– 75,000 –
P=44,215,578 P=42,593,064 P=43,505,312 P=60,090,825 P=251,353,422

21
Transactions for the period ended March 31
Net amount Due from (to) Related Parties
Related Party Nature of Transaction 2012 2011 March 31, 2012
(Unaudited)
December 31, 2011
(Audited)
March 31, 2011
(Unaudited)
Trade and other
payables
Thermaprime Work fees 299,979,684 – 101,023,501 101,171,006 –
First Balfour, Inc. Steam augmentation
contract in Leyte 42,363,462 22,364,154 58,004,741 38,989,273 63,233,022 FPRC Purchase of services and
utilities 571,808 1,306,265 – 458,150 –
Bayantel
Purchase of services and
utilities 294,182 2,968,487 3,627,954 4,524,811 3,257,693
Sky Cable Purchase of services and
utilities 6,482 – – –
343,209,136 26,645,388 162,656,196 145,143,240 66,490,715
Long-term debt
IFC Interest-bearing loans 8,393,823 1,897,474 7,070,840,366 7,067,386,686 4,036,164,381
f. Intercompany Guarantees
EDC’s subsidiary in Chile is participating in the bids for geothermal concession areas by the
Chilean government. The bid rules call for the provision of proof of EDC Chile Limitada’s
financial capability to participate in said bids or evidence of financial support from its Parent
Company. Letters of credit amounting to US$80.0 million were issued by EDC in favor of
EDC Chile Limitada as evidence of its financial support. There were no guarantees received
from any related party.
Except for the US$80.0 million letters of credit issued by the Parent Company in favor of
EDC Chile Limitada as mentioned above, there were no guarantees that have been given to or
and received from any related party in 2011 and 2010.
The Company has not recognized any impairment losses on receivables from related parties as of
March 31, 2012 and 2011 and December 31, 2011.
24. Explanatory Comments about the Seasonality or Cyclicality of Interim Operations
Except for the hydro operations of First Gen Hydro, seasonality or cyclicality of interim
operations is not applicable to the Parent Company’s type of business because of the nature of its
contracts with NPC, which includes guaranteed volume under the applicable take-or-pay,
minimum energy off-take or contracted energy provisions. GCGI’s sales to cooperatives and
industries are also not subject to seasonality or cyclicality.
25. The Nature and Amount of Items Affecting Assets, Liabilities, Equity, Net Income, or Cash
Flows that are Unusual Because of their Nature, Size or Incidence
There are no assets, liabilities, equity, net income or cash flows that are unusual because of their
nature, size or incidence during the current period.

22
26. The Nature and Amount of Changes in Estimates of Amounts Reported in Prior Interim
Periods of the Current Fiscal Year or Changes in Estimates of Amounts Reported in Prior
Financial Years, If Those Changes Have a Material Effect in the Current Interim Period
There are no significant changes in estimates of amounts during the current period as well as in the
comparative period in 2011 with the exception of the recognition of rig consumables as
inventories which was previously accounted for as direct expense (Note 2).
27. Issuances, Repurchases, and Repayments of Debt and Equity Securities
There are no issuances, repurchases and repayments of debt and equity securities during the
current period.
28. Dividend Declarations
Retained Earnings
On March 13, 2012, the BOD of the Parent Company approved the following cash dividends in
favor of all stockholders of record as of March 28, 2012 and payable on or before April 24, 2012:
cash dividend of P=0.0008 per share on the preferred shares
cash dividend of P=0.10 per share on the common shares
On March 15, 2011, the BOD of the Parent Company approved the following cash dividends in
favor of all stockholders of record as of March 29, 2011 and payable on or before April 22, 2011:
cash dividend of P=0.0008 per share on the preferred shares
cash dividend of P=0.16 per share on the common shares
NCI
In March 7, 2012 FG Hydro declared and paid cash dividends to the NCI for common shares
amounting to P=88.49 million.
29. The Effect of Changes in the Composition of the Issuer During the Interim Period, including
Business Combinations, Acquisition or Disposal of Subsidiaries and Long-term Investments,
Restructurings, and Discontinuing Operations
There are no material changes in the composition of the registrant during the period.
30. Changes in Contingent Liabilities or Contingent Assets Since the Last Annual Consolidated
Statement of Financial Position Date
There are no material changes in the contingent liabilities or contingent assets since the last annual
consolidated statement of financial position date.

23
31. Existence of Material Contingencies and Any Other Events or Transactions that are
Material to an Understanding of the Current Interim Period
There are no material contingencies and any other events or transactions during the period.
32. Financial Risk Management Objectives and Policies
The Company’s financial instruments consist mainly of cash equivalents, AFS investments, and
long-term debt. The main purpose of these financial instruments is to finance the Company’s
operations and accordingly manage its exposure to financial risks. The Company has various
financial assets and liabilities such as trade receivables, concession receivables, trade payables and
other liabilities, which arise directly from operations.
Overview of the Company’s Risk Management
The Company has an Enterprise Risk Management (ERM) System in place covering all areas of
its organization, and it is aligned with ISO 31000:2009 (Risk Management - Principles and
Guidelines).
The risk management process involves a systematic application of management policies,
procedures, and practices to the activities of communicating, consulting, establishing the context,
and identifying, analyzing, evaluating, treating, monitoring, and reviewing risk. It is aligned and
integrated in the Company’s business model through the annual Strategy Execution Process which
integrates strategic planning, balanced scorecard, risk management, budget and performance
management processes.
The implementation of the Company’s ERM System provides the following benefits and
advantages:
a. Proactively identifies and manages the key exposures of the Company to protect corporate
assets and profits by identifying and preventing risks before they occur. Thus, it helps avoid
losses which can impair the operations or financial position of the Company in case of
fortuitous events;
b. Identifies and exploits areas of “risk-based advantage”;
c. Provides management at all levels with the required information to make informed decisions on
issues critical to the success of the business and its projects;
d. Establishes the accountability of risk owners in the management of risks;
e. Provides balance in the management of risks and an objective basis for allocating resources;
f. Ensures that efforts and initiatives are well-coordinated so that the Company does not manage
risks in silo;
g. Monitors the implementation and effectiveness of the risk treatment options;
h. Ensures compliance with the policies and processes that are established to manage risks; and
i. Reduces the reliance on increasingly expensive insurance protection. Insurance may provide
the financial relief in case of loss. However, certain risks are not insurable, while some though
insurable, may be too costly and uneconomical to insure.
Risk Assessment
One major activity in the Company’s ERM System is the risk assessment. It is the overall process
of risk identification, risk analysis, and risk evaluation (ISO 31000:2009). It is performed at the
project level by project teams, at the operational level by the line and middle management, at the
executive level by the Management Committee, and at the strategic level by the BOD through its
Risk Management Committee.

24
Risk Treatment
Risk management strategies and action plans are formulated once the risks have been evaluated
and the top risks have been identified. Risk treatment is a process to modify risk (ISO
Guide 73:2009) and is synonymous with risk mitigation, risk elimination, risk prevention, and risk
reduction. It can involve:
a. Avoiding the risk by deciding not to start or continue with the activity that gives rise to the
risk;
b. Taking or increasing risk in order to pursue an opportunity;
c. Removing the risk source;
d. Changing the likelihood;
e. Changing the consequences;
f. Sharing the risk with another party or parties (including contracts and risk financing); and
g. Retaining the risk by informed decision.
Financial Risk Management Policy
The main financial risks arising from the Company’s financial instruments are credit risk, foreign
currency risk, interest rate risk and liquidity risk. The Company’s policies for managing the
aforementioned risks are summarized hereinafter below.
Credit Risk
The Company’s geothermal and power generation business trades with only one major customer,
NPC, a government-owned-and-controlled corporation. Any failure on the part of NPC to pay its
obligations to the Company would significantly affect the Company’s business operations. As a
practice, the Company monitors closely its collection from NPC and charges interest on delayed
payments following the provision of its respective SSAs and PPAs. Receivable balances are
monitored on an ongoing basis to ensure that the Company’s exposure to bad debts is not
significant. The maximum exposure of trade receivable is equal to its carrying amount.
With respect to credit risk arising from other financial assets of the Company, which comprise
cash and cash equivalents excluding cash on hand, other receivables, AFS investments and
derivatives assets, the Company’s exposure to credit risk arises from default of the counterparty,
with a maximum exposure equal to the carrying amount of these instruments before taking into
account any collateral and other credit enhancements.
The following tables show the Company’s aging analysis of past due but not impaired financial
assets as of March 31, 2012 and 2011 and December 31, 2011:
March 31, 2012 (Unaudited)
Past Due but Not Impaired
Neither Past
Due nor
Impaired
Less than
30 Days
31 Days
to 1 Year
Over 1 Year
up to
3 Years
Over
3 Years
Past
Due and
Impaired Total
(In Thousand Pesos)
Loans and receivables:
Cash and cash
equivalents P=13,117,802 P=– P=– P=– P=– P=– P=13,117,802
Trade receivables 3,175,371 166,045 74,521 34,146 – 130,807 3,580,890
Non-trade receivables 2,623 25,270 15,809 260 – – 43,962
Loans and notes
receivables 50,266
4,297 3,596 4,374 –
– 62,533
Employee receivables 18,318 – – – 18,318
Advances to
employees 36,551
405 1,974 741 –
– 39,671
Long-term receivables 561,517 – – – – 62,066 623,583
Due from Related
Parties – – – – – – –

25
March 31, 2012 (Unaudited)
Past Due but Not Impaired
Neither Past
Due nor
Impaired
Less than
30 Days
31 Days
to 1 Year
Over 1 Year
up to
3 Years
Over
3 Years
Past
Due and
Impaired Total
(In Thousand Pesos)
AFS investments:
Debt investments 649,830 – – – – – 649,830
Equity investments 20,604 – – – – – 20,604
Derivative Assets – – – – – – –
Total P=17,632,882 P=196,017 P=95,900 P=39,521 P=– P=192,873 P=18,157,193
December 31, 2011 (Audited)
Past Due but Not Impaired
Neither Past Due nor
Impaired
Less than
30 Days
31 Days
to 1 Year
Over 1 Year up to
3 Years
Over
3 Years
Past Due and
Impaired Total
(In Thousand Pesos)
Loans and receivables:
Cash and cash equivalents P=12,486,732 P=– P=– P=– P=– P=– P=12,486,732
Trade receivables 2,942,461 75,181 150,377 37,576 – 130,839 3,336,434
Non-trade receivables 54,130 6,792 38,477 – – – 99,399 Loans and notes
receivables 59,332
– –
– –
– 59,332
Employee receivables 19,949 – – – – – 19,949 Advances to
employees 26,025
1,416 7,727 2,767 –
– 37,935
Long-term receivables – – – – – 61,062 61,062 Due from related
parties 8 – – – – – 8
AFS investments: Debt investments 673,854 – – – – – 673,854
Equity investments 20,444 – – – – – 20,444
Total P=16,282,935 P=83,389 P=196,581 P=40,343 P=– P=191,901 P=16,795,149
March 31, 2011 (Unaudited)
Past Due but Not Impaired
Neither Past
Due nor
Impaired
Less than
30 Days
31 Days
to 1 Year
Over 1 Year
up to
3 Years
Over
3 Years
Past
Due and
Impaired Total
(In Thousand Pesos)
Loans and receivables: Cash and cash
equivalents P=19,809,227 P=– P=– P=– P=– P=– P=19,809,227
Trade receivables 2,489,998 29,266 228,578 – 13,600 126,349 2,887,791
Non-trade receivables 44,899 2 979 3,871 – – 49,751
Loans and notes receivables 1,912
– 4,377 54,224 621
– 61,134
Employee receivables 28,953 – – – – – 28,953
Advances to employees 2,873
– 7,559 27,131 374
– 37,937
Long-term receivables 919 – – – – 46,673 47,592
AFS investments: Debt investments 690,344 – – – – – 690,344
Equity investments 20,059 – – – – – 20,059
Derivative Assets 11,789 – – – – – 11,789
Total P=23,100,973 P=29,268 P=241,493 P=85,226 P=14,595 P=173,022 P=23,644,577
Credit Quality of Neither Past due nor Impaired Financial Assets
Financial assets are classified as high grade if the counterparties are not expected to default in
settling their obligations. Thus, the credit risk exposure is minimal. These counterparties
normally include customers, banks and related parties who pay on or before due date. Financial
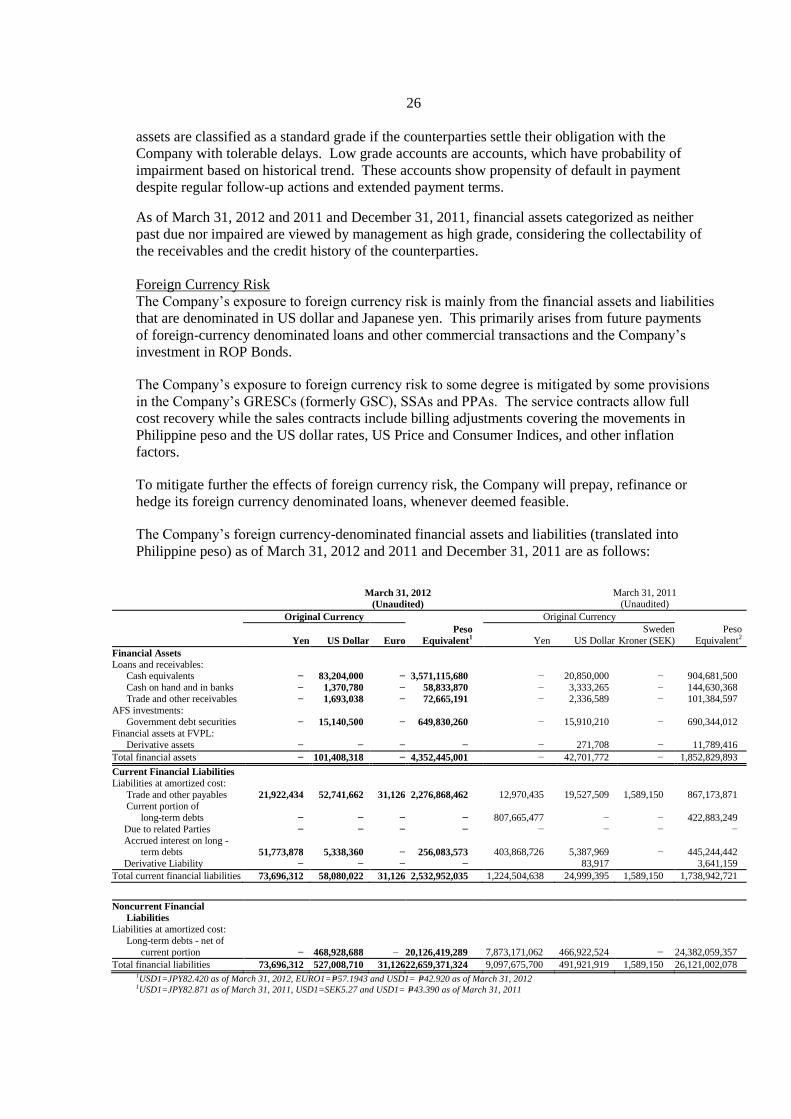
26
assets are classified as a standard grade if the counterparties settle their obligation with the
Company with tolerable delays. Low grade accounts are accounts, which have probability of
impairment based on historical trend. These accounts show propensity of default in payment
despite regular follow-up actions and extended payment terms.
As of March 31, 2012 and 2011 and December 31, 2011, financial assets categorized as neither
past due nor impaired are viewed by management as high grade, considering the collectability of
the receivables and the credit history of the counterparties.
Foreign Currency Risk
The Company’s exposure to foreign currency risk is mainly from the financial assets and liabilities
that are denominated in US dollar and Japanese yen. This primarily arises from future payments
of foreign-currency denominated loans and other commercial transactions and the Company’s
investment in ROP Bonds.
The Company’s exposure to foreign currency risk to some degree is mitigated by some provisions
in the Company’s GRESCs (formerly GSC), SSAs and PPAs. The service contracts allow full
cost recovery while the sales contracts include billing adjustments covering the movements in
Philippine peso and the US dollar rates, US Price and Consumer Indices, and other inflation
factors.
To mitigate further the effects of foreign currency risk, the Company will prepay, refinance or
hedge its foreign currency denominated loans, whenever deemed feasible.
The Company’s foreign currency-denominated financial assets and liabilities (translated into
Philippine peso) as of March 31, 2012 and 2011 and December 31, 2011 are as follows:
March 31, 2012
(Unaudited)
March 31, 2011 (Unaudited)
Original Currency Original Currency
Yen US Dollar Euro
Peso
Equivalent1 Yen US Dollar
Sweden
Kroner (SEK)
Peso
Equivalent2
Financial Assets
Loans and receivables: Cash equivalents − 83,204,000 − 3,571,115,680 − 20,850,000 − 904,681,500
Cash on hand and in banks − 1,370,780 − 58,833,870 − 3,333,265 − 144,630,368
Trade and other receivables − 1,693,038 − 72,665,191 − 2,336,589 − 101,384,597
AFS investments:
Government debt securities − 15,140,500 − 649,830,260 − 15,910,210 − 690,344,012
Financial assets at FVPL:
Derivative assets − − − − − 271,708 − 11,789,416
Total financial assets − 101,408,318 − 4,352,445,001 − 42,701,772 − 1,852,829,893
Current Financial Liabilities
Liabilities at amortized cost:
Trade and other payables 21,922,434 52,741,662 31,126 2,276,868,462 12,970,435 19,527,509 1,589,150 867,173,871
Current portion of
long-term debts − − − − 807,665,477 − − 422,883,249
Due to related Parties − − − − − − − −
Accrued interest on long - term debts 51,773,878 5,338,360 − 256,083,573 403,868,726 5,387,969 − 445,244,442
Derivative Liability − − − − 83,917 3,641,159
Total current financial liabilities 73,696,312 58,080,022 31,126 2,532,952,035 1,224,504,638 24,999,395 1,589,150 1,738,942,721
Noncurrent Financial
Liabilities
Liabilities at amortized cost:
Long-term debts - net of
current portion − 468,928,688
− 20,126,419,289 7,873,171,062 466,922,524
− 24,382,059,357
Total financial liabilities 73,696,312 527,008,710 31,126 22,659,371,324 9,097,675,700 491,921,919 1,589,150 26,121,002,078 1USD1=JPY82.420 as of March 31, 2012, EURO1=P=57.1943 and USD1= P=42.920 as of March 31, 2012 1USD1=JPY82.871 as of March 31, 2011, USD1=SEK5.27 and USD1= P=43.390 as of March 31, 2011

27
December 31, 2011
(Audited)
Original Currency
Yen US Dollar
Sweden
Kroner (SEK)
Peso
Equivalent1
Financial Assets
Loans and receivables:
Cash equivalents − 99,562,576 − 4,364,823,332
Cash on hand and in banks 125,208 1,909,007 − 83,761,320
Trade and other receivables − 1,802,580 − 79,025,107 AFS investments:
Government debt securities − 15,370,750 − 673,853,680
Total financial assets 125,208 118,644,913 − 5,201,463,439
Current Financial Liabilities
Liabilities at amortized cost:
Trade and other payables 53,561,520 69,067,270 10,776,022 3,126,615,268
Current portion of long-term debts 35,992,417 − − 20,252,433
Accrued interest on long - term debts 52,256,670 10,214,835 − 477,222,468
Total current financial liabilities 141,810,607 79,282,105 10,776,022 3,624,090,169
Noncurrent Financial Liabilities Liabilities at amortized cost:
Long-term debts - net of current portion − 468,600,735 − 20,543,456,222
Total financial liabilities 141,810,607 547,882,840 10,776,022 24,167,546,391 1US$1=JP¥77.912, US$1= P=43.840 and SEK1=P=6.363 as of December 31, 2011
The following table demonstrates the sensitivity to a reasonably possible change in the US dollar
and Japanese yen exchange rates, with all other variables held constant, of the Company’s profit
before tax as at March 31, 2012 and 2011 and December 31, 2011 (arising from revaluation of
monetary assets and liabilities and derivative instruments.)
March 31, 2012 (Unaudited)
Foreign Currency
Appreciates (Depreciates) By
Effect on Income
Before Income Tax
USD 10% or PHP4.292 (P=1,826,685,460)
(10% or PHP4.292) 1,826,685,460
JPY 10% or PHP0.05786 (4,264,000)
(10% or PHP0.04734) 3,488,728
eEURO (10% or PHP5.71943) 178,026
10% or PHP5.71943 (178,026)
December 31, 2011 (Audited)
Foreign Currency
Appreciates (Depreciates) By
Effect on Income
Before Income Tax
USD 10% or P=4.38 (P=1,880,062,120)
(10% or P=4.38) 1,880,062,120
JPY 10% or P=0.06252 (P=8,858,171)
(10% or P=0.05115) 7,247,208
SSEK 10% or P=0.6363 (6,856,783)
(10% or P=0.6363) 6,856,783
March 31, 2011 (Unaudited)
Foreign Currency
Appreciates (Depreciates) By
Effect on Income
Before Income Tax
USD 10% or PHP4.40 (P=2,560,304,316)
(10% or PHP4.40) 2,560,304,316
JPY 10% or PHP0.05818 (529,267,239)

28
March 31, 2011 (Unaudited)
Foreign Currency
Appreciates (Depreciates) By
Effect on Income
Before Income Tax
(10% or PHP0.04760) 433,036,832
SSEK 10% or PHP0.91482 (1,453,789)
(10% or PHP0.74849) 1,189,464
Equity Price Risk
Equity price risk is the risk that the fair values of traded equity instruments decrease as the result
of the changes in the levels of equity indices and the value of the individual stocks.
As of March 31, 2012 and 2011 and December 31, 2011, the Company’s exposure to equity price
risk is minimal.
Interest Rate Risk
The Company’s exposure to the risk of changes in market interest rates relates primarily to the
Company’s long-term debt obligations with floating interest rates, derivative assets and AFS debt
investments.
The interest rates of some of the Company’s long-term borrowings and AFS debt investments are
fixed at the inception of the loan agreement.
The Company regularly evaluates its interest rate risk by taking into account the cost of qualified
borrowings being charged by its creditors. Prepayment, refinancing or hedging the risks are
undertaken when deemed feasible and advantageous to the Company.
Interest Rate Risk Table
The following tables provide for the effective interest rates and interest payments by period of
maturity of the Company’s long-term debts:
Interest
Rates
Within 1 Year
More than 1
year but less
than 4 years
4–5 Years
More than
5 Years
Total
March 31, 2012
(Unaudited)
Fixed Rate
PNB and Allied Bank 9.03% 416,291 1,014,291 246,520 423,956 2,101,058
IFC 1 7.40% 289,163 711,135 186,262 582,174 1,768,734
IFC 2 6.66% 273,799 608,541 165,548 723,131 1,771,019
FRCN 8.37% 157,487 134,304 – – 291,791
Series 1
Series 2 9.40% 388,739 688,205 34,631 – 1,111,575
Series 3 8.43% 89,978 76,732 – – 166,710
Peso Public Bonds
Series 1 8.64% 734,553 1,836,383 – – 2,570,936
Series 2 9.33% 326,645 979,934 326,645 – 1,633,224
USD 300.0 Notes 6.50% 836,940 2,510,820 836,940 3,347,760 7,532,460
Floating Rate
USD 175.0
Refinanced
Syndicated Term
Loan
1.75% +
LIBOR
152,040
350,108
83,664
18,953
604,765

29
Interest
Rates
Within
1 Year
More than 1 year
but less than 4
years
45 Years
More than
5 Years
Total
December 31, 2011
(Audited)
Fixed Rate
OECF
PNB and Allied Bank
IFC 1
IFC 2
3.20%
9.03%
7.40%
6.66%
P=327
416,291
289,163
273,799
P=–
1,014,291
711,135
608,541
P=–
246,520
186,262
165,548
P=–
423,956
582,174
723,131
P=327
2,101,058
1,768,734
1,771,019
FRCN
Series 1
8.37%
180,117
207,851
–
–
387,968
Series 2 9.40% 423,750 816,579 92,983 – 1,333,312
Series 3
US$ 300M Notes
8.43%
6.50%
102,907
854,880
118,752
2,564,640
–
854,880
–
3,846,960
221,659
8,121,360
Peso Public Bonds:
Series 1 8.64% P=734,553 P=1,836,383 P=– P=– P=2,570,936
Series 2 9.33% 326,645 979,934 326,645 – 1,633,224
Floating Rate
US$ 175.0M
Refinanced
Syndicated Term
Loan
1.75% +
LIBOR
155,724
372,675
89,541
38,506
656,446
Interest
Rates
Within 1 Year
More than 1
year but less
than 4 years
4–5 Years
More than
5 Years
Total
March 31, 2011
(Unaudited)
Fixed Rate
OECF
JBIC(b) 21st yen
PNB and Allied Bank
IFC
3%–5.7%
2.3% & 2.7%
9.03%
7.40%
P=9,443,044
112,946,671
442,550,903
328,398,611
P=17,556,550
295,022,974
1,135,576,892
875,164,931
P=4,813,545
84,264,290
295,004,688
224,284,236
P=20,271,423
452,678,103
670,476,024
872,275,000
P=52,084,562
944,912,038
2,543,608,507
2,300,122,778
FRCN 8.37% 201,916,530 291,790,448 – – 493.706,978
Series 1
Series 2 9.40% 422,449,569 868,715,640 115,562,362 23,087,102 1,429,814,673
Series 3 8.43% 102,537,849 134,667,664 – – 237,205,513
Peso Public Bonds
Series 1 8.64% 734,553,000 2,203,659,000 367,276,500 – 3,305,488,500
Series 2 9.33% 326,644,500 979,933,500 326,644,500 326,644,500 1,959,867,000
USD 300.0 Notes 6.5% 846,105,000 2,538,315,000 846,105,000 4,230,525,000 8,461,050,000
Floating Rate
USD 175.0
Syndicated Term
Loan
3.25% + Libor
303,696,590
455,544,885 – –
759,241,475
The following tables demonstrate the sensitivity to a reasonably possible change in interest rates,
with all other variables held constant, of the Company’s profit before tax and equity for the three
month period ending March 31, 2012 and 2011 and for the year ending December 31, 2011. The
effect also includes impact of changes in interest rates on derivatives.
March 31, 2012 (Unaudited)
Increase/Decrease
in Basis Points
Effect on Income
Before Income Tax
Effect on Equity
Excluding Income
US$ +100 (P=75,110,000) P=1,664,399
-100 75,110,000 29,278,708
30
December 31, 2011 (Audited)
Increase/Decrease
in Basis Points
Effect on Income
Before Income Tax
Effect on Equity
Excluding Income
USD +100 (P=76,720,000) (P=8,929,578)
-100 76,720,000 19,217,468
March 31, 2011 (Unaudited)
Increase/Decrease
in Basis Points
Effect on Income
Before Income Tax
Effect on Equity
Excluding Income
PHP +100 (P=2,086,718) (P=8,929,578)
-100 2,085,799 19,217,468
USD +100 (P=73,846,701) (P=17,173,190)
-100 73,845,782 20,147,216
Liquidity Risk
The Company’s objective is to maintain a balance between continuity of funding and sourcing
flexibility through the use of available financial instruments. The Company manages its liquidity
profile to meet its working and capital expenditure requirements and service debt obligations. As
part of the liquidity risk management program, the Company regularly evaluates and considers the
maturity of both its financial investments and financial assets (e.g. trade receivables, other
financial assets) and resorts to short-term borrowings whenever its available cash or matured
placements is not enough to meet its daily working capital requirements. To ensure immediate
availability of short-term borrowings, the Company maintains credit lines with banks on a
continuing basis.
Liquidity risk arises primarily when the Company has difficulty collecting its receivables from its
major customer, NPC. Other instances that contribute to its exposure to liquidity risk are when the
company finances long-term projects with internal cash generation and when there is credit crunch
especially at times when the company has temporary funding gaps.
The tables below show the maturity profile of the Company’s financial assets used for liquidity
purposes based on contractual undiscounted cash flows as of March 31, 2012 and 2011 and
December 31, 2011.
March 31, 2012 (Unaudited)
On Demand
Within 30
Days
31 to 60
Days
61 to 180
Days
181 to 360
Days
Over
360 Days Total
(In Thousand Pesos)
AFS investments -
Debt investments P=649,830 P=– P=– P=– P=– P=– P=649,830
Loans and receivables -
Cash equivalents – 11,082,324 1,105,190 – – – 12,187,514
P=649,830 P=11,082,324 P=1,105,190 P=– P=– P=– P=12,837,344

31
December 31, 2011 (Audited)
On Demand
Within 30
Days
31 to 60
Days
61 to 180
Days
181 to 360
Days
Over
360 Days Total
(In Thousand Pesos)
AFS investments -
Debt investments P=673,854 P=– P=– P=– P=– P=– P=673,854 Loans and receivables -
Cash equivalents – 9,574,010 2,226,633 – – – 11,800,643
P=673,854 P=9,574,010 P=2,226,633 P=– P=– P=– P=12,474,497
March 31, 2011 (Unaudited)
On Demand Within 30
Days 31 to 60
Days 61 to 180
Days 181 to 360
Days Over
360 Days Total
(In Thousand Pesos)
AFS investments -
Debt investments P=690,344 P=– P=– P=– P=– P=– P=690,344
Loans and receivables - Cash equivalents – 13,769,016 – – – – 13,769,016
Financial Assets at FVPL-
Derivative Assets 11,789 11,789
P=690,344 P=13,780,805 P=– P=– P=– P=– P=14,471,149
The table below summarizes the maturity analysis of the Company’s financial liabilities as of
March 31, 2012 and 2011 and December 31, 2011 based on contractual undiscounted payments:
March 31, 2012 (Unaudited)
On
Demand
Less than
3 Months
3 to
6 Months
>6 to
12 Months
>1 to
5 Years
More than
5 Years Total
(In Thousand Pesos)
Liabilities at amortized cost:
Accounts payable P=− P=7,031,579 P=− P=− P=− P=− P=7,031,579
Accrued interest and
guarantee fees 87,304 741,703 315,572 − − − 1,144,579
Other current liabilities − 59,633 − − − − 59,633
Due to related parties 43,505 − − − − − 43,505
Royalty fee payable − 136,846 87,500 49,073 − − 273,419
Long-term debts − 641,203 1,215,407 2,988,399 36,098,859 28,454,454 69,398,322
Total P=130,809 P=8,610,964 P=1,618,479 P=3,037,472 P=36,098,859 P=28,454,454 P=77,951,037
December 31, 2011 (Audited)
On
Demand
Less than
3 Months
3 to
6 Months
>6 to
12 Months
>1 to
5 Years
More than
5 Years Total
(In Thousand Pesos)
Liabilities at amortized cost:
Accounts payable P=− P=5,028,880 P=− P=− P=− P=− P=5,028,880 Accrued interest and
guarantee fees 90,769 713,620 243,217 − − − 1,047,606
Other current liabilities − 3,518 − − − − 3,518 Due to related parties 60,091 − − − − − 60,091
Royalty fee payable − 133,228 87,500 136,573 − − 357,301
Long-term debts − 924,581 1,140,510 3,030,619 37,322,968 29,329,707 71,748,385
Total P=150,860 P=6,803,827 P=1,471,227 P=3,167,192 P=37,322,968 P=29,329,707 P=78,245,781

32
March 31, 2011 (Unaudited)
On Demand
Less than 3 Months
3 to 6 Months
>6 to 12 Months
>1 to 5 Years
More than 5 Years Total
(In Thousand Pesos)
Liabilities at amortized cost:
Accounts payable P=− P=5,798,084 P=− P=− P=− P=− P=5,798,084
Accrued interest and guarantee fees 266,759 491,152 347,495 − − − 1,105,406
Other current liabilities − 1,023 − − − − 1,023
Short-term loan payable − 90,000 − − − − 90,000 Due to related parties 251,353 − − − − − 251,353
Royalty fee payable − 42,426 175,000 86,421 224,073 − 527,920
Long-term debts − 4,785,014 23,003,431 12,453,462 31,908,529 3,495,476 75,645,912 Financial Liabilities at FVPL:
Derivative Liability − 3,641 − − − − 3,641
Total P=518,112 P=11,211,340 P=23,525,926 P=12,539,883 P=32,132,602 P=3,495,476 P=83,489,830
Financial Assets and Financial Liabilities
Set out below is a comparison of carrying amounts and fair values of the Company’s financial
instruments as of March 31, 2011 and 2010 and December 31, 2010.
March 31, 2012
(Unaudited)
March 31, 2011
(Unaudited)
Carrying
Amount Fair Value
Carrying
Amount Fair Value
Financial Assets
Loans and receivables:
Cash and cash equivalents P=13,123,430,589 P=13,123,430,589 P=19,814,618,839 P=19,814,618,839
Trade receivables 3,450,083,190 3,450,083,190 2,761,441,656 2,761,441,656
Non-trade receivables 43,962,775 43,962,775 49,750,536 49,750,536
Loans and notes receivables 62,531,897 62,531,897 61,134,558 61,134,558
Employee receivables 18,317,607 18,317,607 28,952,730 28,952,730
Advances to employees 39,669,975 39,669,975 37,937,045 37,937,045
Long-term receivables 561,517,259 561,517,259 919,031 872,568
AFS investments: – –
Debt investments 649,830,260 649,830,260 690,344,012 690,344,012
Equity investments 20,603,788 20,603,788 20,059,151 20,059,151
Financial assets at FVPL:
Derivative assets 11,789,416 11,789,416 11,789,416 11,789,416
P=17,981,736,756 P=17,981,736,756 P=23,476,946,974 P=23,476,900,51
Financial Liabilities
Financial liabilities at amortized cost:
Accounts payable P=7,031,579,051 P=7,031,579,051 P=5,798,083,773 P=5,798,083,773
Accrued interest and guarantee fees 1,144,578,826 1,144,578,826 1,276,554,336 1,276,554,336
Other current liabilities 59,633,315 59,633,315 1,022,811 1,022,811
Short term loan payable – – 90,000,000 90,000,000
Due to related parties 43,505,311 43,505,311 251,353,422 251,353,422
Royalty fee payable 217,335,769 220,496,096 495,319,145 503,054,037
Long-term debts 50,294,356,886 57,698,353,640 53,457,206,325 57,387,808,114
Financial liabilities at FVPL -
Derivative liabilities – – 3,641,161 3,641,161
P=58,790,989,158 P=66,198,146,239 P=61,373,180,973 P=65,311,517,654

33
December 31, 2011
(Audited)
Carrying
Amount Fair Value
Financial Assets
Loans and receivables:
Cash and cash equivalents P=12,493,406,963 P=12,493,406,963
Trade receivables 3,205,594,212 3,205,594,212
Non-trade receivables 99,398,810 99,398,810
Loans and notes receivables 59,331,933 59,331,933
Employee receivables 19,948,544 19,948,544
Advances to employees 37,934,595 37,934,595
Due from related parties 7,812 7,812
Long-term receivables − −
AFS investments:
Debt investments 673,853,680 673,853,680
Equity investments 20,443,924 20,443,924
P=16,609,920,473 P=16,609,920,473
Financial Liabilities
Financial liabilities at amortized cost:
Accounts payable P=5,028,879,595 P=5,028,879,595
Accrued interest and guarantee fees 1,047,605,943 1,047,605,943
Other current liabilities 3,517,746 3,517,746
Short term loan payable − −
Due to related parties 60,090,825 60,090,825
Royalty fee payable 287,626,313 290,907,188
Long-term debts 51,489,571,455 59,055,715,275
P=57,917,291,877 P=65,486,716,572
The methods and assumptions used by the Company in estimating the fair value of financial
instruments are:
Cash and Cash Equivalents
Carrying amounts approximate fair values due to its short-term nature. Trade and Other Receivables, Due to Related Parties, Trade and Other Payables and Short-term
Loan Payable
These are instruments with relatively short maturity ranging from 1 to 3 months. Carrying
amounts approximate fair values.
Long-term Receivables
The fair value of long-term receivables was computed by discounting the expected cash flow using
the applicable rates of 3.01% in March 31, 2011.
AFS Investments
Fair values of quoted debt and equity securities are based on quoted market prices. For equity
investments that are not quoted, the investments are carried at cost less allowance for impairment
losses due to the unpredictable nature of future cash flows and the lack of suitable methods of
arriving at a reliable fair value.
Derivative Assets
The fair value of currency forwards was determined by reference to market values provided by
counterparty banks. The currency options were valued using Garman- Kohlhagen option pricing
model that takes into account such factors as the risk-free US Dollar and Euro interest rates and
historical volatility.

34
Long-term Debts and Royalty Fee Payable
The fair values for the Company’s long-term debts are estimated using the discounted cash flow
methodology with the applicable rates ranging from 1.75% to 10.96%, 1.91% to 10.88%, 2.06% to
10.57% in March 31, 2012, December 31, 2011 and March 31, 2011, respectively. Fair values of
royalty fee payable are determined using discount rates ranging from 5.37% to 6.02%, 5.32% to
6.43%, 4.07% to 6.04% in March 31, 2012, December 31, 2011, March 31, 2011, respectively. The following tables show the fair value information of financial instruments classified under
FVPL and AFS investments analyzed by source of inputs on fair valuation as follows:
Quoted prices in active markets for identical assets or liabilities (Level 1);
Those involving inputs other than quoted prices included in Level 1 that are observable for the
asset or liability, either directly (as prices) or indirectly (derived from prices) (Level 2); and
Those with inputs for the asset or liability that are not based on observable market data
(unobservable inputs) (Level 3).
March 31, 2012
(Unaudited) Level 1 Level 2 Level 3 At Cost
AFS investments:
Debt investments P=649,830,260 P=649,830,260 P= P= P=
Equity investments 20,603,788 20,529,238 74,550
December 31, 2011
(Audited) Level 1 Level 2 Level 3 At Cost
AFS investments:
Debt investments P=673,853,680 P=673,853,680 P=− P=− P=−
Equity investments 20,443,924 20,369,374 − − 74,550
March 31, 2011
(Unaudited) Level 1 Level 2 Level 3 At Cost
AFS investments:
Debt investments P=707,524,992 P=707,524,992 P=− P=− P=−
Equity investments 18,166,353 18,091,803 − − 74,550
During 2012 and 2011, there were no transfers between Level 1 and Level 2 fair value measurements and no transfers into and out of Level 3 fair value measurements.
The Company classifies its financial instruments in the following categories. March 31, 2012 (Unaudited)
Loans and
Receivables
AFS
Investments
Financial
Assets at
FVPL
Liabilities at
Amortized
Cost
Financial
Liabilities at
FVPL Total
(In Thousand Pesos)
Financial Assets
Cash and cash equivalents P=13,123,431 P=− P=− P=− P=− P=13,123,431
Trade receivables 3,450,083 − − − − 3,450,083
Non-trade receivables 43,963 − − − − 43,963
Loans and notes receivables 62,532 − − − − 62,532
Employee receivables 18,318 − − − − 18,318
Advances to employees 39,670 − − − − 39,670
Other long-term receivables 561,517 − − − − 561,517
AFS - debt investments − 649,830 − − − 649,830
AFS - equity investments − 20,604 − − − 20,604

35
March 31, 2012 (Unaudited)
Loans and
Receivables
AFS
Investments
Financial
Assets at
FVPL
Liabilities at
Amortized
Cost
Financial
Liabilities at
FVPL Total
(In Thousand Pesos)
Financial Liabilities Accounts payable − − − 7,031,579 − 7,031,579
Accrued interest and guarantee
fees − − − 1,144,579 − 1,144,579
Other current liabilities − − − 59,633 − 59,633
Due to related parties − − − 43,505 − 43,505
Royalty fee payable − − − 217,336 − 217,336
Long-term debts − − − 50,294,357 − 50,294,357
Total P=17,299,514 P=670,434 P=− P=58,790,989 P=− P=76,760,937
December 31, 2011 (Audited)
Loans and
Receivables
AFS
Investments
Financial
Assets at
FVPL
Liabilities at
Amortized
Cost
Financial
Liabilities at
FVPL Total
(In Thousand Pesos)
Financial Assets
Cash and cash equivalents P=12,493,407 P=− P=− P=− P=− P=12,493,407
Trade receivables 3,205,594 − − − − 3,205,594
Non-trade receivables 99,399 − − − − 99,399
Loans and notes receivables 59,332 − − − − 59,332
Employee receivables 19,949 − − − − 19,949
Advances to employees 37,935 − − − − 37,935
Due from related parties 8 − − − − 8
AFS - debt investments − 673,854 − − − 673,854
AFS - equity investments − 20,444 − − − 20,444
Financial Liabilities
Accounts payable − − − 5,028,880 − 5,028,880
Accrued interest and guarantee
fees − − − 1,047,606 − 1,047,606
Other current liabilities − − − 3,518 − 3,518
Due to related parties − − − 60,091 − 60,091
Royalty fee payable − − − 287,626 − 287,626
Long-term debts − − − 51,489,571 − 51,489,571
Total P=15,915,624 P=694,298 P=− P=57,917,292 P=− P=74,527,214
March 31, 2011 (Unaudited)
Loans and
Receivables
AFS
Investments
Financial
Assets at
FVPL
Liabilities at
Amortized
Cost
Financial
Liabilities at
FVPL Total
(In Thousand Pesos)
Financial Assets
Cash and cash equivalents P=19,814,619 P=− P=− P=− P=− P=19,814,619
Trade receivables 2,761,442 − − − − 2,761,442
Non-trade receivables 49,751 − − − − 49,751
Loans and notes receivables 61,135 − − − − 61,135
Employee receivables 28,953 − − − − 28,953
Advances to employees 37,937 − − − − 37,937
Other long-term receivables 919 − − − − 919
AFS - debt investments − 690,344 − − − 690,344
AFS - equity investments − 20,059 − − − 20,059
Derivative Assets − − 11,789 − − 11,789
Financial Liabilities
Accounts payable − − − 5,798,084 − 5,798,084
Accrued interest and guarantee − − 1,276,554 1,276,554

36
March 31, 2011 (Unaudited)
Loans and
Receivables
AFS
Investments
Financial
Assets at
FVPL
Liabilities at
Amortized
Cost
Financial
Liabilities at
FVPL Total
(In Thousand Pesos)
fees − −
Other current liabilities − − − 1,023 − 1,023
Short-term loan payable − − − 90,000 − 90,000
Due to related parties − − − 317,844 − 317,844
Royalty fee payable − − − 495,319 − 495,319
Long-term debts − − − 53,457,206 − 53,457,206
Derivative Liabilities − − − − 3,641 3,641
Total P=22,754,756 P=710,403 P=11,789 P=61,436,030 P=3,641 P=84,916,619
The following table demonstrates the income, expense, gains or losses of the Company’s financial
instruments for the years ended March 31, 2012 and 2011 and December 31, 2011:
March 31, 2012
(Unaudited)
December 31, 2011 (Audited)
March 31, 2011 (Unaudited)
Effect on
Profit or Loss
Effect
on Equity
Effect on
Profit or Loss
Effect
on Equity
Effect on
Profit or Loss
Effect
on Equity
Increase
(Decrease)
Increase
(Decrease)
Increase
(Decrease)
Increase
(Decrease)
Increase
(Decrease)
Increase
(Decrease)
Loans and receivables
Interest income on: Cash in banks P=236,811 P=– P=6,388,430 P=– P=4,020,311 –
Cash equivalents 72,619,964 – 369,729,747 – 104,916,319 –
Trade receivables 1,377,041 – 2,983,715 – – –
Employee receivables 1,010,976 – 8,909,082 – – –
Due from related parties – – – – – –
Other receivables – – – – 14,319,893 –
P=75,244,792 P= P=388,010,974 P= P=123,256,523 P=
AFS investments Equity investments:
Net gain (loss) recognized
in equity – (36,814) – 2,277,570 – 1,892,798 Debt investments:
Net gain (loss) recognized
in equity – (11,646,862) (30,001,763) – (11,320,801) Net unrealized gain removed
from equity and recognized
in profit or loss – – 235,689 – Interest income on
ROP Bonds 18,357,534 – 1,099,376 – 217,799 – Gain on early redemption of
AFS bond investment – – 271,292 –
P=18,357,534 (P=11,683,676) P=1,606,357 (P=27,724,193) P=217,799 (P=9,428,003)
Derivative Financial Instruments
at FVPL
Fair value changes and premium on forward contracts – – 108,319,377 – 37,533,046 –
P=– P=– P=108,319,377 P=– P=37,533,046 P=–
Financial liabilities at amortized
cost
Interest expense on long-term
debts (1,001,271,276) – (4,005,331,916) – (986,627,533) – Interest expense on royalty
payable (4,697,188) – (31,332,828) – – –
Interest expense on short-term loans (1,140,521) – (782,375) –
“Day 1” gain on royalty fee – – – (9,676,224) –
Loss on extinguishment of deb – – (197,898,124) – – –
(P=1,005,968,464) P=– (P=4,235,703,389 P=– (P=997,086,132) P=–

37
Capital Management
The primary objective of the Company’s capital management is to ensure that it maintains a
healthy capital ratio in order to comply with its financial loan covenants and support its business
operations.
The Company manages and makes adjustment to its capital structure as it deems necessary.
To maintain or adjust its capital structure, the Company may increase the levels of capital
contributions from its creditors and owners/shareholders through debt and new shares issuance,
respectively.
The Company monitors capital using the debt ratio, which is long-term liabilities divided by long-
term liabilities plus equity. The Company’s policy is to keep the debt ratio not more than 70:30.
The Company’s long-term liabilities include both the current and long-term portions of long-term
debts. Equity includes capital stock attributable to common and preferred shares, unrealized gains
reserve and retained earnings.
Table below shows the Company’s debt ratio as of March 31, 2012 and 2011 and
December 31, 2011.
March 31, 2012
(Unaudited)
December 31, 2011
(Audited)
March 31, 2011
(Unaudited)
Long-term liabilities P=50,294,356,886 P=51,489,571,455 P=53,457,206,325
Equity 30,810,826,866 29,646,601,493 30,684,626,415
Total P=81,105,183,752 P=81,136,172,948 P=84,141,832,740
Debt ratio
62.0% 63.5%
63.5%
Derivative Financial Instruments
The Company’s derivative financial instruments are accounted for as financial instruments at
FVPL. The table below shows the fair value of derivative financial instruments reported as assets
or liabilities as of March 31, 2011 and nil in March 31, 2012 and December 31, 2011.
March 31, 2011
(Unaudited)
Derivative
Assets
Derivative
Liabilities
Embedded derivatives -
Currency options P=– P=–
Free standing derivatives
Currency forwards 11,789,416 3,641,161
Total derivatives P=11,789,416 P=3,641,161
Presented as:
Current P=11,789,416 P=3,641,161
Noncurrent – –
Total derivatives P=11,789,416 P=3,641,161
Freestanding Derivatives. The Company enters into derivative transactions to hedge the foreign
currency exposure arising from its foreign currency denominated loan contracts. In 2012 and
2011, the Company had positions in the following types of freestanding derivatives to protect
itself against foreign currency risk arising from the changes on the exchange rate of the Peso in
relation to the foreign currency.

38
Foreign Currency Forward Contracts. Foreign currency forward contracts are contractual
agreements to buy or sell a foreign currency at an agreed rate on a future date. These are contracts
that are customized and transacted with a bank or financial institution.
For the three-month period ending March 31, 2011, the Company entered a total of 6 buy JPY -
sell USD foreign currency forward contracts with various counter-party banks. These contracts
have notional amounts and average rates of JP¥2,441 million and JP¥83.00, respectively.
Foreign Exchange Swap Contracts. These are contractual agreements between parties to
exchange two currencies at a certain exchange rate at a certain time in the future.
For the three-month period ending March 31, 2011, the company has entered a total of 26 foreign
exchange swap contracts with various counter-party banks. These contracts which include five sell
JPY-buy PHP, two sell JPY-buy USD and nineteen sell USD-buy PHP on trade date have notional
amounts of JP¥12,450 million, JP¥2,075 million and $448 million, respectively.
Embedded Derivatives. The Company has financial and non-financial contracts with derivatives
embedded in them. These embedded derivatives have the effect that some of the cash flows of the
financial and non-financial contracts vary in a similar way to a freestanding derivative.
Fair Value Changes of Derivatives
The tables below summarize the net movement in fair values of the Company’s derivatives as of
March 31, 2012 and 2011 and December 31, 2011.
Freestanding Derivatives
March 31, 2012
(Unaudited)
December 31, 2011
(Audited)
March 31, 2011
(Unaudited)
Derivative
Asset
Derivative
Liability
Derivative Asset
Derivative Liability
Derivative Asset
Derivative Liability
Currency Forwards
Balance at beginning of year P=– P=– P=– P=– P=– P=–
Net changes in fair value – – 381,813,015 (273,493,638) 57,326,207 (P=19,773,161) Settlement – – (381,813,015) 273,493,638 (45,536,791) 16,132,000
Balance at end of year P=– P=– P=– P=– P=11,789,416 (P=3,641,161)
The net changes in fair value of the Company’s derivatives for the periods ended December 31,
2011 and March 31, 2011, amounting to P=108.32 million gain and P=37.5 million gain, respectively
were taken to the “Derivatives gain (loss)” account in the consolidated statements of income.
33. Event After the Financial Reporting Period
On April 4, 2012 the company entered into a 10-year 7,000.00 billion Fixed Rate Note Facility
Agreement(FXCN) to prepay existing FXCN series one (P=2,644.00 million), two (P=1,500.00
million) and three (P=4,856.00 million). The Company has prepaid series one and three for
P=1,774.32 million and P=1,007.07 million, respectively. Subsequently, on May 3, 2012 the FRCN
series 2 (P=4,856.00 million) was also prepaid for P=4,211.10 million.
The Company’s subsidiaries applications as Renewable Energy developer of Tongonan and
Palinpinon Power Plant for GCGI and BMGPP for BGI were approved on May 8, 2012.
Related Documents