M. Fraga, Prague, May 17th. 2 006 The role of temperature on air The role of temperature on air fluorescence measurements fluorescence measurements M. Fraga 1 , A. Onofre 1,2 , N. F. Castro 1 , F. Fraga 1 , L. Pereira 1 , F. Veloso 1 , P. Vieira 1 , R. Ferreira Marques 1 , M. Pimenta 3 , A. Policarpo 1 J. A. C. Gonçalves 4 , C. C. Bueno 4 1 LIP- Coimbra, Dep. Física, Univ. Coimbra, 3004-516 Coimbra, Portugal 2 UCP, R. Dr. Mendes Pinheiro, 24, 3080 Figueira da Foz, Portugal 3 LIP-IST, Av. Elias Garcia 14, 1100-149 Lisboa, Portugal 4 IPEN and PUC, S. Paulo, Brasil

M. Fraga, Prague, May 17th. 2006 The role of temperature on air fluorescence measurements M. Fraga 1, A. Onofre 1,2, N. F. Castro 1, F. Fraga 1, L. Pereira.
Dec 17, 2015
Welcome message from author
This document is posted to help you gain knowledge. Please leave a comment to let me know what you think about it! Share it to your friends and learn new things together.
Transcript

M. Fraga, Prague, May 17th. 2006
The role of temperature on air fluorescence The role of temperature on air fluorescence measurementsmeasurements
M. Fraga1, A. Onofre1,2, N. F. Castro1, F. Fraga1, L. Pereira1, F. Veloso1, P. Vieira1, R. Ferreira Marques1, M. Pimenta3, A. Policarpo1
J. A. C. Gonçalves4, C. C. Bueno4
1 LIP- Coimbra, Dep. Física, Univ. Coimbra, 3004-516 Coimbra, Portugal2UCP, R. Dr. Mendes Pinheiro, 24, 3080 Figueira da Foz, Portugal
3 LIP-IST, Av. Elias Garcia 14, 1100-149 Lisboa, Portugal4IPEN and PUC, S. Paulo, Brasil

M. Fraga, Prague, May 17th. 2006
Layout:Layout:
• Theory;
• Experimental set-up;
• Previous measurements taken with alpha particles as excitation source (Nc versus T for = const.);
• Simulation of the chamber and correction factors evaluation;
• Corrected data versus T and comparison with recent measurements;
• Further tests – the need of a precise knowledge of the behaviour all the components of the experimental set up;
• Conclusions and plans for the future

M. Fraga, Prague, May 17th. 2006
In steady state conditions, the light yield for the v’v’’ band is given by:
with
The rate constant is given by:
F () represents the fraction of the excitation processes which produce
photons that arrive at the PMT window.
NN22 scintillation scintillation
2nd positive system (300-400 nm)2nd positive system (300-400 nm)
v'0*2´´v´v''v'v ]'v,N[AY
)scm(Tk8
vk 1321
Br
v '1 2v ' 2 xv '
1
k k N k X
v 'v ''ph v 'v '' vN ( ,T) ( ,T) A ( ,T) ( ) F
1 v 'k A

M. Fraga, Prague, May 17th. 2006
Experimental set-up and data (raw) on Dec. Experimental set-up and data (raw) on Dec. 2004 – Jan. 20052004 – Jan. 2005
PM2 PM1
Interferencefilter
Fused silicawindows
Fused silicawindows
Freezer
PM1, PM2 - XP2020Q
Cooling unit
to vacuum pump
gas input
PM3
-30 -20 -10 0 10 20 300,84
0,86
0,88
0,90
0,92
0,94
0,96
0,98
1,00
1,02
1,04
1,06
434 hPa 520 hPa 600 hPa 688 hPa 818 hPa
L rel
temperature (ºC)
Excitation source: particles (5.4 MeV)

M. Fraga, Prague, May 17th. 2006
Am-241 source Am-241 source outside the chamber, outside the chamber,
exposed to airexposed to air
– For a constant , as the temperature is lowered, the energy loss outside the chamber increases:
• the mean energy, <>, with which the a particle enters the chamber is
lower for lower temperatures;
• the length of the track is also shorter for lower temperatures ;
f
R ' i iv 'v '' v ' v '' v ' exc0 S 2
dE 1 dScos T( )( ,T) A
d 4 r dx'
x'
N
thin mylar window
y = 6 mm

M. Fraga, Prague, May 17th. 2006
Filter TransmissionFilter Transmission** : T( : T(ii))
Filter: Melles Griot, c = 340 nm; = 10 nm
2i
CWL CWL,0sin
1n
For small angles of incidence, i
*S. Klepser, AirLight 03, Dec. 2003, Bad Liebenzell, Germany.
0º Transmission curve as given by the manufacturer
Otherwise it has to be measured:
0
300
600
900
1200
1500
1800
300 310 320 330 340 350 360
wavelength (nm)
Nc
(u.a
.)
0º
5º
10º
15º
20º
25º
30º
35º
40º
0
0.2
0.4
0.6
0.8
1
1.2
0 5 10 15 20 25 30 35 40
angle of incidence (º)
Irel
(337
nm
)

M. Fraga, Prague, May 17th. 2006
Monte Carlo simulation using GEANT4 codeMonte Carlo simulation using GEANT4 code**
Outside the chamber:
air (273 K)air (273 K)
Inside:
N2 (336 hPa at 20ºC)
<track> = 46 mm
N2 (818 hPa at 20ºC)
<track> = 22 mm
Outside the chamber: PPair air < 0.1 torr< 0.1 torr
Inside: Dry air (434 hPa at 20ºC)
5 events 5 events
5 events
* Note: pressure effects on light yields are not included in the simulation

M. Fraga, Prague, May 17th. 2006
Results of simulation: typical Results of simulation: typical FF (( factors with air at 1013 hPa factors with air at 1013 hPa outside the chamberoutside the chamber
Uncertainties in <Nph_PM>/ :• < 2% - due to variations of atmospheric pressure • < 1% - due temperature variations
818 hPa 336 hPa
dE/dx dE/dx
<Nph_PM> <Nph_PM>
250 260 270 280 290 3001.5
1.6
1.7
1.8
1.9
2.0
<N
ph_P
M>
/
T (K)
2.92
2.96
3.00
3.04
3.08
3.12
P20ºC
= 818 hPa
Elo
ss (
MeV
)
250 260 270 280 290 3001.68
1.72
1.76
1.80
<N
ph_P
M>
/
T (K)
2.56
2.60
2.64
2.68
2.72
P20ºC
= 336 hPa
Elo
ss (
Me
V)

M. Fraga, Prague, May 17th. 2006
Introducing the corrections to the experimental data (0-0 band) ...Introducing the corrections to the experimental data (0-0 band) ...
one gets ...
250 260 270 280 290 300
0.85
0.90
0.95
1.00
1.05
<N
ph_P
M>
/ (
norm
.)
T (K)
250 hPa 336 hPa 434 hPa 520 hPa 600 hPa 688 hPa 818 hPa
-30 -20 -10 0 10 200.80
0.85
0.90
0.95
1.00
1.05
1.10
336 hPa 434 hPa 520 hPa 600 hPa 688 hPa 818 hPa
#coi
nc/s
norm
0ºC
temperature (ºC)
-30 -20 -10 0 10 200.80
0.85
0.90
0.95
1.00
1.05
1.10
1.15
1.20
336 hPa 434 hPa 520 hPa 600 hPa 688 hPa 818 hPa
Rno
rm
Temperature (ºC)
ph _ PM
#coinc / sR
N

M. Fraga, Prague, May 17th. 2006
-30 -20 -10 0 10 20 30
0.20
0.25
0.30
0.35
0.40 336 hPa 434 hPa 520 hPa 600 hPa 688 hPa 818 hPa 817 hPa
R (
a.u
.)
temperature (ºC)
Light yield versus t (ºC) .
Values are corrected for the geometrical factors and different energy losses inside the chamber.
For constant one would expect that:
and
or
v '1
A ' B' T
1R
A ' B' T
1A B T
R 15.6 15.8 16.0 16.2 16.4 16.6 16.8 17.0 17.2
0.80
0.85
0.90
0.95
1.00
1.05
1.10
1.15
1.20
336 hPa 434 hPa 520 hPa 600 hPa 688 hPa 818 hPa
1/R
(re
l.)
T0.5 (K0.5)
Inverse of light yield versus . T

M. Fraga, Prague, May 17th. 2006
300 400 500 600 700 800 900
2.5
3.0
3.5
4.0
4.5
5.0
5.5
1/R
(a
.u.)
P20ºC
(hPa)
2
21 N
v 1
1 kIf 0 k 1 P
k X ,
2
v1 2 N x X
1;
k k P k P
2N 2 11
and A B P where B / A k / kR
Dependence of Light Yield on Pressure, at room temperatureDependence of Light Yield on Pressure, at room temperature
Inverse of light yield versus pressure at room temperature (0-0 band at 337 nm)
B/A = (5.8±1.4)×10-3 hPa-1
(2.8 MeV) P = 30-500 hPa 8.8×10⁻³ hPa-1 Brunet 1973, PhD Thesis
(5.3 MeV), P > 300 hPa 5.4×10⁻³ hPa-1 Duchaffaut 1969, PhD Thesis
(4.3 MeV), P < 190 hPa 8.3×10⁻³ hPa-1 Tatischeff 1967, PhD Thesis
k20/k10
For T = constant,

M. Fraga, Prague, May 17th. 2006
Improvement in the experimental set-up: very low pressure in the Improvement in the experimental set-up: very low pressure in the region of the alpha sourceregion of the alpha source
M. Fraga, Prague, May 17th. 2006
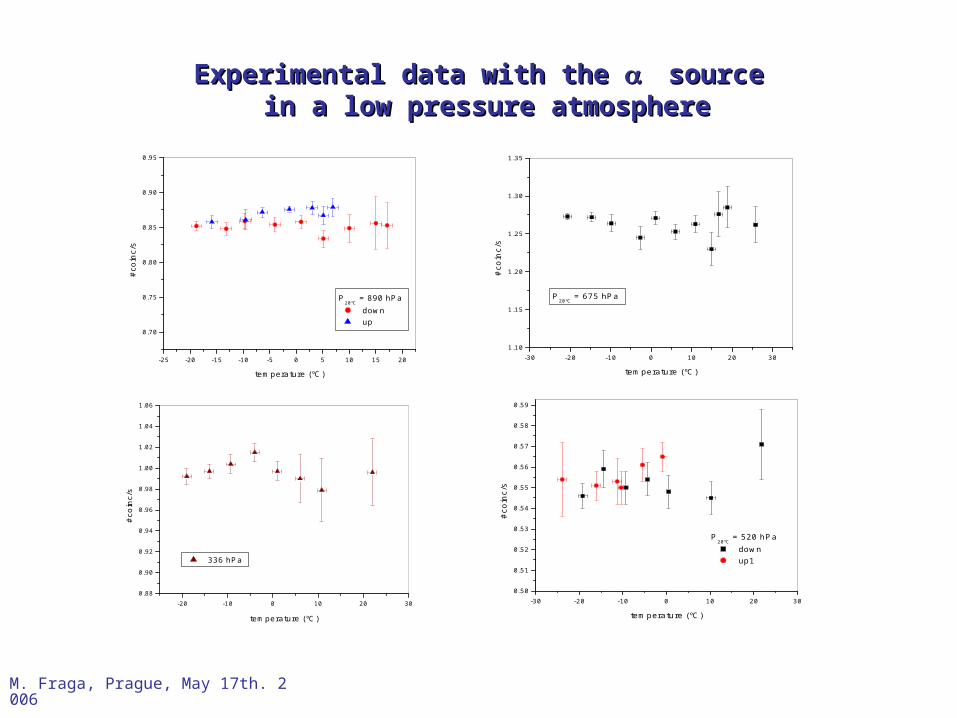
Experimental data with the Experimental data with the sourcesource in a low pressure atmosphere in a low pressure atmosphere
-25 -20 -15 -10 -5 0 5 10 15 20
0.70
0.75
0.80
0.85
0.90
0.95
#co
inc/
s
temperature (ºC)
P20ºC
= 890 hPa down up
-30 -20 -10 0 10 20 301.10
1.15
1.20
1.25
1.30
1.35
#co
inc/
s
temperature (ºC)
P20ºC
= 675 hPa
-20 -10 0 10 20 300.88
0.90
0.92
0.94
0.96
0.98
1.00
1.02
1.04
1.06
#co
inc/
s
temperature (ºC)
336 hPa
-30 -20 -10 0 10 20 300.50
0.51
0.52
0.53
0.54
0.55
0.56
0.57
0.58
0.59
P20ºC
= 520 hPa down up1
#co
inc/
s
temperature (ºC)
M. Fraga, Prague, May 17th. 2006
200 300 400 500 600 700 800 9000.3
0.4
0.5
0.6
0.7
0.8
0.9
1.0
1.1
1.2
Elo
ss/E
i
P20ºC
(hPa)
24
27
30
33
36
39
42
45
48
51
<p
ath
> (m
m)
Fraction of the alpha particle energy, lost in the gas.
particle source in a low pressure environment.
200 300 400 500 600 700 800 9000.5
1.0
1.5
2.0
2.5
3.0
3.5
<p
h_
de
t>/
P20ºC
(hPa)
Correction factors :Correction factors :
For P20º = 243 hPa,
(#coinc/s)Patm/(#coinc/s)low P = 1.26 ± 0.03
and
<Nph_PM>Patm/<Nph_PM>low P = 1.16 ± 0.08
M. Fraga, Prague, May 17th. 2006
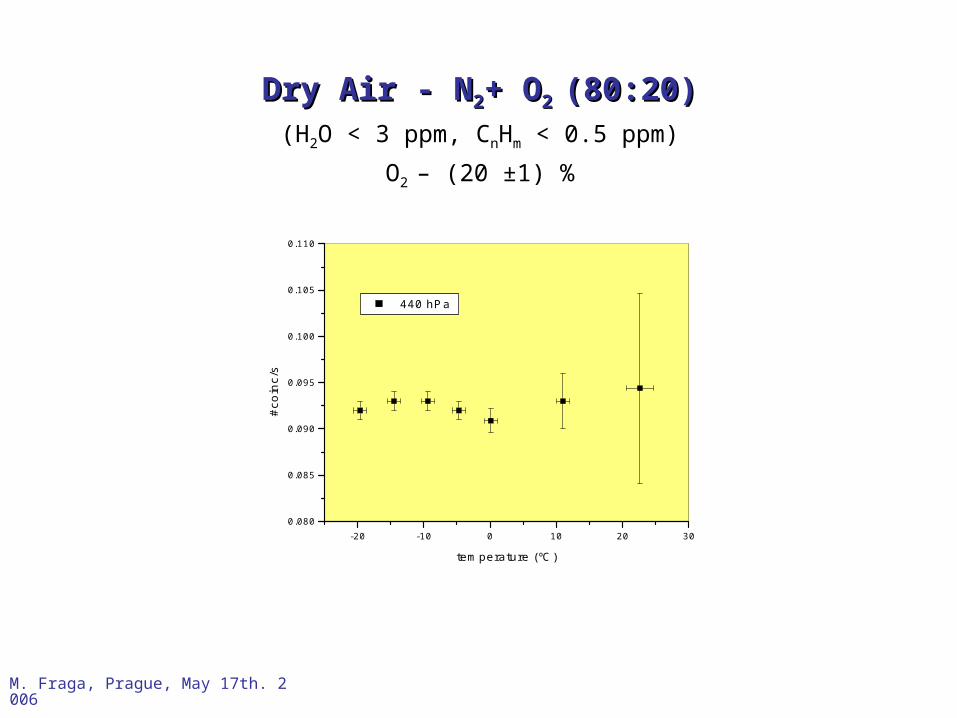
Dry Air - NDry Air - N22+ O+ O2 2 (80:20)(80:20)(H2O < 3 ppm, CnHm < 0.5 ppm)
O2 – (20 ±1) %
-20 -10 0 10 20 300.080
0.085
0.090
0.095
0.100
0.105
0.110
#co
inc/
s
temperature (ºC)
440 hPa

M. Fraga, Prague, May 17th. 2006
Further corrections:Further corrections:
• variation of the PMT gain with T
m = - 0.121 (±0.008) #/ºC for = 337 nm;
• Variation of quantum efficiency of the photocathode with T – in progress
• Variation of the transmission of the interference filter with T – in progress
-10 -5 0 5 10 15 20 25 30
54
55
56
57
58
59
60
pe
ak
cha
nn
el
temperature (ºC)
0
5
10
15
20
25
0 20 40 60 80 100 120 140 160
# canal
Nc
(s-1
)

M. Fraga, Prague, May 17th. 2006
Study of the transmission of the IFStudy of the transmission of the IF
Set-up :
Data from Melles Griot
375 400 425 450 475 500 525 5500.000
0.005
0.010
0.015
0.020
0.025
Y = A + B X----------------------------------------A 8.29739E-4 5.5495E-4B 3.79734E-5 1.15368E-6---------------------------------------- = 337 nm, =0.014 nm/º,
peak=0.6 nm
(n
m/º
)
(nm)
M. Fraga, Prague, May 17th. 2006
Conclusions and plans for the futureConclusions and plans for the future
• A coherent set of results were obtained under particle excitation .
• The expected dependence on T is not clear from the present set of
experimental data and further studies and tests are needed (and they are
underway).
• An important issue is to lower the temperature of the gas below -20º ; this
implies improvements on the experimental set-up (studies are underway).
• Simulation of the chamber will go on.
• Measurements using particles (Sr-90) (already underway) will be carried
out ;
Related Documents