SPECTRAL PROPERTIES (0.4 to 25 microns) OF SELECTED ROCKS ASSOCIATED WITH DISSEMINATED GOLD AND SILVER DEPOSITS IN NEVADA AND IDAHO M. Dennis Krohn U.S. Geological Survey Reston, Virginia 22092 submitted to: Journal of Geophysical Research

Welcome message from author
This document is posted to help you gain knowledge. Please leave a comment to let me know what you think about it! Share it to your friends and learn new things together.
Transcript

SPECTRAL PROPERTIES (0.4 to 25 microns) OF SELECTED ROCKS
ASSOCIATED WITH DISSEMINATED GOLD AND SILVER DEPOSITS
IN NEVADA AND IDAHO
M. Dennis Krohn
U.S. Geological Survey
Reston, Virginia 22092
submitted to:
Journal of Geophysical Research

SPECTRAL PROPERTIES (0.4 to 25 microns) OF SELECTED ROCKSASSOCIATED WITH DISSEMINATED GOLD AND SILVER DEPOSITS
IN NEVADA AND IDAHO
M. Dennis Krohn U.S. Geological Survey Reston, Virginia 22092
ABSTRACTVisible, near-infrared (VNIR) reflectance spectra and mid-infrared (MIR)
transmission spectra (2.5 urn - 25. urn) were measured for selected rock types from disseminated gold and silver deposits in northern Nevada and southern Idaho. Samples from the open-pit mines at Pinson, Nevada, and Delamar, Idaho, were compared to weathered surface samples from a prospect at Preble, Nevada. Eight characteristics of the disseminated deposits were proposed that could be identified by remote sensing applications. Of these eight characteristics, jasperoids, the siliceous replacement of limestones were readily distinguishable from the carbonate host rock and other associated silicate rocks by their spectral characteristics in the MIR. Active or fossil hot spring sites, where present near the deposit, display similar VNIR spectral features at the surface as hydrothermally altered rocks found at depth in the open-pit mines. However, most of the host rocks at the surface above a disseminated gold prospect show few VNIR absorption features, because of the presence of organic matter. VNIR spectral features of carbonate were detectable in a few cases immediately adjacent to a jasperoid. Ammonium spectral features are observed on some of the hydrothermally altered shale surrounding the prospect, also suggesting the presence of organic matter. Because organic matter exerts such a large influence on the spectral character of the host rocks, the combined MIR and VNIR wavelengths are needed for remote discrimination of disseminated gold prospects in the western U.S.

1. INTRODUCTIONSeveral distinctive types of base- and precious-metal deposits in the
arid western United States have been mapped recently by use of multispectral remote sensing data from aircraft and spacecraft [Goetz and Rowan, 1981], Different types of hydrothermally altered rocks have been mapped at Goldfield, Nevada. [Rowan et al, 1974]; at Cuprite, Nevada. [Abrams et al, 1977], at Tintic, Utah. [Rowan and Kahle, 1982]; at Silver Bell and other southern Arizona deposits [Abrams et al, 1983]; at Oatman, Arizona. [Marsh and McKeon, 1983]; at Marysvale, Utah. [Podwysocki et al, 1983]; in the Baja California region of Mexico [Rowan et al, 1983]; and in southern Nevada [Podwysocki et al, 1985]. These deposits have been detected primarily because of the presence of two types of minerals that produce diagnostic spectral absorption features in the visible and near-infrared (VNIR). Clay minerals and other sheet silicates associated with argillic and phyllic types of alteration [Lovering, 1949; Hayba et al, 1984] exhibit characteristic molecular-vibration absorption features near 2.2 um [Hunt and Salisbury, 1970]. In addition, iron oxide minerals, which are either primary or secondary products of hydrothermal alteration, produce absorption features in the near-infrared near 0.9 um and in the visible and ultraviolet (UV) portions of the spectrum due to Fe ligand field and 0 - Fe charge-transfer transitions [Sherman, in press].
"Disseminated gold deposits" is the name being applied to a newly defined type of precious metal deposit in the western United States [E.W.Tooker, in press]. The common characteristic of all these deposits is the presence of gold disseminated in submicroscopic particles generally less than 5 um «0.005 mm) throughout the host rock. The deposits are generally classified as low- temperature replacement deposits, where hydrothermal fluids have dissolved carbonate minerals and deposited quartz and fine-grained gold [Fournier, in press; Dickson et al, 1979]. Two general types of disseminated deposits are recognized depending upon their geological setting, the sediment-hosted deposits and the volcanic-hosted deposits. Nine of the twenty-five leading gold-producing mines in the United States in 1982 occur as sediment-hosted disseminated gold deposits from Nevada [Lucas, 1983]. Prospecting for these deposits is generally based on geochemical sampling looking for anomalous concentrations of gold, mercury, arsenic, antimony, tungsten, and thallium [Erickson et al, 1964; Dickson et al, 1979]. The sediment-hosted type of disseminated gold deposit occurs as a replacement of a sedimentary rock, commonly an organic-rich carbonate, by silica in the form of a massive siliceous body known as a jasperoid [Lovering, 1972], These geologic characteristics suggest that at least two additional spectral-absorption bands may be needed for remote detection of the disseminated gold deposits: the carbonate band at 2.35 um and the fundamental silicon-oxygen absorption band at 9.3 um [Hunt and Salisbury, 1971; 1975],
The purpose of this preliminary discussion is to provide a description of spectral features in the visible and near-infrared (VNIR) (0.4 um - 2.5 um) and the mid-infrared (MIR) (2.5 um - 25 um) wavelengths of selected rock samples from several disseminated gold and silver deposits in the western U.S. Spectra of fresh rock samples at depth from the open-pit mines will be compared to spectral features of weathered samples at the surface of an active disseminated gold prospect. The analysis of spectral features observed in the laboratory is presented as a guide to determine potential remote sensing characteristics of disseminated gold and silver deposits in the western U.S.

2. REMOTE-SENSING CHARACTERISTICS OF DISSEMINATED GOLD DEPOSITS A comparison of some of the major disseminated gold deposits in Nevada
(table 1, fig. 1) indicates that a number of surface geologic characteristics may be detectable by remote sensing. The following eight remote-sensing characteristics were deduced from descriptions of the five major sediment- hosted disseminated gold deposits listed in table 1. They can be depicted either by distinctive spectral characteristics or by photo-interpretation of the images. (1) Carbonate Rocks: Sedimentary carbonate rocks, commonly interbedded with shale, siltstone, or dolomite, are the dominant host rocks for the sediment-hosted deposits, although some deposits occur exclusively in shale and sandstone. (2) Organics: Organic material is present in many of the deposits, although its role in the deposits is not clear; it shows evidence in places of being remobilized. (3) Silicification: The primary effect of hydrothermal alteration is silicification; at the surface, massive siliceous outcrops of jasperoids replacing carbonates are the main indicator of hydrothermal alteration. (4) Argillic/Phyllic Alteration: In some deposits, the presence and mineralogy of kaolinite, montmorillonite, illite, or muscovite is indicative of argillic or phyllic types of alteration; (5) Intrusive Rocks: A spatial association of the disseminated deposits to intrusive stocks is commonly observed, but a genetic relationship is still in question. Crosscutting dikes, some of which are hydrothermally altered, are also observed in most deposits; in some cases they are linked to an adjacent intrusive stock. (6) Structures: Ore bodies are commonly associated with steeply dipping faults, although ore boundaries are commonly conformable with bedding. In addition, many of these deposits are aligned along distinctive linear trends. (7) Calc-silicate Rocks: Some of the carbonate rocks near intrusions show effects of high-temperature alteration to calc-silicates. This metamorphism is not considered to be related to the depositon of the gold; however, it does indicate the presence of an intrusive body in the vicinity of a carbonate host rock. (8) Hot Springs: In some deposits, evidence of present or relict hot-spring activity is observed, but again no genetic relationship has been clearly demonstrated between the hot spring deposits and the disseminated gold mineralization.
Several of these characteristics have spectral features that can be directly related to the constituent rock type. Limestones as host rock display a carbonate absorption band at 2.32 urn in the VNIR that shifts to longer wavelengths for dolomitic rocks [Hunt and Salisbury, 1971]. The siliceous replacement deposits display a silicon-oxygen absorption feature at 9.3 urn and in addition have a high reflectance in the VNIR that enhances other spectral absorption features [Hunt and Salisbury, 1974]. Different iron-absorption features are some of the most common spectral features observed in hydrothermally altered rocks. These are caused by electronic transitions in the iron atom. Two primary features are observed in the VNIR, a band near 1.0 urn and an absorption edge in the visible region due to strong bands in the UV. The ferric iron oxides, hematite and goethite, can be discerned by a shift in the absorption band between 0.88 urn and 0.95 urn respectively. Ferrous iron displays an absorption band near 1.02 urn. Other information about the iron oxide mineralogy can be gained by looking at the smaller absorption bands in the visible [Hunt et al, 1971; Hunt and Ashley, 1979; Sherman et al, 1982]. Argillic and phyllic alteration minerals display spectral features resulting from vibrational processes related primarily to the hydroxyl radical. Several absorption features near 2.2 urn are related to Al-OH. Kaolinite displays a doublet at 2.16 urn and 2.20 urn, muscovite and
illite display a primary absorption band at 2.21 urn with smaller bands at 2.35 _um_ and 2.45 um; montmorillonite displays a single absorption band at 2.20 um with hydroxyl and water bands at 1.4 um and 1.9 um [Hunt et al, 1973a; Lee and Raines, 1984; _N. Vergo, 1985, pers. com.]. Intrusive rocks and cross-cutting dikes in the MIR display Si-0 absorption features shifted to longer wavelengths than 9.3 um depending upon the felsic/mafic composition of the rocks [Lyon, 1965]. The VNIR spectra of felsic and intermediate rocks show an increase in reflectance from 0.4 um to 2.0 _um_ and commonly display ferric iron absorption bands. Hydroxyl and water bands at 1.4 um and 1.9 um are sometimes observed because of fluid inclusions in quartz [Hunt et al, 1973b^; 1973c_], Gale-silicate minerals, such as diopside and tremolite, display two absorption bands near 2.3 - 2.4 _um_ arising from hydroxyl ions being bonded to magnesium ions [Hunt and Salisbury, 1970], Such rocks commonly display ferric or ferrous iron absorption features near 0.9 _um_ and 1.0 _um_ respectively. The siliceous portions of a hot spring deposit display an Si-0 feature near 9.3 um and hydroxyl and water absorption features in the VNIR. The acid-leach portion of the hot spring deposit may show other types of spectral features, because of the variety of rock types produced by hydrothermal alteration in these deposits [Hunt and Ashley, 1979]. Iron oxides with spectral features in the visible and in the near-infrared near 0.9 um are common weathering products of hydro thermally altered rocks. In this discussion, emphasis will be placed upon spectral features as they relate to compositional differences in the rock types. Spatial features derived from photointerpretation of images are important to an overall remote sensing technique, but will not be discussed here.
3. VISIBLE AND NEAR-INFRARED REFLECTANCE SPECTRA
The range of spectral properties of rock types associated with disseminated gold deposits can be evaluated by comparing laboratory spectra of selected exposed rocks from open-pit mines to laboratory spectra of weathered outcrops from the surface. The laboratory spectra presented are a preliminary sample of rocks designed to gauge the range of spectral features that might be present in these deposits.
A. Sample ProcedureA laboratory reflectance spectrum was measured for each whole rock sample
collected from the Pinson, Preble, and Delamar deposits. Spectra were run on a Beckman* Model 5240 UV Spectrophotometer equipped with an integrating sphere. Separate detectors are used for the visible and near-infrared wavelengths, which are displayed separately in the figures. Wavelength resolution is estimated to be 0.32 _um_ at 2.5 _um_ and increases to an average of 0.12 um for the rest of the scan in the near-infrared; resolution in the visible is estimated to be 0.023 um.
Whole-rock samples were mounted at the base of the integrating sphere below a 2.5 cm sample opening. For the mine rocks, a fresh face was measured; for the surface rocks, a weathered face was generally measured unless specifically noted otherwise in the text. Supplementary X-ray powder diffraction was run for each sample with random mounts (table 2); oriented
Any use of tradenames and trademarks in this publication is for descriptive purposes only and does not constitute endorsement by the U.S. Geological Survey.

mounts were run for selected samples thought to contain clay minerals. Whole- rock chemical analysis was performed on each sample by energy-dispersive x-ray fluorescence spectroscopy (table 3). Samples were prepared in a loose powder preparation that had been ball-milled for 20 minutes in acetone. A fundamental parameters-type matrix correction was used to obtain the results. Accuracy is estimated to be +_ 10 percent; reproducibility is estimated to be ± 1 pe rcent.
B. Spectra of Mine RocksVNIR laboratory spectra are compared for rocks from two open-pit mines.
The Pinson mine is a sediment-hosted disseminated gold deposit in north- central Nevada; the Delamar mine is a volcanic-hosted disseminated silver deposit in southern Idaho. Rock spectra from Pinson and Delamar mines are compared for two reasons. As a volcanic-hosted disseminated deposit, Delamar may represent an intermediate step between the well-exposed, highly altered, acid-leached deposits in volcanic rocks, well-depicted previously by remote sensing [Goetz and Rowan, 1981] and the sediment-hosted disseminated gold deposits, which show relatively few alteration effects at the surface (table 1). Second, Milestone Knob, a siliceous sinter deposit from a paleo-hot spring adjacent to Delamar, provides an opportunity to relate spectral features from sinter rocks at the surface to the hydrothermally altered rocks at depth.
Pinson. The Pinson mine (fig. 1) is located on the east side of the Osgood Mountains along a mineralized fault zone at the contact between the Cambrian Preble Formation and the Ordovician Comus Formation [Antioniuk and Crombie, 1982]. At Pinson, the Comus Formation is composed of interbedded siltstone and limestone with minor dolomite and chert and is the principal host rock for the ore. The Preble Formation is composed of dark carbonaceous shale interbedded with quartzite and limestone. Mineralization is confined mainly to the silicified fault zones within the Comus Formation, and the highest grades of 0.20 ounces per ton occur in the dense jasperoid along the fault. The gold is generally less than 5 urn in size and occurs mostly as a free phase not associated with any other mineral except silica [Antioniuk and Crombie, 1982]. At the mine, the Osgood Mountain pluton, a granodiorite stock of Late Cretaceous age, intrudes through the Paleozoic sedimentary rocks. Near the contact of the pluton, the calcareous sedimentary rocks have undergone contact metamorphism to diopside, tremolite, and other calc-silicates. Sills and dikes of dacite porphyry are also present in the mine and are believed to be related to the pluton. Some argillic alteration is observed adjacent to the silica replacement.
Laboratory spectra are presented for the silicified, argillized, and adjacent host rock of the Comus Formation for Pinson (figs. 2 and 3). Fe absorption bands at 0.64 urn and 0.95 urn are the dominant spectral feature of the silicified sample (D-26, fig. 2). A weak feature at 2.25 urn is observed in the silicified rock spectrum. The cause of this feature is unknown, because no clay minerals were detected in the X-ray data (table 2). However, the absorption band may be related to a hydroxyl feature associated with silica [Podwysocki et al, in press], although a small percentage of potassium in the rock (table 3) may be associated with a surface coating of illite. The spectrum from the argillized sample from Pinson (D-25, fig. 2) displays a shoulder of the doublet at 2.16 um_and 2.21 um_ indicating kaolinite [Hunt et al, 1973a]. Kaolinite was confirmed by X-ray as the dominant clay mineral in addition to smaller amounts of illite/smectite (table 2). Iron oxides are indicated by a broad band near 0.9 ^im_and are confirmed chemically (table 3). The spectrum also shows a prominent water band at 1.95 urn that is not present

in the laboratory spectra of kaolinite [Hunt et al, 1973a]. Other workers have also observed water bands in samples of kaolinite taken from the field and suggest they may be due to physioadsorbed water [Hunt and Ashley, 1979; Rowan et al, 1983]. Alternate sources for the water band may be the hydroxides associated with limonite, or interlayer water associated with the illite/smectites. A spectrum of calc-silicates, exposed in the Pinson mine workings adjacent to the Osgood Mountain pluton shows two bands near 2.32 um and 2.40 um. Such absorption features are indicative of tremolite, which is confirmed in X-ray (table 2). In addition, a broad ferrous iron band near 1.0 _um_ is also observed in the calc-silicate spectrum (D-116, fig. 2).
Spectra of the Comus Formation, the host rock at Pinson, show different spectral characteristics. A spectrum of the bleached massive limestone unit adjacent to the silicified zone (D-27, fig. 2) shows a fairly high reflectance mostly above 50 percent with deep water bands and a strong band at 2.32 um indicative of carbonate. X-ray and chemical data show almost 50 percent of the rock is composed of quartz, which would tend to increase the overall reflectance of the sample. A spectrum of the dark, carbonaceous interbedded limestone and shale (D-28, fig. 2) from the upper bench of the Pinson mine, however, shows a much lower reflectance, less than 20 percent, and a spectrum that is almost featureless, even though it also has a high percentage of quartz (tables 2 and 3).
Delamar. At the Delamar mine in southern Idaho (fig. 1), the geologic setting is a sequence of Tertiary rhyolitic to basaltic volcanic flows and tuffs that overlie an eroded Cretaceous granodiorite [Pansze, 1975]. A rhyolitic quartz porphyry is the principal ore host; it is intensely fractured with many silicified veins that are surrounded by a halo of argillic alteration. The stratigraphic section exposed at the mine is a rhyolitic tuff breccia at the base, which is weakly mineralized, overlain successively by a rhyolitic vitrophyre that has been mineralized and altered to a clay zone, and capped by a flow-banded rhyolite [Knox and Weitz, 1976]. The clay zone is composed of kaolinite, montmorillonite, illite, and pyrite and is believed to have acted as an impervious barrier to the ascending mineralizing fluids [Rodgers et al, 1980; Beebe, 1981]. Most of the mineralization is disseminated as the silver selenide, naumanite, near the silicified veins.
Spectra of hydrothermally altered rocks from the volcanic-hosted disseminated silver deposit at Delamar (fig. 1), appear similar in some ways to the spectra from Pinson. A spectrum of one of the silicified veins at Delamar (D-19, fig. 3) has a strong iron oxide band at 0.85 um, large hydroxyl and water bands at 1.4 _um_ and 1.9 _um_ and an Al-OH band at 2.2 um. No evidence for clay minerals is detected either by X-ray or chemical analyses (tables 2 and 3) suggesting a thin surface coating may be responsible for the spectral feature. The hydroxyl band at 1.4 um appears relatively broad toward the longer wavelengths resulting in a local maximum at 1.3 um. The spectrum of argillized rock from the clay zone at Delamar (D-18, fig. 3) shows the doublet at 2.21 um_ and 2.16 um indicative of kaolinite and a broad band near 0.9 um indicative of ferric iron. Both quartz and kaolinite are detected in the X-ray analysis (table 2). Like the spectrum for the argillized Pinson sample, this spectrum also shows a water band at 1.95 um.
A sample of the greyish-green tuff breccia and a sample of the upper flow-banded rhyolite were chosen to be representative of weakly altered host rock. The spectrum of the tuff breccia (D-17, fig. 3) exhibits hydroxyl

absorption bands at 1.4 urn, 2.2 urn, 2.35 urn, and 2.45 urn and a water band at 1.9 urn. X-ray analysis (table 2) shows the presence of an illite-smectite mixed-layer clay, which would explain the water and the hydroxyl absorption features. In addition, the spectrum of the tuff breccia displays a broad absorption band between 0.7 urn and 1.1 urn probably caused by combined ferrous and ferric iron absorption features. A spectrum of the flow-banded rhyolite (D-13, fig. 3) shows hydroxyl and ferric and ferrous iron features similar to but weaker than those of the tuff breccia; the two have similar X-ray and chemical analyses (tables 2 and 3). The spectra of the host rocks at Delamar contrast sharply with the spectra of the Comus Formation near the silicified zone at Pinson. Even though the spectra of the surrounding host rocks of the two types of disseminated deposits differ greatly, spectra from the silicified and argillized samples of the mine rocks of the two types are fairly similar.
B. Surface RocksWeathered rocks collected at the surface generally showed less intense
spectral features than samples taken from a mine. Surface samples were collected from four sites: Preble, Golconda, Milestone Knob, and a site near the Getchell mine (fig. 1). Two of the sites, Golconda and Milestone Knob (fig. 1), are hot-spring deposits near the mines at Pinson and Delamar. Preble (fig. 1) is a deposit south of Pinson currently being developed (Kretschmer, 1984), giving an opportunity to examine how hydrothermally altered rocks appear at the surface and in the upper few meters below the surface. The spectra are presented in the order of the remote-sensing characteristics of disseminated gold deposits discussed in section 2.
Organic-rich limestones. Most of the limestones of the Cambrian Preble Formation and Ordovician Comus Formation in the vicinity of the Preble deposit contain some organic matter, so it is difficult to separate the two remote sensing characteristics. A sample of limestone adjacent to the mineralization (D-45-1, fig. 4) at the Preble deposit can be compared to an unaltered sample collected approximately 1.5 km southwest of the deposit (D-70-1, fig. 4) to determine if any local surface effects of mineralization could be observed in the host rocks. Both limestones weather grey and have a pitted, etched surface on the exposed face. Although the sample away from the deposit, D-70, is a lighter shade of grey (N6) than the sample near Preble, D-45 (N3) [Goddard et al, 1948], both spectra appear extremely flat . Some evidence of a carbonate absorption band is observed at 2.35 urn, but it is difficult to measure even at the expanded scale (fig. 4). The underside of the exposed limestones and the soils adjacent to the limestones commonly weather to a light tan color. Spectra of these soils (D-45-2 and D-70-2, fig. 4) display ferric iron absorption in the visible region below 0.7 j^ and have a much higher reflectance than the rocks. Again, a small carbonate band is observed. Chemical analysis (table 3) shows the surface limestones have much less silica than the limestone from the Pinson pit.
Silicification. The primary evidence for hydrothermal alteration at the surface is the presence of siliceous replacement deposits. Jasperoids at Preble weather dark brown to black and commonly protrude slightly above the limestone outcrops. Spectra of two Jasperoids near Preble (D-44 and D-157, fig. 4) show evidence of ferric iron oxides by the band at 0.9 urn. In sample D-157, a hydroxyl band is observed at 2.20 urn, which corresponds to muscovite (table 2). The small band at 2.35 urn is probably a secondary band of muscovite [Lee and Raines, 1984], although a carbonate band might also be interpreted (table 3).

A jasperoid having a highly brecciated texture and well-preserved bedding in the clasts was observed immediately west of the silicified fault zone exposed in the pit at Preble. This jasperoid (D-100, fig. 5) has a higher spectral reflectance than the other jasperoids (fig. 4). A broad ferric iron band is observed at 0.9 urn resulting in a reflectance maximum near 1.3 urn. This pattern is similar to the spectral features of the silicified zones observed at Pinson and Delamar. The adjacent massive limestone of the Preble Formation appears similar in color to the other weathered limestones, but its spectrum (D-102, fig. 5) shows a stronger carbonate band at 2.32 urn. A second sample (D-129, fig. 5) adjacent to a jasperoid shows a similar spectral pattern and has a band depth of 0.83 as opposed to 0.97 for the other surface limestones (D-45) [Clark, 1983], Chemical compositions of the four samples of Preble limestone (D-45, D-70, D-102, D-129, table 3), are similar with less silica than the limestone samples from the Pinson mine (D-27, D-28, table 3). These spectra of surface rocks show that locally diagnostic spectral features are observed in certain environments that can be related to spectral features observed in the mine sites.
Argillic/Phyllie alteration. Unlike the extensive argillic alteration present in the mine sites, argillic alteration is not well expressed at the surface of the Preble deposit. Most of the alteration is phyllic rather than argillic alteration and is observed as a change in the crystallinity of muscovite [_W. Bag by, 1985, pers. com. ]. A sample of the tan hydrothermally altered shale was collected from the recent excavations at the Preble deposit, approximately 2 m below the surface. The spectrum (D-43, fig. 9) shows a fall- off in the visible below 0.55 urn due to ferric iron, a strong hydroxyl absorption band at 2.2 urn, and two weaker bands at 2.35 um and 2.45 urn. This NIR spectral pattern is indicative of muscovite (Hunt et al, 1973a). X-ray analysis shows the presence of both 2M and 1M muscovite (table 2). Most of the rocks in the Preble area have undergone a regional low-grade metamorphism. In the unaltered phyllitic rocks near Preble, micas commonly occur along incipient cleavage planes. A spectrum of an unaltered olive-green shale of the Preble Formation (D-134, fig. 9) from a borrow pit 0.8 km southeast of the main Preble pit also shows a weak hydroxyl band at 2.2 um related to mica as shown by X-ray diffraction (table 2). The presence of mica in both the regionally metamorphosed host rocks and the phyllic altered rocks near the deposit does not appear to permit discrimination between the altered and unaltered rock types in the near-infrared based on hydroxyl absorption features.
Intrusions. No intrusive rocks are present at the surface near the Preble deposit, but the Osgood Mountain pluton is well exposed near the Getchell mine (fig. 1). The pluton is a coarse-grained granodiorite composed primarily of equigranular quartz and plagioclase with lesser amounts of orthoclase and biotite and minor amounts of hornblende and magnetite [Hotz and Willden, 1964]. The pluton is exposed between the Pinson and Getchell deposits (fig. 1) and has been altered in some places to sericite or chlorite. Calcite commonly occurs in veinlets and as small interstitial masses. A spectrum of a sample of the Osgood Mountain pluton (D-63, fig. 6) shows a general rise from 0.4 um to 2.0 um characteristic of felsic rocks. In addition to the water band at 1.9 um, the spectrum shows three absorption features in the 2.2 um region of the spectrum. The large band at 2.32 um and the smaller band at 2.26 um correspond to chlorite in the X-ray data (table 2) [Hunt and Salisbury, 1970]. The band at 2.20 um most likely corresponds to muscovite. The broad band near
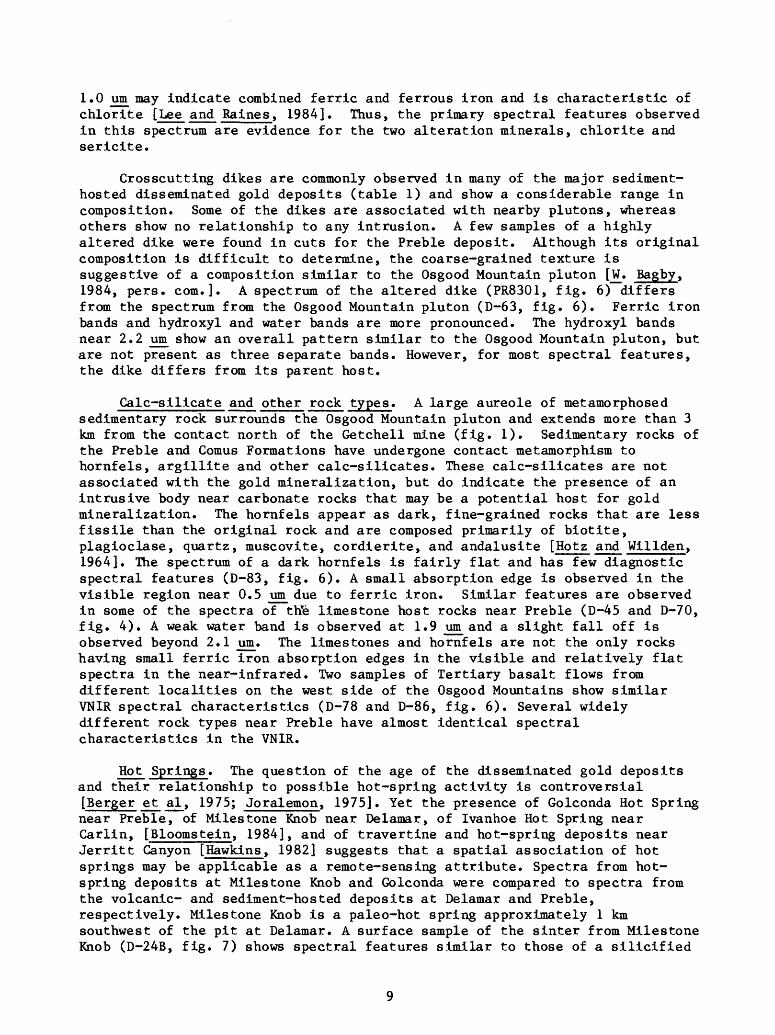
1.0 um may indicate combined ferric and ferrous iron and is characteristic of chlorite [Lee and Raines, 1984]. Thus, the primary spectral features observed in this spectrum are evidence for the two alteration minerals, chlorite and sericite.
Crosscutting dikes are commonly observed in many of the major sediment- hosted disseminated gold deposits (table 1) and show a considerable range in composition. Some of the dikes are associated with nearby plutons, whereas others show no relationship to any intrusion. A few samples of a highly altered dike were found in cuts for the Preble deposit. Although its original composition is difficult to determine, the coarse-grained texture is suggestive of a composition similar to the Osgood Mountain pluton [jtf. Bagby, 1984, pers. com.]. A spectrum of the altered dike (PR8301, fig. 6) differs from the spectrum from the Osgood Mountain pluton (D-63, fig. 6). Ferric iron bands and hydroxyl and water bands are more pronounced. The hydroxyl bands near 2.2 um show an overall pattern similar to the Osgood Mountain pluton, but are not present as three separate bands. However, for most spectral features, the dike differs from its parent host.
Gale-silicate and other rock types. A large aureole of metamorphosed sedimentary rock surrounds the Osgood Mountain pluton and extends more than 3 km from the contact north of the Getchell mine (fig. 1). Sedimentary rocks of the Preble and Comus Formations have undergone contact metamorphism to hornfels, argillite and other calc-silicates. These calc-silicates are not associated with the gold mineralization, but do indicate the presence of an intrusive body near carbonate rocks that may be a potential host for gold mineralization. The hornfels appear as dark, fine-grained rocks that are less fissile than the original rock and are composed primarily of biotite, plagioclase, quartz, muscovite, cordierite, and andalusite [Hotz and Willden, 1964]. The spectrum of a dark hornfels is fairly flat and has few diagnostic spectral features (D-83, fig. 6). A small absorption edge is observed in the visible region near 0.5 um due to ferric iron. Similar features are observed in some of the spectra of tHe limestone host rocks near Preble (D-45 and D-70, fig. 4). A weak water band is observed at 1.9 _um_and a slight fall off is observed beyond 2.1 um. The limestones and hornfels are not the only rocks having small ferric iron absorption edges in the visible and relatively flat spectra in the near-infrared. Two samples of Tertiary basalt flows from different localities on the west side of the Osgood Mountains show similar VNIR spectral characteristics (D-78 and D-86, fig. 6). Several widely different rock types near Preble have almost identical spectral characteristics in the VNIR.
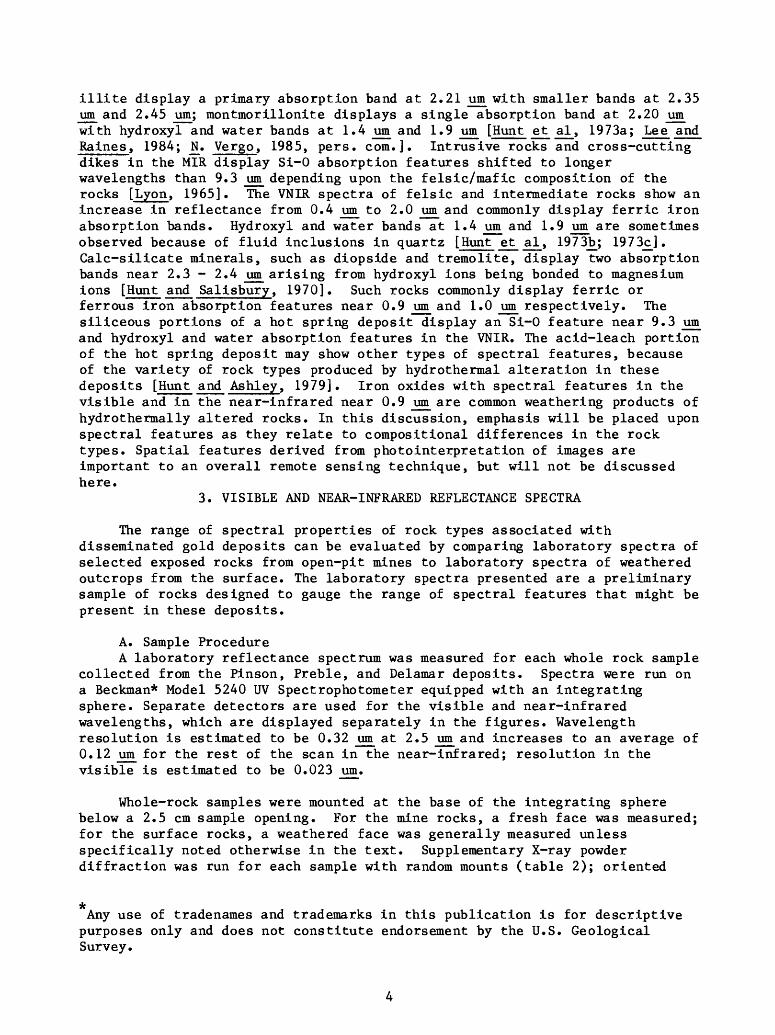
Hot Springs. The question of the age of the disseminated gold deposits and their relationship to possible hot-spring activity is controversial [Berger et al, 1975; Joralemon, 1975]. Yet the presence of Golconda Hot Spring near Preble, of Milestone Knob near Delamar, of Ivanhoe Hot Spring near Carlin, [Bloomstein, 1984], and of travertine and hot-spring deposits near Jerritt Canyon [Hawkins, 1982] suggests that a spatial association of hot springs may be applicable as a remote-sensing attribute. Spectra from hot- spring deposits at Milestone Knob and Golconda were compared to spectra from the volcanic- and sediment-hosted deposits at Delamar and Preble, respectively. Milestone Knob is a paleo-hot spring approximately 1 km southwest of the pit at Delamar. A surface sample of the sinter from Milestone Knob (D-24B, fig. 7) shows spectral features similar to those of a silicified
sample at Delamar (D-19, fig. 3). The broad ferric iron band at 0.9 urn and the deep water band at 1.4 urn result in a local maximum at 1.3 urn. The steep fall-off in the visible is also characteristic of ferric iron. In a second sample (D-23, fig. 7), the same absorption bands are present but do not appear as strong. A single hydroxyl band at 2.2 urn is present in both samples from Milestone Knob. X-ray diffraction (table 2) indicates that halloysite, a hydrated kaolin mineral, is the primary clay mineral present. Halloysite is recognized in X-ray diffraction by the disordering of the 1:1 lattice due to the presence of interlayer water, which broadens out the diffraction peaks [Brindley and Brown, 1980]. The large 1.9 _um band and the X-ray indicate that the sample is hydrated to a large degree. Reference spectra for halloysite [Hunt and Salisbury, 1973a] show that the more hydrated samples have a larger water band at 1.9 um and lose the shoulder of the doublet at 2.16 urn into a single band. One of the interesting aspects of this spectrum is the large tail of the 1.4 um band to longer wavelengths. The absence of a detectable doublet at 2.16 _um_ and 2.2 jim_ in the VNIR does not preclude having a kaolin mineral in the clay fraction.
Golconda is a presently active hot spring approximately 3 km southeast of the Preble deposit that at one time was mined for tungsten [Kerr, 1940; Erickson and Marsh, 1974a_; 1974_bJ. A spectrum of the hydrothermally altered shale from Golconda (D-40, fig. 7) contrasts with the spectra from Milestone Knob, but is comparable to spectra of the hydrothermally altered shale from the Preble pit (D-43, fig. 5). The Golconda spectrum shows the deep hydroxyl band at 2.2 um and well-expressed secondary bands at 2.35 um and 2.45 um indicative of muscovite. The strong hydroxyl band at 1.4 um is most likely related to the depth of the Al-OH band at 2.2 um. Both the Golconda and Preble samples appear light tan, show a weak ferric iron absorption band at 0.9 um, and have a steep fall-off in the visible below 0.55 um. X-ray data confirm that the hydroxyl bands are primarily due to 1M muscovite (table 2).
Ammonium Spectral Features. Ammonium minerals have recently been shown to have diagnostic spectral properties in the near infrared [Krohn and Bethke, 1984], The first naturally occurring ammonium aluminosilicate was described by [Erd et al, 1964] from a hot springs deposit in northern California. The mineral is named buddingtonite and is the ammonium analog of sanidine. The ammonium cation with an effective atomic radius of 1.43 angstroms replaces potassium with a radius of 1.33 angstroms in the feldspar structure. Buddingtonite was shown [Erd et al, 1964] to have a diagnostic absorption band in the mid-infrared near 7 um (1419 cm-1). Ammonium muscovites [Vedder, 1965], ammonium montmorillonites [Mortland et al, 1963], and ammonium illites [Sterne £t_jil_, 1982] were shown to have similar diagnostic features in the MIR.
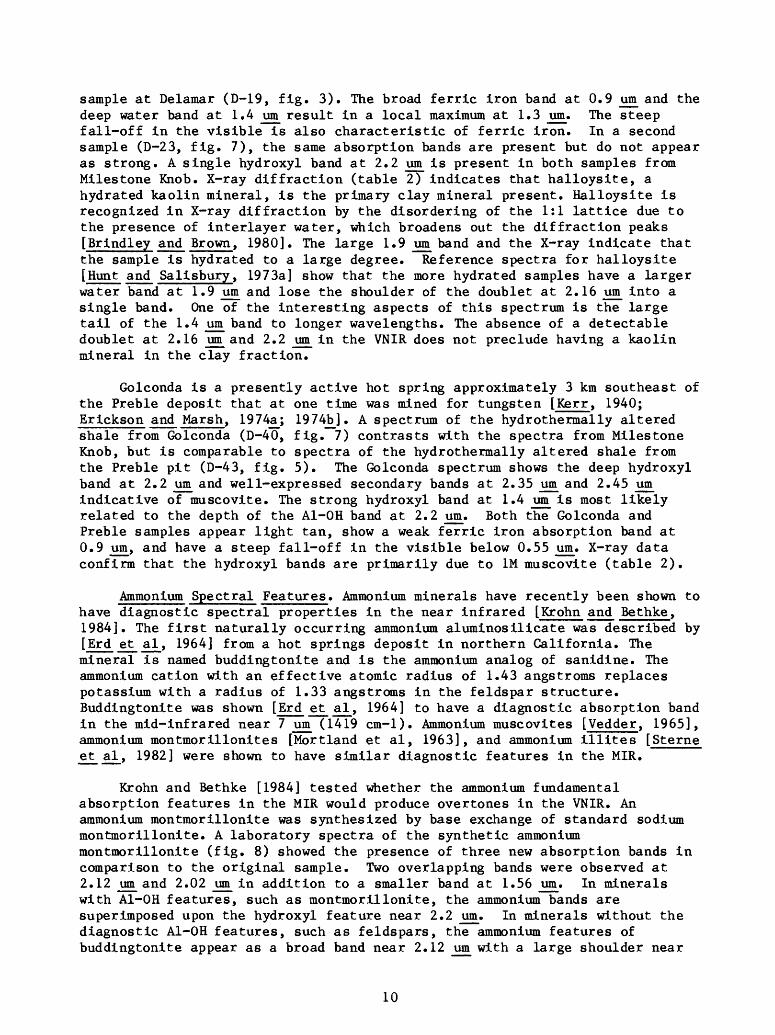
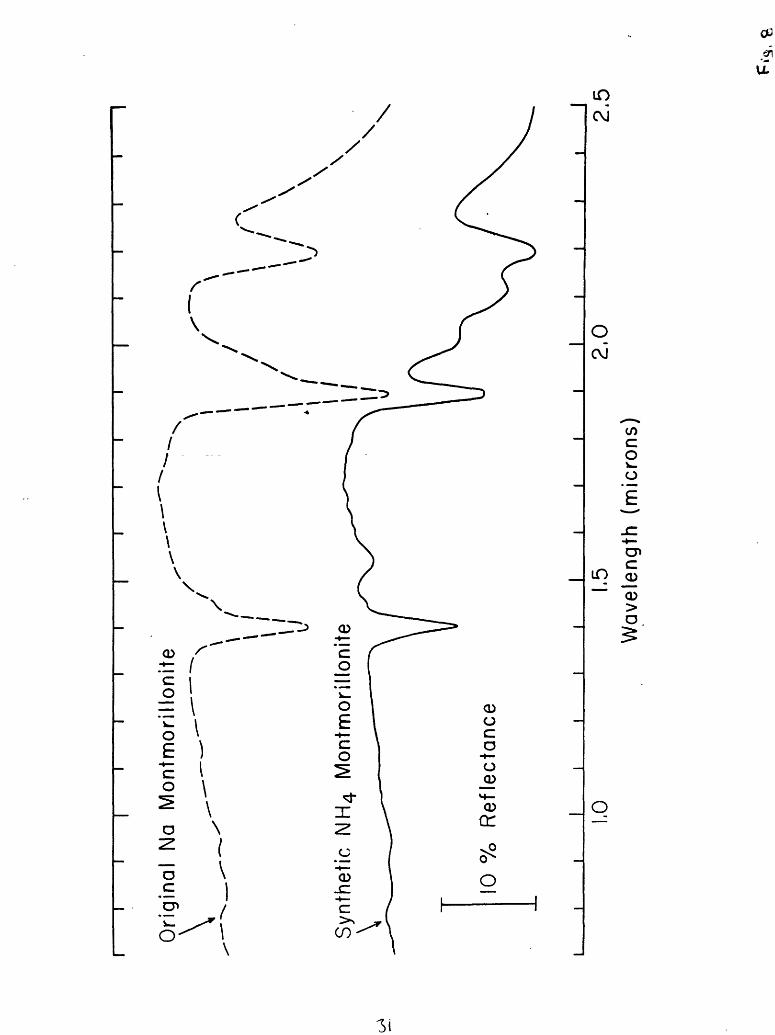
Krohn and Bethke [1984] tested whether the ammonium fundamental absorption features in the MIR would produce overtones in the VNIR. An ammonium montmorillonite was synthesized by base exchange of standard sodium montmorillonite. A laboratory spectra of the synthetic ammonium montmorillonite (fig. 8) showed the presence of three new absorption bands in comparison to the original sample. Two overlapping bands were observed at 2.12 _um_and 2.02 \m_ in addition to a smaller band at 1.56 um. In minerals with Al-OH features, such as montmorillonite, the ammonium bands are superimposed upon the hydroxyl feature near 2.2 um. In minerals without the diagnostic Al-OH features, such as feldspars, the ammonium features of buddingtonite appear as a broad band near 2.12 um with a large shoulder near
10

2.02 urn.
The spectrum of the hydr©thermally altered shale of the Preble Formation near Golconda hot springs (D-43, fig. 7) shows two small bands near 2.0 urn and 2.1 urn that were overlooked in the initial examination of the spectra. Reexamination of all the VNIR spectra from the disseminated gold deposits revealed the presence of similar bands in the spectrum of the Preble Formation (D-40, fig. 6) from the pit at the Preble deposit. The ammonium bands were confirmed by using mid-infrared spectroscopy. Ammonium spectral features were observed near 7 urn (1433 cm ~~ ) for both samples; however, the low intensity of the MIR bands suggests the amount of ammonium substitution for potassium is low. MIR analysis for ammonium can be confused by the presence of carbonate features that overlap the ammonium features near 7 urn; removing the carbonate by a pretreatment of the sample by standard carbonate removal procedures by HC1 may also affect the ammonium content [Altaner et al, in press]. Samples treated with sodium acetate to remove the carbonate also displayed the 7.0-um band, confirming the presence of ammonium.
The significance and phase of the ammonium minerals in disseminated gold deposits are not known at this point. The two samples of the Preble Formation are composed largely of quartz and muscovite (table 2). Ammonium has been shown to occur in muscovite [Vedder, 1965] and in illites for zinc-lead-silver deposits in Alaska [Sterne et al, 1982]. A relation of ammonium to organic matter for the disseminated gold deposits has been proposed by Bloomstein [1984] for the Ivanhoe hot spring near the Carlin disseminated gold deposit(fig. 1).
4. MID-INFRARED TRANSMISSION SPECTRA
The VNIR spectral characteristics of the surface rocks present a problem for the remote sensing of disseminated gold deposits. Three of the primary remote-sensing characteristics of disseminated gold deposits, sedimentary carbonate rocks, organic matter, and silicified jasperoids, show only weak absorption bands in the VNIR and have spectral characteristics of igneous and metamorphic rocks that are not directly related to the gold mineralization. Mid-infrared (MIR) spectra are presented for six different rock types from the area near the Preble deposit that appear spectrally similar in the VNIR wavelengths.
The MIR wavelengths from 2.5 urn to 50 urn contain the fundamental vibrational frequencies of both the carbonate and the silicate radicals. Also, two atmospheric windows are present between 3 urn - 5 urn and 8 urn - 12 urn for remote-sensing applications [Hunt, 1980]. Because the emission properties of rocks can differ substantially from their transmission properties, transmission spectra in the MIR cannot be used to gauge the remote-sensing characteristics of rocks in the way reflectance spectra are used, with some limitations, in the VNIR [Hunt, 1979;1981], However, transmission spectra can be used as an analytical means to compare spectra of field samples with other well-characterized laboratory spectra and to interpolate how the field samples might respond in a remote sensing situation. Transmission spectra were run on a Perkin-Elmer* Model 983 ratio-recording spectrophotometer. Generally 1 mg of sample ground to a fine particle size was embedded in a 300-mg pellet of KBr; for two samples, an oversample of 5 mg was used to bring out the details in the weaker bands.
11
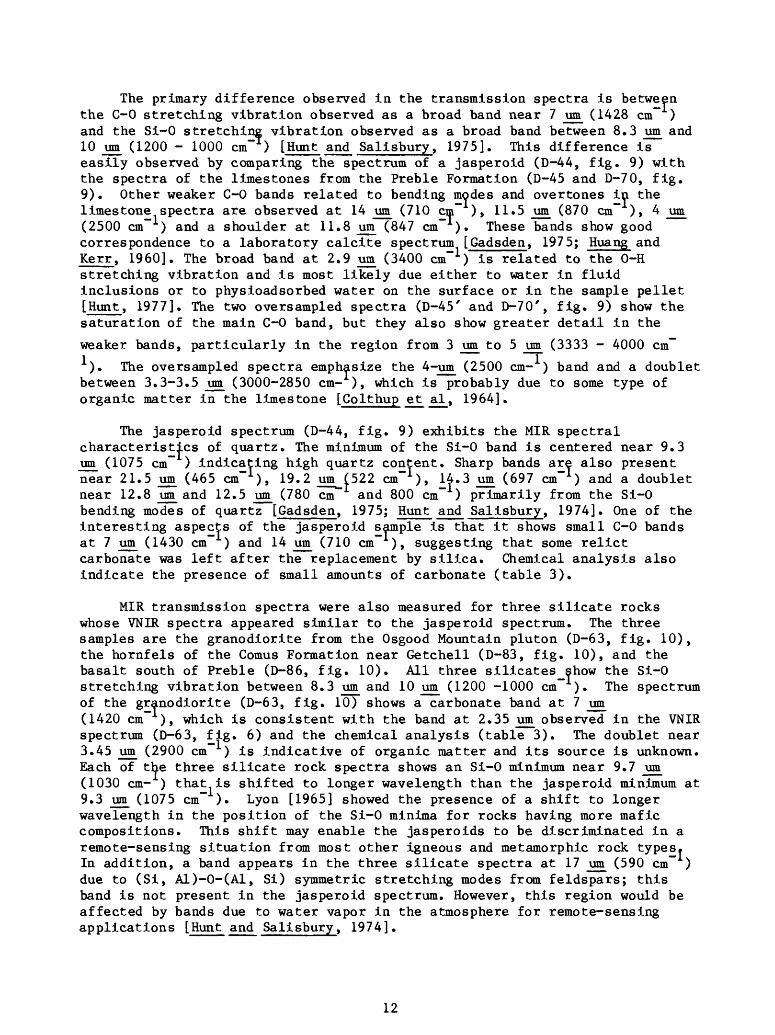
The primary difference observed in the transmission spectra is between the C-0 stretching vibration observed as a broad band near 7 urn (1428 cm"" ) and the Si-0 stretching vibration observed as a broad band between 8.3 urn and 10 urn (1200 - 1000 cm ) [Hunt and Salisbury, 1975], This difference is easily observed by comparing the spectrum of a jasperoid (D-44, fig. 9) with the spectra of the limestones from the Preble Formation (D-45 and D-70, fig. 9). Other weaker C-0 bands related to bending modes and overtones in the limestone spectra are observed at 14 urn (710 cm"" ), 11.5 urn (870 cm"" ), 4 urn (2500 cm) and a shoulder at 11.8 urn (847 cm ) These bands show good correspondence to a laboratory calcite spectrum [Gadsden, 1975; Huang and Kerr, I960]. The broad band at 2.9 urn (3400 cm) is related to the 0-H stretching vibration and is most likely due either to water in fluid inclusions or to physioadsorbed water on the surface or in the sample pellet [Hunt, 1977]. The two oversampled spectra (D-45' and D-70', fig. 9) show the saturation of the main C-0 band, but they also show greater detail in the
weaker bands, particularly in the region from 3 urn to 5 urn (3333 - 4000 cm""
). The oversampled spectra emphasize the 4-urn (2500 cm- ) band and a doublet between 3.3-3.5 urn (3000-2850 cm- ), which is probably due to some type of organic matter in the limestone [Colthup et al, 1964].
The jasperoid spectrum (D-44, fig. 9) exhibits the MIR spectral characteristics of quartz. The minimum of the Si-0 band is centered near 9.3 urn (1075 cm"" ) indicating high quartz content. Sharp bands are also present near 21.5 urn (465 cm"" 1 ), 19.2 um_(522 cm" 1 ), 14.3 urn (697 cm"" 1 ) and a doublet near 12.8 _um and 12.5 urn (780 cm and 800 cm) primarily from the Si-0 bending modes of quartz [Gadsden, 1975; Hunt and Salisbury, 1974]. One of the interesting aspects of the jasperoid sample is that it shows small C-0 bands at 7 urn (1430 cm"" ) and 14 urn (710 cm ), suggesting that some relict carbonate was left after the replacement by silica. Chemical analysis also indicate the presence of small amounts of carbonate (table 3).
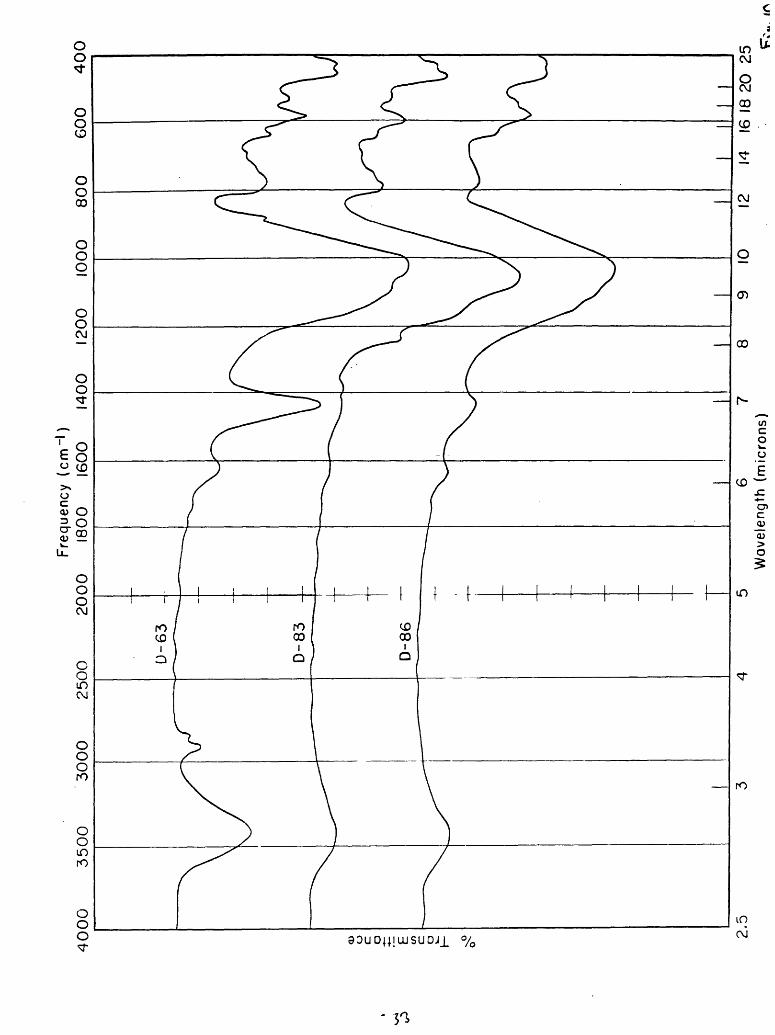
MIR transmission spectra were also measured for three silicate rocks whose VNIR spectra appeared similar to the jasperoid spectrum. The three samples are the granodiorite from the Osgood Mountain pluton (D-63, fig. 10), the hornfels of the Comus Formation near Getchell (D-83, fig. 10), and the basalt south of Preble (D-86, fig. 10). All three silicates show the Si-0 stretching vibration between 8.3 urn and 10 urn (1200 -1000 cm ). The spectrum of the granodiorite (D-63, fig. 10) shows a carbonate band at 7 urn (1420 cm ), which is consistent with the band at 2.35 urn observed in the VNIR spectrum (D-63, fig. 6) and the chemical analysis (table 3). The doublet near 3.45 urn (2900 cm ) is indicative of organic matter and its source is unknown. Each of the three silicate rock spectra shows an Si-0 minimum near 9.7 um (1030 cm- ) that is shifted to longer wavelength than the jasperoid minimum at 9.3 um (1075 cm"" ). Lyon [1965] showed the presence of a shift to longer wavelength in the position of the Si-0 minima for rocks having more mafic compositions. This shift may enable the jasperoids to be discriminated in a remote-sensing situation from most other igneous and metamorphic rock types. In addition, a band appears in the three silicate spectra at 17 um (590 cm" ) due to (Si, A1)-0-(A1, Si) symmetric stretching modes from feldspars; this band is not present in the jasperoid spectrum. However, this region would be affected by bands due to water vapor in the atmosphere for remote-sensing applications [Hunt and Salisbury, 1974].
12

5. DISCUSSIONLaboratory spectra of selected samples from several disseminated gold and
silver deposits reveal some of the difficulties in remote detection of these deposits and some potential solutions. A primary concern to remote sensing is the effect of organic material on the spectral response of the associated rock types. What the exact role of organic matter is to these deposits is not currently known, but many of these deposits in the western U.S. are spatially associated with organic material (table 1). Analysis of the organic matter of several associated samples from these deposits shows much of the organic matter is highly aromatic, indicating a high degree of thermal maturation approaching anthracite grade. The kerogen fraction of the highly organic rich samples varied from 2 to almost 9 weight percent, whereas a sample of the host limestone at Preble (D-70) measured 0.015 weight percent. [P^. Hatcher, 1985, unpub. data].
The spectral effect of organic matter and other opaque material in the VNIR and MIR wavelengths is beginning to receive some attention. Clark [1983] has shown the effect of carbon grains on the spectrum of montmorillonite. He finds the degree to which absorption is suppressed depends upon both the relative grain size and the concentration of the opaques. The overtones of hydroxyl in the VNIR appear to be suppressed more than the fundamental feature in the MIR. Clark and Roush [1984] are proposing techniques to quantitatively test this theory. Crowley [1985] has shown that both the type and the amount of organic material have a large effect on carbonate spectra in the VNIR. Clark [1983] and Crowley [1985] find that 0.5 weight percent of carbon black and 0.02 weight percent kerogen and bitumen respectively greatly suppressed spectral features. These figures are comparable to the amount of kergoen observed in the Preble limestone (D-70).
The presence of silica in the altered carbonate rocks of the mine may help increase the spectral contrast of the limestone. The presence of organic matter appears to suppress spectral features of a sample at Pinson, even with the increased silica content (D-28, fig. 2). Another indirect spectral effect of the organic matter may be the presence of ammonium bands. Since the ammoniumn in the lattice generally replaces potassium, ammonium spectral features should be observed only in rock types with the appropriate cations. The source of ammonium is not known, but its presence at the Sulphur Bank [Erd j|t_jil_, 1964], Ivanhoe [Bloomstein, 1984], and Preble are all near organic-rich source rocks.
A major problem facing remote detection of disseminated gold deposits is discriminating the organic-rich limestones, which are possible host rocks. While some of these limestones show evidence of a small carbonate absorption feature at 2.32 urn, whether such subtle features could be detected in situ is questionable. Many other rock types associated with these deposits also display VNIR spectra with low reflectance and few absorption features. The MIR wavelengths provide a means to separate out these dark silicate rocks from the carbonate rocks. For direct identification of carbonates, the main C-0 band near 7 urn is not in an atmospheric window for remote sensing. Possibly the weaker C-0 bands at 11.5 urn or 4 urn offer a means for direct detection of the organic- rich limestones.
The siliceous replacment bodies, the jasperoids, appear to be more amenable to remote detection, particularly in the MIR wavelengths. The fundamental Si-0 vibrational feature at 9.3 urn is well expressed in the MIR
13

spectra and can be used to distinguish jasperoids from other rock types having similar spectral features in the VNIR (fig. 7). The jasperoids would be distinguishable from the carbonate host rocks, but may be confused with other highly silica-rich rocks such as quartzites. Since the main silicate band minimum occurs in an atmospheric window, highly siliceous rocks have been observed in recently developed multispectral thermal scanners [Kahle and Goetz, 1983; Kahle and Rowan, 1980],
The silicified rocks, in veins and jasperoids, display ferric iron absorption features. While all the silicified samples contain measurable amounts of iron oxides (table 3), the amount measured (table 3) is not significantly greater for the silicified samples than the rest of the samples. The VNIR spectra of the silicified samples indicate that hematite, goethite and mixtures of both are present. The silicified vein from Pinson (D-26, fig. 2) shows a broad band at 0.94 urn and a secondary feature at 0.65 urn, characteristic of goethite. The silicified vein from Delamar (D-19, fig. 3) exhibits a narrower band at 0.89 urn characteristic of hematite [Sherman et al, 1982; Hunt and Ashley, 1979], The jasperoid from the Preble deposit (D-100, fig. 5) exhibits spectral characteristics of both minerals. Rather than a specific iron mineralogy, the spectral shape of the iron bands for the silicified rocks appears to be diagnostic of the silicified rocks; these rocks show a broad band near 0.9 urn followed by a sharp rise to 1.3 ^m_and a deep absorption feature at 1.4 urn. This shape most likely results from the combination of ferric iron with quartz that has many fluid inclusions or other sources of water. The characteristic shape, rather than the band position, may be a means of discriminating silicified samples, although not all surface jasperoids (e.g., D-44, fig. 4) display the intense spectral features. In addition, the hydroxyl feature associated with silica may add another distinguishing characteristic to the jasperoid spectra.
Hot-spring deposits that occur near the disseminated gold and silver deposits appear to be a good surface indicator of the type of spectral characteristics associated with the hydrothermal alteration at depth. In the spectra of samples from two hot-spring deposits, Golconda and Milestone Knob, well-defined VNIR ferric iron and hydroxyl absorption bands were depicted that are related to the hydrothermally altered rocks at Pinson and Delamar, respectively (fig. 1). At Golconda, phyllic and argillically altered rocks containing muscovite and minor kaolinite were observed at the hot-spring deposits. At the Preble deposit, muscovite was not as readily observed at the surface, although it is present in the upper few meters below the surface. However, phyllic alteration is hard to recognize in the VNIR because of the similar spectral character of micas associated with a regional metamorphism in unaltered shales. The question is whether the change in muscovite crystallinity that has been associated with hydrothermal alteration [W. Bagby, 1985, pers. comm.] has any diagnostic spectral properties. Milestone Knob also exhibits ferric iron and hydroxyl features similar to the rocks at Delamar. However, the presence of a hydrated kaolin mineral, halloysite, can give rise to spectral features similar to Golconda, even though the clay mineralogy is dissimilar. Interpretation of smaller secondary spectral characteristics, such as the 2.35 urn and 2.45 urn bands of muscovite or the shoulder near 1.4 um, is important in separating out the mineralogic differences between the two hot springs.
14
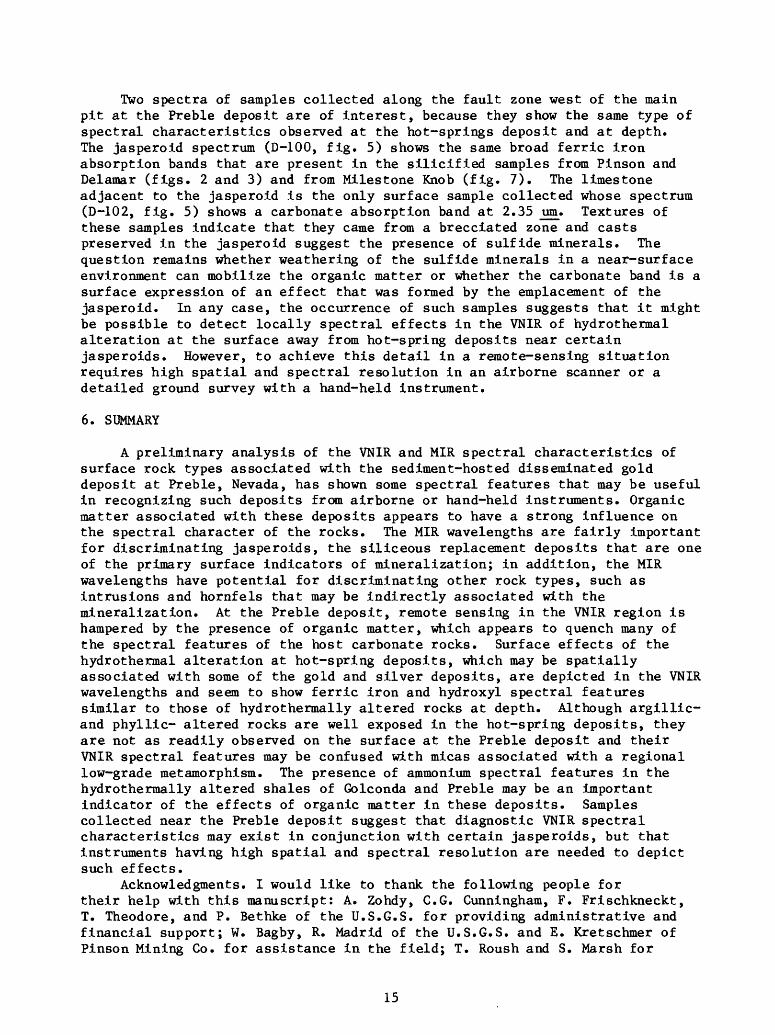
Two spectra of samples collected along the fault zone west of the main pit at the Preble deposit are of interest, because they show the same type of spectral characteristics observed at the hot-springs deposit and at depth. The jasperoid spectrum (D-100, fig. 5) shows the same broad ferric iron absorption bands that are present in the silicified samples from Pinson and Delamar (figs. 2 and 3) and from Milestone Knob (fig. 7). The limestone adjacent to the jasperoid is the only surface sample collected whose spectrum (D-102, fig. 5) shows a carbonate absorption band at 2.35 urn. Textures of these samples indicate that they came from a brecciated zone and casts preserved in the jasperoid suggest the presence of sulfide minerals. The question remains whether weathering of the sulfide minerals in a near-surface environment can mobilize the organic matter or whether the carbonate band is a surface expression of an effect that was formed by the emplacement of the jasperoid. In any case, the occurrence of such samples suggests that it might be possible to detect locally spectral effects in the VNIR of hydrothermal alteration at the surface away from hot-spring deposits near certain jasperoids. However, to achieve this detail in a remote-sensing situation requires high spatial and spectral resolution in an airborne scanner or a detailed ground survey with a hand-held instrument.
6. SUMMARY
A preliminary analysis of the VNIR and MIR spectral characteristics of surface rock types associated with the sediment-hosted disseminated gold deposit at Preble, Nevada, has shown some spectral features that may be useful in recognizing such deposits from airborne or hand-held instruments. Organic matter associated with these deposits appears to have a strong influence on the spectral character of the rocks. The MIR wavelengths are fairly important for discriminating jasperoids, the siliceous replacement deposits that are one of the primary surface indicators of mineralization; in addition, the MIR wavelengths have potential for discriminating other rock types, such as intrusions and hornfels that may be indirectly associated with the mineralization. At the Preble deposit, remote sensing in the VNIR region is hampered by the presence of organic matter, which appears to quench many of the spectral features of the host carbonate rocks. Surface effects of the hydrothermal alteration at hot-spring deposits, which may be spatially associated with some of the gold and silver deposits, are depicted in the VNIR wavelengths and seem to show ferric iron and hydroxyl spectral features similar to those of hydrothermally altered rocks at depth. Although argillic- and phyllic- altered rocks are well exposed in the hot-spring deposits, they are not as readily observed on the surface at the Preble deposit and their VNIR spectral features may be confused with micas associated with a regional low-grade metamorphism. The presence of ammonium spectral features in the hydrothermally altered shales of Golconda and Preble may be an important indicator of the effects of organic matter in these deposits. Samples collected near the Preble deposit suggest that diagnostic VNIR spectral characteristics may exist in conjunction with certain jasperoids, but that instruments having high spatial and spectral resolution are needed to depict such effects.
Acknowledgments. I would like to thank the following people for their help with this manuscript: A. Zohdy, C.G. Cunningham, F. Frischkneckt, T. Theodore, and P. Bethke of the U.S.G.S. for providing administrative and financial support; W. Bagby, R. Madrid of the U.S.G.S. and E. Kretschmer of Pinson Mining Co. for assistance in the field; T. Roush and S. Marsh for
15

journal technical review, J. Salisbury, M. Podwysocki, L. Rowan, D. Sherman, J. DeNoyer, K. Kraft and P. Kerr of the U.S.G.S. for internal technical review; P. Hatcher of U.S.G.S., J. Estes from the Army Corps of Engineers, M.J. Bartholomew and M. Anderson of J.P.L. for help with thermal-infrared instrumentation; S. Altaner, N. Vergo, and B. Eisworth of the U.S.G.S. for help with X-ray interpretation; B. Johnson and P. Hearn of the U.S.G.S. for the chemical data; and K. Hershberg and E. Seginak for clerical and drafting support.
16

7. REFERENCES Abrams, M.J., Ashley, R.P., Rowan, L.C. , Goetz, A.F.H. , and Kahle, A.B.,
Mapping of hydrothermal alteration in the Cuprite mining district,Nevada, using aircraft scanner images for the spectral region 0.46 to2.36 urn, Geology, _5, 713-718, 1977.
Abrams, M.J., Brown, D., Lepley, L., and Sadowski, R., Remote sensing forporphyry copper deposits in southern Arizona, ECon. Geol., 78, 591-604,1983.
Altaner, S.P., Krohn, M.D., and Klock,-P.R., Analytical techniques fordetermining ammonium in minerals (abs), Geol. Soc. Amer., in press.
Antoniuk, T., and Crombie, D.R., The Pinson mine: A Carlin type gold deposit,Canadian Mining J., 103, 61-65, 1982.
Beebe, M., 1981, Disseminated silver mineralization at Delamar, Idaho: anexploration model, paper presented at Symposium of Zoning in Volcanic andSubvolcanic Mineral Deposits, Lake Tahoe, CA, 1981.
Berger, B.R. , Geology and geochemistry of the Getchell disseminated golddeposit, Humboldt Co., Nevada, Soc. Min. Eng., AIME, Preprint 75-1-305,26 pp., 1975.
Berger, B.R., Silberman, M.L., and Koski, R.A., K-Ar relations of granodioriteemplacement and tungsten and gold mineralization near the Getchell Mine,Humboldt County, Nevada Reply to discussion, Econ. Geology, 70, 1487-1491, 1975.
Birak, D.J., and Hawkins, R.J., The geology of the Enfield Bell Mine and theJerritt Canyon district, Elko County, Nevada, in Geologic Characteristicsof the Disseminated Sediment- and Volcanic-Hosted types of Gold Deposits,edited by E.W. Tooker, U.S. Geol. Surv. Bull. 1646, in press.
Bloomstein, E.I., Ammonia alteration as a geochemical link in gold deposits ofthe Carlin-Midas belt (abs.), Assoc. Exp. Geochem., Symposium onExploration for Ore Deposits of the North American Cordillera, Reno, Nv.,1984.
Brindley, G.W., and Brown, G., Crystal Structures of clay minerals and theirX-ray identification, Mineralogical Soc. Monograph 5, London, 495 p.,1980.
Brooks, R.A. , and Berger, B.R., Relationship of soil-mercury values to soiltype and disseminated gold mineralization, Getchell Mine area, HumboldtCo., Nevada, J_. Geochem. Exp. , 9, 186-194, 1978.
Clark, R. N., Spectral properties of mixtures of montmorillonite and darkcarbon grains: Implications for remote sensing minerals containingchemically and physically adsorbed water, J_. Geophys. Res., 88, 10635-10644, 1983.
Clark, R.N., and Roush. T.L., Reflectance spectroscopy: quantitative analysistechniques for remote sensing applications, _J_. Geophys. Res., 89, 6329-6340, 1984.
Colthup, N.B., Daly, L.H., and Wiberley, S.E., Introduction to Infrared andRaman Spectroscopy, 511 pp., Academic Press, New York, 1964.
Crowley, J.K., Multispectral remote sensing of carbonate rocks in theConfusion range, Utah, Proceedings of the International Symposium onRemote Sensing of Environment, Third Thematic Conference, Remote Sensingfor Exploration Geology, II, 837-851, 1985.
Dickson, F.W., Rye, R.O., and Radtke, A.S. , The Carlin gold deposit as aproduct of rock-water interactions, Nevada Bur. Mines, Report 33, 101-108, 1979.
Erd, R.C., White, D.E. , Fahey, J.J. , and Lee, D.E. , Buddingtonite, an ammoniumfeldspar with zeolitic water, Am. Mineral., 49, 831-850, 1964.
17
Erlckson, R.L., Marranzlno, A.P., Oda, U., and Janes, W.W., Geochemicalexploration near the Getchell mine, Humboldt County, Nevada, U.S. Geol.Surv. Bull. 1198, Al - A26, 1964.
Erickson, R.L., and Marsh, S.P., Geologic map of the Golconda Quadrangle,Humboldt Co., Nevada, U.S. Geol. Surv. Map GQ-1174, 1974a.
Erickson, R.L., and Marsh, S.P., Geologic map of the Iron Point Quadrangle,Humboldt Co., Nevada, U.S. Geol. Surv. Map GQ-1175, 1974b.
Fournier, R.F., Silica minerals as indicators of conditions during golddeposition, in Geologic Characteristics of the Disseminated Sediment- andVolcanic-Hosted Types of Gold Deposits, edited by E. W. looker, ed., U.S.Geol. Surv. Bull. 1646, in press.
Gadsden, J.A., Infrared Spectra of Minerals and Related Inorganic Compounds:277 pp., Butterworths, London, 1975.
Goddard, E.N., Trask, P.D., DeFord, R.K., Rove, O.N., Singewald, J.T., andOverbeck, R.M., Rock-color Chart, llpp., Geol. Soc. Amer., Boulder, 1948.
Goetz, A.F.H., and Rowan, L.C., Geologic remote sensing, Science, 211, 781-790, 1981.
Hausen, D.M., Process mineralogy of the auriferous pyritic ores at Carlin,Nevada, in Process Mineralogy, edited by D.H. Hausen, and W.C. Park,American Institue of Mining and Metallurgy, New York, 271-289, 1981.
Hausen, D.M., Ekburg, C., and Kula, F., Geochemical and XRD-computer loggingmethod for lithologic ore types classification of Carlin-type gold ores,in Process Mineralogy II, edited by R.D. Hagen, R.D., Symposium by theMetallurgical Society of the AIME, 1982. 1982, Proceedings, 1982.
Hawkins, R.B., Discovery of the Bell gold mine, Jerritt Canyon district, ElkoCo., Nevada, Mining Congress J., 68, 28-32, 1982.
Hayba, D.O., Foley, N.K., and Heald-Wetlaufer, P., Characteristics thatdistinguish types of epithermal deposits (abs.), Assoc. Exp. Geochem.,Symposium on Exploration for Ore Deposits of North American Cordillera,Reno, Nv., 21, 1984.
Hotz, P.E., and Willden, R., Geology and mineral deposits of the OsgoodMountains Quadrangle, Humboldt Co., Nevada, U.S. Geol. Surv. Prof. Paper431, 128 pp., 1964.
Huang, C.K., and Kerr, P.F., Infrared study of the carbonate minerals, Am.Mineral., 45, 311-324, 1960.
Hunt, G.R., Comments on the origin of features in mineral and rock spectradetectable in the three-micrometer range, U.S. Geol. Surv. Open-file Rep.77-726, 7pp., 1977.
Hunt, G.R., Near-infrared (1.3-2.4 urn) spectra of alteration minerals- Potential for use in remote sensing, Geophysics, 44, 1974-1986, 1979.
Hunt, G.R., Electromagnetic radiation: the communication link in remotesensing, in Remote Sensing in Geology, edited by B.S. Siegal, and A.R.Gillespie, John Wiley and Sons, New York, 5-45, 1980.
Hunt, G.R., Emission spectra in the thermal infra-red region, U.S. Geol. Surv.Open-file Rep. 81-787, 9pp., 1981.
Hunt, G.R., and Ashley, R.P., Spectra of altered rocks in the visible andnear-infrared, Econ. Geol., 74, 1613-1629, 1979.
Hunt, G.R., and Salisbury, J.W., Visible and near-infrared spectra of mineralsand rocks: I. Silicate minerals, Mod. Geo., _1_, 283-300, 1970.
Hunt, G.R., and Salisbury, J.W., Visible and near-infrared spectra of mineralsand rocks: II. Carbonates, Mod. Geo., 2? 23-30, 1971.
Hunt, G.R., and Salisbury, J.W., Mid-infrared spectral behavior of igneousrocks, U.S. Air Force Cambridge Research Laboratory, Technical Report 74-0625, 142 pp., 1974.
l«

Hunt, G.R., and Salisbury, J.W., Mid-infrared spectral behavior of sedimentaryrocks, U.S. Air Force Cambridge Research Laboratory Technical Report 75-0256, 49 pp., 1975.
Hunt, G.R., Salisbury, J.W., and Lenhoff, C.J., Visible and near-infraredspectra of minerals and rocks: III. Oxides and hydroxides, Mod. Geo., 2^195-205, 1971.
Hunt, G.R., Salisbury, J.W., and Lenoff, C.J., Visible and near-infraredspectra of minerals and rocks: VI. Additional silicates, Mod. Geo., j^,85-106, 1973a.
Hunt, G.R., Salisbury, J.W., and Lenhoff, C.J., Visible and near-infraredspectra of mineral and rocks: VII. Acidic igneous rocks, Mod. Geo., ^,217-224, 1973b.
Hunt, G.R., Salisbury, J.W., and Lenhoff, C.J., Visible and near-infraredspectra of minerals and rocks: VIII. Intermediate igneous rocks, Mod.Gep_., 4_, 237-244, 1973c.
Joralemon, P., The occurrence of gold at the Getchell mine, Nevada, Econ.Geology, ^, 267-310, 1951.
Joralemon, P., K-Ar relations of granodiorite emplacement and tungsten andgold mineralization near the Getchell mine, Humboldt County, Nevada,Discussion, Econ. Geology, 70, 405-406, 1975.
Kahle, A.B., and Goetz, A.F.H., Mineralogic information from a new airbornethermal infrared multispectral scanner, Science, 222, 24-27, 1983.
Kahle, A.B., and Rowan, L.C., Evaluation of multispectral middle infraredaircraft images for lithologic mapping in the east Tintic Mountains,Utah, Geology, £, 234-239, 1980.
Kerr, P.F., Tungsten-bearing manganese deposit at Golconda, Nevada, Geol. Soc.Amer. Bull., 5j_, 1359-1390, 1940.
Knox, J.A., and Weitz, T.J., Geology of the Delamar silver-gold deposit,Owyhee Co., Idaho, paper presented at Northwest Mining Assoc., SpokaneWA. , December 4, 1976.
Kretschmer, E.L., Geology of the Pinson and Preble gold deposits, HumboldtCo., Nevada, Arizona Geol. Soc. Digest, 15, pp. 59-66, 1984.
Krohn, M.D. and Bethke, P. M., Near-infrared spectral features of ammoniumminerals: Applications for remote sensing of hot spring deposits (abs.)Geol. Soc. Amer. Abstracts with Program, 16, 566, 1984.
Lee, K., and Raines, G., Reflectance Spectra of Alteration Minerals, U.S.Geol. Surv. Open-file Rep. 84-96, 1984.
Levering, T.S., Rock alteration as a guide to ore East Tintic District,Utah, Econ. Geol. Mono, j^, 64 pp. , 1949.
Levering, T.G., Jasperoid in the United States Its characteristics, origin,and economic significance, U.S. Geol. Surv. Prof. Paper 710, 164 pp.,1972.
Lucas, J.M., Gold, U.S. Bureau of Mines Minerals Yearbook 1982, J_, 369-376,1983.
Lyon, R.J.P., Analysis of rocks by spectral infrared emission (8 to 25microns), Econ. Geology, 60, 715-736, 1965.
Marsh, S.E., and McKeon, J.B., Integrated analysis of high-resolution fieldand airborne spectroradiometer data for alteration mapping, Econ. Geol.,J7£, 618-632, 1983.
Mortland, M.M., Fripiat, J.J., Chaussidon, J., and Uytterhoeven, J.,Interaction between ammonia and the expanding lattices of montmorilloniteand vermiculite, J_. Phys. Chem., 67, 248-258, 1963.
Pansze, A.J., Geology and ore deposits of the Silver City - Delamar - FlintRegion, Owyhee County, Idaho, Idaho Bur, of Mines and Geology Pamphlet161, 79 pp., 1975.
1Q

Podwysocki, M.H., Power, M.S., Salisbury, J.W., and Jones, O.D., Evaluation of low-sun illuminated Landsat-4 Thematic Mapper data for mapping hydrothermally altered rocks in southern Nevada, Proceedings of the International Symposium on Remote Sensing of Environment, Third Thematic Conference, Remote Sensing for Exploration Geology, II, 541-551, 1985.
Podwysocki, M.H., Segal, D.B., and Abrams, M.J., Use of multispectral images for assessment of hydrothermal alteration in the Marysvale, Utah, mining area, Econ. Geology, 78, 675-687, 1983.
Podwysocki, M.H., Salisbury, J.W., and Vergo, N., Use of near-infrared spectra to distingush between sedimentary cherts and hydrothermal silica associated with disseminated gold deposits (abs): Geol. Soc. Amer., in press.
Radtke, A.S., Geology of the Carlin gold deposit, Nevada, U.S. Geol. Surv. Open-File Rep. 81-971, 221 pp., 1981.
Radtke, A.S., and Scheiner, B.J., Studies of hydrothermal gold deposition (I). Carlin gold deposit, Nevada: The role of carbonaceous materials in gold deposition, Econ. Geology, 65, n. 2, 87-102, 1970.
Radtke, A.S., Rye, R.O., and Dickson, F.W., Geology and stable isotopesstudies of the Carlin gold deposit, Nevada, Econ. Geology, 641-672, 1980.
Roberts, R.J., Radtke, A.S., and Coats, R.R., Gold-bearing deposits in north- central Nevada and southwestern Idaho, with a section on periods of plutonism in north-central Nevada by M. L. Silberman and E.H. McKee, Econ. Geology, 66, 14-32, 1971.
Rodgers, W.H., Moss, K.L., and Thompson, R.E., The Delamar Silver Mine, an update, Northwest Mining Assoc., 86th Ann. Conv., 8pp., 1980.
Rowan, L.C., Goetz, A.F.H., Crowley, J., and Kingston, M.J. , Identification of hydrothermal mineralization in Baja California, Mexico from orbit using Shuttle Multispectral Infrared Radiometer, Proc. Int. Geosc. and Remote Sensing Seminar (IGARSS '83), San Francisco, CA., 3.1-3.7, 1983.
Rowan L.C. and Kahle, A.B., Evaluation of 0.46 to 2.36 urn multispectralscanner images of the East Tintic mining district, Utah, for mapping hydrothermally altered rocks, Econ. Geol., 77, 441-452, 1982.
Rowan, L.C., Wetlaufer, P.H., Goetz, A.F.H., Billingsley, F.C., and Stewart, J.H., Discrimination of rock types in Nevada by the use of ERTS images, U.S. Geol. Surv. Prof. Paper 883, 35 pp., 1974.
Rye, R.0., A model for the formation of carbonate-hosted disseminated gold deposits as indicated by geologic, fluid inclusion, geochemical, and stable isotope studies of the Carlin and Cortez deposits, Nevada, in Geologic Characteristics of the Disseminated Sediment- and Volcanic- Hosted Types of Gold Deposits, edited by E. W. Tooker, U.S. Geol. Surv. Bull. 1646, in press.
Rytuba, J.J., Geochemistry of hydrothermal transport and deposition of gold and sulfide minerals in Carlin-type gold deposits, in Geologic Characteristics of the Disseminated Sediment- and Volcanic-Hosted types of Gold Deposits, edited by E.W. Tooker, U.S. Geol. Surv. Bull. 1646, in press.
Sherman, D.M., Electronic structures of Fe coordination sites in iron oxides; applications to spectra, bonding and magnetism, Phys. Chem. Mineral, in press.
Sherman, D.M., Burns, R.G., and Burns, V.M., Spectral characteristics of the iron oxides with application to the Martian bright region mineralogy, J^. Geophys. Res., 87, 10169-10180, 1982.
Silberman, M.L., Berger, B.R., and Koski, R.A., K-Ar age relations ofgranodiorite emplacement and tungsten and gold mineralization near the Getchell mine, Humboldt County, Nevada, Econ. Geology, 69, 646-656, 1974.
20

Sterne, E.J., Reynolds, R.C., and Zantrop, H., Natural ammonium illites from black shales hosting a stratiform base metal deposit, Belong Mountains, northern Alaska, Clay and Clay Minerals, 30, 161-166, 1982.
looker, E.W., Characteristics of disseminated gold occurrences, in Geologic Characteristics of the Disseminated Sediment- and Volcanic-Hosted types of Gold Deposits, edited by E.W. looker, U.S. Geol. Surv. Bull. 1646, in press.
Vedder, W., Ammonium in muscovite, Geochim. Cos. Acta, 29, 221-228, 1965.Wells, J.D., Stoiser, L.R., and Elliot, J.E., Geology and geochemistry of the
Cortez gold deposit, Nevada, Econ. Geology, 64, 526-537, 1969.
W. C. Bagby, U. S. Geological Survey, Menlo Park, CA 94025 P. Hatcher, U. S. Geological Survey, Reston, VA 22092N. Vergo, Dept. of Geology, U. of Illinois at Champaign-Urbana, Urbana, IL
61801
21

Figure 1. Index map of sediment-hosted and volcanic-hosted disseminated gold deposits and hot-spring deposits in northern Nevada and southern Idaho.
Figure 2. Laboratory VN1R reflectance spectra of altered rocks from the Pinson mine, Nv. (fig. 1). D-26 is a sample of silicified rock along the mineralized fault zone, D-25 is a sample of the argillically altered rock near the fault zone, and D-116 is a sample of the calc-silicates near the contact of the Osgood Mountain pluton. D-27 is a sample of the bleached limestone next to the fault zone; D-28 is a sample of the dark interbedded shale and limestone from the upper bench of the Pinson mine.
Figure 3. Laboratory VN1R reflectance spectra of the hydrothermally altered rocks from the Delamar mine, ID (fig. 1). D-19 is a sample of one of the silicified veins; D-18 is a sample of the argillically altered rock from the clay zone. D-17 is a sample of the greyish- green rhyolitic tuff breccia below the clay zone; D-13 is a sample of the flow-banded rhyolite above the clay zone.
Figure 4. Laboratory VNIR reflectance spectra of weathered organic-richlimestones and jasperoids from the Preble Formation at the Preble deposit (fig. l).D-44 is a sample of jasperoid that protrudes above the surface west of the pit at Preble; D-157 is a sample of large jasperoid from approximately 0.5 km east of the pit. D-45-1 is a sample of weathered grey limestone near the pit at Preble; D- 70-1 is a sample of a slightly lighter grey limestone approximately 1.5 km southwest of the deposit. D-45-2 and D-70-2 are the light-tan coatings on the undersides of the limestone samples. Note the expanded reflectance scale.
Figure 5. Laboratory VNIR reflectance spectra of several rock types thatoccur near the pit at the Preble deposit. D-100 is the weathered surface of a jasperoid and two adjacent limestone samples (D-102 and D-129) that occur west of the main mineralized fault structure at Preble, Nv. D-42 and D-134 are samples of an argillically altered shale (D-42) and an unaltered shale (D-134) of the Preble Formation. The argillically altered sample was collected from the main development pit at Preble, Nv.; the unaltered sample was collected from a borrow pit north of the main haul road 0.8 km southeast of the main Preble pit.
Figure 6. Laboratory VNIR reflectance spectra of crystalline rocks near the Osgood Mountain pluton. D-63 is a sample of the pluton collected 0.5 km northwest of the Getchell mine, Nv. (fig. 1); PR8301 is a hydrothermally altered crosscutting dike (PR8301) found north of the main pit at the Preble deposit (W. Bagby, 1984, pers. com.). D-83 is a dark, fine-grained hornfels collected from the metamorphosed Comus Formation, approximately 2 km northwest of the Getchell mine (fig. 1). D-86 and D-78 are spectra of Tertiary basalts collected from south and northwest of the Preble deposit.
Figure 7. Laboratory VNIR reflectance spectra of samples from hot-springdeposits. D-24 and D-23 were collected from Milestone Knob (fig. 1), a relict hot spring adjacent to the Delamar mine; D-40 was collected from north of the presently active Golconda hot spring (fig. 1), which is southeast of the Preble deposit, Nv.
Figure 8. Near-infrared reflectance spectra of a synthetic ammoniummontmorillonite and its predecessor, a sodium montmorillonite.
22

Figure 9. Laboratory MIR transmission spectra of a jasperoid (D-44) andlimestones (D-45, D-70) of the Preble Formation collected near the Preble deposit, Nv. 1 mg of finely ground sample was embedded in a 300-mg pellet of KBr, except for the oversampled D-45' and D-70' which used 5 mg of sample. Spectra are offset vertically with horizontal tics at increments of 10% transmittance. Note the scale change at 5 urn (2000 cm ). VNIR reflectance spectra for these samples are shown in figure 4.
Figure 10. Laboratory MIR transmission spectra of three silicate rocks,granodiorite (D-63), hornfels (D-83) and basalt (D-86) that appear spectrally similar to the jasperoids in the VNIR wavelengths CD- 63, D-78, and D-86, fig. 12). Spectra are offest vertically with horizontal tics at increments of 10% transmittance. Note the scale change at 5 um (2000 cm" ). VNIR reflectance spectra for these samples are shown in figure 6.
23

44°
Wmnemucca
^Sulphur
42°

oCOo
CD
oOJQL
o: ^o
0,4 0,7
10% Reflectance
D-26
0,7 1,0 1,5 WAVELENGTH (MICRONS)

too
CD
a v a. w> a>
cc >.o
0,4 0,7 0,7 1,0 1,5 V/AVELENGTH (MICRONS)
2,0 2,5

oCOo
CD
oo>Q.
sz"I
<u oc
<ucr
J_______I
0,4 0,7 0.7 1,0 1,5 WAVELENGTH (MICRONS)
2.0

[ 1
0,4
COo
CD
o0>Q.
onV.O
i r r
D-129
D-43
D-134
0,7
57%
X39%
i i i0.7 1.0 1,5
WAVELENGTH (MICRONS)2.0 2,5

o*COO
CD
o <uQ. (f> <U
cc >.o
0,4 0,7 0,7 1,0 1,5 WAVELENGTH (MICRONS)
2,0
Fu. 6

% R
efle
ctan
ce
with
res
pect
to
Ba
864 -
*
I I
~i r
i r
i r
Orig
inal
N
a M
on
tmo
rillo
nite
\ ^ -
'\
x\
I
Syn
thet
ic
NH
4 M
ontm
orill
onite
\
I
\i I/\l
'
VA
\ \ \ \
\
\
10 %
R
efle
ctance
I I
1,0
1,5
Wav
elen
gth
(mic
rons)
2,0
2,5

4000
35
00
3000
2500
Fre
quency
(c
m'1
) 2
00
0
1800
1600
1400
1200
1000
80
0
600
40
0
5 6
7
Wav
elen
gth
(mic
rons)
810
12
14
16 1
8 20
25
4000
35
00
3000
25
00
2,5
Fre
quen
cy (c
m"')
20
00
18
00
1600
14
0012
00
1000
8
00
G
OO
400
5 67
Wav
elen
gth
(mic
rons)
8 9
10
12
14
16 1
8 20
25
Table Captions
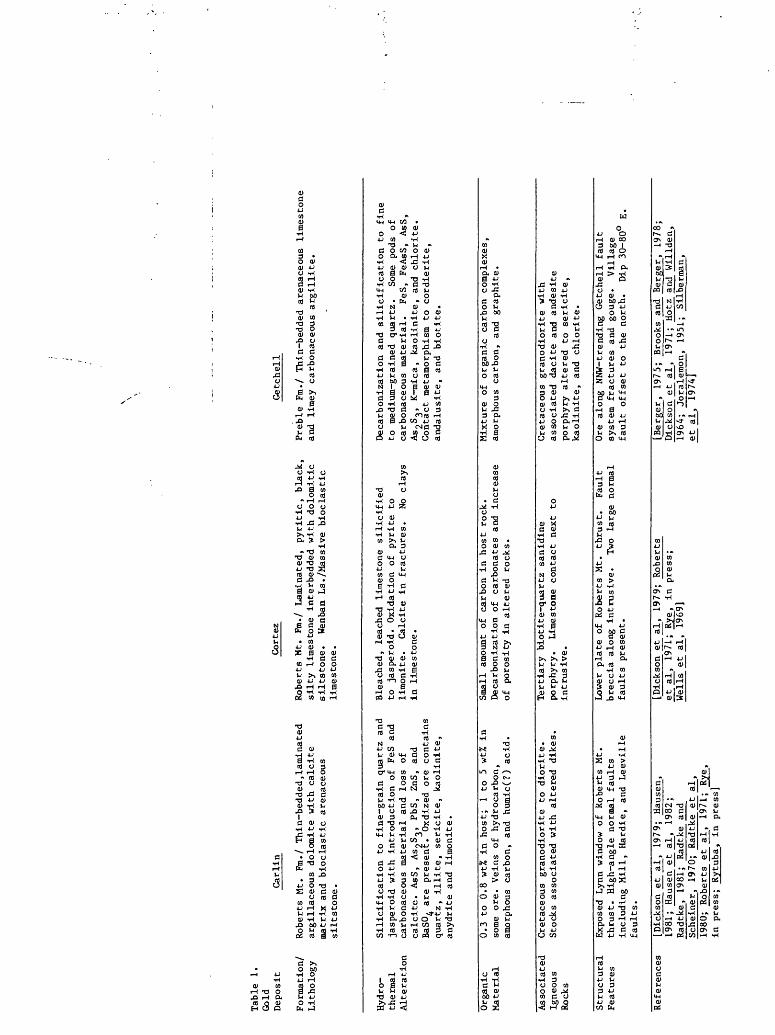
Table 1. Geologic features of five major disseminated gold deposits in northern Nevada.
Table 2. Mineralogy of VNIR and MIR samples, derived from X-ray diffraction.
Table 3. Chemical analysis of VNIR and MIR samples by energy dispersive X-ray fluorescence, reported in weight percent.

Table
1 (c
ont)
,
Gold
Deposit
Formation/
Lith
olog
y
Jerritt
Canyon
Han
son
Cre
ek
Fin
./
Gre
y-b
lack
car
bonac
eous
and
shal
y li
mes
ton
e in
terb
edded
wit
h bio
cla
stic
dolo
mit
ean
d ba
nded
ch
ert
.
Pinson
Comus Fm
./ Interbedded
silt
ston
e and
limestone
with massive limestone
and
thin-bedded
cher
t.
Silicification of
limestone
beds from leached
limestone to
jasperoid.
FeS,
FeS2
, and
limo
nite
present.
Contact
metamorphism of
li
mest
one
to tactite,
Hydro-
therma
l Al
tera
tion
Silicification to
de
nse
chert
and
jasperoid. AsS, As
jS.,
, Fe
AsS,
HgS
pres
ent.
Introduction of
bl
ack,
greasy
graphite, carbonaceous
Carbonaceous so
oty
quality
of underlying
material in
tubular
bodies along
faul
ts.
Preb
le Fm
.Organic
Material
Associated
Igneou
sRocks
No ev
iden
ce of
major
intr
usio
n,
plug
of
diorite
are
pres
ent.
Small
dikes and
Cretaceous granodiorite st
ock
with
dacite
and andesite sills
and
dike
s.
Struct
ural
Features
Exp
osed
win
dow
of
Ro
ber
ts
Mt.
thru
st.
3 se
ts
of
hig
h-a
ng
le fa
ult
s:
NE se
t as
soci
ated
w
ith
ore
; N
E-s
et
cut
ore
; E-
W se
t is
th
e y
ou
ng
est.
Dep
osi
t is
in
G
etch
ell
fault
sy
stem
. N
E-
trendin
g fa
ult
is
co
nta
ct
of
Com
us
Fm.
and
Pre
ble
Fm
. in
a
20-m
-wid
e bre
ccia
zo
ne.
Ref
eren
ces
[Dic
kson
et
al.
19
79;
Haw
kins
. 19
82;
Bir
ak a
nd
H
awki
ns,
in p
ress
][A
nto
niu
k a
nd
Cro
mbi
e,
1982
; D
icks
on et
al,
19
79;
Eri
ckso
n
and
Mar
sh,
1974
a;
Eri
ckso
n
and
M
arsh
, 19
7 4b
_;
Hot
z an
d W
illd
en,
1964
; K
err,
1
94
0].
Tabl
e 1.
Gold
Depo
sit
Form
atio
n/
Lithology
Car
lin
Ro
ber
ts
Mt.
Fm
./
Th
in-b
edd
ed,l
amin
ated
arg
illa
ceous
dolo
mit
e w
ith calc
ite
mat
rix a
nd bio
cla
stic
ar
enac
eou
s si
ltst
on
e.
Cort
ez
Robe
rts
Mt.
Fm./
La
mina
ted,
pyritic, black,
silt
y limestone
inte
rbed
ded
with d
olom
itic
siltstone.
Wenban Ls
./Ma
ssiv
e bioclastic
limestone.
Get
chel
l
Pre
ble
F
m./
T
hin
-bed
ded
ar
enac
eous
lim
esto
ne
and
lim
ey ca
rbo
nac
eous
arg
illi
te.
Hyd
ro-
Sil
icif
icati
on
to fi
ne-g
rain
quar
tz
and
ther
mal
ja
sper
oid
w
ith in
troducti
on o
f Fe
S an
d A
ltera
tion
carb
onac
eous
mate
rial
and
loss
of
calc
ite.
AsS
, A
s2S3
> P
bS,
ZnS
, an
d B
aSO
, are
p
rese
nt.
O
xdiz
ed
ore
co
nta
ins
qu
art
z,
illi
te,
seri
cit
e,
kaoli
nit
e,
any
dri
te
and
lim
onit
e.
Ble
ached
, le
ached
li
mes
tone
sil
icif
ied
to
ja
spero
id.
Ox
idat
ion
of
p
yri
te
to
lim
onit
e.
Cal
cite
in
fr
actu
res.
N
o cl
ays
in l
imes
tone.
Dec
arboniz
atio
n a
nd sil
icif
icati
on
to
fi
ne
to
med
ium
-gra
ined
q
uart
z.
Som
e po
ds
of
carb
on
aceo
us
mate
rial.
F
eS,
FeA
sS,
AsS
, A
snS-
*)
K-m
ica,
k
aoli
nit
e,
and
chlo
rite
. C
onta
ct
met
amor
phis
m
to cord
ieri
te,
an
dalu
site
, an
d b
ioti
te.
Org
anic
0
.3
to
0.8
w
t% in
h
ost
; 1
to
5 w
t% in
M
ater
ial
som
e o
re.
Vei
ns
of
hy
dro
carb
on
,am
orph
ous
carb
on,
and
hum
ic(?
) acid
.
Sm
all
amou
nt
of
carb
on
in
host
ro
ck.
Dec
arboniz
atio
n
of
carb
onat
es
and
incre
ase
of
poro
sity
in
alt
ere
d
rock
s.
Mix
ture
of
o
rgan
ic
carb
on
co
mp
lex
es,
amor
phou
s ca
rbo
n,
and
gra
phit
e.
Ass
oci
ated
Ign
eou
sR
ocks
Cre
tace
ous
gra
nodio
rite
to
d
iori
te.
Sto
cks
ass
ocia
ted w
ith
alt
ere
d
dik
es.
Tert
iary
b
ioti
te-q
uart
z
sanid
ine
po
rph
yry
. L
imes
tone
co
nta
ct
nex
t to
in
tru
siv
e.
Cre
tace
ou
s gra
no
dio
rite
w
ith
ass
ocia
ted d
acit
e
and
andesi
te
porp
hyry
alt
ere
d
to seri
cit
e,
kao
lin
ite,
and
chlo
rite
.
Str
uctu
ral
Exp
osed
L
ynn
win
dow
of
Ro
ber
ts
Mt.
Fea
ture
s th
rust
. H
igh
-an
gle
no
rmal
fa
ult
sin
clu
din
g M
ill,
H
ard
ie,
and
Leev
ille
fault
s.
Low
er p
late
of
R
ob
erts
M
t. th
rust
. F
ault
b
reccia
al
ong in
trusi
ve.
Two
larg
e no
rmal
fa
ult
s p
rese
nt.
Ore
al
on
g
NN
W-t
rend
ing
Get
chel
l fa
ult
sy
stem
fr
actu
res
and
goug
e.
Vil
lag
e fa
ult
o
ffse
t to
th
e nort
h.
Dip
30-8
0°
E.
Ref
eren
ces
[Dic
kson
et
al,
19
79;
Hau
sen,
19
81;
Hau
sen
et
al,
19
82;
Rad
tke,
19
81;
Rad
tke
and
Sch
ein
er.
1970
; R
adtk
e et
al,
19
80;
Rober
ts
et
al,
19
71;
Rye
, in
pre
ss;
Rytu
ba,
in
pre
ss]
[Dic
kson
et
al,
19
79;
Ro
ber
ts
_et^
jil_,
19
71;
Rye
, in
p
ress
; W
ells
et
al,
19
69]
[Ber
ger
, 19
75;
Bro
oks
and
Ber
ger
, 19
78;
Dic
kson
et
al,
19
71;
Hot
z an
c[ W
illd
en,
1964
; Jo
rale
mon,
1951
; S
ilb
erm
an,
£^a^,
1974
]

Table 3.
Sample # Rock-type
D-013 D-017 D-018 D-019 D-023 D-024 D-025 D-026 D-027 D-028 D-040 D-043 D-044 D-045 D-063 D-070 D-078 D-083 D-086 D-100 D-102 D-116 D-129 D-134 D-157
Flow-banded rhyoliteRhyolitic tuffClay zoneSilicified vein - DelamarSilicified sinterMilestone sinterArgillie veinSilicified vein - PinsonLimestoneShaleShale - Golconda Hot SpringAltered shale - Preble FmJasperoidLimestone - Preble FmGraniteLimestone - Preble FmBasaltHornfelsBasaltJasperoidLimestone - Preble FmGale-silicateLimestone - Preble FmUnaltered Shale - Preble FmJasperoid
A1203
19.15.19.
7.
17.
11.18.19.
13.17.4.
15.17.17.
20.
18.
Si02
77.77.77.94.90.94.77.94.48.60.70.75.94.
71.
62.70.58.90.8.
48.3.
69.92.
K2°
3.03.52.0
5.02.01.30.3
5.05.02.00.3
45.04.0
3.02.53.01.0
50.00.6
2.82.0
CaO
0.525.018.0
2.0
4.050.06.03.17.02.0
22.052.0
2.3
TiO
0.30.71.00.30.40.20.60.2
0.81.00.7
0.7
1.00.61.31.0
2.6
0.70.4
Fe 203
0.72.02.01.40.40.73.32.31.63.05.01.02.5
3.0
8.02.87.06.0
2.3
5.73.0
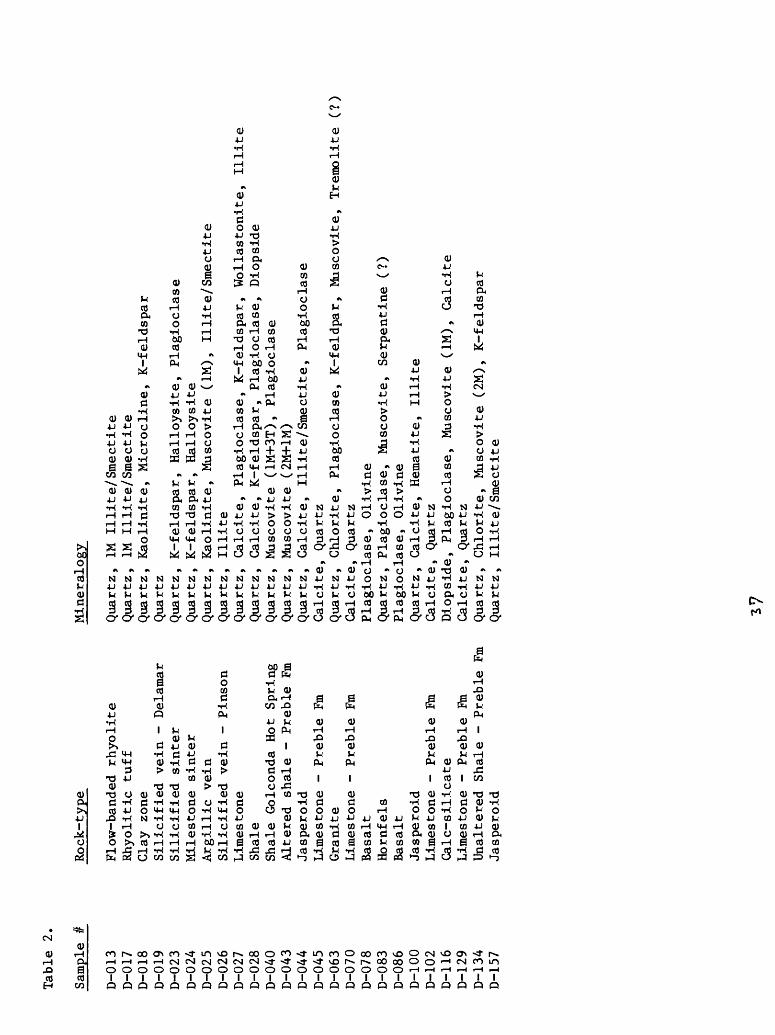
Tabl
e 2
Sample
D-0
13
D-0
17
D-0
18
D-0
19
D-0
23
D-0
24
D-0
25
D-0
26
D-0
27
D-0
28
D-0
40
D-0
43
D-0
44
D-0
45
D-0
63
D-0
70
D-0
78
D-0
83
D-0
86
D-1
00
D-1
02
D-1
16
D-1
29
D-1
34
D-1
57
Rock
-typ
e
Flow-banded
rhyo
lite
Rhyolitic
tuff
Clay
zo
neSi
lici
fied
vein -
Delamar
Sili
cifi
ed si
nter
Milestone
sinter
Argi
llic
vein
Silicified vein - Pinson
Lime
s to
neSh
ale
Shal
e Go
lcon
da Ho
t Spring
Altered
shal
e -
Preble Fm
Jasperoid
Lim
esto
ne
- P
reble
Fm
Gra
nit
eL
imes
tone
- P
reble
Fm
Bas
alt
Horn
fels
Bas
alt
Jasp
ero
idL
imes
tone
- P
reble
Fm
Calc
-sil
icate
Lim
esto
ne
- P
reble
Fm
Unal
tere
d
Sh
ale
- P
reble
Fm
Jasp
ero
id
Min
eral
ogy
Quar
tz,
1M Il
lite
/Sm
ecti
teQ
uar
tz,
1M Il
lite
/Sm
ecti
teQ
uar
tz,
Kaoli
nit
e,
Mic
rocli
ne,
K-f
eld
spar
Quar
tzQ
uar
tz,
K-f
eld
spar,
H
all
oysi
te,
Pla
gio
cla
seQ
uar
tz,
K-f
eld
spar,
H
all
oysi
teQ
uar
tz,
Kaoli
nit
e,
Mu
sco
vit
e (1
M),
Il
lite
/Sm
ecti
teQ
uar
tz,
Illi
teQ
uar
tz,
Calc
ite,
Pla
gio
cla
se,
K-f
eld
spar,
W
oll
ast
onit
e,
Ill
ite
Quar
tz,
Calc
ite,
K-f
eld
spar,
P
lagio
cla
se,
Dio
psi
de
Quar
tz,
Musc
ovit
e (1
M+
3T),
P
lag
iocla
seQ
uar
tz,
Musc
ovit
e (2
M+1
M)
Quar
tz,
Calc
ite,
Illi
te/S
mecti
te,
Pla
gio
cla
seC
alc
ite,
Quar
tzQ
uar
tz,
Chlo
rite
, P
lagio
cla
se,
K-f
eld
par,
M
usc
ovit
e,
Tre
moli
te
(?)
Calc
ite,
Quar
tzP
lagio
cla
se,
Oli
vin
eQ
uar
tz,
Pla
gio
cla
se,
Musc
ovit
e,
Ser
pen
tine
(?)
Pla
gio
cla
se,
Oli
vin
eQ
uar
tz,
Calc
ite,
Hem
atit
e, Ill
ite
Calc
ite,
Quar
tzD
iopsi
de,
P
lagio
cla
se,
Musc
ovit
e (1
M),
C
alc
ite
Calc
ite,
Quar
tzQ
uar
tz,
Chlo
rite
, M
usc
ovit
e (2
M),
K
-feld
spar
Quar
tz,
Illi
te/S
mecti
te
Related Documents