University of Wollongong Research Online University of Wollongong esis Collection University of Wollongong esis Collections 2014 Lysosomal cobalamin transport and its relevance to ageing and Alzheimer's disease Hua Zhao University of Wollongong Research Online is the open access institutional repository for the University of Wollongong. For further information contact the UOW Library: [email protected]

Welcome message from author
This document is posted to help you gain knowledge. Please leave a comment to let me know what you think about it! Share it to your friends and learn new things together.
Transcript
University of WollongongResearch Online
University of Wollongong Thesis Collection University of Wollongong Thesis Collections
2014
Lysosomal cobalamin transport and its relevance toageing and Alzheimer's diseaseHua ZhaoUniversity of Wollongong
Research Online is the open access institutional repository for theUniversity of Wollongong. For further information contact the UOWLibrary: [email protected]
LYSOSOMAL COBALAMIN TRANSPORT AND
ITS RELEVANCE TO AGEING AND
ALZHEIMER’S DISEASE
A thesis submitted in (partial) fulfilment of the requirements for the
award of the degree
DOCTOR OF PHILOSOPHY
from
UNIVERSITY OF WOLLONGONG
by
HUA ZHAO
SCHOOL OF BIOLOGICAL SCIENCES
FACULTY OF SCIENCE, MEDICINE AND HEALTH
2014
I
This thesis is dedicated to my parents.
For their endless love, support and encouragement.
II
DECLARATION
I, Hua Zhao, declare that this thesis, submitted in (partial) fulfilment of the
requirements for the award of Doctor of Philosophy, in the School of Biological
Sciences, University of Wollongong, is wholly my own work unless otherwise
referenced or acknowledged. The document has not been submitted for qualifications
at any other academic institution.
Hua Zhao
16 June 2014

III
IV
ABSTRACT
Vitamin B12, known as cobalamin (Cbl), is required for erythrocyte formation and
DNA synthesis. It plays a crucial role in maintaining neurological function. As a
coenzyme for methionine synthase and methylmalonyl-CoA mutase, Cbl utilisation
depends on its efficient transit through the intracellular lysosomal compartment and
subsequent delivery to the cytosol and mitochondria. Lysosomal function
deteriorates in ageing and Alzheimer’s disease (AD). Although rodent studies
indicate that Cbl supplementation significantly improves cognitive performance,
human trials have failed to provide a consistent beneficial effect on cognitive
performance with either oral or parenteral Cbl. This thesis proposes a novel
hypothesis that neuropathological conditions that impair lysosomal function, such as
age-related lipofuscinosis, lysosomal storage diseases, and AD, may interrupt
lysosomal Cbl transport and thereby impede Cbl utilisation. The experiments will
apply, for the first time, in vitro and in vivo models of ageing and AD to define how
lysosomal perturbations directly affect Cbl utilisation.
To address this question, a subcellular fractionation method was developed and
western blot and gamma counting techniques were used to measure organelle marker
proteins and [57Co] Cbl radioactivity levels in isolated purified lysosomes,
mitochondria, and cytosol that were derived from neuronal cells and mouse brain
tissue. The results from cultured cells, treated with compounds to impair lysosomal
protease function, revealed a ten-fold increase of [57Co] Cbl in lysosomes
concomitant with reduced [57Co] Cbl levels in mitochondria and cytosol. Artificial
V
lipofuscin was synthesized and fed into cells, which also resulted in an accumulation
in lysosomal [57Co] Cbl levels. In addition, lysosomal [57Co] Cbl transport was
interrupted in lysosomal glycosphingolipid storage disease cells derived from a
patient with Gaucher’s disease, where lysosomal glucosylceramides had
accumulated and lysosomal [57Co] Cbl levels were doubled. Furthermore, C57BL/6J
wild type mice and APPxPS1 AD mice were intraperitoneally injected with [57Co]
Cbl and the amount of [57Co] Cbl radioactivity in the major organs was measured.
The [57Co] Cbl level in the APPxPS1 AD mouse brains demonstrated a significant
increase in lysosomes and a decrease in cytosol compared to the wild type mice.
These in vivo experiments were replicated using APP mutant cells treated with a
proteasome inhibitor to induce lysosomal amyloid-beta accumulation. This similarly
increased lysosomal [57Co] Cbl levels.
In summary, the results from the in vitro and in vivo experiments provide a detailed
understanding of the impact of lysosomal dysfunction related to brain ageing and AD
on lysosomal Cbl transport at the subcellular level. These results may also explain
why Cbl administration has not yielded a consistent therapeutic benefit in the ageing
and AD contexts. More importantly, this thesis sheds light on this crucial issue and is
a step towards identifying a clinical therapeutic target to improve neuronal Cbl
utilisation and thus reduce the production of neurotoxic metabolites that accumulate
when the coenzyme forms of Cbl do not reach their intracellular targets.
VI
ACKNOWLEDGMENTS
I would like to thank my supervisor and mentor Professor Brett Garner for your
invaluable support and guidance during my PhD. Thank you for all the opportunities
you have given me and for all your help and advice over the last three years. You
have inspired me to be a better scientist.
To Kalani Reberu and Hongyun Li, I really appreciate all the help and assistance
during my study. I couldn’t have done it without your support.
I would like to thank Andrew Jenner, Adena Spiro, and Sarah Abbott for your advice
and assistance. I will remember the days I work with you guys.
I would like to acknowledge Anthony Don and Timothy Couttas at the University of
New South Wales for using your equipment to measure glucosylceramide.
I would like to acknowledge Linda Cohen for professional proofreading some of the
chapters. Thanks a lot for your time and energy.
Last but not least, to my partner and family members, thank you for all your love and
endless support during my PhD.
VII
PUBLICATIONS TO DATE
Journal articles
Zhao H, Li H, Ruberu K, Garner B (2014) “Impaired lysosomal cobalamin transport
in Alzheimer’s disease” J Alzheimers Dis. 43 (3).
Zhao H, Ruberu K, Li H, Garner B (2014) “Perturbation of neuronal cobalamin
transport by lysosomal enzyme inhibition” Biosci Rep. 34 (1).
Zhao H, Ruberu K, Li H, Garner B (2013) “Analysis of subcellular [57Co]
cobalamin distribution in SH-SY5Y neurons and brain tissue.” J Neurosci Methods.
217(1-2):67-74.
Zhao H, Brunk UT, Garner B (2011) “Age-related lysosomal dysfunction: an
unrecognized roadblock for cobalamin trafficking?” Cell Mol Life Sci. 68(24):3963-
9.
Conference presentations
Oral
Zhao H, Garner B (2012) “Assessing intracellular cobalamin utilisation by
subcellular fractionation method” School of Biological Sciences, Kiola Postgraduate
Conference, Australia.
VIII
Zhao H, Garner B (2011) “Age-related dysfunction of lysosomal cobalamin
metabolism” School of Biological Sciences, Kangaroo Valley Postgraduate
Conference, Australia.
Posters
Zhao H, Ruberu K, Li H, Garner B (2014) “Alzheimer’s disease-related lysosomal
dysfunction impairs neuronal cobalamin transport” Australian Neuroscience Society
annual meeting, Adelaide, Australia.
Zhao H, Ruberu K, Li H, Garner B (2013) “Lysosomal dysfunction disrupts
neuronal cobalamin transport in vitro and in vivo” Society for Neuroscience annual
meeting, San Diego, USA.
Zhao H, Garner B (2013) “Age-related lysosomal alterations perturb neuronal
cobalamin trafficking” Australian Neuroscience Society annual meeting, Melbourne,
Australia.
Zhao H, Ruberu K, Li H, Garner B (2012) “Establishment of subcellular
fractionation techniques to assess intracellular cobalamin transit in vitro and the
impact of lysosomal dysfunction” Vitamin B12 International Symposium, Nancy,
France. (Winner of Young Investigator Award)
IX
TABLE OF CONTENTS
Declaration ................................................................................................................. II
Abstract .................................................................................................................... IV
Acknowledgments ................................................................................................... VI
Publications to Date ............................................................................................... VII
Table of Contents .................................................................................................... IX
List of Tables ........................................................................................................ XIII
List of Figures ....................................................................................................... XIV
Abbreviations ....................................................................................................... XVI
Introduction ............................................................................................................. 2 1
1.1 Cobalamin .................................................................................................... 2
1.2 Cbl absorption .............................................................................................. 4
1.3 Endosomes and Lysosomes.......................................................................... 9
1.4 Lysosomal Cbl intracellular trafficking ..................................................... 13
1.5 The consequence of MeCbl and AdoCbl deficiency.................................. 16
1.6 The significance of Cbl deficiency ............................................................ 21
1.7 AD and its relation to lysosomes ............................................................... 23
1.8 Age-related impairment of lysosomal function.......................................... 26
1.9 Gaucher disease – a lysosomal storage disease.......................................... 31
1.10 Overview .................................................................................................... 32
1.11 Aim of this study ........................................................................................ 34
General methods ................................................................................................... 37 2
2.1 Cell culture ................................................................................................. 37
2.2 [57Co] Cbl incorporation into cultured cells ............................................... 37
2.3 Cell homogenisation .................................................................................. 38
2.4 Density gradient ultracentrifugation .......................................................... 38
2.5 Western blotting ......................................................................................... 42
2.6 Bicinchoninic acid (BCA) protein assay .................................................... 43
X
2.7 Statistical analysis ...................................................................................... 44
Development and application of subcellular fractionation method ................. 47 3
3.1 Introduction ................................................................................................ 47
3.2 Methods ...................................................................................................... 48
3.2.1. Western blotting ................................................................................. 48
3.2.2. Acid phosphatase assay ...................................................................... 48
3.3 Results ........................................................................................................ 49
3.3.1. Isolation of lysosomes, mitochondria and cytosol from fibroblasts .. 49
3.3.2. Isolation of lysosomes, mitochondria and cytosol from neurons ....... 51
3.3.3. Lysosomal membrane integrity after subcellular fractionation ......... 53
3.4 Discussion .................................................................................................. 55
3.5 Conclusion ................................................................................................. 57
Impaired lysosomal function inhibits lysosomal cobalamin transport ............ 59 4
4.1 Subcellular [57Co] Cbl distribution in the standard culture condition........ 59
4.1.1. Introduction ........................................................................................ 59
4.1.2. Results ................................................................................................ 59
4.1.2.1 The effect of serum on [57Co] Cbl incorporation into the cells .................................. 60 4.1.2.3 The effect of cell growth confluence on [57Co] Cbl incorporation into the cells ....... 63 4.1.2.4 Isolated cellular fractions probed by western blotting ............................................... 64 4.1.2.5 Subcellular [57Co] Cbl distribution in the fibroblasts and neurons ............................ 66
4.2 Lysosomal pH alteration interrupts lysosomal [57Co] Cbl transport .......... 67
4.2.1. Introduction ........................................................................................ 67
4.2.2. Methods .............................................................................................. 68
4.2.2.1 Inhibition of lysosomal function with chloroquine .................................................... 68 4.2.2.2 Western blotting ......................................................................................................... 68 4.2.2.3 MTT activity assay .................................................................................................... 69
4.2.3. Results ................................................................................................ 70
4.2.3.1 The toxicity of chloroquine on cellular viability ........................................................ 70 4.2.3.2 Isolated cellular fractions probed by western blotting ............................................... 72 4.2.3.3 Chloroquine treatment impairs lysosomal [57Co] Cbl transport ................................. 74
4.3 Lysosomal protease inhibition impairs lysosomal [57Co] Cbl transport .... 75
4.3.1. Introduction ........................................................................................ 75
4.3.2. Results ................................................................................................ 75
4.3.2.1 Isolated cellular fractions probed by western blotting ............................................... 75
XI
4.3.2.2 Leupeptin treatment impairs lysosomal [57Co] Cbl transport ..................................... 78 4.3.2.3 Comparison of chloroquine and leupeptin treatment on fibroblasts and neurons ...... 79
4.4 [14C] propionate incorporation into fibroblasts and neurons...................... 81
4.4.1. Introduction ........................................................................................ 81
4.4.2. Methods .............................................................................................. 82
4.4.3. Results ................................................................................................ 83
4.5 Inhibition of lysosomal hydrolase pathway may interrupt lysosomal [57Co]
Cbl transport ........................................................................................................... 85
4.5.1. Introduction ........................................................................................ 85
4.5.2. Results ................................................................................................ 85
4.5.2.1 Isolated cellular fractions probing by western blotting .............................................. 86 4.5.2.2 Vinblastine treatment may impair lysosomal [57Co] Cbl transport ............................ 89
4.6 Discussion .................................................................................................. 90
4.7 Conclusions ................................................................................................ 91
Impact of lipofuscin accumulation and Gaucher’s disease on subcellular 5
cobalamin distribution ............................................................................................. 94
5.1 Artificial lipofuscin induction and effect of its accumulation on lysosomal
[57Co] Cbl transport ................................................................................................ 94
5.1.1. Introduction ........................................................................................ 94
5.1.2. Methods .............................................................................................. 95
5.1.2.1 Artificial lipofuscin induction .................................................................................... 95 5.1.2.2 Artificial lipofuscin measurement .............................................................................. 96 5.1.2.3 [57Co] Cbl labelling and western blotting .................................................................. 97
5.1.3. Results ................................................................................................ 97
5.1.3.1 Artificial lipofuscin cellular uptake was inefficient ................................................... 97 5.1.3.2 Isolated cellular fractions probing by western blotting ............................................ 100 5.1.3.3 Subcellular [57Co] Cbl distribution in artificial lipofuscin-loaded cells ................... 102
5.1.4. Discussion ........................................................................................ 102
5.2 Lysosomal [57Co] Cbl transport is impaired in Gaucher’s disease .......... 104
5.2.1. Introduction ...................................................................................... 104
5.2.2. Methods ............................................................................................ 105
5.2.2.1 Induction of GlcCer accumulation ........................................................................... 105 5.2.2.2 [57Co] Cbl labelling and western blotting ................................................................ 106
5.2.3. Results .............................................................................................. 107
XII
5.2.3.1 GlcCer is induced in the CBE-treated neurons but has no effect on lysosomal [57Co]
Cbl level ............................................................................................................................... 107 5.2.3.2 GlcCer is accumulated in GD cells and increases lysosomal [57Co] Cbl level ........ 109
5.2.4. Discussion ........................................................................................ 112
5.3 Conclusions .............................................................................................. 114
Impaired lysosomal cobalamin transport in Alzheimer’s disease .................. 116 6
6.1 Introduction .............................................................................................. 116
6.2 Methods .................................................................................................... 118
6.2.1. Cell culture and induction of lysosomal Aβ accumulation .............. 118
6.2.2. Enzyme-linked immunosorbent assay (ELISA) analysis of
intracellular Aβ40 and Aβ42 levels .................................................................... 119
6.2.3. Western blotting ............................................................................... 122
6.2.4. In vivo mouse study .......................................................................... 123
6.2.5. Histology and immunohistochemistry ............................................. 124
6.3 Results ...................................................................................................... 125
6.3.1. Isolation of lysosomes, mitochondria and cytosol from SH-SY5Y-
APP cells… ...................................................................................................... 125
6.3.2. Proteasome inhibition increases lysosomal Aβ levels and interrupts
lysosomal Cbl transport ................................................................................... 127
6.3.3. Aβ deposition and accumulation in the APPxPS1 AD mouse brain 129
6.3.4. [57Co] Cbl incorporation in WT and APPxPS1 AD mice ................ 132
6.3.5. Lysosomal Cbl transport is impaired in the APPxPS1 AD mouse
brain…………………………………………………………………………..134
6.4 Discussion ................................................................................................ 136
6.5 Conclusion ............................................................................................... 140
General discussion ............................................................................................... 143 7
7.1 Project overview and major outcomes ..................................................... 143
7.2 Future directions....................................................................................... 151
7.3 Conclusion ............................................................................................... 154
References ............................................................................................................... 156
XIII
LIST OF TABLES
Table 2.1 OptiPrep density gradient preparation. ...................................................... 39
Table 2.2 The samples preparation. ........................................................................... 43
Table 2.3 Preparation of BCA standards.................................................................... 44
Table 6.1 Preparation of ELISA standard intermediates. ........................................ 121
Table 6.2 Preparation of ELISA standards. ............................................................. 121
XIV
LIST OF FIGURES
Figure 1.1 Cobalamin chemical structure .................................................................... 3
Figure 1.2 Human dietary Cbl absorption systems. ..................................................... 6
Figure 1.3 TC receptor-mediated intracellular uptake of holoTC via endocytosis. ..... 8
Figure 1.4 The endosome and lysosome system illustrating the endocytic and
autophagic pathways .................................................................................................. 10
Figure 1.5 Autophagosome and autolysosome morphology. ..................................... 13
Figure 1.6 Schematic view of Cbl intracellular trafficking........................................ 14
Figure 1.7 Metabolism of Hcy ................................................................................... 17
Figure 1.8 The citric acid cycle .................................................................................. 20
Figure 2.1 Overview of [57Co] Cbl labelling and subcellular fractionation procedures
.................................................................................................................................... 41
Figure 3.1 Separation of lysosomes, mitochondria, and cytosol in fibroblast fractions
.................................................................................................................................... 50
Figure 3.2 Separation of lysosomes, mitochondria, and cytosol in neuron fractions. 52
Figure 3.3 Acid phosphatase activity in fibroblast and neuron fractions ................... 54
Figure 4.1 Cellular [57Co] Cbl uptake affected by the serum .................................... 61
Figure 4.2 The period of cellular [57Co] Cbl uptake in fibroblasts and neurons ........ 62
Figure 4.3 [57Co] Cbl incorporation under various neuronal growth confluences ..... 63
Figure 4.4 Distribution of [57Co] Cbl in lysosomes, mitochondria, and cytosol. ...... 65
Figure 4.5 The effect of chloroquine treatment on cell viability. .............................. 71
Figure 4.6 Subcellular [57Co] Cbl distribution after chloroquine treatment .............. 73
Figure 4.7 Subcellular [57Co] Cbl distribution after leupeptin treatment .................. 77
Figure 4.8 Comparison of [57Co] Cbl level in lysosomes (A) and cytosol (B). ......... 80
Figure 4.9 [14C] propionate utilisation pathway. ........................................................ 81
Figure 4.10 Lysosomal protease inhibitors reduce cellular [14C] propionate
incorporation. ............................................................................................................. 84
Figure 4.11 Subcellular [57Co] Cbl distribution after vinblastine treatment in SH-
SY5Y cells ................................................................................................................. 88
Figure 5.1 Artificial lipofuscin cellular uptake .......................................................... 99
Figure 5.2 Subcellular [57Co] Cbl distribution after artificial lipofuscin treatment. 101
XV
Figure 5.3 Subcellular [57Co] Cbl distribution after CBE treatment ........................ 108
Figure 5.4 Subcellular [57Co] Cbl distribution in GD cells ...................................... 111
Figure 6.1 Isolation of lysosomes, mitochondria and cytosol fractions from SH-
SY5Y-APP cells ....................................................................................................... 126
Figure 6.2 Proteasome inhibition increases lysosomal Aβ levels and impairs
lysosomal Cbl transport ........................................................................................... 128
Figure 6.3 Aβ deposition and accumulation in the APPxPS1 AD mouse brain. ..... 131
Figure 6.4 The [57Co] Cbl level in WT and APPxPS1 transgenic AD mouse organs.
.................................................................................................................................. 133
Figure 6.5 Subcellular Cbl transport is impaired in the APPxPS1 AD mouse brain.
.................................................................................................................................. 135
XVI
ABBREVIATIONS
4-NPP 4-nitrophenyl phosphate
Aβ Amyloid β
AdoCbl 5-deoxyadenosylcobalamin
AD Alzheimer’s disease
AL Autophagolysosome
Amph Amphisome
AP Autophagosome
APP Amyloid β precursor protein
ASGP-R Asialoglycoprotein receptor
ATP Adenosine-5'-triphosphate
AV Autophagic vacuoles
BHMT Betaine-homocysteine methyltransferase
BCA Bicinchoninic acid
BSA Bovine serum albumin
Cbl Cobalamin
CBE Conduritol B epoxide
CBS Cystathionine-β-synthase
Con Control
CNS Central nervous system
cpm Counts per minute
DAB 3,3'-Diaminobenzidine
DAPI 4',6-diamidino-2-phenylindole
DNA Deoxyribonucleic acid
XVII
DMEM Dulbecco’s Modified Eagle Media
ECL Enhanced chemiluminescence
EE Early endosome
ELISA Enzyme-linked immunosorbent assay
FADH2 Flavin adenine dinucleotide hydroquinone 2
FS Fetal bovine serum
GC Gas chromatography
GCase Glucocerebrosidase
GD Gaucher disease
GlcCer Glucosylceramide
GTP Guanosine triphosphate
HC Haptocorrin
HD Huntington’s disease
Hcy Homocysteine
HHcy Hyperhomocysteine
HoloTC Holotranscobalamin
HRP Horseradish-peroxidase
HS Human serum
IF Intrinsic factor
i.p. intraperitoneally
LAMP1 Lysosomal-associated membrane protein 1
LAMP2 Lysosomal-associated membrane protein 2
LC-MS Liquid chromatography-mass spectrometry
LE Late endosome
LER Lysosome enrichment reagent
LMBD1 Limb region 1 protein homologue (LMBR1) domain-containing protein 1
XVIII
Lyso Lysosome
MCI Mild cognitive impairment
MeCbl Methylcobalamin
Met Methionine
Mito Mitochondria
MTHFR Methylene tetrahydrofolate reductase
MMA Methylmalonic acid
MMACHC Methylmalonic aciduria CblC type with homocystinuria
MMADHC Methylmalonic aciduria CblD type with homocystinuria
MM-CoA Methylmalonyl-CoA
MMCM Methylmalonyl-CoA mutase
MS Methionine synthase
MTT 3-[4,5-dimethylthiazol-2-yl]-2,5 diphenyl tetrazolium bromide
NADH Nicotinamide adenine dinucleotide
NaOH Sodium hydroxide
PAS Pre-autophagic structure
PBS Phosphate buffer saline
PD Parkinson’s diseases
PS1 Presenilin 1
ROS Reactive oxygen species
SAM S-adenosyl-methionine
SAH S-adenosylhomocysteine
SDS-PAGE Sodium dodecyl sulfate polyacrylamide gel electrophoresis
SE Standard error
TC Transcobalamin
TCA Trichloro-acetic acid
XIX
TCblR Transcobalamin receptor
TGN Trans-Golgi network
THF Tetrahydrofolate
ThS Thioflavine S
TMB 3,3',5,5'-tetramethylbenzidine
VDAC1 Voltage-dependent anion channel 1

Chapter 1
1
Chapter 1
Introduction
Chapter 1
2
Introduction 1
1.1 Cobalamin
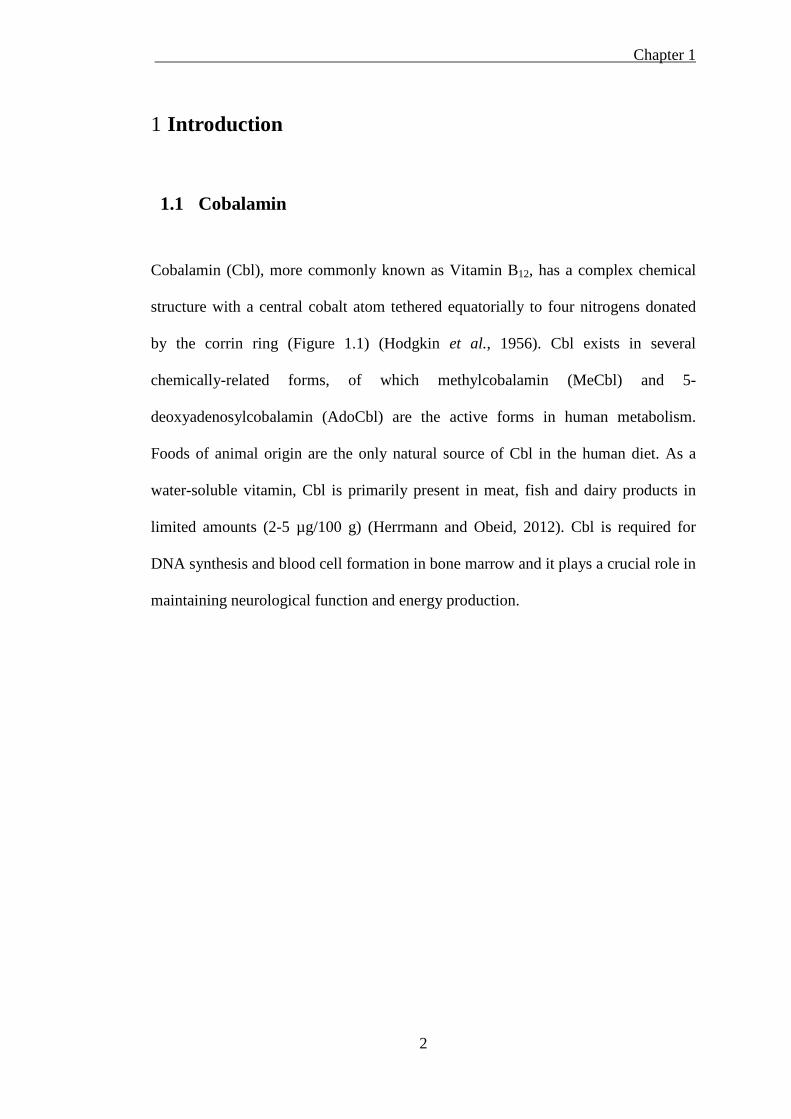
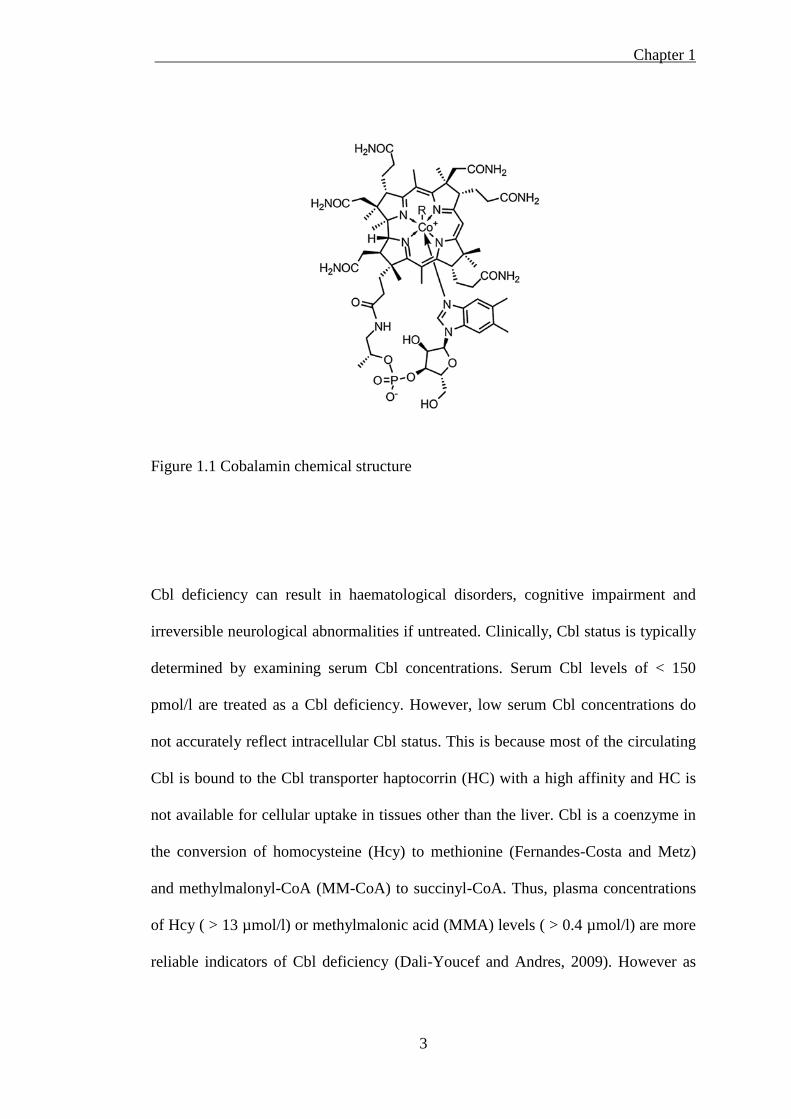
Cobalamin (Cbl), more commonly known as Vitamin B12, has a complex chemical
structure with a central cobalt atom tethered equatorially to four nitrogens donated
by the corrin ring (Figure 1.1) (Hodgkin et al., 1956). Cbl exists in several
chemically-related forms, of which methylcobalamin (MeCbl) and 5-
deoxyadenosylcobalamin (AdoCbl) are the active forms in human metabolism.
Foods of animal origin are the only natural source of Cbl in the human diet. As a
water-soluble vitamin, Cbl is primarily present in meat, fish and dairy products in
limited amounts (2-5 µg/100 g) (Herrmann and Obeid, 2012). Cbl is required for
DNA synthesis and blood cell formation in bone marrow and it plays a crucial role in
maintaining neurological function and energy production.
Chapter 1
3
Figure 1.1 Cobalamin chemical structure
Cbl deficiency can result in haematological disorders, cognitive impairment and
irreversible neurological abnormalities if untreated. Clinically, Cbl status is typically
determined by examining serum Cbl concentrations. Serum Cbl levels of < 150
pmol/l are treated as a Cbl deficiency. However, low serum Cbl concentrations do
not accurately reflect intracellular Cbl status. This is because most of the circulating
Cbl is bound to the Cbl transporter haptocorrin (HC) with a high affinity and HC is
not available for cellular uptake in tissues other than the liver. Cbl is a coenzyme in
the conversion of homocysteine (Hcy) to methionine (Fernandes-Costa and Metz)
and methylmalonyl-CoA (MM-CoA) to succinyl-CoA. Thus, plasma concentrations
of Hcy ( > 13 µmol/l) or methylmalonic acid (MMA) levels ( > 0.4 µmol/l) are more
reliable indicators of Cbl deficiency (Dali-Youcef and Andres, 2009). However as
Chapter 1
4
there is no consensus “gold standard” value for diagnosing Cbl deficiency, the
results should be interpreted individually combined with clinical symptoms.
Clinical evidence indicates that pernicious anaemia accounts for approximately 15-
25% of Cbl deficiency, and is characterised by the lack of intrinsic factor (IF), a
specific Cbl-binding protein that limits the body’s capacity to absorb Cbl from
dietary sources (Dali-Youcef and Andres, 2009). Pernicious anaemia is an
autoimmune disease that affects the gastric mucosa and results in gastric atrophy,
eventually leading to megaloblastic anaemia and neurological disorders. However,
the most common cause of Cbl deficiency (about 60-70%) is due to food-Cbl
malabsorption, especially in the elderly (Andres et al., 2003; Andres et al., 2005).
This syndrome is characterised by the body’s inability to release Cbl from food, and
is usually caused by atrophic gastritis or intestinal transport proteins, even when the
absorption of unbound Cbl is normal from food intake (Carmel, 1995). Oral or
parenteral administration of Cbl is used clinically to treat Cbl deficiency caused by
pernicious anaemia and other conditions that result in Cbl malabsorption.
1.2 Cbl absorption
Dietary Cbl is released from food proteins by gastric acid and pepsin in the stomach,
where Cbl is sequestered and transported by the binding protein HC. HC is a salivary
glycoprotein with broad specificity and high affinity for Cbl at both neutral and
acidic pH (Fedosov et al., 2002). Pancreatic proteases facilitate the degradation of
HC, releasing Cbl into the intestinal lumen, where it binds to gastric IF to form the
IF/Cbl complex. The receptor-mediated absorption of Cbl is a saturable process and
Chapter 1
5
cubilin regulates the number of IF/Cbl binding sites and limits the capacity of Cbl
absorption (Moestrup and Verroust, 2001). The IF/Cbl complex was taken to
endosomes of the ileal cells by endocytosis, where it is processed via the endosomal–
lysosomal pathway.
Upon endocytosis, endosomes deliver the IF/Cbl complex to the lysosomes, while
cubilin is recycled back to the cell surface. Within the lysosomes, IF is degraded by
lysosomal hydrolases while Cbl is released and transported out of the lysosomes into
the ileum. Cbl is secreted via the basolateral membrane of the ileal cells regulated by
the ATP-binding cassette (ABC) transporter MRP1/ABCC1 into the portal vein
blood circulation (Beedholm-Ebsen et al., 2010). From here, it binds to the primary
Cbl binding protein transcobalamin (TC), a 43 kDa protein that is synthesised and
secreted by the vascular endothelium in the intestinal villi (Quadros et al., 1999). Cbl
that is bound to TC is called holotranscobalamin (holoTC), and it is the
metabolically active vitamin B12 fraction. The plasma concentration of holoTC < 40
pmol/l is an early and sensitive indicator for diagnosing Cbl deficiency. HoloTC
consists of about 20% of the total Cbl circulating in the blood (Hall, 1977). Cbl is
transported via systemic circulation to all target cells of the body, where specific cell
membrane receptors are expressed and carry the holoTC into the cells (Figure 1.2).

Chapter 1
6
Figure 1.2 Human dietary Cbl absorption systems (adapted from Seetharam and
Yammani) (Seetharam and Yammani, 2003).
Approximately 80% of circulating Cbl is bound to HC and taken up by hepatocytes
via the asialoglycoprotein receptor (ASGP-R) (Linnell and Bhatt, 1995; Seetharam
and Yammani, 2003). In comparison to IF and TC, HC is more widely and
abundantly distributed in human tissues. HC not only binds Cbl, but it also
specifically binds Cbl analogues such as cobinamide with a higher affinity. In the
liver, Cbl released via the degradation of the HC/Cbl complex is either stored in the
form of Cbl-dependent enzymes or secreted via bile where it may be reabsorbed.
Thus, while the liver contains most of the body’s Cbl, the kidneys and brain are also
Chapter 1
7
important organs which store Cbl (Herrmann and Obeid, 2012). The secreted Cbl
binds to IF in the lumen and the IF receptor cubilin regulates the capacity of Cbl
absorption. Excessive Cbl is excreted from the body through the faeces (Figure
1.2)(Seetharam and Yammani, 2003).
Within the central nervous system (CNS), holoTC rapidly passes through the blood-
brain-barrier and is taken into the cerebrospinal fluid (Van den Berg et al., 2003).
The specific TC receptors (TCblR/CD320) expressed in cell membranes recognize
and bind holoTC (Bose et al., 1995). It is noteworthy that holoTC intracellular
uptake in the brain is critically dependent on the availability of TCblR. Recent
published data has shown that the concentration of Cbl was 92% lower in TCblR
knockout mouse brains than in the controls (Fernandez-Roig et al., 2012). However,
no direct evidence exists that the level of TCblR expression in any tissue is related to
the amount of Cbl transported to that tissue. The levels of TCblR are up-regulated to
import more holoTC when the cells are in a proliferating mode or when intracellular
MeCbl demand increases (Hall, 1984; Fiskerstrand et al., 1998). The TCblR captures
holoTC and is internalised via endocytosis to the endosomes. The empty TC receptor
is recycled back to the cell surface while the endosomes escort holoTC to the
lysosomes, from where TC is degraded by lysosomal hydrolases and Cbl is released
into the cytoplasm (Figure 1.3).
Chapter 1
8
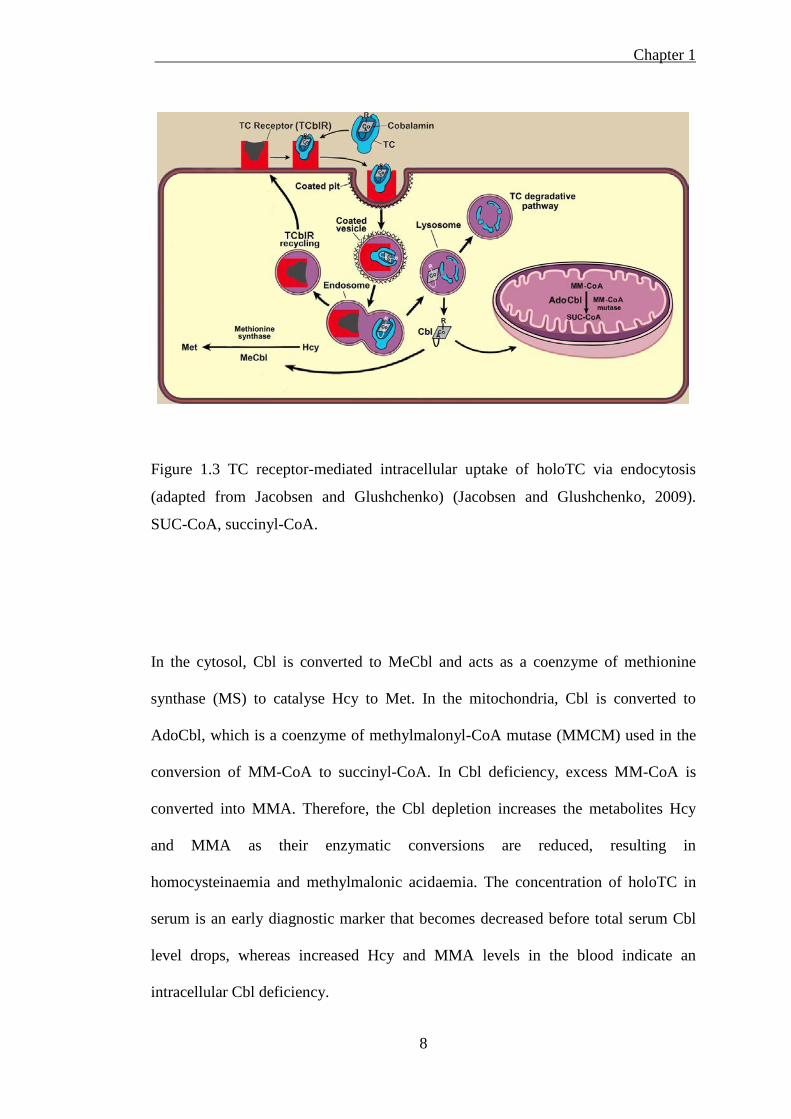
Figure 1.3 TC receptor-mediated intracellular uptake of holoTC via endocytosis
(adapted from Jacobsen and Glushchenko) (Jacobsen and Glushchenko, 2009).
SUC-CoA, succinyl-CoA.
In the cytosol, Cbl is converted to MeCbl and acts as a coenzyme of methionine
synthase (MS) to catalyse Hcy to Met. In the mitochondria, Cbl is converted to
AdoCbl, which is a coenzyme of methylmalonyl-CoA mutase (MMCM) used in the
conversion of MM-CoA to succinyl-CoA. In Cbl deficiency, excess MM-CoA is
converted into MMA. Therefore, the Cbl depletion increases the metabolites Hcy
and MMA as their enzymatic conversions are reduced, resulting in
homocysteinaemia and methylmalonic acidaemia. The concentration of holoTC in
serum is an early diagnostic marker that becomes decreased before total serum Cbl
level drops, whereas increased Hcy and MMA levels in the blood indicate an
intracellular Cbl deficiency.
Chapter 1
9
1.3 Endosomes and Lysosomes
Endosomes are endocytic membrane-bound compartments comprising early
endosomes and late endosomes. Exogenous molecules are internalised to early
endosomes through receptor-mediated endocytosis, pinocytosis, and phagocytosis.
Early endosomes then develop into late endosomes by maturation (Figure 1.4).
Lysosomal hydrolases are synthesised in the rough endoplasmic reticulum and
released from Golgi apparatus. Newly produced hydrolases are taged with mannose-
6-phosphate and delivered to the trans-Golgi network (TGN), where hydrolases are
taken by mannose-6-phosphate receptors and transported to late endosomes. Late
endosomes, known as multivesicular bodies, fuse with hydrolases and deliver them
to the immature lysosomes, while the empty mannose-6-phosphate receptors are
recycled back to the TGN (Mellman, 1996).
Chapter 1
10
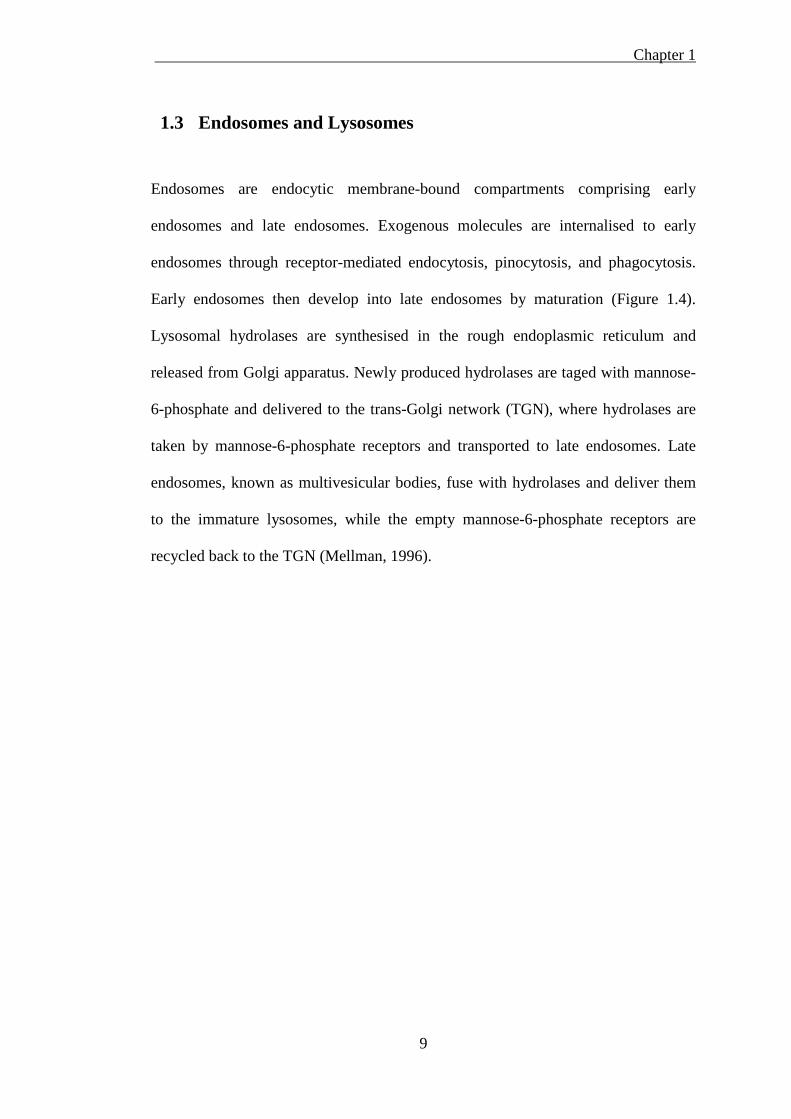
Figure 1.4 The endosome and lysosome system illustrating the endocytic and
autophagic pathways (adapted from Nixon)(Nixon, 2007). In the endocytic pathway,
molecules (such as proteins) are endocytosed and delivered to early endosomes (EE),
which mature into late endosomes (LE). In the autophagic pathway, damaged
organelles and macromolecules are surrounded by a pre-autophagic structure (PAS),
which sequesters large areas of cytoplasm to become a double-membraned
autophagosome (AP). This organelle receives hydrolases by fusing with either
immature lysosomes to form autophagolysosomes (AL) or LE to form amphisomes
(Amph), which fuse eventually with lysosomes (Lyso). ER, endoplasmic reticulum;
G, Golgi; NUC, nucleus.
Chapter 1
11
Lysosomes consist of acidic membrane-bound compartments and their size varies
from 0.05-1 µm. The low pH (4-5) of lysosomes is generated by the action of the
vacuolar H+ membrane proton pump ATPase that acidifies the newly-created
autolysosome (Mindell, 2012). Lysosomes contain over 50 soluble acid hydrolases
and they are nucleases, proteases, glycosidases, lipases, phosphatases, sulphatases
and phospholipases. The majority of lysosomal proteases are cathepsins that are
divided into three groups according to the amino acids of their active sites that confer
catalytic activity: cysteine (cathepsin B, C, F, H, K), aspartyl (cathepsin D, E), and
serine (cathepsin A, G). A limiting membrane containing an abundance of
glycosylated proteins surrounds these pH-sensitive lysosomal hydrolases. An intact
lysosomal membrane provides the barrier necessary to maintain such a low pH
environment compared with the neutral pH of the surrounding cytosol. Lysosomes
play a vital intracellular role in maintaining cellular homeostasis by continually
degrading and recycling cellular components for biosynthesis and energy production.
Lysosomes provide the site for the terminal proteolytic degradation of misfolded
proteins, defective organelles and excessive biological garbage. Lysosomal
hydrolases degrade macromolecules from extracellular space through endocytosis
and phagocytosis, as well as from the cytoplasm through autophagy.
Autophagy is a regulated process of degradation and includes three different
mechanisms: chaperone-mediated autophagy, microautophagy and macroautophagy.
Chaperone-mediated autophagy is a selective form of autophagy in which specific
cytosolic proteins containing a KFERQ motif are selectively targeted by chaperone
proteins to the lysosomal lumen for degradation. In microautophagy, small regions
of cytoplasm are non-selectively internalised via lysosomal membrane invaginations
Chapter 1
12
and continuously degraded within the lysosomal lumen. Macroautophagy regulates
large-scale cytoplasm degradation and is typically referred to as autophagy. During
macroautophagy, a pre-autophagic structure, known as a phagophore, encloses and
sequesters a large region of cytoplasm that contains proteins and organelles such as
mitochondria to become a double-membraned AP. The AP receives acid hydrolases
by fusing with either an immature lysosome to form an AL or with a late endosome
to form an Amph (Figure 1.4 and 1.5). Sequestered cytoplasms are degraded by acid
hydrolases into amino acids in both compartments to yield a mature lysosome
(autolysosome) with lysosomal hydrolases (Nixon, 2007).
Autophagy is essential to maintain cellular homeostasis through the degradation of
malfunctioning organelles and protein aggregates. Autophagy in normal healthy cells
is constitutively active, inducible and highly efficient. Autophagic vacuoles (AV) are
intermediate autophagy-related vesicular structures including autophagosomes,
amphisomes, and autophagolysosomes, and their presence in cells depends on both
the rate of autophagosome formation and rate of clearance by lysosomal hydrolases.
AV accumulation is rare in healthy cells because newly-formed autophagosomes are
rapidly cleared by fusing with lysosomes. However, AV is rapidly accumulated
when lysosomal hydrolases are inhibited by protease inhibitors (e.g leupeptin), or
when the transport of lysosomal hydrolases via microtubules are disrupted (e.g
vinblastine), or under neuropathological conditions (e.g AD) (Ivy et al., 1984; Nixon
et al., 2005).
Chapter 1
13
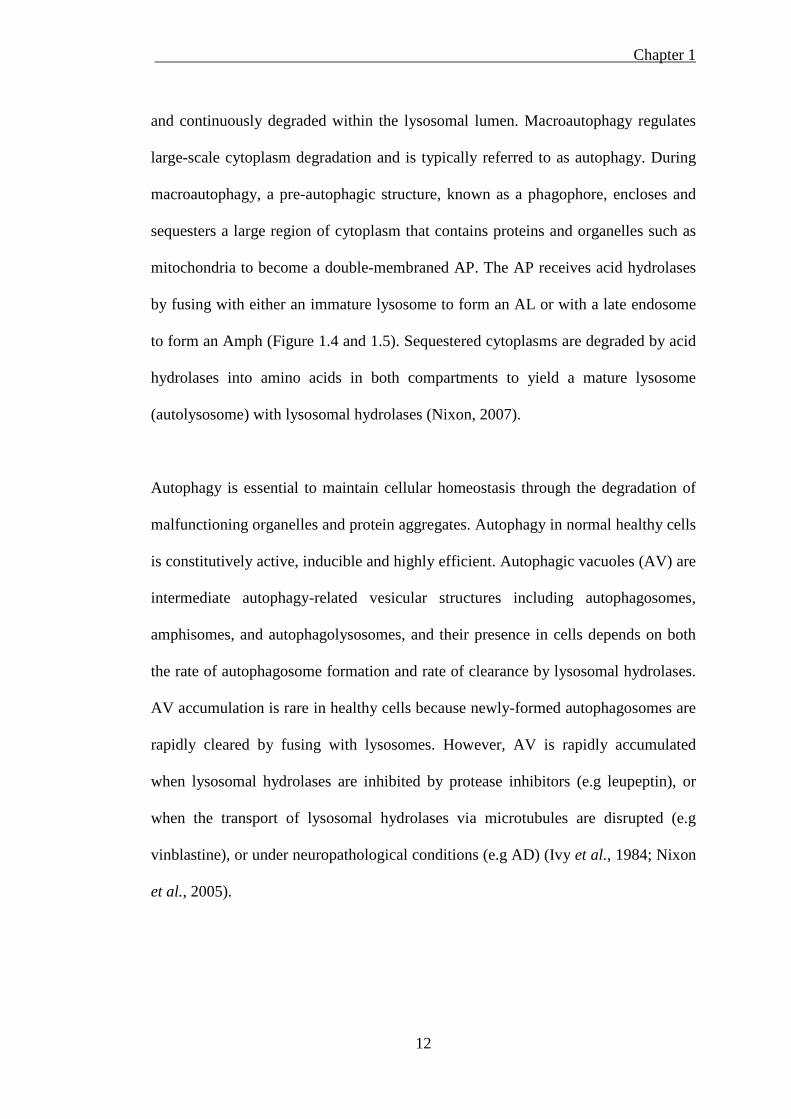
Figure 1.5 Autophagosome and autolysosome morphology. Electron microscopic
analysis of nutrient-starved mouse embryonic fibroblasts. Arrows indicate
autophagosomes and double arrows indicate autolysosomes/amphisomes.
Arrowheads indicate fragments of endoplasmic reticulum inside the autophagosome
(Mizushima et al., 2010).
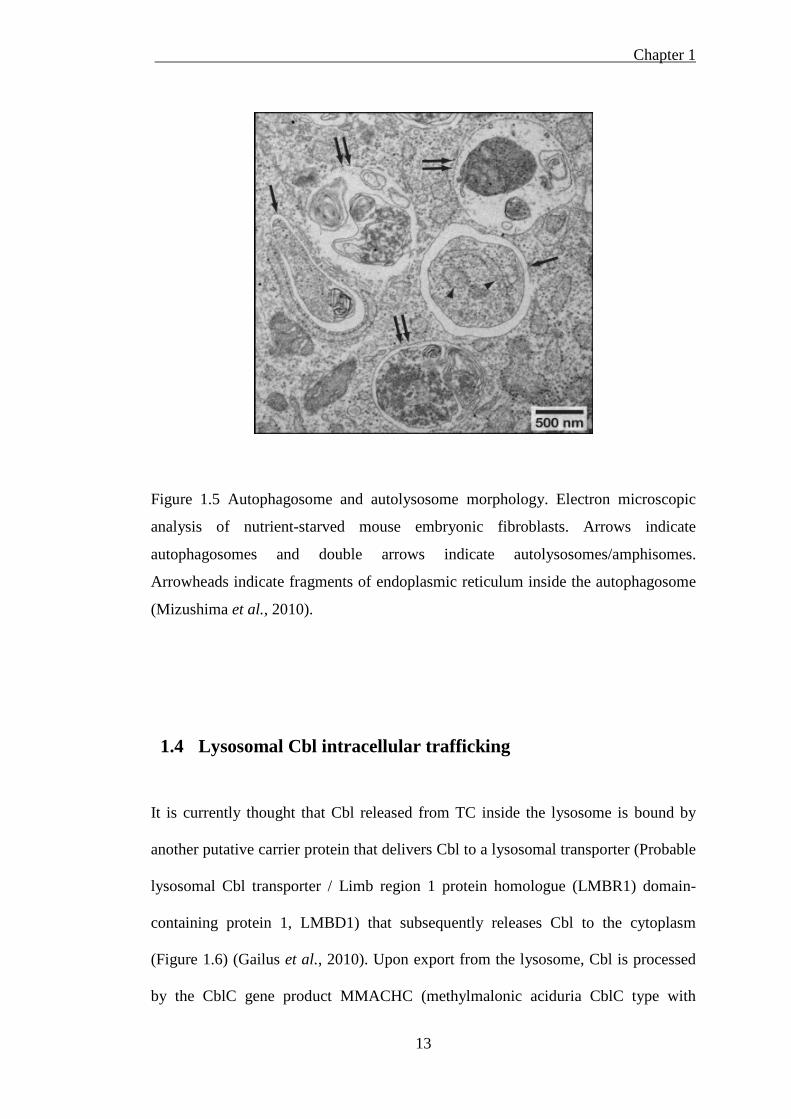
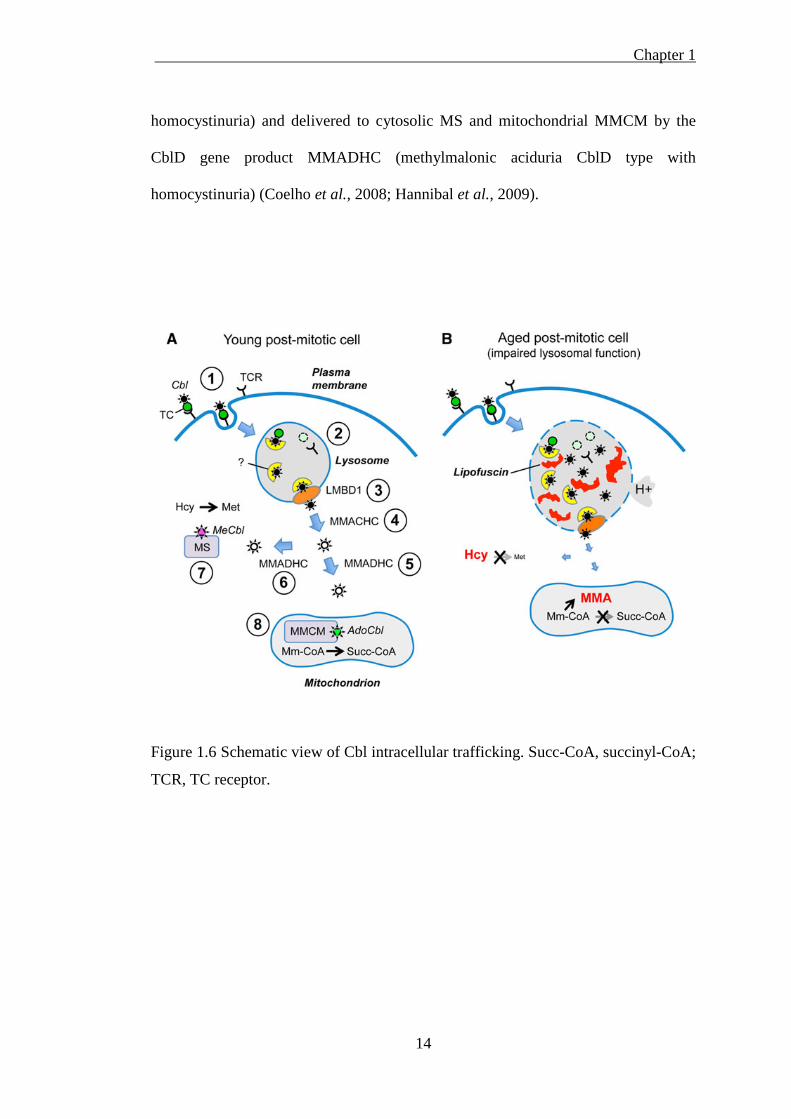
1.4 Lysosomal Cbl intracellular trafficking
It is currently thought that Cbl released from TC inside the lysosome is bound by
another putative carrier protein that delivers Cbl to a lysosomal transporter (Probable
lysosomal Cbl transporter / Limb region 1 protein homologue (LMBR1) domain-
containing protein 1, LMBD1) that subsequently releases Cbl to the cytoplasm
(Figure 1.6) (Gailus et al., 2010). Upon export from the lysosome, Cbl is processed
by the CblC gene product MMACHC (methylmalonic aciduria CblC type with
Chapter 1
14
homocystinuria) and delivered to cytosolic MS and mitochondrial MMCM by the
CblD gene product MMADHC (methylmalonic aciduria CblD type with
homocystinuria) (Coelho et al., 2008; Hannibal et al., 2009).
Figure 1.6 Schematic view of Cbl intracellular trafficking. Succ-CoA, succinyl-CoA;
TCR, TC receptor.
Chapter 1
15
The role that the lysosomes play in delivering Cbl to two important enzymes, MS in
the cytosol and MMCM in the mitochondria, is demonstrated by the defect in the
human LMBRD1 gene that encodes the LMBD1 transporter (Rutsch et al., 2009).
Mutations in LMBRD1 represent one of eight complementation groups of inborn
errors of Cbl metabolism referred to as the CblF defect. This genetic defect in
lysosomal Cbl release was discovered 25 years ago, well before the likely transporter
involved was characterised (Rosenblatt et al., 1985). Recent research has discovered
that ABCD4 (ATP-binding cassette, sub-family D, member 4), an ATP-binding
cassette transporter, is another essential component of intracellular Cbl metabolism
(Coelho et al., 2012). Both LMBD1 and ABCD4 co-localise with the lysosomal
protein LAMP1 (lysosomal-associated membrane protein 1). The precise role of
each protein in the lysosomal export of Cbl is unclear. ABCD4 may interact with
LMBD1 to facilitate passive transport of Cbl across the lysosomal membrane.
It is now recognised that the acidic pH of the lysosome also influences the
conversion of Cbl from the so-called “base-on” to “base-off” state in the interaction
between the dimethylbenzimidazole moiety of the Cbl molecule with the central
cobalt atom (Banerjee, 2006). In the base-on conformation the ligand is attached to
the central cobalt atom, whereas in the base-off conformation the ligand is displaced
from cobalt. It is speculated that the Cbl base-off state is important for subsequent
interactions with cytosolic cargo proteins (Banerjee, 2006). It is likely that the loss of
TC proteolysis and the inhibition of the conversion of Cbl to the base-off state are
related to two changes in lysosomal function (impaired lysosomal proteolytic
activity and increased lysosomal pH) that occur as a consequence of ageing in post-
mitotic cells (Terman et al., 2006; Zhao et al., 2011). It is therefore plausible that the
Chapter 1
16
loss of lysosomal TC proteolysis and the inhibition of the pH-dependent conversion
of Cbl to the base-off state accompany such age-related changes in lysosomal
function. It is noteworthy that in addition to TC, at least one additional
uncharacterised lysosomal Cbl escort/transport protein is predicted to exist and this
may present another point at which Cbl transit could be disrupted when lysosomal
function is impaired (Banerjee et al., 2009).
1.5 The consequence of MeCbl and AdoCbl deficiency
Hcy is a sulphur amino acid that is not obtained from the diet. Hcy is synthesized
from methionine via a multi-step process. Hcy is converted to methionine or cysteine
with the presence of vitamin B6, vitamin B9 (folic acid) and Cbl (Selhub, 1999).
Methyl-tetrahydrofolate (methyl-THF) transfers methyl to Hcy to produce
methionine and THF. This process is catalysed by MeCbl-dependent MS, which is
an enzyme that in humans is encoded by the MTR gene (5-methyltetrahydrofolate-
homocysteine methyltransferase) (Figure 1.7). Betaine-homocysteine
methyltransferase (BHMT) is an another enzyme that catalyses the transfer of a
methyl group from betaine to Hcy to produce dimethylglycine and methionine
respectively (Obeid, 2013). However, BHMT-dependent Hcy methylation is only
active in peripheral tissues, such as liver, but not in the brain.
Chapter 1
17
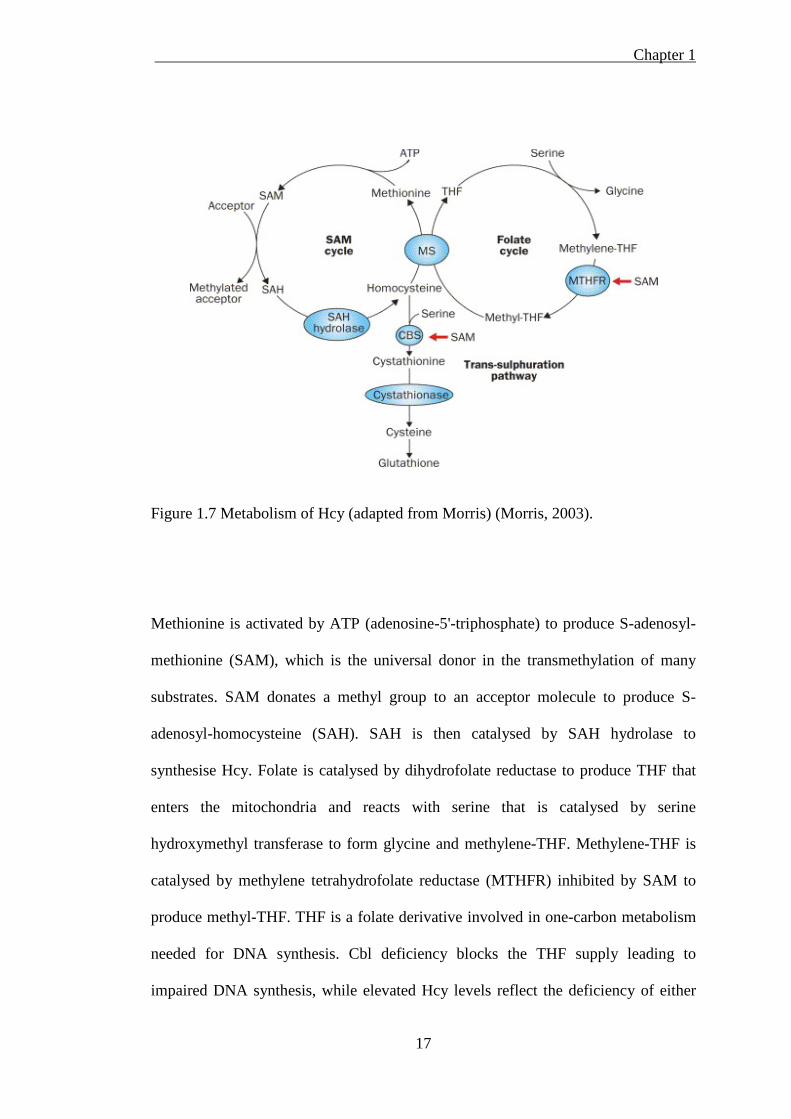
Figure 1.7 Metabolism of Hcy (adapted from Morris) (Morris, 2003).
Methionine is activated by ATP (adenosine-5'-triphosphate) to produce S-adenosyl-
methionine (SAM), which is the universal donor in the transmethylation of many
substrates. SAM donates a methyl group to an acceptor molecule to produce S-
adenosyl-homocysteine (SAH). SAH is then catalysed by SAH hydrolase to
synthesise Hcy. Folate is catalysed by dihydrofolate reductase to produce THF that
enters the mitochondria and reacts with serine that is catalysed by serine
hydroxymethyl transferase to form glycine and methylene-THF. Methylene-THF is
catalysed by methylene tetrahydrofolate reductase (MTHFR) inhibited by SAM to
produce methyl-THF. THF is a folate derivative involved in one-carbon metabolism
needed for DNA synthesis. Cbl deficiency blocks the THF supply leading to
impaired DNA synthesis, while elevated Hcy levels reflect the deficiency of either
Chapter 1
18
Cbl or folate or both. Alternatively, Hcy reacting with serine is catalysed by B6-
dependent cystathionine-β-synthase (CBS) and activated by SAM to form
cystathionine. Cystathionine is then converted to cysteine, which is a precursor of
glutathione (Morris 2003).
MS plays an important role in regulating and limiting the production of methionine
from Hcy in the cytosol. Failing to release Cbl from the lysosomes prevents the
MeCbl intracellular conversion from Cbl, thereby reducing MS activity, inhibiting
Hcy conversion, and resulting in increased Hcy concentrations. Epidemiological and
clinical studies indicate that elevated plasma levels of Hcy, known as
hyperhomocysteinaemia (HHcy), is recognised as a vital risk factor for developing
AD and mild cognitive impairment (MCI) in the elderly (Seshadri et al., 2002;
Quadri et al., 2004). Several clinical studies have reported HHcy in patients with
AD, vascular dementia and MCI (Clarke et al., 1998; Lehmann et al., 1999).
Evidence shows that HHcy enhances oxidative stress (Jacobsen, 2000), alters DNA
methylation (Fuso et al., 2005), and interferes with DNA repair mechanisms
(Kruman et al., 2002). HHcy concentration may increase amyloid-β (Aβ) peptide
levels in the brain and could therefore accelerate AD neuropathology (Pacheco-
Quinto et al., 2006). More recently, Cbl deficient diet-induced HHcy was reported to
increase Aβ peptide levels and Aβ deposition in the cortex and hippocampus in an
AD transgenic mouse model (Zhuo et al., 2010; Zhuo and Pratico, 2010). However,
these deficits are reversible and the reduction in HHcy levels induced by Cbl
replacement results in significantly improved cognitive performance and ameliorated
brain amyloidosis (Zhuo and Pratico, 2010).
Chapter 1
19
In addition, several studies have reported that plasma Hcy levels are positively
correlated with brain atrophy in humans and this has led to the administration of Cbl
(both with and without folate) as a therapeutic agent for MCI and AD (Sachdev et
al., 2002; Seshadri et al., 2008). Although evidence exists that reducing Hcy levels
in MCI patients slows the rate of brain atrophy, this appears to be linked to baseline
Hcy levels (Smith et al., 2010). Oral supplementation combining folate, vitamin B6,
and Cbl substantially lowers circulating Hcy levels, but does not appear to improve
the outcome in the prevention of cardiovascular disease or dementia.
HHcy has also been identified as an independent risk factor for cardiovascular
diseases including ischaemic heart disease, stroke, and peripheral vascular disease,
that are rated among of the most common death in developed countries (Boers,
1994). HHcy-induced microvascular damage is associated with thrombogenesis,
endothelial vasomotor function impairment, lipid peroxidation, and vascular smooth
muscle proliferation (Troen et al., 2008). Eventually these factors contribute to
coronary heart disease and stroke (Refsum et al., 1998).
In the mitochondria, AdoCbl is the coenzyme of MMCM that utilises and regulates
the conversion of MM-CoA to succinyl-CoA, which is also synthesised from
propionyl CoA. Propionic acid, also known as propionate, is involved in glucose
formation. Propionate is efficiently taken up into cells and converted to propionyl-
CoA by thiokinase and CoA, and then carboxylated by propionyl-CoA carboxylase
to yield MM-CoA. Succinyl-CoA is an important intermediate of the citric acid cycle
(energy production cycle) in the mitochondrial matrix. Succinyl-CoA is converted to
Chapter 1
20
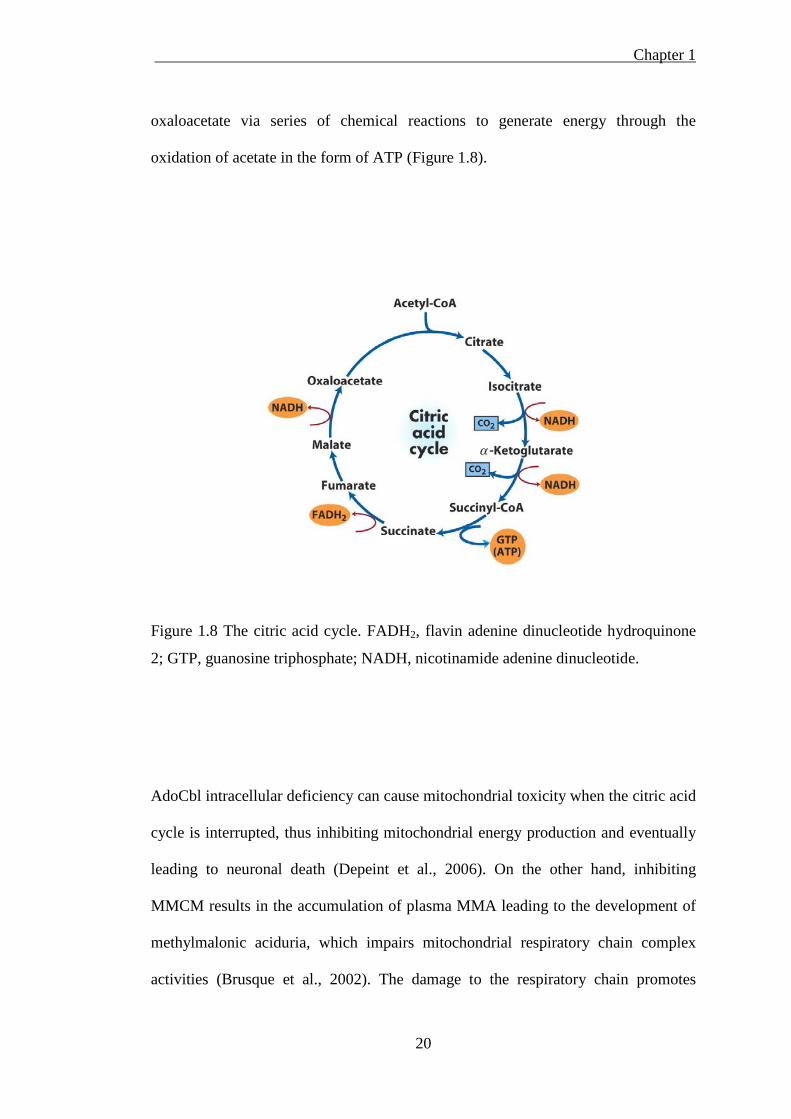
oxaloacetate via series of chemical reactions to generate energy through the
oxidation of acetate in the form of ATP (Figure 1.8).
Figure 1.8 The citric acid cycle. FADH2, flavin adenine dinucleotide hydroquinone
2; GTP, guanosine triphosphate; NADH, nicotinamide adenine dinucleotide.
AdoCbl intracellular deficiency can cause mitochondrial toxicity when the citric acid
cycle is interrupted, thus inhibiting mitochondrial energy production and eventually
leading to neuronal death (Depeint et al., 2006). On the other hand, inhibiting
MMCM results in the accumulation of plasma MMA leading to the development of
methylmalonic aciduria, which impairs mitochondrial respiratory chain complex
activities (Brusque et al., 2002). The damage to the respiratory chain promotes
Chapter 1
21
reactive oxygen species (ROS) generation causing significant oxidative stress in the
mitochondria. The accumulation of oxidative stress stimulates mitochondrial DNA
mutations (Richter et al., 1988), resulting in enzymatic abnormalities and further
oxidative stress inducing cell death. In addtition, lysosomes are rich in low mass
redox-active iron and they are very sensitive to oxidative stress (Kurz et al., 2008).
Lysosomal membranes are permeabilised by increased oxidative stress secondary to
the Fenton reaction, leading to the rupture of the membrane and the release of
lysosomal hydorlases into the cytosol, triggering apoptosis or necrosis (Kurz et al.,
2011).
1.6 The significance of Cbl deficiency
Cbl deficiency is a major widespread public health issue that is mainly observed
during ageing, and often associated with folate deficiency during this period of life.
Due to inadequate dietary intake and increasingly poor absorption (atrophic
gastritis), approximately 6% of the Western population over the age of 60 has low
plasma Cbl levels, with the prevalence of deficiency increasing with age (Krasinski
et al., 1986; Allen, 2009). Clinical studies have shown that dietary Cbl absorption is
significantly reduced in healthy adults aged 55-75 years compared to young adults,
with a further reduction in those older ages (Scarlett et al., 1992). This contributes to
a Cbl deficiency that leads to either methylmalonic aciduria or homocystinuria or
both.
Data from human and animal studies indicate that Cbl deficiency impairs neuronal
function; a process that is thought to contribute to age-related cognitive decline and
Chapter 1
22
dementia, including AD (Calvaresi and Bryan, 2001; Seshadri et al., 2002;
McCaddon, 2006; Zhuo and Pratico, 2010). Plasma levels of both Hcy and MMA
increase with age and elevated plasma Hcy and MMA concentrations correlate
positively with cognitive decline (Herrmann et al., 2000; Williams et al., 2002). Cbl
deficiency also results in the dysfunction of the peripheral nervous system
(Reynolds, 2006). Although the biochemical pathways that are perturbed in Cbl
deficient states are well understood, there is currently no clear explanation as to why
such biochemical/metabolic perturbations increase with age.
Food-Cbl malabsorption is a major cause of Cbl deficiency in the elderly. Low
serum Cbl levels are associated with ageing and cognitive impairment (Calvaresi and
Bryan, 2001; Moore et al., 2012). Studies in rodents indicate that Cbl
supplementation significantly improves cognitive performance (Zhuo and Pratico,
2010). However, human trials have failed to provide a consistent beneficial effect on
cognitive performance with either oral or parenteral Cbl administration (Smith,
2008; Maron and Loscalzo, 2009; McCaddon and Hudson, 2010). The fact is that
both oral Cbl supplementation (by-passing problems associated with release from
food components) and parenteral delivery (by-passing problems associated with both
release from food as well as lack of IF) routes increase circulating Cbl to the same
degree in both young and aged subjects (Nilsson-Ehle, 1998; Andres et al., 2005).
This raises the possibility that other pathways independent of dietary malabsorption
may contribute to suboptimal Cbl utilisation in aged individuals. One possibility that
has not been previously recognised is that the lack of cognitive improvement may be
due to the impaired transit of Cbl through lysosomes within the neurons of aged
individuals. It is also likely that Cbl release from lysosomal TC is compromised and
Chapter 1
23
the conversion to the ‘‘base-off’’ state is inhibited in neurodegenerative diseases
(Nixon et al., 2008). Under these conditions, a localised Cbl deficiency would
prevail despite the fact that plasma Cbl levels may have been normalised by dietary
supplements or intramuscular injections.
1.7 AD and its relation to lysosomes
Dementia is the leading cause of disability in older Australians. AD is the major
cause of dementia (~70% of cases) and affected 250,000 Australians in 2009.
Without a significant medical breakthrough, this number is expected to reach almost
1.1 million by 2050 (Mental Health Research Institute, Australia). There is no
effective cure for AD and little is known regarding the causal molecular pathways
that result in AD and how they may be modulated to delay its onset.
AD is a progressive neurodegenerative disorder characterised by a gradual loss of
memory, orientation, judgement and reasoning. The characteristic neuropathological
alterations of AD include the loss of neurons, particularly in the cerebral cortex and
hippocampus involved with memory and cognition, and the presence of abnormal
intra- and extra-neuronal proteinaceous fibrous material within and around the
surviving neurons (De-Paula et al., 2012).
Neurofibrillary tangles, primarily abnormal paired helical filaments composed of the
microtubule-associated phosphorylated protein, Tau, accumulate within neurons in
large numbers as the disease progresses (Avila, 2006). In the extracellular space,
amorphous insoluble aggregates of proteinaceous debris, termed amyloid plaques,
Chapter 1
24
deposit along extraluminal surfaces of cerebral blood vessels and parenchyma
(Murphy and LeVine, 2010). The main component of amyloid plaques is a highly
hydrophobic 39-43 amino acid Aβ peptide. Aβ is formed after sequential cleavage of
the amyloid β precursor protein (APP), a transmembrane glycoprotein expressed in
many cells and tissues including neurons. APP can be cleaved by the proteolytic
enzymes α-, β- and γ-secretase; Aβ peptide is generated by successive action of the
β- and γ- secretases. Cleavages of APP give rise to most abundant species Aβ40 and
smaller amount of Aβ42 (Nixon, 2007). Soluble Aβ peptide in the blood can cross the
blood-brain barrier and interact with neurons in the brain (Clifford et al., 2007);
however, the hallmark for diagnosing AD is the accumulation of Aβ into numerous
senile amyloid plaques that may induce neuronal dysfunction and cell death (Carter
and Lippa, 2001).
AD is generally regarded as a sporadic disorder, while a small proportion (<5%) of
familial AD (FAD) is caused by genetic defects. The pathogenic mutations in FAD
genes, APP, presenilin 1 (PS1), and presenilin 2, directly cause early-onset FAD in
rare families with onset of disease occurring usually 50-60 years. Together, these
three genes appear to account for approximately 70% of the FAD cases (Williamson
et al., 2009). The inheritance of the apolipoprotein E ε4 allele is associated with an
increased risk for late-onset FAD but is not sufficient to cause the disease (Kim et
al., 2009).
The endosomal-lysosomal pathway plays a major role in maintaining neuronal
homeostasis and survival by degrading and reducing the concentration of misfolded
proteins and damaged organelles to prevent aberrant protein accumulation. In AD
Chapter 1
25
endosomes are a major site of Aβ production in normal cells and mediate the cellular
uptake of Aβ and soluble APP (Nixon, 2007). The endocytic pathway is also
responsible for the internalisation and initial processing of APP at the plasma
membrane (Koo et al., 1996; Nixon et al., 2000). Endosomes were enlarged and
increased in the neurons of the AD brain when they were labelled with the specific
endosomal marker, Rab5, indicating elevated neuronal endocytosis activation
(Cataldo et al., 1996; Cataldo et al., 1997).
Lysosomes contain over 50 acid hydrolases and the majority of lysosomal proteases
are cathepsins. Lysosomal hydrolases degrade and recycle misfolded proteins and
damaged organelles mainly through autophagy. The accumulation of Aβ in the
lysosome has been reported in animal AD models (Langui et al., 2004). Lysosomal
function is continually up-regulated and the levels of lysosomal enzymes are
increased in the hippocampus and frontal cortex in APPxPS1 transgenic AD mice.
This possibly reflects cellular responses to the failed degradation of the accumulating
Aβ (Mueller-Steiner et al., 2006; Amritraj et al., 2009), although residual bodies
gradually accumulate as neurons become compromised when AD progresses.
Lysosomal acidification is defective in AD (Wolfe et al., 2013). PS1 regulates the
trafficking of the vacuolar H+-ATPase to the lysosomes and thus lysosomal
proteolysis is disrupted by AD-related PS1 mutation (Lee et al., 2010).
The incubation of cultured primary neurons with soluble Aβ42 causes the
accumulation of Aβ42 in the lysosomes and intracellular Aβ42 is relative resistant to
protease degradation (Ditaranto et al., 2001; Chafekar et al., 2008). The increased
levels of intralysosomal Aβ stimulate rapid free radical generation within lysosomes
Chapter 1
26
and disrupt the lysosomal membrane proton gradient which together results in a
more rapid Aβ accumulation and aggregation (Ditaranto et al., 2001). This may
initate a vicious cycle as neuronal oxidative stress induces further lysosomal Aβ
accumulation via enhanced autophagy induction and decreased lysosomal clearance
(Zheng et al., 2006; Zheng et al., 2006; Zheng et al., 2011). Lysosomes are rich in
low mass redox-active iron and they are very sensitive to oxidative stress induced by
ROS via the Fenton reaction (Kurz et al., 2011). Lysosomes are indeed under stress
and their membrane becomes vulnerable when accumulated Aβ combines with other
undegradable material to induce oxidative stress and abnormal proteolysis leading to
lysosomal membrane disruption (Yang et al., 1998). Consequently lysosomal
membranes become destabilised and lysosomal hydrolases are released into the
cytosol when lysosomal membrane permeabilisation is induced, contributing to
apoptosis or necrosis (Dunlop et al., 2009). Lysosomal proteases cathepsin B and
cathepsin D are present extracellularly in senile plaques at high levels in the AD
brain, indicating that those hydrolases may be released via lysosomal membrane
rupture as neurons degenerate (Cataldo et al., 1991).
1.8 Age-related impairment of lysosomal function
Ageing is one of the most significant medical challenges facing Australia and the
world. The proportion of people over 60 years old is increasing faster than any other
age group. At the cellular level, ageing is characterised by the increasing
accumulation in long-lived post-mitotic cells of dysfunctional, usually enlarged
mitochondria, lipofuscin-loaded lysosomes, and oxidatively modified cytosolic
Chapter 1
27
proteins and lipids (Brunk and Terman, 2002). Lipofuscin is a brown-yellow,
autofluorescent, electron-dense, intralysosomal pigment that progressively
accumulates over time within non-dividing cells, such as neurons, cardiac myocytes,
skeletal muscle fibres and retinal pigment epithelial cells (Strehler, 1964; Brunk and
Ericsson, 1972; Brunk et al., 1973; Double et al., 2008). Lipofuscin consists
primarily of oxidatively modified cross-linked protein residues originating from
autophagocytosed cytoplasmic components (Terman and Brunk, 1998). One of the
characteristic features of lipofuscin is that it is undegradable and cannot be removed
via exocytosis (Terman and Brunk, 1998). The increase of lipofuscin with age may
be due to an age-dependent reduction in the ability of cells to eliminate lipofuscin
because of their decreased lysosomal degradative capacity and increased oxidant-
induced damage. In addition, the rate of lipofuscin accumulation positively correlates
with the rate of ageing, showing an almost linear dependence (Munnell and Getty,
1968; Nakano and Gotoh, 1992). Thus lipofuscin is often referred to as an age
pigment and considered a hallmark of ageing (Terman and Brunk, 2004).
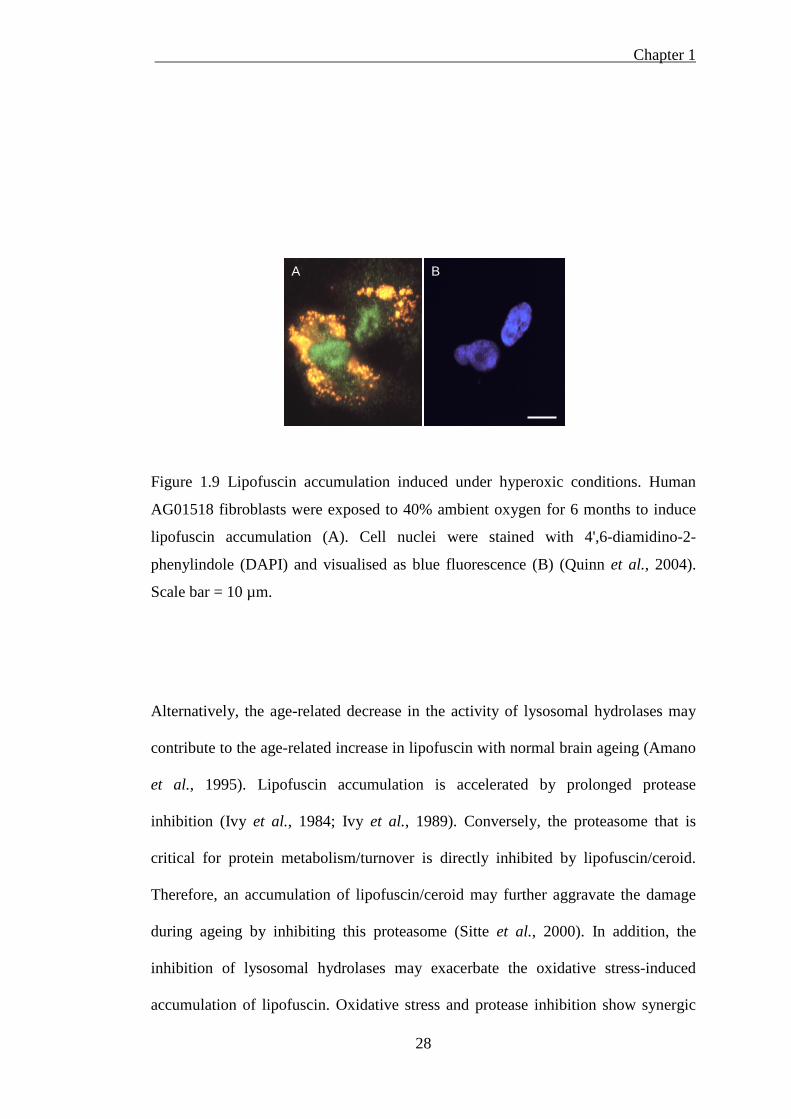
Lipofuscin formation can be induced under experimental conditions. It has been
shown that oxidative stress promotes lipofuscin formation, whereas antioxidant
treatment prevents it. In cell culture models, fibroblasts were exposed to hyperoxic
conditions (40% ambient oxygen) for 6 months to promote lipofuscin accumulation
(Figure 1.9), whereas growth at 8% oxygen and treatment with antioxidants reduce
lipofuscin formation (Thaw et al., 1984; Terman and Brunk, 1998; Quinn et al.,
2004).
Chapter 1
28
Figure 1.9 Lipofuscin accumulation induced under hyperoxic conditions. Human
AG01518 fibroblasts were exposed to 40% ambient oxygen for 6 months to induce
lipofuscin accumulation (A). Cell nuclei were stained with 4',6-diamidino-2-
phenylindole (DAPI) and visualised as blue fluorescence (B) (Quinn et al., 2004).
Scale bar = 10 µm.
Alternatively, the age-related decrease in the activity of lysosomal hydrolases may
contribute to the age-related increase in lipofuscin with normal brain ageing (Amano
et al., 1995). Lipofuscin accumulation is accelerated by prolonged protease
inhibition (Ivy et al., 1984; Ivy et al., 1989). Conversely, the proteasome that is
critical for protein metabolism/turnover is directly inhibited by lipofuscin/ceroid.
Therefore, an accumulation of lipofuscin/ceroid may further aggravate the damage
during ageing by inhibiting this proteasome (Sitte et al., 2000). In addition, the
inhibition of lysosomal hydrolases may exacerbate the oxidative stress-induced
accumulation of lipofuscin. Oxidative stress and protease inhibition show synergic
A B
Chapter 1
29
pathogenic effects as hyperoxia enhances protein oxidation, while decreased protease
degradation delays the removal of oxidised proteins (Terman and Sandberg, 2002).
The accumulation of lipofuscin induced by the combination of oxidative stress and
protease inhibition has been shown to be three times greater than that observed by
either condition alone (Terman and Brunk, 1998).
Ageing is accompanied by progressive cellular accumulation of biological “garbage”
and misfolded proteins (Terman and Brunk, 2006). Although damaged
macromolecules and organelles are continuously degraded by lysosomes through
autophagy and replaced by newly synthesised biological structures, it is clear that the
proportion of waste materials, such as lipofuscin, progressively increases with age in
post-mitotic cells. It is well known that cellular lipofuscin content positively
correlates with oxidative stress and mitochondrial damage (Sohal and Brunk, 1989;
Terman et al., 2004; Terman et al., 2010). ROS are generated continuously from
normal mitochondrial metabolism because of unavoidable electron leakage from
mitochondrial complexes during electron transport and reductive one-electron
transfer processes in the cytosol. With the progressively dysfunctional senescent
mitochondria, more ROS are produced and accumulated. This enhances oxidative
stress that decreases the effective degradation of damaged proteins by lysosomal
hydrolases and promotes lipofuscin accumulation (Terman et al., 2006). Moreover,
accumulating oxidative damage can then affect the efficiency of mitochondria and
further increase the rate of ROS production (Stadtman, 1992).
There are compelling data to suggest that lipofuscin accumulation impairs lysosomal
functions (Brunk and Terman, 2002; Terman et al., 2006). Although lipofuscin-
Chapter 1
30
loaded lysosomes appear to be intact under microscope, it is now recognised that the
lysosomal compartment is rich in iron that partly exists in a redox-active form. This
makes lysosomes sensitive to a high Fe-catalysed oxidative stress (Fenton reaction)
that compromises lysosomal membrane integrity leading to the loss of the proton
gradient (Yu et al., 2003). The susceptibility of lysosomes to oxidative stress or
potential membrane destabilisation or both is thought to play a major role in the
induction of lysosomal membrane permeabilisation. Loss of lysosomal function is
secondary to the abnormal permeabilisation of lysosomal membranes induced by
increased mitochondrial-derived ROS. Dysfunctional lysosomes cause defective
clearance and subsequent accumulation of undegraded autophagosomes, which
contribute directly to neurodegeneration by subsequent release of lysosomal
hydrolases into the cytoplasm triggering apoptosis or necrosis (Yuan et al., 2002).
Lysosomal heterogeneity exists both within cells and between cells, however it can
be seen that the net function of the lysosomal compartment is severely compromised
with ageing (von Zglinicki et al., 1995).
Lysosomal enzymes are produced in the trans-Golgi network and are transported by
mannose-6-phosphate receptors to late endosomes that acidify and mature into
lysosomes. The continual fusion and fission of the lysosomal vacuoles ensures the
distribution of acid hydrolases within the lysosomal compartment. Senescent post-
mitotic cells contain large numbers of lipofuscin-containing lysosomes, to which a
progressively greater proportion of lysosomal enzymes are directed in a futile
attempt to degrade lipofuscin. These lysosomal enzymes are essentially lost for
useful purposes (e.g. for the degradation of newly autophagocytosed material),
Chapter 1
31
resulting in a delayed enzyme turnover and the accumulation of waste products
(Terman and Brunk, 2006).
In addition to the impact of lysosomal lipofuscin accumulation, there are several age-
related settings in which lysosomal function is compromised. Neurodegenerative
diseases including AD, Parkinson’s disease (PD) (and other Lewy body disorders),
and Huntington's disease all involve the accumulation of aggregated
proteins/peptides that eventually overwhelm lysosomal capacity for degradation
(Cuervo et al., 2004; Rubinsztein, 2006; Levine and Kroemer, 2008; Nixon et al.,
2008). There is strong evidence that in these conditions the degradative capacity of
the lysosomes is impaired and the lysosomal membrane is destabilised (Nixon et al.,
2008). In addition, lysosomal pH may be increased in specific lysosomal storage
diseases (e.g. mucolipidosis Type IV), even in dividing cells (Bach et al., 1999).
1.9 Gaucher disease – a lysosomal storage disease
Gaucher disease is the most common lysosomal glycosphingolipid storage disease. It
is a genetic disease caused by mutations in the GBA gene that result in an inherited
deficiency in the lysosomal enzyme glucocerebrosidase (GCase) (Sillence and Platt,
2003; Jmoudiak and Futerman, 2005). This in turn causes the accumulation of
lysosomal glucosylceramide (GlcCer) mostly in the macrophage-derived cells and
neurons (Martin et al., 1989; Vitner and Futerman, 2013). GlcCer can also
accumulate in the spleen, liver, lungs, bone marrow, and brain (Beutler, 2004). Three
clinical types of GD have been identified. Type 1 (non-neuropathic type) is the most
common form and mostly occurs in individuals of Ashkenazi Jewish heritage with
Chapter 1
32
haematological complications. Type 2 (acute neuropathic form, most in infantile)
and type 3 (Chronic neuropathic form, most in juvenile) show neurological
symptoms. All types of GD are characterised by an enlarged liver and spleen
(Grabowski, 2008; Martins et al., 2009). A recent study showed that GlcCer was
present in the endolysosomal membrane and modulated endolysosomal pH in
lymphocytes, suggesting that lysosomal function may be disrupted in GD (Sillence,
2013).
Conduritol B epoxide (CBE) is a competitive, irreversible inhibitor of GCase.
Previous studies found that treating cells with CBE causes GlcCer accumulation,
while other lysosomal hydrolase levels are unaffected (Daniels et al., 1980; Das et
al., 1987). CBE-treatment of macrophages induced many morphological features of
GD cells, including whole cell enlargement, oriented fibrils and vacuolated
cytoplasm, eccentric nucleus and enlarged vacuoles with membranous structures
(Newburg et al., 1988). Moreover, CBE specifically elevated GlcCer levels in
macrophages as well as in neurons without affecting the levels of other glycolipids
(Yatziv et al., 1988; Schwarz et al., 1995). This in vitro system displayed many
essential biological parameters relevant for studying the cellular events responsible
for the neurological damage that occurs in some types of GD. Thus, CBE treatment
has proved an invaluable tool in providing a chemically induced GD phenotype
model.
1.10 Overview
Chapter 1
33
Lysosomes play an important intracellular role maintaining cellular homeostasis by
continually degrading and recycling cellular components for biosynthesis and energy
production. It is possible that lysosomal Cbl intracellular transport may also be
interrupted by aged or impaired lysosomes in ageing and AD. Given the fact that Cbl
utilisation is critically dependent on its efficient transit through the intracellular
lysosomal compartment, it seems reasonable to suggest that Cbl probably does not
reach its intended intracellular targets in aged/lysosome-compromised neurons, even
with an adequate Cbl supply. If the hypothesis is correct, this would result in an
escalating cytotoxic trajectory from the lack of available MeCbl and AdoCbl to act
as cofactors in the two important intracellular pathways.
The available evidence points towards the hypothesis that age-related or
neurodegenerative impairments of lysosomal function represent a novel
‘‘roadblock’’ that prevents Cbl from reaching its target intracellular enzymes in
long-lived post-mitotic cells such as neurons. This may represent a significant cause
of ‘‘functional Cbl deficiency’’ in ageing and neurodegenerative diseases even when
oral/parenteral Cbl supplementation maintains plasma Cbl levels within a healthy
range. This roadblock could contribute to the deleterious increases in Hcy and MMA
levels that occur in the ageing brain and thereby directly accelerate
neurodegeneration. As there is already great interest in the provision of dietary
supplements of Cbl and other B-group vitamins in the ageing and neurodegenerative
diseases, detailed studies of intracellular Cbl transport under these conditions
relevant to impaired lysosomal function are needed to elucidate the mechanism.
Chapter 1
34
1.11 Aim of this study
This study aims to investigate the impact that lysosomal dysfunction has on Cbl
intracellular transport in the context of ageing and AD. Suboptimal lysosomal
processing of Cbl plays a significant role in the age-related loss of neurological
function associated with both ageing and AD. Defining the mechanisms by which
Cbl may confer protection in the AD setting will provide the required information to
use broad scale Cbl administration for the prevention of AD in the ageing
population. I propose that a significant factor responsible for the lack of cognitive
improvement in aged and AD patients is the impaired transit of Cbl through
lysosomes, particularly in long-lived post-mitotic cells such as neurons.
This project will primarily use in vitro models to define how lysosomal dysfunction
directly affects Cbl transport and key metabolic sequelae. In vitro manipulations and
mutant cell models with inhibited lysosomal function may be useful experimental
approaches to investigate the changes in Cbl distribution in different subcellular
compartments. These cell models include those known to induce lysosomal
lipofuscin accumulation, the impairment of lysosomal function due to pathogenic
(e.g. Aβ-induced) lysosomal membrane perturbations, and lysosomal storage
disease. An in vivo APPxPS1 transgenic AD mouse model will also be assessed for
alterations in lysosomal Cbl metabolism. If this hypothesis is correct it may explain
why Cbl administration has not yielded a consistent therapeutic benefit in the ageing
and dementia contexts. More importantly, this study may identify a pathway that
could improve neuronal Cbl utilisation and reduce the production of neurotoxic
Chapter 1
35
metabolites that accumulate when the coenzyme forms of Cbl do not reach their
correct intracellular targets.

Chapter 2
36
Chapter 2
General methods
Chapter 2
37
General methods 2
2.1 Cell culture
The experiments were performed using human fibrosarcoma cells (HT1080, ATCC
#CCL-121) and human neuroblastoma cells (SH-SY5Y, ATCC #CRL-2266), which
were obtained from the American Type Culture Collection (ATCC, Manassas, VA,
USA). The cells were cultured in Dulbecco's modified eagle medium (DMEM, Life
Technologies, USA, Cat #12800-017), and supplemented with 10% (v/v) foetal calf
serum (FCS, Interpath, USA, Cat #SFBS), 100 µg/ml penicillin/streptomycin
(Sigma, USA, Cat #P4333), and 2 mM glutamine (Invitrogen, USA, Cat #15140122)
at 37◦C in a humidified atmosphere containing 5% CO2. The cells were grown in
four 175 cm2 plastic flasks until they reached approximately 70% confluence. The
experiments also used 1-year-old human healthy foreskin fibroblasts (AG01518) and
human Gaucher’s disease fibroblasts (GM00877, Lysosomal Storage Disease)
obtained from the Coriell Institute (New Jersey, USA).
2.2 [57Co] Cbl incorporation into cultured cells
As described previously, Cbl cellular uptake requires the Cbl binding protein TC that
exists in the serum. The HT1080 fibroblasts and SH-SY5Y cells were metabolically
labeled with [57Co] Cbl (0.025 µCi/ml, MP Biomedicals, USA, Cat #06B-430002) in
DMEM with 10% (v/v) human serum (HS, Sigma, USA, Cat #H4522) for 48 h at
37◦C to maximise [57Co] Cbl uptake. The cells were then rinsed with cold (10◦C)
Chapter 2
38
phosphate buffered saline (PBS), harvested with 1% (w/v) trypsin, and centrifuged at
600 × g for 5 min at 4◦C. A small portion of the cells were stained with 1% trypan
blue to determine the number of viable cells.
2.3 Cell homogenisation
A lysosome enrichment kit (Pierce, USA, Cat #89839) was applied to perform
subcellular fractionation. An 800 µl aliquot of extraction buffer Lysosome
Enrichment Reagent (LER) “A”, containing 1% (w/v) protease inhibitors (Sigma,
USA, Cat #P8340), was added to the cell pellets. The pellets were gently re-
suspended and incubated on ice for no more than 2 min. The cell suspension was
transferred to a ball-bearing cell homogeniser (Isobiotec, Germany) and
homogenised on ice. To confirm lysis efficiency, 10 µl of cell lysate was stained
with 1% (w/v) trypan blue and viewed under a light microscope. Homogenisation
was continued until 95% cell membrane breakage was achieved (typically 15
passages through the homogeniser). Next, the lysed cells were transferred into a 2 ml
Eppendorf tube, and 800 µl of LER “B”, containing 1% (w/v) protease inhibitors,
was mixed with the lysed cells. The mixed cell lysates were then centrifuged at 600
× g for 10 min at 4◦C to remove nuclei and membranous debris, and the supernatant
(1,500 µl) containing lysosomes, mitochondria and cytosol was collected.
2.4 Density gradient ultracentrifugation
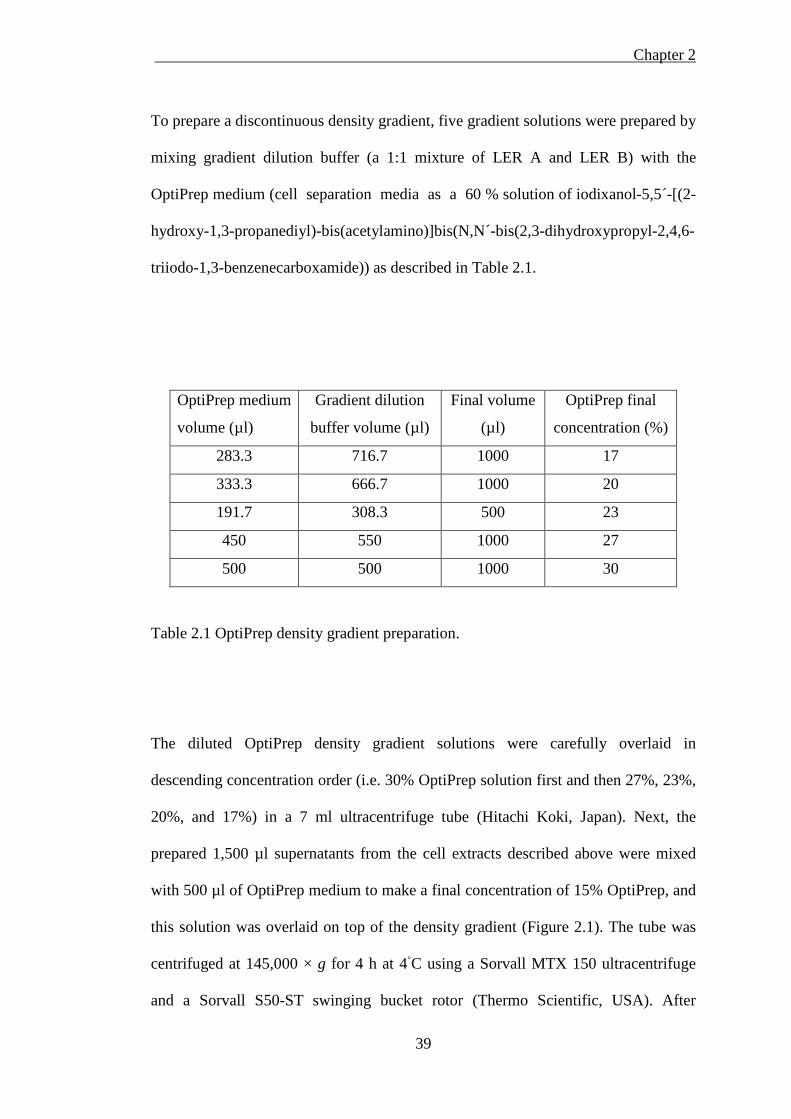
Chapter 2
39
To prepare a discontinuous density gradient, five gradient solutions were prepared by
mixing gradient dilution buffer (a 1:1 mixture of LER A and LER B) with the
OptiPrep medium (cell separation media as a 60 % solution of iodixanol-5,5´-[(2-
hydroxy-1,3-propanediyl)-bis(acetylamino)]bis(N,N´-bis(2,3-dihydroxypropyl-2,4,6-
triiodo-1,3-benzenecarboxamide)) as described in Table 2.1.
Table 2.1 OptiPrep density gradient preparation.
The diluted OptiPrep density gradient solutions were carefully overlaid in
descending concentration order (i.e. 30% OptiPrep solution first and then 27%, 23%,
20%, and 17%) in a 7 ml ultracentrifuge tube (Hitachi Koki, Japan). Next, the
prepared 1,500 µl supernatants from the cell extracts described above were mixed
with 500 µl of OptiPrep medium to make a final concentration of 15% OptiPrep, and
this solution was overlaid on top of the density gradient (Figure 2.1). The tube was
centrifuged at 145,000 × g for 4 h at 4◦C using a Sorvall MTX 150 ultracentrifuge
and a Sorvall S50-ST swinging bucket rotor (Thermo Scientific, USA). After
OptiPrep medium
volume (µl)
Gradient dilution
buffer volume (µl)
Final volume
(µl)
OptiPrep final
concentration (%)
283.3 716.7 1000 17
333.3 666.7 1000 20
191.7 308.3 500 23
450 550 1000 27
500 500 1000 30
Chapter 2
40
centrifugation, two distinct bands appeared in the gradient solution. A total of 10
fractions of 600 µl each were carefully withdrawn from the tops of the gradients
using extra-long micropipette tips (Finntip 200, Thermo Scientific, USA). The
amount of [57Co] Cbl in each fraction was measured using a Wallace Gamma
Counter (PerkinElmer, Finland). Next, each isolated fraction was mixed with 1,000
µl PBS and centrifuged at 20,000 × g for 30 min at 4◦C to separate the lysosomes and
mitochondria from the cytosol. After centrifugation, the supernatant of each fraction
was collected and labelled as cytosolic fractions, while the pellets from each fraction
were mixed with 400 µl PBS and labelled as lysosomal and mitochondrial fractions
(subsequent to the identification of organelle markers using western blot analyses as
described below). Both the pellet and supernatant fractions were assessed for [57Co]
Cbl radioactivity using a gamma counter, and for organelle/cytosolic markers using
western blotting. An overview of this procedure is illustrated in Figure 2.1.
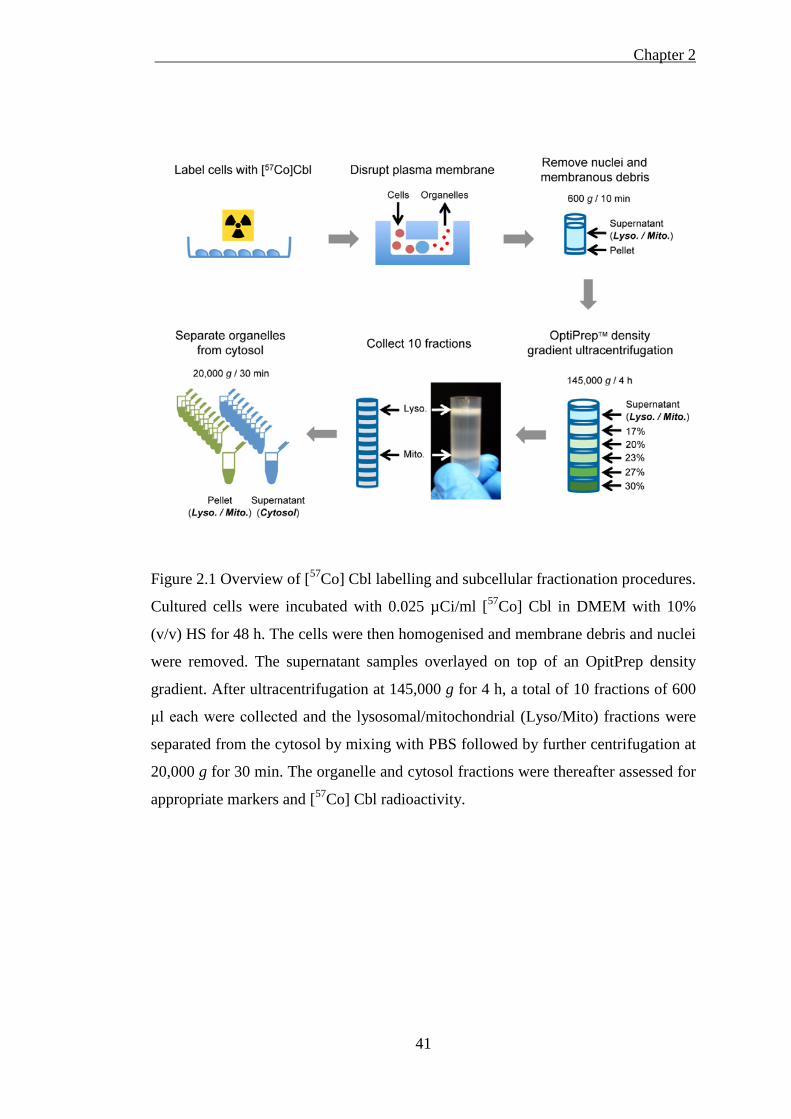
Chapter 2
41
Figure 2.1 Overview of [57Co] Cbl labelling and subcellular fractionation procedures.
Cultured cells were incubated with 0.025 µCi/ml [57Co] Cbl in DMEM with 10%
(v/v) HS for 48 h. The cells were then homogenised and membrane debris and nuclei
were removed. The supernatant samples overlayed on top of an OpitPrep density
gradient. After ultracentrifugation at 145,000 g for 4 h, a total of 10 fractions of 600
μl each were collected and the lysosomal/mitochondrial (Lyso/Mito) fractions were
separated from the cytosol by mixing with PBS followed by further centrifugation at
20,000 g for 30 min. The organelle and cytosol fractions were thereafter assessed for
appropriate markers and [57Co] Cbl radioactivity.
Chapter 2
42
2.5 Western blotting
To identify the fractions containing lysosomes, mitochondria, and cytosol, western
blot was performed using appropriate antibodies for marker proteins: lysosomes
were marked with lysosomal-associated membrane protein 2 (LAMP2, Southern
Biotech, USA); mitochondria were marked with voltage-dependent anion channel 1
(VDAC1, Abcam, USA); and cytosol was marked with β-actin (Sigma, USA) and
methionine synthase/5-methyltetrahydrofolate-homocysteine methyltransferase (MS,
Abnova, USA). Briefly, sample proteins from each fraction were separated on 12%
sodium dodecyl sulfate polyacrylamide gel electrophoresis (SDS-PAGE) gels using
a Mini-Protean II system (Bio-Rad, USA) at 150 V for 70 min and then transferred
at 100 V for 30 min onto 0.45 µm nitrocellulose membranes using a Mini-Trans-Blot
Electrophoretic Transfer cell (Bio-Rad, USA). The membranes were blocked in 5%
(w/v) non-fat milk powder in PBS for 1 h at 22◦C and then probed with an anti-
LAMP2 mouse monoclonal antibody (1:4,000), an anti-VDAC1 rabbit polyclonal
antibody (1:4,000), an anti-β-actin rabbit polyclonal antibody (1:10,000), and an
anti-MS goat polyclonal antibody (1:300) for 16 h at 4◦C. They were then incubated
with the respective horseradish-peroxidase (HRP)-conjugated goat anti-mouse
(1:4,000, Dako, Australia), goat anti-rabbit (1:4,000, Dako, Australia), and rabbit
anti-goat (1:2,000, Dako, Australia) IgG antibodies for 1 h at 22◦C. The blots were
rinsed in PBS, and the proteins were detected using enhanced chemiluminescence
(ECL, Amersham Biosciences, USA). The membranes were exposed to ECL
hyperfilm (Amersham Biosciences, USA), which was developed and scanned, and
the signal intensity was quantified using NIH Image software.
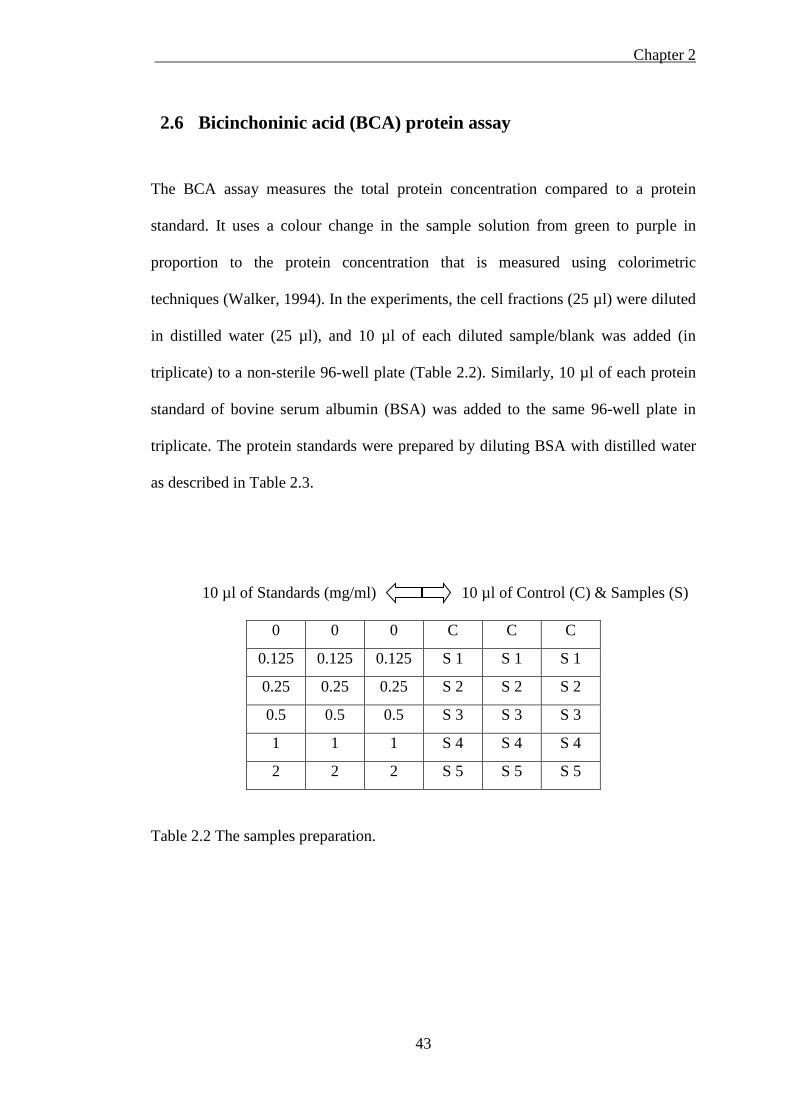
Chapter 2
43
2.6 Bicinchoninic acid (BCA) protein assay
The BCA assay measures the total protein concentration compared to a protein
standard. It uses a colour change in the sample solution from green to purple in
proportion to the protein concentration that is measured using colorimetric
techniques (Walker, 1994). In the experiments, the cell fractions (25 µl) were diluted
in distilled water (25 µl), and 10 µl of each diluted sample/blank was added (in
triplicate) to a non-sterile 96-well plate (Table 2.2). Similarly, 10 µl of each protein
standard of bovine serum albumin (BSA) was added to the same 96-well plate in
triplicate. The protein standards were prepared by diluting BSA with distilled water
as described in Table 2.3.
10 µl of Standards (mg/ml) 10 µl of Control (C) & Samples (S)
0 0 0 C C C
0.125 0.125 0.125 S 1 S 1 S 1
0.25 0.25 0.25 S 2 S 2 S 2
0.5 0.5 0.5 S 3 S 3 S 3
1 1 1 S 4 S 4 S 4
2 2 2 S 5 S 5 S 5
Table 2.2 The samples preparation.
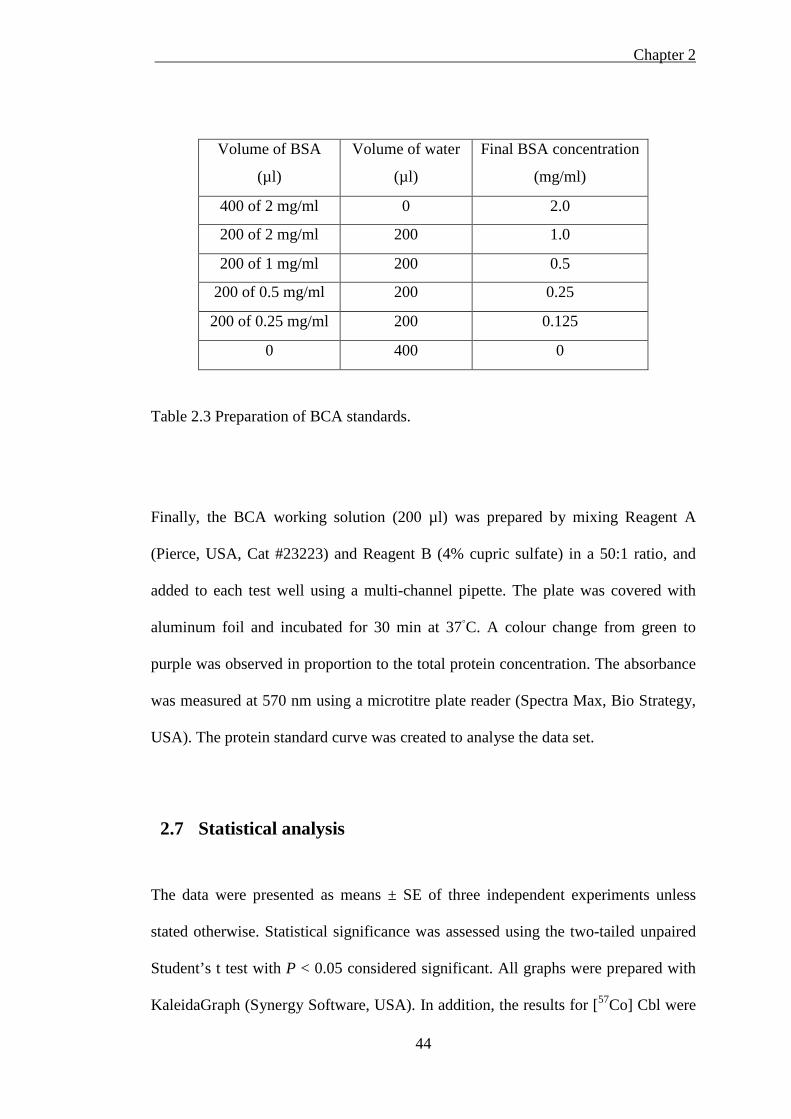
Chapter 2
44
Volume of BSA
(µl)
Volume of water
(µl)
Final BSA concentration
(mg/ml)
400 of 2 mg/ml 0 2.0
200 of 2 mg/ml 200 1.0
200 of 1 mg/ml 200 0.5
200 of 0.5 mg/ml 200 0.25
200 of 0.25 mg/ml 200 0.125
0 400 0
Table 2.3 Preparation of BCA standards.
Finally, the BCA working solution (200 µl) was prepared by mixing Reagent A
(Pierce, USA, Cat #23223) and Reagent B (4% cupric sulfate) in a 50:1 ratio, and
added to each test well using a multi-channel pipette. The plate was covered with
aluminum foil and incubated for 30 min at 37◦C. A colour change from green to
purple was observed in proportion to the total protein concentration. The absorbance
was measured at 570 nm using a microtitre plate reader (Spectra Max, Bio Strategy,
USA). The protein standard curve was created to analyse the data set.
2.7 Statistical analysis
The data were presented as means ± SE of three independent experiments unless
stated otherwise. Statistical significance was assessed using the two-tailed unpaired
Student’s t test with P < 0.05 considered significant. All graphs were prepared with
KaleidaGraph (Synergy Software, USA). In addition, the results for [57Co] Cbl were
Chapter 2
45
presented as counts per minute (cpm). The radioactive tracer molecule [57Co] Cbl
was provided by the supplier in batches of 10.5 µCi in a volume of 1 ml H2O
containing 0.9% (v/v) benzyl alcohol. On the reference date provided by the
manufacturer, 0.1 ml from each batch of [57Co] Cbl yielded 2.0 × 10⁶ cpm. After
evaporation and reconstitution in the cell culture medium (or saline for i.p.
injection), the [57Co] Cbl radioactivity was measured in a 0.1 ml aliquot to confirm
the radioactivity prior to its experimental use. For the experiments described herein,
the [57Co] Cbl tracer was routinely used within 2 months of the reference date, and
the radioactivity per 0.1 ml on the day of preparation for addition to cells or animals
was 1.52 × 10⁶ ± 0.04 × 10⁶ cpm (mean ± SE, n = 8). The values ranged from 1.37 ×
106 to 1.65 × 10⁶ cpm in these experiments. As an approximation, when 300 µCi/µg
[57Co] Cbl was used in experiments, 1,000 cpm equated to ~2.4 pg of [57Co] Cbl. In
all experiments, the [57Co] Cbl was used within two months of the reference date and
the radioactivity of [57Co] Cbl may have decreased by up to a maximum of 14%.
This decrease needs to be considered when directly comparing cpm values from
different experiments.
Chapter 3
46
Chapter 3
Development and application of
subcellular fractionation method
Chapter 3
47
Development and application of subcellular fractionation 3
method
3.1 Introduction
As reviewed in Chapter 1, once Cbl is released from the lysosome, it acts as a
coenzyme that is converted to MeCbl in the cytosol and AdoCbl in the mitochondria,
respectively. Cbl thus locates in three main intracellular compartments: lysosome,
mitochondria and cytosol. To accurately assess Cbl transit through these intracellular
compartments, it was essential to develop a fast and efficient procedure that can
separate these three compartments into fractions in which labeled Cbl can be
unambiguously quantified. The following steps were therefore processed to achieve
this purpose: (1) the fibroblast and neuronal cells were labeled with [57Co] Cbl; (2)
the cells were disrupted in a ball-bearing homogeniser; (3) the isolated organelles
were separated from the cellular membrane debris and nuclei; (4) the density-based
organelles were separated over an OptiPrep density gradient using
ultracentrifugation; (5) ten fractions were collected from the gradient; and (6) the
fractions were separated into pellet (organelle) and supernatant (cytosol) fractions.
The methodological detail for each of these steps is described in Chapter 2, section
2.2-2.4, and an overview is illustrated in Figure 2.1. The purified fractions were then
analyzed for specific organelle markers using western blotting and [57Co] Cbl
radioactivity was measured in each fraction.
Chapter 3
48
3.2 Methods
3.2.1. Western blotting
The detail for identifying the fractions containing lysosomes, mitochondria, and
cytosol using appropriate antibodies for marker proteins was described in Chapter 2,
section 2.5.
3.2.2. Acid phosphatase assay
During cell homogenisation and ultracentrifugation, lysosomal membranes are
susceptible to pressure and may be broken; thus, as a consequence, lysosomal
hydrolases may be leaked into the cytosol. Acid phosphatase is one of the acid
hydrolases that is present in lysosomes and is thus a classical marker for the
identification of lysosomes in subcellular fractionation studies. An acid phosphatase
assay kit (Sigma, USA, Cat #CS0740) was applied to detect lysosomal membrane
integrity in each fraction. Briefly, a substrate solution was prepared by dissolving
one 4-nitrophenyl phosphate tablet in 5 ml of citrate buffer, and the solution was
equilibrated at 37◦C. The standard solution was prepared by diluting 5 µl of the 10
mM nitrophenol standard solution in 995 µl of 0.5 M sodium hydroxide (NaOH).
The reaction components and samples were added to 96-well microtitre plates
according to the manufacturer’s instructions, and the samples were analysed in
triplicate. The plates were incubated for 10 min at 37◦C and then 200 µl of 0.5 M
NaOH was added to all of the wells (except the standard) to stop the reaction. The
absorbance was measured at 405 nm using a microtitre plate reader (Spectra Max,
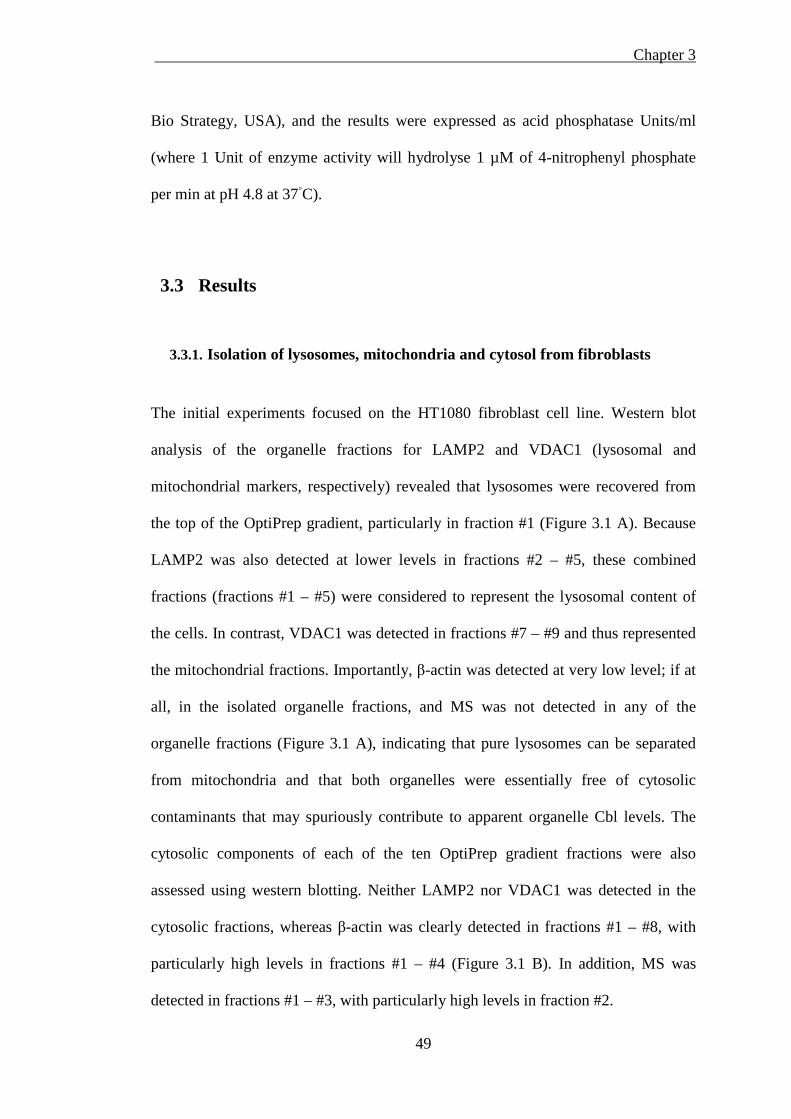
Chapter 3
49
Bio Strategy, USA), and the results were expressed as acid phosphatase Units/ml
(where 1 Unit of enzyme activity will hydrolyse 1 µM of 4-nitrophenyl phosphate
per min at pH 4.8 at 37◦C).
3.3 Results
3.3.1. Isolation of lysosomes, mitochondria and cytosol from fibroblasts
The initial experiments focused on the HT1080 fibroblast cell line. Western blot
analysis of the organelle fractions for LAMP2 and VDAC1 (lysosomal and
mitochondrial markers, respectively) revealed that lysosomes were recovered from
the top of the OptiPrep gradient, particularly in fraction #1 (Figure 3.1 A). Because
LAMP2 was also detected at lower levels in fractions #2 – #5, these combined
fractions (fractions #1 – #5) were considered to represent the lysosomal content of
the cells. In contrast, VDAC1 was detected in fractions #7 – #9 and thus represented
the mitochondrial fractions. Importantly, β-actin was detected at very low level; if at
all, in the isolated organelle fractions, and MS was not detected in any of the
organelle fractions (Figure 3.1 A), indicating that pure lysosomes can be separated
from mitochondria and that both organelles were essentially free of cytosolic
contaminants that may spuriously contribute to apparent organelle Cbl levels. The
cytosolic components of each of the ten OptiPrep gradient fractions were also
assessed using western blotting. Neither LAMP2 nor VDAC1 was detected in the
cytosolic fractions, whereas β-actin was clearly detected in fractions #1 – #8, with
particularly high levels in fractions #1 – #4 (Figure 3.1 B). In addition, MS was
detected in fractions #1 – #3, with particularly high levels in fraction #2.
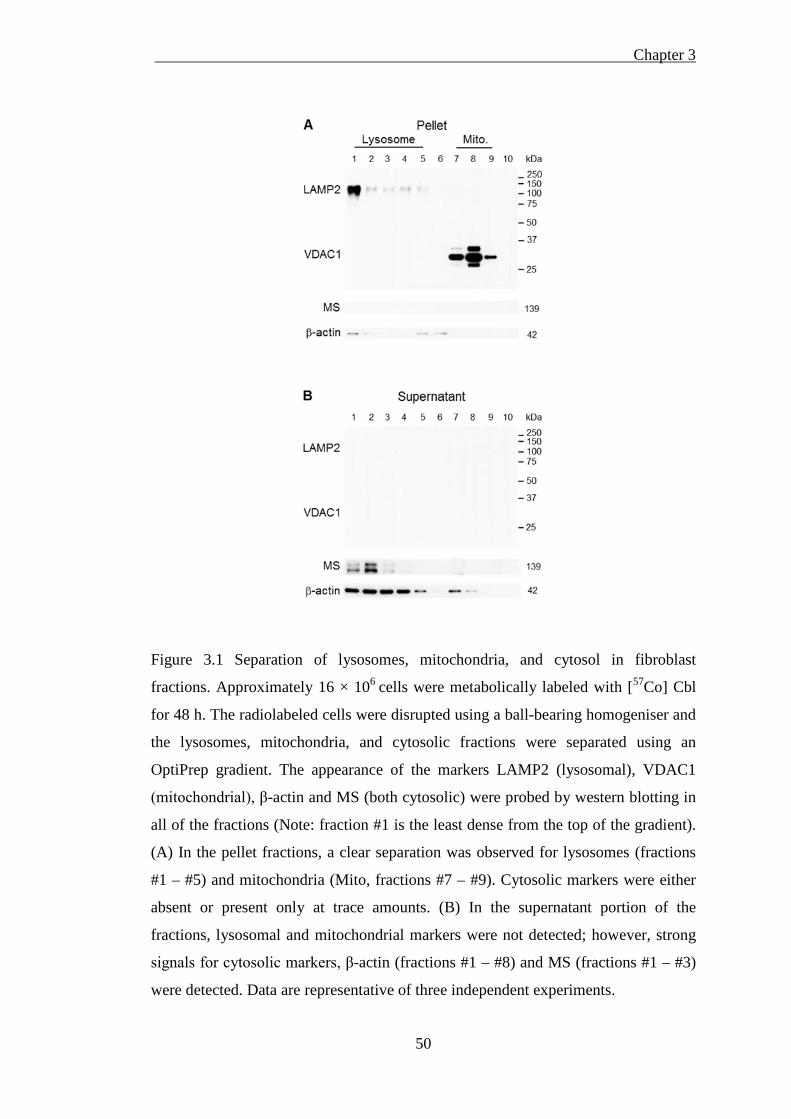
Chapter 3
50
Figure 3.1 Separation of lysosomes, mitochondria, and cytosol in fibroblast
fractions. Approximately 16 × 106 cells were metabolically labeled with [57Co] Cbl
for 48 h. The radiolabeled cells were disrupted using a ball-bearing homogeniser and
the lysosomes, mitochondria, and cytosolic fractions were separated using an
OptiPrep gradient. The appearance of the markers LAMP2 (lysosomal), VDAC1
(mitochondrial), β-actin and MS (both cytosolic) were probed by western blotting in
all of the fractions (Note: fraction #1 is the least dense from the top of the gradient).
(A) In the pellet fractions, a clear separation was observed for lysosomes (fractions
#1 – #5) and mitochondria (Mito, fractions #7 – #9). Cytosolic markers were either
absent or present only at trace amounts. (B) In the supernatant portion of the
fractions, lysosomal and mitochondrial markers were not detected; however, strong
signals for cytosolic markers, β-actin (fractions #1 – #8) and MS (fractions #1 – #3)
were detected. Data are representative of three independent experiments.
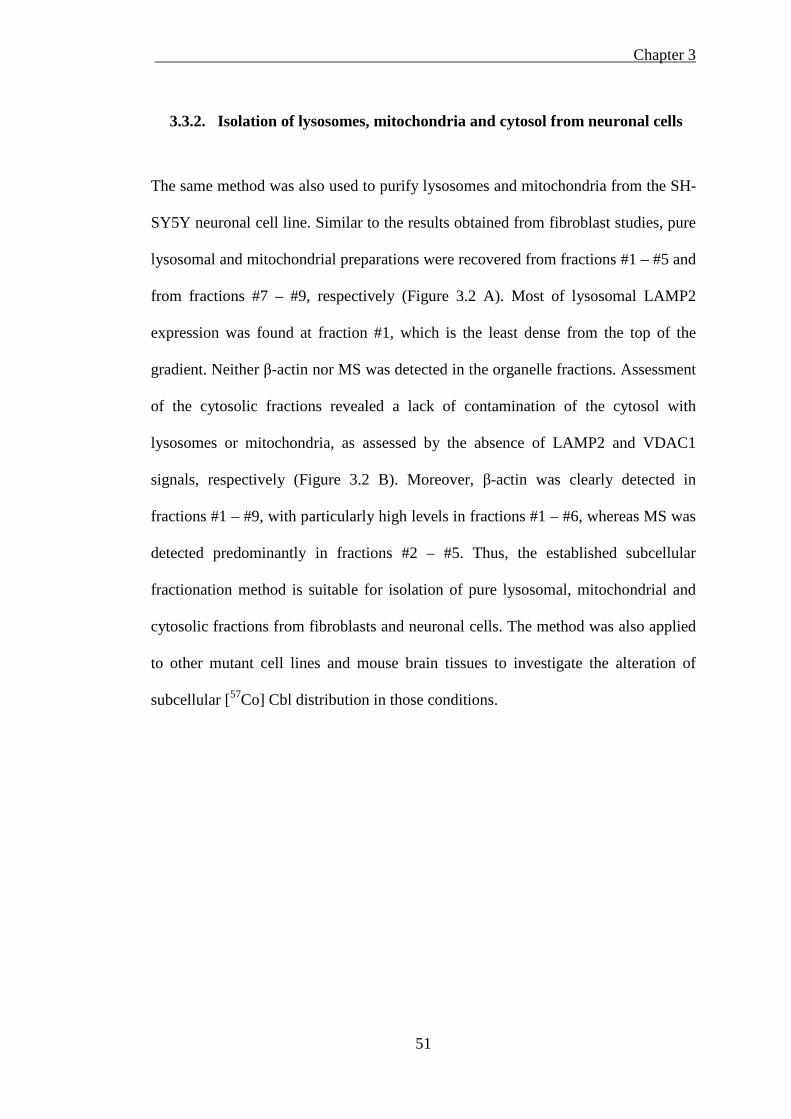
Chapter 3
51
3.3.2. Isolation of lysosomes, mitochondria and cytosol from neuronal cells
The same method was also used to purify lysosomes and mitochondria from the SH-
SY5Y neuronal cell line. Similar to the results obtained from fibroblast studies, pure
lysosomal and mitochondrial preparations were recovered from fractions #1 – #5 and
from fractions #7 – #9, respectively (Figure 3.2 A). Most of lysosomal LAMP2
expression was found at fraction #1, which is the least dense from the top of the
gradient. Neither β-actin nor MS was detected in the organelle fractions. Assessment
of the cytosolic fractions revealed a lack of contamination of the cytosol with
lysosomes or mitochondria, as assessed by the absence of LAMP2 and VDAC1
signals, respectively (Figure 3.2 B). Moreover, β-actin was clearly detected in
fractions #1 – #9, with particularly high levels in fractions #1 – #6, whereas MS was
detected predominantly in fractions #2 – #5. Thus, the established subcellular
fractionation method is suitable for isolation of pure lysosomal, mitochondrial and
cytosolic fractions from fibroblasts and neuronal cells. The method was also applied
to other mutant cell lines and mouse brain tissues to investigate the alteration of
subcellular [57Co] Cbl distribution in those conditions.
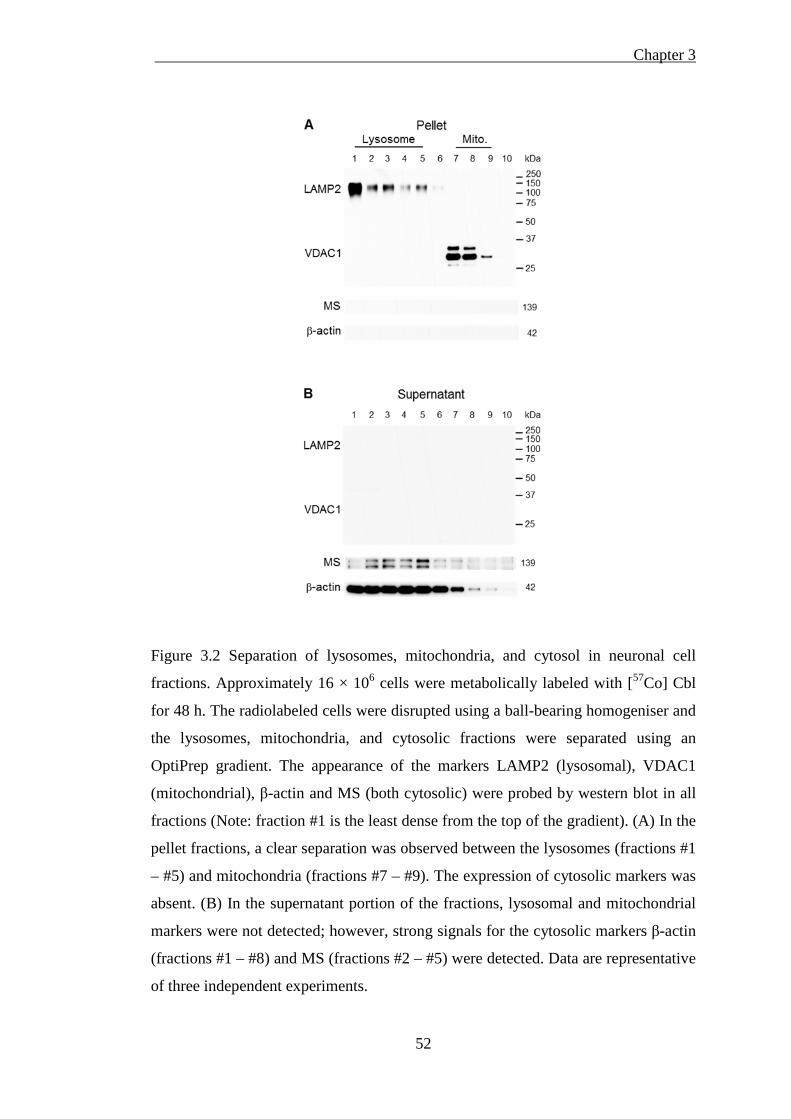
Chapter 3
52
Figure 3.2 Separation of lysosomes, mitochondria, and cytosol in neuronal cell
fractions. Approximately 16 × 106 cells were metabolically labeled with [57Co] Cbl
for 48 h. The radiolabeled cells were disrupted using a ball-bearing homogeniser and
the lysosomes, mitochondria, and cytosolic fractions were separated using an
OptiPrep gradient. The appearance of the markers LAMP2 (lysosomal), VDAC1
(mitochondrial), β-actin and MS (both cytosolic) were probed by western blot in all
fractions (Note: fraction #1 is the least dense from the top of the gradient). (A) In the
pellet fractions, a clear separation was observed between the lysosomes (fractions #1
– #5) and mitochondria (fractions #7 – #9). The expression of cytosolic markers was
absent. (B) In the supernatant portion of the fractions, lysosomal and mitochondrial
markers were not detected; however, strong signals for the cytosolic markers β-actin
(fractions #1 – #8) and MS (fractions #2 – #5) were detected. Data are representative
of three independent experiments.
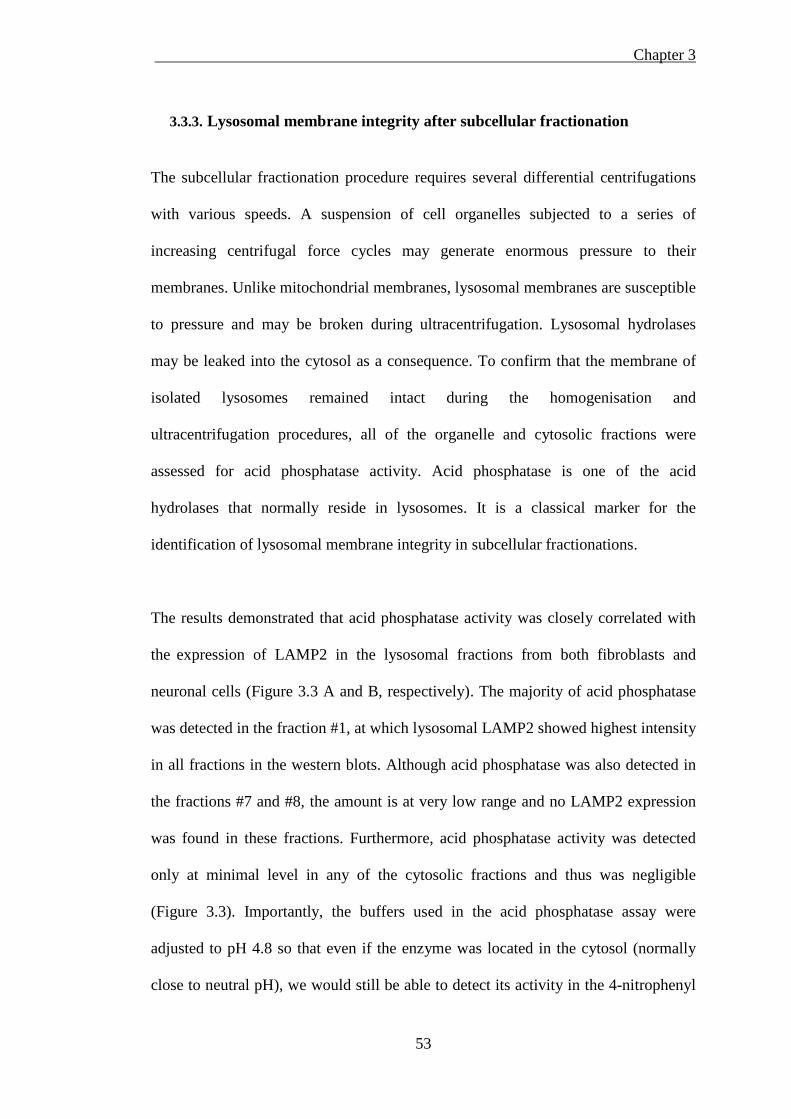
Chapter 3
53
3.3.3. Lysosomal membrane integrity after subcellular fractionation
The subcellular fractionation procedure requires several differential centrifugations
with various speeds. A suspension of cell organelles subjected to a series of
increasing centrifugal force cycles may generate enormous pressure to their
membranes. Unlike mitochondrial membranes, lysosomal membranes are susceptible
to pressure and may be broken during ultracentrifugation. Lysosomal hydrolases
may be leaked into the cytosol as a consequence. To confirm that the membrane of
isolated lysosomes remained intact during the homogenisation and
ultracentrifugation procedures, all of the organelle and cytosolic fractions were
assessed for acid phosphatase activity. Acid phosphatase is one of the acid
hydrolases that normally reside in lysosomes. It is a classical marker for the
identification of lysosomal membrane integrity in subcellular fractionations.
The results demonstrated that acid phosphatase activity was closely correlated with
the expression of LAMP2 in the lysosomal fractions from both fibroblasts and
neuronal cells (Figure 3.3 A and B, respectively). The majority of acid phosphatase
was detected in the fraction #1, at which lysosomal LAMP2 showed highest intensity
in all fractions in the western blots. Although acid phosphatase was also detected in
the fractions #7 and #8, the amount is at very low range and no LAMP2 expression
was found in these fractions. Furthermore, acid phosphatase activity was detected
only at minimal level in any of the cytosolic fractions and thus was negligible
(Figure 3.3). Importantly, the buffers used in the acid phosphatase assay were
adjusted to pH 4.8 so that even if the enzyme was located in the cytosol (normally
close to neutral pH), we would still be able to detect its activity in the 4-nitrophenyl
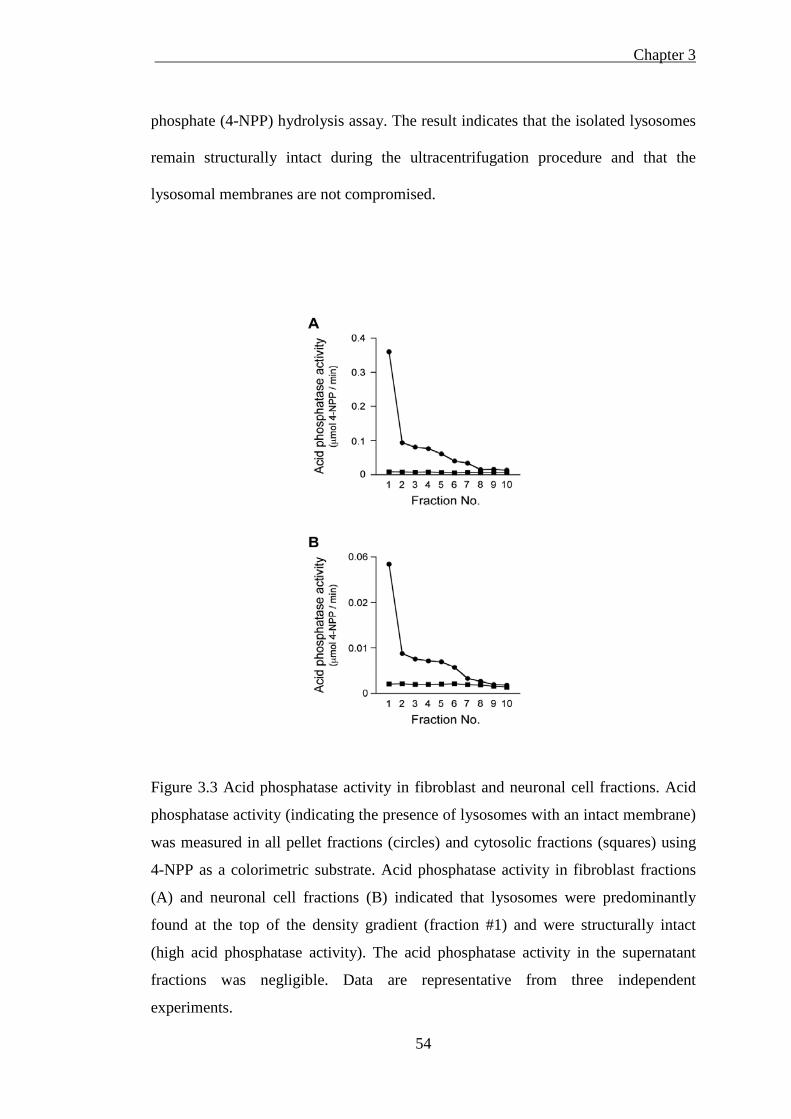
Chapter 3
54
phosphate (4-NPP) hydrolysis assay. The result indicates that the isolated lysosomes
remain structurally intact during the ultracentrifugation procedure and that the
lysosomal membranes are not compromised.
Figure 3.3 Acid phosphatase activity in fibroblast and neuronal cell fractions. Acid
phosphatase activity (indicating the presence of lysosomes with an intact membrane)
was measured in all pellet fractions (circles) and cytosolic fractions (squares) using
4-NPP as a colorimetric substrate. Acid phosphatase activity in fibroblast fractions
(A) and neuronal cell fractions (B) indicated that lysosomes were predominantly
found at the top of the density gradient (fraction #1) and were structurally intact
(high acid phosphatase activity). The acid phosphatase activity in the supernatant
fractions was negligible. Data are representative from three independent
experiments.
Chapter 3
55
3.4 Discussion
In the present study I developed a [57Co] Cbl metabolic labeling / subcellular
fractionation method that permits the separation of the two major pools of
intracellular Cbl (in the cytosol and mitochondria) from the presumably more
transient lysosomal pool. Subcellular fractionation by differential centrifugation was
first described in 1955 (De Duve et al., 1955) and has subsequently been applied for
isolating organelles from various cultured cells and tissues (Maric et al., 1994;
Ferrari et al., 1997; Nothwang et al., 2003). However, those early studies lacked of
detailed evidence whether the isolated organelle fractions were free of contamination
from other organelles. Without this prerequisite, any result from further
measurement or test was questionable. The current method builds on many previous
studies that have separately analysed cellular [57Co] Cbl metabolism in cells and
mice (Mellman et al., 1978; Youngdahl-Turner et al., 1978; Yassin et al., 2000;
Hannibal et al., 2008; Yamani et al., 2008) or aspects of lysosome function in cells
and mice (Manunta et al., 2007; Yang et al., 2011). The isolated lysosomal,
mitochondrial and cytosolic fractions from this method were examined by
appropriate antibodies for marker proteins to confirm that every single fraction was
purified.
During ultracentrifugation, the loaded cell organelles on the top of the gradient move
down through the density gradient. Cell organelles with different densities or sizes in
a suspension will sediment at different rates, with the larger and denser particles, e.g.
mitochondria, moving faster. Because the density of the mitochondria is greater than
the density of the gradient, all the mitochondria will eventually move down and form
Chapter 3
56
a solid pellet zone at the lower level of the gradient. The majority of lysosomes with
lighter density, on the other hand, will stay up on the top of the gradient (Figure 2.1).
However, the morphology and density of lysosomes varies depending on the cell and
tissue source. A couple of fractions close to at the lower level of the gradient may
contain both lysosomes and mitochondria in some cases. This may be due to small
amount of specific lysosomes that have similar density with light mitochondria and
sediment together in the standard condition, or when lysosomal function is inhibited,
or in some pathological conditions where lysosomal autophagy is activated and up-
regulated, resulting in more autophagic vacuoles formation to increase the density of
lysosomes. Therefore, it is necessary to optimize the gradient concentration,
centrifugation speed and time for desired results.
Lysosomes maintain cellular homeostasis by continually degrading cellular waste,
dysfunctional organelles and potential toxic protein aggregates. An intact lysosomal
membrane provides the barrier necessary to maintain such a low pH environment
compared with the neutral pH of the surrounding cytosol. Thus, it is essential to
maintain lysosomal membrane integrity after subcellular fractionation. The results
from acid phosphatase activity indicate that the majority of isolated lysosomes
remained structurally intact. It is noteworthy that a lower level in acid phosphatase
activity was present with the major mitochondrial fraction (Fraction #7 and #8).
LAMP2 expression was not detected in these fractions so lysosomal contamination
seems unlikely. One possible explanation could be that one or more of the several
known mitochondrial phosphatases may have residual activity at pH 4.8 and thus act
upon the 4-NPP is our assay (McBride et al., 2006).
Chapter 3
57
3.5 Conclusion
The development of subcellular fractionation method provides a useful tool for
isolating purified lysosomes, mitochondria and cytosol. It is a prerequisite procedure
before further investigating intracellular [57Co] Cbl trafficking in fibroblast and
neuronal cell lines. Using this method I will also assess cell lines and animal models
that are known to have impaired lysosomal function due to, for example,
accumulation of the age-related pigment lipofuscin, substrate accumulation in
lysosomal storage diseases, and accumulation of AD-derived Aβ. Future studies may
adapt the method to assess subcellular distribution of other specific metals and their
impact on lysosomes and mitochondria in vitro and in vivo.
Chapter 4
58
Chapter 4
Impaired lysosomal function inhibits
lysosomal cobalamin transport
Chapter 4
59
Impaired lysosomal function inhibits lysosomal cobalamin 4
transport
4.1 Subcellular [57Co] Cbl distribution in the standard culture
condition
4.1.1. Introduction
As reviewed in Chapter 1, Cbl utilisation as an enzyme cofactor is dependent on its
efficient transit through lysosomes to the cytosol and mitochondria. I propose that
pathophysiological perturbations in lysosomal function may inhibit intracellular Cbl
transport with consequences for down-stream metabolic pathways. Having
established subcellular fractionation method for the isolation of pure lysosomes,
mitochondria and cytosol, I will use both HT1080 fibroblast and SH-SY5Y neuronal
cells to address fundamental questions related to lysosomal Cbl transport. The
subcellular distribution of [57Co] Cbl is assessed in the standard cultured fibroblasts
and neuronal cells subsequent to a [57Co] Cbl metabolic radiolabelling. Several trial
experiments are conducted to optimise the conditions for [57Co] Cbl incorporation in
these cells before performing [57Co] Cbl metabolic labeling / subcellular
fractionation.
4.1.2. Results
Chapter 4
60
4.1.2.1 The effect of serum on [57Co] Cbl incorporation into the cells
The concentration of 0.025 µCi/ml [57Co] Cbl was applied to all experiments as
suggested in trial experiments and previous studies (Moras et al., 2007; Hannibal et
al., 2009). Cbl cellular uptake requires metabolically active Cbl transporter TC from
the serum delivering to the cell surface, where specific cell membrane receptors are
expressed and carry the TC-Cbl complex into the cells. Mixed previous reports
suggest that [57Co] Cbl incorporation into cells takes place from the medium
containing either FCS (Rosenberg et al., 1975; Berliner and Rosenberg, 1981;
Hannibal et al., 2009) or HS (Mellman et al., 1978; Amagasaki et al., 1990; Moras et
al., 2007). In the current experiment, The SH-SY5Y cells were seeded into 6-well
cell culture plates and incubated with 0.025 µCi/ml [57Co] Cbl in DMEM containing
either 10% (v/v) FCS or 10% (v/v) HS for 48 h at 37˚C. The cells were collected and
measured for radioactivity after incubation. It was observed that FCS substantially
reduced the incorporation of [57Co] Cbl into cells (Figure 4.1), whereas HS promoted
[57Co] Cbl uptake into cells and thus HS was applied to all experiments.
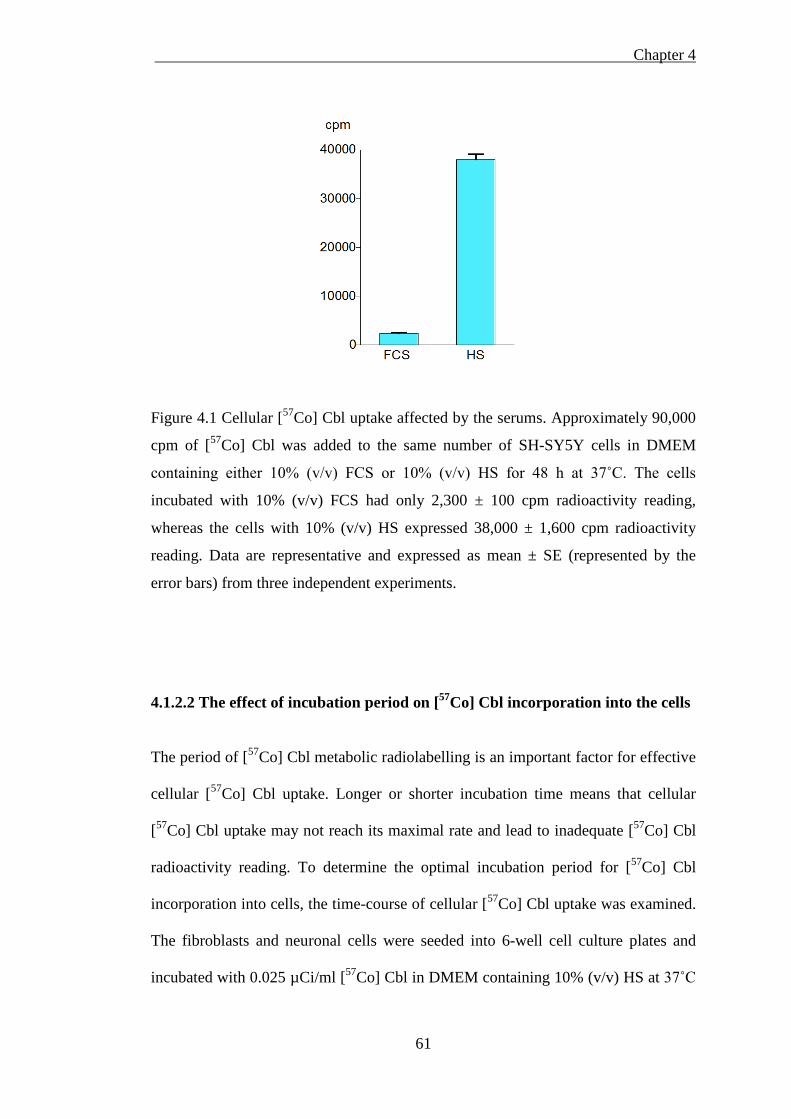
Chapter 4
61
Figure 4.1 Cellular [57Co] Cbl uptake affected by the serums. Approximately 90,000
cpm of [57Co] Cbl was added to the same number of SH-SY5Y cells in DMEM
containing either 10% (v/v) FCS or 10% (v/v) HS for 48 h at 37˚C. The cells
incubated with 10% (v/v) FCS had only 2,300 ± 100 cpm radioactivity reading,
whereas the cells with 10% (v/v) HS expressed 38,000 ± 1,600 cpm radioactivity
reading. Data are representative and expressed as mean ± SE (represented by the
error bars) from three independent experiments.
4.1.2.2 The effect of incubation period on [57Co] Cbl incorporation into the cells
The period of [57Co] Cbl metabolic radiolabelling is an important factor for effective
cellular [57Co] Cbl uptake. Longer or shorter incubation time means that cellular
[57Co] Cbl uptake may not reach its maximal rate and lead to inadequate [57Co] Cbl
radioactivity reading. To determine the optimal incubation period for [57Co] Cbl
incorporation into cells, the time-course of cellular [57Co] Cbl uptake was examined.
The fibroblasts and neuronal cells were seeded into 6-well cell culture plates and
incubated with 0.025 µCi/ml [57Co] Cbl in DMEM containing 10% (v/v) HS at 37˚C
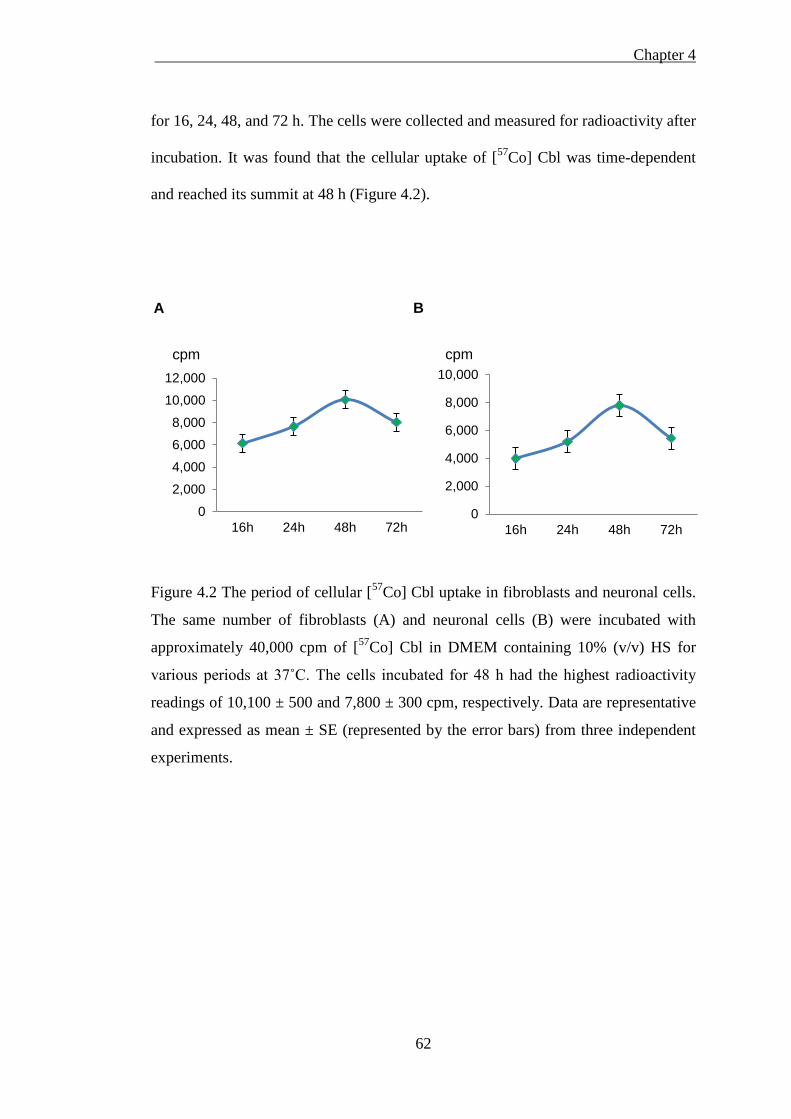
Chapter 4
62
for 16, 24, 48, and 72 h. The cells were collected and measured for radioactivity after
incubation. It was found that the cellular uptake of [57Co] Cbl was time-dependent
and reached its summit at 48 h (Figure 4.2).
Figure 4.2 The period of cellular [57Co] Cbl uptake in fibroblasts and neuronal cells.
The same number of fibroblasts (A) and neuronal cells (B) were incubated with
approximately 40,000 cpm of [57Co] Cbl in DMEM containing 10% (v/v) HS for
various periods at 37˚C. The cells incubated for 48 h had the highest radioactivity
readings of 10,100 ± 500 and 7,800 ± 300 cpm, respectively. Data are representative
and expressed as mean ± SE (represented by the error bars) from three independent
experiments.
0
2,000
4,000
6,000
8,000
10,000
12,000
16h 24h 48h 72h
cpm
0
2,000
4,000
6,000
8,000
10,000
16h 24h 48h 72h
cpm
A B
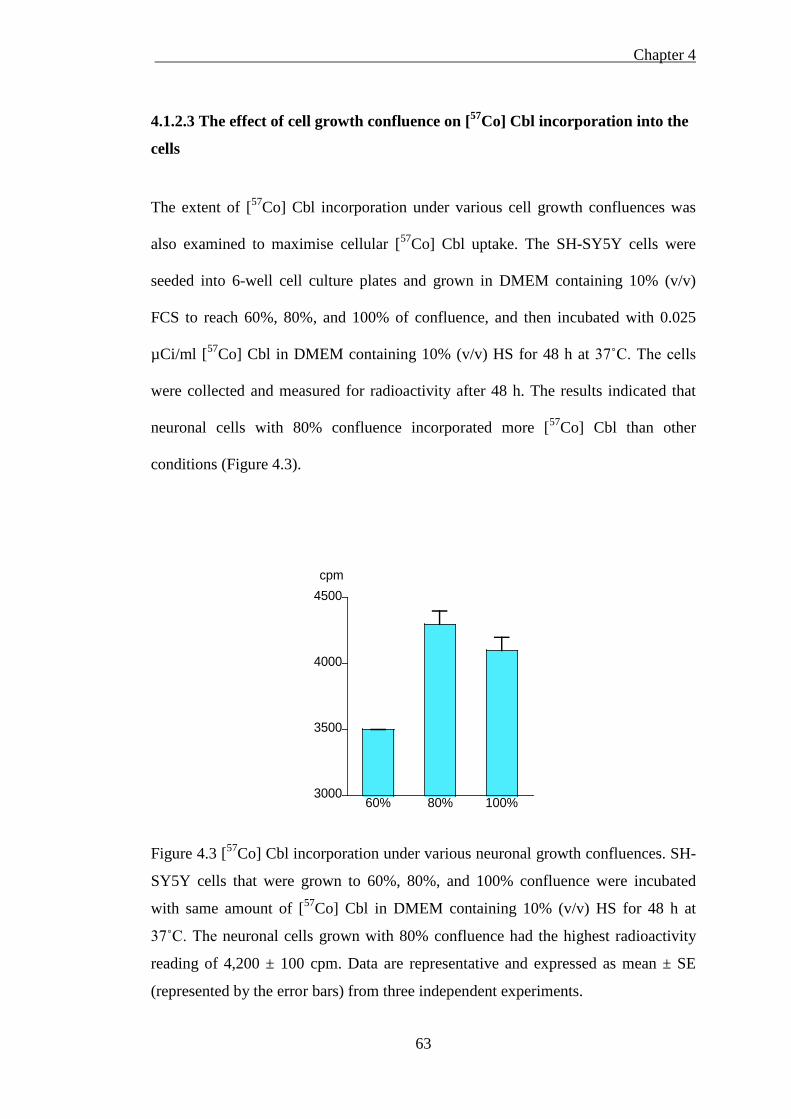
Chapter 4
63
4.1.2.3 The effect of cell growth confluence on [57Co] Cbl incorporation into the
cells
The extent of [57Co] Cbl incorporation under various cell growth confluences was
also examined to maximise cellular [57Co] Cbl uptake. The SH-SY5Y cells were
seeded into 6-well cell culture plates and grown in DMEM containing 10% (v/v)
FCS to reach 60%, 80%, and 100% of confluence, and then incubated with 0.025
µCi/ml [57Co] Cbl in DMEM containing 10% (v/v) HS for 48 h at 37˚C. The cells
were collected and measured for radioactivity after 48 h. The results indicated that
neuronal cells with 80% confluence incorporated more [57Co] Cbl than other
conditions (Figure 4.3).
Figure 4.3 [57Co] Cbl incorporation under various neuronal growth confluences. SH-
SY5Y cells that were grown to 60%, 80%, and 100% confluence were incubated
with same amount of [57Co] Cbl in DMEM containing 10% (v/v) HS for 48 h at
37˚C. The neuronal cells grown with 80% confluence had the highest radioactivity
reading of 4,200 ± 100 cpm. Data are representative and expressed as mean ± SE
(represented by the error bars) from three independent experiments.
3000
3500
4000
4500
60% 80% 100%
cpm
Chapter 4
64
4.1.2.4 Isolated cellular fractions probed by western blotting
Once the optimal conditions for cellular [57Co] Cbl uptake were determined, I
assessed subcellular [57Co] Cbl distribution in the cultured fibroblasts and neuronal
cells based on those conditions. Both cells were grown to reach 80% confluence and
then incubated with 0.025 µCi/ml [57Co] Cbl in DMEM containing 10% (v/v) HS for
48 h at 37◦C. The cells were then homogenised and cell fractions were collected,
followed by subcellular fractionation as described previously (Chapter 2, section
2.4). Isolated cellular fractions containing lysosomes, mitochondria, and cytosol
were probed for appropriate organelle markers by western blotting: lysosome:
LAMP2; mitochondria: VDAC1; and cytosol: MS.
Consistent with the results from the established methods in Chapter 3, the separation
of fibroblast and neuronal cell organelles through an OptiPrep gradient yielded pure
lysosomes (LAMP2-positive fractions #1 – #5 and #1 – #6, respectively) and
mitochondria (VDAC1-positive fractions #7 – #9) as demonstrated by western
blotting (Figure 4.4 A and B). Neither LAMP2 nor VDAC1 signal was detected in
the cytosolic fractions (Data are not shown). The organelle fractions were free of
detectable MS whereas a clear MS signal was detected in the cytosolic fractions (#1
– #5).
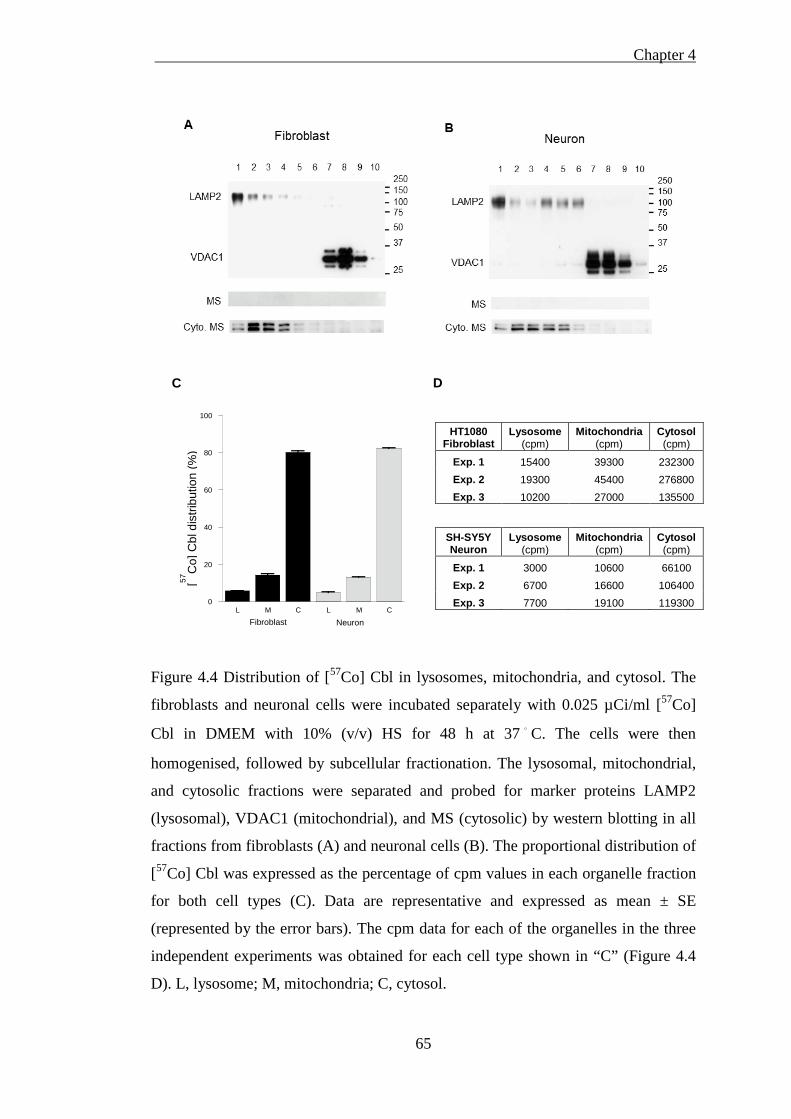
Chapter 4
65
Figure 4.4 Distribution of [57Co] Cbl in lysosomes, mitochondria, and cytosol. The
fibroblasts and neuronal cells were incubated separately with 0.025 µCi/ml [57Co]
Cbl in DMEM with 10% (v/v) HS for 48 h at 37 ◦ C. The cells were then
homogenised, followed by subcellular fractionation. The lysosomal, mitochondrial,
and cytosolic fractions were separated and probed for marker proteins LAMP2
(lysosomal), VDAC1 (mitochondrial), and MS (cytosolic) by western blotting in all
fractions from fibroblasts (A) and neuronal cells (B). The proportional distribution of
[57Co] Cbl was expressed as the percentage of cpm values in each organelle fraction
for both cell types (C). Data are representative and expressed as mean ± SE
(represented by the error bars). The cpm data for each of the organelles in the three
independent experiments was obtained for each cell type shown in “C” (Figure 4.4
D). L, lysosome; M, mitochondria; C, cytosol.
HT1080 Fibroblast
Lysosome (cpm)
Mitochondria (cpm)
Cytosol (cpm)
Exp. 1 15400 39300 232300 Exp. 2 19300 45400 276800 Exp. 3 10200 27000 135500
SH-SY5Y Neuron
Lysosome (cpm)
Mitochondria (cpm)
Cytosol (cpm)
Exp. 1 3000 10600 66100 Exp. 2 6700 16600 106400 Exp. 3 7700 19100 119300 0
20
40
60
80
100
L M C L M C
Fibroblast
Neuron
[57C
o] C
bl d
istri
butio
n (%
)
C D
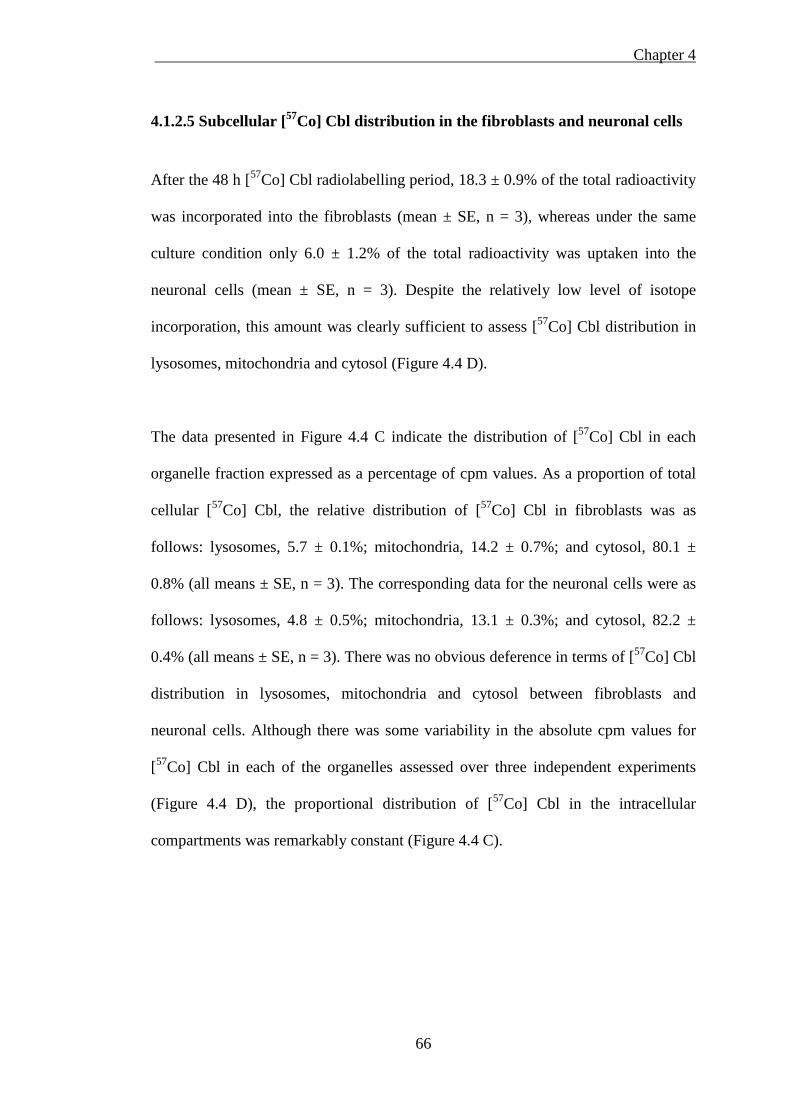
Chapter 4
66
4.1.2.5 Subcellular [57Co] Cbl distribution in the fibroblasts and neuronal cells
After the 48 h [57Co] Cbl radiolabelling period, 18.3 ± 0.9% of the total radioactivity
was incorporated into the fibroblasts (mean ± SE, n = 3), whereas under the same
culture condition only 6.0 ± 1.2% of the total radioactivity was uptaken into the
neuronal cells (mean ± SE, n = 3). Despite the relatively low level of isotope
incorporation, this amount was clearly sufficient to assess [57Co] Cbl distribution in
lysosomes, mitochondria and cytosol (Figure 4.4 D).
The data presented in Figure 4.4 C indicate the distribution of [57Co] Cbl in each
organelle fraction expressed as a percentage of cpm values. As a proportion of total
cellular [57Co] Cbl, the relative distribution of [57Co] Cbl in fibroblasts was as
follows: lysosomes, 5.7 ± 0.1%; mitochondria, 14.2 ± 0.7%; and cytosol, 80.1 ±
0.8% (all means ± SE, n = 3). The corresponding data for the neuronal cells were as
follows: lysosomes, 4.8 ± 0.5%; mitochondria, 13.1 ± 0.3%; and cytosol, 82.2 ±
0.4% (all means ± SE, n = 3). There was no obvious deference in terms of [57Co] Cbl
distribution in lysosomes, mitochondria and cytosol between fibroblasts and
neuronal cells. Although there was some variability in the absolute cpm values for
[57Co] Cbl in each of the organelles assessed over three independent experiments
(Figure 4.4 D), the proportional distribution of [57Co] Cbl in the intracellular
compartments was remarkably constant (Figure 4.4 C).
Chapter 4
67
4.2 Lysosomal pH alteration interrupts lysosomal [57Co] Cbl
transport
4.2.1. Introduction
Early studies described the defective transfer of lysosomal Cbl to the cytosol in
fibroblasts derived from a human patient with inborn error of Cbl metabolism,
chloroquine was used to retard intralysosomal proteolysis in control fibroblasts in
order to model lysosomal Cbl trapping (Rosenblatt et al., 1985). The maintenance of
acidic pH and efficient protease activity is critical for lysosomal Cbl transport.
Chloroquine, a traditional anti-malarial drug, raises intralysosomal pH above its
physical level by disrupting the H+ gradient across the lysosomal membrane and
thereby neutralising the normally acidic lysosomal pH (Gonzalez-Noriega et al.,
1980). Chloroquine alters the lysosomal acidic compartments, causes inhibition of
lysosomal hydrolase activities, and induces accumulation of autophagosomes (Geng
et al., 2010), which prevents the release of Cbl from TC and also blocks the transport
of lysosomal Cbl to both MS and MMCM (Rosenblatt et al., 1985).
The acidic pH of the lysosome also influenced the conversion of Cbl from the “base-
on” to “base-off” state, i.e. the interaction of the dimethylbenzimidazole moiety of
the Cbl molecule with the central Co atom (Banerjee, 2006). The Cbl base-off state
is thought to be important for subsequent interactions of Cbl with cytosolic cargo
proteins. Thus, it is possible that chloroquine could at least partly inhibit Cbl
intracellular transport by blocking its conversion to the base-off state. In addition,
chloroquine-treated cells under transmission electron microscope showed a changed
Chapter 4
68
lysosomal morphology with increased enlarged multilaminar autophagic vacuole
formation in the cytoplasm (Myers et al., 1995). This effect was dose-dependent and
was more pronounced with the higher doses. In the present study, I utilised both
fibroblast and neuronal cells and investigated the effect of chloroquine treatment on
their lysosomal Cbl transport.
4.2.2. Methods
4.2.2.1 Inhibition of lysosomal function with chloroquine
As chloroquine at high concentration is toxic to cells and an overdose of chloroquine
may be lethal, the optimal concentration of chloroquine treatment was determined
before cellular [57Co] Cbl radiolabeling. The fibroblasts were incubated with
chloroquine (Sigma, USA, Cat #C6628) at different concentrations in DMEM with
10% (v/v) FCS for 48 h at 37◦C. The cellular viability was assessed by 3-[4,5-
dimethylthiazol-2-yl]-2,5 diphenyl tetrazolium bromide (MTT) assay and 1% (w/v)
trypan blue cell staining. Once the concentration of chloroquine was determined, the
fibroblasts and SH-SY5Y cells were incubated separately with 0.025 µCi/ml [57Co]
Cbl in DMEM containing 10% (v/v) HS in the presence of chloroquine (25 µM) for
48 h at 37◦C. The cells were then homogenised and cell fractions were collected,
followed by subcellular fractionation as described previously (Chapter 2, section
2.4).
4.2.2.2 Western blotting
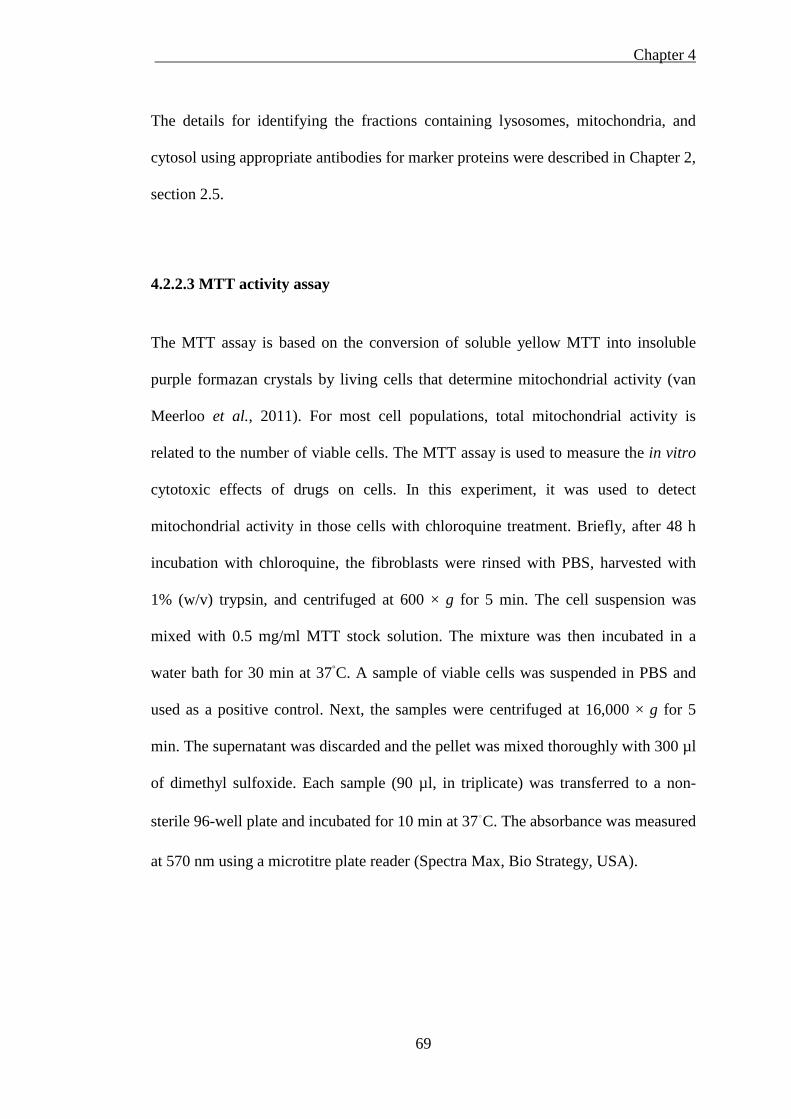
Chapter 4
69
The details for identifying the fractions containing lysosomes, mitochondria, and
cytosol using appropriate antibodies for marker proteins were described in Chapter 2,
section 2.5.
4.2.2.3 MTT activity assay
The MTT assay is based on the conversion of soluble yellow MTT into insoluble
purple formazan crystals by living cells that determine mitochondrial activity (van
Meerloo et al., 2011). For most cell populations, total mitochondrial activity is
related to the number of viable cells. The MTT assay is used to measure the in vitro
cytotoxic effects of drugs on cells. In this experiment, it was used to detect
mitochondrial activity in those cells with chloroquine treatment. Briefly, after 48 h
incubation with chloroquine, the fibroblasts were rinsed with PBS, harvested with
1% (w/v) trypsin, and centrifuged at 600 × g for 5 min. The cell suspension was
mixed with 0.5 mg/ml MTT stock solution. The mixture was then incubated in a
water bath for 30 min at 37◦C. A sample of viable cells was suspended in PBS and
used as a positive control. Next, the samples were centrifuged at 16,000 × g for 5
min. The supernatant was discarded and the pellet was mixed thoroughly with 300 µl
of dimethyl sulfoxide. Each sample (90 µl, in triplicate) was transferred to a non-
sterile 96-well plate and incubated for 10 min at 37◦C. The absorbance was measured
at 570 nm using a microtitre plate reader (Spectra Max, Bio Strategy, USA).
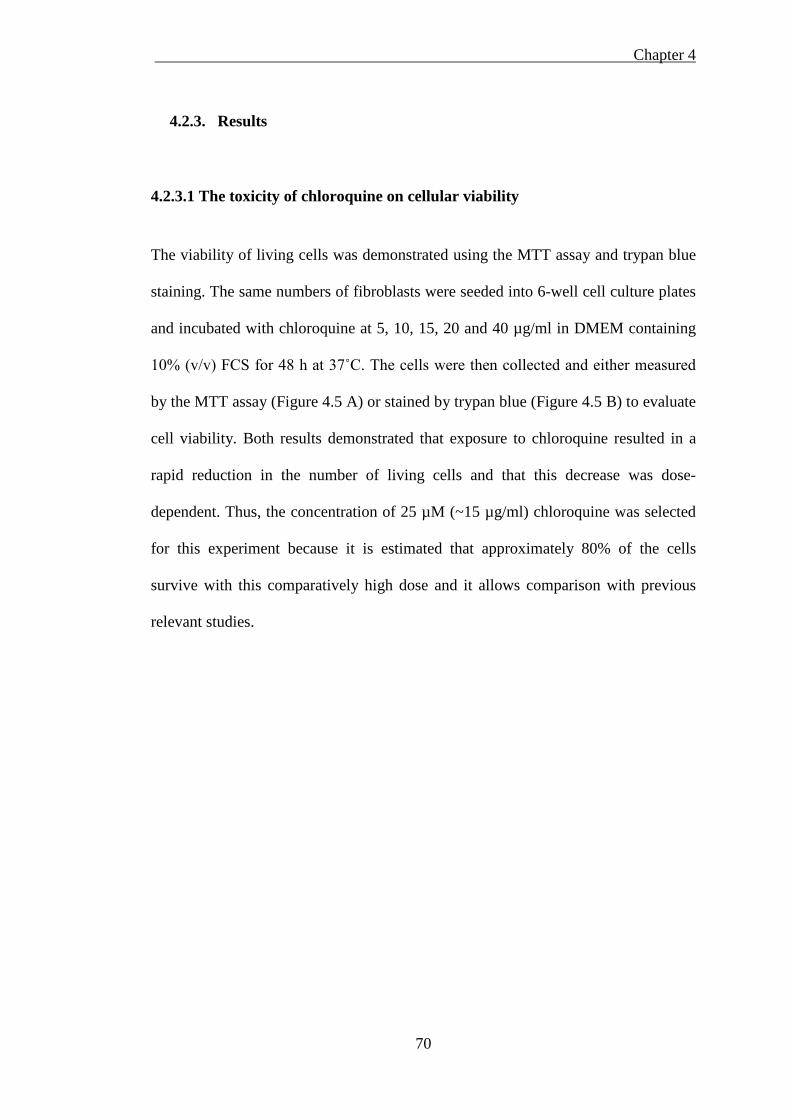
Chapter 4
70
4.2.3. Results
4.2.3.1 The toxicity of chloroquine on cellular viability
The viability of living cells was demonstrated using the MTT assay and trypan blue
staining. The same numbers of fibroblasts were seeded into 6-well cell culture plates
and incubated with chloroquine at 5, 10, 15, 20 and 40 µg/ml in DMEM containing
10% (v/v) FCS for 48 h at 37˚C. The cells were then collected and either measured
by the MTT assay (Figure 4.5 A) or stained by trypan blue (Figure 4.5 B) to evaluate
cell viability. Both results demonstrated that exposure to chloroquine resulted in a
rapid reduction in the number of living cells and that this decrease was dose-
dependent. Thus, the concentration of 25 µM (~15 µg/ml) chloroquine was selected
for this experiment because it is estimated that approximately 80% of the cells
survive with this comparatively high dose and it allows comparison with previous
relevant studies.
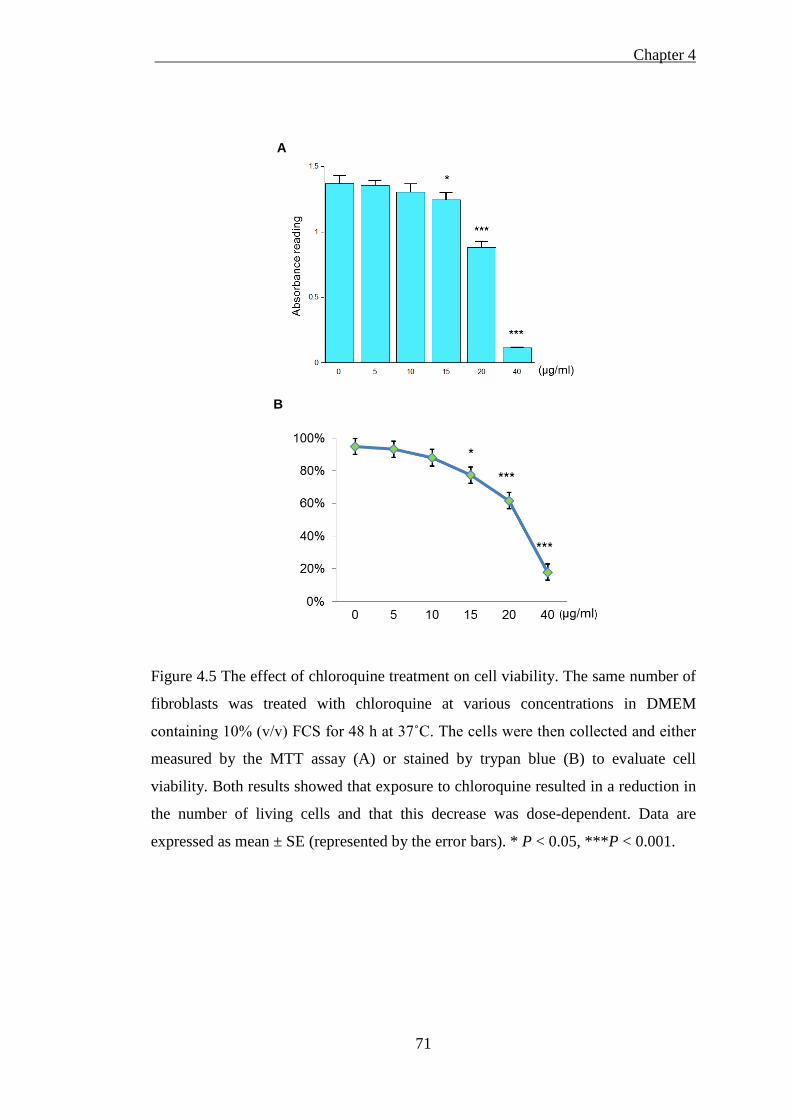
Chapter 4
71
Figure 4.5 The effect of chloroquine treatment on cell viability. The same number of
fibroblasts was treated with chloroquine at various concentrations in DMEM
containing 10% (v/v) FCS for 48 h at 37˚C. The cells were then collected and either
measured by the MTT assay (A) or stained by trypan blue (B) to evaluate cell
viability. Both results showed that exposure to chloroquine resulted in a reduction in
the number of living cells and that this decrease was dose-dependent. Data are
expressed as mean ± SE (represented by the error bars). * P < 0.05, ***P < 0.001.
B
A
Chapter 4
72
4.2.3.2 Isolated cellular fractions probed by western blotting
Next, the fibroblasts and SH-SY5Y cells were incubated separately with 0.025
µCi/ml [57Co] Cbl in the presence of 25 µM chloroquine. Isolated cellular fractions
were collected after subcellular fractionation and probed for appropriate organelle
markers by western blotting. Although chloroquine increased the lysosomal pH and
inhibited lysosomal function, the western blot results from chloroquine-treated
fibroblasts and neuronal cells demonstrated a distribution of organelle markers that
was consistent with the cells incubated under control culture condition (Figure 4.4 A
and B). Pure lysosomes (LAMP2-positive fractions #1 – #5) were separated from
mitochondria (VDAC1-positive fractions #6 – #10) in the fibroblasts (Figure 4.6 A).
In the SH-SY5Y cells, pure lysosomes were located in fractions #1 – #5 and
mitochondria dominated in fractions #6 – #10, with a minor contamination from
lysosomes in fractions #6 – #8 (Figure 4.6 B). With chloroquine treatment, the
appearance of fibroblast and neuronal cell fractions showed a higher intensity in the
LAMP2 band in comparison to the control condition (Figure 4.4 A and B). The
organelle fractions from both fibroblasts and neuronal cells were free of detectable
MS signal (Figure 4.6 A and B). In the cytosolic fractions, LAMP2 and VDAC1
signals were not seen in any fraction, while a clear MS signal was detected in the
cytosolic fractions (#1 – #5) (Figure 4.6 A and B).
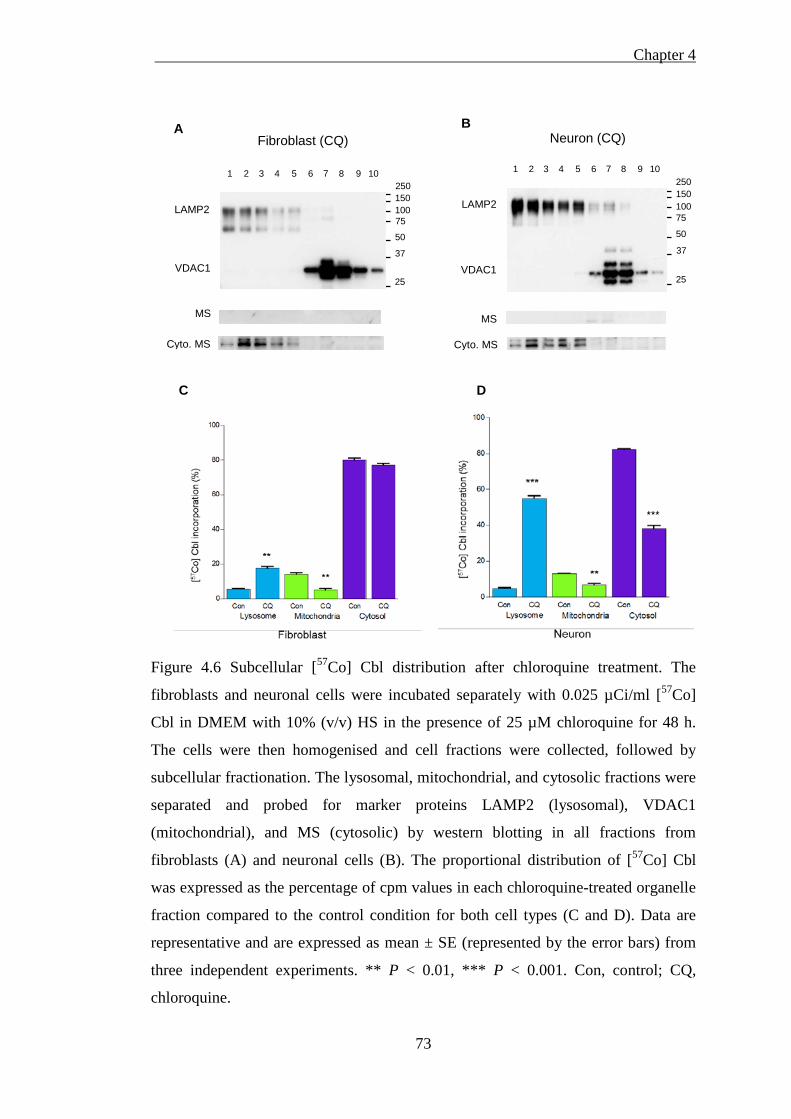
Chapter 4
73
Figure 4.6 Subcellular [57Co] Cbl distribution after chloroquine treatment. The
fibroblasts and neuronal cells were incubated separately with 0.025 µCi/ml [57Co]
Cbl in DMEM with 10% (v/v) HS in the presence of 25 µM chloroquine for 48 h.
The cells were then homogenised and cell fractions were collected, followed by
subcellular fractionation. The lysosomal, mitochondrial, and cytosolic fractions were
separated and probed for marker proteins LAMP2 (lysosomal), VDAC1
(mitochondrial), and MS (cytosolic) by western blotting in all fractions from
fibroblasts (A) and neuronal cells (B). The proportional distribution of [57Co] Cbl
was expressed as the percentage of cpm values in each chloroquine-treated organelle
fraction compared to the control condition for both cell types (C and D). Data are
representative and are expressed as mean ± SE (represented by the error bars) from
three independent experiments. ** P < 0.01, *** P < 0.001. Con, control; CQ,
chloroquine.
Fibroblast (CQ) A
LAMP2
25
37
1 2 3 4 5 6 7 8 9 10
VDAC1
MS
75
250
50
150 100
Cyto. MS
B
LAMP2
25
37
1 2 3 4 5 6 7 8 9 10
VDAC1
MS
75
250
50
150 100
Cyto. MS
Neuron (CQ)
C
D
Chapter 4
74
4.2.3.3 Chloroquine treatment impairs lysosomal [57Co] Cbl transport
The data presented in Figure 4.6 C and D indicated the distribution of [57Co] Cbl in
each organelle fraction expressed as a percentage of cpm values between control and
chloroquine-treated cells. As a proportion of total cellular [57Co] Cbl, lysosomes in
the fibroblasts contained 5.7% of cellular [57Co] Cbl under control culture conditions
and this increased 3.1-fold to 17.6% with chloroquine treatment (Figure 4.6 C). This
retention of [57Co] Cbl in the lysosomes was concomitant with a significant 63%
decrease (from 14.3% to 5.2% of total cellular levels) in mitochondrial [57Co] Cbl
and a trend (P = 0.07) for a 4% decrease (from 80.1% to 77.1% of total cellular
levels) in cytosolic [57Co] Cbl. However, the lysosomal [57Co] Cbl level in the
neuronal cells with chloroquine treatment dramatically increased more than 10-fold
from 4.8% to 55.0%. This remarkable increase was inversely associated with a
decrease in the mitochondrial and cytosolic [57Co] Cbl levels, at which [57Co] Cbl
was significantly reduced to 50% (from 13.1% to 6.8% and from 82.2% to 38.8%,
respectively). Therefore, chloroquine treatment on fibroblasts and neuronal cells
neutralises lysosomal pH and inhibits lysosomal function, resulting in [57Co] Cbl
accumulation in the lysosomes. Lysosomal dysfunction may impair subcellular
[57Co] Cbl transit by inhibiting the release of [57Co] Cbl into mitochondria and
cytosol.
Chapter 4
75
4.3 Lysosomal protease inhibition impairs lysosomal [57Co] Cbl
transport
4.3.1. Introduction
I have shown that chloroquine inhibits lysosomal proteolysis and causes lysosomal
[57Co] Cbl accumulation. As chloroquine can also theoretically modulate the
transition of lysosomal Cbl to the “base-off” state (as explained above), I further
assessed whether a lysosomal hydrolase inhibitor that does not operate through
neutralizing lysosomal pH could also lead to a trapping of Cbl in the lysosome. In
the current experiment, a broad specificity competitive transition state inhibitor,
leupeptin (inhibits cysteine, serine and threonine proteases, but does not alter
lysosomal pH), was given to the cells to examine the impact of lysosomal protease
inhibition on lysosomal Cbl transport.
4.3.2. Results
4.3.2.1 Isolated cellular fractions probed by western blotting
The fibroblasts and neuronal cells were incubated separately with 0.025 µCi/ml
[57Co] Cbl in DMEM containing 10% (v/v) HS in the presence of 40 µM leupeptin
(Sigma, USA, Cat #L2884) for 48 h at 37◦C. The cells were then homogenised and
cell fractions were collected, followed by subcellular fractionation as described
previously (Chapter 2, section 2.4). Isolated cellular fractions containing lysosomes,
Chapter 4
76
mitochondria, and cytosol were probed for appropriate organelle markers by western
blotting: lysosome: LAMP2; mitochondria: VDAC1; and cytosol: MS.
The western blot results from leupeptin-treated fibroblasts and neuronal cells
demonstrated a different distribution of organelle markers from the cells incubated
under control culture conditions (Figure 4.4 A and B). In the fibroblasts, pure
lysosomes were localised in LAMP2-positive fractions #1 – #6 with intense signals
in fractions #1 and #6, while the mitochondria were distributed through VDAC1-
positive fractions #7 – #9 (Figure 4.7 A). In neuronal cells, pure lysosomes appeared
in fractions #1 – #5, the mitochondria and lysosomes were colocalised in fractions #6
– #8, and pure mitochondria appeared in fractions #9 – #10 (Figure 4.7 B). Among
the neuronal lysosomal fractions, fractions #5 and #7 seemed to have the strongest
signal. The organelle fractions from both fibroblasts and neuronal cells were free of
detectable MS signal (Figure 4.7 A and B). In the cytosolic fractions, LAMP2 and
VDAC1 signals were not seen in any fraction, while a clear MS signal (#1 – #5) was
detected from both conditions. Interestingly, both chloroquine and leupeptin
treatment with neuronal cells were associated with the appearance of LAMP2
through a broader range of density fractions isolated from the OptiPrep gradient
(compare Figure 4.4 B to Figure 4.6 B and Figure 4.7 B). This may result from both
an expansion of the lysosomal compartment and an increase in the size and density
of a subpopulation of lysosomes; both of which would be predicted to occur as
intralysosomal substrates accumulate.
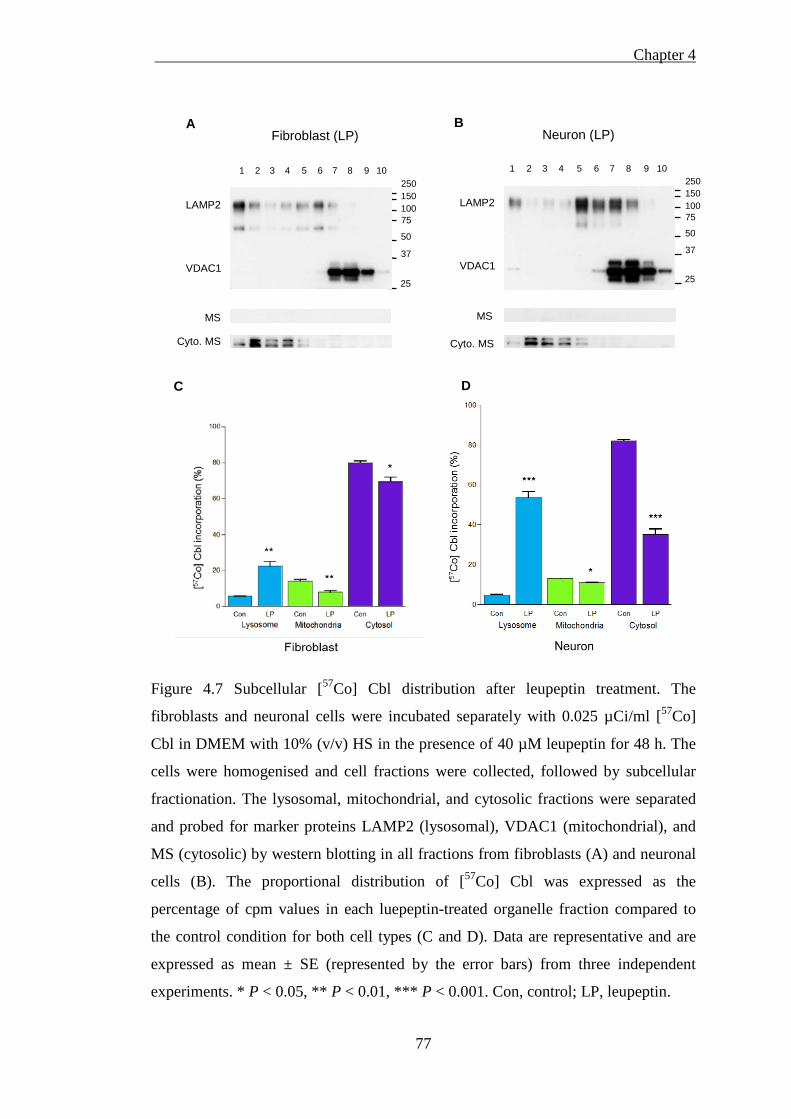
Chapter 4
77
Figure 4.7 Subcellular [57Co] Cbl distribution after leupeptin treatment. The
fibroblasts and neuronal cells were incubated separately with 0.025 µCi/ml [57Co]
Cbl in DMEM with 10% (v/v) HS in the presence of 40 µM leupeptin for 48 h. The
cells were homogenised and cell fractions were collected, followed by subcellular
fractionation. The lysosomal, mitochondrial, and cytosolic fractions were separated
and probed for marker proteins LAMP2 (lysosomal), VDAC1 (mitochondrial), and
MS (cytosolic) by western blotting in all fractions from fibroblasts (A) and neuronal
cells (B). The proportional distribution of [57Co] Cbl was expressed as the
percentage of cpm values in each luepeptin-treated organelle fraction compared to
the control condition for both cell types (C and D). Data are representative and are
expressed as mean ± SE (represented by the error bars) from three independent
experiments. * P < 0.05, ** P < 0.01, *** P < 0.001. Con, control; LP, leupeptin.
B
LAMP2
25
37
1 2 3 4 5 6 7 8 9 10
VDAC1
MS
75
250
50
150 100
Cyto. MS
Neuron (LP)
Fibroblast (LP) A
LAMP2
25
37
1 2 3 4 5 6 7 8 9 10
VDAC1
MS
75
250
50
150 100
Cyto. MS
C D
Chapter 4
78
4.3.2.2 Leupeptin treatment impairs lysosomal [57Co] Cbl transport
In conditions where neuronal proteolysis was inhibited by leupeptin, the density of
lysosomes in 2 of the 8 LAMP2-positive fractions (i.e. fractions #7 and #8) became
so similar to the mitochondria that it was not possible to completely separate them.
In this case the cpm values in those two fractions were estimated based on the
LAMP2 optical density and compared with the closest “clean” LAMP2 fractions (i.e.
fractions #5 and #6). After subtracting the estimated lysosomal radioactivity (cpm) in
fractions #7 and #8, the remaining radioactivity (cpm) was assigned as
mitochondrial. Using this method, both the leupeptin and chloroquine (in the latter
the LAMP2/VDAC1 overlap was not pronounced) treatments gave similar results for
lysosomal Cbl levels.
The data presented in Figure 4.7 C and D indicated the distribution of [57Co] Cbl in
each organelle fraction expressed as a percentage of cpm values between control and
leupeptin-treated cells. Similar to the results using choroquine, the fibroblasts treated
with leupeptin showed a significant 3.9-fold increase (from 5.7% to 22.4%) in
lysosomal [57Co] Cbl level, which was associated with a significant reduction in both
mitochondrial and cytosolic [57Co] Cbl levels (reduced by 44% and 13%,
respectively, Figure 4.7 C). Likewise, the neuronal cells treated with leupeptin
showed that 53.8% of total [57Co] Cbl was trapped in the lysosomes, an 11-fold
increase compared to the control cells, whereas the cellular levels of [57Co] Cbl in
the mitochondria and cytosol significantly decreased (from 13.1% to 11.0% and
from 82.2% to 35.2%, respectively) (P < 0.05 and P < 0.001). Therefore, leupeptin
treatment of fibroblasts and neuronal cells inhibits lysosomal proteases without
Chapter 4
79
disturbing lysosomal pH, a mechanism different from choloquine treatment, causes
lysosomal [57Co] Cbl accumulation. This may impair subcellular [57Co] Cbl transit
by preventing the release of [57Co] Cbl into mitochondria and cytosol.
4.3.2.3 Comparison of chloroquine and leupeptin treatment on fibroblasts and
neuronal cells
In comparing the experiments conducted with fibroblasts and neuronal cells, there
were striking differences in the degree of lysosomal accumulation of [57Co] Cbl and
the cytosolic depletion of [57Co] Cbl, with both parameters being much more severe
in the neuronal cells (Figure 4.8). In addition, associated with the more pronounced
lysosomal [57Co] Cbl accumulation, the change in LAMP2 distribution through the
OptiPrep density gradient was also more pronounced in the neuronal cells (compare
Figure 4.6 C with D; Figure 4.7 C with D); possibly reflecting a more extensive
enlargement of the lysosomal compartment and a greater increase in average
lysosome size and density distribution. It was also clear that there were differences in
the extent to which mitochondrial [57Co] Cbl levels were modulated by chloroquine
and leupeptin treatment in the different cell types and this did not necessarily follow
changes in lysosomal [57Co] Cbl retention. For example, the leupeptin treatment of
neuronal cells resulted in an approximate 11-fold increase in lysosomal [57Co] Cbl,
and an approximate 57% decrease in cytosolic [57Co] Cbl, whereas in the same
experimental condition, the mitochondrial [57Co] Cbl levels were reduced by only
16% (Figure 4.7 D).
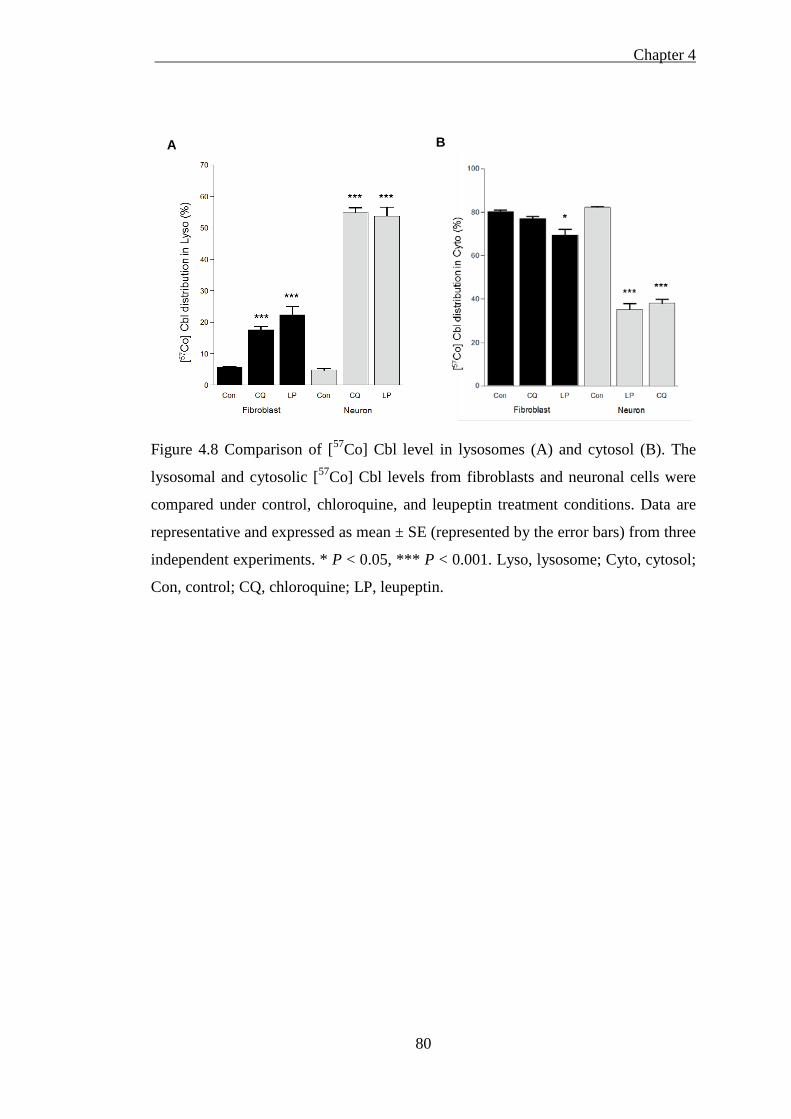
Chapter 4
80
Figure 4.8 Comparison of [57Co] Cbl level in lysosomes (A) and cytosol (B). The
lysosomal and cytosolic [57Co] Cbl levels from fibroblasts and neuronal cells were
compared under control, chloroquine, and leupeptin treatment conditions. Data are
representative and expressed as mean ± SE (represented by the error bars) from three
independent experiments. * P < 0.05, *** P < 0.001. Lyso, lysosome; Cyto, cytosol;
Con, control; CQ, chloroquine; LP, leupeptin.
A B
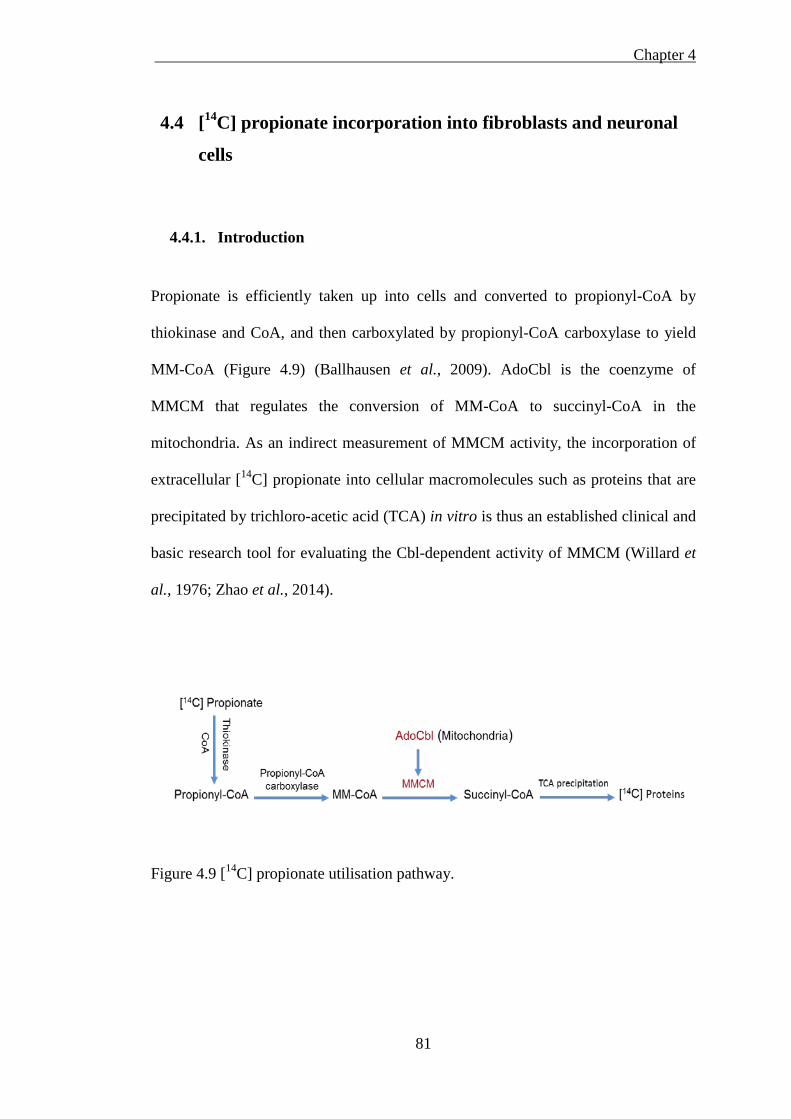
Chapter 4
81
4.4 [14C] propionate incorporation into fibroblasts and neuronal
cells
4.4.1. Introduction
Propionate is efficiently taken up into cells and converted to propionyl-CoA by
thiokinase and CoA, and then carboxylated by propionyl-CoA carboxylase to yield
MM-CoA (Figure 4.9) (Ballhausen et al., 2009). AdoCbl is the coenzyme of
MMCM that regulates the conversion of MM-CoA to succinyl-CoA in the
mitochondria. As an indirect measurement of MMCM activity, the incorporation of
extracellular [14C] propionate into cellular macromolecules such as proteins that are
precipitated by trichloro-acetic acid (TCA) in vitro is thus an established clinical and
basic research tool for evaluating the Cbl-dependent activity of MMCM (Willard et
al., 1976; Zhao et al., 2014).
Figure 4.9 [14C] propionate utilisation pathway.
Chapter 4
82
The importance of the role that the lysosome plays in the delivery of Cbl to MS and
MMCM has been highlighted by the discovery of two inborn errors of Cbl
metabolism referred to as cblF and cblJ (Rosenblatt et al., 1985; Rutsch et al., 2009;
Coelho et al., 2012). These life-threatening conditions are caused by a loss of
function in either LMBD1 or ABCD4, lysosomal membrane proteins that normally
promote Cbl efflux from the lysosome to the cytosol (Rutsch et al., 2009; Coelho et
al., 2012). In cblF and cblJ subjects, Cbl accumulates in lysosomes and levels of
toxic metabolites Hcy and MMA increase (Rutsch et al., 2009; Coelho et al., 2012).
When lysosomal function is inhibited by chloroquine and leupeptin treatment,
intracellular Cbl utilisation might be affected because of the reduction in delivering
Cbl from lysosomes to mitochondria and cytosol. This inhibits the conversion of
MM-CoA to succinyl-CoA, resulting in less succinyl-CoA being converted from
propionate. In order to assess whether the variation in mitochondrial [57Co] Cbl
levels related to chloroquine or leupeptin treatment was associated with changes in
MMCM activity, the incorporation of [14C] propionate into TCA-precipitated
proteins / macromolecules was measured.
4.4.2. Methods
The same number of fibroblasts and neuronal cells were seeded into two 6-well cell
culture plates with 6 wells as control; 3 wells treated with chloroquine (25 µM); and
3 wells treated with leupeptin (40 µM). The cells were incubated in DMEM with
10% (v/v) FCS for 48 h at 37 ◦C. Next, the cells were washed with PBS and
incubated with [14C] propionate (1 µCi/ml, MP Biomedicals, USA, Cat #11221750)
Chapter 4
83
in Puck’s saline containing 15% (v/v) FCS and 0.05 M glucose for 8 h at 37◦C. The
cells were then washed with PBS and incubated with 5% TCA (Sigma, USA, Cat
#9159) for 10 min at 4 ◦ C. The cells were collected with a cell scraper and
centrifuged at 6,000 × g for 5 min at 4◦C. Finally the supernatants were removed and
the pellets were dissolved with 1 M NaOH. The amount of [14C] propionate in the
cell pellets was measured using a Tri-Carb Liquid Scintillation Counter
(PerkinElmer, Finland). The cell protein concentrations in each condition were
determined using BCA protein assay.
4.4.3. Results
The data presented in Figure 4.10 A indicated the incorporation of [14C] propionate
in the cell pellets expressed as a percentage of the control conditions. Chloroquine
treatment resulted in a significant inhibition of [14C] propionate incorporation into
TCA-precipitated pellets in both fibroblasts and neuronal cells (by 25.5% and 15.7%
reduction, respectively). Similarly, leupeptin treatment significantly reduced [14C]
propionate incorporation in fibroblasts (by 24.6%), and there was a trend for reduced
[14C] propionate incorporation in neuronal cells (5.7%, P = 0.07). When the variation
in mitochondrial [57Co] Cbl levels associated with chloroquine or leupeptin
treatment was compared to the relative [14C] propionate incorporation values, a
significant positive correlation (R2 = 0.88, P = 0.003) was detected (Figure 4.10 B).
These results suggest that the accumulation of lysosomal Cbl causes the decrease of
AdoCbl in the mitochondria and may have downstream consequences on cellular
physiology. The inhibition of lysosomal function disrupts intracellular Cbl utilisation
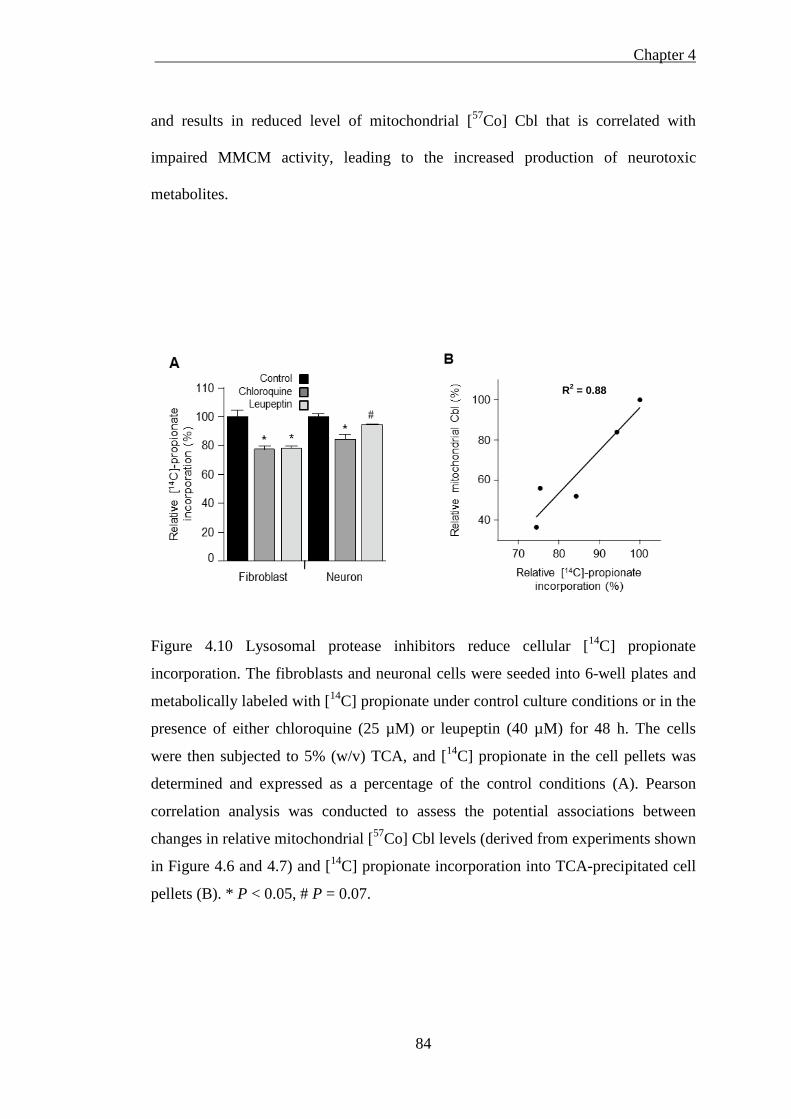
Chapter 4
84
and results in reduced level of mitochondrial [57Co] Cbl that is correlated with
impaired MMCM activity, leading to the increased production of neurotoxic
metabolites.
Figure 4.10 Lysosomal protease inhibitors reduce cellular [14C] propionate
incorporation. The fibroblasts and neuronal cells were seeded into 6-well plates and
metabolically labeled with [14C] propionate under control culture conditions or in the
presence of either chloroquine (25 µM) or leupeptin (40 µM) for 48 h. The cells
were then subjected to 5% (w/v) TCA, and [14C] propionate in the cell pellets was
determined and expressed as a percentage of the control conditions (A). Pearson
correlation analysis was conducted to assess the potential associations between
changes in relative mitochondrial [57Co] Cbl levels (derived from experiments shown
in Figure 4.6 and 4.7) and [14C] propionate incorporation into TCA-precipitated cell
pellets (B). * P < 0.05, # P = 0.07.
R2 = 0.88
Chapter 4
85
4.5 Inhibition of lysosomal hydrolase pathway may interrupt
lysosomal [57Co] Cbl transport
4.5.1. Introduction
Lysosomal hydrolases are synthesised at the rough endoplasmic reticulum and travel
along the secretory pathway until they reach the TGN, from which hydrolases are
taken by mannose-6-phosphate receptors to form vesicles that deliver them to
immature lysosomes (Coutinho et al., 2012). Microtubules are primary components
of the cytoskeleton and they are composed of a single type of globular protein,
tubulin. Microtubules provide platforms for intracellular transport and are involved
in a variety of cellular processes, including the movement of secretory vesicles,
organelles, and intracellular substances (Copper, 2000). Vinblastine is commonly
used for cancer treatment and it is also a microtubule-depolymerising compound that
disrupts cytoskeletal-dependent vesicular transport and inhibits subsequent fusion of
autophagosomes with endosomal and lysosomal compartments (Marzella et al.,
1980; Dhamodharan et al., 1995). Vinblastine treatment induces autophagy and
causes extensive AV accumulation, as well as disrupts lysosomal hydrolase transport
on microtubules, subsequently delaying the formation of mature lysosomes and
inhibiting lysosomal proteolysis (Oliva et al., 1992; Boland et al., 2008). Thus, the
role of vinblastine treatment was investigated in this experiment to assess the impact
of impaired lysosomal enzymes delivery on lysosomal Cbl intracellular transport.
4.5.2. Results
Chapter 4
86
4.5.2.1 Isolated cellular fractions probing by western blotting
Vinblastine is toxic to cells and differential toxicity was observed when cells were
subjected to 4 h exposure (Ferguson et al., 1984). Furthermore, it has been reported
that fibroblasts are more susceptible to vinblastine toxicity (Boland et al., 2008).
Thus, SH-SY5Y cells were treated with vinblastine and incubation period was
reduced to 24 h. As a supplementary experiment to support the above results
(lysosomal protease inhibition by chloroquine and leupeptin), one experiment for
each concentration of vinblastine treatment was conducted. The SH-SY5Y cells were
incubated with 0.025 µCi/ml [57Co] Cbl in DMEM with 10% (v/v) HS in the
presence of 1 µM or 10 µM vinblastine (Sigma, USA, Cat #V1377) for 24 h at 37◦C.
The cells were then homogenised and cell fractions were collected, followed by
subcellular fractionation method as described previously (Chapter 2, section 2.4).
Isolated cellular fractions containing lysosomes, mitochondria, and cytosol were
probed for appropriate organelle markers by western blotting: lysosome: LAMP2;
mitochondria: VDAC1; and cytosol: MS.
The western blot results from both vinblastine concentrations demonstrated a similar
distribution of organelle markers that was consistent with the cells incubated under
control culture conditions (Figure 4.4 A and B). Pure lysosomes (LAMP2-positive
fractions #1 – #2) were separated from mitochondria (VDAC1-positive fractions #6
– #8) with 1 µM vinblastine treatment (Figure 4.11 A). When vinblastine
concentration was increased to 10-fold, pure lysosomes were located in fractions #1
– #5 and mitochondria dominated in fractions #7 – #9 (Figure 4.11 B). The different
pattern of lysosomal location may result from an expansion of the lysosomal
Chapter 4
87
compartment or an increase in the size and density of a subpopulation of lysosomes,
possibly indicating that more cellular [57Co] Cbl were entrapped in the lysosomes
with the increased concentration of vinblastine. The organelle fractions from both
conditions were free from detectable MS. In the cytosolic fractions, LAMP2 and
VDAC1 signals were not seen in any fraction, while a clear MS signal (#2 – #5) was
detected from both conditions (Figure 4.11 A and B).
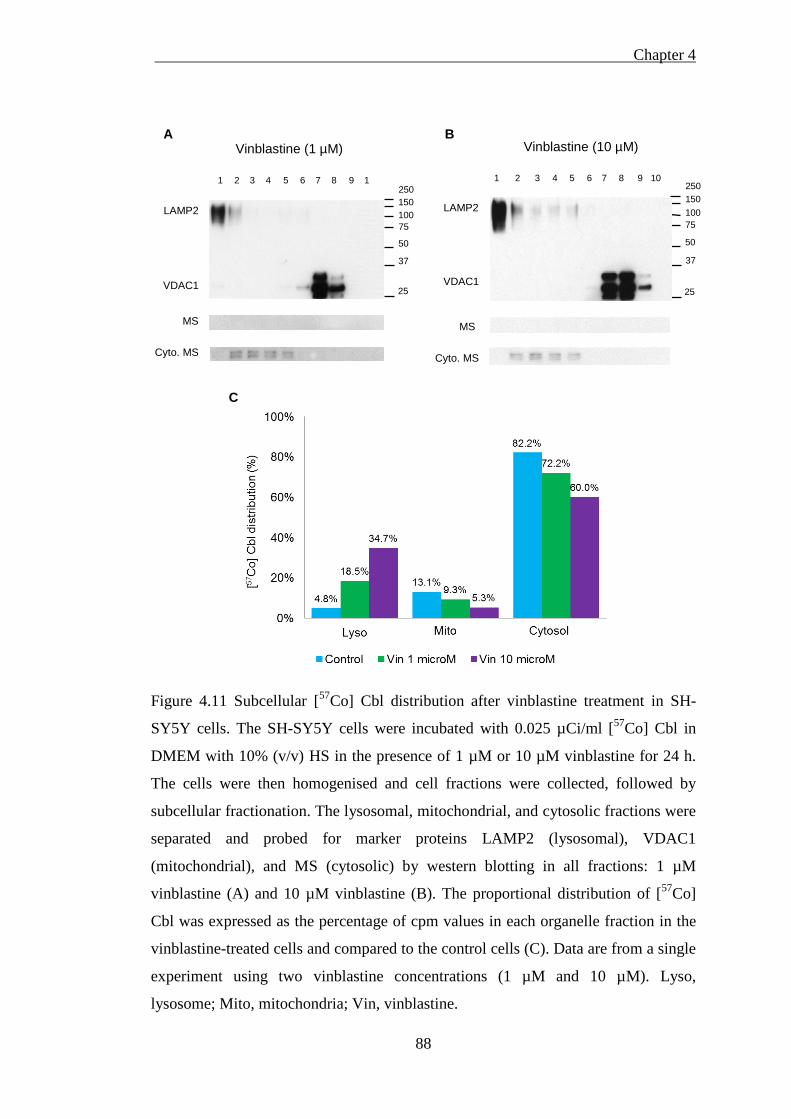
Chapter 4
88
Figure 4.11 Subcellular [57Co] Cbl distribution after vinblastine treatment in SH-
SY5Y cells. The SH-SY5Y cells were incubated with 0.025 µCi/ml [57Co] Cbl in
DMEM with 10% (v/v) HS in the presence of 1 µM or 10 µM vinblastine for 24 h.
The cells were then homogenised and cell fractions were collected, followed by
subcellular fractionation. The lysosomal, mitochondrial, and cytosolic fractions were
separated and probed for marker proteins LAMP2 (lysosomal), VDAC1
(mitochondrial), and MS (cytosolic) by western blotting in all fractions: 1 µM
vinblastine (A) and 10 µM vinblastine (B). The proportional distribution of [57Co]
Cbl was expressed as the percentage of cpm values in each organelle fraction in the
vinblastine-treated cells and compared to the control cells (C). Data are from a single
experiment using two vinblastine concentrations (1 µM and 10 µM). Lyso,
lysosome; Mito, mitochondria; Vin, vinblastine.
Vinblastine (1 µM) A
LAMP2
25
37
1 2 3 4 5 6 7 8 9 1
VDAC1
MS
75
250
50
150 100
Cyto. MS
Vinblastine (10 µM) B
LAMP2
25
37
VDAC1
MS
75
250
50
150100
Cyto. MS
1 2 3 4 5 6 7 8 9 10
C
Chapter 4
89
4.5.2.2 Vinblastine treatment may impair lysosomal [57Co] Cbl transport
The data presented in Figure 4.11 C indicated the distribution of [57Co] Cbl in each
organelle fractions expressed as a percentage of cpm values between control and
vinblastine-treated cells. As a proportion of total cellular [57Co] Cbl, there was a
definite trend for increased lysosomal [57Co] Cbl that was concomitant with an
increasing concentration of vinblastine. There was a simultaneous decreased trend
for the mitochondrial and cytosolic [57Co] Cbl compared to the control condition.
The lysosomes contained 4.8% of the cellular [57Co] Cbl under the control culture
condition and this increased to 4-fold or 8-fold (18.5% or 34.7%) with 1 µM or 10
µM vinblastine treatment, respectively. This retention of [57Co] Cbl in the lysosomes
was associated with a 29.0% or 59.5% decrease (from 13.1% to 9.3% and 5.3% of
total cellular levels) in mitochondrial [57Co] Cbl, and a 12.2% or 27.0% decrease
(from 82.2% to 72.2% and 60.0% of total cellular levels) in cytosolic [57Co] Cbl.
These results suggest that although only one experiment from each vinblastine
concentration is performed, there is an obvious trend underlying the fact, which is
that the disruption of lysosomal hydrolase transport on microtubules inhibits
lysosomal proteolysis and causes [57Co] Cbl build-up in the lysosomes and may
inhibit intracellular [57Co] Cbl transit.
Chapter 4
90
4.6 Discussion
The present results have shown that inhibition of lysosomal proteolysis using both
pH-dependent (chloroquine) and -independent (leupeptin and vinblastine)
approaches suppress lysosomal function, cause lysosomal [57Co] Cbl accumulation,
and interrupt intracellular [57Co] Cbl transit. The results provide the first detailed
analysis of the effects that physiologically relevant impairments of lysosomal
function have on intracellular Cbl transport. Moreover, lysosomal [57Co] Cbl
trapping is correlated with decreased incorporation of [14C] propionate into cellular
macromolecules, which is a physiological marker of mitochondrial MMCM activity.
The increasing amount of [57Co] Cbl in the lysosomes impairs Cbl-dependent
utilisation of [14C] propionate.
The results from western blotting for LAMP2 in OpitPrep gradient fractions suggests
that such lysosomal Cbl “trapping” is associated with an enlargement of the
lysosomal compartment and an increase in a subpopulation of lysosomes with
increased size and/or density distribution. When the [57Co] Cbl cpm values were
compared with LAMP2 signal in the pure lysosome fractions, a close correlation was
generally observed. However, when lysosomal [57Co] Cbl was increased to a 10-fold
with chloroquine or leupeptin treatment in the neuronal cells, the change in LAMP2
signal from western blot did not reach to the same magnitude. For example, a semi-
quantitative comparison of the LAMP2 western blot suggested chloroquine treatment
increased LAMP2 levels approximately 2-fold, whereas lysosomal [57Co] Cbl level
was increased approximately 10-fold. The recent report suggests that lysosomal
protease inhibitors (including chloroquine) have a dual effect on autophagy as they
Chapter 4
91
initiate early autophagic processes while suppressing autophagic degradation (Li et
al., 2013). This is predicted to result in an expansion of the lysosomal compartment
that may be mechanistically related to our current observations. Therefore lysosomal
Cbl accumulation that is induced by protease inhibition seems due to a combination
of both an enlargement of the lysosomal compartment and an increase in lysosomal
Cbl concentration. This along with a failed release of Cbl from the TC-Cbl complex
could together contribute to the impaired transit of [57Co] Cbl through the lysosomal
compartment. Although lysosomal morphology clearly changes in human AD tissues
(Cataldo et al., 1994; Cataldo et al., 1996), future studies utilising electron
microscopy techniques might clarify the extent to which lysosomal morphology
changes under current experimental conditions.
4.7 Conclusions
Three different experimental approaches by inhibiting lysosomal function are
conducted with fibroblasts and neuronal cells to assess the impact on the subcellular
[57Co] Cbl transport in vitro. These results indicate that inhibition of lysosomal
hydrolases suppresses lysosomal function and results in lysosomal [57Co] Cbl
accumulation, consequently interrupting intracellular [57Co] Cbl transit. Moreover,
preventing lysosomal Cbl from the release reduces the amount of Cbl to enter
cytosol and mitochondria, thus, it may have impact on downstream cellular
metabolites and cause cytotoxic accumulation. Lysosomal [57Co] Cbl trapping is
correlated with decreased incorporation of [14C] propionate into cellular
macromolecules. Lysosomal protease inhibition causes reduced mitochondrial [57Co]
Cbl that is correlated with impaired MMCM activity. An important role of lysosome
Chapter 4
92
function on Cbl intracellular transport and utilisation is established which may be
affected in conditions associated with lysosomal dysfunction, e.g. age-related
lipofuscin accumulation, lysosomal storage disorders, and AD.
Chapter 5
93
Chapter 5
Impact of lipofuscin accumulation and
Gaucher’s disease on subcellular
cobalamin distribution
Chapter 5
94
Impact of lipofuscin accumulation and Gaucher’s disease 5
on subcellular cobalamin distribution
5.1 Artificial lipofuscin induction and effect of its accumulation on
lysosomal [57Co] Cbl transport
5.1.1. Introduction
Ageing is accompanied by progressive cellular accumulation of biological “garbage”
and misfolded proteins (Terman and Brunk, 2006). Although damaged
macromolecules and organelles are continuously degraded by lysosomes through
autophagy and replaced by newly synthesized biological structures, it is clear that
some material progressively accumulates in post-mitotic cells. One of the
characteristics of ageing is the increasing accumulation of lipofuscin-loaded
lysosomes in long-lived post-mitotic cells such as cardiac myocytes and neuronal
cells. Lipofuscin is an autofluorescent and undegradable intralysosomal pigment that
consists primarily of oxidatively modified cross-linked protein residues originating
from autophagocytosed cytoplasmic components (Terman and Brunk, 1998; Double
et al., 2008).
Previous studies indicated that lipofuscin accumulation impaired lysosomal
functions (Brunk and Terman, 2002; Terman et al., 2006). Lipofuscin-loaded
lysosomal compartment is rich in iron that partly exists in a redox-active form. This
makes lysosomes sensitive to a high Fe-catalysed oxidative stress (Fenton reaction)
that compromises lysosomal membrane integrity resulting in the loss of the proton
Chapter 5
95
gradient (Yu et al., 2003). The resulting increase in lysosomal pH significantly
reduces protease action and if the lysosomal membrane is sufficiently damaged,
cathepsins may be released to the cytosol and trigger apoptosis (Yuan et al., 2002).
Oxidative stress decreases the effective degradation of damaged proteins by
lysosomal hydrolases and promotes lipofuscin accumulation (Terman et al., 2006;
Terman et al., 2010). To examine whether age-related lipofuscin accumulation affect
intracellular Cbl transport in the cultured cells, artificial lipofuscin was generated in
the current experiment and then fed to fibroblasts and neuronal cells in attempt to
induce lipofuscin accumulation in the lysosomal compartment.
5.1.2. Methods
5.1.2.1 Artificial lipofuscin induction
In the current experiment artificial lipofuscin was generated by exposing cell lysates
that are enriched in lysosomes and mitochondria to UV light as described in an
established method (Nilsson and Yin, 1997). Artificial lipofuscin was then fed to
HT1080 fibroblasts and SH-SY5Y neuronal cells that endocytosed the material and
transported it to the lysosomes. Briefly, the fibroblasts were grown in twelve 175
cm2 plastic flasks until the cells were grown to 100% confluent. The cells were then
rinsed with cold PBS and harvested with 1% (w/v) trypsin. The cell suspension was
transferred to a ball-bearing cell homogeniser and homogenised on ice. Next, the
mixed cell lysates were centrifuged at 600 × g for 10 min at 4◦C to isolate the pellets
containing nuclei and membranous debris. The supernatant was centrifuged at
20,000 × g for 30 min at 4◦C. After centrifugation, the pellets containing
Chapter 5
96
mitochondria and lysosomes were collected. The pellets were suspended with PBS
and then loaded into petri dishes (5 ml/100 mm dish) without lids, and placed under
UV light in a Laminar Air Flow fume hood for up to 24 h to allow peroxidation to
take place. Finally, the resulting dried, lipofuscin-like materials were resuspended in
sterile water to sample original volume. Further homogenisation was conducted by
sonication to make artificial lipofuscin.
5.1.2.2 Artificial lipofuscin measurement
Next, artificial lipofuscin was fed into fibroblasts and neuronal cells. The extent of
lipofuscin “loading” in these cells was measured using flow cytometry technique.
Briefly, the fibroblasts and neuronal cells were incubated with prepared artificial
lipofuscin at different concentrations for 48 h at 37◦C to determine the optimal
condition for cellular uptake. After 48 h, a small portion of cells was washed with
PBS, trypsinised, and analysed using a BD LSR-II flow cytometer (BD Biosciences,
USA). A population of highly fluorescent cells was detected at emission 575 nm
when excited at 488 nm using autofluorescence parameters. In addition, the cells that
were fed artificial lipofuscin were subcultivated onto 22 mm cover slips in a 12-well
cell culture plate. Once the cells settled and spread on the cover slips, they were
fixed in 4% (w/v) formaldehyde in PBS for 30 min. The cover slips were then
inverted onto micro-culture slides before they were assessed with a Nikon TE2000
fluorescence microscope, equipped with a SPOT digital camera (Diagnostic
Instruments, USA), and Image-Pro Plus 6.1 software (Media Cybernetics, USA).
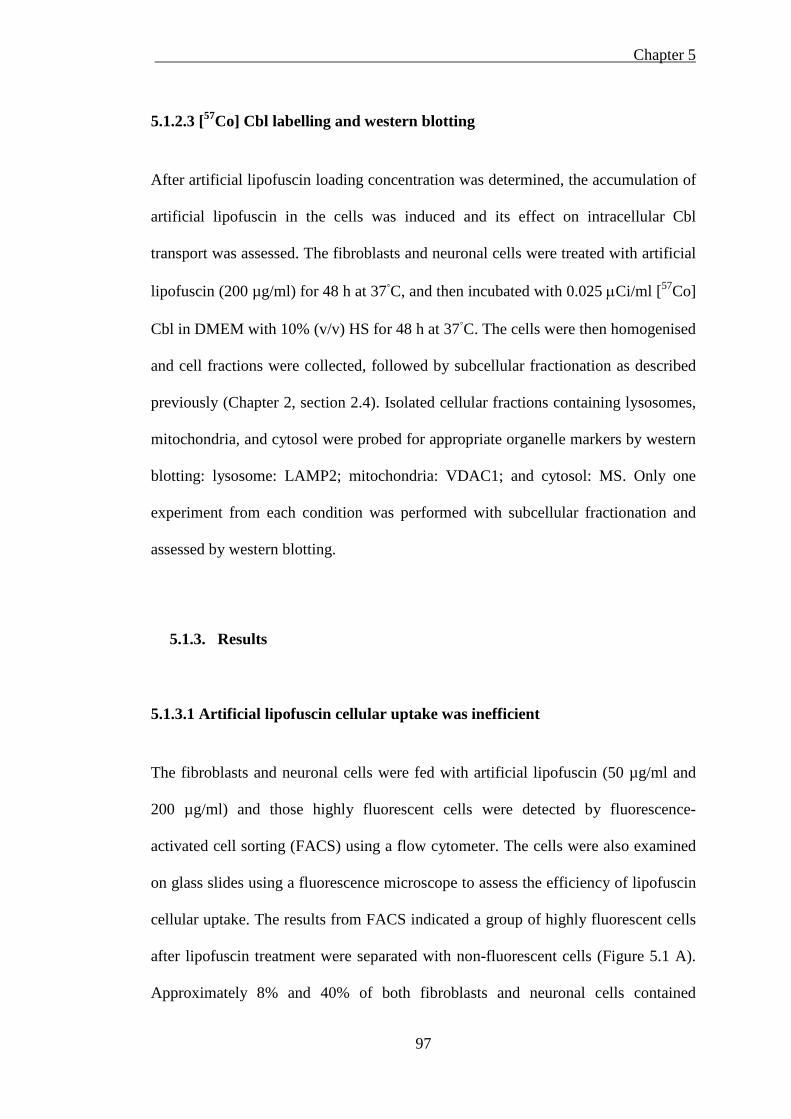
Chapter 5
97
5.1.2.3 [57Co] Cbl labelling and western blotting
After artificial lipofuscin loading concentration was determined, the accumulation of
artificial lipofuscin in the cells was induced and its effect on intracellular Cbl
transport was assessed. The fibroblasts and neuronal cells were treated with artificial
lipofuscin (200 µg/ml) for 48 h at 37◦C, and then incubated with 0.025 µCi/ml [57Co]
Cbl in DMEM with 10% (v/v) HS for 48 h at 37◦C. The cells were then homogenised
and cell fractions were collected, followed by subcellular fractionation as described
previously (Chapter 2, section 2.4). Isolated cellular fractions containing lysosomes,
mitochondria, and cytosol were probed for appropriate organelle markers by western
blotting: lysosome: LAMP2; mitochondria: VDAC1; and cytosol: MS. Only one
experiment from each condition was performed with subcellular fractionation and
assessed by western blotting.
5.1.3. Results
5.1.3.1 Artificial lipofuscin cellular uptake was inefficient
The fibroblasts and neuronal cells were fed with artificial lipofuscin (50 µg/ml and
200 µg/ml) and those highly fluorescent cells were detected by fluorescence-
activated cell sorting (FACS) using a flow cytometer. The cells were also examined
on glass slides using a fluorescence microscope to assess the efficiency of lipofuscin
cellular uptake. The results from FACS indicated a group of highly fluorescent cells
after lipofuscin treatment were separated with non-fluorescent cells (Figure 5.1 A).
Approximately 8% and 40% of both fibroblasts and neuronal cells contained
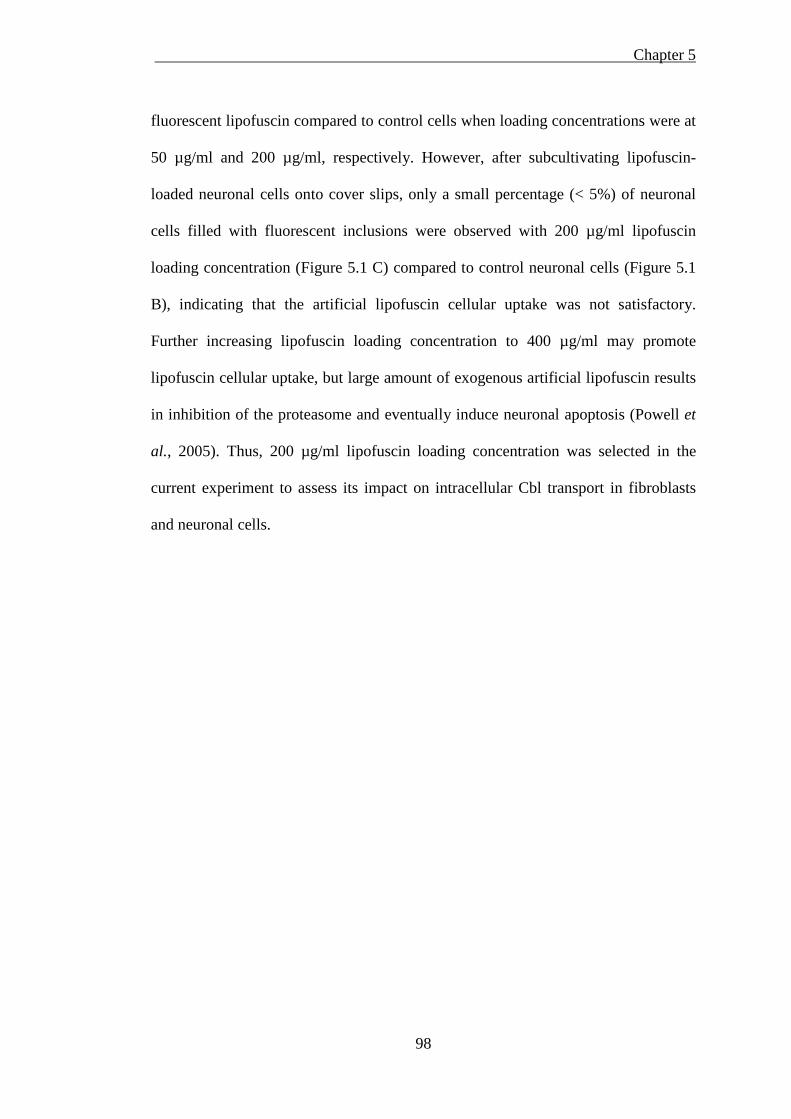
Chapter 5
98
fluorescent lipofuscin compared to control cells when loading concentrations were at
50 µg/ml and 200 µg/ml, respectively. However, after subcultivating lipofuscin-
loaded neuronal cells onto cover slips, only a small percentage (< 5%) of neuronal
cells filled with fluorescent inclusions were observed with 200 µg/ml lipofuscin
loading concentration (Figure 5.1 C) compared to control neuronal cells (Figure 5.1
B), indicating that the artificial lipofuscin cellular uptake was not satisfactory.
Further increasing lipofuscin loading concentration to 400 µg/ml may promote
lipofuscin cellular uptake, but large amount of exogenous artificial lipofuscin results
in inhibition of the proteasome and eventually induce neuronal apoptosis (Powell et
al., 2005). Thus, 200 µg/ml lipofuscin loading concentration was selected in the
current experiment to assess its impact on intracellular Cbl transport in fibroblasts
and neuronal cells.
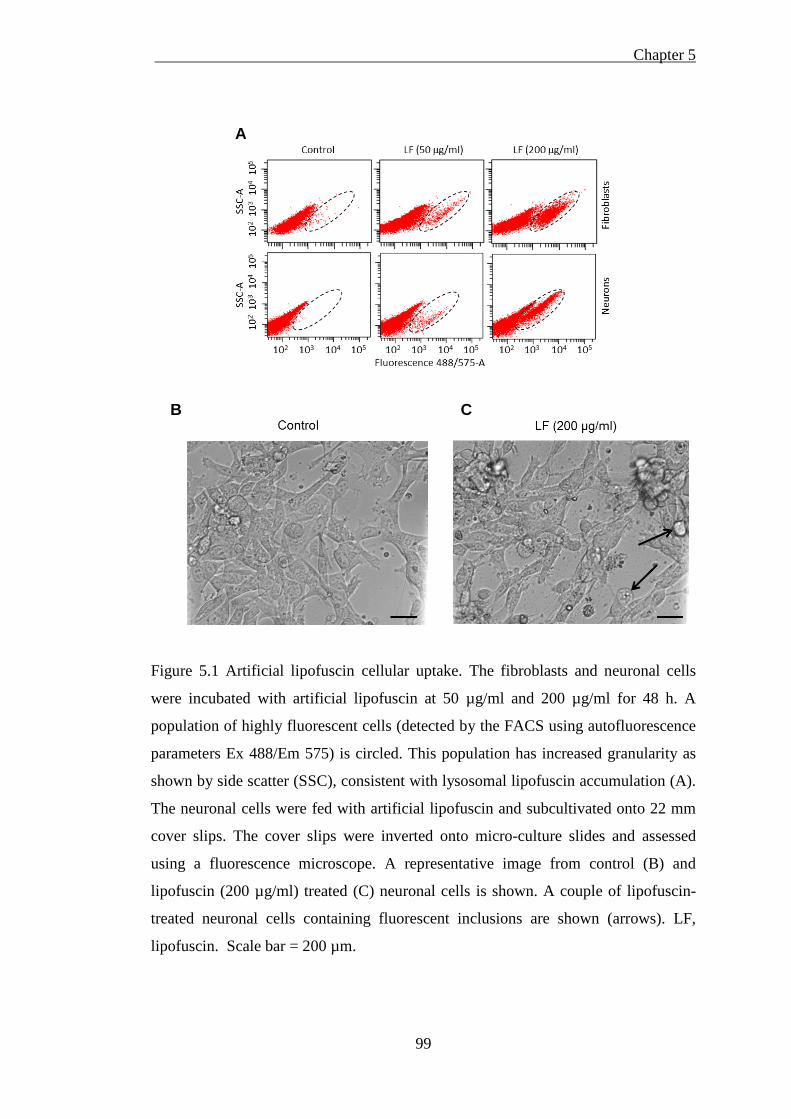
Chapter 5
99
Figure 5.1 Artificial lipofuscin cellular uptake. The fibroblasts and neuronal cells
were incubated with artificial lipofuscin at 50 µg/ml and 200 µg/ml for 48 h. A
population of highly fluorescent cells (detected by the FACS using autofluorescence
parameters Ex 488/Em 575) is circled. This population has increased granularity as
shown by side scatter (SSC), consistent with lysosomal lipofuscin accumulation (A).
The neuronal cells were fed with artificial lipofuscin and subcultivated onto 22 mm
cover slips. The cover slips were inverted onto micro-culture slides and assessed
using a fluorescence microscope. A representative image from control (B) and
lipofuscin (200 µg/ml) treated (C) neuronal cells is shown. A couple of lipofuscin-
treated neuronal cells containing fluorescent inclusions are shown (arrows). LF,
lipofuscin. Scale bar = 200 µm.
A
B C
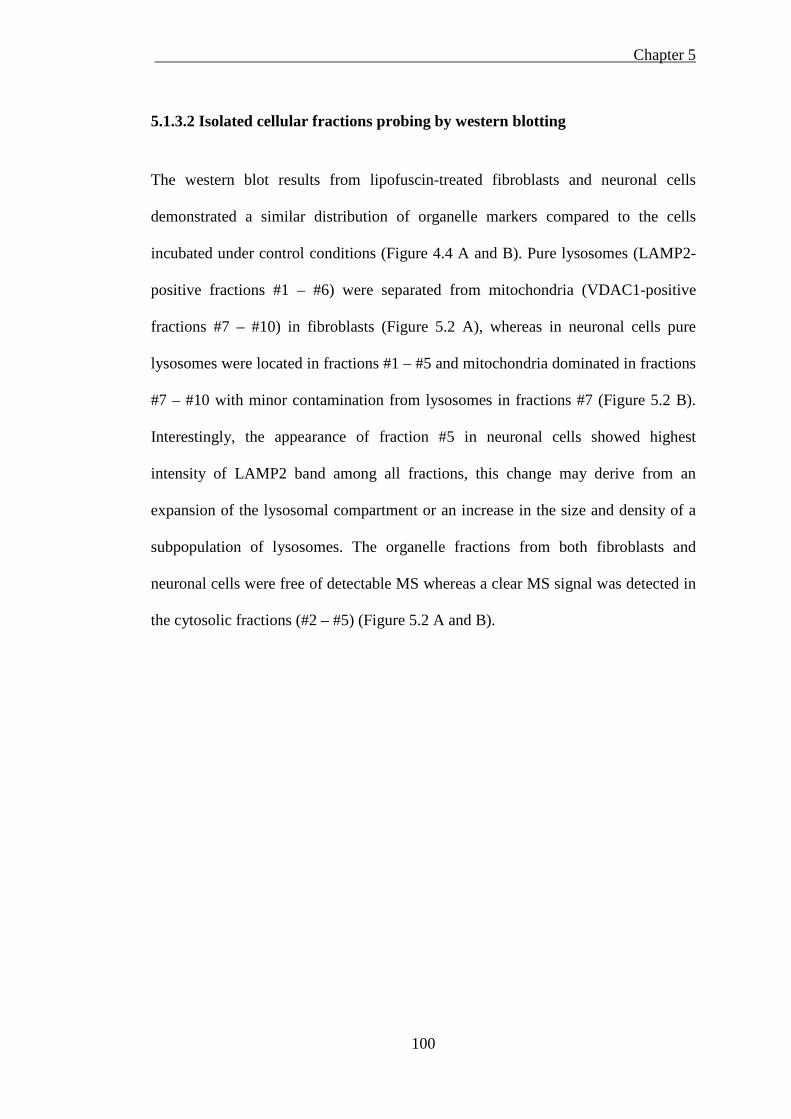
Chapter 5
100
5.1.3.2 Isolated cellular fractions probing by western blotting
The western blot results from lipofuscin-treated fibroblasts and neuronal cells
demonstrated a similar distribution of organelle markers compared to the cells
incubated under control conditions (Figure 4.4 A and B). Pure lysosomes (LAMP2-
positive fractions #1 – #6) were separated from mitochondria (VDAC1-positive
fractions #7 – #10) in fibroblasts (Figure 5.2 A), whereas in neuronal cells pure
lysosomes were located in fractions #1 – #5 and mitochondria dominated in fractions
#7 – #10 with minor contamination from lysosomes in fractions #7 (Figure 5.2 B).
Interestingly, the appearance of fraction #5 in neuronal cells showed highest
intensity of LAMP2 band among all fractions, this change may derive from an
expansion of the lysosomal compartment or an increase in the size and density of a
subpopulation of lysosomes. The organelle fractions from both fibroblasts and
neuronal cells were free of detectable MS whereas a clear MS signal was detected in
the cytosolic fractions (#2 – #5) (Figure 5.2 A and B).
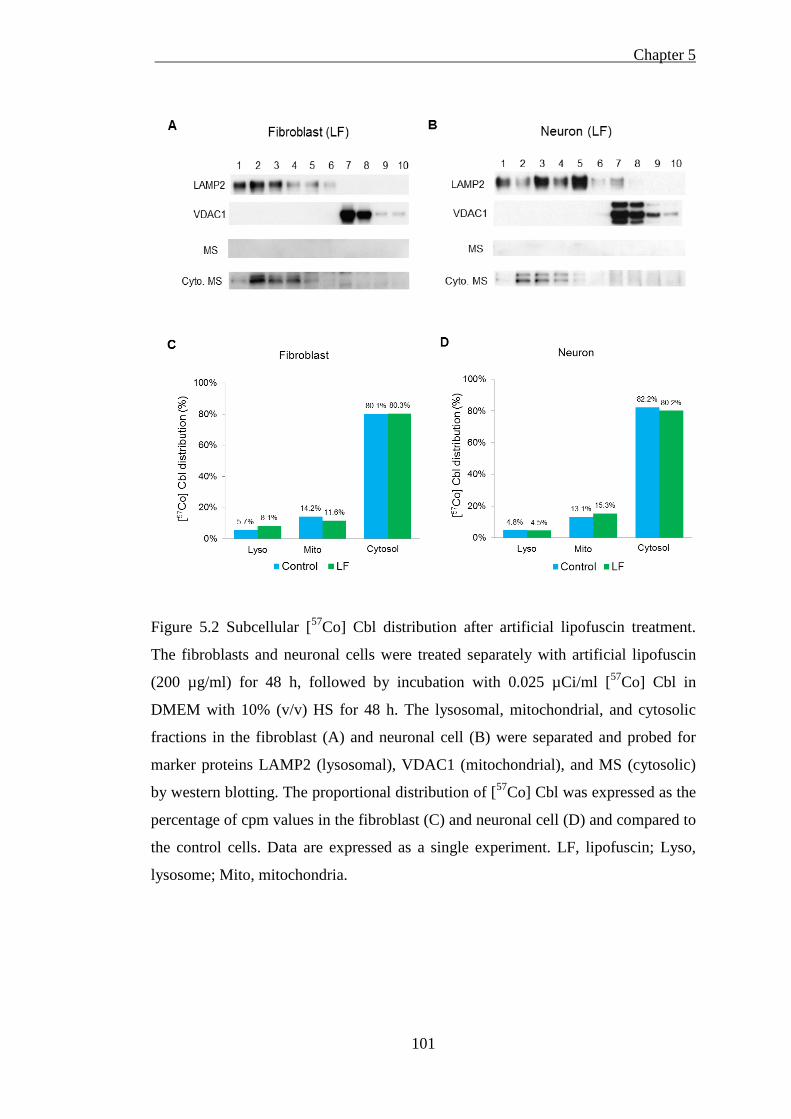
Chapter 5
101
Figure 5.2 Subcellular [57Co] Cbl distribution after artificial lipofuscin treatment.
The fibroblasts and neuronal cells were treated separately with artificial lipofuscin
(200 µg/ml) for 48 h, followed by incubation with 0.025 µCi/ml [57Co] Cbl in
DMEM with 10% (v/v) HS for 48 h. The lysosomal, mitochondrial, and cytosolic
fractions in the fibroblast (A) and neuronal cell (B) were separated and probed for
marker proteins LAMP2 (lysosomal), VDAC1 (mitochondrial), and MS (cytosolic)
by western blotting. The proportional distribution of [57Co] Cbl was expressed as the
percentage of cpm values in the fibroblast (C) and neuronal cell (D) and compared to
the control cells. Data are expressed as a single experiment. LF, lipofuscin; Lyso,
lysosome; Mito, mitochondria.
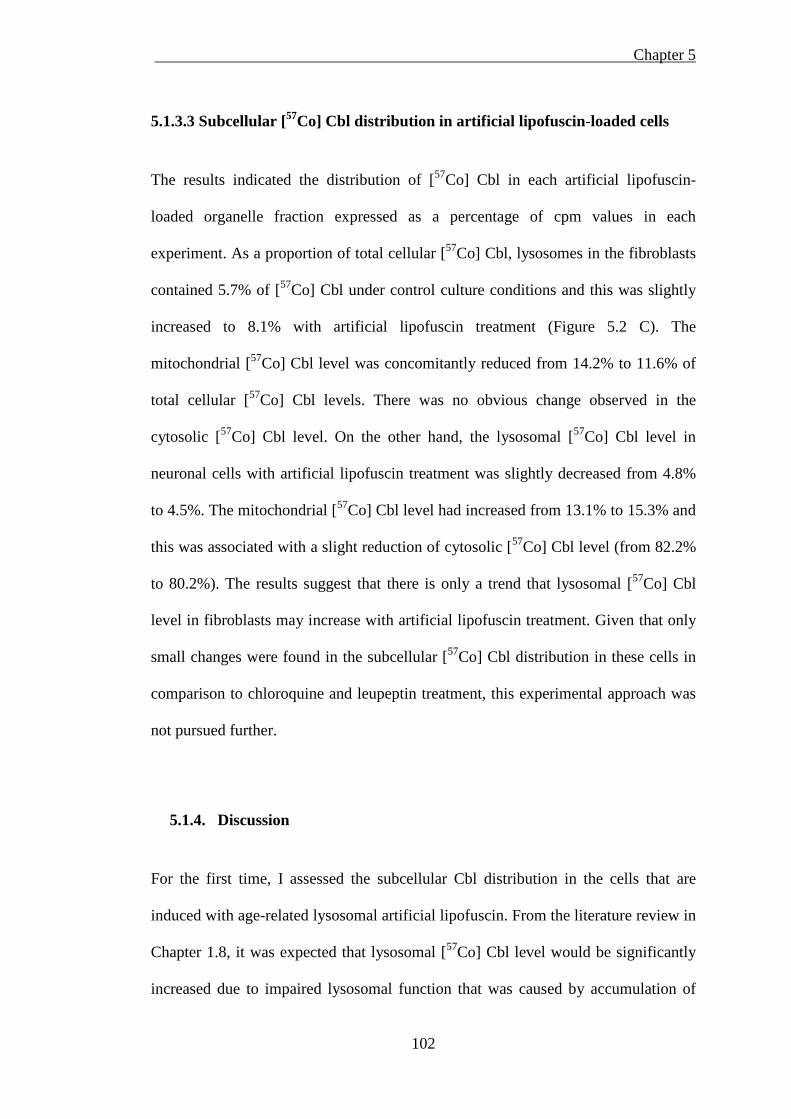
Chapter 5
102
5.1.3.3 Subcellular [57Co] Cbl distribution in artificial lipofuscin-loaded cells
The results indicated the distribution of [57Co] Cbl in each artificial lipofuscin-
loaded organelle fraction expressed as a percentage of cpm values in each
experiment. As a proportion of total cellular [57Co] Cbl, lysosomes in the fibroblasts
contained 5.7% of [57Co] Cbl under control culture conditions and this was slightly
increased to 8.1% with artificial lipofuscin treatment (Figure 5.2 C). The
mitochondrial [57Co] Cbl level was concomitantly reduced from 14.2% to 11.6% of
total cellular [57Co] Cbl levels. There was no obvious change observed in the
cytosolic [57Co] Cbl level. On the other hand, the lysosomal [57Co] Cbl level in
neuronal cells with artificial lipofuscin treatment was slightly decreased from 4.8%
to 4.5%. The mitochondrial [57Co] Cbl level had increased from 13.1% to 15.3% and
this was associated with a slight reduction of cytosolic [57Co] Cbl level (from 82.2%
to 80.2%). The results suggest that there is only a trend that lysosomal [57Co] Cbl
level in fibroblasts may increase with artificial lipofuscin treatment. Given that only
small changes were found in the subcellular [57Co] Cbl distribution in these cells in
comparison to chloroquine and leupeptin treatment, this experimental approach was
not pursued further.
5.1.4. Discussion
For the first time, I assessed the subcellular Cbl distribution in the cells that are
induced with age-related lysosomal artificial lipofuscin. From the literature review in
Chapter 1.8, it was expected that lysosomal [57Co] Cbl level would be significantly
increased due to impaired lysosomal function that was caused by accumulation of
Chapter 5
103
artificial lipofuscin in the lysosomal compartment (Brunk and Terman, 2002).
However, the results showed that lysosomal [57Co] Cbl level was not dramatically
changed in fibroblasts and neuronal cells. The slight increase in the lysosomal [57Co]
Cbl level in fibroblasts is opposite to the change in neuronal cells, which have an
unexpectedly slight decrease in the amount of lysosomal [57Co] Cbl. The induced
artificial lipofuscin in fibroblasts and neuronal cells has not obviously affected
lysosomal [57Co] Cbl transport.
It is noteworthy that the current method was not efficient for the induction of
artificial lipofuscin in this experiment. The procedure requires twelve 175 cm2
plastic flasks with 100% confluent cells so they can generate the minimum amount
of artificial lipofuscin when the mixed lysosomal and mitochondrial pellets were
exposed to UV light for peroxidation. Furthermore, the incorporation rate of artificial
lipofuscin into the cells was also not satisfactory. Only less than 5% of SH-SY5Y
cells were filled with fluorescent inclusions when lipofuscin loading concentration
was increased to 200 µg/ml. This may arise from the fact that HT1080 fibrosarcoma
cells and SH-SY5Y neuroblastoma cells are cancer cells, which are in a constant
proliferating and dividing state. The speed of division and overturning rate in these
cells is much faster than post-mitotic cells. The amount of induced artificial
lipofuscin in these proliferative cells may not be enough to accumulate in the
lysosomes and impair lysosomal function. This may explain the lack of obvious
change in lysosomal [57Co] Cbl level in fibroblasts and neuronal cells with lipofuscin
treatment. Further increasing lipofuscin loading concentration is expected to not only
promote lipofuscin cellular uptake, but also become toxic to cells and trigger cellular
apoptosis or necrosis. The current experimental method was, therefore, time-
Chapter 5
104
consuming and inefficient. Developing a novel technique that can more easily
produce and deliver artificial lipofuscin into the cells is vital to investigate the effect
of age-related lipofuscin on the Cbl intracellular transport in the near future.
5.2 Lysosomal [57Co] Cbl transport is impaired in Gaucher’s
disease
5.2.1. Introduction
GD is the most common lysosomal glycosphingolipid storage disease. GD is a
genetic disease caused by mutations in the GBA gene that result in an inherited
deficiency in the lysosomal enzyme GCase (Sillence, 2007). This in turn causes the
accumulation of lysosomal GlcCer mostly in the macrophage-derived cells and
neurons (Martin et al., 1989; Jmoudiak and Futerman, 2005; Molano et al., 2012;
Vitner and Futerman, 2013). It has been reported that GlcCer was located in the
endolysosomal membrane and modulated endolysosomal pH in lymphocytes
(Sillence, 2013). Thus, lysosomal function may be perturbed by the lysosomal pH
change in GD due to the accumulation of GlcCer, and that may impact on lysosomal
Cbl transport. I have shown that inhibition of lysosomal proteolysis in fibroblasts
and neuronal cells using both pH-dependent and -independent approaches suppresses
lysosomal function and causes lysosomal [57Co] Cbl accumulation, leading to
impaired lysosomal Cbl intracellular transport. Cbl intracellular transport is critically
dependent on its efficient transit through the intracellular lysosomal compartment.
As lysosomal function is affected by the accumulation of GlcCer, it is possible that
lysosomal Cbl transport may also be interrupted by dysfunctional lysosomes in GD.
Chapter 5
105
In addition, CBE is a competitive, irreversible inhibitor of GCase that is commonly
applied to induce acute GlcCer accumulation and pathologically mimic GD
phenotype (Newburg et al., 1988). Previous studies found that treating cells with
CBE specifically elevated GlcCer levels and caused GlcCer accumulation, while
other lysosomal hydrolase levels were unaffected (Daniels et al., 1980; Das et al.,
1987; Yatziv et al., 1988; Schwarz et al., 1995). CBE-treatment of macrophages
induced many morphological features of GD cells, including whole cell enlargement,
oriented fibrils and vacuolated cytoplasm, eccentric nucleus and enlarged vacuoles
with membranous structures (Newburg et al., 1988). This in vitro system displayed
many essential biological parameters relevant for studying the cellular events
responsible for the neurological damage that occurs in some types of GD. Thus, CBE
treatment has proved to be an invaluable tool in providing a chemically induced GD
phenotype. In the current experiment, I used CBE-treated SH-SY5Y cells and human
GD fibroblasts separately to induce GlcCer accumulation and investigate whether
intracellular Cbl transport was affected in these conditions.
5.2.2. Methods
5.2.2.1 Induction of GlcCer accumulation
To examine whether GlcCer was induced and accumulated in the CBE-treated
neuronal cells, total cellular lipid extraction was performed and GlcCer level was
measured. The neuronal cells were seeded into 6-well cell culture plates and
incubated with CBE (500 µM, Calbiochem, USA, Cat #234599) in DMEM
supplemented with 10% (v/v) FCS for 1 week at 37◦C. The cells were then rinsed
Chapter 5
106
with PBS. The cells were treated with 50 µl mass spectrometry standards and 450 µl
methanol for 15 min before transferring into Eppendorf tubes. The cells were then
added to 1,500 µl methyl tert-butyl ether and sonicated in a water bath for 15 min.
Next, the tubes were centrifuged at 16,000 × g for 5 min. The supernatant was
removed and placed into clean Eppendorf tubes. Finally, the supernatant was dried
completely with nitrogen gas. The GlcCer was extracted and quantified using liquid
chromatography-mass spectrometry (LC-MS, Thermo Scientific, USA) analysis
provided by Dr Anthony Don at the University of New South Wales (Hejazi et al.,
2011). In addition, total cellular lipids were also extracted and measured for the
concentration of GlcCer in the human healthy foreskin fibroblasts and human GD
fibroblasts.
5.2.2.2 [57Co] Cbl labelling and western blotting
After GlcCer accumulation was observed in neuronal cells with CBE treatment and
in GD cells, the neuronal cells were incubated with CBE (500 µM) for 1 week at
37◦C, followed by incubation with 0.025 µCi/ml [57Co] Cbl in DMEM with 10%
(v/v) HS for 48 h at 37◦C. The control and GD cells were grown separately until they
reached approximately 80% confluence, they were then incubated with 0.025 µCi/ml
[57Co] Cbl in DMEM with 10% (v/v) HS and 1% (v/v) non-essential amino acid for
48 h at 37◦C. All of the cells were then homogenised and cell fractions were
collected, followed by subcellular fractionation as described previously (Chapter 2,
section 2.4). Isolated cellular fractions containing lysosomes, mitochondria, and
cytosol were probed for appropriate organelle markers by western blotting:
lysosome: LAMP2; mitochondria: VDAC1; and cytosol: MS.
Chapter 5
107
5.2.3. Results
5.2.3.1 GlcCer is induced in the CBE-treated neuronal cells but has no effect on
lysosomal [57Co] Cbl level
The GlcCer level was measured and analysed by LC-MS to examine whether GlcCer
was induced and accumulated in the CBE-treated neuronal cells. The results
demonstrated that total GlcCer level in the CBE-treated cells was dramatically
increased more than 11-fold (from 35 pg/mol to 460 pg/mol) compared to the control
cells. This indicates that GlcCer was induced by CBE treatment and lysosomal
GlcCer accumulation may occur in the CBE-treated neuronal cells (Figure 5.3 A).
The western blot results from CBE-treated neuronal cells demonstrated a similar
distribution of organelle markers compared to the cells incubated under control
conditions (Figure 4.4 A and B). Pure lysosomes (LAMP2-positive fractions #1 –
#5) were separated from mitochondria (VDAC1-positive fractions #6 – #9) in the
CBE-treated neuronal cells (Figure 5.3 B). The organelle fractions were free of
detectable MS whereas a clear MS signal was detected in the cytosolic fractions (#1
– #4).
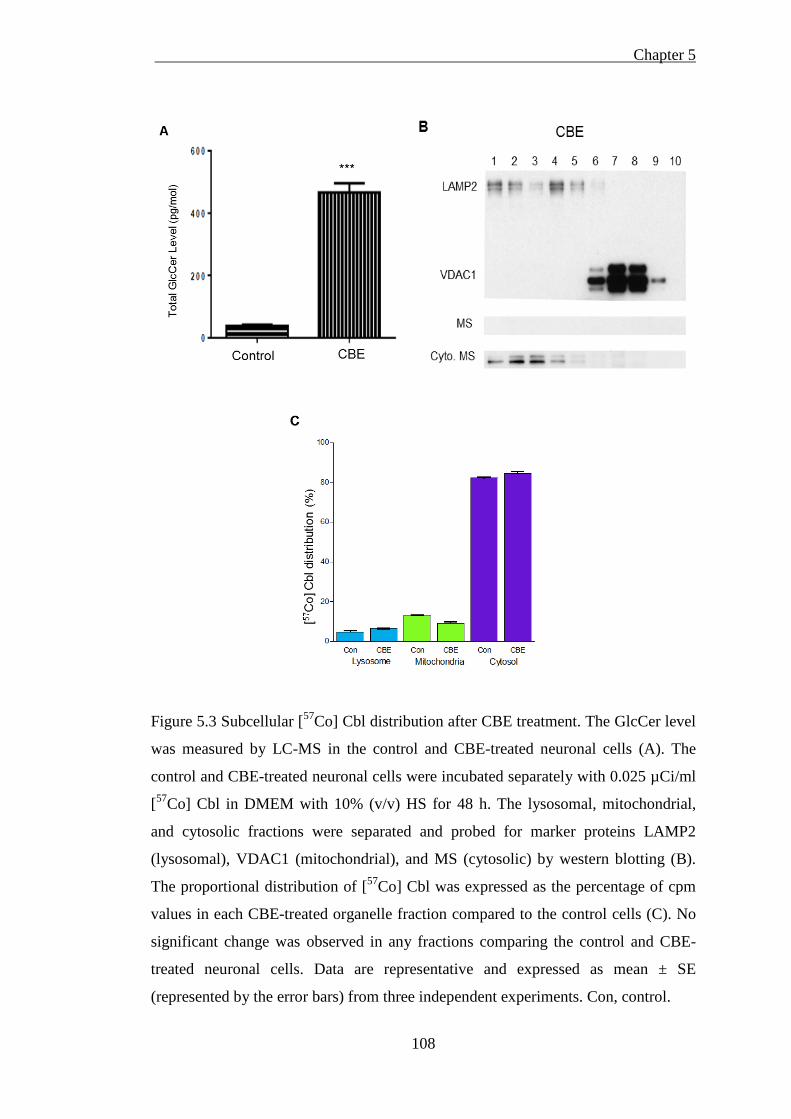
Chapter 5
108
Figure 5.3 Subcellular [57Co] Cbl distribution after CBE treatment. The GlcCer level
was measured by LC-MS in the control and CBE-treated neuronal cells (A). The
control and CBE-treated neuronal cells were incubated separately with 0.025 µCi/ml
[57Co] Cbl in DMEM with 10% (v/v) HS for 48 h. The lysosomal, mitochondrial,
and cytosolic fractions were separated and probed for marker proteins LAMP2
(lysosomal), VDAC1 (mitochondrial), and MS (cytosolic) by western blotting (B).
The proportional distribution of [57Co] Cbl was expressed as the percentage of cpm
values in each CBE-treated organelle fraction compared to the control cells (C). No
significant change was observed in any fractions comparing the control and CBE-
treated neuronal cells. Data are representative and expressed as mean ± SE
(represented by the error bars) from three independent experiments. Con, control.
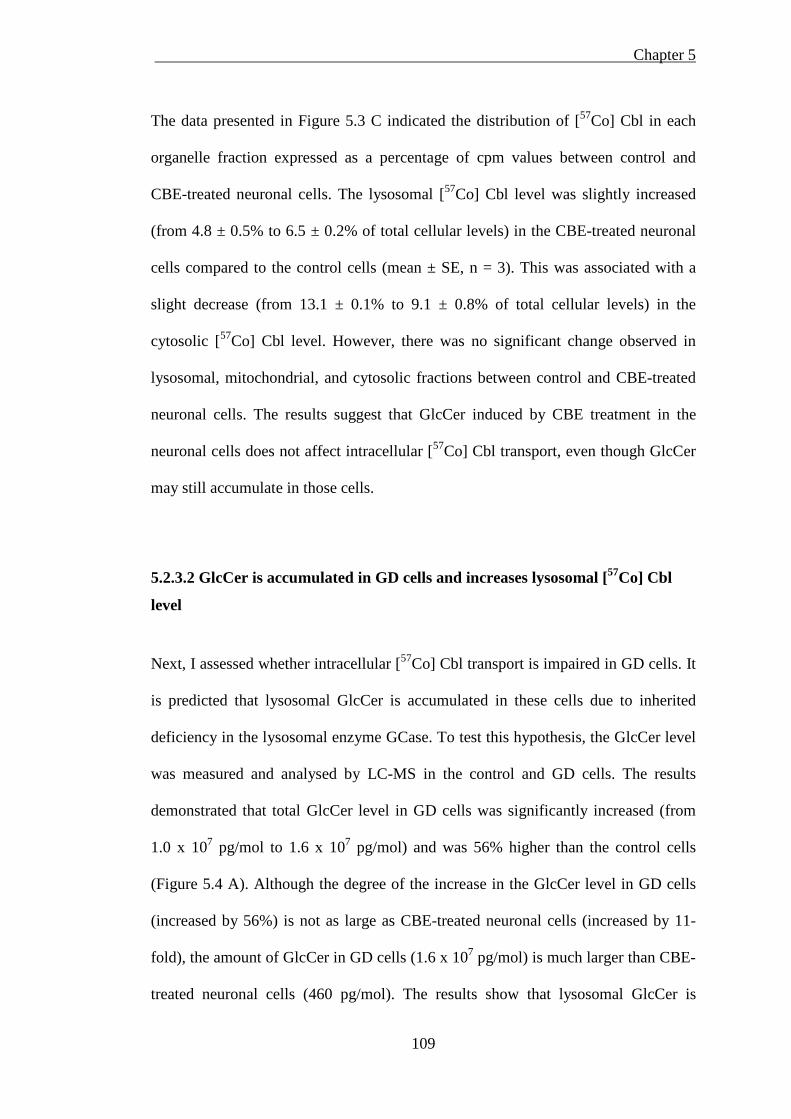
Chapter 5
109
The data presented in Figure 5.3 C indicated the distribution of [57Co] Cbl in each
organelle fraction expressed as a percentage of cpm values between control and
CBE-treated neuronal cells. The lysosomal [57Co] Cbl level was slightly increased
(from 4.8 ± 0.5% to 6.5 ± 0.2% of total cellular levels) in the CBE-treated neuronal
cells compared to the control cells (mean ± SE, n = 3). This was associated with a
slight decrease (from 13.1 ± 0.1% to 9.1 ± 0.8% of total cellular levels) in the
cytosolic [57Co] Cbl level. However, there was no significant change observed in
lysosomal, mitochondrial, and cytosolic fractions between control and CBE-treated
neuronal cells. The results suggest that GlcCer induced by CBE treatment in the
neuronal cells does not affect intracellular [57Co] Cbl transport, even though GlcCer
may still accumulate in those cells.
5.2.3.2 GlcCer is accumulated in GD cells and increases lysosomal [57Co] Cbl
level
Next, I assessed whether intracellular [57Co] Cbl transport is impaired in GD cells. It
is predicted that lysosomal GlcCer is accumulated in these cells due to inherited
deficiency in the lysosomal enzyme GCase. To test this hypothesis, the GlcCer level
was measured and analysed by LC-MS in the control and GD cells. The results
demonstrated that total GlcCer level in GD cells was significantly increased (from
1.0 x 10⁷ pg/mol to 1.6 x 10⁷ pg/mol) and was 56% higher than the control cells
(Figure 5.4 A). Although the degree of the increase in the GlcCer level in GD cells
(increased by 56%) is not as large as CBE-treated neuronal cells (increased by 11-
fold), the amount of GlcCer in GD cells (1.6 x 10⁷ pg/mol) is much larger than CBE-
treated neuronal cells (460 pg/mol). The results show that lysosomal GlcCer is
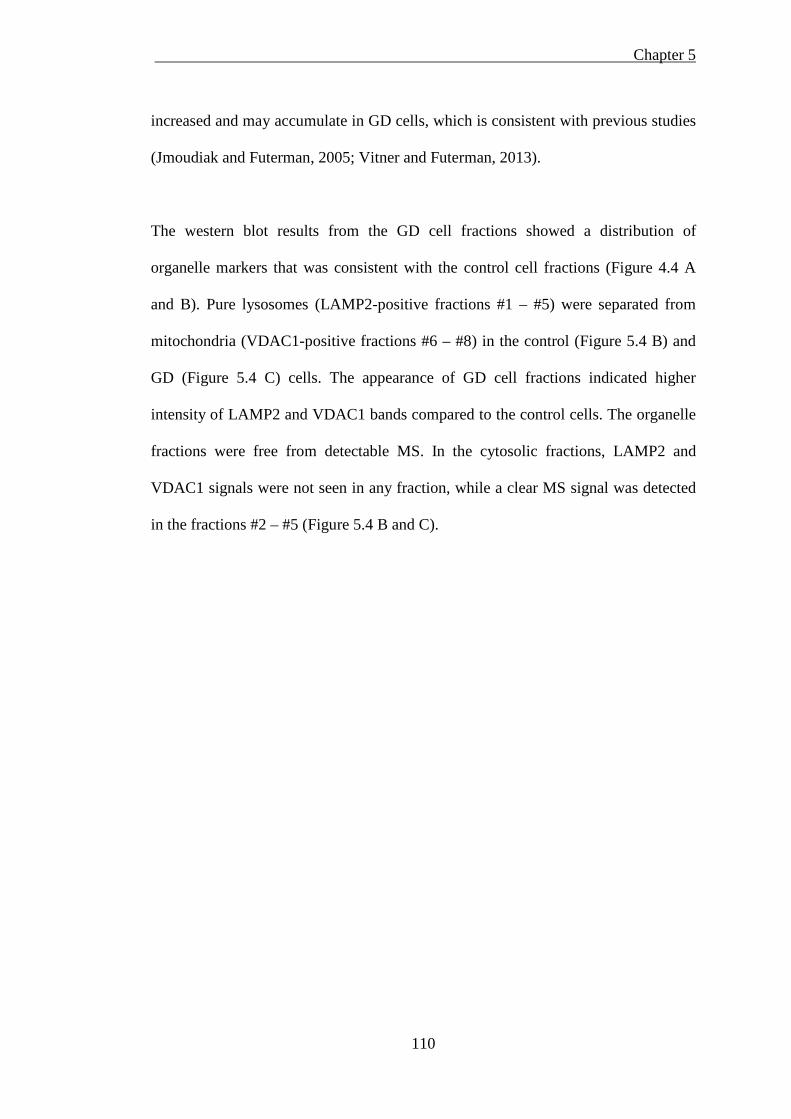
Chapter 5
110
increased and may accumulate in GD cells, which is consistent with previous studies
(Jmoudiak and Futerman, 2005; Vitner and Futerman, 2013).
The western blot results from the GD cell fractions showed a distribution of
organelle markers that was consistent with the control cell fractions (Figure 4.4 A
and B). Pure lysosomes (LAMP2-positive fractions #1 – #5) were separated from
mitochondria (VDAC1-positive fractions #6 – #8) in the control (Figure 5.4 B) and
GD (Figure 5.4 C) cells. The appearance of GD cell fractions indicated higher
intensity of LAMP2 and VDAC1 bands compared to the control cells. The organelle
fractions were free from detectable MS. In the cytosolic fractions, LAMP2 and
VDAC1 signals were not seen in any fraction, while a clear MS signal was detected
in the fractions #2 – #5 (Figure 5.4 B and C).
Chapter 5
111
Figure 5.4 Subcellular [57Co] Cbl distribution in GD cells. The GlcCer was measured
by LC-MS in the control and GD cells (A). The control and GD cells were incubated
separately with 0.025 µCi/ml [57Co] Cbl in DMEM with 10% (v/v) HS for 48 h. The
lysosomal, mitochondrial, and cytosolic fractions in the control (B) and GD (C) cells
were separated and probed for marker proteins LAMP2 (lysosomal), VDAC1
(mitochondrial), and MS (cytosolic) by western blotting. The proportional
distribution of [57Co] Cbl was expressed as the percentage of cpm values in each GD
cell organelle fraction compared to the control cells (D). The lysosomal [57Co] Cbl
level was significantly increased in GD cells. Data are representative and expressed
as mean ± SE (represented by the error bars) from three independent experiments. *P
< 0.05, ** P < 0.01. Con, control; GD, Gaucher disease.
Chapter 5
112
The data presented in Figure 5.4 D indicated the distribution of [57Co] Cbl in each
organelle fraction expressed as a percentage of cpm values between control and GD
cells. According to the distribution of lysosomes and mitochondria from the western
blot, isolated lysosomes contained 8.4 ± 0.4% of total cellular [57Co] Cbl in the
control cells and the amount of [57Co] Cbl was doubled to 17.6 ± 2.2 % in GD cells
(mean ± SE, n = 3). This retention of [57Co] Cbl in the lysosomes was associated
with a significant 10% decrease (from 87.3 ± 1.1% to 77.3 ± 1.6% of total cellular
levels) in the cytosolic [57Co] Cbl level. There was no significant change in the
mitochondrial [57Co] Cbl level in GD cells compared to control cells. The results
suggest that GlcCer accumulation in GD cells may cause lysosomal dysfunction that
increases lysosomal [57Co] Cbl level and impairs lysosomal Cbl transport.
5.2.4. Discussion
The GD cell model was selected for the current experiment because it is a known
lysosomal glycosphingolipid storage disease, which has inherited deficiency in the
lysosomal enzyme GCase, causing the accumulation of lysosomal GlcCer. This
disease inhibits lysosomal function and GlcCer accumulation may increase
lysosomal pH (Sillence, 2013). Consistent with previous results using lysosomal
hydrolase inhibition in Chapter 4, the lysosomal [57Co] Cbl level was doubled in the
GD cells derived from a patient compared to the human healthy foreskin fibroblasts.
This increase is possibly due to GlcCer accumulation in GD cells as total GlcCer
level has a significant increase. The subcellular [57Co] Cbl distribution is affected
and lysosomal [57Co] Cbl transport is impaired in GD cells. It is noteworthy that the
lysosomal [57Co] Cbl level in the healthy foreskin fibroblasts (8.4 ± 0.4%, all means
Chapter 5
113
± SE, n = 3) is higher than SH-SY5Y neuronal cellal cells (4.8 ± 0.5%, all means ±
SE, n = 3). As total GlcCer level in the healthy fibroblasts (1.0 x 10⁷ pg/mol) is
much greater than in the neuroblastoma cells (35 pg/mol), it is speculated that
GlcCer may at least partly contribute to the increase of lysosomal [57Co] Cbl level.
Surprisingly, although CBE treatment caused an acute remarkable increase in the
GlcCer level in the SH-SY5Y cells as expected, the lysosomal [57Co] Cbl levels in
the CBE-treated cells remain statistically unchanged. This result may arise from two
possible reasons. Firstly, the absolute value of total GlcCer level in the SH-SY5Y
cells (460 pg/mol) is much less than in GD cells (1.0 x 10⁷ pg/mol), which means
that GlcCer is induced by CBE treatment compared to the control cells, but the
GlcCer may not accumulate in the SH-SY5Y cells or the amount of GlcCer is not
large enough to affect lysosomal function. Secondly, different from foreskin
fibroblasts and GD fibroblasts, SH-SY5Y neuroblastoma cells are cancer cells that
are in a constant proliferating and dividing state. The cell division and overturning
rate is much faster than those post-mitotic cells. Different from GD cells that have a
genetic defect in the lysosomal enzyme Gcase, CBE induces acute GlcCer
accumulation by inhibiting Gcase. Once GlcCer is induced by CBE treatment in the
SH-SY5Y cells, it is rapidly divided and distributed into newly synthesized daughter
cells. Thus, during cell division, the divided relative small amount of GlcCer may
not have enough time to accumulate in these proliferating active cells. Nonetheless,
although other possible explanations can not be ruled out, CBE has an acute effect
on inducing GlcCer, but GlcCer seems not to sufficiently accumulate in the SH-
SY5Y cells and subsequently may not interrupt lysosomal [57Co] Cbl transport.
Chapter 5
114
5.3 Conclusions
As an inherited lysosomal glycosphingolipid storage disease, GD inhibits lysosomal
function and causes the accumulation of lysosomal GlcCer. Lysosomal [57Co] Cbl
transport is impaired in GD cells and this effect is correlated with the increase of
lysosomal GlcCer. However, exogenous intervention induced by the generation of
either artificial lipofuscin or CBE-derived lysosomal GlcCer may perturb lysosomal
function, but does not have a significant impact on lysosomal [57Co] Cbl transport.
The reason is not fully elucidated and may arise from inefficient penetration of these
materials into the cells or due to the nature of cell itself in a constant proliferating
and dividing state.
Chapter 6
115
Chapter 6
Impaired lysosomal cobalamin
transport in Alzheimer’s disease
Chapter 6
116
Impaired lysosomal cobalamin transport in Alzheimer’s 6
disease
6.1 Introduction
AD is a progressive neurodegenerative disorder characterised by a gradual loss of
memory, orientation, judgment and reasoning. Several genetic mutations, in APP,
PS1 and PS2 cause early-onset familial AD (Williamson et al., 2009). The vast
majority of AD is, however, of the late-onset type for which genes including APOE
and ABCA7 confer increased risk (Bettens et al., 2013). Despite the increased AD
risk associated with such genes, there are many aspects related to the initiation and
progression of AD pathology that remain unclear. The characteristic
neuropathological alterations of AD include neuronal loss in the cerebral cortex and
hippocampus, the presence of abnormal neurofibrillary tau tangles within the
neurons, and the accumulation of insoluble deposits of amyloid plaques surrounding
the neurons (Williamson et al., 2009; De-Paula et al., 2012). The main component of
amyloid plaques is the highly hydrophobic 39-43 amino acid Aβ peptide. Aβ is
generated after sequential cleavage of APP by β- and γ- secretases (Wilquet and De
Strooper, 2004; Nixon, 2007).
The incubation of cultured primary neurons with soluble Aβ42 causes the
accumulation of Aβ42 in the lysosomes due to the fact that intracellular Aβ42 is
relatively resistant to protease degradation (Ditaranto et al., 2001; Chafekar et al.,
2008). The increased levels of intralysosomal Aβ stimulate free radical generation
within lysosomes, disrupt lysosomal membrane proton gradient, impair lysosomal
Chapter 6
117
function which together result in a more rapid Aβ accumulation and aggregation
(Ditaranto et al., 2001). This may initate a vicious cycle as neuronal oxidative stress
induces further lysosomal Aβ accumulation via increased autophagy induction and
decreased lysosomal clearance (Zheng et al., 2009; Zheng et al., 2011). The
accumulation of Aβ in the lysosome has also been reported in AD animal models
(Langui et al., 2004). In APPxPS1 transgenic AD mice, lysosomal function is
continually up-regulated and the levels of lysosomal enzymes are increased in the
hippocampus and frontal cortex (Amritraj et al., 2009). This possibly reflects cellular
responses to the failed degradation of the accumulating Aβ which results in a gradual
accumulation of partially degraded “residual bodies” as neurons become
compromised and AD progresses (Yang et al., 2011). It is therefore clear that
lysosomal function is disturbed in AD and lysosomal membrane becomes vulnerable
and ruptures when accumulated Aβ combines with other undegraded material to
induce oxidative stress (Yang et al., 1998; Pasternak et al., 2004; Zheng et al.,
2006).
I have demonstrated that inhibition of lysosomal proteolysis using both pH-
dependent and -independent approaches impair lysosomal Cbl intracellular transport
which leads to the accumulation of Cbl in the lysosomal compartment in fibroblasts
and neuronal cells. Given the critical role that the lysosome plays in Cbl metabolism,
and the fact that lysosomal function deteriorates in AD, it is possible that lysosomal
Cbl transport may also be interrupted by dysfunctional lysosomes in AD (Zhao et al.,
2011). Lysosomal acidification is defective in AD and lysosomal proteolysis is
disrupted by an AD-related PS1 mutation (Lee et al., 2010; Wolfe et al., 2013). I
propose that this may be a significant factor responsible for the cognitive decline in
Chapter 6
118
AD patients as the impaired transit of Cbl through lysosomes, particularly in long-
lived post-mitotic cells such as neurons. If this hypothesis is correct it may explain
why Cbl administration has not yielded a consistent therapeutic benefit in AD
patients as the supplemented dose may not reach its correct intracellular targets. If
such lysosomal dysfunction is present in vivo, this could identify a pathway that
might be targeted to improve neuronal Cbl utilisation and reduce the production of
neurotoxic metabolites that accumulate when the coenzyme forms of Cbl do not
reach their correct enzyme targets.
In the present study, SH-SY5Y-APP mutant cells were treated with a reversible 20S
and 26S proteasome inhibitor, MG-115, to induce lysosomal Aβ accumulation
(Agholme et al., 2012). The [57Co] Cbl levels in the lysosomes, mitochondria, and
cytosol were measured to assess whether lysosomal Cbl transport is affected in these
cells. In the in vivo study, C57BL/6J WT mice and APPxPS1 transgenic AD mice
were i.p. injected with [57Co] Cbl. The amount of [57Co] Cbl in the major organs of
these mice was measured and the subcellular [57Co] Cbl distribution in the brain was
assessed.
6.2 Methods
6.2.1. Cell culture and induction of lysosomal Aβ accumulation
The SH-SY5Y-APP cells were generated in the laboratory of Prof Ashley Bush by
transfecting SH-SY5Y neuroblastoma cells with an APP cDNA containing the
Chapter 6
119
Swedish mutation (swAβPP695) cloned into the pIRESpuro2 vector (Li et al., 2012).
The cells were cultured in DMEM supplemented with 10% (v/v) FCS, 100 µg/ml
penicillin/streptomycin, 2 mM L-glutamine, and 2µg/ml puromycin (Sigma, USA,
Cat #P9620), at 37˚C in a humidified atmosphere containing 5% (v/v) CO2 until they
reached approximately 70% confluence.
To investigate whether the AD-derived lysosomal Aβ accumulation alters
intracellular Cbl transport, the SH-SY5Y-APP cells were treated with proteasome
inhibitor MG-115 (0.5 µM, Sigma, USA, Cat #SCP0005)) for 48 h at 37˚C, a
technique previously shown to induce intralysosomal Aβ accumulation (Agholme et
al., 2012). The cells were then metabolically labeled with [57Co] Cbl (0.025 µCi/ml)
in DMEM with 10% (v/v) HS in the presence of MG-115 (0.5 µM) for 48 h at 37˚C.
The cells were then homogenised and cell fractions were collected, followed by
subcellular fractionation as described previously (Chapter 2, section 2.4).
6.2.2. Enzyme-linked immunosorbent assay (ELISA) analysis of
intracellular Aβ40 and Aβ42 levels
The quantification of Aβ40 and Aβ42 in each lysosomal and mitochondrial fraction
from SH-SY5Y-APP cells with the MG-115 treatment was achieved using
Colorimetric BetaMark x-40 and x-42 ELISA kits (Covance, Cat #SIG-38954 and
SIG-38956) following the manufacturer's instructions. Samples were diluted 1:8
(Aβ40) or 1:4 (Aβ42) and assayed in duplicate. The ELISA protocol involves three
main steps:
A. Preparation of working incubation buffer
Chapter 6
120
The incubation buffer (10 ml) was diluted in 10 ml of Milli-Q water in a 50 ml
plastic tube. The HRP detection antibody (10 µl) was added to the mixture and
vortexed thoroughly to ensure proper mixing.
B. Preparation of the samples
The fraction samples were diluted in PBS in 1:4 for Aβ40 and 1:2 for Aβ42. They
were further diluted 1:2 in working incubation buffer and mixed well by inverting
the tube.
C. Preparation of the standards
The standards were prepared in two steps:
a. Preparation of standard intermediates
Eppendorf tubes were labelled as intermediate 1 & 2 and 990 µl of the standard
diluents were added to each tube. The x-40 and x-42 standards (20 µg) were
reconstituted with 80 µl of the same standard diluents. The contents of the tubes
were mixed well and then incubated for 30 min at 22◦C. After incubation, the
intermediate 1 & 2 were prepared as shown in Table 6.1.

Chapter 6
121
Table 6.1 Preparation of ELISA standard intermediates.
b. Preparation of Standards
Eppendorf tubes were labelled as 1 to 8 for the preparation of the standards. The
standard intermediate 2 and the working incubation buffer were aliquoted to make
1.8 fold serial dilutions as shown in Table 6.2.
Tube Number
Volume of Standard (µl)
Volume of Working Incubation Buffer
(µl)
Final Concentration
(pg/ml)
1 10 Intermediate 2 990 250.0 2 600 of 1 500 of 1 480 400 138.9
3 600 of 2 500 of 2 480 400 77.2
4 600 of 3 500 of 3 480 400 42.9
5 600 of 4 500 of 4 480 400 23.8
6 600 of 5 500 of 5 480 400 13.2
7 600 of 6 500 of 6 480 400 7.4
8 0 0 480 400 0
Volumes for Aβ40, Volumes for Aβ42
Table 6.2 Preparation of ELISA standards.
Tube Number
Volume of Standard
(µl)
Volume of Standard Diluent
(µl)
Final Concentration
(ng/ml) Reconstituted
Standard 0 80 250 000
Intermediate 1
10 of Reconstituted Standard
990 2 500
Intermediate 2
10 of Intermediate 1
990 25
Chapter 6
122
Next, an ELISA plate was prewashed with 300 µl of washing buffer. The standard
and the samples (100 µl) were added to each well in using a multi-channel pipette.
The ELISA plate was covered with plate sealer and incubated for 16 h at 37◦C to
allow the antigen-antibody binding to occur.
On the next day, the plate was emptied and washed with 300 µl of washing buffer 5
times. The washing process used a platform shaker for 5 min each time to ensure
vigorous washing. The plate was patted dry after the washing. Next, the TMB
substrate (3,3',5,5'-tetramethylbenzidine, 200 µl) was added to each well. The plate
was covered and incubated for 45 min for Aβ40 and 42 min for Aβ42 at 22◦C. After
incubation, the absorbance was measured at 620 nm using a microtitre plate reader
(Spectra Max, Bio Strategy, USA). The average absorbance of standards was used to
plot the standard curve and the samples were quantified using the standard curve.
6.2.3. Western blotting
For SH-SY5Y-APP cultured cell fractions, the detail for identifying the fractions
containing lysosomes, mitochondria, and cytosol using appropriate antibodies for
marker proteins was described in Chapter 2, section 2.5. For mouse brain
homogenates, proteins were probed with an anti-Aβ WO2 mouse monoclonal
antibody (1:200; provided by Dr. Qiao-Xin Li and Prof. Colin Masters, University of
Melbourne, Australia) and HRP-conjugated rabbit anti-mouse (1:4,000, Dako,
Australia). The blots were rinsed in PBS, and the proteins were detected using
enhanced chemiluminescence. The membranes were exposed to ECL hyperfilm,
Chapter 6
123
which was developed and scanned, and the signal intensity was quantified using NIH
Image software.
6.2.4. In vivo mouse study
To examine subcellular [57Co] Cbl distribution in lysosomes, mitochondria, and
cytosol obtained from the brain, an in vivo study was performed using three 12-
month-old male C57BL/6J WT mice and three 12-month-old male APPxPS1
transgenic AD mice. APPxPS1 transgenic AD mice were purchased from Jackson
lab (strain name: B6.Cg-Tg (AβPPswePSEN1dE9)85Dbo/J), and maintained at the
Australian BioResources facility (Moss Vale, Australia). This study was approved
by the University of Wollongong Animal Ethics Committee and was performed in
accordance with the EU Directive 2010/63/EU for animal experiments.
The mice were i.p. injected with 4 µCi [57Co] Cbl in a volume of 0.2 ml sterile saline
(0.9%, (w/v) NaCl) for 72 h. As described previously (Zhao et al., 2013), the mice
were weighed immediately before the time of injection and again just prior to
sacrifice. After 72 h, the mice were sacrificed, and blood samples were collected
using a cardiac puncture. The mice were then transcardially perfused with PBS, and
the brain, liver, kidneys, spleen, and heart were dissected and collected. The plasma
was extracted from the blood by centrifuging at 3,000 g for 15 min at 4˚C. All of the
tissues were weighed. The amount of [57Co] Cbl radioactivity in each organ and
plasma was measured as cpm values using a gamma counter. In the current
experiment, only the brain was used to perform organelle separation. The
quantification of Aβ40 and Aβ42 in each WT and APPxPS1 AD mouse brain was
Chapter 6
124
measured by ELISA. The brains were rinsed with PBS and cut into small pieces (< 3
mm3). The brain were then homogenised and cell fractions were collected, followed
by subcellular fractionation as described previously (Chapter 2, section 2.4).
6.2.5. Histology and immunohistochemistry
To identify amyloid plaques in the WT and APPxPS1 AD mouse brains, free-
floating sagittal sections (45 μm) were immersed in distilled H2O (2 min) followed
by Harris haemotoxylin (2 min), distilled H2O (3 min), 1% (w/v) thioflavine S (ThS,
Sigma, USA, Cat #T1892, 3 min), distilled H2O (3 min), 1% (v/v) acetic acid (20
min), and distilled H2O (3 min), and then mounted onto gelatin-coated slides as
described previously (Kim et al., 2013). Three sections per mouse were analysed
from the hippocampal region between lateral 1 mm to lateral 2 mm from the midline
as defined using a mouse brain atlas. Images were captured using a Nikon TE2000
microscope equipped with a SPOT digital camera (Diagnostic Instruments) and
Image-Pro Plus 6.1 software (Media Cybernetics).
For amyloid immunohistochemistry, the mouse brain was fixed in 4%
paraformaldehyde and was cut at 40 μm by a cryostat (Leica CM1860, USA). The
sagittal sections were washed with PBS and blocked with 5% (v/v) donkey serum,
then incubated with biotin-conjugated anti-Aβ 6E10 monoclonal antibody (1:5,000,
Covance, USA, Cat #SIG39300) for 24 h at 4˚C. After washing with PBS, the
sections were incubated with streptavidin-peroxidase polymer (1:4,000, Sigma,
USA, Cat#S2438) for 2 h at 22˚C. The sections were developed using 3,3'-
diaminobenzidine substrate with metal enhancer (Sigma, USA, Cat #D0426). Images
Chapter 6
125
were taken using a Nikon Eclipse TS100 microscope equipped with a Nikon Coolpix
8400 digital camera (Coherent Scientific, Australia).
6.3 Results
6.3.1. Isolation of lysosomes, mitochondria and cytosol from SH-SY5Y-APP
cells
SH-SY5Y-APP cell organelles were separated through an OptiPrep density gradient
to yield pure lysosomes, mitochondria and cytosol. Western blot analysis of the
organelle fractions revealed that pure lysosomes (LAMP2 positive fractions #1 – #6)
were separated from mitochondria (VDAC1 positive fractions #7 – #9) in the control
cells (Figure 6.1 A). In the MG-115-treated cells, pure lysosomes were located in
fractions #1 – #6 and mitochondria were detected in fractions #7 – #9 with minor
lysosome/mitochondria cross-contamination in fraction #7 (Figure 6.1 B). In this
case the lysosome cpm value in that fraction was estimated based on the LAMP2
optical density and comparison with the closest “clean” LAMP2 fractions (i.e.
fractions #5 and #6). After subtraction of the estimated lysosomal cpm in fractions
#7, the remaining cpm was assigned as mitochondrial. The organelle fractions in
both the control and SH-SY5Y-APP cells contained only trace amounts of β-actin
and were free of detectable MS, whereas clear signals for both β-actin and MS were
detected in the cytosolic fractions.
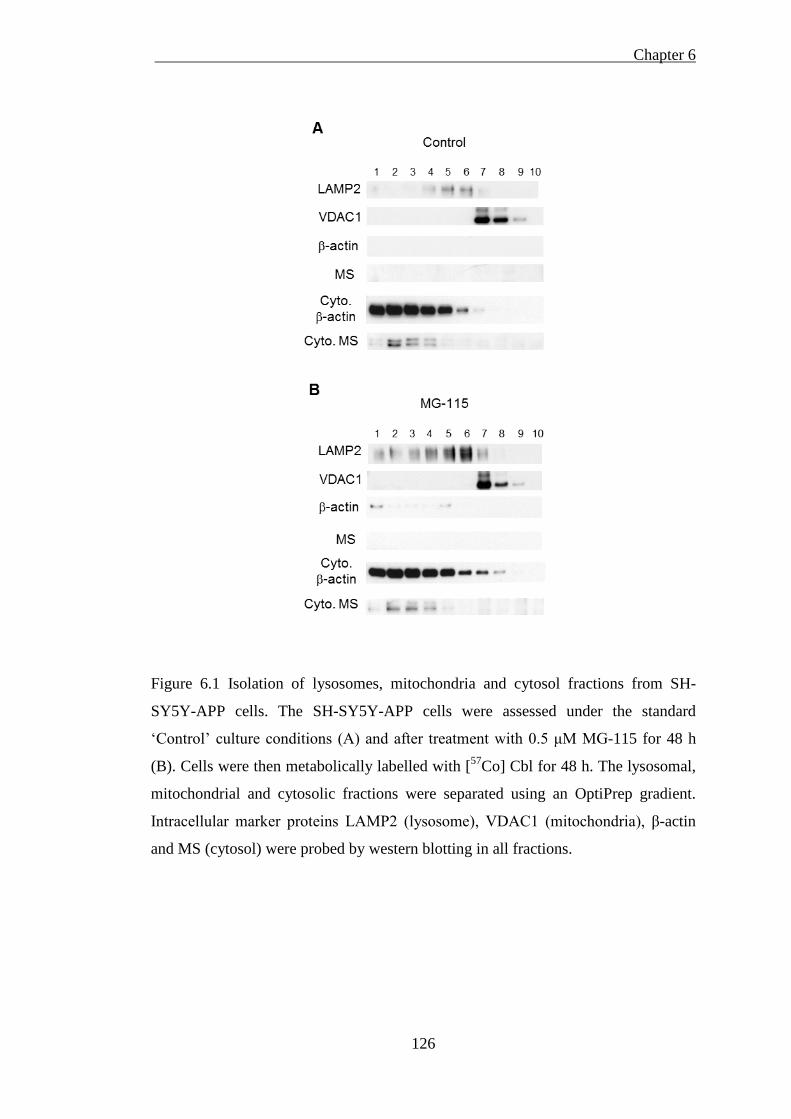
Chapter 6
126
Figure 6.1 Isolation of lysosomes, mitochondria and cytosol fractions from SH-
SY5Y-APP cells. The SH-SY5Y-APP cells were assessed under the standard
‘Control’ culture conditions (A) and after treatment with 0.5 μM MG-115 for 48 h
(B). Cells were then metabolically labelled with [57Co] Cbl for 48 h. The lysosomal,
mitochondrial and cytosolic fractions were separated using an OptiPrep gradient.
Intracellular marker proteins LAMP2 (lysosome), VDAC1 (mitochondria), β-actin
and MS (cytosol) were probed by western blotting in all fractions.
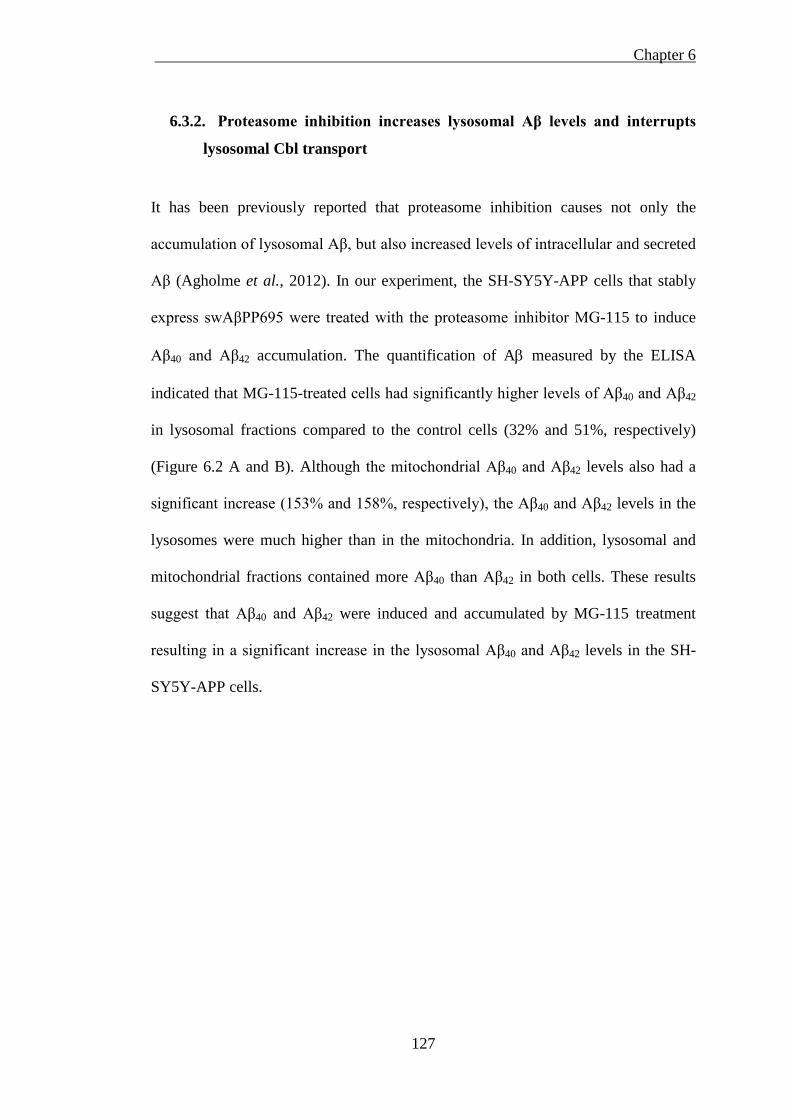
Chapter 6
127
6.3.2. Proteasome inhibition increases lysosomal Aβ levels and interrupts
lysosomal Cbl transport
It has been previously reported that proteasome inhibition causes not only the
accumulation of lysosomal Aβ, but also increased levels of intracellular and secreted
Aβ (Agholme et al., 2012). In our experiment, the SH-SY5Y-APP cells that stably
express swAβPP695 were treated with the proteasome inhibitor MG-115 to induce
Aβ40 and Aβ42 accumulation. The quantification of Aβ measured by the ELISA
indicated that MG-115-treated cells had significantly higher levels of Aβ40 and Aβ42
in lysosomal fractions compared to the control cells (32% and 51%, respectively)
(Figure 6.2 A and B). Although the mitochondrial Aβ40 and Aβ42 levels also had a
significant increase (153% and 158%, respectively), the Aβ40 and Aβ42 levels in the
lysosomes were much higher than in the mitochondria. In addition, lysosomal and
mitochondrial fractions contained more Aβ40 than Aβ42 in both cells. These results
suggest that Aβ40 and Aβ42 were induced and accumulated by MG-115 treatment
resulting in a significant increase in the lysosomal Aβ40 and Aβ42 levels in the SH-
SY5Y-APP cells.
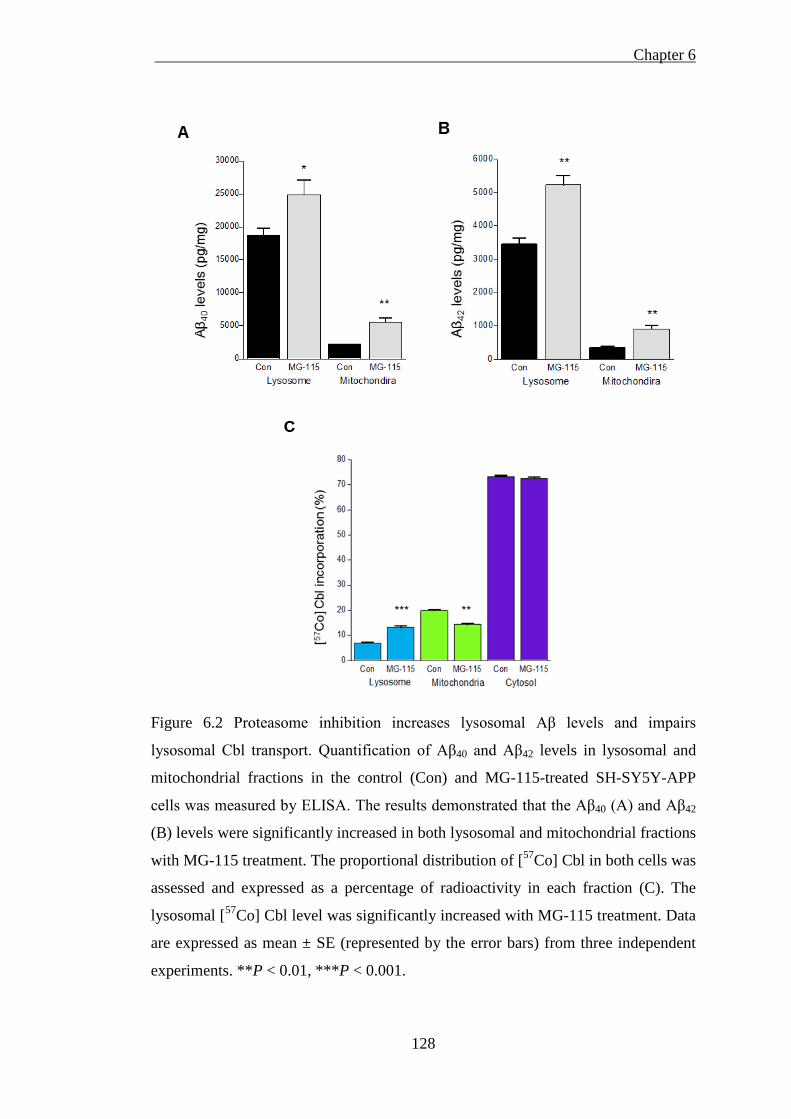
Chapter 6
128
Figure 6.2 Proteasome inhibition increases lysosomal Aβ levels and impairs
lysosomal Cbl transport. Quantification of Aβ40 and Aβ42 levels in lysosomal and
mitochondrial fractions in the control (Con) and MG-115-treated SH-SY5Y-APP
cells was measured by ELISA. The results demonstrated that the Aβ40 (A) and Aβ42
(B) levels were significantly increased in both lysosomal and mitochondrial fractions
with MG-115 treatment. The proportional distribution of [57Co] Cbl in both cells was
assessed and expressed as a percentage of radioactivity in each fraction (C). The
lysosomal [57Co] Cbl level was significantly increased with MG-115 treatment. Data
are expressed as mean ± SE (represented by the error bars) from three independent
experiments. **P < 0.01, ***P < 0.001.
Chapter 6
129
Next, I assessed the impact that Aβ40 and Aβ42 accumulation induced by the
proteasome inhibitor MG-115 may have on subcellular [57Co] Cbl distribution. The
incorporation of [57Co] Cbl in each organelle was expressed as a percentage of cpm
value. According to the distribution of lysosomes and mitochondria from the western
blots, isolated lysosomes contained 7.0 ± 0.2% of the total cellular [57Co] Cbl in the
control cells, and this amount was almost doubled to 13.2 ± 0.7% with MG-115
treatment (mean ± SE, n = 3, Figure 6.2 C). This retention of [57Co] Cbl in the
lysosomes was concomitant with a significant reduction in mitochondrial [57Co] Cbl
levels (from 19.9 ± 0.4% to 14.3± 0.5% of the total cellular levels). Although the
mitochondrial [57Co] Cbl level in the MG-115-treated cells was decreased, there was
no significant change observed in the cytosolic [57Co] Cbl level. These results
suggest that lysosomal Cbl transport in the MG-115-treated SH-SY5Y-APP cells
was impaired, at least partly, due to increased Aβ accumulation that may perturb
lysosomal function and prevent the release of Cbl from the lysosomes.
6.3.3. Aβ deposition and accumulation in the APPxPS1 AD mouse brain
To assess whether lysosomal Cbl transport is affected by Aβ accumulation in the AD
brain in vivo, an APPxPS1 transgenic AD mouse model was used in the current
experiment. To confirm the extent of Aβ deposition, cortical sections from 12-
month-old WT and APPxPS1 AD mice were stained with ThS and 6E10 to identify
plaque pathology. Numerous ThS-positive plaques were deposited in the
hippocampus of APPxPS1 AD mice, whereas ThS-positive plaques were not
observed in the WT mice (Figure 6.3 A). Similar to the result from ThS staining, the
immunohistochemical staining demonstrated that 6E10-positive plaques were
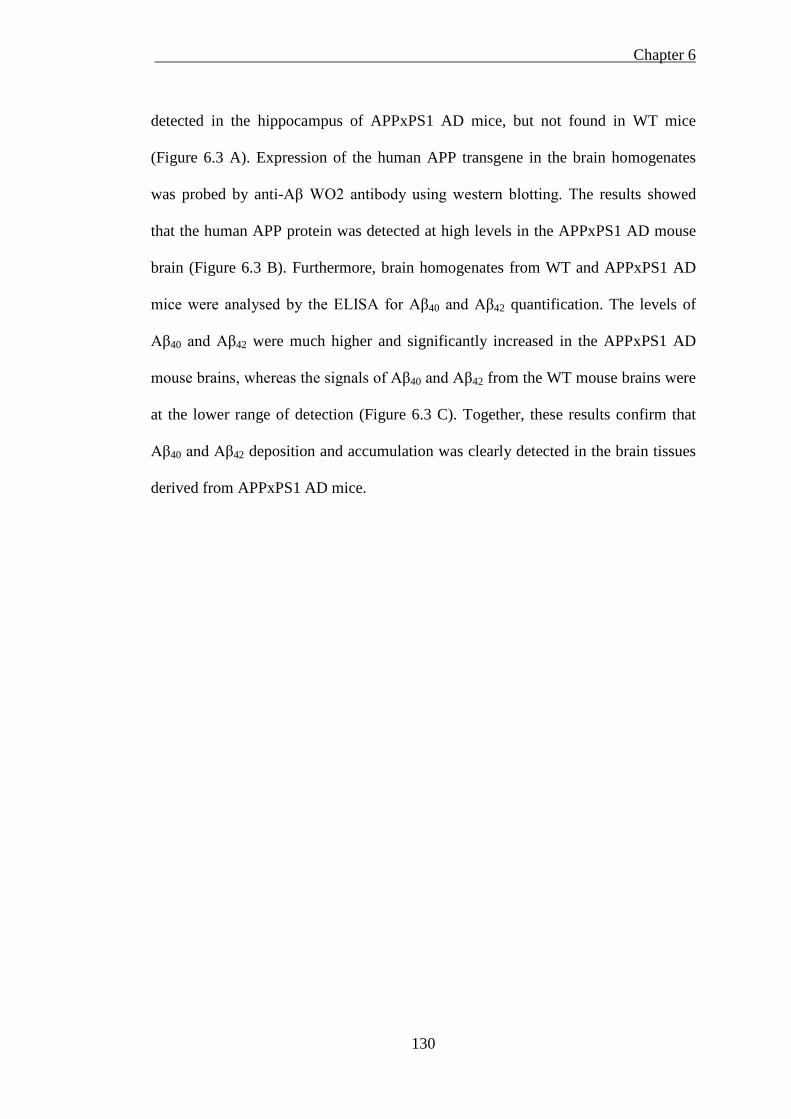
Chapter 6
130
detected in the hippocampus of APPxPS1 AD mice, but not found in WT mice
(Figure 6.3 A). Expression of the human APP transgene in the brain homogenates
was probed by anti-Aβ WO2 antibody using western blotting. The results showed
that the human APP protein was detected at high levels in the APPxPS1 AD mouse
brain (Figure 6.3 B). Furthermore, brain homogenates from WT and APPxPS1 AD
mice were analysed by the ELISA for Aβ40 and Aβ42 quantification. The levels of
Aβ40 and Aβ42 were much higher and significantly increased in the APPxPS1 AD
mouse brains, whereas the signals of Aβ40 and Aβ42 from the WT mouse brains were
at the lower range of detection (Figure 6.3 C). Together, these results confirm that
Aβ40 and Aβ42 deposition and accumulation was clearly detected in the brain tissues
derived from APPxPS1 AD mice.
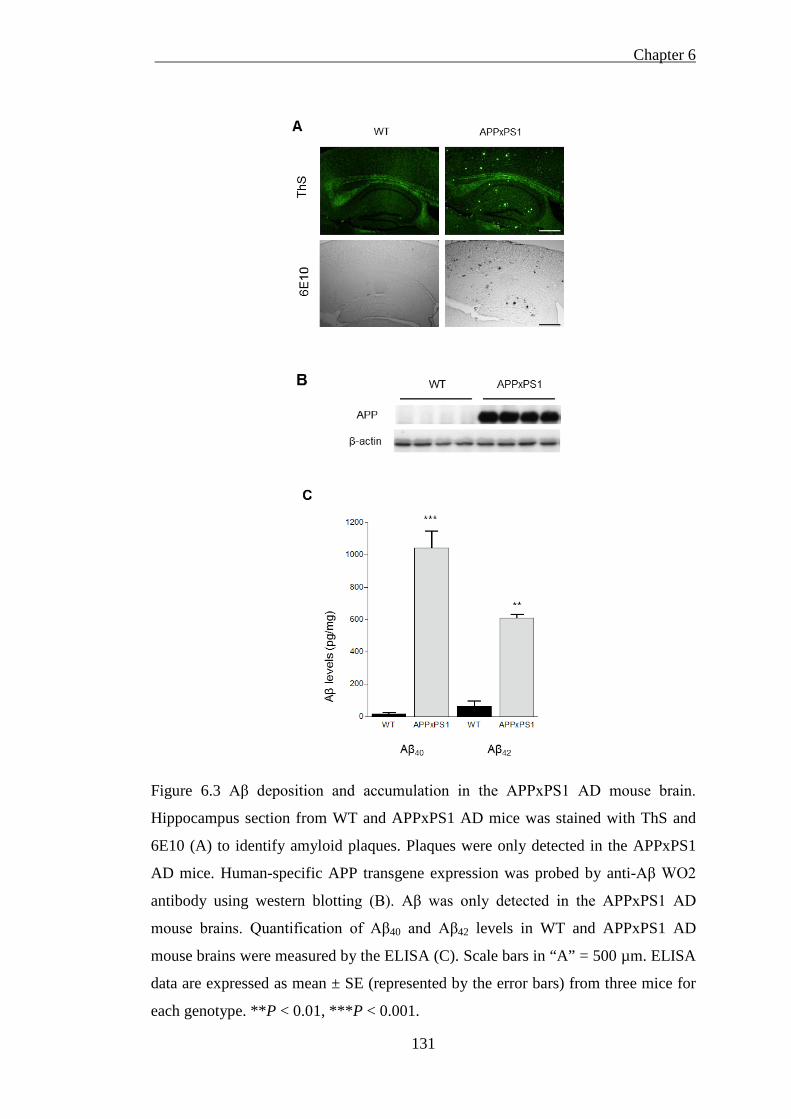
Chapter 6
131
Figure 6.3 Aβ deposition and accumulation in the APPxPS1 AD mouse brain.
Hippocampus section from WT and APPxPS1 AD mice was stained with ThS and
6E10 (A) to identify amyloid plaques. Plaques were only detected in the APPxPS1
AD mice. Human-specific APP transgene expression was probed by anti-Aβ WO2
antibody using western blotting (B). Aβ was only detected in the APPxPS1 AD
mouse brains. Quantification of Aβ40 and Aβ42 levels in WT and APPxPS1 AD
mouse brains were measured by the ELISA (C). Scale bars in “A” = 500 µm. ELISA
data are expressed as mean ± SE (represented by the error bars) from three mice for
each genotype. **P < 0.01, ***P < 0.001.
Chapter 6
132
6.3.4. [57Co] Cbl incorporation in WT and APPxPS1 AD mice
To assess the incorporation of [57Co] Cbl into major organs of the WT and APPxPS1
AD mice, three 12-month-old WT mice and three 12-month-old APPxPS1 AD mice
were i.p. injected with 4 µCi [57Co] Cbl for 72 h. A total of ~30% of the injected
[57Co] Cbl radioactivity was recovered from the collected organs and plasma. No
significant difference was observed in [57Co] Cbl radioactivity in the major organs
when comparing WT and APPxPS1 AD mice (Figure 6.4). Similar to Cbl absorption
in human, the majority of [57Co] Cbl was contained in the kidneys (~15%) and liver
(~11%), where excessive Cbl is known to be stored. The incorporation of [57Co] Cbl
in the brain, heart and spleen was minimal and less than 1% of total recovered [57Co]
Cbl radioactivity. Approximately 2.5% of [57Co] Cbl was detected in the plasma,
from where TC binds and transports Cbl to all target cells of the body. Intriguingly,
and for reasons that remain unclear, plasma levels of [57Co] Cbl were 24% lower (P
< 0.05) in APPxPS1 AD mice compared to WT mice (Figure 4).
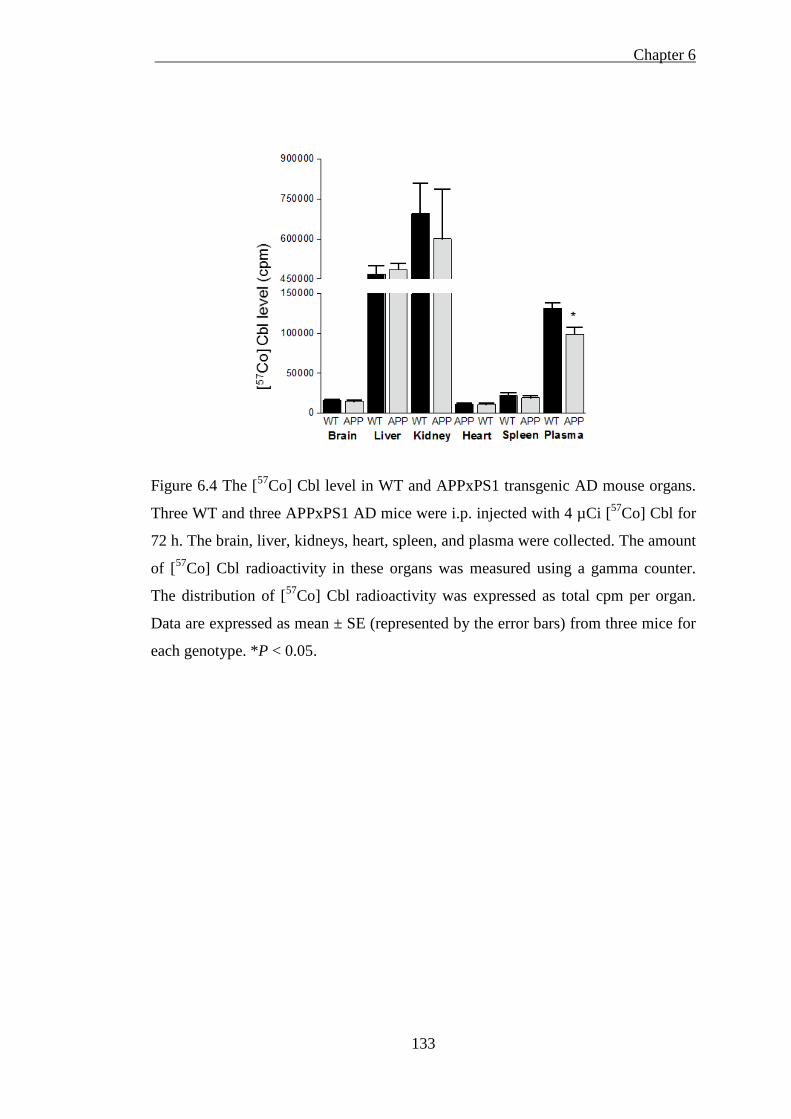
Chapter 6
133
Figure 6.4 The [57Co] Cbl level in WT and APPxPS1 transgenic AD mouse organs.
Three WT and three APPxPS1 AD mice were i.p. injected with 4 µCi [57Co] Cbl for
72 h. The brain, liver, kidneys, heart, spleen, and plasma were collected. The amount
of [57Co] Cbl radioactivity in these organs was measured using a gamma counter.
The distribution of [57Co] Cbl radioactivity was expressed as total cpm per organ.
Data are expressed as mean ± SE (represented by the error bars) from three mice for
each genotype. *P < 0.05.
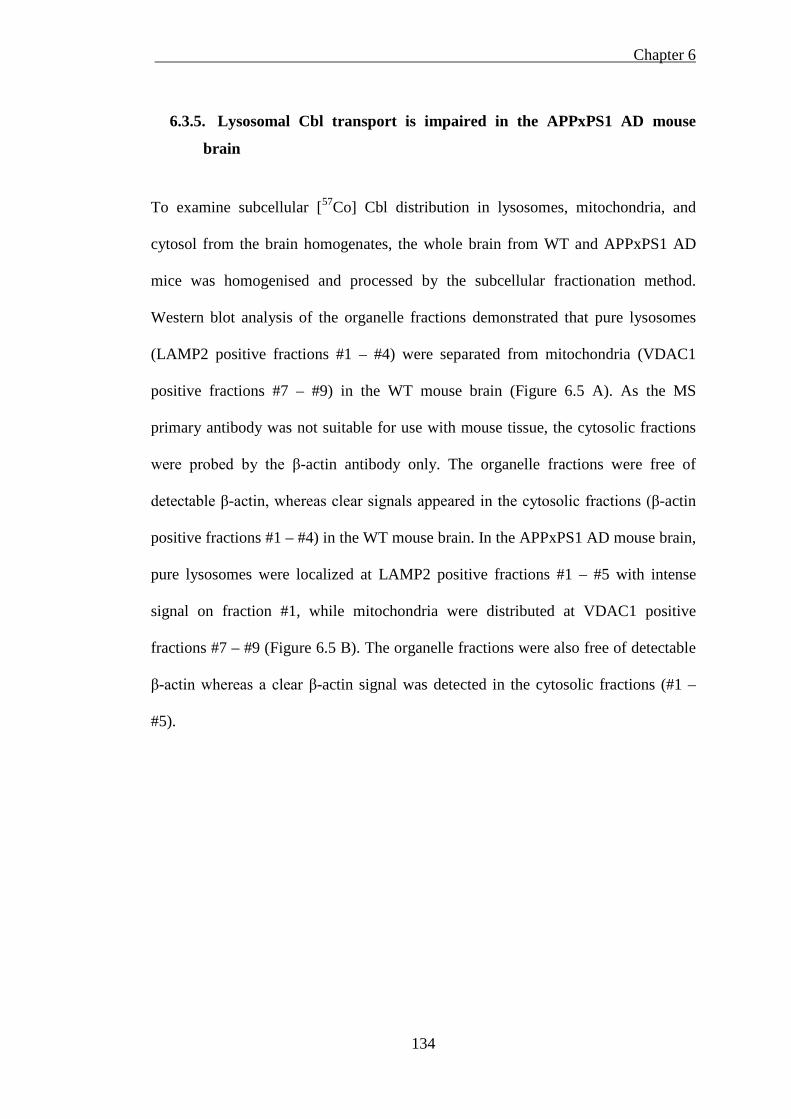
Chapter 6
134
6.3.5. Lysosomal Cbl transport is impaired in the APPxPS1 AD mouse
brain
To examine subcellular [57Co] Cbl distribution in lysosomes, mitochondria, and
cytosol from the brain homogenates, the whole brain from WT and APPxPS1 AD
mice was homogenised and processed by the subcellular fractionation method.
Western blot analysis of the organelle fractions demonstrated that pure lysosomes
(LAMP2 positive fractions #1 – #4) were separated from mitochondria (VDAC1
positive fractions #7 – #9) in the WT mouse brain (Figure 6.5 A). As the MS
primary antibody was not suitable for use with mouse tissue, the cytosolic fractions
were probed by the β-actin antibody only. The organelle fractions were free of
detectable β-actin, whereas clear signals appeared in the cytosolic fractions (β-actin
positive fractions #1 – #4) in the WT mouse brain. In the APPxPS1 AD mouse brain,
pure lysosomes were localized at LAMP2 positive fractions #1 – #5 with intense
signal on fraction #1, while mitochondria were distributed at VDAC1 positive
fractions #7 – #9 (Figure 6.5 B). The organelle fractions were also free of detectable
β-actin whereas a clear β-actin signal was detected in the cytosolic fractions (#1 –
#5).
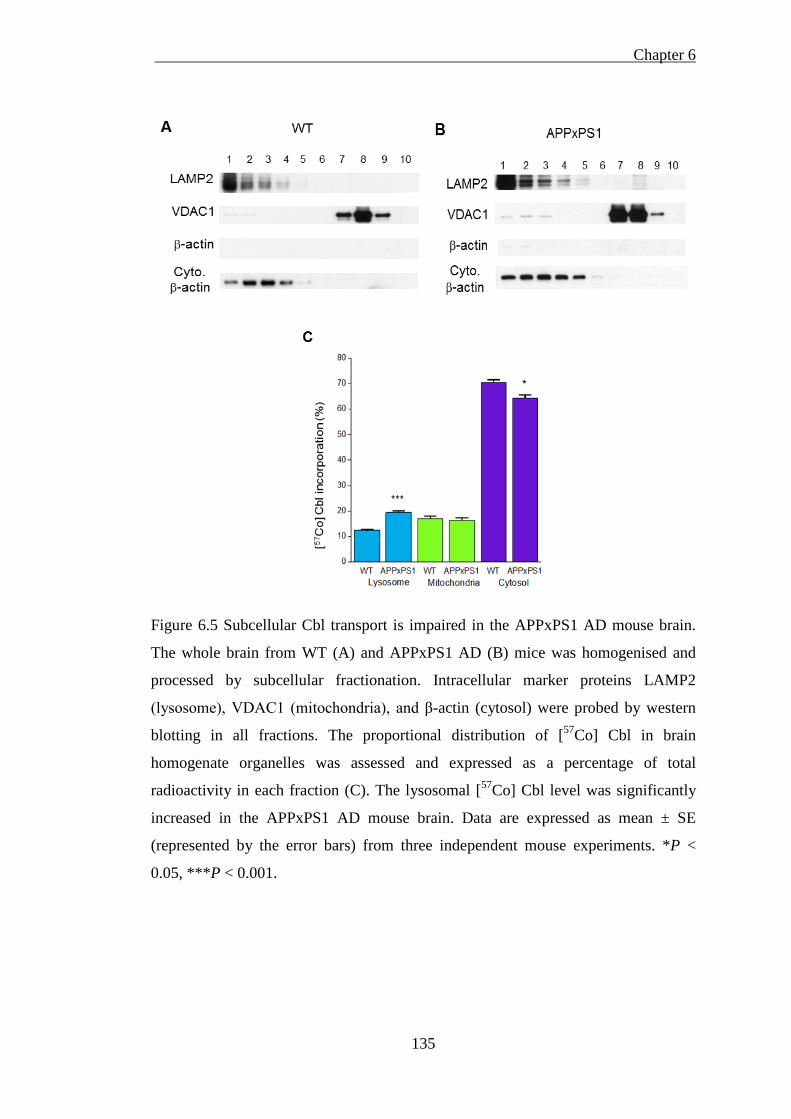
Chapter 6
135
Figure 6.5 Subcellular Cbl transport is impaired in the APPxPS1 AD mouse brain.
The whole brain from WT (A) and APPxPS1 AD (B) mice was homogenised and
processed by subcellular fractionation. Intracellular marker proteins LAMP2
(lysosome), VDAC1 (mitochondria), and β-actin (cytosol) were probed by western
blotting in all fractions. The proportional distribution of [57Co] Cbl in brain
homogenate organelles was assessed and expressed as a percentage of total
radioactivity in each fraction (C). The lysosomal [57Co] Cbl level was significantly
increased in the APPxPS1 AD mouse brain. Data are expressed as mean ± SE
(represented by the error bars) from three independent mouse experiments. *P <
0.05, ***P < 0.001.
Chapter 6
136
Next, I investigated whether subcellular [57Co] Cbl transport was altered in the
APPxPS1 AD mouse brain. The incorporation of [57Co] Cbl in each organelle
expressed as a percentage of cpm values. According to the distribution of lysosomes
and mitochondria from the western blots, the lysosomes contained 12.4 ± 0.6% of
total cellular [57Co] Cbl in the WT mouse brain, whereas the amount of lysosomal
[57Co] Cbl was increased to 19.4 ± 1.1% in the APPxPS1 AD mouse brain (mean ±
SE, n = 3, Figure 5C). This represents a significant 56% increase in lysosomal [57Co]
Cbl level. This accumulation of [57Co] Cbl in the lysosomes was associated with a
significant 6% decrease (from 70.5 ± 1.9% to 64.0 ± 2.3% of total cellular levels) in
the cytosolic [57Co] Cbl level in the APPxPS1 AD mouse brain. Interestingly, there
was no significant change observed in mitochondrial [57Co] Cbl levels. Thus,
lysosomal Cbl transport was interrupted in the APPxPS1 AD mouse brain with a
56% increase of [57Co] Cbl entrapped in the lysosomal compartment.
6.4 Discussion
The ubiquitin-proteasome system and the autophagy-lysosome system are two major
degradative pathways in eukaryotic cells. They are essential for many cellular
processes, including misfolded protein degradation, the regulation of gene
expression, and responses to oxidative stress (Lee et al., 2013). In the present work,
the results have demonstrated that the amount of lysosomal [57Co] Cbl is almost
doubled in the SH-SY5Y-APP cells with proteasome inhibitor treatment. Proteasome
inhibition increases lysosomal Aβ levels and that the accumulation of Aβ is
associated with impaired lysosomal Cbl transport in vitro.
Chapter 6
137
When the proteasome system is inhibited by MG-115, autophagy is activated and up-
regulated as a compensatory mechanism to degrade damaged organelles and protein
aggregates. As more newly synthesised Aβ are delivered to the lysosomes, the
progressively accumulated Aβ may combine with other undegradable materials to
induce oxidative stress and abnormal proteolysis that impair lysosomal function,
resulting in defective clearance of cellular molecules (Yang et al., 1998). Lysosomes
are rich in low mass redox-active iron and they are very sensitive to oxidative stress
induced by ROS via the Fenton reaction (Kurz et al., 2011). Thus, when TC-[57Co]
Cbl is transported to these dysfunctional lysosomes, TC may also fail to be degraded
by lysosomal hydrolases and [57Co] Cbl is therefore unable to be released and
entrapped in the lysosomal compartment. However, from those experiments I did not
determine whether the entrapped lysosomal [57Co] Cbl remains bound to TC.
In the in vivo study, I used 12-month-old APPxPS1 transgenic AD mice as an AD
model and found amyloid plaques and Aβ deposition in the hippocampus region of
these mice. The results provide the first in vivo evidence that lysosomal [57Co] Cbl
level is significantly increased (by 56%) in association with AD pathology. It should
be noted that the 56% increase in lysosomal [57Co] Cbl trapping represent the
average of all lysosomes from all cell types and brain regions. It is likely that post-
mitotic cells such as neurons suffer more from an accumulation of “lysosomal
garbage” as they are unable to divest themselves of their undegradable lysosomal
material to daughter cells (Terman and Brunk, 2006; Terman et al., 2006). This is
predicted to be particularly pronounced under conditions associated with ageing and
neurodegeneration (Zheng et al., 2006; Kurz et al., 2008; Zhao et al., 2011). Thus a
cell-specific roadblock in Cbl trafficking may occur in cell-specific manner or in
Chapter 6
138
specific brain regions where Aβ levels are highest, and this would lead to a localised
deficiency in MS and MMCM enzyme activity and concomitant increases in
neurotoxic Hcy and MMA concentrations.
The exact mechanism responsible for lysosomal [57Co] Cbl trapping in the APPxPS1
mouse brain is unknown. Based on the knowledge that lysosomal function gradually
deteriorates in AD and that endogenous Aβ progressively accumulates in the
dysfunctional lysosomes (Cataldo et al., 1994; Agholme et al., 2012; Wolfe et al.,
2013), it is plausible that excessive Aβ that cannot be degraded becomes aggregated
and further compromises lysosomal function. It is possible that such lysosomes
continue to receive newly synthesised hydrolases from primary lysosomes in a futile
attempt to degrade indigestible material. These lysosomal enzymes would therefore
be essentially lost for other useful purposes, e.g. for the degradation of newly
autophagocytosed materials and releasing Cbl from TC (Terman et al., 2006; Zhao et
al., 2011). This would be predicted to result in a delayed protein turnover,
accumulation of waste products, and an impairment of Cbl transit through the
lysosomal compartment.
Neither WT nor APPxPS1 AD mice had a significant change in body weight during
injection period. All major organs were collected and no obvious weight change in
those tissues was seen between two groups. Unlike humans which express Cbl
carrier proteins TC and haptocorrin, TC is the only Cbl binding protein in mouse
plasma that carries Cbl to the kidneys and liver (Hygum et al., 2011). In our mouse
studies, the kidneys contained the highest amount of [57Co] Cbl among the organs
examined, followed by the liver. The result is consistent with previous reports
Chapter 6
139
(Lildballe et al., 2012; Zhao et al., 2013). It is noteworthy that although Cbl can
rapidly pass through the blood-brain-barrier and is stored in human brain (Van den
Berg et al., 2003; Herrmann and Obeid, 2012), only ~ 0.4% of total [57Co] Cbl
radioactivity was recovered in the mouse brain. Nonetheless, this amount was
adequate for the comparison of subcellular [57Co] Cbl distribution in both WT and
APPxPS1 AD mice. The mechanism regulating Cbl uptake into the brain needs to be
elucidated and could be targeted in the AD context to increase the total CNS Cbl
pool to help alleviate the lysosomal roadblock to Cbl transport that we have
identified.
I also observed qualitatively that both MG-115 treatment (in vitro) and the
accumulation of Aβ (in vivo in the APPxPS1 AD mice) that was associated with
lysosomal [57Co] Cbl trapping, also appeared to be associated with a change in
LAMP2 distribution through the OptiPrep density gradient. In particular, I noted a
tendency for the LAMP2 signal to be stronger in fractions of higher density. This is
similar to the data obtained from cultured fibroblasts and neuronal cells that treated
with lysosomal protease inhibitors to induce lysosomal [57Co] Cbl trapping (Zhao et
al., 2014). This might indicate that lysosomal Cbl trapping is associated with an
enlargement of the lysosomal compartment leading to an increase in average
lysosome size and/or density distribution. This along with a failed release of Cbl
from the TC-Cbl complex could together contribute to the impaired transit of [57Co]
Cbl through the lysosomal compartment. Although lysosomal morphology clearly
changes in human AD tissues (Cataldo et al., 1994; Cataldo et al., 1996), future
studies utilising electron microscopy techniques might clarify the extent to which
lysosomal morphology changes under current experimental conditions.
Chapter 6
140
The data derived from fibroblast and neuronal cell lines indicates that under standard
culture conditions, only ~5.5% of cellular [57Co] Cbl resides in the lysosomes. This
is not surprising based on the fact that the major sites of Cbl utilisation in humans
are the enzymes MS and MMCM located in the mitochondria and cytosol
respectively. The relatively low level of lysosomal Cbl probably reflects the transient
nature of this pool as it is released from the TC-Cbl complex and transported from
the lysosome via LMBD1 and ABCD4 (Rutsch et al., 2009; Coelho et al., 2012).
However, lysosomal [57Co] Cbl level in WT mouse brain is much higher with ~
12.4% of cellular [57Co] Cbl was detected in the lysosomes. It is currently not clear
why lysosomes isolated from the brain tissue are apparently enriched in [57Co] Cbl
compared to the cell lines. As it was unable to measure mouse MS using western
blotting so it was possible that traces of cytosolic contamination in these fractions
could contribute to the cpm values; although the very low levels of β-actin
contamination would argue against this. Further rinse steps after the OptiPrep
gradient may improve organelle purity; however, the challenge with the brain
analysis is the relatively low amount of [57Co] Cbl incorporation (~ 0.4%) and the
possibility that further rinsing may reduce recovery of the lysosomes.
6.5 Conclusion
The previous results have demonstrated that lysosomal enzyme inhibition (either
increasing lysosomal pH or inhibiting lysosomal proteases) surpresses lysosomal
function, resulting in the accumulation of [57Co] Cbl in lysosomes and impairment to
lysosomal transport of Cbl to mitochondria and cytosol in the cultured cells. In this
Chapter 6
141
Chapter, the results demonstrate that lysosomal [57Co] Cbl level is significantly
increased in association with AD-derived lysosomal Aβ accumulation both in vitro
and in vivo. These results indicate that lysosomal [57Co] Cbl transport is at least
partly impaired when lysosomal function becomes defective due to AD-derived Aβ
accumulation. Lysosomal dysfunction may significantly impact upon Cbl
intracellular transport and utilisation.

Chapter 7
142
Chapter 7
General discussion
Chapter 7
143
General discussion 7
7.1 Project overview and major outcomes
Cbl is required for erythrocyte formation and DNA synthesis, and plays a crucial role
in the maintenance of neurological function. MeCbl and AdoCbl are intracellular
active forms in human metabolism. MeCbl is used to transform Hcy to Met via
cytosolic MS, whereas AdoCbl is required for the conversion of MM-CoA to
succinyl-CoA via mitochondrial MMCM. The reduction of MeCbl and AdoCbl
causes elevated plasma Hcy and MMA concentrations that correlate positively with
cognitive decline and brain atrophy (Herrmann et al., 2000; Sachdev et al., 2002).
Thus, Cbl utilisation is critically dependent on Cbl efficient transit through the
intracellular lysosomal compartment and subsequently being released into cytosol
and mitochondria. Research evidence indicates that lysosomal function deteriorates
in ageing post-mitotic cells such as neurons (Brunk and Terman, 2002; Double et al.,
2008). Importantly, it is also clear that lysosomal function is markedly perturbed in
AD, and this is known to be a direct consequence of autophagy failure (Nixon et al.,
2008; Nixon and Yang, 2011). It is possible that lysosomal Cbl intracellular
transport may be interrupted by aged or impaired lysosomes in ageing and AD (Zhao
et al., 2011).
Low serum Cbl levels are associated with neurodegenerative disease and cognitive
impairment (Moore et al., 2012). Increased plasma levels of Hcy are considered as a
strong independent risk factor for developing AD and cognitive defect in the elderly
(Seshadri et al., 2002; Quadri et al., 2004). Although animal studies indicate that Cbl
Chapter 7
144
supplementation significantly improves cognitive performance (Zhang et al., 2009;
Zhuo and Pratico, 2010), human trials have failed to provide a consistent beneficial
effect on cognitive performance with either oral or parenteral Cbl (McMahon et al.,
2006; Maron and Loscalzo, 2009; McCaddon and Hudson, 2010; Smith et al., 2010).
Malabsorption is a major cause of Cbl deficiency in the elderly. However, this is not
likely to account for the lack of efficacy regarding cognitive improvement in clinical
trials because both oral and parenteral delivery routes increase plasma circulating
Cbl to the same degree in both young and aged subjects (Nilsson-Ehle, 1998; Andres
et al., 2005).
Lysosomes maintain cellular homeostasis by continually degrading and recycling
misfolded cellular components. Lysosomes are essential subcellular organelles
involved in the metabolism of intracellular Cbl utilisation. The importance of the
role that the lysosome plays in the delivery of Cbl to MS and MMCM is described in
the early study (Rosenblatt et al., 1985) and has been highlighted by the later
discovery of two inborn errors of Cbl metabolism referred to as cblF and cblJ
(Rutsch et al., 2009; Coelho et al., 2012). These life-threatening conditions are
caused by a loss of function in either LMBD1 or ABCD4, lysosomal membrane
proteins that normally promote Cbl efflux from the lysosome to the cytosol (Rutsch
et al., 2009; Coelho et al., 2012). In cblF and cblJ deficiencies, Cbl accumulates in
lysosomes and levels of toxic metabolites Hcy and MMA increase. However, the
significant impact of lysosomal dysfunction under neuropathological conditions on
intracellular Cbl transport has been overlooked. It has been speculated that the role
of lysosomes during Cbl utilisation is sole as transit station that transfer and release
most lysosomal Cbl into cytosol and mitochondria.
Chapter 7
145
The current project is designed on the basis of hypothesis that neuropathological
conditions that impair lysosomal function, such as age-related lipofuscinosis,
lysosomal storage diseases and AD, may interrupt lysosomal Cbl transport. This
inhibition causes Cbl accumulation in the lysosomes, affects Cbl utilisation and may
result in downstream cytotoxic metabolites accumulation. Suboptimal lysosomal
processing of Cbl plays a significant role in age-related loss of neurological function
associated with both ageing and AD. The impaired transit of Cbl through lysosomes,
particularly in post-mitotic cells such as neurons is responsible for the lack of
cognitive improvement in aged and AD patients. If this hypothesis is correct, it will
explain why Cbl administration has not yielded a consistent therapeutic benefit in the
ageing and dementia contexts, and may develop a clinical therapeutic target that
improves neuronal Cbl utilisation to reduce the production of neurotoxic metabolites
that accumulate when the coenzyme forms of Cbl do not reach their correct
intracellular targets.
To investigate the Cbl intracellular distribution in three main compartments:
lysosome, mitochondria and cytosol, I developed a subcellular fractionation
technique that permits efficient and effective separation of the lysosomes from two
major pools of intracellular Cbl (Silva et al.). This method builds on many previous
studies that have separately analysed cellular [57Co] Cbl metabolism in cells and
mice (Mellman et al., 1978; Youngdahl-Turner et al., 1978; Yassin et al., 2000;
Hannibal et al., 2008; Yamani et al., 2008) or aspects of lysosome function in cells
and mice (Manunta et al., 2007; Yang et al., 2011). The subcellular fractionation
method provides a useful tool for isolating purified subcellular organelles and
Chapter 7
146
investigating intracellular [57Co] Cbl trafficking in fibroblast and neuronal cell lines.
In addition, I assessed the levels of [57Co] Cbl in lysosomes and other intracellular
compartments and organelle markers throughout the separation gradients in the cell
lines and animal models that are known to have impaired lysosome function due to,
for example, accumulation of the age-related pigment lipofuscin, substrate
accumulation in lysosomal storage diseases, and accumulation of Aβ in AD.
One major finding from this PhD study is to demonstrate that inhibition of lysosomal
proteolysis using both pH-dependent (chloroquine) and -independent (leupeptin and
vinblastine) approaches suppress lysosomal function, interrupt intracellular [57Co]
Cbl transit, and cause lysosomal [57Co] Cbl accumulation in the HT1080 fibroblast
and SH-SY5Y neuronal cells. Treating cells with these chemical compounds has
acute impact on lysosomal morphology and significantly inhibit [57Co] Cbl releasing
from lysosomes. There is a close correlation when the [57Co] Cbl cpm values were
compared with LAMP2 signal in the pure lysosome fractions, however, the results
cannot determine whether lysosomal trapping induced by either chloroquine or
leupeptin is due to an expansion of the lysosomal compartment or an increase the
amount of Cbl retained in each lysosome. As lysosomal protease inhibitors were
reported to have a dual effect on autophagy when they initiate early autophagic
processes while suppressing autophagic degradation (Li et al., 2013). This is
predicted to result in an expansion of the lysosomal compartment. Therefore I
speculate that lysosomal Cbl accumulation that is induced by protease inhibition may
due to a combination of both an enlargement of the lysosomal compartment and an
increase in lysosomal Cbl concentration.
Chapter 7
147
There is a marked difference in the amount of lysosomal [57Co] Cbl accumulated in
the fibroblasts compared to neuronal cells, which are more susceptible to these drugs
and trap much more [57Co] Cbl in the lysosomes. In the SH-SY5Y cells, I observed a
very significant drop in cytosolic [57Co] Cbl when lysosomal protease inhibitors are
present. If the half-life of MS is shorter than the half-life of MMCM then one might
predict a more rapid drop in the [57Co] Cbl cytosolic pool; however, the predicted
half-lives of these enzymes are 30 h and 5.5 h, respectively (Bachmair et al., 1986;
Gonda et al., 1989). Therefore the differences in enzyme half-life are unlikely to
account for the relative sensitivity of these pools. I am unaware of detailed studies on
MS and MMCM turnover in neurons and the impact that Cbl deficiency may have
on enzyme half-life. Nevertheless, based on the fact that Cbl deficiency includes a
neurological phenotype (Healton et al., 1991; Baik and Russell, 1999; Calvaresi and
Bryan, 2001), these issues appear to be worthy of future study.
More importantly, lysosomal [57Co] Cbl trapping caused by lysosomal dysfunction is
connected with decreased incorporation of [14C] propionate into cellular
macromolecules, which is a physiological marker of mitochondrial MMCM activity
(Willard et al., 1976). The inhibition of lysosomal function disrupts intracellular Cbl
utilisation and results in reduced level of mitochondrial [57Co] Cbl that is correlated
with impaired Cbl-dependent MMCM activity, which could lead to increased
production of neurotoxic metabolites. To examine the impact of lysosomal
dysfunction on the Cbl metabolic pathway, it is essential to define the relationship
between altered intracellular Cbl distribution and changes in key downstream
metabolites dependent on the availability of Cbl coenzyme forms: MeCbl and
AdoCbl. It is predicted that neurotoxic levels of Hcy and MMA will increase when
Chapter 7
148
MS and MMCM activities are inhibited due to reductions in MeCbl and AdoCbl
supply. Thus, the Hcy and MMA levels in those lysosomal, mitochondrial, and
cytosolic fractions are measured using established LC-MS and GC-MS methods
(Guan et al., 2003; Serot et al., 2005). However, it seems that the amount of Hcy and
MMA in each fraction was not enough to be accurately measured with the equipment
in the lab. The results were variable and inconsistent in each condition, even after
attempting several different measurement approaches. Due to this limited capability
to accurately measure Hcy and MMA concentration, I chose to assess the Cbl
metabolic pathway alteration under conditional lysosomal dysfunction. The reduced
incorporation of [14C] propionate into cellular macromolecules provides crucial
information that impaired lysosomal function was associated with decreased Cbl-
dependent mitochondrial MMCM activity.
Another finding from this study is to demonstrate that lysosomal Cbl transport is
impeded under neuropathological conditions, such as lysosomal storage diseases. An
in vitro experiment using human GD fibroblasts shows that lysosomal function was
suppressed and lysosomal [57Co] Cbl level was doubled in these cells. Lysosomal
[57Co] Cbl transport is impaired in GD cells and this effect was correlated with the
increase of lysosomal GlcCer that is caused by inherited genetic defect in the
lysosomal enzyme GCase. However, when SH-SY5Y cells were treated with CBE,
an irreversible inhibitor of GCase, lysosomal [57Co] Cbl level in these cells remained
statistically unchanged, even though CBE induces rapid increase of GlcCer and
pathologically mimics the GD phenotype. In addition, to examine whether age-
related lipofuscin accumulation interrupts intracellular Cbl transport in the cultured
cells, artificial lipofuscin was synthesised by exposing enriched lysosomes and
Chapter 7
149
mitochondria cell lysates to UV light. HT180 fibroblasts and SH-SY5Y cells were
treated with artificial lipofuscin and the cellular uptake was not efficient. Artificial
lipofuscin had little impact on the lysosomal [57Co] Cbl transport and lysosomal
[57Co] Cbl level in these cells was not statistically changed. It seems exogenous
interventions induced by the generation of either artificial lipofuscin or CBE-derived
lysosomal GlcCer may perturb lysosomal function, but do not have a significant
impact on lysosomal [57Co] Cbl transport. The reason is not fully elucidated and may
arise from inefficient production of induced materials or due to the nature of cell
itself in a constant proliferating and dividing state.
So far, I have examined the proposed hypothesis and proved that inhibition of
lysosomal function (either increasing lysosomal pH, or inhibiting lysosomal
proteases, or in the lysosomal storage disease) results in lysosomal [57Co] Cbl
accumulation and impedes lysosomal [57Co] Cbl transport to mitochondria and
cytosol in the cultured cells. Next, I investigated whether AD-derived lysosomal Aβ
accumulation also interrupts intracellular [57Co] Cbl transport, as defective
intracellular Cbl utilisation is associated with cognitive decline and brain atrophy in
AD patients (Levitt and Karlinsky, 1992; Douaud et al., 2013). The results indicate
that SH-SY5Y-APP cells with proteasome inhibitor MG-115 treatment induced Aβ
accumulation in the lysosome compartment. The ubiquitin-proteasome system and
the autophagy-lysosome system are two major independent degradative pathways in
eukaryotic cells (Lee et al., 2013). It has been reported that perturbations in the flux
through either pathway affect the activity of the other system (Korolchuk et al.,
2010). When the proteasome system is inhibited by MG-115, autophagy is activated
and up-regulated as a compensatory mechanism to mediate clearance of damaged
Chapter 7
150
organelles and protein aggregates. As more newly synthesised Aβ are delivered to
the lysosomes, they combine with other undegradable materials to induce oxidative
stress and abnormal proteolysis that impairs lysosomal function, progressively
resulting in defective clearance of cellular molecules (Yang et al., 1998). Lysosomal
[57Co] Cbl level is almost doubled in the SH-SY5Y-APP cells with proteasome
inhibitor treatment. Thus, proteasome inhibition increases lysosomal Aβ levels and
replicates AD-derived lysosomal Aβ accumulation, which possibly leads to impaired
lysosomal Cbl transport in vitro.
Another major outcome from this study is that I provide the first in vivo evidence
that lysosomal [57Co] Cbl transport in the 12-month-old APPxPS1 transgenic AD
mouse brain is interrupted in association with AD pathology. Amyloid plaques and
Aβ accumulation was clearly detected in hippocampus region of these mice. There
was no obvious difference in terms of [57Co] Cbl incorporation in the major organs
of WT and APPxPS1 AD mice. Consistent with previous reports (Lildballe et al.,
2012; Zhao et al., 2013), the kidneys contain the highest amount of [57Co] Cbl
among those organs, followed by the liver in these WT and APPxPS1 AD mice.
However, when subcellular [57Co] Cbl distribution is examined from the brain
homogenates, lysosomal [57Co] Cbl level in the APPxPS1 AD mouse brain is
significantly increased by 56% compared to WT mouse brain. It should be noted that
the 56% increase in lysosomal [57Co] Cbl trapping represent the average of all
lysosomes from all cell types and brain regions. It is likely that post-mitotic cells
such as neurons suffer more from an accumulation of “lysosomal garbage” as they
are unable to divest themselves of their undegradable lysosomal material to daughter
cells (Terman and Brunk, 2006; Terman et al., 2006).
Chapter 7
151
The detailed mechanism responsible for lysosomal [57Co] Cbl accumulation in the
APPxPS1 AD brain is unknown. It has been reported that lysosomal function
gradually deteriorates in AD and that endogenous Aβ progressively accumulates in
the dysfunctional lysosomes (Cataldo et al., 1994; Agholme et al., 2012; Wolfe et
al., 2013). It is plausible that excessive Aβ becomes aggregated or misfolded, while
newly formed lysosomal hydrolases are in a futile attempt to degrade these
indigestible materials and thus may lose for other useful purposes, e.g. for the
degradation of newly autophagocytosed other materials or releasing Cbl from TC
(Terman et al., 2006; Zhao et al., 2011). This would be speculated to result in a
delayed protein turnover, aggravate waste product accumulation, and eventually
initate a vicious cycle. Therefore, the release of [57Co] Cbl from lysosomal
compartment is inhibited in the APPxPS1 AD brain and the impairment of lysosomal
Cbl transit is closely correlated with AD-derived lysosomal Aβ accumulation in the
defective lysosomes.
7.2 Future directions
Chloroquine is an effective anti-malarial drug to prevent the development of malaria
parasites in the blood and it has long been used in the treatment or prevention of
malaria infection. The side effects of chloroquine treatment include gastrointestinal
problems, stomach ache, itch, headache, postural hypotension, and cognitive
impairment (Albright et al., 2002; Boivin et al., 2007). Clinical studies reported that
malaria patients developed with retinal toxicity secondary to the use of chloroquine
(Reis et al., 2010; Michaelides et al., 2011). In addition, chloroquine raises
intralysosomal pH above its physical level by disrupting the H+ gradient across the
Chapter 7
152
lysosomal membrane (Gonzalez-Noriega et al., 1980). Chloroquine alters the
lysosomal acidic compartments, causes inhibition of lysosomal hydrolase activities,
and induces accumulation of autophagosomes (Geng et al., 2010; Chen et al., 2011).
In the current study, the results demonstrate that the cells with chloroquine treatment
have a significant impact on the lysosomal [57Co] Cbl transport. Chloroquine causes
the increase of lysosomal [57Co] Cbl and simultaneously reduces [57Co] Cbl to be
released into mitochondria and cytosol, and thereby impeding intracellular [57Co]
Cbl transit. Lower cytosolic Cbl level causes increased plasma levels of Hcy, which
is a strong independent risk factor for cognitive decline in the elderly. Therefore,
cognitive impairment caused by chloroquine treatment is possibly linked with
impaired intracellular Cbl utilisation due to mutual defect: dysfunctional lysosomes
(Lie and Schofield, 1973). Further investigation is necessory to provide insight into
cellular and molecular mechanisms underlying the impact of lysosomal protective
function and its regulation on chloroquine treatment and Cbl utilisation. It is
conceivable that approaches to preserve lysosomal function or by-pass the
dysfunctional lysosome roadblock may be explored in the future as novel strategies
to escort Cbl to its correct intracellular targets and with the possibility to alleviate the
side effects of chloroquine on cognitive decline.
The current study examines the subcellular Cbl distribution in the cells that are
induced with age-related lysosomal artificial lipofuscin by exposing enriched
lysosomes and mitochondria cell lysates to UV light for 24 h. It seems that induced
artificial lipofuscin in fibroblasts and neuronal cells have not obviously affected
lysosomal [57Co] Cbl transport. It is noteworthy that this method is not efficient for
the induction of artificial lipofuscin in this experiment. Lipofuscin formation can be
Chapter 7
153
induced under various experimental conditions. It has been shown that oxidative
stress promotes lipofuscin formation, whereas antioxidant treatment prevents it
(Thaw et al., 1984; Terman and Brunk, 1998). In order to generate large amount of
lipofuscin, human fibroblasts can be cultured for 6 months under hyperoxic
conditions (40% ambient oxygen) in the future experiment to induce lipofuscin
accumulation. Studies find that intermediate lipofuscin accumulation occurs at 8
weeks via established methods (Quinn et al., 2004). However, the disadvantage of
this method is time-consuming and may not be practically conducted in most
laboratories.
In the in vivo APPxPS1 AD mouse study, the mice are i.p. injected with 4 µCi [57Co]
Cbl in a volume of 0.2 ml sterile saline (0.9%, (w/v) NaCl) for 72 h. Although Cbl
can rapidly pass through the blood-brain-barrier and store in the brain (Van den Berg
et al., 2003; Herrmann and Obeid, 2012), only ~0.4% of total [57Co] Cbl
radioactivity was detected in the mouse brain. The mechanism regulating Cbl uptake
into the brain is still unknown. However, to increase the total CNS Cbl pool,
stereotaxic instruments can be applied to precisely locate lateral ventricle and less
amount of [57Co] Cbl can be directly injected into the brain. By this method it will
efficiently promote the uptake of [57Co] Cbl into the brain and may attenuate the
effect of dysfunctional lysosomal roadblock on intracellular Cbl transport under
neuropathological conditions. Investigations into the volume of administration of
[57Co] Cbl cerebral injection required to affect lysosomal Cbl transport and possibly
improve Cbl utilisation would be informative.
Chapter 7
154
7.3 Conclusion
Lysosomes play a vital intracellular role maintaining cellular homeostasis by
continually degrading cytoplasmic contents, abnormal protein aggregates and excess
or damaged organelles. Lysosomes are essential subcellular organelles involved in
the metabolism of intracellular Cbl utilisation. However, the important role of
lysosomes that may play on intracellular Cbl transport in aging and AD has been
overlooked. The current study systematically examines the proposed hypothesis that
lysososmal dysfunction impairs lysosomal Cbl transport and has a significant impact
on intracellular Cbl utilisation. A series of experiments were conducted to suppress
lysosomal function by inhibition of lysosomal proteolysis using both pH-dependent
and -independent approaches; generation of artificial lipofuscin and feeding to
cultured cells; using cell model of lysosomal storage disease; applying AD-related
SH-SY5Y-APP cell model and APPxPS1 AD transgenic mice. These results
demonstrate that lysosomal [57Co] Cbl transport is impaired under these conditions
and that increased lysosomal [57Co] Cbl level is concomitant with reduced lysosomal
[57Co] Cbl release into mitochondria and cytosol. The results also show that reduced
level of mitochondrial [57Co] Cbl is closely correlated with impaired Cbl-dependent
MMCM activity, suggesting that inhibition of lysosomal function possibly disrupts
intracellular Cbl utilisation and contributes to the deleterious increases in Hcy and
MMA levels that occur in the aging brain and thereby directly accelerates
neurodegeneration. Taken together, the results from the in vitro and in vivo
experiments provide a detailed understanding of the impact of lysosomal dysfunction
in relation to brain ageing and AD on lysosomal Cbl transport at the subcellular
level. These results may explain why Cbl administration has not yielded a consistent
Chapter 7
155
cognitive improvement in the ageing and AD patients because of the impaired transit
of Cbl through lysosome compartment, particularly in long-lived post-mitotic cells
such as neurons. More importantly, this thesis sheds light on this crucial issue and is
a step towards identifying a clinical therapeutic target to improve neuronal Cbl
utilisation and thus reduce the production of neurotoxic metabolites that accumulate
when the coenzyme forms of Cbl do not reach their intracellular targets.
References
156
REFERENCES
Agholme, L., M. Hallbeck, E. Benedikz, J. Marcusson and K. Kagedal (2012).
"Amyloid-beta secretion, generation, and lysosomal sequestration in response
to proteasome inhibition: involvement of autophagy." J Alzheimers Dis
31(2): 343-358.
Albright, T. A., H. J. Binns and B. Z. Katz (2002). "Side effects of and compliance
with malaria prophylaxis in children." Journal of travel medicine 9(6): 289-
292.
Allen, L. H. (2009). "How common is vitamin B-12 deficiency?" Am J Clin Nutr
89(2): 693S-696S.
Amagasaki, T., R. Green and D. W. Jacobsen (1990). "Expression of transcobalamin
II receptors by human leukemia K562 and HL-60 cells." Blood 76(7): 1380-
1386.
Amano, T., H. Nakanishi, T. Kondo, T. Tanaka, M. Oka and K. Yamamoto (1995).
"Age-related changes in cellular localization and enzymatic activities of
cathepsins B, L and D in the rat trigeminal ganglion neuron." Mech Ageing
Dev 83(3): 133-141.
Amritraj, A., C. Hawkes, A. L. Phinney, H. T. Mount, C. D. Scott, D. Westaway and
S. Kar (2009). "Altered levels and distribution of IGF-II/M6P receptor and
lysosomal enzymes in mutant APP and APP + PS1 transgenic mouse brains."
Neurobiol Aging 30(1): 54-70.
References
157
Andres, E., S. Affenberger, S. Vinzio, J. E. Kurtz, E. Noel, G. Kaltenbach, F.
Maloisel, J. L. Schlienger and J. F. Blickle (2005). "Food-cobalamin
malabsorption in elderly patients: clinical manifestations and treatment." Am
J Med 118(10): 1154-1159.
Andres, E., E. Noel, G. Kaltenbach, A. E. Perrin, S. Vinzio, B. Goichot, J. L.
Schlienger and J. F. Blickle (2003). "[Vitamin B12 deficiency with normal
Schilling test or non-dissociation of vitamin B12 and its carrier proteins in
elderly patients. A study of 60 patients]." Rev Med Interne 24(4): 218-223.
Avila, J. (2006). "Tau phosphorylation and aggregation in Alzheimer's disease
pathology." FEBS letters 580(12): 2922-2927.
Bach, G., C. S. Chen and R. E. Pagano (1999). "Elevated lysosomal pH in
Mucolipidosis type IV cells." Clin Chim Acta 280(1-2): 173-179.
Bachmair, A., D. Finley and A. Varshavsky (1986). "In vivo half-life of a protein is a
function of its amino-terminal residue." Science 234(4773): 179-186.
Baik, H. W. and R. M. Russell (1999). "Vitamin B12 deficiency in the elderly."
Annu Rev Nutr 19: 357-377.
Ballhausen, D., L. Mittaz, O. Boulat, L. Bonafe and O. Braissant (2009). "Evidence
for catabolic pathway of propionate metabolism in CNS: expression pattern
of methylmalonyl-CoA mutase and propionyl-CoA carboxylase alpha-
subunit in developing and adult rat brain." Neuroscience 164(2): 578-587.
Banerjee, R. (2006). "B12 Trafficking in Mammals: A Case for Coenzyme Escort
Service." ACS Chemical Biology 1(3): 149-159.
Banerjee, R. (2006). "B12 trafficking in mammals: A for coenzyme escort service."
ACS Chem Biol 1(3): 149-159.
References
158
Banerjee, R., C. Gherasim and D. Padovani (2009). "The tinker, tailor, soldier in
intracellular B12 trafficking." Curr Opin Chem Biol 13(4): 484-491.
Beedholm-Ebsen, R., K. van de Wetering, T. Hardlei, E. Nexo, P. Borst and S. K.
Moestrup (2010). "Identification of multidrug resistance protein 1
(MRP1/ABCC1) as a molecular gate for cellular export of cobalamin." Blood
115(8): 1632-1639.
Berliner, N. and L. E. Rosenberg (1981). "Uptake and metabolism of free
cyanocobalamin by cultured human fibroblasts from controls and a patient
with transcobalamin II deficiency." Metabolism 30(3): 230-236.
Bettens, K., K. Sleegers and C. Van Broeckhoven (2013). "Genetic insights in
Alzheimer's disease." Lancet Neurol 12(1): 92-104.
Beutler, E. (2004). "Enzyme replacement in Gaucher disease." PLoS Med 1(2): e21.
Boers, G. H. (1994). "Hyperhomocysteinaemia: a newly recognized risk factor for
vascular disease." Neth J Med 45(1): 34-41.
Boivin, M. J., P. Bangirana, J. Byarugaba, R. O. Opoka, R. Idro, A. M. Jurek and C.
C. John (2007). "Cognitive impairment after cerebral malaria in children: a
prospective study." Pediatrics 119(2): e360-e366.
Boland, B., A. Kumar, S. Lee, F. M. Platt, J. Wegiel, W. H. Yu and R. A. Nixon
(2008). "Autophagy induction and autophagosome clearance in neurons:
relationship to autophagic pathology in Alzheimer's disease." J Neurosci
28(27): 6926-6937.
Bose, S., S. Seetharam and B. Seetharam (1995). "Membrane expression and
interactions of human transcobalamin II receptor." J Biol Chem 270(14):
8152-8157.
References
159
Brunk, U. and J. L. Ericsson (1972). "Electron microscopical studies on rat brain
neurons. Localization of acid phosphatase and mode of formation of
lipofuscin bodies." J Ultrastruct Res 38(1): 1-15.
Brunk, U., J. L. Ericsson, J. Ponten and B. Westermark (1973). "Residual bodies and
"aging" in cultured human glia cells. Effect of entrance into phase 3 and
prolonged periods of confluence." Exp Cell Res 79(1): 1-14.
Brunk, U. T. and A. Terman (2002). "Lipofuscin: mechanisms of age-related
accumulation and influence on cell function." Free Radic Biol Med 33(5):
611-619.
Calvaresi, E. and J. Bryan (2001). "B vitamins, cognition, and aging: a review." J
Gerontol B Psychol Sci Soc Sci 56(6): P327-339.
Carmel, R. (1995). "Malabsorption of food cobalamin." Baillieres Clin Haematol
8(3): 639-655.
Carter, J. and C. F. Lippa (2001). "Beta-amyloid, neuronal death and Alzheimer's
disease." Current molecular medicine 1(6): 733-737.
Cataldo, A. M., J. L. Barnett, C. Pieroni and R. A. Nixon (1997). "Increased
neuronal endocytosis and protease delivery to early endosomes in sporadic
Alzheimer's disease: neuropathologic evidence for a mechanism of increased
beta-amyloidogenesis." The Journal of neuroscience : the official journal of
the Society for Neuroscience 17(16): 6142-6151.
Cataldo, A. M., D. J. Hamilton, J. L. Barnett, P. A. Paskevich and R. A. Nixon
(1996). "Properties of the endosomal-lysosomal system in the human central
nervous system: disturbances mark most neurons in populations at risk to
degenerate in Alzheimer's disease." J Neurosci 16(1): 186-199.
References
160
Cataldo, A. M., D. J. Hamilton and R. A. Nixon (1994). "Lysosomal abnormalities in
degenerating neurons link neuronal compromise to senile plaque
development in Alzheimer disease." Brain Res 640(1-2): 68-80.
Cataldo, A. M., P. A. Paskevich, E. Kominami and R. A. Nixon (1991). "Lysosomal
hydrolases of different classes are abnormally distributed in brains of patients
with Alzheimer disease." Proc Natl Acad Sci U S A 88(24): 10998-11002.
Chafekar, S. M., F. Baas and W. Scheper (2008). "Oligomer-specific Abeta toxicity
in cell models is mediated by selective uptake." Biochimica et biophysica
acta 1782(9): 523-531.
Chafekar, S. M., F. Baas and W. Scheper (2008). "Oligomer-specific Abeta toxicity
in cell models is mediated by selective uptake." Biochim Biophys Acta
1782(9): 523-531.
Chen, P. M., Z. J. Gombart and J. W. Chen (2011). "Chloroquine treatment of
ARPE-19 cells leads to lysosome dilation and intracellular lipid
accumulation: possible implications of lysosomal dysfunction in macular
degeneration." Cell Biosci 1(1): 10-10.
Clarke, R., A. D. Smith, K. A. Jobst, H. Refsum, L. Sutton and P. M. Ueland (1998).
"Folate, vitamin B12, and serum total homocysteine levels in confirmed
Alzheimer disease." Arch Neurol 55(11): 1449-1455.
Clifford, P. M., S. Zarrabi, G. Siu, K. J. Kinsler, M. C. Kosciuk, V. Venkataraman,
M. R. D'Andrea, S. Dinsmore and R. G. Nagele (2007). "Abeta peptides can
enter the brain through a defective blood-brain barrier and bind selectively to
neurons." Brain Res 1142: 223-236.
Coelho, D., J. C. Kim, I. R. Miousse, S. Fung, M. du Moulin, I. Buers, T. Suormala,
P. Burda, M. Frapolli, M. Stucki, P. Nurnberg, H. Thiele, H. Robenek, W.
References
161
Hohne, N. Longo, M. Pasquali, E. Mengel, D. Watkins, E. A. Shoubridge, J.
Majewski, D. S. Rosenblatt, B. Fowler, F. Rutsch and M. R. Baumgartner
(2012). "Mutations in ABCD4 cause a new inborn error of vitamin B12
metabolism." Nat Genet 44(10): 1152-1155.
Coelho, D., J. C. Kim, I. R. Miousse, S. Fung, M. du Moulin, I. Buers, T. Suormala,
P. Burda, M. Frapolli, M. Stucki, P. Nurnberg, H. Thiele, H. Robenek, W.
Hohne, N. Longo, M. Pasquali, E. Mengel, D. Watkins, E. A. Shoubridge, J.
Majewski, D. S. Rosenblatt, B. Fowler, F. Rutsch and M. R. Baumgartner
(2012). "Mutations in ABCD4 cause a new inborn error of vitamin B(12)
metabolism." Nat Genet 44(10): 1152-1155.
Coelho, D., T. Suormala, M. Stucki, J. P. Lerner-Ellis, D. S. Rosenblatt, R. F.
Newbold, M. R. Baumgartner and B. Fowler (2008). "Gene identification for
the cblD defect of vitamin B12 metabolism." N Engl J Med 358(14): 1454-
1464.
Copper, G. (2000). "The Cell: A Molecular Approach. 2nd edition " Boston
University.
Coutinho, M. F., M. J. Prata and S. Alves (2012). "Mannose-6-phosphate pathway: a
review on its role in lysosomal function and dysfunction." Molecular genetics
and metabolism 105(4): 542-550.
Cuervo, A. M., L. Stefanis, R. Fredenburg, P. T. Lansbury and D. Sulzer (2004).
"Impaired degradation of mutant alpha-synuclein by chaperone-mediated
autophagy." Science 305(5688): 1292-1295.
Dali-Youcef, N. and E. Andres (2009). "An update on cobalamin deficiency in
adults." QJM 102(1): 17-28.
References
162
Daniels, L. B., R. H. Glew, N. S. Radin and R. R. Vunnam (1980). "A revised
fluorometric assay for Gaucher's disease using conduritol-beta-epoxide with
liver as the source of Beta-glucosidase." Clin Chim Acta 106(2): 155-163.
Das, P. K., G. J. Murray, A. E. Gal and J. A. Barranger (1987). "Glucocerebrosidase
deficiency and lysosomal storage of glucocerebroside induced in cultured
macrophages." Exp Cell Res 168(2): 463-474.
De-Paula, V. J., M. Radanovic, B. S. Diniz and O. V. Forlenza (2012). "Alzheimer's
disease." Sub-cellular biochemistry 65: 329-352.
De Duve, C., B. C. Pressman, R. Gianetto, R. Wattiaux and F. Appelmans (1955).
"Tissue fractionation studies. 6. Intracellular distribution patterns of enzymes
in rat-liver tissue." Biochem J 60(4): 604-617.
Dhamodharan, R., M. A. Jordan, D. Thrower, L. Wilson and P. Wadsworth (1995).
"Vinblastine suppresses dynamics of individual microtubules in living
interphase cells." Molecular biology of the cell 6(9): 1215-1229.
Ditaranto, K., T. L. Tekirian and A. J. Yang (2001). "Lysosomal membrane damage
in soluble Abeta-mediated cell death in Alzheimer's disease." Neurobiol Dis
8(1): 19-31.
Douaud, G., H. Refsum, C. A. de Jager, R. Jacoby, T. E. Nichols, S. M. Smith and
A. D. Smith (2013). "Preventing Alzheimer's disease-related gray matter
atrophy by B-vitamin treatment." Proceedings of the National Academy of
Sciences of the United States of America 110(23): 9523-9528.
Double, K. L., V. N. Dedov, H. Fedorow, E. Kettle, G. M. Halliday, B. Garner and
U. T. Brunk (2008). "The comparative biology of neuromelanin and
lipofuscin in the human brain." Cell Mol Life Sci 65(11): 1669-1682.
References
163
Dunlop, R. A., U. T. Brunk and K. J. Rodgers (2009). "Oxidized proteins:
mechanisms of removal and consequences of accumulation." IUBMB life
61(5): 522-527.
Fedosov, S. N., L. Berglund, N. U. Fedosova, E. Nexo and T. E. Petersen (2002).
"Comparative analysis of cobalamin binding kinetics and ligand protection
for intrinsic factor, transcobalamin, and haptocorrin." The Journal of
biological chemistry 277(12): 9989-9996.
Ferguson, P. J., J. R. Phillips, M. Selner and C. E. Cass (1984). "Differential activity
of vincristine and vinblastine against cultured cells." Cancer research 44(8):
3307-3312.
Fernandes-Costa, F. and J. Metz (1982). "Vitamin B12 binders (transcobalamins) in
serum." Crit Rev Clin Lab Sci 18(1): 1-30.
Fernandez-Roig, S., S. C. Lai, M. M. Murphy, J. Fernandez-Ballart and E. V.
Quadros (2012). "Vitamin B12 deficiency in the brain leads to DNA
hypomethylation in the TCblR/CD320 knockout mouse." Nutr Metab (Lond)
9: 41.
Ferrari, G., A. M. Knight, C. Watts and J. Pieters (1997). "Distinct intracellular
compartments involved in invariant chain degradation and antigenic peptide
loading of major histocompatibility complex (MHC) class II molecules." J
Cell Biol 139(6): 1433-1446.
Fiskerstrand, T., B. Riedel, P. M. Ueland, B. Seetharam, E. H. Pezacka, S. Gulati, S.
Bose, R. Banerjee, R. K. Berge and H. Refsum (1998). "Disruption of a
regulatory system involving cobalamin distribution and function in a
methionine-dependent human glioma cell line." J Biol Chem 273(32): 20180-
20184.
References
164
Fuso, A., L. Seminara, R. A. Cavallaro, F. D'Anselmi and S. Scarpa (2005). "S-
adenosylmethionine/homocysteine cycle alterations modify DNA
methylation status with consequent deregulation of PS1 and BACE and beta-
amyloid production." Mol Cell Neurosci 28(1): 195-204.
Gailus, S., W. Hohne, B. Gasnier, P. Nurnberg, B. Fowler and F. Rutsch (2010).
"Insights into lysosomal cobalamin trafficking: lessons learned from cblF
disease." J Mol Med 88(5): 459-466.
Geng, Y., L. Kohli, B. J. Klocke and K. A. Roth (2010). "Chloroquine-induced
autophagic vacuole accumulation and cell death in glioma cells is p53
independent." Neuro-oncology 12(5): 473-481.
Gonda, D. K., A. Bachmair, I. Wunning, J. W. Tobias, W. S. Lane and A.
Varshavsky (1989). "Universality and structure of the N-end rule." J Biol
Chem 264(28): 16700-16712.
Gonzalez-Noriega, A., J. H. Grubb, V. Talkad and W. S. Sly (1980). "Chloroquine
inhibits lysosomal enzyme pinocytosis and enhances lysosomal enzyme
secretion by impairing receptor recycling." J Cell Biol 85(3): 839-852.
Grabowski, G. A. (2008). "Phenotype, diagnosis, and treatment of Gaucher's
disease." Lancet 372(9645): 1263-1271.
Guan, X., B. Hoffman, C. Dwivedi and D. P. Matthees (2003). "A simultaneous
liquid chromatography/mass spectrometric assay of glutathione, cysteine,
homocysteine and their disulfides in biological samples." Journal of
pharmaceutical and biomedical analysis 31(2): 251-261.
Hall, C. A. (1977). "The carriers of native vitamin B12 in normal human serum."
Clin Sci Mol Med 53(5): 453-457.
References
165
Hall, C. A. (1984). "The uptake of vitamin B12 by human lymphocytes and the
relationships to the cell cycle." J Lab Clin Med 103(1): 70-81.
Hannibal, L., A. Axhemi, A. V. Glushchenko, E. S. Moreira, N. E. Brasch and D. W.
Jacobsen (2008). "Accurate assessment and identification of naturally
occurring cellular cobalamins." Clin Chem Lab Med 46(12): 1739-1746.
Hannibal, L., J. Kim, N. E. Brasch, S. Wang, D. S. Rosenblatt, R. Banerjee and D.
W. Jacobsen (2009). "Processing of alkylcobalamins in mammalian cells: A
role for the MMACHC (cblC) gene product." Mol Genet Metab 97(4): 260-
266.
Healton, E. B., D. G. Savage, J. C. Brust, T. J. Garrett and J. Lindenbaum (1991).
"Neurologic aspects of cobalamin deficiency." Medicine (Baltimore) 70(4):
229-245.
Hejazi, L., J. W. Wong, D. Cheng, N. Proschogo, D. Ebrahimi, B. Garner and A. S.
Don (2011). "Mass and relative elution time profiling: two-dimensional
analysis of sphingolipids in Alzheimer's disease brains." The Biochemical
journal 438(1): 165-175.
Herrmann, W. and R. Obeid (2012). "Cobalamin deficiency." Subcell Biochem 56:
301-322.
Herrmann, W., H. Schorr, M. Bodis, J. P. Knapp, A. Muller, G. Stein and J. Geisel
(2000). "Role of homocysteine, cystathionine and methylmalonic acid
measurement for diagnosis of vitamin deficiency in high-aged subjects."
European journal of clinical investigation 30(12): 1083-1089.
Hodgkin, D. C., J. Kamper, M. Mackay, J. Pickworth, K. N. Trueblood and J. G.
White (1956). "Structure of vitamin B12." Nature 178(4524): 64-66.
References
166
Hygum, K., D. L. Lildballe, E. H. Greibe, A. L. Morkbak, S. S. Poulsen, B. S.
Sorensen, T. E. Petersen and E. Nexo (2011). "Mouse transcobalamin has
features resembling both human transcobalamin and haptocorrin." PLoS One
6(5): e20638.
Ivy, G. O., S. Kanai, M. Ohta, G. Smith, Y. Sato, M. Kobayashi and K. Kitani
(1989). "Lipofuscin-like substances accumulate rapidly in brain, retina and
internal organs with cysteine protease inhibition." Adv Exp Med Biol 266:
31-45; discussion 45-37.
Ivy, G. O., F. Schottler, J. Wenzel, M. Baudry and G. Lynch (1984). "Inhibitors of
lysosomal enzymes: accumulation of lipofuscin-like dense bodies in the
brain." Science 226(4677): 985-987.
Jacobsen, D. W. (2000). "Hyperhomocysteinemia and oxidative stress: time for a
reality check?" Arterioscler Thromb Vasc Biol 20(5): 1182-1184.
Jacobsen, D. W. and A. V. Glushchenko (2009). "The transcobalamin receptor,
redux." Blood 113: 3-4.
Jmoudiak, M. and A. H. Futerman (2005). "Gaucher disease: pathological
mechanisms and modern management." Br J Haematol 129(2): 178-188.
Kim, J., J. M. Basak and D. M. Holtzman (2009). "The role of apolipoprotein E in
Alzheimer's disease." Neuron 63(3): 287-303.
Kim, W. S., H. Li, K. Ruberu, S. Chan, D. A. Elliott, J. K. Low, D. Cheng, T. Karl
and B. Garner (2013). "Deletion of Abca7 increases cerebral amyloid-beta
accumulation in the J20 mouse model of Alzheimer's disease." J Neurosci
33(10): 4387-4394.
Koo, E. H., S. L. Squazzo, D. J. Selkoe and C. H. Koo (1996). "Trafficking of cell-
surface amyloid beta-protein precursor. I. Secretion, endocytosis and
References
167
recycling as detected by labeled monoclonal antibody." Journal of cell
science 109(5): 991-998.
Korolchuk, V. I., F. M. Menzies and D. C. Rubinsztein (2010). "Mechanisms of
cross-talk between the ubiquitin-proteasome and autophagy-lysosome
systems." FEBS letters 584(7): 1393-1398.
Krasinski, S. D., R. M. Russell, I. M. Samloff, R. A. Jacob, G. E. Dallal, R. B.
McGandy and S. C. Hartz (1986). "Fundic atrophic gastritis in an elderly
population. Effect on hemoglobin and several serum nutritional indicators." J
Am Geriatr Soc 34(11): 800-806.
Kruman, II, T. S. Kumaravel, A. Lohani, W. A. Pedersen, R. G. Cutler, Y. Kruman,
N. Haughey, J. Lee, M. Evans and M. P. Mattson (2002). "Folic acid
deficiency and homocysteine impair DNA repair in hippocampal neurons and
sensitize them to amyloid toxicity in experimental models of Alzheimer's
disease." J Neurosci 22(5): 1752-1762.
Kurz, T., J. W. Eaton and U. T. Brunk (2011). "The role of lysosomes in iron
metabolism and recycling." The international journal of biochemistry & cell
biology 43(12): 1686-1697.
Kurz, T., A. Terman, B. Gustafsson and U. T. Brunk (2008). "Lysosomes and
oxidative stress in aging and apoptosis." Biochim Biophys Acta 1780(11):
1291-1303.
Kurz, T., A. Terman, B. Gustafsson and U. T. Brunk (2008). "Lysosomes in iron
metabolism, ageing and apoptosis." Histochemistry and cell biology 129(4):
389-406.
References
168
Langui, D., N. Girardot, K. H. El Hachimi, B. Allinquant, V. Blanchard, L. Pradier
and C. Duyckaerts (2004). "Subcellular topography of neuronal Abeta
peptide in APPxPS1 transgenic mice." Am J Pathol 165(5): 1465-1477.
Langui, D., N. Girardot, K. H. El Hachimi, B. Allinquant, V. Blanchard, L. Pradier
and C. Duyckaerts (2004). "Subcellular topography of neuronal Abeta
peptide in APPxPS1 transgenic mice." The American journal of pathology
165(5): 1465-1477.
Lee, J. H., W. H. Yu, A. Kumar, S. Lee, P. S. Mohan, C. M. Peterhoff, D. M. Wolfe,
M. Martinez-Vicente, A. C. Massey, G. Sovak, Y. Uchiyama, D. Westaway,
A. M. Cuervo and R. A. Nixon (2010). "Lysosomal proteolysis and
autophagy require presenilin 1 and are disrupted by Alzheimer-related PS1
mutations." Cell 141(7): 1146-1158.
Lee, M. J., J. H. Lee and D. C. Rubinsztein (2013). "Tau degradation: the ubiquitin-
proteasome system versus the autophagy-lysosome system." Progress in
neurobiology 105: 49-59.
Lehmann, M., C. G. Gottfries and B. Regland (1999). "Identification of cognitive
impairment in the elderly: homocysteine is an early marker." Dement Geriatr
Cogn Disord 10(1): 12-20.
Levine, B. and G. Kroemer (2008). "Autophagy in the pathogenesis of disease." Cell
132(1): 27-42.
Levitt, A. J. and H. Karlinsky (1992). "Folate, vitamin B12 and cognitive
impairment in patients with Alzheimer's disease." Acta psychiatrica
scandinavica 86(4): 301-305.
References
169
Li, H., G. Evin, A. F. Hill, Y. H. Hung, A. I. Bush and B. Garner (2012).
"Dissociation of ERK signalling inhibition from the anti-amyloidogenic
action of synthetic ceramide analogues." Clin Sci (Lond) 122(9): 409-419.
Li, M., B. Khambu, H. Zhang, J. H. Kang, X. Chen, D. Chen, L. Vollmer, P. Q. Liu,
A. Vogt and X. M. Yin (2013). "Suppression of lysosome function induces
autophagy via a feedback down-regulation of MTOR complex 1 (MTORC1)
activity." J Biol Chem 288(50): 35769-35780.
Lie, S. O. and B. Schofield (1973). "Inactivation of lysosomal function in normal
cultured human fibroblasts by chloroquine." Biochemical pharmacology
22(23): 3109-3114.
Lildballe, D. L., E. Mutti, H. Birn and E. Nexo (2012). "Maximal load of the vitamin
B12 transport system: a study on mice treated for four weeks with high-dose
vitamin B12 or cobinamide." PLoS One 7(10): e46657.
Linnell, J. C. and H. R. Bhatt (1995). "Inherited errors of cobalamin metabolism and
their management." Baillieres Clin Haematol 8(3): 567-601.
Manunta, M., L. Izzo, R. Duncan and A. T. Jones (2007). "Establishment of
subcellular fractionation techniques to monitor the intracellular fate of
polymer therapeutics II. Identification of endosomal and lysosomal
compartments in HepG2 cells combining single-step subcellular fractionation
with fluorescent imaging." J Drug Target 15(1): 37-50.
Maric, M. A., M. D. Taylor and J. S. Blum (1994). "Endosomal aspartic proteinases
are required for invariant-chain processing." Proc Natl Acad Sci U S A 91(6):
2171-2175.
Maron, B. A. and J. Loscalzo (2009). "The treatment of hyperhomocysteinemia."
Annu Rev Med 60: 39-54.
References
170
Martin, B. M., E. Sidransky and E. I. Ginns (1989). "Gaucher's disease: advances
and challenges." Adv Pediatr 36: 277-306.
Martins, A. M., E. R. Valadares, G. Porta, J. Coelho, J. Semionato Filho, M. A.
Pianovski, M. S. Kerstenetzky, F. Montoril Mde, P. C. Aranda, R. F. Pires,
R. M. Mota and T. C. Bortolheiro (2009). "Recommendations on diagnosis,
treatment, and monitoring for Gaucher disease." J Pediatr 155(4 Suppl): S10-
18.
Marzella, L., P. O. Sandberg and H. Glaumann (1980). "Autophagic degradation in
rat liver after vinblastine treatment." Experimental cell research 128(2): 291-
301.
McBride, H. M., M. Neuspiel and S. Wasiak (2006). "Mitochondria: more than just a
powerhouse." Curr Biol 16(14): R551-560.
McCaddon, A. (2006). "Homocysteine and cognition--a historical perspective." J
Alzheimers Dis 9(4): 361-380.
McCaddon, A. and P. R. Hudson (2010). "L-methylfolate, methylcobalamin, and N-
acetylcysteine in the treatment of Alzheimer's disease-related cognitive
decline." CNS Spectr 15(1 Suppl 1): 2-5; discussion 6.
McMahon, J. A., T. J. Green, C. M. Skeaff, R. G. Knight, J. I. Mann and S. M.
Williams (2006). "A controlled trial of homocysteine lowering and cognitive
performance." N Engl J Med 354(26): 2764-2772.
Mellman, I. (1996). "Endocytosis and molecular sorting." Annu Rev Cell Dev Biol
12: 575-625.
Mellman, I., H. F. Willard and L. E. Rosenberg (1978). "Cobalamin binding and
cobalamin-dependent enzyme activity in normal and mutant human
fibroblasts." J Clin Invest 62(5): 952-960.
References
171
Michaelides, M., N. B. Stover, P. J. Francis and R. G. Weleber (2011). "Retinal
toxicity associated with hydroxychloroquine and chloroquine: risk factors,
screening, and progression despite cessation of therapy." Archives of
ophthalmology 129(1): 30-39.
Mindell, J. A. (2012). "Lysosomal acidification mechanisms." Annu Rev Physiol 74:
69-86.
Mizushima, N., T. Yoshimori and B. Levine (2010). "Methods in mammalian
autophagy research." Cell 140(3): 313-326.
Moestrup, S. K. and P. J. Verroust (2001). "Megalin- and cubilin-mediated
endocytosis of protein-bound vitamins, lipids, and hormones in polarized
epithelia." Annu Rev Nutr 21: 407-428.
Molano, A., Z. Huang, M. G. Marko, A. Azzi, D. Wu, E. Wang, S. L. Kelly, A. H.
Merrill, Jr., S. C. Bunnell and S. N. Meydani (2012). "Age-dependent
changes in the sphingolipid composition of mouse CD4+ T cell membranes
and immune synapses implicate glucosylceramides in age-related T cell
dysfunction." PloS one 7(10): e47650.
Moore, E., A. Mander, D. Ames, R. Carne, K. Sanders and D. Watters (2012).
"Cognitive impairment and vitamin B12: a review." International
psychogeriatrics / IPA 24(4): 541-556.
Moras, E., A. Hosack, D. Watkins and D. S. Rosenblatt (2007). "Mitochondrial
vitamin B12-binding proteins in patients with inborn errors of cobalamin
metabolism." Mol Genet Metab 90(2): 140-147.
Morris, M. S. (2003). "Homocysteine and Alzheimer's disease." Lancet Neurol 2(7):
425-428.
References
172
Mueller-Steiner, S., Y. Zhou, H. Arai, E. D. Roberson, B. Sun, J. Chen, X. Wang, G.
Yu, L. Esposito, L. Mucke and L. Gan (2006). "Antiamyloidogenic and
neuroprotective functions of cathepsin B: implications for Alzheimer's
disease." Neuron 51(6): 703-714.
Munnell, J. F. and R. Getty (1968). "Rate of accumulation of cardiac lipofuscin in
the aging canine." J Gerontol 23(2): 154-158.
Murphy, M. P. and H. LeVine, 3rd (2010). "Alzheimer's disease and the amyloid-
beta peptide." Journal of Alzheimer's disease : JAD 19(1): 311-323.
Myers, B. M., P. S. Tietz, J. E. Tarara and N. F. LaRusso (1995). "Dynamic
measurements of the acute and chronic effects of lysosomotropic agents on
hepatocyte lysosomal pH using flow cytometry." Hepatology 22(5): 1519-
1526.
Nakano, M. and S. Gotoh (1992). "Accumulation of cardiac lipofuscin depends on
metabolic rate of mammals." J Gerontol 47(4): B126-129.
Newburg, D. S., T. B. Shea, S. Yatziv, S. S. Raghavan and R. H. McCluer (1988).
"Macrophages exposed in vitro to conduritol B epoxide resemble Gaucher
cells." Exp Mol Pathol 48(3): 317-323.
Nilsson-Ehle, H. (1998). "Age-related changes in cobalamin (vitamin B12) handling.
Implications for therapy." Drugs Aging 12(4): 277-292.
Nilsson, E. and D. Yin (1997). "Preparation of artificial ceroid/lipofuscin by UV-
oxidation of subcellular organelles." Mech Ageing Dev 99(1): 61-78.
Nixon, R. A. (2007). "Autophagy, amyloidogenesis and Alzheimer disease." J Cell
Sci 120(Pt 23): 4081-4091.
References
173
Nixon, R. A., A. M. Cataldo and P. M. Mathews (2000). "The endosomal-lysosomal
system of neurons in Alzheimer's disease pathogenesis: a review."
Neurochem Res 25(9-10): 1161-1172.
Nixon, R. A., J. Wegiel, A. Kumar, W. H. Yu, C. Peterhoff, A. Cataldo and A. M.
Cuervo (2005). "Extensive involvement of autophagy in Alzheimer disease:
an immuno-electron microscopy study." J Neuropathol Exp Neurol 64(2):
113-122.
Nixon, R. A. and D. S. Yang (2011). "Autophagy failure in Alzheimer's disease--
locating the primary defect." Neurobiol Dis 43(1): 38-45.
Nixon, R. A., D. S. Yang and J. H. Lee (2008). "Neurodegenerative lysosomal
disorders: a continuum from development to late age." Autophagy 4(5): 590-
599.
Nothwang, H. G., M. Becker, K. Ociepka and E. Friauf (2003). "Protein analysis in
the rat auditory brainstem by two-dimensional gel electrophoresis and mass
spectrometry." Brain Res Mol Brain Res 116(1-2): 59-69.
Obeid, R. (2013). "The metabolic burden of methyl donor deficiency with focus on
the betaine homocysteine methyltransferase pathway." Nutrients 5(9): 3481-
3495.
Oliva, O., G. Rez, Z. Palfia and E. Fellinger (1992). "Dynamics of vinblastine-
induced autophagocytosis in murine pancreatic acinar cells: influence of
cycloheximide post-treatments." Experimental and molecular pathology
56(1): 76-86.
Pacheco-Quinto, J., E. B. Rodriguez de Turco, S. DeRosa, A. Howard, F. Cruz-
Sanchez, K. Sambamurti, L. Refolo, S. Petanceska and M. A. Pappolla
(2006). "Hyperhomocysteinemic Alzheimer's mouse model of amyloidosis
References
174
shows increased brain amyloid β peptide levels." Neurobiology of disease
22(3): 651-656.
Pasternak, S. H., J. W. Callahan and D. J. Mahuran (2004). "The role of the
endosomal/lysosomal system in amyloid-beta production and the
pathophysiology of Alzheimer's disease: reexamining the spatial paradox
from a lysosomal perspective." J Alzheimers Dis 6(1): 53-65.
Powell, S. R., P. Wang, A. Divald, S. Teichberg, V. Haridas, T. W. McCloskey, K. J.
Davies and H. Katzeff (2005). "Aggregates of oxidized proteins (lipofuscin)
induce apoptosis through proteasome inhibition and dysregulation of
proapoptotic proteins." Free radical biology & medicine 38(8): 1093-1101.
Quadri, P., C. Fragiacomo, R. Pezzati, E. Zanda, G. Forloni, M. Tettamanti and U.
Lucca (2004). "Homocysteine, folate, and vitamin B-12 in mild cognitive
impairment, Alzheimer disease, and vascular dementia." Am J Clin Nutr
80(1): 114-122.
Quadros, E. V., A. L. Regec, K. M. Khan, E. Quadros and S. P. Rothenberg (1999).
"Transcobalamin II synthesized in the intestinal villi facilitates transfer of
cobalamin to the portal blood." Am J Physiol 277(1 Pt 1): G161-166.
Quinn, C. M., K. Kagedal, A. Terman, U. Stroikin, U. T. Brunk, W. Jessup and B.
Garner (2004). "Induction of fibroblast apolipoprotein E expression during
apoptosis, starvation-induced growth arrest and mitosis." Biochem J 378(Pt
3): 753-761.
Refsum, H., P. M. Ueland, O. Nygard and S. E. Vollset (1998). "Homocysteine and
cardiovascular disease." Annu Rev Med 49: 31-62.
Reis, P. A., C. M. Comim, F. Hermani, B. Silva, T. Barichello, A. C. Portella, F. C.
Gomes, I. M. Sab, V. S. Frutuoso, M. F. Oliveira, P. T. Bozza, F. A. Bozza,
References
175
F. Dal-Pizzol, G. A. Zimmerman, J. Quevedo and H. C. Castro-Faria-Neto
(2010). "Cognitive dysfunction is sustained after rescue therapy in
experimental cerebral malaria, and is reduced by additive antioxidant
therapy." PLoS pathogens 6(6): e1000963.
Reynolds, E. (2006). "Vitamin B12, folic acid, and the nervous system." Lancet
Neurol 5(11): 949-960.
Rosenberg, L. E., L. Patel and A. C. Lilljeqvist (1975). "Absence of an intracellular
cobalamin-binding protein in cultured fibroblasts from patients with defective
synthesis of 5'-deoxyadenosylcobalamin and methylcobalamin." Proc Natl
Acad Sci U S A 72(11): 4617-4621.
Rosenblatt, D. S., A. Hosack, N. V. Matiaszuk, B. A. Cooper and R. Laframboise
(1985). "Defect in vitamin B12 release from lysosomes: newly described
inborn error of vitamin B12 metabolism." Science 228(4705): 1319-1321.
Rubinsztein, D. C. (2006). "The roles of intracellular protein-degradation pathways
in neurodegeneration." Nature 443(7113): 780-786.
Rutsch, F., S. Gailus, I. R. Miousse, T. Suormala, C. Sagne, M. R. Toliat, G.
Nurnberg, T. Wittkampf, I. Buers, A. Sharifi, M. Stucki, C. Becker, M.
Baumgartner, H. Robenek, T. Marquardt, W. Hohne, B. Gasnier, D. S.
Rosenblatt, B. Fowler and P. Nurnberg (2009). "Identification of a putative
lysosomal cobalamin exporter altered in the cblF defect of vitamin B12
metabolism." Nat Genet 41(2): 234-239.
Sachdev, P. S., M. Valenzuela, X. L. Wang, J. C. Looi and H. Brodaty (2002).
"Relationship between plasma homocysteine levels and brain atrophy in
healthy elderly individuals." Neurology 58(10): 1539-1541.
References
176
Scarlett, J. D., H. Read and K. O'Dea (1992). "Protein-bound cobalamin absorption
declines in the elderly." Am J Hematol 39(2): 79-83.
Schwarz, A., E. Rapaport, K. Hirschberg and A. H. Futerman (1995). "A regulatory
role for sphingolipids in neuronal growth. Inhibition of sphingolipid
synthesis and degradation have opposite effects on axonal branching." J Biol
Chem 270(18): 10990-10998.
Seetharam, B. and R. R. Yammani (2003). "Cobalamin transport proteins and their
cell-surface receptors." Expert Rev Mol Med 5(18): 1-18.
Selhub, J. (1999). "Homocysteine metabolism." Annu Rev Nutr 19: 217-246.
Serot, J. M., F. Barbe, E. Arning, T. Bottiglieri, P. Franck, P. Montagne and J. P.
Nicolas (2005). "Homocysteine and methylmalonic acid concentrations in
cerebrospinal fluid: relation with age and Alzheimer's disease." J Neurol
Neurosurg Psychiatry 76(11): 1585-1587.
Seshadri, S., A. Beiser, J. Selhub, P. F. Jacques, I. H. Rosenberg, R. B. D'Agostino,
P. W. Wilson and P. A. Wolf (2002). "Plasma homocysteine as a risk factor
for dementia and Alzheimer's disease." N Engl J Med 346(7): 476-483.
Seshadri, S., P. A. Wolf, A. S. Beiser, J. Selhub, R. Au, P. F. Jacques, M. Yoshita, I.
H. Rosenberg, R. B. D'Agostino and C. DeCarli (2008). "Association of
plasma total homocysteine levels with subclinical brain injury: cerebral
volumes, white matter hyperintensity, and silent brain infarcts at volumetric
magnetic resonance imaging in the Framingham Offspring Study." Arch
Neurol 65(5): 642-649.
Sillence, D. J. (2007). "New insights into glycosphingolipid functions—storage, lipid
rafts, and translocators." International review of cytology 262: 151-189.
References
177
Sillence, D. J. (2013). "Glucosylceramide modulates endolysosomal pH in Gaucher
disease." Mol Genet Metab 109(2): 194-200.
Sillence, D. J. and F. M. Platt (2003). "Storage diseases: new insights into
sphingolipid functions." Trends in cell biology 13(4): 195-203.
Silva, D. F., A. R. Esteves, D. M. Arduino, C. R. Oliveira and S. M. Cardoso (2011).
"Amyloid-beta-induced mitochondrial dysfunction impairs the autophagic
lysosomal pathway in a tubulin dependent pathway." J Alzheimers Dis 26(3):
565-581.
Sitte, N., M. Huber, T. Grune, A. Ladhoff, W. D. Doecke, T. Von Zglinicki and K. J.
Davies (2000). "Proteasome inhibition by lipofuscin/ceroid during
postmitotic aging of fibroblasts." FASEB J 14(11): 1490-1498.
Smith, A. D. (2008). "The worldwide challenge of the dementias: a role for B
vitamins and homocysteine?" Food Nutr Bull 29(2 Suppl): S143-172.
Smith, A. D., S. M. Smith, C. A. de Jager, P. Whitbread, C. Johnston, G. Agacinski,
A. Oulhaj, K. M. Bradley, R. Jacoby and H. Refsum (2010). "Homocysteine-
lowering by B vitamins slows the rate of accelerated brain atrophy in mild
cognitive impairment: a randomized controlled trial." PLoS One 5(9):
e12244.
Sohal, R. S. and U. T. Brunk (1989). "Lipofuscin as an indicator of oxidative stress
and aging." Adv Exp Med Biol 266: 17-26; discussion 27-19.
Stadtman, E. R. (1992). "Protein oxidation and aging." Science 257(5074): 1220-
1224.
Strehler, B. L. (1964). "On the Histochemistry and Ultrastructure of Age Pigment."
Adv Gerontol Res 18: 343-384.
References
178
Terman, A. and U. T. Brunk (1998). "Ceroid/lipofuscin formation in cultured human
fibroblasts: the role of oxidative stress and lysosomal proteolysis." Mech
Ageing Dev 104(3): 277-291.
Terman, A. and U. T. Brunk (1998). "Lipofuscin: mechanisms of formation and
increase with age." APMIS 106(2): 265-276.
Terman, A. and U. T. Brunk (1998). "On the degradability and exocytosis of
ceroid/lipofuscin in cultured rat cardiac myocytes." Mech Ageing Dev
100(2): 145-156.
Terman, A. and U. T. Brunk (2004). "Lipofuscin." Int J Biochem Cell Biol 36(8):
1400-1404.
Terman, A. and U. T. Brunk (2006). "Oxidative stress, accumulation of biological
'garbage', and aging." Antioxid Redox Signal 8(1-2): 197-204.
Terman, A., H. Dalen, J. W. Eaton, J. Neuzil and U. T. Brunk (2004). "Aging of
cardiac myocytes in culture: oxidative stress, lipofuscin accumulation, and
mitochondrial turnover." Ann N Y Acad Sci 1019: 70-77.
Terman, A., B. Gustafsson and U. T. Brunk (2006). "The lysosomal-mitochondrial
axis theory of postmitotic aging and cell death." Chem Biol Interact 163(1-2):
29-37.
Terman, A., T. Kurz, M. Navratil, E. A. Arriaga and U. T. Brunk (2010).
"Mitochondrial turnover and aging of long-lived postmitotic cells: the
mitochondrial-lysosomal axis theory of aging." Antioxid Redox Signal 12(4):
503-535.
Terman, A. and S. Sandberg (2002). "Proteasome inhibition enhances lipofuscin
formation." Ann N Y Acad Sci 973: 309-312.
References
179
Thaw, H. H., V. P. Collins and U. T. Brunk (1984). "Influence of oxygen tension,
pro-oxidants and antioxidants on the formation of lipid peroxidation products
(lipofuscin) in individual cultivated human glial cells." Mech Ageing Dev
24(2): 211-223.
Troen, A. M., M. Shea-Budgell, B. Shukitt-Hale, D. E. Smith, J. Selhub and I. H.
Rosenberg (2008). "B-vitamin deficiency causes hyperhomocysteinemia and
vascular cognitive impairment in mice." Proc Natl Acad Sci U S A 105(34):
12474-12479.
Van den Berg, M. P., P. Merkus, S. G. Romeijn, J. C. Verhoef and F. W. Merkus
(2003). "Hydroxocobalamin uptake into the cerebrospinal fluid after nasal
and intravenous delivery in rats and humans." J Drug Target 11(6): 325-331.
van Meerloo, J., G. J. Kaspers and J. Cloos (2011). "Cell sensitivity assays: the MTT
assay." Methods in molecular biology 731: 237-245.
Vitner, E. B. and A. H. Futerman (2013). "Neuronal forms of Gaucher disease."
Handb Exp Pharmacol(216): 405-419.
von Zglinicki, T., E. Nilsson, W. D. Docke and U. T. Brunk (1995). "Lipofuscin
accumulation and ageing of fibroblasts." Gerontology 41 Suppl 2: 95-108.
Walker, J. M. (1994). "The bicinchoninic acid (BCA) assay for protein quantitation."
Methods in molecular biology 32: 5-8.
Willard, H. F., L. M. Ambani, A. C. Hart, M. J. Mahoney and L. E. Rosenberg
(1976). "Rapid prenatal and postnatal detection of inborn errors of
propionate, methylmalonate, and cobalamin metabolism: a sensitive assay
using cultured cells." Human genetics 34(3): 277-283.
References
180
Williams, J. H., E. A. Pereira, M. M. Budge and K. M. Bradley (2002). "Minimal
hippocampal width relates to plasma homocysteine in community-dwelling
older people." Age and ageing 31(6): 440-444.
Williamson, J., J. Goldman and K. S. Marder (2009). "Genetic aspects of Alzheimer
disease." The neurologist 15(2): 80-86.
Wilquet, V. and B. De Strooper (2004). "Amyloid-beta precursor protein processing
in neurodegeneration." Current opinion in neurobiology 14(5): 582-588.
Wolfe, D. M., J. H. Lee, A. Kumar, S. Lee, S. J. Orenstein and R. A. Nixon (2013).
"Autophagy failure in Alzheimer's disease and the role of defective
lysosomal acidification." Eur J Neurosci 37(12): 1949-1961.
Wolfe, D. M., J. H. Lee, A. Kumar, S. Lee, S. J. Orenstein and R. A. Nixon (2013).
"Autophagy failure in Alzheimer's disease and the role of defective
lysosomal acidification." The European journal of neuroscience 37(12):
1949-1961.
Yamani, L., B. F. Gibbs, B. M. Gilfix, D. Watkins, A. Hosack and D. S. Rosenblatt
(2008). "Transcobalamin in cultured fibroblasts from patients with inborn
errors of vitamin B12 metabolism." Mol Genet Metab 95(1-2): 104-106.
Yang, A. J., D. Chandswangbhuvana, L. Margol and C. G. Glabe (1998). "Loss of
endosomal/lysosomal membrane impermeability is an early event in amyloid
Abeta1-42 pathogenesis." J Neurosci Res 52(6): 691-698.
Yang, D. S., P. Stavrides, P. S. Mohan, S. Kaushik, A. Kumar, M. Ohno, S. D.
Schmidt, D. Wesson, U. Bandyopadhyay, Y. Jiang, M. Pawlik, C. M.
Peterhoff, A. J. Yang, D. A. Wilson, P. St George-Hyslop, D. Westaway, P.
M. Mathews, E. Levy, A. M. Cuervo and R. A. Nixon (2011). "Reversal of
autophagy dysfunction in the TgCRND8 mouse model of Alzheimer's disease
References
181
ameliorates amyloid pathologies and memory deficits." Brain 134(Pt 1): 258-
277.
Yassin, M. S., J. Ekblom, M. Xilinas, C. G. Gottfries and L. Oreland (2000).
"Changes in uptake of vitamin B(12) and trace metals in brains of mice
treated with clioquinol." J Neurol Sci 173(1): 40-44.
Yatziv, S., D. S. Newburg, N. Livni, G. Barfi and E. H. Kolodny (1988). "Gaucher-
like changes in human blood-derived macrophages induced by beta-
glucocerebrosidase inhibition." J Lab Clin Med 111(4): 416-420.
Youngdahl-Turner, P., L. E. Rosenberg and R. H. Allen (1978). "Binding and uptake
of transcobalamin II by human fibroblasts." J Clin Invest 61(1): 133-141.
Yu, Z., H. L. Persson, J. W. Eaton and U. T. Brunk (2003). "Intralysosomal iron: a
major determinant of oxidant-induced cell death." Free Radic Biol Med
34(10): 1243-1252.
Yuan, X. M., W. Li, H. Dalen, J. Lotem, R. Kama, L. Sachs and U. T. Brunk (2002).
"Lysosomal destabilization in p53-induced apoptosis." Proc Natl Acad Sci U
S A 99(9): 6286-6291.
Zhang, C. E., W. Wei, Y. H. Liu, J. H. Peng, Q. Tian, G. P. Liu, Y. Zhang and J. Z.
Wang (2009). "Hyperhomocysteinemia increases beta-amyloid by enhancing
expression of gamma-secretase and phosphorylation of amyloid precursor
protein in rat brain." Am J Pathol 174(4): 1481-1491.
Zhao, H., U. T. Brunk and B. Garner (2011). "Age-related lysosomal dysfunction: an
unrecognized roadblock for cobalamin trafficking?" Cell Mol Life Sci
68(24): 3963-3969.
References
182
Zhao, H., K. Ruberu, H. Li and B. Garner (2013). "Analysis of subcellular [57Co]
cobalamin distribution in SH-SY5Y neurons and brain tissue." J Neurosci
Methods 217(1-2): 67-74.
Zhao, H., K. Ruberu, H. Li and B. Garner (2013). "Analysis of subcellular [Co]
cobalamin distribution in SH-SY5Y neurons and brain tissue." J Neurosci
Methods 217(1-2): 67-74.
Zhao, H., K. Ruberu, H. Li and B. Garner (2014). "Perturbation of neuronal
cobalamin transport by lysosomal enzyme inhibition." Bioscience reports.
Zheng, L., K. Kagedal, N. Dehvari, E. Benedikz, R. Cowburn, J. Marcusson and A.
Terman (2009). "Oxidative stress induces macroautophagy of amyloid beta-
protein and ensuing apoptosis." Free Radic Biol Med 46(3): 422-429.
Zheng, L., J. Marcusson and A. Terman (2006). "Oxidative stress and Alzheimer
disease: the autophagy connection?" Autophagy 2(2): 143-145.
Zheng, L., K. Roberg, F. Jerhammar, J. Marcusson and A. Terman (2006).
"Autophagy of amyloid beta-protein in differentiated neuroblastoma cells
exposed to oxidative stress." Neurosci Lett 394(3): 184-189.
Zheng, L., K. Roberg, F. Jerhammar, J. Marcusson and A. Terman (2006).
"Oxidative stress induces intralysosomal accumulation of Alzheimer amyloid
beta-protein in cultured neuroblastoma cells." Ann N Y Acad Sci 1067: 248-
251.
Zheng, L., A. Terman, M. Hallbeck, N. Dehvari, R. F. Cowburn, E. Benedikz, K.
Kagedal, A. Cedazo-Minguez and J. Marcusson (2011). "Macroautophagy-
generated increase of lysosomal amyloid beta-protein mediates oxidant-
induced apoptosis of cultured neuroblastoma cells." Autophagy 7(12): 1528-
1545.
References
183
Zhuo, J. M., G. S. Portugal, W. D. Kruger, H. Wang, T. J. Gould and D. Pratico
(2010). "Diet-induced hyperhomocysteinemia increases amyloid-beta
formation and deposition in a mouse model of Alzheimer's disease." Curr
Alzheimer Res 7(2): 140-149.
Zhuo, J. M. and D. Pratico (2010). "Acceleration of brain amyloidosis in an
Alzheimer's disease mouse model by a folate, vitamin B6 and B12-deficient
diet." Exp Gerontol 45(3): 195-201.
Zhuo, J. M. and D. Pratico (2010). "Normalization of hyperhomocysteinemia
improves cognitive deficits and ameliorates brain amyloidosis of a transgenic
mouse model of Alzheimer's disease." FASEB J 24(10): 3895-3902.
Related Documents