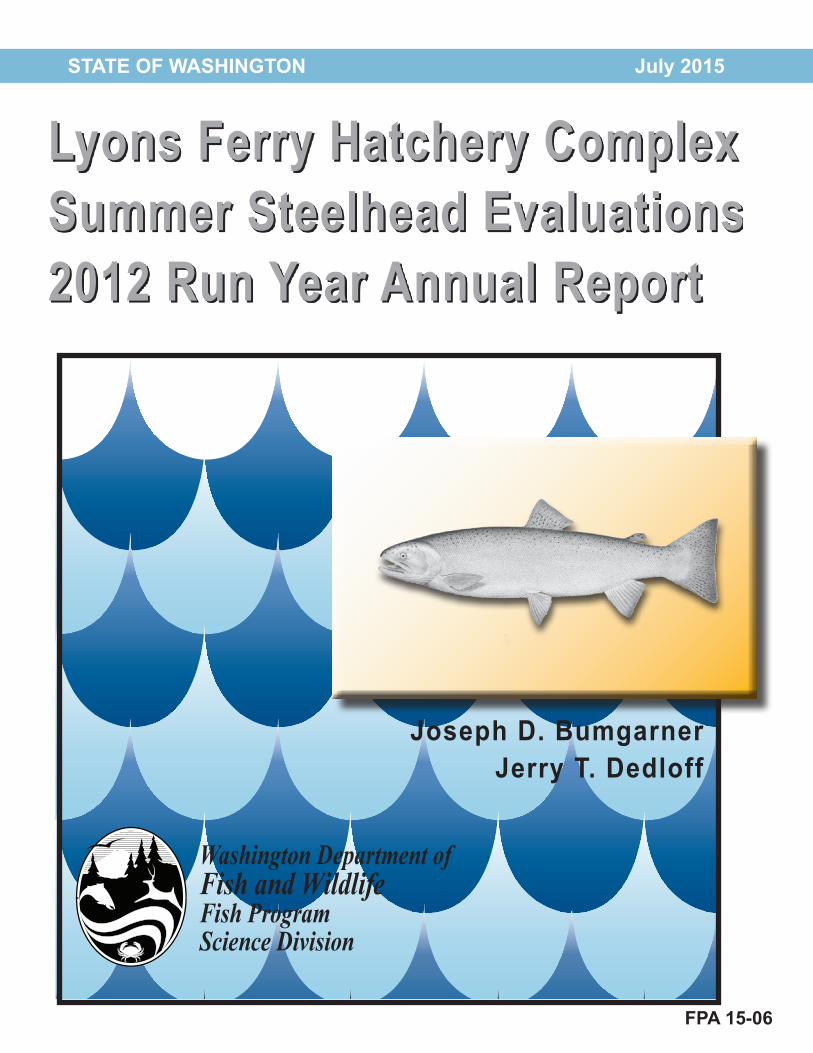
Lyons Ferry Hatchery Complex Summer Steelhead Evaluations 2012 Run Year Annual Report STATE OF WASHINGTON July 2015 Washington Department of Fish and Wildlife Fish Program Science Division Joseph D. Bumgarner Jerry T. Dedloff FPA 15-06

Welcome message from author
This document is posted to help you gain knowledge. Please leave a comment to let me know what you think about it! Share it to your friends and learn new things together.
Transcript
Lyons Ferry Hatchery Complex Summer Steelhead Evaluations 2012 Run Year Annual Report
STATE OF WASHINGTON July 2015
Washington Department ofFish and WildlifeFish ProgramScience Division
Joseph D. BumgarnerJerry T. Dedloff
FPA 15-06


Lyons Ferry Hatchery Complex Summer Steelhead Evaluations
2012 Run Year Annual Report
by
Joseph D. Bumgarner Jerry T. Dedloff
Washington Department of Fish and Wildlife Fish Program / Science Division
600 Capital Way North Olympia, Washington 98501-1091
Prepared for:
U.S. Fish and Wildlife Service Lower Snake River Compensation Plan Office
1387 Vinnell Way, Suite 343 Boise, Idaho 83709
Cooperative Agreement # F13AC00096
July 2015


Acknowledgments
The ongoing success of the steelhead program is the result of the coordinated/dedicated efforts of many WDFW employees. We thank Doug Maxey, Steve Jones, and the LFH and TFH staff for their hard work, insight, and assistance with summer steelhead monitoring and evaluation activities conducted at Lyons Ferry Complex for the year. Special thanks to Michael Gallinat and Lance Ross for the operation of the Tucannon River smolt trap. Current evaluations of summer steelhead in the Tucannon River rely on PIT tags, which begins with the capture and PIT tagging at the smolt trap. Mark rates estimated at the smolt trap are applied to the adults detected at main stem dams and instream PIT Tag Arrays. Over the past few years, Michael re-calculated all prior steelhead smolt estimates (with confidence intervals) using a standardized methodology. These new estimates and confidence intervals allow a range of possible returns of steelhead from the Tucannon River back to the project area (above Ice Harbor) and into the Tucannon River itself. Estimates presented in earlier steelhead evaluation reports have been corrected and are presented in this report. We greatly appreciate the time and effort involved to accomplish this task. We thank the staff of the Snake River Lab, in particular Mark Schuck, Afton Oakerman, Debbie Milks, and seasonal field staff Sean Taylor, Nathan Roueche, Matt Hamby, Doug Falkner, and Cole Webster who helped collect the information presented in this report. We also thank the staff of the Asotin Creek Field Office for assisting with spawning surveys on Asotin Creek. We thank Don Whitney and staff of Idaho Fish and Game for assistance in conducting joint Snake River creel surveys and providing CWT recoveries from Idaho fisheries. We also thank Rich Carmichael’s crew from Oregon Department of Fish and Wildlife, especially Mike Flesher, for their leadership in conducting the Grande Ronde River creel survey and providing angler effort and catch data, and providing CWT recoveries for expansion. Nicole Tancreto with PSMFC provided valuable assistance with our PIT tag files. We thank additional WDFW personnel (John Sneva, Lance Campbell, Gil Lensgrave, and Lynn Anderson) for their assistance with portions of the project. We thank Michael Gallinat, Andrew Murdoch, and Rod Engle for their critical reviews of the draft report. Finally we thank the entire staff of the Lower Snake River Compensation Plan Office for their firm support in funding these monitoring and evaluation studies.

Abstract
This annual report is one in a series describing the Washington Department of Fish and Wildlife’s (WDFW) progress toward meeting summer steelhead and rainbow trout mitigation goals established in the Lower Snake River Compensation Plan (LSRCP). Stocking of LSRCP-produced rainbow trout (208,908 trout) within Washington went as planned and achieved the new LSRCP goal of 198,500. Survival of hatchery steelhead from egg to smolt was greater than 75% for all stocks, and smolt releases and marking/tagging goals for summer steelhead were met, or within acceptable limits. WDFW operates a series of traps in southeast Washington. We report the number of fish captured and released, spawned, composition of hatchery and natural origin fish, coded-wire tag recoveries (where appropriate) and age composition for each steelhead stock. WDFW staff surveyed steelhead sport anglers during 2012/2013 within the LSRCP area of southeast Washington to recover CWTs from tagged steelhead. Summary results of those surveys (anglers, effort, number of fish captured), including joint surveys conducted with ODFW, are provided. All fishery sample data and CWTs recovered were transferred to Olympia for inclusion into the RMIS Regional CWT database. During the spring of 2013, evaluation staff conducted spawning ground surveys to estimate the number of redds in index areas of the Touchet River, Asotin Creek, and Cummings Creek. Stream flows were generally good, but poor conditions limited surveys in some areas. Estimates of redds and spawning fish by origin are provided. Smolt trapping occurred on the Tucannon River to estimate the number of natural origin migrant steelhead. In the 2012/2013 out-migrations we estimated 23,269 natural origin summer steelhead migrants. We continue to PIT tag natural origin steelhead smolts at the Tucannon River smolt trap to estimate smolt-to-adult survivals (SAR) and document straying above Lower Granite Dam. Average SAR of natural origin steelhead from the Tucannon River was 2.7% back to Bonneville Dam, and 2.0% to Ice Harbor Dam. Tucannon River steelhead continue to exhibit a disturbing adult migration pattern, with about 60-70% returning to, and about 50% remaining above, Lower Granite Dam. Similar overshoot rates have also been observed for natural and hatchery steelhead from the Walla Walla Basin, and those steelhead released on-station at LFH. Steelhead released from Cottonwood Pond in the Grande Ronde River do not exhibit this behavior that we are aware of, but limited detection sites exist upstream of Lower Granite Dam.

The LFC summer steelhead program continues to meet and/or exceed its original mitigation goals by supplying large returns of steelhead for harvest in southeast Washington, mainly due to the fact that harvest rates in lower Columbia River fisheries have declined substantially in recent years. Survivals to adult for the endemic Tucannon stock have been high enough to warrant adoption of this program in the Tucannon River. Survivals to adult on the Touchet stock program have been less than desired. WDFW will continue to monitor harvest recoveries and adjust programs as necessary to maintain LSRCP goals.


Lyons Ferry Complex Evaluation: January 2015 Summer Steelhead Annual Report – 2012 Run Year i
Table of Contents
List of Figures ................................................................................................................................ ii List of Tables ................................................................................................................................ iii List of Appendices ........................................................................................................................ vi Introduction ....................................................................................................................................1
Program Objectives ....................................................................................................................1 Production Goals for Rainbow Trout and Summer Steelhead ...................................................3 In-Hatchery Survival ..................................................................................................................4 Marking, Tagging, and the 2013 Smolt Release (2012 Brood) .................................................6 Broodstock Collections/Adult Returns and Evaluations............................................................9
Lyons Ferry Stock Steelhead ...............................................................................................9 Wallowa Stock Steelhead ..................................................................................................11 Tucannon River Stock Steelhead .......................................................................................12 Touchet River Stock Steelhead ..........................................................................................14
Creel Surveys – Snake River and Tributaries ..........................................................................17 Southeast Washington Steelhead Fisheries ........................................................................17 Grande Ronde River Fishery .............................................................................................18
Spawning Ground Surveys ......................................................................................................19 Tucannon River Natural Summer Steelhead Smolt Production, Adult Survival and Return Estimates ...............................................................................................................23 Adult Migratory Patterns Based on PIT tags ...........................................................................29 Smolt-to-Adult Survival Rates .................................................................................................33 Contributions to LSRCP Mitigation Goals ..............................................................................35 Conclusions and Recommendations ........................................................................................40
Literature Cited ...........................................................................................................................45
Lyons Ferry Complex Evaluation: January 2015 Summer Steelhead Annual Report – 2012 Run Year ii
List of Figures Figure 1. Map of major rivers and streams in southeast Washington, and Lyons
Ferry Complex facilities. ...............................................................................................2 Figure 2. Estimated natural and hatchery origin summer steelhead on the
spawning grounds within the Asotin Creek Spawning Ground Survey Index Area (Main stem, North Fork, South Fork, and Charley Creek; 1986-2013). ..................................................................................................................21
Figure 3. Estimated natural and hatchery origin summer steelhead on the
spawning grounds within the Touchet River Index Area (1987-2013) (Areas include the North Fork, South Fork, Wolf Fork, and Robinson Fork). ............................................................................................................................22
Figure 4. Estimates of recruits:spawner for Touchet River summer steelhead. ..........................22 Figure 5. Summer steelhead migrants age distribution by fork length, October
2012 to June 2013 out-migration. ................................................................................25 Figure 6. Migrant production by age class, 1995-2012 brood years. ..........................................26 Figure 7. Smolt-to-adult survival (SAS) estimates (to Bonneville Dam) of LFH or
Tucannon River endemic stock steelhead, 2001-2011 migration years based on PIT tag detections. ........................................................................................35
Figure 8. Smolt-to-adult survival (SAS) estimates (to Bonneville Dam) of LFH or
Touchet River endemic stock steelhead, 2002-2011 migration years based on PIT tag detections. ........................................................................................35
Figure 9. Adult hatchery summer steelhead returns (LFH and Wallowa stock
combined) in relation to the project area or total program goals. ................................39

Lyons Ferry Complex Evaluation: January 2015 Summer Steelhead Annual Report – 2012 Run Year iii
List of Tables
Table 1. Annual broodstock numbers and origin, release locations, and smolt production, marking and tagging goals for all summer steelhead stock produced at Lyons Ferry Complex. ..............................................................................4
Table 2. Numbers of males and females spawned, estimated number of eggs
taken, eyed eggs, eyed eggs retained for program needs, smolts released, and estimated survival by life stage of Wallowa stock summer steelhead spawned at Cottonwood Creek and transferred to LFH, 2000 to 2013 brood years. .....................................................................................................5
Table 3. Numbers of males and females spawned, estimated number of eggs
taken, eyed eggs, eyed eggs retained for program needs, smolts released, and estimated survival by life stage of Tucannon River endemic stock summer steelhead spawned at LFH, 2000 to 2013 brood years. .............................................................................................................................5
Table 4. Numbers of males and females spawned, estimated number of eggs
taken, eyed eggs, eyed eggs retained for program needs, smolts released, and estimated survival by life stage of Touchet River endemic stock summer steelhead spawned at LFH, 2000 to 2013 brood years. .........................6
Table 5. Summer steelhead smolt releases from Lyons Ferry Complex, 2013. .........................8 Table 6. Mean fork lengths, weights, condition factor, coefficient of variation
(CV), fish per pound (FPP), and the percent of visually apparent precocious mature males from LFC steelhead prior to release, 2013. ..........................9
Table 7. Summary of tagged adult summer steelhead trapped at LFH for the
2012 run year. .............................................................................................................10 Table 8. Summary of tagged adult summer steelhead trapped at Cottonwood
Trap for the 2012 run year. .........................................................................................11 Table 9. Natural origin, hatchery LFH stock origin, hatchery Tucannon endemic
stock origin summer steelhead trapped at TFH from the 1997-2012 run years. ...........................................................................................................................12
Table 10. Total number of fish trapped and passed upstream to spawn naturally at
the Tucannon River Adult Trap, 1997-2012 run years. ..............................................13 Table 11. Summary of fresh and salt-water age composition of natural origin adult
steelhead from the Tucannon River, 2000-2013 brood years. Note: this table does not include 3-ocean age fish, or those with freshwater age 4.
Lyons Ferry Complex Evaluation: January 2015 Summer Steelhead Annual Report – 2012 Run Year iv
Only a few of those individuals have been documented overall years (0.04%) .......................................................................................................................13
Table 12. Total number of male and female summer steelhead at the Touchet
River Adult Trap (1992-1994 and 1998-2012 run years). ..........................................15 Table 13. Total number of fish trapped and passed upstream to spawn naturally at
the Touchet River Adult Trap, 1992-1994 and 1998-2012 run years.........................15 Table 14. Summary of fresh and salt-water age composition of natural origin
adults from the Touchet River, 1994-1995 and 1999-2013 brood years. ...................16 Table 15. Steelhead angler interview results for fall/winter/spring of the 2012 run
year from Washington State licensed anglers. ............................................................17 Table 16. Estimated angler effort, catch rates, and harvest for steelhead anglers on
a portion of the Grande Ronde River in Washington, but near the Oregon border, run years 2011, and 2012 (Mike Flesher, ODFW). ..........................18
Table 17. Summer steelhead spawning ground survey results, 2013. ........................................19 Table 18. Standardized redd estimates and redds/kilometer within index reaches
of Asotin Creek in southeast Washington, 1986-2013. ..............................................20 Table 19. Standardized redd estimates and redds/kilometer within index reaches
of the Touchet River in southeast Washington, 1987-2013. ......................................21 Table 20. Updated Tucannon River summer steelhead smolt emigration estimates,
with upper and lower confidence intervals, and proportions of each age class. ............................................................................................................................24
Table 21. Estimated migrant production, percent composition by age class, and
mean length of natural-origin steelhead migrants from the Tucannon River by brood year (1995-2012). ..............................................................................26
Table 22. Estimated smolt-to-adult survival rate of naturally produced summer
steelhead smolts from the Tucannon River based on adult PIT tag detections at Bonneville Dam, Ice Harbor Dam, and in the Tucannon River 1999-2010 migration years. Data shown is for smolts tagged at 125 mm or greater in length. The Tucannon PIT tag array was not operational until 2005. ................................................................................................27
Table 23. Estimated summer steelhead returns for the 2007-2012 run years (RY)
into the Tucannon River based on PIT tag detections. Spawning escapement assumes no pre-spawn mortality due to incidental hooking

Lyons Ferry Complex Evaluation: January 2015 Summer Steelhead Annual Report – 2012 Run Year v
in the fishery, or other factors. PIT array efficiencies have not been taken into account. ......................................................................................................28
Table 24. Detections of PIT tagged Tucannon endemic stock, Tucannon natural
stock, and LFH stock summer steelhead released into the Tucannon River that passed Bonneville Dam (Bonn), Ice Harbor Dam (IHR) and Lower Granite Dam (LGR), and the percent of those that did or didn’t make it back to the Tucannon River. ...........................................................................30
Table 25. Detections of PIT tagged Touchet River endemic stock, Touchet River
natural stock, and LFH stock summer steelhead (Walla Walla and Dayton AP release groups) that crossed Bonnville Dam (Bonn) McNary Dam (MCN), Ice Harbor Dam (IHR), and Lower Granite Dam (LGR), and the percent of those that did or didn’t make it back to the Walla Walla River basin. ........................................................................................................31
Table 26. Detections of PIT tagged Lyons Ferry stock (released at Lyons Ferry) or
Wallowa stock (released in the Grande Ronde at Cottonwood Acclimation Pond) that passed Bonneville Dam (Bonn), Ice Harbor Dam (IHR) and Lower Granite Dam (LGR), and the percent of those that were observed in the Tucannon River, remained between IHR and LGR, or remained above LGR. ..............................................................................................32
Table 27. Smolt-to-adult return (SAR) survival of LFH stock (LFH, Tucannon,
Touchet, and Walla Walla release groups) or Wallowa stock (Grande Ronde release group) summer steelhead back to the lower Snake River project area. ..................................................................................................................34
Table 28. Contribution of LFH stock (LFH, Tucannon, Touchet, and Walla Walla
release groups) or Wallowa stock (Grande Ronde release group) summer steelhead back to the lower Snake River project area..................................................37
Table 29. Contribution of LFH stock (LFH, Tucannon, Touchet, Walla Walla
release groups) or Wallowa stock (Grande Ronde release group) summer steelhead back to the Columbia River. ........................................................................38

Lyons Ferry Complex Evaluation: January 2015 Summer Steelhead Annual Report – 2012 Run Year vi
List of Appendices Appendix A
Rainbow Trout Plants from LFC 2013 ....................................................................................46
Appendix B Bull Trout, Whitefish, and Brown Trout Capture Data from the Touchet River Adult Trap, 2013 ......................................................................................................................48
Appendix C Wallowa Stock Marking/Tagging Scheme ..............................................................................47

Lyons Ferry Complex Evaluation: July 2015 Summer Steelhead Annual Report – 2012 Run Year 1
Introduction This annual report (Run Year 2012) is one in a continuing series describing Washington Department of Fish and Wildlife's (WDFW) progress toward meeting summer steelhead (Oncorhynchus mykiss) and rainbow trout mitigation goals established in the Lower Snake River Compensation Plan (LSRCP). The reporting period covers between 1 July 2012 and 30 June 2013, unless otherwise noted. The LSRCP program in Washington State began in 1981 with construction of Lyons Ferry Hatchery (LFH). Refurbishing of the Tucannon Fish Hatchery (TFH) followed in 1984-1985. In addition to the hatchery construction and modifications, three remote acclimation ponds (AP) were built along the Tucannon (Curl Lake AP), Touchet (Dayton AP), and Grande Ronde (Cottonwood AP) rivers to acclimate juvenile summer steelhead before release. All of these facilities make up WDFW’s Lyons Ferry Complex (LFC) (Figure 1).
Program Objectives Legislation under the Water Resources Act of 1976 authorized the establishment of the Lower Snake River Compensation Plan (LSRCP) to help mitigate for the losses of salmon and steelhead runs due to construction and operation of the Snake River dams and authorized hatchery construction and production in Washington, Idaho, and Oregon as a mitigation tool (USACE 1975). The steelhead trout/resident fish (Oncorhynchus mykiss) portion of the LSRCP as administered by WDFW for the State of Washington was based on two essential criteria: 1) anadromous summer steelhead losses attributable to hydroelectric dam construction on the Snake River amounting to 4,656 adult fish destined for Washington, and 2) resident fisheries for rainbow trout, smallmouth bass (Micropterus dolomieu), sturgeon (Acipenser transmontanus), channel catfish (Ictalurus punctatus), and crappie (Pomoxis sp.) were diminished by 67,500 angler days of recreation annually. These criteria were the basis for designing hatchery facilities capable of producing sufficient steelhead smolt to return 4,656 adults back to the project area (Snake River mouth, including the Walla Walla basin). Additionally, 93,000 pound of catchable size (3 fish/lb) rainbow trout were produced to offset the losses to the resident fisheries. Originally, the LFH was constructed to produce 931,200 steelhead smolts (8 fish/lb - 116,400 pounds) and 45,000 pounds of legal rainbow trout, and TFH was repaired and updated to produce 41,000 pounds of legal rainbow trout, and to aid in the propagation of spring Chinook in the Tucannon River. The remaining 7,000 pounds of catchable rainbow were foregone in-lieu of improving instream habitat in various streams in southeastern Washington. Various actions (e.g. ESA, smolt performance, etc..) have compelled the program to change its steelhead and rainbow trout production goals over the years.

Figure 1. Map of major rivers and streams in southeast Washington, and Lyons Ferry Complex facilities.
Columbia River
Touchet River
Walla Walla River
Ice Harbor Dam
Lower Monumental Dam
Little Goose Dam
Lower Granite Dam
Hatcheries Acclimation Facilities
Adult Trap
Lyons Ferry
Tucannon FH
Curl Lake AP
Dayton AP
Cottonwood AP
Smolt Trap
Lyons Ferry C
omplex E
valuation: July 2015
Summ
er Steelhead Annual R
eport – 2012 Run Y
ear 2

Lyons Ferry Complex Evaluation: July 2015 Summer Steelhead Annual Report – 2012 Run Year 3
Production Goals for Rainbow Trout and Summer Steelhead Rainbow Trout: The LSRCP mitigation trout program has focused on providing recreational fishing opportunities in southeast Washington. The current LFC goal is to produce 198,500 catchable sized (3 fish/lb; generally >8 in) Spokane stock trout (66,167 lbs) for release into southeast Washington area lakes (no stream plants), which is to result in at least 67,500 angler days of recreation. Monitoring of the Tucannon River lakes fishery in 2003 (Mendel and Trump 2010) demonstrate that this goal is easily being met. The LFC also produces a total of 19,250 Spokane stock trout for the Nez Perce Tribe’s resident fish program (1,650 fish) and Idaho Department of Fish and Game (IDFG) resident fall fishery program (17,600 fish). During the report period, stocking of LSRCP produced rainbow trout within Washington lakes/streams (Appendix A), and transfers to Nez Perce Tribe and IDFG went as planned. Summer Steelhead: The LSRCP summer steelhead harvest mitigation program for WDFW is to produce a return of 4,656 adult steelhead to the project area for harvest and to fulfill broodstock needs. The project area is defined as the mouth of the Snake River and upstream. It also includes returns to the Walla Walla basin that were added in the original LSRCP agreement for off-site mitigation because of the drastically reduces fishing areas for steelhead caused by the dams, in addition to the managers being unsure if survival through the hydrosystem in the Snake River would be less than expected . In addition, there is another adult summer steelhead goal for the entire Columbia River (13,968 adults), which assumes a 2:1 economic harvest benefit for lower river fisheries as stated in the original LSRCP planning document (USACE 1975). In 2012, the LFC used four summer steelhead stocks to produce about 645,000 smolts (target size = 4.5 fish/lb (100.8 g/fish, 143,333 pounds) for release into the Snake, Tucannon, Grande Ronde, Walla Walla, and Touchet rivers primarily for enhanced recreational opportunities for steelhead anglers, in addition to two groups (Tucannon and Touchet stocks) also being used for ESA recovery purposes at this time. Changes to the current production levels of summer steelhead may occur in the near future as we continue to address ESA concerns while meeting harvest mitigation goals. In December 2012, WDFW made a decision to eliminate the use of LFH stock steelhead for one of the harvest mitigation programs, and switched the releases that were on-station at LFH, Walla Walla River, and Touchet River at Dayton AP to be of Wallowa stock origin beginning with the 2013 brood year. A revised production table for each steelhead stock is provided (Table 1). The on-station release at LFH is shown as variable, and is adjusted downward from the 160,000 level depending on the production available from the Tucannon endemic stock program, determined on an annual basis per co-manager agreement in US vs Oregon Management Agreement. For example: if there are 110,000 smolts available for the Tucannon endemic stock

Lyons Ferry Complex Evaluation: July 2015 Summer Steelhead Annual Report – 2012 Run Year 4
(50,000 unmarked, 60,000 marked for harvest), then the on-station release is adjusted downward by 60,000, so only 100,000 fish would be released on-station for that year. Excess production of Wallowa stock will be determined early in the rearing cycle; these fish will be planted as fry/fingerlings in area lakes and may contribute to rainbow trout fisheries.
Table 1. Annual broodstock numbers and origin, release locations, and smolt production, marking and tagging goals for all summer steelhead stock produced at Lyons Ferry Complex. Stock
Collection point
Broodstock origin
Broodstock needed
Release location
Total smolt production, mark, and tagging goals
Wallowa Cottonwood Creek Adult Trap
100% Hatchery
140 Females Cottonwood AP 200K, 100% AD Clip, 20K CWT, 6,000 PIT
Dayton AP 85K, 100% AD Clip, 20K CWT, 3,000 PIT
Walla Walla River 100K, 100% AD Clip, 20K CWT, 3,000 PIT
Lyons Ferry 60-160K, 100% AD Clip, 20K CWT, 3,000 PIT
Tucannon Tucannon
Adult Trap 70% Natural 30% Hatchery
28 Females Tucannon River @ Curl Lake Intake
50K, No Fin Clip, 100% CWT, 7,500 PIT
Tucannon River@ Marengo Bridge
50K, 100% AD Clip, 25K CWT, 7,500 PIT
Touchet Touchet
Adult Trap 100% Natural 14 Females North Fork Touchet
River @ Baileysburg Bridge
50K, No Fin Clip, 100% CWT, 5,000 PIT
In-Hatchery Survival One of our main tasks for the hatchery evaluation program is to track survival from the different stocks of steelhead over time, and recommend any changes to improve efficiency of the program. Survival of summer steelhead at LFC facilities remains highly variable among stocks and among years (Tables 2, 3, and 4). Fish health problems (e.g., cold water disease), presence of pathogens such as Infectious Hematopoietic Necrosis virus (IHNV), spawning conditions, and remote spawning sites have all affected in-hatchery survival rates over the years. Due to the nature of the steelhead program and the frequent culling of eggs that have tested positive for IHNV, the only survival goals we used to monitor in hatchery survival is from green-egg to eyed egg, and eyed-egg to smolt release. The survival standard used for the LSRCP program is 80% for green-egg to eyed-egg, and 75% for eyed-egg to smolt release, which for the three current stocks average we have met (Tables 2, 3, and 4). From eyed-egg to smolt release, generally the largest contributor to mortality has been bacterial cold water disease. The severity of the disease varies from year-to-year, but it is documented nearly every year in all stocks.

Lyons Ferry Complex Evaluation: July 2015 Summer Steelhead Annual Report – 2012 Run Year 5
Table 2. Numbers of males and females spawned, estimated number of eggs taken, eyed eggs, eyed eggs retained for program needs, smolts released, and estimated survival by life stage of Wallowa stock summer steelhead spawned at Cottonwood Creek and transferred to LFH, 2000 to 2013 brood years.
Brood year
Number spawned
Green eggs taken
Eyed eggs
Green-to-eyed egg
survival (%)
Number of eyed eggs retained
for program needs
Smolts released
Eyed egg to smolt
survival (%) Female Male 2000 2001 2002 2003 2004 2005 2006 2007 2008 2009 2010 2011 2012 2013
107 97 82 65 68 60
120 106 85
113 56
106 120 144
116 108 87 65
105 70
115 97 85
125 48 82
120 135
523,011 504,182 455,502 327,477 345,565 282,675 316,059 340,589 275,958 494,638 244,487 522,967 632,738 846,970
322,238 381,427 360,811 315,616 326,475 274,586 290,903 310,479 241,638 463,442 212,618 411,077 239,993 642,273
61.6 75.7 79.2 96.4 94.5 97.1 92.0 91.2 87.6 93.7 87.0 78.6 77.5 75.8
322,238 260,000 319,479 242,557 326,475 274,586 290,903 242,710 214,695
172,367 e 242,648 193,180 239,993 599,732
215,584 a 182,722 236,627
137,915 b 150,442 c 169,390
159,242 d 175,961 170,232 163,197 197,839 176,902 205,913
82.5 70.3 74.1 85.9 80.6 61.7 93.5 72.5 79.3 94.7 81.5 91.6 85.8
Mean 84.9 81.1 a A total of 50,270 fry/parr/fingerlings were planted into area lakes from over production. b A total of 70,455 fry/parr/fingerlings were planted into area lakes from overproduction. c A total of 146,481 fry/parr/fingerlings were planted into area lakes from overproduction. d A total of 112,751 fry/parr/fingerlings were planted into area lakes from over production. e The total number of eggs retained includes 40,000 received from ODFW Wallowa Hatchery to supplement the losses from IHNV positive
females spawned at Cottonwood.
Table 3. Numbers of males and females spawned, estimated number of eggs taken, eyed eggs, eyed eggs retained for program needs, smolts released, and estimated survival by life stage of Tucannon River endemic stock summer steelhead spawned at LFH, 2000 to 2013 brood years.
Brood year
Number spawned
Green eggs taken
Eyed eggs
Green-to-eyed egg
survival (%)
Number of eyed eggs retained
for program needs
Smolts released
Eyed egg to smolt
survival (%) Female Male 2000 2001 2002 2003 2004 2005 2006 2007 2008 2009 2010 2011 2012 2013
16 15 13 14 16 14 13 13 1
10 11 21 17 25
21 15 16 18 15 25 16 12 1 9
11 20 19 19
80,850 113,563 74,204 73,573 78,109 77,131 72,520 64,129 3,054 77,279 89,791
121,597 93,065
150,614
71,971 101,197 66,969 46,143 62,460 71,933 67,341 59,970 2,537 68,959 81,100
117,919 72,274
132,460
89.0 89.1 90.2 62.7 80.0 93.3 92.9 93.5 83.1 89.2 90.3 97.0 77.7 87.9
71,971 101,197 66,969 46,143 62,460 71,933 67,341 59,970 2,400 68,959 81,100
117,919 72,274
132,460
60,020 58,616 43,688 42,967 61,238 65,245 62,940 57,230
0 a 57,562 b 77,683
51,124 c 58,357
83.4 57.9 65.2 93.1 98.0 90.7 93.5 95.4 0.0
92.2 95.8 81.7 80.7
Mean 86.9 85.6 a Production of 2,400 was considered inadequate to be of value, these were planted as fry. b A total of 5,999 fry were planted into the Tucannon River as these were high titer positive progeny for IHNV. c A total of 45,236 fry were planted into the Tucannon River as these were high titer positive progeny for IHNV.

Lyons Ferry Complex Evaluation: July 2015 Summer Steelhead Annual Report – 2012 Run Year 6
Table 4. Numbers of males and females spawned, estimated number of eggs taken, eyed eggs, eyed eggs retained for program needs, smolts released, and estimated survival by life stage of Touchet River endemic stock summer steelhead spawned at LFH, 2000 to 2013 brood years.
Brood year
Number spawned
Green eggs taken
Eyed eggs
Green-to-eyed egg
survival (%)
Number of eyed eggs retained
for program needs
Smolts released
Eyed egg to smolt
survival (%) Female Male 2000 2001 2002 2003 2004 2005 2006 2007 2008 2009 2010 2011 2012 2013
12 14 14 16 15 18 18 16 13 15 15 12 17 10
7 11 17 17 10 15 18 17 11 13 13 13 13 8
53,139 69,269 70,843 82,602 68,511 78,813 88,668 73,101 66,520 72,543 75,596 74,408 81,555 65,469
43,572 53,750 66,460 75,059 58,451 75,991 85,730 69,626 62,279 69,801 65,055 64,860 45,418 56,877
82.0 77.6 93.8 90.9 85.3 96.4 96.7 95.2 93.6 96.2 86.1 87.2 55.7 86.9
43,572 53,750 66,460 75,059 58,451 75,991 85,730 69,626 62,279 69,801 65,055 64,860 45,418 56,877
36,487 45,501 31,440 58,733 55,706
52,476 a 58,989 b 48,298 c 55,255 d 62,517 e 62,037 54,386 38,726
83.7 84.7 47.3 78.3 95.3 97.7 85.5 69.4 97.4 89.6 95.4 83.9 85.3
Mean 87.4 84.1 a A total of 21,765 eggs/fry were planted into the Touchet River as these were high titer positive progeny for IHNV. b A total of 14,276 eggs/fry were planted into the Touchet River as these were high titer positive progeny for IHNV. c High fry-smolt loss was due to stress induced mortality of 20,389 fish caused by overcrowding during the PIT tagging operation. d A total of 5,400 eggs were planted into the Touchet River as these were high titer positive progeny for IHNV. e A total of 5,345 fry were planted into the Touchet River as these were high titer positive progeny for IHNV.
Marking, Tagging, and the 2013 Smolt Release (2012 Brood) All harvest mitigation production groups (LFH and Wallowa stocks) destined for release in 2013 were marked with an adipose (AD) fin clip, and a portion of each release group also received a coded-wire tag (CWT), a left ventral fin clip, and a PIT tag prior to release (Table 5). Tagging levels, both CWT and PIT have been set based on expected recoveries/detections as adults. For CWTs, it was determined from previous studies that 20,000/group was adequate to obtain recoveries from a variety of fisheries and traps to assess the harvest program. For PIT tags, the number tagged each year has varied due to budgets, funding source, and the Comparative Survival Study (CSS-Cottonwood releases), though we generally try to tag enough fish to obtain 40-60 adult returns on an annual basis. For all LFH stock steelhead, this equated to a group sizes of 3,000 tags/release, though for 2013, those releases were reduced to 2,500 due to budget constraints. For the Touchet endemic stock (lower survivals) this equated to a minimum of 5,000 tags/release. For the Tucannon endemic stock, all tags are provided by BPA, and due to the nature of that program (conservation and mitigation), and the PIT tag information is guiding those evaluations, 7,500 tags/group are used. At Cottonwood AP, since they are above Lower Granite Dam, releases are included as part of the CSS, where 30% of the fish are run-of-the-river, and 70% are in “passive mode”. Minimum group size for run-of-the-river is 2,000 tags, so a total of 6,000 tags are required for their study.

Lyons Ferry Complex Evaluation: July 2015 Summer Steelhead Annual Report – 2012 Run Year 7
The purpose and use of the marks/tags are as follows: 1) for selective fisheries harvest management (adipose clip), 2) contribution of steelhead to commercial, tribal, and sport fisheries in the ocean, lower Columbia and Snake rivers (CWTs), 3) estimating smolt-to-adult survival and the number of adults back to the project area (PIT), and 4) to document straying (CWT and PIT). Non-harvest mitigation steelhead (Tucannon and Touchet endemic stocks) were given CWTs, but were not externally marked for harvest in the 2013 release. The CWTs for Touchet and Tucannon steelhead stocks are 1) for a hatchery origin identifier when they are captured at the Touchet or Tucannon Adult traps, 2) documenting their harvest in downriver non-selective fisheries, and 3) document straying at other adult traps in SE Washington or other river basins/hatcheries in the Columbia and Snake rivers. Expanded adult returns based on PIT tag detections in all groups will provide the needed information to accurately estimate total contribution of our hatchery summer steelhead to the project area for LSRCP mitigation assessment. Prior to release each year, the WDFW Snake River Lab evaluation staff collect pre-release samples for all LFC release locations (Table 6). Generally, about 200 fish/group are sampled, with the goal to get a sample of the fish a day or two prior to release, so we can best characterize the fish at release. For acclimation sites (Cottonwood and Dayton) that do volitional releases, the sample is collected a day or two before the screens are pulled so fish can exit the pond on their own. In 2013, all release groups from all stocks were close to or above program goals (number of fish and size of fish).

Table 5. Summer steelhead smolt releases from Lyons Ferry Complex, 2013.
Release river Release location (stock)
Rkm
Date of release
Total
number of released smolts
Number of AD-
only released smolts
Number of
CWT released smolts
CWT code
Other external marks
Number of
pounds (lbs)
released
Size of fish
(#/lb)
Estimated loss of
CWT (%)
Number of PIT tags
Grande Ronde Cottonwood AP (Wallowa)
45.6 4/03-20 205,913 851 20,788 636448 Left Ventral
43,811 4.7 3.9 6,000
Snake LFH (Lyons Ferry)
92.8 4/15-19 146,358 168 20,686 636446 Left Ventral
33,926 4.3 0.8 2,500
Touchet Dayton AP (Lyons Ferry)
86.4 4/08-26 84,946 337 20,654 636447 Left Ventral
20,719 4.1 1.6 2,500
Walla Walla McDonald Bridge (Lyons Ferry)
48.0 4/15-17 100,975 482 20,412 636445 Left Ventral
23,266 4.3 2.3 2,500
Tucannon Curl Lake Intake (Tucannon)
66.5 4/22-23 58,357 0 57,011 636078 None 11,404 5.1 2.9 15,000
Touchet NF Touchet Bridge (Touchet)
91.5 4/22 38,726 0 37,627 636440 None 8,068 4.8 2.8 5,000
Lyons Ferry C
omplex E
valuation: July 2015
Summ
er Steelhead Annual R
eport – 2012 Run Y
ear 8

Lyons Ferry Complex Evaluation: July 2015 Summer Steelhead Annual Report – 2012 Run Year 9
Table 6. Mean fork lengths, weights, condition factor, coefficient of variation (CV), fish per pound (FPP), and the percent of visually apparent precocious mature males from LFC steelhead prior to release, 2013.
Location (Stock)
Sample
date
Sample size (N)
Mean length (mm)
Mean weight
(g)
Mean condition factor (K)
CV
FPP
Precocious
(%) Cottonwood AP (Wallowa)
4/2 236 201.7 96.6 1.13 12.6 4.7 0.8
Lyons Ferry (LFH)
4/12 213 215.7 102.7 1.00 10.5 4.4 0.9
Lake #1 (LFH) a
4/15-16 439 224.0 106.3 0.94 6.6 4.3 0.0
Dayton AP (LFH)
4/11 207 214.7 109.4 1.07 10.9 4.1 0.5
Walla Walla (LFH)
4/12 204 213.7 100.3 1.00 10.0 4.5 0.5
Tucannon (Endemic)
4/19 221 193.9 94.9 1.19 16.7 4.8 0.0
Touchet (Endemic)
4/12 224 198.1 94.3 1.09 17.2 4.8 1.8
a Fish removed from Lake#1 during April were released in the Walla Walla River or directly to the Snake River at LFH.
Broodstock Collections/Adult Returns and Evaluations As part of our annual broodstock collection and research activities, WDFW hatchery and evaluation staffs operate a series of adult steelhead traps in southeast Washington Rivers. These traps are primarily used for collection of broodstock, but in some instances, provide us with the opportunity it monitor and assess natural origin steelhead returns. The LFH staff operates the LFH and Cottonwood Creek adult traps. The TFH staff operates the upper Tucannon River adult trap, and the Snake River Lab evaluation staff operates the Touchet River adult trap in Dayton. Information presented below summarizes trapping, collection of broodstock, and hatchery spawning activities and any additional evaluation projects for the reporting period. Lyons Ferry Stock Steelhead The Lyons Ferry adult trap is located the outflow of Lyons Ferry Hatchery, which empties directly to the Snake River. Fish traverse a ladder up to an adult holding pond, where a motorized crowder is used push captured fish to one end of the adult holding pond. A small opening at the end of the pond limits the number of fish that are diverted to a manually operated sorting chute. Summer steelhead and fall Chinook are trapped at the same time, with each diverted to separate adult holding ponds. Fish not needed for broodstock (of either species) can be immediately diverted back to the Snake River.

Lyons Ferry Complex Evaluation: July 2015 Summer Steelhead Annual Report – 2012 Run Year 10
Adult steelhead were trapped from 4 September through 17 September 2012. A total of 1,608 adult steelhead [818 female (61.7%) and 616 male (38.3%)] were trapped. Fish to be retained for broodstock were sorted using electro-narcosis on 26 September 2012. All fish not needed for broodstock or retained to recover CWTs were returned to the Snake River to contribute to the sport fishery (1,067). A total of 96 fish were killed for CWT extraction. On that same day, a total of 99 fish (96 with CWT) were provided to the Clarkston Food Bank. Of the total steelhead trapped at LFH in 2012, three natural origin (unmarked/untagged) fish were found and returned to the Snake River. In early December 2012, WDFW and the co-managers reached a decision to terminate the Lyon Ferry stock steelhead program in the future (see conclusions and recommendations for further explanation). Therefore, on 19 December, fish that were being held for broodstock were sorted to recover the remaining CWTs that might be present in the fish being held, with all other fish returned to the river to contribute to the fishery; with no eggs collected. A total of 154 fish with CWTs were recovered (Table 7) from both sorting events. One Wallowa stock, and one Imnaha stock were recovered (<2% stray origin). Age composition of the return based on CWT recoveries was 57.8% one-ocean and 42.2% two-ocean. Mortality during trapping and holding was 12 fish (0.7% of all fish trapped). All steelhead trapped and/or retained were scanned for PIT tags. For the 2013 brood, we detected 38 unique PIT tags in fish trapped for broodstock. Many were tagged and released as juvenile from LFH, Tucannon, Touchet, or Walla Walla rivers, while others were tagged at main stem Columbia or Snake River dams as juveniles during outmigration or as adult returns. All recovered PIT tag data was uploaded to PTAGIS per sampling and reporting protocols.
Table 7. Summary of tagged adult summer steelhead trapped at LFH for the 2012 run year.
Brood year CWT code Stock Release site Number of CWTs 2009 63 / 51 / 67
63 / 51 / 68 63 / 51 / 69 63 / 51 / 70 63 / 51 / 71
LFH LFH LFH LFH
Wallowa
Snake River – On Station Walla Walla River Tucannon River Touchet River @ Dayton AP Grande Ronde @ Cottonwood AP
32 19 13 20 1
2010 63 / 55 / 68 63 / 55 / 69 63 / 55 / 70 09 / 02 / 96
LFH LFH LFH
Imnaha River
Snake River – On Station Walla Walla River Touchet River @ Dayton AP Little Sheep Creek, Imnaha River
48 10 10
1
LV or RV clip - No CWT 6 Lost CWT 1 Grand Total For Year 161

Lyons Ferry Complex Evaluation: July 2015 Summer Steelhead Annual Report – 2012 Run Year 11
Wallowa Stock Steelhead The Cottonwood Creek adult trap is located about 200 meters upstream of the Cottonwood Creek mouth where it meets the Grande Ronde River. Fish enter a small holding area once they enter trap. Fish in the trap area are sorted once or multiple times a day depending on expected returns and stream flows. Fish to be held for broodstock are netted to a holding area immediately upstream of the trap area, with all wild fish (unmarked/untagged) passed immediately upstream so they can spawn in Cottonwood Creek. A total of 942 adult steelhead [419 (44.5%) male, 523 (55.5%) female] were trapped from mid-February to 23 April. Twenty-six (13 male and 13 female) natural origin fish were captured during the season; all were passed upstream. Age composition based on CWT recoveries of sampled hatchery origin fish was 48.8% one-ocean and 51.2% two-ocean. For the season, 144 females and 136 males were spawned for an egg-take total of 846,970 eggs. Initial egg loss was 24.2%, leaving an estimated 642,273 eyed-eggs for production. No IHNV was detected in any of the females. Eggs in excess of program needs were destroyed per fish health guidelines and with agreement with co-managers (42,541); eyed eggs that were retained equaled 599,732. All carcasses from spawned fish, or those killed to retrieve the CWTs, or were in excess of program needs were buried at LFH, or provided to the Walla Walla Community College for science classroom dissections. In 2013, hatchery staff used an automatic egg picker on all Wallowa stock steelhead, therefore, no individual fecundities by salt-age class were collected. Mean fecundity for the year (both age classes was 5,882 eggs/female. We recovered 93 fish that had, or should have had CWTs (Table 8). Sex ratio of CWT fish (44% male, 56% female) was similar to those that were trapped at large. All CWTs recovered from the 2012 run year were originally released on-site at Cottonwood AP, similar to previous years. All steelhead trapped and/or retained were scanned for PIT tags. For the 2013 brood, we detected 25 unique PIT tags in the fish trapped at Cottonwood. Ten were tagged and released from Cottonwood AP, while others were tagged at the Grande Ronde smolt trap or at Snake River dams as juveniles, or tagged as adult returns in the Columbia and Snake rivers at various locations. All recovered PIT tag data was uploaded to PTAGIS per sampling and reporting protocols.
Table 8. Summary of tagged adult summer steelhead trapped at Cottonwood Trap for the 2012 run year.
Brood year CWT code Stock Release site Number of CWTs 2009 2010
63 / 51 / 71 63 / 55 / 67
Wallowa Wallowa
Cottonwood AP Cottonwood AP
41 48
LV clip - No CWT 4 Grand Total for Year 93

Lyons Ferry Complex Evaluation: July 2015 Summer Steelhead Annual Report – 2012 Run Year 12
Tucannon River Stock Steelhead A permanent adult steelhead and salmon trap was installed in 1998 at the TFH water intake diversion dam. Natural and Tucannon River hatchery endemic stock origin steelhead are enumerated, sampled, and passed upstream to spawn, while LFH stock fish are returned to below the trap unless they are a fish with a CWT. Any AD-clipped steelhead with a CWT present are killed so the tag can be extracted. For the 2012 run year (February-May), hatchery staff trapped 82 natural origin, 218 Tucannon River endemic hatchery stock and 15 LFH stock hatchery-origin steelhead (Tables 9 and 10). Twenty-eight females (18 natural, 10 hatchery endemic origin) and 15 males (11 natural and four hatchery endemic origin) were collected for broodstock. Additionally, seven natural males were live spawned at the adult trap and released, with all of those being used for spawning at the hatchery. At the end of the spawning season, endemic hatchery origin fish contributed to 28.9% of the broodstock. During March and April 2013, 25 females were spawned with 19 males at LFH. Total egg take was estimated at 150,614 (Table 3), and none of the spawned females tested positive for IHNV. Natural fish trapped from the TFH trap consisted of 35.2% one-ocean and 64.8% two-ocean age fish (Table 11). Of the 25 females spawned, 21 were two-ocean females with an average fecundity of 6,338 eggs, with the remaining one-ocean females having an average fecundity of 4,380 eggs.
Table 9. Natural origin, hatchery LFH stock origin, hatchery Tucannon endemic stock origin summer steelhead trapped at TFH from the 1997-2012 run years.
Run year
Natural stock LFH hatchery stock Tucannon endemic hatchery stock Totals (%)
Male Female Total Male Female Total Male Female Total Natural Female 1997 8 10 18 31 47 78 NA NA NA 18.8 59.4 1998 9 13 22 14 19 33 NA NA NA 40.0 58.2 1999 12 6 18 5 5 10 NA NA NA 64.3 39.3 2000 9 1 10 3 0 3 NA NA NA 76.9 7.7 2001 75 103 178 24 4 28 NA NA NA 86.4 51.9 2002 30 34 64 9 3 12 NA NA NA 84.2 48.7 2003 23 10 33 5 0 5 4 1 5 78.6 25.6 2004 36 7 43 2 0 2 11 2 13 74.1 15.5 2005 12 8 20 1 0 1 7 11 18 51.3 48.7 2006 12 2 14 3 2 5 11 3 14 42.4 21.2 2007 6 4 10 5 0 5 6 2 8 43.5 26.1 2008 38 50 88 6 2 8 121 121 242 26.0 51.2 2009 181 142 323 3 5 8 183 147 330 48.9 44.5 2010 78 124 202 1 2 3 33 97 130 60.3 66.6 2011 78 108 186 0 2 2 104 107 211 46.6 54.4 2012 37 45 82 10 5 15 76 142 218 26.0 61.0

Lyons Ferry Complex Evaluation: July 2015 Summer Steelhead Annual Report – 2012 Run Year 13
Table 10. Total number of fish trapped and passed upstream to spawn naturally at the Tucannon River Adult Trap, 1997-2012 run years.
Run year
Natural stock LFH hatchery stock Tucannon endemic
hatchery stock
Trapped Passed Passed
(%) Trapped Passed Passed
(%) Trapped Passed Passed
(%) 1997 18 18 100 78 78 100 NA NA NA 1998 22 22 100 33 33 100 NA NA NA 1999 18 18 100 10 0 0 NA NA NA 2000 10 10 100 3 0 0 NA NA NA 2001 178 178 100 28 2 7 NA NA NA 2002 64 64 100 12 1 8 NA NA NA 2003 33 33 100 5 0 0 5 5 100 2004 43 43 100 2 1 50 13 13 100 2005 20 20 100 1 0 0 18 18 100 2006 14 14 100 5 0 0 14 14 100 2007 10 8 80 5 0 0 8 8 100 2008 88 68 77 8 0 0 242 235 97 2009 323 298 92 8 0 0 330 318 96 2010 202 157 78 3 0 0 130 125 96 2011 186 139 75 2 0 0 211 211 100 2012 87 58 67 15 0 0 218 204 94
Table 11. Summary of fresh and salt-water age composition of natural origin adult steelhead from the Tucannon River, 2000-2013 brood years. Note: this table does not include 3-ocean age fish, or those with freshwater age 4. Only a few of those individuals have been documented overall years (0.04%)
Brood year
Age 1.1 Age 1.2 Age 2.1 Age 2.2 Age 3.1 Age 3.2 Repeat Spawners
(%) N % N % N % N % N % N %
2000 18 25.0 6 8.3 36 50.0 7 9.7 5 6.9 0 0.0 0.0 2001 0 0 13 27.1 13 27.1 19 39.6 0 0.0 3 6.3 0.0 2002 5 8.8 10 17.5 29 50.9 10 17.5 3 5.3 0 0.0 0.0 2003 0 0 4 3.9 29 28.2 56 54.4 5 4.9 6 5.8 3.6 2004 0 0 0 0.0 42 68.9 13 21.3 5 4.9 0 0.0 1.0 2005 15 4.8 32 10.3 99 31.9 141 45.5 14 4.5 7 2.3 0.6 2006 5 4.6 7 6.5 44 40.7 44 40.7 6 5.6 1 0.9 0.9 2007 1 2.0 7 14.3 16 32.7 18 36.7 4 8.2 2 4.1 0.0 2008 1 6.3 1 6.2 8 50.0 5 31.2 1 6.3 0 0.0 0.0 2009 0 0.0 2 2.7 38 50.7 12 16.0 11 14.7 7 9.3 2.7 2010 8 5.6 10 7.0 91 63.6 22 15.4 10 7.0 2 1.4 0.0 2011 1 0.8 2 1.6 30 23.8 78 61.9 5 4.0 10 7.9 0.0 2012 0 0.0 0 0.0 12 17.4 49 71.0 5 7.2 3 4.3 0.0 2013 4 5.5 3 4.1 14 19.2 44 60.3 3 4.1 4 5.5 1.4
Combined 58 4.4 97 7.4 501 38.3 518 39.6 77 5.9 45 3.4 0.6
Lyons Ferry Complex Evaluation: July 2015 Summer Steelhead Annual Report – 2012 Run Year 14
Touchet River Stock Steelhead The Touchet River adult trap, located in Dayton near river kilometer (rkm) 86.4 has been operated continuously each spring since 1999. Dates of annual operation have varied each year due to environmental or other conditions. The main purpose of the adult trap is to capture adult summer steelhead for stock assessment purposes, or for a potentially new hatchery broodstock for use in the Touchet River. This program (similar in nature to the Tucannon River program; see prior sections) continues, but is still considered experimental. Between 2000 and 2009, nearly all LFH stock fish captured in the Touchet River adult trap were returned downstream to either recycle through the sport fishery, or to separate them from the upriver spawning locations. Beginning in 2009, all LFH stock fish captured were transported to the Dayton Juvenile Pond, or were killed outright to obtain the CWT (if present) and provided to the Dayton food bank if possible. For the season, staff trapped 194 (64.7%) natural, 21 (7.0%) LFH hatchery origin, and 85 (28.3%) Touchet River endemic hatchery origin steelhead (Tables 12 and 13). Natural steelhead trapped for the 2012 run year consisted of 47.1% one-ocean and 52.9% two-ocean age fish (Table 14). Sex ratio of natural origin fish was 67.0% female, while hatchery steelhead was 68.9% female. We collected 31 natural origin fish (15 females and 16 males) for broodstock. There was one male pre-spawning mortality (3.2%), and no spawned females tested positive for the IHN virus. Of the fish collected for broodstock, 10 females (all 2-ocean) were spawned with eight males yielding 65,469 eggs (Table 4). Since the run consisted mostly of larger fish (age 2-ocean) with greater fecundity, not all females collected were needed to reach eggtake goals. The remaining five females and 15 live males (8 used for spawning, seven were not) were returned to the river on 15 April. For the 2012 run year, mean fecundities of the two-ocean females were 6,547 eggs.

Lyons Ferry Complex Evaluation: July 2015 Summer Steelhead Annual Report – 2012 Run Year 15
Table 12. Total number of male and female summer steelhead at the Touchet River Adult Trap (1992-1994 and 1998-2012 run years).
Run year
Natural stock LFH hatchery stock Touchet Endemic
hatchery stock Totals (%) Male Female Total Male Female Total Male Female Total Natural Female
1992 17 36 53 2 6 8 NA NA NA 86.9% 68.9% 1993 9 34 43 1 1 2 NA NA NA 95.6% 77.8% 1994 2 6 8 1 1 2 NA NA NA 80.0% 70.0% 1998 13 29 42 5 2 7 NA NA NA 85.7% 63.3% 1999 9 22 31 3 0 3 NA NA NA 91.2% 64.7% 2000 51 129 180 18 19 37 NA NA NA 82.9% 68.2% 2001 68 106 174 9 10 19 NA NA NA 90.2% 60.1% 2002 27 91 118 4 7 11 0 1 1 90.8% 76.2% 2003 28 73 101 19 8 27 11 5 16 70.1% 59.7% 2004 38 48 86 19 25 44 4 7 11 61.0% 56.7% 2005 63 98 161 6 9 15 7 28 35 76.3% 64.0% 2006 38 107 145 13 13 26 12 32 44 67.4% 70.7% 2007 34 85 119 9 10 19 7 20 27 72.1% 69.7% 2008 53 95 148 13 13 26 27 48 75 59.4% 62.7% 2009 267 334 601 35 47 82 42 108 150 72.1% 58.7% 2010 92 242 334 21 45 66 14 42 56 73.2% 72.1% 2011 61 114 175 2 8 10 16 33 49 74.8% 66.2% 2012 64 130 194 11 10 21 22 63 85 64.7% 67.7%
Table 13. Total number of fish trapped and passed upstream to spawn naturally at the Touchet River Adult Trap, 1992-1994 and 1998-2012 run years.
Run year
Natural stock LFH hatchery stock Touchet endemic hatchery stock
Trapped Passed Passed
(%) Trapped Passed Passed
(%) Trapped Passed Passed
(%) 1992 53 49 92.5% 8 7 87.5% NA NA NA 1993 43 43 100.0% 2 2 100.0% NA NA NA 1994 8 8 100.0% 2 2 100.0% NA NA NA 1998 42 42 100.0% 7 7 100.0% NA NA NA 1999 31 9 29.0% 3 0 0.0% NA NA NA 2000 180 142 78.9% 37 8 21.6% NA NA NA 2001 174 136 78.2% 19 4 21.1% NA NA NA 2002 118 84 71.2% 11 1 9.1% 1 1 100.0% 2003 101 69 68.3% 27 1 3.7% 16 16 100.0% 2004 86 42 48.8% 44 16 36.4% 11 11 100.0% 2005 161 120 74.5% 15 0 0.0% 35 34 97.1% 2006 145 109 75.2% 26 0 0.0% 44 44 100.0% 2007 119 93 78.2% 19 0 0.0% 27 27 100.0% 2008 148 116 78.4% 26 0 0.0% 75 75 100.0% 2009 601 566 94.2% 82 0 0.0% 150 150 100.0% 2010 334 300 89.8% 66 0 0.0% 56 56 100.0% 2011 175 143 81.7% 10 0 0.0% 49 49 100.0% 2012 194 163 84.0% 21 0 0.0% 85 84 98.8%

Lyons Ferry Complex Evaluation: July 2015 Summer Steelhead Annual Report – 2012 Run Year 16
Table 14. Summary of fresh and salt-water age composition of natural origin adults from the Touchet River, 1994-1995 and 1999-2013 brood years.
Brood year
Age 1.1 Age 1.2 Age 2.1 Age 2.2 Age 3.1 Age 3.2 Age 4.1 Age 4.2 Repeat
N % N % N % N % N % N % N % N % Spawners (%)
1994 0 0.0 0 0.0 6 28.6 8 38.1 3 14.3 3 14.3 0 0.0 0 0.0 4.8 1995 0 0.0 0 0.0 0 0.0 6 85.7 0 0.0 0 0.0 0 0.0 1 14.3 0.0 1999 0 0.0 1 3.2 18 58.1 9 29.0 2 6.5 0 0.0 0 0.0 0 0.0 3.2 2000 1 3.2 1 3.2 17 54.8 8 25.8 3 9.7 1 3.2 0 0.0 0 0.0 0.0 2001 1 0.6 14 8.0 84 48.3 40 23.0 15 8.6 9 5.2 1 0.6 0 0.0 5.7 2002 6 4.8 3 2.4 84 67.7 20 16.1 6 4.8 3 2.4 0 0.0 0 0.0 1.6 2003 0 0.0 8 6.7 20 16.7 73 60.8 2 1.7 10 8.3 0 0.0 0 0.0 5.8 2004 0 0.0 1 0.8 47 39.2 18 15.0 18 15.0 2 1.7 1 0.8 0 0.0 10.3 2005 0 0.0 0 0.0 37 44.0 21 25.0 15 17.9 8 9.5 0 0.0 0 0.0 3.6 2006 2 1.3 7 4.5 85 54.8 38 24.5 7 4.5 11 7.1 0 0.0 0 0.0 3.2 2007 2 1.4 11 7.9 46 32.9 54 38.6 7 5.0 14 10.0 1 0.7 0 0.0 2.9 2008 2 1.7 6 5.2 47 40.5 38 32.8 7 6.0 7 6.0 0 0.0 0 0.0 7.8 2009 3 2.1 0 0.0 81 56.3 21 14.6 19 13.2 8 5.6 0 0.0 0 0.0 8.3 2010 15 4.1 14 3.8 230 62.8 74 20.2 23 6.3 4 1.1 0 0.0 0 0.0 1.9 2011 3 1.4 9 4.3 54 25.6 114 54.0 16 7.6 10 4.7 0 0.0 0 0.0 2.6 2012 13 8.5 3 2.0 45 29.4 69 45.1 13 8.5 4 2.6 1 0.7 1 0.7 2.6 2013 3 2.1 37 25.9 32 22.4 53 37.1 0 0.0 14 9.8 0 0.0 0 0.0 3.3
Totals 51 1.8 115 4.6 933 40.7 664 34.6 156 7.8 108 5.4 4 0.2 2 0.9 4.0 In addition to trapping summer steelhead, we also capture spring Chinook salmon (O. tshawytscha), bull trout (Salvelinus confluentus), bridgelip sucker (Catastomus columbianus), brown trout (Salmo trutta), whitefish (Prosopium williamsoni) and Northern Pike Minnow (Ptychocheilus oregonensis) in the Touchet adult trap. The number of fish trapped since 1993,a and biological data collected from bull trout, brown trout, and whitefish trapped in 2013 at the Touchet adult trap are provided in Appendix B. Appendix B also provides some summary information on all bull trout that have been PIT tagged since 2001, with the number of recaptures each year and estimated growth between ages based on PIT tagged recaptures. All PIT tags used to tag the bull trout were provided by WDFW Fish Management staff.

Lyons Ferry Complex Evaluation: July 2015 Summer Steelhead Annual Report – 2012 Run Year 17
Creel Surveys – Snake River and Tributaries Southeast Washington Steelhead Fisheries Staff stationed out of the Snake River Lab, or in the Clarkston area surveyed sport anglers within the LSRCP area of Washington to recover CWTs from tagged steelhead using methods described in Schuck et al. (1990). Funding for creel surveys are provided by LSRCP (~60%), with the remaining 40% funded by WDFW under the Columbia River Endorsement Stamp collected as part of the purchase of a standard fishing license and salmon/steelhead catch record card. While not presented here, the number of LFC steelhead in the sport catch in southeast Washington was estimated using WDFW sport harvest estimates from Washington catch record cards. Total contribution of LFC steelhead within these fisheries is available upon request from the Snake River Lab office, and can also be acquired from the Regional Mark Information System (RMIS). When possible, data from weekly surveys were summarized during the season and provided to the local news media to inform anglers. For the 2012/13 run year, we sampled over 16,000 anglers which fished, at time of interview, more than 70,000 hours (Table 15). Nearly 2,500 hatchery fish were sampled, with a little over 1,800 natural origin fish captured and released. Vere few (<300) hatchery fish were released, with the majority of those (84%) released in the Grande Ronde River fishery.
Table 15. Steelhead angler interview results for fall/winter/spring of the 2012 run year from Washington State licensed anglers.
River Basin River section description a
River section number
Anglers surveyed
Total hours fished
Natural fish
released
Hatchery fish kept
Hatchery fish
released
Catch rate
(hours/fish)
Columbia River Basin McNary Dam to Pasco Snake River Basin Mouth to IHR IHR to LMD LMD to LGD LGD to LGR LGR to Hwy 12 Br. Hwy 12 Br. Upstream Lower Grande Ronde (Washington Only) Tucannon River Touchet River Walla Walla River
533
640 642 644 646 648 650
592 653 657 659
1,941
92
4,786 2,138 741 700
4,063
1418 173 19 32
6,820
438
14,575 10,322 2,620 3,135
25,279
7058 357 25 61
221
4
287 323 74 35
647
201 28 1 5
250
8
408 514 82 88
707
407 21 2 1
5
0 6 9 1 0 24
222 1 1 0
14.3
36.5 20.8 12.2 16.7 25.5 18.3
8.5 7.1 6.3
10.2 Totals 16,103 70,690 1,826 2,488 269 15.4 a Abbreviations as follows: IHR=Ice Harbor Dam, LMD=Lower Monumental Dam, LGD=Little Goose Dam, LGR=Lower Granite Dam,
Hwy=Interstate Highway. Creel information from sections 648 and 650 include data collected by IDFG.

Lyons Ferry Complex Evaluation: July 2015 Summer Steelhead Annual Report – 2012 Run Year 18
Grande Ronde River Fishery In addition to the creel surveys on the Snake River, Tucannon River, and in the Walla Walla Basin, we cooperate with ODFW in conducting a joint survey of anglers on the lower Grande Ronde River of Washington and Oregon. The area of the Grande Ronde within Washington included here is from Highway 129 to the Oregon state border, and it does not include downstream portions of the Grande Ronde River to its mouth. Angler effort, catch rates, and harvest were estimated by ODFW staff as described in Carmichael et al. (1988). The total number of fish sampled during the fishery and estimated harvest by the joint surveys from the Grande Ronde fishery in the Washington portion were supplied by ODFW for the 2011 and 2012 run years (Table 16). Compared to other harvest areas (Table 15), note the number of released hatchery fish in the Grande Ronde fishery. This is primarily due to anglers not wanting to keep fish late in the season, and fisherman that catch/release so they can continue fishing for the day.
Table 16. Estimated angler effort, catch rates, and harvest for steelhead anglers on a portion of the Grande Ronde River in Washington, but near the Oregon border, run years 2011, and 2012 (Mike Flesher, ODFW).
2011 2012
Sept. Oct. Nov. Dec. Jan. Feb. Mar. Apr. Total
Effort Hours
Catch Rate a
Total Catch b
Fish Kept
Hatchery Released
Natural Released
1404.2
0.0648
91
7
28
57
7256.1
0.1220
885
158
273
455
4493.6
0.1257
565
209
94
262
1309.6
0.0694
91
39
20
32
1448.0
0.1039
151
67
9
75
6273.4
0.2520
1,581
945
369
267
6703.3
0.3076
2,062
1,086
745
231
634.4
0.1620
103
85
7
11
29,522.6
1.2074
5,529
2,596
1,545
1,390
2012 2013
Sept. Oct. Nov. Dec. Jan. Feb. Mar. Apr. c Total Effort Hours
Catch Rate a
Total Catch b
Fish Kept
Hatchery Released
Natural Released
988.8
0.0190
19
0
0
19
3853.2
0.0398
153
23
45
86
3554.3
0.0809
288
94
45
149
1721.2
0.1051
181
64
34
83
390.2
0.1762
69
5
15
49
5886.4
0.1491
878
447
176
255
8161.7
0.1830
1,494
781
473
240
NA
NA
NA
NA
NA
NA
24555.8
0.7531
3,082
1,414
788
881 a Catch rate here is defined as the estimated fish captured divided by the hours fished. b Estimated fish captured have been rounded to whole numbers, so total of fish kept and released may not always add up to
total catch. c Due to low effort and few fish kept during the month of April, WDFW and ODFW decided to discontinue sampling during
that month beginning in 2013.

Lyons Ferry Complex Evaluation: July 2015 Summer Steelhead Annual Report – 2012 Run Year 19
Spawning Ground Surveys During the spring of 2013, evaluation staff conducted spawning ground surveys to estimate the number of summer steelhead redds in index areas of the Touchet River, Asotin Creek, and Cummings Creek on the Tucannon River drainage. Additional surveys were conducted in the Tucannon River upstream of the TFH adult trap. These surveys were supported by additional funding from BPA and results from those and other surveys will be presented in BPA annual reports. In Asotin Creek, stream flows were low in March, allowing for initial surveys to begin, but then remained moderate in most of the areas during the month of April, which greatly limited our ability to conduct surveys during the prime spawning period. Surveys were able to resume again in late April through the month of May (Table 17), but without surveys being conducted in early to mid-April, our confidence in the estimates provided are less than desired. In the Touchet River, most surveys were limited to the month of May, except in the South Fork, where a few surveys were conducted in March and April by WDFW or the Confederated Tribes of the Umatilla Indian Reservation (CTUIR). However, due the apparent lack of gravel scouring from stream flows, redd life was long and we had greater confidence that our redd counts were accurate. Cummings Creek (Tucannon River Basin) was surveyed once in May.
Table 17. Summer steelhead spawning ground survey results, 2013.
Stream Section surveyed
Estimated river kilometers surveyed
Dates
surveyed
Redds
counted
Total expanded redds in the index
area Touchet River North Fork 14.1 5/2, 5/5, 5/17 115 174 Wolf Fork 13.0 5/1, 5/16 94 139 South Fork 17.2 3/12, 3/20, 3/25, 3/28, 4/03, 4/29,
5/01, 5/15, 5/28 93 144
Robinson Fork 8.2 5/6 40 44 Asotin Creek Main Stem 10.5 3/21, 4/27, 5/21 64 189 North Fork 13.3 3/21, 4/27, 5/20, 5/21, 5/26 43 63 Charley Creek 10.6 4/24, 5/9 18 18 South Fork 12.1 3/21, 4/17, 5/13 31 33 Tucannon River Cummings Creek 10.6 5/3 36 36
We continue to provide standardized spawning ground survey estimates for summer steelhead in the Touchet River and Asotin Creek (Table 18 and 19). The estimated number of spawners (both hatchery and natural) within the indexed area of Asotin Creek (Figure 2) and the Touchet River (Figure 3) is also provided. However, we caution the reader about these estimates due to the

Lyons Ferry Complex Evaluation: July 2015 Summer Steelhead Annual Report – 2012 Run Year 20
assumptions that have to be used regarding sex, females/redd ratios, and percent hatchery fish present that are the key elements to estimate the number of fish on the spawning grounds. In addition, we provide preliminary productivity estimates for Touchet steelhead based on the spawning ground estimates and age composition of returns collected at the Touchet adult trap (Figure 4). Stock recruitment curves (e.g.,Ricker, Beverton-Holt, Hockey Stick) for steelhead populations in the SE Washington are under development and will be presented in future reports. Table 18. Standardized redd estimates and redds/kilometer within index reaches of Asotin Creek in southeast Washington, 1986-2013.
Main stem North Fork South Fork Charley Creek Total Year redds redds/km redds redds/km redds redds/km redds redds/km redds 1986 223 10.8 295 22.2 173 14.3 77 7.3 768 1987 129 6.3 194 14.6 89 7.4 91 8.6 503 1988 56 2.7 141 10.6 87 7.2 48 4.5 332 1989 130 6.3 50 3.8 28 2.3 16 1.5 224 1990 134 6.5 43 3.2 33 2.7 21 2.0 231 1991 147 7.1 58 4.4 28 2.3 20 1.9 253 1992 49 2.4 56 4.2 30 2.5 40 3.8 175 1993 354 17.2 145 10.9 63 5.2 48 4.6 610 1994 70 3.4 50 3.8 18 1.5 15 1.4 153 1995 199 9.7 79 5.9 38 3.1 27 2.6 343 1996 231 11.2 73 5.5 63 5.2 32 3.0 399 1997 140 6.8 69 5.2 13 1.1 19 1.8 241 1998 153 7.4 55 4.1 38 3.1 18 1.7 264 1999 174 8.4 105 7.9 33 2.7 22 2.1 334 2000 120 5.8 71 5.3 46 3.8 24 2.3 261 2001 300 14.6 116 8.7 42 3.5 53 5.0 511 2002 241 11.7 131 9.8 40 3.3 36 3.4 448 2003 285 13.8 103 7.7 36 3.0 40 3.8 464 2004 281 13.6 89 6.7 5 0.4 53 5.0 428 2005 372 18.1 74 5.6 19 1.6 41 3.9 506 2006 254 12.3 62 4.7 32 2.6 32 3.0 380 2007 160 7.8 38 2.9 44 3.6 44 4.2 286 2008 160 7.8 35 2.6 32 2.6 9 0.8 236 2009 146 7.1 56 4.2 28 2.3 22 2.1 252 2010 384 18.6 148 11.1 79 6.5 54 5.1 665 2011 253 12.3 174 13.1 81 6.7 59 5.6 567 2012 274 13.3 134 10.1 65 5.4 51 4.8 524 2013 189 9.2 63 4.8 30 2.7 18 1.7 300

Lyons Ferry Complex Evaluation: July 2015 Summer Steelhead Annual Report – 2012 Run Year 21
Figure 2. Estimated natural and hatchery origin summer steelhead on the spawning grounds within the Asotin Creek Spawning Ground Survey Index Area (Main stem, North Fork, South Fork, and Charley Creek; 1986-2013).
Table 19. Standardized redd estimates and redds/kilometer within index reaches of the Touchet River in southeast Washington, 1987-2013.
North Fork South Fork Wolf Fork Robinson Fork Total Year redds redds/km redds redds/km redds redds/km redds redds/km redds 1987 99 5.2 147 5.5 100 5.7 34 3.8 380 1988 184 9.7 260 9.7 172 9.8 73 8.1 689 1989 65 3.4 71 2.7 42 2.4 20 2.3 198 1990 88 4.6 90 3.4 88 5.0 23 2.5 289 1991 66 3.5 61 2.3 72 4.1 14 1.6 213 1992 152 8.0 180 6.8 95 5.4 41 4.6 468 1993 65 3.4 107 4.0 36 2.1 20 2.2 228 1994 135 7.1 121 4.5 81 4.6 26 2.9 363 1995 98 4.6 116 4.3 83 4.8 17 1.9 314 1996 64 3.4 104 3.9 72 4.1 23 2.6 263 1997 56 2.9 39 1.4 65 3.7 16 1.8 176 1998 118 6.2 112 4.2 84 4.8 30 3.3 344 1999 82 4.3 131 4.9 49 2.8 19 2.1 281 2000 65 3.4 70 2.6 45 2.6 22 2.5 202 2001 55 2.9 84 3.1 57 3.3 17 1.9 213 2002 115 6.0 123 4.6 60 3.4 29 3.2 327 2003 160 8.4 125 4.7 100 5.7 37 4.1 422 2004 68 3.6 48 1.8 44 2.5 16 1.8 176 2005 116 6.1 94 3.5 91 5.2 28 3.1 329 2006 91 4.7 78 2.9 58 3.3 38 4.2 265 2007 160 8.4 133 5.0 97 5.5 32 3.5 422 2008 80 4.2 99 3.7 46 2.6 22 2.4 247 2009 88 4.6 102 3.8 56 3.2 25 2.8 271 2010 195 10.2 235 8.8 84 4.8 25 2.8 539 2011 140 7.4 146 5.5 88 5.0 34 3.8 408 2012 61 3.2 116 4.3 50 2.9 33 3.7 260 2013 174 9.1 144 5.4 139 8.0 44 4.9 501
0
200
400
600
800
1000
1200
1400
1600
1986 1988 1990 1992 1994 1996 1998 2000 2002 2004 2006 2008 2010 2012
Num
ber o
f Fis
h
Spawn Year
Hatchery
Natural

Lyons Ferry Complex Evaluation: July 2015 Summer Steelhead Annual Report – 2012 Run Year 22
Figure 3. Estimated natural and hatchery origin summer steelhead on the spawning grounds within the Touchet River Index Area (1987-2013) (Areas include the North Fork, South Fork, Wolf Fork, and Robinson Fork).
Figure 4. Estimates of recruits:spawner for Touchet River summer steelhead.
0
100
200
300
400
500
600
700
800
900
1987 1989 1991 1993 1995 1997 1999 2001 2003 2005 2007 2009 2011 2013
Num
ber o
f Fis
h
Spawn Year
Touchet Hatchery
Lyons Ferry
Natural
0
0.5
1
1.5
2
2.5
3
3.5
Recr
uit:S
paw
ner R
atio
Brood Year
Replacement Line

Lyons Ferry Complex Evaluation: July 2015 Summer Steelhead Annual Report – 2012 Run Year 23
Tucannon River Natural Summer Steelhead Smolt Production, Adult Survival and Return Estimates 2012/2013 Smolt Outmigration: Snake River Lab evaluation staff operated a 1.5m rotary screw trap at rkm 3.0 on the Tucannon River between fall 2012 and spring 2013 to estimate the number of migrating natural steelhead smolts, other salmonids, and the presence of other resident species. Methods to estimate smolt production are described in Gallinat and Ross (2012). Outmigration estimates were based on the approach of Steinhorst et al. (2004), which involves using a Bailey-modified Lincoln-Peterson estimation with 95% bootstrap confidence intervals by running the Gauss Run-Time computer program (version 7.0). Bootstrap iterations numbered 1,000. The program allows for the division of the out-migration trapping season into strata with similar capture efficiencies as long as at least seven marked recaptures occurred. Strata with less than seven recaptures were grouped with either the preceding or following strata, depending upon similarity in trapping/flow conditions (Gallinat and Ross, 2012). During the 2012/2013 trapping season we captured 3,022 natural steelhead, for an estimated 23,269 migrants (95% CI: 19,421 – 28,612) – Table 20. Age composition based on scale readings was 32.1% age-1, 59.5% age-2, 8.2% age-3, and 0.2% age-4, with age classes by length showing considerable overlap (Figure 5). Mean length, weight, and condition factor (K) for natural fish captured was 174.8 mm, 60.9 g, and 1.03, respectively. Production of age-3 smolts has remained relatively consistent over the years, while age-1 and age-2 have been highly variable (Table 21, Figure 6).

Table 20. Updated Tucannon River summer steelhead smolt emigration estimates, with upper and lower confidence intervals, and proportions of each age class.
Migration year
Population estimate Smolt age Smolt age (%) N Lower Upper age-1 age-2 age-3 age-4 age-1 age-2 age-3 age-4
1997/98 30,060 20,396 46,888 17,224 11,964 872 0 57.3 39.8 2.9 0.0
1998/99 17,990 14,628 22,381 6,674 10,470 846 0 37.1 58.2 4.7 0.0
1999/00 17,758 12,770 25,967 6,109 10,285 1,350 14 34.4 57.9 7.6 0.1
2000/01 22,636 17,384 31,097 10,141 11,696 792 7 44.8 51.7 3.5 0.0
2001/02 7,818 5,573 11,610 3,308 4,338 165 7 42.3 55.5 2.1 0.1
2002/03 16,688 13,615 21,219 8,311 7,610 768 0 49.8 45.6 4.6 0.0
2003/04 13,124 10,708 17,242 2,992 8,990 1,116 26 22.8 68.5 8.5 0.2
2004/05 15,812 11,347 24,786 3,210 9,329 3,257 16 20.3 59.0 20.6 0.1
2005/06 9,092 7,722 10,911 1,491 6,574 1,018 9 16.4 72.3 11.2 0.1
2006/07 11,500 9,683 13,837 1,392 9,620 483 6 12.1 83.7 4.2 0.1
2007/08 26,099 20,189 34,647 6,316 16,990 2,766 26 24.2 65.1 10.6 0.1
2008/09 9,033 7,120 11,638 3,830 4,833 361 9 42.4 53.5 4.0 0.1
2009/10 15,348 13,428 17,891 11,847 3,116 384 2 77.2 20.3 2.5 0.0
2010/11 27,288 23,352 31,880 9,332 17,219 737 0 34.2 63.1 2.7 0.0
2011/12 25,636 19,969 33,760 14,151 10,049 1,384 51 55.2 39.2 5.4 0.2
2012/13 23,269 19,421 28,612 7,469 13,845 1,908 47 32.1 59.5 8.2 0.2
Totals 97/98 to 12/13
289,151 113,797 156,928 18,207 220 39.3% 54.3% 6.3% 0.1%
Lyons Ferry C
omplex E
valuation: July 2015
Summ
er Steelhead Annual R
eport – 2012 Run Y
ear 24

Figure 5. Summer steelhead migrants age distribution by fork length, October 2012 to June 2013 out-migration.
0.0%
2.0%
4.0%
6.0%
8.0%
10.0%
12.0%
14.0%
125 130 135 140 145 150 155 160 165 170 175 180 185 190 195 200 205 210 215 220 225 230 235 240 245 250 255 260
Perc
ent
Fork Length
Age 3 Age 2 Age 1
Lyons Ferry C
omplex E
valuation: July 2015
Summ
er Steelhead Annual R
eport – 2012 Run Y
ear 25

Lyons Ferry Complex Evaluation: July 2015 Summer Steelhead Annual Report – 2012 Run Year 26
Table 21. Estimated migrant production, percent composition by age class, and mean length of natural-origin steelhead migrants from the Tucannon River by brood year (1995-2012).
Brood year
Age-1 Age-2 Age-3 Age-4 Total by Number of migrants
%
Number of migrants
%
Number of migrants
%
Number of migrants
%
brood year
1995 5,583 36.20 8,967 58.14 872 5.65 0 0.000 15,422 1996 6,069 32.12 11,964 63.33 846 4.48 14 0.001 18,893 1997 17,224 59.29 10,470 36.04 1,350 4.65 7 0.000 29,051 1998 6,674 37.58 10,285 57.92 792 4.46 7 0.000 17,758 1999 6,109 34.00 11,696 65.09 165 0.92 0 0.000 17,970 2000 10,141 66.40 4,338 28.40 768 5.03 26 0.002 15,273 2001 3,308 27.45 7,610 63.15 1,116 9.26 16 0.001 12,050 2002 8,311 40.41 8,990 43.71 3,257 15.84 9 0.000 20,567 2003 2,992 22.42 9,329 69.91 1,018 7.63 6 0.000 13,345 2004 3,210 31.19 6,574 63.87 483 4.69 26 0.003 10,293 2005 1,491 10.74 9,620 69.28 2,766 19.92 9 0.001 13,886 2006 1,392 7.43 16,990 90.64 361 1.93 2 0.000 18,745 2007 6,316 54.76 4,833 41.91 384 3.33 0 0.000 11,533 2008 3,830 49.52 3,116 40.29 737 9.53 51 0.007 7,734 2009 11,847 38.85 17,219 56.46 1,384 4.54 47 0.002 30,497 2010 9,332 43.83 10,049 47.20 1,908 8.96 --- --- 21,289 2011 14,151 --- 13,845 --- --- --- --- --- --- 2012 7,469 --- --- --- --- --- --- --- ---
Totals ('95-'10) 103,829 37.85 152,050 55.43 18,207 6.64 220 0.001 274,306
Figure 6. Migrant production by age class, 1995-2012 brood years.
02,0004,0006,0008,000
10,00012,00014,00016,00018,00020,000
1995
1996
1997
1998
1999
2000
2001
2002
2003
2004
2005
2006
2007
2008
2009
2010
2011
2012
Num
ber o
f Sm
olts
Brood Year
Age 1 Age 2 Age 3

Lyons Ferry Complex Evaluation: July 2015 Summer Steelhead Annual Report – 2012 Run Year 27
We continue to PIT tag natural origin steelhead migrants from the Tucannon River smolt trap in an attempt to estimate 1) smolt-to-adult survival, 2) estimate adult returns through the use of a series of four PIT tag arrays in the Tucannon River Basin (operations and maintenance funded by Bonneville Power Administration projects 2010-042-00 and 2010-050-00), and 3) to document overshoot or “bypass” of steelhead to areas upstream of the Tucannon River. Average smolt-to-adult survival of natural origin summer steelhead from the Tucannon River (based on PIT tags) is 2.3% back to Bonneville Dam and 1.7% to the LSRCP project area measured at Ice Harbor Dam, and 0.6% to the Tucannon River (Table 22). The discrepancy in survival from Ice Harbor to the Tucannon River will be discussed in the next section (Adult Migratory Behavior).
Table 22. Estimated smolt-to-adult survival rate of naturally produced summer steelhead smolts from the Tucannon River based on adult PIT tag detections at Bonneville Dam, Ice Harbor Dam, and in the Tucannon River 1999-2010 migration years. Data shown is for smolts tagged at 125 mm or greater in length. The Tucannon PIT tag array was not operational until 2005.
Migration year
Number PIT tagged
Number detected at Bonneville
Dam
Survival (%)
Number detected at Ice Harbor
Dam
Survival (%)
Number detected in Tucannon
River
Survival (%)
1999 2000 2002 2003 2004 2005 2006 2007 2008 2009 2010 2011
363 555
1,508 2150 1,983 1,834 1,416 301
1,087 1,193 2,614 2,942
6 20 39 35 31 27 33 8
68 35 81 28
1.7 3.6 2.6 1.6 1.6 1.5 2.3 2.7 6.3 2.9 3.1 1.0
5 15 31 28 17 20 17 5 54 26 64 17
1.4 2.7 2.1 1.3 0.9 1.1 1.2 1.7 5.0 2.2 2.4 0.6
NA NA NA NA 7
10 4 1
20 15 34 8
NA NA NA NA 0.4 0.5 0.3 0.3 1.8 1.3 1.3 0.3
Average 2.3 1.7 0.6
As mentioned above, WDFW has partnered with BPA, in addition to LSRCP, to better determine the escapement of summer steelhead into the Tucannon River. Through the combination of smolt trapping, PIT tagging, and installation of four PIT tag arrays in the Tucannon River, estimates of adult escapement are more readily derived, compared to previous attempts using index spawning ground surveys. Estimates of natural, hatchery endemic and LFH stock origin (Tucannon River releases only), and other hatchery and natural origin returns to the Tucannon River are presented for the last six run years (Table 23). Estimates of the number of spawners (those remaining after harvest has occurred) have also been calculated. Estimates provided in Table 23 represent actual fish detected by the arrays, which have not been adjusted for array efficiency at this time, so the actual number in all groups will be higher. Preliminary efficiency estimates at the Lower Tucannon Array for summer steelhead from 2005 to 2012 are 82%, 79%,

Lyons Ferry Complex Evaluation: July 2015 Summer Steelhead Annual Report – 2012 Run Year 28
88%, 90%, 97%, 86%, 90%, and 92%, respectively. Estimates of escapement for all steelhead will be adjusted for array efficiency in the next annual report. For Tucannon natural origin steelhead, we used the point estimate from the smolt trap estimates (Table 7) to expand detected PIT tags for the total return to the river.
Table 23. Estimated summer steelhead returns for the 2007-2012 run years (RY) into the Tucannon River based on PIT tag detections. Spawning escapement assumes no pre-spawn mortality due to incidental hooking in the fishery, or other factors. PIT array efficiencies have not been taken into account.
Stock
RY 2007
RY 2008
RY 2009
RY 2010
RY 2011
RY 2012
Average return
Tucannon River Natural Stock 79 73 375 224 127 159 173 Other Natural Stocks A 36 48 162 145 147 30 95 Tucannon River Hatchery Endemic Stock 230 416 748 216 306 295 369 Touchet River Hatchery Endemic Stock 23 35 73 12 42 39 37 LFH Stock (Tucannon River release) 1,119 1,061 1,015 602 929 210 823 Other LFH Hatchery Stocks (Dayton AP, Walla Walla River, LFH On-station Releases) 525 390 910 124 703 307 493
Other Hatchery Stock (Upper Snake Releases) 200 200 150 352 100 0 167 Total Return to Tucannon River 2,212 2,223 3,433 1,675 2,354 1,040 2,156 Total Natural Origin (all stocks) 115 121 537 369 274 189 268 Total Unclipped Hatchery Origin 253 451 821 228 348 334 406 Total Clipped Hatchery Origin 1,844 1,651 2,075 1,078 1,732 517 1,483 Total Harvest (Catch Record Cards) Should Represent only Clipped Fish 751 1,228 1,260 1,265 1,650 1,050 1,200
Spawning Escapement Total Natural Origin (all stocks) 115 121 537 369 274 189 268 Total Unclipped Hatchery Origin 253 451 821 228 348 334 406 Total Clipped Hatchery Origin 1,093 423 815 -187 82 -533 282 % Hatchery Origin on Spawning Grounds B 92.1% 87.8% 75.3% 38.2% 61.1% 63.9% 64.0% A Other natural stocks detected are from the Walla Walla River, Umatilla, Deschutes River, John Day River, etc… B Calculations are based on the number of hatchery fish to the total. In the cases where the number of clipped hatchery fish are less than zero, only the number of unclipped hatchery fish are used.
The average natural origin return (Tucannon River stock) for the last six run years was 173 fish. This estimate is 112 fish below the critical minimum abundance threshold (MAT) of natural-origin adults (285 spawners) described in WDFW’s Fishery Management Evaluation Plan (FMEP). However, other small tributaries along the Snake River, but proximal to the Tucannon River, are also considered part of the Tucannon population at this time (Trump et al. 2013). If their abundance were added to the Tucannon River estimates, the population would be near or above the MAT.

Lyons Ferry Complex Evaluation: July 2015 Summer Steelhead Annual Report – 2012 Run Year 29
Adult Migratory Patterns Based on PIT tags PIT tag detectors in the adult ladders of the Columbia and Snake River dams have been in place for a number of years. In-stream tributary detectors (PIT tag arrays) are becoming more common and have provided more information on escapement and distribution of returning adult summer steelhead into the tributaries. WDFW continues to monitor the general distribution of adult hatchery and natural origin summer steelhead from the Tucannon River, which as shown in previous reports, migrate past the Tucannon River and may remain upstream of Lower Granite Dam (Table 24). As of 2014, PIT detectors have now been installed in the ladders of Lower Monumental and Little Goose dams which should provide additional data on steelhead movements within the Snake River, and may provide more answers as to why the Tucannon River steelhead are overshooting the Tucannon River. Similar to the groups of steelhead from the Tucannon River, we see natural and hatchery origin summer steelhead within the Walla Walla River Basin overshoot, and may remain above Ice Harbor Dam in the Snake River (Table 25). Other Columbia Basin researchers have documented the same overshoot issue with steelhead from the John Day and Umatilla rivers. Many of the overshoot steelhead from the middle Columbia River populations end up in the Snake River as well, with some straying (and we presume spawning based on their entry timing in early spring) in the Tucannon River. The WDFW will continue to monitor this overshoot behavior and assess potential impacts to other steelhead populations. Two other LFC hatchery steelhead releases (LFH stock in the Snake River at LFH, and Cottonwood AP in the Grande Ronde) have also been PIT tagged in more recent years. Releases of steelhead from LFH show a similar, but slightly lower, rate of overshoot as fish from the Tucannon River. Summer steelhead released from Cottonwood AP show a high rate of conversion from Ice Harbor to Lower Granite Dam as expected, since they are destined for the Grande Ronde River (Table 26). Steehead from Cottonwood may exhibit this overshoot behavior once they get above Lower Granite Dam, but the lack of PIT tag arrays in many of the larger river basins upstream of Lower Granite Dam (Clearwater, Salmon, Grande Ronde) do not allow a similar analysis at this time.

Table 24. Detections of PIT tagged Tucannon endemic stock, Tucannon natural stock, and LFH stock summer steelhead released into the Tucannon River that passed Bonneville Dam (Bonn), Ice Harbor Dam (IHR) and Lower Granite Dam (LGR), and the percent of those that did or didn’t make it back to the Tucannon River.
Run year
Number detected at
Bonn
Number detected at
IHR
Number detected at
LGR
Number that initially entered
Tucannon River
Unknown location
Number that returned to
Tucannon from LGR
Fallback rate (%) to Tucannon River
from LGR
Total detected in Tucannon
River a
Fish that passed Bonn Fish that passed IHR
Into Tucannon River (%)
Into Tucannon River (%)
Remain above LGR
(%) Between IHR and LGR (%)
Tucannon Hatchery Endemic Stock 2005 46 32 24 5 3 4 16.7 9 19.6 28.1% 62.5% 9.4% 2006 79 58 35 19 5 6 17.1 25 31.6 43.1% 48.3% 8.6% 2007 123 74 51 17 6 15 29.4 32 26.0 43.2% 48.6% 8.1% 2008a 172 118 79 16 16 16 20.3 32 18.6 27.1% 59.3% 13.6% 2009 453 333 215 94 25 49 22.8 143 31.6 42.9% 49.5% 7.5% 2010 144 115 72 29 16 14 19.4 43 29.9 37.4% 48.7% 13.9% 2011 48 39 30 20 1 7 23.3 27 56.3 69.2% 28.2% 2.6% 2012 70 52 38 26 3 9 23.7 35 50.0 67.3% 26.9% 5.8%
Totals 1,135 821 544 236 86 110 20.2 346 30.5 42.1% 48.7% 9.1%
Tucannon Natural Stock 2005 38 24 13 5 6 3 23.1 8 21.1 33.3% 41.7% 25.0% 2006 24 16 13 3 0 1 7.7 4 16.7 25.0% 75.0% 0.0% 2007 39 24 12 8 3 2 16.7 10 25.6 41.7% 45.8% 12.5% 2008a 17 11 5 5 1 0 0.0 5 29.4 45.5% 45.5% 9.1% 2009 49 39 26 10 4 5 19.2 15 30.6 38.5% 51.3% 10.3% 2010 45 35 18 11 6 3 16.7 14 31.1 40.0% 42.9% 17.1% 2011 52 39 24 12 7 7 29.2 19 36.5 48.7% 33.3% 17.9% 2012 54 43 26 17 1 8 30.8 25 46.3 58.1% 39.5% 2.3%
Totals 318 231 137 71 28 29 21.2 100 31.4 43.3% 44.6% 12.1%
Lyons Ferry Stock Released into the Tucannon River 2007 427 295 203 50 45 41 20.2 91 21.3 30.8% 53.9% 15.3% 2008a 250 192 98 68 32 19 19.4 77 30.8 40.1% 43.2% 16.7% 2009 179 132 90 17 26 20 22.2 37 20.7 28.0% 52.3% 19.7% 2010 124 96 69 7 26 13 18.8 20 16.1 20.8% 52.1% 27.1% 2011 121 101 48 19 40 12 25.0 31 25.6 30.7% 29.7% 39.6% 2012 19 16 9 4 4 3 33.3 7 36.8 43.8% 31.3% 25.0%
Totals 1,120 832 517 165 173 108 20.9 264 23.6 31.7% 47.5% 20.8% a The Tucannon River PIT tag array was taken out by high stream flow in January, 2009 (2008 Run Year). Estimates of fish back to Tucannon were adjusted upwards based on average spring time entries (65% for natural and endemic stock, and 30% for LFH stock).
Lyons Ferry C
omplex E
valuation: July 2015
Summ
er Steelhead Annual R
eport – 2012 Run Y
ear 30

Table 25. Detections of PIT tagged Touchet River endemic stock, Touchet River natural stock, and LFH stock summer steelhead (Walla Walla and Dayton AP release groups) that crossed Bonnville Dam (Bonn) McNary Dam (MCN), Ice Harbor Dam (IHR), and Lower Granite Dam (LGR), and the percent of those that did or didn’t make it back to the Walla Walla River basin.
Run Year
Number detected at Bonn
Number detected at MCN
Number detected in
Walla Walla Basin
Number that stayed
above IHR
Number that
stayed above LGR
Number that stayed in Tucannon
River a
Fish that passed Bonn Fish that passed MCN b
Into Walla Walla
River (%) Into Walla Walla (%)
Above IHR (%)
Above LGR (%)
Into Tucannon River (%)
Touchet Hatchery Endemic Stock 2005 33 29 1 11 0 8 3.0% 3.4 37.9 0.0 27.6 2006 32 26 10 12 1 7 31.3% 38.5 46.2 3.8 26.9 2007 25 17 5 9 1 4 20.0% 29.4 52.9 5.9 23.5 2008 76 59 20 24 6 1 26.3% 32.8 41.4 10.3 1.7 2009 96 73 27 34 8 12 28.1% 37.0 41.1 9.6 16.4 2010 52 47 12 24 8 2 23.1% 25.5 53.2 14.9 4.3 2011 60 49 27 13 0 8 45.0% 55.1 26.5 0.0 16.3 2012 52 40 32 6 1 3 61.5% 72.7 13.6 2.3 6.8
Totals 426 340 134 133 25 45 31.5% 39.4 39.1 7.4 13.2
Touchet Natural Stock 2009 13 10 6 2 2 0 46.2% 60.0 20.0 20.0 0.0 2010 27 19 3 7 2 0 11.1% 15.8 36.8 10.5 0.0 2011 21 13 6 5 0 1 28.6% 46.2 38.5 0.0 7.7 2012 27 20 18 1 0 1 66.7% 90.0 5.0 0.0 5.0
Totals 88 62 33 15 4 2 37.5% 53.2 24.2 6.5 3.2
Lyons Ferry Stock Released at Dayton Acclimation Pond 2008 121 95 11 73 24 10 9.1% 11.6 78.6 25.3 10.5 2009 200 149 19 123 44 22 9.5% 12.8 82.6 29.5 14.8 2010 97 80 16 48 12 2 16.5% 20.0 60.0 15.0 2.5 2011 103 79 10 64 16 12 9.7% 12.7 81.0 20.3 15.2 2012 39 31 4 20 6 4 10.3% 12.9 64.5 19.4 12.9
Totals 560 434 60 328 102 50 10.7% 13.8 75.6 23.5 11.5
Lyons Ferry Stock Released into the Walla Walla River 2008 90 76 1 65 25 2 1.1% 1.3 85.5 32.9 2.6 2009 107 81 11 61 11 11 10.3% 13.6 75.3 13.6 13.6 2010 78 64 14 47 16 3 17.9% 21.9 73.4 25.0 4.7 2011 105 87 7 70 12 6 6.7% 8.0 80.5 13.8 6.9 2012 31 29 6 21 5 6 19.4% 20.7 72.4 17.2 20.7
Totals 411 337 39 264 69 28 9.5% 11.6 78.3 20.5 8.3 a The Tucannon River PIT tag array was taken out by high stream flow in January, 2009. Two salt returns from the 2006 migration year, and 1-salt returns from the 2007 migration year, that entered the
Tucannon River after the array was destroyed could not be added to the table. b Not all fish that crossed McNary Dam are shown in the table, a few were also detected at Priest Rapids Dam, Rock Island Dam, Rocky Reach Dam, and Wells Dam in the upper Columbia River.
Lyons Ferry C
omplex E
valuation: July 2015
Summ
er Steelhead Annual R
eport – 2012 Run Y
ear 31

Table 26. Detections of PIT tagged Lyons Ferry stock (released at Lyons Ferry) or Wallowa stock (released in the Grande Ronde at Cottonwood Acclimation Pond) that passed Bonneville Dam (Bonn), Ice Harbor Dam (IHR) and Lower Granite Dam (LGR), and the percent of those that were observed in the Tucannon River, remained between IHR and LGR, or remained above LGR.
Run year
Number detected at Bonn
Number detected at IHR
Number detected at LGR
Total detected in Tucannon River a
Fish that passed IHR
Into Tucannon River (%)
Remain above LGR (%) Between IHR and LGR (%)
Lyons Ferry Stock Released at Lyons Ferry Hatchery 2009 76 57 25 5 8.8 31.6 59.6 2010 52 41 20 1 2.4 34.1 63.5 2011 60 48 18 5 10.4 22.9 66.7 2012 42 34 16 4 11.8 35.3 52.9
Totals 230 180 79 15 8.3 30.6 61.1
Wallowa Stock Released at Cottonwood AP 2009 242 174 168 2 1.1 96.6 2.3 2010 117 85 82 0 0.0 96.5 3.5 2011 175 137 129 0 0.0 94.2 5.8 2012 98 63 58 1 1.6 92.1 6.3
Totals 632 459 437 3 0.7 95.2 4.1
Lyons Ferry C
omplex E
valuation: July 2015
Summ
er Steelhead Annual R
eport – 2012 Run Y
ear 32
Lyons Ferry Complex Evaluation: July 2015 Summer Steelhead Annual Report – 2012 Run Year 33
Smolt-to-Adult Survival Rates Over nearly all years, coded-wire tag recoveries from fisheries, hatcheries, or from in river traps have provided the basic data to estimate smolt-to-adult return rates on LFH and Wallowa stock summer steelhead from the program. These estimates are considered a minimum because there is no available adjustment to account for fish that escape to the spawning grounds. Under the original program design, the size of the steelhead programs were based on an assumed smolt-to-adult survival rate of 0.5% to the LSRCP project area, and an assumed 2:1 lower river to upper river (project area) harvest ratio. In 2012, WDFW and the other LSRCP cooperators conducted a hatchery summer steelhead program review. To prepare for the review, WDFW re-compiled all past CWT recoveries and updated all smolt-to-adult survival estimates previously reported. The following CWT recovery data (Table 27) demonstrate the success of both the LFH and Wallowa stock summer steelhead programs, as compared to the original survival rate and adult return goals. With initiation of the endemic stock programs on the Touchet and Tucannon Rivers, reductions were made in the LFH stock releases beginning with the 2001 release (in agreement with the co-managers). Further analysis of the CWT data prompted additional reductions that began for the 2003 brood year. Depending on the group, smolt-to-adult return rates since the 2000 brood have been slightly higher, the same, or lower than the long-term average, but are still well above the original assumed LSRCP rate of 0.5%. In addition to the CWT data, WDFW began PIT tagging standard mitigation production groups (LFH and Wallowa stocks) for estimating total adult returns back to the project area. This was done because we know that some proportion of the fish that return as adults escape the fisheries and return to the spawning grounds. Generally, estimates based on PIT tags have been higher than those estimated by CWTs (Table 27). Smolt-to-adult survivals (based on PIT tags) to Bonneville Dam for the LFH stock (Tucannon and Touchet river releases) and Tucannon and Touchet river endemic stocks are provided below (Figures 8 and 9). For the 2006-2011 migration years (excluding 2009 as there was no production for the Tucannon endemic stock in that year, and the last release of the LFH stock into the Tucannon was in 2010), Tucannon endemic stock survivals were on average 54% of the LFH stock. In the Touchet River (2007-2011 migration years), the endemic stock survivals were 24% of the LFH stock. While both endemic stocks have not performed to the same level as the LFH stock, these comparisons have been useful in allowing managers to compare the programs and make decisions about expanding them for mitigation purposes. As such, in 2010, WDFW and the co-managers decided to implement Tucannon stock, and eliminate the use of LFH stock

Lyons Ferry Complex Evaluation: July 2015 Summer Steelhead Annual Report – 2012 Run Year 34
steelhead in the Tucannon River. Due to the poor survivals to data, the Touchet hatchery endemic stock program has not been implemented at this time. Table 27. Smolt-to-adult return (SAR) survival of LFH stock (LFH, Tucannon, Touchet, and Walla Walla release groups) or Wallowa stock (Grande Ronde release group) summer steelhead back to the lower Snake River project area.
Brood Year LFH a
CWT PIT Tucannon
CWT PIT Dayton AP
CWT PIT Walla Walla a CWT PIT
Grande Ronde a CWT PIT
1982 1.20 1.48 1.72 1.57 0.83 1983 1.11 1.23 1.33 1.16 1.27 1984 2.13 0.65 2.94 2.73 1.93 1985 1.56 0.62 1.79 1.66 1.58 1986 2.53 0.96 3.04 2.82 1.50 1987 2.04 0.98 1.64 1.39 2.13 1988 1.06 0.75 1.41 1.19 1.10 1989 1.26 1.55 0.97 0.54 1.31 1990 1.59 1.05 2.22 1.88 1.82 1991 0.43 0.35 0.96 0.81 0.49 1992 1.06 1.38 2.29 1.53 1.21 1993 1.71 0.80 3.15 2.66 1.69 1994 3.62 2.04 4.85 3.37 3.77 1995 1.19 0.60 1.50 1.26 1.24 1996 0.53 0.53 0.91 0.77 0.44 1997 1.47 2.07 2.52 2.13 1.00 1998 1.39 1.70 1.47 1.36 2.03 1999 3.72 3.17 4.00 3.37 4.01 2000 1.38 1.32 1.00 1.35 2.21 2001 1.53 1.90 1.73 1.56 1.82 2002 1.91 1.81 1.73 2.18 1.73 2003 1.31 1.21 1.55 1.30 2.19 2004 1.67 1.50 1.43 1.10 1.14 2005 2.33 2.57 3.40 2.17 1.85 3.31 2006 2.11 2.49 3.46 1.70 1.96 1.58 1.50 2.96 2007 2.25 4.53 2.52 3.46 3.14 3.74 1.71 1.86 5.22 5.23 2008 1.35 2.20 1.47 2.63 1.56 1.37 1.25 1.51 1.54 1.50 2009 2.27 2.60 2.81 2.86 2.29 1.97 2.22 2.20 2.96 2.25 Mean
(All CWT Years) 1.70% 1.48% 2.04% 1.73% 1.94% Mean
(CWT, PIT Years) 1.96% 3.11% 2.37% 3.16% 2.17% 2.26% 1.69% 1.77% 3.24% 2.99% a The LFH group includes releases of fish in other locations of the Snake River and Asotin Creek, the Walla Walla
group includes releases of fish in Mill Creek, and the Grande Ronde include releases of fish from Wildcat Creek in Oregon.
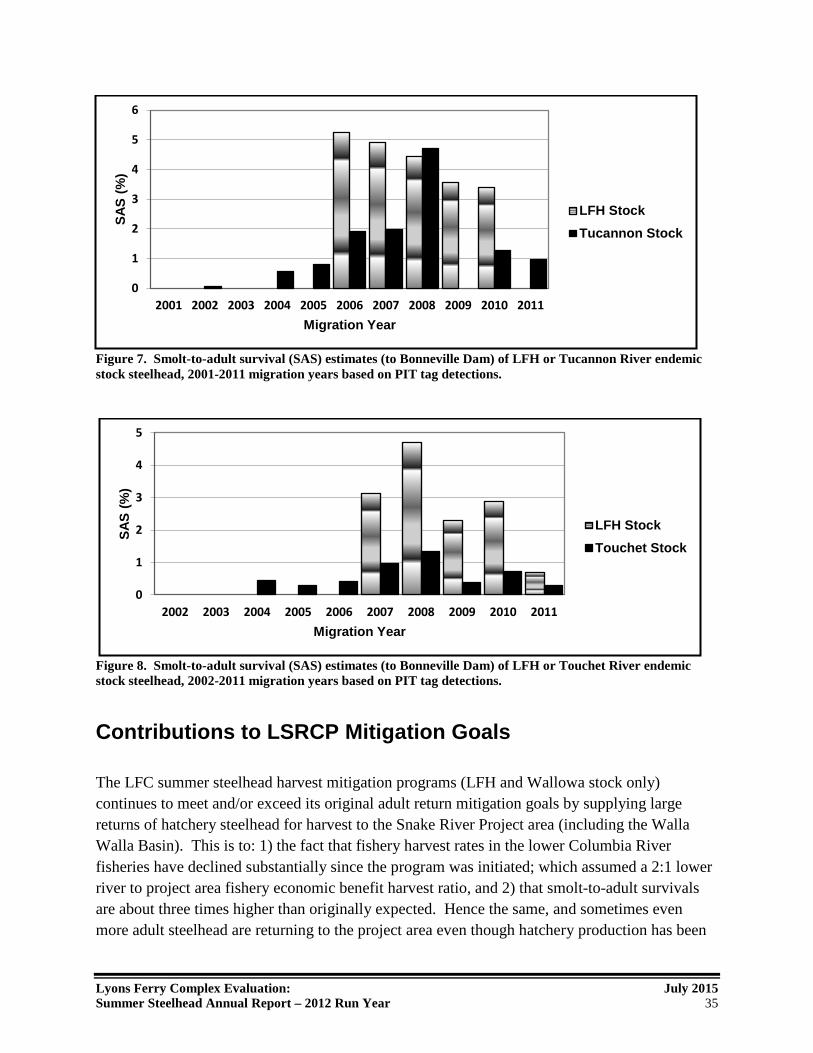
Lyons Ferry Complex Evaluation: July 2015 Summer Steelhead Annual Report – 2012 Run Year 35
Figure 7. Smolt-to-adult survival (SAS) estimates (to Bonneville Dam) of LFH or Tucannon River endemic stock steelhead, 2001-2011 migration years based on PIT tag detections.
Figure 8. Smolt-to-adult survival (SAS) estimates (to Bonneville Dam) of LFH or Touchet River endemic stock steelhead, 2002-2011 migration years based on PIT tag detections.
Contributions to LSRCP Mitigation Goals
The LFC summer steelhead harvest mitigation programs (LFH and Wallowa stock only) continues to meet and/or exceed its original adult return mitigation goals by supplying large returns of hatchery steelhead for harvest to the Snake River Project area (including the Walla Walla Basin). This is to: 1) the fact that fishery harvest rates in the lower Columbia River fisheries have declined substantially since the program was initiated; which assumed a 2:1 lower river to project area fishery economic benefit harvest ratio, and 2) that smolt-to-adult survivals are about three times higher than originally expected. Hence the same, and sometimes even more adult steelhead are returning to the project area even though hatchery production has been
0
1
2
3
4
5
6
2001 2002 2003 2004 2005 2006 2007 2008 2009 2010 2011
SAS
(%)
Migration Year
LFH StockTucannon Stock
0
1
2
3
4
5
2002 2003 2004 2005 2006 2007 2008 2009 2010 2011
SAS
(%)
Migration Year
LFH StockTouchet Stock
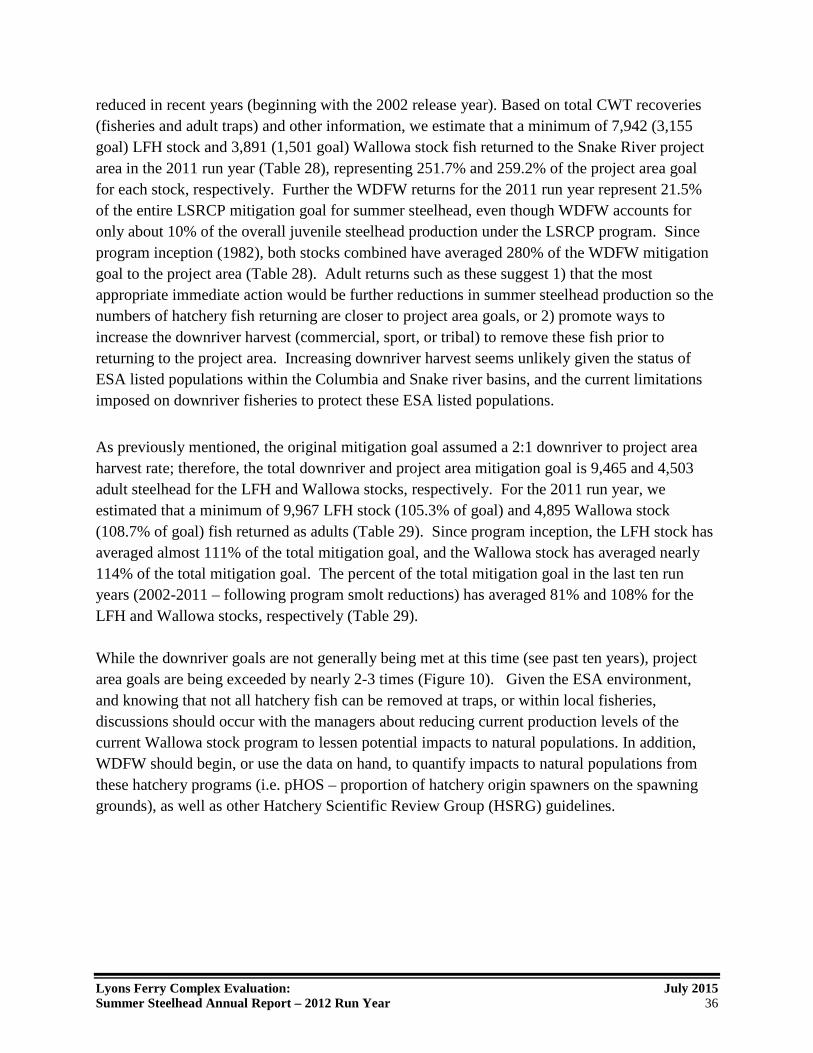
Lyons Ferry Complex Evaluation: July 2015 Summer Steelhead Annual Report – 2012 Run Year 36
reduced in recent years (beginning with the 2002 release year). Based on total CWT recoveries (fisheries and adult traps) and other information, we estimate that a minimum of 7,942 (3,155 goal) LFH stock and 3,891 (1,501 goal) Wallowa stock fish returned to the Snake River project area in the 2011 run year (Table 28), representing 251.7% and 259.2% of the project area goal for each stock, respectively. Further the WDFW returns for the 2011 run year represent 21.5% of the entire LSRCP mitigation goal for summer steelhead, even though WDFW accounts for only about 10% of the overall juvenile steelhead production under the LSRCP program. Since program inception (1982), both stocks combined have averaged 280% of the WDFW mitigation goal to the project area (Table 28). Adult returns such as these suggest 1) that the most appropriate immediate action would be further reductions in summer steelhead production so the numbers of hatchery fish returning are closer to project area goals, or 2) promote ways to increase the downriver harvest (commercial, sport, or tribal) to remove these fish prior to returning to the project area. Increasing downriver harvest seems unlikely given the status of ESA listed populations within the Columbia and Snake river basins, and the current limitations imposed on downriver fisheries to protect these ESA listed populations.
As previously mentioned, the original mitigation goal assumed a 2:1 downriver to project area harvest rate; therefore, the total downriver and project area mitigation goal is 9,465 and 4,503 adult steelhead for the LFH and Wallowa stocks, respectively. For the 2011 run year, we estimated that a minimum of 9,967 LFH stock (105.3% of goal) and 4,895 Wallowa stock (108.7% of goal) fish returned as adults (Table 29). Since program inception, the LFH stock has averaged almost 111% of the total mitigation goal, and the Wallowa stock has averaged nearly 114% of the total mitigation goal. The percent of the total mitigation goal in the last ten run years (2002-2011 – following program smolt reductions) has averaged 81% and 108% for the LFH and Wallowa stocks, respectively (Table 29). While the downriver goals are not generally being met at this time (see past ten years), project area goals are being exceeded by nearly 2-3 times (Figure 10). Given the ESA environment, and knowing that not all hatchery fish can be removed at traps, or within local fisheries, discussions should occur with the managers about reducing current production levels of the current Wallowa stock program to lessen potential impacts to natural populations. In addition, WDFW should begin, or use the data on hand, to quantify impacts to natural populations from these hatchery programs (i.e. pHOS – proportion of hatchery origin spawners on the spawning grounds), as well as other Hatchery Scientific Review Group (HSRG) guidelines.

Lyons Ferry Complex Evaluation: July 2015 Summer Steelhead Annual Report – 2012 Run Year 37
Table 28. Contribution of LFH stock (LFH, Tucannon, Touchet, and Walla Walla release groups) or Wallowa stock (Grande Ronde release group) summer steelhead back to the lower Snake River project area.
Run year LFH a Tucannon Touchet Walla Walla a Grande Ronde a Total Percent of goal (Goal) (630) (875) (750) (900) (1,501) (4,656)
1984 1,013 1,233 736 1,054 424 4,460 95.8% 1985 1,553 1,836 1,439 1,671 3,261 9,760 209.6% 1986 3,771 1,495 4,076 3,838 6,161 19,341 415.4% 1987 2,786 770 2,303 2,149 2,645 10,653 228.8% 1988 5,047 1,571 3,754 3,729 2,781 16,882 362.6% 1989 4,378 2,353 4,070 4,345 6,011 21,157 454.4% 1990 1,494 1,234 2,013 1,789 3,363 9,893 212.5% 1991 2,038 1,506 2,346 1,155 2,476 9,521 204.5% 1992 2,107 2,160 2,511 3,038 5,304 15,120 324.7% 1993 548 1,217 2,055 2,123 2,835 8,778 188.5% 1994 2,199 978 1,517 913 3,414 9,021 193.8% 1995 4,468 1,594 4,752 4,923 4,844 20,581 442.0% 1996 3,003 2,112 4,287 5,188 9,222 23,812 511.4% 1997 2,201 1,834 3,737 3,270 4,938 15,980 343.2% 1998 701 744 1,379 1,560 1,844 6,228 133.8% 1999 1,099 2,531 2,524 2,983 1,591 10,728 230.4% 2000 1,210 2,822 1,994 2,529 4,681 13,236 284.3% 2001 2,418 5,240 4,949 5,825 11,450 29,882 641.8% 2002 778 1,894 1,620 1,937 5,659 11,888 255.3% 2003 937 1,740 1,709 1,261 3,443 9,090 195.2% 2004 1,229 2,839 2,011 2,418 3,279 11,776 252.9% 2005 838 1,067 1,073 909 4,509 8,396 180.3% 2006 1,167 1,282 1,734 1,380 1,578 7,141 153.4% 2007 1,330 2,693 1,776 1,764 4,504 12,067 259.2% 2008 1,250 2,374 1,268 1,542 5,185 11,619 249.5% 2009 1,378 2,592 2,553 1,684 9,335 17,550 376.9% 2010 858 1,652 1,630 1,469 1935 8,125 174.5% 2011 1,573 2,624 1,693 2,052 3,891 11,833 254.2%
Average 1,906 1,928 2,411 2,446 4,306 13,019 279.6%
% of Goal (all years) 302.6% 220.4% 321.5% 271.8% 286.9% 279.6%
% of Goal last 10 years 180.0% 237.2% 227.6% 182.4% 288.6% 235.1%
a The LFH group includes releases of fish in other locations of the Snake River and Asotin Creek, the Walla Walla group includes releases of fish in Mill Creek, and the Grande Ronde include releases of fish from Wildcat Creek in Oregon.

Lyons Ferry Complex Evaluation: July 2015 Summer Steelhead Annual Report – 2012 Run Year 38
Table 29. Contribution of LFH stock (LFH, Tucannon, Touchet, Walla Walla release groups) or Wallowa stock (Grande Ronde release group) summer steelhead back to the Columbia River.
Run rear LFH a Tucannon Touchet Walla Walla a Grande Ronde a Total Percent of goal (Goal) (1,890) (2,625) (2,250) (2,700) (4,503) (13,968)
1984 1,547 1,447 882 919 741 5,536 39.6% 1985 2,247 2,272 1,853 1,852 4,310 12,534 89.7% 1986 4,955 2,009 5,363 5,042 8,076 25,445 182.2% 1987 4,309 1,076 3,420 3,213 4,286 16,304 116.7% 1988 7,462 2,025 5,296 5,321 4,991 25,095 179.7% 1989 5,648 2,858 5,313 5,873 8,105 27,797 199.0% 1990 1,830 1,466 2,676 2,430 4,152 12,554 89.9% 1991 2,603 1,820 2,900 1,532 3,067 11,922 85.4% 1992 3,223 2,908 3,748 4,159 6,564 20,602 147.5% 1993 692 1,460 2,560 2,834 3,444 10,990 78.7% 1994 2,959 1,324 1,968 1,306 4,435 11,992 85.9% 1995 5,676 2,127 5,876 6,615 5,966 26,260 188.0% 1996 3,206 2,486 4,539 5,662 10,055 25,948 185.8% 1997 2,543 2,177 4,121 4,031 5,550 18,422 131.9% 1998 756 780 1,442 1,682 2,040 6,700 48.0% 1999 1,141 2,735 2,622 3,165 1,704 11,367 81.4% 2000 1,304 3,281 2,134 2,754 5,433 14,906 106.7% 2001 2,663 5,899 5,501 6,597 12,797 33,457 239.5% 2002 935 2,457 1,882 2,079 5,986 13,339 95.5% 2003 1,002 2,101 1,776 1,400 3,631 9,910 70.9% 2004 1,557 2,973 2,221 2,531 3,423 12,705 91.0% 2005 1,020 1,356 1,535 1,350 5,085 10,346 74.1% 2006 1,326 1,391 1,857 1,480 1,731 7,785 55.7% 2007 1,459 2,892 2,212 2,321 5,337 14,221 101.8% 2008 1,531 2,691 1,565 1,797 5,809 13,393 95.9% 2009 1,597 3,011 2,891 1,819 10,208 19,526 139.8% 2010 1,097 1,961 1,899 2,007 2,474 9,438 67.6% 2011 2,121 3,065 2,381 2,400 4,895 14,682 106.4%
Average 2,443 2,287 2,944 2,794 5,153 15,622 111.8% % of
Goal (all years)
129.3% 87.1% 130.9% 103.5% 114.4% 111.8%
% of Goal last 10 years
72.2% 91.0% 89.9% 71.1% 107.9% 89.9%
a The LFH group includes releases of fish in other locations of the Snake River and Asotin Creek, the Walla Walla group includes releases of fish in Mill Creek, and the Grande Ronde include releases of fish from Wildcat Creek in Oregon.

Lyons Ferry Complex Evaluation: July 2015 Summer Steelhead Annual Report – 2012 Run Year 39
Figure 9. Adult hatchery summer steelhead returns (LFH and Wallowa stock combined) in relation to the project area or total program goals.
0
5,000
10,000
15,000
20,000
25,000
30,000
35,000
1984
1985
1986
1987
1988
1989
1990
1991
1992
1993
1994
1995
1996
1997
1998
1999
2000
2001
2002
2003
2004
2005
2006
2007
2008
2009
2010
2011
Num
ber o
f Fis
h
Run Year
Project Area Return Project Area Goal
Total Return Total Return Goal

Lyons Ferry Complex Evaluation: July 2015 Summer Steelhead Annual Report – 2012 Run Year 40
Conclusions and Recommendations In an effort to maintain successful mitigation in an ESA environment, we offer the following conclusions/recommendations from our monitoring and evaluation work, and suggest additional critical questions that should be pursued in the future: 1) In December of 2012, WDFW, with agreement from the co-managers and NOAA Fisheries,
terminated the LFH stock steelhead program. Steelhead production of LFH stock was switched over to the Wallowa stock program, with no decrease in production overall. The overall basis for this decision were from conversations about making efficient use of rearing space at LSRCP facilities, and looking for additional rearing space for spring Chinook for harvest mitigation under the LSRCP. The Wallowa stock was chosen for the preferred stock based on 1) origin history (Wallowa = Snake Basin composite stock versus LFH = was primarily an out-of-basin upper Columbia stock), 2) Wallowa stock are older and larger at adult return compared to the LFH stock, making them more desirable from a harvest standpoint (i.e., anglers like bigger fish), and 3) run timing of Wallowa stock fish back to the Snake River is 2-4 weeks later, providing more opportunity for anglers to catch fish when the fishery first opens. Through consolidation of these two program, WDFW has freed up one of the three large rearing lakes at LFH, which could then be used for spring Chinook, or some other LSRCP production for a more efficient use of rearing space.
Recommendation: Mark/Tag representative (see #3 below) groups of Wallowa stock steelhead for the harvest mitigation program. Continue with individual marking by release location for at least five years (2017) to document difference in returns locations to what was previously seen with the LFH stock steelhead. Following such an evaluation, consider consolidating the coded-wire tagging of this group into a single code for documenting straying and contribution to downriver fisheries, and using PIT tag returns from individual release locations to estimate total return to the project area for program evaluation.
2) The mitigation program for WDFW summer steelhead under the LSRCP is to produce 4,656 adult steelhead to the project area for harvest/broodstock needs. Since program inception, WDFW’s Wallowa stock or LFH stock steelhead programs have produced adults back to the project area (above Ice Harbor and including the Walla Walla Basin (off-site mitigation)) well in excess of the mitigation goal – refer to Table 26. In addition, the total mitigation goal of 13,968 (assuming a 2:1 downriver to upriver harvest allotment) has also been met, though with reductions in program size in 2001, returns over the last ten years have generally been below the total adult production goal of 13,968. Downriver harvest, especially in the Zone 6 net fishery, has decreased significantly since the middle 1990s because of ESA protection required for B-run steelhead destined for Idaho. So while smolt production was reduced in an

Lyons Ferry Complex Evaluation: July 2015 Summer Steelhead Annual Report – 2012 Run Year 41
attempt to decrease the number of adults returning to the project area, there has been little effect due to the reduced harvest in the Zone 6 net fishery.
With consolidation of the Wallowa and LFH stock steelhead into one program and into one rearing vessel at LFH (see #3 below), we have the options to re-consider current smolt production levels to address ESA concerns in the project area (i.e., stray hatchery fish). With the current rearing scheme (Appendix C), Wallowa stock production levels could be lowered and then increased again in the future without impacting other LSRCP programs at LFH. Recommendation: Meet with program managers, co-managers, and other interested parties to discuss recommended changes to WDFW’s harvest mitigation steelhead programs at LFH, without hindering recovery of native steelhead stocks. Recommendation: Current production level of Wallowa stock summer steelhead is 495,000 smolts. Assuming the downriver fisheries do not change appreciably, and based on historical smolt-to-adult survival back to the project area, this program could be reduced to approximately 245,000 smolts annually, and still fulfill adult mitigation needs to the project area. Due to the nature of the program, current releases in four different sub-basins, and ESA concerns for each of those, there are multiple options available to restructure the steelhead program. To initiate those discussions, WDFW evaluation staff recommends the following specific production changes at the current release locations to better align WDFW adult steelhead returns to the project area to better address ESA concerns. This is only one of many options that have been thought of by the evaluation staff.
- Reduce on-station release from 110,000 to 35,000 (-68%) - Reduce the Dayton AP release from 85,000 to 45,000 (-48%) - Reduce the Walla Walla release from 100,000 to 60,000 (-40%) - Reduce the Cottonwood AP release from 200,000 to 105,000 (-48%)
3) Representative marking/tagging has always been an issue with the Wallowa and LFH stock
summer steelhead program at LFH. Rearing of fish in the large rearing lakes do not allow for individual marking programs specific for a single release point. As such, coded-wire tag groups or PIT tag groups, which are supposed to represent the entire release population, are many times separated from the fish in the rearing lake for many months. For numerous reasons not discussed here, WDFW evaluation and hatchery staff derived a rearing scheme which will limit the amount of time that tag groups are separated from the rest of the rearing population (Appendix C).
Holding numerous mark groups for each release location has proven difficult in the past, and can impact other programs at LFH, and may limit future production potential. With the

Lyons Ferry Complex Evaluation: July 2015 Summer Steelhead Annual Report – 2012 Run Year 42
recent shift to using Wallowa stock steelhead for harvest mitigation, there is an immediate need to monitor specific release sites using CWTs for at least the short term. However, the long-term need for individual release information could be derived by other methods, and may provide benefits to other LSRCP programs.
Parental Based Tagging has been occurring since 2009 with LFH, Wallowa, Tucannon, and Touchet stocks as part of a bigger Snake River Basin project. Data (fin clips) from returning adults trapped at Lower Granite or sampled at Snake River fisheries are showing that this technique to assign capture fish back to a rearing facility (and sometimes to a specific release location) is viable.
Recommendation: As soon as possible and/or practical, implement a marking/tagging schedule at LFH for Wallowa stock steelhead so resultant tag groups will represent untagged fish going to the same release location. Recommendation: Continue to tag (both CWT and PIT) individual release groups of Wallowa stock steelhead. Monitor adult recoveries and compare harvest timing and distributions within fisheries compared to historical data (LFH stock). If similar, propose using a single CWT for the entire Wallowa stock group to document contribution to fisheries and straying, but use the PIT tag returns/proportions to estimate adult returns of individual release sites. Recommendation: Continue with the collection of tissue samples from all steelhead broodstock sources and provide to IDFG Genetics Lab per requests. Continue to collect tissue samples from steelhead fisheries in the main stem Snake River and provide samples to IDFG for analysis.
4) PIT tag data continues to show as many as 50% of the returning steelhead destined for the Tucannon River (natural, endemic hatchery, and LFH stock), never return to the river, but overshoot the Tucannon River and remain upstream of Lower Granite Dam, where they may stray into other natural spawning areas such as Asotin Creek, Alpowa Creek, or elsewhere. Similarly, other agencies have noted this overshoot phenomenon with mid-Columbia steelhead populations such as the John Day, Umatilla, and Walla Walla natural origin summer steelhead.
Recommendation: Continue PIT tagging large representative groups of all stocks of steelhead for program evaluation (adult return rates) and straying. Work with BPA to continue, and increase if possible, the number of natural origin smolts PIT tagged at the Tucannon River smolt trap to document SARs, estimating total natural origin returns to the Tucannon River, and continued documentation of the overshoot behavior.

Lyons Ferry Complex Evaluation: July 2015 Summer Steelhead Annual Report – 2012 Run Year 43
Recommendation: Work with the U.S. Army Corps of Engineers and others to conduct a telemetry study to develop a better understanding of behavior of returning Tucannon steelhead near the mouth of the Tucannon River, and potentially determine why there is such a high rate of fish overshooting that river and crossing Lower Granite Dam. It is imperative that this high overshoot rate, and the failure of many of these fish to return downstream, be better understood and rectified for WDFW to be able to achieve either LSRCP mitigation fisheries or ESA/WDFW natural stock conservation goals in the Tucannon River. Recommendation: Coordinate with ODFW, CTUIR, NOAA Fisheries, and any other agencies to compile all relevant PIT tag data from mid-Columbia and Tucannon River summer steelhead populations. Begin compiling a report for submission into a peer-reviewed journal.
5) The Touchet endemic stock program was initiated with the intent to replace the LFH stock production in the Touchet River (WDFW intent only). The Touchet endemic stock has not performed to expectations (low SARs), and would therefore not be able to replace the harvest mitigation program without severely reducing the number of fish for harvest. Rearing of the Touchet stock juveniles at LFH continues to be a challenge. Released smolts have varied in size and release date, and downstream survival and adult return survival has been very low compared to the mitigation stock. WDFW has recommended the discontinuation of this program since 2012, but to date, none of the parties agree with that recommendation. Recommendation: Coordinate with co-managers, LSRCP, and BPA to discuss the possibility of continuing this as a conservation program only (RPA #40 – 2008 NOAA Fisheries FCRPS Biological Opinion). Continue to work with the Umatilla Tribe on alternative rearing strategies and/or broodstock composition (i.e. include more hatchery fish into broodstock) to improve the in-hatchery performance (and potentially the post-hatchery performance). Secure funding other than LSRCP to study examine benefits of such actions and recommend changes to the program based on results.
6) Natural production of Touchet summer steelhead appears to be stable (refer to Figures 6 and 7), and it is unclear at this time that the hatchery fish (LFH stock or Touchet endemic stock) have provided any benefit or harm to the population. Harvest mitigation benefits are limited in the Touchet Basin, as most of the harvest occurs in the Snake River or the lower Walla Walla, with only a very small percentage (14%: range 4-28%) of the fish actually making it back to the Touchet River for harvest.
Recommendation: Begin discussions with co-managers and the public about discontinuing all hatchery steelhead production in the Touchet River Basin. Discuss with co-managers and

Lyons Ferry Complex Evaluation: July 2015 Summer Steelhead Annual Report – 2012 Run Year 44
the public about expanding production of spring Chinook in the Touchet River to replace the steelhead mitigation program for harvest.
7) In the spring of 2010, WDFW, the tribal co-managers, NOAA Fisheries, and LSRCP agreed to discontinue releases of LFH stock steelhead into the Tucannon River and to fully implement the Tucannon River endemic stock program per the FCRPS Bi-Op RPA 40.2. In the short term (1-3 years), the Tucannon River endemic stock program was increased to 75,000 smolts annually. It was agreed at the time that additional hatchery rearing space (circular tanks) would be added to expand the program to the desired level (150,000 smolts annually). To date, additional space has not been added. Further, the managers agreed that an adult management plan and sliding scale would be developed for broodstock management and disposition of hatchery fish at the weir. To date, this has not been completed either.
Recommendation: Continue to work with LSRCP on the addition of circular tanks at LFH for Tucannon River steelhead rearing. Recommendation: Work with co-managers and NOAA Fisheries in the development of an adult management plan and sliding scale for Tucannon summer steelhead.
8) The Tucannon River steelhead population was defined by the Interior Columbia Technical Recovery Team (ICTRT) as including the Tucannon River and other smaller tributaries to the Snake River (between Lower Monumental and Lower Granite dams). The abundance of natural origin adults in these smaller tributaries is relatively unknown, but recent trapping efforts (Trump et al. 2013) have helped expand our knowledge. Further, we have yet to confirm the genetic similarities between these small streams and the Tucannon River. Yet, these smaller tributaries could have enough natural origin adults present (of the appropriate stock) that if added to the Tucannon River natural origin adults, could raise the population level above the critical threshold, and allow for continued fisheries within the Tucannon River under the LSRCP mitigation program.
Recommendation: Continue to support/assist adult monitoring efforts within these small Snake River tributaries and conduct a genetic analysis that compares the adult steelhead sampled in the Tucannon, Asotin, Almota, Alpowa, Penawawa, Deadman, and Alkali Flat creeks against the Tucannon and Asotin population baselines and the LFH stock that has been used for mitigation in the lower Snake Basin.

Lyons Ferry Complex Evaluation: July 2015 Summer Steelhead Annual Report – 2012 Run Year 45
Literature Cited Carmichael, R.W., R. T. Messmer and B.A. Miller. 1988. Summer Steelhead Creel Surveys in the Grande Ronde, Wallowa and Imnaha rivers for the 1987-88 Run Year. Progress Report, 1988. Oregon Department of Fish and Wildlife, Portland, Oregon. Gallinat, M.P., and L.A. Ross. 2012. Tucannon River Spring Chinook Salmon Hatchery Evaluation Program 2011 Annual Report to U.S. Fish and Wildlife Service, Cooperative Agreement 14110-B-J012. Washington Department of Fish and Wildlife, Olympia, Washington. Report # FPA12-02. 94 p. Steinhorst, K., Y. Wu, B. Dennis, and P. Kline. 2004. Confidence intervals for fish outmigration estimates using stratified trap efficiency methods. Journal of Agricultural, Biological, and Environmental Statistics 9 (3): 284-299. Mendel, G., and J. Trump. 2010. Tucannon Lakes Fishery Monitoring Report for 2003. Washington Department of Fish and Wildlife. 48 p. Trump, J., G. Mendel, and M. Gembala. 2013. Estimate Adult Steelhead Abundance in Small Streams Associated with the Tucannon and Asotin Populations: 2010-2012 Annual Report to U.S. Department of Energy, Bonneville Power Administration, Environment, Fish and Wildlife, Portland, OR 97208. Project #2010-028-00 Contract Numbers 49149 and 55446. 53 pages. Schuck, M., A. Viola and S. Nostrant. 1990. Lyons Ferry Evaluation Study: Annual Report 1988-89 . Washington Department of Wildlife Report to the USFWS. Report No. AFF1/LSR-90-04. USACE (U.S. Army Corps of Engineers). 1975. Special Reports: Lower Snake River Fish and Wildlife Compensation Plan. Walla Walla, Washington. .

Lyons Ferry Complex Evaluation: July 2015 Summer Steelhead Annual Report – 2012 Run Year 46
Appendix A
Rainbow Trout Plants from LFC 2013
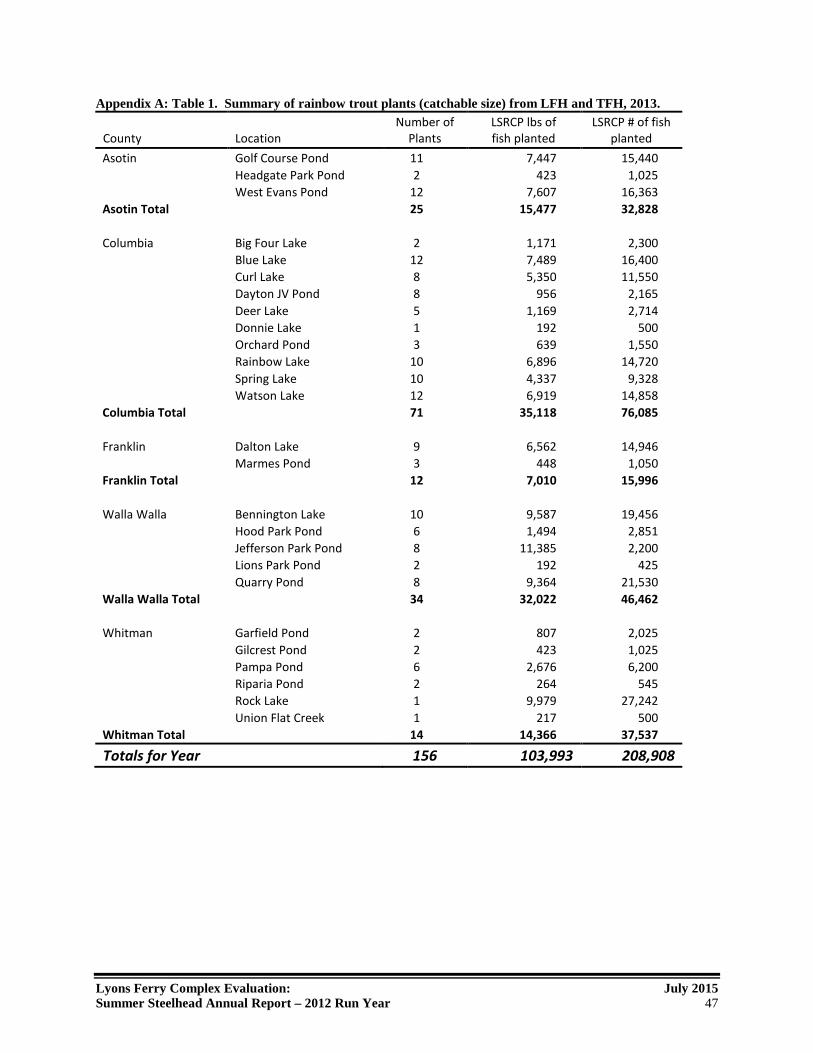
Lyons Ferry Complex Evaluation: July 2015 Summer Steelhead Annual Report – 2012 Run Year 47
Appendix A: Table 1. Summary of rainbow trout plants (catchable size) from LFH and TFH, 2013. County
Location
Number of Plants
LSRCP lbs of fish planted
LSRCP # of fish planted
Asotin Golf Course Pond 11 7,447 15,440 Headgate Park Pond 2 423 1,025 West Evans Pond 12 7,607 16,363 Asotin Total 25 15,477 32,828 Columbia Big Four Lake 2 1,171 2,300 Blue Lake 12 7,489 16,400 Curl Lake 8 5,350 11,550 Dayton JV Pond 8 956 2,165 Deer Lake 5 1,169 2,714 Donnie Lake 1 192 500 Orchard Pond 3 639 1,550 Rainbow Lake 10 6,896 14,720 Spring Lake 10 4,337 9,328 Watson Lake 12 6,919 14,858 Columbia Total 71 35,118 76,085 Franklin Dalton Lake 9 6,562 14,946 Marmes Pond 3 448 1,050 Franklin Total 12 7,010 15,996 Walla Walla Bennington Lake 10 9,587 19,456 Hood Park Pond 6 1,494 2,851 Jefferson Park Pond 8 11,385 2,200 Lions Park Pond 2 192 425 Quarry Pond 8 9,364 21,530 Walla Walla Total 34 32,022 46,462 Whitman Garfield Pond 2 807 2,025 Gilcrest Pond 2 423 1,025 Pampa Pond 6 2,676 6,200 Riparia Pond 2 264 545 Rock Lake 1 9,979 27,242 Union Flat Creek 1 217 500 Whitman Total 14 14,366 37,537
Totals for Year 156 103,993 208,908

Lyons Ferry Complex Evaluation: July 2015 Summer Steelhead Annual Report – 2012 Run Year 48
Appendix B
Bull Trout, Whitefish, and Brown Trout Capture Data from the Touchet River Adult Trap, 2013

Lyons Ferry Complex Evaluation: July 2015 Summer Steelhead Annual Report – 2012 Run Year 49
Appendix B. Table 1. Total number of spring Chinook, bull trout, brown trout, whitefish, northern pikeminnow, and bridgelip sucker (excluding in-season recaptures) captured in the Touchet River Adult Trap (1993-1995 and 1999-2012). Data presented in this table is through the month of September, 2013. Numbers in parenthesis indicate fish removed and not passed upstream.
Year Spring Chinook
Bull trout Brown trout Whitefish Northern
Pikeminnow Bridgelip Sucker Natural Hatchery
1993 0 0 0 0 0 NA NA 1994 0 0 3 3 0 NA NA 1995 0 0 0 0 0 NA NA 1999 0 0 20 4 5 NA NA 2000 2 2 22 8 16 NA NA 2001 24 7 43 14 4 NA NA 2002 0 0 22 0 5 NA NA 2003 2 1 45 19 40 2 (2) 663 2004 4 6 65 17 7 0 238 2005 4 1 49 6 8 1 (1) 171 2006 0 0 53 31 33 0 54 2007 1 3 31 13 18 0 13 2008 1 2 34 11 28 5 (5) 16 2009 15 13 106 10 (10) 32 2 (2) 64 2010 13 3 122 18 (18) 120 0 227 2011 1 0 129 2 (2) 59 0 36 2012 8 1 59 5 (5) 14 0 24 2013 2 2 57 0 15 2 (2) 11

Lyons Ferry Complex Evaluation: July 2015 Summer Steelhead Annual Report – 2012 Run Year 50
Appendix B. Table 2. Bull trout captured at the Dayton Adult Trap on the Touchet River, 2013. Data shown represents first time captures that were then PIT tagged, or fish that were recaptures from previous years (2nd, 3rd, 4th, 5th year recaps, or S, 1st year S were initially tagged at the Dayton Smolt Trap and then recaptured in the adult trap.
Date Length PIT Tag # Recap Date Length PIT Tag # Recap 4/29 31.0 3D9.1C2DCAE625
5/14 40.0 3D9.1C2DCAD0A3
5/6 38.0 3D9.1C2DD3FB2B 2nd year 5/14 40.0 3D9.1C2DCB4E16 5/6 36.0 3D9.1C2DCBD063 5/14 33.0 3D9.1C2DCB7AC3 5/6 50.0 3D9.1C2DCA81E7 3rd year 5/14 46.0 3D9.1C2DD535DC 2nd year 5/6 34.0 3D9.1C2DCAF162 5/14 36.0 3D9.1C2DCB6348 5/6 34.0 3D9.1C2DDA392E S 5/14 43.0 3D9.1C2DCB16F6 5/6 56.0 3D9.1C2DCA9FC2 3rd year 5/14 44.0 3D9.1C2DCBB2E9 5/6 51.0 3D9.1C2CCC61BE 4th year 5/14 34.0 3D9.1C2DCAAB5C 5/6 36.0 3D9.1C2DCB1588 5/14 31.0 3D9.1C2DCAE48A 5/7 29.0 3D9.1C2DCACFD2 5/14 34.0 3D9.1C2DCBCF3C 5/7 48.0 3D9.1C2DC9B8F4 2nd year 5/14 43.0 3D9.1C2D72C763 2nd year 5/7 35.0 3D9.1C2DCA942F 5/14 35.0 3D9.1C2DCB6ACF 5/7 55.0 3D9.1C2CC9C93E 3rd year 5/21 55.0 3D9.1C2CC9DA2D 4th year
5/13 43.0 3D9.1C2DD60673 2nd year 6/5 35.0 3D9.1C2DCBBEF6 5/13 43.0 3D9.1C2D048F8A 2nd Year 6/6 36.0 3D9.1C2DCB8405 5/13 35.0 3D9.1C2DCAB4C2 6/6 61.0 3D9.1C2C876748 6th year 5/13 34.0 3D9.1C2DCB995A 6/6 32.0 3D9.1C2DCAFA88 5/13 39.0 3D9.1C2DCA92CB 6/7 38.0 3D9.1C2DCA92C2 5/13 34.0 3D9.1C2DCAF208 6/7 36.0 3D9.1C2DCBA7B8 5/13 37.0 3D9.1C2DCAF0EC 6/7 32.0 3D9.1C2DCBC18B 5/13 34.0 3D9.1C2DCB98E7 6/7 31.0 3D9.1C2DCB8E1D 5/13 56.0 3D9.1C2C4BAF13 5th year 6/7 29.0 3D9.1C2D9C69DC 1st year S 5/13 36.0 3D9.1C2DCB6E26 6/7 37.0 3D9.1C2DCA9F44 5/13 58.0 3D9.1C2DCA9BA8 3rd year 6/11 33.0 3D9.1C2DCB1699 5/13 48.0 3D9.1C2DC9DE9A 3rd year 7/1 24.0 3D9.1C2DCAD0A1 5/13 36.0 3D9.1C2DCB9E0C 7/1 27.0 3D9.1C2DD46330 5/13 37.0 3D9.1C2DCB7A5A 7/3 34.0 3D9.1C2D42559D 5/13 34.0 3D9.1C2CFD85AE 1st Year S 7/3 25.0 3D9.1C2DD3D0BC 5/13 38.0 3D9.1C2DCA7BA3
Appendix B: Table 3. Whitefish (WF) and brown trout captured at the Dayton Adult Trap on the Touchet River, 2013. Note: No brown trout were captured in 2013.
Date Species Ln (cm) Date Species Ln (cm) Date Species Ln (cm) 5/7 WF 41.0 6/10 WF 27.0 7/3 WF 23.0 5/7 WF 32.0 6/11 WF 21.0 7/3 WF 21.0
5/14 WF 36.0 6/11 WF 37.0 7/3 WF 37.0 5/28 WF 33.0 6/18 WF 37.0 7/3 WF 31.0 6/6 WF 32.0 7/1 WF 23.0 8/19 WF 31.0

Lyons Ferry Complex Evaluation: July 2015 Summer Steelhead Annual Report – 2012 Run Year 47
Appendix C
Wallowa Stock Marking/Tagging Scheme

Attachment #1. Proposed marking/tagging strategy for Wallowa stock summer steelhead – Lyons Ferry Complex.
Rearing Lake 100% AD Clipped
Cottonwood 20K - CWT/PIT
Cottonwood AP Release
200K Total
Dayton 20K - CWT/PIT
Dayton AP Release
85K Total
Walla Walla 20K - CWT/PIT
On-Station 20K - CWT/PIT
On-Station 20K - AD
On-Station 20K - AD
On-Station Release
60K Total
Walla Walla Release
100K Total
180K AD Only to Cottonwood AP
65K AD Only to Dayton AP
20K CWT/PIT back to rearing lake following AD-Clipped transfers to Cottonwood and Dayton (Feb)
All On-Station released fish stay in raceways for remaining rearing cycle.
~120K to Raceways in January
Lyons Ferry C
omplex E
valuation: July 2015
Summ
er Steelhead Annual R
eport – 2012 Run Y
ear 48

This program receives Federal financial assistance from the U.S. Fish and Wildlife Service Title VI of the Civil Rights Act of 1964, Section 504 of the Rehabilitation Act of 1973, Title II of the Americans with Disabilities Act of 1990, the Age Discrimination Act of 1975, and Title IX of the Education Amendments of 1972. The U.S. Department of the Interior and its bureaus prohibit discrimination on the bases of race, color, national origin, age, disability and sex (in educational programs). If you believe that you have been discriminated against in any program, activity or
facility, please contact the WDFW ADA Program Manager at P.O. Box 43139, Olympia, Washington 98504, or write to
Department of the Interior Chief, Public Civil Rights Division 1849 C Street NW Washington D.C. 20240
Related Documents