Lymphocyte Responses in the Lung in Patients with Respiratory Disease Thesis presented for the degree of Doctor of Philosophy at the university of London Dr Simon Barry MBBS, BSc, MRCP, DTMH November 2002

Welcome message from author
This document is posted to help you gain knowledge. Please leave a comment to let me know what you think about it! Share it to your friends and learn new things together.
Transcript

Lymphocyte Responses in the
Lung in Patients with Respiratory
Disease
Thesis presented for the degree of Doctor of Philosophy at the university of London
Dr Simon Barry
MBBS, BSc, MRCP, DTMH
November 2002

ProQuest Number: 10016089
All rights reserved
INFORMATION TO ALL USERS The quality of this reproduction is dependent upon the quality of the copy submitted.
In the unlikely event that the author did not send a complete manuscript and there are missing pages, these will be noted. Also, if material had to be removed,
a note will indicate the deletion.
uest.
ProQuest 10016089
Published by ProQuest LLC(2016). Copyright of the Dissertation is held by the Author.
All rights reserved.This work is protected against unauthorized copying under Title 17, United States Code.
Microform Edition © ProQuest LLC.
ProQuest LLC 789 East Eisenhower Parkway
P.O. Box 1346 Ann Arbor, Ml 48106-1346

Declaration
This work undertaken in this thesis has been undertaken solely by the candidate, Dr
Simon Barry.
This thesis has not been submitted or accepted in any previous application for a
degree.
Sources of information have been acknowledged in the text.

Acknowledgements
This thesis would not have been possible without the considerable help and careful
guidance of the following people.
• Richard Tilling who patiently taught me flow cytometry and encouraged my
interest in immunology with stimulating discussions.
• Margaret Johnson who supported me for longer than she should have done and I
who can only thank for her faith in me. I hope that the persistent watering finally
resulted in a satisfactory bloom!
• To all the consultants in respiratory medicine and infectious disease who helped
my quest for patients with tuberculosis
• To the patients themselves, some of whom undenwent bronchoscopy despite
knowing that they had tuberculosis and especially the two patients who
volunteered for a repeat bronchoscopy following therapy.
• To llesh Jani with whom I shared many ideas, but mostly because he helped me
out of my curmudgeonly state with humour.
• To Sandra, Nick, Helen and Arabi for their help and humour also.
• To Len Poulter for his support and comments on my thesis.
• Most of all, my gratitude goes to my supervisor, George Janossy. He was always
entertaining, sometimes obscure, but I learnt that to listen and to question were
well rewarded. His breadth and depth of knowledge, together with a tremendous
ability to see the direction in which immunology was heading were invaluable in
stimulating my interest in the subject. He was always encouraging and his critical
analysis of my papers helped me to grow during this time. Without his direction
and support I am sure that I could not have completed this work.
Dedication
This thesis is dedicated to my father, who died in a tragic accident soon after I started
working and from whom I learnt the values of enthusiasm and application and with whom
I would have loved to have shared the joys of finishing this project.

AbstractThe initial promise generated by earlier studies of bronchoalveolar lavage (BAL) in the
differential diagnosis of lung disease has generally failed to be translated to routine
clinical practice. The reasons for this delay stem largely from the fact that the cytospin
techniques used to differentiate BAL leukocyte subpopulations are cumbersome, time-
consuming and imprecise. Nevertheless, flow cytometry (FCM) offers an alternative
technology that is rapid, precise and well suited to document complex changes in cellular
phenotype in fresh and cultured specimens.
The patients included in this thesis were all investigated for suspected respiratory
disease and FCM was undertaken in addition to routine diagnostic tests on the BAL
specimens. Three key findings were observed. First, a simple single four-colour panel
has been developed that enables the rapid enumeration of the major clinically relevant
leukocyte components in BAL, including the CD4/CD8 lymphocyte ratio. This technology
is shown to be superior to cytospin techniques in terms of precision and speed, and
should be adopted for routine clinical investigation.
Second, it has been demonstrated that the lung is a distinct immunological site when
compared to the blood. CD8 T lymphocytes have been investigated using the
discriminatory markers, CD27 and CD45RA, and it has been shown that there is a
preferential accumulation of mature memory CD8 cells in the lung.
Lastly, the differences between the lung and the blood have been further evaluated
by analysing antigen-specific responses in patients with tuberculosis. It has been shown
that powerful CD4 interferon-y and tumour necrosis factor-a synthetic responses to short
term incubation with purified protein derivative (PPD) in BAL, but not blood, can be used
for the rapid diagnosis of acute tuberculosis. This test is a candidate for routine clinical
application, particularly because patients with extra-pulmonary tuberculosis also
respond.
Most importantly, this thesis has demonstrated that the focused investigation of BAL
using a powerful tool such as FCM can deliver important immunological information with
direct clinical relevance. It therefore highlights the vital link between medicine and
laboratory services in order to define optimal diagnostic technologies on the basis of
modern research.

Publications arising from this thesis
Papers
1) Barry SM and Janossy G. Optimal gating strategies for determining
bronchoalveolar lavage CD4/CD8 lymphocyte ratios by flow cytometry. J Imm
Methods 2003 in press
2) Barry SM, Johnson MA and Janossy G. Increased proportions of activated
and proliferating memory CD8+ T lymphocytes in both lung and blodd are
associated with blood HIV viral load. JAIDS 2003 34(4): 351-7
3) Barry SM. The utility of bronchoalveolar lavage evaluation in patients with
respiratory disease. CPD Bulletin Immunology and Allergy. 2003, 3: 8-10
4) Barry SM, Lipman MCI, Bannister B, Johnson MA and Janossy G. Type-1
cytokine synthesising CD4 lymphocytes in the lung are a characteristic sign
of pulmonary and non-pulmonary tuberculosis. J Infect Dis 2002,187: 243-
50.
5) Barry SM, Condez A, Deery A, Johnson MA and Janossy G. Determination
of Bronchalveolar lavage Leukocyte Populations by Flow Cytometry in
Patients Investigated for Respiratory Disease. Clinical Cytometry 2002, 50:
291-297.
6) Barry SM, Lipman MCI, Deery AR, Johnson MA and Janossy G. Immune
reconstitution pneumonitis following Pneumocystis carinii pneumonia in HIV-
infected subjects. HIV Medicine 2002, 3: 207-211
7) Barry SM, Johnson MA and Janossy G. Cytopathology or immunopathology?
The puzzle of cytomegalovirus pneumonitis revisited. . Bone Marrow Transpl.
2002, 26: 591-598
8) Barry SM, Lipman MCI, Johnson MA and Prentice HG. Respiratory
infections in immunocompromised patients. CurrOpin Pulm Med 1999, 5:
168-173

Oral presentations
1) Barry SM and Janossy G. Flow cytometry in BAL and other tissue fluids.
European flow cytometry conference andworking group on clinical cell
analysis. Urbino, Italy 2002.
2) Barry SM and Janossy G. Applications of flow cytometry in bronchoalveolar
lavage from patients with respiratory disease. European flow cytometry
conference and working group on clinical cell analysis. Urbino, Italy 2001.
Poster presentations
1) Barry SM, Johnson MA and Janossy G. Analysis of lung and blood CD8 T
lymphocytes in patients with HIV infection. 13^ World AIDS conference,
Durban, South Africa 2001

Index of Tables
T able 1.1 Advantages and disadvantages of different methods for determining
antigen-specific lymphocyte responses...................................................... 20
Table 2.1 Fluorochromes available for use between the CytoronAbsolute and
FACSCalibur flow cytometers...................................................................... 46
Table 2.2 Monoclonal antibodies used in this thesis................................. ...................51
Table 2.3 Antigens and substances used to stimulate cytokine synthesis...................61
Table 3.1 Coefficients of variation for BAL lymphocyte, macrophage and
granulocyte percentages derived by flow cytometry and cytospin.............. 75
Table 4.1 Demographic details, diagnoses and CD4/CD8 ratios by different
FCM methods in the study population.................................................. 88
Table 5.1 Characteristics of BAL from study population.............................................. 101
Table 5.2 Main BAL diagnoses in HIV- and HIV+ patients...............................L........ 102
Table 5.3 Demographic and diagnostic features of patients with sarcoid....................104
Table 5.4 Demographic, diagnostic and BAL FCM data of patients with TB.............. 107
Table 5.5 BAL lymphocyte percentages from radiologically abnormal and normal
lung in patients with pulmonary TB.............................................................110
Table 6.1. Demographic, Immunological, Viral and Diagnostic Data of the HIV+
study Population.........................................................................................127
Table 7.1 Demographic and diagnostic data for patients undergoing CD8
phenotypic analysis in blood and BAL........................................................143
Table 8.1 Demographic and diagnostic results in patients with TB..............................159
Table 8.2 Demographic and diagnostic results of patients with non-tuberculous
respiratory disease..................................................................................... 161
Table 8.3 BAL lymphocyte percentages and CD4 type-1 cytokine responses at
diagnosis of TB and following completion of TB therapy ............167
Table 8.4 BAL IFN-y responses to PPD from radiologically affected and
unaffected lung in patients with TB.............................................................168

Index of Figures
Figure 1.1 FCM dotplots of lysed whole blood and BAL...............................................17
Figure 1.2 Cartoon of immune response to Mycobacterium tuberculosis (TB)............25
Figure 2.1 Photomicrographs of stained BAL cytospin preparations............................43
Figure 2.2 FCM dotplot of lysed whole blood............................................................... 45
Figure 2.3 FCM dotplot of CD45 panleukogating against side scatter (SSC) to
differentiate the major leukocyte populations in lysed whole blood............ 47
Figure 2.4 FCM dotplot from BAL demonstrating the separation of CD45+
leukocytes from CD45- non-leukocyte debris.............................................48
Figure 2.5 Epithelial cell contamination of BAL in FCM dotplots and cytospins...........49
Figure 2.6 FCM gating strategy for phenotyping of lymphocytes................................. 50
Figure 2.7 Mean fluorescence intensity (MFI) of CD4 expression on BAL
lymphocytes with incubation time................................................................ 55
Figure 2.8 Time course of BAL CD4 cytokine responses to PPD................................ 56
Figure 2.9 CD69 expression on CD4 and CD8 lymphocytes in fresh BAL.................. 57
Figure 2.10 Dose response curve of CD4 cytokine synthesis to PPD stimulation......... 59
Figure 2.11 BAL CD4 expression before and after permeabilisation............................. 60
Figure 3.1 CD45 panleukogating in BAL.......................................................................67
Figure 3.2 BAL eosinophil discrimination by FCM........................................................ 68
Figure 3.3 BAL lymphocyte determination by CD45 expression and light scatter
compared with lymphosum gating................................................................ 69
Figure 3.4 CD45 expression and light side scatter characteristics in BAL cells
expressing the dead cell marker, 7-AAD.....................................................72
Figure 3.5 Correlation plots comparing the enumeration of BAL lymphocytes,
granulocytes and macrophages by flow cytometry and cytospin................ 73
Figure 3.6 Bland-Altman plots comparing the enumeration of BAL lymphocytes,
granulocytes and macrophages by flow cytometry and cytospin............... 74
Figure 3.7 Correlation and Bland Altman plots comparing BAL lymphocyte
percentages by CD45 gating with lymphosum.............................................76
Figure 3.8 Immunofluoresence staining of BAL with an eosinophilia........................... 77
Figure 4.1 Optimum gating strategy for determining BAL CD4/CD8 ratios...................85
Figure 4.2 Simplified gating strategy for determining BAL CD4/CD8 ratios..................86
Figure 4.3 Standard gating strategy to determine the BAL CD4/CD8 ratios................ 86

Figure 4.4 Correlation between method 1 and method 2 for determining
the CD4/CD8 ratio determination................................................................. 89
Figure 4.5 Bland Altman comparisons between method 1 and 2 for the
determination of CD4/CD8 ratios................................................................ 89
Figure 4.6 Correlation between method 1 and method 3 for determining the BAL
CD4/CD8 ratios............................................................................................ 90
Figure 4.7 Bland Altman comparisons between method 1 and 3 for the
determination of CD4/CD8 ratios................................................................ 91
Figure 5.1 Percentage of BAL lymphocytes by FCM in patients with sacoidosis
according to the stage of their pulmonary disease.................................... 105
Figure 5.2 BAL CD4/CD8 ratios by FCM in patients with sacoidosis according to
the stage of their pulmonary disease.........................................................105
Figure 5.3 Percentage of BAL lymphocytes by FCM in patients with tuberculosis,
sacoidosis, and in healthy controls............................................................108
Figure 5.4 Percentage of BAL lymphocytes by FCM in patients with tuberculosis
with washings taken from cavities and radiologically normal lung............108
Figure 5.5 BAL lymphocyte percentages in all patients withTB, in symptomatic
TB patients without cavities and in healthy controls..................................110
Figure 5.6 BAL CD4/CD8 ratios in patients with TB, sarcoidosis and in controls...... 111
Figure 5.7 Blood CD4 count in HIV+ patients according to pathogens obtained in
BAL............................................................................................................. 112
Figure 5.8 BAL lymphocyte percentages in HIV+ patients without respiratory
Pathogens according their blood CD4 counts........................................... 113
Figure 5.9 CD4/CD8 ratios in blood and BAL in HIV+ patients without respiratory
Pathogens according their blood CD4 counts........................................... 114
Figure 5.10 Box and whisker plots comparing the percentage of CD4 lymphocytes
in BAL and blood according to different blood CD4 categories in HIV+
Patients without respiratory pathogens..................................................... 115
Figure 5.11 Box and whisker plots comparing the percentage of CD8 lymphocytes
in BAL and blood according to different blood CD4 categories in HIV+
Patients without respiratory pathogens..................................................... 115
Figure 5.12 Leukocyte discrimination and CD4/CD8 ratios by FCM in pleural fluid.
Ascetic fluid and cerebrospinal fluid...........................................................116

Figure 6.1 FCM gating strategy to determine the activation and proliferation staus
Of CD8+ memory lymphocytes..................................................................129
Figure 6.2 Determination of CD38 gating strategy by FCM........................................ 130
Figure 6.3 Comparison between the percentages of CD38+ CD8+ T lymphocytes
in BAL and blood in controls and HIV+ patients........................................ 133
Figure 6.4 Comparison between CD38+ CD8+ T lymphocytes from BAL of HIV+
Patients with and without respiratory pathogens.......................................134
Figure 6.5 Box and whisker plots comparing the percentage of Ki67+ CD8+ T
Lymphocytes in CD38+ and CD38- populations in BAL and blood...........135
Figure 7.1 FCM dotplots demonstrating CD8 naïve and memory subsets in BAL
In HIV infection and sarcoidosis................................................................ 145
Figure 7.2 Expression of of CD8 CD45 isoforms in BAL.............................................146
Figure 7.3 Box and whisker plots comparing memory CD8 lymphocytes in BAL
and blood....................................................................................................147
Figure 7.4 Pie charts of CD8 naïve and memory CD8 subpopulations in BAL and
Blood for the whole study population.........................................................149
Figure 7.5 Pie charts of CD8 naïve and memory CD8 subpopulations in BAL and
and blood from HIV+ patients and controls............................................... 151
Figure 8.1 IFN-y and TN F-a responses in BAL T lymphocytes following incubation
with PPD in a patient with TB.....................................................................163
Figure 8.2 CD4 IFN-y responses in BAL in patients with TB and non-TB
respiratory disease..................................................................................... 164
Figure 8.3 CD4 IFN-y responses in BAL in patients with pulmonary and non-
pulmonary TB..............................................................................................165
Figure 8.4 CD4 IFN-y responses in blood in patients with TB, BCG-vaccinated
healthy controls and non-BCG vaccinated patients without TB................ 168

Table of Contents
Acknowledgements....................................................................................................... 1
Dedication......................................................................................................................... 1
Publications arising from this thesis ........................................................................3
Papers............................. 3Oral presentations.................................................................................................................................. 4Poster presentations..............................................................................................................................4
Index of Tables................................................................................................................ 5
Index of Figures..............................................................................................................6
Table of Contents............................................................................................................9
1. Chapter 1............................................ 13
1.1 Background.....................................................................................................................................141.2 Flow cytometry and CD45 panleukogating.............................................................................. 171.3 Techniques for detecting antigen-specific I lymphocytes................................................... 191.4 Overview of recent developments in understanding lung immune responses................231.5 Summary of rationale and aims.................................................................................................. 281.6 References....................................................................................................................................... 29
2. Chapter 2.............................................................................................................40
2.1 Introduction.....................................................................................................................................412.2 Fibreoptic bronchoscopy and bronchoalveolar lavage.........................................................412.3 Preparation of BAL........................................................................................................................ 412.4 Cytospins......................................................................................................................................... 422.5 Immunofluoresence staining.......................................................................................................422.6 Flow cytometry: general introduction and gating strategies...............................................44
2.6.1 General characteristics of the flow cytometers used...................................................... 442.6.2 Mechanisms of analyte discrimination by FCM.............................................................. 442.6.3 CD45 directed panieukogating in blood and BAL........................................................... 462.6.4 Gating strategy to identify bronchiai epitheiiai and squamous celis in BAL by FCM....482.6.5 General gating strategy for lymphocyte phenotypic analysis: primary immunological gating.......................................................................................................................................... 49
2.7 Flow cytometry: Reagents, panels and protocols.................................................................502.7.1 Reagents and panels for three and four colour FCM.......................................................502.7.2 Protocols for staining of fresh whole blood and BAL......................................................522.7.3 Intracellular staining by FCM: fixation and permeabilisation of ceils............................ 52
2.8 Measurement of antigen-specific responses: cytokine synthesis assay..........................532.8.1 General introduction to the method.................................................................................. 532.8.2 Time course experiment for cytokine synthesis following incubation with PPD.......... 542.8.4 Use of CD69 in BAL........................................................................................................... 572.8.5 Dose response curve for purified protein derivative...................................................... 582.8.6 Optimisation of antibody surface staining sequence..................................................... 602.8.7 Method for the detection of intracellular cytokine synthesis in whole blood and BAL .602.8.8 Antigens used for the cytokine synthesis assay............................................................. 61
2.9 Statistics.......................................................................................................................................... 61

2.10 References..................................................................................................................................... 62
.............................................................................................................................Chapter 3........................................................................................................................................... 64
3.1 Introduction.....................................................................................................................................653.2 Material and methods.................................................................................................................... 66
3.2.1 Subjects..............................................................................................................................663.2.2 Bronchoalveolar lavage.................................................................................................... 663.2.3 Flow cytometry.................................................................................................................. 663.2.4 Cytospin.............................................................................................................................703.2.5 Freezing and thawing of BAL............................................................................................703.2.6 Immunofluorescence staining of BAL..............................................................................703.2.7 Statistical analysis.............................................................................................. 70
3.3 Results.............................................................................................................................................. 713.3.1 BAL diagnoses.................................................................................................................. 713.3.2 BAL leukocyte differential counts by FCM....................................................................... 713.3.3 7-AAD expression In BAL................................................................................................. 723.3.4 Correlation between leukocyte differentials by FCM and cytospin................................723.3.5 Coefficient of variation between FCM and cytospin........................................................ 753.3.6 Comparison between fresh and frozen BAL for leukocyte subset determination by FCM .....................................................................................................................................................753.3.7 Comparison between BAL lymphocyte percentages obtained by CD45 and light scatter with the sum of the lymphocyte subsets by FCM..................................................................... 763.3.8 Immunofluorescence staining of BAL..............................................................................77
3.4 Discussion....................................................................................................................................... 773.5 References....................................................................................................................................... 79
.............................................................................................................................Chapter 4 82
4.1 Introduction.....................................................................................................................................834.2 Methods............................................................................................................................................83
4.2.1 Patients...............................................................................................................................834.2.3 Bronchoalveolar lavage and pleural fluid.........................................................................844.2.4 Handling of samples......................................................................................................... 844.2.5 Flow cytometry.................................................................................................................. 844.2.6 Statistics.............................................................................................................................87
4.3 Results.............................................................................................................................................. 874.3.1 Diagnoses In the study population...................................................................................874.3.2 Comparison of CD4/CD8 ratios determined by the ‘gold standard’ (method 1) with the simplified technique (method 2)................................................................................................ 874.3.3 Differences between the BAL and pleural fluid CD4/CD8 ratios measured by method 1 and method 3 ..............................................................................................................................90
4.4 Discussion....................................................................................................................................... 914.5 References....................................................................................................................................... 93
Chapter 6........................................................................................................................................... 96
5.1 Introduction.....................................................................................................................................975.2 Methods............................................................................................................................................97
5.2.1 Patients...............................................................................................................................975.2.2 Bronchoalveolar lavage and bronchial biopsy................................................................ 985.2.3 Acquisition of pleural, peritoneal and cerebrospinal fluid samples...............................985.2.4 Routine analysis of Clinical Specimens........................................................................... 985.2.5 Preparation of Specimens.................................................................................................995.2.6 Flow Cytometry.................................................................................................................. 99
10

5.2.7 Statistics........................................................................................................................ 1005.3 Results............................................................................................................................................100
5.3.1 General characteristics of BAL.......................................................................................1005.3.2 Diagnoses in patients undergoing BAL.......................................................................... 1015.3.3 Sarcoidosis...................................................................................................................... 1035.3.4 Tuberculosis.................................................................. 1065.3.5 HIV....................................................................................................................................112
5.4 Analysis of leukocyte differentials in non-BAL flu ids......................................................... 1165.5 Discussion............................................... 1175.6 References..................................................................................................................................... 120
.................................... Chapter 6......................................................................................................................................... 124
6.1 introduction...................................................................................................................................1256.2 Methods......................................................................................................................................... 126
6.2.1 Patients.............................................................................................................................1266.2.2 Determination of HIV Viral Load......................................................................................1266.2.3 Standard Investigations for Respiratory Pathogens in BAL..........................................1266.2.4 Bronchoscopy and Sample Preparation........................................................................ 1286.2.5 Flow Cytometry and Gating strategies........................................................................... 1286.2.6 Statistical Analysis...........................................................................................................131
6.3 Results............................................................................................................................................1316.3.1 Diagnoses in the HIV* patients with respiratory disease and BAL lymphocyte percentages..............................................................................................................................1316.3.2 CD45 Isoform Expression of CDS* I lymphocytes in BAL and blood in HIV* Patients and control subjects................................................................................................................ 1316.3.3 CD38 expression in CD45RA CDS* lymphocytes from BAL and blood of HIV* patients and control subjects................................................................................................................ 1326.3.4 CD3S expression in CD45RA CDS* lymphocytes from BAL of HIV* patients with and without Respiratory Pathogens................................................................................................1335.3.5 Expression of KI67 in activated and unactivated CDS* lymphocytes in lung and blood ...................................................................................................................................................135
6.4 Discussion.....................................................................................................................................1366.5 References.....................................................................................................................................137
.............................................................................................................................Chapter 7.........................................................................................................................................141
7.1 Introduction...................................................................................................................................1427.2 Materials and Methods................................................................................................................142
7.2.1 Patients.............................................................................................................................142CD4............................................................................................................................................143HIV viral load’' ........................................................................................................................... 1437.2.2 Bronchoscopy................................................................................................................. 1447.2.3 Sample preparation......................................................................................................... 1447.2.4 Flow Cytometry and Gating strategies........................................................................... 1447.2.5 Statistical Analysis.......................................................................................................... 146
7.3 Results............................................................................................................................................1467.3.1 Comparison of the proportion of memory CDS+1 lymphocytes in the total CDS I cellpool in BAL and blood..............................................................................................................1467.3.3 Differences in CDS lymphocyte subpopulations between patients with HIV, sarcoidosis and healthy control subjects....................................................................................................149
7.4 Discussion.....................................................................................................................................1527.5 References.....................................................................................................................................154
Chapter 8.............................................................................................................. 167
11

8.1 Introduction...................................................................................................................................1588.2 Methods..........................................................................................................................................158
8.2.1 Patients............................................................................................................................. 1588.2.2 Bronchoalveolar lavage...................................................................................................1618.2.3 Sample preparation..........................................................................................................1628.2.4 PPD stimulation and FCM analysis................................................................................. 1628.2.5 Statistics........................................................................................................................... 1638.3.1 Comparison of IFN-y and TNF-a responses to PPD In BAL between IB-Infected and uninfected Individuals.............................................................................................................. 1648.3.3 Type-1 cytokine responses In PPD-stlmulated CD4 lymphocytes In BAL In patients with pulmonary and non-pulmonary TB..........................................................................................1658.3.4 Type-1 cytokine synthetic responses to PPD In BAL CD4 and CD8 lymphocytes In patients with TB........................................................................................................................ 1668.3.5 Persistence of type-1 cytokine synthetic responses to PPD In BAL following Initiationof treatment for TB...................................................................................................... 166Patient.......................................................................................................................................1678.3.6 Type-1 cytokine synthetic responses to PPD In BAL from radiologically normal and abnormal areas of lung In patients with TB............................................................................ 1678.3.7 Comparison of IFN-y and TNF-a responses In the blood of TB patients with BCG- vacclnated controls........................................................................................................... 167
8.4 Discussion..................................................................................................................................... 1698.5 References..................................................................................................................................... 172
............................................................................................................................ Chapter 9.........................................................................................................................................176
9.1 Discussion..................................................................................................................................... 1779.2 References..................................................................................................................................... 182
Glossary of Abréviations..........................................................................................184
Appendix 1....................................................................................................................185
Appendix 2....................................................................................................................186
12

1. Chapter 1
Introduction, Rationale and Aims
13
1.1 BackgroundThe burden of respiratory infections worldwide is enormous. The broad spectrum of
these diseases encompasses upper and lower respiratory tract infections through to
community and hospital acquired pneumonia and tuberculosis. Tuberculosis (TB) is
estimated to infect one third of the world’s population and causes eight million new
infections and nearly two million deaths each year [1]. Untreated, the mortality rate of
clinical disease has been estimated at 40-60% [2]. One of the terrible tragedies of this
disease is that effective chemotherapeutic regimes exist [3], although 95% of cases and
deaths occur in resource-poor countries [1] that often cannot afford the drugs and do not
have the health infrastructure to cope. Despite a commitment to reduce the death rate
from tuberculosis by 50% by the year 2010, the leaders of the world’s most powerful
countries have seemingly set themselves an impossible task. The rising TB pandemic in
Sub-Saharan Africa is fuelled by a number of factors including HIV co-infection [4, 5],
poor health infrastructures, famine, poverty and war. Nevertheless, sensible directly
observed therapy (DOTS) treatment programmes adapted to local situations have
proved highly effective [6-8] and have led some observers to be cautiously optimistic
about TB control [9].
Even more disastrous than TB in terms of mortality rates is pneumonia which is the
most frequent cause of death worldwide in children under five [10] and also carries a
high mortality rate in both resource-rich and poor settings in adults [11]. Viral respiratory
tract infections are generally less severe in the immunocompetent host, but they are a
very significant factor in exacerbations in patients with underlying asthma [12, 13] and
chronic obstructive pulmonary disease [14].
The burden of respiratory disease in patients who are immunocompromised either
due to HIV infection, organ transplantation, or immunosuppressive therapy is even
greater than in the immunocompetent patient. Worldwide HIV infection is by far the most
significant cause of immunosuppression, with an estimated 40 million infected individuals
in 2001 of whom 70% are from Sub-Saharan Africa [15]. Overall, the greatest burden of
respiratory disease in HIV infected individuals is that of tuberculosis with recent
estimates from some Sub-Saharan countries that 70% of patients with active
tuberculosis are also co-infected with HIV [16]. Tuberculosis is the leading cause of
death among people with HIV infection, accounting for a third of deaths world-wide [16].
In resource-poor settings, the burden of tuberculosis is a mixture of reactivation and re
infection, with the latter thought to be increasingly more important in TB endemic areas
14
[17]. HIV co-infection dramatically increases the risk of reactivation in those who are
infected with TB but do not have clinical disease. It has been estimated that the rate of
reactivation of primary TB is only 5-10% for the lifetime of a non-HIV infected individual
[18]. In those co-infected with HIV the annual risk of developing active disease ranges
from 5% to 15% [19-21]. These features have been highly significant in fuelling the TB
pandemic in resource-poor countries, particularly in Sub-Saharan Africa. The high
prevalence of TB in HIV-infected patients is not confined to the developing world.
Increasing migration and immigration of persons from such countries has contributed to
rising rates of TB in the West [22-24]. A particular concern is that of multi-drug resistant
TB in HIV infection that has extremely high mortality rates [25]
In addition to increased susceptibility to mycobacterial infections, HIV+ patients are
also at increased risk of Pneumocystis carinii pneumonia (PCP) which historically
occurred in 60-80% in the resource-rich world prior to the advent of anti-retroviral and
anti-pneumocystis therapy [26]. However, infection with this opportunistic pathogen is
rare in adults from resource-poor settings, a finding that is largely explained by death
from other diseases before a sufficient drop in CD4 count is reached to increase the risk
of PCP [27]. In addition, HIV-infected adults and children are at increased risk of
developing bacterial pneumonia [28, 29] and bacteraemia complicating this [30, 31].
By contrast with the HIV-infected population, where cytomegalovirus (CMV) infection
is a rare respiratory pathogen [32, 33], patients who have undergone bone marrow
transplantation (BMT) are known to be particularly at risk of cytomegalovirus
pneumonitis (CMV-P). Infection with this pathogen had historical mortality rates of 30-
80% until the recent introduction of effective prophylactic therapy [34]. Fungal infections,
particularly with aspergiiius species are also frequent infectious hazards in the early post
transplant period characterized by neutropenia [34]. In lung transplant patients, CMV-P
is also a well-recognised infectious complication [35].
Therefore, one of the characteristic features of respiratory infections in these groups
reveals that different patterns emerge in the types of respiratory pathogens between
patients who are immunocompromised due to HIV infection from those that have had
BMT or solid organ transplantation. Fungal infections and cytomegalovirus frequently
cause respiratory infections in BMT patients, but only rarely in those with HIV, whilst
PCP and tuberculosis are more common in HIV infection than following BMT [34]
Underlying these clinical presentations are various defects in the host immune
response that, in combination with the direct pathogenic effects of the organism, lead to
15

different clinical outcomes. Unfortunately, relatively few studies have examined the
processes of the immune response in the lung in humans, but instead, investigations
frequently extrapolate from the findings seen with cells taken from peripheral blood
samples with the assumption that these are equally applicable to the responses in
tissues.
Interest in the lung as a distinct immunological site has been stimulated by the
investigation of diseases such as sarcoidosis in which lung involvement is a dominant
clinical presentation. Considerable effort has been invested over the last two decades in
determining the leukocyte differentials and CD4/CD8 lymphocyte ratios in the lung in
patients with lung disease. The impetus behind this drive was threefold. First, it was
discovered that the lymphocyte proportions obtained in BAL were similar to those
obtained from lung biopsy specimens in sarcoidosis patients, thus lending credence to
the use of BAL as an investigative sample [36, 37]. Second, sarcoidosis was shown to
be characterized by a BAL lymphocytosis and a raised CD4/CD8 ratio when compared
to healthy controls. [38, 39]. Lastly, it was documented that the changes noted in BAL
were largely absent in the blood [38]. Therefore, the investigation of cell populations in
the lung was thought to be of diagnostic relevance for diseases such as sarcoidosis and
provided a further impetus to study BAL lymphocyte differentials in other respiratory
diseases such as TB [40-42], cryptogenic organising pneumonia [43] and pulmonary
fibrosis [44-46].
One of the features that has handicapped the investigation of lung immunology has
been a conservatism in adopting new investigative tools and the consequent reluctance
for introducing new concepts into the evaluation of disease processes. For example, flow
cytometry, which has been the gold standard for enumerating CD4 counts and CD4/CD8
ratios in blood for twenty years [47], has yet to be adopted as a standard technique for
BAL lymphocyte analysis. Most of the studies investigating BAL CD4/CD8 lymphocyte
ratios have involved the use of immunofluoresence or peroxidase-anti-peroxidase
staining. These techniques are time consuming and suffer from inaccuracies due to the
low number of cells routinely counted. Furthermore, such a cumbersome technology
does not allow the convenient application of new ideas that aim to solve complex
problems of immunoregulation at the relevant tissue sites, in this case the lung.
16

1.2 Flow cytometry and CD45 panleukogating
Flow cytometry (FCM) is an alternative investigative tool to cytocentrifuge
preparations (cytospins) that has several advantages. First, it analyses data for
thousands of events and therefore reduces errors due to manual counting of small cell
numbers. Second, it is fast as FCM can be performed immediately after filtering,
centrifugation and staining of BAL samples. Third, and most importantly, the extensive
experience of analyzing leukocytes in blood with FCM has resulted in the development
of convenient and precise techniques for determining leukocyte differential counts. The
key strategy that has recently emerged has been morphospectral analysis using the
leukocyte marker, CD45 [48-50]. Importantly, these methods are readily exploitable for
the analysis of other tissue samples. In the past, it has been well documented that CD45
staining was optimal to differentiate lymphomas from anaplastic carcinomas in tissue
sections by immunohistology [51, 52]. In BAL, the use of CD45 enables leukocytes to be
differentiated from non-leukocyte components such as mucoid particles and epithelial
cells. Here, the adoption of CD45 pan-leukogating is particularly important because in
BAL the intrinsic cell parameters measured by FCM, size and granularity are not
sufficient to distinguish between the different leukocyte components and contaminating
debris (figure 1.1)Figure 1.1
B lo od B A L
SSC
Figure 1.1
FCM dotplots of fresh lysed whole blood and BAL. The intrinsic parameters of the
acquired events measured are forward scatter (FSC, size, y axis) and side scatter
(SSC, granularity, x axis). In the lysed blood, distinct leukocyte populations of
lymphocytes, monocytes and granulocytes are demonstrated. In BAL, no clear
populations are determined by these characteristics.
17

The concept of using CD45 during BAL analysis is not new. Several investigators
have adopted a gating approach that included CD45 for distinguishing lymphocytes from
the rest of the leukocyte pool in BAL [53-55]. However, these earlier methods have
included unnecessary complications that masked the advantages of using CD45 [54]. An
even more serious problem has been that in these previous studies the discrimination
between the relevant leukocyte components of the BAL fluid such as neutrophils and
eosinophils was neglected by FCM. This omission has been a significant factor in
ensuring that cytospins have generally remained the dominant method for BAL leukocyte
differential analysis.
Alveolar macrophages have also posed particular problems for flow cytometric
evaluation due to their autofluoresence [56] and heterogenous light scatter
characteristics. Some investigators have attempted to overcome the autofluoresence by
quenching with gentian violet [57]. However, It has remained unclear whether such
techniques have rendered these treated cells more amenable to phenotypic analysis by
FCM. A further problem has been the lack of a bona fide’ surface marker that would
identify macrophages in their various stages of differentiation. The only likely candidate
for the role of a pan-macrophage marker is the transmembrane glycoprotein CD68 [58].
Unfortunately, this marker is only suitable for histological or intracellular staining as the
molecule is not well expressed on the membrane of intact macrophages when studied in
suspension. This fact has led to an extra complication for the use of FCM to characterize
alveolar macrophages since an additional permeabilisation step is required for adequate
CD68 staining. As a result of these problems most, but not all analyses of alveolar
macrophages have still been performed by cytospin preparations.
In summary, despite the fact that FCM has been refined, simplified and accepted as
the gold standard method for the determination of leukocyte differentials in blood, this
technology has not yet been adequately applied to BAL. Therefore, the first aim of this
thesis was to develop a flow cytometric system that could distinguish all the relevant
leukocyte components in BAL. In particular, it was felt necessary that such a system
should be simpler, faster and more precise than the existing cytospin methods and thus
provide an impetus for adopting FCM as the routine diagnostic tool for BAL analysis.
This initial aim provided the platform for the further investigation of BAL by FCM and
the logical development of the other aims of this thesis. The second aim was to
investigate the differences between the lung and the blood T cell responses in terms of
both the major subsets of these lymphocytes and their particular phenotypic
18

characteristics found in each site. This second aim sought to determine to what extent
the lung was a distinct immunological compartment when compared to the blood, the
third aim of the thesis was to apply this comparative technique for the investigation of
antigen-specific responses in both the lung and blood compartments by making use of
recent advances in immunological techniques to detect such T lymphocyte responses.
1.3 Techniques for detecting antigen-specific I lymphocytes.Over the last six years there have been major advances in cellular immunology, the
most important of which has been the development of several techniques for the
accurate determination of antigen-specific lymphocytes [59-61] This has been a
revolutionary step as it has enabled the study of the functional performance of antigen-
specific CD4 and CDS T lymphocytes in vivo and also provided valuable insights into the
nature of immune responses to pathogens. Experiments using class I MHC tetramers
bound to Epstein-Barr virus (EBV) epitopes have demonstrated huge EBV-specific CDS
responses during acute infection that previous limiting dilution techniques had markedly
underestimated [62]. In the field of HIV, the detection of HIV-specific responses by
tetramers and cytokine production methods such as the ELISPOT have been
instrumental in understanding how the immune system responds to the virus [61, 63].
Each of these techniques has both advantages and disadvantages that are relevant to
their application as research tools (table 1.1).
Tetramers are major histocompatibility (MHC) class 1 molecules folded into a
tetrameric complex bound together with streptavidin to which relevant peptides can be
attached. This structure forms a stable unit that binds CD8+ T lymphocytes that
recognize the MHC-restricted peptide. This tetrameric complex has the advantage that it
binds specific CD8+ T lymphocytes with greater avidity than the natural monomeric
complex [64, 65]. The addition of a fluorochrome allows the CD8-tetramer complex to be
analysed by FCM [66].
To date the majority of tetrameric complexes have been made with class 1 MHC
molecules, although most recently class 2 MHC tetramers have also appeared as
research tools [67]. The advantages of using tetramers are that the peptide-specific CD8
lymphocytes and with class 2 tetramers, CD4 lymphocytes can be directly visualized by
FCM and the phenotype of these cells analysed using further discriminating monoclonal
antibodies. Nevertheless, some investigators have questioned the functional ability of the
tetramer-binding cells [68-70].
19

Table 1.1 Advantages and disadvantages of different methods for determining
antigen-specific lymphocyte responses
Method Advantages Disadvantages
Tetramer
1. Rapid detection (1 hour) of
Ag-specific response by FCM
2. Phenotypic analysis possible
1. Only measures response to
peptide present on tetramer
which may not be
immunodominant
2. Predominantly only CD8
responses since veiV few class-2
tetramers exist
3. Functionality of the cells not
determined
4. HI_A restriciton
5. Tetramer binding is temperature
dependent
6. Requires a flow cytometer
Elispot
1. Functional responses
measured.
2. low tech- responses can be
assessed with a microscope
3. Can use a variety of
stimulatory antigens so HLA
restriction not an issue
1. Cannot distinguish which
lymphocyte (CD4 or CD8) is
responding
2. Only measures the secretion of a
single cytokine thereby may
underestimate the Ag-specific
response
3. Phenotypic analysis not possible
Flow cytometric
1. Functional responses
measured
2. Can determine the
responding lymphocyte
subset
3. phenotypic analysis possible
4. Can distinguish a variety of
different cytokines
synthesized
5. Can use a variety of
stimulatory antigens so HLA
restriction is not an issue
Requires a flow cytometer.
Phenotypic analysis and multiple
cytokine detection is dependent
on the type of machine (number
of lasers) and the number of
fluorochromes used
20

The addition of a peptide stimulation step following tetramer staining has overcome this
problem by enabling the analysis of cytokine responses in the tetramer binding cells [71].
The major disadvantage of using tetramers to study CD8 lymphocytes is the HLA-
restriction of the response. Subjects must share the HLA haplotype of the tetramer and
there is no guarantee that the response generated is an immunodominant one.
Pathogens contain multiple epitopes that stimulate different responses between
individuals. Thus in order to approximate the natural response to many pathogens a
battery of different HLA-tetrameric complexes would need to constructed. Fortunately,
some well-studied viruses such as cytomegalovirus (CMV) appear to generate dominant
responses to conserved epitopes of the CMV matrix protein pp65 [72]. This restriction of
responses has facilitated the use of tetramers to study the immune response to this
pathogen in various clinical settings [73-75]. The responses to viruses such as HIV are
more complex and tetramer studies using separate HIV epitopes will only measure part
of the total immune response against the virus. These limitations, in addition to the fact
that tetramers are expensive and difficult to construct make them likely to have a limited
role beyond that of purely applied scientific research.
The two main additional well-standardized techniques for analysing antigen-specific
responses both detect cytokine responses following incubation with antigen. Both
techniques more closely mimic the natural immune response in the sense that antigen,
added to the culture medium is presented to cognate T lymphocytes by antigen-
presenting cells. The concept underlying these systems is that T cells, either CD4 or
CD8, that recognize antigen in the context of relevant MHC molecules, rapidly start
synthesizing cytokines. These cytokines can then be measured intracellularly by FCM
[60], visualized as spot forming colonies following secretion into a gel matrix containing
anti-cytokine antibodies [76], or detected by ELISA [77]. These methods both have the
advantage over the standard tetramer-binding assay that they directly measure the
functional responses of antigen-specific cells.
A potential problem with the cytokine production methods for quantifying the antigen-
specific lymphocyte populations are that a variety of different cytokines may be produced
by these cells on encounter with antigen. Conventionally, interferon-y (IFN-y) has been
measured by ELISPOT [61, 78] although this system can be used to detect other
cytokines such as interleukin-12 (IL-12) released from monocytes [79]. The flow
cytometric technique has also predominantly measured type-1 cytokine responses.
21

including tumour necrosis factor-a (TNF-a) [80]. However, focusing on such responses
ignores other cytokines that may be produced and therefore may underestimate the total
number of antigen-specific cells. This is a particularly important shortfall of the ELISPOT
method where only one cytokine response is measured. The FCM method has the
advantage of being able to discriminate a variety of different cytokine responses in
addition to providing a phenotypic analysis of responding cells. Whilst current flow
cytometers widely available on the market are set up for three of four colour analysis,
industry is rapidly responding with interest to this powerful tool. As a result machines are
in use that can perform 11 colour analysis, enabling the measurement of a large number
of different cytokine responses in addition to phenotyping the responding cells [81]. It is
likely that in the future cheaper multi-parameter flow cytometers will become widely
available.
The major advantage of the cytokine-production methods over the tetramer assay for
the detection of antigen-specific lymphocytes is that both CD4 and CD8 lymphocyte
responses can be measured. In these assays the size of the stimulating antigen
determines which T lymphocytes are preferentially stimulated. Complex antigens are
phagocytosed and then presented in the context of class-2 MHC molecules [82]. Studies
using peptides, rather than complex soluble antigens have demonstrated that larger
peptides of 15 amino acids or more stimulate CD4 lymphocyte responses whilst CD8
responses are optimally stimulated by short peptides of between 8-12 amino acids [83].
By constructing overlapping libraries of peptides of varying lengths to use as the
stimulating antigens the sum total of the CD4 and CD8 responses can be estimated [83,
84]. This technique has the great advantage that it overcomes the problem of HLA-
restriction of responses.
Nevertheless, despite the proliferation of recent studies examining antigen-specific
responses, these have been, with few exceptions [85] confined to looking at whole
blood, or peripheral blood mononuclear cells (PBMC). In particular, there have been few
attempts to examine antigen-specific responses in the lung, despite the high burden of
pulmonary pathology. The reason behind this undoubtedly relates to the difficulty in
obtaining lung specimens for examination when compared to the ease of evaluating
peripheral blood. The investigation of lung responses in humans requires a BAL
specimen in order to obtain sufficient leukocytes for immunological analysis. Fortunately,
BAL is often routinely performed in cases with suspected respiratory infections where a
diagnosis is not rapidly obtained from sputum samples or where an unusual organism.
22

such as mycobacterium tuberculosis is suspected. The threshold for performing BAL is
lower in immunocompromised patients because the range of potential pathogens is
greater and the treatment options are more complex. Therefore, BAL performed on
these patients should provide an adequate specimen for both routine laboratory testing
in microbiology, virology and cytology in addition to an aliquot for cellular analysis.
1.4 Overview of recent developments in understanding lung
immune responsesAn integrative understanding of lung immune responses has been elusive, in part due
to the paucity of knowledge of the role played by antigen-presenting dendritic cells (DC)
in orchestrating the immune response. Animal studies have demonstrated that DC reside
throughout the respiratory tract in epithelial tissue [86] and more recently the function of
DC s has been more clearly defined.
It is now well documented that DC s determine the type of immunological response
by secreting cytokines that influence the subsequent development of CD4 and CDS
effector phenotypes. Interleukin 12 (IL-12) is the key cytokine determining differentiation
towards Th1 responses [87-89] and interleukin-10 (IL-10) drives Th2 responses. The
signals that encourage these critical cytokines to be produced by DCs are unclear,
however, there is evidence that lung DCs in the rat preferentially stimulate Th2
responses and require additional signals such as TN F-a to switch to IL-12 production
[90]. Furthermore, there is a growing body of evidence demonstrating that IL-12
production can be suppressed by a variety of microenvironmental tissue factors such as
prostaglandin E2 (PGE2) [91], nitrous oxide [92] and histamines [93], as well as by drugs
such as P2 agonists [94]. Although these studies were performed on blood monocytes
and macrophages rather than alveolar cells, the findings are suggestive that a number of
different mechanisms exist in vivo to control Thi responses.
It has been argued that type-1 immune responses in such a delicate tissue as the
lung must be carefully controlled as the foreign antigen load is high and there is a
potential for damaging the fragile alveolar compartment vital for gas exchange [95].
Indeed, sarcoidosis, a disease characterized by strong type-1 responses and granuloma
formation in the lung is associated with lung fibrosis, a restrictive lung defect and
eventual respiratory failure in severe cases.
23

Most of the studies of DC and macrophage function have been performed on cells
isolated from lung epithelial tissue sections in animal models. However, most antigens
that escape the mucociliary escalator in the large airways will be likely to first encounter
alveolar macrophages that comprise approximately 90-95% of the alveolar cells [39].
These cells phagocytose the antigens, but their role as antigen presenters is uncertain.
Several studies have suggested that these cells are poor antigen presenters and argue,
like Holt, that this could be an adaptive response to minimise lung injury [96, 97].
However, other investigators have demonstrated that alveolar macrophages are good
antigen presenting cells [98]. Recently, this issue has been resolved by the
demonstration of low percentages of cells with phenotypic and functional characteristics
of DCs that were distinct from the main macrophage population from BAL in humans [99,
100]. It is likely that following lung infection, DC recruitment into BAL from epithelial
tissue is enhanced. Evidence from animal models suggests that this population of DCs
that is initially rare can be increased dramatically by intratracheal BCG inoculation [101].
Intriguingly, infection with BCG or with live mycobacterium tuberculosis (MTB) also
resulted in maturation and activation of the DCs [101-103].
Taken together, these findings suggest that antigen presentation occurs
predominantly in the alveolar space. It is likely that signals, such as TNF-a and GM-CSF
released by macrophages that have phagocytosed antigen encourage both the migration
into and the maturation of DCs in the alveoli. The antigen-loaded DCs must then migrate
back into lung epithelial tissues and thence to the regional lymph nodes. The key events
taking place in the immune response to mycobacteria are summarised in figure 1.2
Within the draining lymph nodes the key aspects of lymphocyte recruitment,
proliferation and maturation into effector cells is determined. The role of chemokines in
the recruitment of lymphocytes both to the lymph nodes and then to the lung is becoming
better understood [104, 105] and clearly plays a crucial role in the inflammatory
response. Of considerable interest has been the recent discovery that the chemokine
receptor CCR7, which is expressed on naïve and a subset of memory T cells is also
upregulated during DC maturation [106]. The localization of naïve T cells and DCs in the
lymph node is then mediated by the expression of two T cell zone expressed
chemokines, secondary lymphoid tissue chemokine (SLC) and EBL1 ligand chemokine
(ELC) which bind to CCR7 [107, 108]. Thus brought together in the T cell zones of the
24

Figure 1.2
GranulomaTB
AM AMAlveolar space
ifn -y ( e • TNF-a \T cell
TNF-a
DC DC
DC DC
IL-12
m atu ration proliferation
T cell
T cellBALTLung interstitium
Blood
J cel T cell J cell
Figure 1.2
Cartoon of immune response to Mycobacterium tuberculosis (TB). Macrophages
release TNF-a on encounter with TB, resulting in migration into and maturation of
dendritic cells (DC) in the alveolar space. Antigen-loaded DC orchestrate antigen-
specific naïve and memory T cells maturation to effector cells in bronchial
associated lymphoid tissue (BALT) under the influence of IL-12. Secretion of IFN-y
and TNF-a by T cells are crucial for the formation of granulomas to control TB.
25

lung lymph nodes, naïve CD4 and CD8 T lymphocytes that recognize antigen presented
in the context of relevant class-1 and class-2 MHC on mature DCs will undergo
proliferation. These proliferating, antigen-specific lymphocytes then develop their effector
phenotype under the influence of the DC derived cytokines, IL-12 or IL-10. Consequent
upon encounter with antigen, CD4 and CD8 lymphocytes undergo changes in their
surface markers as well as in their expression of cytokines. The CD45 isoform changes
from RA+ RO- to RA- R0+ [109, 110] and in CD8 lymphocytes there is a progressive
loss of CD27 [111, 112]. Both CD4 and CD8 lymphocytes emigrating from the lymph
nodes lose CCR7 expression [113].
One of the final important pieces in the immunological jigsaw puzzle has been the
discovery of chemokine receptors on different lymphocyte subsets that mediate the
recruitment of these cells to the sites of infection or inflammation. CD8 Lymphocytes with
predominant Thi characteristics have been demonstrated to express CXCR3 receptors
and to accumulate in the lungs of HIV infected subjects [114]. By contrast Th2 type
lymphocytes may preferentially express receptors for different chemokines such as
CCR3 and CCR4[104].
These studies, taken as a whole have contributed greatly to our understanding of the
immune response to pathogens in the lung. A picture has emerged of the role of antigen
presenting cells, interactions in regional lymph nodes and the recruitment and
differentiation of lymphocytes to the lung. However, there have been only a few attempts
to characterize the antigen-specific lymphocyte populations in the lung.
The immune responses to tuberculosis in the lung are undoubtedly the best studied
of all lung infections in humans. Investigators have examined the different leukocyte
populations found in radiologically normal and abnormal lung [41, 115], thus giving
insights into the pathogenesis of the disease. More interestingly, two studies have
estimated the antigen-specific component of the lung responses by measuring
lymphocyte proliferation to TB antigens. Both studies separated T lymphocytes from
BAL and incubated them with either irradiated PBMC or isolated autologous monocytes
in the presence of various MTB antigens. Increased proliferative responses to
tuberculosis antigens in BAL, but not PBMC measured by [^H]-methyl thymidine
incorporation were demonstrated when T cells from TB patients were incubated with TB
antigens [116, 117].
26

These complex experimental designs presumably reflected fears that the
macrophages from BAL would suppress the antigen-specific responses. Indeed, in one
of the studies the authors demonstrated that addition of alveolar macrophages
suppressed the BAL I cell proliferative responses to phytohaemaglutinin (PHA) from TB
patients [117]. The later study also used an ELISPOT system to measure IFN-y, IL-4
and IL-10 responses to PPD a in a subgroup of six patients. This is the first study to
utilize one of the new antigen-specific techniques to examine lung immune responses.
The authors demonstrated increased IFN-y spot-forming colonies in the BAL from TB
patients, but not from BAL from healthy subjects [117]. In three patients with TB, BAL
was taken from radiologically unaffected areas of the lung and in these samples the
number of spot-forming colonies were similar to those in the healthy controls. In this
paper the dominance of anti-TB responses in the lung, but not in the blood has been
clearly demonstrated by both the proliferative assays and the ELISPOT tests.
However, the ELISPOT system may not be the optimum technique for the delineation
of BAL antigen-specific lung responses. The proportions of lymphocytes and the
CD4/CD8 ratios may be highly variable in BAL from patients with active TB [40, 115].
Since complex antigens such as PPD will predominantly stimulate CD4 lymphocytes in
the short incubation period of the ELISPOT assay, then the number of spots detected by
this method will be depend on the proportion of CD4 lymphocytes in the BAL sample.
For example, a low number of spot-forming colonies could be obtained from BAL from a
tuberculous cavity in which the predominant leukocyte subset are neutrophils and only a
small proportion CD4 lymphocytes. In fact, the proportion of antigen-specific CD4
lymphocytes from such a sample could be very high but this would be more accurately
determined by a flow cytometric system.
A flow cytometric experimental system has been used to examine lymphocyte
responses in the lung from mice infected with MTB [118]. Following intravenous
inoculation with M. tuberculosis, lungs and spleens were removed at different time points
following infection and mononuclear cells separated by density centrifugation. The tissue
cells were then incubated with brefeldin A to prevent the secretion of cytokines and the
cells were stimulated with phorbol 12-myristate 13-acetate (PMA) and ionomycin.
Following incubation, the cells were permeabilised and intracellular cytokine staining in
combination with surface staining for CD4 and CD8 was performed. The proportion of
IFN-y producing T lymphocytes from the lung and spleen were then measured by FCM.
27

In resistant C57BL/6 mice infected with virulent M. tuberculosis, there was an early
and persistent production of IFN-y by CD4 and CD8 lymphocytes in the lung that
controlled the mycobacteria. By contrast, in susceptible mice, these IFN-y producing
responses in the lung were both delayed and attenuated, and there was failure to control
the mycobacterial load. This study elegantly demonstrates the importance of IFN-y
producing lymphocytes in the control of TB in a murine model and supports the previous
studies using IFN-y knockout mice [119]. However, in this study lymphocyte activation
was achieved in cells taken from the Tb-infected mice by using phorbol mystral acetate
(PMA) and ionomycin instead of specific antigens in order to boost cytokine synthesis.
The use of such powerful immune activators may by-pass certain physiological steps
that occur in antigen-specific systems and therefore these observations may generate a
misleading picture of the true antigen-specific cytokine response.
The conclusion of this review is therefore that the technology exists for the detection
of antigen specific responses in a tissue fluid such as BAL. A consideration of the merits
and disadvantages of each method has led to the conclusion that the optimum technique
is to detect intracellular cytokine synthesis following incubation with antigen by flow
cytometry. This is because the ELISPOT assay suffers from the lack of information about
the type of cells that respond by cytokine synthesis and the detection of only one
cytokine in the secreted product. This is likely to make this method far less sensitive than
FCM when using a tissue fluid such as BAL as the proportion of lymphocytes may be
highly variable during episodes of respiratory disease. The limitations imposed by HLA-
restriction and the current inability to measure CD4 lymphocyte responses that would
require class-2 tetramers excludes the direct antigen binding assays from use in this
investigation.
1.5 Summary of rationale and aimsStudies from the 1980’s, that focused on the lung as a target of immunological
investigation have confirmed that the lymphocyte responses in BAL differ considerably
from those in the blood. This holds true both for the simple lymphocyte percentages and
CD4/CD8 ratios demonstrated in sarcoidosis and also for the recently published fledgling
antigen-specific studies in patients with tuberculosis. These early comparative studies in
patients with sarcoidosis have demonstrated close correlations between the lymphocyte
percentages in BAL and those seen in biopsy specimens from the lung interstitium.
28

Consequently, samples of BAL can be regarded as a ‘window’ for lung immunity. From
these findings a strong case can be made that lymphocyte responses in BAL are likely to
be especially informative both in terms of understanding immune responses to
pathogens and also as diagnostic tools.
These investigations into lung immune responses are particularly topical due to the
recent development of exciting new techniques in the field of immunology. The most
important of these has been the ability to precisely and rapidly detect antigen-specific
responses and flow cytometry has emerged as optimum tool for this purpose.
The main impetus for this thesis was the exploration of the immune responses to
pathogens in BAL by flow cytometry. Encompassing this broad aim were three
objectives. First, to establish a simple and reliable panel for the detection of the most
clinically relevant parameters in BAL by flow cytometry. This was an important primary
objective since a narrow focus on lymphocytes alone would have ignored other
leukocyte responses that are relevant both for immunopathological and diagnostic
reasons.
The second objective was to examine more closely T lymphocyte differentiation by
investigating the various phenotypic alternatives of these populations during bacterial
and viral infections in the lung and the blood. Although it has been previously
demonstrated that the lung serves as a repository for T cells of ‘memory’ type, it has not,
so far, been investigated whether these cells can undergo local stimulation and show
special alterations in phenotypic and activation markers. Such investigations are timely
in the light of recent advances that have generated a more complete picture of
lymphocyte differentiation patterns.
The third objective was to introduce the tests of antigen-driven stimulation of cytokine
synthesis into clinical diagnosis using BAL samples. In this area the most important task
was to assess whether such as system would be relevant for the diagnosis of
tuberculosis.
Altogether, these objectives represent the first comprehensive array of technical
innovations that aim to place clinical flow cytometry of the lung using BAL samples into
the realms of practical thoracic medicine.
1.6 References
29

1. Dye C, Scheele S, Dolin P, et al. Consensus statement. Global burden of
tuberculosis: estimated incidence, prevalence, and mortality by country. WHO
Global Surveillance and Monitoring Project. JAMA 1999;282:677-86.
2. Styblo K. Epidemiology of tuberculosis. Vol. 24. The Hague, 1991 Royal
Netherlands Tuberculosis Association Selected Papers
3. Mitchison DA. The action of antituberculosis drugs in short-course chemotherapy.
Tubercle 1985;66:219-25.
4. Harries AD, Hargreaves NJ, Kemp J, et al. Deaths from tuberculosis in sub-
Saharan African countries with a high prevalence of HIV-1. Lancet
2001;357:1519-23.
5. Drobniewski FA, Pozniak AL and Uttley AH. Tuberculosis and AIDS. J Med
Microbiol 1995;43:85-91.
6. Wilkinson D. High-compliance tuberculosis treatment programme in a rural
community. Lancet 1994;343:647-8.
7. Wilkinson D, Anderson E, Davies GR, et al. Efficacy of twice weekly treatment for
tuberculosis given under direct observation in Africa. Trans R Soc Trop Med Hyg
1997;91:87-9.
8. Floyd K, Wilkinson D and Gilks C. Comparison of cost effectiveness of directly
observed treatment (DOT) and conventionally delivered treatment for
tuberculosis: experience from rural South Africa. BMJ 1997;315:1407-11.
9. Nunn P. The global control of tuberculosis: what are the prospects? Scand J
Infect Dis 2001 ;33:329-32.
10. Douglas RM. Acute respiratory infections in children in the developing world.
Semin Respir Infect 1991;6:217-24.
11. Sow O, Frechet M, Diallo AA, et al. Community acquired pneumonia in adults: a
study comparing clinical features and outcome in Africa (Republic of Guinea) and
Europe (France). Thorax 1996;51:385-8.
12. Peebles RS, Jr., Hartert TV. Respiratory viruses and asthma. Curr Opin Pulm
Med 2000;6:10-4.
13. Papadopoulos NG, Johnston SL. The role of viruses in the induction and
progression of asthma. Curr Allergy Asthma Rep 2001;1:144-52.
14. Glezen WP, Greenberg SB, Atmar RL, et al. Impact of respiratory virus infections
on persons with chronic underlying conditions. JAMA 2000;283:499-505.
30
15. UNAIDS. AIDS epidemic update: December 2001.
www.unaids.org/epidemic_update/report_dec2001/index.html accessed 050602
16. WHO. Tuberculosis: Strategy and operations.
www.who.int/gtb/policyrd/TBHIV.htm accessed 050602.
17. Fine PE, Small PM. Exogenous reinfection in tuberculosis. N Engl J Med
1999;341:1226-7.
18. Sutherland I. Recent studies in the epidemiology of tuberculosis, based on the
risk of being infected with tubercle bacilli. Adv Tuberc Res 1976;19:1-63.
19. Selwyn PA, Sckell BM, Alcabes P, et al. High risk of active tuberculosis in HIV-
infected drug users with cutaneous anergy. JAMA 1992;268:504-9.
20. Allen S, Batungwanayo J, Kerlikowske K, et al. Two-year incidence of
tuberculosis in cohorts of HIV-infected and uninfected urban Rwandan women.
Am Rev Respir Dis 1992;146:1439-44.
21. Antonucci G, Girardi E, Raviglione MC and Ippolito G. Risk factors for
tuberculosis in HIV-infected persons. A prospective cohort study. The Gruppo
Italiano di Studio Tubercolosi e AIDS (GISTA). JAMA 1995;274:143-8.
22. Rose AM, Watson JM, Graham C, et al. Tuberculosis at the end of the 20th
century in England and Wales: results of a national survey in 1998. Thorax
2001;56:173-9.
23. Del Amo J, Petruckevitch A, Phillips AN, et al. Risk factors for tuberculosis in
patients with AIDS in London: a case-control study. IntJ Tuberc Lung Dis
1999;3:12-7.
24. Bowen EF, Rice PS, Cooke NT, et al. HIV seroprevalence by anonymous testing
in patients with Mycobacterium tuberculosis and in tuberculosis contacts. Lancet
2000;356:1488-9.
25. Drobniewski F. Is death inevitable with multiresistant TB plus HIV infection?
Lancet 1997;349:71-2.
26. Guidelines for prophylaxis against Pneumocystis carinii pneumonia for persons
infected with human immunodeficiency virus. MMWR Morb Mortal Wkly Rep
1989;38 SuppI 5:1-9
27. Barry SM, Johnson MA. Pneumocystis carinii pneumonia: a review of current
issues in diagnosis and management. HIV Mecf 2001;2:123-32.
28. Gilks CF. Acute bacterial infections and HIV disease. Br Med Bull 1998;54:383-
93.
31

29. Moroni M, Franzetti F. Bacterial pneumonia in adult patients with HIV infection. J
C/?emof/7er 1995;7:292-306.
30. Gilks CF, Brindle RJ, Otieno LS, et al. Life-threatening bacteraemia in HIV-1
seropositive adults admitted to hospital in Nairobi, Kenya. Lancet 1990;336:545-
9.
31. Frankel RE, Virata M, Hardalo C, et al. Invasive pneumococcal disease: clinical
features, serotypes, and antimicrobial resistance patterns in cases involving
patients with and without human immunodeficiency virus infection. Clin Infect Dis
1996;23:577-84.
32. Millar AB, Patou G, Miller RF, et al. Cytomegalovirus in the lungs of patients with
AIDS. Respiratory pathogen or passenger? Am Rev Respir Dis 1990;141:1474-7
33. d'Arminio Monforte A, Mainini F, Testa L, et ai. Predictors of cytomegalovirus
disease, natural history and autopsy findings in a cohort of patients with AIDS.
Aids 1997;11:517-24
34. Barry SM, Lipman MC, Johnson MA and Prentice HG. Respiratory infections in
immunocompromised patients. Curr Opin Pulm Med 1999;5:168-73.
35. Zeevi A, Morel P, Spichty K, et ai. Clinical significance of CMV-specific I helper
responses in lung transplant recipients. Hum Immunol 1998;59:768-75
36. Semenzato G, Chilosi M, Ossi E, et ai. Bronchoalveolar lavage and lung
histology. Comparative analysis of inflammatory and immunocompetent cells in
patients with sarcoidosis and hypersensitivity pneumonitis. Am Rev Respir Dis
1985;132:400-4.
37. Campbell DA, Poulter LW and du Bois RM. Immunocompetent cells in
bronchoalveolar lavage reflect the cell populations in transbronchial biopsies in
pulmonary sarcoidosis. Am Rev Respir Dis 1985;132:1300-6.
38. Drent M, Wagenaar SS, Mulder PH, et ai. Bronchoalveolar lavage fluid profiles in
sarcoidosis, tuberculosis, and non-Hodgkin's and Hodgkin's disease. An
evaluation of differences. Chest 1994;105:514-9.
39. Bronchoalveolar lavage constituents in healthy individuals, idiopathic pulmonary
fibrosis, and selected comparison groups. The BAL Cooperative Group Steering
Committee. Am Rev Respir Dis 1990;141:8169-202.
40. Hoheisel GB, Tabak L, Teschler H, et ai. Bronchoalveolar lavage cytology and
immunocytology in pulmonary tuberculosis. Am J Respir Crit Care Med
1994;149:460-3.
32

41. Ainslie GM, Solomon JA and Bateman ED. Lymphocyte and lymphocyte subset
numbers in blood and in bronchoalveolar lavage and pleural fluid in various forms
of human pulmonary tuberculosis at presentation and during recovery. Thorax
1992;47:513-8.
42. Baughman RP, Dohn MN, Loudon RG and Frame FT. Bronchoscopy with
bronchoalveolar lavage in tuberculosis and fungal infections. Chest 1991;99:92-
7.
43. Poletti V, Cazzato 8, Minicuci N, at a/. The diagnostic value of bronchoalveolar
lavage and transbronchial lung biopsy in cryptogenic organizing pneumonia. Eur
Respir J 1996;9:2513-6.
44. Hunninghake GW, Kawanami O, Ferrans VJ, et al. Characterization of the
inflammatory and immune effector cells in the lung parenchyma of patients with
interstitial lung disease. Am Rev Respir Dis 1981;123:407-12.
45. Haslam PL, Poulter LW, Rossi GA, et al. The clinical role of BAL in idiopathic
pulmonary fibrosis. Eur Respir J 1990;3:940-2, 961-9.
46. Costabel U, Guzman J. Bronchoalveolar lavage in interstitial lung disease. Curr
Opin Pulm Med 2001 ;7:255-61.
47. Mandy F NJ, Autran B and Janossy G. T-Cell Subset Counting and Fight Against
AIDS: Reflections Over a 20-Year Struggle. Clinical Cytometry 2002;50:39-45
48. Loken MR, Brosnan JM, Bach BA and Ault KA. Establishing optimal lymphocyte
gates for immunophenotyping by flow cytometry. Cytometry 1990;11:453-9.
49. Glencross DK SL, Jani IV, Barnett D and Janossy G. CD45-Assisted
Panleukogating for Accurate, Cost-Effective Dual-Platform CD4+ T-Cell
Enumeration. Cytometry (Clinical Cytometry) 2002;50:69-78
50. Janossy G Jl, Kahan M, Barnett D, Mandy F, and Shapiro H. Precise CD4 T-Cell
Counting Using Red Diode Laser Excitation: For Richer, for Poorer. Cytometry
(Clinical Cytometry) 2002;50:78-85.
51. Pizzolo G, Sloane J, Beverley P, et ai. Differential diagnosis of malignant
lymphoma and nonlymphoid tumors using monoclonal anti-leucocyte antibody.
Cancer 1980;46:2640-7.
52. Gatter KC, Abdulaziz Z, Beverley P, et al. Use of monoclonal antibodies for the
histopathological diagnosis of human malignancy. J Clin Pathol 1982;35:1253-67.
33

53. Padovan CS, Behr J, Allmeling AM, et al. Immunophenotyping of lymphocyte
subsets in bronchoalveolar lavage fluid. Comparison of flow cytometric and
immunocytochemical techniques. J Immunol Methods 1992;147:27-32.
54. Brandt B, Thomas M, von Eiff M and Assmann G. Immunophenotyping of
lymphocytes obtained by bronchoalveolar lavage: description of an all-purpose
tricolor flow cytometric application. J Immunol Methods 1996;194:95-102.
55. Dauber JH, Wagner M, Brunsvold S, et al. Flow cytometric analysis of
lymphocyte phenotypes in bronchoalveolar lavage fluid: comparison of a two-
color technique with a standard immunoperoxidase assay. Am J Respir Cell Mol
B/o/1992;7:531-41.
56. Aubin JE. Autofluorescence of viable cultured mammalian cells. J Histochem
Cytochem 1979;27:36-43.
57. Umino I , Skold CM, Pirruccello SJ, et al. Two-colour flow-cytometric analysis of
pulmonary alveolar macrophages from smokers. Eur Respir J 1999;13:894-9.
58. Pulford KA, Rigney EM, Micklem KJ, et al. KP1 : a new monoclonal antibody that
detects a monocyte/macrophage associated antigen in routinely processed tissue
sections. J Clin Pathol 1989;42:414-21.
59. Altman JD, Moss PAH, Goulder PJR, et al. Phenotypic analysis of antigen-
specific T lymphocytes Science 1996;274:94-6
60. Maine VC, Picker LJ. Identification of functional subsets by flow cytometry:
intracellular detection of cytokine expression. Cytometry 1998;34:207-15
61. Rowland-Jones SL, Dong T, Fowke KR, et al. Cytotoxic T cell responses to
multiple conserved HIV epitopes in HIV-resistant prostitutes in Nairobi. J Clin
Invest 1998;102:1758-65.
62. Callan MF, Tan L, Annels N, et al. Direct visualization of antigen-specific CD8+ T
cells during the primary immune response to Epstein-Barr virus In vivo. J Exp
/Wed 1998;187:1395-402
63. Ogg GS, Jin X, Bonhoeffer 8, et al. Quantitation of HIV-1-specific cytotoxic T
lymphocytes and plasma load of viral RNA. Science 1998;279:2103-6
64. Matsui K, Boniface JJ, Steffner P, et al. Kinetics of T-cell receptor binding to
peptide/l-Ek complexes: correlation of the dissociation rate with T-cell
responsiveness. Proc Natl Acad Sci U S A 1994;91:12862-6.
65. Valitutti 8, Muller 8, Celia M, et al. 8erial triggering of many T-cell receptors by a
few peptide-MHC complexes. Nature 1995;375:148-51.
34

66. McMichael AJ, O'Callaghan CA. A new look at T cells. J Exp Med
1998;187:1367-71.
67. Novak EJ, Liu AW, Gebe JA, at a i Tetramer-guided epitope mapping: rapid
identification and characterization of immunodominant CD4+ T cell epitopes from
complex antigens. J Immunol 2001;166:6665-70.
68. Gallimore A, Glithero A, Godkin A, at a i Induction and exhaustion of lymphocytic
choriomeningitis virus-specific cytotoxic T lymphocytes visualized using soluble
tetrameric major histocompatibility complex class l-peptide complexes. J Exp
/Wed 1998;187:1383-93.
69. Zajac AJ, Blattman JN, Murali-Krishna K, at a i Viral immune evasion due to
persistence of activated T cells without effector function. J Exp Mad
1998;188:2205-13.
70. Lee PP, Yee C, Savage PA, at a i Characterization of circulating T cells specific
for tumor-associated antigens in melanoma patients. Nat Mad 1999;5:677-85.
71. Appay V, Nixon DF, Donahoe SM, at a i HIV-specific CD8(+) T cells produce
antiviral cytokines but are impaired in cytolytic function. J Exp Mad 2000;192:63-
75
72. Bitmansour AD, Waldrop SL, Pitcher CJ, at a i Clonotypic structure of the human
CD4+ memory T cell response to cytomegalovirus. J Immunol 2001;167:1151-63.
73. Cwynarski K, Ainsworth J, Cobbold M, at a i Direct visualization of
cytomegalovirus-specific T-cell reconstitution after allogeneic stem cell
transplantation. Blood 2001 ;97:1232-40.
74. Komanduri KV, Donahoe SM, Moretto WJ, at a i Direct measurement of CD4+
and CD8+ T-cell responses to CMV in HIV-1-infected subjects. Virology
2001;279:459-70.
75. Engstrand M, Tournay C, Peyrat MA, at a i Characterization of CMVpp65-specific
CD8+ T lymphocytes using MHC tetramers in kidney transplant patients and
healthy participants. Transplantation 2000;69:2243-50
76. Lalvani A, Brookes R, Hambleton S, at a i Rapid effector function in CD8+
memory T cells. J Exp Mad 1997;186:859-65.
77. Petrovsky N, Harrison LC. Cytokine-based human whole blood assay for the
detection of antigen-reactive T cells. J Immunol Methods 1995;186:37-46.
35

78. Lalvani A, Pathan AA, McShane H, et al. Rapid detection of Mycobacterium
tuberculosis infection by enumeration of antigen-specific T cells. Am J Respir Crit
Care Med 2001;163:824-8.
79. Ozenci V, Kouwenhoven M, Press R, et ai. IL-12 elispot assays to detect and
enumerate IL-12 secreting cells. Cytokine 2000;12:1218-24.
80. Badovinac VP, Harty JT. Intracellular staining for TNF and IFN-gamma detects
different frequencies of antigen-specific CD8(+) T cells. J immunoi Methods
2000;238:107-17.
81. De Rosa SC, Roederer M. Eleven-color flow cytometry. A powerful tool for
elucidation of the complex immune system, d in Lab Med 2001;21:697-712, vii.
82. Nakagawa TY, Rudensky AY. The role of lysosomal proteinases in MHC class II-
mediated antigen processing and presentation, immunoi Rev 1999;172:121-9.
83. Maecker H I, Dunn MS, Suni MA, et ai. Use of overlapping peptide mixtures as
antigens for cytokine flow cytometry. J immunoi Methods 2001;255:27-40.
84. Kern F, Faulhaber N, Frommel C, et ai. Analysis of CD8 T cell reactivity to
cytomegalovirus using protein-spanning pools of overlapping pentadecapeptides.
Eur J immunoi 2000;30:1676-82.
85. Tan LC, Mowat AG, Fazou C, et ai. Specificity of T cells in synovial fluid: high
frequencies of CD8(+) T cells that are specific for certain viral epitopes. Arthritis
Res 2000;2:154-64.
86. Schon-Hegrad MA, Oliver J, McMenamin PG and Holt PG. Studies on the
density, distribution, and surface phenotype of intraepithélial class II major
histocompatibility complex antigen (la)-bearing dendritic cells (DC) in the
conducting airways. J Exp Med 1991;173:1345-56.
87. Sinigaglia F, D'Ambrosio D, Panina-Bordignon P and Rogge L. Regulation of the
IL-12/IL-12R axis: a critical step in T-helper cell differentiation and effector
function, immunoi Rev 1999;170:65-72.
88. Murphy KM, Guyang W, Farrar JD, et ai. Signaling and transcription in T helper
development. Annu Rev immunoi 2000;18:451-94.
89. O'Garra A. Cytokines induce the development of functionally heterogeneous T
helper cell subsets, immunity 1998;8:275-83.
90. Stumbles PA, Thomas JA, Pimm CL, et ai. Resting respiratory tract dendritic cells
preferentially stimulate T helper cell type 2 (Th2) responses and require
36

obligatory cytokine signals for induction of Th1 immunity. J Exp Med
1998;188:2019-31.
91. van der Pouw Kraan TC, Boeije LC, Smeenk RJ, et al. Prostaglandin-E2 is a
potent inhibitor of human interleukin 12 production. J Exp Med 1995;181:775-9.
92. Huang FP, Niedbala W, Wei XQ, et al. Nitric oxide regulates Thi cell
development through the inhibition of IL-12 synthesis by macrophages. EurJ
Immunol 1998;28:4062-70.
93. van der Pouw Kraan TC, Snijders A, Boeije LC, et al. Histamine inhibits the
production of interleukin-12 through interaction with H2 receptors. J Clin Invest
1998;102:1866-73.
94. Panina-Bordignon P, Mazzeo D, Lucia PD, et al. Beta2-agonists prevent Thi
development by selective inhibition of interleukin 12. J Clin Invest
1997;100:1513-9.
95. Holt PG. Antigen presentation in the lung. Am J Respir Crit Care Med
2000;162:S151-6.
96. Chelen CJ, Fang Y, Freeman GJ, et al. Human alveolar macrophages present
antigen ineffectively due to defective expression of B7 costimulatory cell surface
molecules. J Clin Invest 1995;95:1415-21.
97. Blumenthal RL, Campbell DE, Hwang P, et al. Human alveolar macrophages
induce functional inactivation in antigen-specific CD4 T cells. J Allergy Clin
Immunol 2001;107:258-64.
98. Vecchiarelli A, Dottorini M, Pietrella D, et al. Role of human alveolar
macrophages as antigen-presenting cells in Cryptococcus neoformans infection.
Am J Respir Cell Mol Biol 1994; 11:130-7.
99. van Haarst JM, Hoogsteden HC, de Wit HJ, et al. Dendritic cells and their
precursors isolated from human bronchoalveolar lavage: immunocytologic and
functional properties. Am J Respir Cell Mol Biol 1994;11:344-50.
100. Havenith CE, van Haarst JM, Breedijk AJ, et al. Enrichment and characterization
of dendritic cells from human bronchoalveolar lavages. Clin Exp Immunol
1994;96:339-43.
101. Havenith CE, Breedijk AJ and Hoefsmit EC. Effect of Bacillus Calmette-Guerin
inoculation on numbers of dendritic cells in bronchoalveolar lavages of rats.
Immunobiology 1992;184:336-47.
37

102. Henderson RA, Watkins SC and Flynn JL. Activation of human dendritic cells
following infection with Mycobacterium tuberculosis. J Immunol 1997;159:635-43.
103. Demangel C, Bean AG, Martin E, et al. Protection against aerosol
Mycobacterium tuberculosis infection using Mycobacterium bovis Bacillus
Calmette Guerin-infected dendritic cells. Eur J Immunol 1999;29:1972-9.
104. D'Ambrosio D, Mariani M, Panina-Bordignon P and Sinigaglia F. Chemokines
and their receptors guiding T lymphocyte recruitment in lung inflammation. Am J
Respir Crit Care Med 2001 ; 164:1266-75.
105. Sinigaglia F, D'Ambrosio D. Regulation of helper T cell differentiation and
recruitment in airway inflammation. Am J Respir Crit Care Med 2000;162:S157-
60.
106. Sallusto F, Mackay CR and Lanzavecchia A. The role of chemokine receptors in
primary, effector, and memory immune responses. Annu Rev Immunol
2000;18:593-620.
107. Cyster JG. Leukocyte migration: scent of the I zone. Curr Biol 2000;10:R30-3.
108. Cyster JG. Chemokines and the homing of dendritic cells to the I cell areas of
lymphoid organs. J Exp Med 1999;189:447-50.
109. Akbar AN, Terry L, Timms A, et al. Loss of CD45R and gain of UCHL1 reactivity
is a feature of primed T cells. J Immunol 1988;140:2171-8.
110. Trowbridge IS, Thomas ML. CD45: an emerging role as a protein tyrosine
phosphatase required for lymphocyte activation and development. Annu Rev
Immunol 1994;12:85-116.
111. Hendriks J, Gravestein LA, Tesselaar K, et al. CD27 is required for generation
and long-term maintenance of T cell immunity. Nat Immunol 2000,^ :433-40.
112. Hamann D, Baars PA, Rep MH, et al. Phenotypic and functional separation of
memory and effector human CD8+ T cells. J Exp Med 1997;186:1407-18.
113. Sallusto F, Lenig D, Forster R, et al. Two subsets of memory T lymphocytes with
distinct homing potentials and effector functions. Nature 1999;401:708-12.
114. Agostini C, Facco M, Siviero M, et al. CXC chemokines IP-10 and mig expression
and direct migration of pulmonary CD8+/CXCR3+ T cells in the lungs of patients
with HIV infection and T-cell alveolitis. Am J Respir Crit Care Med
2000;162:1466-73.
38

115. Condos R, Rom WN, Liu YM and Schluger NW. Local immune responses
correlate with presentation and outcome in tuberculosis. Am J Respir Crit Care
Med 1998;167:729-35.
116. Faith A, Schellenberg DM, Rees AD and Mitchell DM. Antigenic specificity and
subset analysis of T cells isolated from the bronchoalveolar lavage and pleural
effusion of patients with lung disease. Clin Exp Immunol 1992;87:272-8.
117. Schwander SK, Torres M, Sada E, et ai. Enhanced responses to Mycobacterium
tuberculosis antigens by human alveolar lymphocytes during active pulmonary
tuberculosis. J Infect Dis 1998;178:1434-45.
118. Chackerian AA, Perera TV and Behar SM. Gamma interferon-producing CD4+ T
lymphocytes in the lung correlate with resistance to infection with Mycobacterium
tuberculosis. Infect Immun 2001;69:2666-74.
119. Flynn JL, Chan J, Triebold KJ, et al. An essential role for interferon gamma in
resistance to Mycobacterium tuberculosis infection. J Exp Med 1993;178:2249-
54.

2. Chapter 2
Methods
40

2.1 IntroductionThe methods described in this chapter cover the techniques used in the thesis as a
whole. Bronchoscopy and cytospin preparation are comrnonly used and the details of
these methods are well established and therefore given only a brief description here. By
contrast, considerable attention has been devoted in this thesis to describing flow
cytometry in general and CD45-directed gating in particular. The method for determining
antigen-specific analysis in BAL has also been described in detail including modifications
of this technique to enable it to be applied to tissue fluids such as BAL.
2.2 FIbreoptic bronchoscopy and bronchoalveolar lavageBronchoscopy was performed in a fully equipped endoscopy suite at the Royal Free
Hospital. British Thoracic Society (BTS) guidelines [1] regarding the safe practice of
bronchoscopy were adhered to. Bronchoscopies were generally performed through the
oral, rather than nasal approach which was more comfortable for the patient.
Bronchoalveolar lavage (BAL) was performed with a maximum of 200ml of warmed,
sterile 0.9% normal saline introduced in aliquots of 20 or 30ml. The bronchoscope was
wedged into a subsegmental bronchus directed to an area of radiological abnormality. In
patients or control subjects with radiologically normal lung parenchyma, standard BAL
was performed from the right middle lobe.
Bottles for acquiring BAL were siliconized glass containers that had been autoclaved
to ensure sterility prior to the procedure. Immediately following acquisition of the sample,
the bottles were placed on ice and sent to the laboratory.
2.3 Preparation of BALThe BAL specimen was kept on ice and all samples were analysed within two hours of
their acquisition. BAL was performed for the investigation of respiratory disease and the
appropriate samples were therefore sent to the relevant diagnostic laboratories. BAL
specimens were divided, placed into universal containers and sent to microbiology,
cytology and virology laboratories in most cases. The remaining BAL was used for
immunological analysis. BAL was centrifuged at 430g for 8 minutes and decanted. The
pellet was resuspended in phosphate buffered saline (PBS) and filtered through a
100pm filter (CellTricks, Partec GmBH, Munster, Germany) and centrifuged again. The
pellet was resuspended up to 1ml in either culture medium (RPMI 1640 with 10% PCS)
41

or PBS depending on whether simple leukocyte differentials were to be determined or
whether further culture and functional assays were planned.
2.4 CytospinsCytospin preparations were made in order to obtain BAL leukocyte differentials which
could then be compared with those obtained by a flow cytometric method. Following the
washing and filtering of BAL described in 2.3 above, an absolute cell count of the
number of leukocytes/ml was obtained using the CytoronAbsolute flow cytometer (see
below). A 50|xl aliquot of the BAL suspension containing 3-5 X 10® cells/ml was then
used to prepare a cytospin slide by standard methods. 50pl of BAL was introduced onto
glass microscope slides placed within a cytospin machine (Shandon cytospin 11,
Shandon scientific Ltd, Runcorn, UK) and spun for two minutes at 800 rpm. The slides
were then air-dried for one hour and fixed for ten minutes in a 50:50 mixture of
chloroform and acetone before air drying again.
The slides were then stained using a modified May-Grunwald Giemsa stain
(DiffQuik), left to dry and then mounted in DPX (BDH Chemicals Ltd, Poole, Dorset).
Formal cell differentiation into lymphocytes, alveolar macrophages, neutrophils,
eosinophils and any other cell types was then performed by light microscopy (figure 2.1)
by an expert cytologist. 500 leukocytes were counted per sample and the leukocyte
differentials recorded.
2.5 Immunofluoresence stainingIn several samples, immunofluoresence staining was performed on cytospin
preparations in order to validate the use of antibodies to discriminate eosinophils and
neutrophils by FCM. Cytospins were made as described above but were not fixed and
dried. Immunofluoresence staining was performed in a moist staining chamber to ensure
that the cytospins did not dry out. 50pl of the following antibodies: CD15 FITC (Dako,
Ely, UK) and CD23 FITC (Caltag Medsystems, Towcester, UK) both at a dilution of 1:10
with PBS were added to the cytospin preparations. Staining was performed in the dark
for 45 minutes and then the cytospins were washed twice with PBS before fixing in 4%
paraformaldehyde for five minutes. After fixation, the slides were washed again with PBS
and then examined using a fluorescence microscope with barrier filters appropriate for
FITC conjugated antibody staining.
42

Figure 2.1
#
Lymphocyte
W
Macrophage m
Neutrophil% t f t \
#* \
Eosinophil
m
Figure 2.1
Digital photographs of stained cytospin preparations from BAL at 400x
magnification. The morphological and staining characteristics of the major BAL
cell populations-alveolar macrophages, lymphocyte and neutrophils (a) and
eosinophils (b) are shown.
43
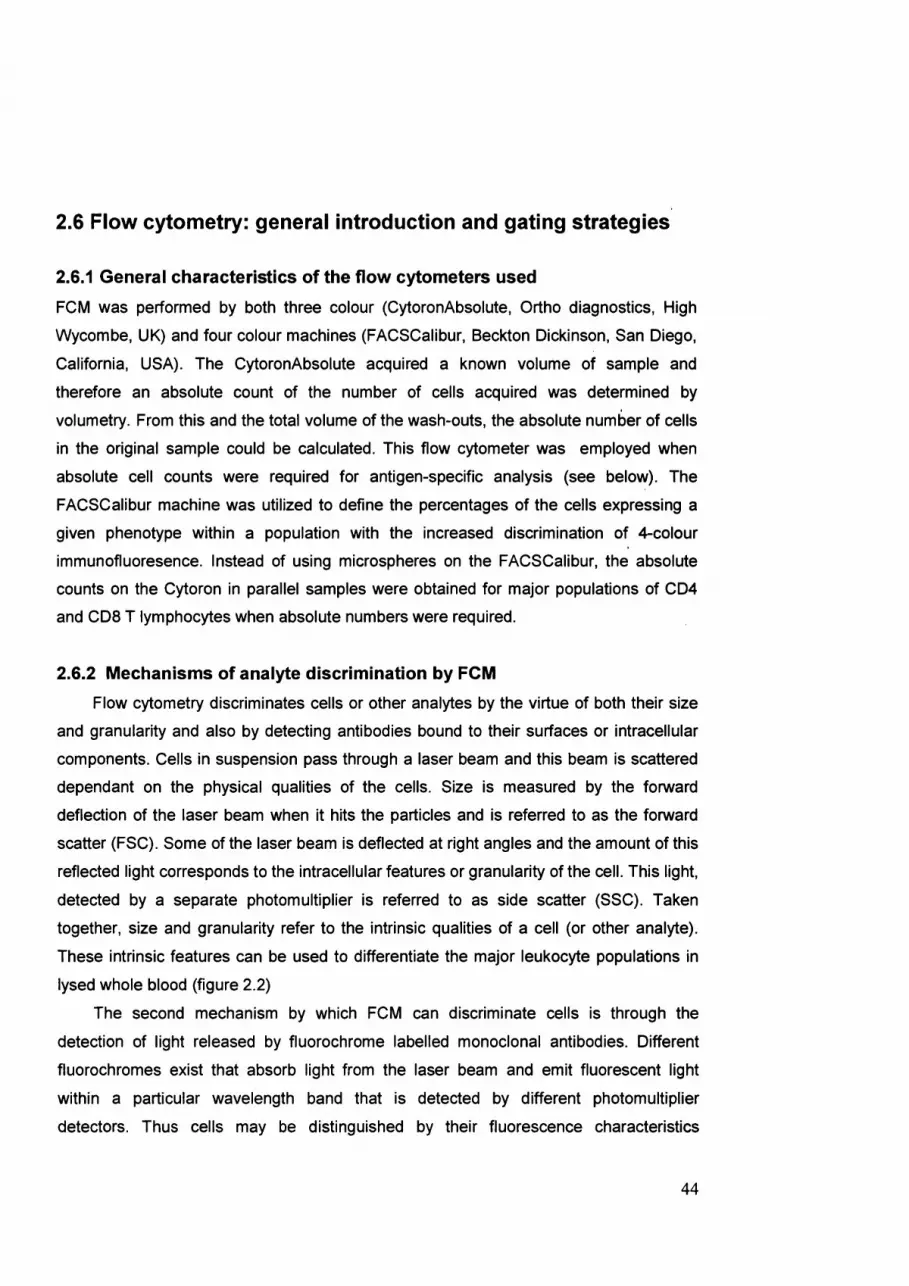
2.6 Flow cytometry: general introduction and gating strategies
2.6.1 General characteristics of the fiow cytometers used
FCM was performed by both three colour (CytoronAbsolute, Ortho diagnostics, High
Wycombe, UK) and four colour machines (FACSCalibur, Beckton Dickinson, San Diego,
California, USA). The CytoronAbsolute acquired a known volume of sample and
therefore an absolute count of the number of cells acquired was determined by
volumetry. From this and the total volume of the wash-outs, the absolute number of cells
in the original sample could be calculated. This flow cytometer was employed when
absolute cell counts were required for antigen-specific analysis (see below). The
FACSCalibur machine was utilized to define the percentages of the cells expressing a
given phenotype within a population with the increased discrimination of 4-colour
immunofluoresence. Instead of using microspheres on the FACSCalibur, the absolute
counts on the Cytoron in parallel samples were obtained for major populations of CD4
and CDS T lymphocytes when absolute numbers were required.
2.6.2 Mechanisms of analyte discrimination by FCM
Flow cytometry discriminates cells or other analytes by the virtue of both their size
and granularity and also by detecting antibodies bound to their surfaces or intracellular
components. Cells in suspension pass through a laser beam and this beam is scattered
dependant on the physical qualities of the cells. Size is measured by the forward
deflection of the laser beam when it hits the particles and is referred to as the forward
scatter (FSC). Some of the laser beam is deflected at right angles and the amount of this
reflected light corresponds to the intracellular features or granularity of the cell. This light,
detected by a separate photomultiplier is referred to as side scatter (SSC). Taken
together, size and granularity refer to the intrinsic qualities of a cell (or other analyte).
These intrinsic features can be used to differentiate the major leukocyte populations in
lysed whole blood (figure 2.2)
The second mechanism by which FCM can discriminate cells is through the
detection of light released by fluorochrome labelled monoclonal antibodies. Different
fluorochromes exist that absorb light from the laser beam and emit fluorescent light
within a particular wavelength band that is detected by different photomultiplier
detectors. Thus cells may be distinguished by their fluorescence characteristics
44

dependant on which monoclonal antibodies are bound to their surface. This
fluorochrome labelled antibody discrimination of a cell relates to its extrinsic features.
The investigation of both the intrinsic and extrinsic characteristics of an analyte may be
F ig u re 2.2
oCO
termed morphospectral analysis.SSC
Figure 2.2
FCM dotplot of lysed whole blood demonstrating that the intrinsic cell parameters
size (forward scatter, FSC) and granularity (side scatter, SSC) can be used to
distinguish lymphocytes (a), monocytes (b) and granulocytes (c)
The number and type of different fluorochromes that can be used is dependant on
their various absorption and emission spectra as well as the number of lasers present in
the machine. A single laser machine such as the CytoronAbsolute can perform analysis
with three fluorochromes, whereas with the FACSCalibur, the two lasers allow the
routine use of four fluorochromes (table 2.1). The use of four fluorochromes is not only
more informative than three colour analysis but is also more economical because fewer
tubes are required to investigate complex patterns of differentiation antigen expression.
The four colour analysis is also important in BAL where lymphocyte populations may be
scanty.
45

Table 2.1 Fluorochromes available for use between the CytoronAbsolute and
FACSCalibur flow cytometers
Detector Cytoron FACSCalibur
1 FITC' FITC
2 PE^ PE
3 PEcyS, PerCP^ PerCP, PEcyS.S, PEcy7
4 - APC^
Footnotes
1. FITC=Fluorescein isothiocyanate
2. PE=Phycoerythrin
3. PerCP=Perididine chlorophyll protein
4. APC=Allophycocyanin
2.6.3 CD45 directed panleukogating in blood and BAL
A number of different strategies have been developed for the discrimination of leukocyte
subsets by FCM. Lymphocytes, monocytes, neutrophils and eosinophils all carry unique
antigens by which they may be distinguished flow cytometrically using monoclonal
antibodies. However, the use of large numbers of different fluorochrome labelled
antibodies often introduces unnecessary complications and cost to the analysis. More
recently, the features of CD45 staining, well established since 1979 [2] when the first
CD45 reagent was made are coming back to prominence for two reasons: their simplicity
and their reliability on stored samples. These simple protocols investigate both the
intrinsic and extrinsic parameters of analytes. CD45-directed gating allows leukocytes to
be distinguished from non-leukocyte parenchymal cells and debris, a factor that is
particularly important for the analysis of tissue fluids such as BAL where many of the
acquired events are not leukocytes.
One of the basic features of CD45 staining is that on leukocyte populations in blood,
CD45 is expressed at high density on lymphocytes with medium density on monocytes
and more weakly on granulocytes. This feature, combined with the differences in tbe
46

intrinsic parameters of these populations allows CD45 and side scatter to precisely
differentiate these major populations in lysed whole blood (figure 2.3).
It is not known however, whether these features of discriminating intensity of
staining are maintained in BAL samples where in this thesis the various aspects of CD45
labelling will be investigated (see below). It appears that when using BAL lymphocytes
form an easily gateable population but the alveolar macrophages cannot be easily
distinguished from the granulocytes since macrophages have very heterogenous side
scatter characteristics (figure 2.4). Clearly the preliminary observations indicate that
additional granulocyte markers such as CD15 may be needed to achieve macrophage-
granulocyte discrimination.
Figure 2.3
LO
OU
SSC
Figure 2.3
FCM dotplot of CD45 panleukogating against side scatter (SSC) to differentiate the
major leukocyte populations in lysed whole blood. Lymphocytes (a) have low side
scatter and express CD45 brightly whilst granulocytes (c) have high side scatter
but are CD45 dim. Monocytes (b) are intermediate for both characteristics.
47

F i g u r e 2.4
in é
QO &
ssc1023
Figure 2.4
FCM dotpiot from BAL demonstrating the separation of CD45+ leukocytes from
CD45- non-leukocyte debris. CD45 bright lymphocytes form a gateable population
due to their low side scatter, but the other BAL populations cannot be clearly
distinguished.
2.6.4 Gating strategy to identify bronchial epithelial and squamous cells in
BAL by FCM
Effective BAL adequately samples the alveolar cellular component of the washed lobe.
However, BAL may be of variable quality and often specimens may include high
proportions of bronchial epithelial and squamous cells, indicating sampling from the
airways rather than the alveoli. These cells are readily identifiable by light microscopy,
thereby enabling the cytologist to comment on the adequacy of the BAL sample.
Therefore, it was felt that that a flow cytometric system should be devised that could also
identify these cells from the non-leukocyte component.
An epithelial marker conjugated to FITC (Ber-EP4, Dako) was used in tandem with
CD45. This epithelial antigen consists of two glycoproteins of 34 and 39 Kda and is
expressed on a broad range of epithelial tissues, but not on mésothélial cells [3]. In poor
quality BAL the epithelial+ cells could be gated and were demonstrated to be CD45-
(figure 2.5).
48

Figure 2.5
10* 1 0 ’ 10^ 1 0 ’ 10*
Epithelial
Bronchial epithelial cell
. '
Squamous cell
Epithelia l '
d• 1
• . ^
■ #
Figure 2.5
FCM dotpiots and images of cytospins of BAL indicating upper airways cellular
contamination (a,c) and a good alveolar specimen (b,d). The gated populations in
the dotpiots represent the epithelial+, CD45- bronchial epithelial and squamous
cell component. The staining aligned around the 45° is a feature of non-specific
labeling, including dead cells and debris.
2.6.5 General gating strategy for lymphocyte phenotypic analysis: primary
immunological gating
For all lymphocyte phenotypic analysis by FCM, primary immunological gating using the
relevant discriminatory monoclonal antibody (CD4, CDS or CDS) against side scatter
was performed. These gated events were subsequently sent to a lymphoid scatter gate.
Events that lay outside this gate were excluded from the analysis. Care was taken to
include larger lymphoid blast cells (figure 2.6). The events with lower forward scatter
49

lying outside this gate were assumed to be apoptotic lymphocytes. This strategy of
primary immunological gating followed by back gating to assess scatter characteristics
has been demonstrated to be the optimum method for flow cytometric discrimination of
lymphocyte and leukocyte subpopulations [2, 4], Further strategies for lymphocyte gating
are discussed in the relevant results chapters.
Figure 2.6
ssc
R:
Gated by R1
FSC
Figure 2.6
Flow cytometric gating strategy for lymphocyte subsets for phenotypic analysis.
Primary immunological gating of CD4+ events with low side scatter (R1, plot a) are
then sent to a forward scatter, side scatter plot (b) to ensure that they lie within a
characteristic lymphoid gate (R2). Events with high FSC within R2 are blast cells.
2.7 Flow cytometry: Reagents, panels and protocols
2.7.1 Reagents and panels for three and four colour FCM
The monoclonal antibodies, their manufacturers and the fluorochromes to which they
were conjugated to are shown in table 2.2. All antibodies were used in optimised pre
titrated saturating concentrations.
50

Table 2.2 Monoclonal antibodies used In this thesis
CD Fluorochrome Clone Isotype Manufacturer Staining type
CD45 FITC 2D1 igGi Southern Biotechnology
CD45 ARC H130 igGi BD PharMingen
CD15 FITC C3D-1 igM Dako
CD15 PE V 1M C 6 igM Caltag
CD15 FITC MCS-1 igG Cytognos
CD23 FITC TU 1 igG3 Caltag
CD4 FITC RFT-4 igGi Royal Free Hospital
CD3 PEcyS UCHT1 igGi Dako
CD3 PEcyS.5 S4.1 lgG2a Caltag
MembraneCD3 Pecy7 S4.1 lgG2a Caltag
CD8 PE RFT-8 lgG1 Royal Free Hospital
CD8 PEcy5.5 3B5 lgG2a Caltag
CD8 Pecy7 3B5 lgG2a Caltag
CD27 FITC CLB-27/1 lgG2a Caltag
CD45RA ARC Sn130 lgG1 Southern Biotechnology
CD38 PE HIT2 lgG1 Caltag
CD56 FITC NCAM16.2 lgG1 BD
CD22 PE S-HCL-1 lgG2b BD
Epithelial FITC Ber-EP4 lgGl Dako
KI67 FITC MIB-1 lgGl Immunotech
Perforin PE ÔG9 lgG2b BD PharMingenIntracellular
IFN-y PE B27 lgGl Caltag
TN F-a ARC M P9-20A4 igGl Caltag
51

The monoclonal antibodies were used in panels of three reagents for the Cytoron, or four
reagents for the FACSCalibur. On the Cytoron, the following panels were used:
1. CD45 FITC / CD15 PE / 7-AAD
2. CD4 FITC / CD8 PE/ CD3 PEcyS
For the FACSCalibur the following panels were used:
3. CD23 FITC / CD15 PE / CD45 APC
4. Epith FITC / CD45 APC
5. CD15 FITC / CD4 PE / CD8 PEcy7 / CD45 APC
6 . CD4 FITC / CD8 PE / CD3 PEcy7 / CD45 APC
7. CD56 FITC / CD22 PE / CD3 PerCP / CD45 APC
8 . CD27 FITC / Perforin PE / CD8 PerCP / CD45RA APC
9. CD27 FITC / CD8 PE / CD3 PerCP / CD45RA APC
10. KI67 FITC / CD38 PE / CD8 PerCP / CD45RA APC
11. CD4 FITC / IFN-y PE / CD3 PerCP / TNF-a APC
2.7.2 Protocols for staining of fresh whole blood and BAL
Parallel blood and BAL samples were run using panels 1 and 2 above to determine the
leukocyte subsets and CD4/CD8 ratios in these fluids. 50pl of whole blood or 50pl of
prepared BAL (see 2.3) was added to the antibody panels in separate flow cytometry
tubes. The samples were stained at room temperature in the dark for 15 minutes.
Following this QSOpI of lysis buffer (ammonium chloride 8.26%, potassium bicarbonate
1% and EDTA tetra sodium salt 0.036%, pH 7.5) was added to the blood and 950pl of
PBS added to the BAL. The samples were left for a further 15 minutes at room
temperature to allow lysis of the red cells and then run immediately on the Cytoron using
an absolute counting protocol.
Absolute cell counts of the CD4 and CD8 lymphocyte subsets as well as the
CD4/CD8 ratio, and the percentages of lymphocytes granulocytes and
monocytes/macrophages were calculated for both blood and BAL (see chapter 3 for
further discussion)
2.7.3 Intracellular staining by FCM: fixation and permeabilisation of cells
In addition to characterising the phenotype of cells by their surface antibody staining,
intracellular components could also be identified following permeabilisation of the cells.
This technique was necessary for demonstrating the presence of cytokines following
52

incubation with antigen or for the presence of cytotoxic markers such as perforin or
nuclear markers of cell proliferation such as Ki67. Several different techniques exist for
the permeabilisation of cells [5].
In this study fixation and permeabilisation was performed using fix and perm (Caltag).
200|il of reagent A (fix) was added to SOOpI of whole blood or BAL in a universal
container and left for 15 minutes in the dark at room temperature. The samples were
then washed in PBS at 430g for 8 minutes. Following the wash step, the containers were
decanted allowing red cells to separate away from the cell pellet. 200pl of reagent B
(perm) was then added, the samples vortexed and then incubated in the dark for a
further 15 minutes. Following a second wash step, the pellet was resuspended up to
200pl with PBS and then added to the relevant antibody panel requiring intracellular
staining (panels 5 and 6 ). Staining was performed at 4°C for 30 minutes and followed by
a final wash step. By this stage almost all red cells were removed during the decanting
phases. Samples were run on the FACSCalibur machine.
2.8 Measurement of antigen-specific responses: cytokine
synthesis assay2.8.1 General introduction to the method
Several investigators have described methods for the detection of antigen specific
lymphocyte responses by measuring the production of cytokines in response to antigen
added in assays of whole blood or PBMC [6-9]. These assays used short (6-48) hour
incubations and the cytokines synthesised were measured by ELISA [6 ], visually by
detecting spot forming colonies in a gel matrix [8 , 10], or by flow cytometry [7].
The underlying assumption in all of these systems is that cognate T lymphocytes
present in the blood samples respond to antigen by producing cytokines. Therefore the
measurement of the proportion of lymphocytes synthesising cytokines is a measure of
the antigen-specific response. The caveat to this assumption is that a variety of different
cytokines may be produced following the encounter of cognate lymphocytes with antigen
and usually only one, or sometimes two cytokines are actually measured. This method
may therefore underestimate the true population of antigen-specific responses.
Nevertheless, these techniques have distinct advantages over the use of class 1 HLA
tetramers to detect antigen-specific responses since they do not require HLA matching
53

of the subject with the tetramer. Moreover, the detection of cytokine synthesis gives an
indication of the functionality of the responding lymphocytes.
FCM is a powerful technique that enables the rapid and accurate elucidation of both
the subtypes of responding lymphocyte (CD4 or CD8 ) as well as being able to
discriminate a number of different cytokines synthesised by the addition of further
fluorochrome labelled anti-cytokine antibodies.
The flow cytometric method, first described by Suni, Picker and Maino [7] used a
whole blood assay with a short incubation period of six hours in total before the samples
were lysed, fixed and permeabilised and stained prior to acquisition on the flow
cytometer. Integral to this method was the addition of the co-stimulatory antibody CD28
to augment the cytokine responses and the secretion blocking agent Brefeldin A to keep
the synthesised cytokines within lymphocytes [1 1 , 1 2 ], and therefore optimise their
detection by FCM following cell permeabilisation.
The aim was to modify and simplify the existing described method so that it would be
appropriate for use in bronchoalveolar lavage. One important consideration was that the
timings of the assay should be appropriate for the analysis of samples of BAL that were
collected following the routine clinical bronchoscopy lists.
The following issues were addressed when adapting this method for the
detection of antigen specific responses in BAL;
1. What was the optimum incubation time with antigen in order to maximise cytokine
synthesis?
2. Should a marker of cell activation such as CD69 be used in BAL?
3. What was the dose response curve for PPD?
4. What was the best sequence of staining of surface antigens in order to achieve
optimum flow cytometric discrimination of the T lymphocyte subpopulations?
2.8.2 Time course experiment for cytokine synthesis following incubation
with PPD
In this experiment a single patient with tuberculosis was investigated and the BAL CD4
IFN-y and TNF-a synthetic responses were measured at different time points following
incubation with PPD, ESAT- 6 or no antigen. A standard initial 2 hour incubation was
performed to allow antigen presentation and then 5pg of brefeldin A was added.
Samples were then incubated for a further 4, 8 , 16, 24 or 36 hours and the cytokines
synthesized were measured by FCM for each of the different time points.
54

The time course experiment demonstrated several important features of this assay
that were relevant to a precise determination of the antigen-specific response by FCM.
The first feature was that the CD4 molecules were progressively down regulated with
increasing incubation time so that at later time points it was difficult to distinguish CD4+
from CD4- events (figure 2.7). By contrast, CD3 molecules were well preserved on the
lymphocyte surface (MPI at four hours 280.9 and at 36 hours 174.0). The second feature
was that the scatter characteristics of the lymphocytes changed with time.
'5 50 n
I % 4 0
I I 30.S I (0 > '
201 8
10 -
Figure 2.7
10 20 30 40
Incubation time (hours)
50
4 hours
iSiiif;16 hours
SSC
36 hours
Figure 2.7
Decline in mean fluorescence intensity (MFi) of CD4 expression on BAL
lymphocytes demonstrated graphically and by FCM dotpiots with incubation time
following brefeldin administration. At 36 hours CD4+ lymphocytes were difficult to
distinguish from CD4- events.
55

At up to 8 hours incubation well preserved lymphoid scatter was noted, but by 24 hours
many of these cells had increased side scatter. A viability dye was not used in these
experiments, but many of these lymphocytes may have been undergoing apoptosis.
The percentage of CD4+ T lymphocytes synthesizing either IFN-y or TNF-a was
determined in CD3+ CD4+ lymphocytes (figure 2.8). The IFN-y and TNF-a responses
were maximal at 8 hours, but did not start to decline until after 24 hours incubation. It is
difficult to interpret why there was a drop in the 16 hour response.
Figure 2.8
20-1COto0)
<uc2 10 -
oQÜ
360 8 16 244
IFN-gTMF-a
Incubation time (hours)
Figure 2.8
IFN-g and TNF-a CD4 responses to PPD In BAL at different Incubations times
following the addition of brefeldin to the culture medium. The control samples had
no antigen added and show low responses.
The conclusion of this time course experiment is that the optimum incubation time for
maximizing the CD4 cytokine responses, lies between 8 and 24 hours following the
addition of brefeldin. However, CD4 down-regulation at longer incubation periods is a
significant problem for the accurate gating of CD4 lymphocyte responses. In addition, it
is not clear to what extent apoptosis may become a problem with longer incubation. The
final important factor was that the assay should be appropriate for routine analysis.
Therefore, BAL specimens were incubated with brefeldin for two hours and then for an
additional 14 hours overnight to allow the practical evaluation of the responses the
following day.
56

2.8.4 Use o f CD69 in BAL
The proportions of T lymphocytes responding to antigens has traditionally been
measured by determining the proportion of lymphocytes (CD4 or CDS) that have both
synthesised the cytokine of interest in addition to expressing the activation marker CD69
[7, 13, 14]. Despite the convention of using CD69 as an activation marker, it is not clear
that this provides any additional useful information than the cytokine synthetic response
alone for determining the antigen-specific response. In fact, some cognate cells may
take up to 3 days to maximally express this marker after encounter with antigen [15], so
exclusively counting the cells both expressing CD69 and cytokine may underestimate
the true antigen-specific response. A more serious problem with the use of CD69 in
Figure 2.9
CD 69
Control
71%
CDS A
CD 69
Sarcoid ds99%
CDS 110 10 10 10 10'
Figure 2.9
Histograms of expression of the activation marker, CD69 on CD4 lymphocytes
(a,c) and CDS lymphocytes (b,d) from fresh, unactivated BAL from a healthy
control subject and a patient with pulmonary sarcoidosis. Very high percentages
of CD69 expression are demonstrated on both CD4 and CDS lymphocytes.
57

tissue specimens such as BAL is that a high proportion of unactivated T lymphocytes
express this marker. Almost three-quarters of CD4 and CD8 BAL lymphocytes in a
healthy individual and even more in a patient with sarcoidosis expressed CD69 when the
BAL preparations were examined fresh without the addition of antigen (figure 2.9). These
findings render CD69 unsuitable for use as an activation marker in BAL.
2.8.5 Dose response curve for purified protein derivative
Different doses of PPD were added to BAL as the stimulatory antigen in order to
establish the optimum dose. The parameters measured by the standardised flow
cytometric cytokine synthesis assay were both the percentage of lymphocytes producing
cytokines and the mean fluorescence intensity (MFI) of the synthesised cytokines. Using
the standardised gating strategy described above, the percentage of CD4+ T
lymphocytes producing either IFN-y or TN F-a following incubation with PPD was
measured in comparison with the control samples to which no antigen was added. The
following doses of PPD were used 1pg, 2 pg, 5pg, 10pg and 20 pg. The standard 16
hour incubation was used for all samples and the percentages of CD4+ T lymphocytes
staining for intracellular IFN-y and TN F-a were measured for each dose of antigen by
FCM. The dose titration was performed on two patients with TB and the response
reached a plateau at a dose of lOpg of PPD in one patient and 5pg in the other (figure
2.10). For each dose of stimulatory antigen, the percentage CD4+ T lymphocytes
synthesising TN F-a was greater than those synthesising IFN-y (figure 2.10).
The MFI for the relevant cytokine was determined by flow cytometry using winMDI
software (M Trotter, free software). Single parameter histograms of cytokine synthesis by
CD4+ T lymphocytes were used to allow accurate gating of the positive events and the
mean values of these events calculated using the software. The MFI increased with
increasing doses of PPD (figure 2.9). What was most noticeable was the much greater
MFI for TN F-a expression than for IFN-y, particularly in one subject. However the
increased fluorescence noted with the APC-conjugated TN F-a antibody cannot be
directly correlated with increased production of that cytokine when compared to IFN-y
since APC fluorescence is greater than PE.
Based on these observations a dose of lOpg of PPD was chosen although 5pg
could have been adequate.
58

Figure 2.10
75 -,
25-
0 1 2 10 205
40-1
30-
20-
IFN-g
0 2 5 10 20
Dose of PPD Dose of PPD
10000
5 | 10004
s
1001 2 5 10 20
Doœof PPD
lOOOOi
| | «nw
s
100
TT\F-a— - à
IFNg
2 5 10 20Doœof PPD
Figure 2.10
The percentage of CD4 lymphocytes synthesizing IFN-7 and TNF-a in response to
different doses of PPD (dose in ^g) in BAL from two patients with TB (top two
graphs). The bottom two graphs demonstrate the mean fluorescence intensity
(MFi) of the synthesized cytokines.
59

2.8.6 Optimisation of antibody surface staining sequence
Following incubation, the surface antigens used to delineate the lymphocyte subsets
may become downregulated, thus affecting the ability of monoclonal antibodies to
reliably distinguish such populations. This process of downregulation may be
exaggerated by permeabilisation of the cells. Therefore, the MFI of CD4 and CD8
expression was compared when antibodies against these antigens were added before
fixation and permeabilisation (pre-staining), or when added at the same time as the
cytokine antibodies.
There was a clear advantage for CD4 discrimination with pre-staining as compared to
staining with the cytokines (figure 2.11). No difference was noted for CD8 staining
between these two sequences.
Figure 2.11
SSC
Figure 2.11
FCM dotpiots of BAL following 16 hour incubation demonstrating that optimum
CD4 discrimination is achieved when surface staining is performed prior to
fixation and permeabilisation (a) rather than after this process (b)
2.8.7 Method for the detection of intracellular cytokine synthesis in whole
blood and BAL
Aliquots of the BAL suspension containing 1X10^ CD4+ lymphocytes in 1ml of culture
medium were placed into sterile 5ml polypropylene tubes (Thermo Life Sciences, UK). In
addition, 1 ml of peripheral blood from the same patient collected into lithium heparin
60

tubes was also placed into polypropylene tubes. To one of the BAL and blood samples,
10|ig of PPD (Statens Serum Institute, Copenhagen, Denmark) was added. The other
tubes were unstimulated control samples. The samples were incubated for two hours at
37°C and 5% CO2 , after which time 5pg of Brefeldin A (Epicentre Technologies,
Cambridge, UK) was added and the samples incubated for a further 14 hours.
Following incubation, the samples were vortexed vigorously to detach cells from the
walls of the tube. First, lymphocyte surface markers were stained using CD4-FITC
(Royal Free Hospital) and CD3-PerCP (Becton Dickinson) for 15 minutes in the dark at
room temperature and the samples were washed. Fixation and permeabilisation of the
cells was performed as described in 2.8.3 above using Fix-and-Perm (Caltag). Following
this, IFN-y-PE (Caltag) and TNF-a-APC (Becton Dickinson) were added and the samples
stained at 4°C for 30 minutes, followed by a final wash step. The acquisition and
analysis of the stained preparations is described in chapter 7.
2.8.8 Antigens used for the cytokine synthesis assay
The cytokine synthetic responses to a variety of antigens other than PPD were assessed
in both BAL and blood (table 2.3).
Table 2.3 Antigens and substances used to stimulate cytokine synthesis
Antigen Indication Manufacturer
Staphylococcal enterotoxin B Positive control Ag Sigma Aldrich
(SEE)
Purified protein derivative (PPD) TB-specific responses Statens serum institute
Tetanus toxoid Control antigen Pasteur Merieux
2.9 StatisticsMost of the data generated such as leukocyte differentials in BAL, and cytokine synthetic
responses were not normally distributed. Therefore median values and inter-quartile
ranges or full ranges were recorded in the text. Comparisons between data sets were
made using Mann-Whitney analysis.
61

Results generated using different techniques, for example the BAL leukocyte
differentials by cytospin and FCM were compared using both the Spearmans correlation
coefficient, and by Bland-Altman analysis.
2.10 References
1. Honeybourne D, Babb J, Bowie P, et al. British Thoracic Society guidelines on
diagnostic flexible bronchoscopy. Thorax 2001 ;56:i1-i21
2. Loken MR, Brosnan JM, Bach BA and Ault KA. Establishing optimal lymphocyte
gates for immunophenotyping by flow cytometry. Cytometry 1990;11:453-9.
3. Latza U, Niedobitek G, Schwarting R, et el. Ber-EP4: new monoclonal antibody
which distinguishes epithelia from mésothélial. J Clin Pathol 1990;43:213-9.
4. Mandy F Nicholson J, Autran B and Janossy G. T-Cell Subset Counting and
Fight Against AIDS: Reflections Over a 20-Year Struggle. Clinical Cytometry
2002;60:39-45
5. Kappelmayer J, Gratama JW, Karaszi E, et al. Flow cytometric detection of
intracellular myeloperoxidase, CD3 and CD79a. Interaction between monoclonal
antibody clones, fluorochromes and sample preparation protocols. J Immunol
Methods 2000;242:53-65.
6 . Petrovsky N, Harrison LC. Cytokine-based human whole blood assay for the
detection of antigen-reactive T cells. J Immunol Methods 1995;186:37-46.
7. Suni MA, Picker LJ and Maino VC. Detection of antigen-specific T cell cytokine
expression in whole blood by flow cytometry. J Immunol Methods 1998;212:89-
98.
8 . Rowland-Jones SL, Dong I , Fowke KR, et al. Cytotoxic I cell responses to
multiple conserved HIV epitopes in HIV-resistant prostitutes in Nairobi. J Clin
Invest 1998;102:1758-65.
9. Lalvani A, Pathan AA, Durkan H, et al. Enhanced contact tracing and spatial
tracking of Mycobacterium tuberculosis infection by enumeration of antigen-
specific I cells. Lancet 2001;357:2017-21.
10. Lalvani A, Pathan AA, McShane H, et al. Rapid detection of Mycobacterium
tuberculosis infection by enumeration of antigen-specific I cells. Am J RespirCrit
Care Med 2001;163:824-8.
62

11. Lippincott-Schwartz J, Yuan LC, Bonifacino JS and Klausner RD. Rapid
redistribution of Golgi proteins into the ER in cells treated with brefeldin A:
evidence for membrane cycling from Golgi to ER. Cell 1989;66:801-13.
12. Klausner RD, Donaldson JG and Lippincott-Schwartz J. Brefeldin A: insights into
the control of membrane traffic and organelle structure. J Cell Biol
1992;116:1071-80.
13. Kern F, Faulhaber N, Frommel C, et al. Analysis of CD8 T cell reactivity to
cytomegalovirus using protein-spanning pools of overlapping pentadecapeptides.
EurJ/mmuno/2000;30:1676-82.
14. Waldrop SL, Pitcher CJ, Peterson DM, et al. Determination of antigen-specific
memory/effector CD4+ T cell frequencies by flow cytometry: evidence for a novel,
antigen-specific homeostatic mechanism in HIV-associated immunodeficiency. J
Clin Invest 1997;99:1739-50.
15. Gibbons DC, Evans TG. CD69 expression after antigenic stimulation. Cytometry
1996;23:260-1.
63

Chapter 3
Comparison of Flow Cytometry with
Cytospin for the Determination of
Bronchoalveolar Lavage Leukocyte
Populations in Patients Investigated with
Respiratory Disease
64

3.1 IntroductionBronchoalveolar lavage is a recognized procedure for the diagnosis of respiratory
disease of both infective and inflammatory etiologies. Not only does the directed
washing of an affected area of lung provide specimens that may enable a microbiological
or cytological diagnosis to be made, but effective BAL also samples the cellular
component of the lower bronchial tree. Increases in BAL cell lymphocyte populations
have been found to be helpful in the diagnosis of inflammatory conditions such as
sarcoidosis [1, 2], interstitial lung diseases [3] and in cryptogenic organizing pneumonias
[4], while increasing neutrophil concentrations in BAL may be evidence of a bacterial
infection [5, 6 ], in types of pulmonary fibrosis [7], or as a response to lung transplantation
[8 . 9].
The existing standard method for the evaluation of BAL leukocyte populations is
predominantly through the investigation of cytospin preparations. Simple differential
counts of lymphocytes, macrophages and granulocytes can be achieved by counting
stained cells by microscopy. Further identification of subpopulations of lymphocytes or
macrophages can also be performed by the use of immunoperoxidase [1 0 ] or
immunofluorescence staining.
Similarly, flow cytometric (FCM) techniques have been developed to distinguish the
BAL leukocyte component from the non-cellular and non-leukocyte events. Several
investigators have used the pan-leukocyte marker, CD45 to determine the lymphocyte
events acquired by FCM [11, 12]. Lymphocytes form homogenous populations of small
cells that express high levels of CD45 and are easily gateable by FCM. Whilst
lymphocytes can be accurately determined by CD45 expression and light scatter
characteristics, this is not true of neutrophils, eosinophils and macrophages.
Macrophages in particular are notoriously difficult to distinguish by FCM, although
fortunately the enumeration of the total macrophage pool in BAL is rarely of clinical
significance. By contrast, BAL neutrophilia and eosinophilia are diagnostically important.
A granulocyte marker, CD15 was therefore used to distinguish these cells from the
macrophages by FCM. The macrophage population was then derived as those CD45+
events remaining after subtraction of the gated lymphocytes and granulocytes.
The main aim of this study was to develop a simple flow cytometric method for
determining the proportions of the clinically relevant leukocyte populations in BAL. The
results obtained by FCM were then compared with those from cytospin preparations
under optimum conditions using a highly experienced cytologist counting 500 -cells, A
65

significant improvement on the standard visual counts in which 2 0 0 cells are routinely
counted. A further aim of this study was to assess whether both techniques could reliably
determine BAL leukocyte differentials on samples frozen in liquid nitrogen.
3.2 Material and methods3.2.1 Subjects
Patients undergoing bronchoscopy for the diagnosis of suspected non-malignant
respiratory disease were included. 100 BAL were performed on 92 patients. 53 BAL
were performed on HIV-infected patients. The remaining 47 episodes included four BAL
undertaken on patients following bone marrow transplantation, three on patients
immunocompromised with haematological malignancies and two on subjects in intensive
care.
3.2.2 Bronchoalveolar lavage
Bronchoscopies were performed under sedation using a flexible bronchoscope
wedged into a subsegmental bronchus. BAL was site-directed in cases with
radiologically defined areas of abnormality, but otherwise the right middle lobe was
washed. Sterile normal saline was introduced through the bronchoscope to a maximum
volume of 200ml and the fluid aspirated into a siliconized glass container on ice. BAL
specimens were analysed within two hours of their acquisition. Aliquots of BAL were sent
to the relevant laboratories and the remaining fluid (normally >25ml) was centrifuged at
430g for 8 minutes, decanted and the pellet resuspended. The sample was then filtered
through a 100pm filter (Cell Tries, Partec GmBH, Münster, Germany), centrifuged again
and the pellet resuspended in 1 ml of Phosphate buffered saline (PBS).
3.2.3 Flow cytometry
50pl of the BAL suspension was added to a flow cytometry tube containing the following
monoclonal antibodies; CD45-FITC (Beckton Dickinson, Oxford, UK), CD15-PE (Caltag
Medsystems, Towcester, UK) and 7-AAD (7 amino-actinomycin D, Pharmingen, San
Diego. California, USA). These antibodies were pretitrated and added in saturating
concentrations. The samples were stained at room temperature in the dark for 15
minutes and PBS added to a volume of 1ml. In samples that were visibly bloodstained,
lysis buffer (0.17M NH4CI) was added instead of PBS and left for 15 minutes to ensure
66

red cell lysis. Samples were run on a CytoronAbsolute flow cytometer (Ortho Diagnostic
Systems, Raritan, New Jersey, USA) using an absolute counting protocol.
List mode data were analysed using lmmunoCount-2 software. Primary immunological
gating of CD45+ events against side scatter was performed and a tight gate placed
around the low side scatter lymphocytes (Figure 3.1, plot a). Second, a dot plot of CD45
against GDI 5 was produced and a gate placed around the CD45+, CD15+ granulocytes
(Figure 3.1, plot b). The percentages of the lymphocyte and granulocyte populations
were calculated as the number of gated events divided by the total number of CD45+
events.
Figure 3.1
ssc GDIS
Figure 3.1
FCM dotpiots of BAL demonstrating CD45 panleukogating (R1, plot a) to
differentiate leukocytes from debris. Lymphocytes (R2, plot a) express CD45
brightly and have low side scatter. Granulocytes can be distinguished from
macrophages within the panleukogate by their expression of G DI5 (R3, plot b).
The macrophage pool was derived from the total number of GD45+ cells after
subtraction of lymphocytes and granulocytes.
In selected patients in whom eosinophils were identified by cytospin a further aliquot of
BAL was stained with the following antibodies; GD23-FITG (Galtag), GD15-PE (Galtag)
and GD45-APG (Pharmingen). The samples were run on a FAGScalibur flow cytometer
(Becton Dickinson) after a wash step following antibody staining. G D I5+ granulocytes
within the GD45 pan-leukogate were gated and sent to a GD45 GD23 dotpiot (Figure
67

3.2). Eosinophils were characterized by the dual expression of CD15 and the IgE
receptor antigen, CD23, whereas neutrophils were CD23 negative.
F ig u re 3.2
CD 15
Gated by R2
10* "W 10-CD 23
%
A■ Eosinophil
‘ è /
Figure 3.2
FCM dotpiots and a photomicrograph of BAL from a patient with an eosinophilia.
CD45+ CD15+ granulocytes (R2) are demonstrated to be predominantly CD23+
eosinophils (R3) with few CD23- neutrophils (R4, plot b). The photograph (c)
confirms eosinophilia in the cytospin preparation.
The accuracy of the BAL lymphocyte gating strategy of CD45 expression and scatter
characteristics was compared with lymphocyte enumeration by counting the sum of the
various lymphocyte subsets in BAL by FCM (lymphosum).
68

In 15 samples, BAL was stained with T cell (CD3), B cell (CD19) and NK cell (CD56)
markers in addition to CD45. A cocktail of the following antibodies were used; CD56-
FITC (Beckton Dickinson), CD19-PE (Beckton Dickinson), CD3-perCP (Beckton
Dickinson) and CD45-APC (Beckton Dickinson). The samples were stained as described
above and washed before running on a FAGScalibur. First, Lymphocyte percentages
were derived by CD45 expression and side scatter characteristics as described above.
These values were then compared with the sum of the percentages of T, B and NK cells.
Individual lymphocyte subsets were calculated by gating the number of CD3, CD56 or
GDI9 bright events with lymphoid side scatter characteristics (figure 3.3).
Figure 3.3
R2
QOssc
G a t e d by R 2
C D 56
S S C ssc
Figure 3.3
FCM dotpiots of BAL lymphocyte determination by CD45 expression and light
scatter (a) compared with gating strategies to determine the numbers of NK (b), T
(c) and B (d) lymphocytes. The numbers of each of the lymphocyte subsets were
expressed as a percentage of the total CD45 panleukogate (R1). These
percentages were added together to give a sum value of the lymphocyte
percentage and this was compared with the lymphocyte percentage derived from
plot a. NK cells (b) were CD56+ but CD3-.
69

NK cells were only counted as such if they were CD56+ but CD3-. The numbers of each
lymphocyte subset were then expressed as a percentage of the total number of CD45+
events and these were added together to give the total lymphocyte percentage.
3.2.4 Cytospin
BAL was adjusted to a concentration of 2-5 x 10® CD45+ cells/ml. lOOpI of BAL was
centrifuged for 2 minutes at SOOrpm in a cytospin machine (Shandon, Runcorn, UK) and
the resultant slide air dried, fixed in chloroform and acetone for 10 minutes and stained
with Haematoxylin and eosin. 500 cells were counted by light microscopy and the BAL
cells differentiated by morphological and staining characteristics. The cytologist was
blinded to the BAL differentials achieved by FCM.
3.2.5 Freezing and thawing of BAL
15 BAL’s were frozen in liquid nitrogen after the samples were run on the flow cytometer
as described above. 500pl of the BAL suspension was added to 500pl of freeze mixture
(10% DMSO in 20% fetal calf serum in RPMI 1640) in a cryovial. The sample was
vortexed rapidly and then placed in the vapour phase of liquid nitrogen to ensure
freezing at the rate of 1°G/minute. After 12 hours the samples were stored in liquid
nitrogen. For reanalysis after freezing, the samples were rapidly defrosted by pippetting
with warm RPMI and 10% FCS into a universal container. The thawed sample was then
centrifuged, decanted and the pellet resuspended in RPMI and FCS before a further
centrifugation step to ensure complete removal of the freeze mixture.
3.2.6 Immunofluorescence staining of BAL
Cytospins were prepared from a sample with a BAL neutrophilia and a further sample
with an eosinophilia. After fixation, the cytospins were stained with either 5pl CD15-FITC
(Dako) or CD23-FITC (Caltag) in 45pl of PBS. The stained preparations were examined
using a fluorescence microscope.
3.2.7 Statistical analysis
Comparisons between FCM and cytospin cell differentials were made using Pearsons
correlation. Bland-Altman plots were used to analyse the degree of variation between the
two techniques. Coefficients of variation (CV) were assessed by the parallel analysis of
10 cytopsins and 10 FCM tubes from the same BAL specimen. This process was
70

undertaken with 5 different BAL samples. The microscopist was unaware that the
cytospins were from the same BAL specimen. The CV’s for cytospin and FCM were
estimated using the analysis of variance (ANOVA), after controlling for the difference
between the mean percentage of each leukocyte subset for the different samples.
Otherwise, data was expressed as mean values with 95% confidence limit adjustments
included.
3.3 Results3.3.1 BAL diagnoses
46 BAL specimens yielded a diagnosis of which tuberculosis was the most common,
occurring in 21 cases. A bacterial organism was only cultured in 8 specimens, partly
reflecting prior antibiotic usage. For the HIV-infected population, the most common BAL
diagnosis was tuberculosis, occurring in 9 cases. Pneumocystis carinii was found in 4
patients and rare diagnoses included strongyloidiasis, cryptococcosis and
cytomegalovirus infection. One patient was co-infected with pneumocystis carinii,
mycobacterium tuberculosis and cytomegalovirus and went on to have 3 further BAL.
The median blood CD4 count in the HIV-infected subjects was 78 cells/pl.
3.3.2 BAL leukocyte differential counts by FCM
The median recovery of saline introduced during BAL was 90ml (50%). Using CD45 to
differentiate the leukocyte from the non-leukocyte populations, a mean of 61.6% (95%
Cl; 56.6% to 66.6%) of the events acquired by FCM were leukocytes when using fresh
BAL. The majority of the CD45 negative events were non-cellular debris, although a
variable proportion consisted of bronchial epithelial cells and squamous cells. The mean
absolute number of leukocytes counted by FCM was 9305 cells (95% Cl: 7740 to
10870).
There was a marked variability in the leukocyte proportions between different
patients with lymphocyte percentages varying from 0.3% to 86% of CD45+ events and
the granulocyte percentages varying from 0.2% to 94%.
71

3.3.3 7-AAD expression in BAL
The mean number of CD45+ events that co-expressed the dead cell marker 7-AAD
was 37.2% (95% Cl: 32.7% to 41.7%). When these 7-AAD+ events were further
analysed, the majority were found to by non-lymphoid. 7-AAD+ lymphocytes maintained
their light scatter characteristics and formed a similar gateable population to 7-AAD-
lymphocytes (figure 3.4).
Figure 3.4
ssc
G ated by R3
SSC
R3
7-AAD
Figure 3.4
FCM dotpiots of fresh BAL demonstrating CD45 expression and light side scatter
before (a) and after (b) gating by the dead cell marker, 7-AAD (R3, histogram c).
CD45+ events that co-express the dead cell marker 7-AAD (b) maintain light side
scatter characteristics and lymphoctes (R2) can be as easily differentiated from
non-lymphocytes as in the non-7-AAD gated leukocytes (a).
3.3.4 Correlation between leukocyte differentials by FCM and cytospin
The correlation between each of the leukocyte proportions in BAL enumerated by FCM
and cytospin were close with R values of 0.92 for lymphocytes, 0.95 for granulocytes
and 0.86 for macrophages (figure 3.5). Bland-Altman analysis (figure 3.6) demonstrated
72

Figure 3.5100
ç■q.
I0È
1oa.
80 -
♦♦
60
40 0.922
20
20 1000 40 60 80
% Lymphocytes by FCM
100c■q.
IÈ
13C2 CD
80
60
R* = 0.945
40
♦ ♦20
8 0 1000 20 40 6 0
% Granulocytes by FCM
1 0 0c■q.
IÈ$
♦80
♦ ♦ ♦
60= 0.861
4 0•§.ii
♦ ♦
20
1000 20 40 60 80
% Derived macrophages by FCM
Figure 3.5
Correlation plots comparing the enumeration of BAL lymphocytes, granulocytes
and macrophages by flow cytometry and cytospin.
73

Figure 3.6
20 •
10 ■ 4.8%
««.CV* *** * * % ^-3.0%(95%CI-3.7to-2.2). # « .» • ••••••• .»^»......." y ................................................. ..
* # ♦ ♦ , ♦ ♦ ♦ ♦ , ♦ ♦«» * ** .* . .
-10.8%
10 20 30 40 50 60 70 80 90 100
Average lymphocyte %30
2 0 -
g■q.
I
iu_ç
î
-20
-30I
30
20
10
0
-10
-20
-30
17.5% ♦
♦ %. . . y . . . . . . y . . . .
♦ ♦«»
' . . '♦ * +24% (095% 0.9 to+3.9) * ♦ ; * *
-12.7%♦ ♦
10 20 30 40 50 60 70 8 0 90 100
Average granulocyte %
+24.7%
+3.4%(CI95%1.3tp5.5)....................
♦ ♦ ♦ - ... • .r
-17.9%
10 20 30 40 50 60 70 80 90 100Average macrophage %
Figure 3.6
Bland-Altman plots comparing the enumeration of BAL lymphocytes,
granulocytes and macrophages by flow cytometry and cytospin.
74

a small but statistically significant tendency by cytospin to underestimate the percentage
of lymphocytes by 3% (95% Cl: -3.7% to -2.2%) when compared to FCM. There was a
significant tendency for cytospin to overestimate the percentage of macrophages by
3.4% (95% Cl: 1.3% to 5.5%). For granulocytes, the overestimation on cytospin was
2.4% (95% Cl: 0.9% to 3.9%).
3.3.5 Coefficient of variation between FCM and cytospin
The coefficient of variation for lymphocyte determination was 2.67% by FCM and 13.3%
by cytospin, whilst for macrophages the figures were 2.60% and 10.9% and for
granulocytes, 2.78% and 23.0% respectively (table 3.1).
Table 3.1 Coefficients of variation for BAL lymphocyte, macrophage and
granulocyte percentages derived by flow cytometry and cytospin
BAL Leukocyte subset FCM Cytospin
Lymphocytes 2.67% 13.3%
Macrophages 2.60% 10.9%
Granulocytes 2.78% 23.0%
3.3.6 Comparison between fresh and frozen BAL for leukocyte subset
determination by FCM
Frozen BAL specimens were analysed using the FCM method described above and the
leukocyte differentials were compared with those obtained previously from the same
fresh BAL sample. A correlation of 0.978 was achieved for lymphocytes (n=11), with
Bland Altman analysis demonstrating limits of agreement between 11.9% and -7.4% for
lymphocyte percentages derived from fresh and frozen samples. Similar close
correlations were reached for granulocyte and macrophage proportions by FCM. In
cytospins made from frozen BAL samples lymphocytes retained their morphology, but it
was difficult to count macrophages and neutrophils due to the deterioration of their
cellular architecture.
75

3.3.7 Comparison between BAL lymphocyte percentages obtained by CD45
and light scatter with the sum of the lymphocyte subsets by FCM
Excellent correlations between lymphocyte enumeration by CD45-light scatter and
lymphosum were obtained (r=0.9986). Bland Altman analysis demonstrated very close
limits of agreement between these two methods (figure 3.7) thus confirming the
adequacy of the CD45-light scatter method of calculating BAL lymphocyte percentages
Figure 3.7
>. >- J3 0
|1tl
I I
1 0 0
so
t o
4 0
2 0
0
0 2 0 4 0 6 0 6 0 100% Lymphocytes by lymphosum
Q.
1.7%
0.12% (95% Cl: -0.28-0.52)-1.46%
vn
0 20 60 60 100
Average lymphocyte %
Figure 3.7
Correlation plot (a) and Bland Altman plot (b) for the total percentage of
lymphocytes in BAL derived by CD45 expression and low side scatter compared
with the lymphocyte percentage derived by adding the percentages of T, B and NK
cells (lymphosum).
76

3.3.8 Immunofluorescence staining of BAL
Positively stained cells with characteristic granulocyte morphology were demonstrated
using both CD23 and CD15 reagents in samples with an eosinophilia (figure 3.8) As
expected, CD23 staining was negative on CD15-positive granulocytes in samples with a
neutrophilia. These findings confirm that CD23 allows eosinophils to be distinguished
from neutrophils and validates the FCM gating strategy (Figure 3.2).
Figure 3.8
Figure 3.8
Immunofluoresence staining of BAL from a patient with a BAL eosinophilia. Green
fluorescent cells with a characteristic eosinophil appearance are noted following
staining with CD23 FITC (a) and also following staining with CD15 FITC (b).
3.4 DiscussionCytospin remains the most frequently used method of analysing BAL leukocytes,
despite the fact that FCM readily discriminates lymphocytes, macrophages and
granulocytes in addition to providing details about lymphocyte subsets. Previous studies
using FCM have provided a biased view of BAL analysis by concentrating on the
characteristics of the easily distinguishable lymphocytes and their subsets [11-13]. Such
an approach has failed to provide information on the relative proportions of the clinically
77

important granulocyte component. Here a more complete picture has been provided by
recording the proportions of lymphocytes, granulocytes and macrophages in BAL in
patients with respiratory disease.
The precision of cytospin versus FCM has not previously been compared under
optimal conditions. In this study cytospins were evaluated by a cytologist of 15 years
experience who counted 500 leukocytes in each preparation. FCM was undertaken
using CD45 directed gating to distinguish leukocytes from debris and epithelial cells. The
use of CD45 panleukogating and light scatter characteristics has been established as
the optimum method for lymphocyte enumeration in blood [14]. The addition of a
granulocyte marker is required in BAL, but not blood, because light scatter and CD45
expression alone cannot reliably distinguish granulocytes from macrophages.
Some investigators have argued that the best strategy for BAL lymphocyte
analysis is to eliminate damaged cells from the analysis by using a DMA dye, LDS-751
after first gating the CD45+ low side scatter lymphocytes [12]. Whilst the exclusion of
damaged cells may be necessary for functional and phenotypic analysis of lymphocytes,
our study demonstrates that CD45 expression and light scatter characteristics are
remarkably robust for BAL leukocytes and are not significantly affected by freezing.
Moreover, the exclusion of damaged cells also skews the BAL leukocyte differentials.
We used a nuclear dye, 7-AAD to recognize early apoptotic and dying cells [15]. In fresh
BAL, the majority of 7AAD+ leukocytes were non-lymphoid, but the 7-AAD+ lymphoid
and non-lymphoid components could still differentiated from each other by light scatter
characteristics (figure 3.4). Thus, the exclusion of 7-AAD+ events will overestimate the
proportion of lymphocytes and underestimate macrophages and granulocytes that are
more prone to cell death.
Comparisons between FCM and cytospin were made using three statistical
techniques. First, the coefficient of variation for each method in determining leukocyte
subsets was assessed by the analysis of 10 parallel preparations of cytospins and FCM
tubes from the same BAL sample repeated with 5 different samples. The coefficients of
variation by FCM were considerably lower than by cytospin for each leukocyte subset
(Table 3.1), demonstrating the superior precision of FCM. Such a finding is unsurprising
as a mean of 9305 CD45+ events were counted by FCM in this study compared with 500
cells by cytospin. Second, correlation plots between the two methods for the
enumeration of lymphocytes, granulocytes and macrophages were performed to
demonstrate the excellent overall agreement of the mean values. Third, the two methods
78

were scrutinized using the Bland-Altman test (figure 3.6) to detect any consistent
variation between the two techniques. Bland-Altman analysis demonstrated a slight
selective accumulation of the larger macrophages and the reciprocal depletion of the
smaller lymphocytes by cytospin when compared to FCM. Such a phenomena has
previously been described when stimulated large blast cells preferentially accumulated
on cytospins at the expense of small lymphocytes [16].
The FCM method described here distinguishes granulocytes from macrophages by
virtue of CD15 expression. CD15+ granulocytes consist of neutrophils, eosinophils and
basophils. Basophils are rare populations in BAL, but the presence of eosinophils can be
diagnostically helpful. Eosinophils were found to co-express both CD15 and the IgE
receptor antigen, CD23 (Figure 3.2), whereas neutrophils were CD15+ but did not
express CD23.
In summary, a simple flow cytometric technique has been described for
distinguishing the BAL leukocyte populations that avoids the potential complications
recorded by previous investigators [12]. This system, using primary immunological gating
of CD45+ events in conjunction with the granulocyte marker CD15 and the eosinophil
marker CD23 represents is an effective antibody panel for the delineation of the clinically
relevant leukocyte subsets in BAL with apoptotic markers such as 7AAD demonstrated
to be unhelpful. Statistical analysis has confirmed close correlations between the
leukocyte populations demonstrated by FCM and by cytospin preparations while also
documenting that FCM is superior in terms of precision, reliability and robustness. These
features, combined with its speed and the ability to perform simple additional lymphocyte
phenotyping panels argue strongly in favor of FCM being adopted as a standard method
for BAL analysis.
3.5 References1. Campbell DA, Poulter LW and du Bois RM. Immunocompetent cells in
bronchoalveolar lavage reflect the cell populations in transbronchial biopsies in
pulmonary sarcoidosis. Am Rev Respir Dis 1985;132:1300-6.
2. Agostini C, Trentin L, Zambello R, et al. CDS alveolitis in sarcoidosis: incidence,
phenotypic characteristics, and clinical features. Am J Med 1993;95:466-72.
3. Hunninghake GW, Kawanami O, Ferrans VJ, et al. Characterization of the
inflammatory and immune effector cells in the lung parenchyma of patients with
interstitial lung disease. Am Rev Respir Dis 1981;123:407-12.
79

4. Poletti V, Castrilli G, Romagna M, et al. Bronchoalveolar lavage, histological and
immunohistochemical features in cryptogenic organizing pneumonia. Monaldi
Arch Chest Dis 1996;51:289-95.
5. Jensen BN, Lisse IM, Gerstoft J, et al. Cellular profiles in bronchoalveolar lavage
fluid of HIV-infected patients with pulmonary symptoms: relation to diagnosis and
prognosis. Aids 1991;5:527-33
6. Sternberg Rl, Baughman RP, Dohn MN and First MR. Utility of bronchoalveolar
lavage in assessing pneumonia in immunosuppressed renal transplant recipients.
Am J Med 1993;95:358-64
7. Wells AU, Mansell DM, Haslam PL, et ai. Bronchoalveolar lavage cellularity: lone
cryptogenic fibrosing alveolitis compared with the fibrosing alveolitis of systemic
sclerosis. Am J Respir Cht Care Med 1998;157:1474-82.
8. Tiroke AH, Bewig B and Haverich A. Bronchoalveolar lavage in lung
transplantation. State of the art. Clin Transplant 1999;13:131-57.
9. Ward 0, Whitford H, Snell G, et ai. Bronchoalveolar lavage macrophage and
lymphocyte phenotypes in lung transplant recipients. J Heart Lung Transplant
2001;20:1064-74.
10. Costabel U, Bross KJ and Matthys H. Diagnosis by bronchoalveolar lavage of
cause of pulmonary infiltrates in haematological malignancies. Br Med J (Clin
Res Ed) 1985;290:1041.
11. Padovan OS, Behr J, Allmeling AM, et ai. Immunophenotyping of lymphocyte
subsets in bronchoalveolar lavage fluid. Comparison of flow cytometric and
immunocytochemical techniques. J Immunol Methods 1992;147:27-32.
12. Brandt B, Thomas M, von Eiff M and Assmann G. Immunophenotyping of
lymphocytes obtained by bronchoalveolar lavage: description of an all-purpose
tricolor flow cytometric application. J Immunol Methods 1996;194:95-102.
13. Dauber JH, Wagner M, Brunsvold S, et al. Flow cytometric analysis of
lymphocyte phenotypes in bronchoalveolar lavage fluid: comparison of a two-
color technique with a standard immunoperoxidase assay. Am J Respir Cell Mol
8/0/1992;7:531-41.
14. Loken MR, Brosnan JM, Bach BA and Ault KA. Establishing optimal lymphocyte
gates for immunophenotyping by flow cytometry. Cytometry 1990;11:453-9.
80
15. Schmid I, Krall WJ, Uittenbogaart CH, et al. Dead cell discrimination with 7-
amino-actinomycin D in combination with dual color immunofluorescence in
single laser flow cytometry. Cytometry 1992;13:204-8.
16. Janossy G. Polyclonal activation of murine and human T and B lymphocytes.
University College London, 1974 PhD thesis.
81

Chapter 4
Optimal Gating Strategies for
Determining Bronchoalveolar Lavage
CD4/CD8 Lymphocyte Ratios by Flow
Cytometry
82

4.1 IntroductionThe aim of this chapter was to compare different gating strategies for the determination
of CD4/CD8 ratios in BAL with a gold standard’ flow cytometric method. The impetus for
this investigation was to generate a single, 4-colour monoclonal antibody panel that
could determine the lymphocyte hetereogeneity based on the CD4/CD8 ratios in addition
to the relevant BAL leukocyte components discussed in the previous chapter.
Raised BAL CD4/CD8 lymphocyte ratios have been known to be associated with
diseases such as sarcoidosis and berryliosis and respiratory physicians have found
these parameters helpful in diagnostic decision making [1-4]. Nevertheless, these early
studies have used cumbersome immunofluoresence or immunoperoxidase methods for
lymphocyte subset analysis that are both time consuming and labour intensive. Flow
cytometry has been demonstrated to be an alternative method for BAL lymphocyte
subsetting [5-7] . However, it remains unclear what are the optimum combinations of
antibodies and gating strategies in order to perform BAL lymphocyte subset analysis.
Since the publication of these early studies on the use of FCM in BAL, there have been
few subsequent published reports dedicated to exploring this issue. By contrast there
has been a considerable degree of research interest in the generation of simple new
protocols for the determination of CD4 and CD8 lymphocyte subsets in blood [8, 9] . In
view of these developments, a simplified, CD45 panleukogating system where CD45+
low side scatter lymphocytes were gated and the CD4 and CD8 subsets directly
investigated without the use of the T cell marker, CD3. The CD4 and CD8 subsets
derived by this method were compared with several different techniques. As a gold
standard’ comparator, a more complex panel including an anti-CD3 antibody and a
precise gating strategy designed for optimum CD4 counting in blood was used [10]. In
addition, the CD4/CD8 ratios were also analysed using a CD3 gating method, but
without CD45 discrimination on a different flow cytometer.
4.2 Methods4.2.1 Patients
Immunocompetent patients undergoing BAL for suspected respiratory disease
were included. In addition, pleural fluid was also analysed from two patients. The
majority of patients (table 4.1) had either sarcoidosis or tuberculosis. HIV+
patients were not included since the BAL CD4/CD8 ratios were reduced and
83

therefore any differences between the two techniques would have been less easy
to detect.
4.2.3 Bronchoalveolar lavage and pleural fluid
BAL and pleural aspirations were performed for clinical indications. Standard
techniques for BAL and pleural aspirations were undertaken. Aliquots of BAL and
pleural fluid were sent to the relevant laboratories and the remainder was used to
perform differential cell counts.
4.2.4 Handling of samples
BAL and pleural fluid samples were washed and filtered as described in chapter
3.
4.2.5 Flow cytometry
The following monoclonal antibodies were used in optimised, pretitrated saturating
concentrations. For the first panel (method 1): CD4 FITC (Royal Free Hospital), CD8 PE
(Cymbus), CDS PECyT (Caltag) and CD45 APC (Pharmingen). For the second panel
(method 2): CD15 FITC (Cytognos, Salamanca, Spain), CD4 PE (Cymbus), CD8 PECy7
(Caltag) and CD45 APC (Pharmingen) were used. For the third panel (method 3): CD4
FITC (Royal Free Hospital), CD8-PE (Royal Free Hospital) and CD3-PEcy5 (Dako). SOpI
of BAL or pleural fluid was added to the different antibody panels and the samples
stained at room temperature in the dark for 15 minutes. For the first two panels a wash
step was then perfomed and the pellets resuspended up to a volume of 200pl with PBS-
A before running on a FACSCalibur flow cytometer (Becton Dickinson). The wash step
was omitted for the last panel and the samples were made up to 1ml with PBS-A before
running directly on the CytoronAbsolute flow cytometer (Ortho diagnostics).
20,000 CD45+, low side scatter lymphocytes were acquired for each sample run on
the FACSCalibur. The listmode data generated were analysed in the following fashion.
For the first panel, the gating strategy adopted was the same as that described by
Bergeron et al [10] . Briefly, CD45+ low side scatter lymphocytes were first gated and
then sent to a second dotplot to discriminate CD3+ T cells with low side scatter from
non-T cell lymphocytes. The CD3+ CD45+ events were then backgated to a CD45 side
84
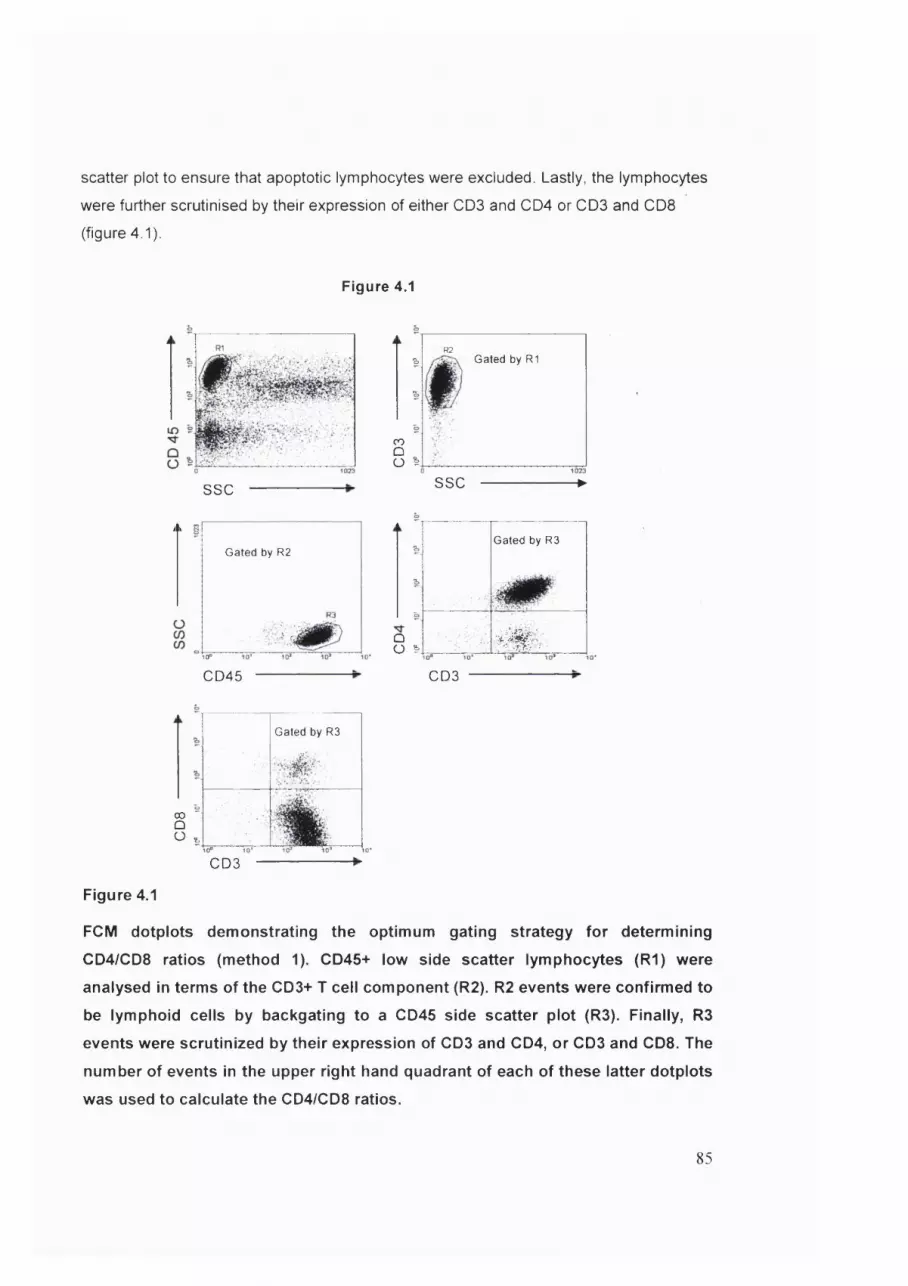
scatter plot to ensure that apoptotic lymphocytes were excluded. Lastly, the lymphocytes
were further scrutinised by their expression of either CD3 and CD4 or CD3 and CD8
(figure 4.1).
Figure 4.1
ssc
R2& Gated by R1
COt3Ü s
i I
Gated by R2
10"
CD45
SSC
&
QO &
—►
Gated by R3
# ' »
CD3
00 ÛO ^
Gated by R3
- '
CD3
Figure 4.1
FCM dotplots demonstrating the optimum gating strategy for determining
CD4/CD8 ratios (method 1). CD46+ low side scatter lymphocytes (R l) were
analysed in terms of the CD3+ T cell component (R2). R2 events were confirmed to
be lymphoid cells by backgating to a CD45 side scatter plot (R3). Finally, R3
events were scrutinized by their expression of CD3 and CD4, or CD3 and CD8. The
number of events in the upper right hand quadrant of each of these latter dotplots
was used to calculate the CD4/CD8 ratios.
85

For the simplified second panel (method 2), CD45+ low side scatter lymphocytes were
analysed directly in terms of CD4 and CD8 expression (figure 4.2). The final 3-colour
panel run on the cytoron was analysed as follows (method 3).
Figure 4.2
2
2
2COQO ^
Gated by R1#f
SSC
Figure 4.2
Dotplots demonstrating the simplified gating strategy for determining the BAL
CD4/CD8 ratios (method 2). CD46+ low side scatter lymphocytes were sent directly
to a second dotplot to differentiate the CD4 and CD8 components.
Figure 4.3
G ated by R2
C D 4 ------------------------------- 1
G ated by R1
ssc
Figure 4.3
Dotplots demonstrating the gating strategy to determine the BAL CD4/CD8 ratios
on samples run on the CytoronAbsolute (method 3). Cells with lymphoid forward
and side scatter (R1) were analysed in terms of their CD3 expression (R2) and
these CD3+ T lymphocytes were finally differentiated into CD4 and CD8 subsets.
86

Lymphocytes in BAL were gated on their intrinsic properties (figure 4.3) and sent to a
further dotplot in which CD3+ T cells were gated. This CD3+ lymphoid population was
then directly differentiated into its CD4+ and CD8+ components.
4.2.6 Statistics
The different methods for determining the BAL CD4/CD8 ratios were compared
by Spearmans correlation coefficient and by Bland Altman analysis.
4.3 Results4.3.1 Diagnoses in the study population
31 subjects were included in the analysis (table 4.1). Of these 15 had mycobacterium
tuberculosis diagnosed by culture confirmation and in one mycobacterium avium
intracellulari was grown. In 6 patients, sarcoidosis was diagnosed by a combination of
clinical suspicion, typical histological appearances on endobronchial or transbronchial
biopsies and failure to culture mycobacterium tuberculosis. Two bone marrow transplant
patients undenwent BAL for respiratory symptoms and in one cytomegalovirus was
detected by polymerase chain reaction (PCR). Cytomegalovirus was also detected in
BAL from a patient with chronic renal failure (patient 20). In 7 patients, no diagnosis was
determined from the BAL. Of the two pleural fluid specimens analysed, one was from a
patient with tuberculosis and in the other a pathological cause was not identified.
4.3.2 Comparison of CD4/CD8 ratios determined by the ‘gold standard’
(method 1 ) with the simplified technique (method 2 )
The BAL and pleural fluid CD4/CD8 ratios in the study population were compared using
method 1 and method 2 as described above. Comparisons were made both by
determining the correlation between the two methods (figure 4.4) and by Bland Altman
analysis (figure 4.5). An excellent close correlation was achieved (r=0.992). More
importantly. Bland Altman analysis demonstrated a very minimal difference between the
two techniques for BAL and pleural fluid CD4/CD8 ratio determination. When compared
to the method 1, the simplified gating strategy overestimated the CD4/CD8 ratio by only
0.08. Close levels of agreement were demonstrated between the two techniques
87

Table 4.1 Demographic details, diagnoses and BAL and pleural fluid CD4/CD8
ratios by different methods in the study population
Patient Age/sex DiagnosisCD4/CD8 ratio
Method 1
CD4/CD8 ratio
Method 2
CD4/CD8 ratio
Method 3
1 M45 Sarcoidosis 5.11 5.67 5.19
2 M51 Sarcoidosis 2.59 3.12 3.0
3 M40 Sarcoidosis 10.4 9.88 9.39
4 M52 Sarcoidosis 10.5 11.3 -
5 M30 Sarcoidosis 16.8 16.5 15.8
6 M33 Sarcoidosis 5.72 4.83 5.42
7 F 60 Tubercuiosis 1.56 1.65 1.62
8 F 37 Tubercuiosis 1.15 1.15 1.05
9 F 29 Tuberculosis 3.50 3.94 3.35
10 F 31 Tuberculosis 5.06 5.03 5.19
11 F 46 MAI 4.69 4.99 4.69
12 F 36 Tubercuiosis 3.47 3.32 3.44
13 F 41 Tuberculosis 5.33 5.05 4.12
14 M32 Tuberculosis 8.20 8.92 7.91
15 M24 Tuberculosis 2.62 2.83 2.57
16 F 42 Tuberculosis 2.63 2.37 2.61
17 M32 Tuberculosis 6.43 6.95 7.35
18 M 37 Tuberculosis 0.19 0.19 0.35
19 M27 Tubercuiosis 6.40 6.39 -
20 F 35 Tuberculosis 4.12 4.60 4.24
21 F 38 Tuberculosis 5.01 5.91 4.74
22 F 63 Tuberculosis 1.26 1.20 1.35
23 M27 Cytomegalovirus 0.64 0.63 0.66
24 M 31 Cytomegalovirus 0.52 0.53 0.44
25 M 52 NAD= 1.23 1.26 1.18
26 M29 NAD 0.47 0.45 0.44
27 M43 NAD 3.74 3.49 -
28 M 28 NAD 1.52 1.65 -
29 M38 NAD 1.96 2.53 -
30 F 63 Pleurai fluid NAD 6.37 5.97 8.06
31 M 32 Pleural fluid Tuberculosis 5.42 4.82 5.74
Footnotes MAI= Mycobacterium avium intracellulari
NAD=nothing abnormal detected

Figure 4 4
181
16-CNIT3 14-
12 -
R?=0.902O 10-
co
0 2 8 10 12 16 184 6 14Œ)4/Œ38 ratio methcd 1
Figure 4.4
Correlation plot for CD4/CD8 ratio determination between the complex
technique (method 1 ) and a more simplified approach (method 2 )
Figure 4.5
5
4
3
| o
i::-3
-4
-5
■0.77
......* ....... ♦.*....... .....................-0.08 (95% Cl:-0.26 to 0.1) • ♦ ^
-0.93
10
Log average CD4/CD8 ratio
Figure 4.5
Bland Altman comparisons between method 1 and 2 for the determination of
CD4/CD8 ratios.
89

with the differences ranging from + 0.77 to -0.93! The widest limits of agreement for the
CD4/CD8 ratios determined by these two methods were demonstrated in those with the
highest values (mostly in patients with sarcoidosis). At lower values, the limits of
agreement were tighter and there was very little variation when the CD4/CD8 ratios were
<2.5.
4.3.3 Differences between the BAL and pleural fluid CD4/CD8 ratios
measured by method 1 and method 3
This analysis was performed to assess whether a standard method for CD4/CD8
ratio determination in BAL and pleural fluid using CDS to identify T lymphocytes
performed as well as the ‘gold standard’, method 1. 24 BAL specimens and the
two pleural fluid samples were analysed by both methods. The correlation
between these two methods was close (R=0.9B8, figure 4.6).
Figure 4.6
18
16CO
14
12 = 0.98810
8006
4
2
00 2 6 8 10 164 12 14 18
CD4/CD8 ratios method 1
Figure 4.6
Correlation plot between the CD4/CD8 ratios derived on the FACSCalibur by a
complex gating system (method 1) and those derived by a different method on the
Cytoron (method 3).
90

Bland Altman analysis demonstrated an insignificant underestimation of the CD4/CD8
ratio by the cytoron of 0.02. The limits of agreement were slightly wider (-1.1 to 1.1) than
between method 1 and method 2 that were both performed on the FACSCalibur.
However, at lower CD4/CD8 ratios the limits of agreement where much closer, and the
wider limits of agreement were a feature of higher CD4/CD8 values.
Figure 4.7
5
4
3
2
1
00.02 (95% 01: -1.1 to 1.1)
1
2
3
-4
•50.1 1 10
Log a v e ra g e C D 4 /C D 8 ratio
Figure 4.7
Bland Altman plot comparing the CD4/CD8 ratios in BAL and pleural fluid between
method 1 and method 3
4.4 DiscussionThis study has been the first to assess the precision of flow cytometry for determining
tissue fluid CD4/CD8 ratios by comparing different flow cytometric methods. As the ‘gold
standard’, a recently published method using a combination of CD45-directed gating in
conjunction with CDS gating was used [10] . This gating strategy was designed as a
universal template to produce accurate absolute CD4 and CD8 T cell counts, but was
equally applicable for deriving the CD4/CD8 ratios. However, it was clear that optimum
precision was not an overriding concern for CD4/CD8 ratio measurement in tissue fluids.
Rather, the method should be able to distinguish between those with normal and high
91

ratios, with the upper limit of normal generally agreed to lie between 2.5 to 3 [11] .
Therefore, the primary aim was to develop a simplified gating strategy with adequate
precision to determine the CD4/CD8 ratios in BAL for clinical diagnostic purposes.
Interestingly, close agreement between these methods was demonstrated by Bland
Altman analysis with the simplified method overestimating the CD4/CD8 ratios by only
0.08. More importantly, the limits of agreement between these two techniques varied
between only 0.77 and -0.93, with the main variability occurring at the higher CD4/CD8
ratios. The conclusion, therefore, is that the simplified method offers no loss of precision
for CD4/CD8 ratio analysis. Such a finding is reassuring, since it might be expected that
the omission of a CD3 antibody could introduce an error into the CD4/CD8 ratios
analysis. The reason for this is that NK cells, which weakly express CD8 but do not
express CD3 may be erroneously included as CD8 cells in the simplified method. It is of
interest, therefore that this analysis included a bone marrow transplant patient (patient
24, table 4.1), in whom BAL was performed only three months after the transplant. Since
it is known that NK cells reconstitute early after transplantation followed by a slower
recovery of T cells [12] , the BAL cellular constituents were examined more closely in
this patient in order to determine the NK cell component. NK cells, defined as CD56+
and CD3-, constituted 20.1% of the total CD45+ low side scatter BAL lymphocyte pool.
Nevertheless, despite this high proportion of NK cells, the CD4/CD8 ratios determined by
both the optimum and the simplified method were virtually identical. The explanation for
this finding is that the gate to differentiate the CD8 component in the simplified method
was placed to include only the CD8 "^ * lymphocytes, thus excluding NK cells.
Both methods 1 and 2 described above were performed on the FACSCalibur flow
cytometer. In this study an additional panel was run using a different flow cytometer, the
CytoronAbsolute. This last method has been extensively employed for deriving CD4 and
CD8 counts in both blood [13] and BAL [14] using a CD3 gating strategy without the
use of panleukogating. Again, close correlations between the ‘gold standard’ method
and the Cytoron method were observed for the generation of CD4/CD8 ratios. Bland
Altman analysis demonstrated that the latter method underestimated the lymphocyte
ratios by only 0.02 and the limits of agreement ranged between -1.1 to 1.1. As with the
first comparison, the greatest variation occurred with the highest CD4/CD8 ratios.
Taken together, these observations demonstrate the remarkable precision of flow
cytometry. Here three different gating methods were employed and two different flow
cytometers used. Despite this, there was clinically insignificant variability between the
92

different techniques. It has been demonstrated in chapter 3 that CD45 directed gating, in
conjunction with only one other antibody, CD15 to determine the granulocyte component
in BAL was able to discriminate the major leukocyte subpopulations in BAL. Therefore, a
single 4-colour antibody panel can be constructed enabling the differentiation of not only
the lymphocyte, granulocyte and macrophage populations but also the CD4 and CD8
lymphocyte subset ratios. The following monoclonal antibodies were used: CD45, CD15,
CD4 and CD8. This single panel could therefore provide the maximum clinically relevant
information in a rapid and simple manner. Nevertheless, such a panel does not provide
information on the relative proportions of neutrophils and eosinophils within the total
granulocyte pool. The importance of eosinophils discrimination in BAL was discussed in
the previous chapter where it was also demonstrated that monoclonal antibodies against
the IgE receptor, CD23 could be used to discriminate eosinophils from neutrophils within
the CD15+ granulocyte pool. Preliminary observations have suggested that CD23 may
be included in the single panel by staining with CD15 and either CD4 or CD8 conjugated
to the same fluorochrome. This is possible since the difference in the scatter
characteristics between lymphocytes and granulocytes allow these two populations to be
easily distinguished within the CD45 panleukogate. Whether such a panel is
demonstrated to be equally reliable for lymphocyte and leukocyte subsetting remains to
be determined.
In summary, it has been demonstrated here that CD45-directed morphospectral gating
of lymphocytes is sufficient before CD4 and CD8 discrimination to assess the clinically
relevant CD4/CD8 ratio in both BAL and pleural fluid. The ratios generated by this
method varied by a clinically insignificant amount when compared to an optimal gating
strategy. Therefore, these results have made feasible a simple, single panel protocol for
the determination of both the major leukocyte components and the CD4/CD8 lymphocyte
subsets in BAL.
4.5 References1. Epstein PE, Dauber JH, Rossman MD,Daniele RP. Bronchoalveolar lavage in a
patient with chronic berylliosis: evidence for hypersensitivity pneumonitis. Ann
Intern Med 1982;97:213-6.
2. Costabel U, Bross KJ, Guzman J, et al. Predictive value of bronchoalveolar T cell
subsets for the course of pulmonary sarcoidosis. Ann N Y Acad Sol
1986;465:418-26.
93

3. Drent M, Wagenaar SS, Mulder PH, et al. Bronchoalveolar lavage fluid profiles in
sarcoidosis, tuberculosis, and non-Hodgkin's and Hodgkin's disease. An
evaluation of differences. Chest 1994;105:514-9.
4. Ward K, O'Connor 0, Odium 0 ,Fitzgerald MX. Prognostic value of
bronchoalveolar lavage in sarcoidosis: the critical influence of disease
presentation. Thorax 1989;44:6-12.
5. Dauber JH, Wagner M, Brunsvold S, et al. Flow cytometric analysis of
lymphocyte phenotypes in bronchoalveolar lavage fluid: comparison of a two-
color technique with a standard immunoperoxidase assay. Am J Respir Cell Mol
B/o/1992;7:531-41.
6. Brandt B, Thomas M, von Eiff M, Assmann G. Immunophenotyping of
lymphocytes obtained by bronchoalveolar lavage: description of an all-purpose
tricolor flow cytometric application. J Immunol Methods 1996;194:95-102.
7. Padovan OS, Behr J, Allmeling AM, et al. Immunophenotyping of lymphocyte
subsets in bronchoalveolar lavage fluid. Comparison of flow cytometric and
immunocytochemical techniques. J Immunol Methods 1992;147:27-32.
8. Glencross DK SL, Jani IV, Barnett D and Janossy G. CD45-Assisted
Panleukogating for Accurate, Cost-Effective Dual-Platform CD4+ T-Cell
Enumeration. Cytometry (Clinical Cytometry) 2002;50:69-78
9. Janossy G, Jani IV, Bradley NJ, et al. Affordable CD4(+)-T-cell counting by flow
cytometry: CD45 gating for volumetric analysis. Clin Diagn Lab Immunol
2002;9:1085-94.
10. Bergeron M, Faucher S, Ding T, Phaneuf S,Mandy F. Evaluation of a universal
template for single-platform absolute T-lymphocyte subset enumeration.
Cytometry 2002;50:62-8.
11. Bronchoalveolar lavage constituents in healthy individuals, idiopathic pulmonary
fibrosis, and selected comparison groups. The BAL Cooperative Group Steering
Committee. Am Rev Respir Dis 1990;141:8169-202.
12. Barry SM, Johnson MA,Janossy G. Cytopathology or immunopathology? The
puzzle of cytomegalovirus pneumonitis revisited. Bone Marrow Transplant
2000;26:591-7.
13. Mercolino TJ, Connelly MC, Meyer EJ, et al. Immunologic differentiation of
absolute lymphocyte count with an integrated flow cytometric system: a new
concept for absolute T cell subset determinations. Cytometry 1995;22:48-59.
94
14. Whitehead BF, Stoehr C, Pinkie C, et al. Analysis of bronchoalveolar lavage from
human lung transplant recipients by flow cytometry. Respir Med 1995;89:27-34.
95

Chapter 5
Bronchoalveolar Lavage and Other
Tissue Fluid Leukocyte Differentials
Assessed by Flow Cytometry in Patients
with Distinct Clinical Syndromes
96

5.1 IntroductionIn the previous chapters, flow cytometry was used to simplify and optimize the
discrimination of both the BAL leukocyte differentials and CD4/CD8 ratios. In this
chapter, these parameters were determined in BAL from a large number of patients
investigated for respiratory disease. The results were then correlated with the clinical
findings in order to assess their diagnostic relevance.
Such a study is not new as numerous previous investigators have examined BAL
leukocyte differentials and shown certain characteristic features in a variety of clinical
diseases such as sarcoidosis [1-6], tuberculosis [7-9] and interstitial lung diseases [10,
11]. Nevertheless, these previous studies have exclusively used cytospin techniques to
determine the differentials. Although there have been some investigations using FCM on
BAL from patients with various interstitial lung diseases, these have focused mainly on
analysing either the CD4/CD8 I lymphocyte subset ratios [12, 13], or the lymphocyte
proportions using CD45 panleukogating and light scatter characteristics [14, 15]. Whilst
the BAL lymphocyte percentages and CD4/CD8 ratio are undoubtedly the most useful
cellular characteristics for the diagnosis of sarcoidosis, the omission of details of the
neutrophil component is serious as a BAL neutrophilia in this disease may be an adverse
prognostic factor [16]. Similarly, raised neutrophils in interstitial lung diseases and
tuberculosis may also be relevent to the disease process.
Therefore, a comprehensive FCM system has not previously been applied to the
routine investigation of BAL in patients with respiratory disease and the leukocyte
differentials thus derived assessed for their diagnostic significance. The same flow
cytometric analysis was also performed on a small number of clinical specimens other
than BAL in order to demonstrate that such a system has more widespread clinical
applicability. These specimens included pleural, peritoneal, ascitic and cerebrospinal
fluid.
5.2 Methods5.2.1 Patients
Samples were analysed from patients undergoing routine bronchoscopy for the
investigation of respiratory disease of presumed infectious or inflammatory aetiology. 5
healthy control subjects also underwent bronchoscopy (median age 38; range 25-56, 2
smokers, 3 non-smokers). A small number of specimens of pleural, peritoneal or
97

cerebrospinal fluid were also investigated after samples had been sent for routine
diagnostic analysis. In total 167 subjects including the controls had BAL differentials
measured by FCM. In addition, five had pleural fluid, one peritoneal fluid and one
cerebrospinal fluid measured by the same procedure.
5.2.2 Bronchoalveolar lavage and bronchial biopsy
BAL was performed as previously detailed and according to British Thoracic Society
guidelines. In cases with focal abnormalities detected on thoracic radiographs or
computed tomograms, the BAL was site-directed to these areas. In those in whom either
diffuse radiological abnormalities were noted, or the chest radiography was normal but
respiratory pathology was still suspected, standard right middle lobe BAL’s were
performed. In several cases with pulmonary tuberculosis, BAL was undertaken from both
a radiologically abnormal and normal area. In these latter cases, 150ml of normal saline
was instilled into the radiologically affected area and 50ml into the right middle lobe.
10ml of blood was collected into a lithium heparinised tube at the time of bronchoscopy.
In patients suspected of having sarcoidosis, endobronchial, and in most cases
transbronchial biopsies were performed in addition to BAL.
5.2.3 Acquisition of pleural, peritoneal and cerebrospinal fluid samples
Samples obtained from pleural, peritoneal and cerebrospinal sites were obtained
using standard sterile procedures by medical staff investigating patients with suspected
clinical disease. In these cases, aliquots were sent to the relevant diagnostic laboratories
and the remainder analysed by flow cytometry.
5.2.4 Routine analysis of Clinical Specimens
All samples other than those from the normal control subjects who underwent BAL
were sent for routine analysis. Since the patients who underwent BAL and other
diagnostic procedures were being investigated for presumed infectious or inflammatory
conditions, an aliquot from all samples was sent to microbiology. Standard culture was
performed with an additional Ziehl-Neelson smear for acid-alcohol fast bacilli,
polymerase chain reaction (PGR) and culture on Lowenstein-Jensen medium if
tuberculosis (IB) was suspected. Fungal culture was also performed in those at high risk
such as bone marrow transplant patients. In almost all specimens a further sample was
sent to cytology. Stained cytology specimens were examined for the presence of acid-
98

alcohol fast bacilli, pneumocystis carinii, fungal hyphae and viral inclusion bodies. In
addition a comment was made on the relative proportions of the leukocyte populations
although a formal leukocyte differential was not performed. Lastly, in BAL and other
samples where a viral aetiology was considered, an aliquot was sent to virology where
relevant immunofluorescence or enzyme linked immunoabsorbant (ELISA) assays were
performed. In BAL samples, adenovirus, influenza and parainfluenza viruses as well as
respiratory syncitial virus were routinely tested for. In selected samples from patients
who had undergone bone marrow transplantation, or those severely
immunocompromised due to HIV, a cytomegalovirus direct antigen fluorescent foci test
(DEAFF) and cytomegalovirus PCR were performed. All HIV+ BAL specimens were sent
to microbiology, cytology and virology.
Endobronchial, and transbronchial biopsies from patients with sarcoidosis were
examined for the characteristic histological features of the disease. Some cases
presenting with stage 1 pulmonary disease with hilar adenopathy underwent mediastinal
lymph node biopsies following failed endobronchial and transbronchial biopsy
procedures. Patients with suspected sarcoidosis also had their serum angiotensin
converting enzyme (SACE) levels measured routinely in biochemistry.
The pleural, peritoneal and cerebrospinal samples were analysed in a similar manner.
Formal leukocyte differential counts were determined in the microbiology laboratory for
cerebrospinal and peritoneal fluid samples and expressed as the number of cells per
mm . In addition, the protein and glucose concentrations were also determined in these
samples. Further tests such as lactate dehydrogenase levels and pH were performed on
pleural fluid samples.
5.2.5 Preparation of Specimens
BAL specimens were collected on ice and analysed within two hours. Aliquots were sent
for routine analysis and the remainder was prepared for flow cytometric analysis as
detailed in chapter 3. The non-BAL specimens were also prepared in the same way.
Briefly, this involved centrifugation, filtering and a further centrifugation step before the
cell pellets were resuspended up to a volume of 1 ml in phosphate buffered saline
(PBS).
5.2.6 Flow Cytometry
Flow cytometry was performed following staining with CD45 FITC and CD15 PE on both
the prepared BAL samples as well as peripheral blood as detailed in chapter 3. In
99

addition, a second panel containing CD4-FITC (Royal Free Hospital), CD8-PE (Royal
Free Hospital) and CD3-PEcy5 (Dako, Ely, UK) was also used to assess the CD4/CD8
ratios as described in chapter 4. The samples were run on a Cytoron flow cytometer
using an absolute counting protocol. Gating strategies using a CD45 panleukogate and a
CD15+ granulocyte gate were performed and the lymphocyte, macrophage/monocyte
and granulocyte proportions calculated as detailed previously in chapter 3. The
CD4/CD8 ratios were determined as detailed in chapter 4.
5.2.7 Statistics
Data on leukocyte differentials and CD4/CD8 ratios was not normally distributed and
therefore median values and interquartile ranges were quoted in the text. Comparison
between data sets was performed using Mann-Whitney analysis.
5.3 Results5.3.1 General characteristics of BAL
The median volume of saline instilled during BAL was 180ml (IQR: 180-200ml) and
the median return was 50% (IQR: 40%-55.6%), Table 5.1. Following removal of aliquots
for routine analysis, the remaining BAL (normally more than 25ml) was left for analysis.
When the BAL sample had been washed, filtered and the pellet resuspended up to a
volume of 1 ml, only 50pl was used for the leukocyte differentials and 50pl for the
CD4/CD8 ratios. The remaining 0.9ml of BAL was reserved for further phenotypic and
functional analysis in the HIV-infected group and those with suspected tuberculosis.
Therefore, the number of events acquired following staining with CD45 and GDI 5
represented only 5% of the available sample. The median total number of CD45+
leukocytes acquired from the 50pl sample even after resuspension up to 1ml was 8312
(IQR: 4867-17440).
These findings confirm that routine clinical BAL specimens provide more than
adequate cells for the simple flow cytometric analysis described here. The majority of
samples were of good quality as determined by the percentage of CD45+ leukocytes in
the total number of events acquired by FCM. A median of 82.0% (IQR: 57.4-92.3%) of all
events fell within the panleukogate. The non-leukocyte cells were a mixture of epithelial
cells and non-cellular debris.
1 0 0

Since an absolute counting FCM was used (CytoronAbsolute), the absolute number of
events in the total (1 ml) BAL sample could be calculated. The median number of CD45+
BAL leukocytes was 7.5 X 10® (IQR: 3.6-14.4 X 10®).
Table 5.1 Characteristics of BAL from study population
Characteristic Median value Inter-quartile range
Saline instilled at BAL (ml) 180 180-200
% return of saline 50% 40-55.6%
Number of leukocytes acquired by FCM 8312 4867-17440
% Leukocytes in total number of BAL events 82.0 % 57.4-92.3%
Total number of leukocytes in BAL sample 7.5X10® 3.6-14.4 X 10®
5.3.2 Diagnoses in patients undergoing BAL
162 patients underwent BAL of whom 70 (43.2%) were HIV+, reflecting the particular
cohort of respiratory patients seen at the Royal Free Hospital. A pathological result was
obtained from the BAL, or endobronchial or transbronchial biopsies in 99 (61.1%), table
5.2. In several patients with sarcoidosis, the BAL provided additional diagnostic
information in terms of the lymphocyte percentages and CD4/CD8 ratio, even though the
endobronchial or transbronchial specimens were non-diagnostic.
The most common BAL diagnosis in both HIV+ and HIV- patients was tuberculosis,
accounting for 51 (31.5%) of all BAL. TB was diagnosed in 12 (17.1%) of BAL from HIV+
patients and 39 (42.4%) of those that were HIV-. Sarcoidosis was diagnosed in 15
patients. Bacterial organisms other than mycobacteria were only cultured in seven
patients (4.3%). The low frequency of bacterial culture positivity may in part have
reflected prior antibiotic usage. Nevertheless, a number of patients in whom a bacterial
infection was suspected, but not proven had a marked increase in BAL neutrophil count.
Two HIV- individuals with Pneumocystis carinii pneumonia (PCP) were
immunocompromised on therapy for lymphoma and of the two HIV- patients with
1 0 1

Table 5.2 Main BAL diagnoses In HIV- and HIV+ patients
HIV status BAL Diagnosis^ Number
No pathogen 25
Mycobacterium tuberculosis 39
sarcoid 15
Bacterial infection 1
HIV- (n=95) Atypical mycobacteria 2
Pneumocystis carinii 2
Cytomegalovirus 2
other 6
Total 92
No pathogen 41
Mycobacterium tuberculosis 12
Pneumocystis carinii 6
HIV+ (n=70) Bacterial infection 6
Cytomegalovirus 3
other 4
Total 72
Footnotes
1. Diagnosis determined by pathological investigation of BAL (see methods).
2. One HIV+ subject was co-infected with cytomegalovirus and TB.
cytomegalovirus infection, one was a bone marrow recipient and the other had chronic
renal failure. For further analysis, the BAL differentials were only considered in those in
whom a firm clinical diagnosis was determined in order to assess their diagnostic
relevance. The major clinical disease groups studied were those with sarcoidosis,
tuberculosis and HIV.
102

5.3.3 Sarcoidosis
15 patients were diagnosed with pulmonary saroidosis. The demographic, diagnostic
and clinical features together with the BAL leukocyte differentials and CD4/CD8 ratios
are displayed in table 5.3. Patients were divided dependent on the radiological staging of
their disease into those with stage 1, stage 2 or stage 3 pulmonary disease [17]. No
patients had stage 4 disease. A computed tomogram (CT) of the chest was performed
in all these patients. Stage 1 pulmonary sarcoidosis included those with bilateral hilar
lymphadenopathy without evidence of interstitial or parenchymal disease. Patients with
Stage 2 disease had mediastinal and/or hilar lymphadenopathy with evidence of
pulmonary involvement. Stage 3 disease comprised those with interstitial or
parenchymal disease without lymphadenopathy and stage 4 was those with irreversible
pulmonary fibrosis. The diagnosis was supported by endobronchial or transbronchial
biopsy at bronchoscopy in six patients (37.5%). For a further two patients characteristic
histological features were also determined by mediastinal lymph node biopsy following
inconclusive bronchial biopsies. All BAL and biopsy specimens were sent for
mycobacterial culture and all were negative. In seven cases, the biopsies were not
helpful and a combination of high clinical suspicion, a raised serum angiotensin
converting enzyme (SACE) level and an abnormal BAL lymphocyte profile were
supportive of the diagnosis in most cases (table 5.3). Patient 15 had skin lesions from
which histology demonstrated characteristic features of sarcoidosis.
When analysed together, the BAL leukocyte differentials in the sarcoidosis patients
demonstrated a striking lymphocytosis (median 65.7%, IQR: 46.4- 77.0%). When the
patients were divided into the different stages of pulmonary disease (figure 5.1), the
median percentage lymphocytosis was higher in those with stage 1 (74.4%) than those
with stage 2 disease (51.2%). This difference was not significant (p=0.11). In the single
patient with stage 3 disease the BAL lymphocyte percentage was 35.3%.
The median BAL CD4/CD8 ratio for the whole group was 5.1 (IQR: 3.9-9.5), but as
with the BAL lymphocyte percentages, the CD4/CD8 ratio was higher in stage 1 (median
8.8) than stage 2 sarcoidosis (median 4.4), figure 5.2. The difference between the two
was not significant (p=0.15). In the single case with stage 3 disease, the BAL CD4/CD8
ratio was 4.2.
103

Table 5.3 Demographic and diagnostic features of patients with sarcoid.
Patient Sex/age Ettinicity^ H isto log / Stage® SAGE‘S
BAL leukocyte %GD4/
GD8®
Lymph Mac Neut
1 M 34 G Non-diagnostic 1 (BHL + EN) 40 78.0 19.5 2.5 8.0
2 F 29 G Non-diagnostic 1 (BHL + EN) 58 70.7 27.8 1.6 11.0
3 M 3 0 G Non-diagnostic 1 (BHL + EN) 112 83.8 15.7 0.5 15.8
4 F 42 G Supportive (med LN) 1 (BHL,ML) 89 65.7 ?1.6 0.9 4.6
5 F 41 G Non-diagnostic 1 (BHL + EN) 85 53.3 45.5 1.2 9.5
6 M 36 A Supportive (med LN) 1 (BHL) 80 81.9 17.9 0.2 4.8
7 F 49 BAG Supportive (EB) 2 (BHL + nodules) 135 44.8 53.4 1.8 8.7
8 F 71 G Supportive (EB+TB) 2 (BHL,ML + nodules) 169 82.0 17.5 0.5 2.5
9 F 40 G Supportive (EB+TB) 2 (BHL + nodules) 61 54.3 44.0 1.7 3.6
10 M 4 0 BA Supportive (LN+liver) 2 (BHL,ML + nodules) 254 68.4 24.7 6.9 9.4
11 M 33 G Non-diagnostic 2 (BHL,ML + nodules) 47 76.0 23.3 0.7 43.4
12 M 29 BA Supportive (EB) 2 (BHL,ML + nodules) 120 48.0 50.9 1.1 2.5
13 F 35 G Supportive (EB) 2 (BHL + nodules) 88 26.8 71.0 2.2 2.0
14 M 4 5 G Non-diagnostic 2 (BHL + nodules) 40 39.6 59.4 1 5.1
15 F 52 BA Non-diagnostic 3 (Reticulo-nodular) 112 35.3 64.6 0.1 4.2
Footnotes
1 Ethnicity: C= Caucasian, A= Asian, BAC= black Afro-Caribbean, BA= black
African, 0= other.
2 Supportive histology included non-caseating granulomas. The biopsy site is in
parenthesis. Med LN = mediastinal lymph node biopsy, EB = endobronchial
biopsy, TB = transbronchial biopsy. Non-diagnostic biopsies failed to
demonstrate granulomas in the lung.
3 Staging of pulmonary sarcoidosis into stage 1, 2 or 3 disease. BHL = bilateral
hilar lymphadenopathy, EN = erythema nodosum, ML = mediastinal
lymphadenopathy.
4 SACE = serum angiotensin converting enzyme. The normal range at the Royal
Free Hospital is < 50.
5 The BAL CD4/CD8 ratio determined by FCM.
104

Figure 5.1
100n
$
I75-
50-
25-
Stage 1 Stage 2 Stage 3
Figure 5.1
Percentage of BAL lymphocytes by flow cytometry in patients with sacoidosis
according to the stage of their pulmonary disease. The bars represent the median
values for each group. The differences between the groups were not statistically
significant.
Figure 5.2
20-1
o2So
o
stage 1 Stage 2 Stage 3
Figure 5.2
BAL CD4/CD8 ratio determined by FCM in patients with sarcoidosis according to
the stage of their disease. The bars represent median values.
105

5.3.4 Tuberculosis
51 patients were diagnosed with tuberculosis of which 39 were HIV seronegative
and 12 HIV seropositive. The leukocyte differentials and CD4/CD8 ratios were further
considered in HIV negative group, the majority of whom had pulmonary disease (31,
79.5%). Of the patients with non-pulmonary disease, two had tuberculous
lymphadenopathy, one spinal and one pharyngeal disease. These patients had normal
chest radiographs with failure to culture the organism from BAL. Four patients were
diagnosed with disseminated TB in which there was both pulmonary and extra-
pulmonary involvement. In patient 5 the predominant clinical manifestation was cerebral
tuberculomas. Patient 6 had miliary TB, whilst patients 7 and 8 had predominantly lymph
node disease.
Mycobacterium tuberculosis was confirmed by culture in all but three patients. In
patient 4 with pharyngeal TB, acid fast bacilli were seen within granulomas of a
pharyngeal biopsy, but the specimen was not sent for culture. The pharyngeal mass
resolved on treatment. Patients 33 and 34 in whom a clinical diagnosis of pulmonary TB
was made had suggestive respiratory symptoms and chest radiographic abnormalities
both of which resolved on anti-tuberculous therapy. M. tuberculosis was cultured from
the appropriate tissue biopsies of the patients with non-pulmonary TB, other than patient
4.
In most patients a polymerase chain reaction (PCR) test was also performed on the
BAL. The demographic and diagnostic characteristics as well as the BAL FCM findings
are detailed in table 5.3. The BAL leukocyte differentials demonstrated a lymphocytosis
in many, but not all patients with TB. The BAL lymphocyte percentages were compared
with those from the sarcoidosis patients and five healthy control subjects (figure 5.3).
The difference in the median BAL lymphocyte percentage between the patients with TB
and those with sarcoidosis was highly significant (p< 0.0001). Nevertheless, there was
still considerable overlap in the BAL lymphocyte percentages between these two groups
suggesting that a raised lymphocyte percentage alone would not be a very good
discriminating marker. When compared to the control subjects, there was no significant
difference in the BAL lymphocyte percentages in those with TB (p= 0.07).
Several patients with TB were noted to have very low BAL lymphocyte percentages,
and these were usually associated with a co-existing BAL granulocytosis. The site of the
BAL was detailed in this subgroup by referring to the chest radiographic and/or
computed tomographic findings in addition to the bronchoscopy report.
106

Table 5.4 Demographic, diagnostic and BAL FCM data of patients with TB
Patient Sex/age Ethnicity^ TB diagnosis BAL findings^ AFB PCR cuit
BAL Leukocyte % Lymph Mac Neut
BALCD4/CD8
1 F 16 BA Spinal TB 42.8 57.1 0.1 2.72 M 2 8 BA Lymph TB - - - 32.0 65.6 2.4 1.23 F 42 BA Lymph TB - - - 29.0 18.1 52.8 2.94 F 39 BUK Pharyngeal TB - - - 46.2 52.6 1.2 3.25 M 3 2 BA Disseminated TB - + + 43.6 55.3 1.1 7.36 M 21 BA Disseminated TB - + + 44.6 53.5 1.9 2.27 F 32 0 Disseminated TB - ND® + 20.2 77.9 2.1 2.78 F 41 BUK Disseminated TB - + + 27.6 70.2 2.2 4.19 F 24 C Pulmonary TB + + + 33.0 30.2 36.8 2.510 M 2 4 A Pulmonary TB + + + 62.0 37.1 0.9 0.411 F 21 BA Pulmonary TB + + + 20.8 6.3 72.9 11.712 M 18 BA Pulmonary TB - + + 33.5 63.7 2.8 2.013 M 2 4 A Pulmonary TB - - + 70.4 27.6 2.0 2.614 M 2 7 C Pulmonary TB - - + 15.7 82.4 1.9 2.415 M 3 7 A Pulmonary TB + + + 41.3 7.2 11.5 1.716 M 35 C Pulmonary TB + + + 4.6 27.9 67.5 1.217 M 31 C Pulmonary TB + + + 15.2 79.7 5.1 1.118 F 26 BA Pulmonary TB + + + 46.8 46 7.2 5.919 F 27 BA Pulmonary TB - - + 10.3 19.5 70.2 1.120 M 2 8 A Pulmonary TB - + + 7.0 70.6 22.4 1.321 M 31 C Pulmonary TB + + + 3.2 15.3 81.5 3.022 M 5 0 BUK Pulmonary TB + + + 0.7 6.0 93.3 2.923 M 19 BA Pulmonary TB + + + 18.0 14.0 68.0 4.324 M 5 5 A Pulmonary TB - + + 39.9 54.8 5.3 5.225 M 2 5 A Pulmonary TB - + + 44.9 43.9 11.2 3.426 M 3 0 A Pulmonary TB - + + 7.1 78.7 14.2 1.727 M 4 0 0 Pulmonary TB - + + 23.1 75.0 1.9 0.328 M 4 8 A Pulmonary TB - ND + 16.8 19.4 63.8 1.029 M 4 0 0 Pulmonary TB + ND + 16.9 14.1 69.0 2.830 M 3 5 0 Pulmonary TB - ND + 18.3 37.0 44.7 1.331 F 66 C Pulmonary TB + + + 1.3 18.3 80.4 0.632 F 35 A Pulmonary TB - - + 29.7 66.0 4.3 3.233 M 3 2 C Pulmonary TB - - - 43.3 52.6 4.1 4.734 M 4 0 C Pulmonary TB - - - 13.1 86.1 0.8 1.035 M 20 A Pulmonary TB - + + 14.6 78.7 6.7 2.336 M 3 3 BA Pulmonary TB + + + 28.2 35.5 36.3 4.637 F 20 A Pulmonary TB - + + 62.1 24.5 13.4 1.438 F C Pulmonary TB + - + 25.4 71.6 3 139 M A Pulmonary TB + ND + 35.8 63.3 0.9 1.7
Footnotes
1. Ethnicity. BA=black African, A=Asian, C=Caucasian, 0=other
2. Acid fast bacilli (APB), polymerase chain reaction (PCR) and culture results for
M. tuberculosis from BAL. Patients 1-3 had positive cultures from tissue biopsies.
Patients 33 and 34 were clinical diagnoses and patient 4 was a combination of
pathological and clinical diagnosis but without culture of the organism.
3. ND=not done
107

Figure 6.3
1 0 0
IS'o.cQ.E
75-
50-
25-
0-
TB Sarcoid Control
Figure 5.3
The BAL lymphocyte percentages in patients with tuberculosis, sarcoidosis and in
healthy control subjects. The bars represent median values.
Figure 5.475
I8
I>.
50
Pulmonary Pulmonary Non-pulmonaryTB TB cavity TB
Figure 5.4
The percentage of BAL lymphocytes in patients with pulmonary tuberculosis. The
first column contains the lymphocyte percentages when washings were taken
from areas of radiologically abnormal lung that were not cavities. In the second
column washings were taken from cavities and in the third column, washings were
taken from radiologically normal lung.
108

In cases where washings were performed from a pulmonary cavity, the predominant
leukocytes were granulocytes with a corresponding reduction in the lymphocyte
percentage. In several cases (patients 22 and 31), frank pus was aspirated at BAL. The
BAL lymphocyte percentages were then compared between those in whom washings
were taken from cavities, those with non-cavitatory radiographic abnormalities and those
with normal chest radiographs (figure 5.4). This latter population consisted of those with
non-pulmonary disease. A reanalysis of the BAL lymphocyte percentages following the
separation of those with tuberculosis into different groups based on the type of disease
revealed several interesting features.
First, those with non-pulmonary disease all had a BAL lymphocytosis, a finding that
is of relevance for the antigen-specific analyses detailed in chapter 8. Second, advanced
pulmonary TB with cavitation was characterized by a granulocytosis (neutrophila) with
corresponding low lymphocyte percentages. Nevertheless, even after those with
cavitation were separated from the main group with TB, two patients were noted to have
low BAL lymphocyte percentages, (patients 20 and 26, table 5.3). Interestingly, these
two individuals were entirely asymptomatic, but were referred to the infectious diseases
team at this hospital following the discovery of abnormal chest radiographs on arrival into
the United Kingdom by air. These findings are consistent with the hypothesis that the
immune response plays a primary role in the symptomatology of TB and that in the early
phase of mycobacterial proliferation, patients might be expected to have low BAL
lymphocyte percentages as these cells are actively recruited to the site of infection.
Finally, the BAL lymphocyte percentages were compared in eight patients with TB
in whom washings were simultaneously taken from radiologically normal and abnormal
lung (table 5.4). In two of these subjects (patients 19 and 21, table 4.3), washings were
taken from apical cavities as well as radiologically unaffected lobes. Taken together with
the BAL lymphocyte differentials from the patients with non-pulmonary disease, these
findings demonstrate that a generalised BAL lymphocytosis is a common feature in
patients with pulmonary and non-pulmonary TB. The two caveats are that washings
should not be taken from cavities and also that patients should be symptomatic.
A reanalysis of the BAL lymphocyte percentages following the exclusion of the two
patients with asymptomatic disease and those in whom washings were taken from
cavities demonstrated a significant difference when compared to the healthy controls
(P=0.01), figure 5.5.
109
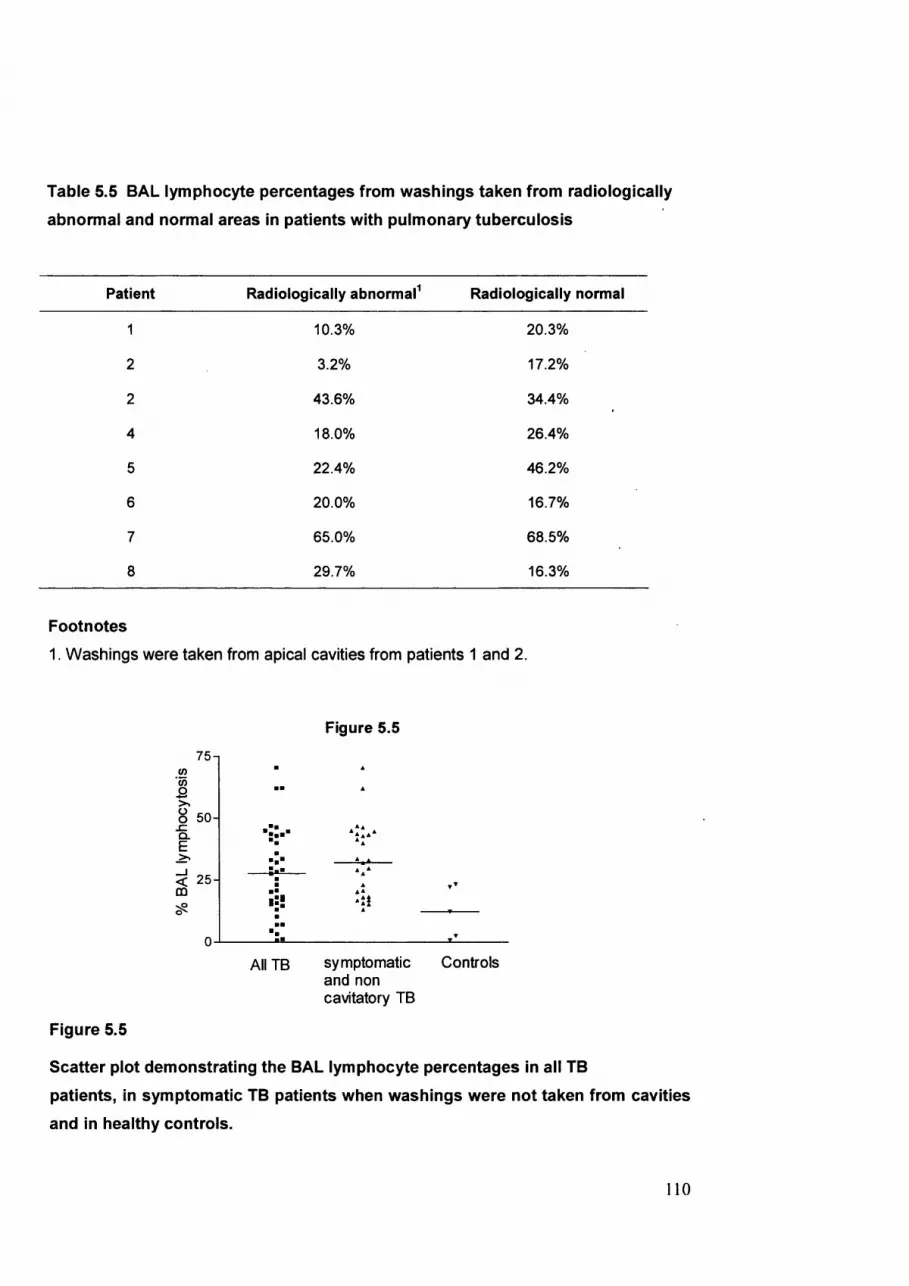
Table 5.5 BAL lymphocyte percentages from washings taken from radiologically
abnormal and normal areas in patients with pulmonary tuberculosis
Patient Radiologically abnormal Radiologically normal
1 10.3% 20.3%
2 3.2% 17.2%
2 43.6% 34.4%
4 18.0% 26.4%
5 22.4% 46.2%
6 20.0% 16.7%
7 65.0% 68.5%
8 29.7% 16.3%
Footnotes
1. Washings were taken from apical cavities from patients 1 and 2.
Figure 5.5
7 5(0
1O 5 0 .c Q.E
< 2 5 00
All TB symptomatic Controls and non cavitatory TB
Figure 5.5
Scatter plot demonstrating the BAL lymphocyte percentages in all TB
patients, in symptomatic TB patients when washings were not taken from cavities
and in healthy controls.
110

It should be noted both that the number of normal controls was small and also that
two non-smoking subjects had rather high BAL lymphocyte percentages of 22.2% and
23.3% respectively. The lymphocyte percentages in healthy subjects generally lie within
the range of 4-18% in non-smokers and 3-8% in smokers [11]. However, it has also been
demonstrated that the lymphocyte percentages in healthy individuals may fluctuate
considerably [18]. The comparison between the BAL lymphocyte differentials in the TB
patients and the controls may reach more statistical significance with a larger control
group.
The CD4/CD8 ratios were also examined in all patients with TB and compared with
the values obtained in patients with sarcoidosis and in control subjects (figure 5.6).
When compared to the patients with sarcoidosis, the BAL CD4/CD8 ratios in patients
with TB were significantly lower (p=0.001). There was no statistical difference in the
CD4/CD8 ratios between the patients with TB and the controls (p=0.44).
Figure 5.6
20-1
o200QÜIO
TB Sarcoidosis Controls
Figure 5.6
BAL CD4/CD8 ratios derived by flow cytometry in patients with tuberculosis,
sarcoidosis and in control subjects.
I l l

5.3.5 HIV
The final major group to be considered in terms of the BAL leukocyte differentials and
CD4/CD8 ratio were the HIV+ patients. Of the 70 total HIV+ patients in whom BAL was
performed, a diagnosis was achieved in 29 (41.4%). As expected, the CD4 counts were
lower in the patients with respiratory pathogens (median 47 cells/pl IQR: 11-109) than
those in whom no pathogens were found (median 133 cells/^il (IQR: 36-261). In the HIV+
group with respiratory disease, different BAL pathogens occurred at varying levels of
immunosuppression. In patients with bacterial infections, the median blood CD4 count
was 107 cells/|il (IQR: 104-176), in those with tuberculosis it was lower (median 60
cells/pl, IQR: 51-244) whilst the HIV+ group with PCP, CMV, MAI, cryptococcus and
invasive strongyloides had the lowest CD4 counts (median 14 cells/p.1 IQR: 7-31) (figure
5.7). Since the hallmark of HIV infection is the depletion of CD4 lymphocytes, both the
leukocyte differentials, and more especially the CD4/CD8 ratios would therefore be
expected to be disturbed in HIV+ individuals.
c3OoÛ0
1CQ
500
400-
300-
200 -
100
Figure 5.7
No BAL Bacterial pathogen infection
TB Otherdiagnoses
Figure 5.7
Blood CD4 count in HIV+ patients according to pathogens determined in BAL. The
group denoted ‘other diagnoses’ had Pneumocystis carinii, Cytomegalovirus,
Mycobacterium avium intracellulari, cryptococcus or strongyloides isolated from
the BAL. All data points and median values are shown
112

In view of this a decision was taken to focus the analysis on BAL from patients in whom
no respiratory pathogens were identified since the effect of any lung pathogens would be
difficult to interpret in the context of co-infection with HIV. Although there were 41
patients in whom no BAL diagnosis was made, a number of these subjects had very high
granulocyte percentages by FCM suggestive of a bacterial infection, despite failure to
culture an organism. Seven patients had a BAL granulocyte percentage of greater than
40% and were therefore excluded, leaving 34 available for analysis.
The remaining 34 patients were categorized according to their blood CD4 count into
three groups; those with a CD4 count of <100 cells/pl, those with 101-200 cells/pl and
those with >201 cells/pl. There was a tendency for an increasing BAL lymphocytosis in
those with lower blood CD4 counts (figure 5.8), although the differences between the
BAL lymphocyte percentages in the highest and lowest CD4 groups did not reach
statistical significance (p=0.06).
Figure 5.8
Q- 30
CD40-100
fi/
CD4101-200
CD4 201 +
Figure 5.8
Comparison of BAL lymphocyte percentages in HIV+ patients without respiratory
pathogens grouped according to their blood CD4 counts. Mean values and
standard error of the mean are shown.

More interesting was a comparison between the CD4/CD8 ratios in blood and BAL for
each of these CD4 categories. As expected, the CD4/CD8 ratios in both blood and BAL
declined in parallel with a decline in the blood CD4 count. However, for each blood CD4
category, the CD4/CD8 ratio in BAL was lower than that in blood (figure 5.9). The
differences between BAL and blood CD4/CD8 ratios reached statistical significance for
those with a CD4 count <100 and 101-200 cells/pl (p=0.009 and 0.01 respectively), but
not for the highest CD4 group (p=0.22).
Figure 5.9
oro
COÛOÛo
0.75-1
0.50-
0.25-
0.00
CD40-100
CD4101-200
CD4 201 +
Figure 5.9
Comparison of the CD4/CD8 ratios in blood (hatched bars) and BAL (black bars) in
HIV+ patients without respiratory pathogens according to their blood CD4 counts.
Means and standard error of the means are shown.
Taken together, the findings of a declining CD4/CD8 ratio, but an increasing
lymphocytosis in BAL in patients with increasing immunodeficiency suggests that a BAL
CD8 lymphocytosis may be a feature of advanced HIV disease.
In order to directly investigate whether this was the case, this data was also analysed
by separately determining the percentage of CD8 and CD4 cells from the total CD3+ T
cell pool in BAL and blood for each of the blood CD4 categories. CD4 lymphocytes
accounted for fewer of the total number of T cells in BAL than blood for each of the three
CD4 categories and the difference between these two sites was statistically significant
14

for each category (figure 5.10). When this analysis was performed on CDS lymphocytes,
no statistically significant difference was detected in the proportion of CDS lymphocytes
between BAL and blood for each CD4 category (figure 5.11).
40 -
° o .5 §_ 30
ÜQ +
2 0 -
O CO O
o Ü 10
+COQ Ü2 S
i sou
100n
Ô 754 oQ -
5 0 -
2 5 -
Figure 5.10
p=0.04
p=0.02
p=0.01
X
CD40-100
CD4101-200
Figure 5.11
CD4 201 +
p = 0 . 1 p = 0 . 1 2 p=0.44
CD40-100
CD4101-200
---- \—CD4 201 +
Figures 5.10 and 5.11
Box and whisker plots comparing the percentage of CD4 lymphocytes (figure 5.10)
and CDS lymphocytes (figure 5.11) from the total T cell compartment in BAL
(black) and blood (red) according to blood CD4 categories in HIV+ patients without
respiratory disease. The p values indicate the significance between the T cell
subset percentages in BAL with those in blood for each CD4 category.
15

When the CD8 proportions in BAL alone were considered, there was a significant
increase in this lymphocyte subset between those in the lowest and the highest blood
CD4 categories (p=0.002). These findings confirm that there is a more profound CD4
lymphopoenia in BAL than blood and that a CD8 lymphocytosis is a characteristic
feature of advanced HIV in both blood and BAL. Since the proportion of CD3+ events
that were neither CD4+ nor CD8+ did not change with declining CD4 count
(approximately 10% in BAL), it is reasonable to attribute the increasing total lymphocyte
percentage in BAL in HIV+ subjects to a CD8 lymphocytosis. Nevertheless, CD3-
lymphocytes such as natural killer cells and B cells could have contributed to the
lymphocytsosis and these were not measured here.
5.4 Analysis of leukocyte differentials in non-BAL fluidsLeukocyte differentials and CD4/CD8 ratios were performed by flow cytometry in tissue
fluids other than BAL in several cases. The samples investigated included pleural fluid
from five patients and ascitic and cerebrospinal fluid from one patient each.
Figure 5.12
ssc
bC D 1 5 C D 4
C D1 58
C D4
U .
S S C C D 1 5 C D4
Figure 5.12
FCM dotplots of leukocyte discrimination and lymphocyte T cell subset analysis in
pleural fluid (a), ascitic fluid (b) and cerebrospinal fluid (c).
116

As demonstrated in figure 5.12, CD45 directed panleukogating allowed the
discrimination of leukocytes from non-leukocytes and within the leukocyte gate
lymphocytes were easily distinguished in all samples by their low side scatter. The
discrimination of CD15+ granulocytes and CD4/CD8 T cell subsets was also achieved by
FCM in the same manner as with BAL.
5.5 DiscussionThis chapter has examined the BAL leukocyte differentials determined by flow
cytometry in patients with sarcoidosis, tuberculosis and HIV. Although many previous
studies have investigated these cellular features in similar patients using cytospin
technology, the published data using FCM has been limited mainly to determining BAL
CD4/CD8 ratios in sarcoidosis. The data presented here demonstrates broad agreement
with previous cytospin studies. This finding, together with fact that FCM enables the
rapid and precise enumeration of the CD4/CD8 ratios by FCM when compared to
cumbersome immunofluorescent techniques required for cytospin preparations supports
the conclusion of chapter 3 that FCM is the optimum technique for BAL leukocyte
analysis. Moreover, preliminary data presented here has demonstrated that a simple
CD45 directed gating strategy together with CD15 allows the differentiation of the
leukocyte populations in tissue fluids other than BAL. Likewise, the CD4/CD8 ratios in
these fluids can be readily determined by FCM exactly as in BAL.
Aside from this broad conclusion regarding the suitability of FCM for tissue fluid
analysis, the results from this chapter have also stimulated a critical appraisal of the
published literature on the diagnostic relevance of leukocyte differentials in different
respiratory diseases.
Sarcoidosis is the most widely examined disease in terms of BAL leukocyte
differentials. Many investigators have demonstrated that a BAL lymphocytosis and
increased CD4/CD8 ratio are supportive of the diagnosis [2-6, 19]. However, others have
questioned the diagnostic relevance of raised BAL CD4/CD8 ratios [20, 21]. One
problem with the analysis of these BAL parameters is that sarcoidosis is an evolving
disease and therefore patients presenting with early disease may have profoundly
different BAL differentials than those with late pulmonary fibrosis. Therefore studies that
have considered all stages of the disease together may be misleading. For example,
Kantrow et al analysed the CD4/CD8 ratio in 86 patients with sarcoidosis and found that
Only 42% of these had BAL CD4/CD8 ratios >4 [20]. However, in their sample 46% had
117

stage 2 and 14% stage 3 sarcoidosis. These authors did not distinguish the I cell subset
ratios with different stage of disease presentation. By contrast, the findings recorded in
this thesis support those of other investigators that stage 1 disease is more likely to be
associated with both a BAL lymphocytosis and a raised CD4/CD8 ratio [2, 4].
The conclusion, therefore is that in early sarcoidosis BAL is most likely to be a
helpful diagnostic test. This finding is of significance since in stage 1 disease
endobronchial and transbronchial biopsies are less likely to reveal characteristic non-
caseating granulomata than with stage 2 or 3 disease [22, 23]. The data presented in
this thesis supports these findings since none of the five patients with stage 1
sarcoidosis had diagnostic endobronchial or transbronchial biopsies and two of these
went on to have mediastinal lymph node biopsies. The value of undertaking
endobronchial and transbronchial biopsies may therefore be questioned in those with
presumed stage 1 sarcoidosis in whom Mycobacterium tuberculosis culture and skin
tests are negative and the BAL differentials are characteristic. In particular, it has been
suggested that the risks of performing mediastinal lymph node biopsy outweigh the
potential diagnostic benefits in this setting [24].
When patients with tuberculosis rather than sarcoidosis were examined, similar BAL
features were noted as with previous published data. In particular, a predominant BAL
lymphocytosis but with a CD4/CD8 ratio within the normal range has been described [8,
25]. The data presented in this thesis confirm that a BAL lymphocytosis is a common
feature in tuberculosis. It has also been demonstrated here that a raised BAL
lymphocyte percentage is a hallmark of non-pulmonary and disseminated TB.
When washings were performed from tuberculous cavities, the predominant cell
types were often granulocytes with corresponding decreases in the lymphocyte
percentages. Nevertheless, when washings were performed simultaneously from both
radiologically unaffected and affected areas, a lymphocytosis was noted from the
unaffected lung in all cases. This finding is contrary to that from previous investigators
where lymphocyte percentages in washings from radiologically normal lung were similar
to those seen in control subjects [9].
The demonstration of a BAL granulocytosis when washings were taken from
tuberculous cavities as compared to a lymphocytosis from radiologically normal or non-
cavitatory areas may reflect different outcomes in the battle between pathogen and host
response. It has been known from both murine and human studies that T cell responses,
in particular those involved in the production of type-1 cytokines such as IFN-y and TNF-
118
a are crucial for the formation of protective granulomas and the control of infection [26-
33]. In the light of these findings, the demonstration of large proportions of granulocytes
and corresponding low percentages of lymphocytes from tuberculous cavities may
represent failure of protective immune responses [34].
The data presented here on the BAL differentials from patients with both sarcoidosis
and tuberculosis is largely in agreement with previously published data. Only a few
healthy control subjects undenwent bronchoscopy and cell differential analysis in this
thesis. Two control subjects had relatively high BAL lymphocyte percentages (22.5 and
23%). Most large studies report the range of lymphocyte percentages to be between 3-
18% in non-smoking subjects and 3-8% in smokers [11]. Nevertheless, wide fluctuations
have been noted in the lymphocyte proportions in healthy subjects who had serial BAL’s
[18].
A large proportion of the BAL samples were obtained from HIV+ patients, reflecting
the mix of patients seen at this institution. As expected, opportunistic infections with
pathogens such as Pneumocystis carinii, cytomegalovirus, Mycobacterium avium
intracellulari and Cryptococcus occurred at low CD4 counts whereas tuberculosis and
other bacterial infections occurred with better preserved CD4 cell counts. The findings of
a relative CD4 lymphopoenia in BAL when compared to blood in patients in whom no
pathogens were determined in the BAL is of interest. Several investigators have
demonstrated that HIV is present in BAL [35-39]. The differences in CD4 lymphocyte
percentages between lung and blood could reflect differences in the HIV viral load
between the two sites. The CD4 lymphopoenia may be a function of either direct HIV
mediated cell death or alternatively of immune activated cell death. Some evidence from
simian models exists that immune activation may be the most important factor in the
local depletion of CD4 lymphocytes since macrophage tropic SIV viral strains
predominated in the lung whilst lymphotropic strains were dominant in the blood [35].
The role of immune activation in HIV pathogenesis is explored further in chapter 6.
These studies into the leukocyte differentials and lymphocyte subset ratios in BAL
demonstrate the difference between the lung and the blood in a variety of different
disease states and provide tantalizing clues to the nature of disease pathogenesis.
Nevertheless, such parameters are crude measurements of processes that are
undoubtedly subtle and complex. What is clear, however is two points: first that the lung
is the relevant investigative site in patients with respiratory disease and second that a
119

powerful and precise tool such as FCM will be instrumental in exploring the nature of
these immune responses.
5.6 References
1. Semenzato G, Chilosi M, Ossi E, et al. Bronchoalveolar lavage and lung
histology. Comparative analysis of inflammatory and immunocompetent cells in
patients with sarcoidosis and hypersensitivity pneumonitis. Am Rev RespirDls
1985;132:400-4.
2. Ward K, O'Connor C, Odium C and Fitzgerald MX. Prognostic value of
bronchoalveolar lavage in sarcoidosis: the critical influence of disease
presentation. Thorax 1989;44:6-12.
3. Costabel U, Bross KJ, Guzman J, et al. Predictive value of bronchoalveolar T cell
subsets for the course of pulmonary sarcoidosis. Ann N Y Acad Sol
1986;465:418-26.
4. Drent M, van Velzen-Blad H, Diamant M, et al. Relationship between
presentation of sarcoidosis and T lymphocyte profile. A study in bronchoalveolar
lavage fluid. Chest 1993;104:795-800.
5. Poulter LW, Rossi GA, Bjermer L, et al. The value of bronchoalveolar lavage in
the diagnosis and prognosis of sarcoidosis. EurRespirJ 1990;3:943-4.
6. Winterbauer RH, Lammert J, Selland M, et al. Bronchoalveolar lavage cell
populations in the diagnosis of sarcoidosis. Chest 1993;104:352-61.
7. Baughman RP, Dohn MN, Loudon RG and Frame PT. Bronchoscopy with
bronchoalveolar lavage in tuberculosis and fungal infections. Chest 1991;99:92-
7.
8. Hoheisel GB, Tabak L, Teschler H, et al. Bronchoalveolar lavage cytology and
immunocytology in pulmonary tuberculosis. Am J Respir Crit Care Med
1994;149:460-3.
9. Ainslie GM, Solomon JA and Bateman ED. Lymphocyte and lymphocyte subset
numbers in blood and in bronchoalveolar lavage and pleural fluid in various forms
of human pulmonary tuberculosis at presentation and during recovery. Thorax
1992;47:513-8.
120

10. Hunninghake GW, Kawanami O, Ferrans VJ, et al. Characterization of the
inflammatory and immune effector cells in the lung parenchyma of patients with
interstitial lung disease. Am Rev RespirDls 1981;123:407-12.
11. Bronchoalveolar lavage constituents in healthy individuals, idiopathic pulmonary
fibrosis, and selected comparison groups. The BAL Cooperative Group Steering
Committee. Am Rev RespirDls 1990;141:8169-202.
12. Padovan CS, Behr J, Allmeling AM, et al. Immunophenotyping of lymphocyte
subsets in bronchoalveolar lavage fluid. Comparison of flow cytometric and
immunocytochemical techniques. J Immunol Methods 1992;147:27-32.
13. Mukae H, Kohno 8, Morikawa I , et al. Two-color analysis of lymphocyte subsets
of bronchoalveolar lavage fluid and peripheral blood in Japanese patients with
sarcoidosis. Chest 1994;105:1474-80.
14. Dauber JH, Wagner M, Brunsvold 8, et al. Flow cytometric analysis of
lymphocyte phenotypes in bronchoalveolar lavage fluid: comparison of a two-
color technique with a standard immunoperoxidase assay. Am J Respir Cell Mol
B/o/1992;7:531-41.
15. Brandt B, Thomas M, von Eiff M and Assmann G. Immunophenotyping of
lymphocytes obtained by bronchoalveolar lavage: description of an all-purpose
tricolor flow cytometric application. J Immunol Methods 1996;194:95-102.
16. Drent M, Jacobs JA, de Vries J, et al. Does the cellular bronchoalveolar lavage
fluid profile reflect the severity of sarcoidosis? EurRespirJ 1999;13:1338-44.
17. Beaton A Beaton D and Leitch G. Crofton and Douglas's Respiratory Diseases. 5
ed. Oxford: Blackwell Bcience, 2000
18. Laviolette M. Lymphocyte fluctuation in bronchoalveolar lavage fluid in normal
volunteers. Thorax 1985;40:651-6.
19. Chretien J, Venet A, Danel 0, et al. Bronchoalveolar lavage in sarcoidosis.
Respiration 1985;48:222-30.
20. Kantrow BP, Meyer KG, Kidd P and Raghu G. The CD4/CD8 ratio in BAL fluid is
highly variable in sarcoidosis. EurRespirJ 1997;10:2716-21.
21. Agostini C, Trentin L, Zambello R, et al. CD8 alveolitis in sarcoidosis: incidence,
phenotypic characteristics, and clinical features. Am J Med 1993;95:466-72.
22. Descombes E, Gardiol D and Leuenberger P. Transbronchial lung biopsy: an
analysis of 530 cases with reference to the number of samples. Monaldi Arch
Chest Dis 1997;52:324-9.
121

23. Bilaceroglu S, Perim K, Gunel O, et al. Combining transbronchial aspiration with
endobronchial and transbronchial biopsy in sarcoidosis. Monaldi Arch Chest bis
1999;54:217-23.
24. Reich JM, Brouns MG, O'Connor EA and Edwards MJ. Mediastinoscopy in
patients with presumptive stage I sarcoidosis: a risk/benefit, cost/benefit analysis.
C/?esM 998; 113:147-53.
25. Drent M, Wagenaar SS, Mulder PH, et al. Bronchoalveolar lavage fluid profiles in
sarcoidosis, tuberculosis, and non-Hodgkin's and Hodgkin's disease. An
evaluation of differences. Chest 1994;105:514-9.
26. Chackerian AA, Perera TV and Behar SM. Gamma interferon-producing CD4+ I
lymphocytes in the lung correlate with resistance to infection with Mycobacterium
tuberculosis. Infect Immun 2001;69:2666-74.
27. Feng CG, Bean AG, Hooi H, et al. Increase in gamma interferon-secreting
CD8(+), as well as CD4(+), T cells in lungs following aerosol infection with
Mycobacterium tuberculosis. Infect Immun 1999;67:3242-7.
28. Flynn JL, Chan J, Triebold KJ, et al. An essential role for interferon gamma in
resistance to Mycobacterium tuberculosis infection. J Exp Med 1993; 178:2249-
54.
29. Flynn JL, Goldstein MM, Chan J, et al. Tumor necrosis factor-alpha is required in
the protective immune response against Mycobacterium tuberculosis in mice.
Immunity 1995;2:561-72.
30. Faith A, Schellenberg DM, Rees AD and Mitchell DM. Antigenic specificity and
subset analysis of T cells isolated from the bronchoalveolar lavage and pleural
effusion of patients with lung disease. Clin Exp Immunol 1992;87:272-8.
31. Schwander SK, Torres M, Sada E, et al. Enhanced responses to Mycobacterium
tuberculosis antigens by human alveolar lymphocytes during active pulmonary
tuberculosis. J Infect Dis 1998;178:1434-45.
32. Jouanguy E, Lamhamedi-Cherradi S, Altare F, et at. Partial interferon-gamma
receptor 1 deficiency in a child with tuberculoid bacillus Calmette-Guerin infection
and a sibling with clinical tuberculosis. J Clin Invest 1997;100:2658-64.
33. Newport MJ, Huxley CM, Huston S, et al. A mutation in the interferon-gamma-
receptor gene and susceptibility to mycobacterial infection. N Engl J Med
1996;335:1941-9.
122

34. Condos R, Rom WN, Liu YM and Schluger NW. Local immune responses
correlate with presentation and outcome in tuberculosis. Am J Respir Crit Care
Med 1998;157:729-35.
35. Babas T, Vieler E, Hauer DA, at al. Pathogenesis of SIV pneumonia: selective
replication of viral genotypes in the lung, y/ro/ogy 2001;287:371-81.
36. Twigg ML, Soliman DM, Day RB, etal. Lymphocytic alveolitis, bronchoalveolar
lavage viral load, and outcome in human immunodeficiency virus infection. Am J
Respir Crit Care Med 1999;159:1439-44.
37. Caufour P, Le Grand R, Cheret A, et ai. Secretion of beta-chemokines by
bronchoalveolar lavage cells during primary infection of macaques inoculated
with attenuated nef-deleted or pathogenic simian immunodeficiency virus strain
mac251. J Gen Virol 1999;80:767-76.
38. Semenzato G, Agostini 0, Chieco-Bianchi L and De Rossi A. HIV load in highly
purified CD8+ T cells retrieved from pulmonary and blood compartments. J
Leukoc Biol 1998;64:298-301.
39. Lewin SR, Kirihara J, Sonza S, et ai. HIV-1 DMA and mRNA concentrations are
similar in peripheral blood monocytes and alveolar macrophages in HIV-1-
infected individuals. Aids 1998;12:719-27.
123

Chapter 6
Increased Proportions of Activated and
Proliferating Memory CD8* T
Lymphocytes in both Blood and Lung
are Associated with Blood HIV Viral
Load.
124

6.1 IntroductionIn recent years there has been an intense debate about the nature of HIV
pathogenesis. It has been argued that CD4 depletion is primarily a result of infection and
subsequent cell death caused by HIV virions that homeostatic mechanisms are
eventually unable to correct [1, 2]. Others have emphasised that whilst HIV does infect
some CD4 lymphocytes, its primary mechanism of pathogenesis is by causing immune
activation of both CD4 and CD8 cells resulting in apoptosis of this activated population
[3-5]. Evidence in support of the latter theory has been provided by measuring the
proliferation of cells in vivo using radioactive labels such as Bromodeoxyuridine (brdU)
[5] or deuterated glucose [6]. These studies demonstrated reductions in not only CD4,
but also CDS cell proliferation in HIV-infected subjects when the HIV viral load was
reduced by drug therapy. Further support for the importance of immune activation in HIV
pathogenesis has been provided by the study of SIV in different Simian species. Sooty
Mangabeys and African Green Monkeys, which are the natural hosts of SIV tolerate high
SIV viral loads yet maintain relatively normal CD4 counts and live normal lifespans [7, 8j.
By contrast. Macaques infected with SIV undergo a course of infection similar to that in
humans with high viral loads resulting in CD4 cell depletion, illness and death. brDU
labeling studies have demonstrated that the Sooty Mangabeys have low rates of both
CD4 and CD8 cell turnover when compared to the Macaques [9], suggesting that they
have developed mechanisms to avoid immune activated cell death.
Studies in patients infected with HIV have demonstrated that immune activation,
determined by the expression of CD38 on CDS* T lymphocytes is associated with
disease progression [10-14] and that effective antiretroviral therapy results in a decline in
the expression of this marker in parallel with the fall in HIV viral load [15]. These findings
suggest that HIV drives immune activation, although some authors have stressed the
role of additional infections that might contribute to HIV-induced activation [16]
One serious drawback of previous studies has been the exclusive examination of
blood T lymphocytes. The lung was investigated in this study for two reasons: First,
previous studies have demonstrated that the lung is a site of HIV replication [17-20] and
therefore the investigation of this organ in addition to the blood may provide a more
closely associated picture between viral replicative events and immune activation than
the examination of blood alone. Second, the role of additional respiratory pathogens in
stimulating immune activation could be assessed by comparison with H iV subjects in
whom no BAL pathogen was identified.
125

In this study both the activation and proliferation of CDS'" memory T cells in lung and
blood was investigated. Activation was determined by CD38 expression on CD8+
lymphocytes using a simple, reproducible gating strategy. Proliferation was measured in
both the CD38‘’' ' ‘ and CD38^'"' CD8^ populations using Ki67, a nuclear marker
associated with dividing cells [21, 22].
6.2 Methods6.2.1 Patients
HIV-infected Patients undergoing bronchoscopy for suspected respiratory disease were
invited to take part in the study that was approved by the hospital ethics committee. 35
H iV patients were tested and a control group of 5 healthy individuals was also
examined. The HIV cohort mostly consisted of patients with advanced disease with only
five patients on antiretroviral therapy. The median CD4 count of the H lV patients was 75
cells/|il (IQR: 11-265) and median HIV viral load was 164,000 copies/ml (IQR: 49,300-
413,000) at the time of investigation. The demographic characteristics, CD4 counts, HIV
viral loads and BAL diagnoses of the study population are depicted in table 6.1.
6.2.2 Determination of HIV Viral Load
HIV viral loads were determined by the automated amplicor polymerase chain reaction
(Cobas Amplicor; Roche Diagnostics, Basel, Switzerland). The minimal level of detection
was 50 HIV copies/ml and the upper limit 750,000 copies/ml. Viral load was not
determined in BAL for the following reason. The procedure of BAL involves the
instillation of large volumes of saline (typically 180-200ml) with the bronchoscope
wedged into a subsegmental bronchus. The return of both fluid and cells is highly
variable and dependant on operator technique, patient tolerability and the pathological
state of the lungs. It is possible to control for these variable factors by measuring the
concentration of standard metabolites such as urea that are found in both BAL and blood
and adjusting the viral load measurements accordingly, but this was not performed here.
6.2.3 Standard Investigations for Respiratory Pathogens in BAL
All BAL samples from HIV+ individuals were investigated for the presence of respiratory
viruses, including influenza, parainfluenza, adenovirus and respiratory syncitial virus
126

Table 6.1. Demographic, Immunological, Viral and Diagnostic Data of the HIV+Study Population
Patient Sex/age Ethnicity^ Blood
CD4
Blood HIV
VL^
BAL
diagnosis
BAL
Lymphocyte%
BAL CD 4/CD8
Ratio
Antiretroviral
therapy
1 M 5 7 C 527 <50 No pathogens 44.7 0.89 HAART
2 M 35 C 397 <50 No pathogens 20.5 0.21 HAART
3 M 3 2 C 291 <50 No pathogens 3.7 0.71 HAART
4 F 47 BA 272 <400 No pathogens 87.3 0.05 HAART
5 M 4 3 C 185 506 No pathogens 6.4 0.02 HAART
6 M 3 6 BA 12 12,300 tuberculosis 76.3 0.15 HAART
7 M 4 3 BA 78 15,300 tuberculosis 40.1 0.17 none
8 M 2 9 C 566 21,000 No pathogens 6.8 0.4 none
9 M 4 2 C 3 33,600 tuberculosis 9.2 0.04 none
10 M 34 BA 185 65,000 tuberculosis 48.6 0.27 none
11 M 3 7 BA 2 83,200 tuberculosis 37.2 0.27 none
12 F 34 BA 285 88,600 tuberculosis 18.7 0.25 none
13 M 36 0 12 91,600 PCP^ 41.0 0.04 none
14 M 36 BA 258 92,400 No pathogens 87.7 0.04 none
15 M 4 6 C 9 110,000 PCP 81.4 0.002 none
16 M 4 3 0 1 110,000 PGP, CMV^, TB 11.7 0.02 none
17 F 46 0 7 146,000 PCP 22.1 0.14 none
18 M 3 2 0 126 164,000 PCP 61.3 0.07 none
19 M 41 C 399 217,000 No pathogens 24.6 0.16 none
20 M 35 BA 185 220,000 tuberculosis 29.9 0.13 none
21 M 3 0 C 40 229,000 pneumonia 12.8 0.44 none
22 M 3 9 BA 94 246,000 tuberculosis 56.1 0.01 none
23 M 2 7 C 720 261,000 No pathogens 20.6 0.47 none
24 M 34 C 10 306,000 No pathogens 55.3 0.01 none
25 M 4 9 C 75 357,000 No pathogens 33.1 0.01 none
26 M 3 2 0 145 403,000 No pathogens 14.9 0.02 none
Footnotes
Ethnicity; C=Caucasian, BA=black African, 0=other.
HIV viral load copies/ml
PCP= pneumocystis carinii pneumonia
CMV=cytomegalovirus
127

(RSV). Cytomegalovirus direct antigen fluorescent foci (DEAFF) test and polymerase
chain reaction (PGR) were performed in those with CD4 counts less than 100 cells/pl.
Culture of BAL for bacteria, fungi and mycobacteria was undertaken and in addition, a
stained specimen was examined by a cytopathologist for the presence of pneumocystis
carinii, acid fast bacilli and fungal pathogens.
6.2.4 Bronchoscopy and Sample Preparation
Fibreoptic bronchoscopy was performed according to established methodologies as
previously described in chapter 2. Bronchoalveolar lavage was performed from an area
of radiologically abnormal lung, otherwise standard right middle lobe lavage was
performed. The samples were kept on ice and then divided and aliquots sent to relevant
laboratories for pathological investigations. The remaining BAL was kept for
immunological analysis. The BAL samples were prepared as described in chapter 2. At
the time of bronchoscopy 5ml of EDTA peripheral blood was also taken.
6.2.5 Flow Cytometry and Gating strategies
The proportions of lymphocytes, granulocytes and alveolar macrophages in BAL in
addition to the CD4/CD8 ratios were determined as previously described in chapters 3
and 4. These procedures were carried out using a volumetric flow cytometer (cytoron
absolute, Raritan, New Jersey, USA) that enabled the absolute counts of CD4 and CDS
lymphocytes to be determined.
An aliquot of BAL containing 1x10® CDS'" lymphocytes and a sample of blood
containing the same number of cells were then fixed and permeabilised as previously
described in chapter 2. No lysis step was included as adequate decanting during the
fixation and permeabilisation stage removed nearly all red cells. Following this
procedure, the separate samples were stained at 4°C for 30 minutes, followed by a wash
step. The following monoclonal antibodies were used in pre-titrated optimal
concentrations in a single four-colour panel: KI67 FITC (Immunotech, Marseilles,
France), CD38 PE (Caltag Medsystems, Towcester, UK), CD8 PECy7 (Caltag
Medsystems) and CD45RA APC (Southern Biotechnology, clone sn130, Alabama,
USA). Stained blood and BAL specimens were run on a FACSCalibur flow cytometer
(Becton Dickinson, San Jose, California, US). 20,000 CD8+ lymphocytes were acquired
and the list mode data were analysed using Winlist 4.0 software (Verity inc. Topsham,
Virginia, USA). Primary immunological gating of CDQ* lymphocytes was performed and
128

these events that were confirmed to lie within a lymphoid scatter gate. These CD8^ cells
were further investigated in terms of their naive/memory phenotype by their CD45RA
isoform expression (Figure 6.1).
Figure 6.1
QO fc
IR1 . R 1 g a t e d
J R2C/5CO
ssc
Û j R 1 + R 2 g a t e d O &
F S C
R5 R4& 1
&
00( R 1 + R 2 + R 3 g a t e d
10* 10* 10’ io' 10’C D 4 5 R A C D 3 8
00Û
R 5 g a t e d
0 . 2 3 %
10* 10* 10 10* 10*
KÎ67 -------------------------►
COQO &
R 4 g a t e d
1 . 9 7 %
10* io
Ki67
Figure 6.1
FCM gating strategy for determining the activation and proliferation status of CD8"
memory lymphocytes. Primary immunological gating of CD8^ cells with low side
scatter (R1) is performed. These events are then confirmed to fall within a tight
lymphoid scatter gate (R2). Events fulfilling both R1 and R2 gating constraints are
then confirmed to be CD45RA (R3). These CD45- CD8^ memory lymphocytes are
then scrutinized in terms of their CD38 expression. 0038*""^^^ (R4) and CD38*""
CD8* memory lymphocytes are finally analysed in terms of their expression of the
proliferation marker, Ki67.
129

Since CD45RA' memory CD8+ lymphocytes formed the vast majority of BAL
lymphocytes with only a small percentage of CD45RA'^ naive/revertant cells, the degree
of activation in the memory pool in both blood and BAL compartments using CD38
expression was investigated here. Decisions regarding placement of the gate to
differentiate between CD38'' and CD38' CD8 cells were determined from staining of
control blood. The majority of CD8+ T cells in healthy individuals were CD38‘ " with only
a few activated cells, although Natural killer (NK) cells express this marker brightly.
Therefore, a decision was taken to draw a gate to differentiate between the
predominantly CD38' '"’ CD8+ lymphocytes and the CD38^"^^* NK cells. Using this method
on blood from healthy controls that had been fixed and permeabilised, the gate was
drawn at log 1.3 mean fluorescence intensity (MFI) CD38 expression (Figure 6.2). The
proportions of CD38^"^^' and CD38‘ ™ CD8* cells in BAL and blood from the HIV^ study
population and the normal controls was then determined by the same cut-off.
Lastly, the proportions of memory CD8^ lymphocytes that expressed the marker of
cell proliferation, Ki67 were determined in the CD38^"^^‘ and CD38'’'"' subpopulations
(Figure 6.1).
Figure 6.2
C D 3 8
Figure 6.2
Demonstration of the CD38 gating strategy by flow cytometry. CDS' CDB* '"’ natural
killer (NK) cells (R3) form a CDSB* "'® * population, whereas the CD3^, CDB* T
lymphocytes (R2) are predominantly CDSB'*'"’ In a healthy subject. The gate to
differentiate between CD3B^ and CD3B Is drawn at log 10 mean fluorescence
Intensity (MFI) between the NK and the bulk of the CDB T cell population.

6.2.6 Statistical Analysis
Median values and interquartile ranges were expressed in the text. Non-parametric
analysis by the Mann-Whitney method was used to compare the data sets.
6.3 Results6.3.1 Diagnoses in the HIV* patients with respiratory disease and BAL
lymphocyte percentages
In19 HIV" patients a respiratory pathogen was identified in BAL. The diagnoses were;
nine culture confirmed tuberculosis (TB), seven pneumocystis carinii pneumonia (PCP),
one bacterial pneumonia and one cytomegalovirus (CMV) infection. In addition, one
patient had multiple infections with TB, PCP and CMV simulataneously. In 19 HIV""
patients, no pathogens were identified in BAL. Three subjects in this group were
excluded because FCM demonstrated a marked BAL neutrophilia suggestive of a
bacterial lung infection despite failure to culture an organism. 16 HIV^ patients were
therefore included in this group. The BAL lymphocyte percentages were highly variable
(table 6.1). When compared to the control subjects, BAL from the HIV subjects without
respiratory disease contained a lymphocytosis (median 26.1% vs 10.2%, p=0.06). This
BAL lymphocytosis was more marked in the patients with respiratory disease (median
40.1%, p=0.02 compared to control values).
6.3.2 CD45 Isoform Expression of CD8* I lymphocytes in BAL and blood in
HIV* Patients and control subjects
BAL CDS'" T lymphocytes from HIV" patients were overwhelmingly of a memory
phenotype with a median of 97.5% CD45RA' (IQR: 96.1-97.9%). There was no
significant difference in the proportion of CD45RA' phenotype between those patients
with respiratory pathogens isolated in BAL (median 97.6%) and those in whom no
pathogens were isolated (median 97.1%). In the control patients, slightly fewer (median
91.8% IQR: 86.4-97.2%) of BAL lymphocytes were CD45RA-. Therefore, BAL in both the
HIV-infected patients and the control subjects contained predominantly memory CD8'" T
lymphocytes.
The expression of CD45RA'^ does not delineate a naïve CD8 population, however,
since some memory CD8 lymphocytes may switch from the CD45RA7RO'" isoform to
CD45RAVRO'. These cells can be distinguished from true naïve cells by their lack of
131

CD27 expression [23]. In BAL approximately a quarter of the CD45RA'" CD8+ T
lymphocytes in this HIV^ cohort also expressed CD27 and were therefore truly naïve
(data shown in chapter 7).
Peripheral blood from the HIV" patients comprised a median value of 56.3% (IQR:
48.5%-73.1%) of CD45RA- CD8* T lymphocytes. The corresponding value in blood from
the control patients was 36.9% (IQR: 32.1-42.0%).
6.3.3 CD38 expression In CD45RA' CD8* lymphocytes from BAL and blood
of HIV* patients and control subjects
The proportion CD38 "^^ CD8" T lymphocytes were examined in both blood and BAL.
The results were stratified according to the blood HIV viral load between the following
categories: undetectable to 1000 copies/ml (low viral load group), 1000 to 100,000
copies/ml (medium viral load) and greater than 100,000 copies/ml (high viral load, figure
6.3). In the first viral load category, three patients had an undetectable HIV viral load with
the assay limit of detection at 50 copies/ml. The remaining subjects had 400 and 506
HIV copies/ml. The upper limit of detection of the viral load assay was 750,000 copies/ml
and four patients had unspecified HIV viral loads above this level. Higher percentages of
CD38 "^^ CD8* T lymphocytes in both blood and BAL were associated with higher blood
HIV viral loads (figure 6.3). For the patients in the lowest category of viral load data the
median percentage of activated CD8 lymphocytes was 29.8% (IQR: 17.8-37.7%) in BAL
and 24.1% in blood (IQR: 21.9-28.4%). In the medium HIV viral load category, the CD8*
lymphocytes were more activated in both blood and BAL compartments with median
values of 42.4% (IQR: 35.9-63.8%) and 53.6% (IQR: 24.9-80.7%) respectively. Lastly, in
the highest viral load category, the CD8 lymphocytes were most activated, with median
values of CD38‘”’' ‘ CD8* T lymphocytes in BAL of 73.5% (IQR: 45.7-88.7%) and in
blood of 74.6% (IQR: 64.8-87.1%). In the control subjects only a minority of BAL (median
4.5%, IQR: 3.2-5.7%) and blood (median 12.3%, IQR: 4.2-14%) of the CD8^
lymphocytes were activated. When the control patients were examined, the percentages
of activated CD8 lymphocytes were much lower than in the HIV" patients in both BAL
(median 4.5% IQR: 3.2-5.7%) and blood (median 12.3% IQR: 4.2-14%).
132

Figure 6.3
m%oonCl
E>._ i00QO+
00coQO
100-
7 5 -
5 0 -
2 5 -
: :
C o n tro l H IV VL 0-1000
H IV V L 1000 -
100,000
HIV V L> 100 ,000 -
Flgure 6.3
Comparison between the percentages of 0038* "^ * CD8 + T lymphocytes in BAL
(black) and blood (red) in healthy controls and HIV patients according to HIV viral
load categories < 1 0 0 0 copies/ml, 1 0 0 0 -1 0 0 ,0 0 0 copies/ml and >1 0 0 ,0 0 0 copies/ml.
All data points are shown with median values demonstrated by bars.
There was a statistically significant difference in CD8 activation between the control
values and those in the low viral load category in both lung (p=0.03) and blood (p=0.05)
and in the CDB activation between the low and high viral load groups in BAL (p=0.03)
and blood (p=0.002). However, the CDB activation values only reached statistical
significance when comparing the medium-high viral load groups in BAL (p=0.03).
6.3.4 CD38 expression in CD45RA CD8 lymphocytes from BAL of HiV"
patients with and without Respiratory Pathogens
Since higher viral loads were associated with lower CD4 counts and increased rates
of pathogens detected in the lung, the analysis was repeated but this time comparing the
proportion of activated CDB+ lymphocytes for the same HIV viral load categories in BAL
from HIV^ patients with respiratory disease and those in whom no pathogens were
identified in BAL (figure 6.4). The aim for this analysis was to assess the relative
contributions of respiratory pathogens and of HIV viral load in inducing CDB cell
activation.
33

In the patients in whom BAL revealed no pathogens, the median values for
CD8+ T lymphocytes in BAL were 29.8%, 50.4% and 68.2% for each of the increasing
viral load categories. In the HIV" patients with respiratory pathogens, the median values
were 49.9% and 81.0% for the medium and high viral load categories, since no patients
with respiratory pathogens had a viral load in the lowest range group. There was no
significant difference in the percentage of activated CD8+ lymphocytes between the
patients with respiratory disease and those without (p=0.5 in the highest viral load
category). This data suggests that HIV viral load is the most significant factor in
stimulating CD8 lymphocyte activation.
Figure 6.4
(/)
Io.c
E
COQO+CO
COQÜ
lOOn
75-
50-
25-
HIV VL 0-1000
HIV VL 1000-
100,000
HIV VL >100,000
Figure 6.4
Comparison between 0038'' ' ' * CDS'" T lymphocytes from BAL of HIV* patients in
whom no respiratory pathogens were identified (black) and those in whom
respiratory pathogens were found in BAL (blue) according to HIV viral load
categories. Median values are shown. There were no patients with respiratory
disease in the lowest HIV viral load category.
134

5.3.5 Expression of KI67 In activated and unactivated CD8" lymphocytes in
lung and blood
The relationship between CD38 activation and CD8 lymphocyte proliferation was next
investigated by comparing the proportions of Ki67^ CD8+ cells in the CD38^"^^ and
CD38' '"’ populations in both BAL and blood (figure 6.5). Activated, CD38 "9^ CD8+ T
lymphocytes were associated with higher percentages of Ki67^ cells in BAL (median
2.37, IQR: 1.65-3.98%) than in the CD38 '"^ CD8+ lymphocytes (median 1.10%, IQR:
0.38-1.535). Increased percentages of Ki67^ CD8 lymphocytes in the activated cells
were also documented in blood (median 1.48%, IQR: 0.77-3.03%) when compared to
the unactivated cells (median 0.04%, IQR: 0-0.29%). These differences between the
Ki67^ populations in the activated and unactivated CD8+ lymphocytes were highly
significant for both compartments (p=<0.0001). In the control subjects, high proportions
of Ki67^ CD8+ cells were noted amongst the rarer CD38^''^^' population in BAL (median
7.68, IQR: 1.96%-11.5%), whilst in the predominant CD38^"^ component, Ki67
expression was very low (median 0.12%, IQR: 0-0.54%). Ki67^ CD8 cells in blood from
the controls were very low both in the CD38^"^^’ (median 0.24%) and the CD38^"^
(median 0.01%) populations.
Figure 6.5
c/30)
oQ.E00QÜN
10.0 -,
7.5-
5.0-
2.5-
0.0
HIV BAL HIV BAL HIV Blood HIV BloodCD38+ CD38- CD38+ CD38-
Flgure 6.5
Box and whisker plots determining the percentage of Ki67^ CD8 * T lymphocytes in
the 0038 " * and CD38^"" populations in both BAL (black) and blood (red).
135

6.4 Discussion
In this study the relationship between blood HIV viral load and the features of
activation and proliferation of memory CDS'" T lymphocytes in both blood and lung was
investigated. Early studies have noted that CD38 expression on CD8 lymphocytes was
associated with accelerated HIV disease progression [10, 11, 24], a finding that was
most clearly documented in the CD45RO"^ memory CD8'’ pool [12]. This observation can
be explained in the light of the immune activation model of HIV pathogenesis by
postulating that activated lymphocytes proliferate more rapidly and undergo apoptosis at
a much faster rate than unactivated lymphocytes.
Whilst previous studies have demonstrated increased lymphocyte proliferation in HIV-
infected humans and SIV-infected animals using Ki67 expression or radiolabelling, this is
the first study to investigate directly the role that immune activation plays in cell
proliferation in both the blood and a relevant tissue compartment, the lung. In this study it
has been demonstrated that activated, CD38‘’"®* memory CD8* cells have significantly
higher rates of proliferation as measured by Ki67 expression than CD38‘ '"’ CD8* cells in
both blood and lung. This finding, together with the demonstration that the CD8
activation status in both compartments was correlated with the blood HIV viral load is
direct evidence for HIV in promoting increased proliferation.
Some authors have questioned the extent to which Ki67 expression accurately
reflects cell proliferation [14]. This consideration has arisen due to the observation that
nearly half of the KiGT" CD4* lymphocytes also expressed CTLA-4, a marker for
activated cells arrested at the G1 stage of prolferation [25]. However, Ki67 may be a
more reliable measure of cell proliferation for CD8 lymphocytes since only 10% of Ki67*
CD8 cells also co-expressed CTLA-4 [14].
The HIV viral load in the lung has not been measured here since the process of
bronchoalveolar lavage introduces a highly variable dilution factor rendering quantitative
HIV viral loads difficult to interpret. Nevertheless, our data supports the findings of
previous investigators that the lung is a site of HIV replication [17-20].
Since this cohort included HIV-infected patients both with and without respiratory
disease, it was possible to further investigate the relationship between HIV and CD8
lymphocyte activation and to consider whether co-infections with respiratory pathogens
could play an important role in this process. No significant difference between the
CD3 8 bnght CD8* lung lymphocytes was documented between the patients with respiratory
136

pathogens and those without pathogens in each of the three HIV viral load categories.
This finding is important additional evidence for the primary role of HIV in driving cellular
activation. It cannot be concluded, however, that co-infections may not exacerbate
immune activation, since in our cohort most patients had either TB or PCP. It is
interesting to note that the patient in whom CMV was the only respiratory pathogen
found did not have especially activated BAL CD8+ lymphocytes.
Lastly, this study raises the issue of whether the CD38 activation status of CD8*
lymphocytes could be used as a surrogate marker for HIV viral load that may be
applicable in resource-poor settings. Whilst CD38* "® * CD8 cells were significantly higher
in both blood and BAL, for each viral load category there were several outliers
suggesting that such a marker may not be reliable in routine clinical practice. Moreover,
HIV-infected subjects from resource-poor settings may have increased activation status
of their lymphocytes due to a variety of co-factors as previously demonstrated [16].
In summary, a simple, reliable gating strategy for determining the CD38 activation
statues of CD8'" lymphocytes has been developed here. Using such a system it has
been shown that CD8 cell activation is related to the blood HIV viral load in both blood
and an important tissue site, the lung. The primary role of HIV in stimulating this immune
activation is strengthened by the demonstration that respiratory co-infections did not
significantly increase the CD8 activation state of lung CD8^ lymphocytes when compared
to those with matched HIV viral loads without respiratory pathogens. Lastly, it has also
been documented that the activated, CD38‘’"®* CD8 cells proliferate more than the
CD38'*" cells. Taken together, these findings are consistent with the model that HIV
drives cell activation and proliferation and that this may be the central mechanism of HIV
pathogenesis.
6.5 References
1. Ho DD, Neumann AU, Perelson AS, et al. Rapid turnover of plasma virions and
CD4 lymphocytes in HIV-1 infection. Nature 1995;373:123-6.
2. Mohri H, Bonhoeffer S, Monard 8, et ai. Rapid turnover of T lymphocytes in SIV-
infected rhesus macaques. Science 1998;279:1223-7.
3. Hazenberg MD, Stuart JW, Otto SA, et al. T-cell division in human
immunodeficiency virus (HIV)-I infection is mainly due to immune activation: a
137

longitudinal analysis in patients before and during highly active antiretroviral
therapy (HAART). Blood 2000;95:249-55.
4. Grossman Z, Meier-Schellersheim M, Sousa AE, et ai. CD4+ T-cell depletion in
HIV infection: are we closer to understanding the cause? Nat Med 2002;8:319-
23.
5. Kovacs JA, Lempicki RA, Sidorov lA, et ai. Identification of dynamically distinct
subpopulations of T lymphocytes that are differentially affected by HIV. J Exp
Med 2001;194:1731-41.
6. Deeks SG, Hoh R, Grant RM, et al. CD4+ T cell kinetics and activation in human
immunodeficiency virus-infected patients who remain viremic despite long-term
treatment with protease inhibitor-based therapy. J Infect Dis 2002;185:315-23.
7. Kaur A, Grant RM, Means RE, et al. Diverse host responses and outcomes
following simian immunodeficiency virus SIVmac239 infection in sooty
mangabeys and rhesus macaques. J Virol 1998;72:9597-611.
8. Broussard SR, Staprans SI, White R, et al. Simian immunodeficiency virus
replicates to high levels in naturally infected African green monkeys without
inducing immunologic or neurologic disease. J Virol 2001;75:2262-75.
9. Kaur A, Barabasz, A., Rosenzweig, M., McClure, H, Feinberg, M. and Johnson,
R. Dynamics of T-Lymphocyte Turnover in Sooty Mangabeys, a Non-Pathogenic
Host of Simian Immunodeficiency Virus Infection. In: 9th Conference on
Retroviruses and Opportunisitc Infections. Seattle, 2002
10. Levacher M, Hulstaert F, Tallet S, et al. The significance of activation markers on
CD8 lymphocytes in human immunodeficiency syndrome: staging and prognostic
value. Clin Exp Immunol 1992;90:376-82.
11. Giorgi JV, Liu Z, Hultin LE, et al. Elevated levels of CD38+ CD8+ T cells in HIV
infection add to the prognostic value of low CD4+ T cell levels: results of 6 years
of follow-up. The Los Angeles Center, Multicenter AIDS Cohort Study. J Acquir
Immune Defic Syndr 1993;6:904-12.
12. Bofill M, Mocroft A, Lipman M, et al. Increased numbers of primed activated
CD8+CD38+CD45RO+ T cells predict the decline of CD4+ T cells in HIV-1-
infected patients. Aids 1996;10:827-34.
13. Liu Z, Cumberland WG, Hultin LE, et al. Elevated CD38 antigen expression on
CD8+ T cells is a stronger marker for the risk of chronic HIV disease progression
to AIDS and death in the Multicenter AIDS Cohort Study than CD4+ cell count.
138

soluble immune activation markers, or combinations of HLA-DR and CD38
expression. J Acquir Immune Defic SyndrHum Retrovirol 1997;16:83-92.
14. Leng Q, Borkow G, Weisman Z, et al. Immune activation correlates better than
HIV plasma viral load with CD4 T-cell decline during HIV infection. J Acquir
Immune Defic Syndr 2001 ;27:389-97.
15. Tilling R, Kinloch S, Goh LE, et al. Parallel decline of CD8+/CD38++ T cells and
viraemia in response to quadruple highly active antiretroviral therapy in primary
HIV infection. Aids 2002;16:589-96.
16. Bentwich Z, Kalinkovich A and Weisman Z. Immune activation is a dominant
factor in the pathogenesis of African AIDS. Immunol Today 1995;16:187-91.
17. Chayt KJ, Harper ME, Marselle LM, et al. Detection of HTLV-III RNA in lungs of
patients with AIDS and pulmonary involvement. Jama 1986;256:2356-9.
18. Linnemann CC, Jr., Baughman RP, Frame PT and Floyd R. Recovery of human
immunodeficiency virus and detection of p24 antigen in bronchoalveolar lavage
fluid from adult patients with AIDS. Chest 1989;96:64-7.
19. Twigg HL, Soliman DM, Day RB, etal. Lymphocytic alveolitis, bronchoalveolar
lavage viral load, and outcome in human immunodeficiency virus infection. Am J
Respir Crit Care Med 1999; 159:1439-44.
20. Semenzato G, Agostini 0, Chieco-Bianchi L and De Rossi A. HIV load in highly
purified CD8+ T cells retrieved from pulmonary and blood compartments. J
Leukoc Biol 1998;64:298-301.
21. Gerdes J, Lemke H, Baisch H, et al. Cell cycle analysis of a cell proliferation-
associated human nuclear antigen defined by the monoclonal antibody Ki-67. J
Immunol 1984; 133:1710-5.
22. Schwarting R, Gerdes J, Niehus J, et al. Determination of the growth fraction in
cell suspensions by flow cytometry using the monoclonal antibody Ki-67. J
Immunol Methods 1986;90:65-70.
23. Hamann D, Kostense S, Wolthers KC, et al. Evidence that human
CD8+CD45RA+CD27- cells are induced by antigen and evolve through extensive
rounds of division. Int Immunol 1999;11:1027-33.
24. Liu Z, Hultin LE, Cumberland WG, et al. Elevated relative fluorescence intensity
of CD38 antigen expression on CD8+ T cells is a marker of poor prognosis in HIV
infection: results of 6 years of follow-up. Cytometry 1996;26:1-7.
139

25. Brunner MC, Chambers CA, Chan FK, et al. CTLA-4-Mediated inhibition of early
events of T cell proliferation. J Immunol 1999:162:5813-20.
140

Chapter 7
Memory Phenotype CD8+ T
Lymphocytes Including CD45RA+ CD27
Revertants Accumulate in the Lung
141

7.1 IntroductionThe pathways of differentiation of CD8+ T lymphocytes following their encounter with
antigen are understood in some detail. It is well established that changes in the
expression of the CD45RA/RO isoform is now no longer an adequate sole discriminating
marker for differentiating naïve and memory CD8 lymphocytes. Several investigators
have shown that the expression of the co-stimulatory molecules CD28 and CD27 can be
used in conjunction with CD45RA to distinguish subpopulations of memory CD8
lymphocytes [1]. More recently, this analysis has been taken a step further by perfoming
CD8 lymphocyte subset analysis on antigen-specific cells through the use of class-1
tetramers or peptide induced cytokine synthesis methods [2-6]. These studies have
produced remarkable insights into the function of subpopulations of memory CD8
lymphocytes in terms of the ability of these cells to synthesise cytotoxic effector
molecules such perforin or granzymes and cytokines such as IFN-y.
However, the vast majority of studies in this field have concentrated on examining
lymphocyte responses in blood, with a only few important studies directed towards the
responses in lymph nodes [7-9] and other tissues [10]. Thus there is a paucity of
information on the function and phenotype of CD8 lymphocytes at tissue sites such as
the lung in humans. This is an important omission since activated lymphocyte
populations are available for analysis from the lung by simple bronchoalveolar lavage.
Indeed, the lung is a crucial primary site for encountering foreign antigen including viral
infections and tuberculosis and thus the BAL samples might be expected to contain
lymphocytes able to generate responses against various pathogens.
The aim of this chapter was therefore use to investigate CD8+ T lymphocyte subsets
using the discriminatory markers CD27 and CD45RA in order to assess the relative
accumulation of memory and naïve CD8 T lymphocytes in the lung.
7.2 Materials and Methods7.2.1 Patients
Patients undergoing bronchoscopy for suspected non-malignant respiratory disease
were invited to take part in the study, which was approved by the hospital ethics
committee. The majority of patients investigated were HIV seropositive, reflecting the
patient population of the respiratory team. A total of 46 patients were investigated, of
whom 37 were HIV+. Four subjects had sarcoidosis and six were healthy controls
142

without respiratory disease. The demographic characteristics, BAL diagnoses and CD4
counts of the study population are shown in table 7.1.
Table 7.1 Demographic and diagnostic data for patients undergoing CD8
phenotypic analysis in blood and BAL
Patient Age/sex Diagnoses CD4 HIV viral load^
1 43 M HIV, P. carinii, TB 12 32 F HiV, cytomegalovirus 1 >750.0003 47 M HIV, P. carinii 2 >750,0004 37 M HiV, TB 2 83,2005 42 M HiV, TB 3 33,6006 43 F HiV 7 146,0007 46 M HiV, P.carinii 9 110,0008 37 M HiV, P.carinii 12 91,6009 45 M HiV 18 542,00010 36 M HiV, TB 18 12,30011 28 F HiV 20 423,00012 64 M HiV, P.carinii 21 503,00013 32 M HiV 35 >750,00014 40 M HiV, P.carinii 40 >750,00015 37 F HiV 43 >750,00016 47 F HiV 48 <5017 43 F HiV 55 463,00018 49 M HiV 75 357,00019 39 M HiV, TB 94 246,00020 47 F HiV, P.carinii 100 115021 31 M HiV, Bacterial infection 102 229,00022 36 F HiV, Bacterial infection 111 19723 33 M HiV, P.carinii 126 164,00024 43 M HiV 133 15,30025 34 M HiV 145 403,00026 44 M HiV 165 50627 37 M HiV 171 92,40028 37 M HiV, TB 185 220,00029 47 F HiV, TB 272 40030 34 F HiV, TB 285 88,60031 33 M HiV 291 <5032 35 M HiV 397 <5033 42 M HiV 399 217,00034 58 M HiV 527 <5035 29 M HiV 566 21,00036 27 M HiV 800 261,00037 35 M Sarcoid - -
38 36 M Sarcoid - -
39 29 M Sarcoid - -
40 45 M Sarcoid - -
41 58 M Control - -
42 38 M Control - -
43 30 M Control - -
44 54 M Control - -
45 24 M Control - -
46 36 F Control - -
Footnotes
1: HIV viral load expressed as number of copies/pl in blood. Lower limit of detection 50
copies/pl and upper limit 750,000 copies/pl.
143

7.2.2 Bronchoscopy
Fibreoptic bronchoscopy was undertaken as previously described in chapter 2.
Bronchoalveolar lavage was performed from an area of radiologically abnormal lung,
othenA/ise a standard right middle lobe lavage was performed. The samples were divided
and aliquots sent to relevant laboratories for pathological investigations, and the
remaining BAL was kept for immunological analysis. At the time of bronchoscopy 5ml of
blood was also taken.
7.2.3 Sample preparation
The BAL samples were collected into a siliconized glass container kept on ice and were
analysed within two hours of their acquisition. Aliquots were sent to the relevant
laboratories for pathological investigation and the remaining sample was filtered and
washed and the absolute CD4 and CD8 counts determined as previously described
using the CytoronAbsolute flow cytometer. A sample of BAL containing 1x10® CD8
lymphocytes and a sample of blood containing the same number of cells were then
stained for 15 minutes at room temperature with the following monoclonal antibodies in
pre-titrated optimal concentrations. CD27 FITC (Becton Dickinson), CD8 PE (Cymbus),
CD3 PECy7 (Caltag Medsystems) and CD45RA (Southern Biotechnology, Alabama,
USA). Following staining, 1ml of lysis buffer was added to the blood sample and left at
room temperature for 15 minutes to ensure red cell lysis. Both the blood and BAL
samples were then washed and the pellets resuspended in PBS. In further selected BAL
samples, staining was performed with both CD45RA and CD45RO in order to confirm
that CD8+ T lymphocytes did not co-express both markers. The antibodies used for
these samples were: CD3 FITC (Becton Dickinson), CD45RO PE (Southern
Biotechnology), CD8 PECy7 (Caltag) and CD45RA (Southern Biotechnology) and
staining was performed as described above.
7.2.4 Flow Cytometry and Gating strategies
Phenotypic analysis of the CD8 populations was performed using the FACScalibur
(Becton Dickinson). 20,000 CD8+ T lymphocytes were acquired and the list mode data
analysed using Winlist 4.0 software (Verity inc. Topsham, Virginia, USA). Primary
immunological gating of CD3+ lymphocytes was performed and these events were
confirmed to lie within a lymphoid scatter gate. Defining CD8+ T lymphocytes by their co-
144

expression of CD3 and CD8 ensured that there was no contamination with natural killer
(NK) cells that express CD8 dimly, but do not express CDS. CD8+ T cells were then
gated from this population and then further investigated in terms of their naïve/memory
phenotype by the expression of CD45RA and CD27 (figure 7.1).
Lastly, in the BAL samples in which both CD45 isoforms were stained for
simultaneously, the expression of these markers was directly determined on CD8
lymphocytes (figure 7.2).
Figure 7.1
oo
ssc
<a:in
QO
1.2 1.5
37.4 59.9
wC D 2 7
S S C C D 2 7
Figure 7.1
FCM dotplots demonstrating CDB T lymphocyte naïve and memory subsets in BAL
in a patient with HIV infection (a) and sarcoidosis (b). Memory CDB lymphocytes
comprise those cells in the bottom two quadrants and upper left quadrant.
CD45RA+ CD27+ naïve CDB T cells in the upper right quadrant are rare
populations in BAL in both patients.
145

Figure 7.2
gIf)'4-QO
§ 5.8% 0 .6%
3.1% 90.5%
SSC CD 45RO
Figure 7.2
FCM dotplots demonstrating the expression of the CD45 isoforms CD46RA and
CD45RO in CD8+ T lymphocytes in BAL. The CD45RA+ population of the CD8+
lineage is mainly represented by the CD45RA+,R0- cell type and not by the rare
transitional forms that are CD45RO+,RA+ (upper right quadrant).
7.2.5 Statistical Analysis
Median values and interquartile ranges of the expression of the CDS phenotypic markers
were noted in the text. Non-parametric analysis by the Mann-Whitney method was used
to compare the data sets.
7.3 Results7.3.1 Comparison of the proportion of memory CD8 + T lymphocytes in the
total CDB T cell pool in BAL and bloody
Memory CD8+ T lymphocytes were defined as being either CD45RA- CD27+,
CD45RA- CD27- or CD45RA+ and CD27-, the latter population being consistent with a
revertant phenotype [11]. True naive CD8+ T cells were defined as cells that were both
CD45RA+ and CD27+. In BAL CD8+ T lymphocytes from all subjects were
overwhelmingly of a memory phenotype (median 99.5% IQR: 98.8-99.8%, figure 7.3).
Peripheral blood from the same patients demonstrated a lower predominance of memory
CDS lymphocytes (median 88.0%, IQR: 78.8-93.7%). When compared to the lung, the
difference in memory CDS lymphocytes in the blood was highly significant (p=<0.001).
146

This data was then further examined to determine whether there was any difference
in the memory CD8 lymphocyte proportions between those with HIV infection and those
with sarcoidosis or the healthy control subjects.
Figure 7.3
100n
90-
70-
BloodBAL
Figure 7.3
Box and whisker plots demonstrating the percentages of CDS T lymphocytes that
expressed a memory phenotype for the whole study population in BAL and blood
In the HIV-infected patients the median BAL CDS memory proportion was 99.5% (IQR:
98.5-99.9%). In the Sarcoidosis patients the equivalent values were median 99.8%,
(IQR: 99.6-99.8%) and for the healthy control subjects they were median 98.5% (IQR:
96.2-99.6%). The proportion of memory CD8+ T cells in BAL did not differ significantly
between those with HIV and the healthy control subjects (p=0.23) or between those with
HIV and sarcoidosis (p=0.16).
When the blood was compared between these three patient groups, there was a
significant difference (p=0.02) between the CDS memory proportion in those with HIV
(median 90.2%, IQR: 83.0-93.9%) and the healthy controls (median 72.7%, IQR: 56.9-
80.2%), but not between the HIV+ patients and those with sarcoidosis.
147

7.3.2 Expression of CD27 and CD45RA in CDS lymphocyte subpopulations
in the lung and blood
Next, the relative proportions of the four subpopulations of CD8 T lymphocytes
described by the expression of CD45RA and CD27 were compared in the lung and the
blood samples from all patients together (figure 7.4). These subpopulations were
described as follows: CD45RA+ CD27+, CD45RA- CD27+, CD45RA- CD27- and
CD45RA+ CD27-. Naïve CDS lymphocytes characterized by the dual expression of
CD45RA+ and CD27+ were a rare population in the lung, accounting for a median of
0.7% of all CDS cells (IQR: 0.1-2.4%). By contrast, naïve cells were far more common in
the blood (median 13.4%, IQR: 6.0-32.S%). The difference between the proportions of
naïve CDS cells in these two compartments was highly significant (p=<0.0001).
The second population of CDS cells were CD45RA- and CD27+. In BAL these
contributed to a highly variable proportion of the total CDS pool but with a low median
proportion (4.5%, IQR: O.S-54.1%). In blood, these cells were more common (median
32.7%, IQR: 1S.5-51.S%). The difference in the proportions of these CDS cells between
the two sites was significant (p=0.02). The third population were CD45RA- CD27- and
these comprised the majority of the lung CDS lymphocytes (median 92.6%, IQR: 42.5-
97.6%). In the blood, the equivalent cells accounted for a much lower proportion of the
total CDS lymphocyte pool (median 22.7%, IQR: 11.0-40.S%). Again, the difference in
the proportions of these CDS populations between the lung and the blood was significant
(p<0.0001).
The final population was that of the CD45RA+ CD27- CDS cells. It has recently been
determined that a proportion of memory CDS lymphocytes switch their CD45 isoform
from CD45R0+/RA- to CD45RO-/RA+. This population can be distinguished from true
naïve CDS lymphocytes since they have short telomeres, indicating a replicative history
and do not express CD27 [11]. In BAL these cells were rare (median 2.2%, IQR: 0.9-
5.3%), whilst in blood they were much more common (median 31.2%, IQR: 12.4-44.0%).
The difference between the proportions of this memory pool in BAL and blood was again
significant (p<0.0001).
These findings demonstrate that lung directed CDS lymphocytes in BAL consist
ovenA/helmingly of a memory phenotype that are CD45RA- and CD27-. The new
observation is that we can find in the lung a smaller subset of CD45RA+ CDS+ cells that
are also of memory type because of their CD27 negativity. These are known to be
mature memory cells (figure 7.4).
148

Figure 7.4
BAL
2 .2%0 .7% 4 .5%
C D 4 5 R A - C D 27
92.6%
C D 45R A + C D 2 7 - C D 4 5 R A + C D 2 7 +
Blood13.4%
31.2%
32.7%
22.7%
C D 4 5 R A - C D 2 7 +
Figure 7.4
Pie charts demonstrating the percentages of the CD8 T lymphocyte
subpopulations defined by their expression of CD45RA and CD27 in BAL and
blood for the whole study population.
7.3.3 Differences in CDS lymphocyte subpopulations between patients with
HIV, sarcoidosis and healthy control subjects
Next, the same CDS lymphocyte subpopulations were examined in the three different
patient groups. This analysis was performed since chronic antigenic stimulation in
patients with untreated or inadequately treated HIV infection may result in skewed
populations of lymphocytes with increases in the memory subsets. The majority of the
149

HIV+ patients in this cohort had advanced disease with low CD4 counts (median 85
cells/pl, IQR: 18-175) and high blood HIV viral loads (median 146,000 copies/pl, IQR:
13,800-413,000). Thus HIV itself could act to stimulate the proliferation and
differentiation of lymphocytes in these patients.
CD45RA+ CD27+ naïve CD8 lymphocytes were rare populations in all three groups
in BAL. In HIV+ subjects they accounted for a median of 0.6% (IQR: 0.1-2.0%), whilst in
the sarcoidosis patients the proportions were very similar (median 0.2% (IQR: 0.1-0.5%).
In BAL from the healthy control subjects, naïve lymphocytes comprised a slightly higher
proportion of the total CD8 pool (median 1.4%, IQR: 0.3-5.4%). The difference between
the naïve lymphocyte proportions in BAL between the HIV+ and control subjects and
between the sarcoidosis and control subjects was not significant (p=0.24 and 0.11
respectively). In blood there was a significant difference (p=0.02) between the naive
CD8 population in the HIV+ subjects (median 11.6%, IQR: 5.6-29.3%) and the healthy
controls (median 33.3%, IQR: 17.0-52.8%).
The next population to be compared was that of the CD45RA- CD27+ memory
lymphocytes. In BAL from the HIV+ individuals this subset comprised a median of 3.1%
of the CD8 cells with a very wide interquartile range (0.8-61.3%). In the control group a
slightly higher proportion (median 14.3%, IQR: 1.1-27.9%) of the CD8 lymphocytes
expressed these markers, but the difference between the two was not significant
(p=0.76). In BAL from patients with sarcoidosis, similar low values of CD45RA- C027+
CD8 cells were determined (median 6.8%, IQR: 3.9-9.1%). In blood, the proportions of
this subset were very similar (p=0.27) in both the HIV+ subjects (median 33.3%, IQR:
18.8-47.9%) and in the controls (median 29.6%, IQR: 17.0-39.6%).
The third population to be compared between the different patient categories was
that of the memory CD45RA- CD27- CD8 lymphocytes. In BAL, these cells comprised
the predominant CD8 lymphoid population in the HIV+ patients (median 94.4%, IQR:
36.2-98.0%), with the corresponding proportions in the sarcoid patients being slightly
lower (median 85.7%, IQR: 80.4-91.5%) and for the controls lower again (median 76.6%,
IQR: 63.3-93.7%). The differences in the proportion of these memory lymphocytes
between all three patient groups were not siginificant (p=0.79 HIV vs control, p=0.95 HIV
vs sarcoid and p=0.61 sarcoid vs control). In the blood, the CD45RA- CD27- memory
CD8 cells were higher in the HIV patients (median 24.7%, IQR: 14.0-41.7%) than in the
healthy controls (median 8.7%, IQR: 4.7-23.2%) and this time the difference was
statistically significant (p=0.02).
150

Figure 7.5
BAL BloodCD45RA+ CD27-
1.gp/cQ6P/c 31%
HIV+ CD45RA- CD27-
333%
%4% 347%
CD45RA- CD27+ CD45RA+ CD27+
Control
7.7% 1.4%
333%
766% 296%
Figure 7.5
Pie charts demonstrating the percentages of CDS lymphocyte subsets in BAL and
blood from the HIV+ patients and control subjects.
The final population was that of the CD45RA+ CD27- ‘revertant’ memory phenotype.
In BAL from the HIV+ patients this subset accounted for very few of the total CDS pool
(median 1.9%, IQR: 0.7-4.2%), whilst in the control subjects (median 7.7%, IQR: 2.7-
10.5%) and the sarcoidosis patients (median 7.3%, IQR: 4.1-11.0%) the equivalent cells
were more common. The differences were significant between the HIV and control group
(p=0.01) and the HIV and sarcoid group (p=0.008), but not between the controls and
those with sarcoidosis (p=0.76). By contrast, the proportion of CD45RA-I- CD27-
memory CDS lymphocytes in the blood of the HIV patients (median 30.4%, IQR: 13.1-
15
42.8%) and the control subjects (median 28.4%, IQR: 10.8-45.1%) was very similar
(p=0.75). The differences in the proportions of these CD8 lymphocyte subsets in both
BAL and blood from the HIV+ patients and the healthy controls are graphically
represented in pie charts (figure 7.5).
7.4 DiscussionThis study demonstrates that CD8 lymphocytes recovered from the alveolar space are
overwhelmingly of a memory phenotype. Very few published reports have investigated
the differentiation and migration patterns of lymphocytes to tissue sites such as the lung
in humans [12, 13] or animal models [14, 15] and none of these have considered the
CD8 lymphocyte subsets in the lung using an optimum combination of discriminatory
markers such as CD45RA or RO and CD27.
Here it has been shown that this memory CD8 cell accumulation in the lung is
predominantly of a mature effector phenotype in which the cells do not express the co
stimulatory marker CD27. These cells are CD45RA- and in a selective series of tests
their CD45RO positivity has been documented. Only very few transitional CD45RA+
R0+ doubles were found in the lungs. Therefore the CD45RA- phenotype is
synonymous with CD45RO positivity.
Several investigators have demonstrated that CD27- CD45RA- CD8 lymphocytes
express high levels of the cytotoxic molecule perforin when compared to the CD27+
CD45RA- CD8 cells in blood [2, 5, 6] and it has therefore been suggested that the
CD27+ CD45RA- phenotype may represent an intermediate stage between CD45RA+
CD27- and CD45RA- CD27- cells. It is of interest that despite the fact that low median
values for the proportion of CD45RA- CD27+ CD8 cells were obtained for all patient
groups, there were many patients in whom this population comprised a significant
minority of the total BAL CD8 pool, particularly in the HIV+ population.
This finding is of interest since it has been established that HIV results in a failure of
maturation of HIV-specific CD8 effector lymphocytes [3, 16, 17]. It would therefore be
important to investigate the antigen specificity of the BAL CD8 lymphocytes in such
patients to determine the relative proportions of HIV-specific cells within the CD27+ and
CD27- pools.
A further significant finding in this study is the discovery of small percentages of
CD45RA revertants among the CD27- memory population. This population of memory
CD8 lymphocytes has been demonstrated to contain perforin and granzyme, to
152

synthesise both interferon-y (IFN-y) and tumour necrosis factor-a (TNF-a) [1] and also to
express high quantities of the anti-apoptotic molecules Bcl-2 and B c I-X l [11, 18].
Although initially thought to be terminally differentiated [19], it has recently been
demonstrated that these cells can proliferate in response to antigens and show strong
cytotoxic activity [4, 11, 18]. In view of these findings, this subset of CD8 lymphocytes
has been termed an effector memory population and has been implicated in the control
of chronic viral illness [20]. In the control subjects, these CD45RA+ revertants comprised
7.7% of the total BAL CD8 lymphocytes, whilst in the HIV+ subjects the same population
accounted for only 1.9%. Failure of differentiation of CD8 lymphocytes in BAL to this
mature effector phenotype may represent a specific defect induced by the HIV virus. It
would be interesting to determine whether this defect is restricted to the HIV-specific
CD8 lymphocytes, or whether it occurs across a broad range of different antigen-specific
responses, a factor that would help to account for the markedly increased rates of
respiratory infections in this population.
Nevertheless, these findings do indicate that the lung is equipped to maintain long
term immunity. Indeed, such specific responses to challenge are well documented in the
fast stimulation induced by purified protein derivative (PPD) in the BAL of patients with
tuberculosis (explored in chapter 8).
Lastly, it has been demonstrated here that naïve CD8+ T lymphocytes, characterized
by their co-expression of CD45RA and CD27 are also found in BAL. This subset
accounted for only approximately 1% of the total CD8 pool in BAL in all three patient
groups, in contrast to the higher proportions found in the blood. A small percentage of
these cells designated as memory lymphocytes may not be true CD45RA+ CD27+
lymphocytes since it has been demonstrated that approximately 10% of the CD45RA+
lymphocytes in BAL are transitional forms that co-express the CD45 isoform R0+.
Nevertheless, the conclusion can still be made that naïve CD8 lymphocytes can be
found in the alveolar space at low frequencies.
In summary, this study has demonstrated that a focused investigation of lymphocytes
using good discriminatory markers reveals important differences between the lung and
the blood, in direct conflict to the findings of previous investigators [21]. Here it has been
shown that there is a preferential accumulation of memory CD8 lymphocytes in the lung,
the majority of which displayed a mature effector phenotype characterized by the lack of
expression of the co-stimulatory molecule CD27. Importantly, it has also been
demonstrated that revertant effector memory CD8 cells are also detected in BAL and it is
153
suggested that these may play a vital role in the immune response against pathogens.
Lastly, differences in the relative proportions of these lymphocytes have been shown
between the HIV infected and normal control subjects. Specifically, the reduction in the
proportion of revertant CD8 cells in BAL in addition to the demonstration of significant
numbers of CD27+ memory cells may indicate a specific defect in the maturation of CD8
lymphocytes induced by HIV.
7.5 References1. Hamann D, Baars PA, Rep MH, et al. Phenotypic and functional separation of
memory and effector human CD8+ T cells. J Exp Med 1997;186:1407-18.
2. Kern F, Khatamzas E, Surel I, et al. Distribution of human CMV-specific memory
T cells among the CD8pos. subsets defined by CD57, CD27, and CD45 isoforms.
Eur J Immunol 1999;29:2908-15.
3. Appay V, Dunbar PR, Callan M, et al. Memory CD8+ T cells vary in differentiation
phenotype in different persistent virus infections. Nat Med 2002;8:379-85
4. Wills MR, Okecha G, Weekes MP, et al. Identification of naive or antigen-
experienced human CD8(+) T cells by expression of costimulation and
chemokine receptors: analysis of the human cytomegalovirus-specific CD8(+) T
cell response. J/mmuno/2002;168:5455-64
5. Tomiyama H, Matsuda T and Takiguchi M. Differentiation of human CD8(+) T
cells from a memory to memory/effector phenotype. J Immunol 2002; 168:5538-
50
6. van Baade D, Hovenkamp E, Callan MF, ef a/. Dysfunctional Epstein-Barr virus
(EBV)-specific CD8(+) T lymphocytes and increased EBV load in HIV-1 infected
individuals progressing to AIDS-related non-Hodgkin lymphoma. Blood
2001;98:146-55.
7. Brodie SJ, Patterson BK, Lewinsohn DA, et a i HIV-specific cytotoxic T
lymphocytes traffic to lymph nodes and localize at sites of HIV replication and cell
death. J Clin Invest 2000;105:1407-17.
8. Goodall JO, Bledsoe P and Gaston JS. Tracking antigen-specific human I
lymphocytes in rheumatoid arthritis by I cell receptor analysis. Hum Immunol
1999;60:798-805.
154

9. Labarriere N, Pandolfino MC, Raingeard D, et al. Frequency and relative fraction
of tumor antigen-specific T cells among lymphocytes from melanoma-invaded
lymph nodes. /nfJ Cancer 1998;78:209-15.
10. Tan LG, Mowat AG, Fazou 0, at al. Specificity of I cells in synovial fluid: high
frequencies of CD8(+) I cells that are specific for certain viral epitopes. Arthritis
Res 2000;2:154-64.
11. Faint JM, Annels NE, Curnow SJ, et ai. Memory T cells constitute a subset of the
human CD8+CD45RA+ pool with distinct phenotypic and migratory
characteristics. J/mmuno/2001;167:212-20.
12. Agostini C, Trentin L, Zambello R, et ai. CD8 alveolitis in sarcoidosis: incidence,
phenotypic characteristics, and clinical features. Am J Med 1993;95:466-72.
13. Albera 0, Ohio P, Solidoro P, et al. Activated and memory alveolar T-
lymphocytes in idiopathic eosinophilic pneumonia. EurRespirJ 1995;8:1281-5
14. Cerwenka A, Morgan TM and Dutton RW. Naive, effector, and memory CD8 I
cells in protection against pulmonary influenza virus infection: homing properties
rather than initial frequencies are crucial. J Immunol 1999;163:5535-43
15. Mathy NL, Walker J and Lee RP. Characterization of cytokine profiles and
double-positive lymphocyte subpopulations in normal bovine lungs. Am J Vet Res
1997;58:969-75
16. Shankar P, Russo M, Harnisch B, et al. Impaired function of circulating HIV-
specific CD8(+) T cells in chronic human immunodeficiency virus infection. Blood
2000;96:3094-101
17. Van Baarle D, Kostense 8, Hovenkamp E, et al. Lack of Epstein-Barr virus- and
HIV-specific CD27- CD8+ I cells is associated with progression to viral disease
in HIV-infection. A/ds 2002;16:2001-2011
18. Dunne PJ, Faint JM, Gudgeon NH, et al. Epstein-Barr virus-specific CD8(+) I
cells that re-express CD45RA are apoptosis-resistant memory cells that retain
replicative potential. Blood 2002;100:933-40.
19. Champagne P, Ogg GS, King AS, et al. Skewed maturation of memory HIV-
specific CD8 T lymphocytes. Nature 2001;410:106-11
20. Sallusto F, Lenig D, Forster R, et al. Two subsets of memory T lymphocytes with
distinct homing potentials and effector functions. Nature 1999;401:708-12.
155

21. Bofill M, Lipman M, McLaughlin JE, et al. Changes in lung lymphocyte
populations reflect those seen in peripheral blood in HIV-1 positive individuals.
Eur Respir J 1998; 11:548-53
156

Chapter 8
Antigen-Specific Responses in the Lung
in Patients with Pulmonary and Non-
Pulmonary Tuberculosis
157

8.1 IntroductionIt is estimated that one third of the world’s population is infected with mycobacterium
tuberculosis and that there are eight million new cases of TB and nearly three million
deaths each year [1]. The most common route of infection is through the inhalation of
droplets carrying the mycobacterium. This results in a local lung immune response that
generally contains the infection. However, re-infection, or reactivation may occur
resulting predominantly in apical lung disease [2].
The gold standard diagnostic test for tuberculosis remains the visualisation of acid-
alcohol fast bacilli (AFB) by Ziehl-Neelsen or auramine staining, with confirmatory culture
of the organism. This can take up to eight weeks using solid culture medium. However,
only 54% of all cases of TB and 61% of those with pulmonary TB were culture positive in
1999 in the UK [3]. Although the true figures for culture positive TB may be higher due to
underreporting, there still remains a large proportion of TB diagnoses that are made on
clinical grounds alone. More recently, DMA amplification techniques have been
employed as a rapid diagnostic test in suspected TB cases [4-6]. However, the
sensitivity of DMA amplification tests may be reduced in those with smear negative
disease [7, 8].
An alternative diagnostic strategy is suggested by the discovery that antigen-
specific cells can be identified by a variety of different techniques [9-11]. Nevertheless,
these studies have so far been almost exclusively directed towards examining responses
in the blood. We reasoned that in infectious lung diseases antigen-specific responses of
lymphocytes recovered from BAL might prove to be clinically more relevant. We used
flow cytometry (FCM) to detect CD4 lymphocyte cytokine production in response to PPD
in short-term cultures of blood and BAL in patients with suspected TB.
8.2 Methods8.2.1 Patients
The hospital ethics committee approved this study to obtain BAL and blood from patients
with suspected or proven TB. Of the 60 patients included in this study, 34 were
diagnosed with mycobacterium tuberculosis infection (TB). Of these, 29 were confirmed
by culture (table 8.1), including from aspirates of bone (patient 1) and lymph node
(patients 3 and 4). TB was not cultured from the remaining five patients, but acid fast
bacilli were identified in caseating granulomas from tissue specimens in two patients (2
158

Table 8.1 Demographic and diagnostic results in patients with TB
Patient Sexandage
Ethnicity
AndBCG’
Diagnosis BAL TB diagnosis^
AFB PCR Culture
BAL Lymph %
BALCD4/CD8
BAL CD4IF N Y
Blood CD 4 IFN-y
1 F 16 BA + Spinal TB 42.8 2.7 23.5 0.052 F 36 BUK+ Pharyngeal TB - - - 22.4 3.2 31.1 0.353 M 2 8 BA + Lymph node TB - - - 32.0 1.2 22.7 0.044 F 42 BA + Lymph node TB - - - 29.0 2.9 17.7 0.565 F 33 BA+ Lymph node TB - - - 65.0 5.0 51.6 1.086 F 41 BUK+ Disseminated TB - + + 27.6 4.1 24.4 0.067 F 32 0 + Disseminated TB - - + 16.7 2.7 25.2 0.078 M 3 2 BA + Disseminated TB - + + 43.6 7.3 34.0 0.029 M 7 7 A - Disseminated TB - + - 57.0 1.6 60.p -
10 M 21 BA+ Disseminated TB - + + 44.6 2.2 25.5 0.0111 F 24 C + Pulmonary TB + + + 33.0 2.5 12.4 0.0312 M 2 4 A + Pulmonary TB + + + 62.0 0.4 11.3 1.4313 F 21 BA + Pulmonary TB + + + 20.8 11.7 17.0 0.1314 M 18 BA + Pulmonary TB - + + 33.5 2.0 37.2 0.3915 M 2 4 A + Pulmonary TB - - + 70.4 2.6 17.2 0.0216 M 2 7 C - Pulmonary TB - - + 15.7 2.4 31.7 0.1517 M 3 7 A + Pulmonary TB + + + 32.0 1.7 24.9 0.2318 M 3 5 C + Pulmonary TB + + + 4.60 1.2 25.6 0.0619 M 31 C - Pulmonary TB + + + 15.2 1.1 31.3 0.2120 F 26 BA + Pulmonary TB + + + 46.8 5.9 21.8 0.0221 F 27 BA + Pulmonary TB - - + 20.3 1.3 5.71 0.9222 M 28 A + Pulmonary TB - + + 7.0 1.3 1.98 0.0823 M 31 C + Pulmonary TB + + + 3.2 3.0 31.6 0.0724 M 50 B U K - Pulmonary TB + + + 0.7 2.9 3.01 0.0325 M 19 BA + Pulmonary TB + + + 18.0 4.3 28.4 0.2626 F 25 A+ Pulmonary TB - - + 29.7 3.2 42.5 0.5427 M 2 0 BA+ Pulmonary TB - + + 14.6 2.3 61.3 0.6928 M 33 B A - Pulmonary TB + + + 28.2 4.6 32.8 0.4129 F 20 A - Pulmonary TB - + + 62.1 1.4 26.5 0.8930 M 30 A - Pulmonary TB - + + 7.1 1.7 20.9 0.1031 M 55 0 - Pulmonary TB - + + 39.9 5.2 3.51 0.0632 M 39 C+ Pulmonary TB - - - 13.1 1.0 36.5 0.3033 M 32 c- Pulmonary TB - - - 43.3 4.7 34.0 0.0234 M 37 0 + Pulmonary TB - - + 40.6 11.3 2.07 0.03
Footnotes
1. Ethnicity; BA= black African, BUK= black UK born, A=Asian, C= Caucasian,
0=other. BCG vaccinated (+) or not (-).
2. Diagnosis of TB from BAL by smear (AFB), PCR and culture. In patients 1, 3 and
4 tissue culture confirmed TB. In patients 2 and 5 caseating granulomas and AFB
were seen on biopsy.
3. Percentage of BAL CD4 lymphocytes synthesizing IFN-y.
and 5, table 8.1). Three further subjects had clinical diagnoses of TB of whom two had
resolution of chest radiographic abnormalities on therapy and the final patient had a
159

positive tuberculin skin test and cerebrospinal fluid changes supportive of tuberculosis
meningitis. All of these five patients responded to anti-tuberculous therapy.
25 of the patients with tuberculosis had pulmonary disease, three had tuberculous
lymphadenopathy, five disseminated disease and one each had spinal and pharyngeal
TB. The patients with disseminated TB had predominantly cerebro-spinal disease
(patients 8 and 9) and lymph node disease (patients 6 and 7). The remaining patient had
classical miliary chest radiographic changes. All patients with TB with the exception of
patient 9 were HIV tested and were seronegative.
The control group comprised of 26 patients with a variety of conditions requiring a
bronchoscopy in which TB was considered in the differential diagnosis (table 8.2). Of
these, eight were diagnosed with sarcoidosis. This diagnosis was made on the basis of
computed tomograms (CT) of the chest demonstrating bilateral hilar lymphadenopathy in
all cases, with or without lung parenchymal nodules in addition to a failure to culture TB.
Supportive lung histology was present in five of the eight patients and additional
diagnostic clues were provided by the BAL lymphocyte percentage and CD4/CD8 ratios,
the serum angiotensin converting enzyme (SAGE) levels and gallium scanning.
Seven patients presenting with respiratory symptoms were confirmed on culture to
have mycobacterial infection other than TB (MOTT), including three with M. fortuitum,
and two with M kansasii and one each with M. chelonei, and M avium intracellulari. Five
of these patients responded to appropriate anti-mycobacterial therapy. The patient with
M. avium intracellulari (MAI) had previously been given a course of anti-mycobacterial
drugs for culture proven MAI that had failed to sterilise the infection and she was not
treated again and a patient with M. Kansasii was noted treated. Two of these patients
were confirmed to be HIV negative and the others were not tested. The remaining 11
patients with non-tuberculous respiratory disease had a variety of different diagnoses
(table 8.2). Two patients were confirmed to have cytomegalovirus (CMV) infection of
whom one had chronic renal failure and the other was a bone marrow recipient. In four
patients no diagnosis was determined from the bronchoscopy, but their symptoms
resolved.
Patients 1,2,7,14,17,18,19 and 20, (table 8.2) were HIV negative and the remainder
were not tested. These patients were generally older and felt not to be in a high HIV risk
group. Moreover, absolute blood CD4 counts measured from these patients as part of
the study methods were all greater than 500 cells/pl). In addition, blood was taken from
20 BCG-vaccinated control subjects who were nursing, medical and laboratory staff at
160

the Royal Free Hospital. Nine of this control group were females and the median age
was 36 years.
Table 8.2 Demographic and diagnostic results of patients with non-tuberculous
respiratory disease
Patient Sex and age
Ethnicity’
And BCG
Diagnosis BAL Lymph %
BALCD4/CD8
BAL CD4 IFN-y
BloodCD4IFN-y
1 M 4 0 B A - Sarcoidosis 68.4 9.4 15.2 0.082 M 3 3 BA+ Sarcoidosis 31.4 3.0 13.7 0.113 F 35 c+ Sarcoidosis 26.8 2.0 13.9 0.014 F 71 A - Sarcoidosis 81.7 2.5 0.19 0.035 F 41 c + Sarcoidosis 53.3 9.5 0.05 0.026 M 3 3 c + Sarcoidosis 76.0 43.4 0.14 -
7 M 4 5 0 - Sarcoidosis 39.6 5.1 2.99 0.078 F 42 c+ Sarcoidosis 67.5 4.6 4.78 0.079 F 56 c- M fortuitum 48.1 0.7 0.55 0.0110 M 3 8 A+ M fortuitum 13.7 0.7 0.39 0.011 M 6 6 A - M fortuitum 9.2 0.3 8.21 0.1612 F 60 c- MAI 34.5 4.7 2.70 0.0313 M 7 2 C - M kansasii 3.3 21.5 3.08 0.1714 M 4 3 C+ M chelonei 74.4 0.7 0.41 0.0115 M 5 8 C - M Kansasii 13.1 8.5 2.87 0.0516 F 71 0 - Carcinoma 74.5 6.2 0.0 0.0117 M 26 A + Cytomegaiovirus 21.0 0.7 1.12 0.1518 M 19 0 - Cytomegalovirus 13.0 0.5 0.35 0.0619 F 38 BUK + Pneumonia 24.2 2.7 0.57 0.0620 M 6 6 O - Lymphoma 21.4 1.7 0.06 0.0221 F 50 C + Bronchiectasis 4.1 0.4 0.31 0.0622 F 78 C - Lung fibrosis 8.4 1.0 0.45 0.023 F 66 A - No diagnosis 17.9 1.7 0.16 0.0224 F 71 0 - Carcinoma 74.5 6.2 0.0 0.0125 F 61 A - No diagnosis 3.2 1.7 0.83 0.0726 F 70 C - No diagnosis 32.6 7.2 0.83 0.0
Footnotes
1. Ethnicity and BCG staus as defined in table 8.1 above.
8.2.2 Bronchoalveolar lavage
BAL was undertaken by standard technique as described in chapter 2. An area of
radiologically affected lung was washed otherwise the right middle lobe was used. In five
patients that already had a prior microbiological diagnosis of TB, bronchoscopies were
performed within two weeks of commencing TB therapy. In the remaining cases, TB
therapy was commenced following bronchoscopy.
1 6 1

8.2.3 Sample preparation
The fresh BAL samples were prepared as described in chapter 2 and the washed and
filtered BAL was resuspended in culture medium before FCM analysis to assess the BAL
leukocyte components, CD4/CD8 ratio and the absolute CD4 count as described
previously.
8.2.4 PPD stimulation and FCM analysis
Aliquots of the BAL suspension containing 1X10® CD4+ lymphocytes in 1ml of
culture medium were placed into two sterile 5ml polypropylene tubes (Thermo Life
Sciences, UK). In addition, 1ml of peripheral blood from the same patient collected into
lithium heparin tubes was also placed into two polypropylene tubes. To one of the BAL
and blood samples, lOpg of PPD (Statens Serum Institute, Copenhagen, Denmark) was
added. The other tubes were unstimulated control samples. In selected cases, 0.08 lU of
tetanus toxoid (Pasteur Merieux, Lyon, France) was added to a third BAL sample as a
control antigen. The samples were incubated for two hours at 37°C and 5% CO2, after
which time 5pg of Brefeldin A (Epicentre Technologies, Cambridge, UK) was added and
the samples incubated for a further 14 hours.
Following incubation, the samples were vortexed vigorously to detach cells from the
walls of the tube. First, lymphocyte surface markers were stained using CD4-FITC
(Royal Free Hospital) and CDS-PerCP (Becton Dickinson) for 15 minutes in the dark at
room temperature followed by a wash step. Fixation and permeabilisation of the cells
was performed as previously described using Fix-and-Perm (An-Der-Grub, Kaumberg,
Austria) [12]. Following this, IFN-y-PE (Caltag Laboratories, Towcester, UK) and TNF-a-
APC (Becton Dickinson) were added and the samples stained at 4°C for 30 minutes,
followed by a final wash step. Analysis of the stained preparations was performed on
FACSCalibur (Becton Dickinson). 40,000 CD4+ events were acquired and the proportion
of IFN-y and TNF-a staining cells within the total lymphocyte and CD4+ T cell
populations were analysed using WINMDI software (Version 4.2a; M Trotter) in both the
PPD activated and control cultures. The responses attributable to specific PPD effects
were calculated by subtracting the responses in the control tubes from those in the PPD
activated tubes (figure 8.1).
162

8.2.5 Statistics
Median values and interquartile ranges were recorded in the text and non-parametric
statistical analysis was performed with the Mann-W hitney test to determine any
difference between data sets.
Figure 8.1
24 .2%
2.3 1%
8 ^
BALNo Ag 0.78%
■ . ■
.. 1.13%
B A LP P D 35 . 1 %
2 . 4 8 %10“ 10' io“ io ‘ 1
T N F - a
d
BloodP P D 0.09%
0.02%
IFN-y IFN-y
Figure 8.1
FCM dotplots demonstrating the proportion of CD3+ lymphocytes producing IFN-y
in response to PPD in BAL (a) and blood (d) from a patient with TB. The TNF-a
response to PPD in BAL (b) and the IFN-y response in BAL when no antigen is
added (c) are also shown. BAL CD4 responses are high (upper left quadrants) with
limited responses in the CD3+ CD4- CD8 cells (lower left quadrants). The
responses in the BAL control (c) and blood sample (d) are low.
163
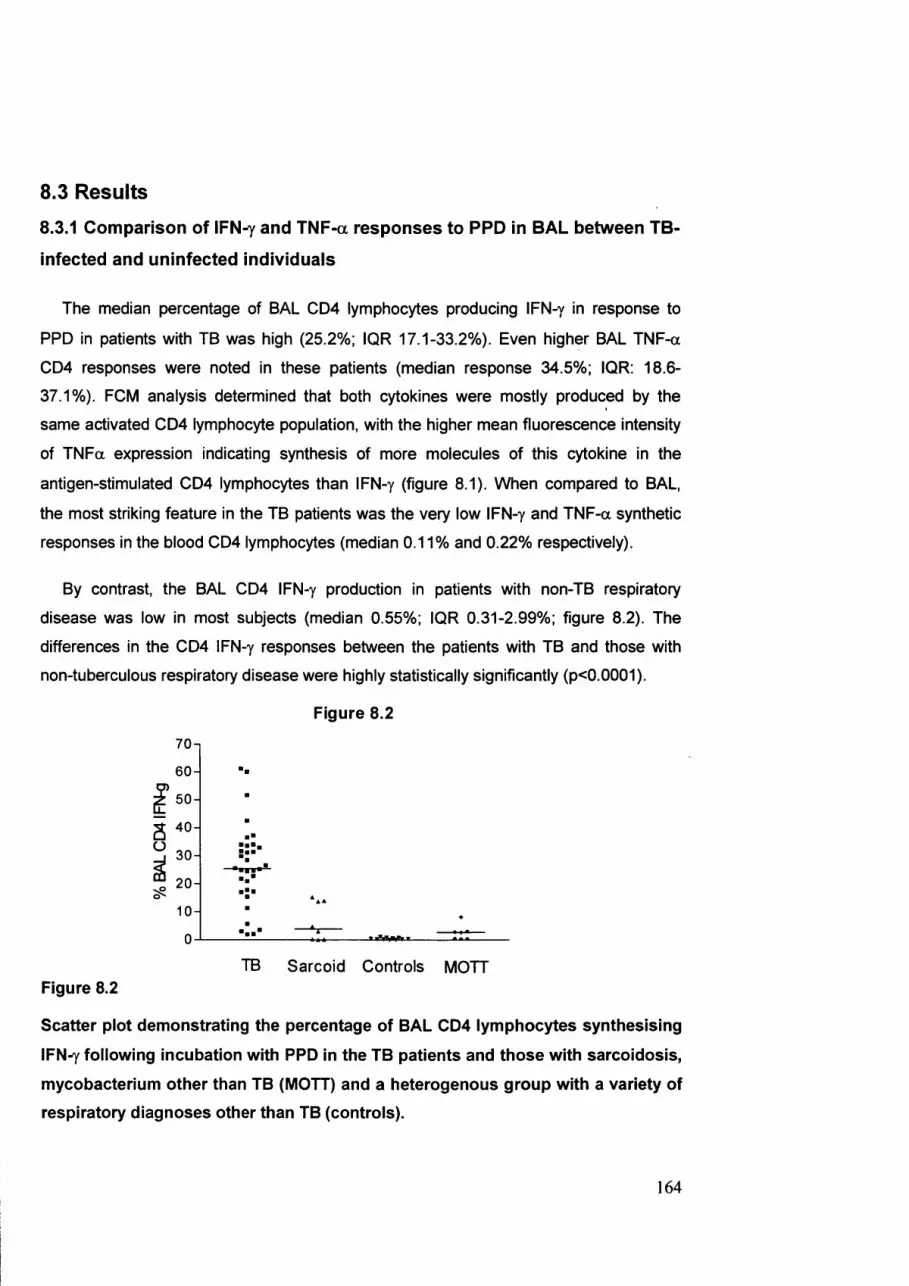
8.3 Results
8.3.1 Comparison of IFN ^ and TNF-a responses to PPD In BAL between TB-
Infected and uninfected individuals
The median percentage of BAL CD4 lymphocytes producing IFN-y in response to
PPD in patients with TB was high (25.2%; IQR 17.1-33.2% ). Even higher BAL TN F-a
CD4 responses were noted in these patients (median response 34.5%; IQR: 18.6-
37.1%). FCM analysis determined that both cytokines were mostly produced by the
same activated CD4 lymphocyte population, with the higher mean fluorescence intensity
of TN Fa expression indicating synthesis of more molecules of this cytokine in the
antigen-stimulated CD4 lymphocytes than IFN-y (figure 8.1). When compared to BAL,
the most striking feature in the TB patients was the very low IFN-y and TN F-a synthetic
responses in the blood CD4 lymphocytes (median 0.11% and 0.22% respectively).
By contrast, the BAL CD4 IFN-y production in patients with non-TB respiratory
disease was low in most subjects (median 0.55%; IQR 0.31-2.99%; figure 8.2). The
differences in the CD4 IFN-y responses between the patients with TB and those with
non-tuberculous respiratory disease were highly statistically significantly (p<0.0001).
Figure 8.2
70-1
6 0 -
± 50-
ây 304
2 0 -
10 -
0
TB Sarcoid Controls MOTTFigure 8.2
Scatter plot demonstrating the percentage of BAL CD4 lymphocytes synthesising
IFN^ following incubation with PPD in the TB patients and those with sarcoidosis,
mycobacterium other than TB (MOTT) and a heterogenous group with a variety of
respiratory diagnoses other than TB (controls).
164

CD4 TNF-a responses to PPD in BAL were also low in the non-TB control patients
(median 2.08% IQR: 0.72-4.07%). The BAL cytokine synthetic responses were low in the
majority of patients regardless of whether they had been BCG-vaccinated (n=10) or not
(n=15). However, when this group were examined more carefully, high type-1 cytokine
responses were noted in several, but not all patients with sarcoidosis (figure 8.2). These
were confirmed to be genuine PPD-specific responses since BAL from each of these
patients was also stimulated with a control antigen, tetanus toxoid, which failed to elicit a
response.
Moderate cytokine responses were also demonstrated in several of the patients with
MOTT. Nevertheless, PPD stimulated lower IFN-y and TN F-a synthesis in these patients
than in the majority of the TB patients (p=0.0007).
8.3.3 Type-1 cytokine responses in PPD-stimulated CD4 lymphocytes in
BAL in patients with pulmonary and non-pulmonary TB
Intriguingly, high CD4 IFN-y and TN F-a responses to PPD in BAL were
demonstrated in TB patients with non-pulmonary disease (median 25.4% and 41.7%
respectively). The median values for the CD4 cytokine responses in the patients with
pulmonary and non-pulmonary disease were virtually indistinguishable (figure 8.3).
Figure 8.3
70-1
6 0 - ■
é*
a " 0-
" 3 0 - ■ i :
1 0 -
0 -
PulmonaryTB
Non-pulmonary/ disseminated TB
Figure 8.3
Percentage of BAL CD4 lymphocytes synthesising IFN^ following incubation with
PPD in patients with pulmonary and non-pulmonary TB.
165

Importantly, every patient with non-pulmonary TB had high CD4 cytokine responses in
BAL, suggesting that such a test may be of particular diagnostic benefit in this group
8.3.4 Type-1 cytokine synthetic responses to PPD in BAL CD4 and CDS
lymphocytes in patients with TB
In the short incubation period of this assay, PPD was demonstrated to mainly activate
CD4 lymphocytes (median IFN-y 25.2%, IQR: 17.1-33.2%) and not CD8 I lymphocytes
(median IFN-y 4.09%, IQR: 1.57-7.25%). Similarly, the TN F-a responses were low in the
CD8 lymphocytes (median 3.87%, IQR:2.26-6.81%) when compared to the CD4 cells
(median 34.5% , IQR: 18.6-37.1%). In this analysis, CD8 lymphocytes were identified as
being CD3+ and CD4-. This approach to defining CD8 lymphocytes rather than primary
immunological gating of CD8+ events was performed since it ensured that NK cells, that
express CD8 dimly, but do not express CD3 were excluded. However, it is possible that
yô T lymphocytes that also express CD3 may have been erroneously included as
responding CD8 lymphocyte in this analysis. The characterisation of CD4 lymphocyte
cytokine synthesis was the primary objective of this study since it was expected that a
complex antigen such as PPD would primarily activate CD4, rather than CD8
lymphocytes. The use of CD4 alone to determine CD4 cells was not sufficient as this
marker was variably downregulated in culture (figure 2.7), whereas this was not a feature
of CD3 staining. A more precise definition of CD4 and CD8 lymphocytes and their
synthesised cytokines will be possible with five or more colour flow cytometry.
8.3.5 Persistence of type-1 cytokine synthetic responses to PPD in BAL
following initiation of treatment for TB
The PPD-activated CD4 populations in the lung remained high in patients who had
been on anti-tuberculous therapy for up to two weeks (median seven days) prior to BAL
(patients 1,3,8,9, 13,19 and 23, table 1). In addition, steroid therapy did not significantly
attenuate the response in patient 8 who was treated with corticosteroids for ten days
before BAL. Two patients undenA/ent a repeat BAL and PPD stimulation assay within two
months of completion of their TB therapy (table 8.3). In one subject, the responses
returned to low values, but in the other, they did not. More extensive investigation will be
166

required to determine the duration of persistence of type-1 cytokine responses following
episodes of treated TB.
Table 8.3 BAL lymphocyte percentages and CD4 type-1 cytokine responses In two
patients at diagnosis of TB and following completion of TB therapy.
Patient BAL lymph % BAL CD4 IFN-y BAL CD4 TNF-a
At diagnosis 33.0 15.4 21.3
After TB therapy 35.7 0.17 0.3
At diagnosis 22.4 31.1 35.5
After TB therapy 28.1 25.9 21.8
8.3.6 Type-1 cytokine synthetic responses to PPD in BAL from
radiologically normal and abnormal areas of lung in patients with TB
High cytokine responses to PPD were present throughout the lung and not just
localised to radiologically abnormal areas in patients with TB. In patients with non-
pulmonary TB, BAL was performed from the radiologically unaffected right middle lobe
and in each case high PPD responses were noted (table 8.1). In addition, comparative
washings from areas of radiologically affected and unaffected lung were performed on
selected patients with pulmonary TB. In each case, the CD4 cytokine responses elicited
in BAL taken from radiologically normal lung (usually the right middle lobe) were
equivalent to, and in several cases, higher than the responses in BAL taken from
radiologically affected areas (table 8.4). The conclusion from these findings is that
powerful type-1 cytokine responses in patients with TB are pan-pulmonary and not
specifically directed against areas of pathology such as cavitation defined by chest
radiography.
8.3.7 Comparison of IFN^ and TNF-a responses In the blood of TB patients
with BCG-vacclnated controls
Finally, the low level CD4 responses to PPD detected in the blood of the patients with
TB were compared with those in healthy, BCG-vaccinated control subjects and with non-
BCG vaccinated subjects with respiratory disease other than TB (figure 8.4). Patients
167

with sarcoidosis and MOTT were excluded from this latter group control since the BAL
analysis suggested that both of these conditions could result in a cytokine synthetic
response to PPD.
Table 8.4 Comparison of IFN^ synthesis following stimulation with PPD in BAL
from radiologically affected and unaffected lung in patients with TB
Patient Chest radiograph % CD4 IFN-y response from abnormal lung
% CD4 IFN-y response from normal lung
1 Upper zone changes 15.4 13.3
2 Upper zone changes 34.0 18.4
3 Upper zone cavity 31.6 56.2
4 Upper zone cavity 1.56 5.71
5 Mid/upper zone changes 28.4 32.9
6 Upper zone changes 21.1 25.2
7 Upper zone changes 42.5 26.7
8 Upper zone changes 51.6 55.9
Figure 8.4
0.0
TB blood
Figure 8.4
BCGvaccinatedblood
Non-BCGnon-TBblood
Percentage of blood CD4 lymphocytes synthesising IFN^ following incubation
with PPD in patients with TB, BCG-vaccinated healthy controls and non-BCG
vaccinated patients with respiratory disease other than TB, MOTT or sarcoidosis.
168

The median frequency of IFN-y producing CD4+ T lymphocytes in response to PPD in
the TB patients was only 0.11% (IQR: 0.04-0.38%). This value was lower than in the
BCG vaccinated controls (median 0.14%; IQR: 0.08-0.27%). Similarly, the blood CD4
TN F-a responses in the TB patients were low (median 0.22, IQR: 0.10-0.57%) as were
those from the BCG vaccinated controls (median 0.32%, IQR: 0.18-1.23%). The blood
IFN-y responses in the non-BCG vaccinated patients with respiratory disease other than
TB were very low (median 0.02%, IQR: 0.001-0.03%).
8.4 DiscussionThe demonstration of high CD4 IFN-y and TN F-a synthetic responses to PPD in BAL
when compared to the low proportions in peripheral blood is powerful evidence for the
dominance of lung immune responses and for the active recruitment of TB-specific
CD4+ T lymphocytes to the lung during TB infection. Previous human [13-15] and
murine [16, 17] studies have also indicated that lung immune responses predominate
during TB infection in different experimental systems. In two of these human studies [13,
14], T cells were separated from the BAL leukocytes and incubated with peripheral blood
mononuclear cells (PBMC) and TB antigens, before investigating [^H] thymidine
incorporation. These studies used complex experimental techniques due to concerns
regarding the possible suppressive effects of alveolar macrophages and their
unsuitability as antigen presenting cells (APC). The impressive antigen-specific CD4
lymphocyte cytokine responses demonstrated in our simplified system supports the
findings of previous investigators that BAL contains effective APC [18].
The main conclusion of our paper is that the PPD activated CD4+ T cell type-1
cytokine response, measured by IFN-y or TN F-a synthesis is a useful diagnostic test for
active TB in HIV uninfected individuals. Importantly, high CD4 type-1 cytokine responses
were present not only in those with pulmonary disease, but also in patients with non-
pulmonary and disseminated TB in whom extra-pulmonary manifestations dominated the
clinical picture. This finding has particularly significant diagnostic implications as BAL
may be both an easier and safer procedure than the biopsy of other tissues in patients
investigated for occult TB.
The other significant development inherent in this assay is that the results were
available within 24 hours of acquisition of the BAL sample. It is relevant that in this TB
cohort 63% of patients were smear negative, 46% both smear and PCR negative and in
169

14% M. tuberculosis was not cultured. The rapid results achieved by the
immunodiagnostic test were therefore of considerable diagnostic interest.
The BAL type-1 cytokine synthetic responses following PPD stimulation in several
patients with sarcoidosis is another significant finding and resurrects the fascinating and
enduring question of the pathogenesis of this disease. The predominance of lung
disease, together with the pathological findings of granulomas have long been held to be
evidence that this disease may be a response to mycobacterial antigens [19]. However,
attempts to convincingly document the presence of mycobacteria, or mycobacterial
nucleic acid from tissue specimens of patients with sarcoidosis has resulted in conflicting
evidence [20-23]. Here, it has been demonstrated that some, but not all patients with this
disease have significant BAL CD4 responses following incubation with PPD, but not with
a control antigen. Further investigation in this field is certainly warranted and it will be
interesting to determine which specific mycobacterial antigens optimally stimulate these
responses.
Several cases with TB had a low (<10%) BAL CD4 cytokine responses to PPD. It is
interesting that all but one of these patients were both smear and PCR negative, and
that TB was only confirmed by culture. Three patients were investigated on the basis of
abnormal chest radiographs, but without any of the clinical features of TB such as weight
loss, fever and prolonged cough. The remaining case with a low BAL CD4 cytokine
response had advanced TB with cavitation (patient 24, table 8.1). The BAL from an
apical cavity in this subject revealed pus with only 0.7% of the recovered cells being
lymphocytes. These findings suggest some important limitations of this
immunodiagnostic test. First, BAL CD4 responses may be low in patients with
asymptomatic disease, prior to the recruitment of TB-specific lymphocytes to the site of
disease and the initiation of the potent inflammatory responses. Second, that in
advanced cavitatory TB, characterised by a neutrophilia, lymphocytes may be a scarce
population. It is likely that the development of cavitation reflects a failure of the protective
lymphocyteresponse to control mycobacterial proliferation. Nevertheless, this limitation
may be circumvented as it has been demonstrated here that high CD4 cyokine
responses to PPD are present in BAL taken from radiologically unaffected lung even in
patients with cavitatory disease.
A corollary of these observations is that testing the CD4 responses to PPD in blood
alone is inadequate to diagnose active TB. The blood lymphocyte responses from TB
patients remained indistinguishable from the responses seen in BCG vaccinated control
170

subjects (figure 8.4). The most likely explanation for the low blood responses seen in the
TB patients is that these antigen-specific lymphocytes are actively recruited to the site of
infection in the lung resulting in their relative depletion in the blood. Furthermore, it has
been demonstrated that BCG vaccinated subjects develop cytokine responses to PPD in
an ELISPOT system [24]. Therefore, PPD which shares epitopes with both
mycobacterium tuberculosis and BCG is not a discriminating stimulatory antigen when
measuring blood lymphocyte responses. Interestingly, BCG vaccination did not provoke
a significant BAL cytokine response to PPD as no difference was demonstrated between
the BCG vaccinated and unvaccinated control patients (table 1).
One could argue that TB infection and BCG vaccination can be better
discriminated by using antigens specific for TB, such as the TB early secretory antigen,
ESAT-6. Overlapping peptides of this antigen have been demonstrated to elicit IFN-y
responses in peripheral blood mononuclear cells (PBMC) in patients with TB, but not in
BCG vaccinated subjects when measured by a sensitive ELISPOT technique [11].
However, this test did not distinguish between active and latent disease. Furthermore,
the use of ESAT-6 does not solve the problem of impaired cytokine responses in blood
from patients with severe TB [25, 26]. These pitfalls are avoided by examining lung
immune responses where high cytokine responses by TB antigen-recruited cells in
addition to a generalised lymphocytosis are supportive of active TB.
The flow cytometric assay used in our study has a considerable advantage over
other methods to determine antigen-specific responses such as the ELISPOT system for
three reasons. First, FCM provides a rapid and precise quantification of the total BAL
lymphocyte percentage together with the proportions and absolute counts of the
responding cell types, CD4 or CDS. Second, different cytokine responses, in our study
IFN-y and TN F-a can be investigated from the same activated lymphocytes. Third, the
new generation of cheap red diode laser flow cytometers will render this FCM technology
an accessible and affordable option [27].
From an immunological perspective this study highlights several issues. The
importance of the type 1 cytokine axis in the control of TB has been documented in both
murine experiments [17, 28, 29] and in patients with inherited defects in the interleukin-
12 and IFN-y receptors [30-32]. Other investigators using murine TB models have
demonstrated that TN F-a is essential for the generation of protective granulomas,
without which TB control is insufficient [29, 33]. Our study gives direct support for both
IFN-y and TN F-a in mediating anti-TB responses in the lung. It is intriguing that powerful
171
cytokine responses to PPD in BAL are generated in patients with non-pulmonary TB.
These findings are suggestive of a lymphocyte recirculation pathway to the lung,
presumably reflecting the fact that even in these patients the origin of post-primary
disease was the lung.
Finally, the data presented here demonstrate the limitations of exclusively
measuring CD4 lymphocyte responses. In patients co-infected with HIV, CD4
lymphopenia may limit the applicability of this CD4 IFN-y test. In order to develop a
reliable immunodiagnostic TB test in this important group of patients, antigen-specific
CD8 responses to TB antigens will need to be explored in the lung. Furthermore, The
specificity of this method for identifying active TB will also need to be confirmed by
examining the responses to PPD in BAL from patients with treated disease.
In conclusion, a novel method for diagnosing TB by measuring intracellular cytokine
responses to PPD in BAL by a simple and rapid flow cytometric technique has been
described here. High responses were demonstrated in BAL from patients with both
pulmonary and non-pulmonary TB. In patients with non-tuberculous respiratory disease,
low responses were recorded except in some patients with sarcoidosis, perhaps
reflecting a mycobacterial origin of this disease. This test therefore appears to be a
promising diagnostic resource, particularly in those with non-pulmonary TB in whom
achieving a culture diagnosis may be both difficult and hazardous.
8.5 References1. Dye C, Scheele S, Dolin P, et al. Consensus statement. Global burden of
tuberculosis: estimated incidence, prevalence, and mortality by country. WHO
Global Surveillance and Monitoring Project. Jama 1999;282:677-86.
2. Balasubramanian V, Wiegeshaus EH, Taylor BT and Smith DW. Pathogenesis of
tuberculosis: pathway to apical localization. Tuber Lung Dis 1994;75:168-78.
3. Gatto A. Report on Cases of Tuberculosis Reported in 1999: PHLS
Communicable Diseases Surveillance Centre.
www.phls.co.uk/facts/TB/lndex/htm
4. Brisson-Noel A, Aznar C, Chureau C, et ai. Diagnosis of tuberculosis by DMA
amplification in clinical practice evaluation. Lancet 1991;338:364-6.
5. Wong CF, Yew WW, Chan CY, et ai. Rapid diagnosis of smear-negative
pulmonary tuberculosis via fibreoptic bronchoscopy: utility of polymerase chain
172

reaction in bronchial aspirates as an adjunct to transbronchial biopsies. Respir
Med 1998;92:815-9.
6. Yuen KY, Chan KS, Chan CM, et al. Use of PCR in routine diagnosis of treated
and untreated pulmonary tuberculosis. J Clin Pathol 1993;46:318-22.
7. AI Zahrani K, AI Jahdali H, Poirier L, at a/. Accuracy and utility of commercially
available amplification and serologic tests for the diagnosis of minimal pulmonary
tuberculosis. Am J Respir Grit Care Med 2000;162:1323-9.
8. Soini H, Musser JM. Molecular diagnosis of mycobacteria. Clin Chem
2001;47:809-14.
9. Maino VC, Picker LJ. Identification of functional subsets by flow cytometry:
intracellular detection of cytokine expression. Cytometry 1998;34:207-15
10. Callan MF, Tan L, Annels N, et al. Direct visualization of antigen-specific CD8+ T
cells during the primary immune response to Epstein-Barr virus In vivo. J Exp
Mecf 1998;187:1395-402
11. Lalvani A, Pathan AA, Durkan H, et al. Enhanced contact tracing and spatial
tracking of Mycobacterium tuberculosis infection by enumeration of antigen-
specific I cells. Lancet 2001;357:2017-21.
12. Kappelmayer J, Gratama JW, Karaszi E, et al. Flow cytometric detection of
intracellular myeloperoxidase, CD3 and CD79a. Interaction between monoclonal
antibody clones, fluorochromes and sample preparation protocols. J Immunol
Methods 2000;242:53-65.
13. Schwander SK, Torres M, Sada E, et al. Enhanced responses to Mycobacterium
tuberculosis antigens by human alveolar lymphocytes during active pulmonary
tuberculosis. J Infect Dis 1998;178:1434-45.
14. Faith A, Schellenberg DM, Rees AD and Mitchell DM. Antigenic specificity and
subset analysis of T cells isolated from the bronchoalveolar lavage and pleural
effusion of patients with lung disease. Clin Exp Immunol 1992;87:272-8.
15. Condos R, Rom WN, Liu YM and Schluger NW. Local immune responses
correlate with presentation and outcome in tuberculosis. Am J Respir Crit Care
Med 1998;157:729-35.
16. Chackerian AA, Perera TV and Behar SM. Gamma interferon-producing CD4+ T
lymphocytes in the lung correlate with resistance to infection with Mycobacterium
tuberculosis. Infect Immun 2001;69:2666-74.
173
17. Demangel C, Bean AG, Martin E, et al. Protection against aerosol
Mycobacterium tuberculosis infection using Mycobacterium bovis Bacillus
Calmette Guerin-infected dendritic cells. EurJ Immunol 1999;29:1972-9.
18. Havenith CE, van Haarst JM, Breedijk AJ, et al. Enrichment and characterization
of dendritic cells from human bronchoalveolar lavages. Clin Exp Immunol
1994;96:339-43.
19. Mitchell DN, Rees RJ. A transmissible agent from sarcoid tissue. Lancet
1969;2:81-4
20. Saboor SA, Johnson NM and McFadden J. Detection of mycobacterial DMA in
sarcoidosis and tuberculosis with polymerase chain reaction. Lancet
1992;339:1012-5
21. Mitchell 10, Turk JL and Mitchell DN. Detection of mycobacterial rRNA in
sarcoidosis with liquid-phase hybridisation. Lancet 1992;339:1015-7
22. Almenoff PL, Johnson A, Lesser M and Mattman LH. Growth of acid fast L forms
from the blood of patients with sarcoidosis. Thorax 1996;51:530-3
23. Bocart D, Lecossier D, De Lassence A, et al. A search for mycobacterial DMA in
granulomatous tissues from patients with sarcoidosis using the polymerase chain
reaction. Am Rev Respir Dis 1992;146:1142-8
24. Barry SM, Lipman MC, Johnson MA and Prentice HG. Respiratory infections in
immunocompromised patients. CurrOpin Pulm Med 1999;5:168-73.
25. Johnson PD, Stuart RL, Grayson ML, et al. Tuberculin-purified protein derivative-,
MPT-64-, and ES AT-6-stimulated gamma interferon responses in medical
students before and after Mycobacterium bovis BCG vaccination and in patients
with tuberculosis. Clin Diagn Lab Immunol 1999;6:934-7.
26. Sodhi A, Gong J, Silva C, et al. Clinical correlates of interferon gamma
production in patients with tuberculosis. Clin Infect Dis 1997;25:617-20.
27. Barry S, Condez, A, Johnson, MA and Janossy, G. Determination of
Bronchoalveolar Lavage Leukocyte Populations by Flow Cytometry in Patients
Investigated for Respiratory Disease. Clinical Cytometry 2002,50 in press.
28. Flynn JL, Chan J, Triebold KJ, et al. An essential role for interferon gamma in
resistance to Mycobacterium tuberculosis infection. J Exp Med 1993;178:2249-
54.
174

29. Flynn JL, Goldstein MM, Chan J, et al. Tumor necrosis factor-alpha is required in
the protective immune response against Mycobacterium tuberculosis in mice,
/mmun/fy 1995;2:561-72.
30. Altare F, Lammas D, Revy P, etal. Inherited interleukin 12 deficiency in a child
with bacille Calmette-Guerin and Salmonella enteritidis disseminated infection. J
Clin Invest 1998;102:2035-40.
31. Jouanguy E, Lamhamedi-Cherradi 8, Altare F, etal. Partial interferon-gamma
receptor 1 deficiency in a child with tuberculoid bacillus Calmette-Guerin infection
and a sibling with clinical tuberculosis. J Clin Invest 1997;100:2658-64.
32. Newport MJ, Huxley CM, Huston 8, et al. A mutation in the interferon-gamma-
receptor gene and susceptibility to mycobacterial infection. N Engl J Med
1996;335:1941-9.
33. Bean AG, Roach DR, Briscoe H, et al. Structural deficiencies in granuloma
formation in IN F gene-targeted mice underlie the heightened susceptibility to
aerosol Mycobacterium tuberculosis infection, which is not compensated for by
lymphotoxin. J Immunol 1999;162:3504-11.
175

Chapter 9
Discussion
176

9.1 DiscussionAmongst many researchers there is an idea that FCM is an ‘aristocratic’ technique. Its
use, primarily by immunologists has been to develop ever more intricate ways of
investigating the extraordinary complexity of immune responses, culminating in the
impressive, but bewildering 11-colour, 13-parameter FCM analysis of lymphocytes [1] .
Although FCM has the capability to determine not only cluster differentiation (CD)
antigens on the surface of cells, it can also analyse intracellular antigens, such as
cytokines, or nuclear markers of cellular proliferation to provide a highly complex
analysis of cellular functions. Therefore, this technology has been widely perceived as
being appropriate only for complex research applications, primarily in the field of
immunology. This view is unjustified since it is the very precision of this technology that
lends itself equally well to the simple differentiation of leukocytes as to more complex
leukocyte phenotyping studies.
The precision of FCM stems from a number of factors. First, the development of
highly specific monoclonal antibodies has enabled subsets of cells or other analytes to
be labelled. Second the discovery of different fluorochromes with which the antibodies
can be conjugated and which offer minimal spectral overlap following laser excitation has
made differentiation feasible by FCM. Third, the fact that large numbers of events are
analysed during flow cytometric acquisition of samples has ensured that statistical
variability is minimised.
These benefits offered by flow cytometry have long been recognised as an important
solution to the inherent limitations provided by manual counting of leukocyte differentials
using a microscope [2] . At the present time, automated haematology analysers
generally perform leukocyte differential counting using several techniques. However,
there is a growing acceptance that FCM is an alternative technique that is precise and
offers the advantage of being able to provide absolute cell counts. Recently, the
acceptance of CD45 panleukogating in simplifying the protocols for leukocyte and
lymphocyte differential analysis has been acknowledged [3, 4] . These developments
have heralded a new era for FCM and widened its application from complex
immunological research tool to that of a ‘workhorse’ capable of the routine evaluation of
white blood cell differentials. New flow cytometers that work on volumetric sample
acquisition and therefore provide absolute cell counts without the need for expensive
bead systems are eminently suited to this task [5] . It is particularly exciting that a
volumetric cytometer may be able to perform absolute cell counts, simple leukocyte
177

differentials and also to undertake multiplex analysis of samples to detect the presence
of either antigens, or antibodies to a wide variety of different pathogens, th is
multiplexing facility offers enormous potential for the differential diagnosis of infectious
disease [6] and is the sort of technology that could revolutionise laboratory diagnosis in
both resource rich and poor settings.
Unfortunately, there has been a reluctance to adopt these exciting new technologies
for the analysis of tissue fluid samples such as BAL. Although several investigators have
demonstrated that FCM is better suited to performing CD4/CD8 differentials than the
time consuming and cumbersome immunofluoresence or immunoperoxidase techniques
[7, 8], it has yet to be adopted as a routine diagnostic tool.
This study has therefore attempted to redress this imbalance by demonstrating that
FCM is the appropriate technology for BAL analysis. The first problem was to
demonstrate that BAL leukocyte differentials and lymphocyte subset ratios could be
reliably performed by FCM. Although previous investigators had already recognised the
value of CD45 directed gating [8, 9] , their interest was primarily in determining the
lymphocyte component in BAL. Such a focus on the lymphocytes neglected the clinically
relevant granulocyte populations in BAL and therefore did not provide adequate
evidence of the benefits of FCM over conventional cytospin methods. Here, the value of
CD45 panleukogating for distinguishing leukocytes from epithelial cells and debris in
BAL has been confirmed. In addition, it has been demonstrated that BAL lymphocyte
gating using a combination of CD45 expression and low side scatter is an adequate
method for determining the lymphocyte percentages in BAL. When this method was
compared with a lymphosum method that gated the individual lymphocyte components
(T cells, B cells and NK cells), the results were virtually indistinguishable.
The more difficult problem was to distinguish macrophages from granulocytes.
Rather than attempt to directly distinguish macrophages by FCM, a notoriously difficult
project due to their autofluorescence, heterogenous intrinsic characterisitcs and the lack
of an adequate surface marker, a different approach was adopted here. Characterisation
of granulocytes using CD15 allowed the macrophage pool to be derived as those CD45+
events remaining after subtraction of the lymohocytes and granulocytes. When
compared with cytospin preparations in which 500 BAL leukocytes were counted by a
highly experienced cytologist, this flow cytometric method showed good agreement for
determining the BAL leukocyte differentials. As expected, the coefficient of variation for
differential analysis by FCM was considerably lower than by cytospin. The conclusion of
178

this initial study was that the use of only two monoclonal antibodies, CD45 and CD15
was adequate to demonstrate the major clinically relevant leukocyte populations in BAL
by FCM. Additional discrimination of granulocytes into eosinophils and neutrophils was
achieved by the addition of an antibody against the IgE receptor, CD23.
The value of BAL lymphocyte subset analysis, in particular the CD4/CD8 ratio has
also been demonstrated to be of diagnostic value in diseases such as sarcoidosis by
many investigators and therefore it was felt to be important to include such discrimination
in a single four-colour panel together with CD45 and CD15. A simplified method by
which lymphocytes were gated on the basis of CD45 and side scatter and then directly
differentiated into CD4 and CD8 components offered no loss of precision when
compared to a more sophisticated panel including the I cell marker, CD3. The final
conclusion of this initial investigation is that a single four-colour panel combining
CD45/CD15/CD4 and CD8 can rapidly provide most of the clinically relevant information
required for the differential diagnosis of various respiratory diseases. Moreover, it has
also been demonstrated that such a system is equally applicable for the analysis of other
tissue fluid samples such as pleural fluid, cerebrospinal fluid and ascitic fluid.
One of the most significant findings of early studies investigating the lung as a site
of pathological and diagnostic interest was the discovery that the responses
demonstrated at the site of disease activity in the lung were not reflected by the
responses demonstrated in the blood. This has held true not only for the simple
lymphocyte differentials in patients with sarcoidosis, but also for the demonstration of
cytokine responses in the lung in patients with TB [10] and sarcoidosis [11] . These
findings have emphasised the importance of focusing on the immune responses at the
site of infection, rather than in the blood. Such an approach has also been informative in
patients presenting with respiratory illness in unusual circumstances. Here, an HIV-
infected man was identified who developed a pneumonic illness following the institution
of highly active antiretroviral therapy (HAART) after an episode of treated PCP. Analysis
of the CD8 lymphocyte phenotype demonstrated the predominance of proliferating
(Ki67+), perforin producing cells in BAL, that declined considerably following steroid
therapy and were not seen in the blood [12] . In this case it was argued that the highly
atypical proliferating CD8 lymphocytes may have represented an immune reconstitution
disorder to P. carinii antigen after vigorous immune restoration on HAART. Nevertheless,
although interesting and informative, studies such as these are not proof of the concept
179

since the antigen-specific responses were not measured. The most informative
investigations of tissue fluid analysis will therefore be those that focus on determining the
pathogen-specific lymphocyte responses.
In the light of its clinical importance, together with an emphasis on pulmonary
presentation, TB has emerged as the most obvious candidate for the investigation of
tissue immune responses. Several investigators have sought to determine the TB-
specific responses in the lung in both human infection and animal models, but these
early studies have generally been hampered by complex techniques that are not
appropriate for routine clinical investigation.
Several of the early studies used lymphocytes that were separated from BAL and
then incubated with peripheral blood mononuclear cells (PBMC’s) from the same
patients Before measuring proliferative responses to TB antigens [10,13]. In these two
studies the investigators presumably felt that BAL either did not contain adequate
numbers of dendritic cells (DC) or that alveolar macrophages may suppress this process
and so consequently PBMC’s were used as a source of antigen presenting cells.
Nevertheless, DC s have been identified in BAL and more importantly, these cells have
been demonstrated to be increased following TB infection in both humans [14] and
animals [15, 16]. Therefore, unmanipulated BAL from patients with TB should contain
sufficient dendritic cells for antigen presentation. This assumption has opened the way
for simple, rapid analysis of antigen-specific responses either using ELISPOT or FCM.
IFN-y synthesis in BAL has been reported both in patients with TB [10], and also in
their household contacts [17] in response to TB antigens when measured by ELISPOT.
However, it has been argued here that ELISPOT is not the optimum method for
determining antigen-specific responses in BAL since the proportion of lymphocytes and
the CD4 and CD8 subset ratios are highly variable in the lung during infectious episodes.
These facts are relevant because the TB antigens that are used in these assays, such
as PPD, Ag85, and ESAT-6 are generally large and predominantly presented to CD4
lymphocytes. By contrast, CD8 responses may be preferentially stimulated by smaller
peptides of 9 amino acids.
Therefore, flow cytometry, which can rapidly determine the cytokine synthetic
responses specifically in either the CD4 or the CD8 lymphocyte subset is likely to be far
more sensitive than the ELISPOT system. For example, in one paper in which ELISPOT
was used to determine the IFN-y secretion following incubation with PPD [10], the
median number of spot forming colonies/10® BAL cells was 400 in a small subset of
180

patients with pulmonary TB, giving a response rate of 0.4%. In the study presented in
this thesis, the median IFN-y response rate in the BAL CD4 lymphocytes was 25.2% by
flow cytometry. This huge discrepancy may explain why these authors did not find IFN-y
secretion in BAL taken from the unaffected lung in these patients in contrast to the data
presented here.
Another important advantage of FCM over ELISPOT is that multiple cytokine
responses can be determined in the same cognate T lymphocytes. The demonstration of
greater TNF-a synthesis than IFN-y in BAL CD4 cells from patients with TB is especially
interesting. The analysis of multiple cytokine synthetic capabilities by antigen-specific
cells may be particularly important in certain situations such as HIV infection, where
there may be a relative defect in one of the responses. It would be interesting to note
whether the increased presentation of non-pulmonary TB in HIV infected individuals is
not only explained by CD4 lymphopoenia, but also by a loss of TNF-a synthesis, which
has been demonstrated to be vital for protective granuloma formation in animal models.
Although PPD was used as the stimulatory antigen in this thesis, it would be
interesting to continue this work by examining the responses to other antigens that are
specific for TB and that do not share epitopes with BCG, such as ESAT-6. Since it has
been demonstrated here that prior BCG vaccination does not result in type-1 cytokine
synthesis following incubation with PPD in the lung, in contrast to the findings in
peripheral blood, it is unlikely that ESAT-6, or similar peptides will prove more sensitive
for TB diagnosis in BAL. The problem with using specific peptides will be that the
responses demonstrated will be almost certainly much smaller than with PPD. However,
it will be extremely interesting to investigate which antigens stimulate the optimum
cytokine responses in BAL from patients with sarcoidosis. The tantalising discovery of
responses to PPD in these patients has opened the old debate as to whether sarcoidosis
is indeed a response to mycobacterial antigens, although these may be environmental
mycobacteria rather than M. tuberculosis.
This simple, rapid flow cytometric method is also applicable for the study of other
clinically relevant antigen-specific responses in BAL. A significant CD4 IFN-y synthetic
response to cytomegalovirus (CMV) viral lysate was demonstrated in a bone marrow
transplant patient who developed a febrile respiratory illness. Analysis of BAL confirmed
the presence of CMV nucleic acid by PCR that was not present in the blood where the
CD4 cytokine response was correspondingly low (submitted for publication).
181

In summary, the work presented in this thesis has demonstrated the value of a
focused investigation of BAL and highlighted the role of flow cytometry in this pocess.
FCM has been shown to be applicable both for the routine analysis of simple variables
such as the leukocyte differentials and CD4/CD8 ratios in BAL as well as demonstrating
the presence of antigen-specific responses to clinically relevant pathogens such as M
tuberculosis. These findings have therefore brought flow cytometry firmly into the realms
of diagnostic investigation in the fields of respiratory medicine and infectious disease.
9.2 References
1. De Rosa SC, Herzenberg LA, Roederer M. 11-color, 13-parameter flow,
cytometry: identification of human naive I cells by phenotype, function, and T-cell
receptor diversity. Nat Med 2001 ;7:245-8.
2. Koepke JA, Dotson MA, Shifman MA. A critical evaluation of the manual/visual
differential leukocyte counting method. Blood Cells 1985;11:173-86
3. Glencross DK SL, Jani IV, Barnett D and Janossy G. CD45-Assisted
Panleukogating for Accurate, Cost-Effective Dual-Platform CD4+ T-Cell
Enumeration. Cytometry (Clinical Cytometry) 2002;50:69-78
4. Janossy G, Jani IV, Bradley NJ, et al. Affordable CD4(+)-T-cell counting by flow
cytometry: CD45 gating for volumetric analysis. Clin Diagn Lab Immunol
2002;9:1085-94.
5. Janossy G, Jani IV, Kahan M, et al. Precise CD4 T-cell counting using red diode
laser excitation: For richer, for poorer. Cytometry 2002;50:78-85
6. Jani IV, Janossy G, Brown DW, etal. Multiplexed immunoassays by flow
cytometry for diagnosis and surveillance of infectious diseases in resource-poor
settings. Lancet Infect Dis 2002;2:243-50
7. Padovan CS, Behr J, Allmeling AM, et al. Immunophenotyping of lymphocyte
subsets in bronchoalveolar lavage fluid. Comparison of flow cytometric and
immunocytochemical techniques. J Immunol Methods 1992;147:27-32.
8. Brandt B, Thomas M, von Eiff M, et al. Immunophenotyping of lymphocytes
obtained by bronchoalveolar lavage: description of an all-purpose tricolor flow
cytometric application. J Immunol Methods 1996;194:95-102.
182

9. Dauber JH, Wagner M, Brunsvold S, et aJ. Flow cytometric analysis of
lymphocyte phenotypes in bronchoalveolar lavage fluid: comparison of a two-
color technique with a standard immunoperoxidase assay. Am J Respir Cell Mol
8/0/1992:7:531-41.
10. Schwander SK, Torres M, Sada E, et al. Enhanced responses to Mycobacterium
tuberculosis antigens by human alveolar lymphocytes during active pulmonary
tuberculosis. J Infect Dis 1998;178:1434-45.
11. Wahlstrom J, Katchar K, Wigzell H, et al. Analysis of intracellular cytokines in
CD4+ and CD8+ lung and blood T cells in sarcoidosis. Am J Respir Crit Care
/Wed 2001;163:115-21.
12. Barry SM, Lipman MC, Deery AR, et al. Immune reconstitution pneumonitis
following Pneumocystis carinii pneumonia in HIV-infected subjects. HIV Med
2002;3:207-11
13. Faith A, Schellenberg DM, Rees AD, et al. Antigenic specificity and subset
analysis of I cells isolated from the bronchoalveolar lavage and pleural effusion
of patients with lung disease. Clin Exp Immunol 1992;87:272-8.
14. Henderson RA, Watkins SC, Flynn JL. Activation of human dendritic cells
following infection with Mycobacterium tuberculosis. J Immunol 1997;159:635-43.
15. Demangel C, Bean AG, Martin E, etal. Protection against aerosol
Mycobacterium tuberculosis infection using Mycobacterium bovis Bacillus
Calmette Guerin-infected dendritic cells. Bur J Immunol 1999;29:1972-9.
16. Havenith CE, Breedijk AJ, Hoefsmit EC. Effect of Bacillus Calmette-Guerin
inoculation on numbers of dendritic cells in bronchoalveolar lavages of rats.
Immunobiology 1992;184:336-47.
17. Schwander SK, Torres M, Carranza CC, et al. Pulmonary mononuclear cell
responses to antigens of Mycobacterium tuberculosis in healthy household
contacts of patients with active tuberculosis and healthy controls from the
community. J Immunol 2000;165:1479-85
183

Glossary of Abréviations
AFB acid fast bacillus
APC antigen presenting cell
BAL bronchoalveolar lavage
BMT bone marrow transplantation
CD cluster differentiation
CMV cytomegalovirus
DEAFF direct early antigen fluorescent foci
DNA deoxyribonucleic acid
EDTA ethylenediamine tetracetate
ELISA enzyme-linked immunoabsorbant assay
ESAT-6 early secretory antigen of tuberculosis-6
FCM flow cytometry
HAART highly active antiretroviral therapy
HIV human immunodeficiency virus
IFN-y Interferon-y
MFI mean fluorescence intensity
MAI mycobacterium avium intracellulari
MOTT mycobacterium other than TB
NK natural killer cell
PBMC peripheral blood mononuclear cell
PBS phosphate buffered saline
PCP Pneumocystis carinii pneumonia
PCR polymerase chain reaction
PPD purified protein derivative
RSV respiratory syncitial virus
SACE serum angiotensin converting enzyme
SEB staphylococcal enterotoxin B
SIV simian immunodeficiency virus
TB tuberculosis
TNF-a tumour necrosis factor-a
ZN Ziehl neelson
184

Appendix 1
Presentation of results of flow cytometric analysis of BAL leukocyte differentials
and CD4/CD8 ratios given to clinicians
Royal Free and University College Medical SchoolDept Immunology and Molecular Pathology, Royal free Campus, Rowland H ill St London NW3 2PF
H IV Immunology UnitProf G Janossy,MD, PhD, PRC Path, DSc RFH ex 3745BAL Leukocyte Differential Analysis by FCM
ssc
00
QU
CD 15
Lymphocytes (R2)= 83.8% Granulocytes (R3)= 0.5% Macrophages = 15.7%
CD4/CD8 ratio: 15.8
CD 4
ConclusionMassive lymphocytosis w ith greatly increased CD4/CD8 Ratio strongly supportive o f sarcoidosis.
Dr S Barry
185
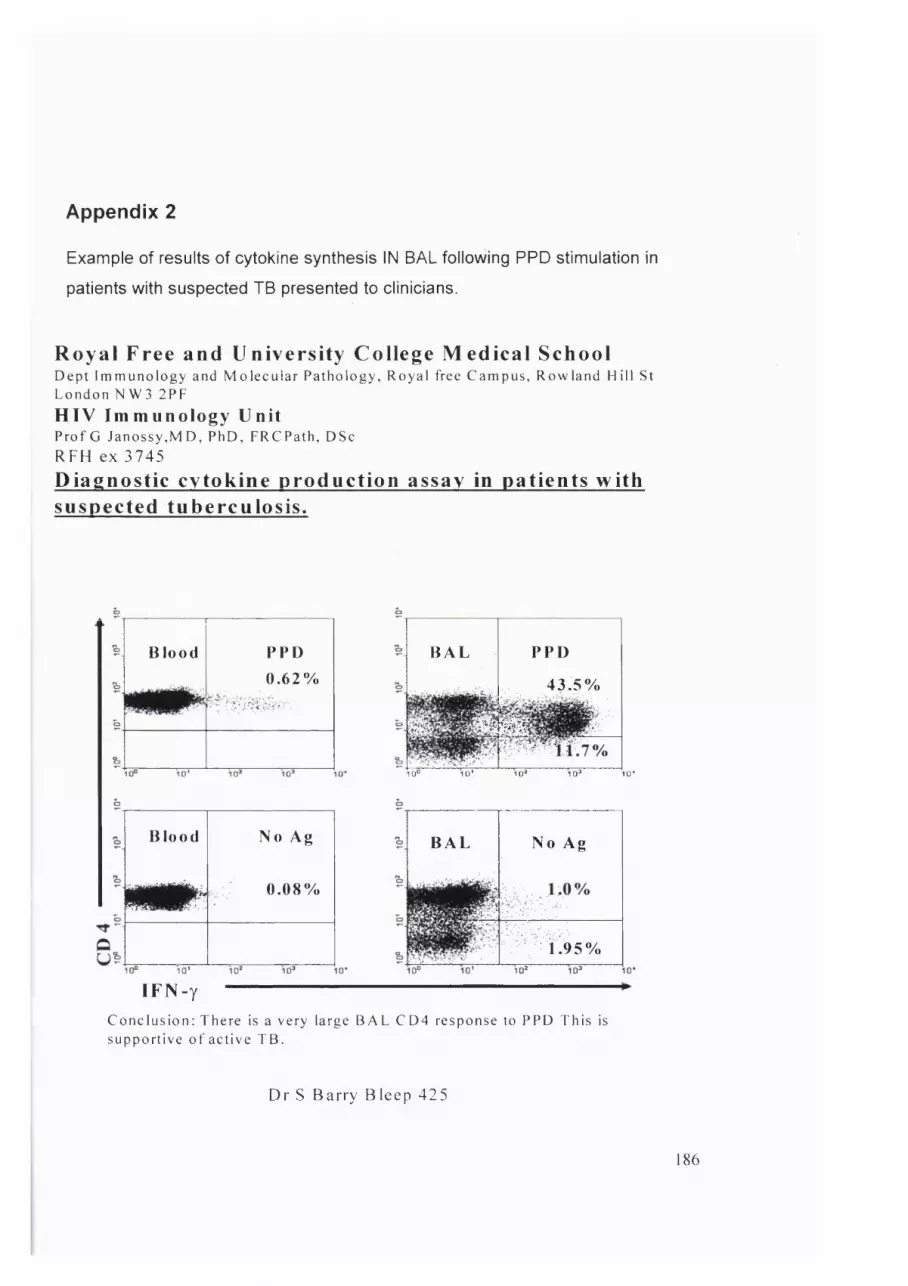
Appendix 2
Example of results of cytokine synthesis IN BAL following PPD stimulation in
patients with suspected TB presented to clinicians.
R o y a l Free and Uni vers i ty Col lege M e d i c a l S c hoo lDe pt Im m u n o l o g y and M o l e c u l a r Pathology, Royal free C ampus, R ow la nd Hi l l StLondon N W 3 2P F
H I V I m m u n o l o g y Un i tP ro f G Ja nos s y , M D , P hD , F RC P at h , DSc
RFH ex 3745
Diag n ost ic cy to k ine p ro d u c t i o n assay in pat ients with suspected tuberculos i s .
Blood PPD0.62%
BAL PPD
43.5%
wmm10° ID' 1 0 ' 1 0° 10*
Blood No Ag
0.08%
BAL No Ag
1.95%
IF N -yConclus ion: There is a very large B A L C D 4 response to P PD This is support ive o f active T B .
D r S B a rry B leep 425
186
Related Documents