pharmaceuticals Article Luteolin-Loaded Elastic Liposomes for Transdermal Delivery to Control Breast Cancer: In Vitro and Ex Vivo Evaluations Mohammad A. Altamimi 1, * , Afzal Hussain 1, * , Mohammad AlRajhi 1 , Sultan Alshehri 1 , Syed Sarim Imam 1 and Wajhul Qamar 2 Citation: Altamimi, M.A.; Hussain, A.; AlRajhi, M.; Alshehri, S.; Imam, S.S.; Qamar, W. Luteolin-Loaded Elastic Liposomes for Transdermal Delivery to Control Breast Cancer: In Vitro and Ex Vivo Evaluations. Pharmaceuticals 2021, 14, 1143. https://doi.org/10.3390/ph14111143 Academic Editor: Dimitris Tsiourvas Received: 19 October 2021 Accepted: 8 November 2021 Published: 11 November 2021 Publisher’s Note: MDPI stays neutral with regard to jurisdictional claims in published maps and institutional affil- iations. Copyright: © 2021 by the authors. Licensee MDPI, Basel, Switzerland. This article is an open access article distributed under the terms and conditions of the Creative Commons Attribution (CC BY) license (https:// creativecommons.org/licenses/by/ 4.0/). 1 Department of Pharmaceutics, College of Pharmacy, King Saud University, P.O. Box 2457, Riyadh 11451, Saudi Arabia; [email protected] (M.A.); [email protected] (S.A.); [email protected] (S.S.I.) 2 Department of Pharmacology and Toxicology, College of Pharmacy, King Saud University, P.O. Box 2457, Riyadh 11451, Saudi Arabia; [email protected] * Correspondence: [email protected] (M.A.A.); [email protected] (A.H.) Abstract: The study aimed to prepare and optimize luteolin (LUT)-loaded transdermal elastic liposomes (LEL1-LEL12), followed by in vitro and ex vivo evaluations of their ability to control breast cancer. Various surfactants (Span 60, Span 80, and Brij 35), and phosphatidyl choline (PC) as a lipid, were used to tailor various formulation as dictated by “Design Expert ® software (DOE). These were characterized for size, polydispersity index (PDI), and zeta potential. The optimized formulation (OLEL1) was selected for comparative investigations (in vitro and ex vivo) against lipo (conventional liposomes) and drug suspension (DS). Moreover, the in vitro anticancer activity of OLEL1 was compared against a control using MCF-7 cell lines. Preliminary selection of the suitable PC: surfactant ratio for formulations F1–F9 showed relative advantages of Span 80. DOE suggested two block factorial designs with four center points to identify the design space and significant factors. OLEL1 was the most robust with high functional desirability (0.95), minimum size (202 nm), relatively high drug release, increased drug entrapment (92%), and improved permeation rate (~3270 μg/cm 2 ) as compared with liposomes (~1536 μg/cm 2 ) over 24 h. OLEL1 exhibited a 6.2- to 2.9-fold increase in permeation rate as compared with DS (drug solution). The permeation flux values of OLEL1, and lipo were found to be 136.3, 64 and 24.3 μg/h/cm 2 , respectively. The drug disposition values were 670 μg, 473 μg and 148 μg, for OLEL1, lipo and DS, respectively. Thus, ex vivo parameters were significantly better for OLEL1 compared with lipo and DS which is attributed to the flexibility and deformability of the optimized formulation. Furthermore, OLEL1 was evaluated for anticancer activity and showed maximized inhibition as compared with DS. Thus, elastic liposomes may be a promising approach for improved transdermal delivery of luteolin, as well as enhancing its therapeutic efficacy in controlling breast cancer. Keywords: luteolin; elastic liposomes; design expert-based optimization; ex vivo permeation and drug deposition; cytotoxicity against MCF-7 1. Introduction Cancer is a disease with the highest mortality rate second only to cardiovascular disorders [1,2]. Furthermore, Sung H, et al., published statistics based on GLOBOCAN, showing that nearly 20 million new cancer cases and 10 million deaths occurred worldwide in the year 2020 alone. The projection of newly diagnosed cancer cases worldwide is estimated to be nearly 30 million in 2040 [3]. In 2020, 2.3 million women were diagnosed with breast cancer and 568,000 deaths occurred globally [4]. Several synthetic and natural drugs have been explored for their therapeutic poten- tial to control breast cancer. However, commercial synthetic or semi-synthetic drugs are associated with various side effects and drug related toxicity. Natural luteolin (LUT) is found in spinach, different peppers, and lettuce. LUT possess anticancer potential despite Pharmaceuticals 2021, 14, 1143. https://doi.org/10.3390/ph14111143 https://www.mdpi.com/journal/pharmaceuticals

Welcome message from author
This document is posted to help you gain knowledge. Please leave a comment to let me know what you think about it! Share it to your friends and learn new things together.
Transcript
pharmaceuticals
Article
Luteolin-Loaded Elastic Liposomes for Transdermal Delivery toControl Breast Cancer: In Vitro and Ex Vivo Evaluations
Mohammad A. Altamimi 1,* , Afzal Hussain 1,* , Mohammad AlRajhi 1, Sultan Alshehri 1 ,Syed Sarim Imam 1 and Wajhul Qamar 2
�����������������
Citation: Altamimi, M.A.; Hussain,
A.; AlRajhi, M.; Alshehri, S.; Imam,
S.S.; Qamar, W. Luteolin-Loaded
Elastic Liposomes for Transdermal
Delivery to Control Breast Cancer: In
Vitro and Ex Vivo Evaluations.
Pharmaceuticals 2021, 14, 1143.
https://doi.org/10.3390/ph14111143
Academic Editor: Dimitris Tsiourvas
Received: 19 October 2021
Accepted: 8 November 2021
Published: 11 November 2021
Publisher’s Note: MDPI stays neutral
with regard to jurisdictional claims in
published maps and institutional affil-
iations.
Copyright: © 2021 by the authors.
Licensee MDPI, Basel, Switzerland.
This article is an open access article
distributed under the terms and
conditions of the Creative Commons
Attribution (CC BY) license (https://
creativecommons.org/licenses/by/
4.0/).
1 Department of Pharmaceutics, College of Pharmacy, King Saud University, P.O. Box 2457,Riyadh 11451, Saudi Arabia; [email protected] (M.A.); [email protected] (S.A.);[email protected] (S.S.I.)
2 Department of Pharmacology and Toxicology, College of Pharmacy, King Saud University, P.O. Box 2457,Riyadh 11451, Saudi Arabia; [email protected]
* Correspondence: [email protected] (M.A.A.); [email protected] (A.H.)
Abstract: The study aimed to prepare and optimize luteolin (LUT)-loaded transdermal elasticliposomes (LEL1-LEL12), followed by in vitro and ex vivo evaluations of their ability to controlbreast cancer. Various surfactants (Span 60, Span 80, and Brij 35), and phosphatidyl choline (PC)as a lipid, were used to tailor various formulation as dictated by “Design Expert® software (DOE).These were characterized for size, polydispersity index (PDI), and zeta potential. The optimizedformulation (OLEL1) was selected for comparative investigations (in vitro and ex vivo) against lipo(conventional liposomes) and drug suspension (DS). Moreover, the in vitro anticancer activity ofOLEL1 was compared against a control using MCF-7 cell lines. Preliminary selection of the suitablePC: surfactant ratio for formulations F1–F9 showed relative advantages of Span 80. DOE suggestedtwo block factorial designs with four center points to identify the design space and significant factors.OLEL1 was the most robust with high functional desirability (0.95), minimum size (202 nm), relativelyhigh drug release, increased drug entrapment (92%), and improved permeation rate (~3270 µg/cm2)as compared with liposomes (~1536 µg/cm2) over 24 h. OLEL1 exhibited a 6.2- to 2.9-fold increase inpermeation rate as compared with DS (drug solution). The permeation flux values of OLEL1, and lipowere found to be 136.3, 64 and 24.3 µg/h/cm2, respectively. The drug disposition values were 670 µg,473 µg and 148 µg, for OLEL1, lipo and DS, respectively. Thus, ex vivo parameters were significantlybetter for OLEL1 compared with lipo and DS which is attributed to the flexibility and deformabilityof the optimized formulation. Furthermore, OLEL1 was evaluated for anticancer activity and showedmaximized inhibition as compared with DS. Thus, elastic liposomes may be a promising approach forimproved transdermal delivery of luteolin, as well as enhancing its therapeutic efficacy in controllingbreast cancer.
Keywords: luteolin; elastic liposomes; design expert-based optimization; ex vivo permeation anddrug deposition; cytotoxicity against MCF-7
1. Introduction
Cancer is a disease with the highest mortality rate second only to cardiovasculardisorders [1,2]. Furthermore, Sung H, et al., published statistics based on GLOBOCAN,showing that nearly 20 million new cancer cases and 10 million deaths occurred worldwidein the year 2020 alone. The projection of newly diagnosed cancer cases worldwide isestimated to be nearly 30 million in 2040 [3]. In 2020, 2.3 million women were diagnosedwith breast cancer and 568,000 deaths occurred globally [4].
Several synthetic and natural drugs have been explored for their therapeutic poten-tial to control breast cancer. However, commercial synthetic or semi-synthetic drugs areassociated with various side effects and drug related toxicity. Natural luteolin (LUT) isfound in spinach, different peppers, and lettuce. LUT possess anticancer potential despite
Pharmaceuticals 2021, 14, 1143. https://doi.org/10.3390/ph14111143 https://www.mdpi.com/journal/pharmaceuticals
Pharmaceuticals 2021, 14, 1143 2 of 20
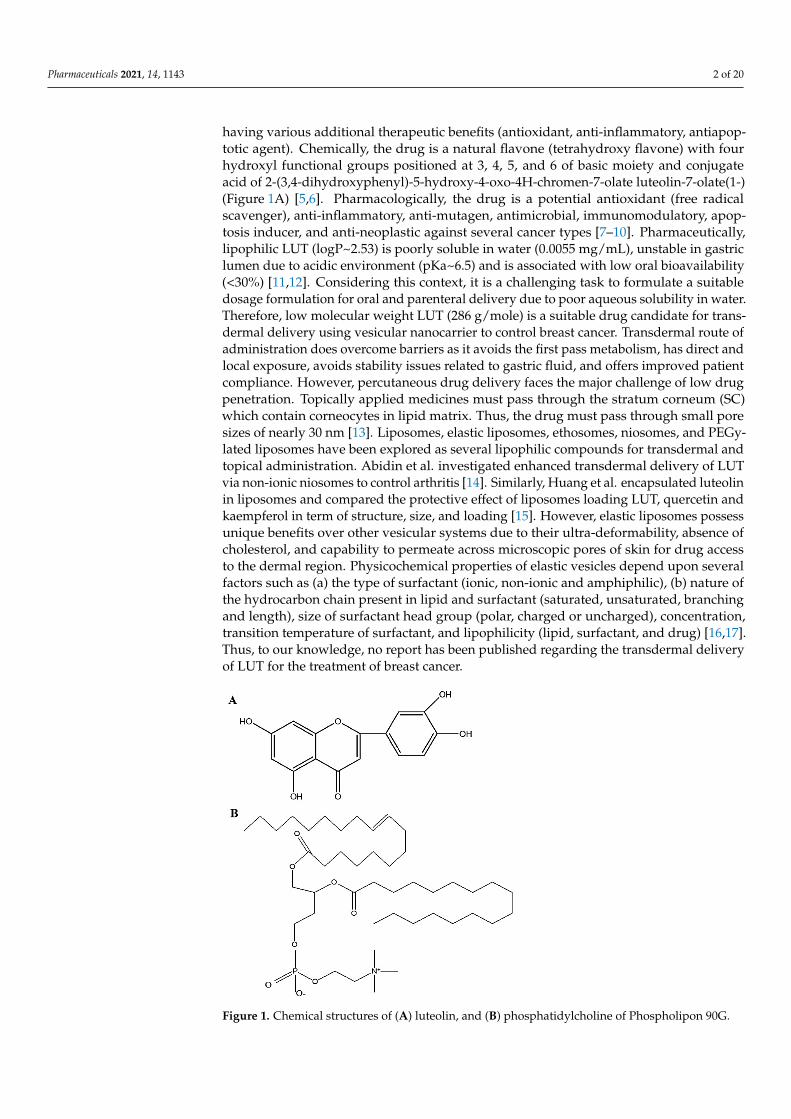
having various additional therapeutic benefits (antioxidant, anti-inflammatory, antiapop-totic agent). Chemically, the drug is a natural flavone (tetrahydroxy flavone) with fourhydroxyl functional groups positioned at 3, 4, 5, and 6 of basic moiety and conjugateacid of 2-(3,4-dihydroxyphenyl)-5-hydroxy-4-oxo-4H-chromen-7-olate luteolin-7-olate(1-)(Figure 1A) [5,6]. Pharmacologically, the drug is a potential antioxidant (free radicalscavenger), anti-inflammatory, anti-mutagen, antimicrobial, immunomodulatory, apop-tosis inducer, and anti-neoplastic against several cancer types [7–10]. Pharmaceutically,lipophilic LUT (logP~2.53) is poorly soluble in water (0.0055 mg/mL), unstable in gastriclumen due to acidic environment (pKa~6.5) and is associated with low oral bioavailability(<30%) [11,12]. Considering this context, it is a challenging task to formulate a suitabledosage formulation for oral and parenteral delivery due to poor aqueous solubility in water.Therefore, low molecular weight LUT (286 g/mole) is a suitable drug candidate for trans-dermal delivery using vesicular nanocarrier to control breast cancer. Transdermal route ofadministration does overcome barriers as it avoids the first pass metabolism, has direct andlocal exposure, avoids stability issues related to gastric fluid, and offers improved patientcompliance. However, percutaneous drug delivery faces the major challenge of low drugpenetration. Topically applied medicines must pass through the stratum corneum (SC)which contain corneocytes in lipid matrix. Thus, the drug must pass through small poresizes of nearly 30 nm [13]. Liposomes, elastic liposomes, ethosomes, niosomes, and PEGy-lated liposomes have been explored as several lipophilic compounds for transdermal andtopical administration. Abidin et al. investigated enhanced transdermal delivery of LUTvia non-ionic niosomes to control arthritis [14]. Similarly, Huang et al. encapsulated luteolinin liposomes and compared the protective effect of liposomes loading LUT, quercetin andkaempferol in term of structure, size, and loading [15]. However, elastic liposomes possessunique benefits over other vesicular systems due to their ultra-deformability, absence ofcholesterol, and capability to permeate across microscopic pores of skin for drug accessto the dermal region. Physicochemical properties of elastic vesicles depend upon severalfactors such as (a) the type of surfactant (ionic, non-ionic and amphiphilic), (b) nature ofthe hydrocarbon chain present in lipid and surfactant (saturated, unsaturated, branchingand length), size of surfactant head group (polar, charged or uncharged), concentration,transition temperature of surfactant, and lipophilicity (lipid, surfactant, and drug) [16,17].Thus, to our knowledge, no report has been published regarding the transdermal deliveryof LUT for the treatment of breast cancer.
Pharmaceuticals 2021, 14, x FOR PEER REVIEW 3 of 22
Figure 1. Chemical structures of (A) luteolin, and (B) phosphatidylcholine of Phospholipon 90G.
2. Results and Discussion
2.1. Screening of Lipid and Surfactant Ratio
2.1.1. Preliminary Study to Select Lipid and Surfactant Ratio
The basic liposomal formulation contains phospholipid (containing ~ 94% phospha-
tidylcholine as major constituent as shown in Figure 1B) and surfactant in a specific ratio.
Here, formulations were prepared using varied ratios of phosphatidylcholine to surfac-
tants. The selected composition ratios were (PC: Span 60, PC: Span 80 and PC: Brij 35)
(Table 1). The basis for selection of the surfactants were hydrophilic lipophilic balance
(HLB), which was anticipated to have significant impact on size, % EE, and elastic nature
of ELs. Results revealed significant difference in the values of size and PDI when formu-
lated with the selected ratio of PC to specific surfactant based on HLB (low and high) and
glass transition temperature (low to high) of surfactant as shown in Table 1. Nonionic
Span 80 (HLB ~ 4.3) and Span 60 (HLB ~ 4.7) are expected to impart substantial deforma-
bility and flexibility in the lipid bilayer followed by reduced vesicle size and PDI values.
Therefore, results showed reduced size of the vesicles (358–170 nm) and PDI (0.62–0.35)
values. Also, the change in PDI values may be due to formation of small micelles to some
extent [16,18,19]. On the other hand, nonionic (hydrophilic) polyoxyethylene (23) lau-
rylether (Brij 35) with (HLB ~ 16.9) showed an increase in the average vesicle size com-
pared with the lipophilic surfactants with nearly similar PDI values at different ratios [20–
22]. The disparity in the hydrophilicity between Brij 35 and LUT is attributed to the aver-
age larger vesicles size as compared with Span 60 and Span 80. In general, micelles are
formed above their CMC value and can coexist with the liposomal formulation leading to
Figure 1. Chemical structures of (A) luteolin, and (B) phosphatidylcholine of Phospholipon 90G.
Pharmaceuticals 2021, 14, 1143 3 of 20
In this study, we aimed to formulate LUT-loaded elastic liposomes using varioussurfactants (based on different HLB and transition temperature), optimize them usingDesign Expert, and evaluate their in vitro parameters. Ex vivo permeation parameters(cumulative permeation rate, enhancement ratio, permeation flux and drug deposition)were investigated using rat skin for comparison against the drug suspension. Finally, theoptimized formulation was evaluated for in vitro anticancer activity using MCF-7 cell lines.
2. Results and Discussion2.1. Screening of Lipid and Surfactant Ratio2.1.1. Preliminary Study to Select Lipid and Surfactant Ratio
The basic liposomal formulation contains phospholipid (containing ~94% phosphatidylcholineas major constituent as shown in Figure 1B) and surfactant in a specific ratio. Here,formulations were prepared using varied ratios of phosphatidylcholine to surfactants. Theselected composition ratios were (PC: Span 60, PC: Span 80 and PC: Brij 35) (Table 1). Thebasis for selection of the surfactants were hydrophilic lipophilic balance (HLB), which wasanticipated to have significant impact on size, % EE, and elastic nature of ELs. Resultsrevealed significant difference in the values of size and PDI when formulated with theselected ratio of PC to specific surfactant based on HLB (low and high) and glass transitiontemperature (low to high) of surfactant as shown in Table 1. Nonionic Span 80 (HLB ~4.3)and Span 60 (HLB ~4.7) are expected to impart substantial deformability and flexibilityin the lipid bilayer followed by reduced vesicle size and PDI values. Therefore, resultsshowed reduced size of the vesicles (358–170 nm) and PDI (0.62–0.35) values. Also, thechange in PDI values may be due to formation of small micelles to some extent [16,18,19].On the other hand, nonionic (hydrophilic) polyoxyethylene (23) laurylether (Brij 35) with(HLB ~16.9) showed an increase in the average vesicle size compared with the lipophilicsurfactants with nearly similar PDI values at different ratios [20–22]. The disparity inthe hydrophilicity between Brij 35 and LUT is attributed to the average larger vesiclessize as compared with Span 60 and Span 80. In general, micelles are formed above theirCMC value and can coexist with the liposomal formulation leading to reduced size andentrapment efficiency of the formulated vesicles. Therefore, Span 80 was selected as thesuitable surfactant for further optimization using the experimental tool (two blocks factorialdesign with four center points) (Design Expert). In the present study, 30 mg lutein wasadded to the formulation to get 3 mg per g of total formulation (0.3% w/w). Moreover,the drug strength per 100 mg of lipid was found to be in the range of 3.2–4.3 mg for thedeveloped formulations (Table 1).
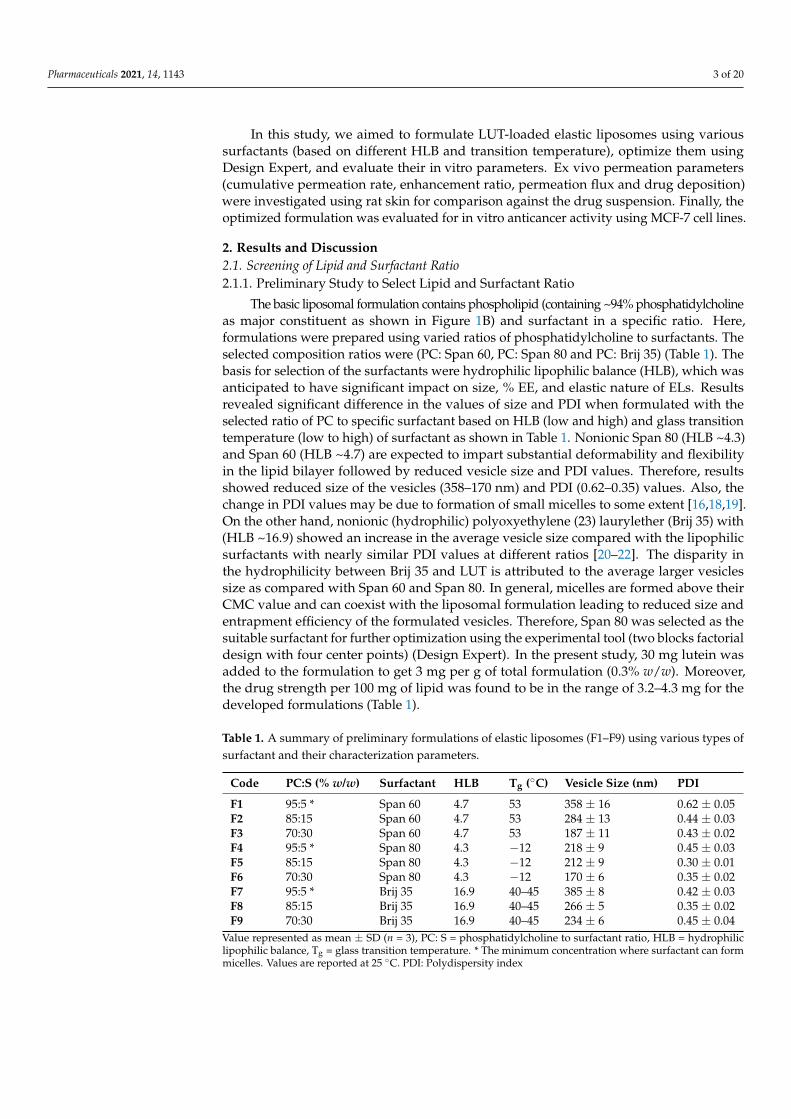
Table 1. A summary of preliminary formulations of elastic liposomes (F1–F9) using various types ofsurfactant and their characterization parameters.
Code PC:S (% w/w) Surfactant HLB Tg (◦C) Vesicle Size (nm) PDI
F1 95:5 * Span 60 4.7 53 358 ± 16 0.62 ± 0.05F2 85:15 Span 60 4.7 53 284 ± 13 0.44 ± 0.03F3 70:30 Span 60 4.7 53 187 ± 11 0.43 ± 0.02F4 95:5 * Span 80 4.3 −12 218 ± 9 0.45 ± 0.03F5 85:15 Span 80 4.3 −12 212 ± 9 0.30 ± 0.01F6 70:30 Span 80 4.3 −12 170 ± 6 0.35 ± 0.02F7 95:5 * Brij 35 16.9 40–45 385 ± 8 0.42 ± 0.03F8 85:15 Brij 35 16.9 40–45 266 ± 5 0.35 ± 0.02F9 70:30 Brij 35 16.9 40–45 234 ± 6 0.45 ± 0.04
Value represented as mean ± SD (n = 3), PC: S = phosphatidylcholine to surfactant ratio, HLB = hydrophiliclipophilic balance, Tg = glass transition temperature. * The minimum concentration where surfactant can formmicelles. Values are reported at 25 ◦C. PDI: Polydispersity index
Pharmaceuticals 2021, 14, 1143 4 of 20
2.1.2. Optimization Using Design Expert
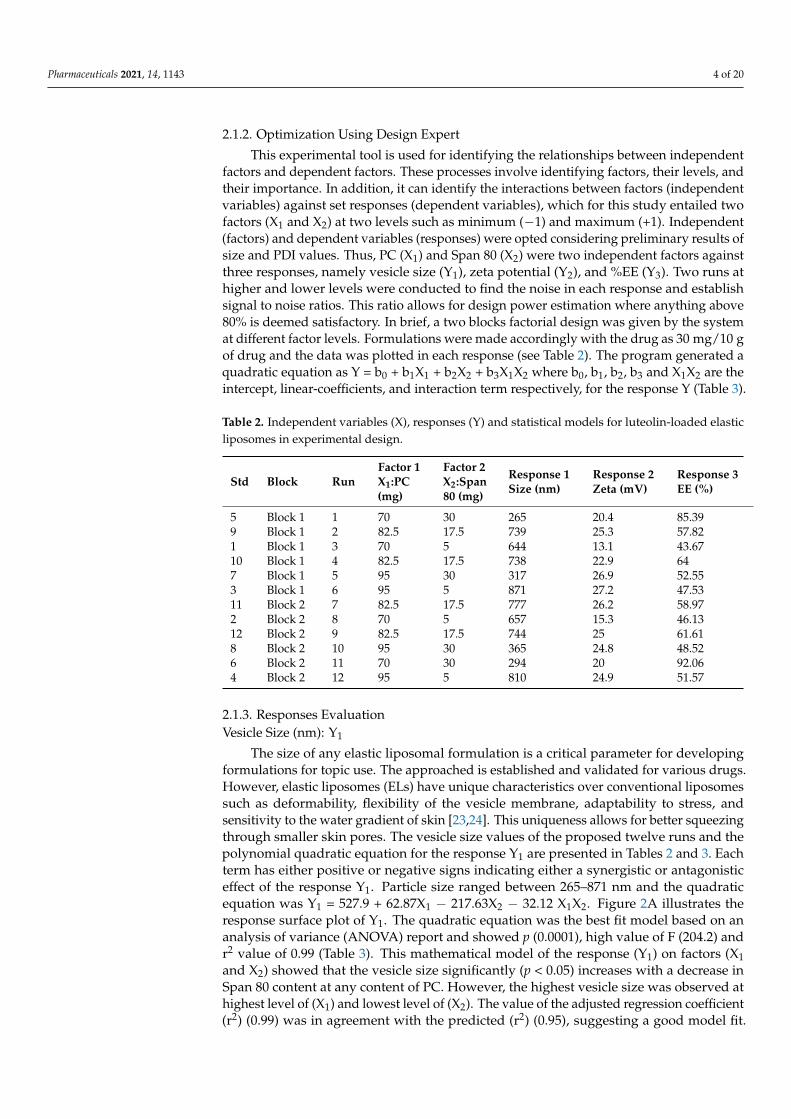
This experimental tool is used for identifying the relationships between independentfactors and dependent factors. These processes involve identifying factors, their levels, andtheir importance. In addition, it can identify the interactions between factors (independentvariables) against set responses (dependent variables), which for this study entailed twofactors (X1 and X2) at two levels such as minimum (−1) and maximum (+1). Independent(factors) and dependent variables (responses) were opted considering preliminary results ofsize and PDI values. Thus, PC (X1) and Span 80 (X2) were two independent factors againstthree responses, namely vesicle size (Y1), zeta potential (Y2), and %EE (Y3). Two runs athigher and lower levels were conducted to find the noise in each response and establishsignal to noise ratios. This ratio allows for design power estimation where anything above80% is deemed satisfactory. In brief, a two blocks factorial design was given by the systemat different factor levels. Formulations were made accordingly with the drug as 30 mg/10 gof drug and the data was plotted in each response (see Table 2). The program generated aquadratic equation as Y = b0 + b1X1 + b2X2 + b3X1X2 where b0, b1, b2, b3 and X1X2 are theintercept, linear-coefficients, and interaction term respectively, for the response Y (Table 3).
Table 2. Independent variables (X), responses (Y) and statistical models for luteolin-loaded elasticliposomes in experimental design.
Std Block RunFactor 1X1:PC(mg)
Factor 2X2:Span80 (mg)
Response 1Size (nm)
Response 2Zeta (mV)
Response 3EE (%)
5 Block 1 1 70 30 265 20.4 85.399 Block 1 2 82.5 17.5 739 25.3 57.821 Block 1 3 70 5 644 13.1 43.6710 Block 1 4 82.5 17.5 738 22.9 647 Block 1 5 95 30 317 26.9 52.553 Block 1 6 95 5 871 27.2 47.5311 Block 2 7 82.5 17.5 777 26.2 58.972 Block 2 8 70 5 657 15.3 46.1312 Block 2 9 82.5 17.5 744 25 61.618 Block 2 10 95 30 365 24.8 48.526 Block 2 11 70 30 294 20 92.064 Block 2 12 95 5 810 24.9 51.57
2.1.3. Responses EvaluationVesicle Size (nm): Y1
The size of any elastic liposomal formulation is a critical parameter for developingformulations for topic use. The approached is established and validated for various drugs.However, elastic liposomes (ELs) have unique characteristics over conventional liposomessuch as deformability, flexibility of the vesicle membrane, adaptability to stress, andsensitivity to the water gradient of skin [23,24]. This uniqueness allows for better squeezingthrough smaller skin pores. The vesicle size values of the proposed twelve runs and thepolynomial quadratic equation for the response Y1 are presented in Tables 2 and 3. Eachterm has either positive or negative signs indicating either a synergistic or antagonisticeffect of the response Y1. Particle size ranged between 265–871 nm and the quadraticequation was Y1 = 527.9 + 62.87X1 − 217.63X2 − 32.12 X1X2. Figure 2A illustrates theresponse surface plot of Y1. The quadratic equation was the best fit model based on ananalysis of variance (ANOVA) report and showed p (0.0001), high value of F (204.2) andr2 value of 0.99 (Table 3). This mathematical model of the response (Y1) on factors (X1and X2) showed that the vesicle size significantly (p < 0.05) increases with a decrease inSpan 80 content at any content of PC. However, the highest vesicle size was observed athighest level of (X1) and lowest level of (X2). The value of the adjusted regression coefficient(r2) (0.99) was in agreement with the predicted (r2) (0.95), suggesting a good model fit.

Pharmaceuticals 2021, 14, 1143 5 of 20
Therefore, Y1 can be optimized by increasing Span 80 content and lowering PC content(size at minimum ~265 nm).
Table 3. Factors and responses and statistical parameters for luteolin-loaded elastic liposomes inexperimental design.
Experimental Design and Summary Reports
Factors Range Goal
X1: PC (mg) 70–95 In rangeX2: Span 80 (mg) 5–30 In range
Responses
Y1 (nm) as size 265–871 MinimumY2 (mV) as zeta potential −13.1—-27.2 MaximumY3 (%) as % EE 43.7–92.1 Maximum
Regression equations with best fitted model
Y1 = 527.9 + 62.87X1 − 217.63X2 − 32.12 X1X2Y2 = 21.58 + 4.73X1 + 1.45X2 − 1.55 X1X2Y3 = 58.43 – 8.39X1 + 11.2X2 − 10.71 X1X2
Statistical parameters Y1 Y2 Y3
r2 0.99 0.93 0.98Adjusted r2 0.99 0.90 0.97Predicted r2 0.95 0.72 0.90Model f value 204.16 28.69 83.67p value 0.0001 0.0006 0.0001Model Quadratic Quadratic QuadraticSD 26.15 1.48 3.14Mean value 601.75 22.67 59.15% CV 4.35 6.54 5.32
Value of regression coefficient represented as r2, SD = Standard deviation, % CV = Coefficient of variation.
Zeta Potential (ZP): Y2
The electric potential difference in vesicle double layer and media is called Zeta poten-tial. Higher ZP values (nearly ± 30 mV) represent a good stability in colloidal system [25].The values of PC and Span 80 based on the design of experiment (12 runs) formulationsshowed in the range of −13 to −27 mV. The quadratic equation wasY2 = 21.58 + 4.73X1 + 1.45X2 − 1.55 X1X2. Figure 2B shows the response surface plotof Y2. The quadratic model was the best fit and supported with ANOVA report [p (0.0006),high F (28.7) and r2 values (0.93) (Table 3)]. This mathematical model of the response(Y2) on factors (X1 and X2) showed that zeta potential significantly (p < 0.05) increaseswith increase in PC and Span 80 contents. The value of adjusted regression coefficient (r2)(0.90) and predicted (r2) (0.72) suggesting enough power for model fit. Here, values ofzeta potential were found to be significantly higher with higher PC levels regardless ofSpan 80 content. However, the zeta potential decreased the most when both factors were atlower levels.
Pharmaceuticals 2021, 14, 1143 6 of 20Pharmaceuticals 2021, 14, x FOR PEER REVIEW 7 of 22
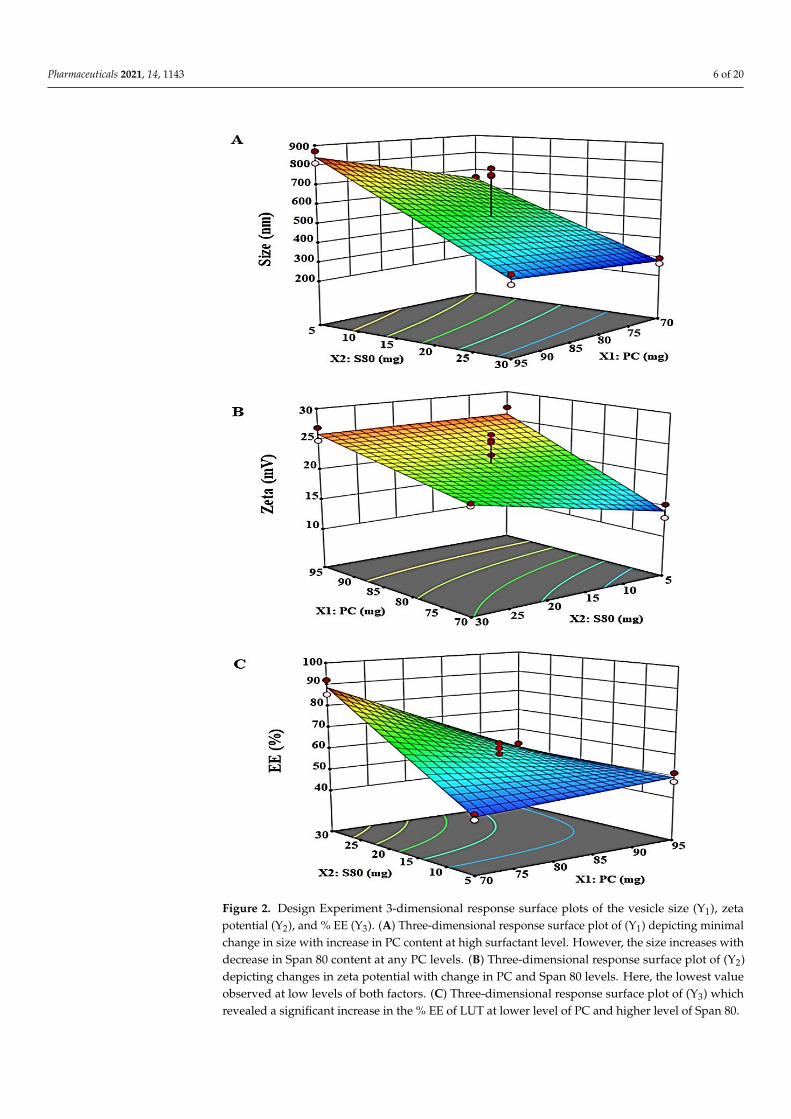
Figure 2. Design Experiment 3-dimensional response surface plots of the vesicle size (Y1), zeta po-
tential (Y2), and % EE (Y3). (A) Three-dimensional response surface plot of (Y1) depicting minimal
change in size with increase in PC content at high surfactant level. However, the size increases with
decrease in Span 80 content at any PC levels. (B) Three-dimensional response surface plot of (Y2)
depicting changes in zeta potential with change in PC and Span 80 levels. Here, the lowest value
observed at low levels of both factors. (C) Three-dimensional response surface plot of (Y3) which
revealed a significant increase in the % EE of LUT at lower level of PC and higher level of Span 80.
Figure 2. Design Experiment 3-dimensional response surface plots of the vesicle size (Y1), zetapotential (Y2), and % EE (Y3). (A) Three-dimensional response surface plot of (Y1) depicting minimalchange in size with increase in PC content at high surfactant level. However, the size increases withdecrease in Span 80 content at any PC levels. (B) Three-dimensional response surface plot of (Y2)depicting changes in zeta potential with change in PC and Span 80 levels. Here, the lowest valueobserved at low levels of both factors. (C) Three-dimensional response surface plot of (Y3) whichrevealed a significant increase in the % EE of LUT at lower level of PC and higher level of Span 80.
Pharmaceuticals 2021, 14, 1143 7 of 20
Percentage Entrapment Efficiency: Y3
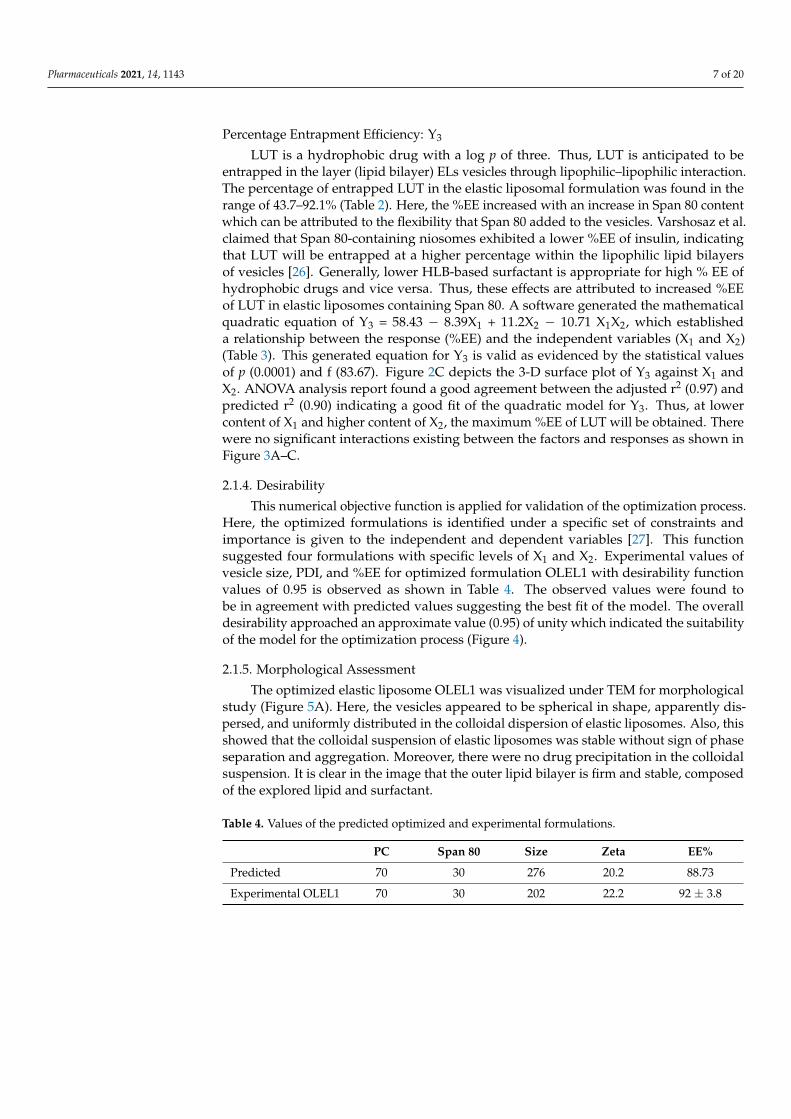
LUT is a hydrophobic drug with a log p of three. Thus, LUT is anticipated to beentrapped in the layer (lipid bilayer) ELs vesicles through lipophilic–lipophilic interaction.The percentage of entrapped LUT in the elastic liposomal formulation was found in therange of 43.7–92.1% (Table 2). Here, the %EE increased with an increase in Span 80 contentwhich can be attributed to the flexibility that Span 80 added to the vesicles. Varshosaz et al.claimed that Span 80-containing niosomes exhibited a lower %EE of insulin, indicatingthat LUT will be entrapped at a higher percentage within the lipophilic lipid bilayersof vesicles [26]. Generally, lower HLB-based surfactant is appropriate for high % EE ofhydrophobic drugs and vice versa. Thus, these effects are attributed to increased %EEof LUT in elastic liposomes containing Span 80. A software generated the mathematicalquadratic equation of Y3 = 58.43 − 8.39X1 + 11.2X2 − 10.71 X1X2, which establisheda relationship between the response (%EE) and the independent variables (X1 and X2)(Table 3). This generated equation for Y3 is valid as evidenced by the statistical valuesof p (0.0001) and f (83.67). Figure 2C depicts the 3-D surface plot of Y3 against X1 andX2. ANOVA analysis report found a good agreement between the adjusted r2 (0.97) andpredicted r2 (0.90) indicating a good fit of the quadratic model for Y3. Thus, at lowercontent of X1 and higher content of X2, the maximum %EE of LUT will be obtained. Therewere no significant interactions existing between the factors and responses as shown inFigure 3A–C.
2.1.4. Desirability
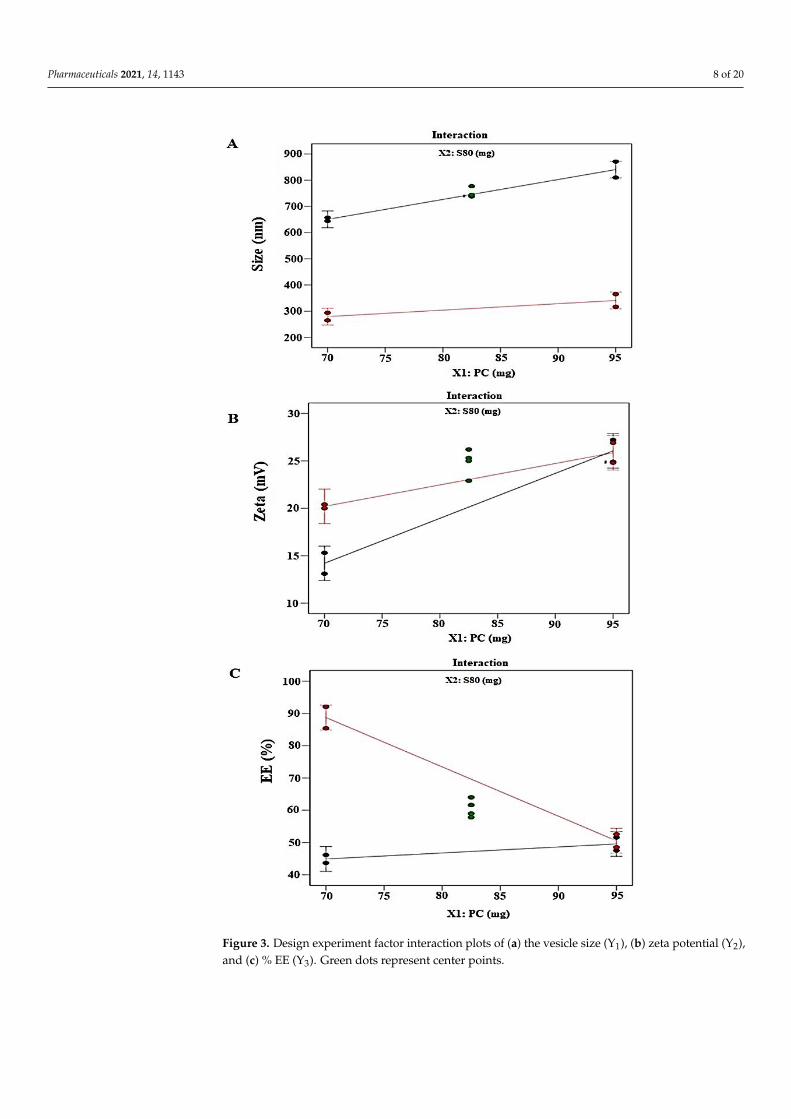
This numerical objective function is applied for validation of the optimization process.Here, the optimized formulations is identified under a specific set of constraints andimportance is given to the independent and dependent variables [27]. This functionsuggested four formulations with specific levels of X1 and X2. Experimental values ofvesicle size, PDI, and %EE for optimized formulation OLEL1 with desirability functionvalues of 0.95 is observed as shown in Table 4. The observed values were found tobe in agreement with predicted values suggesting the best fit of the model. The overalldesirability approached an approximate value (0.95) of unity which indicated the suitabilityof the model for the optimization process (Figure 4).
2.1.5. Morphological Assessment
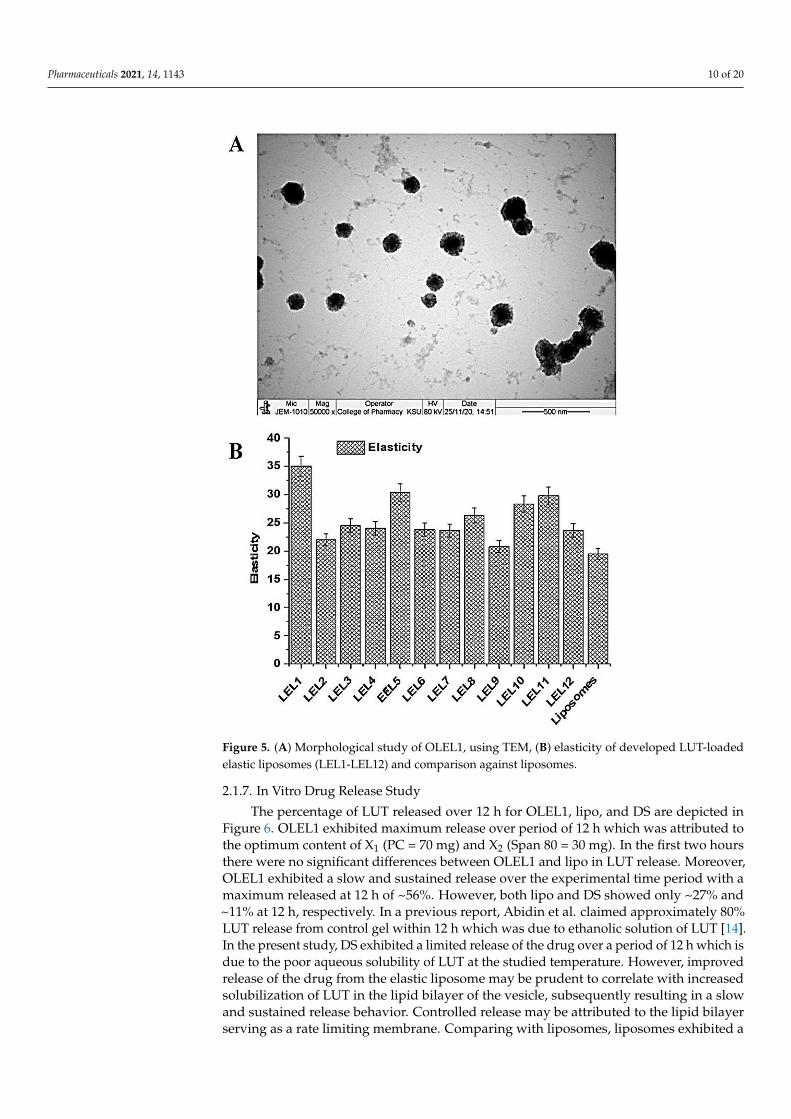
The optimized elastic liposome OLEL1 was visualized under TEM for morphologicalstudy (Figure 5A). Here, the vesicles appeared to be spherical in shape, apparently dis-persed, and uniformly distributed in the colloidal dispersion of elastic liposomes. Also, thisshowed that the colloidal suspension of elastic liposomes was stable without sign of phaseseparation and aggregation. Moreover, there were no drug precipitation in the colloidalsuspension. It is clear in the image that the outer lipid bilayer is firm and stable, composedof the explored lipid and surfactant.
Table 4. Values of the predicted optimized and experimental formulations.
PC Span 80 Size Zeta EE%
Predicted 70 30 276 20.2 88.73
Experimental OLEL1 70 30 202 22.2 92 ± 3.8
Pharmaceuticals 2021, 14, 1143 8 of 20Pharmaceuticals 2021, 14, x FOR PEER REVIEW 9 of 22
Figure 3. Design experiment factor interaction plots of (a) the vesicle size (Y1), (b) zeta potential (Y2),
and (c) % EE (Y3). Green dots represent center points.
Figure 3. Design experiment factor interaction plots of (a) the vesicle size (Y1), (b) zeta potential (Y2),and (c) % EE (Y3). Green dots represent center points.
Pharmaceuticals 2021, 14, 1143 9 of 20
Pharmaceuticals 2021, 14, x FOR PEER REVIEW 10 of 22
2.1.4. Desirability
This numerical objective function is applied for validation of the optimization pro-
cess. Here, the optimized formulations is identified under a specific set of constraints and
importance is given to the independent and dependent variables [27]. This function sug-
gested four formulations with specific levels of X1 and X2. Experimental values of vesicle
size, PDI, and %EE for optimized formulation OLEL1 with desirability function values of
0.95 is observed as shown in Table 4. The observed values were found to be in agreement
with predicted values suggesting the best fit of the model. The overall desirability ap-
proached an approximate value (0.95) of unity which indicated the suitability of the model
for the optimization process (Figure 4).
Table 4. Values of the predicted optimized and experimental formulations.
PC Span 80 Size Zeta EE%
Predicted 70 30 276 20.2 88.73
Experimental OLEL1 70 30 202 22.2 92 ± 3.8
Figure 4. The desirability function of the optimized proposed formulations (OLEL1).
2.1.5. Morphological Assessment
The optimized elastic liposome OLEL1 was visualized under TEM for morphological
study (Figure 5A). Here, the vesicles appeared to be spherical in shape, apparently dis-
persed, and uniformly distributed in the colloidal dispersion of elastic liposomes. Also,
this showed that the colloidal suspension of elastic liposomes was stable without sign of
Figure 4. The desirability function of the optimized proposed formulations (OLEL1).
2.1.6. Elasticity
The proposed vesicular carrier system is devoid of cholesterol and expected to bearmaximized ultra-deformability under stress conditions. Therefore, it is expected to haverelatively high flexibility due to the combined effect of plasticizer (7% ethanol), and Span80 (serving as edge activator). Cholesterol provides a stern and firm strength to the lipidbilayer of liposomes due to which it is considered as relatively more rigid compared withelastic liposomes [28]. The result of elasticity of all elastic liposomes and liposomes isportrayed in Figure 5B. Total twelve elastic liposomes loaded with LUT were prepared(LEL1–LEL12) as per suggested block (Table 2). All of the elastic liposome formulationsexhibited significantly (p < 0.05) higher elasticity (in the range of 20.6 ± 1.0–35.5 ± 1.3)as compared with liposomes (E = 18.3 ± 0.7) (Figure 5B). There was a remarkable impactof Span 80 concentration relative to PC for elasticity. LEL1, LEL5, LEL10, and LEL11exhibited higher elasticity among them which may be attributed to high content of Span80 (30 mg) as compared with others. Likewise, LEL3, LEL6, LEL8, and LEL12 revealedrelatively low elasticity as evidenced by a low content of Span 80 (5 mg). FormulationsLEL2, LEL4, LEL7, and LEL9 exhibited elasticity in the range of 20–23.7. This may beattributed to cholesterol free vesicular lipid bilayer and ethanol mediated fluidity impartedto the layer. There are several factors controlling the elasticity of lipid vesicles such ascomposition, hydrocarbon chain of lipid, types of edge activator, polarity of head group oflipid and surfactant, glass transition temperature of lipid, and glycerol bridge as link of acylhydrocarbon [29]. Moreover, molecular weight, degree of unsaturation in hydrocarbon,cholesterol content, transition temperature, and the nature of surfactant all have a collectiveinfluence in modulating the fluidity and flexibility of the lipid bilayer of the vesicle’s systemfor enhanced permeation across the microscopic pores of human skin [28].
Pharmaceuticals 2021, 14, 1143 10 of 20
Pharmaceuticals 2021, 14, x FOR PEER REVIEW 11 of 22
phase separation and aggregation. Moreover, there were no drug precipitation in the col-
loidal suspension. It is clear in the image that the outer lipid bilayer is firm and stable,
composed of the explored lipid and surfactant.
Figure 5. (A) Morphological study of OLEL1, using TEM, (B) elasticity of developed LUT-loaded
elastic liposomes (LEL1-LEL12) and comparison against liposomes.
2.1.6. Elasticity
The proposed vesicular carrier system is devoid of cholesterol and expected to bear
maximized ultra-deformability under stress conditions. Therefore, it is expected to have
relatively high flexibility due to the combined effect of plasticizer (7% ethanol), and Span
80 (serving as edge activator). Cholesterol provides a stern and firm strength to the lipid
bilayer of liposomes due to which it is considered as relatively more rigid compared with
elastic liposomes [28]. The result of elasticity of all elastic liposomes and liposomes is por-
trayed in Figure 5B. Total twelve elastic liposomes loaded with LUT were prepared
(LEL1–LEL12) as per suggested block (Table 2). All of the elastic liposome formulations
exhibited significantly (p < 0.05) higher elasticity (in the range of 20.6 ± 1.0–35.5 ± 1.3) as
compared with liposomes (E = 18.3 ± 0.7) (Figure 5B). There was a remarkable impact of
Figure 5. (A) Morphological study of OLEL1, using TEM, (B) elasticity of developed LUT-loadedelastic liposomes (LEL1-LEL12) and comparison against liposomes.
2.1.7. In Vitro Drug Release Study
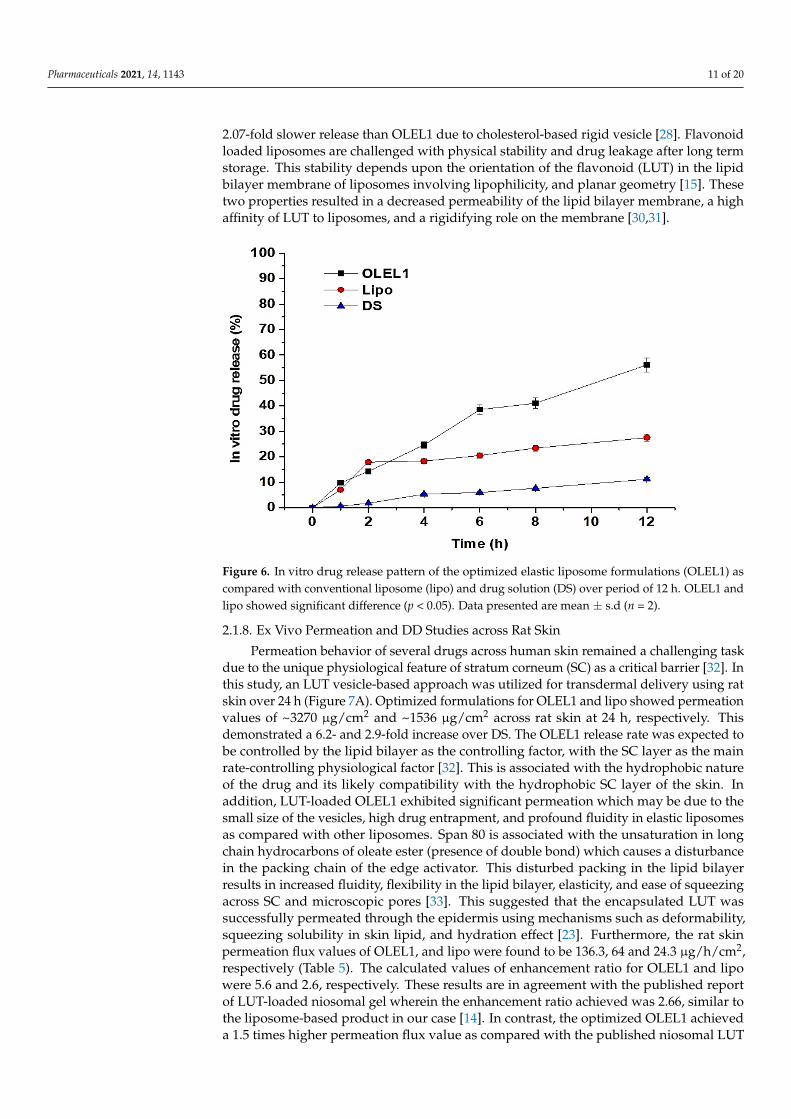
The percentage of LUT released over 12 h for OLEL1, lipo, and DS are depicted inFigure 6. OLEL1 exhibited maximum release over period of 12 h which was attributed tothe optimum content of X1 (PC = 70 mg) and X2 (Span 80 = 30 mg). In the first two hoursthere were no significant differences between OLEL1 and lipo in LUT release. Moreover,OLEL1 exhibited a slow and sustained release over the experimental time period with amaximum released at 12 h of ~56%. However, both lipo and DS showed only ~27% and~11% at 12 h, respectively. In a previous report, Abidin et al. claimed approximately 80%LUT release from control gel within 12 h which was due to ethanolic solution of LUT [14].In the present study, DS exhibited a limited release of the drug over a period of 12 h which isdue to the poor aqueous solubility of LUT at the studied temperature. However, improvedrelease of the drug from the elastic liposome may be prudent to correlate with increasedsolubilization of LUT in the lipid bilayer of the vesicle, subsequently resulting in a slowand sustained release behavior. Controlled release may be attributed to the lipid bilayerserving as a rate limiting membrane. Comparing with liposomes, liposomes exhibited a
Pharmaceuticals 2021, 14, 1143 11 of 20
2.07-fold slower release than OLEL1 due to cholesterol-based rigid vesicle [28]. Flavonoidloaded liposomes are challenged with physical stability and drug leakage after long termstorage. This stability depends upon the orientation of the flavonoid (LUT) in the lipidbilayer membrane of liposomes involving lipophilicity, and planar geometry [15]. Thesetwo properties resulted in a decreased permeability of the lipid bilayer membrane, a highaffinity of LUT to liposomes, and a rigidifying role on the membrane [30,31].
Pharmaceuticals 2021, 14, x FOR PEER REVIEW 12 of 22
Span 80 concentration relative to PC for elasticity. LEL1, LEL5, LEL10, and LEL11 exhib-
ited higher elasticity among them which may be attributed to high content of Span 80 (30
mg) as compared with others. Likewise, LEL3, LEL6, LEL8, and LEL12 revealed relatively
low elasticity as evidenced by a low content of Span 80 (5 mg). Formulations LEL2, LEL4,
LEL7, and LEL9 exhibited elasticity in the range of 20–23.7. This may be attributed to cho-
lesterol free vesicular lipid bilayer and ethanol mediated fluidity imparted to the layer.
There are several factors controlling the elasticity of lipid vesicles such as composition,
hydrocarbon chain of lipid, types of edge activator, polarity of head group of lipid and
surfactant, glass transition temperature of lipid, and glycerol bridge as link of acyl hydro-
carbon [29]. Moreover, molecular weight, degree of unsaturation in hydrocarbon, choles-
terol content, transition temperature, and the nature of surfactant all have a collective in-
fluence in modulating the fluidity and flexibility of the lipid bilayer of the vesicle’s system
for enhanced permeation across the microscopic pores of human skin [28].
2.1.7. In Vitro Drug Release Study
The percentage of LUT released over 12 h for OLEL1, lipo, and DS are depicted in
Figure 6. OLEL1 exhibited maximum release over period of 12 h which was attributed to
the optimum content of X1 (PC = 70 mg) and X2 (Span 80 = 30 mg). In the first two hours
there were no significant differences between OLEL1 and lipo in LUT release. Moreover,
OLEL1 exhibited a slow and sustained release over the experimental time period with a
maximum released at 12 h of ~56%. However, both lipo and DS showed only ~27% and
~11% at 12 h, respectively. In a previous report, Abidin et al. claimed approximately 80%
LUT release from control gel within 12 h which was due to ethanolic solution of LUT [14].
In the present study, DS exhibited a limited release of the drug over a period of 12 h which
is due to the poor aqueous solubility of LUT at the studied temperature. However, im-
proved release of the drug from the elastic liposome may be prudent to correlate with
increased solubilization of LUT in the lipid bilayer of the vesicle, subsequently resulting
in a slow and sustained release behavior. Controlled release may be attributed to the lipid
bilayer serving as a rate limiting membrane. Comparing with liposomes, liposomes ex-
hibited a 2.07-fold slower release than OLEL1 due to cholesterol-based rigid vesicle [28].
Flavonoid loaded liposomes are challenged with physical stability and drug leakage after
long term storage. This stability depends upon the orientation of the flavonoid (LUT) in
the lipid bilayer membrane of liposomes involving lipophilicity, and planar geometry
[15]. These two properties resulted in a decreased permeability of the lipid bilayer mem-
brane, a high affinity of LUT to liposomes, and a rigidifying role on the membrane [30,31].
Figure 6. In vitro drug release pattern of the optimized elastic liposome formulations (OLEL1) ascompared with conventional liposome (lipo) and drug solution (DS) over period of 12 h. OLEL1 andlipo showed significant difference (p < 0.05). Data presented are mean ± s.d (n = 2).
2.1.8. Ex Vivo Permeation and DD Studies across Rat Skin
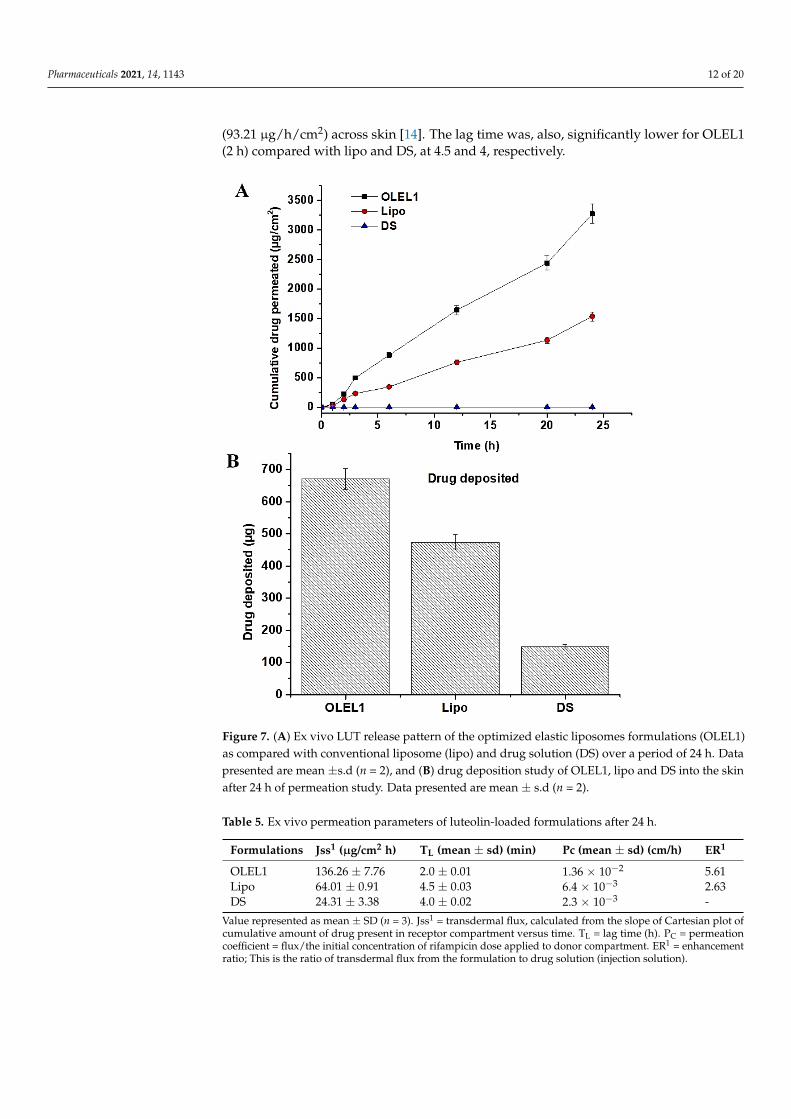
Permeation behavior of several drugs across human skin remained a challenging taskdue to the unique physiological feature of stratum corneum (SC) as a critical barrier [32]. Inthis study, an LUT vesicle-based approach was utilized for transdermal delivery using ratskin over 24 h (Figure 7A). Optimized formulations for OLEL1 and lipo showed permeationvalues of ~3270 µg/cm2 and ~1536 µg/cm2 across rat skin at 24 h, respectively. Thisdemonstrated a 6.2- and 2.9-fold increase over DS. The OLEL1 release rate was expected tobe controlled by the lipid bilayer as the controlling factor, with the SC layer as the mainrate-controlling physiological factor [32]. This is associated with the hydrophobic natureof the drug and its likely compatibility with the hydrophobic SC layer of the skin. Inaddition, LUT-loaded OLEL1 exhibited significant permeation which may be due to thesmall size of the vesicles, high drug entrapment, and profound fluidity in elastic liposomesas compared with other liposomes. Span 80 is associated with the unsaturation in longchain hydrocarbons of oleate ester (presence of double bond) which causes a disturbancein the packing chain of the edge activator. This disturbed packing in the lipid bilayerresults in increased fluidity, flexibility in the lipid bilayer, elasticity, and ease of squeezingacross SC and microscopic pores [33]. This suggested that the encapsulated LUT wassuccessfully permeated through the epidermis using mechanisms such as deformability,squeezing solubility in skin lipid, and hydration effect [23]. Furthermore, the rat skinpermeation flux values of OLEL1, and lipo were found to be 136.3, 64 and 24.3 µg/h/cm2,respectively (Table 5). The calculated values of enhancement ratio for OLEL1 and lipowere 5.6 and 2.6, respectively. These results are in agreement with the published reportof LUT-loaded niosomal gel wherein the enhancement ratio achieved was 2.66, similar tothe liposome-based product in our case [14]. In contrast, the optimized OLEL1 achieveda 1.5 times higher permeation flux value as compared with the published niosomal LUT
Pharmaceuticals 2021, 14, 1143 12 of 20
(93.21 µg/h/cm2) across skin [14]. The lag time was, also, significantly lower for OLEL1(2 h) compared with lipo and DS, at 4.5 and 4, respectively.
Pharmaceuticals 2021, 14, x FOR PEER REVIEW 14 of 22
In our recent publication, we reported cation nanoemulsion for transdermal delivery
of LUT using bergamot oil (as organic phase), cremophor-EL (surfactant), labrasol (as sur-
factant) and oleylamine as positive charge inducer [34]. On comparing cationic nanoemul-
sion (CNE4) with anionic nanoemulsion, the imposed cationic charge enhanced the trans-
dermal permeation profile across rat skin. It is interesting that the elastic liposome-based
formulation achieved the same permeation flux (136.3 µg/cm2 h) without this charge im-
posed on the vesicle surface or cationic lipid. However, the optimized elastic liposome
“OLEL1” was found to have a higher drug deposition value (22.33%/cm2) as compared
with the previously reported cationic CNE-4 (10.98%/cm2) [34]. Thus, the augmented flux
and drug deposition of LUT may be attributed to the ultra-deformability and flexibility of
elastic liposomes (free from cholesterol content) as compared with cholesterol based lipo-
somes. In addition, it may be prudent to correlate the high drug deposition of OLEL1′s
vesicular nature and high drug entrapment as compared with cationic nanoemulsion.
Figure 7. (A) Ex vivo LUT release pattern of the optimized elastic liposomes formulations (OLEL1)
as compared with conventional liposome (lipo) and drug solution (DS) over a period of 24 h. Data
presented are mean ±s.d (n = 2), and (B) drug deposition study of OLEL1, lipo and DS into the skin
after 24 h of permeation study. Data presented are mean ± s.d (n = 2).
2.1.9. Cytotoxicity Study
Data reveal that both LUT standard and LUT formulation exhibit concentration de-
pendent effects on the cell viability of MCF7. Cell viability (%) for different LUT standard
Figure 7. (A) Ex vivo LUT release pattern of the optimized elastic liposomes formulations (OLEL1)as compared with conventional liposome (lipo) and drug solution (DS) over a period of 24 h. Datapresented are mean ±s.d (n = 2), and (B) drug deposition study of OLEL1, lipo and DS into the skinafter 24 h of permeation study. Data presented are mean ± s.d (n = 2).
Table 5. Ex vivo permeation parameters of luteolin-loaded formulations after 24 h.
Formulations Jss1 (µg/cm2 h) TL (mean ± sd) (min) Pc (mean ± sd) (cm/h) ER1
OLEL1 136.26 ± 7.76 2.0 ± 0.01 1.36 × 10⁻² 5.61Lipo 64.01 ± 0.91 4.5 ± 0.03 6.4 × 10⁻³ 2.63DS 24.31 ± 3.38 4.0 ± 0.02 2.3 × 10⁻³ -
Value represented as mean ± SD (n = 3). Jss1 = transdermal flux, calculated from the slope of Cartesian plot ofcumulative amount of drug present in receptor compartment versus time. TL = lag time (h). PC = permeationcoefficient = flux/the initial concentration of rifampicin dose applied to donor compartment. ER1 = enhancementratio; This is the ratio of transdermal flux from the formulation to drug solution (injection solution).
Pharmaceuticals 2021, 14, 1143 13 of 20
Results of the drug deposition study are presented in Figure 7B. OLEL1, lipo andDS formulation deposited LUT as 670 µg (22.33%/cm2), 473 µg (15.76%/cm2) and 148 µg(4.9%/cm2), respectively. It is apparent that for maximum LUT deposition higher per-meation flux is needed as found in OLEL1. Moreover, OLEL1 and lipo showed 4.5- and3.2-fold increases in drug deposition as compared with DS. In general, the more the valueof drug deposition, the more permeation flux is expected due to drug deposit formationin the dermal layer. Thus, the elastic, deformability, flexibility, and fluidity behaviors ofthe vesicle membrane, and permeation improvement through surfactant and plasticizer ofelastic liposomes, supported drug deposition and subsequent permeation flux of LUT [34].
In our recent publication, we reported cation nanoemulsion for transdermal deliv-ery of LUT using bergamot oil (as organic phase), cremophor-EL (surfactant), labrasol(as surfactant) and oleylamine as positive charge inducer [34]. On comparing cationicnanoemulsion (CNE4) with anionic nanoemulsion, the imposed cationic charge enhancedthe transdermal permeation profile across rat skin. It is interesting that the elastic liposome-based formulation achieved the same permeation flux (136.3 µg/cm2 h) without this chargeimposed on the vesicle surface or cationic lipid. However, the optimized elastic liposome“OLEL1” was found to have a higher drug deposition value (22.33%/cm2) as comparedwith the previously reported cationic CNE-4 (10.98%/cm2) [34]. Thus, the augmented fluxand drug deposition of LUT may be attributed to the ultra-deformability and flexibilityof elastic liposomes (free from cholesterol content) as compared with cholesterol basedliposomes. In addition, it may be prudent to correlate the high drug deposition of OLEL1′svesicular nature and high drug entrapment as compared with cationic nanoemulsion.
2.1.9. Cytotoxicity Study
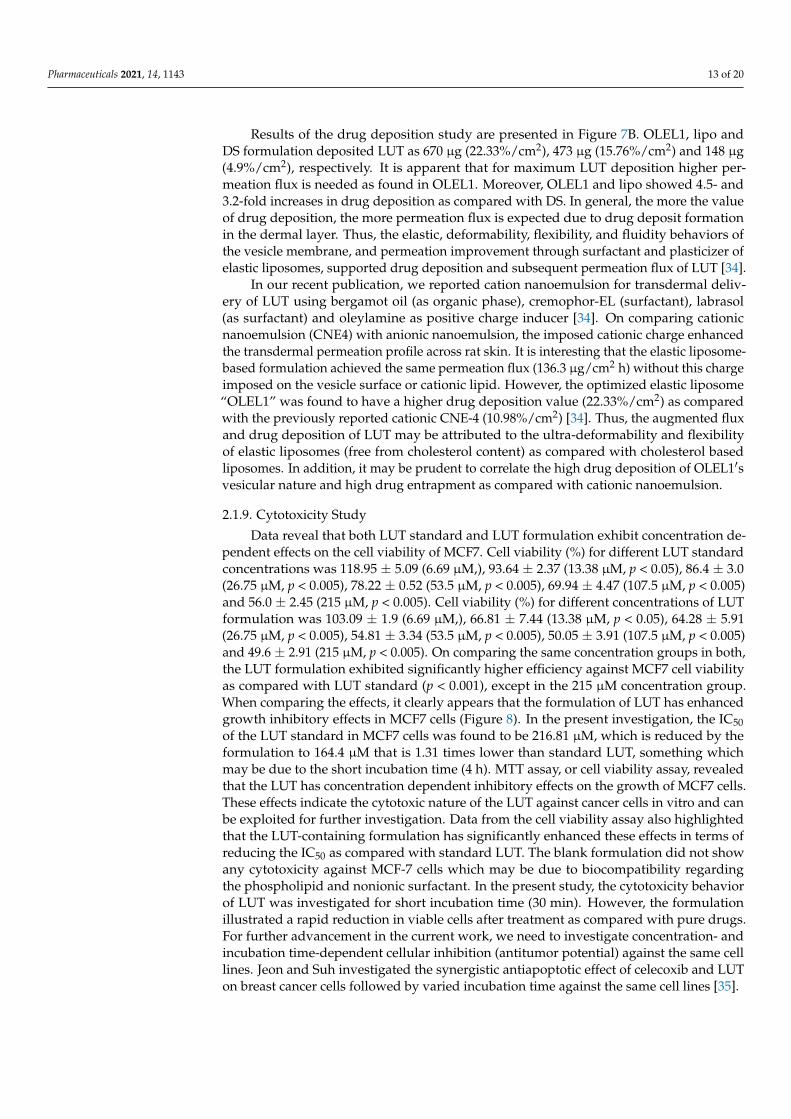
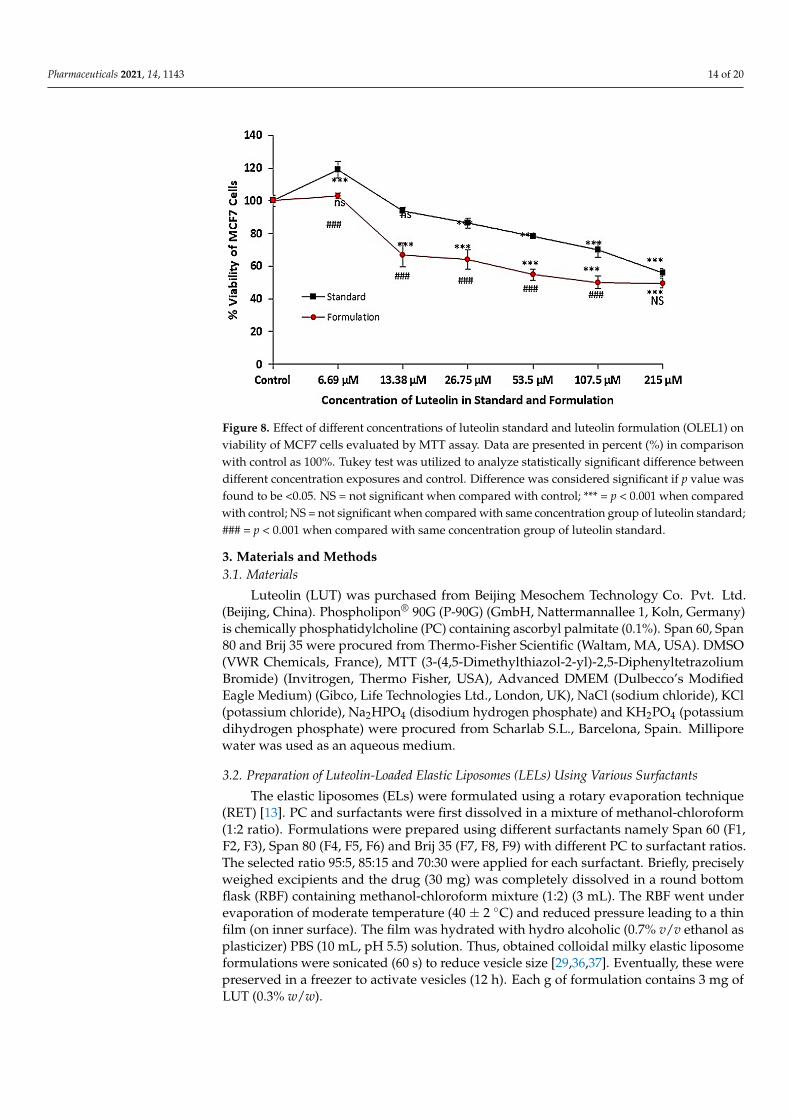
Data reveal that both LUT standard and LUT formulation exhibit concentration de-pendent effects on the cell viability of MCF7. Cell viability (%) for different LUT standardconcentrations was 118.95 ± 5.09 (6.69 µM,), 93.64 ± 2.37 (13.38 µM, p < 0.05), 86.4 ± 3.0(26.75 µM, p < 0.005), 78.22 ± 0.52 (53.5 µM, p < 0.005), 69.94 ± 4.47 (107.5 µM, p < 0.005)and 56.0 ± 2.45 (215 µM, p < 0.005). Cell viability (%) for different concentrations of LUTformulation was 103.09 ± 1.9 (6.69 µM,), 66.81 ± 7.44 (13.38 µM, p < 0.05), 64.28 ± 5.91(26.75 µM, p < 0.005), 54.81 ± 3.34 (53.5 µM, p < 0.005), 50.05 ± 3.91 (107.5 µM, p < 0.005)and 49.6 ± 2.91 (215 µM, p < 0.005). On comparing the same concentration groups in both,the LUT formulation exhibited significantly higher efficiency against MCF7 cell viabilityas compared with LUT standard (p < 0.001), except in the 215 µM concentration group.When comparing the effects, it clearly appears that the formulation of LUT has enhancedgrowth inhibitory effects in MCF7 cells (Figure 8). In the present investigation, the IC50of the LUT standard in MCF7 cells was found to be 216.81 µM, which is reduced by theformulation to 164.4 µM that is 1.31 times lower than standard LUT, something whichmay be due to the short incubation time (4 h). MTT assay, or cell viability assay, revealedthat the LUT has concentration dependent inhibitory effects on the growth of MCF7 cells.These effects indicate the cytotoxic nature of the LUT against cancer cells in vitro and canbe exploited for further investigation. Data from the cell viability assay also highlightedthat the LUT-containing formulation has significantly enhanced these effects in terms ofreducing the IC50 as compared with standard LUT. The blank formulation did not showany cytotoxicity against MCF-7 cells which may be due to biocompatibility regardingthe phospholipid and nonionic surfactant. In the present study, the cytotoxicity behaviorof LUT was investigated for short incubation time (30 min). However, the formulationillustrated a rapid reduction in viable cells after treatment as compared with pure drugs.For further advancement in the current work, we need to investigate concentration- andincubation time-dependent cellular inhibition (antitumor potential) against the same celllines. Jeon and Suh investigated the synergistic antiapoptotic effect of celecoxib and LUTon breast cancer cells followed by varied incubation time against the same cell lines [35].
Pharmaceuticals 2021, 14, 1143 14 of 20
Pharmaceuticals 2021, 14, x FOR PEER REVIEW 15 of 22
concentrations was 118.95 ± 5.09 (6.69 µM,), 93.64 ± 2.37 (13.38 µM, p < 0.05), 86.4 ± 3.0
(26.75 µM, p < 0.005), 78.22 ± 0.52 (53.5 µM, p < 0.005), 69.94 ± 4.47 (107.5 µM, p < 0.005)
and 56.0 ± 2.45 (215 µM, p < 0.005). Cell viability (%) for different concentrations of LUT
formulation was 103.09 ± 1.9 (6.69 µM,), 66.81 ± 7.44 (13.38 µM, p < 0.05), 64.28 ± 5.91 (26.75
µM, p < 0.005), 54.81 ± 3.34 (53.5 µM, p < 0.005), 50.05 ± 3.91 (107.5 µM, p < 0.005) and 49.6
± 2.91 (215 µM, p < 0.005). On comparing the same concentration groups in both, the LUT
formulation exhibited significantly higher efficiency against MCF7 cell viability as com-
pared with LUT standard (p < 0.001), except in the 215 µM concentration group. When
comparing the effects, it clearly appears that the formulation of LUT has enhanced growth
inhibitory effects in MCF7 cells (Figure 8). In the present investigation, the IC50 of the LUT
standard in MCF7 cells was found to be 216.81 µM, which is reduced by the formulation
to 164.4 µM that is 1.31 times lower than standard LUT, something which may be due to
the short incubation time (4 h). MTT assay, or cell viability assay, revealed that the LUT
has concentration dependent inhibitory effects on the growth of MCF7 cells. These effects
indicate the cytotoxic nature of the LUT against cancer cells in vitro and can be exploited
for further investigation. Data from the cell viability assay also highlighted that the LUT-
containing formulation has significantly enhanced these effects in terms of reducing the
IC50 as compared with standard LUT. The blank formulation did not show any cytotoxi-
city against MCF-7 cells which may be due to biocompatibility regarding the phospho-
lipid and nonionic surfactant. In the present study, the cytotoxicity behavior of LUT was
investigated for short incubation time (30 min). However, the formulation illustrated a
rapid reduction in viable cells after treatment as compared with pure drugs. For further
advancement in the current work, we need to investigate concentration- and incubation
time-dependent cellular inhibition (antitumor potential) against the same cell lines. Jeon
and Suh investigated the synergistic antiapoptotic effect of celecoxib and LUT on breast
cancer cells followed by varied incubation time against the same cell lines [35].
Figure 8. Effect of different concentrations of luteolin standard and luteolin formulation (OLEL1)
on viability of MCF7 cells evaluated by MTT assay. Data are presented in percent (%) in comparison
with control as 100%. Tukey test was utilized to analyze statistically significant difference between
different concentration exposures and control. Difference was considered significant if p value was
found to be <0.05. NS = not significant when compared with control; *** = p < 0.001 when compared
with control; NS = not significant when compared with same concentration group of luteolin stand-
ard; ### = p < 0.001 when compared with same concentration group of luteolin standard.
Figure 8. Effect of different concentrations of luteolin standard and luteolin formulation (OLEL1) onviability of MCF7 cells evaluated by MTT assay. Data are presented in percent (%) in comparisonwith control as 100%. Tukey test was utilized to analyze statistically significant difference betweendifferent concentration exposures and control. Difference was considered significant if p value wasfound to be <0.05. NS = not significant when compared with control; *** = p < 0.001 when comparedwith control; NS = not significant when compared with same concentration group of luteolin standard;### = p < 0.001 when compared with same concentration group of luteolin standard.
3. Materials and Methods3.1. Materials
Luteolin (LUT) was purchased from Beijing Mesochem Technology Co. Pvt. Ltd.(Beijing, China). Phospholipon® 90G (P-90G) (GmbH, Nattermannallee 1, Koln, Germany)is chemically phosphatidylcholine (PC) containing ascorbyl palmitate (0.1%). Span 60, Span80 and Brij 35 were procured from Thermo-Fisher Scientific (Waltam, MA, USA). DMSO(VWR Chemicals, France), MTT (3-(4,5-Dimethylthiazol-2-yl)-2,5-DiphenyltetrazoliumBromide) (Invitrogen, Thermo Fisher, USA), Advanced DMEM (Dulbecco’s ModifiedEagle Medium) (Gibco, Life Technologies Ltd., London, UK), NaCl (sodium chloride), KCl(potassium chloride), Na2HPO4 (disodium hydrogen phosphate) and KH2PO4 (potassiumdihydrogen phosphate) were procured from Scharlab S.L., Barcelona, Spain. Milliporewater was used as an aqueous medium.
3.2. Preparation of Luteolin-Loaded Elastic Liposomes (LELs) Using Various Surfactants
The elastic liposomes (ELs) were formulated using a rotary evaporation technique(RET) [13]. PC and surfactants were first dissolved in a mixture of methanol-chloroform(1:2 ratio). Formulations were prepared using different surfactants namely Span 60 (F1,F2, F3), Span 80 (F4, F5, F6) and Brij 35 (F7, F8, F9) with different PC to surfactant ratios.The selected ratio 95:5, 85:15 and 70:30 were applied for each surfactant. Briefly, preciselyweighed excipients and the drug (30 mg) was completely dissolved in a round bottomflask (RBF) containing methanol-chloroform mixture (1:2) (3 mL). The RBF went underevaporation of moderate temperature (40 ± 2 ◦C) and reduced pressure leading to a thinfilm (on inner surface). The film was hydrated with hydro alcoholic (0.7% v/v ethanol asplasticizer) PBS (10 mL, pH 5.5) solution. Thus, obtained colloidal milky elastic liposomeformulations were sonicated (60 s) to reduce vesicle size [29,36,37]. Eventually, these werepreserved in a freezer to activate vesicles (12 h). Each g of formulation contains 3 mg ofLUT (0.3% w/w).

Pharmaceuticals 2021, 14, 1143 15 of 20
3.3. Vesicle Size and Size Distribution (Polydispersity Index, PDI)
Each formulation was individually assessed for size and PDI using a Zetasizer NanoZS (Malvern Instruments, Worcestershire, UK) equipped with 4.0 mW He Ne red laser(633 nm) [37]. The samples were previously diluted (100 times) using water (milli-Q) toavoid instrument al error during analysis. The experiment was performed at 25 ± 1 ◦Cand scattering angle of 90◦.
3.4. Experimental Design Tool (Design Expert®)
Finding the optimum content of excipients in a formulation is called optimization.Therefore, Design-Expert 13.0.5 software was used to design the experiment (Table 2). Twoblocks factorial design with four center points (12 runs) was employed to explore the designspace for the selected factors and responses. This would later allow the software to predictthe optimized formulation(s). This “Design Expert software” follows a random order fordesired combination(s) to maximize the chance of identifying variation between runs. Inthis study, PC (X1) and Span 80 (X2) were selected as independent factors (variables) againstfour dependent variables. These responses were vesicle size (Y1), Zeta potential (Y2), and%EE (Y3). Both dependent and independent variables values are shown in Table 2. Smallersize liposomal formulations have a better chance to pass through the microscopic pores ofthe skin due to high elasticity. However, an optimum concentration of excipient is optedfor safety concern and maximized delivery of LUT (0.05% w/w). Hence, two levels of PCwere selected as 70 mg (low) and 95 mg (high) whereas Span 80 was set at 5 mg (low) and30 mg (high).
In addition, the regression equation showing the best fit using the selected mathe-matical models was used and validated by equating various statistical parameters suchas p value, regular, adjusted and predicted correlation coefficient (r2) [38,39]. Polynomialequations generated 3-dimensional surface and contour graphs were produced by thesoftware. p and F values were used to assess model suitability while the optimizationprocess was assessed using individual (di) and overall desirability function (Di). Table 3summarizes details of independent (X1 and X2) and dependent variables (Y1 to Y3). Thisvalue depends on several independent variables and set goals.
3.5. Formulations Characterizations3.5.1. Vesicle Size and Zeta Potential
All prepared formulations were prepared and evaluated for size, polydispersity index(PDI) and surface charge (zeta potential, mV). Vesicle size and size distribution wereassessed as per method reported in previous section. All of the formulations were assessedfor zeta potential as an essential parameter controlling stability of the product. The samplewas diluted (100 times) with water to disperse vesicles in the medium before size andPDI determination. In case of zeta analysis, the liposomal colloid was processed as suchwithout dilution.
3.5.2. Percentage Entrapment Efficiency (% EE)
This was determined by the reported procedure [40,41]. Developed formulations wereplaced aside overnight at 4 ◦C. Un-entrapped (free drug) was determined using Eppendorftube (2 mL) centrifugation method (15,000 rpm for 15 min). The procedure was repeated toremove free drug completely. LUT contents were determined using a HPLC technique atλmax of 350 nm. Finally, the entrapped drug in the vesicles was calculated by Equation (1):
% EE = [(Qt − Qs)/Qt)] × 100 (1)
where, “Qt” and “Qs” were the added theoretical content of the drug added and the contentof LUT present in the clear supernatant, respectively.
Pharmaceuticals 2021, 14, 1143 16 of 20
3.5.3. Desirability Function Parameter and Validation
Desirability is a numerical function with the objective to reach the value of 1 leading tothe best fit within expected constraints and goals. This is, also, used to identify interactionbetween factors if it exists. Statistically, “Di” is a geometrical mean function of the exploredresponses depending upon set “maximum”, “minimum”, “in range” “equal to”, and“target” ranges by the investigator during optimization process (Equation (2)):
Di = (d1. d2. . . . dn) = IIii = 1 di)1/n (2)
3.5.4. Morphological Assessment
The formulation with highest desirability value (OLEL1) was visualized under trans-mission electron microscopy (TEM) (JOEL JEM1010, Japan). The sample (2–3 drops) waskept on a glass coverslip and dried overnight. Then, the same sample was kept on thecarbon-coated copper grid for complete drying. Osmium was used to stain the lipid com-ponents and left for 24 h to dry. Then, the sample was loaded into the TEM to be viewedunder different magnifications.
3.5.5. Elasticity
Elasticity was measured following the reported method [42–44]. Briefly, elastic lipo-somes (LEL1–LEL12) and liposomes (as control) were extruded through a 50 nm pore-sizedmembrane (rp) for 10 min under 2.5 bar pressure. The extruded volume (J) and the meandiameter of the vesicles after extrusion (rv) were determined. Thus, the elasticity (E) ofvesicles was calculated using Equation (3):
E = J × (rv/rp)2 (3)
3.5.6. In Vitro Drug Release (%DR)
OLEL1, control liposome (lipo) and drug suspension (DS) prepared using 0.1% w/vsodium CMC (Na-carboxymethyl cellulose), were studied to understand their %DR pro-file. The study was conducted using a dialysis membrane (molecular cut-off 12–14 KDa,Himedia Labs). Each formulation and control samples (2 mL containing 6 mg LUT) wereseparately placed in the membrane tied from each ends using clip. The sample containingmembrane bag was suspended in a beaker previously filled with 400 mL of PBS (pH 7.4) setat 37 ± 1 ◦C and constant stirring (100 rpm) using magnetic bead. The sample for analysis(3 mL) was withdrawn at 1, 2, 4, 6, 8, and 12 h to estimate the drug concentration releasedin the medium using a U.V. spectrophotometer at 350 nm.
3.6. Analytical Method
The quantitative assessment of LUT was performed using a validated high perfor-mance liquid chromatography (HPLC) technique [45]. In this, the packing material of theanalytical column (150 mm × 4.5 mm) worked as stationary phase with particle size of5 µm operating at 30 ± 1 ◦C. The sample was injected at low volume (20 µL) for 8 min (runtime) at flow rate of 1 mL/min. For quantitative assessment, the mobile phase (MP) wasfreshly prepared using acetonitrile, methyl alcohol, and aqueous (including 1%v/v aceticacid). These components were prepared in 60:30:10% v/v, ratio. The prepared MP wasset at pH 4.0 and subsequently passed through a membrane filter to retain any fibers andparticles (if found). The drug analysis was conducted on an isocratic mode using a UVdetector (350 nm as set wavelength). A working calibration curve was constructed overconcentration range of 20–100 µg/mL with high regression coefficient (r2 > 0.99) [45].
3.7. Ex Vivo Drug Permeation and Deposition Study
This study was carried out using rat skin (excised from abdominal portion) (bodyweight of ~200 g albino male rats) from the Animal Center, College of Pharmacy, KingSaud University, Riyadh, Saudi Arabia. Approval (2 December 2020) was issued from
Pharmaceuticals 2021, 14, 1143 17 of 20
the Institute’s Ethics Committee (King Saud University, Riyadh) (KSU-SE-20-64). Thisexperiment was conducted based on the guideline for animal care (NC3Rs, ARRIVEguidelines). Stratum corneum (SC) of rat skin has similar thickness to human skin andshows similarity in the permeation in different studies [46]. Thus, transdermal permeationof the optimized formulations (OLEL1), control liposome (lipo) and drug solution (DS)was conducted using a Franz diffusion cell. The collected skin was cleaned (free from hairs,and fatty matters) using an electric shaver. The skin was placed between both chamberswhere dermal side faced the receptor PBS medium (pH 7.4) and donor received the sample(LUT = 15 mg). The receptor medium was under regular stirring (rice bead, 100 rpm) andtemperature of 37 ± 1 ◦C. Furthermore, sampling was carried out at 1, 2, 3, 6, 12, 20 and24 h and estimated using HPLC (absorbance wavelength as 350 nm). Permeation flux,cumulative permeation, and drug deposition (DD) were calculated [28,47,48]. DD valueswere obtained after completion of ex vivo permeation (24 h). For this, the remaining sampleon the surface was washed with running water and then sliced into small pieces. The drugwas extracted using methanol: chloroform (1:2) mixture under constant stirring for 4 h.The tissue was filtered and the filtrate was analyzed for the drug content [49–52].
3.8. Cytotoxicity Study Using MCF-7 Cell Lines
Effect on MCF7 cell viability of different concentrations of LUT standard and formu-lation was estimated by the MTT (3-(4,5-dimethylthiazol-2-yl)-2,5-diphenyl tetrazoliumbromide). Then, MCF7 cell-lines (15,000 cells per well), were transferred to seed into theplates (96-well-oplates) along with 100 µL of the culture media (DMEM, 10% FBS). Thesame plates were required to incubate for overnight at 37 ± 1 ◦C and constant supply of5% CO2 for complete adherence. To expose the cells to the compound, varied contentsof LUT standard and the optimized formulation were poured into the respective wells.Standard LUT solution and formulation were prepared in DMSO (1%) and serially dilutedusing serum free media in a 96-well plate. The same concentration of DMSO was used inthe vehicle control to avoid cell damage. The selected the drug concentrations in standardand formulation, were 215 µM, 107.5 µM, 53.5 µM, 26.75 µM, 13.38 µM and 6.69 µM. Cellswere exposed to the samples (24 h), and then MTT solution (10 µL, 5 mg/mL PBS) wastransferred to the respective wells. Furthermore, the culture was again incubated (4 h) sothat the viable cells can metabolize MTT. The culture media was removed from each wellfollowed by addition of DMSO solution (100 µL) to solubilize the formazan of MTT. Eachplate was subjected for reading after 30 min of incubation at 570 nm. The DMSO solutionwas used as the blank.
3.9. Statistical Analysis
Experiments were performed in triplicate to get mean and standard deviation. Alldata were processed using Origin-pro (OriginLab Corporation, Northampton, MA, USA),and GraphPad version 5.01 software (La Jolla, CA, USA). Data were processed statisticallyusing ANOVA (analysis of variance), Student’s t-test and a Turkey or Dunnett tests (SigmaStat Software, 2.03). The value was considered significant at p value of ≤0.05 for fitting theapplied model followed by the correlation factor (r2).
4. Conclusions
The drug is challenging for formulation scientists due to low aqueous solubility, andpoor oral bioavailability. Despite these limitations, the drug is well reported to havemultiple therapeutic benefits, including for breast cancer (as discussed in the introductionsection). Several scientists have applied techniques and carriers for improved efficacyof the drug to control breast cancer. However, no one has reported the use of vesicularelastic liposomes for transdermal delivery of LUT with improved efficacy against MCF-7cell lines. The present study developed and optimized elastic liposomes and evaluatedthem for in vitro and ex vivo parameters. Results show that Span 80 was the most suitableedge activator amongst investigated surfactants (Span 60, and Brij) which may be due to
Pharmaceuticals 2021, 14, 1143 18 of 20
negative glass transition temperature. Considering this, several formulations were dictatedin Design Expert and characterized for vesicle size, zeta potential and %EE. Interestingly,these results were close to the predicted values suggesting the suitability of the modeladopted for optimization (desirability~0.95). TEM corroborated quite dispersed vesicles incolloidal system. Elastic liposomes showed Span 80 mediated elasticity. The optimizedformulation illustrated facilitated drug release as compared with DS and rigid liposome.The proposed deformable vesicular carrier enhanced permeation parameters across rat skinas compared with DS and liposomes. Finally, the drug loaded carrier (OLEL1) exhibitedconcentration-dependent MCF-7 cells inhibition and elastic liposome improved cellularinternalization for maximized inhibition as compared with control pure drug solution.Thus, the elastic liposomes can be a promising approach for improved transdermal deliveryof LUT and enhanced therapeutic efficacy to control breast cancer.
Author Contributions: M.A.A.: funding and conceptualization; A.H.: methodology, analysis, draft-ing and writing; M.A.: methodology, data curation: S.A.: formal review: S.S.I.: formal review; W.Q.:analysis. All authors have read and agreed to the published version of the manuscript.
Funding: Authors thank and extend sincere appreciations to the Deanship of Scientific Research atKing Saud University for their support of the present research work through research group projectnumber RG-1441-010.
Institutional Review Board Statement: The study was conducted according to the guidelines of theDeclaration of Helsinki and approved (approved on 2 December 2020) by the Institutional ReviewBoard (or Ethics Committee) of College of Pharmacy, King Saud University (Institutional AnimalHouse (Institutional ethical committee), Riyadh (approved ethical No: KSU-SE-20-64). The protocolwas followed as per ARRIVE guidelines.
Informed Consent Statement: Not applicable.
Data Availability Statement: Not applicable.
Acknowledgments: The authors extend their appreciation to the Deanship of Scientific Research atKing Saud University for funding this work through research group number RG-1441-010.
Conflicts of Interest: The authors declare no conflict of interest.
References1. Ali, I.; Wani, W.A.; Saleem, K. Cancer scenario in India with future perspectives. Cancer Ther. 2011, 8, 56–70.2. Jain, A.S.; Dhawan, V.K.; Sarmento, B.; Nagarsenker, M.S. In vitro and ex vivo evaluations of lipid anti-cancer nanoformulations:
Insights and assessment of bioavailability enhancement. AAPS PharmSciTech 2016, 17, 553–571.3. Sung, H.; Ferlay, J.; Siegel, R.L.; Laversanne, M.; Soerjomataram, I.; Jemal, A.; Bray, F. Global Cancer Statistics 2020: GLOBOCAN
Estimates of Incidence and Mortality Worldwide for 36 Cancers in 185 Countries. CA A Cancer J. Clin. 2021, 71, 209–249. [CrossRef]4. World Health Organization. Fact. Sheet Datail of Breast Cancer. Available online: https://www.who.int/news-room/fact-sheets/
detail/breast-cancer (accessed on 22 June 2021).5. Seelinger, G.I.; Merfort Schempp, C.M. Anti-oxidant, anti-inflammatory and anti-allergic activities of luteolin. Planta Medica 2008,
74, 1667–1677. [CrossRef]6. Peng, B.; Yan, W. Solubility of Luteolin in Ethanol + Water Mixed Solvents at Different Temperatures. J. Chem. Eng. Data 2010, 55,
583–585. [CrossRef]7. Lin, Y.; Shi, R.; Wang, X.; Shen, H.-M. Luteolin, a Flavonoid with Potential for Cancer Prevention and Therapy. Curr. Cancer Drug
Targets 2008, 8, 634–646. [CrossRef] [PubMed]8. Dirscherl, K.; Karlstetter, M.; Ebert, S.; Kraus, D.; Hlawatsch, J.; Walczak, Y.; Moehle, C.; Fuchshofer, R.; Langmann, T. Luteolin
triggers global changes in the microglial transcriptome leading to a unique anti-inflammatory and neuroprotective phenotype. J.Neuroinflamm. 2010, 7, 1–16. [CrossRef] [PubMed]
9. Süzgeç-Selçuk, S.; Birteksöz, A. Flavonoids of Helichrysum chasmolycicum and its antioxidant and antimicrobial activities. SouthAfr. J. Bot. 2011, 77, 170–174. [CrossRef]
10. Wu, G.; Li, J.; Yue, J.; Zhang, S.; Yunusi, K. Liposome encapsulated luteolin showed enhanced antitumor efficacy to colorectalcarcinoma. Mol. Med. Rep. 2018, 17, 2456–2464. [CrossRef]
11. Chen, Z.; Tu, M.; Sun, S.; Kong, S.; Wang, Y.; Ye, J.; Li, L.; Zeng, S.; Jiang, H. The Exposure of Luteolin Is Much Lower than That ofApigenin in Oral Administration of Flos Chrysanthemi Extract to Rats. Drug Metab. Pharmacokinet. 2012, 27, 162–168. [CrossRef]
12. Dang, H.; Meng, M.H.W.; Zhao, H.; Iqbal, J.; Dai, R.; Deng, Y.; Lv, F. Luteolin-loaded solid lipid nanoparticles synthesis,characterization, & improvement of bioavailability, pharmacokinetics in vitro and vivo studies. J. Nanoparticle Res. 2014, 16, 1–10.
Pharmaceuticals 2021, 14, 1143 19 of 20
13. Trotta, M.; Peira, E.; Debernardi, F.; Gallarate, M. Elastic liposomes for skin delivery of dipotassium glycyrrhizinate. Int. J. Pharm.2002, 241, 319–327. [CrossRef]
14. Abidin, L.; Mujeeb, M.; Imam, S.S.; Aqil, M.; Khurana, D. Enhanced transdermal delivery of luteolin via non-ionic surfactant-basedvesicle: Quality evaluation and anti-arthritic assessment. Drug Deliv. 2016, 23, 1069–1074. [CrossRef] [PubMed]
15. Huang, M.; Su, E.; Zheng, F.; Tan, C. Encapsulation of flavonoids in liposomal delivery systems: The case of quercetin, kaempferoland luteolin. Food Funct. 2017, 8, 3198–3208. [CrossRef]
16. Mishra, D.; Garg, M.; Dubey, V.; Jain, S.; Jain, N. Elastic Liposomes Mediated Transdermal Deliveryof an Anti-HypertensiveAgent: Propranolol Hydrochloride. J. Pharm. Sci. 2007, 96, 145–155. [CrossRef] [PubMed]
17. Lopez, O.; De La Maza, A.; Coderch, L.; López-Iglesias, C.; Wehrli, E.; Parra, J.L. Direct formation of mixed micelles in thesolubilization of phospholipid liposomes by Triton X-100. FEBS Lett. 1998, 426, 314–318. [CrossRef]
18. Cevc, G.; Gebauer, D.; Stieber, J.; Schätzlein, A.; Blume, G. Ultraflexible vesicles, Transfersomes, have an extremely low porepenetration resistance and transport therapeutic amounts of insulin across the intact mammalian skin. Biochim. Et Biophys. Acta(BBA)-Biomembr. 1998, 1368, 201–215. [CrossRef]
19. Cevc, G. Lipid vesicles and other colloids as drug carriers on the skin. Adv. Drug Deliv. Rev. 2004, 56, 675–711. [CrossRef][PubMed]
20. Fazel, M.; Daeihamed, M.; Osouli, M.; Almasi, A.; Haeri, A.; Dadashzadeh, S. Preparation, in-vitro characterization andpharmacokinetic evaluation of Brij decorated doxorubicin liposomes as a potential nanocarrier for cancer therapy. IJPR 2018, 17,33–43. [CrossRef]
21. Ghosh, S.; Moulik, S. Interfacial and Micellization Behaviors of Binary and Ternary Mixtures of Amphiphiles (Tween-20, Brij-35,and Sodium Dodecyl Sulfate) in Aqueous Medium. J. Colloid Interface Sci. 1998, 208, 357–366. [CrossRef]
22. Sharma, B.; Rakshit, A.K. Thermodynamics of micellization of a nonionic surfactant: Brij 35 in aquo-sucrose solution. J. ColloidInterface Sci. 1989, 129, 139–144. [CrossRef]
23. Jain, S.K.; Gupta, Y.; Jain, A.; Rai, K. Enhanced Transdermal Delivery of Acyclovir Sodium via Elastic Liposomes. Drug Deliv.2008, 15, 141–147. [CrossRef] [PubMed]
24. Hussain, A.; Singh, S.; Sharma, D.; Webster, T.J.; Shafaat, K.; Faruk, A. Elastic liposomes as novel carriers: Recent advances indrug delivery. Int. J. Nanomed. 2017, 12, 5087–5108. [CrossRef] [PubMed]
25. Lu, G.W.; Gao, P. Emulsions and Microemulsions for Topical and Transdermal Drug Delivery. In Handbook of Non-Invasive DrugDelivery Systems; Elsevier: Amsterdam, The Netherlands, 2010; pp. 59–94.
26. Varshosaz, J.; Pardakhty, A.; Hajhashemi, V.I.; Najafabadi, A.R. Development and physical characterization of sorbitan monoesterniosomes for insulin oral delivery. Drug Deliv. 2003, 10, 251–262. [CrossRef]
27. Derringer, G.; Suich, R. Simultaneous Optimization of Several Response Variables. J. Qual. Technol. 1980, 12, 214–219. [CrossRef]28. Tas, C.; Ozkan, Y.; Okyar, A.; Savaser, A. In vitro and ex vivo permeation studies of etodolac from hydrophilic gels and effect of
terpenes as enhancers. Drug Deliv. 2007, 14, 453–459. [CrossRef]29. Chen, J.; Lu, W.-L.; Gu, W.; Lu, S.-S.; Chen, Z.-P.; Cai, B.-C. Skin permeation behavior of elastic liposomes: Role of formulation
ingredients. Expert Opin. Drug Deliv. 2013, 10, 845–856. [CrossRef]30. Ollila, F.; Halling, K.; Vuorela, P.; Vuorela, H.; Slotte, J. Characterization of flavonoid–biomembrane interactions. Arch. Biochem.
Biophys. 2002, 399, 103–108. [CrossRef]31. Selvaraj, S.; Krishnaswamy, S.; Devashya, V.; Sethuraman, S.; Krishnan, U.M. Influence of membrane lipid composition on
flavonoid–membrane interactions: Implications on their biological activity. Prog. Lipid Res. 2015, 58, 1–13. [CrossRef]32. Hussain, A.; Samad, A.; Ramzan, M.; Ahsan, M.N.; Rehman, Z.U.; Ahmad, F. Elastic liposome-based gel for topical delivery of
5-fluorouracil: In vitro and in vivo investigation. Drug Deliv. 2016, 23, 1115–1129. [CrossRef]33. Yeom, S.; Shin, B.S.; Han, S. An electron spin resonance study of non-ionic surfactant vesicles (niosomes). Chem. Phys. Lipids 2014,
181, 83–89. [CrossRef]34. Cevc, G.; Blume, G.; Schätzlein, A. Transfersomes-mediated transepidermal delivery improves the regio-specificity and biological
activity of corticosteroids in vivo. J. Control Release 1997, 45, 211–226. [CrossRef]35. Jeon, Y.-W.; Suh, Y.J. Synergistic apoptotic effect of celecoxib and luteolin on breast cancer cells. Oncol. Rep. 2012, 29, 819–825.
[CrossRef]36. Ita, K.B.; Du Preez, J.; du Plessis, J.; Lane, M.E.; Hadgraft, J. Dermal delivery of selected hydrophilic drugs from elastic liposomes:
Effect of phospholipid formulation and surfactants. J. Pharm. Pharmacol. 2007, 59, 1215–1222. [CrossRef] [PubMed]37. Balaguer-Fernández, C.; Femenía-Font, A.; Merino, V.; Cordoba-Diaz, D.; Elorza-Barroeta, M.A.; López-Castellano, A.; Cordoba-
Diaz, M. Elastic vesicles of sumatriptan succinate for transdermal administration: Characterization and in vitro permeationstudies. J. Liposome Res. 2011, 21, 55–59. [CrossRef] [PubMed]
38. Gusai, T.; Dhavalkumar, M.; Soniwala, M.; Dudhat, K.; Vasoya, J.; Chavda, J. Formulation and optimization of microsponge-loaded emulgel to improve the transdermal application of acyclovir—a DOE based approach. Drug Deliv. Transl. Res. 2020, 1–21.[CrossRef] [PubMed]
39. Prasanthi, D.; Lakshmi, P.K. Development of ethosomes with taguchi robust design-based studies for transdermal delivery ofalfuzosin hydrochloride. Int. Curr. Pharm. J. 2012, 1, 370–375. [CrossRef]
40. Duangjit, S.; Opanasopit, P.; Rojanarata, T.; Ngawhirunpat, T. Evaluation of meloxicam-loaded cationic transfersomes astransdermal drug delivery carriers. AAPS PharmSciTech 2012, 14, 133–140. [CrossRef]
Pharmaceuticals 2021, 14, 1143 20 of 20
41. Ahad, A.; Aqil, M.; Kohli, K.; Sultana, Y.; Mujeeb, M. Enhanced transdermal delivery of an anti-hypertensive agent viananoethosomes: Statistical optimization, characterization and pharmacokinetic assessment. Int. J. Pharm. 2013, 443, 26–38.[CrossRef]
42. Mishra, D.; Dubey, V.; Asthana, A.; Saraf, D.; Jain, N. Elastic liposomes mediated transcutaneous immunization against HepatitisB. Vaccine 2006, 24, 4847–4855. [CrossRef]
43. Benson, H.A. Elastic Liposomes for Topical and Transdermal Drug Delivery, in Liposomes; Springer: Berlin/Heidelberg, Germany, 2010;pp. 77–86.
44. Vanic, Ž.; Rukavina, Z.; Manner, S.; Fallarero, A.; Uzelac, L.; Kralj, M.; Klaric, D.A.; Bogdanov, A.; Raffai, T.; Virok, D.P.; et al.Azithromycin-liposomes as a novel approach for localized therapy of cervicovaginal bacterial infections. Int. J. Nanomed. 2019, 14,5957–5976. [CrossRef] [PubMed]
45. Altamimi, M.A.; Hussain, A.; Alshehri, S.; Imam, S.S.; Alnemer, U.A. Develop-ment and Evaluations of Transdermally DeliveredLuteolin Loaded Cationic Nanoemulsion: In Vitro and Ex Vivo Evaluations. Pharmaceutics 2021, 13, 1218. [CrossRef] [PubMed]
46. Godin, B.; Touitou, E. Transdermal skin delivery: Predictions for humans from in vivo, ex vivo and animal models. Adv. DrugDeliv. Rev. 2007, 59, 1152–1161. [CrossRef]
47. Gannu, R.; Vishnu, Y.V.; Kishan, V.; Rao, Y.M. Development of Nitrendipine Transdermal Patches: In vitro and Ex vivo Character-ization. Curr. Drug Deliv. 2007, 4, 69–76. [CrossRef] [PubMed]
48. Gannu, R.; Palem, C.R.; Yamsani, V.V.; Yamsani, S.K.; Yamsani, M.R. Enhanced bioavailability of lacidipine via microemulsionbased transdermal gels: Formulation optimization, ex vivo and in vivo characterization. Int. J. Pharm. 2010, 388, 231–241.[CrossRef]
49. AbdelSamie, S.M.; Kamel, A.O.; Sammour, O.; Ibrahim, S. Terbinafine hydrochloride nanovesicular gel: In vitro characterization,ex vivo permeation and clinical investigation. Eur. J. Pharm. Sci. 2016, 88, 91–100. [CrossRef]
50. Thomas, L.; Zakir, F.; Mirza, M.A.; Anwer, K.; Ahmad, F.; Iqbal, Z. Development of Curcumin loaded chitosan polymer basednanoemulsion gel: In vitro, ex vivo evaluation and in vivo wound healing studies. Int. J. Biol. Macromol. 2017, 101, 569–579.[CrossRef]
51. Aziz, D.E.; Abdelbary, A.A.; Elassasy, A.I. Investigating superiority of novel bilosomes over niosomes in the transdermal deliveryof diacerein: In vitro characterization, ex vivo permeation and in vivo skin deposition study. J. Liposome Res. 2019, 29, 73–85.[CrossRef]
52. Pandey, S.S.; Shah, K.M.; Maulvi, F.A.; Desai, D.T.; Gupta, A.R.; Joshi, S.V.; Shah, D.O. Topical delivery of cyclosporine loadedtailored niosomal nanocarriers for improved skin penetration and deposition in psoriasis: Optimization, ex vivo and animalstudies. J. Drug Deliv. Sci. Technol. 2021, 63, 102441. [CrossRef]
Related Documents


![pH gradient loading of anthracyclines into cholesterol ... · sively used in the preparation of liposomes for improving transdermal liposomal drug delivery [25], improving encap-sulation](https://static.cupdf.com/doc/110x72/5ec666a52a5b1b797e2a9fef/ph-gradient-loading-of-anthracyclines-into-cholesterol-sively-used-in-the-preparation.jpg)


