DISPLACEMENT OF NITROGEN FROM NORMAL HUMAN LUNGS DURING OXYGEN BREATHING' By AARON A. COHEN, ALLAN HEMINGWAY, AND CLAIRE HEMINGWAY (From the Veterans Administration Hospital, San Fernando, Calif., and the Department of Physiology, School of Medicine, University of California, Los Angeles, Calif.) (Submitted for publication September 17, 1957; accepted October 4, 1957) Abnormalities of intrapulmonary distribution and mixing of inspired gases occur in diseases of the lungs, particularly in pulmonary emphysema. Interest in this problem began in 1864, and has been pursued with many different methods (1). However, uncertainty and even confusion still exists not only in the definition but also in the quantitative measurement of intrapulmonary dis- tribution and mixing. One means of investigating the problem is the measurement of nitrogen dis- placement from the lung as it occurs during oxy- gen breathing, reported by Cournand and his as- sociates (2-4). As an index of impaired distribu- tion and mixing of the inspired gas with alveolar gas, they proposed an end-expired nitrogen con- centration exceeding 2.5 per cent, delivered by a forced expiration at the end of a seven minute period of quiet oxygen-breathing (3). With such a technique only two points in the course of the nitrogen dilution were known-the initial alveolar nitrogen concentration while breathing air, and the final nitrogen concentration produced by the terminal forced expiration. Subsequently, a mathematical expression was presented (4) for ideal intrapulmonary mixing of oxygen and nitro- gen, enabling predictions of the intrapulmonary nitrogen concentration at the end of any given number of breaths of oxygen. Divergence was found even in normal persons between the actual course of nitrogen dilution and the predicted course. With the help of continuous rapid automatic gas analyzers such as the nitrogen meter (5) and the mass spectrometer (6), later investigators could follow the breath-by-breath dilution of nitrogen during the breathing of oxygen. After graphical analysis of the displacement curves they proposed interesting concepts of well-ventilated and poorly- 1 This work was supported in part by a grant from the Los Angeles County Tuberculosis and Health Association. ventilated lung compartments, and of rates of gas mixing in these spaces (6-8). Simpler criteria were proposed by others (9-13), in particular "turnover indices" which related functional resid- ual capacity to the total ventilation required to di- lute the intrapulmonary nitrogen to a given end- point (10, 12, 13). Previous workers have studied relatively few normal human subjects. The purposes of the present paper are to present data on the quanti- tative aspects of nitrogen displacement from the lungs of fifty normal persons, as a basis of com- parison for the findings in patients with pulmo- nary disease, and to suggest certain clinically valu- able criteria for the evaluation of intrapulmonary gas mixing. From this investigation normal ni- trogen clearance characteristics have been deter- mined, and the physiological factors which influ- ence clearance have been evaluated. MATERIAL AND METHODS Fifty medical students free from pulmonary disease were selected for study, on the basis of a health question- naire and review of Student Health Service records, which included recent chest radiographs and physical examinations. The open-circuit method of Cournand, Baldwin, Dar- ling, and Richards (3) for measurement of functional residual capacity was modified to include continuous monitoring of the expired nitrogen by a nitrogen meter with a recording milliammeter.2 The combined accuracy of our nitrogen meter and recording system varied from + 0.1 per cent to - 0.2 per cent (mean, - 0.05 per cent in 51 trials) in the range of 0 to 20 per cent nitrogen, and amounted to ± 0.5 per cent in the 20 per cent to 80 per cent nitrogen range, as determined by comparison with manometric gas analysis (14). Minimum readability in the 0 to 20 per cent range was 0.1 per cent nitrogen; in the 20 per cent to 80 per cent range it was 0.5 per cent 2 The nitrogen meter was manufactured by the Waters Company, Rochester, Minnesota. The recorder was man- ufactured by the Esterline-Angus Company, Indianapolis, Indiana. 306

Welcome message from author
This document is posted to help you gain knowledge. Please leave a comment to let me know what you think about it! Share it to your friends and learn new things together.
Transcript

DISPLACEMENTOF NITROGENFROMNORMALHUMANLUNGSDURINGOXYGENBREATHING'
By AARONA. COHEN,ALLAN HEMINGWAY,AND CLAIRE HEMINGWAY
(From the Veterans Administration Hospital, San Fernando, Calif., and the Department ofPhysiology, School of Medicine, University of California, Los Angeles, Calif.)
(Submitted for publication September 17, 1957; accepted October 4, 1957)
Abnormalities of intrapulmonary distributionand mixing of inspired gases occur in diseases ofthe lungs, particularly in pulmonary emphysema.Interest in this problem began in 1864, and hasbeen pursued with many different methods (1).However, uncertainty and even confusion stillexists not only in the definition but also in thequantitative measurement of intrapulmonary dis-tribution and mixing. One means of investigatingthe problem is the measurement of nitrogen dis-placement from the lung as it occurs during oxy-gen breathing, reported by Cournand and his as-sociates (2-4). As an index of impaired distribu-tion and mixing of the inspired gas with alveolargas, they proposed an end-expired nitrogen con-centration exceeding 2.5 per cent, delivered by aforced expiration at the end of a seven minuteperiod of quiet oxygen-breathing (3). With sucha technique only two points in the course of thenitrogen dilution were known-the initial alveolarnitrogen concentration while breathing air, andthe final nitrogen concentration produced by theterminal forced expiration. Subsequently, amathematical expression was presented (4) forideal intrapulmonary mixing of oxygen and nitro-gen, enabling predictions of the intrapulmonarynitrogen concentration at the end of any givennumber of breaths of oxygen. Divergence wasfound even in normal persons between the actualcourse of nitrogen dilution and the predictedcourse.
With the help of continuous rapid automatic gasanalyzers such as the nitrogen meter (5) and themass spectrometer (6), later investigators couldfollow the breath-by-breath dilution of nitrogenduring the breathing of oxygen. After graphicalanalysis of the displacement curves they proposedinteresting concepts of well-ventilated and poorly-
1 This work was supported in part by a grant from theLos Angeles County Tuberculosis and Health Association.
ventilated lung compartments, and of rates of gasmixing in these spaces (6-8). Simpler criteriawere proposed by others (9-13), in particular"turnover indices" which related functional resid-ual capacity to the total ventilation required to di-lute the intrapulmonary nitrogen to a given end-point (10, 12, 13).
Previous workers have studied relatively fewnormal human subjects. The purposes of thepresent paper are to present data on the quanti-tative aspects of nitrogen displacement from thelungs of fifty normal persons, as a basis of com-parison for the findings in patients with pulmo-nary disease, and to suggest certain clinically valu-able criteria for the evaluation of intrapulmonarygas mixing. From this investigation normal ni-trogen clearance characteristics have been deter-mined, and the physiological factors which influ-ence clearance have been evaluated.
MATERIAL ANDMETHODS
Fifty medical students free from pulmonary diseasewere selected for study, on the basis of a health question-naire and review of Student Health Service records,which included recent chest radiographs and physicalexaminations.
The open-circuit method of Cournand, Baldwin, Dar-ling, and Richards (3) for measurement of functionalresidual capacity was modified to include continuousmonitoring of the expired nitrogen by a nitrogen meterwith a recording milliammeter.2 The combined accuracyof our nitrogen meter and recording system varied from+ 0.1 per cent to - 0.2 per cent (mean, - 0.05 per cent in51 trials) in the range of 0 to 20 per cent nitrogen, andamounted to ± 0.5 per cent in the 20 per cent to 80 percent nitrogen range, as determined by comparison withmanometric gas analysis (14). Minimum readability inthe 0 to 20 per cent range was 0.1 per cent nitrogen; inthe 20 per cent to 80 per cent range it was 0.5 per cent
2 The nitrogen meter was manufactured by the WatersCompany, Rochester, Minnesota. The recorder was man-ufactured by the Esterline-Angus Company, Indianapolis,Indiana.
306
NITROGEN DISPLACEMENTBY OXYGENFROM NORMALLUNGS
nitrogen. The nitrogen meter was calibrated before andafter each run with a series of known mixtures of nitro-gen and oxygen, bubbled through water.
The subjects, in a nonbasal state, rested for 10 to 15minutes before being tested. All tests were made in thesupine position. Air was breathed by mouthpiece througha four-way respiratory valve, two arms of which wereconnected to a balloon-in-bottle system containing air,one arm to a Douglas bag containing oxygen, and onearm to a 120 liter Tissot spirometer. A spirometer rec-ord of the tidal volume changes in the balloon was ob-tained during air-breathing. When it was apparent thatbreathing was even and that the expiratory base line wassteady, the subject was switched from air to cylinder oxy-gen exactly at the end of a normal expiration. With thisarrangement, a switch made too soon or too late could becorrected in the calculation of functional residual capac-ity. For the next seven minutes the subject inspiredoxygen from the Douglas bag and expired into the Tissotspirometer. The volume of each expiration was recordedon the Tissot kymograph, which was started simultane-ously with the nitrogen meter recorder at the instantoxygen-breathing began. The nitrogen meter sampledcontinuously from a point just distal to an expiratoryflap valve near the mouthpiece. Thus, a breath-by-breathanalysis of the end-expired nitrogen concentration and ex-piratory volume was made. At the end of the seventhminute a forced expiration was made and a sample of gaswas drawn into a syringe from a point adjacent to thenitrogen meter sampling connection, following which thesubject was switched back to air-breathing. The finalconcentrations of nitrogen and carbon dioxide in the Tis-sot spirometer were measured by manometric (14) andvolumetric (15) methods, as well as by the nitrogenmeter. The final forced expiratory sample was analyzedfor carbon dioxide. The peak end-expired nitrogen con-centration was considered "alveolar" (FAN2), as was thecarbon dioxide concentration in the final forced expiration(FAco2) -
The Tissot kymograph record was used to calculatetidal volumes, respiratory rates, and minute ventilation(all volumes in this report are corrected to body tempera-ture and pressure, saturated with water vapor). Func-tional residual capacity (FRC) was calculated accordingto the previously described method (3), correcting fordiffusion of tissue nitrogen into the alveoli (16). Suit-able corrections were made for valve dead space and fordeviations from the true expiratory base' line when thesubject was switched to oxygen. Alveolar ventilationwas computed according to a derivation from the Bohrformula (17): VA/VE = FEco2/FAco2, where VA is al-veolar ventilation, VE is total expired ventilation, FACo2is alveolar carbon dioxide (vide supra), and FECO2 is thevolume fraction of carbon dioxide in the mixed expired(spirometer) gas (18). From the record of the nitrogenmeter and from the spirometer kymograph record of col-lected expired gas, a graph was prepared plotting thelogarithm of 100 (FAN2- FIN2), which is the differencebetween end-expired nitrogen and inspired nitrogen (usu-
I T ISOA-Fl" .- IFlI
X IV
\'vHe _ _ -~~~~~~~~~~~~~~~~~~~~
FRCE EXW.)OS- .
I1) 2o D 4 D S0 50 LffERS
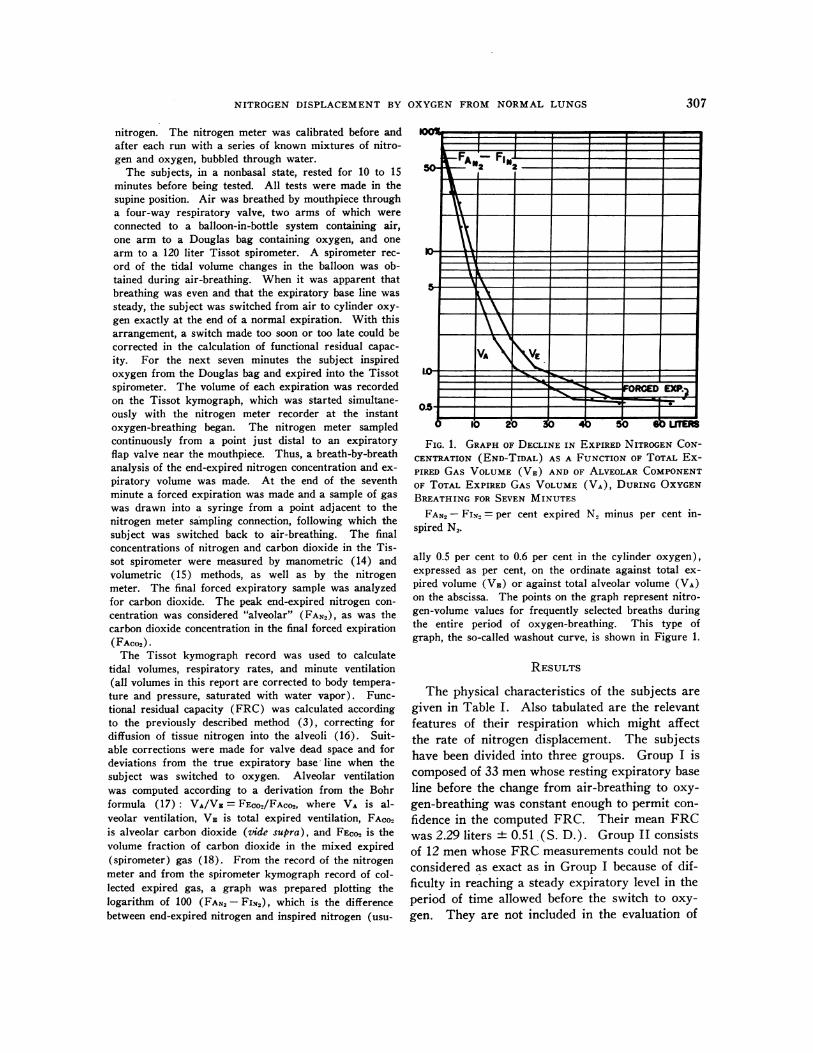
FIG. 1. GRAPHOF DECLINE IN ExPIRED NITROGENCON-CENTRATION (END-TIDAL) AS A FUNCTION OF TOTAL Ex-PIRED GAS VOLUME(VE) AND OF ALVEOLARCOMPONENTOF TOTAL EXPIRED GAS VOLUME(VA), DURING OXYGENBREATHINGFOR SEVEN MINUTES
FAN2- FIN2 = per cent expired N2 minus per cent in-spired N2.
ally 0.5 per cent to 0.6 per cent in the cylinder oxygen),expressed as per cent, on the ordinate against total ex-pired volume (VE) or against total alveolar volume (VA)on the abscissa. The points on the graph represent nitro-gen-volume values for frequently selected breaths duringthe entire period of oxygen-breathing. This type ofgraph, the so-called washout curve, is shown in Figure 1.
RESULTS
The physical characteristics of the subjects aregiven in Table I. Also tabulated are the relevantfeatures of their respiration which might affectthe rate of nitrogen displacement. The subjectshave been divided into three groups. Group I iscomposed of 33 men whose resting expiratory baseline before the change from air-breathing to oxy-gen-breathing was constant enough to permit con-fidence in the computed FRC. Their mean FRCwas 2.29 liters ±+ . 1. (S. D.). Group II consistsof 12 men whose FRCmeasurements could not beconsidered as exact as in Group I because of dif-ficulty in reaching a steady expiratory level in theperiod of time allowed before the switch to oxy-gen. They are not included in the evaluation of
I I I I I I I.r- -%-0 A
307
AARONA. COHEN, ALLAN HEMINGWAY,AND CLAIRE HEMINGWAY
TABLE I
Characteristics of fifty normal young adults
Group Age Height Weight B.S.A.* FRC* f* VT* VE5 VA/VE*
yrs. in. lbs. M.2 liters ml. liters/min./M.2I. 33 males
Mean 24.1 70.7 162.7 1.92 2.295 11.0 803 4.13 0.66S. D. 2.3 2.7 19.3 0.14 0.512 4.2 281 0.79 0.08
II. 12 malesMean 23.1 71.1 172.3 1.98 2.543 9.7 956 4.32 0.70S. D. 1.6 2.4 28.3 0.17 0.373 3.1 401 0.88 0.08
III. 5 femalesMean 26.2 65.3 128.6 1.64 1.742 13.5 500 4.06 0.62S. D. 7.7 2.9 18.8 0.15 0.302 3.3 60 0.72 0.06
* B.S.A. = Body surface area, in square meters.FRC = Functional residual capacity, in liters.
f = Number of respirations per minute.VT = Tidal volume, in ml.VE = Minute volume of expired gas, in liters per square meter B.S.A.
VA/VE = Alveolar fraction of total expired gas.
the initial or steep part of the nitrogen washout correlation was found between FRC and variouscurve, where size of FRC exerts its greatest in- parameters of body size, including the cube of thefluence (vide infra). However, their washout be- height as suggested by Bateman (23).havior in the latter part of the seven minute pe- The ratio VA/VE, which relates total ventilationriod is regarded as satisfactory for inclusion with to alveolar ventilation, depends on FACO2 in a sin-the other subjects because, despite variation of the gle forced expiration and has the inherent errorsinitial FRC, intrapulmonary mixing should be of dead space determination (24), yet offers thecomplete, or almost so, at the end of seven minutes advantages of utility. The mean values in Groupsin these normal young individuals. Review of the I, II, and III are 0.66, 0.70, and 0.62, respectively,data showed this assumption to be correct. The and are close to the generally accepted normaldata for five females are listed separately in Table value of 0.70 (25).I as Group III. Their mean FRCwas 1.74 liters The nitrogen clearance curves are presented for± 0.30 (S. D.). simplicity in two phases-the initial rapid drop of
The values for, and the variability of, FRC end-expired nitrogen as a function of summatedamong our subjects confirm the findings of others expired ventilation (VE) or of summated alveolar(19-21) who have measured pulmonary volume ventilation (VA), and the subsequent slow decline.compartments in normals (Table II). In agree- Previous workers (6, 7) have attempted, by plot-ment with these investigators (19-22), no close ting log FEN2 against time or number of breaths
TABLE II
Comparative values for functional residual capacity in literature and in present study
No. of VariabilityInvestigators subjects Sex Age Posture Mean FRC of FRC
yrs. litersKaltreider (19) 50 M 18-30 Supine 2.18 0.50 (S. D.)
50 F 18-30 Supine 1.82 0.39 (S. D.)
Needham (20) 27 M 20-30 Seated 3.21 1.9-4.318 F 20-30 Seated 2.34 1.7-3.5
Whitfield (21) 41 M 10-70 Supine 2.459 0.591 (S. D.)16 F 10-70 Supine 1.856 0.458 (S. D.)
Present study 33 M 21-31 Supine 2.295 0.512 (S. D.)5 F 21-38 Supine 1.742 0.302 (S. D.)
308
NITROGEN DISPLACEMENTBY OXYGENFROM NORMALLUNGS
K AN2 FIN2
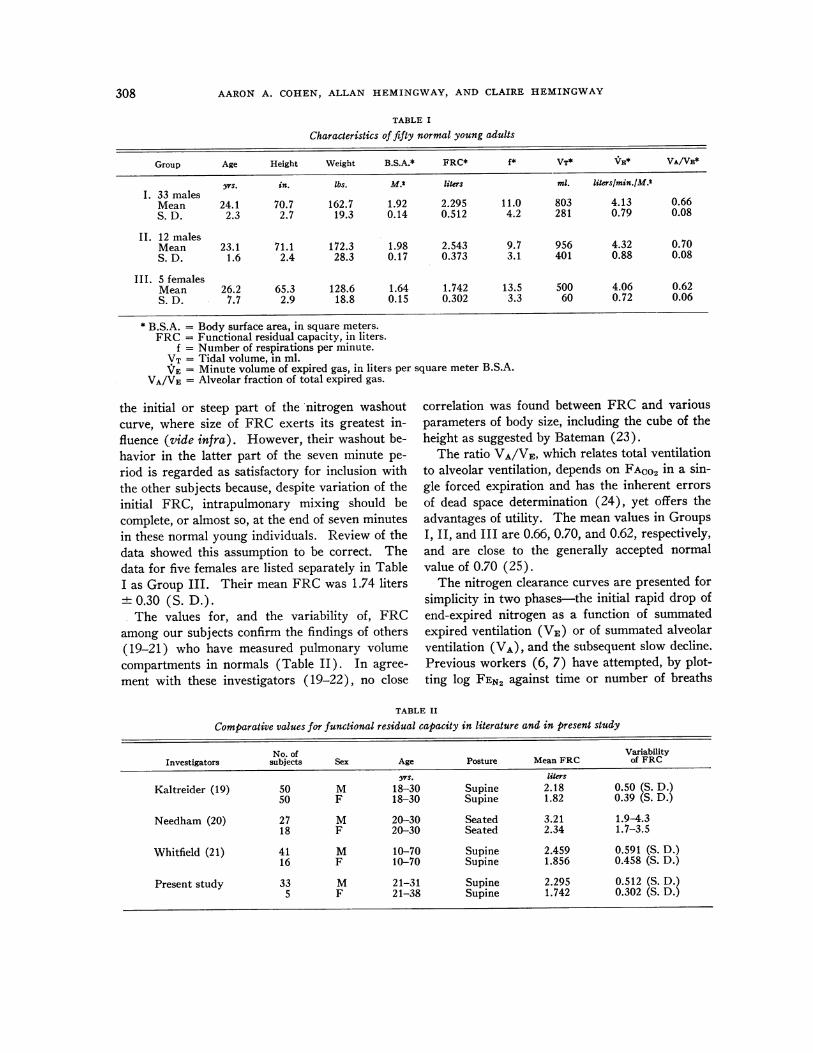
FIG. 2. A-COURSEOF DECLINE OF END-TIDAL NITRO-GEN CONCENTRATIONTO 1 PER CENT AS FUNCTION OF
TOTAL EXPIRED GAS VOLUME, DURING OXYGENBREATH-
ING; B-SAME, RELATING DECLINE IN NITROGEN CON-
CENTRATIONTO ALVEOLARVENTILATION
Heavy central lines represent mean values for Group I
(33 subjects). Cross-hatching represents one standard
deviation from the mean. FAN2,- FIN2 = per cent expired
N. minus per cent inspired N,.
on semilogarithmic paper, to divide the clearancecurves into one or more straight-line segments,and to interpret these segments as representingclearance from separate pulmonary compartments.In the washout curves presented here for normalindividuals, where log (FAN2 - FIN2) is plottedagainst expired volume, no constant number ofstraight-line segments could be determined. Inmany instances a single straight line could be
drawn through all the nitrogen concentrationpoints for the first few breaths, followed by one
or more somewhat less steep straight-line seg-
ments. However, the length, slope, and numberof these segments varied from one individual toanother; hence the attempt to plot straight-linesegments to match exactly all observed points was
abandoned and instead lines were drawn to fit a
majority of the points by inspection. The transi-tion of the initial rapid decline of nitrogen concen-
tration into the later slow decline was also variablefrom one person to another, but in all subjectstook the form of a smooth bend. A conven-
ient end-point for the initial rapid washout phasewas arbitrarily chosen as the ventilation point on
the curves which coincided with the 1 per cent(FAN2- FIN2) line. This total observed volumeof expired gas is designated VE (1 per cent), andthe calculated total expired alveolar gas to thispoint is designated VA (1 per cent).
Figure 2A shows for Group I the mean plot ofVE against FAN2- FIN2 down to 1 per cent, to-gether with the standard deviation. The mean VE(1 per cent) is 25.14 liters 5.70 (S. D.), witha coefficient of variation of 22.7 per cent. Figure2B shows the corresponding relationship for VA(1 per cent). The mean value for VA (1 percent) is 16.55 liters 4.46 (S. D.), with a co-
efficient of variation of 27 per cent. These dataare tabulated in Table III.
The main physiological factor determining ni-trogen clearance from the lung during the oxygen-breathing period should, theoretically, be the lung
,E III
Initial or steep part of clearance curve-Group I
VIC* VA* Vz/FRC* VA/FRC*FAN, -FIN2* (liters) (liters) (liters) (liters)
(%) Mean S.D. Mean S.D. Mean S.D. Mean S.D.
60 0.98 0.66 0.55 0.55 0.42 0.19 0.23 0.1840 2.36 0.84 1.55 0.62 1.04 0.26 0.67 0.1820 5.24 1.46 3.54 0.98 2.31 0.34 1.53 0.2510 8.39 1.74 5.62 1.36 3.70 0.45 2.43 0.30
8 9.52 1.93 6.35 1.52 4.19 0.48 2.75 0.336 11.00 2.25 7.29 1.77 4.84 0.53 3.15 0.344 13.29 2.78 8.72 2.16 5.84 0.59 3.76 0.412 18.03 3.74 11.80 2.92 7.93 0.82 5.09 0.551 25.14 5.70 16.55 4.46 10.97 1.29 7.08 0.89
* FAN2 -FIN2 = Per cent N2 in expired gas minus per cent N2 in inspired gas.VE = Total expired gas volume, or sum of tidal volumes.VA = Alveolar component of VE.
FRC = Functional residual capacity.
309
AARONA. COHEN, ALLAN HEMINGWAY,AND CLAIRE HEMINGWAY
TABLE IV
Relation of increasing functional residual capacity to ventilation and time required to lowerFAN2- FIN2 to 1 per cent-Group I *
FRC No. VB (1%)t VA (1%)t VE (1%)/FRCt VA (1%)/FRCt T (1%)t
liters liters liters liters liters minutes1.400-1.799 4 19.7 11.6 12.290 7.300 2.291.800-2.199 12 22.6 13.7 11.179 6.768 2.772.200-2.599 8 23.6 16.6 10.055 7.102 3.212.600-2.999 4 31.1 21.5 10.929 7.581 3.423.000-3.599 4 35.7 23.9 10.954 7.504 4.04
* Mean values given for each subgroup.t See Tables I and III for terminology.
volurvolur(eithVA)normwas,
andThison Trelatiand
30
20
1030
20
10
0
FIGRESIIVOLURELACENT
He(1 pe=-
standPoint
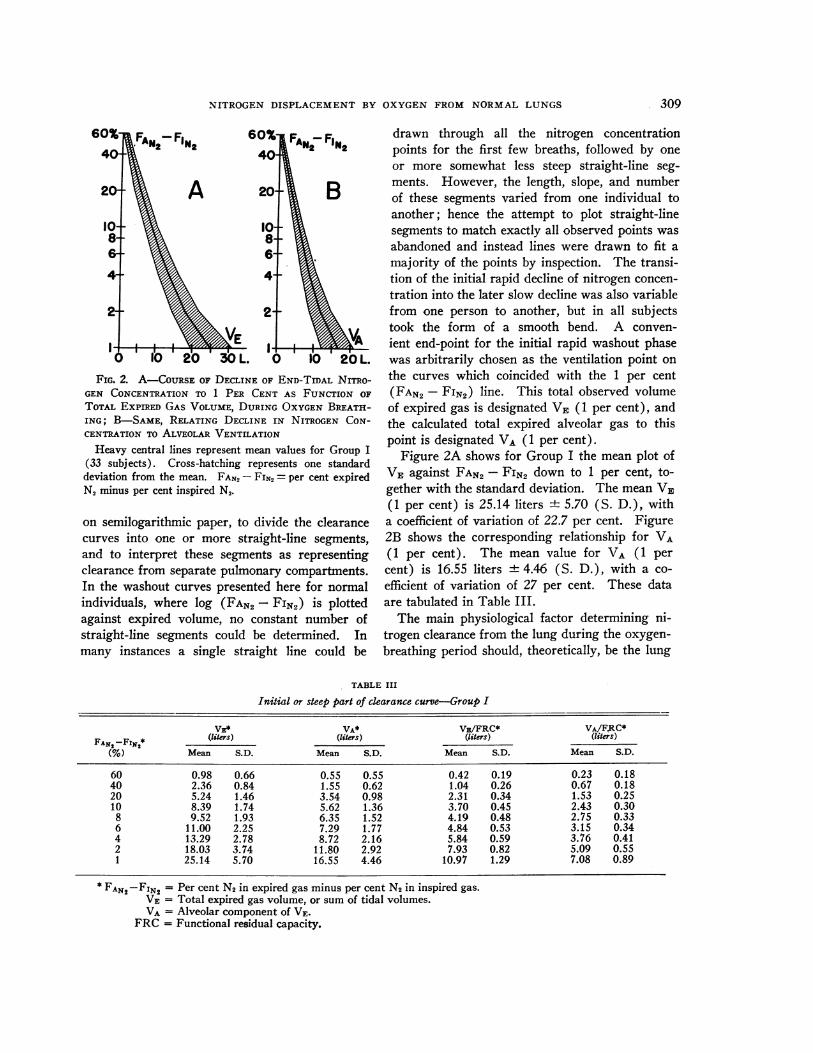
ne (FRC) to be cleared. The larger the lung efficient for VE (1 per cent) with FRC is 0.872,me the greater should be the total ventilation and for VA (1 per cent) with FRC is 0.745, whicher expired air volume VE or alveolar volume are high coefficients for lung volume variables.required for clearance, provided the lung is Since the size of the FRC influences strongly
ial and no poorly ventilated spaces exist. It the ventilation required to dilute the nitrogen to 1therefore, of interest to plot VE (1 per cent) per cent, the ratios VE (1 per cent) /FRC and VAVA (1 per cent) as a function of the FRC. (1 per cent)/FRC are proposed for the purposehas been done in Figures 3A and 3B, based of minimizing this influence and to allow compari-
able IV. A linear regression formula for the son of individuals with different FRC values.ionship between the two has been obtained These "turnover ratios" may be expressed as theis given in the figures. The correlation co- number of complete replacements of FRC by an
equivalent volume of expired gas required to re-duce the alveolar nitrogen to 1 per cent, or as the
VE(IX * -- a fraction of the ventilation of the total FRC to 1per cent nitrogen which is required to clear oneliter of FRC to this level. The results of usingUS Ad
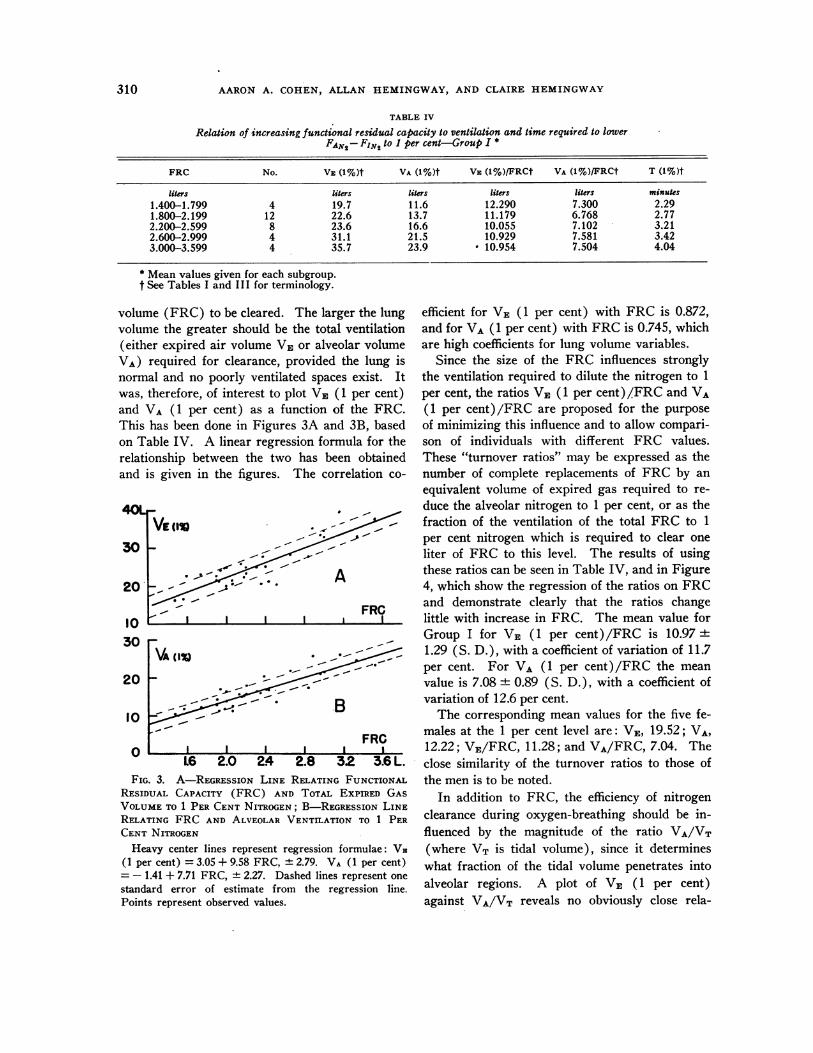
A these ratios can be seen in Table IV, and in Figure4, which show the regression of the ratios on FRCand demonstrate clearly that the ratios change
'r | | | | a | little with increase in FRC. The mean value forGroup I for VE (1 per cent)/FRC is 10.97 ±1.29 (S. D.), with a coefficient of variation of 11.7
._ok~ per cent. For VA (1 per cent)/FRC the meanvalue is 7.08 ± 0.89 (S. D.), with a coefficient ofvariation of 12.6 per cent.
-B*The corresponding mean values for the five fe-males at the 1 per cent level are: VE, 19.52; VA,
|Z 12.22; VE/FRC, 11.28; and VA/FRC, 7.04. TheL6 2.0 24 2.8 32 3.6 L. close similarity of the turnover ratios to those of
3. A-REGRESSION LINE RELATING FUNCTIONAL the men is to be noted.DUAL CAPACITY (FRC) AND TOTAL EXPIRED GAS In addition to FRC, the efficiency of nitrogenJME TO 1 PER CENT NITROGEN; B-REGRESSIONLINETING FRC AND ALVEOLAR VENTILATION TO 1 PER clearance during oxygen-breathing should be in-NITROGEN fluenced by the magnitude of the ratio VA/VT
avy center lines represent regression formulae: VE (where VT is tidal volume), since it determines!r cent) = 3.05 + 9.58 FRC, ± 2.79. VA (1 per cent) what fraction of the tidal volume penetrates into1.41 + 7.71 FRC, + 2.27. Dashed lines represent one alveolar regions. A plot of VE (1 per cent)[ard error of estimate from the regression line.ts represent observed values. against VA/VT reveals no obviously close rela-
310
40L4
NITROGEN DISPLACEMENTBY OXYGENFROM NORMALLUNGS31
g0
1o
2
1I
I FRC
FRC
I I I I I
VA(I'X B
0
fE FRC F1RC--
A
40
20,
1.5 2.0 24 2.5 &.Z 3.6L
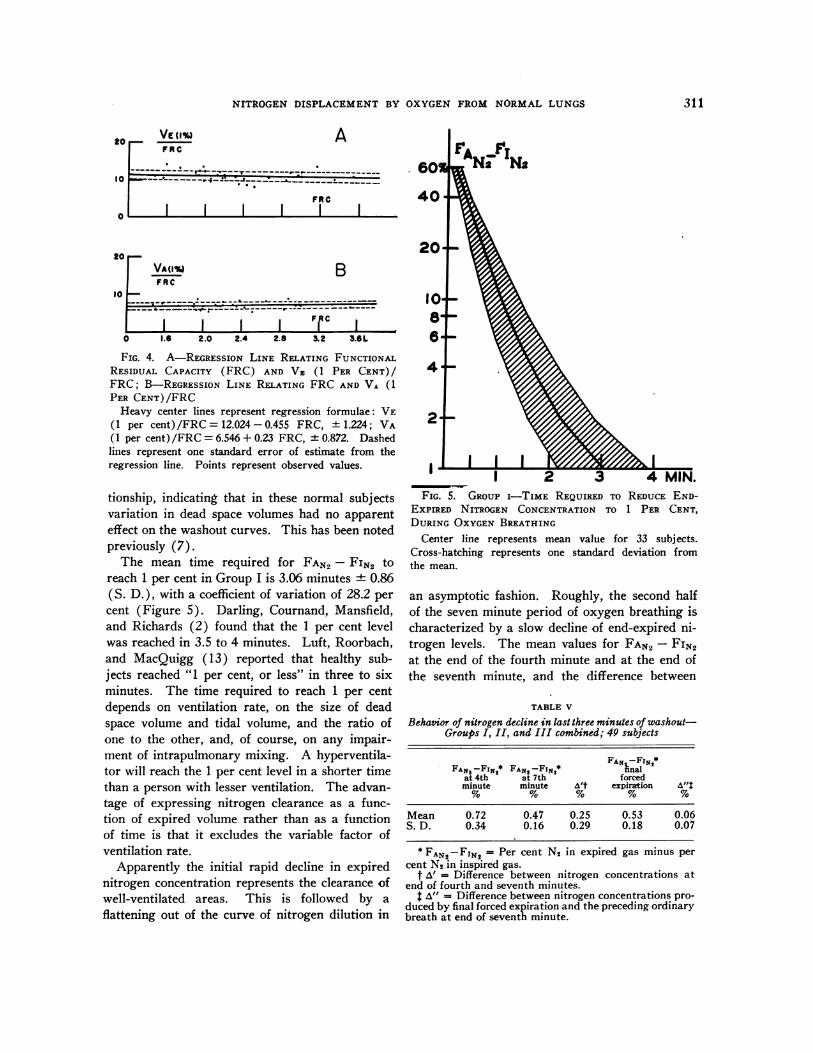
FIG. 4. A-REGRESSION LINE RELATING FUNCTIONAL
RESIDUAL CAPACITY (FRC) AND VE (1 PER CENT)/FRC; B-REGRESSION LINE RELATING FRC AND VA (1
PER CENT)/FRC
Heavy center lines represent regression formulae: VE
(1 per cent) /FRC = 12.024 0.455 FRC, ±t 1.224; VA
(1 per cent) /FRC = 6.546 + 0.23 FRC, ±t 0.872. Dashed
lines represent one standard error of estimate from the
regression line. Points represent observed values.
tionship, indicating that in these normal subjects
variation in dead space volumes had no apparent
effect on the washout curves. This has been noted
previously (7).
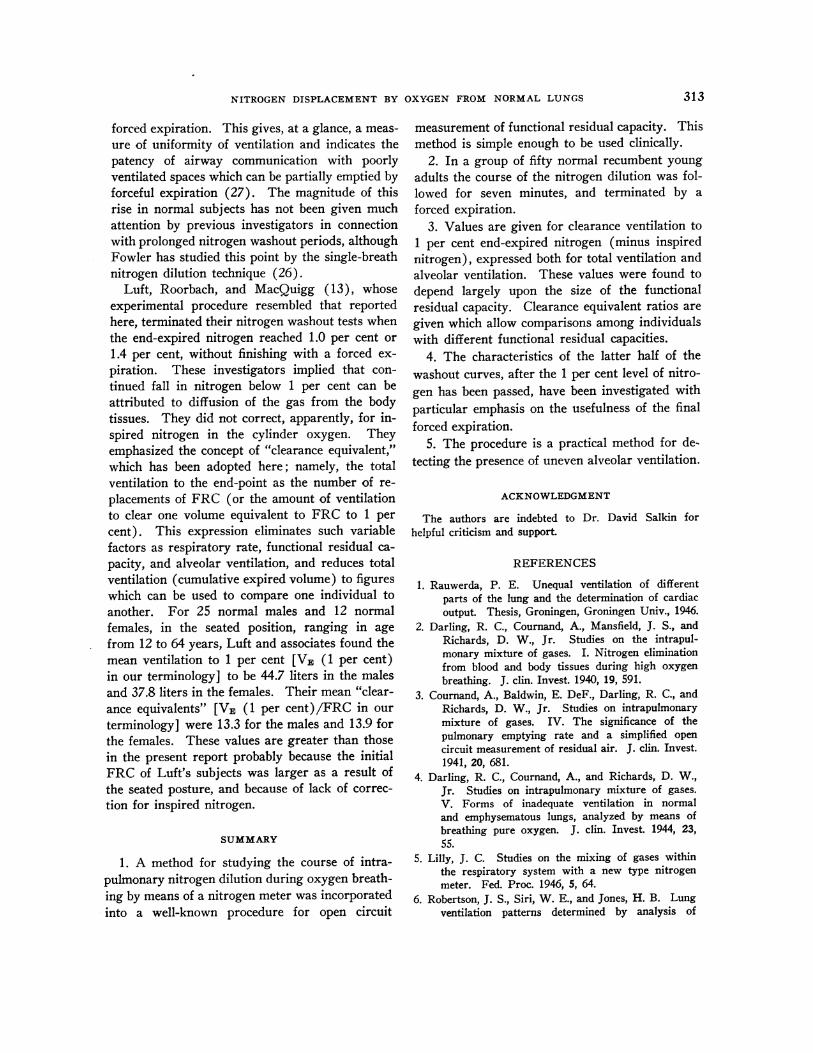
The mean time required for FAN, FIN, to
reach 1 per cent in Group I is 3.06 minutes ±+ 0.86
(S. D.), with a coefficient of variation of 28.2 per
cent (Figure 5). Darling, Cournand, Mansfield,
and Richards (2) found that the 1 per cent level
was reached in 3.5 to 4 minutes. Luft, Roorbach,
and MacQuigg (13) reported that healthy sub-
jects reached "1 per cent., or less" in three to six
minutes. The time required to reach 1 per cent
depends on ventilation rate, on the size of dead
space volume and tidal volume, and the ratio of
one to the other, and, of course, on any impair-
ment of intrapulmonary mixing. A hyperventila-
tor will reach the 1 per cent level in a shorter -time
than a person with lesser ventilation. The advan-
tage of expressing nitrogen clearance as a func-
tion of expired volume rather than as a function
of time is that it excludes the variable factor of
ventilation rate.
Apparently the initial rapid decline in expired
nitrogen concentration represents the clearance of
well-ventilated areas. This is followed by a
flattening out of the curve of nitrogen dilution in
2-
I
FIG. 5. GROUPI-TIME REQUIRED To REDUCE END-EXPIRED NITROGEN CONCENTRATION TO 1 PER CENT,DURING OXYGENBREATHING
Center line represents mean value for 33 subj ects.Cross-hatching represents one standard deviation fromthe mean.
an asymptotic fashion. Roughly, the second halfof the seven minute period of oxygen breathing ischaracterized by a slow decline of end-expired ni-trogen levels. The mean values for FAN, - FIN,,at the end of the fourth minute and at the end ofthe seventh minute, and the difference between
TABLE v
Behavior of nitrogen decline in last three minutes of washout-Groups I, II, and III combined; 49 subjects
FAN -FiN2*FAN2 -FIN2* FAN2 -FiN,* ha
at 4th at 7th forcedminute minute Alt expiration A'l
Mean 0.72 0.47 0.25 0.53 0.06S. D. 0.34 0.16 0.29 0.18 0.07
*FAN2 -FIN2 = Per cent N2 in expired gas minus percent N, in inspired gas.
f A' = Difference between nitrogen concentrations atend of fourth and seventh minutes.
tA" = Difference between nitrogen concentrations pro-duced by final forced expiration and the preceding ordinarybreath at end of seventh minute.
311
I
0

AARONA. COHEN, ALLAN HEMINGWAY,AND CLAIRE HEMINGWAY
1.5%
1.0'
0.54
N- N
_._. ". *a *-._ -
i~ ~ ~ ~ ~ ~ ~ ~~~.foIN~~ ~ ~ ~ ~ ~~~~~~~1-
-W 4""MIN. 7D-iNFIG. 6. SCHEMATIC REPRESENTATIONOF DECLINE OF
NITROGEN CONCENTRATIONFROM FOURTH TO SEVENTHMINUTE OF OXYGENBREATHING, FOLLOWEDBY A MAXI-MUMEXPIRATION-FORTY-NINE SUBJECTS
Heavy dashed center line represents mean value. Outerdashed lines represent one standard deviation from themean.
these two values, are shown in Table V and inFigure 6.
The final characteristic of these normal washoutcurves is the small change in nitrogen concentra-tion produced by a maximal forced expiration atthe conclusion of seven minutes of quiet breathingof oxygen. The mean end-expired nitrogen con-
centration in the terminal forced expirationreached by 49 subjects is 0.53 per cent + 0.18(S. D.), expressed at FAN, - FIN,. The mean
increment between this and the last preceding ordi-nary breath is 0.06 per cent + 0.07 (S. D.) as
shown in Table V. Sixteen out of 49 subjects hadno detectable rise; 20 additional subjects had a risenot exceeding 0.1 per cent above the last precedingordinary breath. Ninety-four per cent of the sub-
V 0.25 0.5 075 10%FIG. 7. DIFFERENCE BETWEENEND-TIDAL NITROGEN
CONCENTRATIONOF LAST TIDAL BREATH AT END OF
SEVEN MINUTES OXYGENBREATHINGAND THE NITROGENCONCENTRATION PRODUCEDBY THE TERMINAL FORCEDEXPIRATION-FORTY-NINE SUBJECTS
jects had no increment greater than 0.2 per centnitrogen (Figure 7). The greatest increases pro-duced by the forced expirations were, respectively,0.23 per cent in each of two women, and 0.35 percent in one man. No adequate explanation forthese three aberrant values could be found on re-view either of the experimental data or of thehealth records and chest radiographs of thesestudents.
DISCUSSION
It is obvious that the initial or rapidly decliningpart of the nitrogen displacement curve depicts awell-ventilated space or series of spaces. Thelater, slowly falling, portions of the curve repre-sent probably a combination of nitrogen displace-ment from poorly-ventilated alveolar regions andthe diffusion of nitrogen from the tissues via thepulmonary circulation into the alveolar gas wherethe nitrogen tension is lower. How much each ofthese factors enter into the situation is unknown.The small terminal rise in nitrogen produced byforced expiration would indicate that completeintrapulmonary mixing of oxygen and nitrogenmay not occur even after seven minutes in normalpersons. This finding confirms the conclusions ofFowler, Cornish, and Kety (7, 26).
Calculation of the ventilation in terms of alveo-lar ventilation involves assumptions not only ofconstancy of tidal volumes, dead space, and FRC,but also of the validity of a single, forced expira-tion sample as a true representation of alveolarcarbon dioxide. It will be noted in Table II thatin the Group I cases the scatter of VA (1 per cent)leads to a coefficient of variation of 27 per cent.The above mentioned variables may be partiallycircumvented if analyses are limited to VE (1 percent), where the coefficient of variation is 22.7per cent. Using the ratio VE (1 per cent)/FRCreduces the scatter still further to a coefficient ofvariation of 11.7 per cent. Moreover, it allowscomparison among individuals with different lungsizes and rates of ventilation. Therefore, the ra-tio can be considered as a useful index of intrapul-monary mixing. Expressing this ratio as VA (1per cent)/FRC does not reduce scatter (coeffi-cient of variation, 12.6 per cent).
A second useful and easily determined index ofintrapulmonary mixing is the presence and sizeof the increment in nitrogen produced by the final
312
NITROGEN DISPLACEMENTBY OXYGENFROM NORMALLUNGS
forced expiration. This gives, at a glance, a meas-
ure of uniformity of ventilation and indicates thepatency of airway communication with poorlyventilated spaces which can be partially emptied byforceful expiration (27). The magnitude of thisrise in normal subjects has not been given muchattention by previous investigators in connectionwith prolonged nitrogen washout periods, althoughFowler has studied this point by the single-breathnitrogen dilution technique (26).
Luft, Roorbach, and MacQuigg (13), whoseexperimental procedure resembled that reportedhere, terminated their nitrogen washout tests whenthe end-expired nitrogen reached 1.0 per cent or
1.4 per cent, without finishing with a forced ex-
piration. These investigators implied that con-
tinued fall in nitrogen below 1 per cent can beattributed to diffusion of the gas from the bodytissues. They did not correct, apparently, for in-spired nitrogen in the cylinder oxygen. Theyemphasized the concept of "clearance equivalent,"which has been adopted here; namely, the totalventilation to the end-point as the number of re-
placements of FRC (or the amount of ventilationto clear one volume equivalent to FRC to 1 per
cent). This expression eliminates such variablefactors as respiratory rate, functional residual ca-
pacity, and alveolar ventilation, and reduces totalventilation (cumulative expired volume) to figureswhich can be used to compare one individual toanother. For 25 normal males and 12 normalfemales, in the seated position, ranging in age
from 12 to 64 years, Luft and associates found themean ventilation to 1 per cent [VE (1 per cent)in our terminology] to be 44.7 liters in the malesand 37.8 liters in the females. Their mean "clear-ance equivalents" [VE (1 per cent)/FRC in our
terminology] were 13.3 for the males and 13.9 forthe females. These values are greater than thosein the present report probably because the initialFRC of Luft's subjects was larger as a result ofthe seated posture, and because of lack of correc-
tion for inspired nitrogen.
SUMMARY
1. A method for studying the course of intra-pulmonary nitrogen dilution during oxygen breath-ing by means of a nitrogen meter was incorporatedinto a well-known procedure for open circuit
measurement of functional residual capacity. Thismethod is simple enough to be used clinically.
2. In a group of fifty normal recumbent youngadults the course of the nitrogen dilution was fol-lowed for seven minutes, and terminated by aforced expiration.
3. Values are given for clearance ventilation to1 per cent end-expired nitrogen (minus inspirednitrogen), expressed both for total ventilation andalveolar ventilation. These values were found todepend largely upon the size of the functionalresidual capacity. Clearance equivalent ratios aregiven which allow comparisons among individualswith different functional residual capacities.
4. The characteristics of the latter half of thewashout curves, after the 1 per cent level of nitro-gen has been passed, have been investigated withparticular emphasis on the usefulness of the finalforced expiration.
5. The procedure is a practical method for de-tecting the presence of uneven alveolar ventilation.
ACKNOWLEDGMENT
The authors are indebted to Dr. David Salkin forhelpful criticism and support
REFERENCES
1. Rauwerda, P. E. Unequal ventilation of differentparts of the lung and the determination of cardiacoutput. Thesis, Groningen, Groningen Univ., 1946.
2. Darling, R. C., Cournand, A., Mansfield, J. S., andRichards, D. W., Jr. Studies on the intrapul-monary mixture of gases. I. Nitrogen eliminationfrom blood and body tissues during high oxygenbreathing. J. clin. Invest. 1940, 19, 591.
3. Cournand, A., Baldwin, E. DeF., Darling, R. C., andRichards, D. W., Jr. Studies on intrapulmonarymixture of gases. IV. The significance of thepulmonary emptying rate and a simplified opencircuit measurement of residual air. J. clin. Invest.1941, 20, 681.
4. Darling, R. C., Cournand, A., and Richards, D. W.,Jr. Studies on intrapulmonary mixture of gases.V. Forms of inadequate ventilation in normaland emphysematous lungs, analyzed by means ofbreathing pure oxygen. J. clin. Invest. 1944, 23,55.
5. Lilly, J. C. Studies on the mixing of gases withinthe respiratory system with a new type nitrogenmeter. Fed. Proc. 1946, 5, 64.
6. Robertson, J. S., Siri, W. E., and Jones, H. B. Lungventilation patterns determined by analysis of
313
AARONA. COHEN, ALLAN HEMINGWAY,AND CLAIRE HEMINGWAY
nitrogen elimination rates; use of the massspectrometer as a continuous gas analyzer. J.clin. Invest. 1950, 29, 577.
7. Fowler, W. S., Cornish, E. R., Jr., and Kety, S. S.Lung function studies. VIII. Analysis of alveo-lar ventilation by pulmonary N2 clearance curves.J. clin. Invest. 1952, 31, 40.
8. Bateman, J. B. Studies of lung volume and intra-pulmonary mixing. Nitrogen clearance curves:Apparent respiratory dead space and its significance.J. appl. Physiol. 1950, 3, 143.
9. Boothby, W. M., Lundin, G., and Helmholz, H. F.,Jr. A gaseous nitrogen elimination test to deter-mine pulmonary efficiency. Proc. Soc. exp. Biol.(N. Y.) 1948, 67, 558.
10. Wolfe, W. A., and Carlson, L. D. Studies of pul-monary capacity and mixing with the N2 meter.J. clin. Invest. 1950, 29, 1568.
11. Colldahl, H., and Lundin, G. Ventilatory studies ofthe lungs in asthma. Acta allerg. (Kbh.) 1952, 5,37.
12. Becklake, M. B. New index of intrapulmonary mix-ture of inspired air. Thorax 1952, 7, 111.
13. Luft, U. C., Roorbach, E. H., and MacQuigg, R. E.Pulmonary nitrogen clearance as a criterion ofventilatory efficiency. Amer. Rev. Tuberc. 1955,72, 465.
14. Peters, J. P., and Van Slyke, D. D. QuantitativeClinical Chemistry, Volume II, Methods. Balti-more, The Williams & Wilkins Co., 1932.
15. Scholander, P. F. Analyzer for accurate estimationof respiratory gases in one-half cubic centimetersamples. J. biol. Chem. 1947, 167, 235.
16. Cournand, A., Yarmush, I. G., and Riley, R. L. In-fluence of body size on gaseous nitrogen elimina-tion during high oxygen breathing. Proc. Soc.exp. Biol. (N. Y.) 1941, 48, 280.
17. Methods in Medical Research, J. H. Comroe, Jr., Ed.Chicago, Year Book Publishers, 1950, vol. 2, p.200.
18. Standardization of definitions and symbols in re-spiratory physiology. Fed. Proc. 1950, 9, 602.
19. Kaltreider, N. L., Fray, W. W., and Hyde, H. V. Z.The effect of age on the total pulmonary capacityand its subdivisions. Amer. Rev. Tuberc. 1938, 37,662.
20. Needham, C. D., Rogan, M. C., and McDonald, I.Normal standards for lung volumes, intrapulmo-nary gas-mixing, and maximum breathing ca-pacity. Thorax 1954, 9, 313.
21. Whitfield, A. G. W., Waterhouse, J. A. H., andArnott, W. M. The total lung volume and itssubdivisions. A study in physiological norms.I. Basic data. Brit. J. soc. Med. 1950, 4, 1.
22. Whitfield, A. G. W., Waterhouse, J. A. H., andArnott, W. M. The total lung volume and itssubdivisions. A study in physiological norms.III. Correlation with other anthropometric data.Brit. J. soc. Med. 1950, 4, 113.
23. Bateman, J. B. Studies of lung capacities and intra-pulmonary mixing; normal lung capacities. J.appl. Physiol. 1950, 3, 133.
24. Gray, J. S., Grodins, F. S., and Carter, E. T. Al-veolar and total ventilation and the dead spaceproblem. J. appl. Physiol. 1956, 9, 307.
25. Rossier, P. H., and Buhlmann, A. The respiratorydead space. Physiol. Rev. 1955, 35, 860.
26. Fowler, W. S. Lung function studies. III. Unevenpulmonary ventilation in normal subjects and inpatients with pulmonary disease. J. appl. Physiol.1949, 2, 283.
27. Bedell, G. N., Marshall, R., DuBois, A. B., and Com-roe, J. H., Jr. Plethysmographic determination ofthe volume of gas trapped in the lungs. J. clin.Invest. 1956, 35, 664.
314
Related Documents