Luminescence dating of deltaic deposits from eastern Crete, Greece: Geoarchaeological implications Nikolaos Zacharias a, ⁎, Yannis Bassiakos a , Barbara Hayden b , Katie Theodorakopoulou a,c , Christodoulos T. Michael a a Laboratory of Archaeometry, Institute of Materials Science, N.C.S.R. Demokritos,15 310 Ag. Paraskevi, Attiki, Greece b Mediterranean Section, University of Pennsylvania Museum of Archaeology and Anthropology, 3405 Woodland Walk Philadelphia, PA 19104-6208, USA c Department of Geography, Harokopio University of Athens, 70 E. Venizelou Str.,17 671 Athens, Greece abstract article info Article history: Accepted 30 November 2008 Available online 12 February 2009 Keywords: Luminescence dating OSL Holocene Crete PIPS a-counting XRF analysis Within the framework of an ongoing geoarchaeological project undertaken in the area of Istron, Gulf of Mirabello, eastern Crete, sediment dating using optical stimulated luminescence (OSL) was employed to provide information on the landscape evolution of the area. In addition to detailed field-survey, geophysical prospection, and archaeological excavations, drilling of five boreholes provided undisturbed and light protected sediments to depths up to 12 m below sea level. OSL dating using blue-light stimulation was undertaken on pure quartz grain samples from two cores. In addition, chemical and spectrometric studies on selected deltaic deposits are enlightening for paleoenvironmental differentiations that prevailed at neighboring sites. The reported ages, with a span of 770 to ca. 15,000 a, along with the results of field work and chemical analysis provide insight for landscape evolution, influenced mainly by environmental changes at an area occupied by the man since Neolithic onwards. © 2009 Elsevier B.V. All rights reserved. 1. Introduction The Istron area is a shore-side valley facing the Aegean Sea in the west-central part of the Mirabello Gulf, eastern Crete (Fig. 1). Because of its nodal position in the center of the eastern Mediterranean basin, and its cultural relevance, the region has attracted archaeological interest since the early 1900s. At a limestone promontory known as Priniatikos Pyrgos in the center of a broad embayment, a few ancient architectural remains were exposed and observed at that time. The first excavations were conducted by American archaeologists of the University of Pennsylvania Museum in 1912. They found a Bronze Age coastal town, accompanied by high-quality pottery of Early to Late Minoan date. Historical occupation was represented by abundant Roman pottery (Hall 1914, 1915). A 30-year fieldwork project, named The Vrokastro Regional Survey Project (initiated in 1986) in the region recently concluded that the site of Priniatikos Pyrgos was the regional template for the cultural development of west-central Mirabello in both prehistoric and historical epochs. This was based on its size, complexity, range and quality of artifacts found, and its function as the primary harbor or “gateway” community of the region (Hayden et al., 2004). In 2005, a new exploratory excavation program began on the promontory, directed by the University of Pennsylvania Museum and the Greek Archaeological Service, now continued under the co-direction of the Irish Archae- ological School. Well-preserved architectural remains and pottery dating from early 3rd millennium BC to the Byzantine and Venetian (10th–17th centuries AD) periods were discovered. Prehistoric (Min- oan) ceramic kilns and later cobble-build circular structures that might be smelting furnaces for iron production were also recovered, increasing the likelihood that the site was a center of craft specialization for both ceramic and, later, iron production (Hayden et al., 2006). A concise report on the Holocene evolution of the coastal zone along the course of the Istron River is given by G. Postma, contained as appendix 6 in Hayden et al., 2004. Postma, in the absence of any naturally exposed layers dating from pre-Roman times, examines morphologically the upper Holocenic layers only, and concludes that the encountered sedimentary facies seem to be not ‘typical’ deltaic, they are more characteristic for fluvial deposition in a fan delta. He also accepts a Late Quaternary northward tilting of the whole of eastern Crete as inferred from the tilted Pleistocene terrace deposits. The drainage system of the area mainly consists of the Istron River catchment with perennial flow. Two main geomorphic units can be distinguished in the area under study; a) the coast strip which includes the interjected promontories (Fig. 1) and b) the Istron River valley along with its deltaic deposits. The limestone promontory of Priniatikos Pyrgos (with its impor- tant archaeological finds) is surrounded from its eastern, southern and western sides by the sediments of the near-shore plain, the topmost of them exposed, and their overlying recent soils intensively cultivated. Geomorphology 109 (2009) 46–53 ⁎ Corresponding author. E-mail address: [email protected] (N. Zacharias). 0169-555X/$ – see front matter © 2009 Elsevier B.V. All rights reserved. doi:10.1016/j.geomorph.2009.02.002 Contents lists available at ScienceDirect Geomorphology journal homepage: www.elsevier.com/locate/geomorph

Welcome message from author
This document is posted to help you gain knowledge. Please leave a comment to let me know what you think about it! Share it to your friends and learn new things together.
Transcript
Geomorphology 109 (2009) 46–53
Contents lists available at ScienceDirect
Geomorphology
j ourna l homepage: www.e lsev ie r.com/ locate /geomorph
Luminescence dating of deltaic deposits from eastern Crete, Greece:Geoarchaeological implications
Nikolaos Zacharias a,⁎, Yannis Bassiakos a, Barbara Hayden b,Katie Theodorakopoulou a,c, Christodoulos T. Michael a
a Laboratory of Archaeometry, Institute of Materials Science, N.C.S.R. Demokritos, 15 310 Ag. Paraskevi, Attiki, Greeceb Mediterranean Section, University of Pennsylvania Museum of Archaeology and Anthropology, 3405 Woodland Walk Philadelphia, PA 19104-6208, USAc Department of Geography, Harokopio University of Athens, 70 E. Venizelou Str., 17 671 Athens, Greece
⁎ Corresponding author.E-mail address: [email protected] (N. Za
0169-555X/$ – see front matter © 2009 Elsevier B.V. Adoi:10.1016/j.geomorph.2009.02.002
a b s t r a c t
a r t i c l e i n f oArticle history:
Within the framework of an o Accepted 30 November 2008Available online 12 February 2009Keywords:Luminescence datingOSLHoloceneCretePIPS a-countingXRF analysis
ngoing geoarchaeological project undertaken in the area of Istron, Gulf ofMirabello,eastern Crete, sediment dating using optical stimulated luminescence (OSL) was employed to provideinformation on the landscape evolution of the area. In addition to detailed field-survey, geophysical prospection,and archaeological excavations, drilling of five boreholes provided undisturbed and light protected sediments todepths up to 12 m below sea level. OSL dating using blue-light stimulationwas undertaken on pure quartz grainsamples from two cores. In addition, chemical and spectrometric studies on selected deltaic deposits areenlightening for paleoenvironmental differentiations that prevailed at neighboring sites. The reported ages, witha span of 770 to ca. 15,000 a, along with the results of field work and chemical analysis provide insight forlandscape evolution, influencedmainly by environmental changes at an area occupied by theman since Neolithiconwards.
© 2009 Elsevier B.V. All rights reserved.
1. Introduction
The Istron area is a shore-side valley facing the Aegean Sea in thewest-central part of theMirabello Gulf, eastern Crete (Fig.1). Because ofits nodal position in the center of the eastern Mediterranean basin, andits cultural relevance, the region has attracted archaeological interestsince the early 1900s. At a limestone promontory known as PriniatikosPyrgos in the center of a broad embayment, a few ancient architecturalremains were exposed and observed at that time. The first excavationswere conducted by American archaeologists of the University ofPennsylvania Museum in 1912. They found a Bronze Age coastal town,accompanied by high-quality pottery of Early to Late Minoan date.Historical occupationwas represented byabundant Romanpottery (Hall1914, 1915). A 30-year fieldwork project, named The Vrokastro RegionalSurvey Project (initiated in 1986) in the region recently concluded thatthe site of Priniatikos Pyrgos was the regional template for the culturaldevelopmentofwest-centralMirabello in bothprehistoric andhistoricalepochs. This was based on its size, complexity, range and quality ofartifacts found, and its function as the primary harbor or “gateway”community of the region (Hayden et al., 2004). In 2005, a newexploratory excavation program began on the promontory, directed bythe University of Pennsylvania Museum and the Greek Archaeological
charias).
ll rights reserved.
Service, now continued under the co-direction of the Irish Archae-ological School. Well-preserved architectural remains and potterydating from early 3rd millennium BC to the Byzantine and Venetian(10th–17th centuries AD) periods were discovered. Prehistoric (Min-oan) ceramic kilns and later cobble-build circular structures that mightbe smelting furnaces for ironproductionwere also recovered, increasingthe likelihood that the site was a center of craft specialization for bothceramic and, later, iron production (Hayden et al., 2006).
A concise report on the Holocene evolution of the coastal zone alongthe course of the Istron River is given by G. Postma, contained asappendix 6 in Hayden et al., 2004. Postma, in the absence of anynaturally exposed layers dating from pre-Roman times, examinesmorphologically the upper Holocenic layers only, and concludes thatthe encountered sedimentary facies seem to be not ‘typical’ deltaic, theyare more characteristic for fluvial deposition in a fan delta. He alsoaccepts a LateQuaternarynorthward tiltingof thewholeof easternCreteas inferred from the tilted Pleistocene terrace deposits.
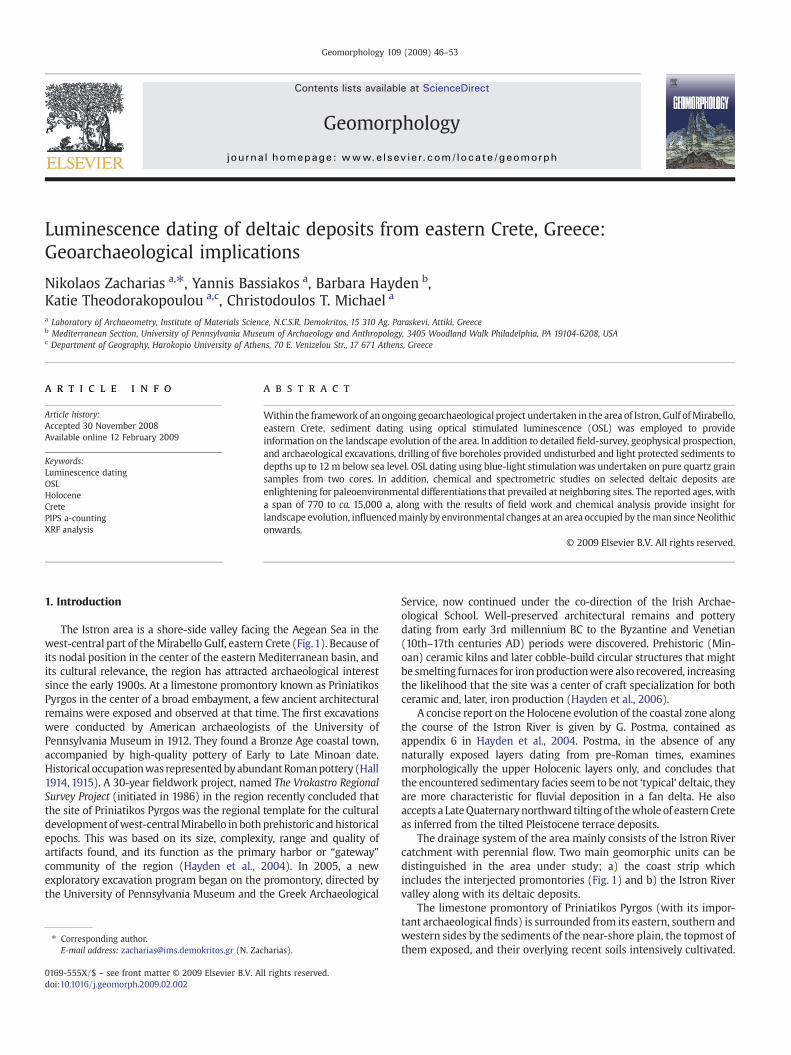
The drainage system of the area mainly consists of the Istron Rivercatchment with perennial flow. Two main geomorphic units can bedistinguished in the area under study; a) the coast strip whichincludes the interjected promontories (Fig. 1) and b) the Istron Rivervalley along with its deltaic deposits.
The limestone promontory of Priniatikos Pyrgos (with its impor-tant archaeological finds) is surrounded from its eastern, southern andwestern sides by the sediments of the near-shore plain, the topmost ofthem exposed, and their overlying recent soils intensively cultivated.
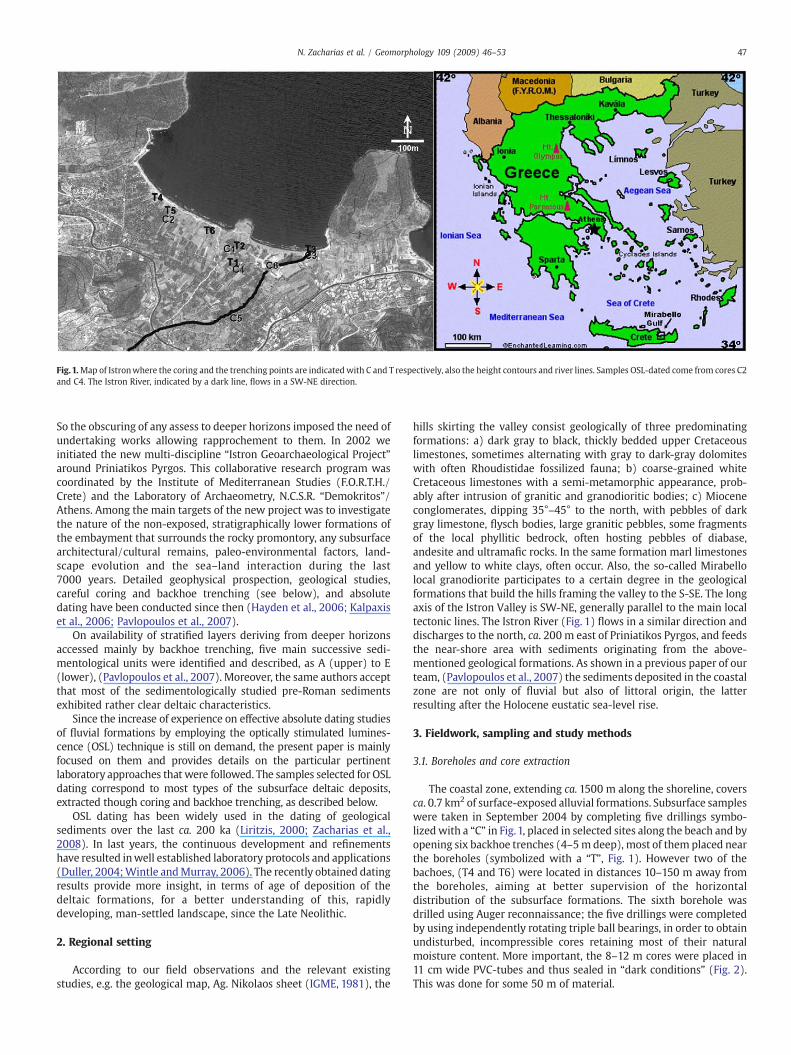
Fig.1.Map of Istronwhere the coring and the trenching points are indicatedwith C and T respectively, also the height contours and river lines. Samples OSL-dated come from cores C2and C4. The Istron River, indicated by a dark line, flows in a SW-NE direction.
47N. Zacharias et al. / Geomorphology 109 (2009) 46–53
So the obscuring of any assess to deeper horizons imposed the need ofundertaking works allowing rapprochement to them. In 2002 weinitiated the new multi-discipline “Istron Geoarchaeological Project”around Priniatikos Pyrgos. This collaborative research program wascoordinated by the Institute of Mediterranean Studies (F.O.R.T.H./Crete) and the Laboratory of Archaeometry, N.C.S.R. “Demokritos”/Athens. Among the main targets of the new project was to investigatethe nature of the non-exposed, stratigraphically lower formations ofthe embayment that surrounds the rocky promontory, any subsurfacearchitectural/cultural remains, paleo-environmental factors, land-scape evolution and the sea–land interaction during the last7000 years. Detailed geophysical prospection, geological studies,careful coring and backhoe trenching (see below), and absolutedating have been conducted since then (Hayden et al., 2006; Kalpaxiset al., 2006; Pavlopoulos et al., 2007).
On availability of stratified layers deriving from deeper horizonsaccessed mainly by backhoe trenching, five main successive sedi-mentological units were identified and described, as A (upper) to E(lower), (Pavlopoulos et al., 2007). Moreover, the same authors acceptthat most of the sedimentologically studied pre-Roman sedimentsexhibited rather clear deltaic characteristics.
Since the increase of experience on effective absolute dating studiesof fluvial formations by employing the optically stimulated lumines-cence (OSL) technique is still on demand, the present paper is mainlyfocused on them and provides details on the particular pertinentlaboratory approaches that were followed. The samples selected for OSLdating correspond to most types of the subsurface deltaic deposits,extracted though coring and backhoe trenching, as described below.
OSL dating has been widely used in the dating of geologicalsediments over the last ca. 200 ka (Liritzis, 2000; Zacharias et al.,2008). In last years, the continuous development and refinementshave resulted inwell established laboratory protocols and applications(Duller, 2004;Wintle andMurray, 2006). The recently obtained datingresults provide more insight, in terms of age of deposition of thedeltaic formations, for a better understanding of this, rapidlydeveloping, man-settled landscape, since the Late Neolithic.
2. Regional setting
According to our field observations and the relevant existingstudies, e.g. the geological map, Ag. Nikolaos sheet (IGME, 1981), the
hills skirting the valley consist geologically of three predominatingformations: a) dark gray to black, thickly bedded upper Cretaceouslimestones, sometimes alternating with gray to dark-gray dolomiteswith often Rhoudistidae fossilized fauna; b) coarse-grained whiteCretaceous limestones with a semi-metamorphic appearance, prob-ably after intrusion of granitic and granodioritic bodies; c) Mioceneconglomerates, dipping 35°–45° to the north, with pebbles of darkgray limestone, flysch bodies, large granitic pebbles, some fragmentsof the local phyllitic bedrock, often hosting pebbles of diabase,andesite and ultramafic rocks. In the same formation marl limestonesand yellow to white clays, often occur. Also, the so-called Mirabellolocal granodiorite participates to a certain degree in the geologicalformations that build the hills framing the valley to the S-SE. The longaxis of the Istron Valley is SW-NE, generally parallel to the main localtectonic lines. The Istron River (Fig. 1) flows in a similar direction anddischarges to the north, ca. 200 m east of Priniatikos Pyrgos, and feedsthe near-shore area with sediments originating from the above-mentioned geological formations. As shown in a previous paper of ourteam, (Pavlopoulos et al., 2007) the sediments deposited in the coastalzone are not only of fluvial but also of littoral origin, the latterresulting after the Holocene eustatic sea-level rise.
3. Fieldwork, sampling and study methods
3.1. Boreholes and core extraction
The coastal zone, extending ca. 1500 m along the shoreline, coversca. 0.7 km2 of surface-exposed alluvial formations. Subsurface sampleswere taken in September 2004 by completing five drillings symbo-lizedwith a “C” in Fig.1, placed in selected sites along the beach and byopening six backhoe trenches (4–5m deep), most of them placed nearthe boreholes (symbolized with a “T”, Fig. 1). However two of thebachoes, (T4 and T6) were located in distances 10–150 m away fromthe boreholes, aiming at better supervision of the horizontaldistribution of the subsurface formations. The sixth borehole wasdrilled using Auger reconnaissance; the five drillings were completedby using independently rotating triple ball bearings, in order to obtainundisturbed, incompressible cores retaining most of their naturalmoisture content. More important, the 8–12 m cores were placed in11 cm wide PVC-tubes and thus sealed in “dark conditions” (Fig. 2).This was done for some 50 m of material.
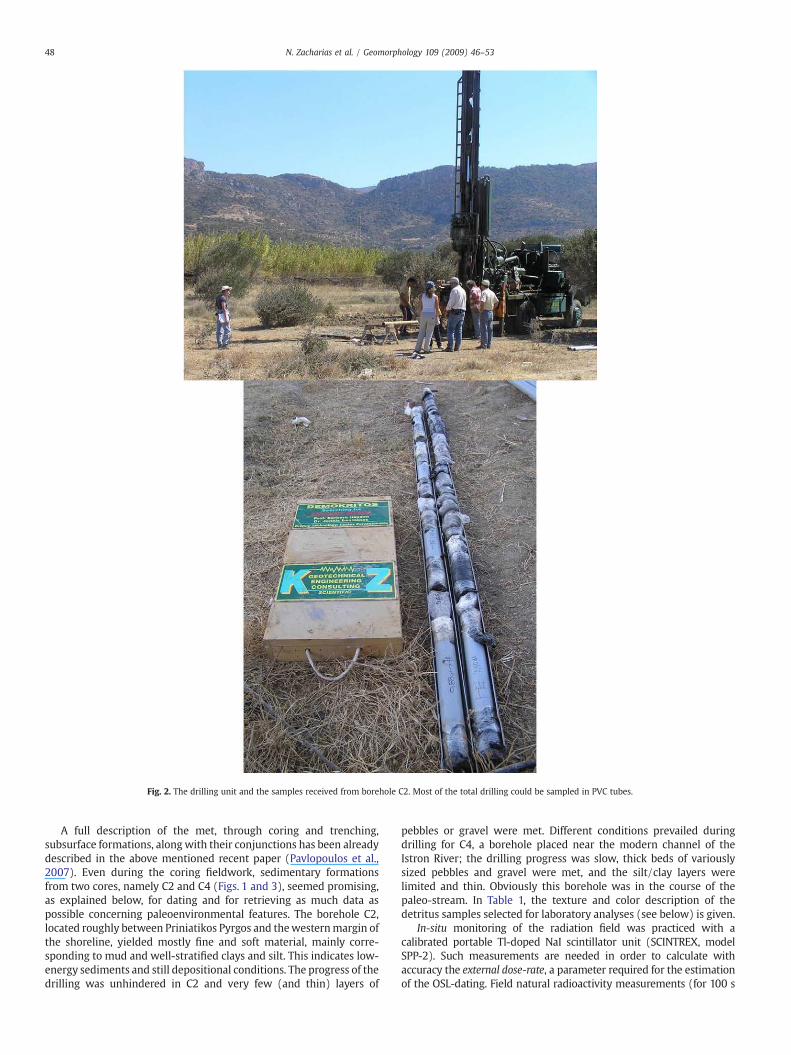
Fig. 2. The drilling unit and the samples received from borehole C2. Most of the total drilling could be sampled in PVC tubes.
48 N. Zacharias et al. / Geomorphology 109 (2009) 46–53
A full description of the met, through coring and trenching,subsurface formations, along with their conjunctions has been alreadydescribed in the above mentioned recent paper (Pavlopoulos et al.,2007). Even during the coring fieldwork, sedimentary formationsfrom two cores, namely C2 and C4 (Figs. 1 and 3), seemed promising,as explained below, for dating and for retrieving as much data aspossible concerning paleoenvironmental features. The borehole C2,located roughly between Priniatikos Pyrgos and thewesternmargin ofthe shoreline, yielded mostly fine and soft material, mainly corre-sponding to mud and well-stratified clays and silt. This indicates low-energy sediments and still depositional conditions. The progress of thedrilling was unhindered in C2 and very few (and thin) layers of
pebbles or gravel were met. Different conditions prevailed duringdrilling for C4, a borehole placed near the modern channel of theIstron River; the drilling progress was slow, thick beds of variouslysized pebbles and gravel were met, and the silt/clay layers werelimited and thin. Obviously this borehole was in the course of thepaleo-stream. In Table 1, the texture and color description of thedetritus samples selected for laboratory analyses (see below) is given.
In-situ monitoring of the radiation field was practiced with acalibrated portable Tl-doped NaI scintillator unit (SCINTREX, modelSPP-2). Such measurements are needed in order to calculate withaccuracy the external dose-rate, a parameter required for the estimationof the OSL-dating. Field natural radioactivity measurements (for 100 s
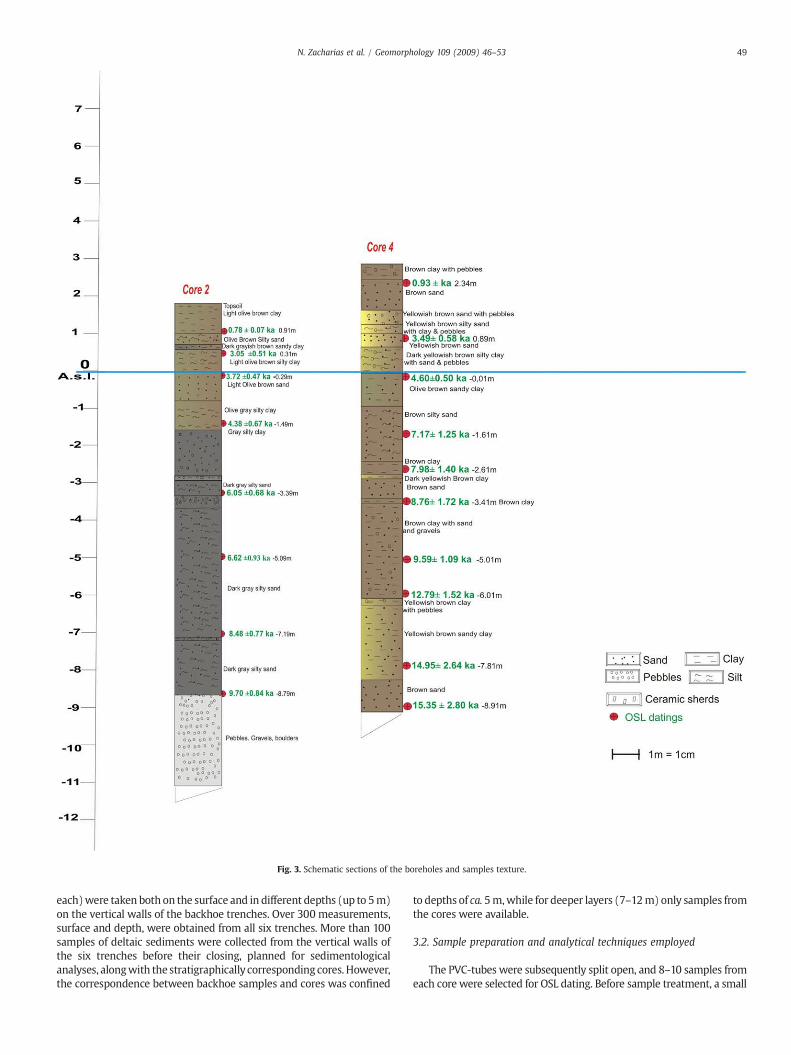
Fig. 3. Schematic sections of the boreholes and samples texture.
49N. Zacharias et al. / Geomorphology 109 (2009) 46–53
each)were taken both on the surface and in different depths (up to 5m)on the vertical walls of the backhoe trenches. Over 300 measurements,surface and depth, were obtained from all six trenches. More than 100samples of deltaic sediments were collected from the vertical walls ofthe six trenches before their closing, planned for sedimentologicalanalyses, alongwith the stratigraphically corresponding cores. However,the correspondence between backhoe samples and cores was confined
to depths of ca. 5m,while for deeper layers (7–12m) only samples fromthe cores were available.
3.2. Sample preparation and analytical techniques employed
The PVC-tubes were subsequently split open, and 8–10 samples fromeach core were selected for OSL dating. Before sample treatment, a small
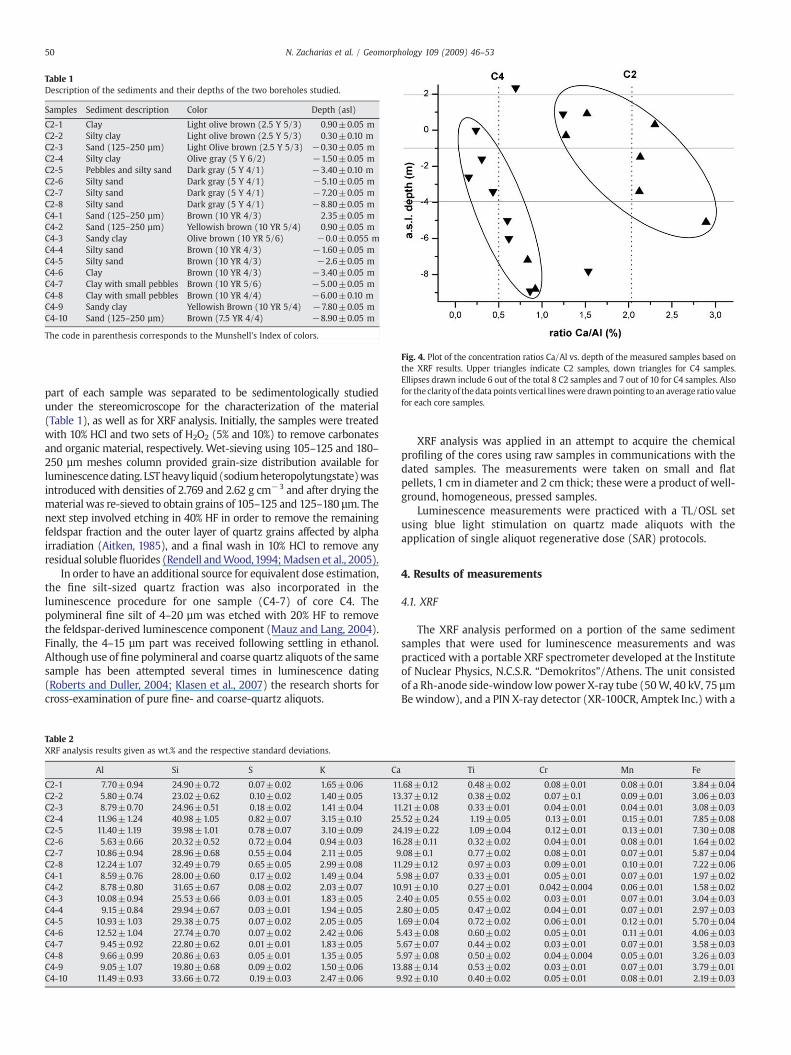
Table 1Description of the sediments and their depths of the two boreholes studied.
Samples Sediment description Color Depth (asl)
C2-1 Clay Light olive brown (2.5 Y 5/3) 0.90±0.05 mC2-2 Silty clay Light olive brown (2.5 Y 5/3) 0.30±0.10 mC2-3 Sand (125–250 µm) Light Olive brown (2.5 Y 5/3) −0.30±0.05 mC2-4 Silty clay Olive gray (5 Y 6/2) −1.50±0.05 mC2-5 Pebbles and silty sand Dark gray (5 Y 4/1) −3.40±0.10 mC2-6 Silty sand Dark gray (5 Y 4/1) −5.10±0.05 mC2-7 Silty sand Dark gray (5 Y 4/1) −7.20±0.05 mC2-8 Silty sand Dark gray (5 Y 4/1) −8.80±0.05 mC4-1 Sand (125–250 µm) Brown (10 YR 4/3) 2.35±0.05 mC4-2 Sand (125–250 µm) Yellowish brown (10 YR 5/4) 0.90±0.05 mC4-3 Sandy clay Olive brown (10 YR 5/6) −0.0±0.055 mC4-4 Silty sand Brown (10 YR 4/3) −1.60±0.05 mC4-5 Silty sand Brown (10 YR 4/3) −2.6±0.05 mC4-6 Clay Brown (10 YR 4/3) −3.40±0.05 mC4-7 Clay with small pebbles Brown (10 YR 5/6) −5.00±0.05 mC4-8 Clay with small pebbles Brown (10 YR 4/4) −6.00±0.10 mC4-9 Sandy clay Yellowish Brown (10 YR 5/4) −7.80±0.05 mC4-10 Sand (125–250 µm) Brown (7.5 YR 4/4) −8.90±0.05 m
The code in parenthesis corresponds to the Munshell's Index of colors.
Fig. 4. Plot of the concentration ratios Ca/Al vs. depth of the measured samples based onthe XRF results. Upper triangles indicate C2 samples, down triangles for C4 samples.Ellipses drawn include 6 out of the total 8 C2 samples and 7 out of 10 for C4 samples. Alsofor the clarity of thedata points vertical lineswere drawnpointing to an average ratio valuefor each core samples.
50 N. Zacharias et al. / Geomorphology 109 (2009) 46–53
part of each sample was separated to be sedimentologically studiedunder the stereomicroscope for the characterization of the material(Table 1), as well as for XRF analysis. Initially, the samples were treatedwith 10% HCl and two sets of H2O2 (5% and 10%) to remove carbonatesand organic material, respectively. Wet-sieving using 105–125 and 180–250 µm meshes column provided grain-size distribution available forluminescencedating. LSTheavy liquid (sodiumheteropolytungstate)wasintroduced with densities of 2.769 and 2.62 g cm−3 and after drying thematerial was re-sieved to obtain grains of 105–125 and 125–180 µm. Thenext step involved etching in 40% HF in order to remove the remainingfeldspar fraction and the outer layer of quartz grains affected by alphairradiation (Aitken, 1985), and a final wash in 10% HCl to remove anyresidual solublefluorides (Rendell andWood,1994;Madsen et al., 2005).
In order to have an additional source for equivalent dose estimation,the fine silt-sized quartz fraction was also incorporated in theluminescence procedure for one sample (C4-7) of core C4. Thepolymineral fine silt of 4–20 µm was etched with 20% HF to removethe feldspar-derived luminescence component (Mauz and Lang, 2004).Finally, the 4–15 µm part was received following settling in ethanol.Although use of fine polymineral and coarse quartz aliquots of the samesample has been attempted several times in luminescence dating(Roberts and Duller, 2004; Klasen et al., 2007) the research shorts forcross-examination of pure fine- and coarse-quartz aliquots.
Table 2XRF analysis results given as wt.% and the respective standard deviations.
Al Si S K Ca
C2-1 7.70±0.94 24.90±0.72 0.07±0.02 1.65±0.06 11C2-2 5.80±0.74 23.02±0.62 0.10±0.02 1.40±0.05 13C2-3 8.79±0.70 24.96±0.51 0.18±0.02 1.41±0.04 11C2-4 11.96±1.24 40.98±1.05 0.82±0.07 3.15±0.10 25C2-5 11.40±1.19 39.98±1.01 0.78±0.07 3.10±0.09 24C2-6 5.63±0.66 20.32±0.52 0.72±0.04 0.94±0.03 16C2-7 10.86±0.94 28.96±0.68 0.55±0.04 2.11±0.05 9C2-8 12.24±1.07 32.49±0.79 0.65±0.05 2.99±0.08 11C4-1 8.59±0.76 28.00±0.60 0.17±0.02 1.49±0.04 5C4-2 8.78±0.80 31.65±0.67 0.08±0.02 2.03±0.07 10C4-3 10.08±0.94 25.53±0.66 0.03±0.01 1.83±0.05 2C4-4 9.15±0.84 29.94±0.67 0.03±0.01 1.94±0.05 2C4-5 10.93±1.03 29.38±0.75 0.07±0.02 2.05±0.05 1C4-6 12.52±1.04 27.74±0.70 0.07±0.02 2.42±0.06 5C4-7 9.45±0.92 22.80±0.62 0.01±0.01 1.83±0.05 5C4-8 9.66±0.99 20.86±0.63 0.05±0.01 1.35±0.05 5C4-9 9.05±1.07 19.80±0.68 0.09±0.02 1.50±0.06 13C4-10 11.49±0.93 33.66±0.72 0.19±0.03 2.47±0.06 9
XRF analysis was applied in an attempt to acquire the chemicalprofiling of the cores using raw samples in communications with thedated samples. The measurements were taken on small and flatpellets, 1 cm in diameter and 2 cm thick; these were a product of well-ground, homogeneous, pressed samples.
Luminescence measurements were practiced with a TL/OSL setusing blue light stimulation on quartz made aliquots with theapplication of single aliquot regenerative dose (SAR) protocols.
4. Results of measurements
4.1. XRF
The XRF analysis performed on a portion of the same sedimentsamples that were used for luminescence measurements and waspracticed with a portable XRF spectrometer developed at the Instituteof Nuclear Physics, N.C.S.R. “Demokritos”/Athens. The unit consistedof a Rh-anode side-window lowpower X-ray tube (50W, 40 kV, 75 µmBe window), and a PIN X-ray detector (XR-100CR, Amptek Inc.) with a
Ti Cr Mn Fe
.68±0.12 0.48±0.02 0.08±0.01 0.08±0.01 3.84±0.04
.37±0.12 0.38±0.02 0.07±0.1 0.09±0.01 3.06±0.03
.21±0.08 0.33±0.01 0.04±0.01 0.04±0.01 3.08±0.03
.52±0.24 1.19±0.05 0.13±0.01 0.15±0.01 7.85±0.08.19±0.22 1.09±0.04 0.12±0.01 0.13±0.01 7.30±0.08.28±0.11 0.32±0.02 0.04±0.01 0.08±0.01 1.64±0.02.08±0.1 0.77±0.02 0.08±0.01 0.07±0.01 5.87±0.04.29±0.12 0.97±0.03 0.09±0.01 0.10±0.01 7.22±0.06.98±0.07 0.33±0.01 0.05±0.01 0.07±0.01 1.97±0.02.91±0.10 0.27±0.01 0.042±0.004 0.06±0.01 1.58±0.02.40±0.05 0.55±0.02 0.03±0.01 0.07±0.01 3.04±0.03.80±0.05 0.47±0.02 0.04±0.01 0.07±0.01 2.97±0.03.69±0.04 0.72±0.02 0.06±0.01 0.12±0.01 5.70±0.04.43±0.08 0.60±0.02 0.05±0.01 0.11±0.01 4.06±0.03.67±0.07 0.44±0.02 0.03±0.01 0.07±0.01 3.58±0.03.97±0.08 0.50±0.02 0.04±0.004 0.05±0.01 3.26±0.03.88±0.14 0.53±0.02 0.03±0.01 0.07±0.01 3.79±0.01.92±0.10 0.40±0.02 0.05±0.01 0.08±0.01 2.19±0.03
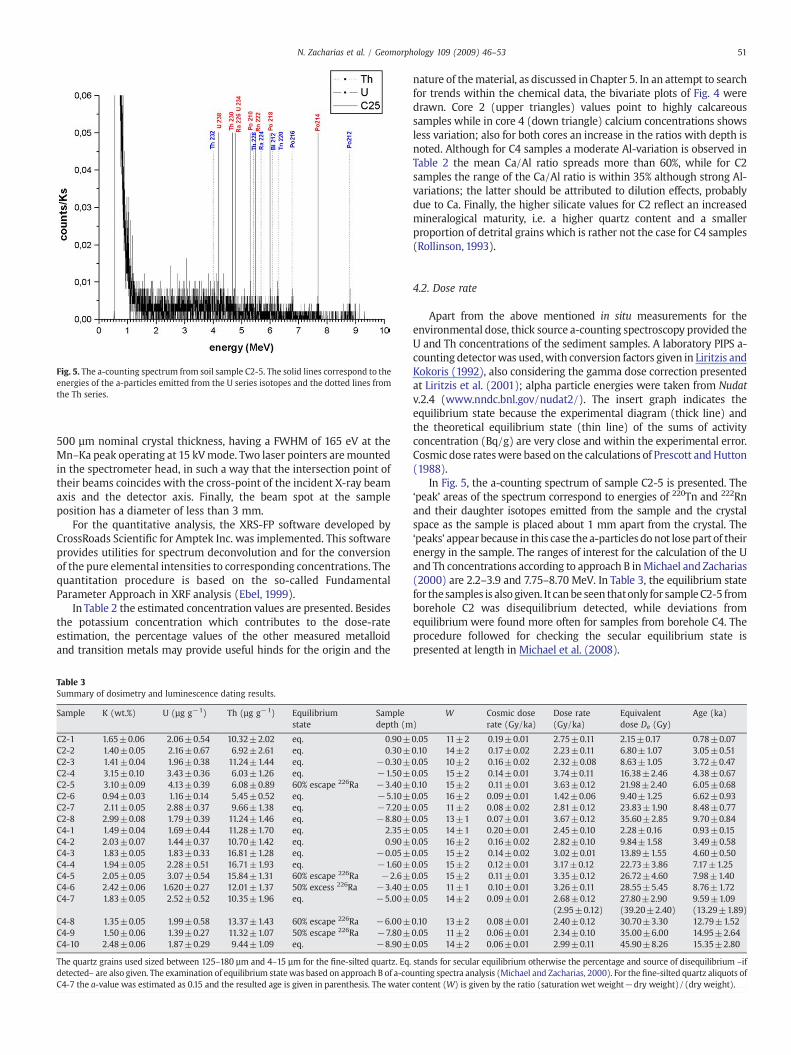
Fig. 5. The a-counting spectrum from soil sample C2-5. The solid lines correspond to theenergies of the a-particles emitted from the U series isotopes and the dotted lines fromthe Th series.
51N. Zacharias et al. / Geomorphology 109 (2009) 46–53
500 µm nominal crystal thickness, having a FWHM of 165 eV at theMn–Ka peak operating at 15 kVmode. Two laser pointers aremountedin the spectrometer head, in such a way that the intersection point oftheir beams coincides with the cross-point of the incident X-ray beamaxis and the detector axis. Finally, the beam spot at the sampleposition has a diameter of less than 3 mm.
For the quantitative analysis, the XRS-FP software developed byCrossRoads Scientific for Amptek Inc. was implemented. This softwareprovides utilities for spectrum deconvolution and for the conversionof the pure elemental intensities to corresponding concentrations. Thequantitation procedure is based on the so-called FundamentalParameter Approach in XRF analysis (Ebel, 1999).
In Table 2 the estimated concentration values are presented. Besidesthe potassium concentration which contributes to the dose-rateestimation, the percentage values of the other measured metalloidand transition metals may provide useful hinds for the origin and the
Table 3Summary of dosimetry and luminescence dating results.
Sample K (wt.%) U (µg g−1) Th (µg g−1) Equilibriumstate
Sampledepth (m
C2-1 1.65±0.06 2.06±0.54 10.32±2.02 eq. 0.90±C2-2 1.40±0.05 2.16±0.67 6.92±2.61 eq. 0.30±C2-3 1.41±0.04 1.96±0.38 11.24±1.44 eq. −0.30±C2-4 3.15±0.10 3.43±0.36 6.03±1.26 eq. −1.50±C2-5 3.10±0.09 4.13±0.39 6.08±0.89 60% escape 226Ra −3.40±C2-6 0.94±0.03 1.16±0.14 5.45±0.52 eq. −5.10±C2-7 2.11±0.05 2.88±0.37 9.66±1.38 eq. −7.20±C2-8 2.99±0.08 1.79±0.39 11.24±1.46 eq. −8.80±C4-1 1.49±0.04 1.69±0.44 11.28±1.70 eq. 2.35±C4-2 2.03±0.07 1.44±0.37 10.70±1.42 eq. 0.90±C4-3 1.83±0.05 1.83±0.33 16.81±1.28 eq. −0.05±C4-4 1.94±0.05 2.28±0.51 16.71±1.93 eq. −1.60±C4-5 2.05±0.05 3.07±0.54 15.84±1.31 60% escape 226Ra −2.6±C4-6 2.42±0.06 1.620±0.27 12.01±1.37 50% excess 226Ra −3.40±C4-7 1.83±0.05 2.52±0.52 10.35±1.96 eq. −5.00±
C4-8 1.35±0.05 1.99±0.58 13.37±1.43 60% escape 226Ra −6.00±C4-9 1.50±0.06 1.39±0.27 11.32±1.07 50% escape 226Ra −7.80±C4-10 2.48±0.06 1.87±0.29 9.44±1.09 eq. −8.90±
The quartz grains used sized between 125–180 µm and 4–15 µm for the fine-silted quartz. Eq.detected– are also given. The examination of equilibrium statewas based on approach B of a-coC4-7 the a-value was estimated as 0.15 and the resulted age is given in parenthesis. The water
nature of thematerial, as discussed in Chapter 5. In an attempt to searchfor trends within the chemical data, the bivariate plots of Fig. 4 weredrawn. Core 2 (upper triangles) values point to highly calcareoussamples while in core 4 (down triangle) calcium concentrations showsless variation; also for both cores an increase in the ratios with depth isnoted. Although for C4 samples a moderate Al-variation is observed inTable 2 the mean Ca/Al ratio spreads more than 60%, while for C2samples the range of the Ca/Al ratio is within 35% although strong Al-variations; the latter should be attributed to dilution effects, probablydue to Ca. Finally, the higher silicate values for C2 reflect an increasedmineralogical maturity, i.e. a higher quartz content and a smallerproportion of detrital grains which is rather not the case for C4 samples(Rollinson, 1993).
4.2. Dose rate
Apart from the above mentioned in situ measurements for theenvironmental dose, thick source a-counting spectroscopy provided theU and Th concentrations of the sediment samples. A laboratory PIPS a-counting detectorwas used,with conversion factors given in Liritzis andKokoris (1992), also considering the gamma dose correction presentedat Liritzis et al. (2001); alpha particle energies were taken from Nudatv.2.4 (www.nndc.bnl.gov/nudat2/). The insert graph indicates theequilibrium state because the experimental diagram (thick line) andthe theoretical equilibrium state (thin line) of the sums of activityconcentration (Bq/g) are very close and within the experimental error.Cosmic dose rateswere based on the calculations of Prescott andHutton(1988).
In Fig. 5, the a-counting spectrum of sample C2-5 is presented. The‘peak’ areas of the spectrum correspond to energies of 220Tn and 222Rnand their daughter isotopes emitted from the sample and the crystalspace as the sample is placed about 1 mm apart from the crystal. The‘peaks’ appear because in this case the a-particles donot lose part of theirenergy in the sample. The ranges of interest for the calculation of the Uand Th concentrations according to approach B inMichael and Zacharias(2000) are 2.2–3.9 and 7.75–8.70 MeV. In Table 3, the equilibrium statefor thesamples is also given. It canbe seen thatonly for sampleC2-5 fromborehole C2 was disequilibrium detected, while deviations fromequilibrium were found more often for samples from borehole C4. Theprocedure followed for checking the secular equilibrium state ispresented at length in Michael et al. (2008).
)W Cosmic dose
rate (Gy/ka)Dose rate(Gy/ka)
Equivalentdose De (Gy)
Age (ka)
0.05 11±2 0.19±0.01 2.75±0.11 2.15±0.17 0.78±0.070.10 14±2 0.17±0.02 2.23±0.11 6.80±1.07 3.05±0.510.05 10±2 0.16±0.02 2.32±0.08 8.63±1.05 3.72±0.470.05 15±2 0.14±0.01 3.74±0.11 16.38±2.46 4.38±0.670.10 15±2 0.11±0.01 3.63±0.12 21.98±2.40 6.05±0.680.05 16±2 0.09±0.01 1.42±0.06 9.40±1.25 6.62±0.930.05 11±2 0.08±0.02 2.81±0.12 23.83±1.90 8.48±0.770.05 13±1 0.07±0.01 3.67±0.12 35.60±2.85 9.70±0.840.05 14±1 0.20±0.01 2.45±0.10 2.28±0.16 0.93±0.150.05 16±2 0.16±0.02 2.82±0.10 9.84±1.58 3.49±0.580.05 15±2 0.14±0.02 3.02±0.01 13.89±1.55 4.60±0.500.05 15±2 0.12±0.01 3.17±0.12 22.73±3.86 7.17±1.250.05 15±2 0.11±0.01 3.35±0.12 26.72±4.60 7.98±1.400.05 11±1 0.10±0.01 3.26±0.11 28.55±5.45 8.76±1.720.05 14±2 0.09±0.01 2.68±0.12
(2.95±0.12)27.80±2.90(39.20±2.40)
9.59±1.09(13.29±1.89)
0.10 13±2 0.08±0.01 2.40±0.12 30.70±3.30 12.79±1.520.05 11±2 0.06±0.01 2.34±0.10 35.00±6.00 14.95±2.640.05 14±2 0.06±0.01 2.99±0.11 45.90±8.26 15.35±2.80
stands for secular equilibrium otherwise the percentage and source of disequilibrium –ifunting spectra analysis (Michael and Zacharias, 2000). For the fine-silted quartz aliquots ofcontent (W) is given by the ratio (saturation wet weight−dry weight)/(dry weight).
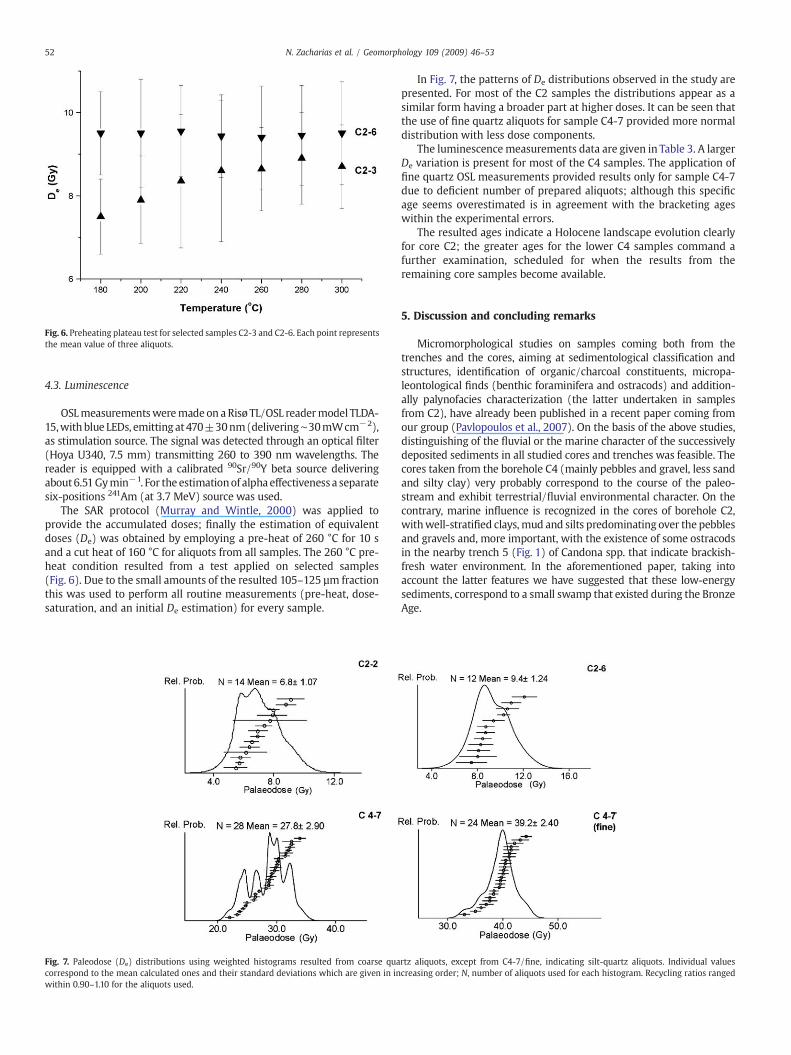
Fig. 6. Preheating plateau test for selected samples C2-3 and C2-6. Each point representsthe mean value of three aliquots.
52 N. Zacharias et al. / Geomorphology 109 (2009) 46–53
4.3. Luminescence
OSLmeasurementsweremadeon aRisø TL/OSL readermodel TLDA-15,with blue LEDs, emitting at470±30nm(delivering∼30mWcm−2),as stimulation source. The signal was detected through an optical filter(Hoya U340, 7.5 mm) transmitting 260 to 390 nm wavelengths. Thereader is equipped with a calibrated 90Sr/90Y beta source deliveringabout6.51Gymin−1. For the estimationof alpha effectiveness a separatesix-positions 241Am (at 3.7 MeV) source was used.
The SAR protocol (Murray and Wintle, 2000) was applied toprovide the accumulated doses; finally the estimation of equivalentdoses (De) was obtained by employing a pre-heat of 260 °C for 10 sand a cut heat of 160 °C for aliquots from all samples. The 260 °C pre-heat condition resulted from a test applied on selected samples(Fig. 6). Due to the small amounts of the resulted 105–125 µm fractionthis was used to perform all routine measurements (pre-heat, dose-saturation, and an initial De estimation) for every sample.
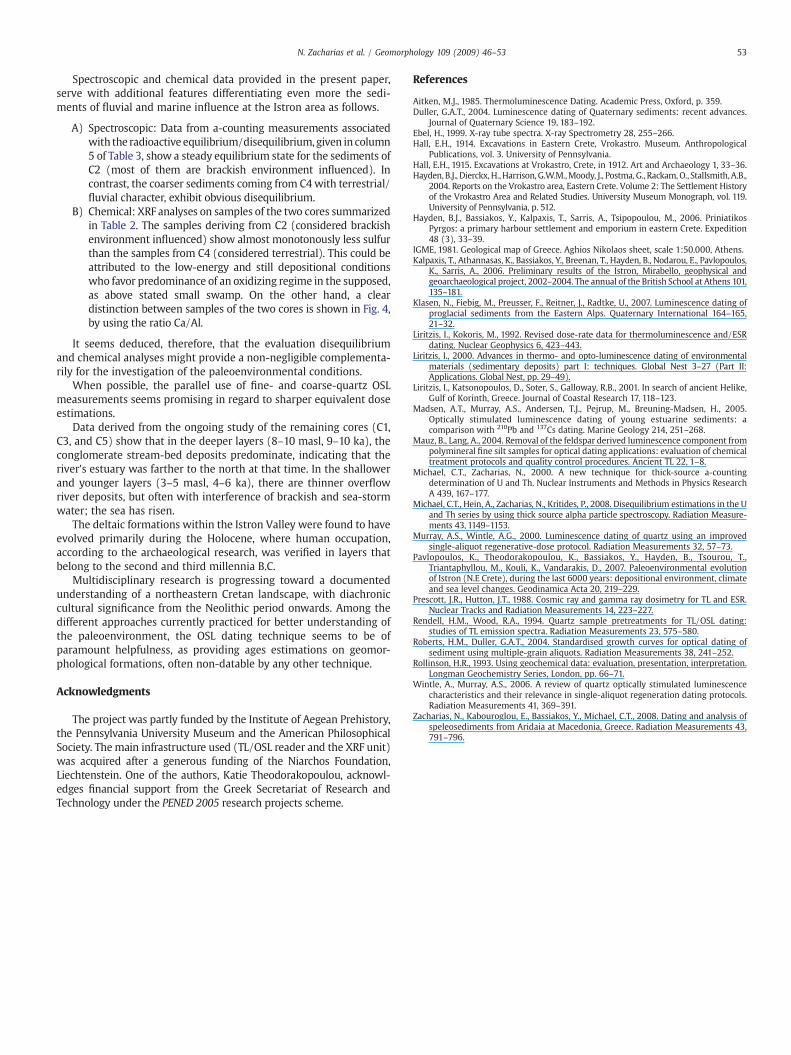
Fig. 7. Paleodose (De) distributions using weighted histograms resulted from coarse quacorrespond to the mean calculated ones and their standard deviations which are given in inwithin 0.90–1.10 for the aliquots used.
In Fig. 7, the patterns of De distributions observed in the study arepresented. For most of the C2 samples the distributions appear as asimilar form having a broader part at higher doses. It can be seen thatthe use of fine quartz aliquots for sample C4-7 provided more normaldistribution with less dose components.
The luminescence measurements data are given in Table 3. A largerDe variation is present for most of the C4 samples. The application offine quartz OSL measurements provided results only for sample C4-7due to deficient number of prepared aliquots; although this specificage seems overestimated is in agreement with the bracketing ageswithin the experimental errors.
The resulted ages indicate a Holocene landscape evolution clearlyfor core C2; the greater ages for the lower C4 samples command afurther examination, scheduled for when the results from theremaining core samples become available.
5. Discussion and concluding remarks
Micromorphological studies on samples coming both from thetrenches and the cores, aiming at sedimentological classification andstructures, identification of organic/charcoal constituents, micropa-leontological finds (benthic foraminifera and ostracods) and addition-ally palynofacies characterization (the latter undertaken in samplesfrom C2), have already been published in a recent paper coming fromour group (Pavlopoulos et al., 2007). On the basis of the above studies,distinguishing of the fluvial or the marine character of the successivelydeposited sediments in all studied cores and trenches was feasible. Thecores taken from the borehole C4 (mainly pebbles and gravel, less sandand silty clay) very probably correspond to the course of the paleo-stream and exhibit terrestrial/fluvial environmental character. On thecontrary, marine influence is recognized in the cores of borehole C2,withwell-stratified clays, mud and silts predominating over the pebblesand gravels and, more important, with the existence of some ostracodsin the nearby trench 5 (Fig. 1) of Candona spp. that indicate brackish-fresh water environment. In the aforementioned paper, taking intoaccount the latter features we have suggested that these low-energysediments, correspond to a small swamp that existed during the BronzeAge.
rtz aliquots, except from C4-7/fine, indicating silt-quartz aliquots. Individual valuescreasing order; N, number of aliquots used for each histogram. Recycling ratios ranged
53N. Zacharias et al. / Geomorphology 109 (2009) 46–53
Spectroscopic and chemical data provided in the present paper,serve with additional features differentiating even more the sedi-ments of fluvial and marine influence at the Istron area as follows.
A) Spectroscopic: Data from a-counting measurements associatedwith the radioactive equilibrium/disequilibrium, given in column5 of Table 3, show a steady equilibrium state for the sediments ofC2 (most of them are brackish environment influenced). Incontrast, the coarser sediments coming from C4with terrestrial/fluvial character, exhibit obvious disequilibrium.
B) Chemical: XRF analyses on samples of the two cores summarizedin Table 2. The samples deriving from C2 (considered brackishenvironment influenced) show almost monotonously less sulfurthan the samples from C4 (considered terrestrial). This could beattributed to the low-energy and still depositional conditionswho favor predominance of an oxidizing regime in the supposed,as above stated small swamp. On the other hand, a cleardistinction between samples of the two cores is shown in Fig. 4,by using the ratio Ca/Al.
It seems deduced, therefore, that the evaluation disequilibriumand chemical analyses might provide a non-negligible complementa-rily for the investigation of the paleoenvironmental conditions.
When possible, the parallel use of fine- and coarse-quartz OSLmeasurements seems promising in regard to sharper equivalent doseestimations.
Data derived from the ongoing study of the remaining cores (C1,C3, and C5) show that in the deeper layers (8–10 masl, 9–10 ka), theconglomerate stream-bed deposits predominate, indicating that theriver's estuary was farther to the north at that time. In the shallowerand younger layers (3–5 masl, 4–6 ka), there are thinner overflowriver deposits, but often with interference of brackish and sea-stormwater; the sea has risen.
The deltaic formations within the Istron Valley were found to haveevolved primarily during the Holocene, where human occupation,according to the archaeological research, was verified in layers thatbelong to the second and third millennia B.C.
Multidisciplinary research is progressing toward a documentedunderstanding of a northeastern Cretan landscape, with diachroniccultural significance from the Neolithic period onwards. Among thedifferent approaches currently practiced for better understanding ofthe paleoenvironment, the OSL dating technique seems to be ofparamount helpfulness, as providing ages estimations on geomor-phological formations, often non-datable by any other technique.
Acknowledgments
The project was partly funded by the Institute of Aegean Prehistory,the Pennsylvania University Museum and the American PhilosophicalSociety. The main infrastructure used (TL/OSL reader and the XRF unit)was acquired after a generous funding of the Niarchos Foundation,Liechtenstein. One of the authors, Katie Theodorakopoulou, acknowl-edges financial support from the Greek Secretariat of Research andTechnology under the PENED 2005 research projects scheme.
References
Aitken, M.J., 1985. Thermoluminescence Dating. Academic Press, Oxford, p. 359.Duller, G.A.T., 2004. Luminescence dating of Quaternary sediments: recent advances.
Journal of Quaternary Science 19, 183–192.Ebel, H., 1999. X-ray tube spectra. X-ray Spectrometry 28, 255–266.Hall, E.H., 1914. Excavations in Eastern Crete, Vrokastro. Museum. Anthropological
Publications, vol. 3. University of Pennsylvania.Hall, E.H., 1915. Excavations at Vrokastro, Crete, in 1912. Art and Archaeology 1, 33–36.Hayden,B.J., Dierckx, H.,Harrison,G.W.M.,Moody, J., Postma, G., Rackam,O., Stallsmith,A.B.,
2004. Reports on the Vrokastro area, Eastern Crete. Volume 2: The Settlement Historyof the Vrokastro Area and Related Studies. University Museum Monograph, vol. 119.University of Pennsylvania, p. 512.
Hayden, B.J., Bassiakos, Y., Kalpaxis, T., Sarris, A., Tsipopoulou, M., 2006. PriniatikosPyrgos: a primary harbour settlement and emporium in eastern Crete. Expedition48 (3), 33–39.
IGME, 1981. Geological map of Greece. Aghios Nikolaos sheet, scale 1:50.000, Athens.Kalpaxis, T., Athannasas, K., Bassiakos, Y., Breenan, T., Hayden, B., Nodarou, E., Pavlopoulos,
K., Sarris, A., 2006. Preliminary results of the Istron, Mirabello, geophysical andgeoarchaeological project, 2002–2004. The annual of the British School at Athens 101,135–181.
Klasen, N., Fiebig, M., Preusser, F., Reitner, J., Radtke, U., 2007. Luminescence dating ofproglacial sediments from the Eastern Alps. Quaternary International 164–165,21–32.
Liritzis, I., Kokoris, M., 1992. Revised dose-rate data for thermoluminescence and/ESRdating. Nuclear Geophysics 6, 423–443.
Liritzis, I., 2000. Advances in thermo- and opto-luminescence dating of environmentalmaterials (sedimentary deposits) part I: techniques. Global Nest 3–27 (Part II:Applications. Global Nest, pp. 29–49).
Liritzis, I., Katsonopoulos, D., Soter, S., Galloway, R.B., 2001. In search of ancient Helike,Gulf of Korinth, Greece. Journal of Coastal Research 17, 118–123.
Madsen, A.T., Murray, A.S., Andersen, T.J., Pejrup, M., Breuning-Madsen, H., 2005.Optically stimulated luminescence dating of young estuarine sediments: acomparison with 210Pb and 137Cs dating. Marine Geology 214, 251–268.
Mauz, B., Lang, A., 2004. Removal of the feldspar derived luminescence component frompolymineral fine silt samples for optical dating applications: evaluation of chemicaltreatment protocols and quality control procedures. Ancient TL 22, 1–8.
Michael, C.T., Zacharias, N., 2000. A new technique for thick-source a-countingdetermination of U and Th. Nuclear Instruments and Methods in Physics ResearchA 439, 167–177.
Michael, C.T., Hein, A., Zacharias, N., Kritides, P., 2008. Disequilibrium estimations in the Uand Th series by using thick source alpha particle spectroscopy. Radiation Measure-ments 43, 1149–1153.
Murray, A.S., Wintle, A.G., 2000. Luminescence dating of quartz using an improvedsingle-aliquot regenerative-dose protocol. Radiation Measurements 32, 57–73.
Pavlopoulos, K., Theodorakopoulou, K., Bassiakos, Y., Hayden, B., Tsourou, T.,Triantaphyllou, M., Kouli, K., Vandarakis, D., 2007. Paleoenvironmental evolutionof Istron (N.E Crete), during the last 6000 years: depositional environment, climateand sea level changes. Geodinamica Acta 20, 219–229.
Prescott, J.R., Hutton, J.T., 1988. Cosmic ray and gamma ray dosimetry for TL and ESR.Nuclear Tracks and Radiation Measurements 14, 223–227.
Rendell, H.M., Wood, R.A., 1994. Quartz sample pretreatments for TL/OSL dating:studies of TL emission spectra. Radiation Measurements 23, 575–580.
Roberts, H.M., Duller, G.A.T., 2004. Standardised growth curves for optical dating ofsediment using multiple-grain aliquots. Radiation Measurements 38, 241–252.
Rollinson, H.R., 1993. Using geochemical data: evaluation, presentation, interpretation.Longman Geochemistry Series, London, pp. 66–71.
Wintle, A., Murray, A.S., 2006. A review of quartz optically stimulated luminescencecharacteristics and their relevance in single-aliquot regeneration dating protocols.Radiation Measurements 41, 369–391.
Zacharias, N., Kabouroglou, E., Bassiakos, Y., Michael, C.T., 2008. Dating and analysis ofspeleosediments from Aridaia at Macedonia, Greece. Radiation Measurements 43,791–796.
Related Documents