1 Experimental and computational modelling of vibration performance of ultrasonic tools for manufacturing applications Dr Margaret Lucas and Andrea Cardoni Department of Mechanical Engineering, University of Glasgow UIA Symposium, 2002

Welcome message from author
This document is posted to help you gain knowledge. Please leave a comment to let me know what you think about it! Share it to your friends and learn new things together.
Transcript

1
Experimental and computational modelling of vibration performance of
ultrasonic tools for manufacturing applications
Dr Margaret Lucas and Andrea Cardoni
Department of Mechanical Engineering, University of Glasgow
UIA Symposium, 2002
2
Objectives
• Study the causes of component failure in simple and complex ultrasoniccutting systems by finite element (FE) modelling.
• Investigate geometric modifications of the ultrasonic components inorder to reduce stress.
• Characterise the vibration behaviour of ultrasonic components by FEand modal analysis.
• Propose geometric modifications to improve vibration performance.
• Characterise the nonlinear responses of ultrasonic systems.
• Illustrate the theory of Nonlinear Cancellation Coupling.
• Propose strategies to reduce effects of nonlinear behaviour and toreduce nonlinearities.
3
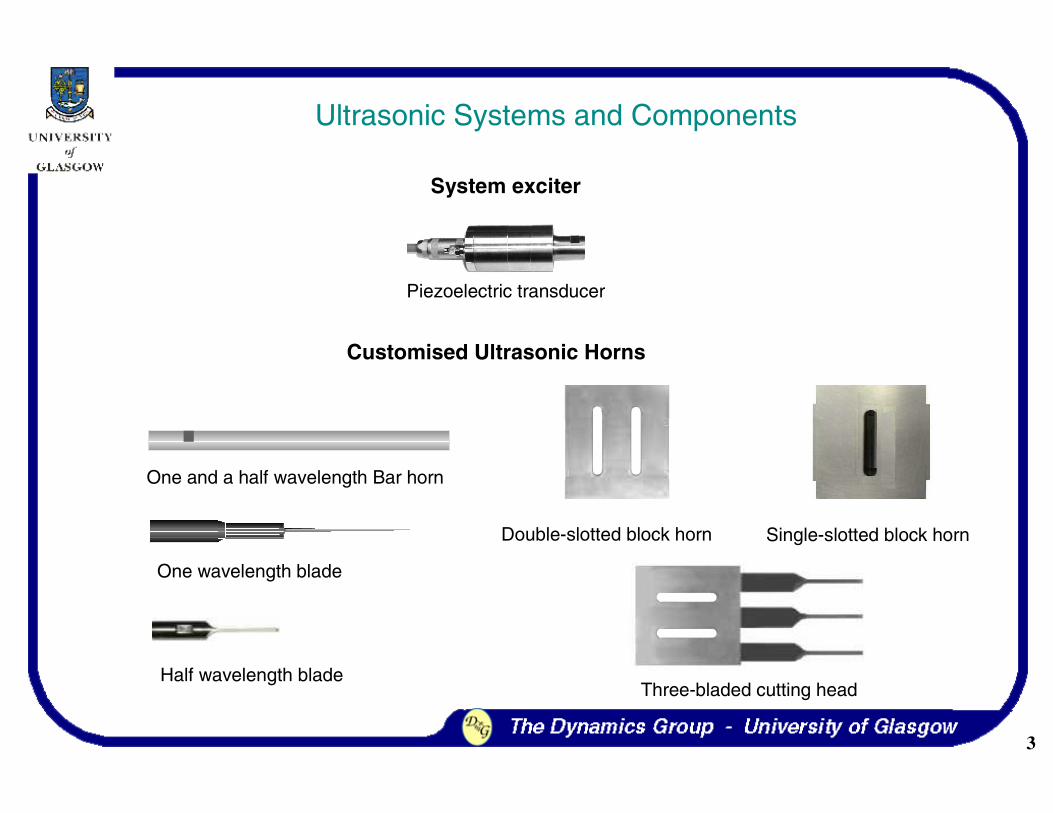
Customised Ultrasonic Horns
Piezoelectric transducer
Single-slotted block horn
Half wavelength blade
System exciter
Three-bladed cutting head
Ultrasonic Systems and Components
One wavelength blade
One and a half wavelength Bar horn
Double-slotted block horn
4
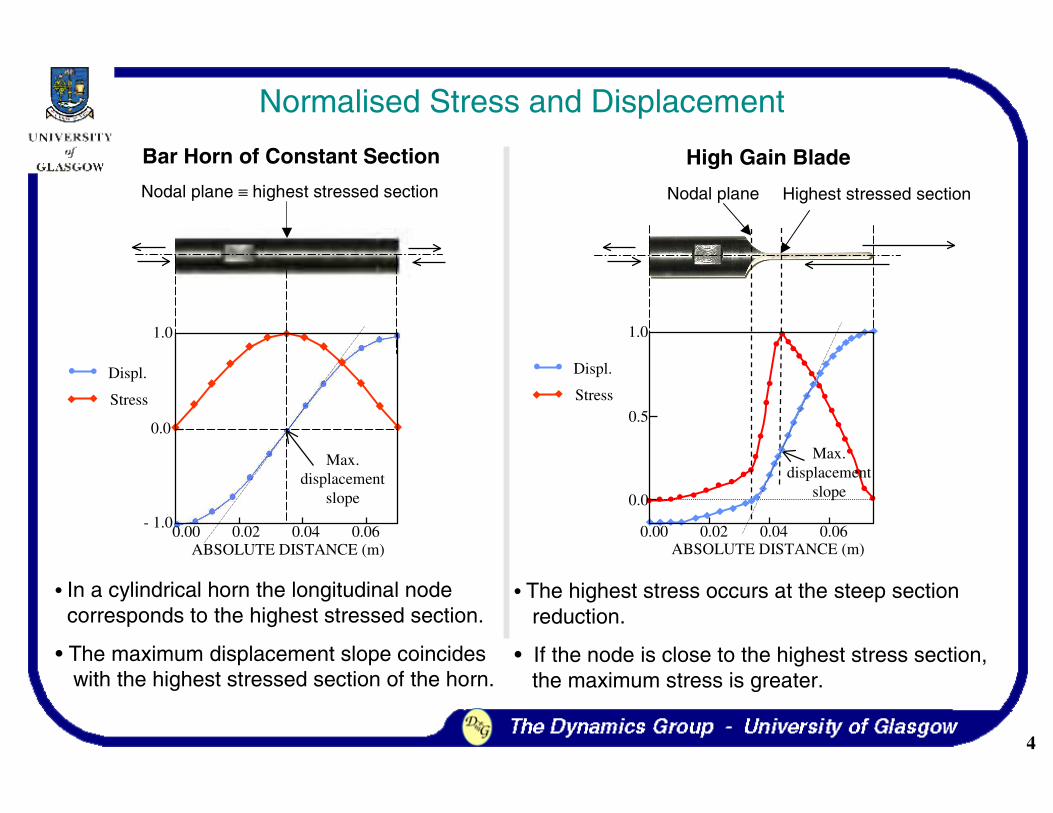
High Gain Blade
• In a cylindrical horn the longitudinal nodecorresponds to the highest stressed section.
• The maximum displacement slope coincideswith the highest stressed section of the horn.
• The highest stress occurs at the steep section reduction.
• If the node is close to the highest stress section,the maximum stress is greater.
Bar Horn of Constant Section
Normalised Stress and Displacement
Highest stressed sectionNodal plane
ABSOLUTE DISTANCE (m)
Max.displacement
slope
0.00 0.02 0.04 0.06
0.0
0.5
1.0
Stress
Displ.
ABSOLUTE DISTANCE (m)
Max.displacement
slope
0.00 0.02 0.04 0.06
Nodal plane ≡ highest stressed section
0.0
- 1.0
1.0
Stress
Displ.
5
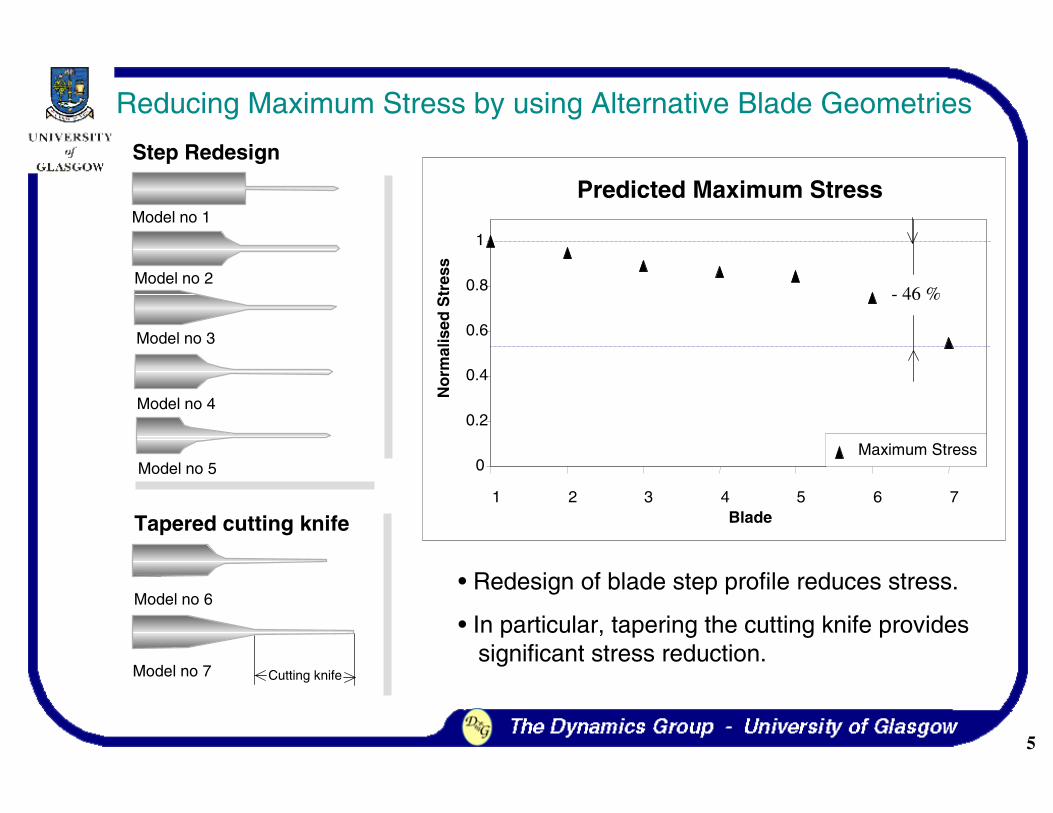
Tapered cutting knife
Model no 7
Model no 6
Model no 4
Model no 3
Model no 2
Model no 1
Step Redesign
Reducing Maximum Stress by using Alternative Blade Geometries
Cutting knife
Model no 5 0
0.2
0.4
0.6
0.8
1
1 2 3 4 5 6 7Blade
No
rmal
ised
Str
ess
Maximum Stress
- 46 %
Predicted Maximum Stress
• Redesign of blade step profile reduces stress.
• In particular, tapering the cutting knife provides significant stress reduction.
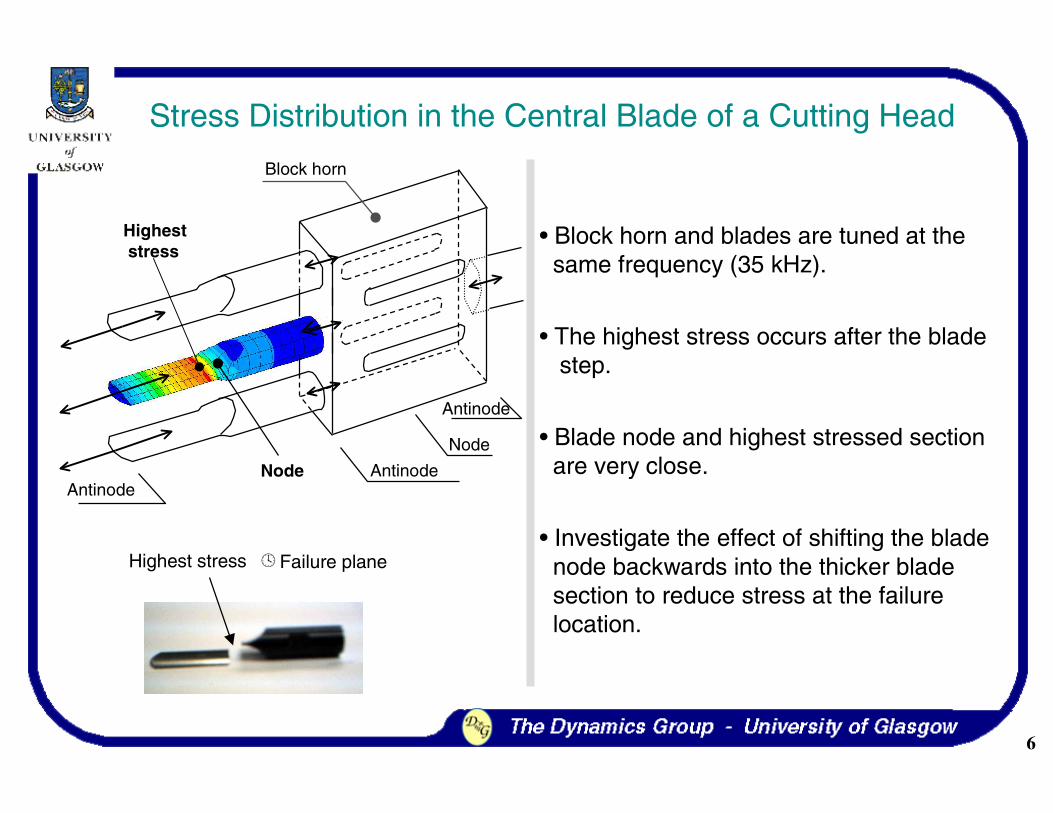
6
Highest stress Failure plane
Highest stress
Node AntinodeAntinode
Node
Antinode
Stress Distribution in the Central Blade of a Cutting Head
• Block horn and blades are tuned at thesame frequency (35 kHz).
• The highest stress occurs after the bladestep.
• Blade node and highest stressed sectionare very close.
• Investigate the effect of shifting the bladenode backwards into the thicker bladesection to reduce stress at the failurelocation.
Block horn
7
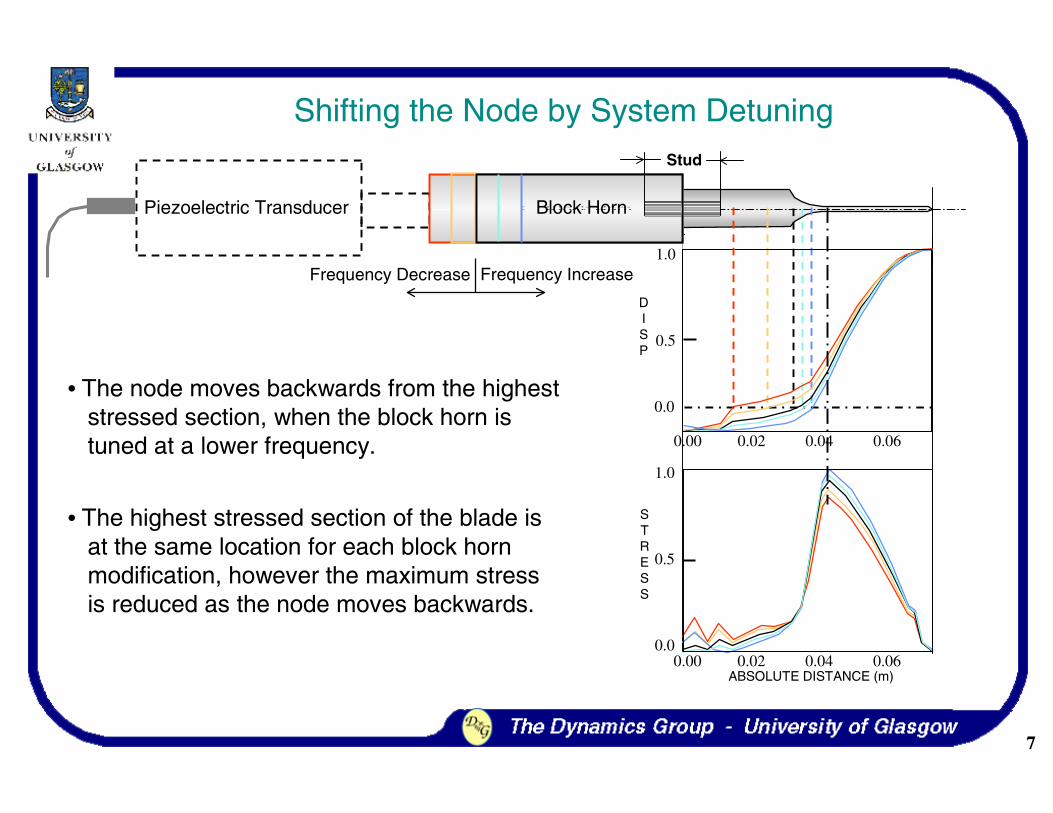
Shifting the Node by System Detuning
DISP
Block Horn
Stud
Piezoelectric Transducer Block Horn
Frequency IncreaseFrequency Decrease
ABSOLUTE DISTANCE (m)
STRESS
0.00 0.02 0.04 0.06
0.00 0.02 0.04 0.06
1.0
0.5
0.0
1.0
0.5
0.0• The node moves backwards from the highest
stressed section, when the block horn is tuned at a lower frequency.
• The highest stressed section of the blade is at the same location for each block hornmodification, however the maximum stress is reduced as the node moves backwards.
8
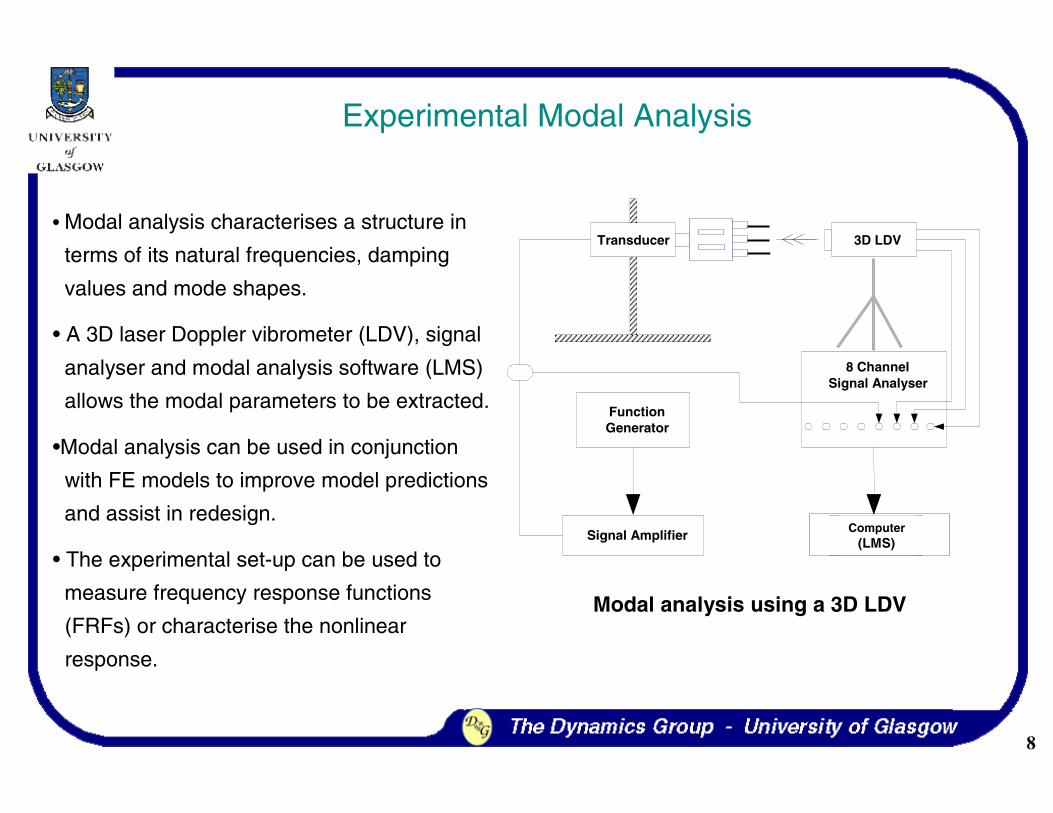
Experimental Modal Analysis
• Modal analysis characterises a structure in
terms of its natural frequencies, damping
values and mode shapes.
• A 3D laser Doppler vibrometer (LDV), signal
analyser and modal analysis software (LMS)
allows the modal parameters to be extracted.
•Modal analysis can be used in conjunction
with FE models to improve model predictions
and assist in redesign.
• The experimental set-up can be used to
measure frequency response functions
(FRFs) or characterise the nonlinear
response.
Modal analysis using a 3D LDV
3D LDVTransducer
8 ChannelSignal Analyser
FunctionGenerator
Signal Amplifier ComputerComputer(LMS)
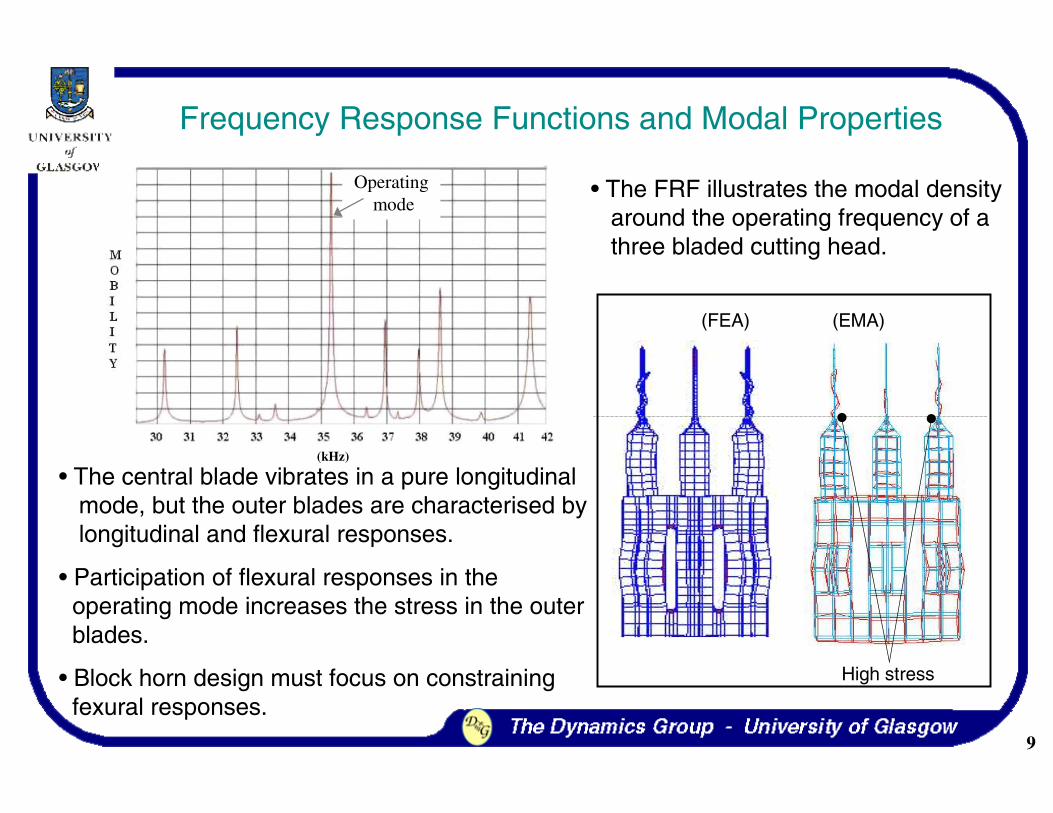
9
High stress
(FEA) (EMA)
(kHz)
Operatingmode
• The central blade vibrates in a pure longitudinalmode, but the outer blades are characterised bylongitudinal and flexural responses.
• Participation of flexural responses in theoperating mode increases the stress in the outerblades.
• Block horn design must focus on constrainingfexural responses.
Frequency Response Functions and Modal Properties
• The FRF illustrates the modal densityaround the operating frequency of athree bladed cutting head.
10
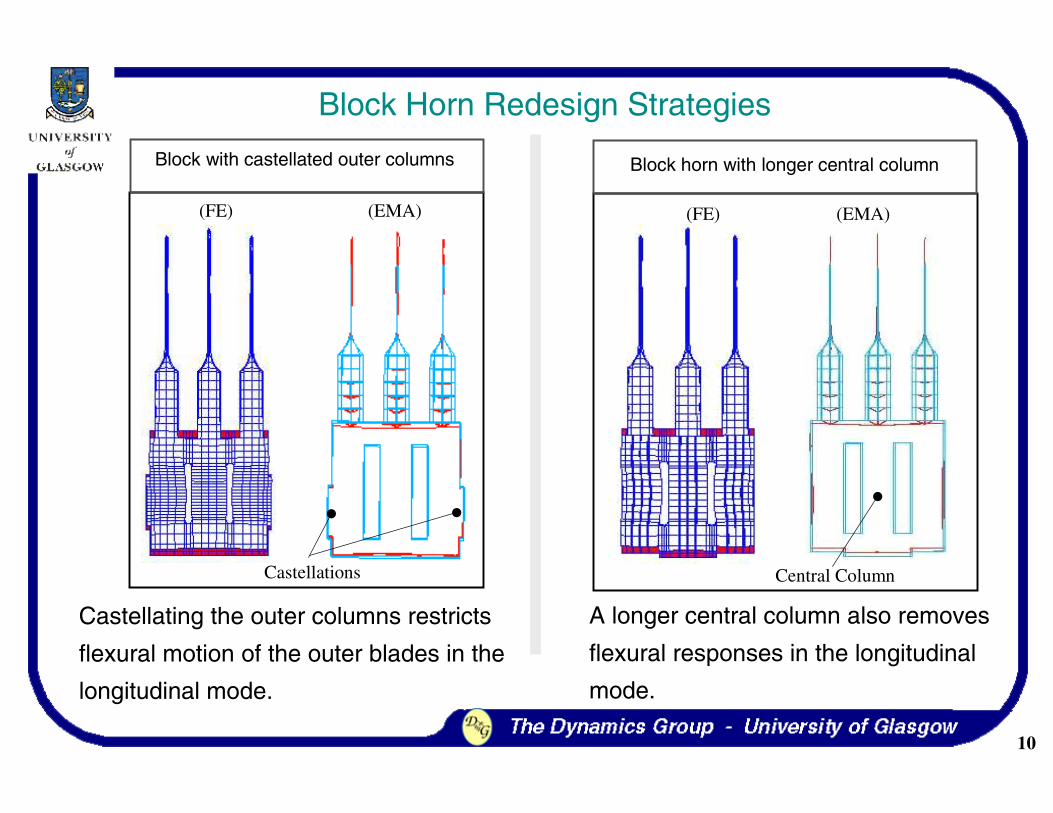
Castellating the outer columns restricts
flexural motion of the outer blades in the
longitudinal mode.
A longer central column also removes
flexural responses in the longitudinal
mode.
Block Horn Redesign Strategies
Block with castellated outer columns
(FE) (EMA)
Castellations
Block horn with longer central column
(FE) (EMA)
Central Column
11
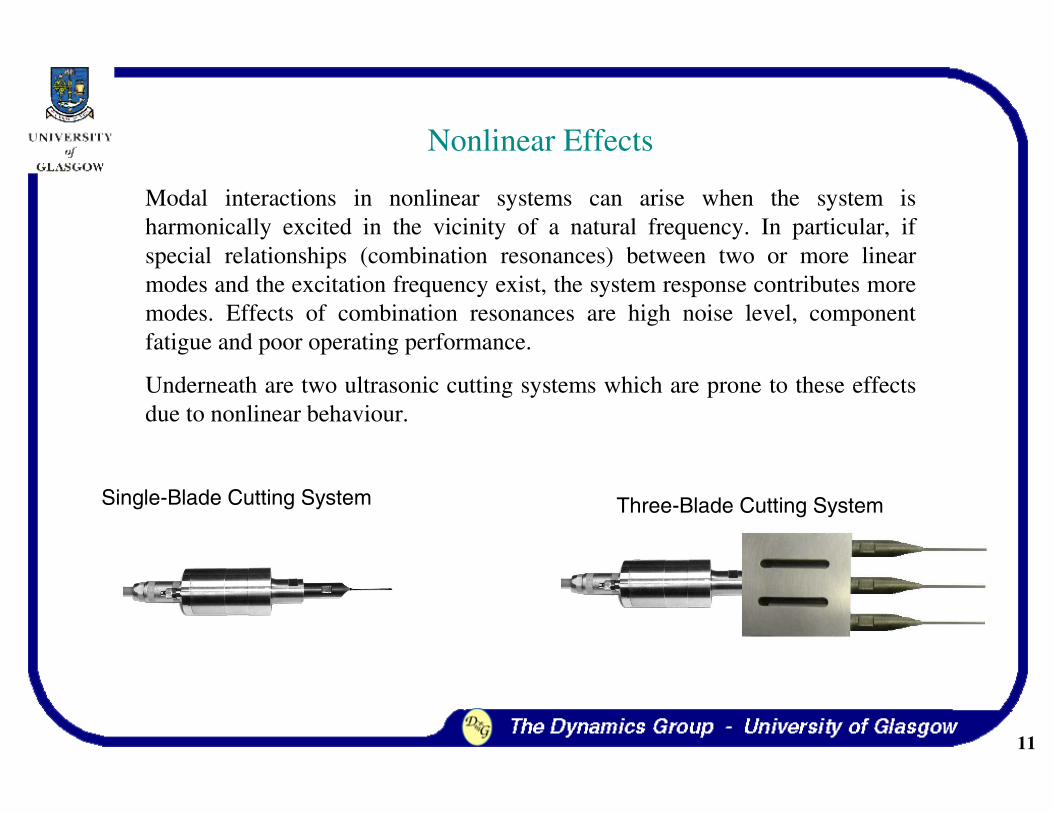
Nonlinear Effects
Modal interactions in nonlinear systems can arise when the system is harmonically excited in the vicinity of a natural frequency. In particular, if special relationships (combination resonances) between two or more linear modes and the excitation frequency exist, the system response contributes more modes. Effects of combination resonances are high noise level, component fatigue and poor operating performance.
Underneath are two ultrasonic cutting systems which are prone to these effects due to nonlinear behaviour.
Single-Blade Cutting System Three-Blade Cutting System
12
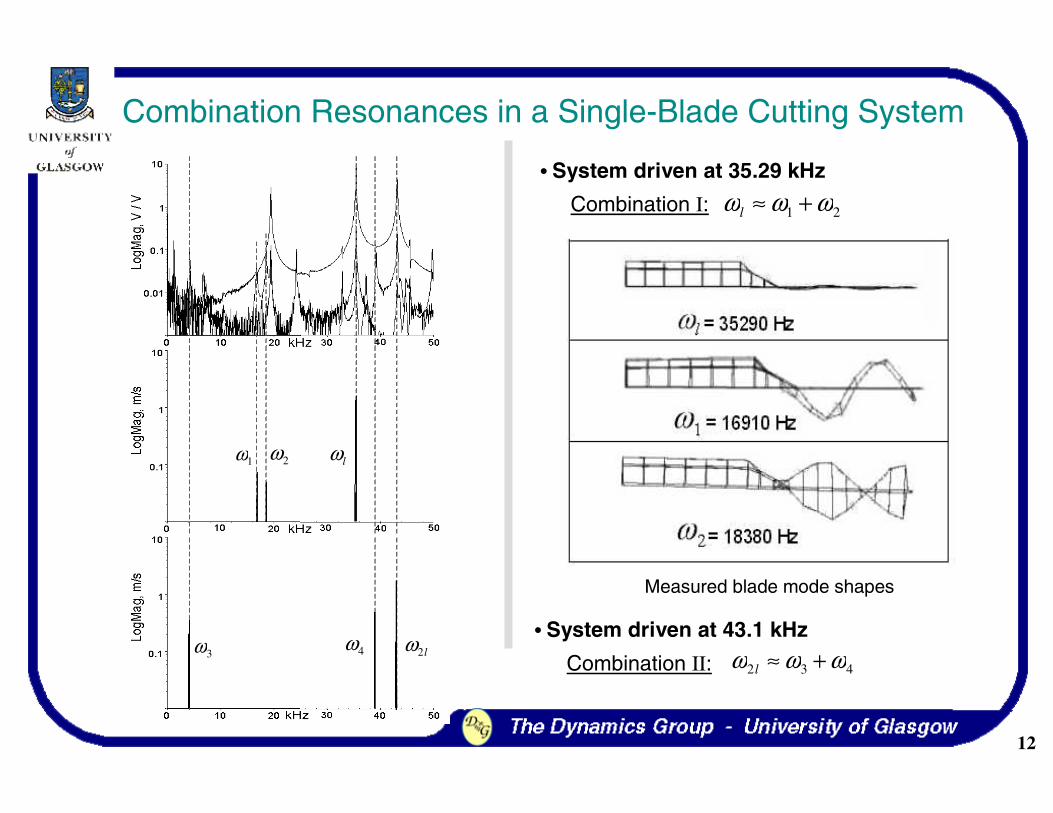
Combination Resonances in a Single-Blade Cutting System
lω1ω 2ω
Combination I: 21 ωωω +≈l
432 ωωω +≈ll2ω4ω
3ω
Measured blade mode shapes
Combination II:
• System driven at 35.29 kHz
• System driven at 43.1 kHz
13
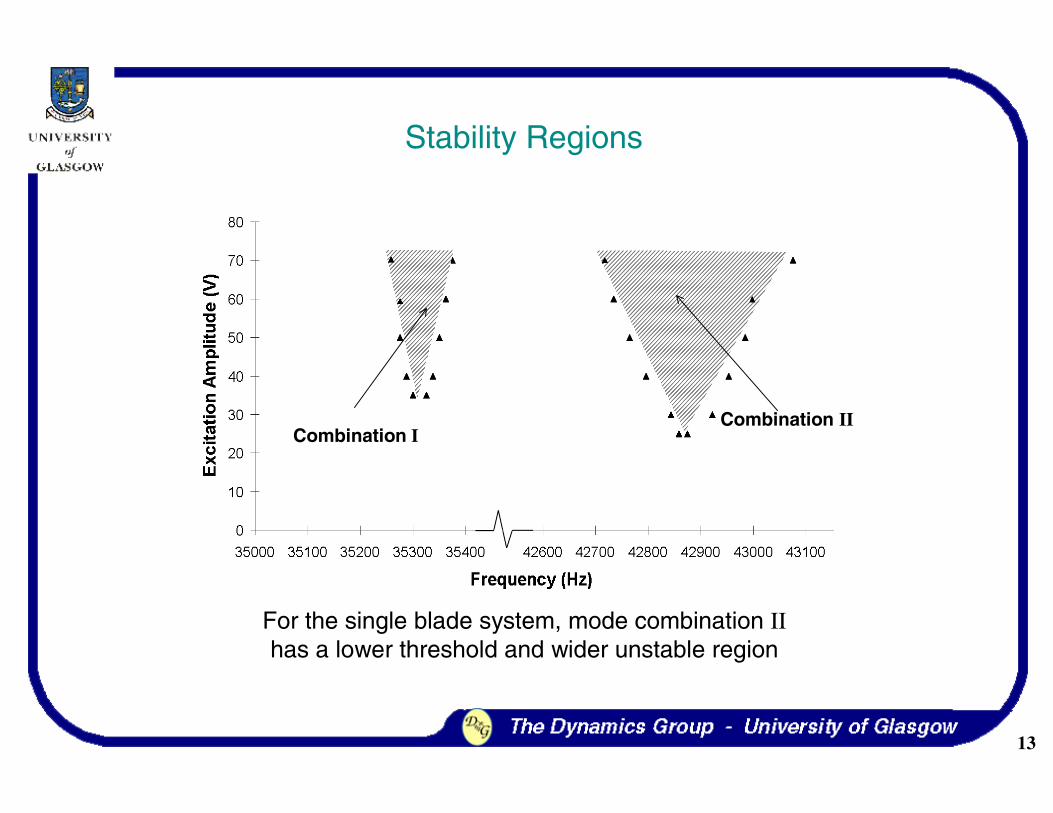
Combination ICombination II
For the single blade system, mode combination IIhas a lower threshold and wider unstable region
Stability Regions
14
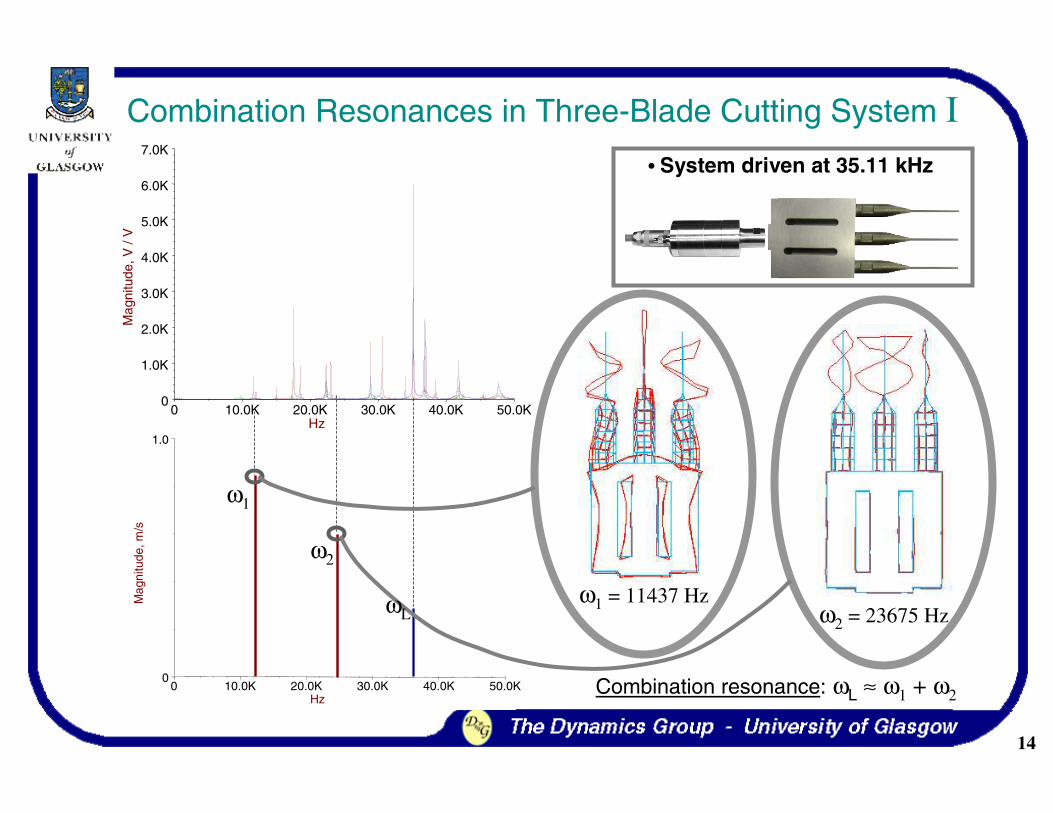
0 10.0K 20.0K 30.0K 40.0K 50.0K0
1.0
Hz
Mag
nitu
de, m
/s
ω1 = 11437 Hz
Combination resonance: ωL ≈ ω1 + ω2
ω2 = 23675 Hz
ω1
ω2
ωL
• System driven at 35.11 kHz
0 10.0K 20.0K 30.0K 40.0K 50.0K0
1.0K
2.0K
3.0K
4.0K
5.0K
6.0K
7.0K
Hz
Mag
nitu
de, V
/ V
Combination Resonances in Three-Blade Cutting System I
15
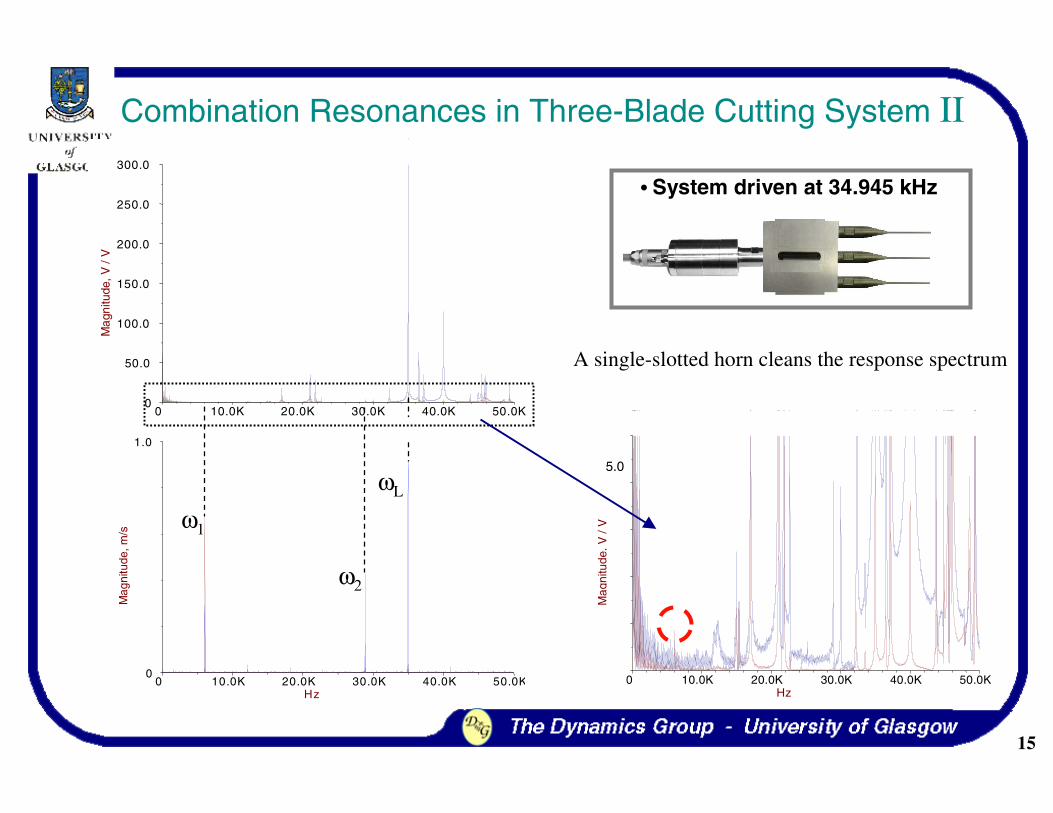
0 10.0K 20.0K 30.0K 40.0K 50.0K0
50.0
100.0
150.0
200.0
250.0
300.0
Hz
Mag
nitu
de, V
/ V
Combination Resonances in Three-Blade Cutting System II
0 10.0K 20.0K 30.0K 40.0K 50.0K0
1.0
2.0
3.0
4.0
5.0
Hz
Mag
nitu
de, V
/ V
5.0
• System driven at 34.945 kHz
A single-slotted horn cleans the response spectrum
0 10.0K 20.0K 30.0K 40.0K 50.0K0
1.0
Hz
Mag
nitu
de, m
/s
ω1
ω2
ωL
16
0.0
0.2
0.4
0.6
0.8
1.0
1.2
1.4
34950 35000 35050 35100 35150 35200 35250 35300
Frequency (Hz)R
esp
on
se (
m/s
)
30 V (Up)
30 V (Down)
0
0.2
0.4
0.6
0.8
1
1.2
1.4
35000 35050 35100 35150 35200 35250 35300 35350
Frequency (Hz)
Res
po
nse
(m
/s)
30 V (Up)
30 V (Down)
5 V (Up)
5 V (Down)Instabilityregion
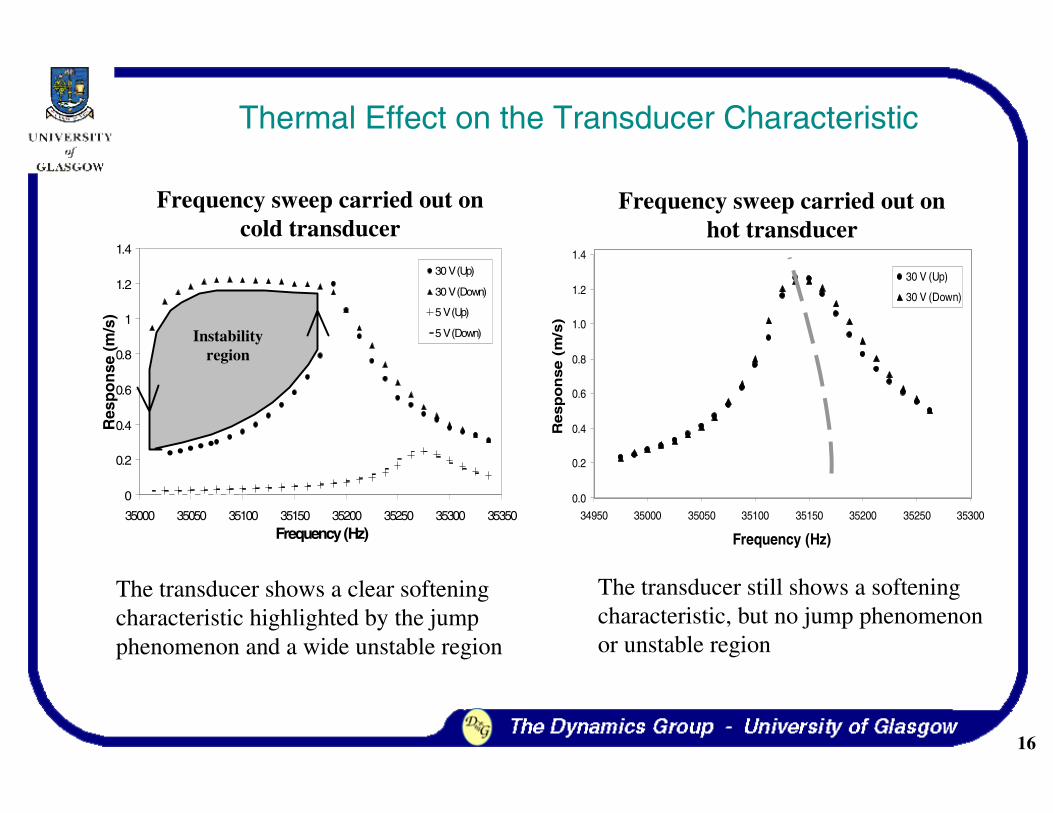
Thermal Effect on the Transducer Characteristic
Frequency sweep carried out oncold transducer
Frequency sweep carried out onhot transducer
The transducer shows a clear softening characteristic highlighted by the jump phenomenon and a wide unstable region
The transducer still shows a softening characteristic, but no jump phenomenonor unstable region
17
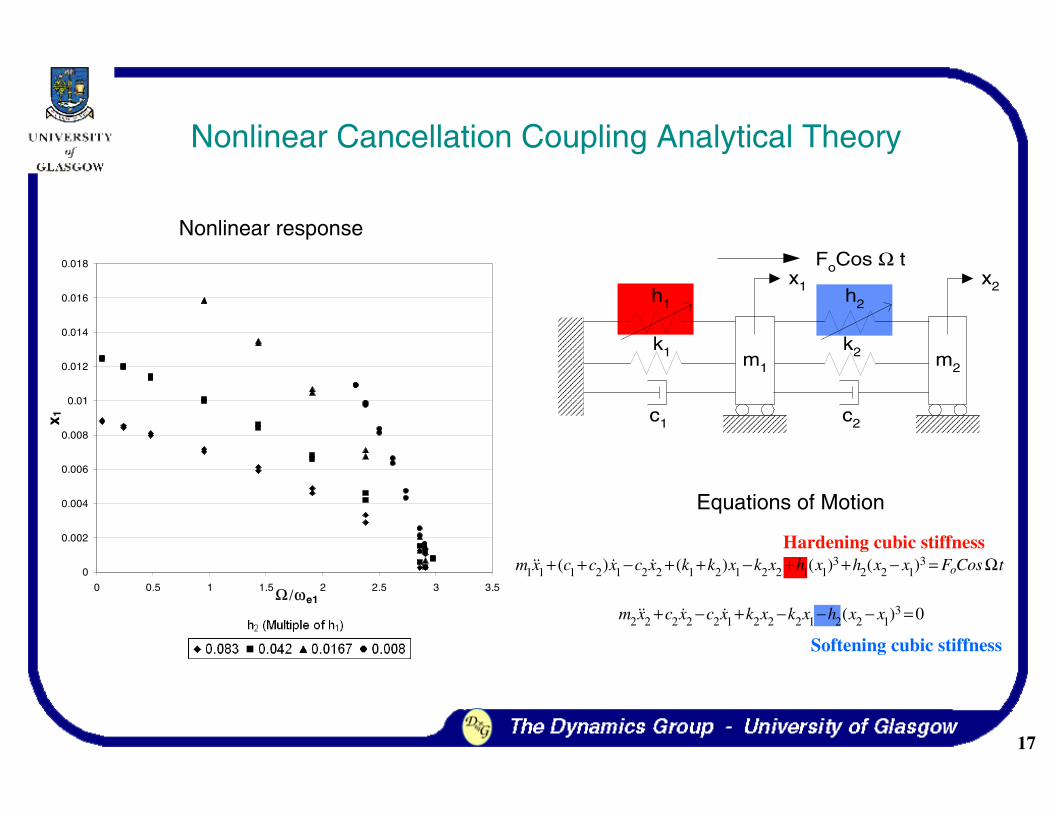
Softening cubic stiffness
Hardening cubic stiffness
0
0.002
0.004
0.006
0.008
0.01
0.012
0.014
0.016
0.018
0 0.5 1 1.5 2 2.5 3 3.5Ω/ωe1
x 1
Nonlinear Cancellation Coupling Analytical Theory
Equations of Motion
Nonlinear response
k2k1 m2
x2
c2
h2
FoCos Ω t
m1
x1
c1
h1
3 31 1 1 2 1 2 2 1 2 1 2 2 1 1 2 2 1( ) ( ) ( ) ( ) om x c c x c x k k x k x h x h x x F Cos t+ + − + + − + + − = Ω&& & &
32 2 2 2 2 1 2 2 2 1 2 2 1( ) 0m x c x c x k x k x h x x+ − + − − − =&& & &

18
0.0
0.2
0.4
0.6
0.8
1.0
1.2
1.4
34950 35000 35050 35100 35150 35200 35250 35300
Frequency (Hz)
Res
po
nse
(m
/s)
30 V (Up)
30 V (Down)
0.0
0.2
0.4
0.6
0.8
1.0
1.2
1.4
1.6
35050 35100 35150 35200 35250 35300 35350 35400 35450
Frequency (Hz)
Resp
on
se (
m/s
)
30 V (Up)
30 V ( Down)
Transducer
The transducer exhibits a softening characteristic The transducer-bar horn system exhibits a slightly hardening characteristic
Transducer and 1.5 wavelength bar horn system
Effect of Tuned Bar on Response Characteristic(Case I: Excitation 30 V)
19
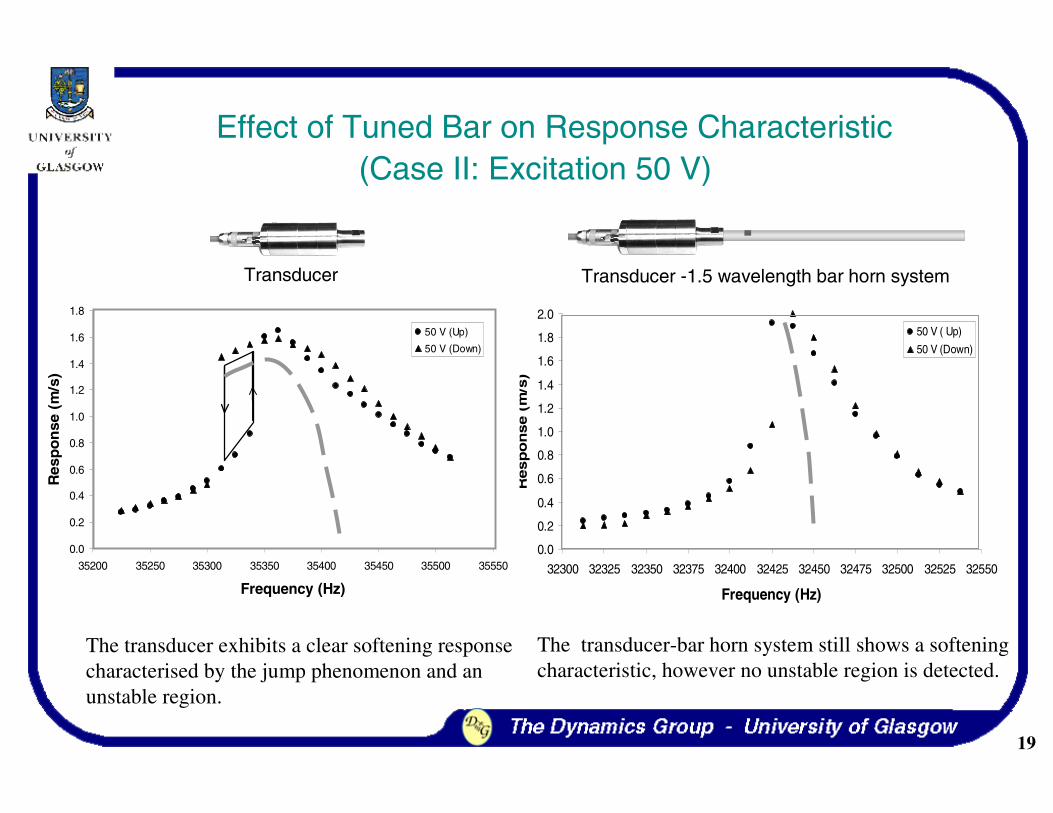
Effect of Tuned Bar on Response Characteristic(Case II: Excitation 50 V)
0.0
0.2
0.4
0.6
0.8
1.0
1.2
1.4
1.6
1.8
2.0
32300 32325 32350 32375 32400 32425 32450 32475 32500 32525 32550
Frequency (Hz)
Resp
on
se (
m/s
)
50 V ( Up)
50 V (Down)
The transducer exhibits a clear softening responsecharacterised by the jump phenomenon and an unstable region.
The transducer-bar horn system still shows a softening characteristic, however no unstable region is detected.
0.0
0.2
0.4
0.6
0.8
1.0
1.2
1.4
1.6
1.8
35200 35250 35300 35350 35400 35450 35500 35550
Frequency (Hz)
Res
po
nse
(m
/s)
50 V (Up)
50 V (Down)
Transducer Transducer -1.5 wavelength bar horn system
20
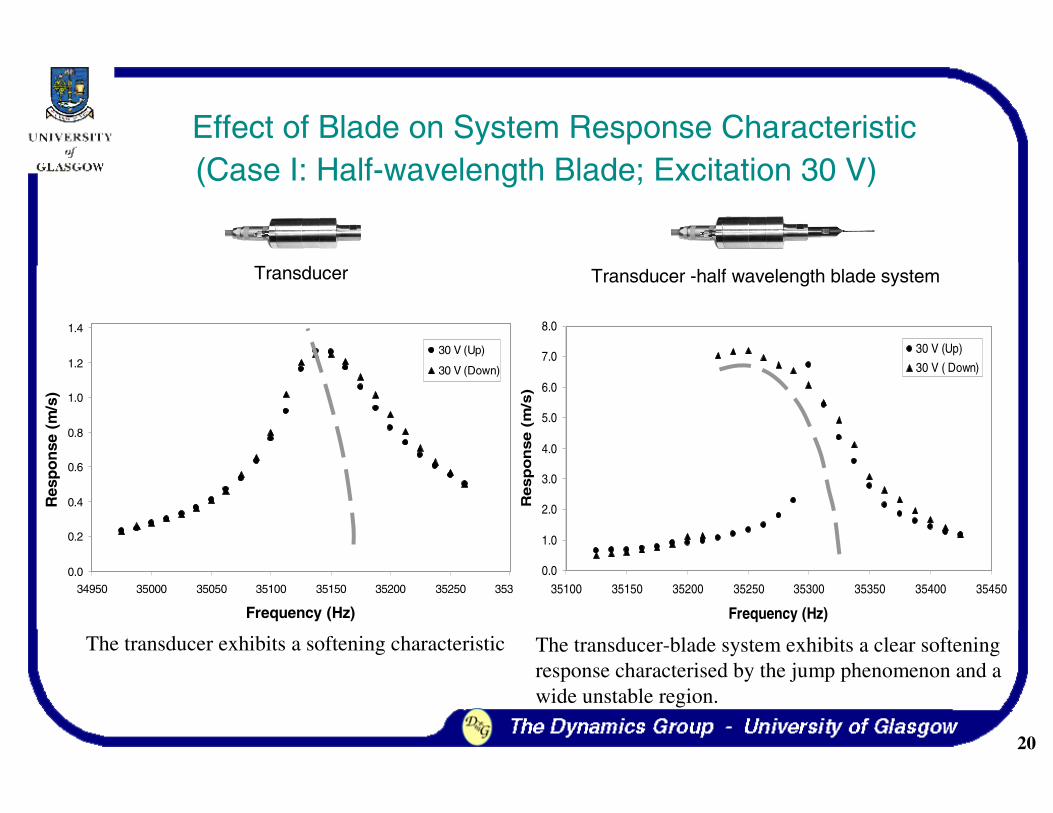
Effect of Blade on System Response Characteristic
0.0
0.2
0.4
0.6
0.8
1.0
1.2
1.4
34950 35000 35050 35100 35150 35200 35250 35300
Frequency (Hz)
Res
po
nse
(m
/s)
30 V (Up)
30 V (Down)
0.0
1.0
2.0
3.0
4.0
5.0
6.0
7.0
8.0
35100 35150 35200 35250 35300 35350 35400 35450
Frequency (Hz)
Resp
on
se (
m/s
)
30 V (Up)
30 V ( Down)
Transducer -half wavelength blade systemTransducer
(Case I: Half-wavelength Blade; Excitation 30 V)
The transducer exhibits a softening characteristic The transducer-blade system exhibits a clear softening response characterised by the jump phenomenon and a wide unstable region.
21
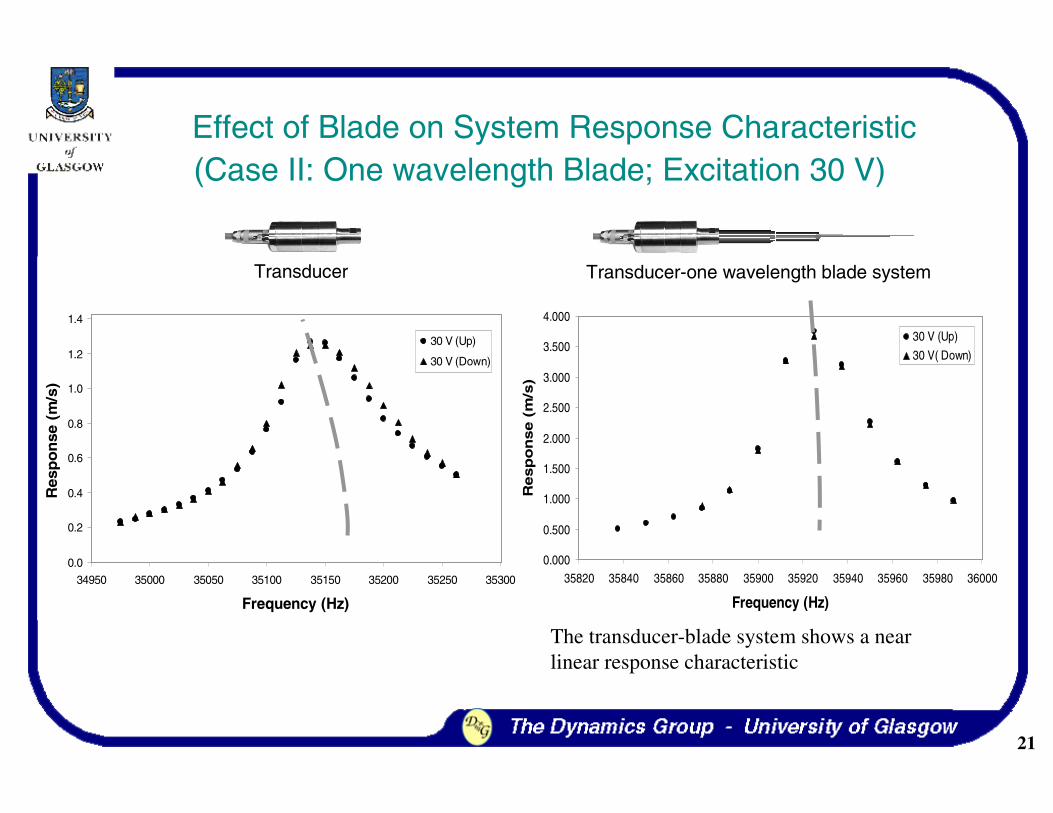
Effect of Blade on System Response Characteristic(Case II: One wavelength Blade; Excitation 30 V)
0.0
0.2
0.4
0.6
0.8
1.0
1.2
1.4
34950 35000 35050 35100 35150 35200 35250 35300
Frequency (Hz)
Res
po
nse
(m
/s)
30 V (Up)
30 V (Down)
Transducer Transducer -half wavelength blade system
The transducer-blade system shows a near linear response characteristic
0.000
0.500
1.000
1.500
2.000
2.500
3.000
3.500
4.000
35820 35840 35860 35880 35900 35920 35940 35960 35980 36000
Frequency (Hz)
Resp
on
se (
m/s
)
30 V (Up)
30 V( Down)
Transducer-one wavelength blade system
22
0
0.1
0.2
0.3
0.4
0.5
0.6
0.7
0.8
0.9
1
35150 35200 35250 35300 35350 35400 35450 35500
Frequency (Hz)
Res
po
nse
(m
/s)
30 V (Up)
30 V (Down)
0
0.2
0.4
0.6
0.8
1
1.2
1.4
1.6
35150 35200 35250 35300 35350 35400 35450
Frequency (Hz)
Res
po
nse
(m
/s)
30 V (Up)
30 V (Down)
0
0.2
0.4
0.6
0.8
1
1.2
1.4
35150 35200 35250 35300 35350 35400 35450 35500
Frequency (Hz)
Res
po
nse
(m
/s)
30 V (Up)
30 V (Down)
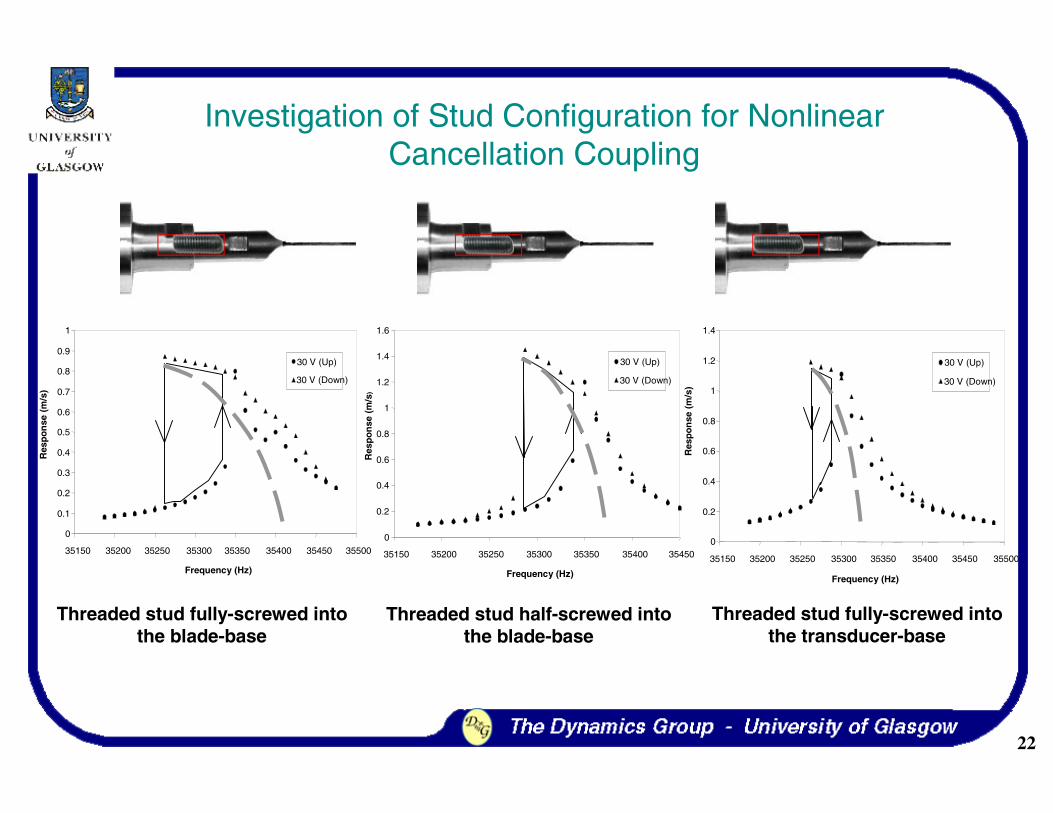
Threaded stud fully-screwed into the blade-base
Threaded stud half-screwed into the blade-base
Threaded stud fully-screwed into the transducer-base
Investigation of Stud Configuration for Nonlinear Cancellation Coupling
23
Conclusions
• FE analysis is an effective numerical method for design andanalysis of ultrasonic tools.
• Strategies have been proposed to reduce stress at blade failurelocations by geometric modifications (by blade profile andblock geometries).
• The nonlinear behaviour of ultrasonic cutting systems has beencharacterised experimentally.
• Strategies to reduce the effects of nonlinear reponses bycleaning the response spectrum have been proposed.
• Strategies to reduce nonlinearity by Nonlinear CancellationCoupling have been proposed.
Related Documents


