Welcome message from author
This document is posted to help you gain knowledge. Please leave a comment to let me know what you think about it! Share it to your friends and learn new things together.
Transcript


LUBRICATION AND RELIABILITY HANDBOOK

This Page Intentionally Left Blank
LUBRICATION AND RELIABILITY HANDBOOK
Edited by
M. J. NEALEOBE, BSc(Eng), DIC, FCGI, WhSch, FREng, FIMechE
BOSTON OXFORD AUCKLAND JOHANNESBURG MELBOURNE NEW DELHI
Copyright © 2001 by the editor and contributors
A member of the Reed Elsevier plc group
All rights reserved.
No part of this publication may be reproduced, stored in a retrieval system, or transmitted in any form or by anymeans, electronic, mechanical, photocopying, recording, or otherwise, without the prior written permission of thepublisher.
Recognizing the importance of preserving what has been written, Butterworth-Heinemann prints its books onacid-free paper whenever possible.
Butterworth-Heinemann supports the efforts of American Forests and the Global ReLeaf program in its campaignfor the betterment of trees, forests, and our environment.
Library of Congress Cataloging in Publication DataLubrication and reliability handbook/edited by M.J. Neale.
p. cm.ISBN 0 7506 5154 71. Lubrication and lubricants – Handbooks, manuals, etc. 2. Reliability(Engineering) – Handbooks, manual, etc. I Neale, M. J. (Michael John)TJ1075.L812 2000621.8'9–dc21 00–049378
British Library Cataloguing in Publication DataA catalogue record for this book is available from the British Library
The publisher offers special discounts on bulk orders of this book.For information, please contact:Manager of Special SalesButterworth-Heinemann225 Wildwood AvenueWoburn, MA 01801-2041Tel: 781-904-2500Fax: 781-904-2620
For information on all Butterworth-Heinemann publications available, contact our World Wide Web home page at:http://www.bh.com
10 9 8 7 6 5 4 3 2 1
Composition by Genesis Typesetting, Rochester, Kent, EnglandPrinted in the United States of America
CONTENTS
IntroductionList of Contributors
LubricantsA1 Selection of lubricant typeA2 Mineral oilsA3 Synthetic oilsA4 GreasesA5 Solid lubricants and coatingsA6 Other liquids
Lubrication of componentsA7 Plain bearingsA8 Rolling bearingsA9 Gears and roller chainsA10 Wire ropesA11 Flexible couplingsA12 SlidesA13 Lubricant selection
Lubrication systemsA14 Selection of lubrication systemsA15 Total loss grease systemsA16 Total loss oil and fluid grease systemsA17 Mist systemsA18 Dip, splash systemsA19 Circulation systemsA20 Design of oil tanksA21 Oil pumpsA22 Filters and centrifugesA23 Heaters and coolersA24 A guide to piping designA25 Warning and protection devices
Machine operationA26 Commissioning lubrication systemsA27 Running-in proceduresA28 Industrial plant environmental dataA29 High pressure and vacuumA30 High and low temperaturesA31 Chemical effects
Machine maintenanceB1 Maintenance methodsB2 Condition monitoringB3 Operating temperature limitsB4 Vibration analysisB5 Wear debris analysisB6 Lubricant change periods and testsB7 Lubricant biological deteriorationB8 Component performance analysisB9 Allowable wear limits
Component failuresB10 Failure patterns and analysisB11 Plain bearingsB12 Rolling bearingsB13 GearsB14 Pistons and ringsB15 SealsB16 Brakes and clutchesB17 Wire ropesB18 Fretting of surfacesB19 Wear mechanisms
Component repairB20 Repair of worn surfacesB21 Wear resistant materialsB22 Repair of plain bearingsB23 Repair of friction surfaces
Reference dataC1 Viscosity of lubricantsC2 Surface hardnessC3 Surface finish and shapeC4 Shape tolerances of componentsC5 SI units and conversion factors
Index

This Page Intentionally Left Blank
INTRODUCTION
This handbook is intended to help engineers in industrywith the operation and maintenance of machinery. Itgives the information that these engineers need in aform that is instantly accessible and easy to read.
The manufacturers of machinery provide guidance onthe operation, lubrication and maintenance required fortheir particular machines. However, there are, of course,many different machines in an industrial plant or serviceorganisation, supplied by various manufacturers, andthere is a need to select as many similar lubricants aspossible, and to use related maintenance techniques.This book attempts to bridge the gap which existsbetween the available data on the various machines, byproviding overall guidance on how to co-ordinate therecommendations of the various manufacturers.
The handbook is structured in a number of sections tomake it easier to use, and to bring together relatedsubjects, so that the reader when focusing on a particularproblem can also refer to related material that is likely tobe of interest. The various sections are listed here in thisintroduction, to provide some overall guidance, addi-tional to that available in the contents list and theindex.
Lubricants
This section describes the various types of lubricant thatare available with guidance on their overall propertiesand performance. Detailed information is provided onmineral oils, synthetic oils, greases and solid lubricants,as well as on the various oil additives that are commonlyused. Since some machines are now lubricated by theirown process fluids information is also given on theviscosity of water, refrigerants and various hydrocarbonsand chemicals.
Lubrication of components
The lubrication of machines relates to the lubrication oftheir various moving components. This section givesguidance on the selection of lubricants to match theneeds of the components under a range of operatingconditions. The components covered are plain androlling bearings, gears, roller chains, wire ropes, flexiblecouplings and slides.
Lubrication systems
The next subject requiring review is the optimummethod of feeding the lubricant to the various machinesand their components. This can range from manualgreasing to automated centralising greasing systems, andfrom splash, wick and ring oil feeding to pressurised mistsystems and full size oil circulation systems. Detailedguidance is also given on the selection and design ofcirculation system components such as oil tanks, pumps,
filters and coolers as well as the interconnecting pipingsystems and the necessary instrumentation and warningdevices.
Machine operation
The machine manufacturers and/or process designerswill usually provide the necessary guidance on machineoperating conditions. The operating engineers canhowever benefit from additional guidance on running inprocedures, and on lubricant related operating prob-lems, such as potential lubricant deterioration due tohigh or low temperatures, and the effect of contaminantprocess gases and liquids. Information is provided onthese areas, together with data on fire or health hazardsfrom lubricants.
Machine maintenance
To keep the machines in a plant or fleet operatingeffectively, requires good maintenance procedures. Thehandbook reviews the suitability of the various main-tenance methods for various types of machines and givesguidance on their selection. Condition based main-tenance is covered in detail with the various methods bywhich the condition of a machine can be monitoredwhile it is in operation, so that future essential main-tenance can be planned. Such methods include tem-perature measurement, vibration analysis, wear debrisanalysis, and lubricant tests, as well as methods ofassessing the operating performance of machinecomponents.
Component failure
When a failure does occur on one of the workingcomponents of a machine, such as a bearing, gear, seal orcoupling, it is useful to have guidance on understandingthe causes of the failure from the appearance of thefailed component. This section therefore includes alarge number of photographs of machine componentsshowing the typical surface appearance associated withthe various failure modes.
Component repair
Finally, after a failure has occurred it is useful to haveguidance on how a worn surface can be rebuilt orrefaced, or how a bearing or friction surface can berelined.
This handbook is based on experience from aroundthe world, over many years, of the investigation ofproblems with machines of all kinds, and of dealing withthese by practical and economical solutions. It is hopedthat it will be helpful to the many engineers involved inmachine operation and maintenance of all kinds ofmachinery and plant.

This Page Intentionally Left Blank

CONTRIBUTORS
Section Author
Selection of lubricant type A. R. Lansdown MSc, PhD, FRIC, FInstPet
Mineral oils T. I. Fowle BSc(Hons), ACGI, CEng, FIMechE
Synthetic oils A. R. Lansdown MSc, PhD, FRIC, FInstPet
Greases N. Robinson & A. R. Lansdown MSc, PhD, FRIC, FInstPet
Solid lubricants and coatings J. K. Lancaster PhD, DSc, FInstP
Other liquids D. T. Jamieson FRIC
Plain bearing lubrication J. C. Bell BSc, PhD
Rolling bearing lubrication E. L. Padmore CEng, MIMechE
Gear and roller chain lubrication J. Bathgate BSc, CEng, MIMechE
Wire rope lubrication D. M. Sharp
Lubrication of flexible couplings J. D. Summers-Smith BSc, PhD, CEng, FIMechE
Slide lubrication M. J. Neale OBE, BSc(Eng), DIC, FCGI, WhSch, FEng, FIMechE
Lubricant selection R. S. Burton
Selection of lubrication systems W. J. J. Crump BSc, ACGI, FInstP
Total loss grease systems P. L. Langborne BA, CEng, MIMechE
Total loss oil and fluid grease systems P. G. F. Seldon CEng, MIMechE
Mist systems R. E. Knight BSc, FCGI
Dip splash systems J. Bathgate BSc, CEng, MIMechE
Circulation systems D. R. Parkinson FInstPet
Design of oil tanks A. G. R. Thomson BSc(Eng), CEng, AFRAeS
Selection of oil pumps A. J. Twidale
Selection of filters and centrifuges R. H. Lowres CEng, MIMechE, MIProdE, MIMarE, MSAE,MBIM
Selection of heaters and coolers J. H. Gilbertson CEng, MIMechE, AMIMarE
A guide to piping design P. D. Swales BSc, PhD, CEng, MIMechE
Selection of warning and protection devices A. J. Twidale
Commissioning lubrication systems N. R. W. Morris
Running-in procedures W. C. Pike BSc, ACGI, CEng, MIMechE
Industrial plant environmental data R. L. G. Keith BSc
High pressure and vacuum A. R. Lansdown MSc, PhD, FRIC, FInstPetJ. D. Summers-Smith BSc, PhD, CEng, FIMechE
High and low temperatures M. J. Todd MA
Chemical effects H. H. Anderson BSc(Hons), CEng, FIMechE
Maintenance methods M. J. Neale OBE, BSc(Eng), DIC, FCGI, WhSch, FEng, FIMechE
Condition monitoring M. J. Neale OBE, BSc(Eng), DIC, FCGI, WhSch, FEng, FIMechE
Operating temperature limits J. D. Summers-Smith BSc, PhD, CEng, FIMechE
Vibration analysis M. J. Neale OBE, BSc(Eng), DIC, FCGI, WhSch, FEng, FIMechE
Wear debris analysis M. H. Jones BSc(Hons), CEng, MIMechE, MInstNDTM. J. Neale OBE, BSc(Eng), DIC, FCGI, WhSch, FEng, FIMechE
Lubricant change periods and tests J. D. Summers-Smith BSc, PhD, CEng, FIMechE
Lubricant biological deterioration E. C. Hill MSc, FInstPet
Component performance analysis M. J. Neale OBE, BSc(Eng), DIC, FCGI, WhSch, FEng, FIMechE
Allowable wear limits H. H. Heath FIMechE

CONTRIBUTORS
Section Author
Failure patterns and failure analysis J. D. Summers-Smith BSc, PhD, CEng, FIMechEM. J. Neale OBE, BSc(Eng), DIC, FCGI, WhSch, FEng, FIMechE
Plain bearing failures P. T. Holingan BSc(Tech), FIM
Rolling bearing failures W. J. J. Crump BSc, ACGI, FInstP
Gear failures T. I. Fowle BSc(Hons), ACGI, CEng, FIMechEH. J. Watson BSc(Eng), CEng, MIMechE
Piston and ring failures M. J. Neale OBE, BSc(Eng), DIC, FCGI, WhSch, FEng, FIMechE
Seal failures B. S. Nau BSc, PhD, ARCS, CEng, FIMechE, MemASME
Brake and clutch failures T. P. Newcombe DSc, CEng, FIMechE, FInstPR. T. Spurr BSc, PhD
Wire rope failures S. Maw MA, CEng, MIMechE
Fretting of surfaces R. B. Waterhouse MA, PhD, FIM
Wear mechanisms K. H. R. Wright PhD, FInstP
Repair of worn surfaces G. R. Bell BSc, ARSM, CEng, FIM, FWeldI, FRIC
Wear resistant materials H. Hocke CEng, MIMechE, FIPlantE, MIMH, FILM. Bartle CEng, MIM, DipIM, MIIM, AMWeldI
Repair of plain bearings P. T. Holligan BSc(Tech), FIM
Repair of friction surfaces T. P. Newcomb DSc, CEng, FIMechE, FInstPR. T. Spurr BSc, PhD
Viscosity of lubricants H. Naylor BSc, PhD, CEng, FIMechE
Surface hardness M. J. Neale OBE, BSc(Eng), DIC, FCGI, WhSch, FEng, FIMechE
Surface finish and shape R. E. Reason DSc, ARCS, FRS
Shape tolerances of components J. J. Crabtree BSc(Tech)Hons
S.I. units and conversion factors M. J. Neale OBE, BSc(Eng), DIC, FCGI, WhSch, FEng, FIMechE
A1Selection of lubricant type
A1.1
Table 1.1 Importance of lubricant properties in relation to bearing type
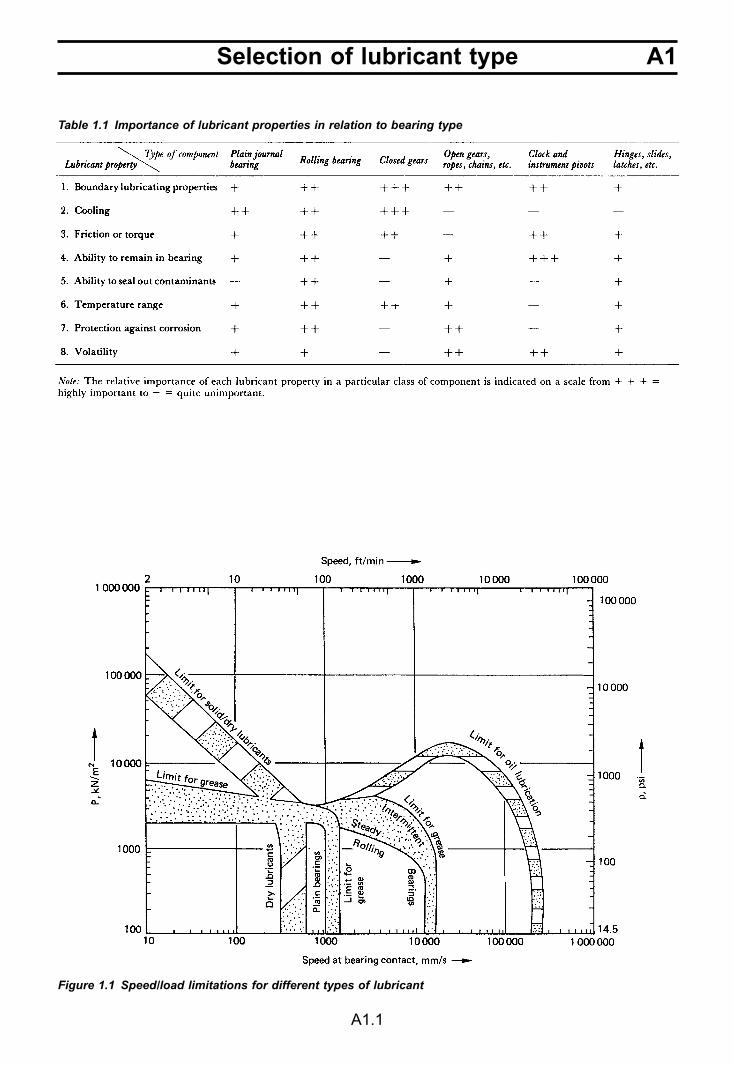
Figure 1.1 Speed/load limitations for different types of lubricant
A1 Selection of lubricant type
A1.2
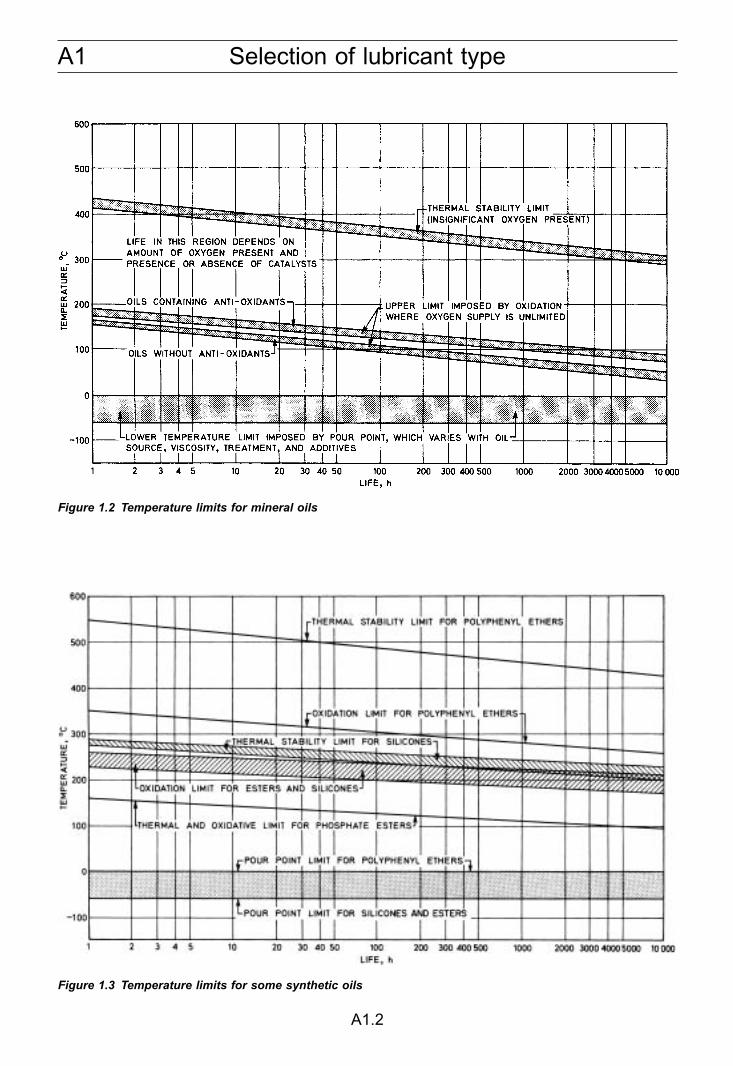
Figure 1.2 Temperature limits for mineral oils
Figure 1.3 Temperature limits for some synthetic oils
A1Selection of lubricant type
A1.3
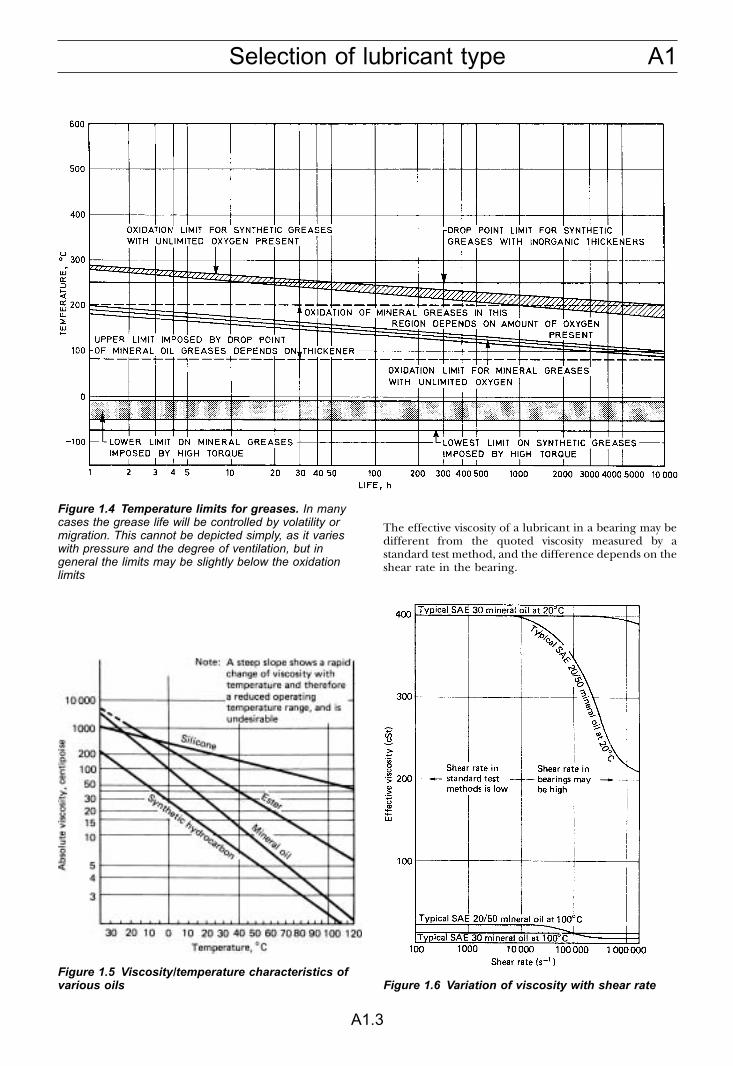
Figure 1.4 Temperature limits for greases. In manycases the grease life will be controlled by volatility ormigration. This cannot be depicted simply, as it varieswith pressure and the degree of ventilation, but ingeneral the limits may be slightly below the oxidationlimits
Figure 1.5 Viscosity/temperature characteristics ofvarious oils Figure 1.6 Variation of viscosity with shear rate
The effective viscosity of a lubricant in a bearing may bedifferent from the quoted viscosity measured by astandard test method, and the difference depends on theshear rate in the bearing.
A2 Mineral oils
A2.1
CLASSIFICATION
Mineral oils are basically hydrocarbons, but all containthousands of different types of varying structure, molec-ular weight and volatility, as well as minor but importantamounts of hydrocarbon derivatives containing one ormore of the elements nitrogen, oxygen and sulphur.They are classified in various ways as follows.
Types of crude petroleum
Paraffinic Contains significant amounts of waxy hydro-carbons and has ‘wax’ pour point (seebelow) but little or no asphaltic matter.Their naphthenes have long side-chains.
Naphthenic Contains asphaltic matter in least volatilefractions, but little or no wax. Their naph-thenes have short side-chains. Has ‘viscosity’pour point.
Mixed base Contains both waxy and asphaltic materials.Their naphthenes have moderate to longsidechains. Has ‘wax’ pour point.
Viscosity index
Lubricating oils are also commonly classified by theirchange in kinematic viscosity with temperature, i.e. bytheir kinematic viscosity index or KVI. Formerly, KVIsranged between 0 and 100 only, the higher figuresrepresenting lower degrees of viscosity change withtemperature, but nowadays oils may be obtained withKVIs outside these limits. They are generally groupedinto high, medium and low, as in Table 2.1.
It should be noted, however, that in Table 2.5 viscosityindex has been determined from dynamic viscosities bythe method of Roelands, Blok and Vlugter,1 since this isa more fundamental system and allows truer comparisonbetween mineral oils. Except for low viscosity oils, whenDVIs are higher than KVIs, there is little differencebetween KVI and DVI for mineral oils.
Traditional use
Dating from before viscosity could be measured accu-rately, mineral oils were roughly classified into viscositygrades by their typical uses as follows:
Spindle oils Low viscosity oils (e.g. below about0.01 Ns/m2 at 60°C,) suitable for thelubrication of high-speed bearingssuch as textile spindles.
Light machine oils Medium viscosity oils (e.g. 0.01–0.02Ns/m2) at 60°C, suitable for machin-ery running at moderate speeds.
Heavy machine oils Higher viscosity oils (e.g. 0.02–0.10Ns/m2) at 60°C, suitable for slow-moving machinery.
Cylinder oils Suitable for the lubrication of steamengine cylinder; viscosities from 0.12to 0.3 Ns/m2 at 60°C.
Hydrocarbon types
The various hydrocarbon types are classified as follows:
(a) Chemically saturated (i.e. no double valence bonds)straight and branched chain. (Paraffins or alkanes.)
(b) Saturated 5- and 6-membered rings with attachedside-chains of various lengths up to 20 carbon atomslong. (Naphthenes.)
(c) As (b) but also containing 1, 2 or more 6-memberedunsaturated ring groups, i.e. containing doublevalence bonds, e.g. mono-aromatics, di-aromatics,polynuclear aromatics, respectively.
A typical paraffinic lubricating oil may have thesehydrocarbon types in the proportions given in Table 2.2.
The VI of the saturates has a predominant influence onthe VI of the oil. In paraffinic oils the VI of the saturatesmay be 105–120 and 60–80 in naphthenic oils.
Table 2.1 Classification by viscosity index
Table 2.2 Hydrocarbon types in Venezuelan 95 VIsolvent extracted and dewaxed distillate
A2Mineral oils
A2.2
Structural group analyses
This is a useful way of accurately characterising mineraloils and of obtaining a general picture of their structurewhich is particularly relevant to physical properties, e.g.increase of viscosity with pressure. From certain otherphysical properties the statistical distribution of carbon
atoms in aromatic groups (% CA), in naphthenic groups(% CN), in paraffinic groups (% CP), and the totalnumber (RT) of naphthenic and aromatic rings (RN andRA) joined together. Table 2.3 presents examples on anumber of typical oils.
REFINING
Distillation
Lubricants are produced from crude petroleum bydistillation according to the outline scheme given inFigure 2.1.
The second distillation is carried out under vacuum toavoid subjecting the oil to temperatures over about 370°C,which would rapidly crack the oil.
The vacuum residues of naphthenic crudes are bitu-mens. These are not usually classified as lubricants but are
used as such on some plain bearings subject to hightemperatures and as blending components in oils andgreases to form very viscous lubricants for open gears, etc.
Refining processes
The distillates and residues are used to a minor extent assuch, but generally they are treated or refined both beforeand after vacuum distillation to fit them for the morestringent requirements. The principal processes listed inTable 2.4 are selected to suit the type of crude oil and theproperties required.
Elimination of aromatics increases the VI of an oil. Alightly refined naphthenic oil may be LVI but MVI ifhighly refined. Similarly a lightly refined mixed-base oilmay be MVI but HVI if highly refined. Elimination ofaromatics also reduces nitrogen, oxygen and sulphurcontents.
The distillates and residues may be used alone orblended together. Additionally, minor amounts of fattyoils or of special oil-soluble chemicals (additives) areblended in to form additive engine oils, cutting oils, gearoils, hydraulic oils, turbine oils, and so on, with superiorproperties to plain oils, as discussed below. The tolerancein blend viscosity for commercial branded oils is typically±4% but official standards usually have wider limits, e.g.±10% for ISO 3448.
PHYSICAL PROPERTIES
Viscosity-temperature
Figure 2.4 illustrates the variation of viscosity withtemperature for a series of oils with kinematic viscosity
Table 2.3 Typical structural group analyses (courtesy: Institution of Mechanical Engineers)
Figure 2.1 (courtesy: Institution of MechanicalEngineers)

A2 Mineral oils
A2.3
index of 95 (dynamic viscosity index 93). Figure 2.2shows the difference between 150 Grade ISO 3448 oilswith KVIs of 0 and 95.
Viscosity-pressure
The viscosity of oils increases significantly under pres-sure. Naphthenic oils are more affected than paraffinicbut, very roughly, both double their viscosity for every35 MN/m2 increase of pressure. Figure 2.3 gives animpression of the variation in viscosity of an SAE 20 WISO 3448 or medium machine oil, HVI type, with bothtemperature and pressure.
In elastohydrodynamic (ehl) formulae it is usuallyassumed that the viscosity increases exponentially withpressure. Though in fact considerable deviations from anexponential increase may occur at high pressures, theassumption is valid up to pressures which control ehlbehaviour, i.e. about 35 MN/m2. Typical pressure vis-cosity coefficients are given in Table 2.5, together withother physical properties.
Pour point
De-waxed paraffinic oils still contain 1% or so of waxyhydrocarbons, whereas naphthenic oils only have tracesof them. At about 0°C, according to the degree ofdewaxing, the waxes in paraffinic oils crystallise out ofsolution and at about –10°C the crystals grow to theextent that the remaining oil can no longer flow. Thistemperature, or close to it, when determined underspecified conditions is known as the pour point. Naph-
thenic oils, in contrast, simply become so viscous withdecreasing temperature that they fail to flow, althoughno wax crystal structure develops. Paraffinic oils aretherefore said to have ‘wax’ pour points while naph-thenic oils are said to have ‘viscosity’ pour points.
Table 2.4 Refining processes (Courtesy: Institutionof Mechanical Engineers)
Figure 2.2 150 grade ISO 3448 oils of 0 and 95 KVI
Figure 2.3 Variation of viscosity with temperatureand pressure of an SAE 20 W (HVI) oil (Courtesy:Institution of Mechanical Engineers)
A2
Mineral oils
A2.4
Figure 2.4 ISO 3448 ranges for 95 KVI oils with approximate SAE limits
A2 Mineral oils
A2.5
Thermal properties
DETERIORATION
Lubricating oils can become unfit for further service by:oxidation, thermal decomposition, and contamination.
Oxidation
Mineral oils are very stable relative to fatty oils and purehydrocarbons. This stability is ascribed to the combina-tion of saturated and unsaturated hydrocarbons and tocertain of the hydrocarbon derivatives, i.e. compoundscontaining oxygen, nitrogen and sulphur atoms – the so-called ‘natural inhibitors’.
Factors influencing oxidation
Temperature Rate doubles for every 8–10°C tempera-ture rise.
Oxygen access Degree of agitation of the oil with air.Catalysis Particularly iron and copper in finely
divided or soluble form.Top-up rate Replenishment of inhibition (natural or
added).Oil type Proportions and type of aromatics and
especially on the compounds containingnitrogen, oxygen, sulphur.
Table 2.5 Typical physical properties of highly refined mineral oils (Courtesy: Institution of MechanicalEngineers)
Table 2.6 Effects of oxidation and methods of test
A2Mineral oils
A2.6
Thermal decomposition
Mineral oils are also relatively stable to thermal decom-position in the absence of oxygen, but at temperaturesover about 330°C, dependent on time, mineral oils willdecompose into fragments, some of which polymerise toform hard insoluble products.
Some additives are more liable to thermal decomposi-tion than the base oils, e.g. extreme pressure additives;and surface temperature may have to be limited totemperatures as low as 130°C.
Contamination
Contamination is probably the most common reason forchanging an oil. Contaminants may be classified asshown in Table 2.8.
Where appropriate, oils are formulated to cope withlikely contaminants, for example turbine oils aredesigned to separate water and air rapidly, diesel engineoils are designed to suspend fuel soot in harmless finelydivided form and to neutralise acids formed fromcombustion of the fuel.
Solid contaminants may be controlled by appropriatefiltering or centrifuging or both. Limits depend on theabrasiveness of the contaminant and the sensitivity of thesystem.
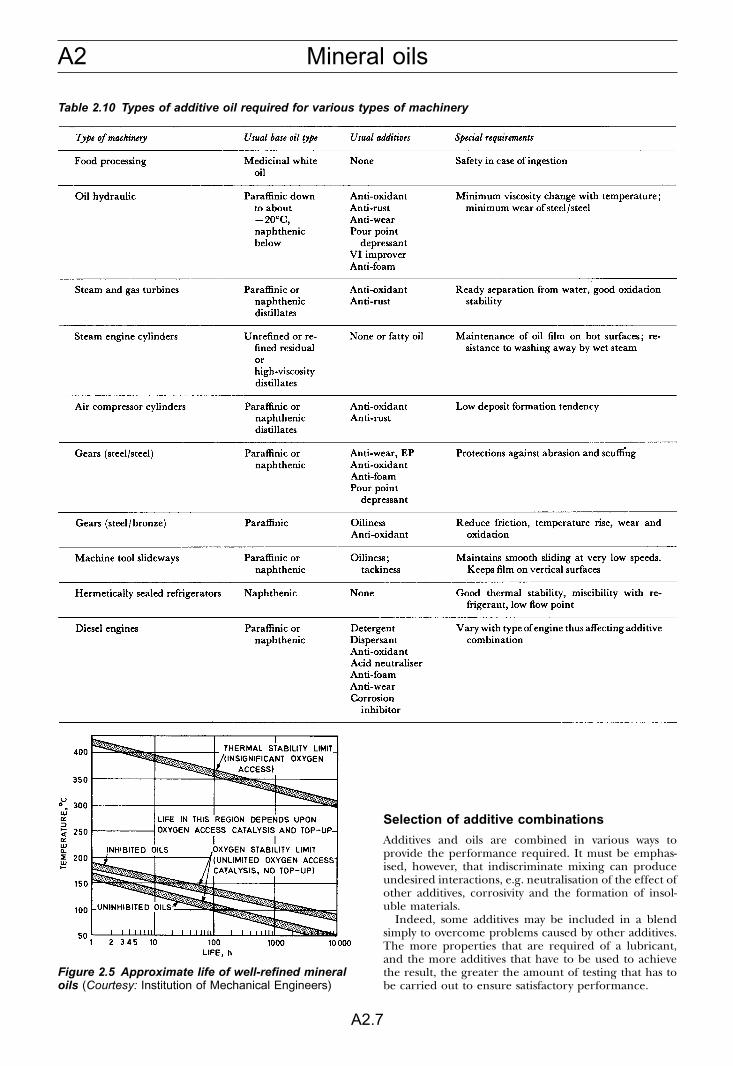
Oil life
Summarising the data given under the headings Oxida-tion and Thermal decomposition, above, Figure 2.5 givesan indication of the time/temperature limits imposed bythermal and oxidation stability on the life of a well-refined HVI paraffinic oil.
ADDITIVE OILS
Plain mineral oils are used in many units and systems forthe lubrication of bearings, gears and other mechanismswhere their oxidation stability, operating temperaturerange, ability to prevent wear, etc., are adequate. Nowa-days, however, the requirements are often greater thanplain oils are able to provide, and special chemicals oradditives are ‘added’ to many oils to improve theirproperties. The functions required of these ‘additives’gives them their common names listed in Table 2.9.Table 2.7 Thermal decomposition products
Table 2.8 Contaminants
Table 2.9 Types of additives
A2 Mineral oils
A2.7
Selection of additive combinations
Additives and oils are combined in various ways toprovide the performance required. It must be emphas-ised, however, that indiscriminate mixing can produceundesired interactions, e.g. neutralisation of the effect ofother additives, corrosivity and the formation of insol-uble materials.
Indeed, some additives may be included in a blendsimply to overcome problems caused by other additives.The more properties that are required of a lubricant,and the more additives that have to be used to achievethe result, the greater the amount of testing that has tobe carried out to ensure satisfactory performance.
Table 2.10 Types of additive oil required for various types of machinery
Figure 2.5 Approximate life of well-refined mineraloils (Courtesy: Institution of Mechanical Engineers)
A3Synthetic oils
A3.1
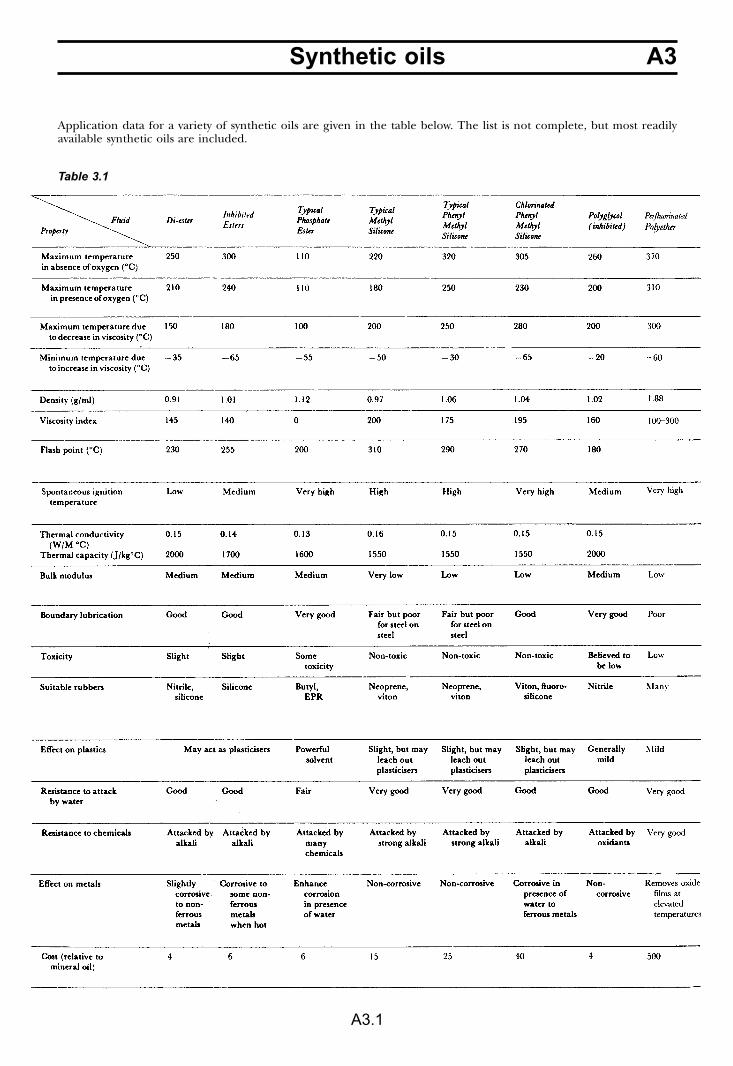
Application data for a variety of synthetic oils are given in the table below. The list is not complete, but most readilyavailable synthetic oils are included.
Table 3.1
A3 Synthetic oils
A3.2
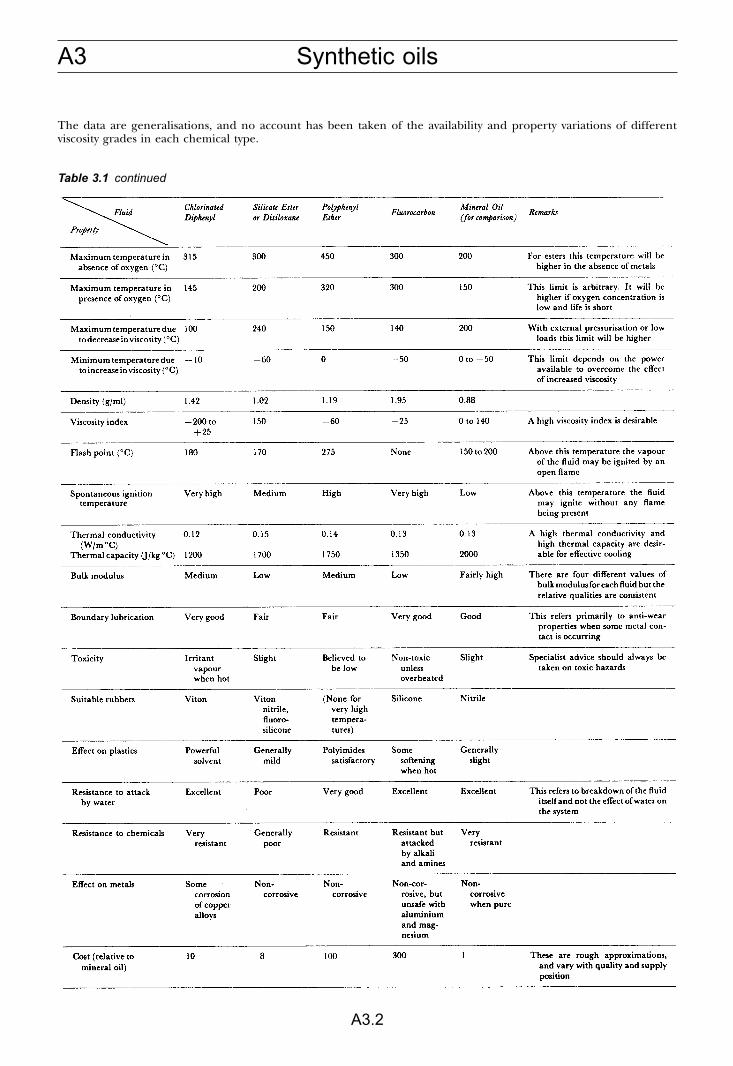
The data are generalisations, and no account has been taken of the availability and property variations of differentviscosity grades in each chemical type.
Table 3.1 continued
A4Greases
A4.1
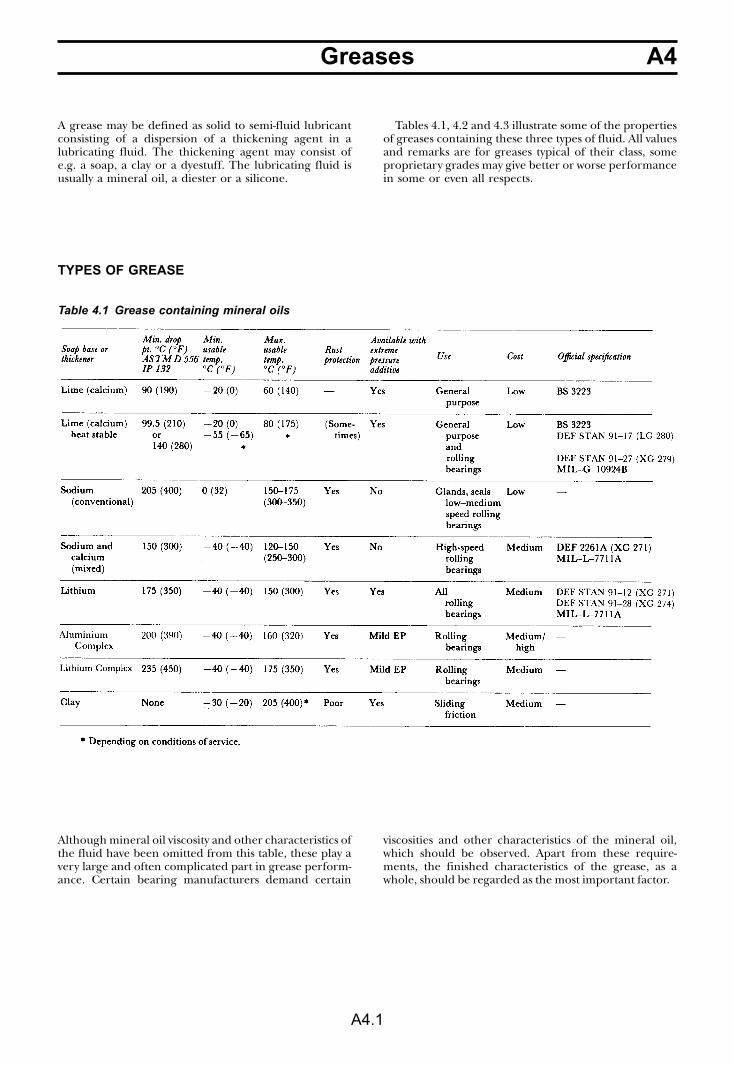
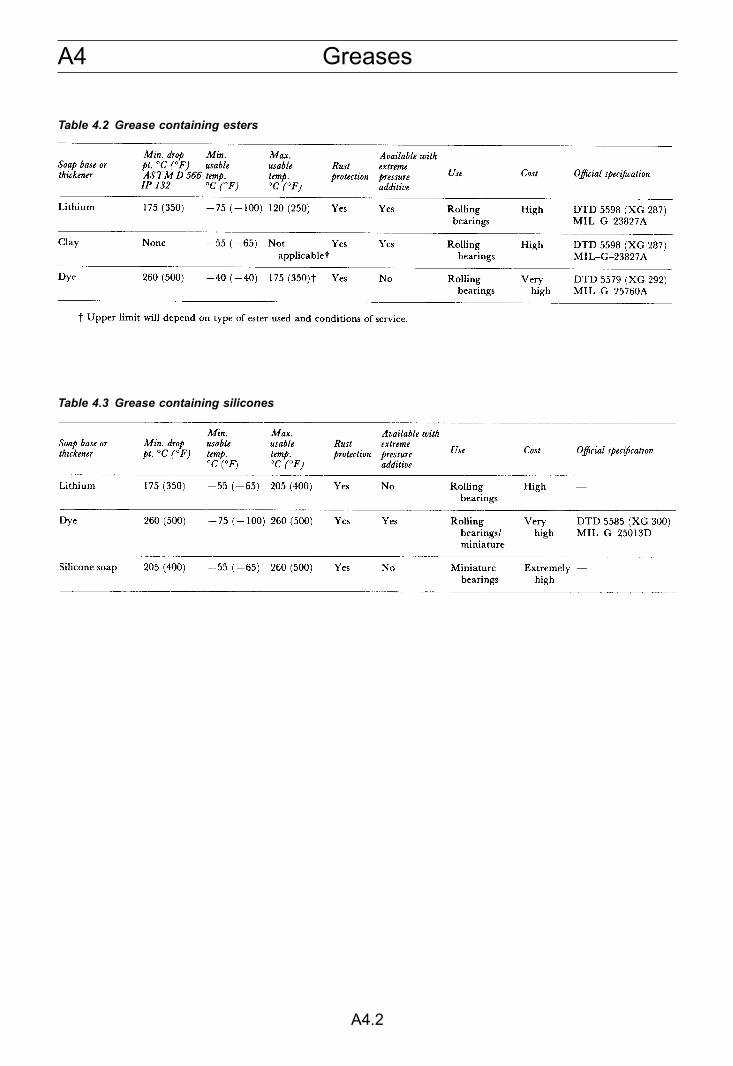
A grease may be defined as solid to semi-fluid lubricantconsisting of a dispersion of a thickening agent in alubricating fluid. The thickening agent may consist ofe.g. a soap, a clay or a dyestuff. The lubricating fluid isusually a mineral oil, a diester or a silicone.
Tables 4.1, 4.2 and 4.3 illustrate some of the propertiesof greases containing these three types of fluid. All valuesand remarks are for greases typical of their class, someproprietary grades may give better or worse performancein some or even all respects.
TYPES OF GREASE
Although mineral oil viscosity and other characteristics ofthe fluid have been omitted from this table, these play avery large and often complicated part in grease perform-ance. Certain bearing manufacturers demand certain
viscosities and other characteristics of the mineral oil,which should be observed. Apart from these require-ments, the finished characteristics of the grease, as awhole, should be regarded as the most important factor.
Table 4.1 Grease containing mineral oils
A4 Greases
A4.2
Table 4.2 Grease containing esters
Table 4.3 Grease containing silicones
A4Greases
A4.3
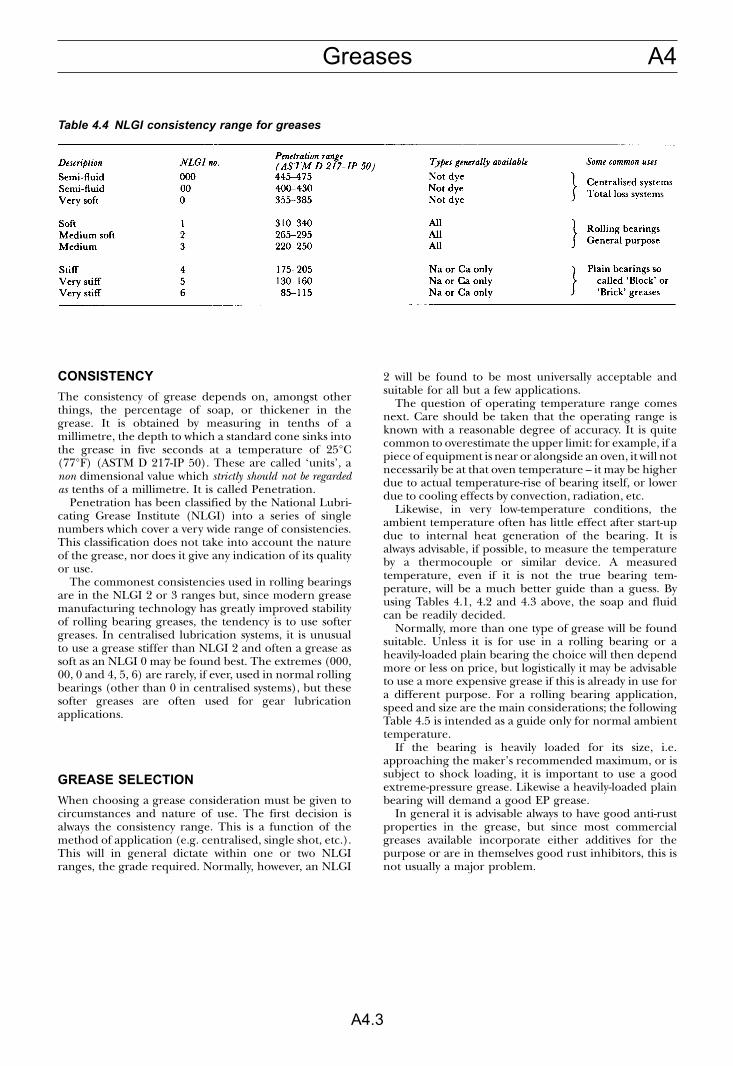
CONSISTENCY
The consistency of grease depends on, amongst otherthings, the percentage of soap, or thickener in thegrease. It is obtained by measuring in tenths of amillimetre, the depth to which a standard cone sinks intothe grease in five seconds at a temperature of 25°C(77°F) (ASTM D 217-IP 50). These are called ‘units’, anon dimensional value which strictly should not be regardedas tenths of a millimetre. It is called Penetration.
Penetration has been classified by the National Lubri-cating Grease Institute (NLGI) into a series of singlenumbers which cover a very wide range of consistencies.This classification does not take into account the natureof the grease, nor does it give any indication of its qualityor use.
The commonest consistencies used in rolling bearingsare in the NLGI 2 or 3 ranges but, since modern greasemanufacturing technology has greatly improved stabilityof rolling bearing greases, the tendency is to use softergreases. In centralised lubrication systems, it is unusualto use a grease stiffer than NLGI 2 and often a grease assoft as an NLGI 0 may be found best. The extremes (000,00, 0 and 4, 5, 6) are rarely, if ever, used in normal rollingbearings (other than 0 in centralised systems), but thesesofter greases are often used for gear lubricationapplications.
GREASE SELECTION
When choosing a grease consideration must be given tocircumstances and nature of use. The first decision isalways the consistency range. This is a function of themethod of application (e.g. centralised, single shot, etc.).This will in general dictate within one or two NLGIranges, the grade required. Normally, however, an NLGI
2 will be found to be most universally acceptable andsuitable for all but a few applications.
The question of operating temperature range comesnext. Care should be taken that the operating range isknown with a reasonable degree of accuracy. It is quitecommon to overestimate the upper limit: for example, if apiece of equipment is near or alongside an oven, it will notnecessarily be at that oven temperature – it may be higherdue to actual temperature-rise of bearing itself, or lowerdue to cooling effects by convection, radiation, etc.
Likewise, in very low-temperature conditions, theambient temperature often has little effect after start-updue to internal heat generation of the bearing. It isalways advisable, if possible, to measure the temperatureby a thermocouple or similar device. A measuredtemperature, even if it is not the true bearing tem-perature, will be a much better guide than a guess. Byusing Tables 4.1, 4.2 and 4.3 above, the soap and fluidcan be readily decided.
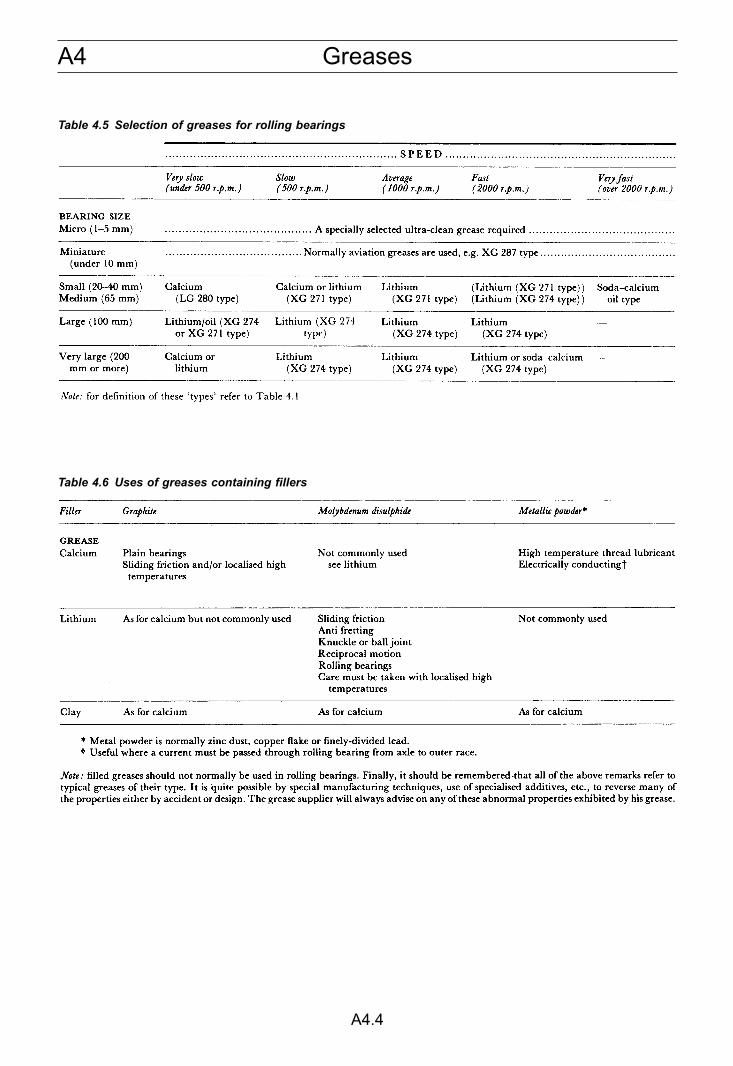
Normally, more than one type of grease will be foundsuitable. Unless it is for use in a rolling bearing or aheavily-loaded plain bearing the choice will then dependmore or less on price, but logistically it may be advisableto use a more expensive grease if this is already in use fora different purpose. For a rolling bearing application,speed and size are the main considerations; the followingTable 4.5 is intended as a guide only for normal ambienttemperature.
If the bearing is heavily loaded for its size, i.e.approaching the maker’s recommended maximum, or issubject to shock loading, it is important to use a goodextreme-pressure grease. Likewise a heavily-loaded plainbearing will demand a good EP grease.
In general it is advisable always to have good anti-rustproperties in the grease, but since most commercialgreases available incorporate either additives for thepurpose or are in themselves good rust inhibitors, this isnot usually a major problem.
Table 4.4 NLGI consistency range for greases
A4 Greases
A4.4
Table 4.5 Selection of greases for rolling bearings
Table 4.6 Uses of greases containing fillers
A5Solid lubricants and coatings
A5.1
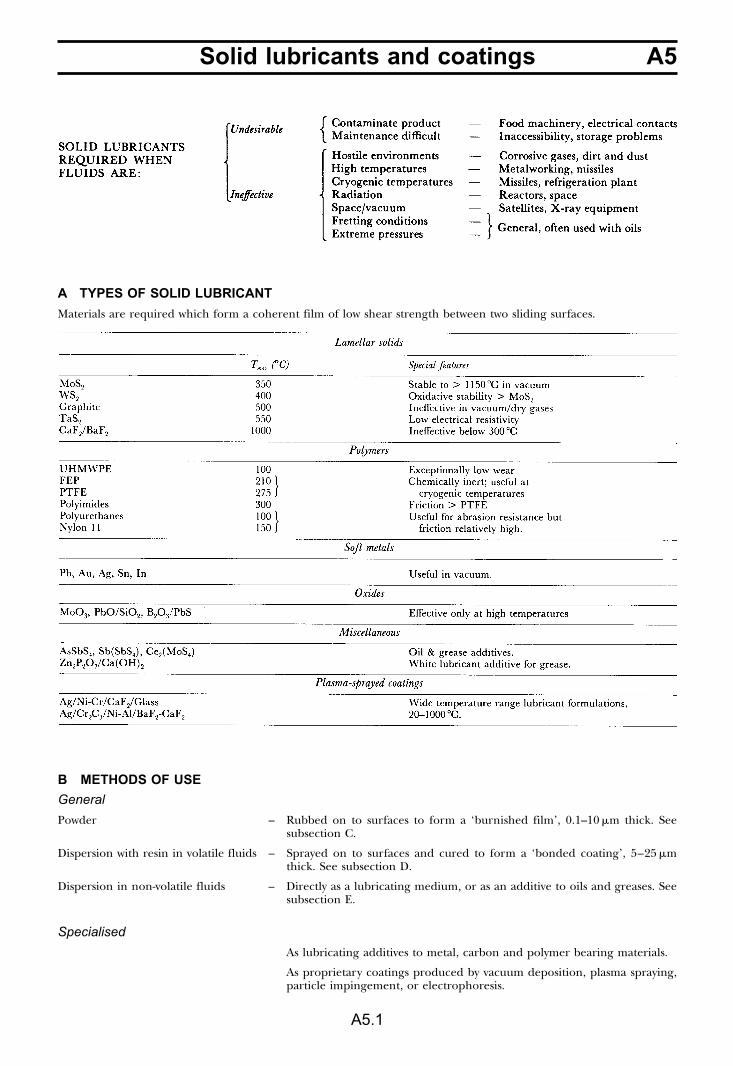
A TYPES OF SOLID LUBRICANT
Materials are required which form a coherent film of low shear strength between two sliding surfaces.
B METHODS OF USE
General
Powder – Rubbed on to surfaces to form a ‘burnished film’, 0.1–10 �m thick. Seesubsection C.
Dispersion with resin in volatile fluids – Sprayed on to surfaces and cured to form a ‘bonded coating’, 5–25 �mthick. See subsection D.
Dispersion in non-volatile fluids – Directly as a lubricating medium, or as an additive to oils and greases. Seesubsection E.
Specialised
As lubricating additives to metal, carbon and polymer bearing materials.
As proprietary coatings produced by vacuum deposition, plasma spraying,particle impingement, or electrophoresis.
A5 Solid lubricants and coatings
A5.2
C BURNISHED FILMS
Effects of operational variables
Results obtained from laboratory tests with a ball sliding on a film-covered disc. Applicable to MoS2, WS2 and relatedmaterials, but not to PTFE and graphite.
No well-defined trend exists between film life and substrate hardness. Molybdenum is usually an excellent substratefor MoS2 films. Generally similar trends with film thickness and load also apply to soft metal films.
A5Solid lubricants and coatings
A5.3
D BONDED COATINGS
MoS2 resin coatings show performance trends broadly similar to those forburnished films but there is less dependence of wear life upon relativehumidity.
Both the coefficient of friction and the wear rate of the coating vary withtime.
Laboratory testing is frequently used to rate different coatings forparticular applications. The most common tests are:
It is essential to coat the moving surface. Coating both surfaces usually increases the wear life, but by much less than100% (�30% for plain bearings, �1% for Falex tests). Considerable variations in wear life are often found in replicatetests (and service conditions).
Performance of MoS2 bonded coatings at elevated temperatures is greatly dependent on the type of resin binder andon the presence of additives in the formulation. Typical additives include graphite, soft metals (Au, Pb, Ag), leadphosphite, antimony trioxide, and sulphides of other metals.
General characteristics of MoS2 films withdifferent binders
Points to note in design
1 Wide variety of types available; supplier’s advice shouldalways be sought.
2 Watch effect of cure temperature on substrate.3 Use acrylic binders on rubbers, cellulose on wood and
plastics.4 Substrate pretreatment essential.5 Fluids usually deleterious to life.
A5 Solid lubricants and coatings
A5.4
Preparation of coatings
Specifications for solid film bonded coatings
US-MIL-L23398 Lubricant, solid film, air-drying
UK-DEF-STAN 91–19/1 � Lubricant, solid film, heat-curingUS-MIL-L-8937
US-MIL-L-46010 Lubricant, solid film, heat cured, corrosion inhibited
US-MIL-L-81329 Lubricant, solid film, extreme environment
Other requirements
Satisfactory appearance
Limits on � Curing time/temperatureFilm thickness
Adhesion – tape test
Thermal stability – resistance to flaking/cracking at temperature extremes
Fluid compatibility – no softening/peeling after immersion
Performance � Wear lifeLoad carrying capacity
Storage stability of dispersion
Corrosion – anodised aluminium or phosphated steel
A5Solid lubricants and coatings
A5.5
E DISPERSIONS
Graphite, MoS2 and PTFE dispersions are available in a wide variety of fluids: water, alcohol, toluene, white spirit,mineral oils, etc.
In addition to uses for bonded coatings, other applications include:
Specifications for solid lubricant dispersions in oils and greases
Paste
UK-DTD-392B � Anti-seize compound, high temperatures (50% graphite in petrolatum)US-MIL-T-5544
UK-DTD-5617 Anti-seize compound, MoS2 (50% MoS2 in mineral oil)
US-MIL-A-13881 Anti-seize compound, mica base (40% mica in mineral oil)
US-MIL-L-25681C Lubricant, MoS2, silicone (50% MoS2 – anti-seize compound)
Grease
US-MIL-G-23549A Grease, general purpose (5% MoS2, mineral oil base)
UK-DTD-5527A � Grease, MoS2, low and high temperature (5% MoS2, synthetic oil base)US-MIL-G-21164C
US-MIL-G-81827 Grease, MoS2, high load, wide temperature range (5% MoS2)
UK-DEF-STAN 91–18/1 Grease, graphite, medium (5% in mineral oil base)
UK-DEF-STAN 91–8/1 Grease, graphite (40% in mineral oil base)
Oil
UK-DEF-STAN 91–30/1 � Lubricating oil, colloidal graphite (10% in mineral oil)US-MIL-L-3572
A6 Other liquids
A6.1
There is a wide variety of liquids with many different uses and which may interact with tribological components. In thesecases, the most important property of the liquid is usually its viscosity. Viscosity values are therefore presented for somecommon liquids and for some of the more important process fluids.
Figure 6.1 The viscosity of water at various temperatures and pressures
A6Other liquids
A6.2
Figure 6.2 The viscosity of various refrigerant liquids
A6 Other liquids
A6.3
Figure 6.3 The viscosity of various heat transfer fluids
A6Other liquids
A6.4
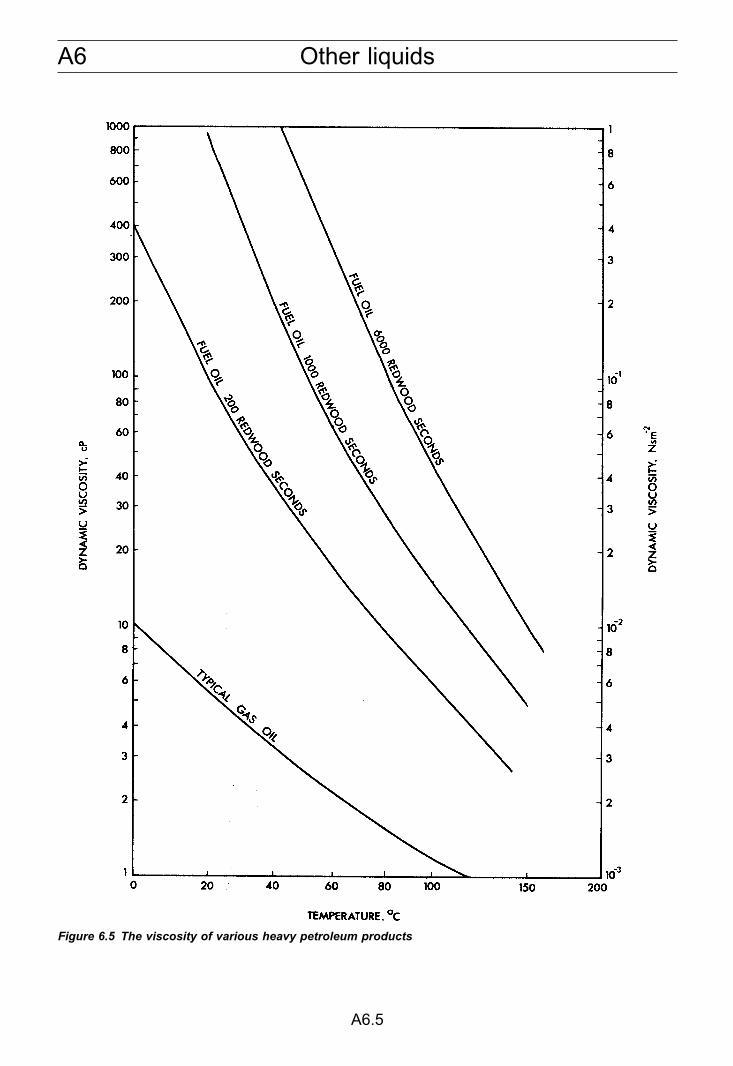
Petroleum products are variable in composition and so only typical values or ranges of values are given.
Figure 6.4 The viscosity of various light petroleum products
A6 Other liquids
A6.5
Figure 6.5 The viscosity of various heavy petroleum products
A6Other liquids
A6.6
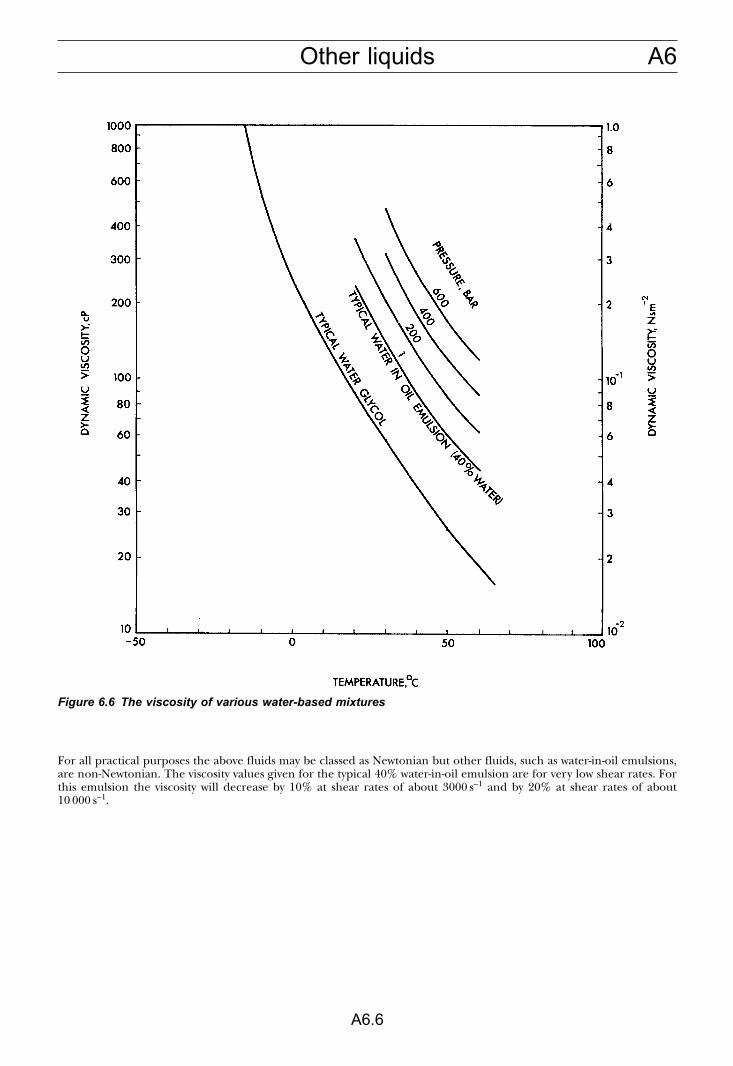
For all practical purposes the above fluids may be classed as Newtonian but other fluids, such as water-in-oil emulsions,are non-Newtonian. The viscosity values given for the typical 40% water-in-oil emulsion are for very low shear rates. Forthis emulsion the viscosity will decrease by 10% at shear rates of about 3000 s–1 and by 20% at shear rates of about10 000 s–1.
Figure 6.6 The viscosity of various water-based mixtures
A7 Plain bearing lubrication
A7.1
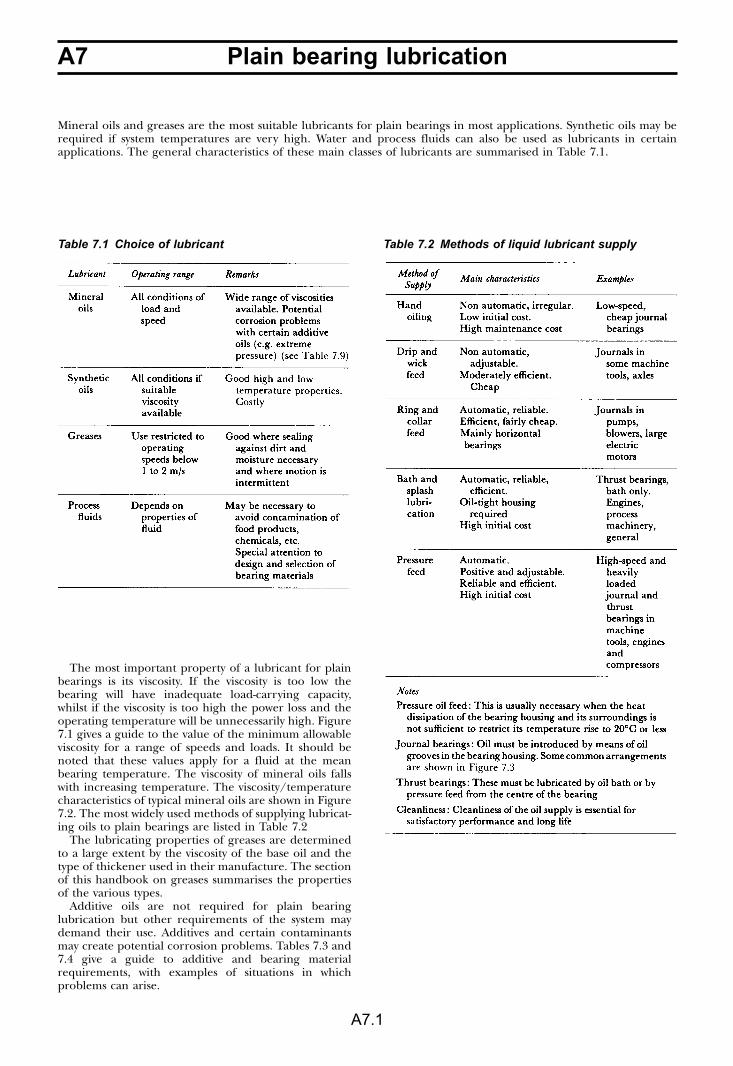
Mineral oils and greases are the most suitable lubricants for plain bearings in most applications. Synthetic oils may berequired if system temperatures are very high. Water and process fluids can also be used as lubricants in certainapplications. The general characteristics of these main classes of lubricants are summarised in Table 7.1.
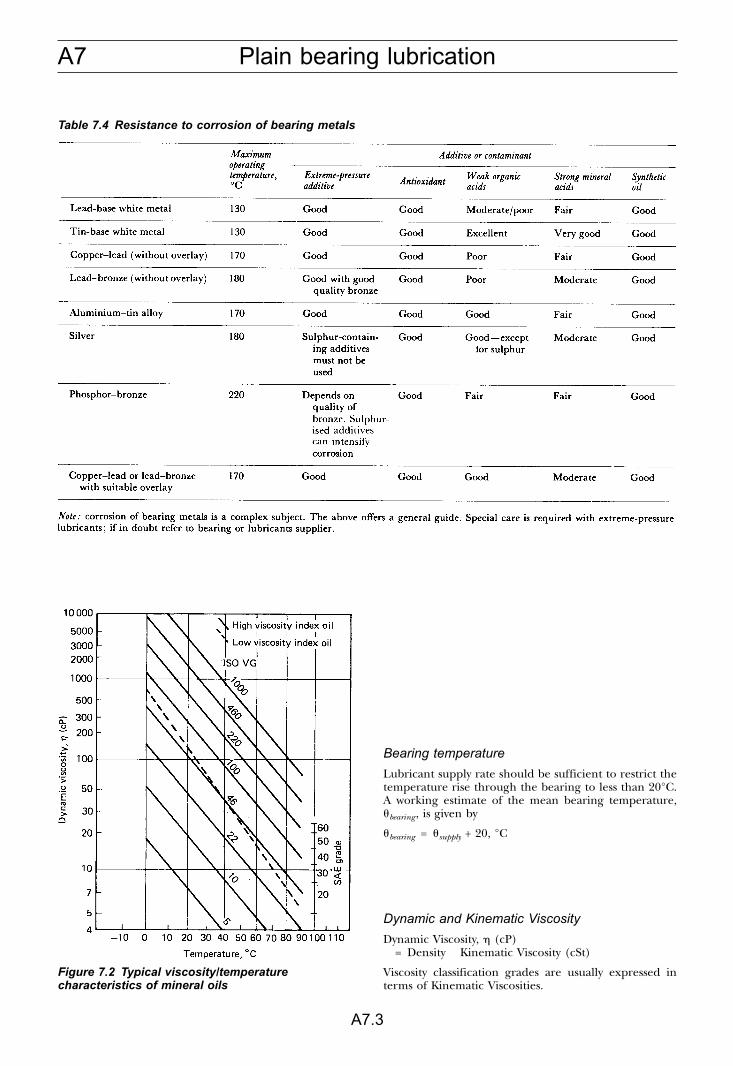
The most important property of a lubricant for plainbearings is its viscosity. If the viscosity is too low thebearing will have inadequate load-carrying capacity,whilst if the viscosity is too high the power loss and theoperating temperature will be unnecessarily high. Figure7.1 gives a guide to the value of the minimum allowableviscosity for a range of speeds and loads. It should benoted that these values apply for a fluid at the meanbearing temperature. The viscosity of mineral oils fallswith increasing temperature. The viscosity/temperaturecharacteristics of typical mineral oils are shown in Figure7.2. The most widely used methods of supplying lubricat-ing oils to plain bearings are listed in Table 7.2
The lubricating properties of greases are determinedto a large extent by the viscosity of the base oil and thetype of thickener used in their manufacture. The sectionof this handbook on greases summarises the propertiesof the various types.
Additive oils are not required for plain bearinglubrication but other requirements of the system maydemand their use. Additives and certain contaminantsmay create potential corrosion problems. Tables 7.3 and7.4 give a guide to additive and bearing materialrequirements, with examples of situations in whichproblems can arise.
Table 7.1 Choice of lubricant Table 7.2 Methods of liquid lubricant supply
A7Plain bearing lubrication
A7.2
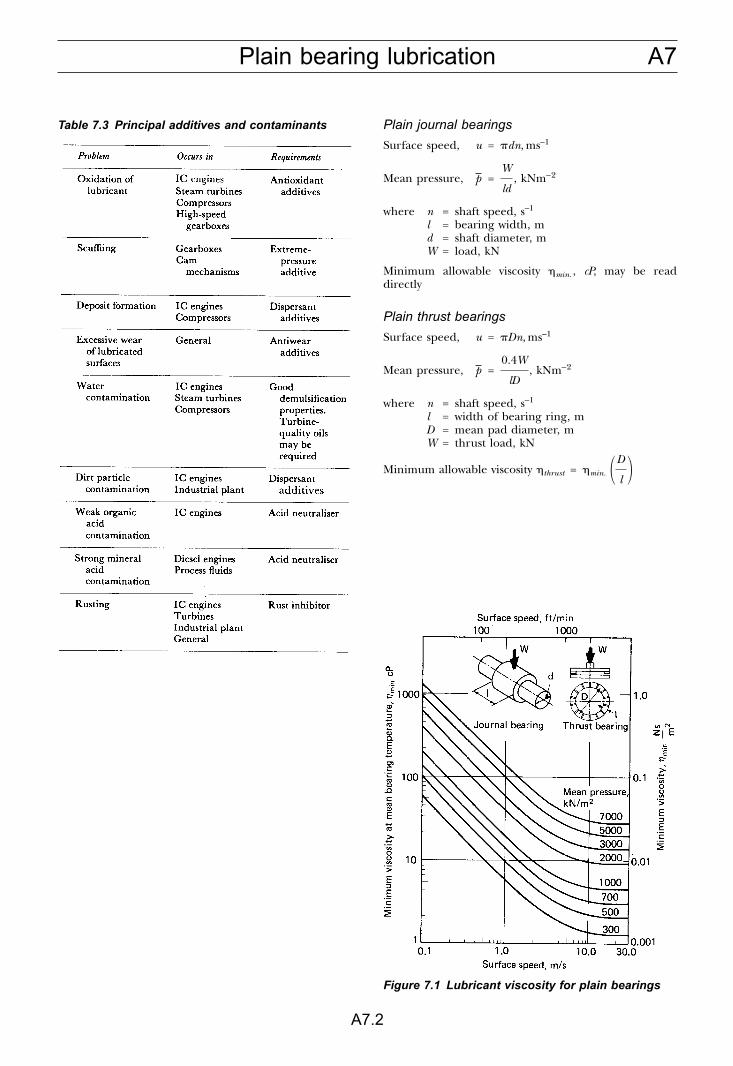
Plain journal bearings
Surface speed, u = �dn, ms–1
Mean pressure, p =W
ld, kNm–2
where n = shaft speed, s–1
l = bearing width, md = shaft diameter, mW = load, kN
Minimum allowable viscosity �min. , cP, may be readdirectly
Plain thrust bearings
Surface speed, u = �Dn, ms–1
Mean pressure, p =0.4W
lD, kNm–2
where n = shaft speed, s–1
l = width of bearing ring, mD = mean pad diameter, mW = thrust load, kN
Minimum allowable viscosity �thrust = �min. �D
l �
Table 7.3 Principal additives and contaminants
Figure 7.1 Lubricant viscosity for plain bearings
A7 Plain bearing lubrication
A7.3
Bearing temperature
Lubricant supply rate should be sufficient to restrict thetemperature rise through the bearing to less than 20°C.A working estimate of the mean bearing temperature,�bearing , is given by
�bearing = �supply + 20, °C
Dynamic and Kinematic Viscosity
Dynamic Viscosity, � (cP)= Density � Kinematic Viscosity (cSt)
Viscosity classification grades are usually expressed interms of Kinematic Viscosities.
Table 7.4 Resistance to corrosion of bearing metals
Figure 7.2 Typical viscosity/temperaturecharacteristics of mineral oils
A7Plain bearing lubrication
A7.4
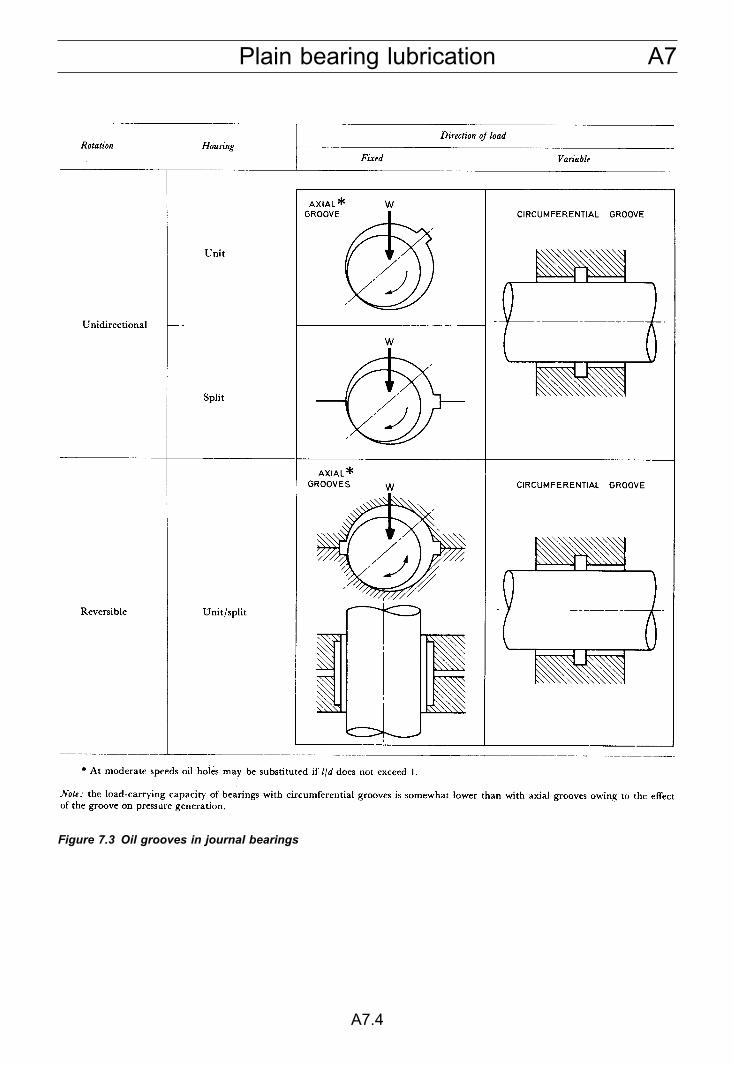
Figure 7.3 Oil grooves in journal bearings
A8 Rolling bearing lubrication
A8.1
SELECTION OF THE LUBRICANT
GREASE LUBRICATION
Grease selection
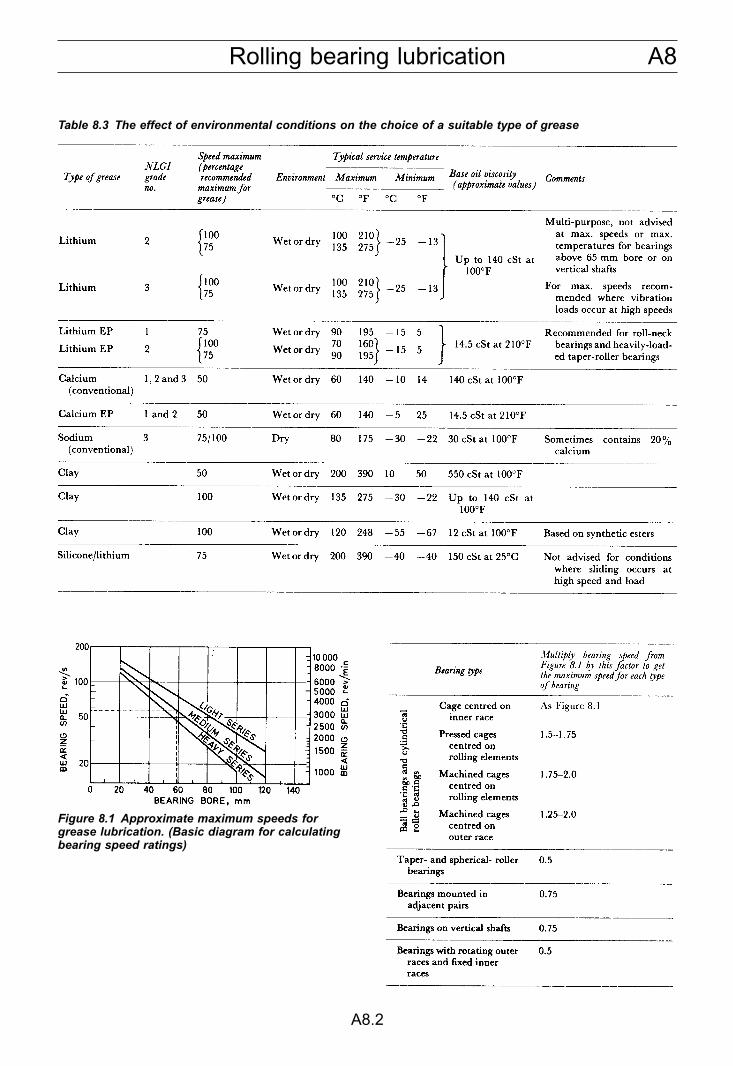
The principal factors governing the selection of greasesfor rolling bearings are speed, temperature, load, envi-ronment and method of application. Guides to theselection of a suitable grease taking account of the abovefactors are given in Tables 8.2 and 8.3.
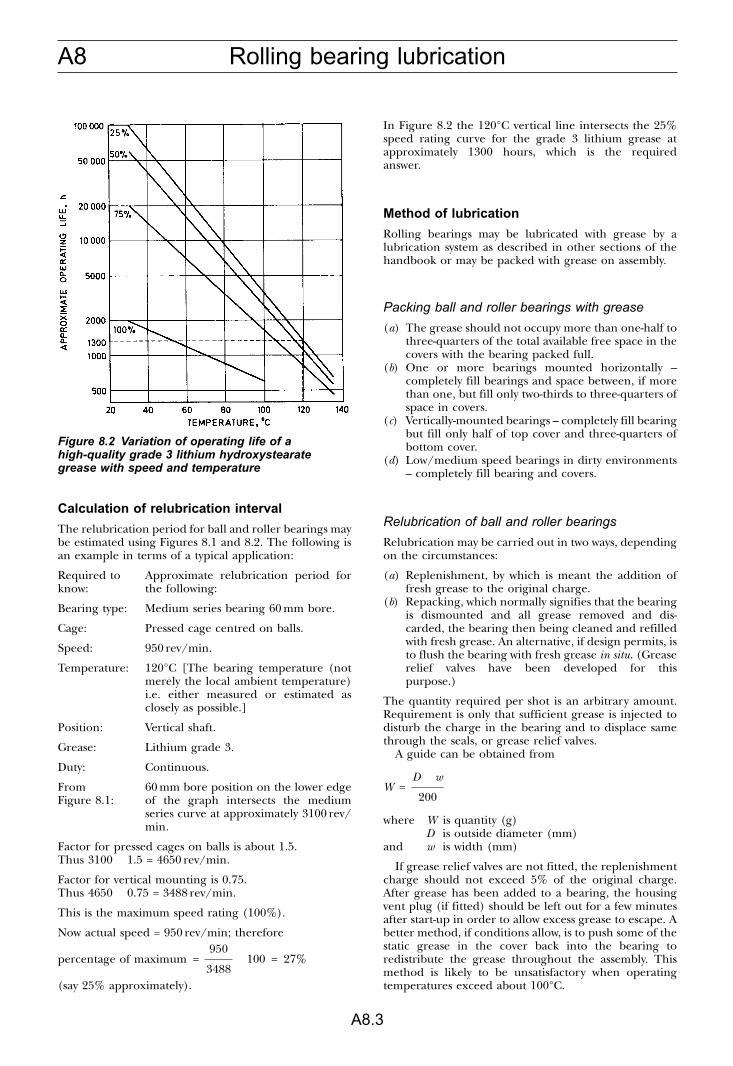
The appropriate maximum speeds for grease lubrica-tion of a given bearing type are given in Figure 8.1. Thelife required from the grease is also obviously importantand Figure 8.2 gives a guide to the variation of greaseoperating life with percentage speed rating and tem-perature for a high-quality lithium hydroxystearategrease as derived from Figure 8.1. (These greases givethe highest speed ratings.)
When shock loading and/or high operating tem-peratures tend to shake the grease out of the covers intothe bearing, a grease of a harder consistency should bechosen, e.g. a no. 3 grease instead of a no. 2 grease.
Note: it should be recognised that the curves in Figures 8.1 and8.2 can only be a guide. Considerable variations in life arepossible depending on precise details of the application, e.g.vibration, air flow across the bearing, clearances, etc.
Table 8.1 General guide for choosing between grease and oil lubrication
Table 8.2 The effect of the method of applicationon the choice of a suitable grade of grease
A8Rolling bearing lubrication
A8.2
Table 8.3 The effect of environmental conditions on the choice of a suitable type of grease
Figure 8.1 Approximate maximum speeds forgrease lubrication. (Basic diagram for calculatingbearing speed ratings)
A8 Rolling bearing lubrication
A8.3
Calculation of relubrication interval
The relubrication period for ball and roller bearings maybe estimated using Figures 8.1 and 8.2. The following isan example in terms of a typical application:
Required toknow:
Approximate relubrication period forthe following:
Bearing type: Medium series bearing 60 mm bore.
Cage: Pressed cage centred on balls.
Speed: 950 rev/min.
Temperature: 120°C [The bearing temperature (notmerely the local ambient temperature)i.e. either measured or estimated asclosely as possible.]
Position: Vertical shaft.
Grease: Lithium grade 3.
Duty: Continuous.
FromFigure 8.1:
60 mm bore position on the lower edgeof the graph intersects the mediumseries curve at approximately 3100 rev/min.
Factor for pressed cages on balls is about 1.5.Thus 3100 � 1.5 = 4650 rev/min.
Factor for vertical mounting is 0.75.Thus 4650 � 0.75 = 3488 rev/min.
This is the maximum speed rating (100%).
Now actual speed = 950 rev/min; therefore
percentage of maximum =950
3488� 100 = 27%
(say 25% approximately).
In Figure 8.2 the 120°C vertical line intersects the 25%speed rating curve for the grade 3 lithium grease atapproximately 1300 hours, which is the requiredanswer.
Method of lubrication
Rolling bearings may be lubricated with grease by alubrication system as described in other sections of thehandbook or may be packed with grease on assembly.
Packing ball and roller bearings with grease
(a) The grease should not occupy more than one-half tothree-quarters of the total available free space in thecovers with the bearing packed full.
(b) One or more bearings mounted horizontally –completely fill bearings and space between, if morethan one, but fill only two-thirds to three-quarters ofspace in covers.
(c) Vertically-mounted bearings – completely fill bearingbut fill only half of top cover and three-quarters ofbottom cover.
(d) Low/medium speed bearings in dirty environments– completely fill bearing and covers.
Relubrication of ball and roller bearings
Relubrication may be carried out in two ways, dependingon the circumstances:
(a) Replenishment, by which is meant the addition offresh grease to the original charge.
(b) Repacking, which normally signifies that the bearingis dismounted and all grease removed and dis-carded, the bearing then being cleaned and refilledwith fresh grease. An alternative, if design permits, isto flush the bearing with fresh grease in situ. (Greaserelief valves have been developed for thispurpose.)
The quantity required per shot is an arbitrary amount.Requirement is only that sufficient grease is injected todisturb the charge in the bearing and to displace samethrough the seals, or grease relief valves.
A guide can be obtained from
W =D � w
200
where W is quantity (g)D is outside diameter (mm)
and w is width (mm)
If grease relief valves are not fitted, the replenishmentcharge should not exceed 5% of the original charge.After grease has been added to a bearing, the housingvent plug (if fitted) should be left out for a few minutesafter start-up in order to allow excess grease to escape. Abetter method, if conditions allow, is to push some of thestatic grease in the cover back into the bearing toredistribute the grease throughout the assembly. Thismethod is likely to be unsatisfactory when operatingtemperatures exceed about 100°C.
Figure 8.2 Variation of operating life of ahigh-quality grade 3 lithium hydroxystearategrease with speed and temperature
A8Rolling bearing lubrication
A8.4
OIL LUBRICATION
Oil viscosity selection
Generally, when speeds are moderate, the followingminimum viscosities at the operating temperatures arerecommended:
Ball and cylindrical-roller bearingscSt12
Spherical-roller bearings 20Spherical-roller thrust bearings 32
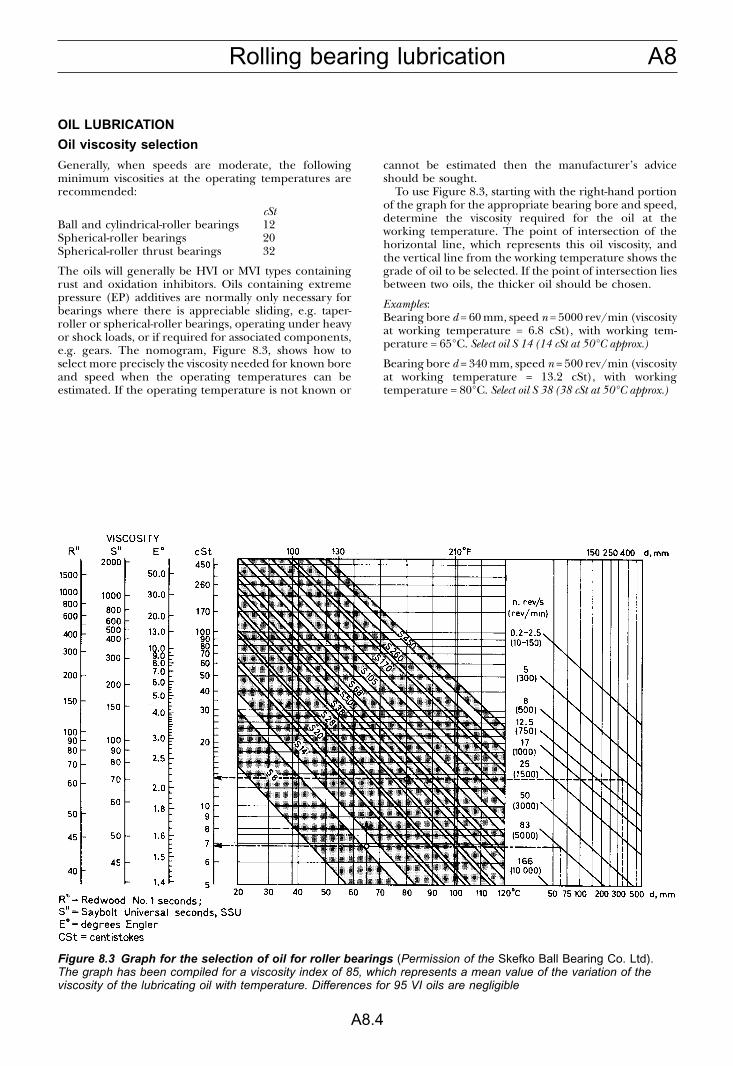
The oils will generally be HVI or MVI types containingrust and oxidation inhibitors. Oils containing extremepressure (EP) additives are normally only necessary forbearings where there is appreciable sliding, e.g. taper-roller or spherical-roller bearings, operating under heavyor shock loads, or if required for associated components,e.g. gears. The nomogram, Figure 8.3, shows how toselect more precisely the viscosity needed for known boreand speed when the operating temperatures can beestimated. If the operating temperature is not known or
cannot be estimated then the manufacturer’s adviceshould be sought.
To use Figure 8.3, starting with the right-hand portionof the graph for the appropriate bearing bore and speed,determine the viscosity required for the oil at theworking temperature. The point of intersection of thehorizontal line, which represents this oil viscosity, andthe vertical line from the working temperature shows thegrade of oil to be selected. If the point of intersection liesbetween two oils, the thicker oil should be chosen.
Examples:Bearing bore d = 60 mm, speed n = 5000 rev/min (viscosityat working temperature = 6.8 cSt), with working tem-perature = 65°C. Select oil S 14 (14 cSt at 50°C approx.)
Bearing bore d = 340 mm, speed n = 500 rev/min (viscosityat working temperature = 13.2 cSt), with workingtemperature = 80°C. Select oil S 38 (38 cSt at 50°C approx.)
Figure 8.3 Graph for the selection of oil for roller bearings (Permission of the Skefko Ball Bearing Co. Ltd).The graph has been compiled for a viscosity index of 85, which represents a mean value of the variation of theviscosity of the lubricating oil with temperature. Differences for 95 VI oils are negligible
A8 Rolling bearing lubrication
A8.5
Application of oil to rolling bearings
A9Gear and roller chain lubrication
A9.1
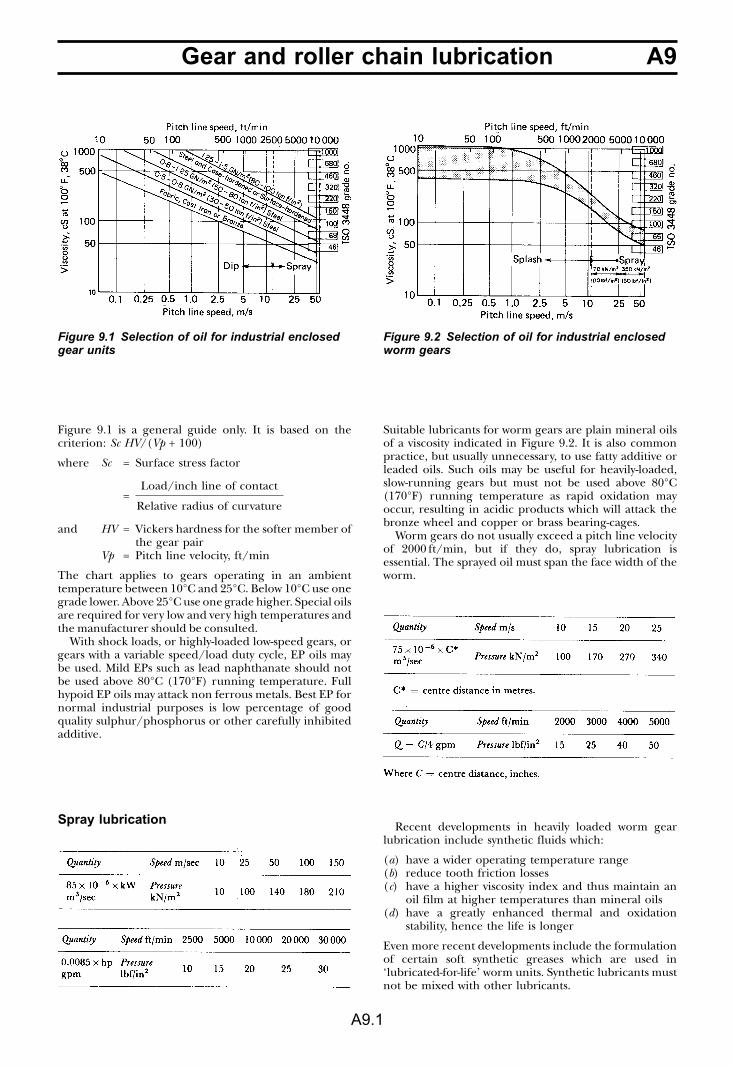
Figure 9.1 is a general guide only. It is based on thecriterion: Sc HV/(Vp + 100)
where Sc = Surface stress factor
=Load/inch line of contact
Relative radius of curvature
and HV = Vickers hardness for the softer member ofthe gear pair
Vp = Pitch line velocity, ft/min
The chart applies to gears operating in an ambienttemperature between 10°C and 25°C. Below 10°C use onegrade lower. Above 25°C use one grade higher. Special oilsare required for very low and very high temperatures andthe manufacturer should be consulted.
With shock loads, or highly-loaded low-speed gears, orgears with a variable speed/load duty cycle, EP oils maybe used. Mild EPs such as lead naphthanate should notbe used above 80°C (170°F) running temperature. Fullhypoid EP oils may attack non ferrous metals. Best EP fornormal industrial purposes is low percentage of goodquality sulphur/phosphorus or other carefully inhibitedadditive.
Spray lubrication
Suitable lubricants for worm gears are plain mineral oilsof a viscosity indicated in Figure 9.2. It is also commonpractice, but usually unnecessary, to use fatty additive orleaded oils. Such oils may be useful for heavily-loaded,slow-running gears but must not be used above 80°C(170°F) running temperature as rapid oxidation mayoccur, resulting in acidic products which will attack thebronze wheel and copper or brass bearing-cages.
Worm gears do not usually exceed a pitch line velocityof 2000 ft/min, but if they do, spray lubrication isessential. The sprayed oil must span the face width of theworm.
Recent developments in heavily loaded worm gearlubrication include synthetic fluids which:
(a) have a wider operating temperature range(b) reduce tooth friction losses(c) have a higher viscosity index and thus maintain an
oil film at higher temperatures than mineral oils(d) have a greatly enhanced thermal and oxidation
stability, hence the life is longer
Even more recent developments include the formulationof certain soft synthetic greases which are used in‘lubricated-for-life’ worm units. Synthetic lubricants mustnot be mixed with other lubricants.
Figure 9.1 Selection of oil for industrial enclosedgear units
Figure 9.2 Selection of oil for industrial enclosedworm gears
A9 Gear and roller chain lubrication
A9.2
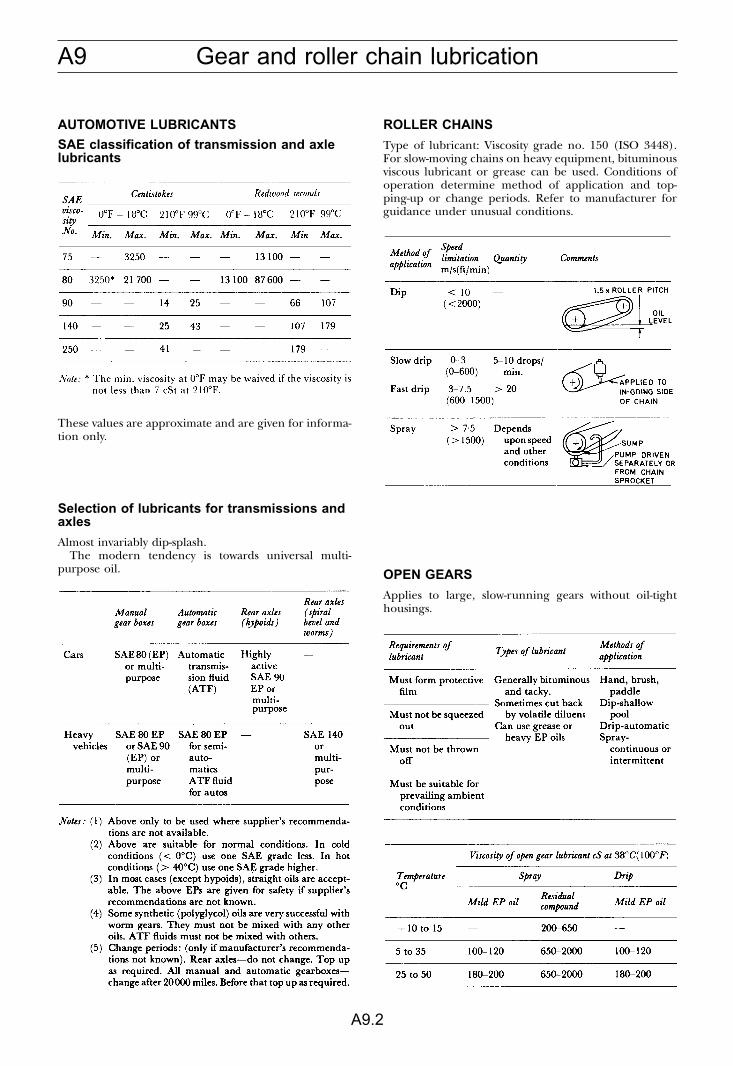
AUTOMOTIVE LUBRICANTS
SAE classification of transmission and axlelubricants
These values are approximate and are given for informa-tion only.
Selection of lubricants for transmissions andaxles
Almost invariably dip-splash.The modern tendency is towards universal multi-
purpose oil.
ROLLER CHAINS
Type of lubricant: Viscosity grade no. 150 (ISO 3448).For slow-moving chains on heavy equipment, bituminousviscous lubricant or grease can be used. Conditions ofoperation determine method of application and top-ping-up or change periods. Refer to manufacturer forguidance under unusual conditions.
OPEN GEARS
Applies to large, slow-running gears without oil-tighthousings.
A10Wire rope lubrication
A10.1
THE ADVANTAGES OF LUBRICATION
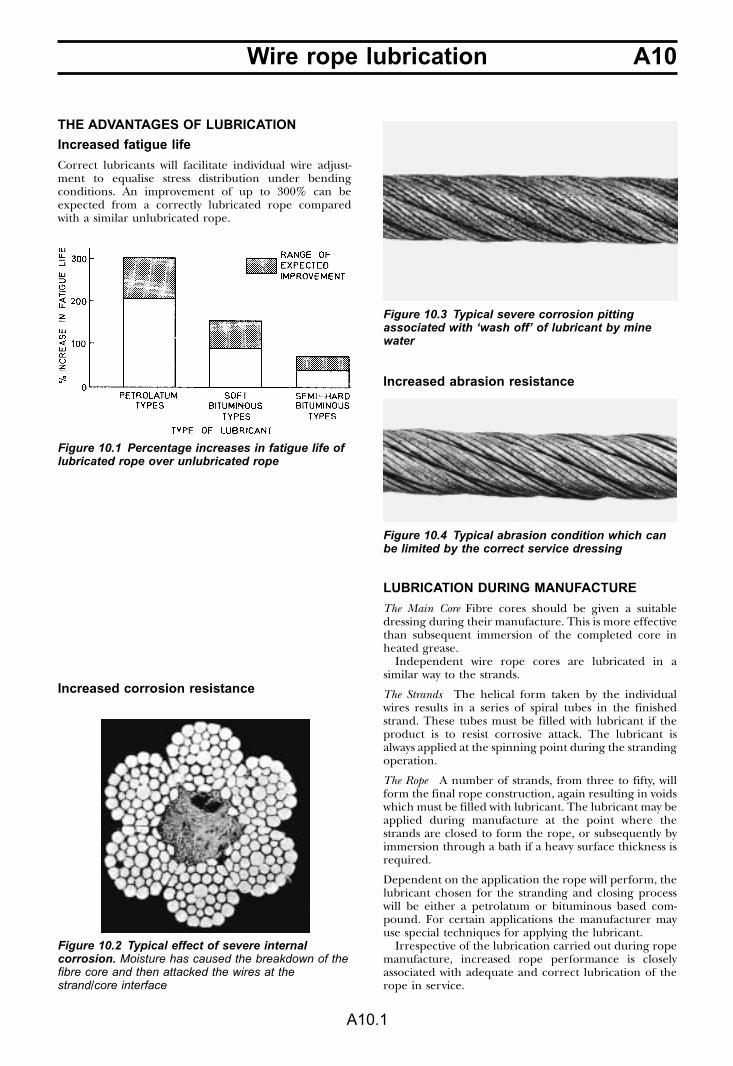
Increased fatigue life
Correct lubricants will facilitate individual wire adjust-ment to equalise stress distribution under bendingconditions. An improvement of up to 300% can beexpected from a correctly lubricated rope comparedwith a similar unlubricated rope.
Increased corrosion resistance
Increased abrasion resistance
LUBRICATION DURING MANUFACTURE
The Main Core Fibre cores should be given a suitabledressing during their manufacture. This is more effectivethan subsequent immersion of the completed core inheated grease.
Independent wire rope cores are lubricated in asimilar way to the strands.
The Strands The helical form taken by the individualwires results in a series of spiral tubes in the finishedstrand. These tubes must be filled with lubricant if theproduct is to resist corrosive attack. The lubricant isalways applied at the spinning point during the strandingoperation.
The Rope A number of strands, from three to fifty, willform the final rope construction, again resulting in voidswhich must be filled with lubricant. The lubricant may beapplied during manufacture at the point where thestrands are closed to form the rope, or subsequently byimmersion through a bath if a heavy surface thickness isrequired.
Dependent on the application the rope will perform, thelubricant chosen for the stranding and closing processwill be either a petrolatum or bituminous based com-pound. For certain applications the manufacturer mayuse special techniques for applying the lubricant.
Irrespective of the lubrication carried out during ropemanufacture, increased rope performance is closelyassociated with adequate and correct lubrication of therope in service.
Figure 10.1 Percentage increases in fatigue life oflubricated rope over unlubricated rope
Figure 10.2 Typical effect of severe internalcorrosion. Moisture has caused the breakdown of thefibre core and then attacked the wires at thestrand/core interface
Figure 10.3 Typical severe corrosion pittingassociated with ‘wash off’ of lubricant by minewater
Figure 10.4 Typical abrasion condition which canbe limited by the correct service dressing
A10 Wire rope lubrication
A10.2
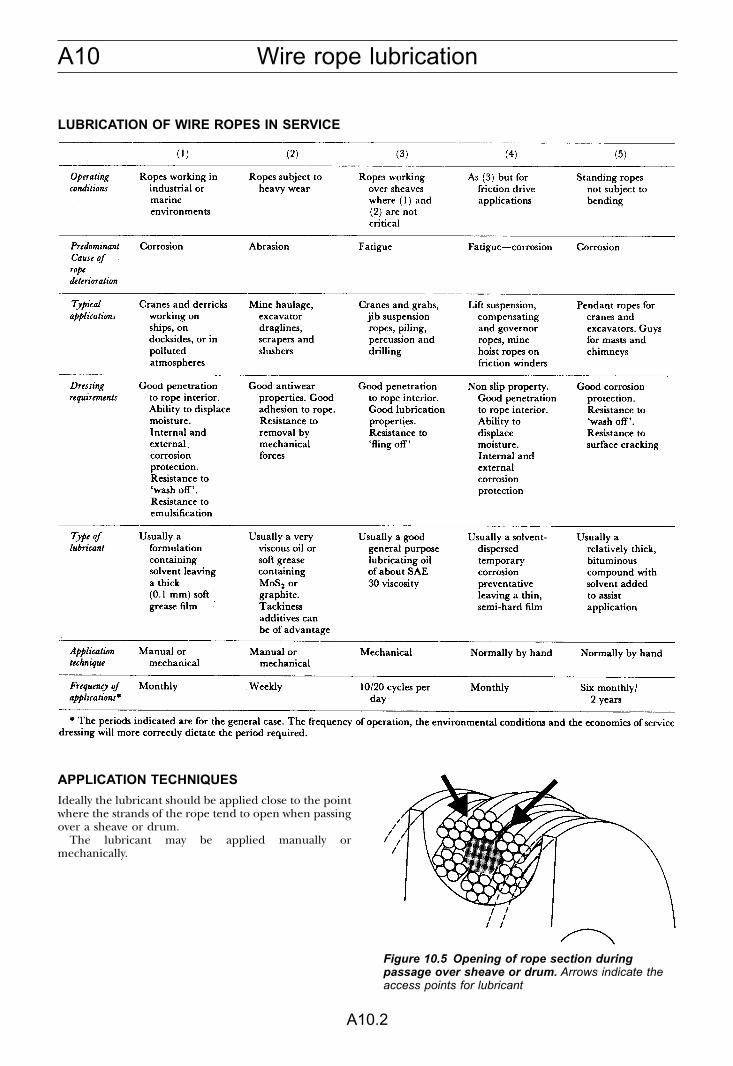
LUBRICATION OF WIRE ROPES IN SERVICE
APPLICATION TECHNIQUES
Ideally the lubricant should be applied close to the pointwhere the strands of the rope tend to open when passingover a sheave or drum.
The lubricant may be applied manually ormechanically.
Figure 10.5 Opening of rope section duringpassage over sheave or drum. Arrows indicate theaccess points for lubricant
A10Wire rope lubrication
A10.3
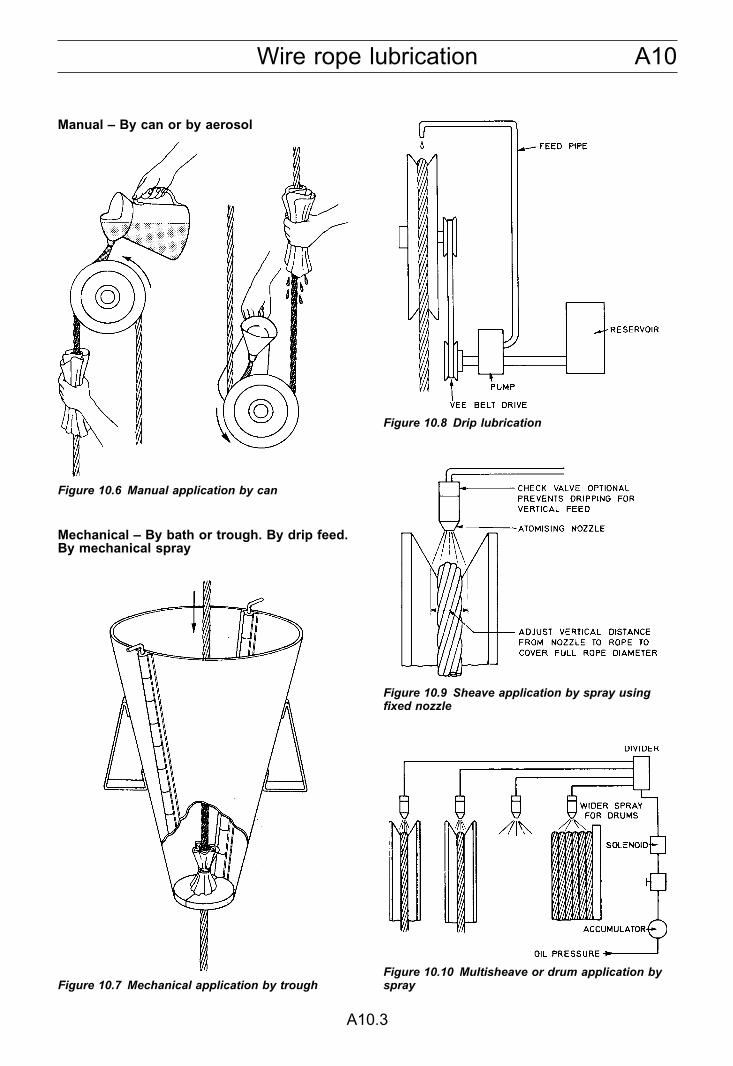
Manual – By can or by aerosol
Mechanical – By bath or trough. By drip feed.By mechanical spray
Figure 10.6 Manual application by can
Figure 10.7 Mechanical application by trough
Figure 10.8 Drip lubrication
Figure 10.9 Sheave application by spray usingfixed nozzle
Figure 10.10 Multisheave or drum application byspray
A11 Lubrication of flexible couplings
A11.1
FILLED COUPLINGS (GEAR, SPRING-TYPE, CHAIN)
Limits
Grease lubrication, set by soap separation under cen-trifuging action. Semi-fluid grease lubrication, set by heatdissipation.
Table 11.1 Recommendations for the lubrication of filled couplings
Figure 11.1 Types of filled couplings
A11Lubrication of flexible couplings
A11.2
CONTINUOUSLY-LUBRICATED GEARCOUPLINGS
Lubrication depends on coupling type
Limits:
set by centrifuging of solids or sludge in oil causingcoupling lock:
damless-type couplings 45 � 103 m/sec2
dam-type couplings 30 � 103 m/sec2
Lubricant feed rate:
damless-type couplings Rate given on Figure 11.5dam-type coupling with 50% of rate on Figure 11.5
sludge holesdam-type coupling without 25% of rate on Figure 11.5
sludge holes
Lubricant:
Use oil from machine lubrication system (VG32, VG46 orVG68)
Figure 11.2 Dam-type coupling
Figure 11.3 Dam-type coupling with anti-sludgeholes
Figure 11.4 Damless-type coupling
Figure 11.5 Lubrication requirements of gearcouplings

A12 Slide lubrication
A12.1
Slides are used where a linear motion is requiredbetween two components. An inherent feature of thislinear motion is that parts of the working surfaces mustbe exposed during operation. The selection of methodsof slide lubrication must therefore consider not only thesupply and retention of lubricant, but also the protectionof the working surfaces from dirt contamination.
Figure 12.1 Slide movements expose the workingsurfaces to contamination
Table 12.1 The lubrication of slides in various applications
Figure 12.2 Typical wick lubricator arrangement ona machine tool
Figure 12.3 Typical roller lubricator arrangementon a machine tool
Table 12.2 The lubrication of various types of linear bearings on machine tools
A13Lubricant selection
A13.1
To achieve efficient planning and scheduling of lubrica-tion a great deal of time and effort can be saved byfollowing a constructive routine. Three basic steps arerequired:
(a) A detailed and accurate survey of the plant to belubricated including a consistent description of thevarious items, with the lubricant grade currentlyused or recommended, and the method of applica-tion and frequency
(b) A study of the information collected to attempt torationalise the lubricant grades and methods ofapplication
(c) Planning of a methodical system to applylubrication
THE PLANT SURVEY
Plant identification
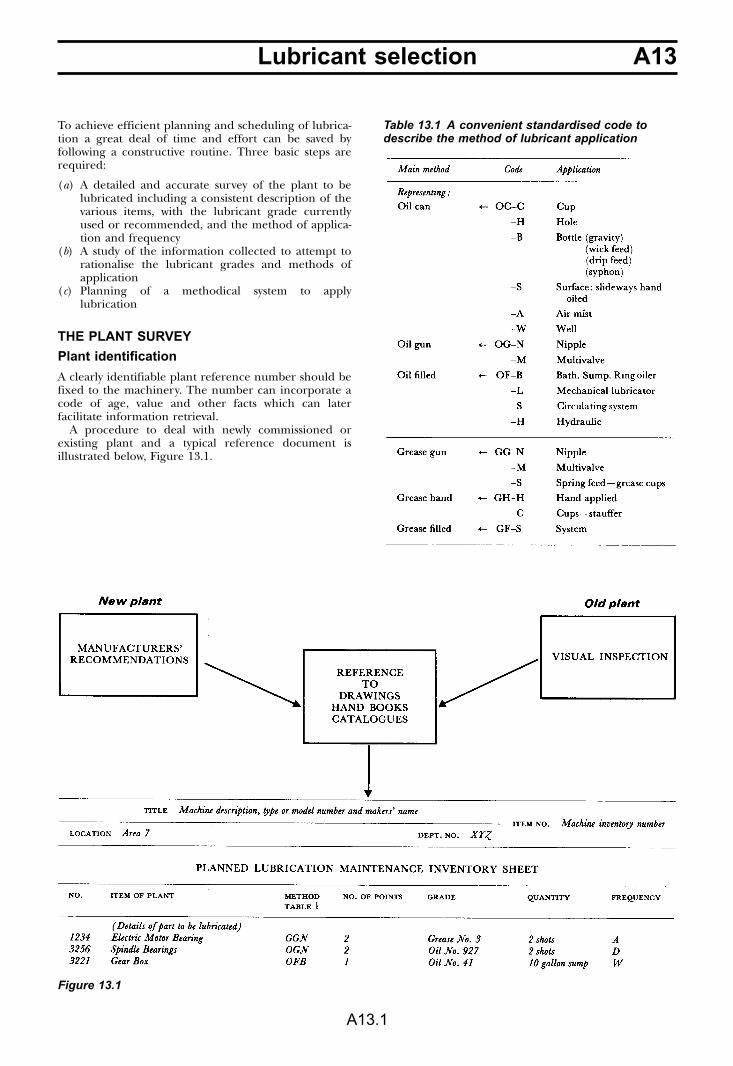
A clearly identifiable plant reference number should befixed to the machinery. The number can incorporate acode of age, value and other facts which can laterfacilitate information retrieval.
A procedure to deal with newly commissioned orexisting plant and a typical reference document isillustrated below, Figure 13.1.
Table 13.1 A convenient standardised code todescribe the method of lubricant application
Figure 13.1
A13 Lubricant selection
A13.2
Method of application
In the case of new plant the proposed methods oflubrication should be subjected to careful scrutinybearing in mind subsequent maintenance requirements.Manufacturers are sometimes preoccupied with capitalcosts when selling their equipment and so designed-outmaintenance should be negotiated early on when thetribological conditions are studied. In this context it ispossible to economise on the application costs oflubrication and problems of contamination and firehazards can be forestalled. A standardised code fordescribing the method of application is given in Table13.1. Confusion can arise unless a discipline is main-tained both on surveying and scheduling.
Number of application points
The number of application points must be carefullynoted.
(a) By adequate description – group together numbersof identical points wherever possible when individ-ual point description serves no purpose. This sim-plifies the subsequent planning of daily workschedules.
(b) Highlighting of critical points by symbol or codeidentification as necessary.
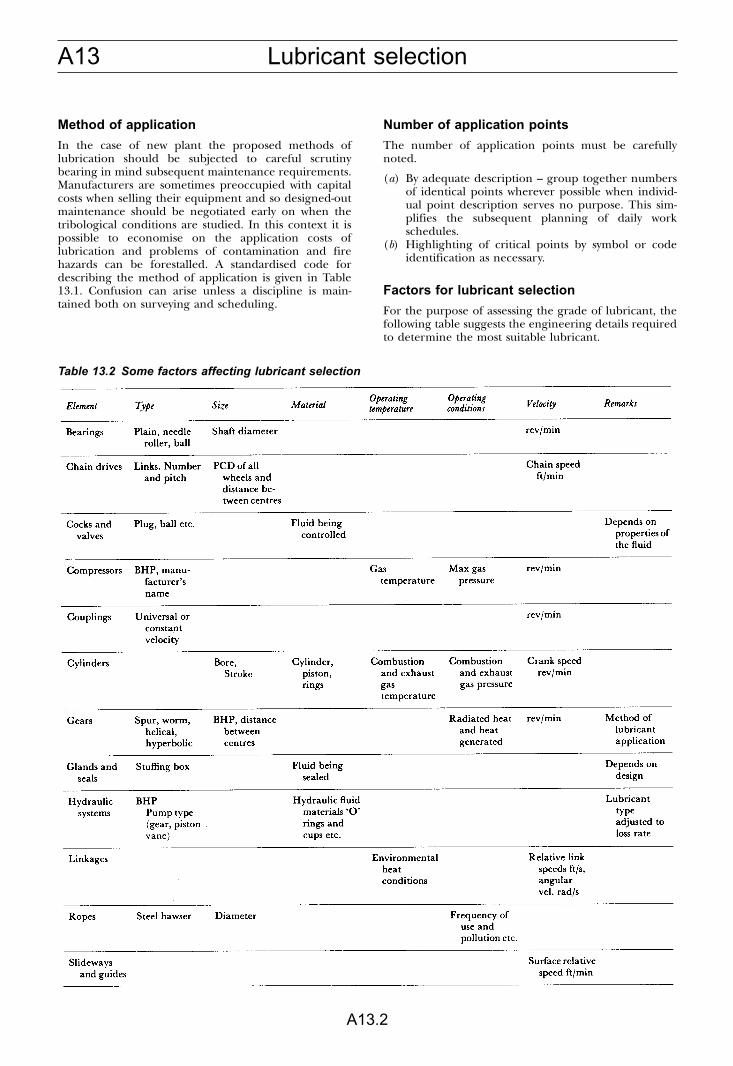
Factors for lubricant selection
For the purpose of assessing the grade of lubricant, thefollowing table suggests the engineering details requiredto determine the most suitable lubricant.
Table 13.2 Some factors affecting lubricant selection
A13Lubricant selection
A13.3
LUBRICANT RATIONALISATION
Recommended grade of lubricant
Manufacturers recommended grades may have to beacceded to during the guarantee period for criticalapplications. However, a compromise must be reached inorder to ensure the maintenance of an optimum list ofgrades which is essential to the economic sorting,handling and application of lubricants. In arriving at thisrationalised list of grades, speeds, tolerances, wear ofmoving parts and seals create conditions where theviscosity and quality of lubricant required may vary. For abalanced and economic rationalisation, all tribologicalfactors have therefore to be assessed. Where a speciallubricant has to be retained, if economically viable it mayform a compromise solution that will satisfy futuredevelopment projects, particularly where demands arelikely to be more critical than for existing equipment.Generally speaking, in most industries 98% of the bulk oflubrication can be met by six grades of oil and threegreases.
A considerable range of lubricant grades exists largelyblended to meet specific demands of manufacturers.Table 13.3 illustrates a typical selection. There areviscosity ranges, indices, inherent characteristics andadditive improvers to be considered. Generally speaking,the more complex the grade, the more expensive, butoften the more comprehensive its application. Advice isreadily available from oil companies.
Quantity and frequency
In the main the quantity of lubricant applied is subjectedto so many variable conditions that any general scale ofrecommendations would be misleading. ‘Little andoften’ has an in-built safeguard for most applications(particularly new plant), but as this can be uneconomicin manpower, and certain items can be over-lubricatedplanning should be flexible to optimise on frequencyand work loads. Utilisation of the machinery must alsobe allowed for.
Knowledge of the capacity and quantity required willnaturally help when assessing the optimum frequency ofapplication and a rough guide is given in Table 13.4.
Table 13.3 Range of lubricant grades commonly available showing factors to be taken into account foreconomic rationalisation

A13 Lubricant selection
A13.4
Table 13.4 Some factors affecting lubrication frequency (This is a general guide only – affected by localconditions and environment)
A14Selection of lubrication systems
A14.1
For brevity and convenience the vast array of lubrication systems have been grouped under nine headings. These areeach more fully discussed in other Sections of the Handbook.
TYPES OF LUBRICATION SYSTEM
A14 Selection of lubrication systems
A14.2
METHODS OF SELECTION
Table 14.1 Oil systems
Table 14.2 Grease systems
Table 14.3 Relative merits of grease and oilsystems
Table 14.4 Selection by heat removal
A14Selection of lubrication systems
A14.3
Table 14.5 Selection by type of component to be lubricated
Table 14.6 Selection by economic considerations
A14 Selection of lubrication systems
A14.4
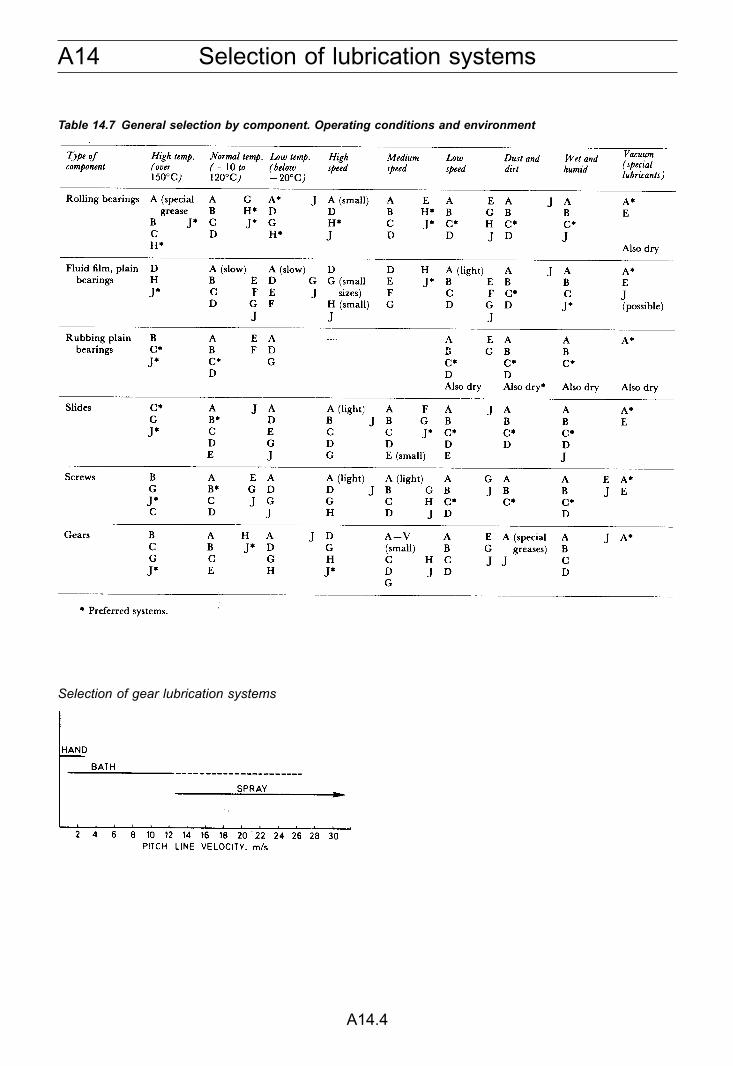
Table 14.7 General selection by component. Operating conditions and environment
Selection of gear lubrication systems
A15Total loss grease systems
A15.1
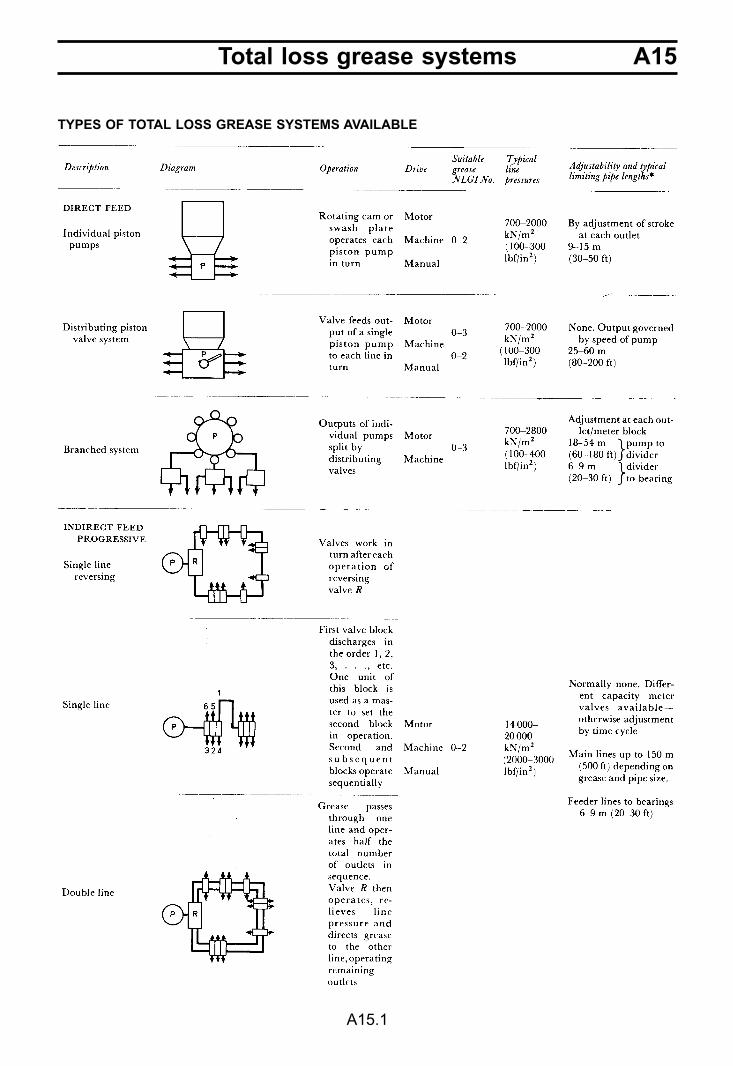
TYPES OF TOTAL LOSS GREASE SYSTEMS AVAILABLE

A15 Total loss grease systems
A15.2
Considerations in selecting type of system
A15Total loss grease systems
A15.3
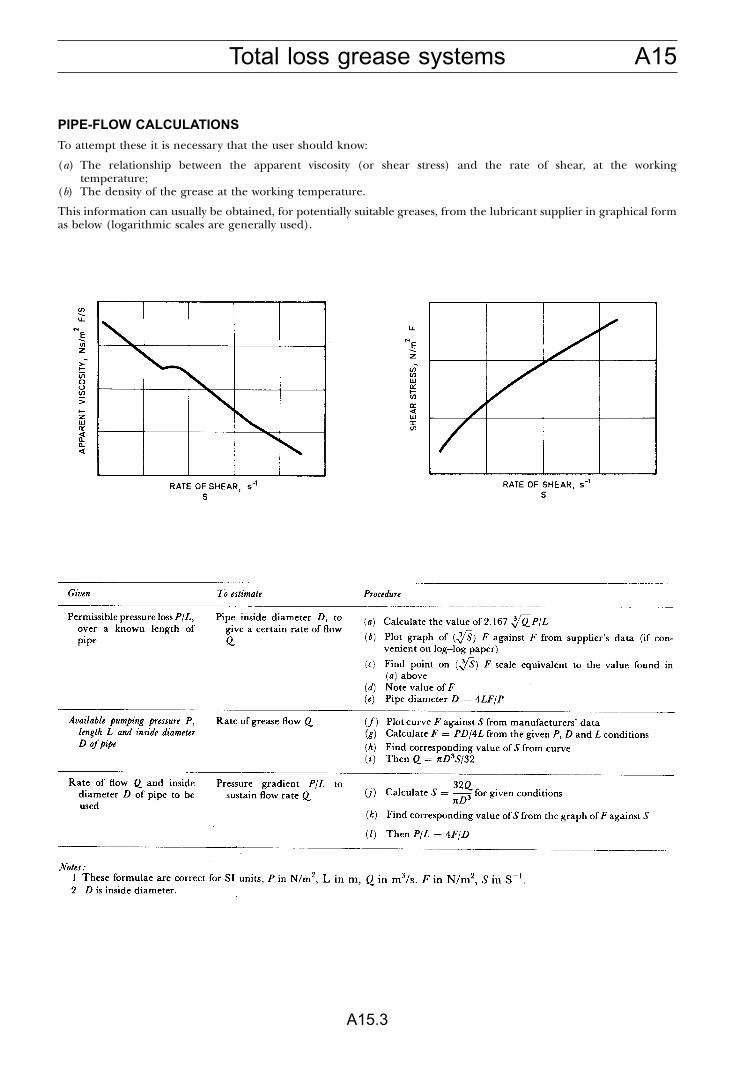
PIPE-FLOW CALCULATIONS
To attempt these it is necessary that the user should know:
(a) The relationship between the apparent viscosity (or shear stress) and the rate of shear, at the workingtemperature;
(b) The density of the grease at the working temperature.
This information can usually be obtained, for potentially suitable greases, from the lubricant supplier in graphical formas below (logarithmic scales are generally used).
A15 Total loss grease systems
A15.4
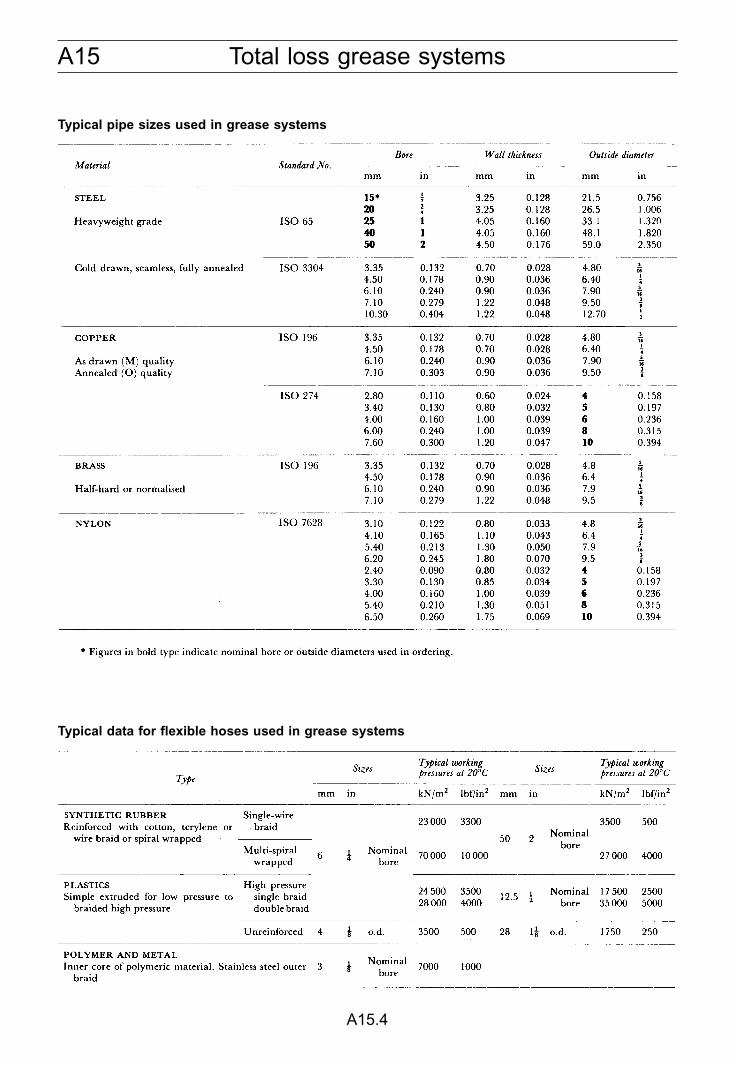
Typical pipe sizes used in grease systems
Typical data for flexible hoses used in grease systems
A15Total loss grease systems
A15.5
CONSIDERATIONS IN STORING, PUMPING AND TRANSMITTING GREASE AND GENERALDESIGN OF SYSTEMS
A16 Total loss oil and fluid grease systems
A16.1
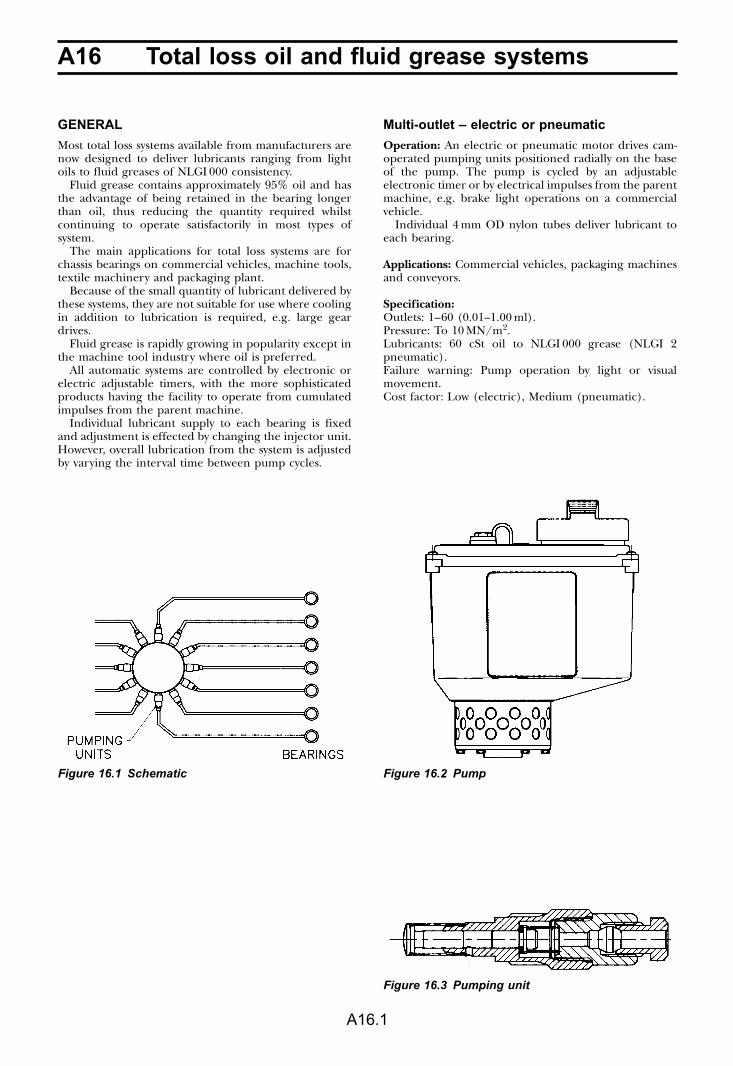
GENERAL
Most total loss systems available from manufacturers arenow designed to deliver lubricants ranging from lightoils to fluid greases of NLGI 000 consistency.
Fluid grease contains approximately 95% oil and hasthe advantage of being retained in the bearing longerthan oil, thus reducing the quantity required whilstcontinuing to operate satisfactorily in most types ofsystem.
The main applications for total loss systems are forchassis bearings on commercial vehicles, machine tools,textile machinery and packaging plant.
Because of the small quantity of lubricant delivered bythese systems, they are not suitable for use where coolingin addition to lubrication is required, e.g. large geardrives.
Fluid grease is rapidly growing in popularity except inthe machine tool industry where oil is preferred.
All automatic systems are controlled by electronic orelectric adjustable timers, with the more sophisticatedproducts having the facility to operate from cumulatedimpulses from the parent machine.
Individual lubricant supply to each bearing is fixedand adjustment is effected by changing the injector unit.However, overall lubrication from the system is adjustedby varying the interval time between pump cycles.
Multi-outlet – electric or pneumatic
Operation: An electric or pneumatic motor drives cam-operated pumping units positioned radially on the baseof the pump. The pump is cycled by an adjustableelectronic timer or by electrical impulses from the parentmachine, e.g. brake light operations on a commercialvehicle.
Individual 4 mm OD nylon tubes deliver lubricant toeach bearing.
Applications: Commercial vehicles, packaging machinesand conveyors.
Specification:Outlets: 1–60 (0.01–1.00 ml).Pressure: To 10 MN/m2.Lubricants: 60 cSt oil to NLGI 000 grease (NLGI 2pneumatic).Failure warning: Pump operation by light or visualmovement.Cost factor: Low (electric), Medium (pneumatic).
Figure 16.1 Schematic Figure 16.2 Pump
Figure 16.3 Pumping unit
A16Total loss oil and fluid grease systems
A16.2
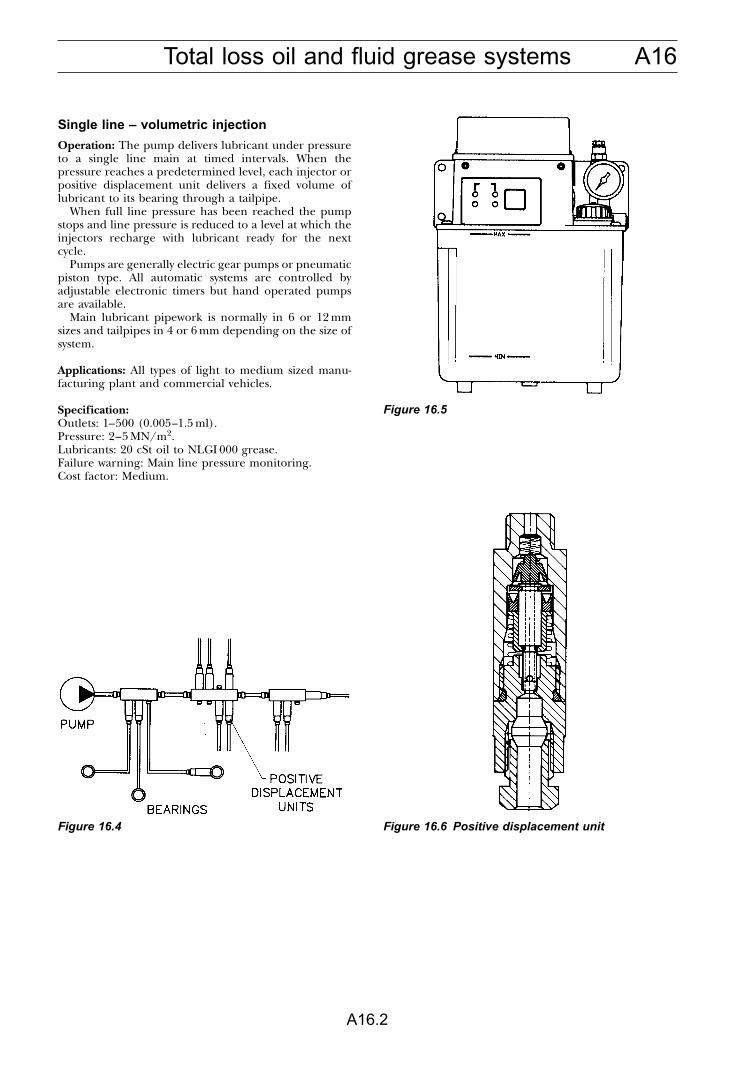
Single line – volumetric injection
Operation: The pump delivers lubricant under pressureto a single line main at timed intervals. When thepressure reaches a predetermined level, each injector orpositive displacement unit delivers a fixed volume oflubricant to its bearing through a tailpipe.
When full line pressure has been reached the pumpstops and line pressure is reduced to a level at which theinjectors recharge with lubricant ready for the nextcycle.
Pumps are generally electric gear pumps or pneumaticpiston type. All automatic systems are controlled byadjustable electronic timers but hand operated pumpsare available.
Main lubricant pipework is normally in 6 or 12 mmsizes and tailpipes in 4 or 6 mm depending on the size ofsystem.
Applications: All types of light to medium sized manu-facturing plant and commercial vehicles.
Specification:Outlets: 1–500 (0.005–1.5 ml).Pressure: 2–5 MN/m2.Lubricants: 20 cSt oil to NLGI 000 grease.Failure warning: Main line pressure monitoring.Cost factor: Medium.
Figure 16.4
Figure 16.5
Figure 16.6 Positive displacement unit
A16 Total loss oil and fluid grease systems
A16.3
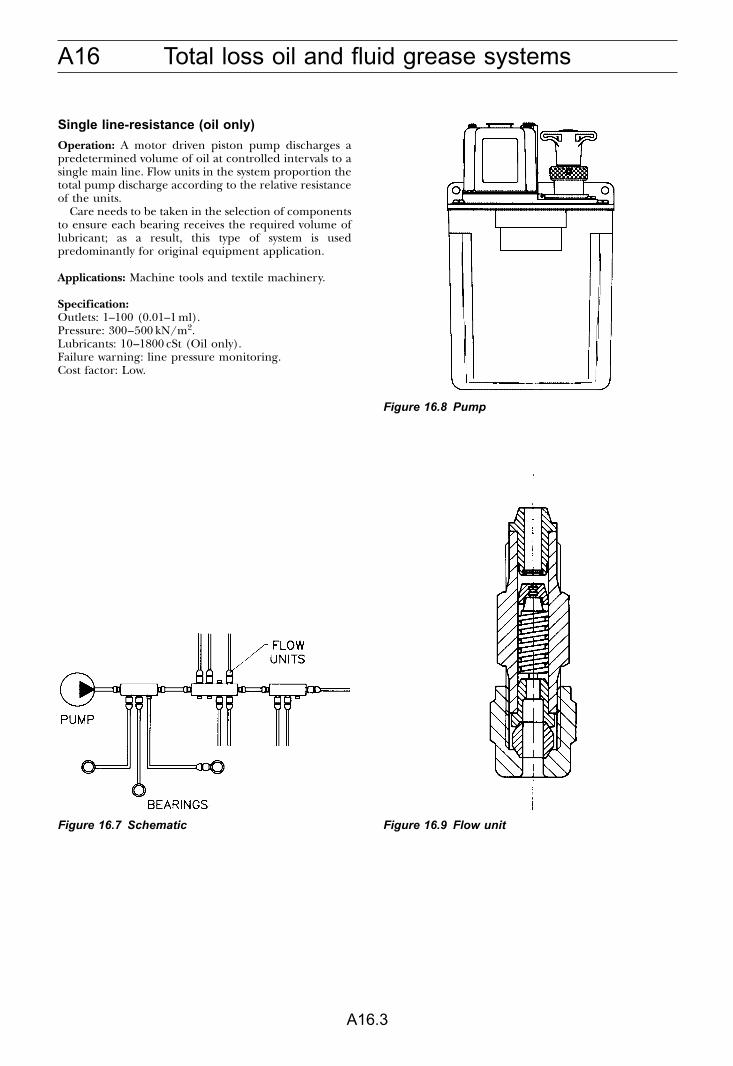
Single line-resistance (oil only)
Operation: A motor driven piston pump discharges apredetermined volume of oil at controlled intervals to asingle main line. Flow units in the system proportion thetotal pump discharge according to the relative resistanceof the units.
Care needs to be taken in the selection of componentsto ensure each bearing receives the required volume oflubricant; as a result, this type of system is usedpredominantly for original equipment application.
Applications: Machine tools and textile machinery.
Specification:Outlets: 1–100 (0.01–1 ml).Pressure: 300–500 kN/m2.Lubricants: 10–1800 cSt (Oil only).Failure warning: line pressure monitoring.Cost factor: Low.
Figure 16.7 Schematic
Figure 16.8 Pump
Figure 16.9 Flow unit
A16Total loss oil and fluid grease systems
A16.4
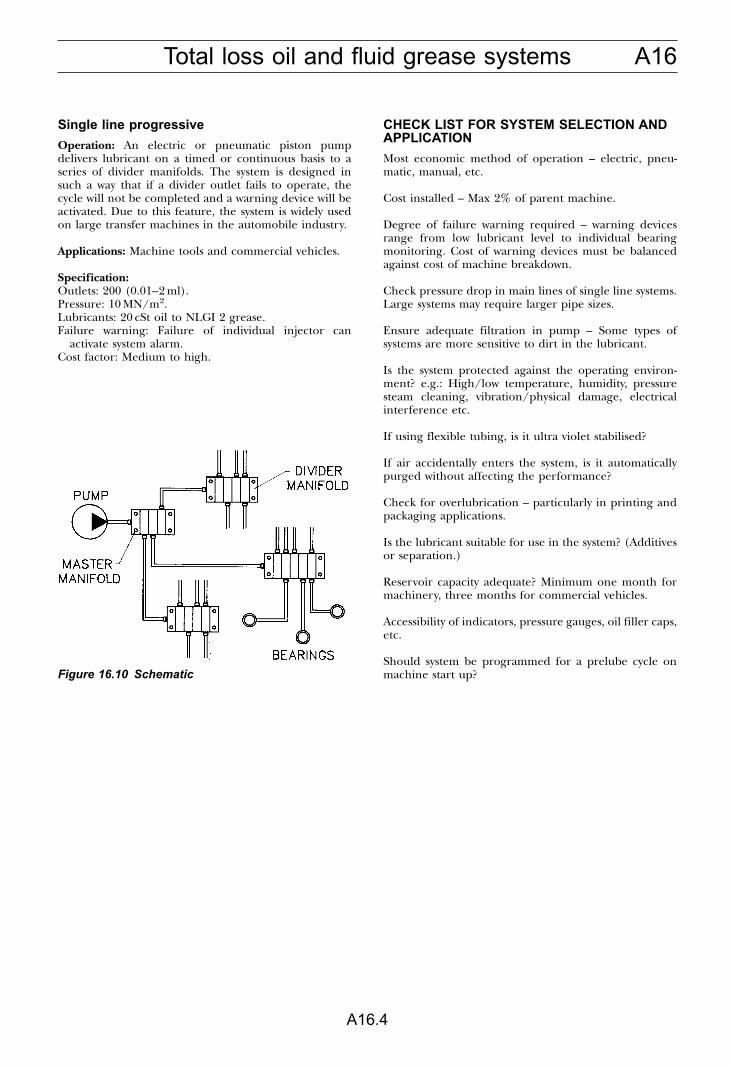
Single line progressive
Operation: An electric or pneumatic piston pumpdelivers lubricant on a timed or continuous basis to aseries of divider manifolds. The system is designed insuch a way that if a divider outlet fails to operate, thecycle will not be completed and a warning device will beactivated. Due to this feature, the system is widely usedon large transfer machines in the automobile industry.
Applications: Machine tools and commercial vehicles.
Specification:Outlets: 200 (0.01–2 ml).Pressure: 10 MN/m2.Lubricants: 20 cSt oil to NLGI 2 grease.Failure warning: Failure of individual injector can
activate system alarm.Cost factor: Medium to high.
CHECK LIST FOR SYSTEM SELECTION ANDAPPLICATION
Most economic method of operation – electric, pneu-matic, manual, etc.
Cost installed – Max 2% of parent machine.
Degree of failure warning required – warning devicesrange from low lubricant level to individual bearingmonitoring. Cost of warning devices must be balancedagainst cost of machine breakdown.
Check pressure drop in main lines of single line systems.Large systems may require larger pipe sizes.
Ensure adequate filtration in pump – Some types ofsystems are more sensitive to dirt in the lubricant.
Is the system protected against the operating environ-ment? e.g.: High/low temperature, humidity, pressuresteam cleaning, vibration/physical damage, electricalinterference etc.
If using flexible tubing, is it ultra violet stabilised?
If air accidentally enters the system, is it automaticallypurged without affecting the performance?
Check for overlubrication – particularly in printing andpackaging applications.
Is the lubricant suitable for use in the system? (Additivesor separation.)
Reservoir capacity adequate? Minimum one month formachinery, three months for commercial vehicles.
Accessibility of indicators, pressure gauges, oil filler caps,etc.
Should system be programmed for a prelube cycle onmachine start up?Figure 16.10 Schematic
A17 Mist systems
A17.1
Mist systems, generically known as aerosol systems,employ a generator supplied with filtered compressed airfrom the normal shop air main, to produce a mist offinely divided oil particles having little tendency to wet asurface. The actual air pressure applied to the inlet ofthe generator is controlled and adjusted to provide thedesired oil output.
The mist must be transmitted at a low velocity below6 m/s and a low pressure usually between 25 and 50 mbargauge through steel, copper or plastic tubes. The tubesmust be smooth and scrupulously clean internally.
At the lubrication point the mist is throttled toatmospheric pressure through a special nozzle whoseorifice size controls the total amount of lubricant appliedand raises the mist velocity to a figure in excess of 40 m/s.This causes the lubricant to wet the rubbing surfaces andthe air is permitted to escape to atmosphere. Empiricalformulae using an arbitrary unit – the ‘LubricationUnit’, are used to assess the lubricant requirements ofthe machine, the total compressed air supply requiredand the size of tubing needed.
DESIGN
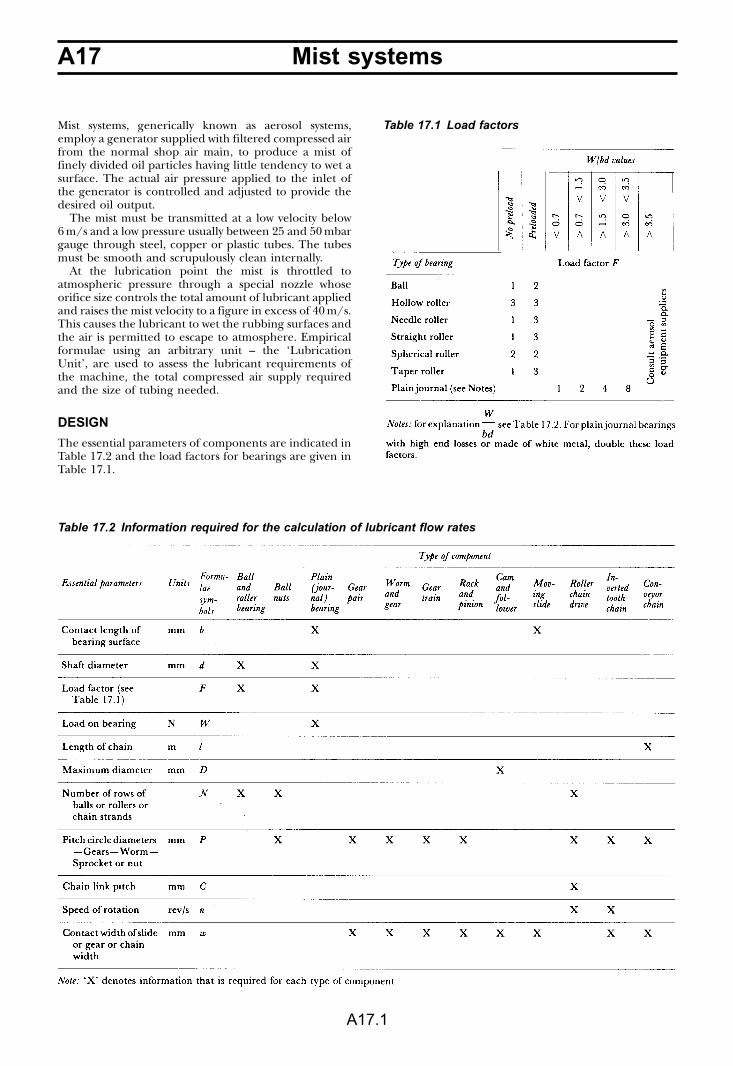
The essential parameters of components are indicated inTable 17.2 and the load factors for bearings are given inTable 17.1.
Table 17.1 Load factors
Table 17.2 Information required for the calculation of lubricant flow rates
A17Mist systems
A17.2
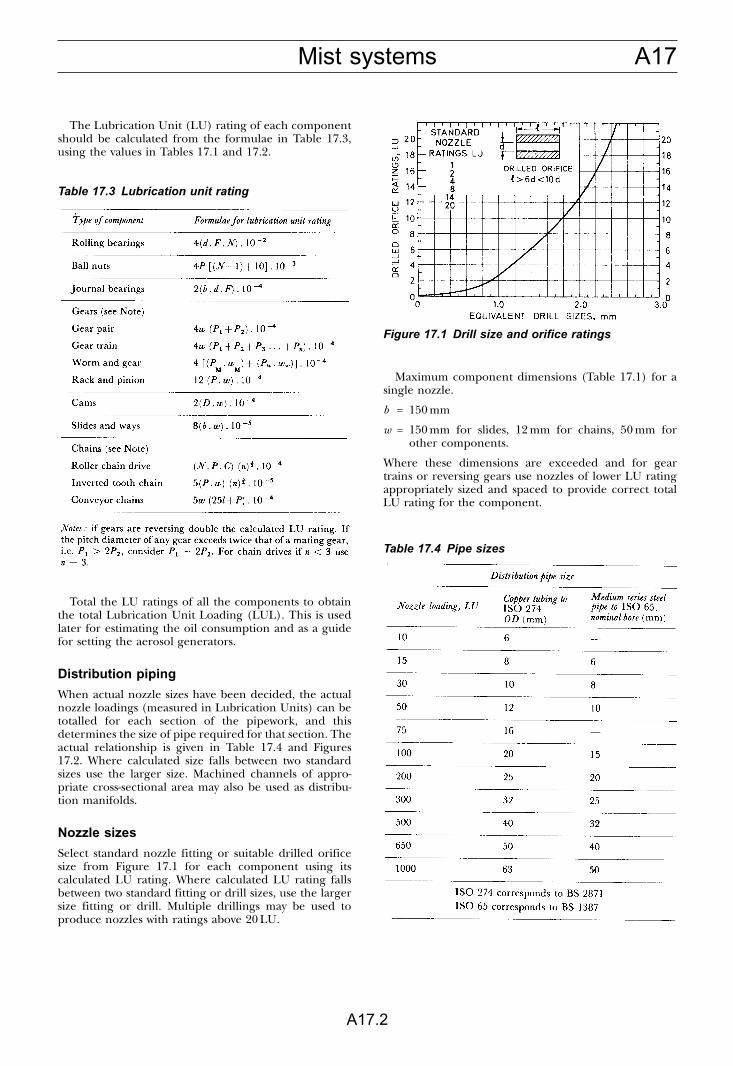
The Lubrication Unit (LU) rating of each componentshould be calculated from the formulae in Table 17.3,using the values in Tables 17.1 and 17.2.
Total the LU ratings of all the components to obtainthe total Lubrication Unit Loading (LUL). This is usedlater for estimating the oil consumption and as a guidefor setting the aerosol generators.
Distribution piping
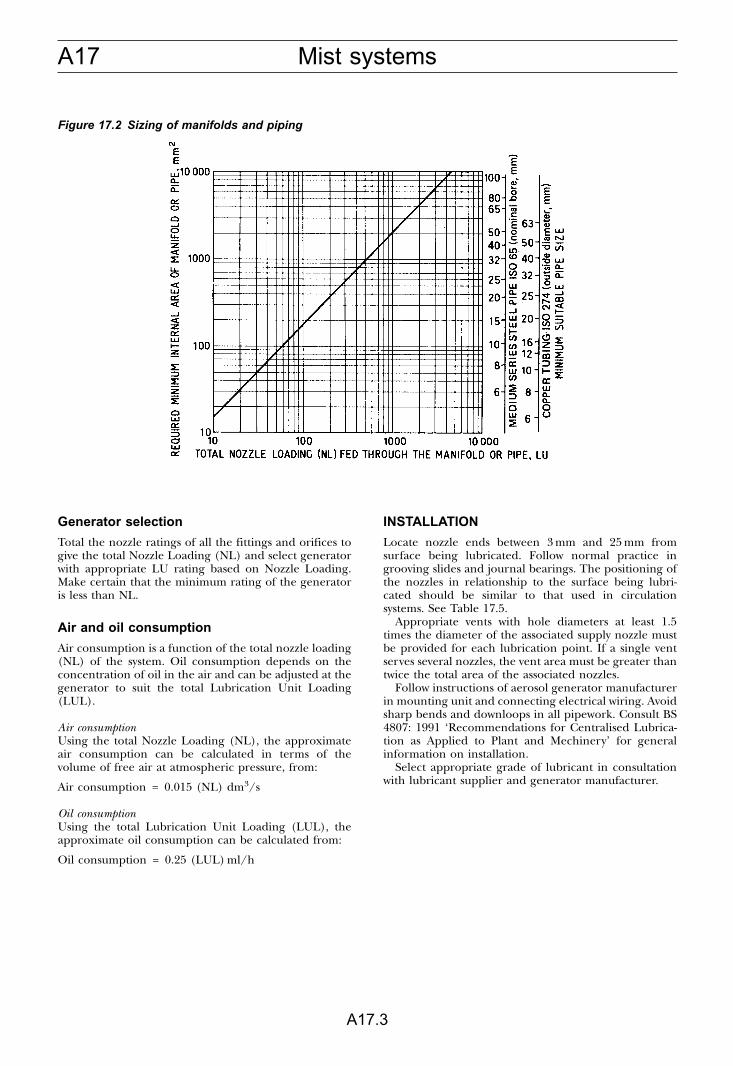
When actual nozzle sizes have been decided, the actualnozzle loadings (measured in Lubrication Units) can betotalled for each section of the pipework, and thisdetermines the size of pipe required for that section. Theactual relationship is given in Table 17.4 and Figures17.2. Where calculated size falls between two standardsizes use the larger size. Machined channels of appro-priate cross-sectional area may also be used as distribu-tion manifolds.
Nozzle sizes
Select standard nozzle fitting or suitable drilled orificesize from Figure 17.1 for each component using itscalculated LU rating. Where calculated LU rating fallsbetween two standard fitting or drill sizes, use the largersize fitting or drill. Multiple drillings may be used toproduce nozzles with ratings above 20 LU.
Maximum component dimensions (Table 17.1) for asingle nozzle.
b = 150 mm
w = 150 mm for slides, 12 mm for chains, 50 mm forother components.
Where these dimensions are exceeded and for geartrains or reversing gears use nozzles of lower LU ratingappropriately sized and spaced to provide correct totalLU rating for the component.
Table 17.3 Lubrication unit rating
Figure 17.1 Drill size and orifice ratings
Table 17.4 Pipe sizes
A17 Mist systems
A17.3
Generator selection
Total the nozzle ratings of all the fittings and orifices togive the total Nozzle Loading (NL) and select generatorwith appropriate LU rating based on Nozzle Loading.Make certain that the minimum rating of the generatoris less than NL.
Air and oil consumption
Air consumption is a function of the total nozzle loading(NL) of the system. Oil consumption depends on theconcentration of oil in the air and can be adjusted at thegenerator to suit the total Lubrication Unit Loading(LUL).
Air consumptionUsing the total Nozzle Loading (NL), the approximateair consumption can be calculated in terms of thevolume of free air at atmospheric pressure, from:
Air consumption = 0.015 (NL) dm3/s
Oil consumptionUsing the total Lubrication Unit Loading (LUL), theapproximate oil consumption can be calculated from:
Oil consumption = 0.25 (LUL) ml/h
INSTALLATION
Locate nozzle ends between 3 mm and 25 mm fromsurface being lubricated. Follow normal practice ingrooving slides and journal bearings. The positioning ofthe nozzles in relationship to the surface being lubri-cated should be similar to that used in circulationsystems. See Table 17.5.
Appropriate vents with hole diameters at least 1.5times the diameter of the associated supply nozzle mustbe provided for each lubrication point. If a single ventserves several nozzles, the vent area must be greater thantwice the total area of the associated nozzles.
Follow instructions of aerosol generator manufacturerin mounting unit and connecting electrical wiring. Avoidsharp bends and downloops in all pipework. Consult BS4807: 1991 ‘Recommendations for Centralised Lubrica-tion as Applied to Plant and Mechinery’ for generalinformation on installation.
Select appropriate grade of lubricant in consultationwith lubricant supplier and generator manufacturer.
Figure 17.2 Sizing of manifolds and piping
A17Mist systems
A17.4
Table 17.5 Nozzle positioning
A18 Dip, splash systems
A18.1
SPUR, BEVEL AND HELICAL GEARS
All gears, except very slow running ones, require complete enclosure. In general, gears dip into oil for twice tooth depth,to provide sufficient splash for pinions, bearings, etc. and to reduce churning loss to a minimum.
Typical triple reduction helical gear unit
This has guards and tanks for individual gears. Bearings are fed by splash and from a trough round the walls of the case.Suitable for up to 12.5 m/s (2500 ft/min) peripheral speed.
Typical single reduction bevel gear unit
Suitable for up to 12.5 m/s (2500 ft/min).
Typical high-speed gear unit guard
Normally satisfactory up to 25 m/s (5000 ft/min). Withspecial care can be used up to 100 m/s (20 000 ft/min).
Figure 18.1
Figure 18.2 Bevel unit with double row bearingson pinion shaft
Figure 18.3 Typical bearing lubricationarrangement with taper roller bearings
Figure 18.4
Figure 18.5 Peripheral speed against geardiameter for successful splash lubrication toupper bearings in dip-lubricated gear units
A18Dip, splash systems
A18.2
WORM GEARS
Typical under-driven worm gear unit
Oil is churned by the worm and thrown up to the topand sides of the case. From here it drips down via thewheel bearings to the sump.
A simple lip seal on a hard, ground shaft surface,prevents leakage.
Oil level generally just below worm centre-line.An oil scraper scrapes oil into a trough to feed the
wheel bearings.
Typical over-driven worm gear unit
Similar to under-driven worm gear unit except that theworm is over the wheel at the top of the unit, and the oillevel varies in depth from just above wheel tooth depth toalmost up to the centre line of the wheel, depending
upon speed. The greater the speed, the higher thechurning loss, therefore the lower should be the oil level.At low speeds, the churning loss is small and a largedepth of oil ensures good heat-transfer characteristics.
GENERAL DESIGN NOTES
Gears
In dip-splash systems, a large oil quantity is beneficial inremoving heat from the mesh to the unit walls andthence to the atmosphere.
However, a large quantity may mean special care has tobe paid to sealing, and churning losses in gears andbearings may be excessive. It is necessary to achieve abalance between these factors.
Other applications
The cylinders and small-end bearings of reciprocatingcompressors and automotive internal combustionengines are frequently splash lubricated by oil flung fromthe rotating components. In these applications thesource of the oil is usually the spill from the pressure-fedcrankshaft bearings. In some small single-cylinder com-pressors and four-stroke engines, the cap of the connect-ing rod may be fitted with a dipper which penetrates upto 10 mm into the oil in the sump and generates splashlubrication as a result. In lightly loaded applications thebig-end bearings may also be splash lubricated in thisway, and in some cases the dipper may be in the form ofa tube which scoops the oil directly into the big-endbearing. In small domestic refrigeration compressors, asimilar system may also be used to scoop oil into the endof the crankshaft, in order to lubricate all the crankshaftbearings.
Figure 18.6
A19 Circulation systems
A19.1
A circulation system is defined as an oil system in which the oil is returned to the reservoir for re-use. There are twogroups of systems: group 1, lubrication with negligible heat removal; and group 2, lubrication and cooling.
GROUP 1 SYSTEMS
Virtually any form of mechanically or electrically driven pump may be used, including piston, plunger, multiplunger,gear, vane, peristaltic, etc. The systems are comparatively simple in design and with low outputs. Various metering devicesmay be used.
Multiplunger pump systems
These systems utilise the plunger-type oil lubricators of the rising or falling drop type, employing a separate pumpingelement for each feed, giving individual adjustment and a positive feed to each lubrication point. Generally, thelubricators have up to some 32 outlets with the discharges being adjustable from zero to maximum.
Typical applications
Paper machines, large kilns, calenders, and general machinery with a large number of bearings requiring a positive feedwith feed adjustment.
Figure 19.1 Simple multipointlubricator – system containsbarest elements of pump reservoirand interconnecting pipework
Figure 19.2 Multi-point lubricatorsmounted on receiving tank –system has the advantage ofproviding setting time and betterfiltration of returned oil
Figure 19.3 Extensive system forlarge numbers of bearings, usingmulti-point lubricator system canbe extended within the limitationof the gravity feed from the headertanks
A19Circulation systems
A19.2
Positive-split systems
In general these systems deliver a larger quantity of lubricant than multiplunger systems. They comprise a small high-pressure pump with or without stand-by, fitted with integral relief valve supplying lubricant to the bearings via positivedividers. These dividers then deliver the oil to the bearings in a predetermined ratio of quantities. By use of amicroswitch operated by the indicator pin on the master divider (or single divider if the number of points is small),either timed automatic or continuous operation is available. The microswitch can also be used to give a warning offailure of the system.
Typical applications
Machine tools, sugar industry, gearboxes, printing machines, and special-purpose machinery.
Figure 19.4
A19 Circulation systems
A19.3
Double-line systems
Double-line elements can be used in conjunction with areversing valve and piston or gear pump to lubricatelarger numbers of points spread over longer distancesgeographically. These elements and their operation aresimilar to those previously described under greasesystems.
Typical applications
Machine tools, textile plant, and special-purposemachinery.
Simple low-pressure systems
The simple form illustrated uses a gear pump feeding thepoints from connections from a main feed line throughneedle valves with or without sight glasses.
Typical applications
Special-purpose machinery and machine tools.
Gravity-feed systems
Gravity-feed systems consist of a header tank, pipedthrough to one or more lubrication points. The level inthe header tank is maintained by a gear or other pumpwith relief valve and filter mounted at the collectiontank.
This may be used as a back-up for a forced-feed systemwhere important bearings have a long run-down periodafter removal of the power source, e.g. large air fans.
Figure 19.5
Figure 19.6
Figure 19.7
Figure 19.8
A19Circulation systems
A19.4
GROUP 2 SYSTEMS
The larger and usually more complex type of oil-circulatory system, used for both lubrication and cooling, falls into twodistinct classes. The first type, known as the self-contained system, is usually limited in size by the weights of thecomponents. For this reason the storage capacity of this type does not usually exceed 1000 gal. The second type coveringthe larger systems has the main components laid out at floor level, e.g. in the oil cellar. The detailed designconsiderations of the main components are discussed elsewhere, but in laying out the system the possible need for theequipment in Table 19.1 should be considered.
Self-contained systems
Large oil-circulatory systems
The large oil-circulatory systems typical of those in use in steelworks, marine applications and power stations areillustrated diagrammatically above.
Figure 19.9 A typical self-contained oil-circulatorysystem, incorporating a200 gal tank. These types ofsystem may be used, ifrequired, with a pressurevessel which would bemounted as a separate unit
Figure 19.10
A19 Circulation systems
A19.5
CONTROL OF LUBRICANT QUANTITIES
The quantity fed to the lubrication point can be controlled in a number of ways; typical examples are shown below:
The output of a metering pump is itself adjustable bysome form of manual adjustment on each pump unit.Sight glasses, of the rising or falling drop type, or of theplug and taper tube type, are normally fitted.
The positive dividers may have sections which havedifferent outputs, and may be cross-drilled to connectone or more outlets together to increase the quantityavailable for each cycle.
Table 19.1 Main components of group 2 systems
Figure 19.11 Figure 19.12
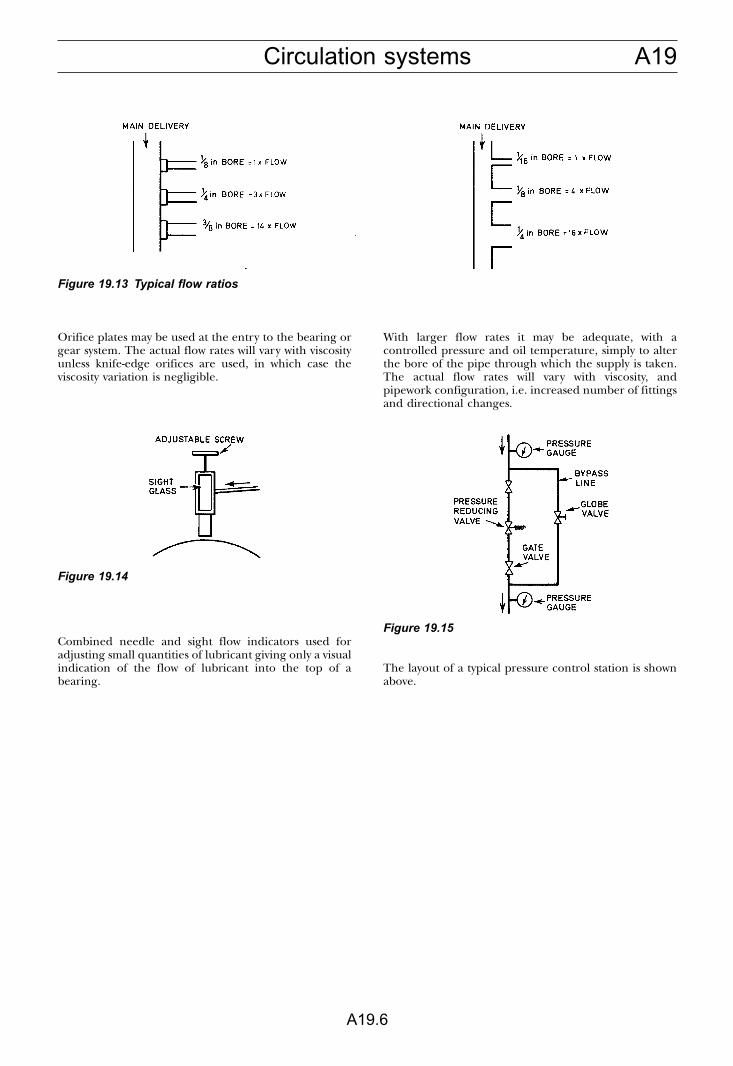
A19Circulation systems
A19.6
Orifice plates may be used at the entry to the bearing orgear system. The actual flow rates will vary with viscosityunless knife-edge orifices are used, in which case theviscosity variation is negligible.
Combined needle and sight flow indicators used foradjusting small quantities of lubricant giving only a visualindication of the flow of lubricant into the top of abearing.
With larger flow rates it may be adequate, with acontrolled pressure and oil temperature, simply to alterthe bore of the pipe through which the supply is taken.The actual flow rates will vary with viscosity, andpipework configuration, i.e. increased number of fittingsand directional changes.
The layout of a typical pressure control station is shownabove.
Figure 19.13 Typical flow ratios
Figure 19.14
Figure 19.15
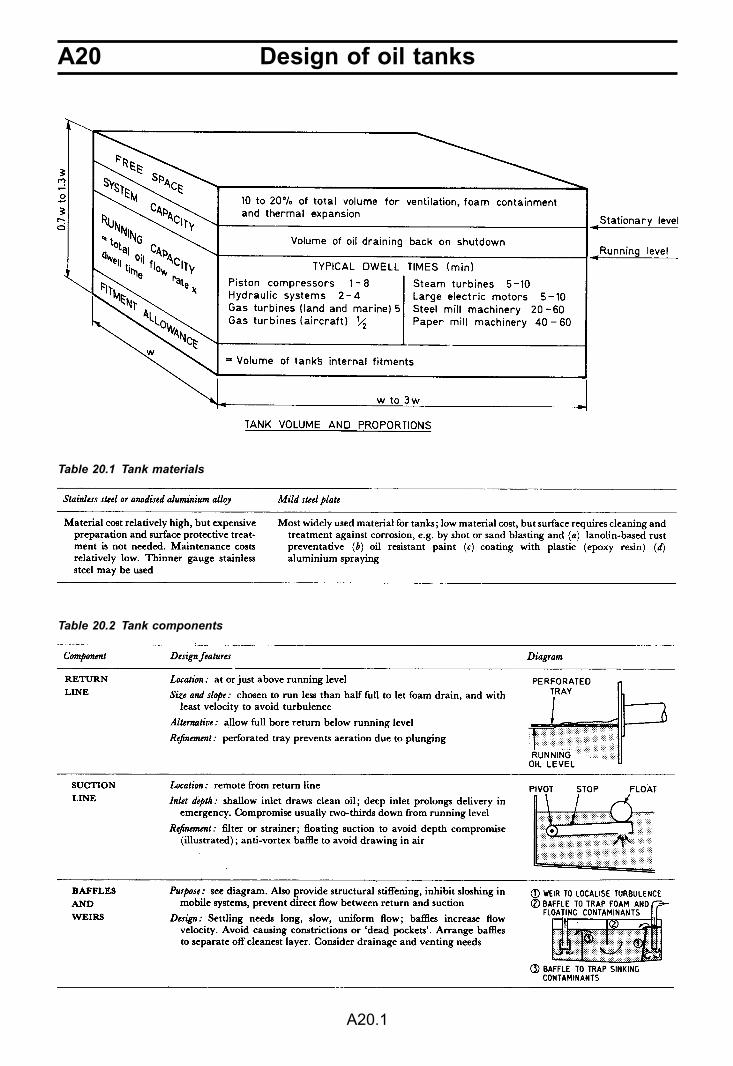
A20 Design of oil tanks
A20.1
Table 20.1 Tank materials
Table 20.2 Tank components
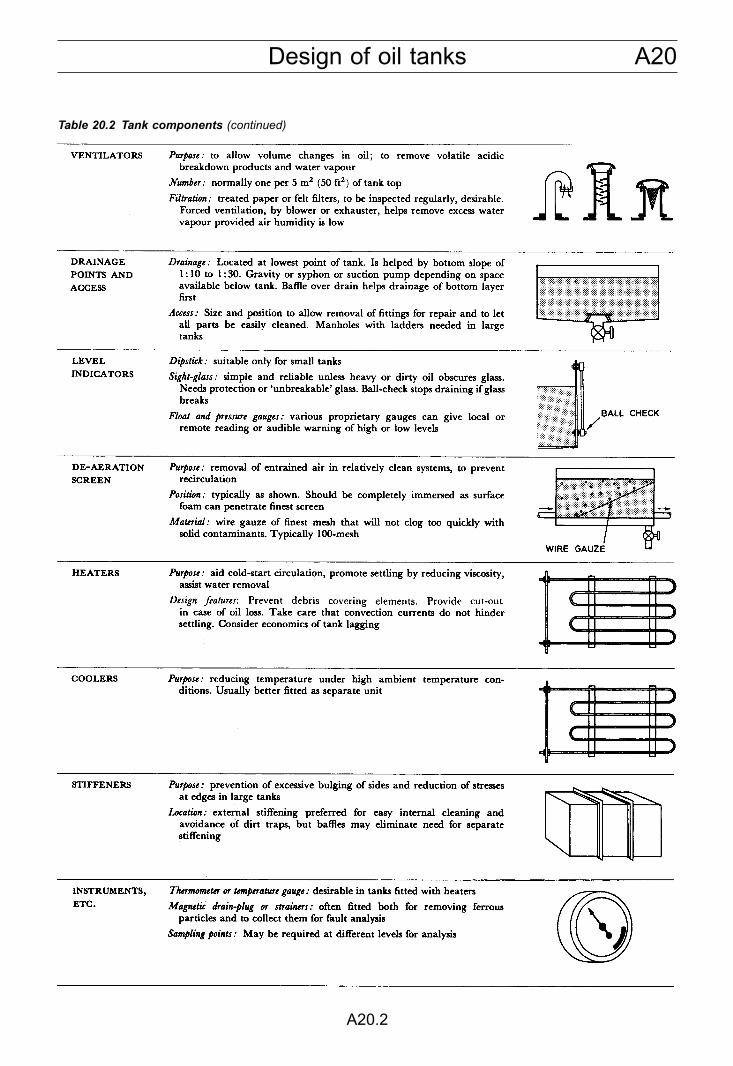
A20Design of oil tanks
A20.2
Table 20.2 Tank components (continued)
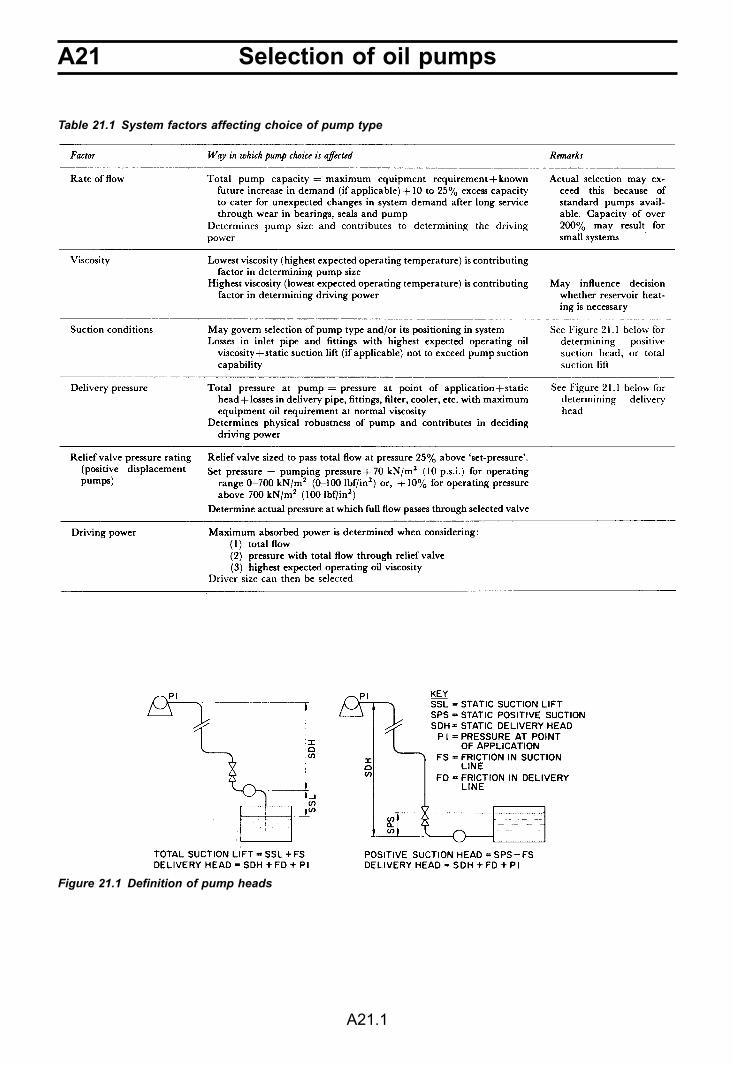
A21 Selection of oil pumps
A21.1
Table 21.1 System factors affecting choice of pump type
Figure 21.1 Definition of pump heads
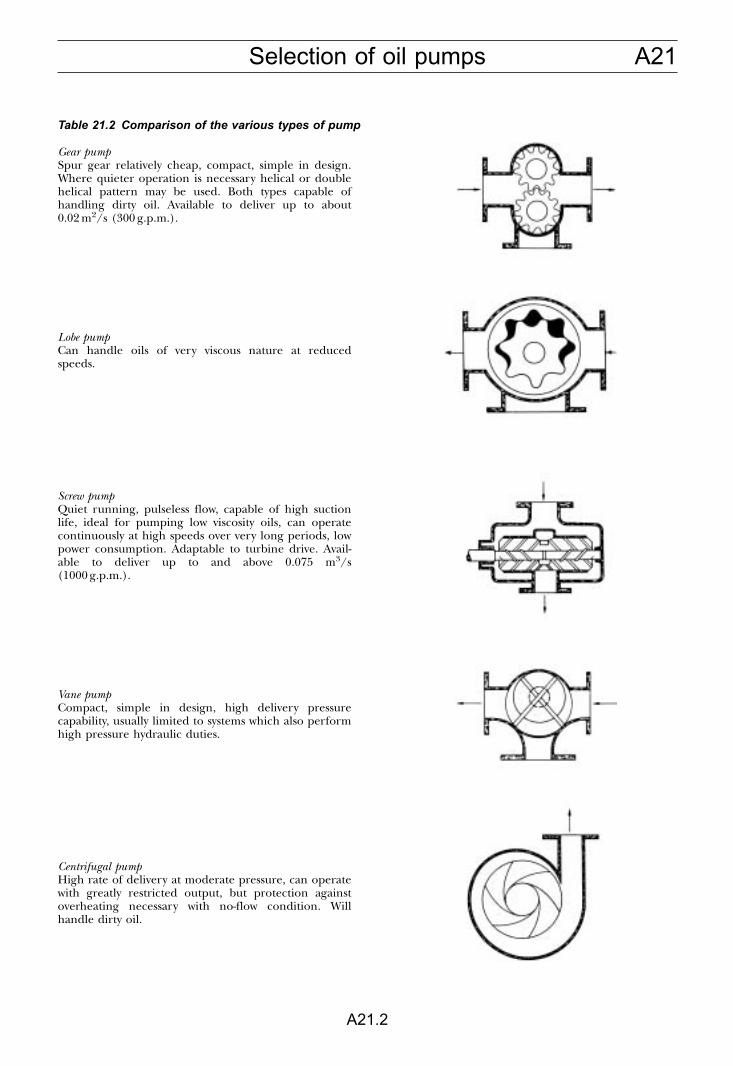
A21Selection of oil pumps
A21.2
Table 21.2 Comparison of the various types of pump
Gear pumpSpur gear relatively cheap, compact, simple in design.Where quieter operation is necessary helical or doublehelical pattern may be used. Both types capable ofhandling dirty oil. Available to deliver up to about0.02 m2/s (300 g.p.m.).
Lobe pumpCan handle oils of very viscous nature at reducedspeeds.
Screw pumpQuiet running, pulseless flow, capable of high suctionlife, ideal for pumping low viscosity oils, can operatecontinuously at high speeds over very long periods, lowpower consumption. Adaptable to turbine drive. Avail-able to deliver up to and above 0.075 m3/s(1000 g.p.m.).
Vane pumpCompact, simple in design, high delivery pressurecapability, usually limited to systems which also performhigh pressure hydraulic duties.
Centrifugal pumpHigh rate of delivery at moderate pressure, can operatewith greatly restricted output, but protection againstoverheating necessary with no-flow condition. Willhandle dirty oil.

A21 Selection of oil pumps
A21.3
Table 21.3 Pump performance factors affecting choice of pump type
Figure 21.2 Delivery against speed and viscosityfor a positive displacement pump
Figure 21.3 Pressure against delivery for positivedisplacement and centrifugal pumps
Table 21.4 Selection by suction characteristics
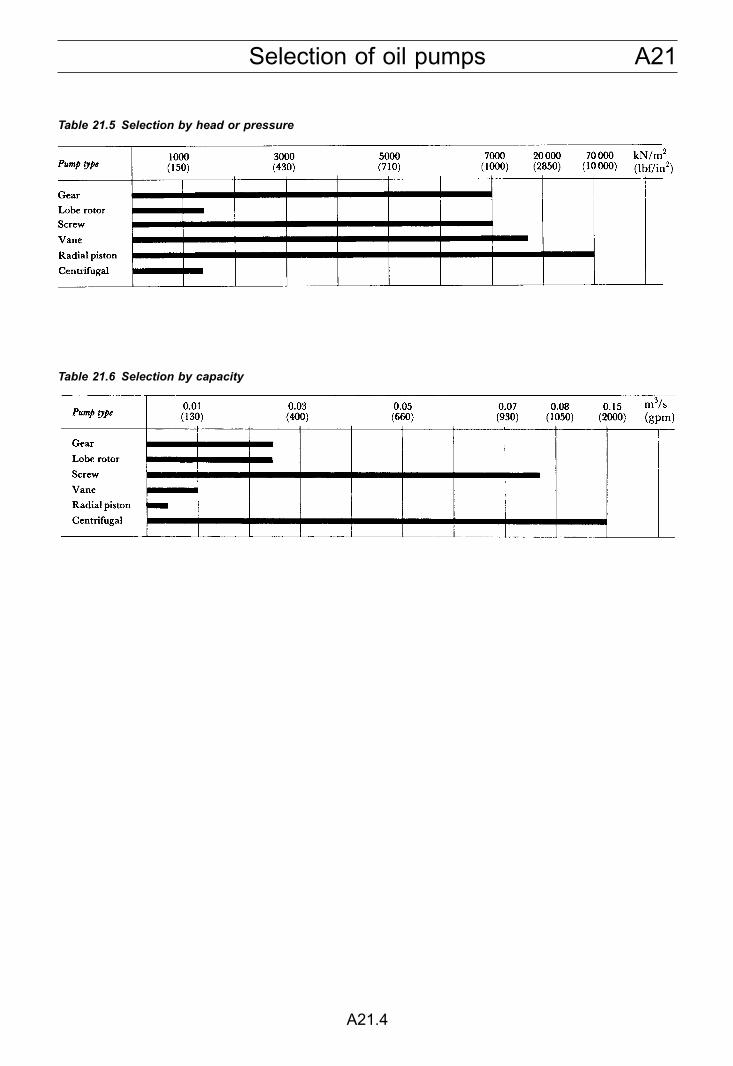
A21Selection of oil pumps
A21.4
Table 21.5 Selection by head or pressure
Table 21.6 Selection by capacity
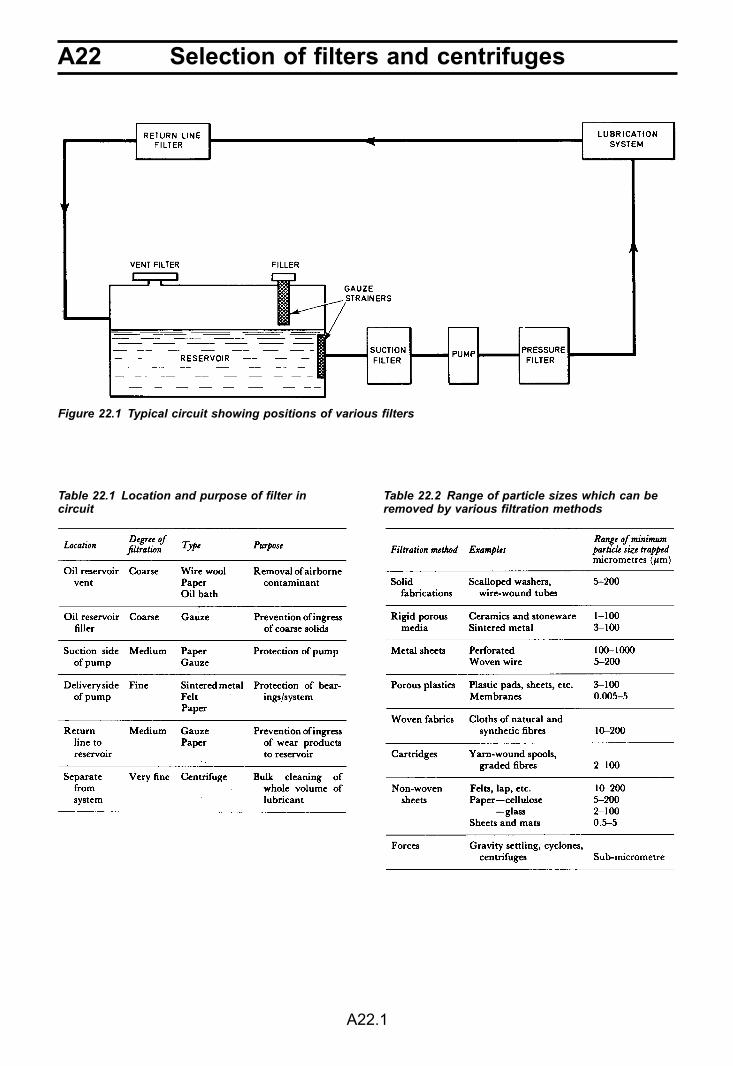
A22 Selection of filters and centrifuges
A22.1
Figure 22.1 Typical circuit showing positions of various filters
Table 22.1 Location and purpose of filter incircuit
Table 22.2 Range of particle sizes which can beremoved by various filtration methods

A22Selection of filters and centrifuges
A22.2
PRESSURE FILTERS
Pressure filter specification and use
Figure 22.2 Various forms of woven wire mesh Figure 22.3 Typical filter efficiency curves
Figure 22.4 Typical full-flow pressure filter with integral bypass and pressure differential indicator
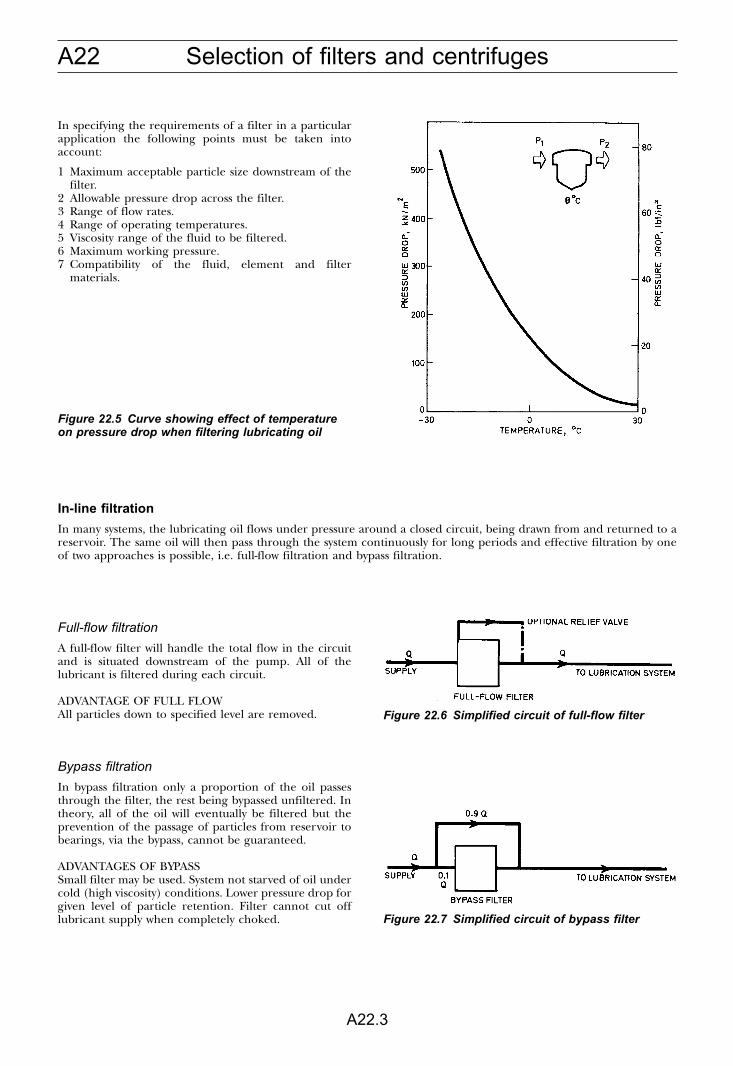
A22 Selection of filters and centrifuges
A22.3
In specifying the requirements of a filter in a particularapplication the following points must be taken intoaccount:
1 Maximum acceptable particle size downstream of thefilter.
2 Allowable pressure drop across the filter.3 Range of flow rates.4 Range of operating temperatures.5 Viscosity range of the fluid to be filtered.6 Maximum working pressure.7 Compatibility of the fluid, element and filter
materials.
In-line filtration
In many systems, the lubricating oil flows under pressure around a closed circuit, being drawn from and returned to areservoir. The same oil will then pass through the system continuously for long periods and effective filtration by oneof two approaches is possible, i.e. full-flow filtration and bypass filtration.
Full-flow filtration
A full-flow filter will handle the total flow in the circuitand is situated downstream of the pump. All of thelubricant is filtered during each circuit.
ADVANTAGE OF FULL FLOWAll particles down to specified level are removed.
Bypass filtration
In bypass filtration only a proportion of the oil passesthrough the filter, the rest being bypassed unfiltered. Intheory, all of the oil will eventually be filtered but theprevention of the passage of particles from reservoir tobearings, via the bypass, cannot be guaranteed.
ADVANTAGES OF BYPASSSmall filter may be used. System not starved of oil undercold (high viscosity) conditions. Lower pressure drop forgiven level of particle retention. Filter cannot cut offlubricant supply when completely choked.
Figure 22.5 Curve showing effect of temperatureon pressure drop when filtering lubricating oil
Figure 22.6 Simplified circuit of full-flow filter
Figure 22.7 Simplified circuit of bypass filter
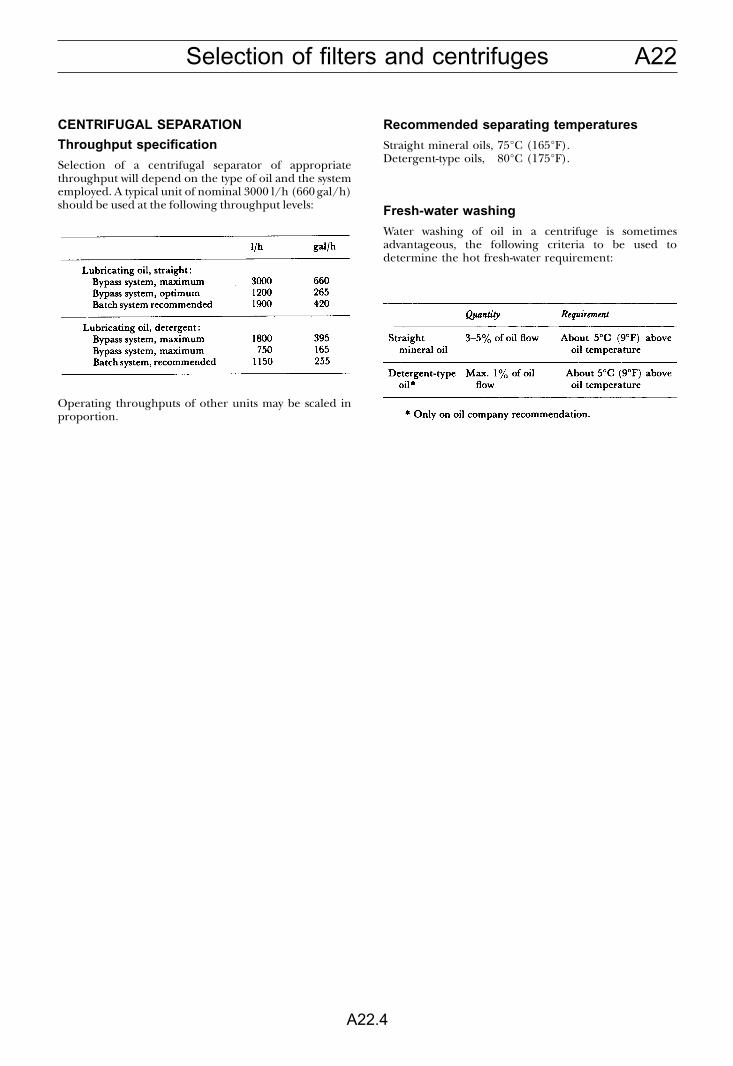
A22Selection of filters and centrifuges
A22.4
CENTRIFUGAL SEPARATION
Throughput specification
Selection of a centrifugal separator of appropriatethroughput will depend on the type of oil and the systememployed. A typical unit of nominal 3000 l/h (660 gal/h)should be used at the following throughput levels:
Operating throughputs of other units may be scaled inproportion.
Recommended separating temperatures
Straight mineral oils, 75°C (165°F).Detergent-type oils, 80°C (175°F).
Fresh-water washing
Water washing of oil in a centrifuge is sometimesadvantageous, the following criteria to be used todetermine the hot fresh-water requirement:
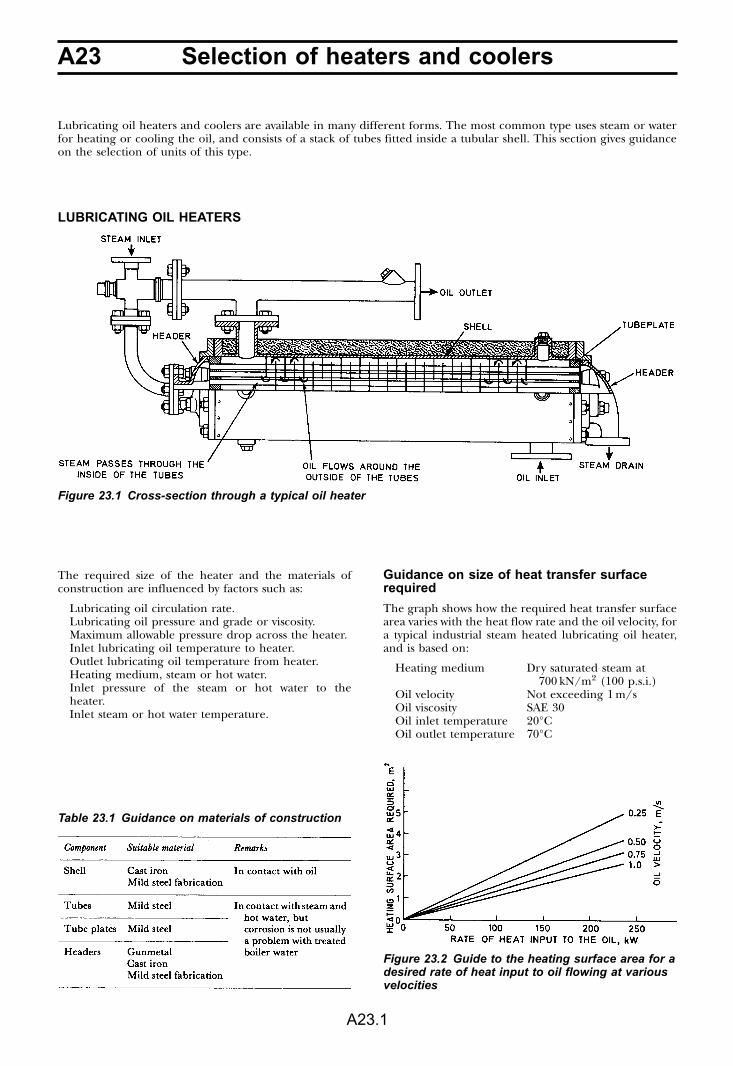
A23 Selection of heaters and coolers
A23.1
Lubricating oil heaters and coolers are available in many different forms. The most common type uses steam or waterfor heating or cooling the oil, and consists of a stack of tubes fitted inside a tubular shell. This section gives guidanceon the selection of units of this type.
LUBRICATING OIL HEATERS
The required size of the heater and the materials ofconstruction are influenced by factors such as:
Lubricating oil circulation rate.Lubricating oil pressure and grade or viscosity.Maximum allowable pressure drop across the heater.Inlet lubricating oil temperature to heater.Outlet lubricating oil temperature from heater.Heating medium, steam or hot water.Inlet pressure of the steam or hot water to theheater.Inlet steam or hot water temperature.
Guidance on size of heat transfer surfacerequired
The graph shows how the required heat transfer surfacearea varies with the heat flow rate and the oil velocity, fora typical industrial steam heated lubricating oil heater,and is based on:
Heating medium Dry saturated steam at700 kN/m2 (100 p.s.i.)
Oil velocity Not exceeding 1 m/sOil viscosity SAE 30Oil inlet temperature 20°COil outlet temperature 70°C
Figure 23.1 Cross-section through a typical oil heater
Table 23.1 Guidance on materials of construction
Figure 23.2 Guide to the heating surface area for adesired rate of heat input to oil flowing at variousvelocities
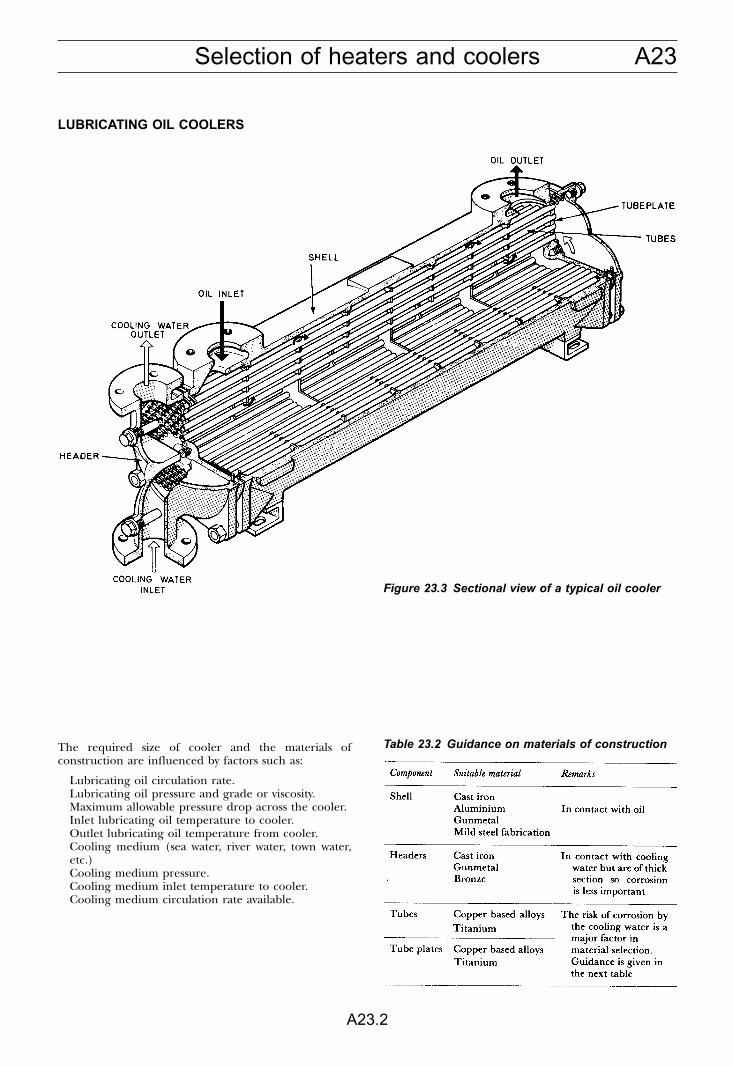
A23Selection of heaters and coolers
A23.2
LUBRICATING OIL COOLERS
The required size of cooler and the materials ofconstruction are influenced by factors such as:
Lubricating oil circulation rate.Lubricating oil pressure and grade or viscosity.Maximum allowable pressure drop across the cooler.Inlet lubricating oil temperature to cooler.Outlet lubricating oil temperature from cooler.Cooling medium (sea water, river water, town water,etc.)Cooling medium pressure.Cooling medium inlet temperature to cooler.Cooling medium circulation rate available.
Figure 23.3 Sectional view of a typical oil cooler
Table 23.2 Guidance on materials of construction

A23 Selection of heaters and coolers
A23.3
Guidance on the size of cooling surface arearequired
The graph shows how the cooling area required varieswith the heat dissipation required, and the cooling watertemperature for typical lubricating oil system conditionsof:
Oil velocity 0.7 m/sOil viscosity SAE 30Water velocity 1 m/sOil inlet temperature 70°COil outlet temperature 60°C
Table 23.3 Choice of tube materials for use withvarious types of cooling water
Figure 23.4 Guide to the cooling surface arearequired for a desired dissipation rate at variouscooling water temperatures
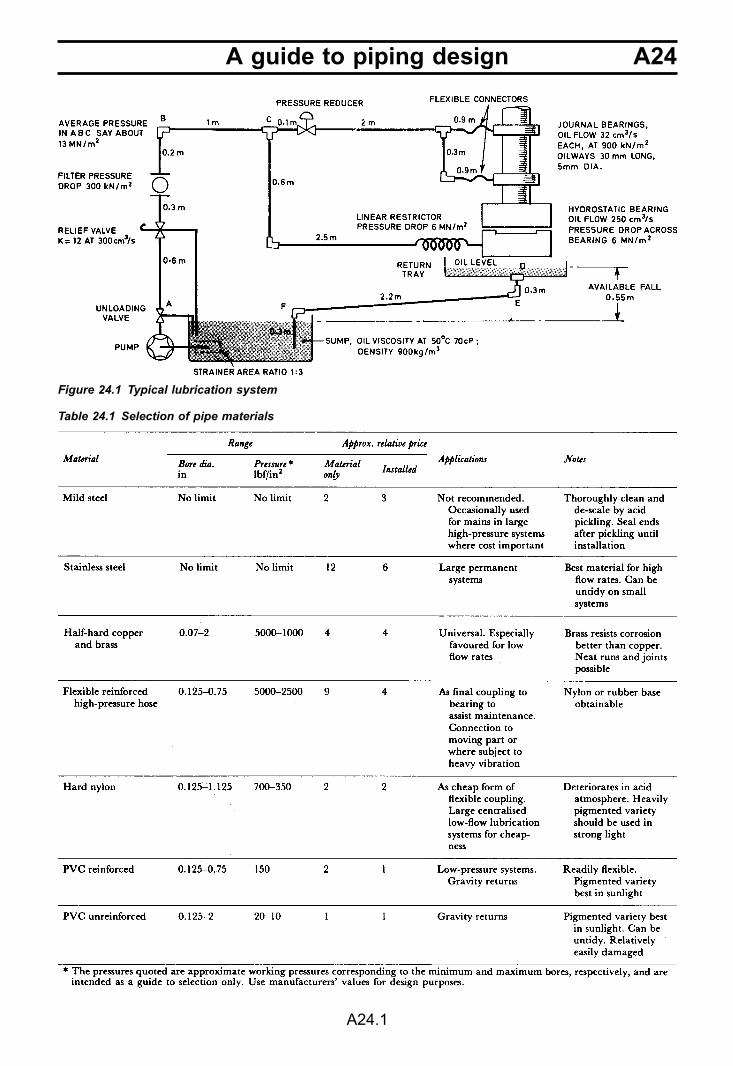
A24A guide to piping design
A24.1
Figure 24.1 Typical lubrication system
Table 24.1 Selection of pipe materials
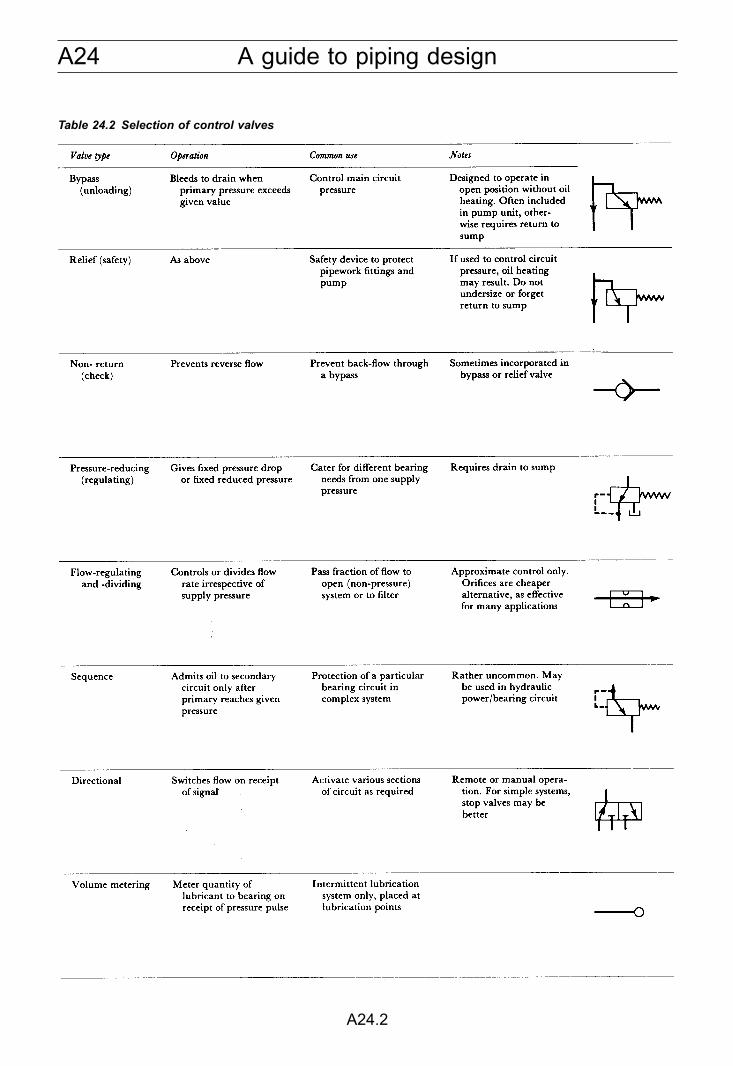
A24 A guide to piping design
A24.2
Table 24.2 Selection of control valves
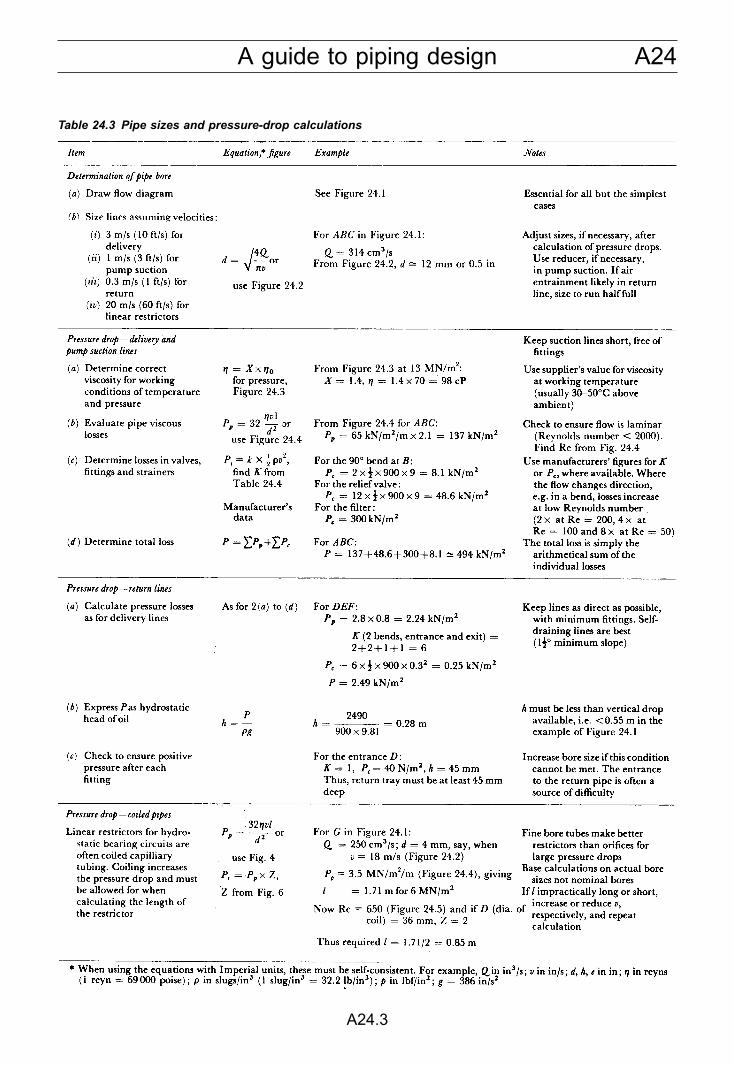
A24A guide to piping design
A24.3
Table 24.3 Pipe sizes and pressure-drop calculations
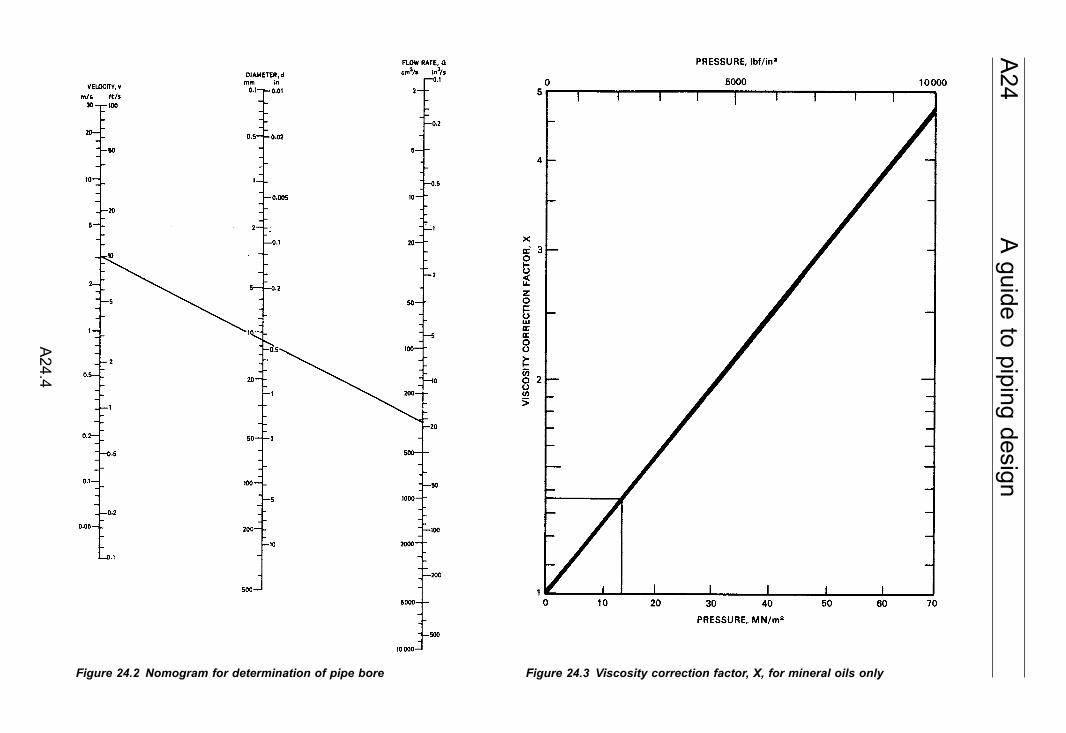
A24
A guide to piping design
A24.4
Figure 24.2 Nomogram for determination of pipe bore Figure 24.3 Viscosity correction factor, X, for mineral oils only
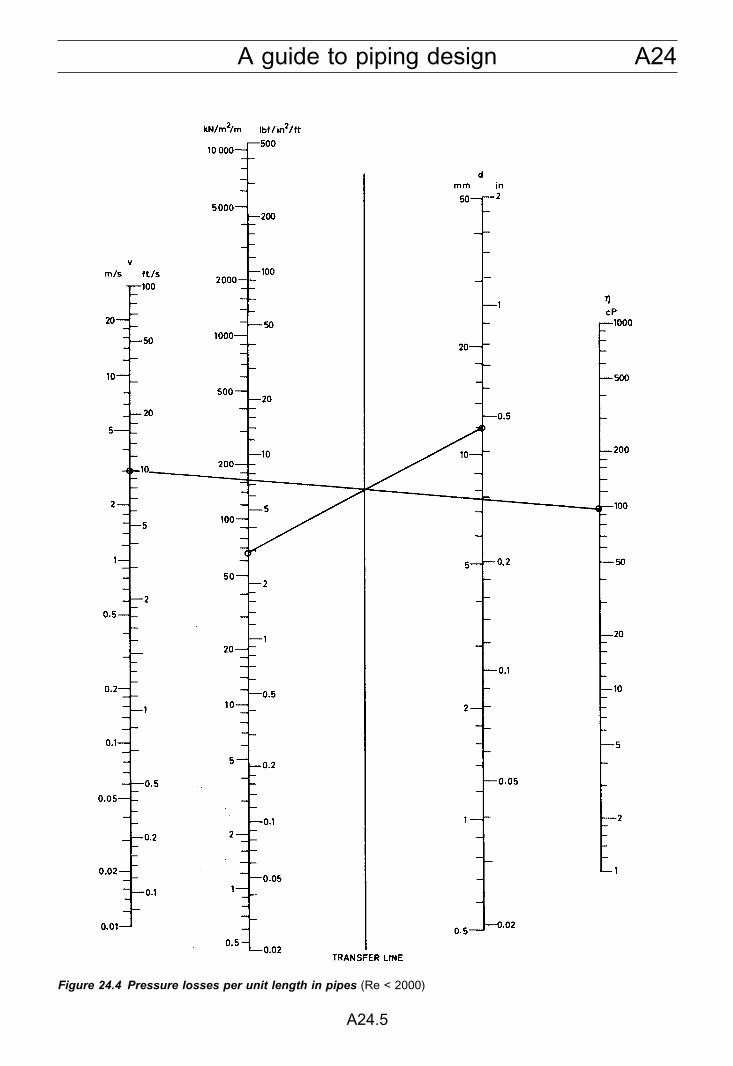
A24A guide to piping design
A24.5
Figure 24.4 Pressure losses per unit length in pipes (Re < 2000)
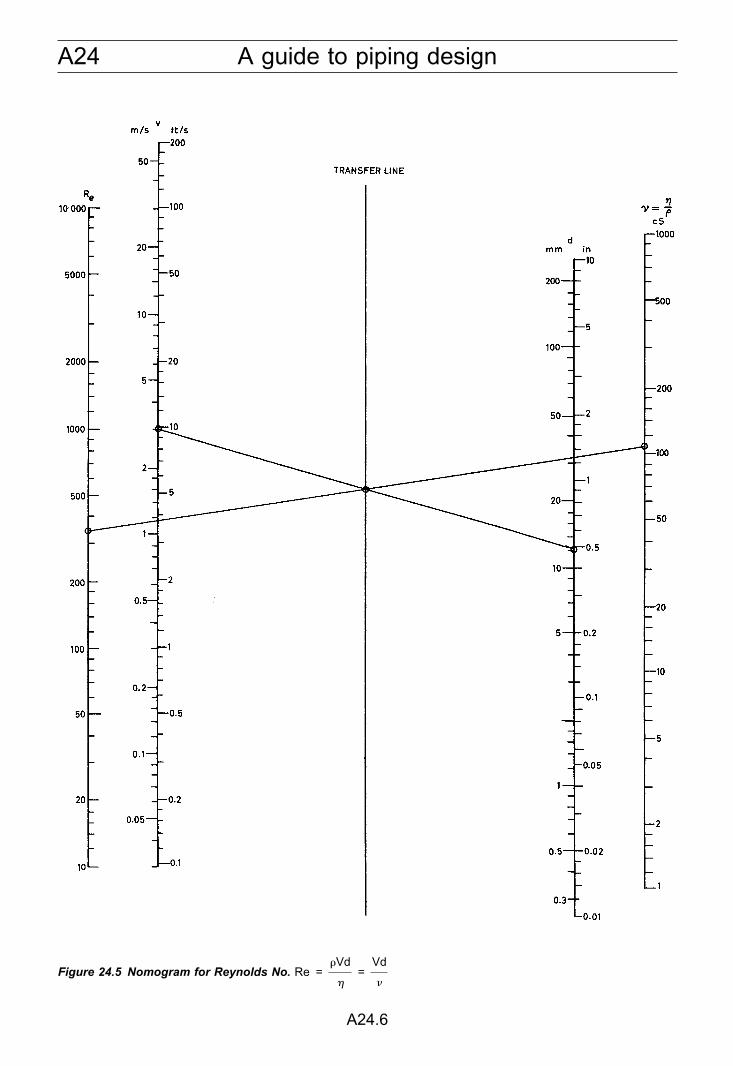
A24 A guide to piping design
A24.6
Figure 24.5 Nomogram for Reynolds No. Re =�Vd
�=
Vd
�
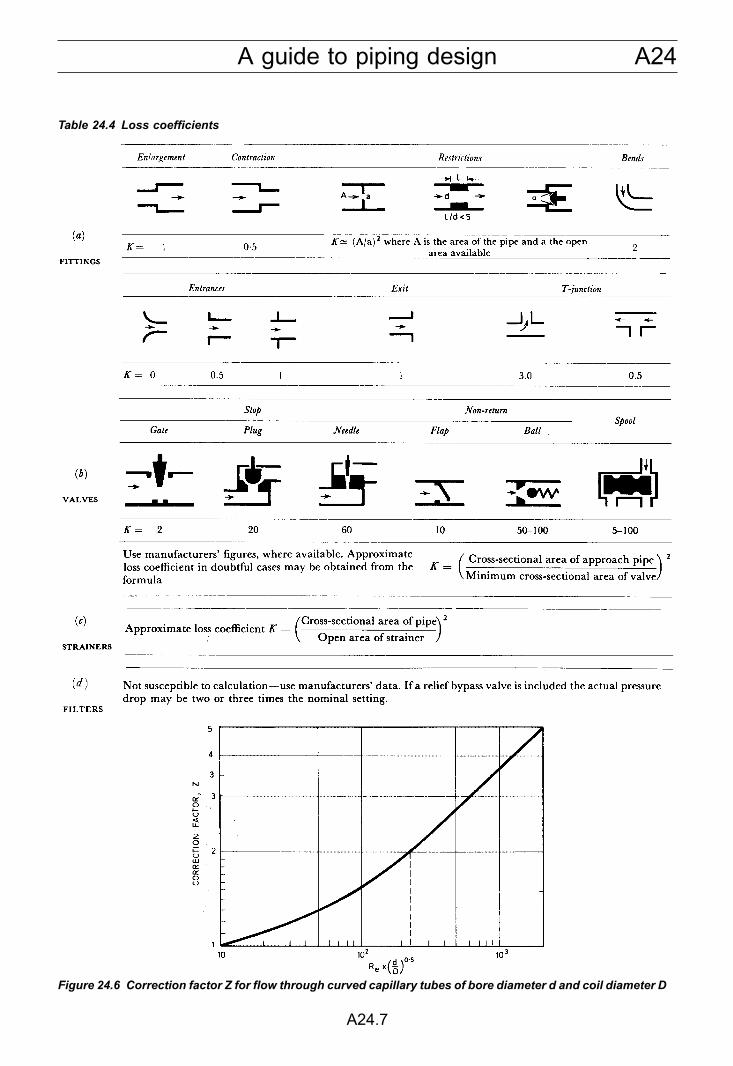
A24A guide to piping design
A24.7
Table 24.4 Loss coefficients
Figure 24.6 Correction factor Z for flow through curved capillary tubes of bore diameter d and coil diameter D
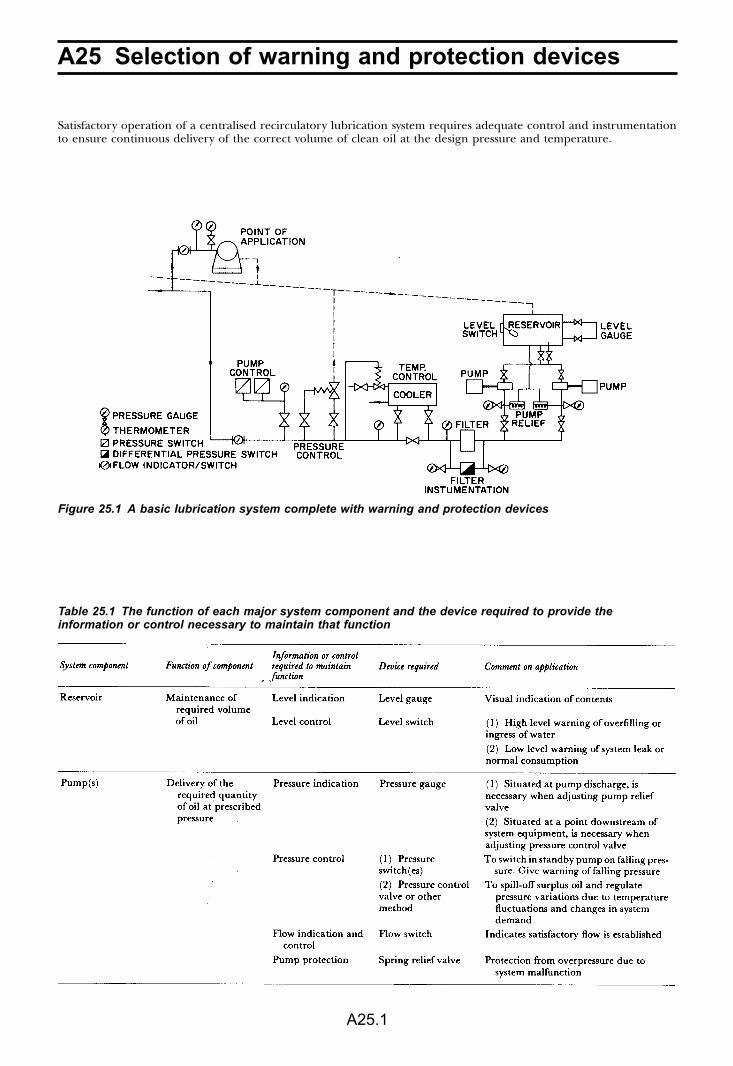
A25 Selection of warning and protection devices
A25.1
Satisfactory operation of a centralised recirculatory lubrication system requires adequate control and instrumentationto ensure continuous delivery of the correct volume of clean oil at the design pressure and temperature.
Figure 25.1 A basic lubrication system complete with warning and protection devices
Table 25.1 The function of each major system component and the device required to provide theinformation or control necessary to maintain that function
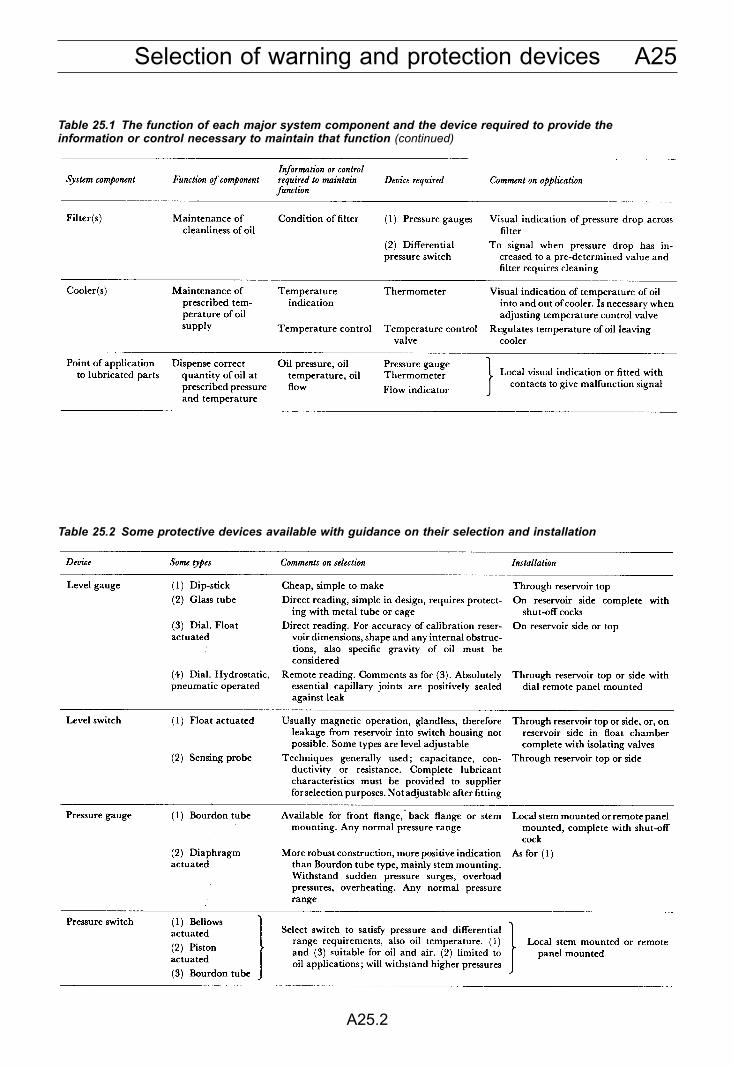
A25Selection of warning and protection devices
A25.2
Table 25.1 The function of each major system component and the device required to provide theinformation or control necessary to maintain that function (continued)
Table 25.2 Some protective devices available with guidance on their selection and installation
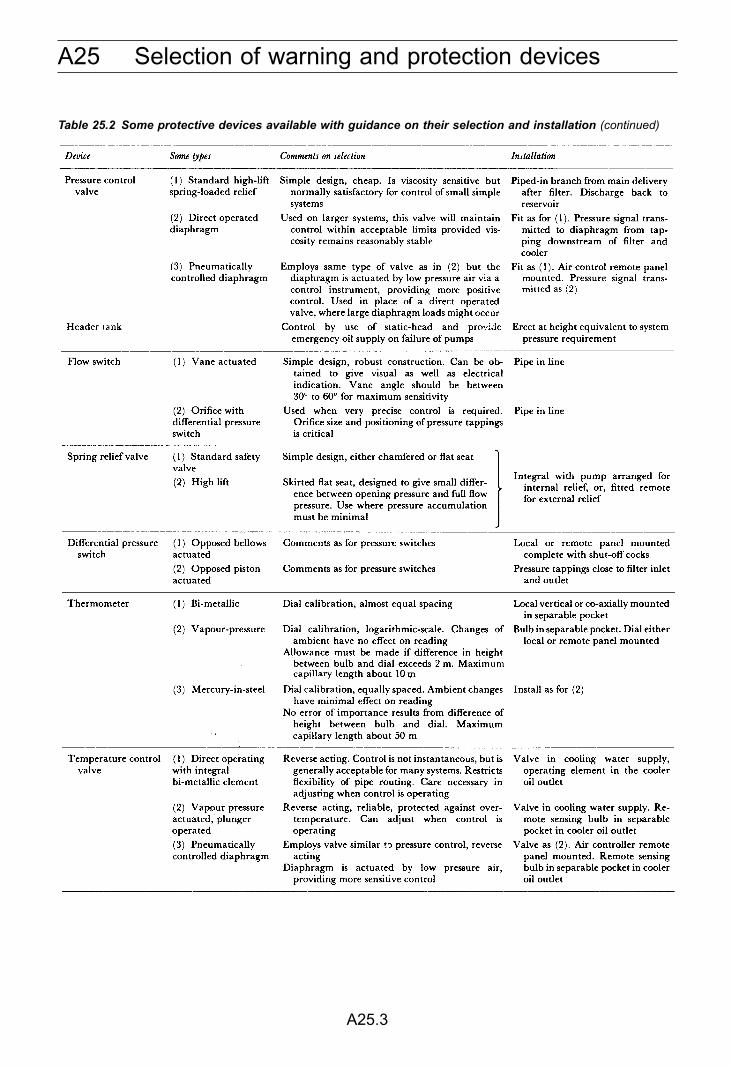
A25 Selection of warning and protection devices
A25.3
Table 25.2 Some protective devices available with guidance on their selection and installation (continued)
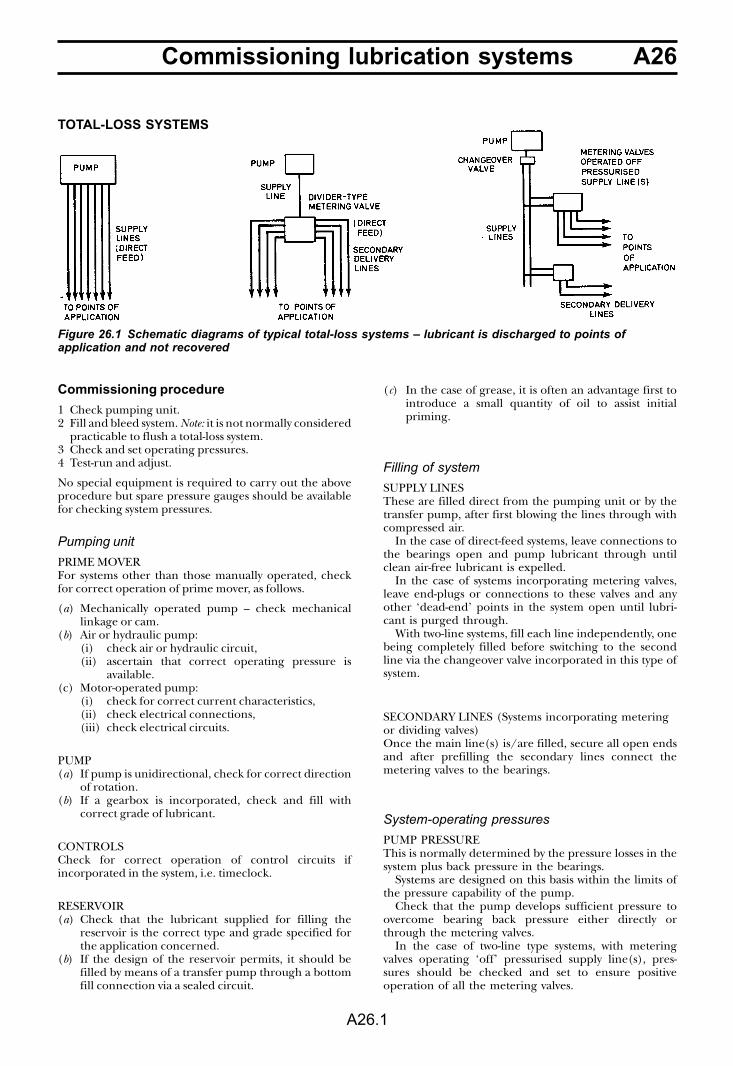
A26Commissioning lubrication systems
A26.1
TOTAL-LOSS SYSTEMS
Commissioning procedure
1 Check pumping unit.2 Fill and bleed system. Note: it is not normally considered
practicable to flush a total-loss system.3 Check and set operating pressures.4 Test-run and adjust.
No special equipment is required to carry out the aboveprocedure but spare pressure gauges should be availablefor checking system pressures.
Pumping unit
PRIME MOVERFor systems other than those manually operated, checkfor correct operation of prime mover, as follows.
(a) Mechanically operated pump – check mechanicallinkage or cam.
(b) Air or hydraulic pump:(i) check air or hydraulic circuit,(ii) ascertain that correct operating pressure is
available.(c) Motor-operated pump:
(i) check for correct current characteristics,(ii) check electrical connections,(iii) check electrical circuits.
PUMP(a) If pump is unidirectional, check for correct direction
of rotation.(b) If a gearbox is incorporated, check and fill with
correct grade of lubricant.
CONTROLSCheck for correct operation of control circuits ifincorporated in the system, i.e. timeclock.
RESERVOIR(a) Check that the lubricant supplied for filling the
reservoir is the correct type and grade specified forthe application concerned.
(b) If the design of the reservoir permits, it should befilled by means of a transfer pump through a bottomfill connection via a sealed circuit.
(c) In the case of grease, it is often an advantage first tointroduce a small quantity of oil to assist initialpriming.
Filling of system
SUPPLY LINESThese are filled direct from the pumping unit or by thetransfer pump, after first blowing the lines through withcompressed air.
In the case of direct-feed systems, leave connections tothe bearings open and pump lubricant through untilclean air-free lubricant is expelled.
In the case of systems incorporating metering valves,leave end-plugs or connections to these valves and anyother ‘dead-end’ points in the system open until lubri-cant is purged through.
With two-line systems, fill each line independently, onebeing completely filled before switching to the secondline via the changeover valve incorporated in this type ofsystem.
SECONDARY LINES (Systems incorporating meteringor dividing valves)Once the main line(s) is/are filled, secure all open endsand after prefilling the secondary lines connect themetering valves to the bearings.
System-operating pressures
PUMP PRESSUREThis is normally determined by the pressure losses in thesystem plus back pressure in the bearings.
Systems are designed on this basis within the limits ofthe pressure capability of the pump.
Check that the pump develops sufficient pressure toovercome bearing back pressure either directly orthrough the metering valves.
In the case of two-line type systems, with meteringvalves operating ‘off’ pressurised supply line(s), pres-sures should be checked and set to ensure positiveoperation of all the metering valves.
Figure 26.1 Schematic diagrams of typical total-loss systems – lubricant is discharged to points ofapplication and not recovered
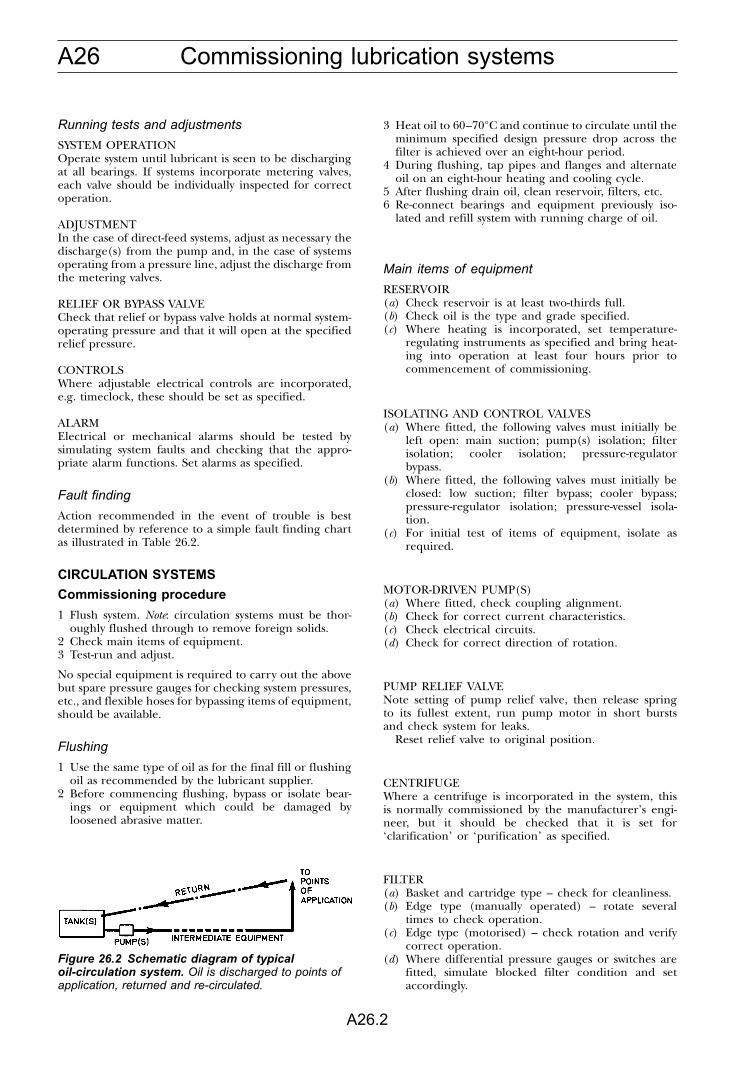
A26 Commissioning lubrication systems
A26.2
Running tests and adjustments
SYSTEM OPERATIONOperate system until lubricant is seen to be dischargingat all bearings. If systems incorporate metering valves,each valve should be individually inspected for correctoperation.
ADJUSTMENTIn the case of direct-feed systems, adjust as necessary thedischarge(s) from the pump and, in the case of systemsoperating from a pressure line, adjust the discharge fromthe metering valves.
RELIEF OR BYPASS VALVECheck that relief or bypass valve holds at normal system-operating pressure and that it will open at the specifiedrelief pressure.
CONTROLSWhere adjustable electrical controls are incorporated,e.g. timeclock, these should be set as specified.
ALARMElectrical or mechanical alarms should be tested bysimulating system faults and checking that the appro-priate alarm functions. Set alarms as specified.
Fault finding
Action recommended in the event of trouble is bestdetermined by reference to a simple fault finding chartas illustrated in Table 26.2.
CIRCULATION SYSTEMS
Commissioning procedure
1 Flush system. Note: circulation systems must be thor-oughly flushed through to remove foreign solids.
2 Check main items of equipment.3 Test-run and adjust.
No special equipment is required to carry out the abovebut spare pressure gauges for checking system pressures,etc., and flexible hoses for bypassing items of equipment,should be available.
Flushing
1 Use the same type of oil as for the final fill or flushingoil as recommended by the lubricant supplier.
2 Before commencing flushing, bypass or isolate bear-ings or equipment which could be damaged byloosened abrasive matter.
3 Heat oil to 60–70°C and continue to circulate until theminimum specified design pressure drop across thefilter is achieved over an eight-hour period.
4 During flushing, tap pipes and flanges and alternateoil on an eight-hour heating and cooling cycle.
5 After flushing drain oil, clean reservoir, filters, etc.6 Re-connect bearings and equipment previously iso-
lated and refill system with running charge of oil.
Main items of equipment
RESERVOIR(a) Check reservoir is at least two-thirds full.(b) Check oil is the type and grade specified.(c) Where heating is incorporated, set temperature-
regulating instruments as specified and bring heat-ing into operation at least four hours prior tocommencement of commissioning.
ISOLATING AND CONTROL VALVES(a) Where fitted, the following valves must initially be
left open: main suction; pump(s) isolation; filterisolation; cooler isolation; pressure-regulatorbypass.
(b) Where fitted, the following valves must initially beclosed: low suction; filter bypass; cooler bypass;pressure-regulator isolation; pressure-vessel isola-tion.
(c) For initial test of items of equipment, isolate asrequired.
MOTOR-DRIVEN PUMP(S)(a) Where fitted, check coupling alignment.(b) Check for correct current characteristics.(c) Check electrical circuits.(d) Check for correct direction of rotation.
PUMP RELIEF VALVENote setting of pump relief valve, then release springto its fullest extent, run pump motor in short burstsand check system for leaks.
Reset relief valve to original position.
CENTRIFUGEWhere a centrifuge is incorporated in the system, thisis normally commissioned by the manufacturer’s engi-neer, but it should be checked that it is set for‘clarification’ or ‘purification’ as specified.
FILTER(a) Basket and cartridge type – check for cleanliness.(b) Edge type (manually operated) – rotate several
times to check operation.(c) Edge type (motorised) – check rotation and verify
correct operation.(d) Where differential pressure gauges or switches are
fitted, simulate blocked filter condition and setaccordingly.
Figure 26.2 Schematic diagram of typicaloil-circulation system. Oil is discharged to points ofapplication, returned and re-circulated.
A26Commissioning lubrication systems
A26.3
PRESSURE VESSEL(a) Check to ensure safety relief valve functions correctly.(b) Make sure there are no leaks in air piping.
PRESSURE-REGULATING VALVE(a) Diaphragm-operated type – with pump motor swit-
ched on, set pressure-regulating valve by openingisolation valves and diaphragm control valve andslowly closing bypass valve.
Adjust initially to system-pressure requirements asspecified.
(b) Spring-pattern type – set valve initially to system-pressure requirements as specified.
COOLERCheck water supply is available as specified.
Running tests and adjustments
(1) Run pump(s) check output at points of application,and finally adjust pressure-regulating valve to suitoperating requirements.
(2) Where fitted, set pressure and flow switches as speci-fied in conjunction with operating requirements.
(3) Items incorporating an alarm failure warning shouldbe tested separately by simulating the appropriatealarm condition.
Fault finding
Action in the event of trouble is best determined byreference to a simple fault finding chart illustrated inTable 26.1.
FAULT FINDING
Table 26.1 Fault finding – circulation systems
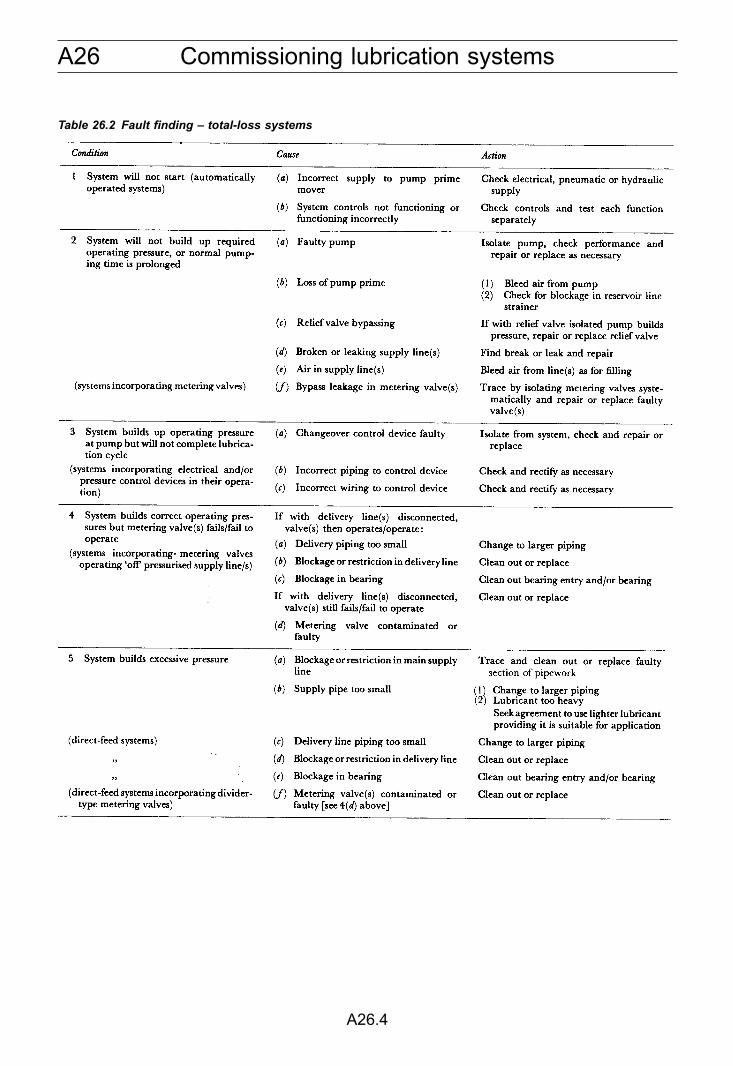
A26 Commissioning lubrication systems
A26.4
Table 26.2 Fault finding – total-loss systems
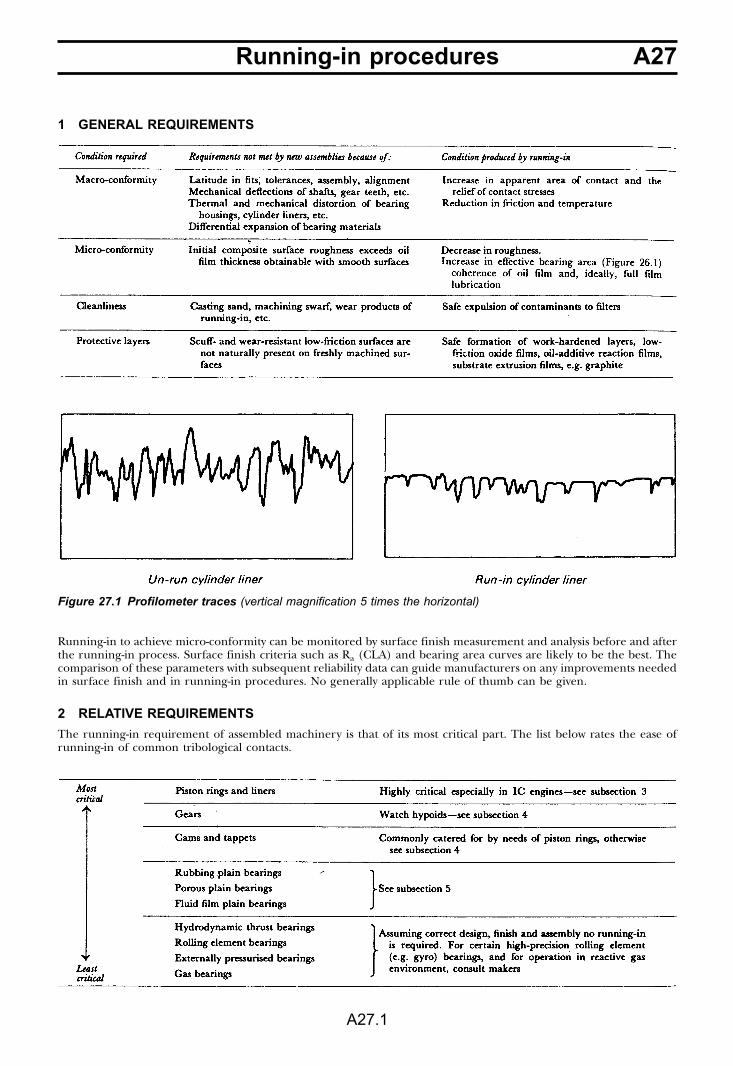
A27Running-in procedures
A27.1
1 GENERAL REQUIREMENTS
Running-in to achieve micro-conformity can be monitored by surface finish measurement and analysis before and afterthe running-in process. Surface finish criteria such as Ra (CLA) and bearing area curves are likely to be the best. Thecomparison of these parameters with subsequent reliability data can guide manufacturers on any improvements neededin surface finish and in running-in procedures. No generally applicable rule of thumb can be given.
2 RELATIVE REQUIREMENTS
The running-in requirement of assembled machinery is that of its most critical part. The list below rates the ease ofrunning-in of common tribological contacts.
Figure 27.1 Profilometer traces (vertical magnification 5 times the horizontal)

A27 Running-in procedures
A27.2
3 RUNNING-IN OF INTERNAL COMBUSTION ENGINES
The most effective running-in schedule for new andrebuilt engines depends to a large extent on theindividual design of engine and materials used. It istherefore important to follow the maker’s recommenda-tions. In the absence of a specific schedule the followingpractice is recommended.
Running-in on dynamometer
Running-in a road vehicle
Monitoring running-in
The following observations provide a guide as to thecompleteness of the running-in process:
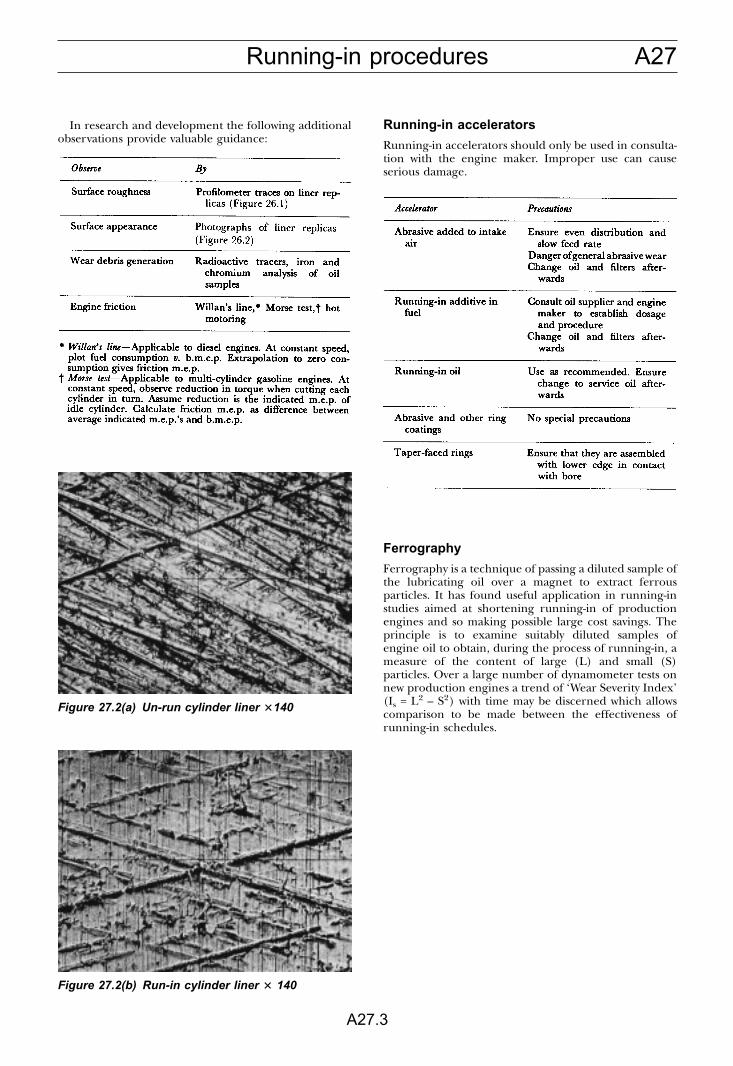
A27Running-in procedures
A27.3
In research and development the following additionalobservations provide valuable guidance:
Running-in accelerators
Running-in accelerators should only be used in consulta-tion with the engine maker. Improper use can causeserious damage.
Ferrography
Ferrography is a technique of passing a diluted sample ofthe lubricating oil over a magnet to extract ferrousparticles. It has found useful application in running-instudies aimed at shortening running-in of productionengines and so making possible large cost savings. Theprinciple is to examine suitably diluted samples ofengine oil to obtain, during the process of running-in, ameasure of the content of large (L) and small (S)particles. Over a large number of dynamometer tests onnew production engines a trend of ‘Wear Severity Index’(Is = L2 – S2) with time may be discerned which allowscomparison to be made between the effectiveness ofrunning-in schedules.
Figure 27.2(a) Un-run cylinder liner �140
Figure 27.2(b) Run-in cylinder liner � 140
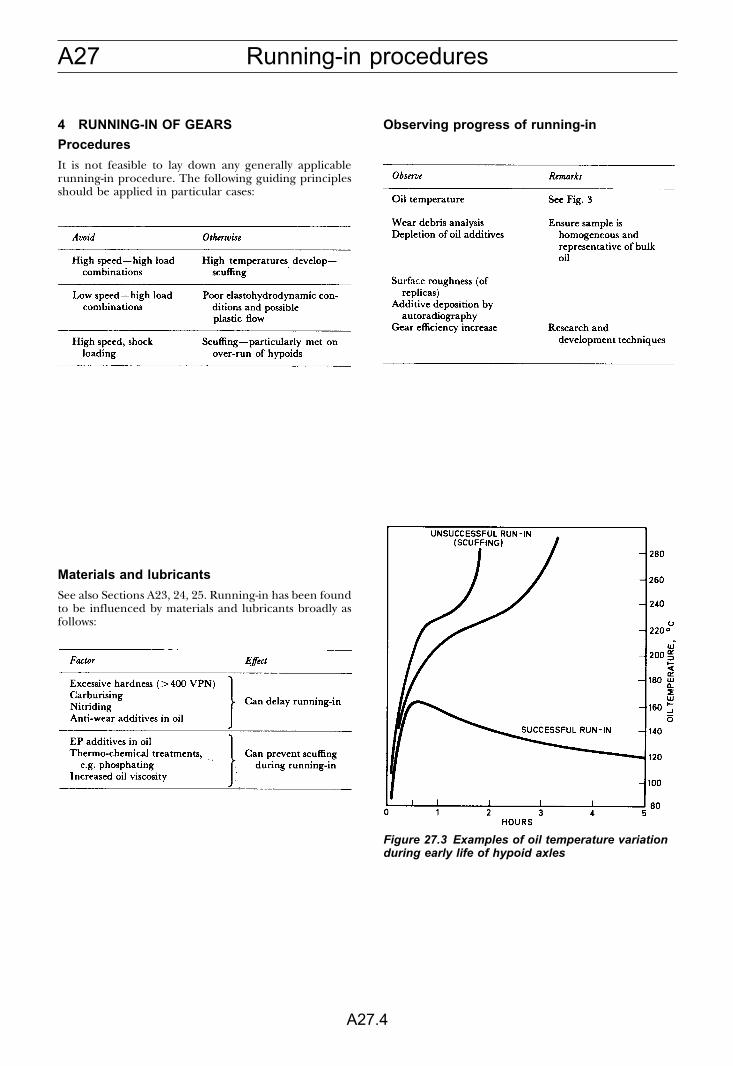
A27 Running-in procedures
A27.4
4 RUNNING-IN OF GEARS
Procedures
It is not feasible to lay down any generally applicablerunning-in procedure. The following guiding principlesshould be applied in particular cases:
Materials and lubricants
See also Sections A23, 24, 25. Running-in has been foundto be influenced by materials and lubricants broadly asfollows:
Observing progress of running-in
Figure 27.3 Examples of oil temperature variationduring early life of hypoid axles
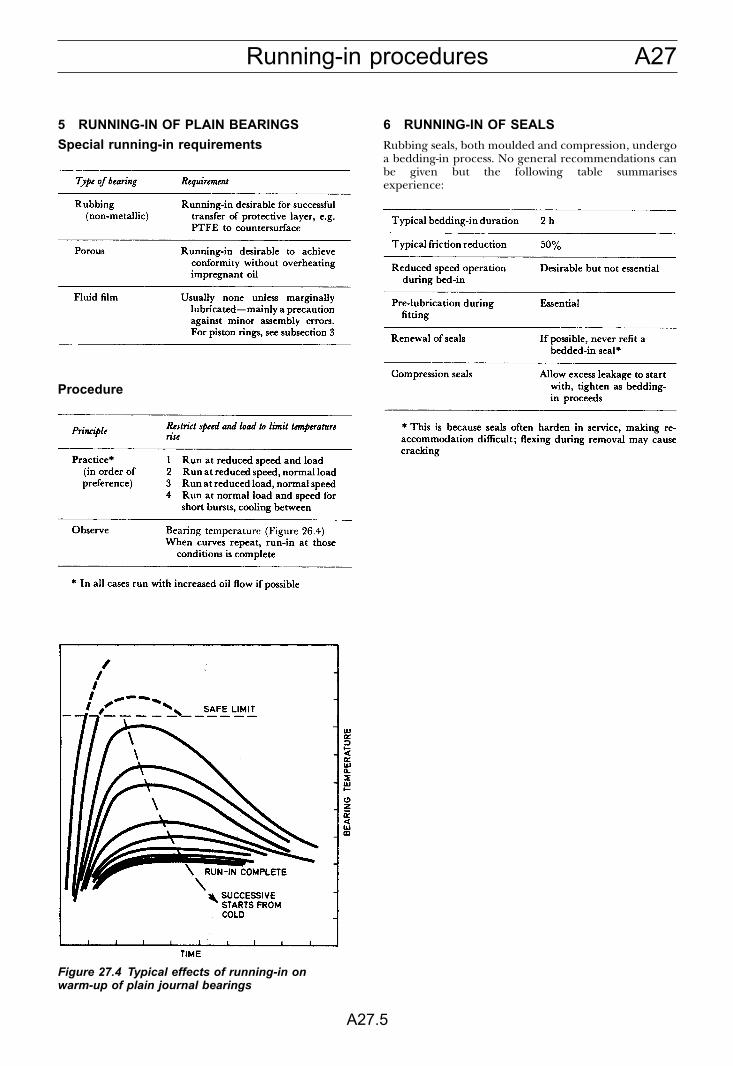
A27Running-in procedures
A27.5
5 RUNNING-IN OF PLAIN BEARINGS
Special running-in requirements
Procedure
6 RUNNING-IN OF SEALS
Rubbing seals, both moulded and compression, undergoa bedding-in process. No general recommendations canbe given but the following table summarisesexperience:
Figure 27.4 Typical effects of running-in onwarm-up of plain journal bearings
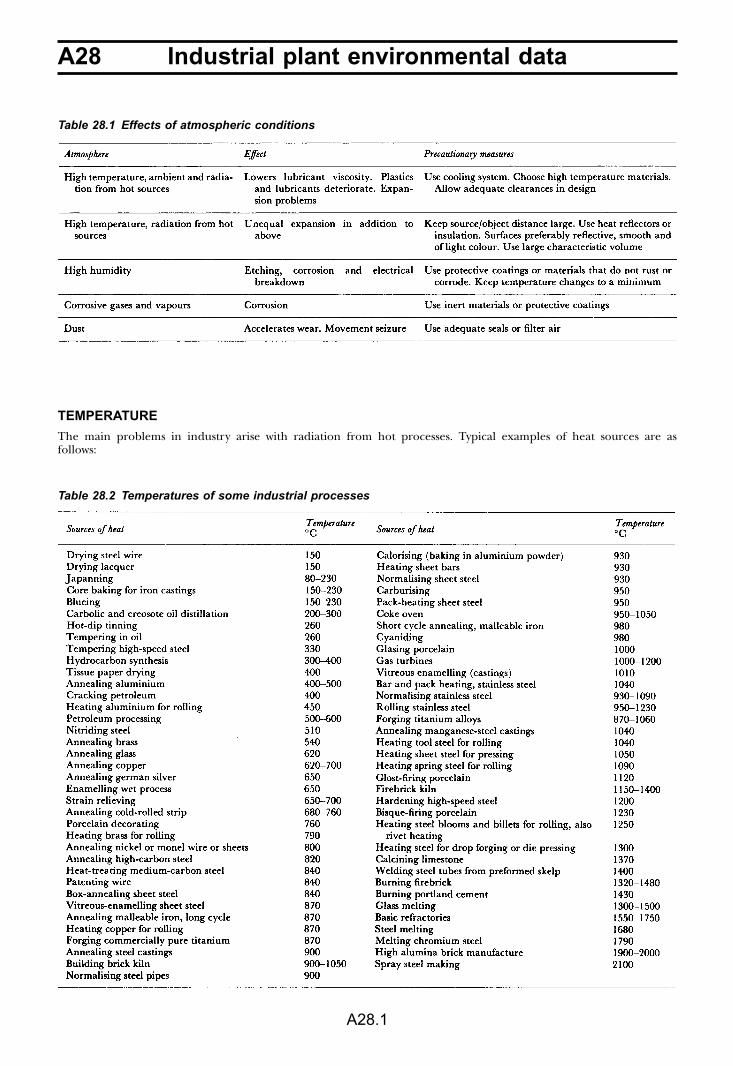
A28 Industrial plant environmental data
A28.1
TEMPERATURE
The main problems in industry arise with radiation from hot processes. Typical examples of heat sources are asfollows:
Table 28.1 Effects of atmospheric conditions
Table 28.2 Temperatures of some industrial processes
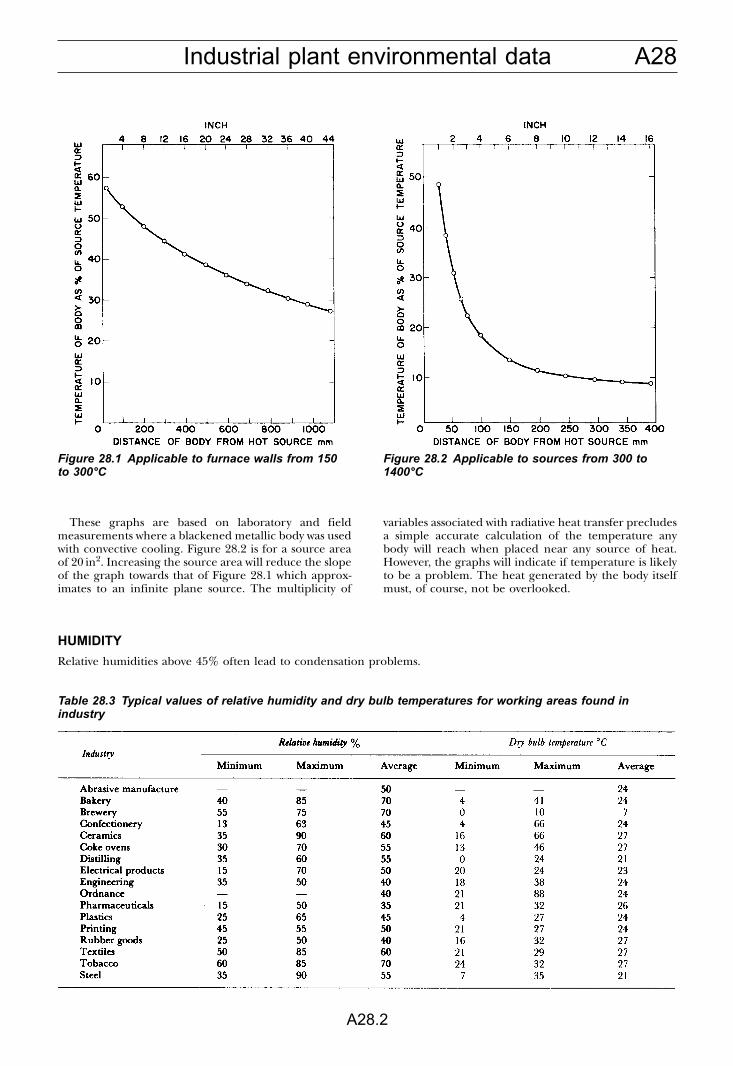
A28Industrial plant environmental data
A28.2
These graphs are based on laboratory and fieldmeasurements where a blackened metallic body was usedwith convective cooling. Figure 28.2 is for a source areaof 20 in2. Increasing the source area will reduce the slopeof the graph towards that of Figure 28.1 which approx-imates to an infinite plane source. The multiplicity of
variables associated with radiative heat transfer precludesa simple accurate calculation of the temperature anybody will reach when placed near any source of heat.However, the graphs will indicate if temperature is likelyto be a problem. The heat generated by the body itselfmust, of course, not be overlooked.
HUMIDITY
Relative humidities above 45% often lead to condensation problems.
Figure 28.1 Applicable to furnace walls from 150to 300°C
Figure 28.2 Applicable to sources from 300 to1400°C
Table 28.3 Typical values of relative humidity and dry bulb temperatures for working areas found inindustry
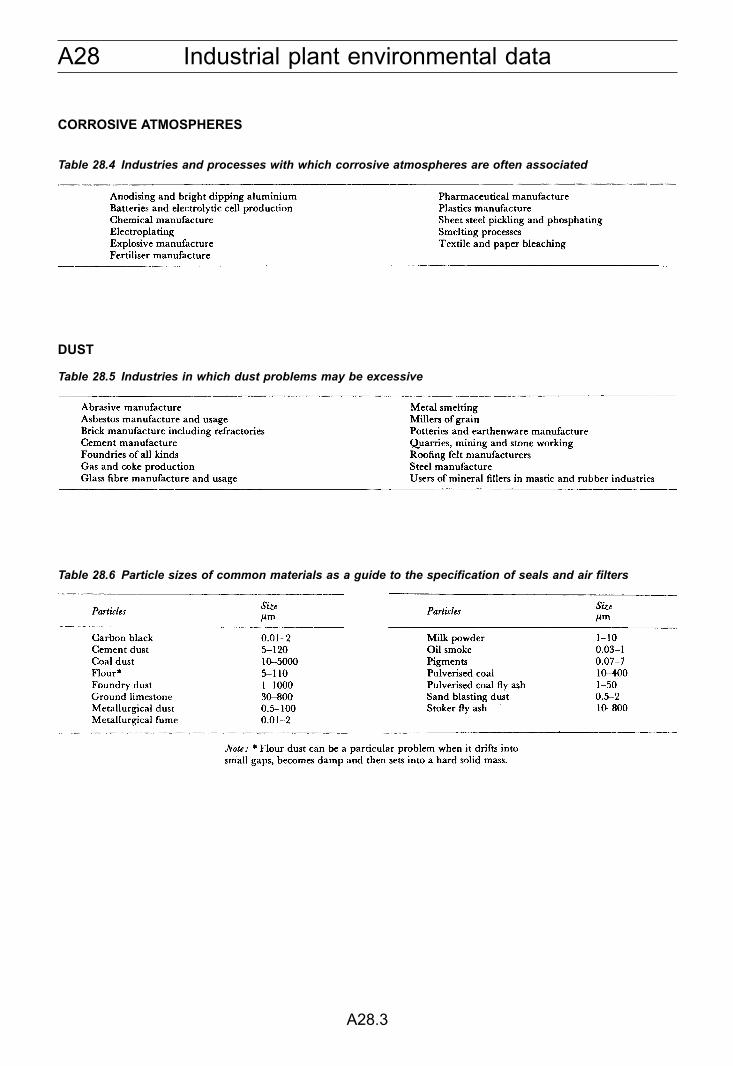
A28 Industrial plant environmental data
A28.3
CORROSIVE ATMOSPHERES
DUST
Table 28.4 Industries and processes with which corrosive atmospheres are often associated
Table 28.5 Industries in which dust problems may be excessive
Table 28.6 Particle sizes of common materials as a guide to the specification of seals and air filters
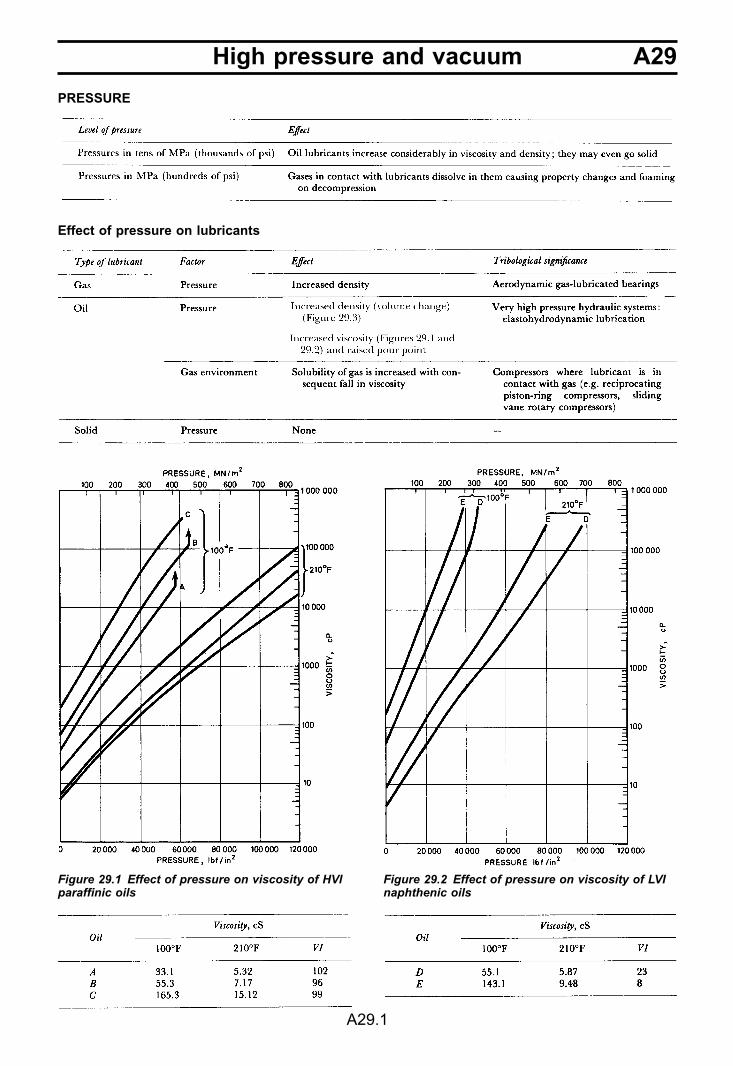
A29High pressure and vacuum
A29.1
PRESSURE
Effect of pressure on lubricants
Figure 29.1 Effect of pressure on viscosity of HVIparaffinic oils
Figure 29.2 Effect of pressure on viscosity of LVInaphthenic oils
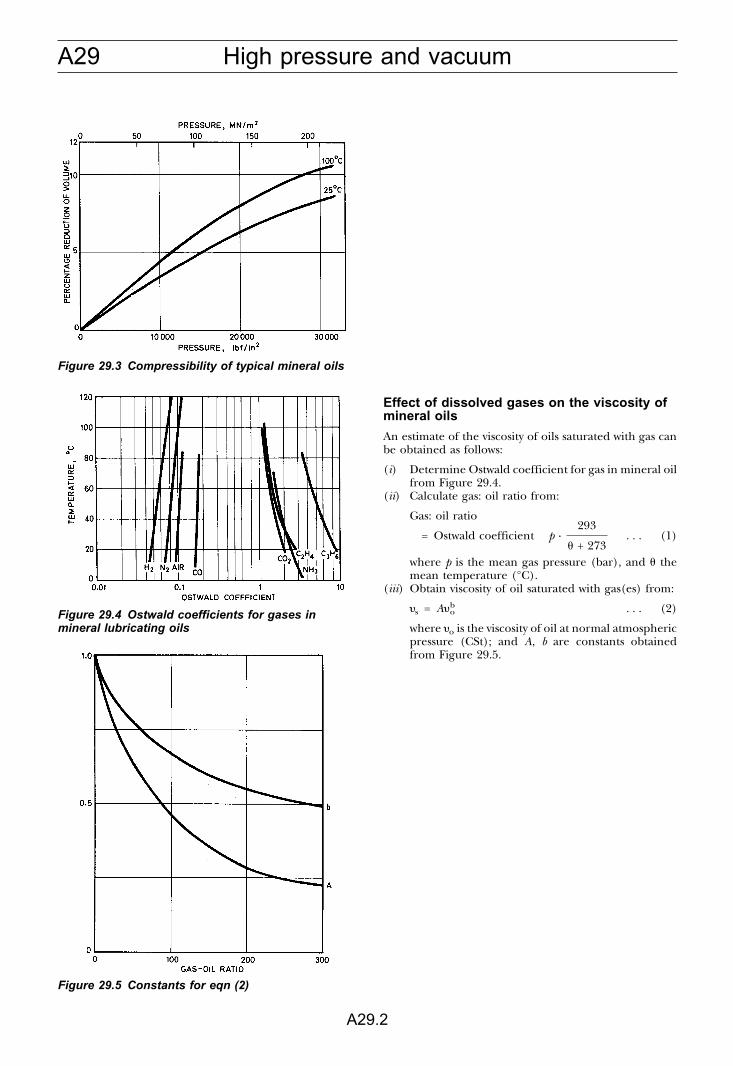
A29 High pressure and vacuum
A29.2
Effect of dissolved gases on the viscosity ofmineral oils
An estimate of the viscosity of oils saturated with gas canbe obtained as follows:
(i) Determine Ostwald coefficient for gas in mineral oilfrom Figure 29.4.
(ii) Calculate gas: oil ratio from:
Gas: oil ratio
= Ostwald coefficient � p ·293
� + 273. . . (1)
where p is the mean gas pressure (bar), and � themean temperature (°C).
(iii) Obtain viscosity of oil saturated with gas(es) from:
�s = A�bo . . . (2)
where �o is the viscosity of oil at normal atmosphericpressure (CSt); and A, b are constants obtainedfrom Figure 29.5.
Figure 29.3 Compressibility of typical mineral oils
Figure 29.4 Ostwald coefficients for gases inmineral lubricating oils
Figure 29.5 Constants for eqn (2)
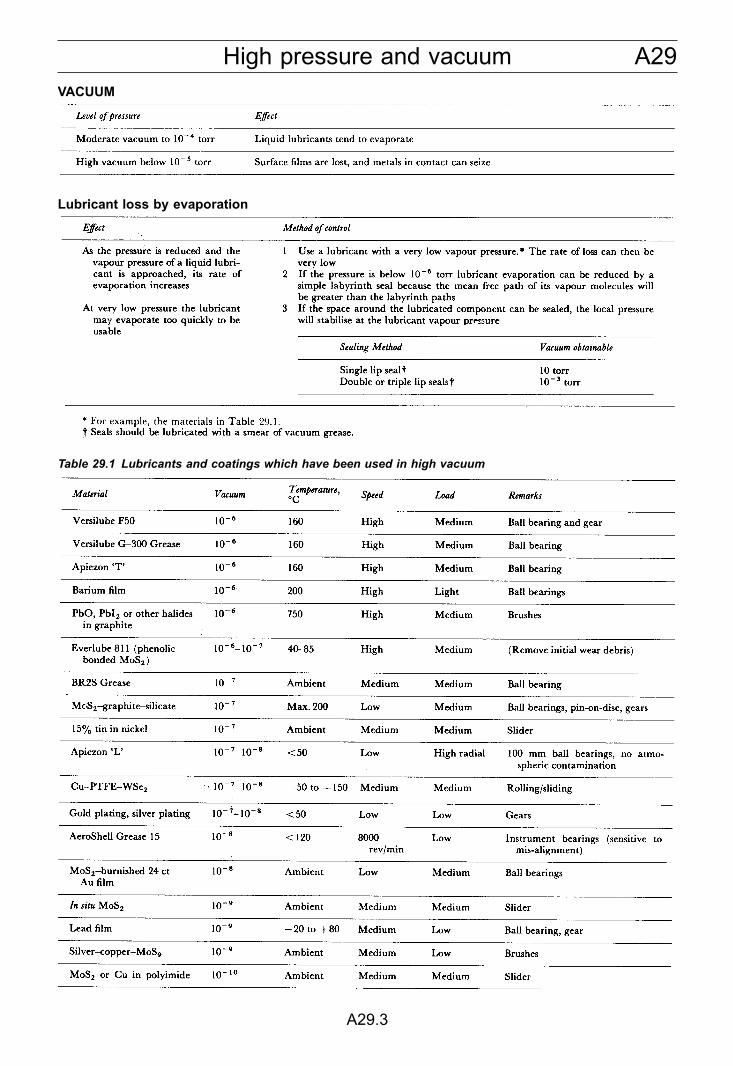
A29High pressure and vacuum
A29.3
VACUUM
Lubricant loss by evaporation
Table 29.1 Lubricants and coatings which have been used in high vacuum
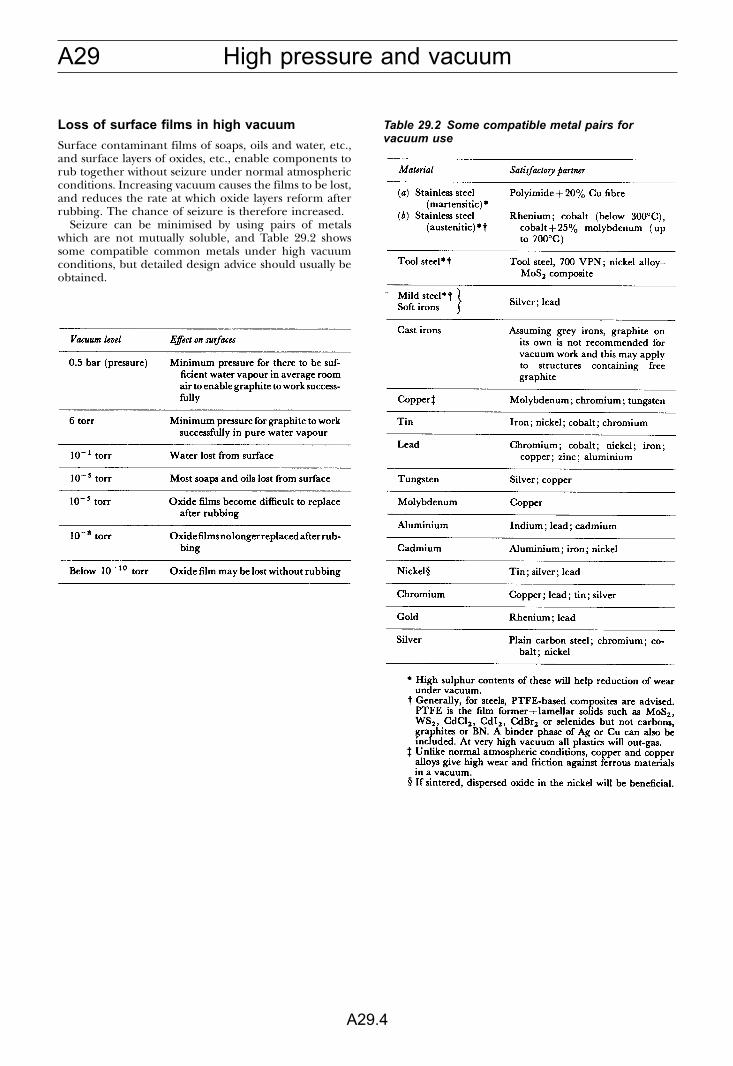
A29 High pressure and vacuum
A29.4
Loss of surface films in high vacuum
Surface contaminant films of soaps, oils and water, etc.,and surface layers of oxides, etc., enable components torub together without seizure under normal atmosphericconditions. Increasing vacuum causes the films to be lost,and reduces the rate at which oxide layers reform afterrubbing. The chance of seizure is therefore increased.
Seizure can be minimised by using pairs of metalswhich are not mutually soluble, and Table 29.2 showssome compatible common metals under high vacuumconditions, but detailed design advice should usually beobtained.
Table 29.2 Some compatible metal pairs forvacuum use
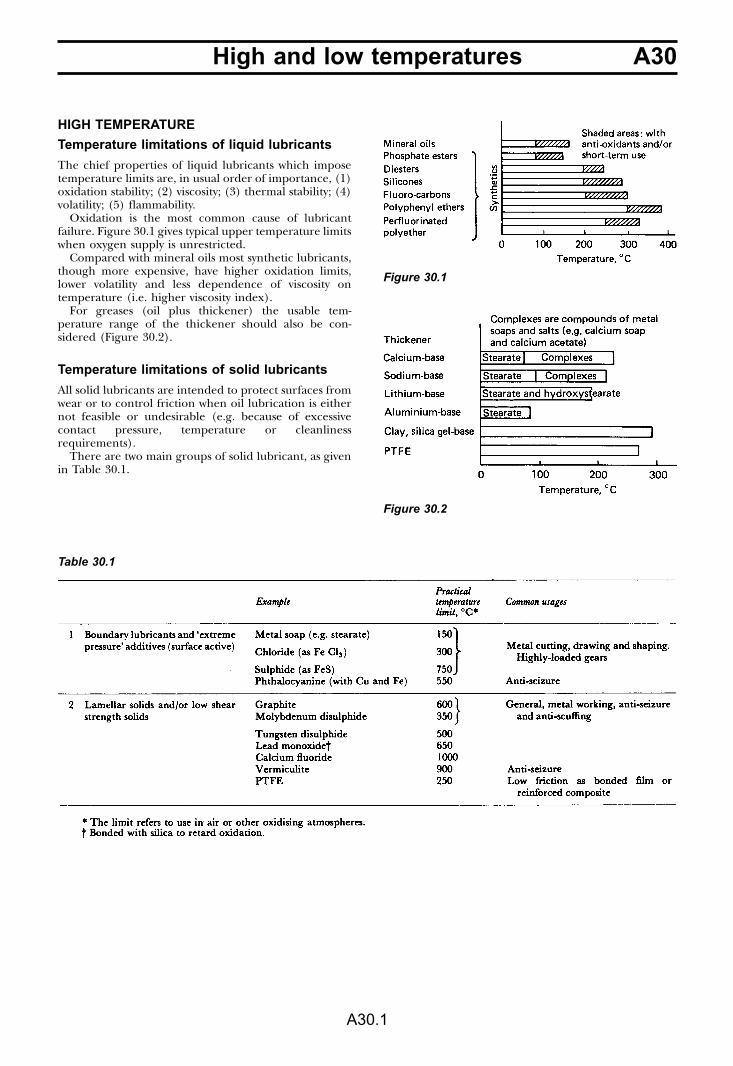
A30High and low temperatures
A30.1
HIGH TEMPERATURE
Temperature limitations of liquid lubricants
The chief properties of liquid lubricants which imposetemperature limits are, in usual order of importance, (1)oxidation stability; (2) viscosity; (3) thermal stability; (4)volatility; (5) flammability.
Oxidation is the most common cause of lubricantfailure. Figure 30.1 gives typical upper temperature limitswhen oxygen supply is unrestricted.
Compared with mineral oils most synthetic lubricants,though more expensive, have higher oxidation limits,lower volatility and less dependence of viscosity ontemperature (i.e. higher viscosity index).
For greases (oil plus thickener) the usable tem-perature range of the thickener should also be con-sidered (Figure 30.2).
Temperature limitations of solid lubricants
All solid lubricants are intended to protect surfaces fromwear or to control friction when oil lubrication is eithernot feasible or undesirable (e.g. because of excessivecontact pressure, temperature or cleanlinessrequirements).
There are two main groups of solid lubricant, as givenin Table 30.1.
Figure 30.1
Figure 30.2
Table 30.1
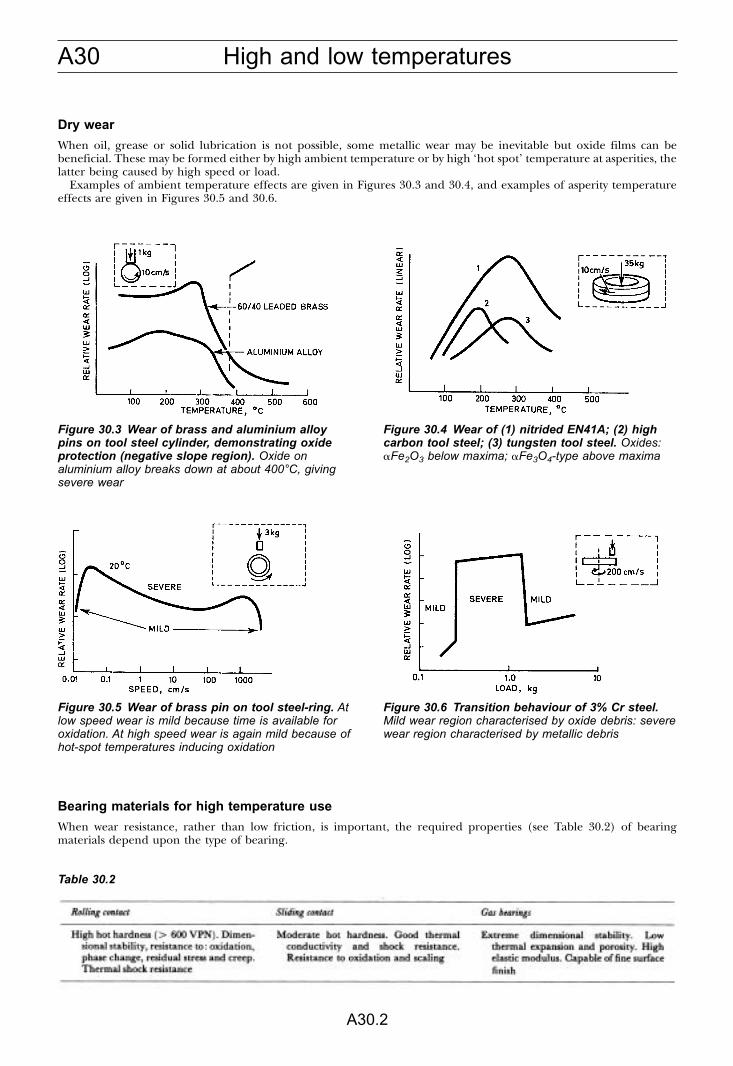
A30 High and low temperatures
A30.2
Dry wear
When oil, grease or solid lubrication is not possible, some metallic wear may be inevitable but oxide films can bebeneficial. These may be formed either by high ambient temperature or by high ‘hot spot’ temperature at asperities, thelatter being caused by high speed or load.
Examples of ambient temperature effects are given in Figures 30.3 and 30.4, and examples of asperity temperatureeffects are given in Figures 30.5 and 30.6.
Bearing materials for high temperature use
When wear resistance, rather than low friction, is important, the required properties (see Table 30.2) of bearingmaterials depend upon the type of bearing.
Figure 30.3 Wear of brass and aluminium alloypins on tool steel cylinder, demonstrating oxideprotection (negative slope region). Oxide onaluminium alloy breaks down at about 400°C, givingsevere wear
Figure 30.4 Wear of (1) nitrided EN41A; (2) highcarbon tool steel; (3) tungsten tool steel. Oxides:Fe2O3 below maxima; Fe3O4-type above maxima
Figure 30.5 Wear of brass pin on tool steel-ring. Atlow speed wear is mild because time is available foroxidation. At high speed wear is again mild because ofhot-spot temperatures inducing oxidation
Figure 30.6 Transition behaviour of 3% Cr steel.Mild wear region characterised by oxide debris: severewear region characterised by metallic debris
Table 30.2
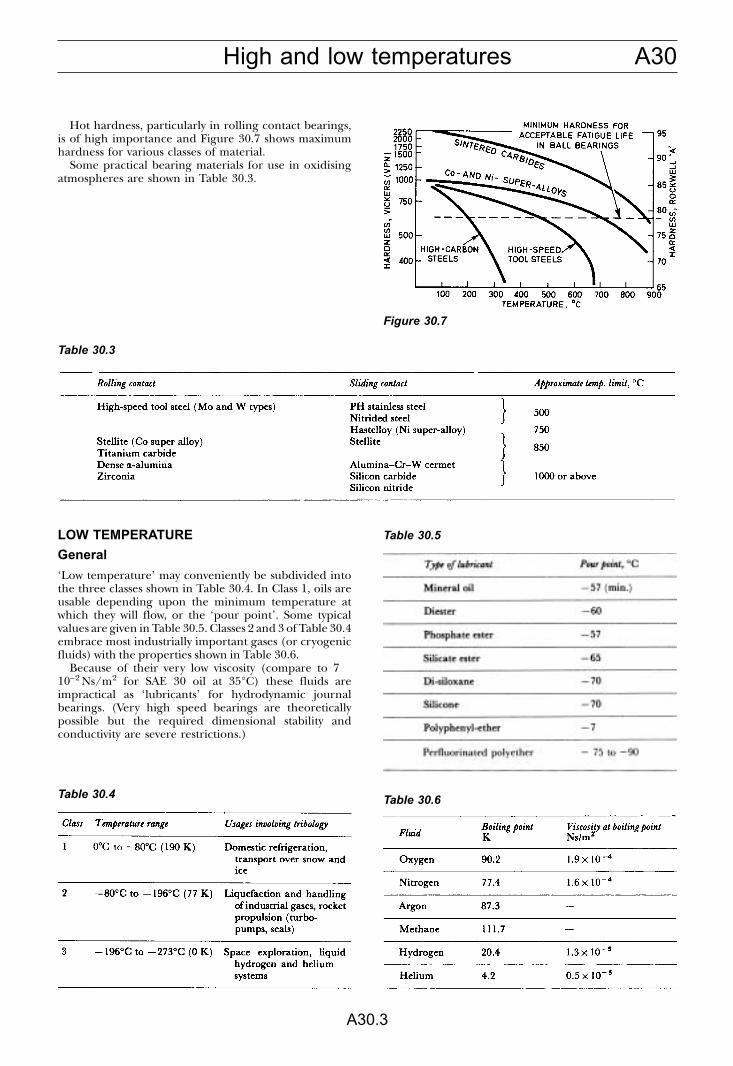
A30High and low temperatures
A30.3
Hot hardness, particularly in rolling contact bearings,is of high importance and Figure 30.7 shows maximumhardness for various classes of material.
Some practical bearing materials for use in oxidisingatmospheres are shown in Table 30.3.
LOW TEMPERATURE
General
‘Low temperature’ may conveniently be subdivided intothe three classes shown in Table 30.4. In Class 1, oils areusable depending upon the minimum temperature atwhich they will flow, or the ‘pour point’. Some typicalvalues are given in Table 30.5. Classes 2 and 3 of Table 30.4embrace most industrially important gases (or cryogenicfluids) with the properties shown in Table 30.6.
Because of their very low viscosity (compare to 7 �10–2 Ns/m2 for SAE 30 oil at 35°C) these fluids areimpractical as ‘lubricants’ for hydrodynamic journalbearings. (Very high speed bearings are theoreticallypossible but the required dimensional stability andconductivity are severe restrictions.)
Figure 30.7
Table 30.3
Table 30.4
Table 30.5
Table 30.6
A30 High and low temperatures
A30.4
Unlubricated metals
In non-oxidising fluids, despite low temperature, metalsshow adhesive wear (galling, etc.) but in oxygen the wearis often less severe because oxide films may be formed.Where there is condensation on shafts, seals or ballbearings (dry lubricated) a corrosion-resistant hard steel(e.g. 440°C) is preferable.
Plain bearing materials
As bushes and thrust bearings, filled PTFE/metal andfilled graphite/metal combinations are often used – seeTable 30.8.
Safety
Aspects of safety are summarised in Table 30.7.
Ball bearings and seals for cryogenic temperatures
Table 30.7
Table 30.8 Some successful plain bearingmaterials for cryogenic fluids
Table 30.9 Recommended tribological practice at cryogenic temperatures
A31Chemical effects
A31.1
This section is restricted to chemical effects on metals.Chemical effects can arise whenever metals are in contact with chemicals, either alone or as a contaminant in a
lubricant.Wear in the presence of a corrosive liquid can lead to accelerated damage due to corrosive wear. This problem is
complex, and specialist advice should be taken.Corrosion or corrosive wear are often caused by condensation water in an otherwise clean system.
SELECTION OF CORROSION RESISTANT MATERIALS FOR CONTACT WITH VARIOUS LIQUIDS
Table 31.1 Some specific contamination situations
Table 31.2 Typical corrosion resistant materials
A31 Chemical effects
A31.2
A31Chemical effects
A31.3

This Page Intentionally Left Blank
B1Maintenance methods
B1.1
The purpose of maintenance is to preserve plant and machinery in a condition in which it can operate, and can do sosafely and economically.
It is the components of plant and machinery which fail individually, and can lead to the loss of function of the wholeunit or system. Maintenance activity needs therefore to be concentrated on those components that are critical.
Table 1.1 Situations requiring maintenance action
Table 1.2 Factors in the selection of critical components
B1 Maintenance methods
B1.2
Table 1.3 Maintenance methods which can be used
B1Maintenance methods
B1.3
Figure 1.1 The results of maintaining the same industrial plant in different ways. The height of the barsindicates the amount of maintenance effort required
B1 Maintenance methods
B1.4
The components of machines do not fail at regularintervals but show a range of times to failure before andafter a mean time.
If it is essential that no failures occur in service, thecomponents must be changed within the time that theearliest failure may be expected.
Figure 1.2 The distribution of the time to failure for a typical component
Table 1.4 Feedback from maintenance to equipment design
B1Maintenance methods
B1.5
Table 1.5 Maintenance management
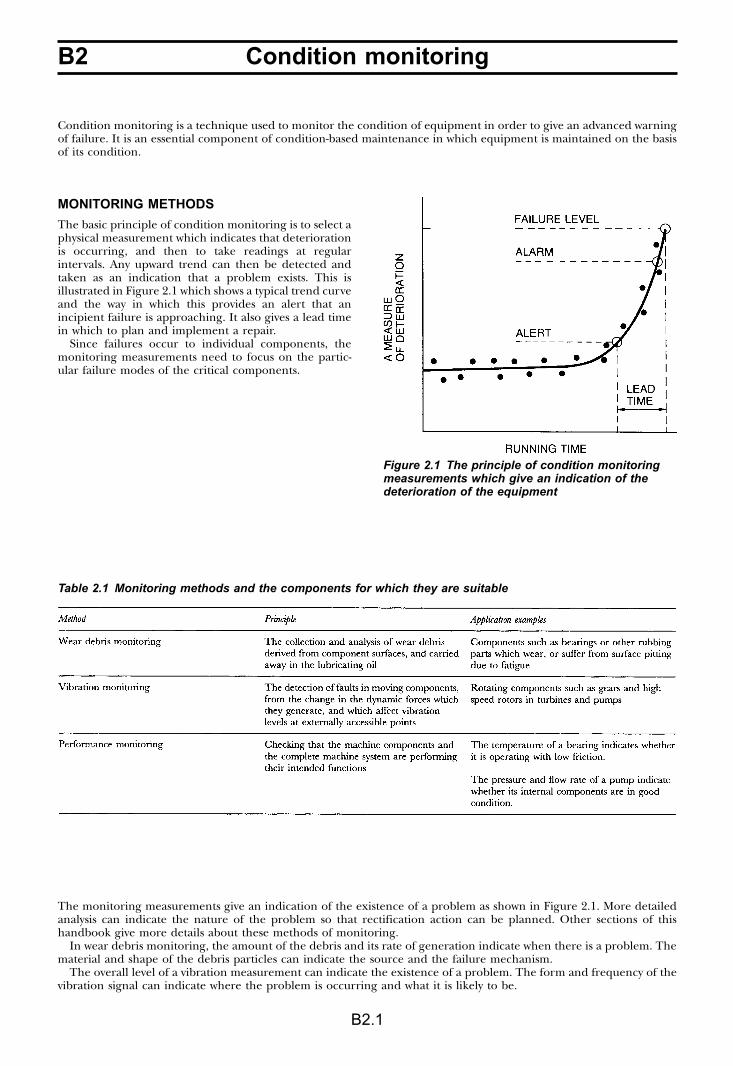
B2 Condition monitoring
B2.1
Condition monitoring is a technique used to monitor the condition of equipment in order to give an advanced warningof failure. It is an essential component of condition-based maintenance in which equipment is maintained on the basisof its condition.
MONITORING METHODS
The basic principle of condition monitoring is to select aphysical measurement which indicates that deteriorationis occurring, and then to take readings at regularintervals. Any upward trend can then be detected andtaken as an indication that a problem exists. This isillustrated in Figure 2.1 which shows a typical trend curveand the way in which this provides an alert that anincipient failure is approaching. It also gives a lead timein which to plan and implement a repair.
Since failures occur to individual components, themonitoring measurements need to focus on the partic-ular failure modes of the critical components.
The monitoring measurements give an indication of the existence of a problem as shown in Figure 2.1. More detailedanalysis can indicate the nature of the problem so that rectification action can be planned. Other sections of thishandbook give more details about these methods of monitoring.
In wear debris monitoring, the amount of the debris and its rate of generation indicate when there is a problem. Thematerial and shape of the debris particles can indicate the source and the failure mechanism.
The overall level of a vibration measurement can indicate the existence of a problem. The form and frequency of thevibration signal can indicate where the problem is occurring and what it is likely to be.
Figure 2.1 The principle of condition monitoringmeasurements which give an indication of thedeterioration of the equipment
Table 2.1 Monitoring methods and the components for which they are suitable
B2Condition monitoring
B2.2
Introducing condition monitoring
If an organisation has been operating with breakdown maintenance or regular planned maintenance, a change over tocondition-based maintenance can result in major improvements in plant availability and in reduced costs. There are,however, up front costs for organisation and training and for the purchase of appropriate instrumentation. There areoperational circumstances which can favour or retard the potential for the introduction of condition-basedmaintenance.
Table 2.2 Factors which can assist the introduction of condition-based maintenance
Table 2.3 Factors which can retard the introduction of condition-based maintenance
B2 Condition monitoring
B2.3
Table 2.4 A procedure for setting up a plant condition monitoring activity
Table 2.5 Problems which can arise
B2Condition monitoring
B2.4
Table 2.6 The benefits that can arise from the use of condition monitoring
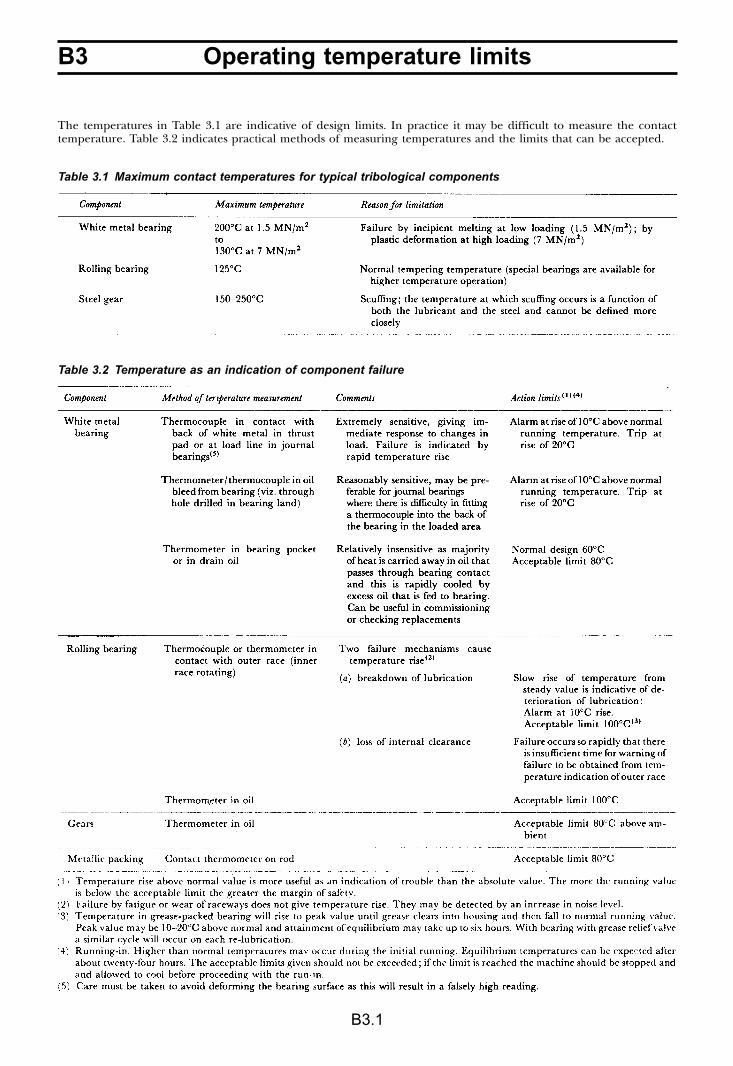
B3 Operating temperature limits
B3.1
Table 3.1 Maximum contact temperatures for typical tribological components
Table 3.2 Temperature as an indication of component failure
The temperatures in Table 3.1 are indicative of design limits. In practice it may be difficult to measure the contacttemperature. Table 3.2 indicates practical methods of measuring temperatures and the limits that can be accepted.
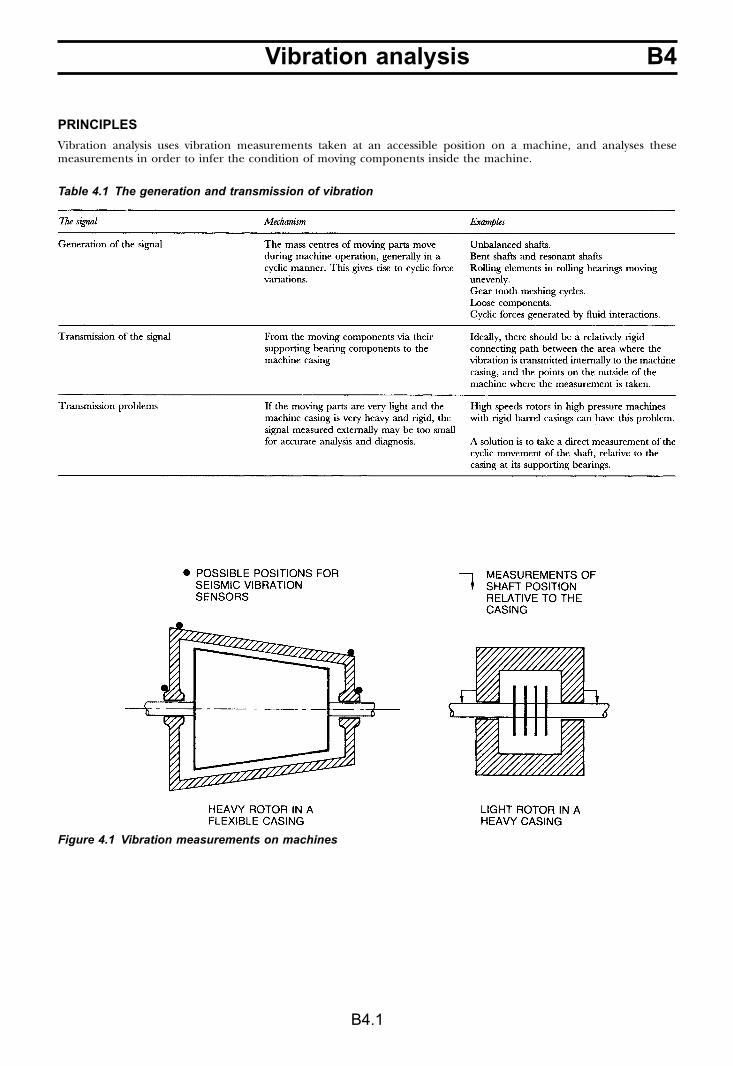
B4Vibration analysis
B4.1
PRINCIPLES
Vibration analysis uses vibration measurements taken at an accessible position on a machine, and analyses thesemeasurements in order to infer the condition of moving components inside the machine.
Table 4.1 The generation and transmission of vibration
Figure 4.1 Vibration measurements on machines
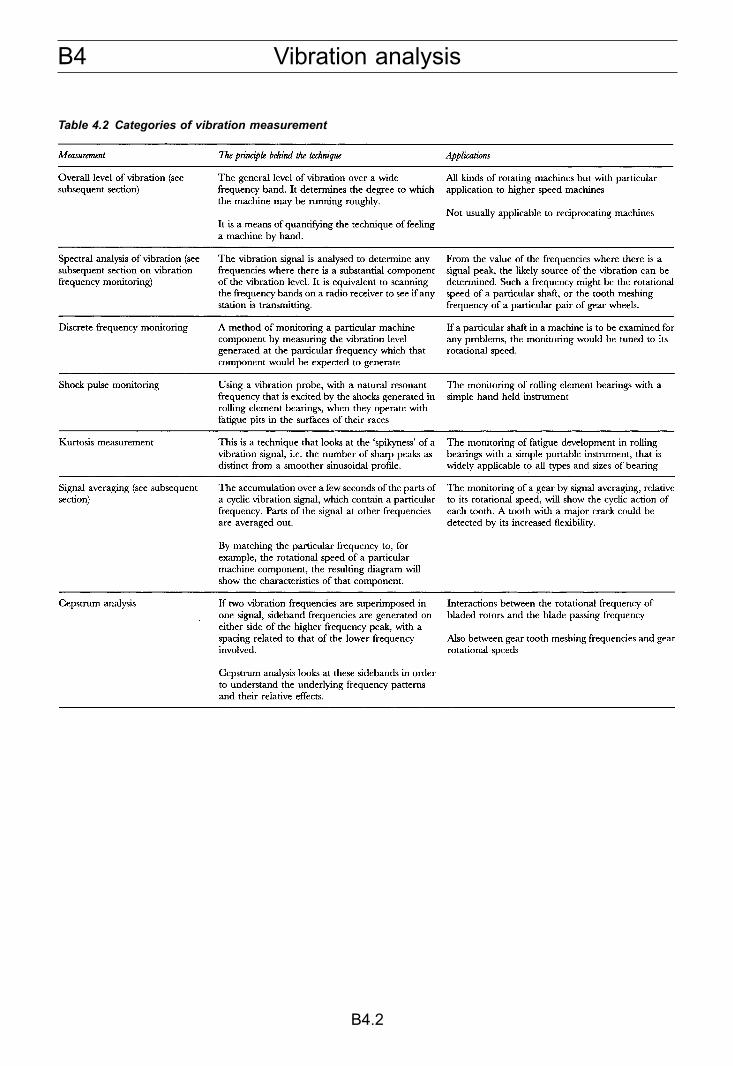
B4 Vibration analysis
B4.2
Table 4.2 Categories of vibration measurement
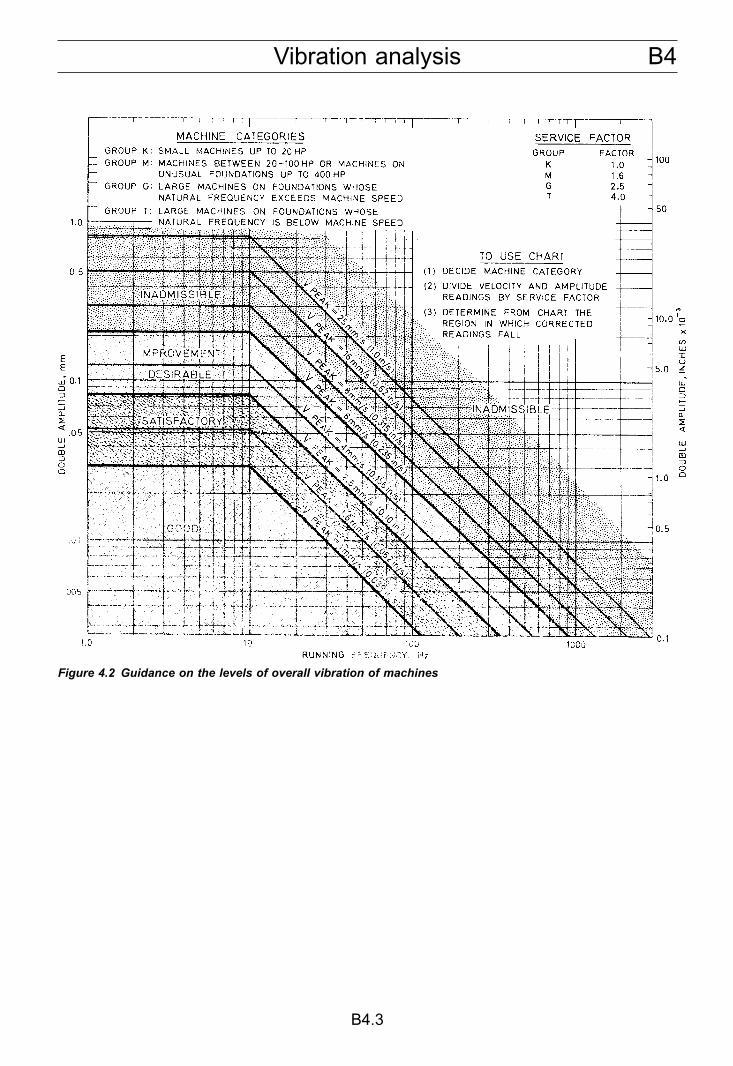
B4Vibration analysis
B4.3
Figure 4.2 Guidance on the levels of overall vibration of machines
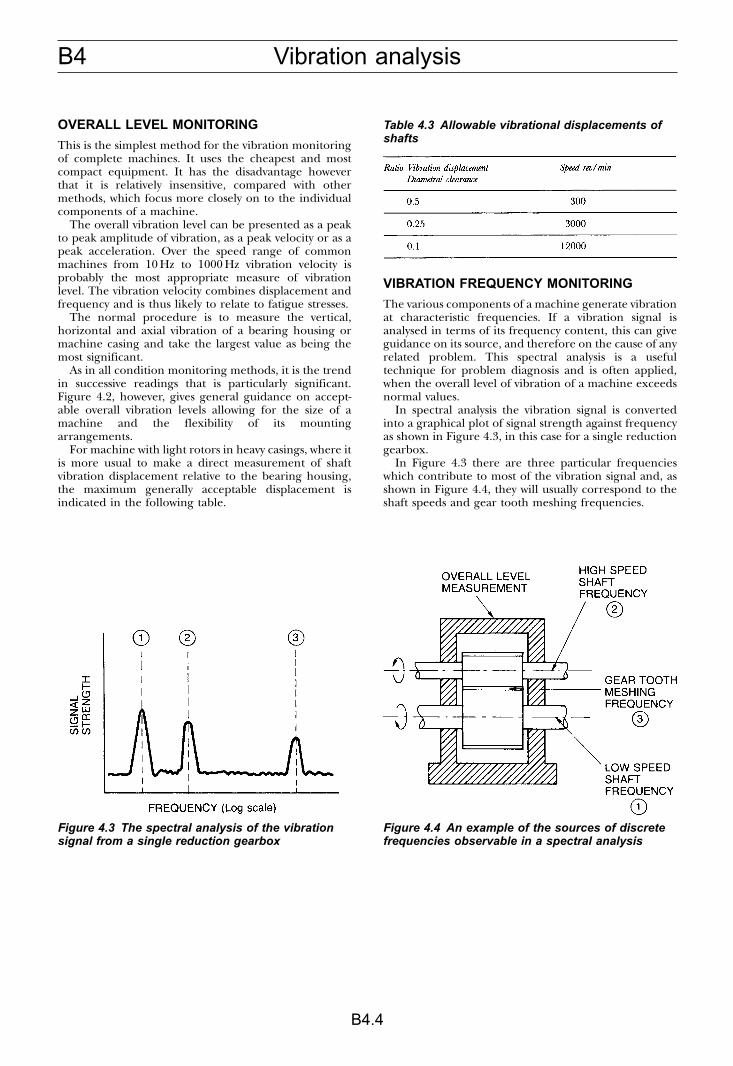
B4 Vibration analysis
B4.4
OVERALL LEVEL MONITORING
This is the simplest method for the vibration monitoringof complete machines. It uses the cheapest and mostcompact equipment. It has the disadvantage howeverthat it is relatively insensitive, compared with othermethods, which focus more closely on to the individualcomponents of a machine.
The overall vibration level can be presented as a peakto peak amplitude of vibration, as a peak velocity or as apeak acceleration. Over the speed range of commonmachines from 10 Hz to 1000 Hz vibration velocity isprobably the most appropriate measure of vibrationlevel. The vibration velocity combines displacement andfrequency and is thus likely to relate to fatigue stresses.
The normal procedure is to measure the vertical,horizontal and axial vibration of a bearing housing ormachine casing and take the largest value as being themost significant.
As in all condition monitoring methods, it is the trendin successive readings that is particularly significant.Figure 4.2, however, gives general guidance on accept-able overall vibration levels allowing for the size of amachine and the flexibility of its mountingarrangements.
For machine with light rotors in heavy casings, where itis more usual to make a direct measurement of shaftvibration displacement relative to the bearing housing,the maximum generally acceptable displacement isindicated in the following table.
VIBRATION FREQUENCY MONITORING
The various components of a machine generate vibrationat characteristic frequencies. If a vibration signal isanalysed in terms of its frequency content, this can giveguidance on its source, and therefore on the cause of anyrelated problem. This spectral analysis is a usefultechnique for problem diagnosis and is often applied,when the overall level of vibration of a machine exceedsnormal values.
In spectral analysis the vibration signal is convertedinto a graphical plot of signal strength against frequencyas shown in Figure 4.3, in this case for a single reductiongearbox.
In Figure 4.3 there are three particular frequencieswhich contribute to most of the vibration signal and, asshown in Figure 4.4, they will usually correspond to theshaft speeds and gear tooth meshing frequencies.
Table 4.3 Allowable vibrational displacements ofshafts
Figure 4.3 The spectral analysis of the vibrationsignal from a single reduction gearbox
Figure 4.4 An example of the sources of discretefrequencies observable in a spectral analysis

B4Vibration analysis
B4.5
Discrete frequency monitoring
If it is required to monitor a particular critical component the measuring system can be turned to signals at itscharacteristic frequency in order to achieve the maximum sensitivity. This discrete frequency monitoring is particularlyappropriate for use with portable data collectors, particularly if these can be preset to measure the critical frequenciesat each measuring point. The recorded values can then be fed into a base computer for conversion into trends of thereadings with the running time of the machine.
Table 4.4 Typical discrete frequencies corresponding to various components and problems
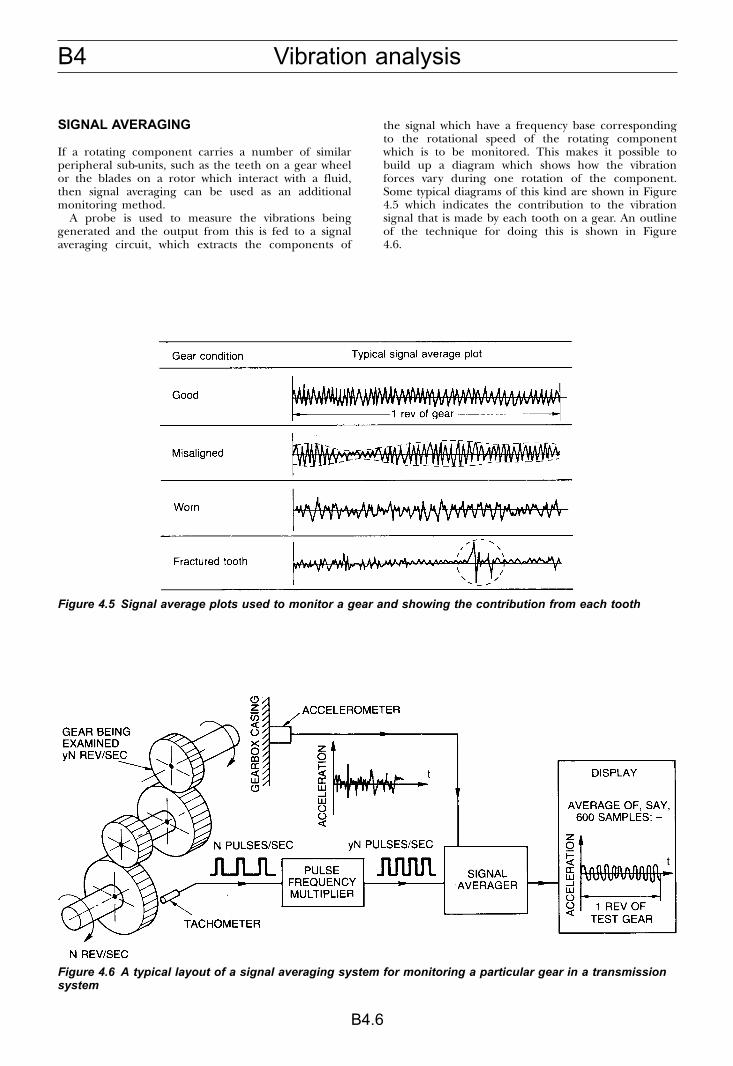
B4 Vibration analysis
B4.6
SIGNAL AVERAGING
If a rotating component carries a number of similarperipheral sub-units, such as the teeth on a gear wheelor the blades on a rotor which interact with a fluid,then signal averaging can be used as an additionalmonitoring method.
A probe is used to measure the vibrations beinggenerated and the output from this is fed to a signalaveraging circuit, which extracts the components of
the signal which have a frequency base correspondingto the rotational speed of the rotating componentwhich is to be monitored. This makes it possible tobuild up a diagram which shows how the vibrationforces vary during one rotation of the component.Some typical diagrams of this kind are shown in Figure4.5 which indicates the contribution to the vibrationsignal that is made by each tooth on a gear. An outlineof the technique for doing this is shown in Figure4.6.
Figure 4.5 Signal average plots used to monitor a gear and showing the contribution from each tooth
Figure 4.6 A typical layout of a signal averaging system for monitoring a particular gear in a transmissionsystem
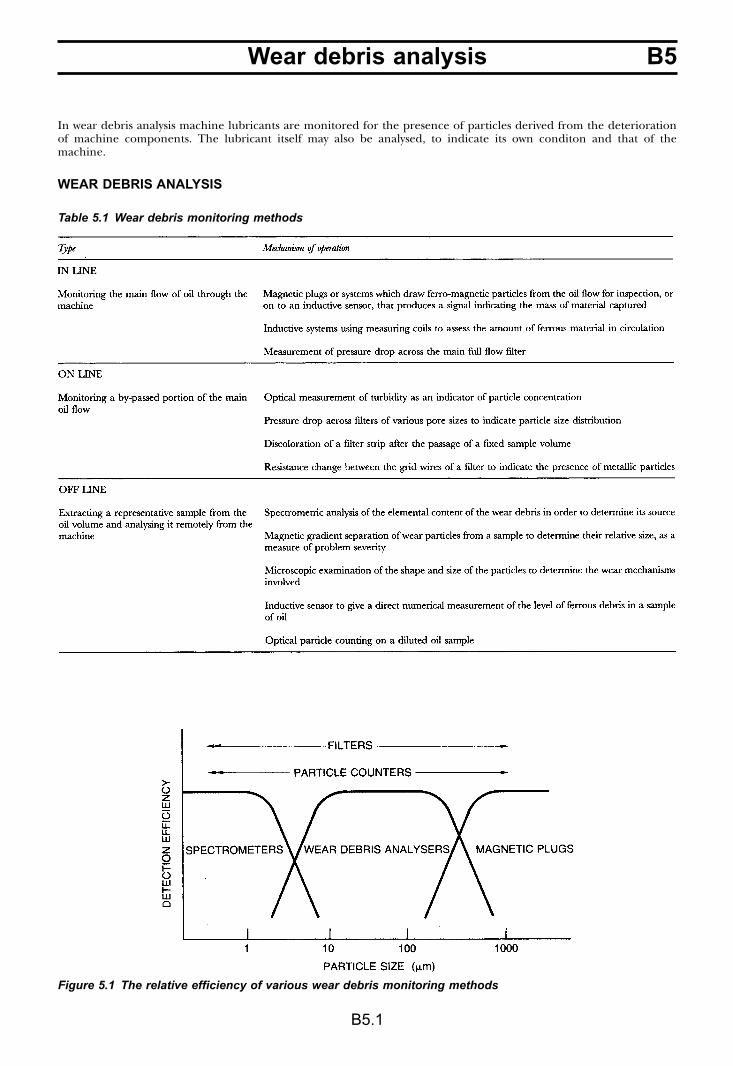
B5Wear debris analysis
B5.1
In wear debris analysis machine lubricants are monitored for the presence of particles derived from the deteriorationof machine components. The lubricant itself may also be analysed, to indicate its own conditon and that of themachine.
WEAR DEBRIS ANALYSIS
Table 5.1 Wear debris monitoring methods
Figure 5.1 The relative efficiency of various wear debris monitoring methods
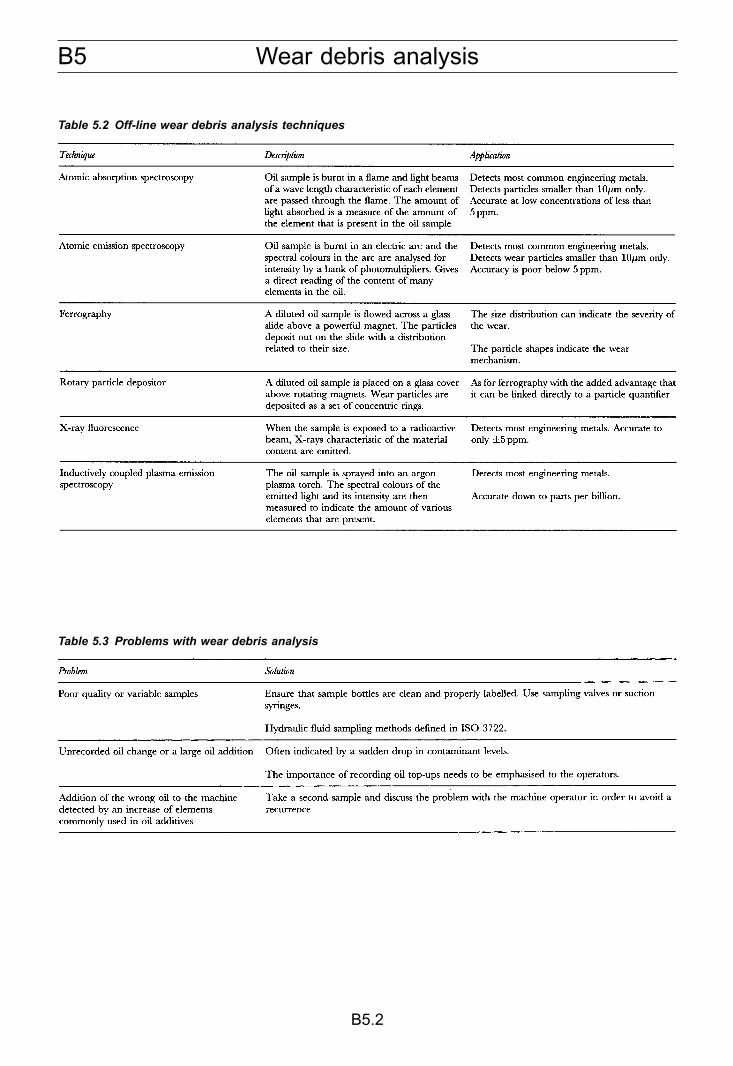
B5 Wear debris analysis
B5.2
Table 5.2 Off-line wear debris analysis techniques
Table 5.3 Problems with wear debris analysis
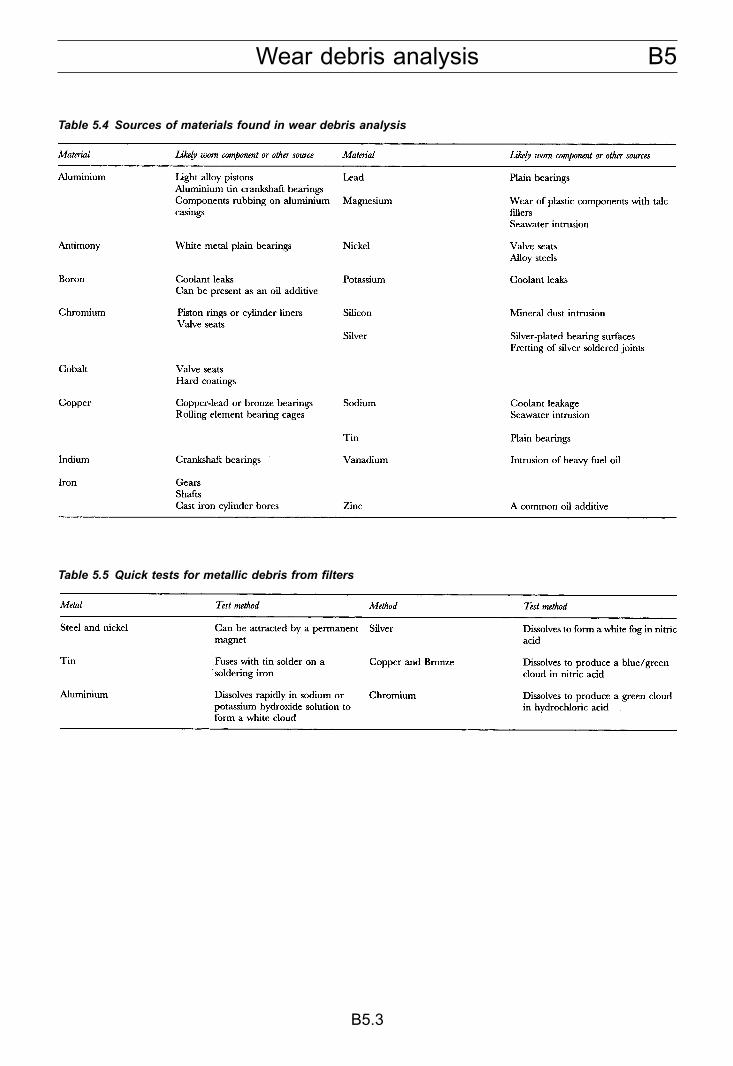
B5Wear debris analysis
B5.3
Table 5.4 Sources of materials found in wear debris analysis
Table 5.5 Quick tests for metallic debris from filters
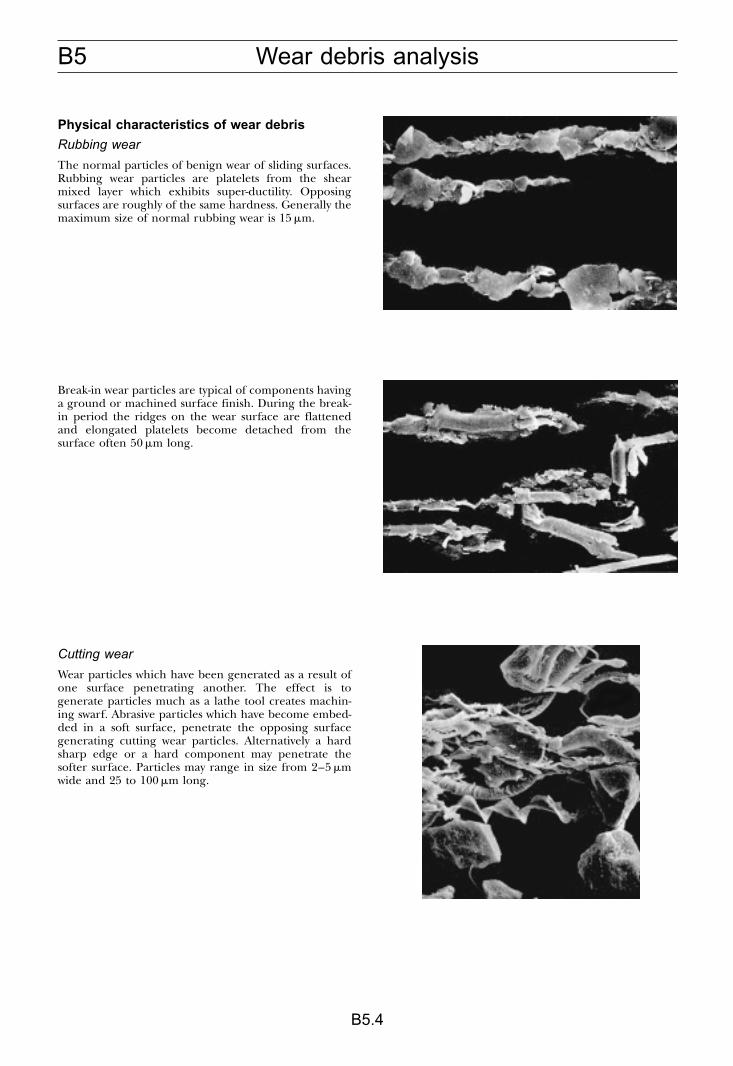
B5 Wear debris analysis
B5.4
Physical characteristics of wear debris
Rubbing wear
The normal particles of benign wear of sliding surfaces.Rubbing wear particles are platelets from the shearmixed layer which exhibits super-ductility. Opposingsurfaces are roughly of the same hardness. Generally themaximum size of normal rubbing wear is 15 �m.
Break-in wear particles are typical of components havinga ground or machined surface finish. During the break-in period the ridges on the wear surface are flattenedand elongated platelets become detached from thesurface often 50 �m long.
Cutting wear
Wear particles which have been generated as a result ofone surface penetrating another. The effect is togenerate particles much as a lathe tool creates machin-ing swarf. Abrasive particles which have become embed-ded in a soft surface, penetrate the opposing surfacegenerating cutting wear particles. Alternatively a hardsharp edge or a hard component may penetrate thesofter surface. Particles may range in size from 2–5 �mwide and 25 to 100 �m long.
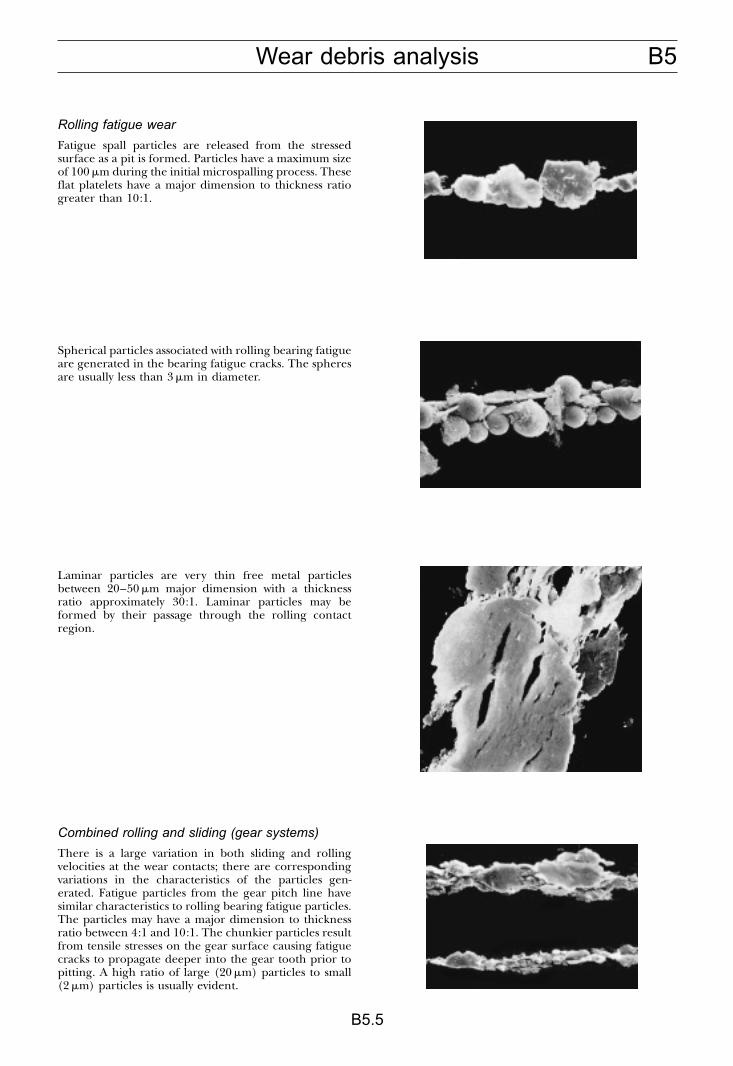
B5Wear debris analysis
B5.5
Rolling fatigue wear
Fatigue spall particles are released from the stressedsurface as a pit is formed. Particles have a maximum sizeof 100 �m during the initial microspalling process. Theseflat platelets have a major dimension to thickness ratiogreater than 10:1.
Spherical particles associated with rolling bearing fatigueare generated in the bearing fatigue cracks. The spheresare usually less than 3 �m in diameter.
Laminar particles are very thin free metal particlesbetween 20–50 �m major dimension with a thicknessratio approximately 30:1. Laminar particles may beformed by their passage through the rolling contactregion.
Combined rolling and sliding (gear systems)
There is a large variation in both sliding and rollingvelocities at the wear contacts; there are correspondingvariations in the characteristics of the particles gen-erated. Fatigue particles from the gear pitch line havesimilar characteristics to rolling bearing fatigue particles.The particles may have a major dimension to thicknessratio between 4:1 and 10:1. The chunkier particles resultfrom tensile stresses on the gear surface causing fatiguecracks to propagate deeper into the gear tooth prior topitting. A high ratio of large (20 �m) particles to small(2 �m) particles is usually evident.
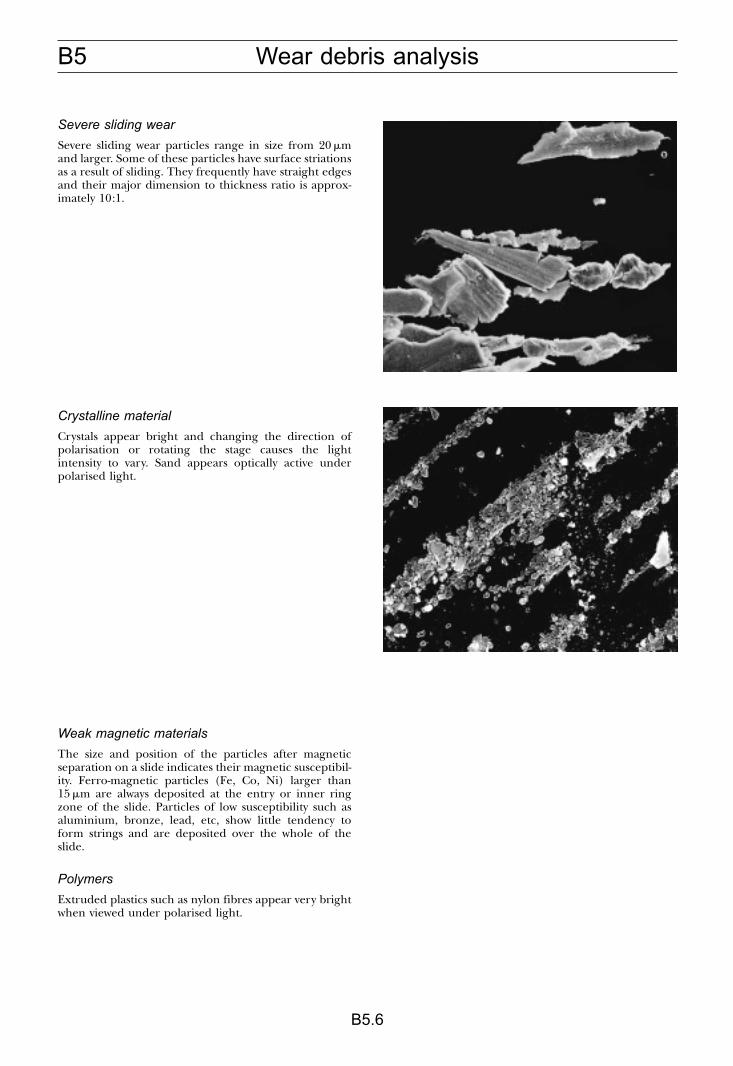
B5 Wear debris analysis
B5.6
Severe sliding wear
Severe sliding wear particles range in size from 20 �mand larger. Some of these particles have surface striationsas a result of sliding. They frequently have straight edgesand their major dimension to thickness ratio is approx-imately 10:1.
Crystalline material
Crystals appear bright and changing the direction ofpolarisation or rotating the stage causes the lightintensity to vary. Sand appears optically active underpolarised light.
Weak magnetic materials
The size and position of the particles after magneticseparation on a slide indicates their magnetic susceptibil-ity. Ferro-magnetic particles (Fe, Co, Ni) larger than15 �m are always deposited at the entry or inner ringzone of the slide. Particles of low susceptibility such asaluminium, bronze, lead, etc, show little tendency toform strings and are deposited over the whole of theslide.
Polymers
Extruded plastics such as nylon fibres appear very brightwhen viewed under polarised light.
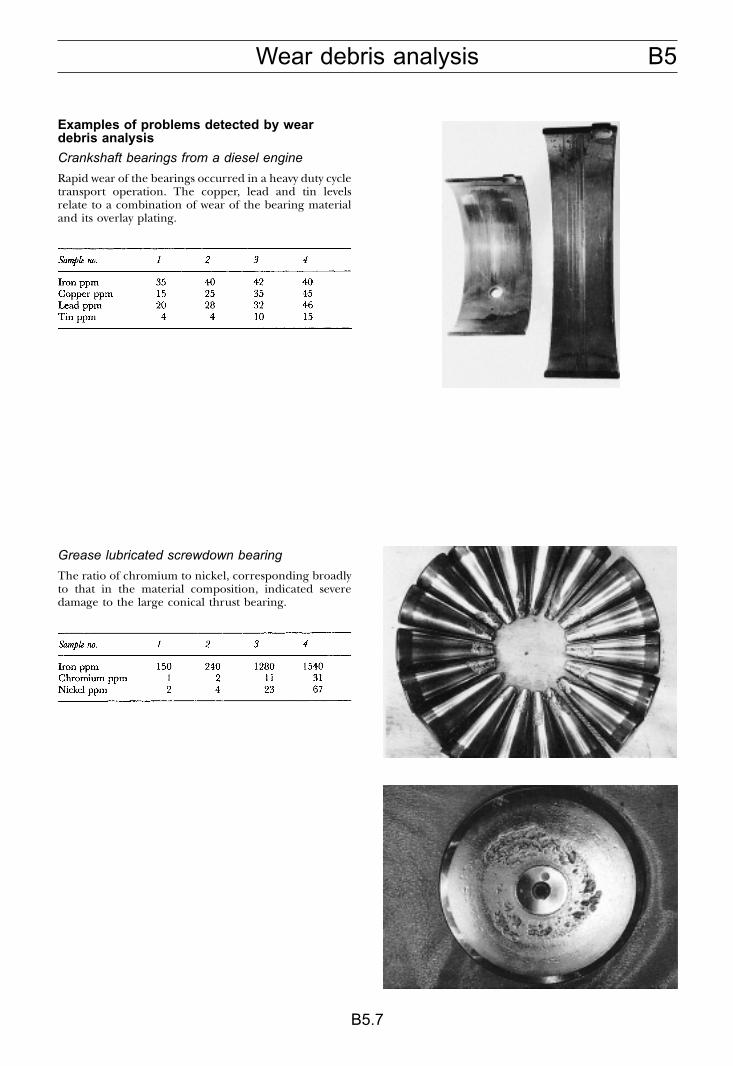
B5Wear debris analysis
B5.7
Examples of problems detected by weardebris analysis
Crankshaft bearings from a diesel engine
Rapid wear of the bearings occurred in a heavy duty cycletransport operation. The copper, lead and tin levelsrelate to a combination of wear of the bearing materialand its overlay plating.
Grease lubricated screwdown bearing
The ratio of chromium to nickel, corresponding broadlyto that in the material composition, indicated severedamage to the large conical thrust bearing.
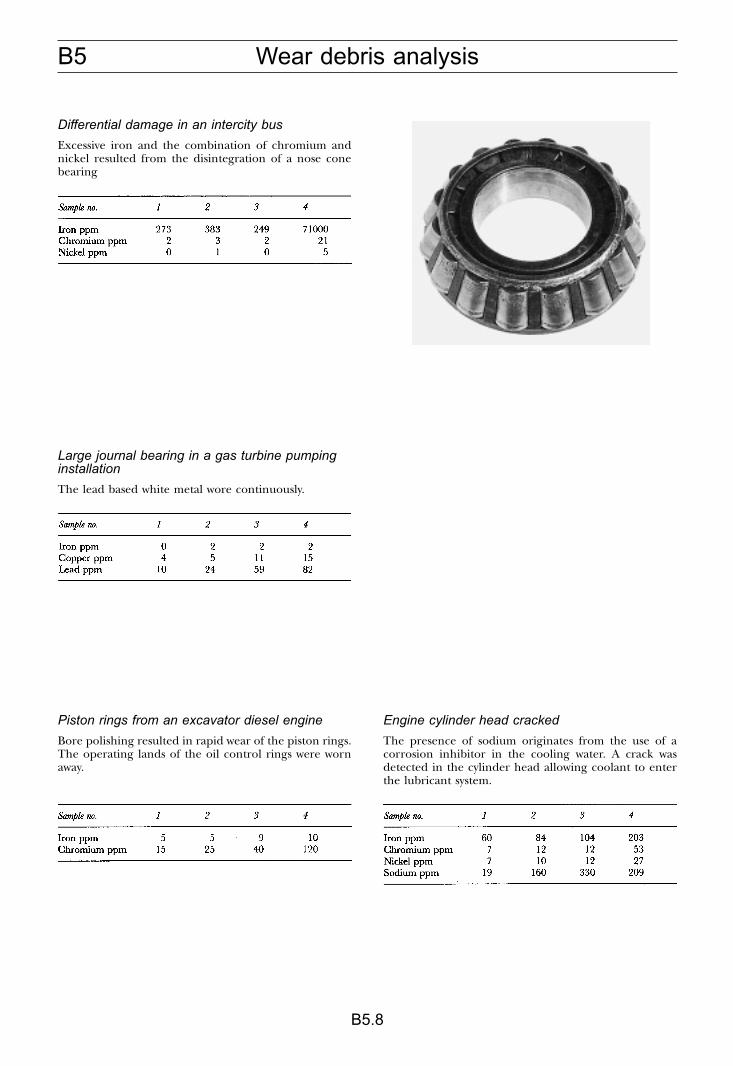
B5 Wear debris analysis
B5.8
Differential damage in an intercity bus
Excessive iron and the combination of chromium andnickel resulted from the disintegration of a nose conebearing
Large journal bearing in a gas turbine pumpinginstallation
The lead based white metal wore continuously.
Piston rings from an excavator diesel engine
Bore polishing resulted in rapid wear of the piston rings.The operating lands of the oil control rings were wornaway.
Engine cylinder head cracked
The presence of sodium originates from the use of acorrosion inhibitor in the cooling water. A crack wasdetected in the cylinder head allowing coolant to enterthe lubricant system.
B5Wear debris analysis
B5.9
LUBRICANT ANALYSIS
Table 5.6 Off-line lubricant analysis techniques
Table 5.7 Analysis techniques for the oil from various types of machine
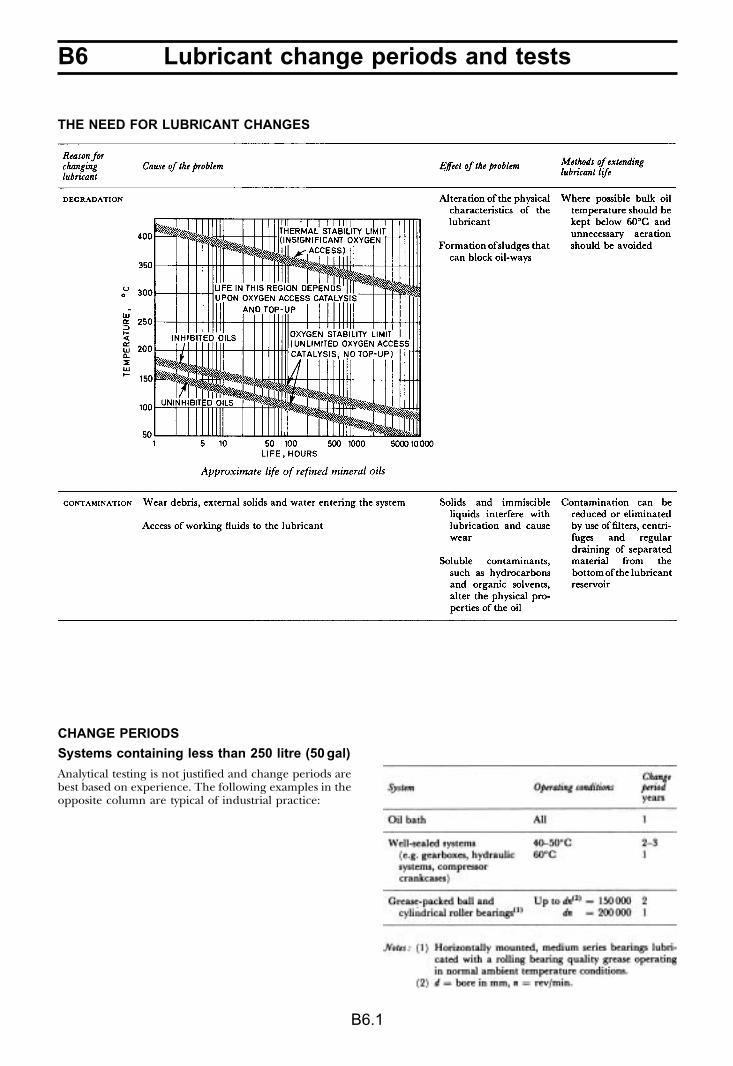
B6 Lubricant change periods and tests
B6.1
THE NEED FOR LUBRICANT CHANGES
CHANGE PERIODS
Systems containing less than 250 litre (50 gal)
Analytical testing is not justified and change periods arebest based on experience. The following examples in theopposite column are typical of industrial practice:

B6Lubricant change periods and tests
B6.2
Systems containing more than 250 litre (50 gal)
Regular testing should be carried out to determine when the lubricant is approaching the end of its useful service life.A combination of visual examination and laboratory testing is recommended.
The results obtained are only representative of the sample. This should preferably be taken when the system isrunning, and a clean container must be used. Guidance on interpreting the results is given in the following tables.
VISUAL EXAMINATION OF USED LUBRICATING OIL
1 Take sample of circulating oil in clean glass bottle (50–100 ml).2 If dirty or opaque, stand for 1 h, preferably at 60°C (an office radiator provides a convenient source of heat).
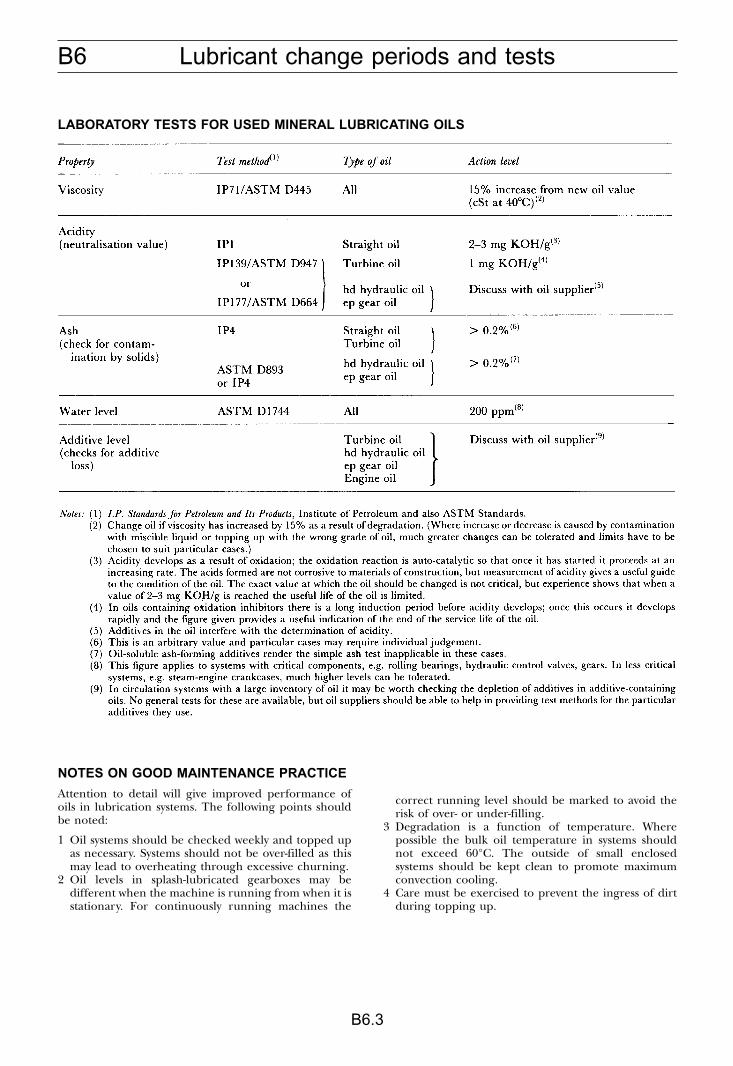
B6 Lubricant change periods and tests
B6.3
LABORATORY TESTS FOR USED MINERAL LUBRICATING OILS
NOTES ON GOOD MAINTENANCE PRACTICE
Attention to detail will give improved performance ofoils in lubrication systems. The following points shouldbe noted:
1 Oil systems should be checked weekly and topped upas necessary. Systems should not be over-filled as thismay lead to overheating through excessive churning.
2 Oil levels in splash-lubricated gearboxes may bedifferent when the machine is running from when it isstationary. For continuously running machines the
correct running level should be marked to avoid therisk of over- or under-filling.
3 Degradation is a function of temperature. Wherepossible the bulk oil temperature in systems shouldnot exceed 60°C. The outside of small enclosedsystems should be kept clean to promote maximumconvection cooling.
4 Care must be exercised to prevent the ingress of dirtduring topping up.
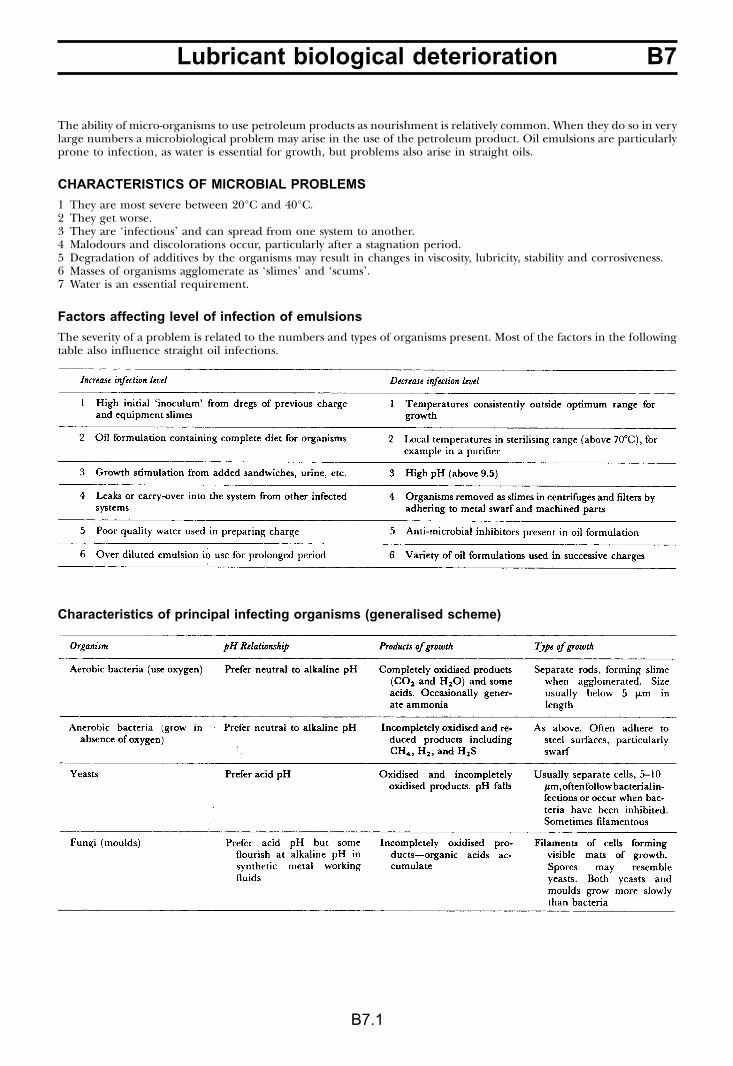
B7Lubricant biological deterioration
B7.1
The ability of micro-organisms to use petroleum products as nourishment is relatively common. When they do so in verylarge numbers a microbiological problem may arise in the use of the petroleum product. Oil emulsions are particularlyprone to infection, as water is essential for growth, but problems also arise in straight oils.
CHARACTERISTICS OF MICROBIAL PROBLEMS
1 They are most severe between 20°C and 40°C.2 They get worse.3 They are ‘infectious’ and can spread from one system to another.4 Malodours and discolorations occur, particularly after a stagnation period.5 Degradation of additives by the organisms may result in changes in viscosity, lubricity, stability and corrosiveness.6 Masses of organisms agglomerate as ‘slimes’ and ‘scums’.7 Water is an essential requirement.
Factors affecting level of infection of emulsions
The severity of a problem is related to the numbers and types of organisms present. Most of the factors in the followingtable also influence straight oil infections.
Characteristics of principal infecting organisms (generalised scheme)
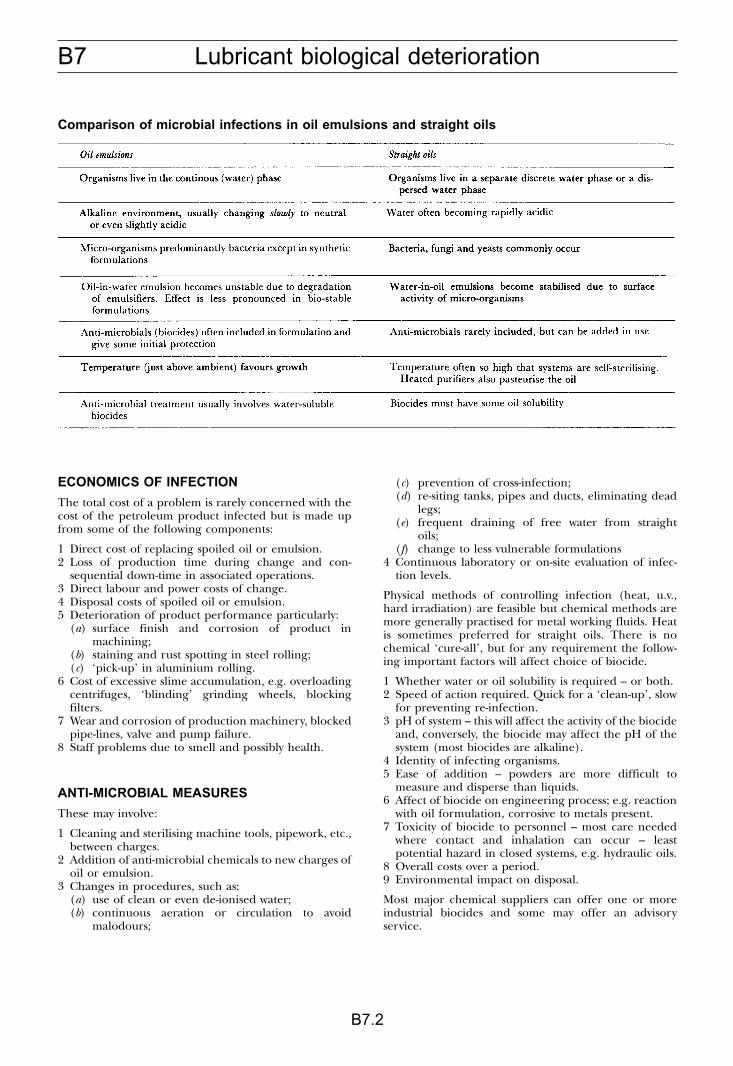
B7 Lubricant biological deterioration
B7.2
Comparison of microbial infections in oil emulsions and straight oils
ECONOMICS OF INFECTION
The total cost of a problem is rarely concerned with thecost of the petroleum product infected but is made upfrom some of the following components:
1 Direct cost of replacing spoiled oil or emulsion.2 Loss of production time during change and con-
sequential down-time in associated operations.3 Direct labour and power costs of change.4 Disposal costs of spoiled oil or emulsion.5 Deterioration of product performance particularly:
(a) surface finish and corrosion of product inmachining;
(b) staining and rust spotting in steel rolling;(c) ‘pick-up’ in aluminium rolling.
6 Cost of excessive slime accumulation, e.g. overloadingcentrifuges, ‘blinding’ grinding wheels, blockingfilters.
7 Wear and corrosion of production machinery, blockedpipe-lines, valve and pump failure.
8 Staff problems due to smell and possibly health.
ANTI-MICROBIAL MEASURES
These may involve:
1 Cleaning and sterilising machine tools, pipework, etc.,between charges.
2 Addition of anti-microbial chemicals to new charges ofoil or emulsion.
3 Changes in procedures, such as:(a) use of clean or even de-ionised water;(b) continuous aeration or circulation to avoid
malodours;
(c) prevention of cross-infection;(d) re-siting tanks, pipes and ducts, eliminating dead
legs;(e) frequent draining of free water from straight
oils;(f) change to less vulnerable formulations
4 Continuous laboratory or on-site evaluation of infec-tion levels.
Physical methods of controlling infection (heat, u.v.,hard irradiation) are feasible but chemical methods aremore generally practised for metal working fluids. Heatis sometimes preferred for straight oils. There is nochemical ‘cure-all’, but for any requirement the follow-ing important factors will affect choice of biocide.
1 Whether water or oil solubility is required – or both.2 Speed of action required. Quick for a ‘clean-up’, slow
for preventing re-infection.3 pH of system – this will affect the activity of the biocide
and, conversely, the biocide may affect the pH of thesystem (most biocides are alkaline).
4 Identity of infecting organisms.5 Ease of addition – powders are more difficult to
measure and disperse than liquids.6 Affect of biocide on engineering process; e.g. reaction
with oil formulation, corrosive to metals present.7 Toxicity of biocide to personnel – most care needed
where contact and inhalation can occur – leastpotential hazard in closed systems, e.g. hydraulic oils.
8 Overall costs over a period.9 Environmental impact on disposal.
Most major chemical suppliers can offer one or moreindustrial biocides and some may offer an advisoryservice.
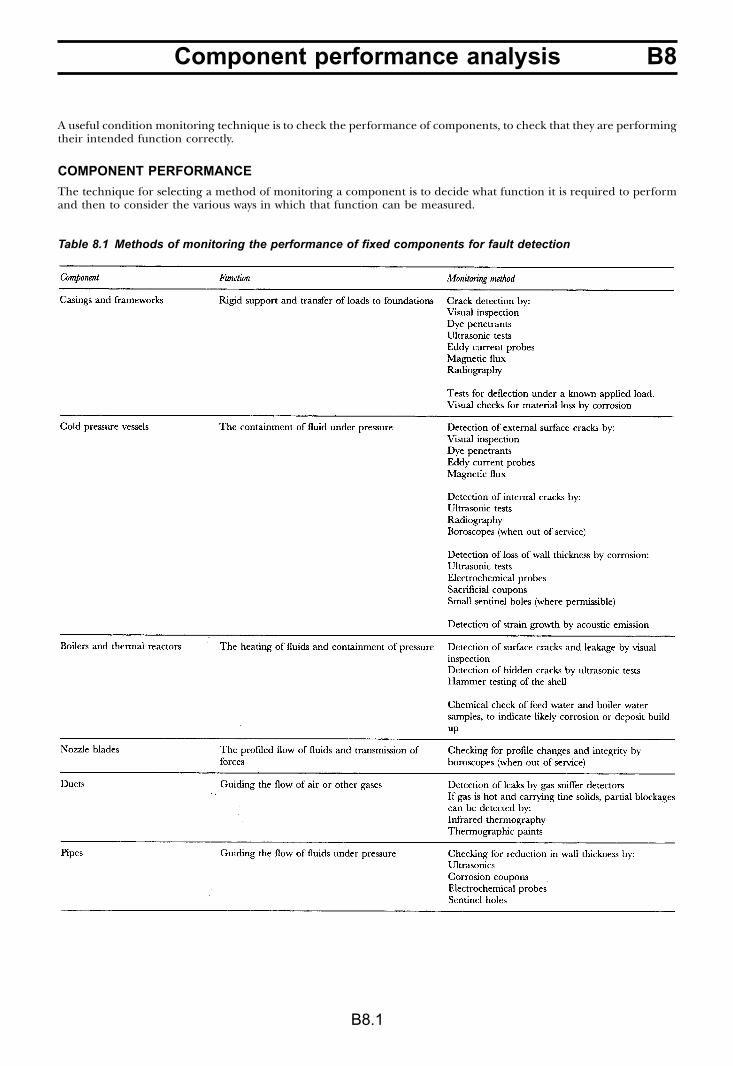
B8Component performance analysis
B8.1
A useful condition monitoring technique is to check the performance of components, to check that they are performingtheir intended function correctly.
COMPONENT PERFORMANCE
The technique for selecting a method of monitoring a component is to decide what function it is required to performand then to consider the various ways in which that function can be measured.
Table 8.1 Methods of monitoring the performance of fixed components for fault detection

B8 Component performance analysis
B8.2
Table 8.2 Methods of monitoring the performance of moving components for fault detection
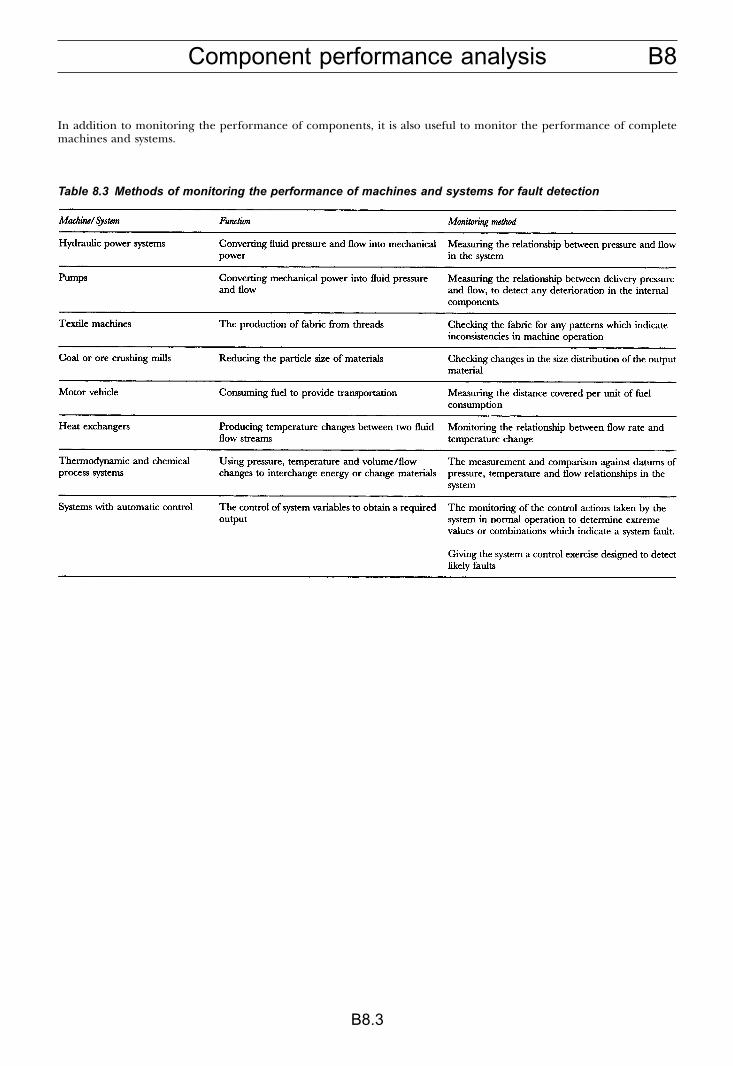
B8Component performance analysis
B8.3
Table 8.3 Methods of monitoring the performance of machines and systems for fault detection
In addition to monitoring the performance of components, it is also useful to monitor the performance of completemachines and systems.
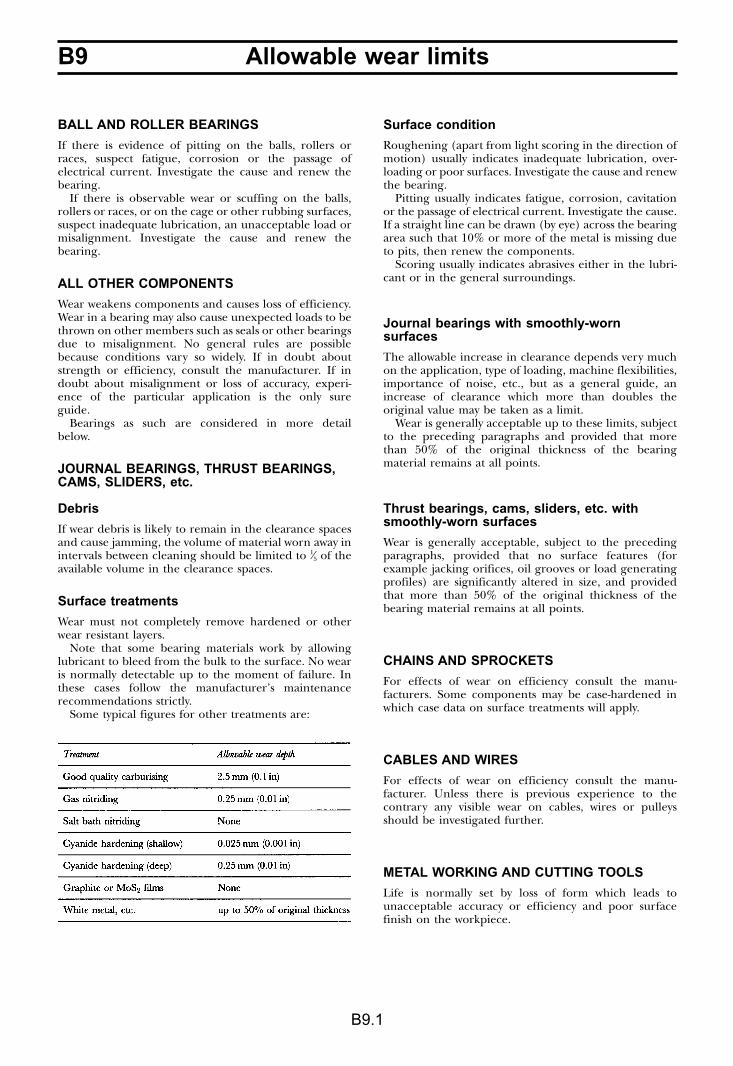
B9 Allowable wear limits
B9.1
BALL AND ROLLER BEARINGS
If there is evidence of pitting on the balls, rollers orraces, suspect fatigue, corrosion or the passage ofelectrical current. Investigate the cause and renew thebearing.
If there is observable wear or scuffing on the balls,rollers or races, or on the cage or other rubbing surfaces,suspect inadequate lubrication, an unacceptable load ormisalignment. Investigate the cause and renew thebearing.
ALL OTHER COMPONENTS
Wear weakens components and causes loss of efficiency.Wear in a bearing may also cause unexpected loads to bethrown on other members such as seals or other bearingsdue to misalignment. No general rules are possiblebecause conditions vary so widely. If in doubt aboutstrength or efficiency, consult the manufacturer. If indoubt about misalignment or loss of accuracy, experi-ence of the particular application is the only sureguide.
Bearings as such are considered in more detailbelow.
JOURNAL BEARINGS, THRUST BEARINGS,CAMS, SLIDERS, etc.
Debris
If wear debris is likely to remain in the clearance spacesand cause jamming, the volume of material worn away inintervals between cleaning should be limited to 1⁄5 of theavailable volume in the clearance spaces.
Surface treatments
Wear must not completely remove hardened or otherwear resistant layers.
Note that some bearing materials work by allowinglubricant to bleed from the bulk to the surface. No wearis normally detectable up to the moment of failure. Inthese cases follow the manufacturer’s maintenancerecommendations strictly.
Some typical figures for other treatments are:
Surface condition
Roughening (apart from light scoring in the direction ofmotion) usually indicates inadequate lubrication, over-loading or poor surfaces. Investigate the cause and renewthe bearing.
Pitting usually indicates fatigue, corrosion, cavitationor the passage of electrical current. Investigate the cause.If a straight line can be drawn (by eye) across the bearingarea such that 10% or more of the metal is missing dueto pits, then renew the components.
Scoring usually indicates abrasives either in the lubri-cant or in the general surroundings.
Journal bearings with smoothly-wornsurfaces
The allowable increase in clearance depends very muchon the application, type of loading, machine flexibilities,importance of noise, etc., but as a general guide, anincrease of clearance which more than doubles theoriginal value may be taken as a limit.
Wear is generally acceptable up to these limits, subjectto the preceding paragraphs and provided that morethan 50% of the original thickness of the bearingmaterial remains at all points.
Thrust bearings, cams, sliders, etc. withsmoothly-worn surfaces
Wear is generally acceptable, subject to the precedingparagraphs, provided that no surface features (forexample jacking orifices, oil grooves or load generatingprofiles) are significantly altered in size, and providedthat more than 50% of the original thickness of thebearing material remains at all points.
CHAINS AND SPROCKETS
For effects of wear on efficiency consult the manu-facturers. Some components may be case-hardened inwhich case data on surface treatments will apply.
CABLES AND WIRES
For effects of wear on efficiency consult the manu-facturer. Unless there is previous experience to thecontrary any visible wear on cables, wires or pulleysshould be investigated further.
METAL WORKING AND CUTTING TOOLS
Life is normally set by loss of form which leads tounacceptable accuracy or efficiency and poor surfacefinish on the workpiece.
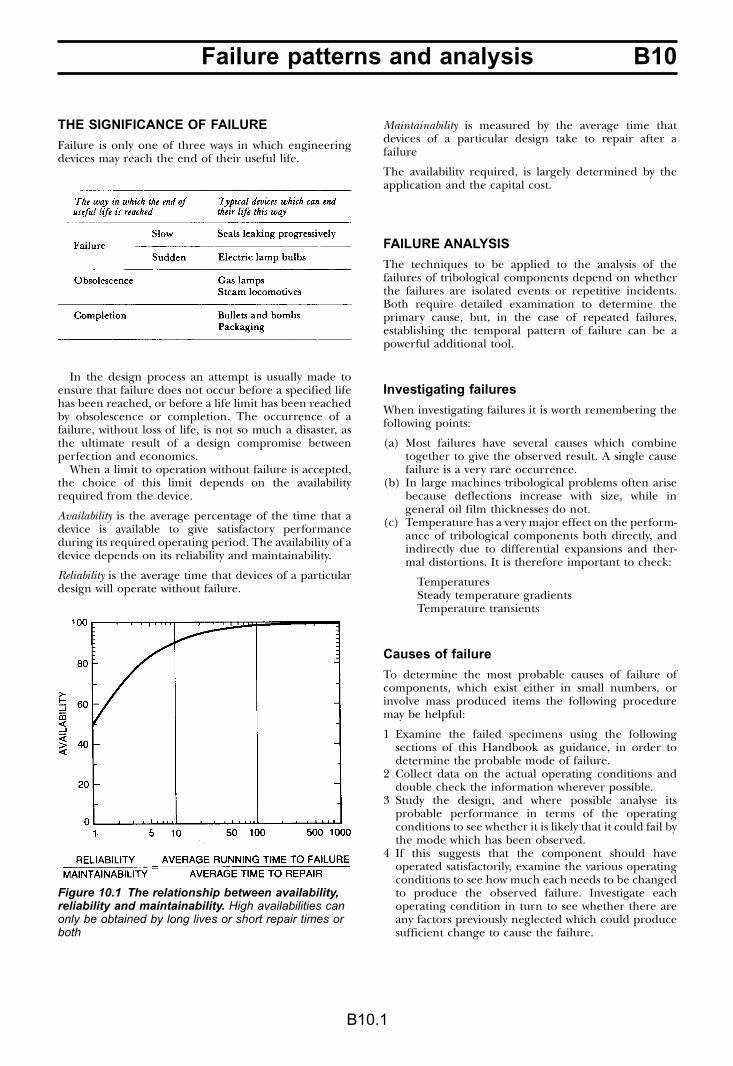
B10Failure patterns and analysis
B10.1
THE SIGNIFICANCE OF FAILURE
Failure is only one of three ways in which engineeringdevices may reach the end of their useful life.
In the design process an attempt is usually made toensure that failure does not occur before a specified lifehas been reached, or before a life limit has been reachedby obsolescence or completion. The occurrence of afailure, without loss of life, is not so much a disaster, asthe ultimate result of a design compromise betweenperfection and economics.
When a limit to operation without failure is accepted,the choice of this limit depends on the availabilityrequired from the device.
Availability is the average percentage of the time that adevice is available to give satisfactory performanceduring its required operating period. The availability of adevice depends on its reliability and maintainability.
Reliability is the average time that devices of a particulardesign will operate without failure.
Maintainability is measured by the average time thatdevices of a particular design take to repair after afailure
The availability required, is largely determined by theapplication and the capital cost.
FAILURE ANALYSIS
The techniques to be applied to the analysis of thefailures of tribological components depend on whetherthe failures are isolated events or repetitive incidents.Both require detailed examination to determine theprimary cause, but, in the case of repeated failures,establishing the temporal pattern of failure can be apowerful additional tool.
Investigating failures
When investigating failures it is worth remembering thefollowing points:
(a) Most failures have several causes which combinetogether to give the observed result. A single causefailure is a very rare occurrence.
(b) In large machines tribological problems often arisebecause deflections increase with size, while ingeneral oil film thicknesses do not.
(c) Temperature has a very major effect on the perform-ance of tribological components both directly, andindirectly due to differential expansions and ther-mal distortions. It is therefore important to check:
TemperaturesSteady temperature gradientsTemperature transients
Causes of failure
To determine the most probable causes of failure ofcomponents, which exist either in small numbers, orinvolve mass produced items the following proceduremay be helpful:
1 Examine the failed specimens using the followingsections of this Handbook as guidance, in order todetermine the probable mode of failure.
2 Collect data on the actual operating conditions anddouble check the information wherever possible.
3 Study the design, and where possible analyse itsprobable performance in terms of the operatingconditions to see whether it is likely that it could fail bythe mode which has been observed.
4 If this suggests that the component should haveoperated satisfactorily, examine the various operatingconditions to see how much each needs to be changedto produce the observed failure. Investigate eachoperating condition in turn to see whether there areany factors previously neglected which could producesufficient change to cause the failure.
Figure 10.1 The relationship between availability,reliability and maintainability. High availabilities canonly be obtained by long lives or short repair times orboth
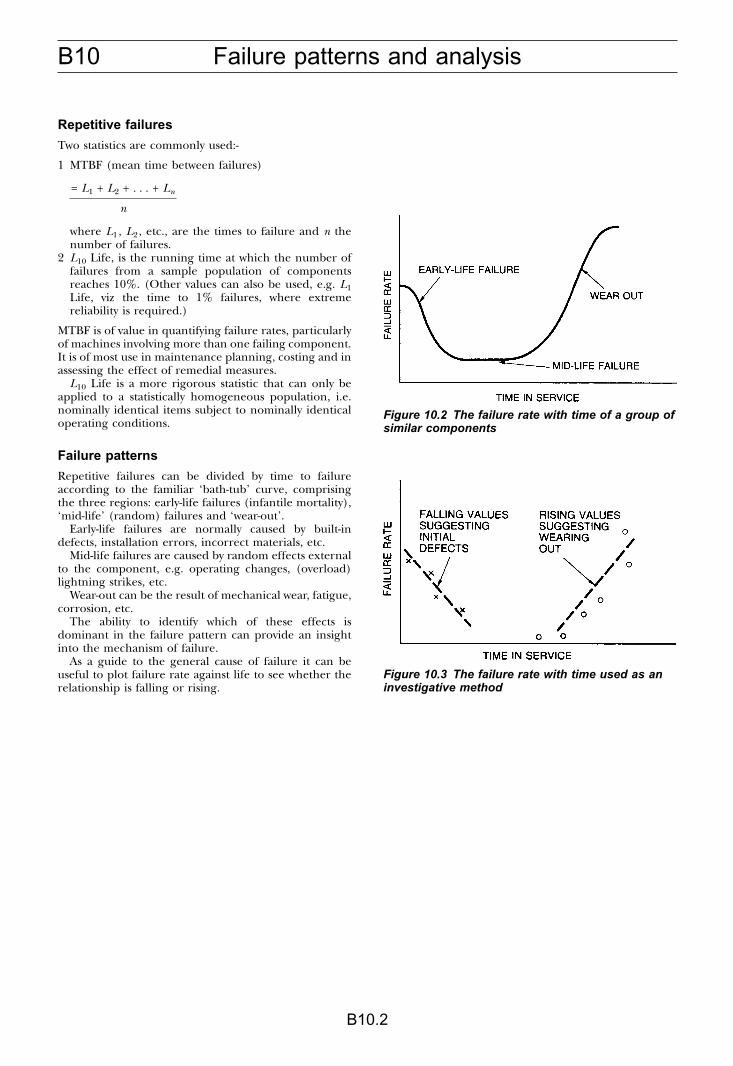
B10 Failure patterns and analysis
B10.2
Repetitive failures
Two statistics are commonly used:-
1 MTBF (mean time between failures)
= L1 + L2 + . . . + Ln
n
where L1, L2, etc., are the times to failure and n thenumber of failures.
2 L10 Life, is the running time at which the number offailures from a sample population of componentsreaches 10%. (Other values can also be used, e.g. L1Life, viz the time to 1% failures, where extremereliability is required.)
MTBF is of value in quantifying failure rates, particularlyof machines involving more than one failing component.It is of most use in maintenance planning, costing and inassessing the effect of remedial measures.
L10 Life is a more rigorous statistic that can only beapplied to a statistically homogeneous population, i.e.nominally identical items subject to nominally identicaloperating conditions.
Failure patterns
Repetitive failures can be divided by time to failureaccording to the familiar ‘bath-tub’ curve, comprisingthe three regions: early-life failures (infantile mortality),‘mid-life’ (random) failures and ‘wear-out’.
Early-life failures are normally caused by built-indefects, installation errors, incorrect materials, etc.
Mid-life failures are caused by random effects externalto the component, e.g. operating changes, (overload)lightning strikes, etc.
Wear-out can be the result of mechanical wear, fatigue,corrosion, etc.
The ability to identify which of these effects isdominant in the failure pattern can provide an insightinto the mechanism of failure.
As a guide to the general cause of failure it can beuseful to plot failure rate against life to see whether therelationship is falling or rising.
Figure 10.2 The failure rate with time of a group ofsimilar components
Figure 10.3 The failure rate with time used as aninvestigative method
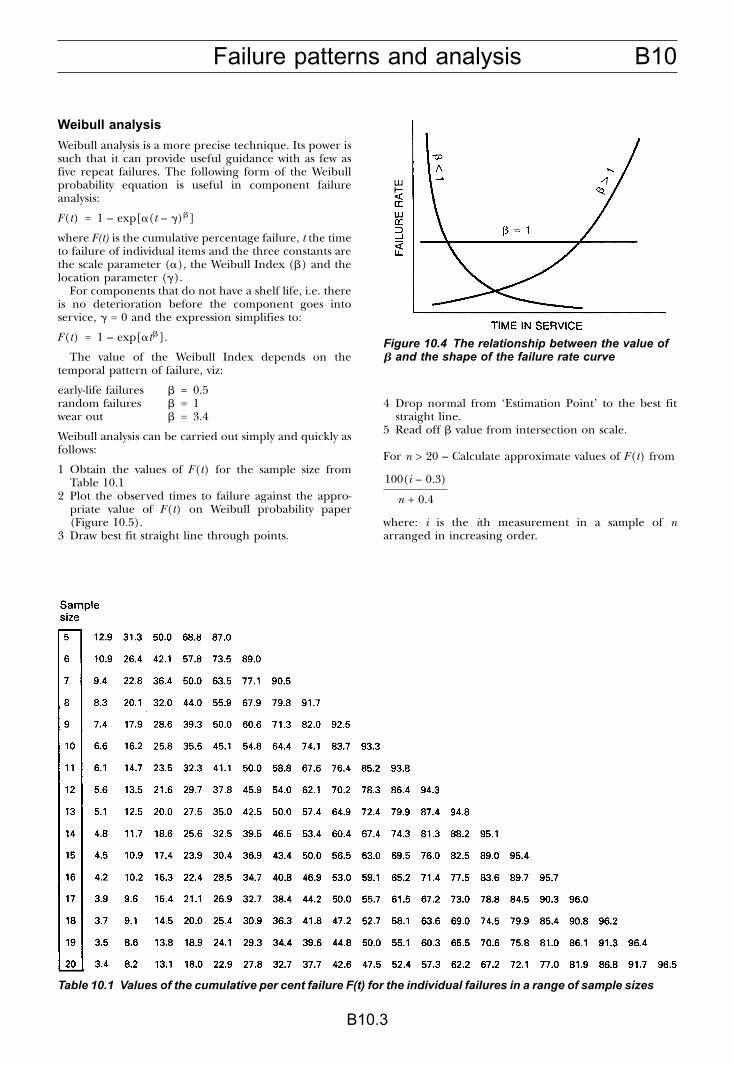
B10Failure patterns and analysis
B10.3
Weibull analysis
Weibull analysis is a more precise technique. Its power issuch that it can provide useful guidance with as few asfive repeat failures. The following form of the Weibullprobability equation is useful in component failureanalysis:
F(t) = 1 – exp[(t – )�]
where F(t) is the cumulative percentage failure, t the timeto failure of individual items and the three constants arethe scale parameter (), the Weibull Index (�) and thelocation parameter ().
For components that do not have a shelf life, i.e. thereis no deterioration before the component goes intoservice, = 0 and the expression simplifies to:
F(t) = 1 – exp[t�].
The value of the Weibull Index depends on thetemporal pattern of failure, viz:
early-life failures � = 0.5random failures � = 1wear out � = 3.4
Weibull analysis can be carried out simply and quickly asfollows:
1 Obtain the values of F(t) for the sample size fromTable 10.1
2 Plot the observed times to failure against the appro-priate value of F(t) on Weibull probability paper(Figure 10.5).
3 Draw best fit straight line through points.
4 Drop normal from ‘Estimation Point’ to the best fitstraight line.
5 Read off � value from intersection on scale.
For n > 20 – Calculate approximate values of F(t) from
100(i – 0.3)
n + 0.4
where: i is the ith measurement in a sample of narranged in increasing order.
Figure 10.4 The relationship between the value of� and the shape of the failure rate curve
Table 10.1 Values of the cumulative per cent failure F(t) for the individual failures in a range of sample sizes
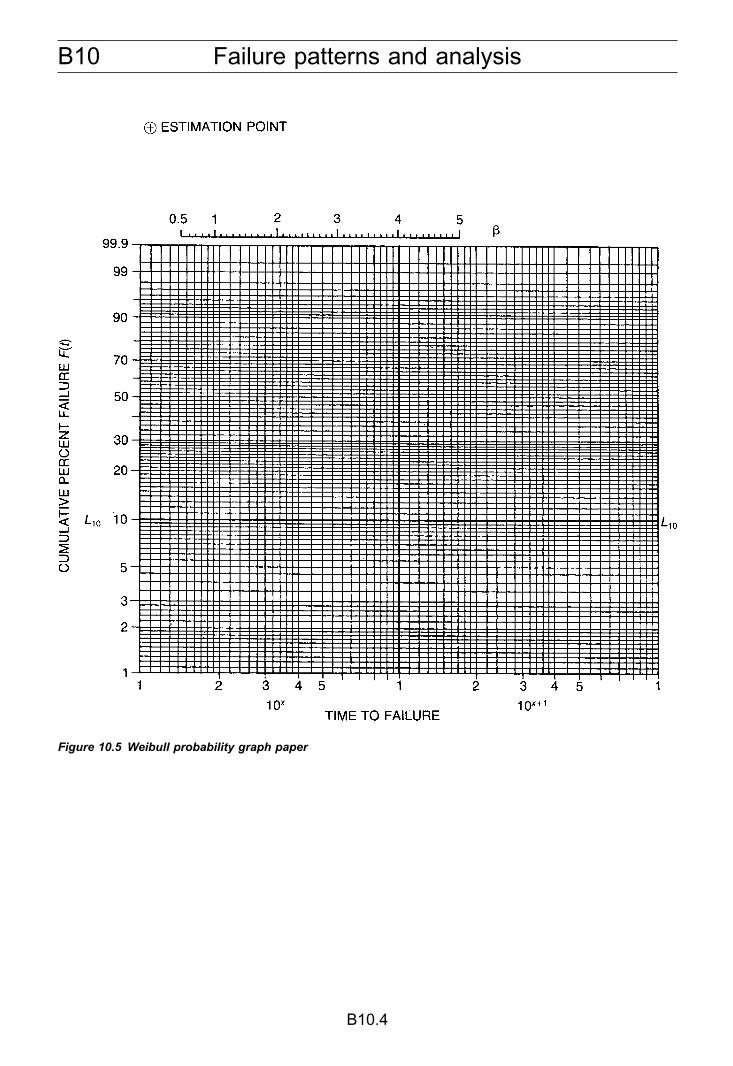
B10 Failure patterns and analysis
B10.4
Figure 10.5 Weibull probability graph paper
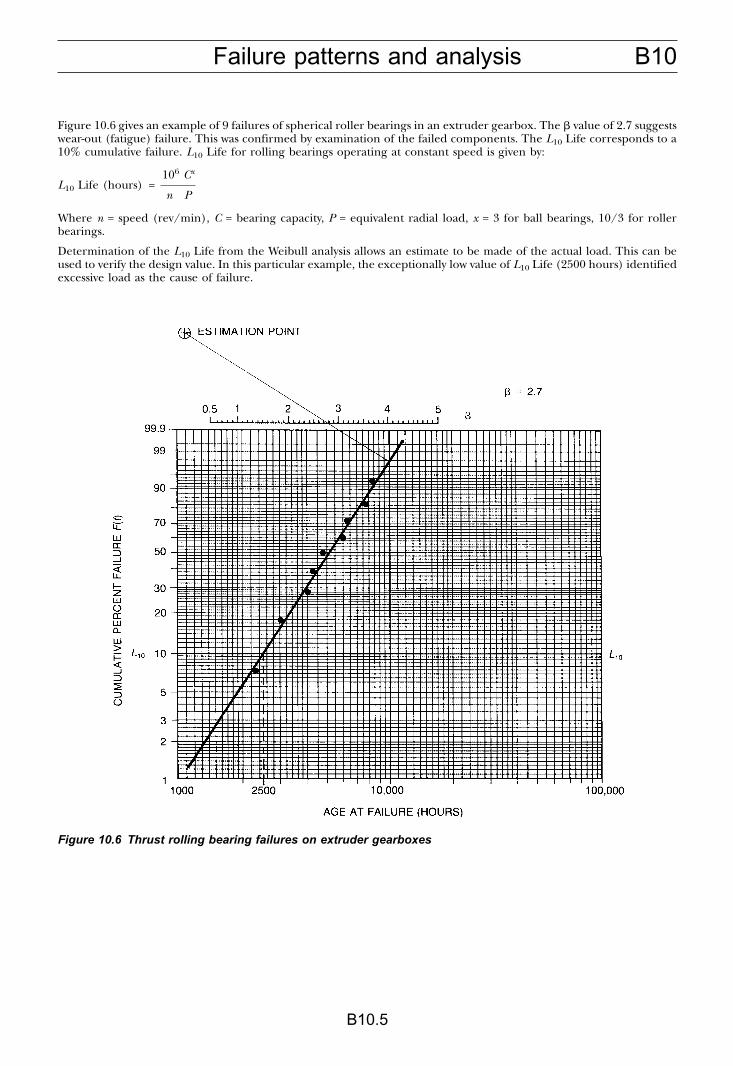
B10Failure patterns and analysis
B10.5
Figure 10.6 gives an example of 9 failures of spherical roller bearings in an extruder gearbox. The � value of 2.7 suggestswear-out (fatigue) failure. This was confirmed by examination of the failed components. The L10 Life corresponds to a10% cumulative failure. L10 Life for rolling bearings operating at constant speed is given by:
L10 Life (hours) =106 Cx
n P
Where n = speed (rev/min), C = bearing capacity, P = equivalent radial load, x = 3 for ball bearings, 10/3 for rollerbearings.
Determination of the L10 Life from the Weibull analysis allows an estimate to be made of the actual load. This can beused to verify the design value. In this particular example, the exceptionally low value of L10 Life (2500 hours) identifiedexcessive load as the cause of failure.
Figure 10.6 Thrust rolling bearing failures on extruder gearboxes
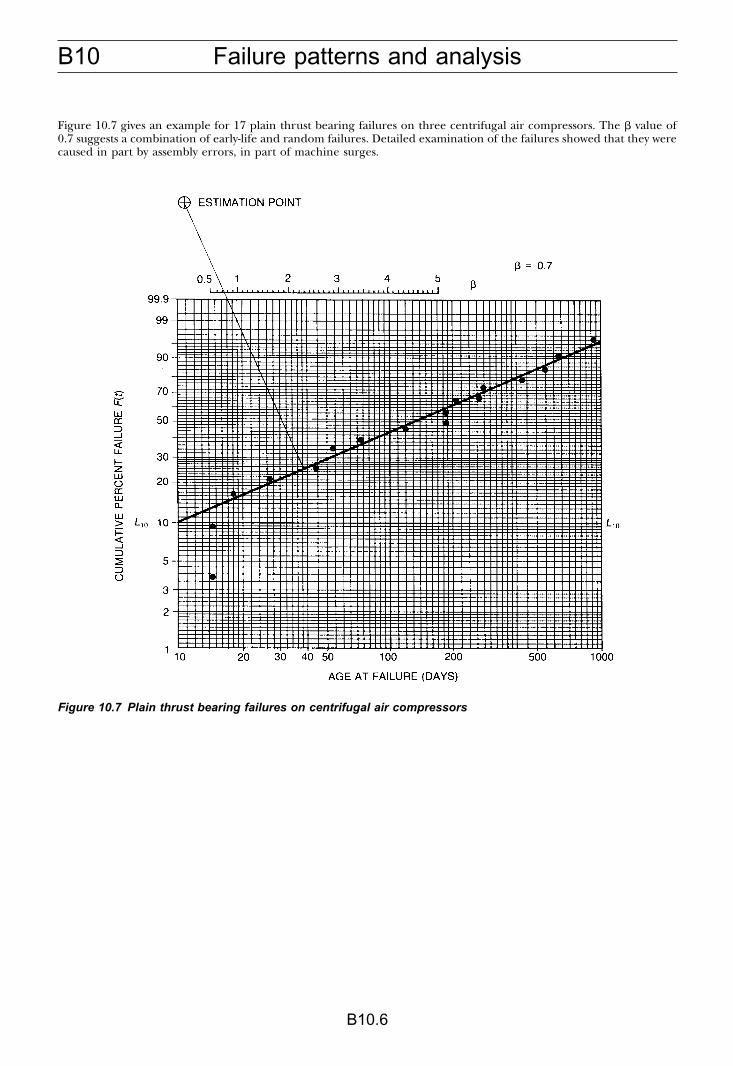
B10 Failure patterns and analysis
B10.6
Figure 10.7 gives an example for 17 plain thrust bearing failures on three centrifugal air compressors. The � value of0.7 suggests a combination of early-life and random failures. Detailed examination of the failures showed that they werecaused in part by assembly errors, in part of machine surges.
Figure 10.7 Plain thrust bearing failures on centrifugal air compressors
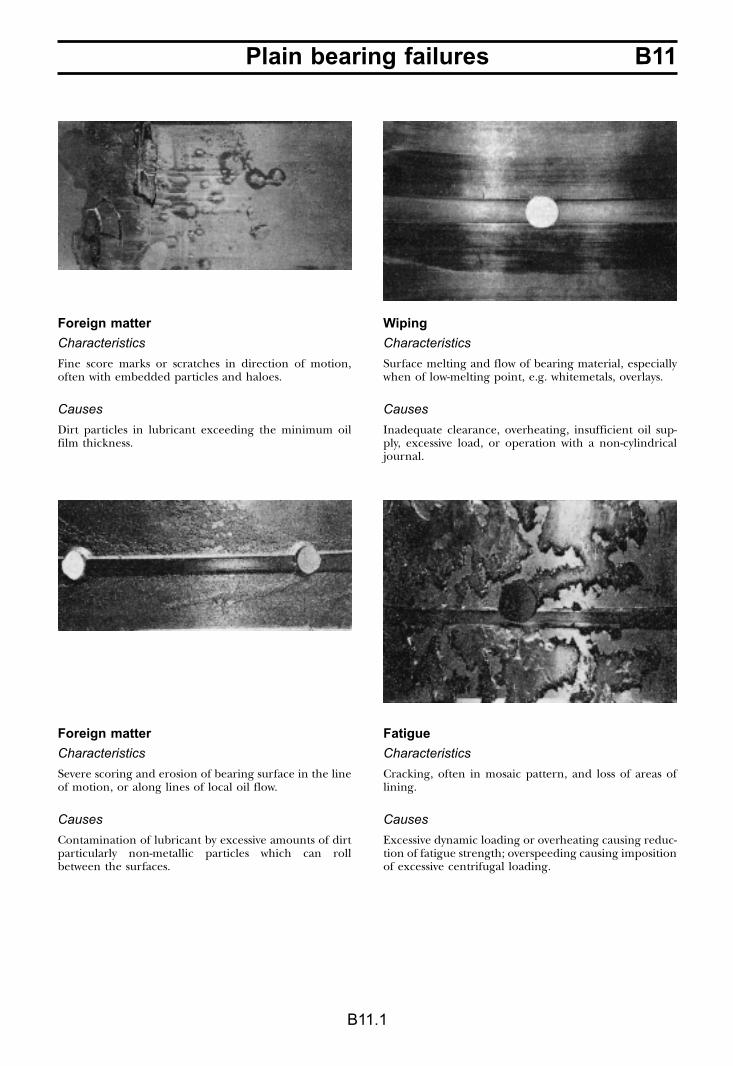
B11Plain bearing failures
B11.1
Foreign matter
Characteristics
Fine score marks or scratches in direction of motion,often with embedded particles and haloes.
Causes
Dirt particles in lubricant exceeding the minimum oilfilm thickness.
Foreign matter
Characteristics
Severe scoring and erosion of bearing surface in the lineof motion, or along lines of local oil flow.
Causes
Contamination of lubricant by excessive amounts of dirtparticularly non-metallic particles which can rollbetween the surfaces.
Wiping
Characteristics
Surface melting and flow of bearing material, especiallywhen of low-melting point, e.g. whitemetals, overlays.
Causes
Inadequate clearance, overheating, insufficient oil sup-ply, excessive load, or operation with a non-cylindricaljournal.
Fatigue
Characteristics
Cracking, often in mosaic pattern, and loss of areas oflining.
Causes
Excessive dynamic loading or overheating causing reduc-tion of fatigue strength; overspeeding causing impositionof excessive centrifugal loading.
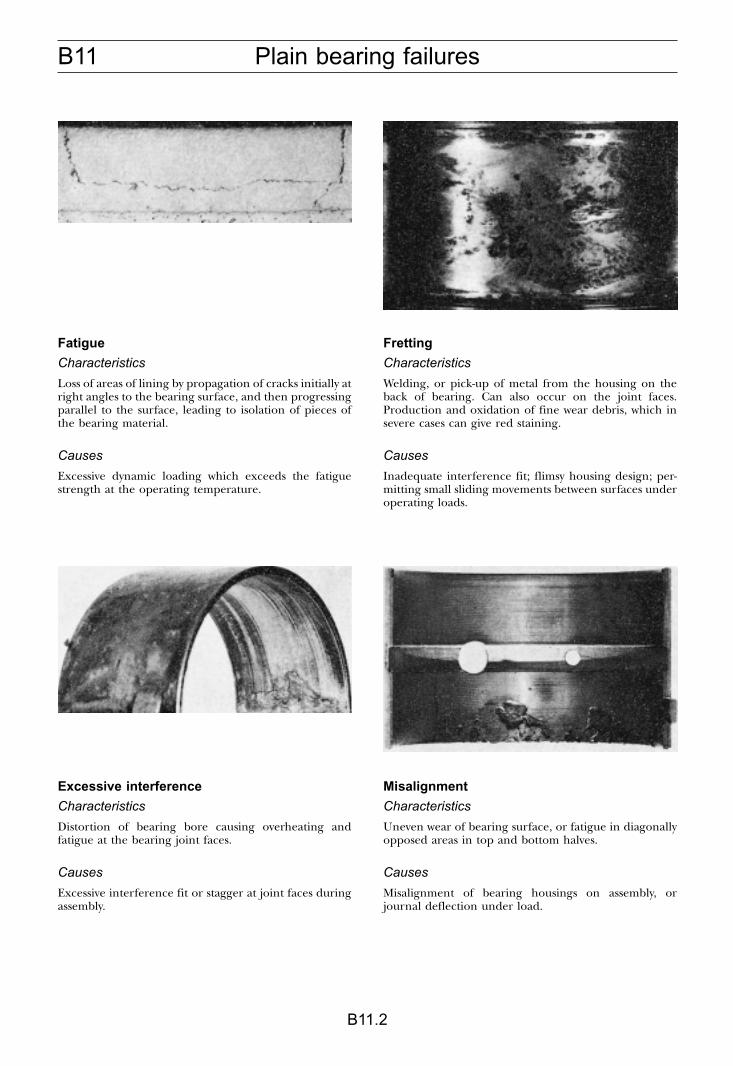
B11 Plain bearing failures
B11.2
Fatigue
Characteristics
Loss of areas of lining by propagation of cracks initially atright angles to the bearing surface, and then progressingparallel to the surface, leading to isolation of pieces ofthe bearing material.
Causes
Excessive dynamic loading which exceeds the fatiguestrength at the operating temperature.
Excessive interference
Characteristics
Distortion of bearing bore causing overheating andfatigue at the bearing joint faces.
Causes
Excessive interference fit or stagger at joint faces duringassembly.
Fretting
Characteristics
Welding, or pick-up of metal from the housing on theback of bearing. Can also occur on the joint faces.Production and oxidation of fine wear debris, which insevere cases can give red staining.
Causes
Inadequate interference fit; flimsy housing design; per-mitting small sliding movements between surfaces underoperating loads.
Misalignment
Characteristics
Uneven wear of bearing surface, or fatigue in diagonallyopposed areas in top and bottom halves.
Causes
Misalignment of bearing housings on assembly, orjournal deflection under load.
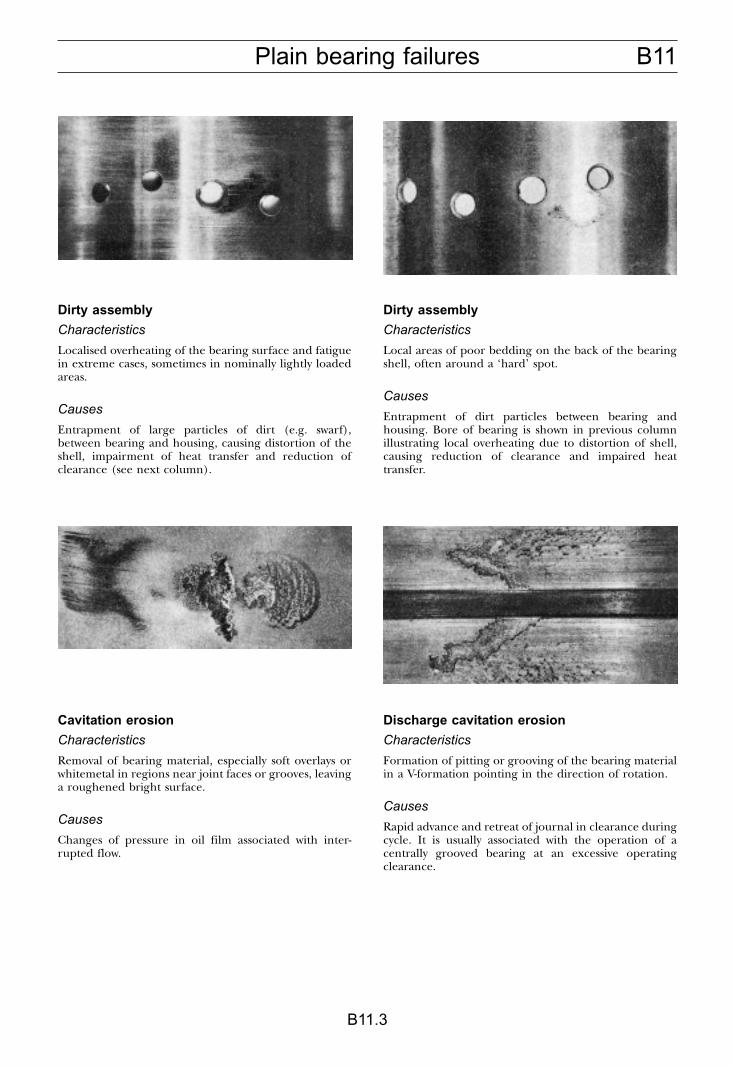
B11Plain bearing failures
B11.3
Dirty assembly
Characteristics
Localised overheating of the bearing surface and fatiguein extreme cases, sometimes in nominally lightly loadedareas.
Causes
Entrapment of large particles of dirt (e.g. swarf),between bearing and housing, causing distortion of theshell, impairment of heat transfer and reduction ofclearance (see next column).
Cavitation erosion
Characteristics
Removal of bearing material, especially soft overlays orwhitemetal in regions near joint faces or grooves, leavinga roughened bright surface.
Causes
Changes of pressure in oil film associated with inter-rupted flow.
Dirty assembly
Characteristics
Local areas of poor bedding on the back of the bearingshell, often around a ‘hard’ spot.
Causes
Entrapment of dirt particles between bearing andhousing. Bore of bearing is shown in previous columnillustrating local overheating due to distortion of shell,causing reduction of clearance and impaired heattransfer.
Discharge cavitation erosion
Characteristics
Formation of pitting or grooving of the bearing materialin a V-formation pointing in the direction of rotation.
Causes
Rapid advance and retreat of journal in clearance duringcycle. It is usually associated with the operation of acentrally grooved bearing at an excessive operatingclearance.
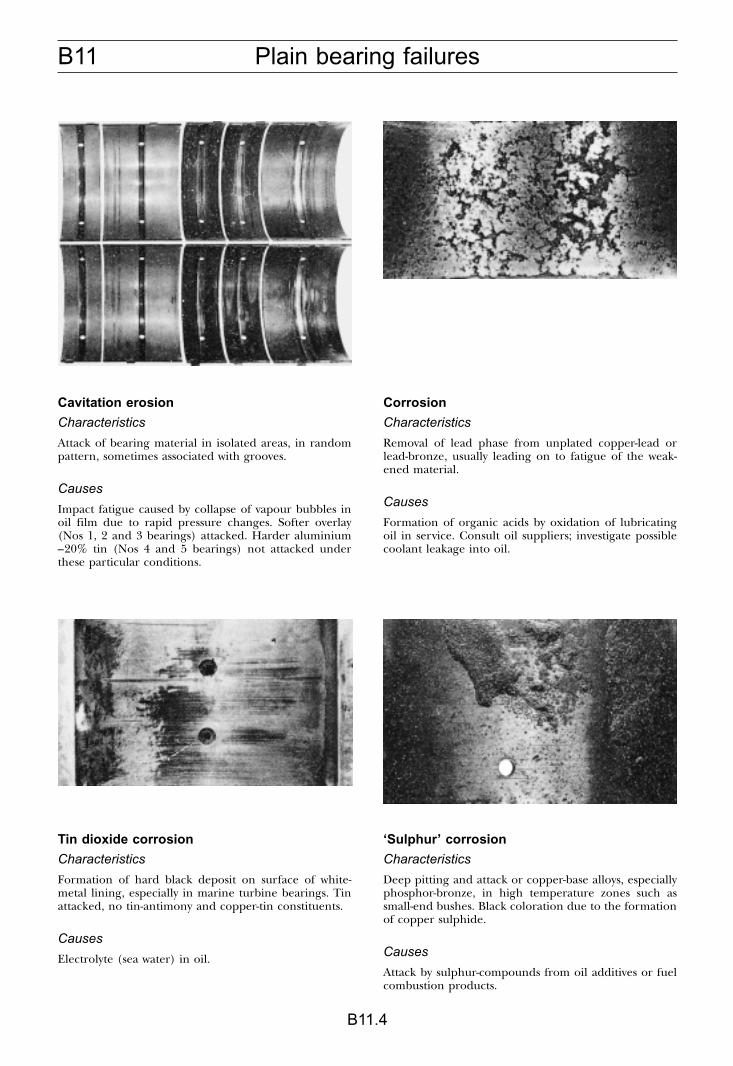
B11 Plain bearing failures
B11.4
Cavitation erosion
Characteristics
Attack of bearing material in isolated areas, in randompattern, sometimes associated with grooves.
Causes
Impact fatigue caused by collapse of vapour bubbles inoil film due to rapid pressure changes. Softer overlay(Nos 1, 2 and 3 bearings) attacked. Harder aluminium–20% tin (Nos 4 and 5 bearings) not attacked underthese particular conditions.
Tin dioxide corrosion
Characteristics
Formation of hard black deposit on surface of white-metal lining, especially in marine turbine bearings. Tinattacked, no tin-antimony and copper-tin constituents.
Causes
Electrolyte (sea water) in oil.
Corrosion
Characteristics
Removal of lead phase from unplated copper-lead orlead-bronze, usually leading on to fatigue of the weak-ened material.
Causes
Formation of organic acids by oxidation of lubricatingoil in service. Consult oil suppliers; investigate possiblecoolant leakage into oil.
‘Sulphur’ corrosion
Characteristics
Deep pitting and attack or copper-base alloys, especiallyphosphor-bronze, in high temperature zones such assmall-end bushes. Black coloration due to the formationof copper sulphide.
Causes
Attack by sulphur-compounds from oil additives or fuelcombustion products.
B11Plain bearing failures
B11.5
‘Wire wool’ damage
Characteristics
Formation of hard black scab on whitemetal bearingsurface, and severe machining away of journal in way ofscab, as shown on the right.
Causes
It is usually initiated by a large dirt particle embedded inthe whitemetal, in contact with journal, especially chro-mium steel.
Electrical discharge
Characteristics
Pitting of bearing surface and of journal; may causerapid failure in extreme cases.
Causes
Electrical currents from rotor to stator through oil film,often caused by faulty earthing.
‘Wire wool’ damage
Characteristics
Severe catastrophic machining of journal by ‘black scab’formed in whitemetal lining of bearing. The machining‘debris’ looks like wire wool.
Causes
Self-propagation of scab, expecially with ‘susceptible’journals steels, e.g. some chromium steels.
Fretting due to external vibration
Characteristics
Pitting and pick-up on bearing surface.
Causes
Vibration transmitted from external sources, causingdamage while journal is stationary.
B11 Plain bearing failures
B11.6
Overheating
Characteristics
Extrusion and cracking, especially of whitemetal-linedbearings.
Causes
Operation at excessive temperatures.
Faulty assembly
Characteristics
Localised fatigue or wiping in nominally lightly loadedareas.
Causes
Stagger at joint faces during assembly, due to excessivebolt clearances, or incorrect bolt disposition (bolts toofar out).
Thermal cycling
Characteristics
Surface rumpling and grain-boundary cracking of tin-base whitemetal bearings.
Causes
Thermal cycling in service, causing plastic deformation,associated with the non-uniform thermal expansion oftin crystals.
Faulty assembly
Characteristics
Overheating and pick-up at the sides of the bearings.
Causes
Incorrect grinding of journal radii, causing fouling atfillets.
B11Plain bearing failures
B11.7
Incorrect journal grinding
Characteristics
Severe wiping and tearing-up of bearing surface.
Causes
Too coarse a surface finish, or in the case of SG ironshafts, the final grinding of journal in wrong directionrelative to rotation in bearing.
Inadequate lubrication
Characteristics
Seizure of bearing.
Causes
Inadequate pump capacity or oil gallery or oilwaydimensions. Blockage or cessation of oil supply.
Inadequate oil film thickness
Characteristics
Fatigue cracking in proximity of a groove.
Causes
Incorrect groove design, e.g. positioning a groove in theloaded area of the bearing.
Bad bonding
Characteristics
Loss of lining, sometimes in large areas, even in lightlyloaded regions, and showing full exposure of the backingmaterial.
Causes
Poor tinning of shells; incorrect metallurgical control oflining technique.
All photographs courtesy of Glacier Metal Co. Ltd
B12 Rolling bearing failures
B12.1
FATIGUE FLAKE
CharacteristicsFlaking with conchoidal or ripplepattern extending evenly across theloaded part of the race.
CausesFatigue due to repeated stressing ofthe metal. This is not a fault condi-tion but it is the form by which arolling element bearing should even-tually fail. The multitude of smalldents are caused by the debris and area secondary effect.
ROLLER STAINING
CharacteristicsDark patches on rolling surfaces andend faces of rollers in bearings withyellow metal cages. The patchesusually conform in shape to the cagebars.
CausesBi-metallic corrosion in storage. Maybe due to poor storage conditions orinsufficient cleaning during manu-facture. Special packings are avail-able for severe conditions. Staining,as shown, can be removed by themanufacturer, to whom the bearingshould be returned.
EARLY FATIGUE FLAKE
CharacteristicsA normal fatigue flake but occurringin a comparatively short time.Appearance as for fatigue flake.
CausesWide life-expectancy of rolling bear-ings. The graph shows approximatedistribution for all types. Unlessrepeated, there is no fault. Ifrepeated, load is probably higherthan estimated; check thermalexpansion and centrifugal loads.
BRUISING (OR TRUEBRINELLING)
CharacteristicsDents or grooves in the bearing trackconforming to the shape of therolling elements. Grinding marks notobliterated and the metal at the edgesof the dents has been slightly raised.
CausesThe rolling elements have beenbrought into violent contact with therace; in this case during assemblyusing impact.
ATMOSPHERIC CORROSION
CharacteristicsNumerous irregular pits, reddishbrown to dark brown in colour. Pitshave rough irregular bottoms.
CausesExposure to moist conditions, use ofa grease giving inadequate protectionagainst water corrosion.
FALSE BRINELLING
CharacteristicsDepressions in the tracks which mayvary from shallow marks to deepcavities. Close inspection reveals thatthe depressions have a roughenedsurface texture and that the grindingmarks have been removed. There isusually no tendency for the metal atthe groove edges to have been dis-placed.
CausesVibration while the bearing is sta-tionary or a small oscillating move-ment while under load.

B12Rolling bearing failures
B12.2
FRACTURED FLANGE
CharacteristicsPieces broken from the inner raceguiding flange. General damage tocage and shields.
CausesBad fitting. The bearing was pressedinto housing by applying load to theinner race causing cracking of theflange. During running the cracksextended and the flange collapsed. Abearing must never be fitted so thatthe fitting load is transmitted via therolling elements.
INNER RACE SPINNING
CharacteristicsSoftening and scoring of the innerrace and the shaft, overheating lead-ing to carbonisation of lubricant insevere cases, may lead to completeseizure.
CausesInner race fitted with too little inter-ference on shaft and with light axialclamping.
OUTER RACE FRETTING
CharacteristicsA patchy discoloration of the outersurface and the presence of reddishbrown debris (‘cocoa’). The race isnot softened but cracks may extendinwards from the fretted zone.
CausesInsufficient interference betweenrace and housing. Particularly notice-able with heavily loaded bearingshaving thin outer races.
SKEW RUNNING MARKS
CharacteristicsThe running marks on the stationaryrace are not parallel to the faces ofthe race. In the figure the outer raceis stationary.
CausesMisalignment. The bearing has notfailed but may do so if allowed tocontinue to run out of line.
INNER RACE FRETTING
CharacteristicsHeavy fretting of the shaft often withgross scalloping; presence of browndebris (‘cocoa’). Inner race may showsome fretting marks.
CausesToo little interference, often slightclearance, between the inner raceand the shaft combined with heavyaxial clamping. Axial clamping alonewill not prevent a heavily loadedinner race precessing slowly on theshaft.
UNEVEN FATIGUE
CharacteristicsNormal fatigue flaking but limited to,or much more severe on, one side ofthe running track.
CausesMisalignment.
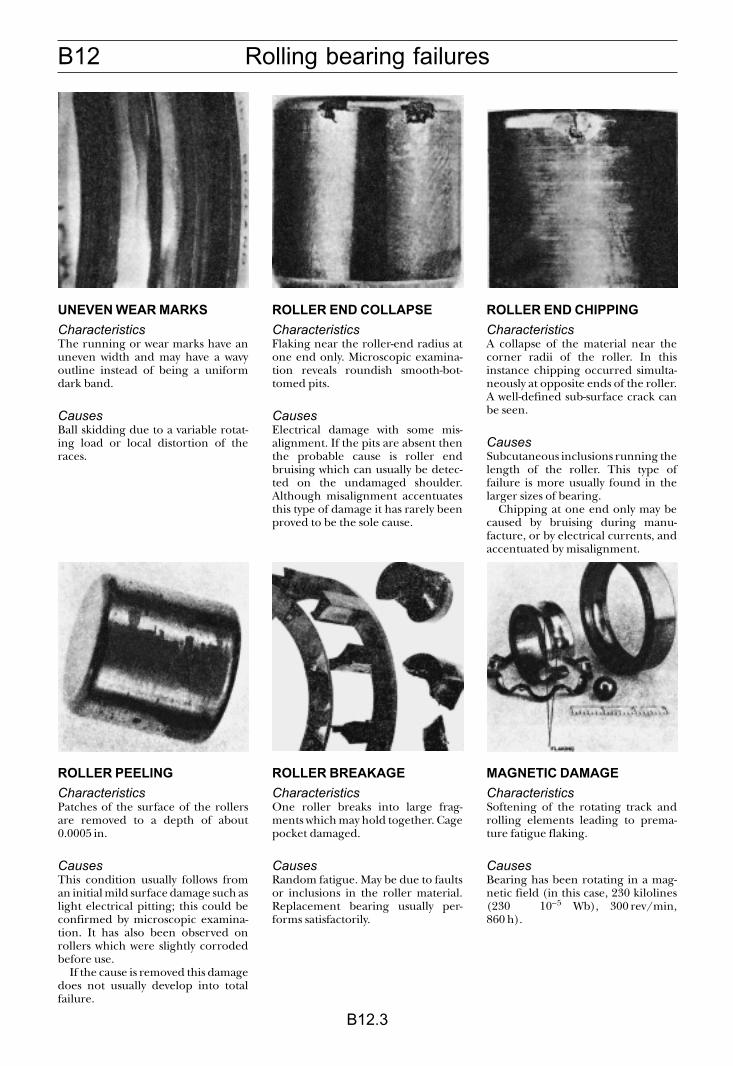
B12 Rolling bearing failures
B12.3
UNEVEN WEAR MARKS
CharacteristicsThe running or wear marks have anuneven width and may have a wavyoutline instead of being a uniformdark band.
CausesBall skidding due to a variable rotat-ing load or local distortion of theraces.
ROLLER PEELING
CharacteristicsPatches of the surface of the rollersare removed to a depth of about0.0005 in.
CausesThis condition usually follows froman initial mild surface damage such aslight electrical pitting; this could beconfirmed by microscopic examina-tion. It has also been observed onrollers which were slightly corrodedbefore use.
If the cause is removed this damagedoes not usually develop into totalfailure.
ROLLER END COLLAPSE
CharacteristicsFlaking near the roller-end radius atone end only. Microscopic examina-tion reveals roundish smooth-bot-tomed pits.
CausesElectrical damage with some mis-alignment. If the pits are absent thenthe probable cause is roller endbruising which can usually be detec-ted on the undamaged shoulder.Although misalignment accentuatesthis type of damage it has rarely beenproved to be the sole cause.
ROLLER BREAKAGE
CharacteristicsOne roller breaks into large frag-ments which may hold together. Cagepocket damaged.
CausesRandom fatigue. May be due to faultsor inclusions in the roller material.Replacement bearing usually per-forms satisfactorily.
ROLLER END CHIPPING
CharacteristicsA collapse of the material near thecorner radii of the roller. In thisinstance chipping occurred simulta-neously at opposite ends of the roller.A well-defined sub-surface crack canbe seen.
CausesSubcutaneous inclusions running thelength of the roller. This type offailure is more usually found in thelarger sizes of bearing.
Chipping at one end only may becaused by bruising during manu-facture, or by electrical currents, andaccentuated by misalignment.
MAGNETIC DAMAGE
CharacteristicsSoftening of the rotating track androlling elements leading to prema-ture fatigue flaking.
CausesBearing has been rotating in a mag-netic field (in this case, 230 kilolines(230 � 10–5 Wb), 300 rev/min,860 h).
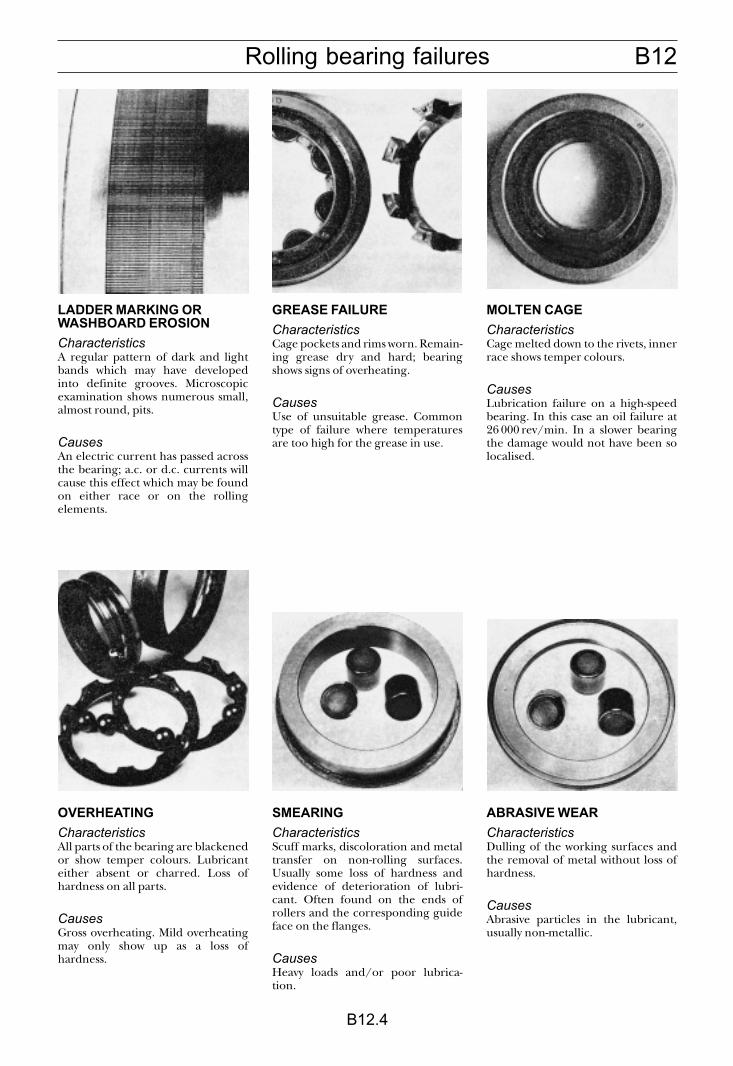
B12Rolling bearing failures
B12.4
LADDER MARKING ORWASHBOARD EROSION
CharacteristicsA regular pattern of dark and lightbands which may have developedinto definite grooves. Microscopicexamination shows numerous small,almost round, pits.
CausesAn electric current has passed acrossthe bearing; a.c. or d.c. currents willcause this effect which may be foundon either race or on the rollingelements.
OVERHEATING
CharacteristicsAll parts of the bearing are blackenedor show temper colours. Lubricanteither absent or charred. Loss ofhardness on all parts.
CausesGross overheating. Mild overheatingmay only show up as a loss ofhardness.
GREASE FAILURE
CharacteristicsCage pockets and rims worn. Remain-ing grease dry and hard; bearingshows signs of overheating.
CausesUse of unsuitable grease. Commontype of failure where temperaturesare too high for the grease in use.
SMEARING
CharacteristicsScuff marks, discoloration and metaltransfer on non-rolling surfaces.Usually some loss of hardness andevidence of deterioration of lubri-cant. Often found on the ends ofrollers and the corresponding guideface on the flanges.
CausesHeavy loads and/or poor lubrica-tion.
MOLTEN CAGE
CharacteristicsCage melted down to the rivets, innerrace shows temper colours.
CausesLubrication failure on a high-speedbearing. In this case an oil failure at26 000 rev/min. In a slower bearingthe damage would not have been solocalised.
ABRASIVE WEAR
CharacteristicsDulling of the working surfaces andthe removal of metal without loss ofhardness.
CausesAbrasive particles in the lubricant,usually non-metallic.
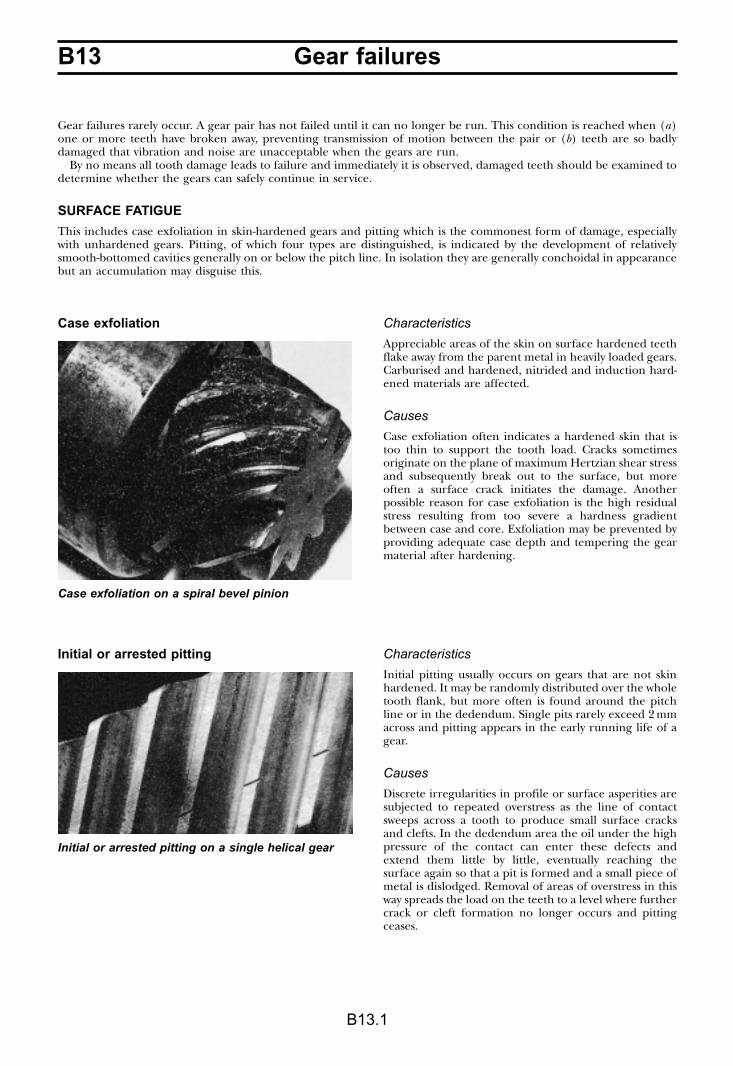
B13 Gear failures
B13.1
Gear failures rarely occur. A gear pair has not failed until it can no longer be run. This condition is reached when (a)one or more teeth have broken away, preventing transmission of motion between the pair or (b) teeth are so badlydamaged that vibration and noise are unacceptable when the gears are run.
By no means all tooth damage leads to failure and immediately it is observed, damaged teeth should be examined todetermine whether the gears can safely continue in service.
SURFACE FATIGUE
This includes case exfoliation in skin-hardened gears and pitting which is the commonest form of damage, especiallywith unhardened gears. Pitting, of which four types are distinguished, is indicated by the development of relativelysmooth-bottomed cavities generally on or below the pitch line. In isolation they are generally conchoidal in appearancebut an accumulation may disguise this.
Case exfoliation Characteristics
Appreciable areas of the skin on surface hardened teethflake away from the parent metal in heavily loaded gears.Carburised and hardened, nitrided and induction hard-ened materials are affected.
Causes
Case exfoliation often indicates a hardened skin that istoo thin to support the tooth load. Cracks sometimesoriginate on the plane of maximum Hertzian shear stressand subsequently break out to the surface, but moreoften a surface crack initiates the damage. Anotherpossible reason for case exfoliation is the high residualstress resulting from too severe a hardness gradientbetween case and core. Exfoliation may be prevented byproviding adequate case depth and tempering the gearmaterial after hardening.
Initial or arrested pitting Characteristics
Initial pitting usually occurs on gears that are not skinhardened. It may be randomly distributed over the wholetooth flank, but more often is found around the pitchline or in the dedendum. Single pits rarely exceed 2 mmacross and pitting appears in the early running life of agear.
Causes
Discrete irregularities in profile or surface asperities aresubjected to repeated overstress as the line of contactsweeps across a tooth to produce small surface cracksand clefts. In the dedendum area the oil under the highpressure of the contact can enter these defects andextend them little by little, eventually reaching thesurface again so that a pit is formed and a small piece ofmetal is dislodged. Removal of areas of overstress in thisway spreads the load on the teeth to a level where furthercrack or cleft formation no longer occurs and pittingceases.
Case exfoliation on a spiral bevel pinion
Initial or arrested pitting on a single helical gear
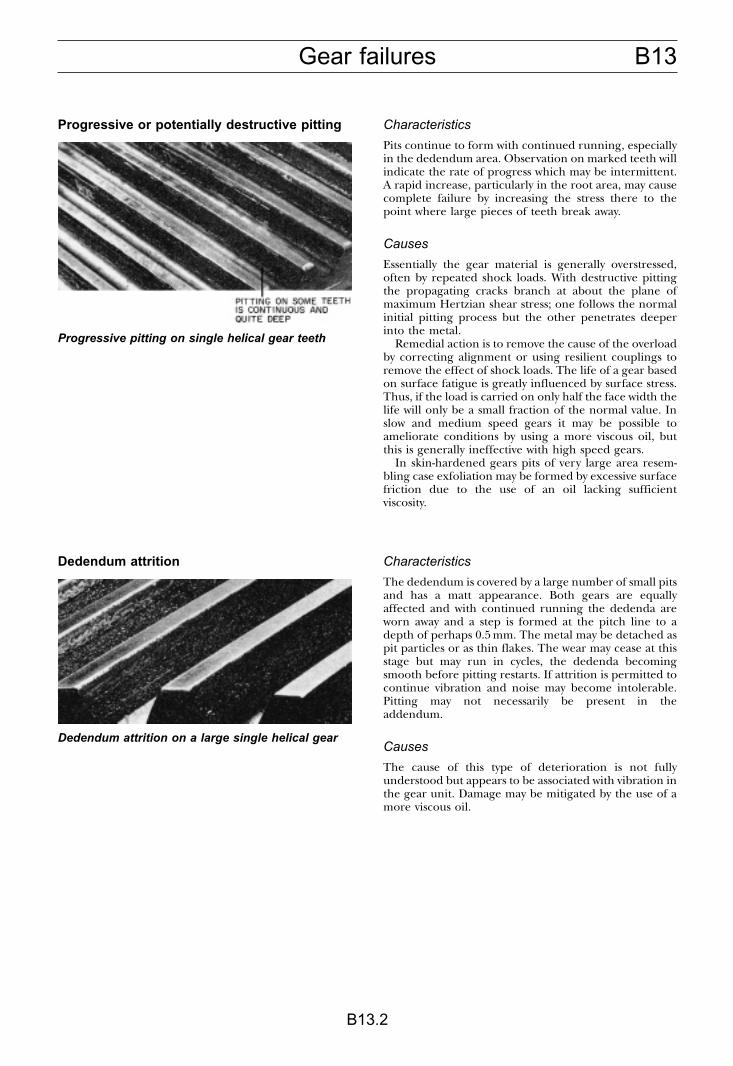
B13Gear failures
B13.2
Progressive or potentially destructive pitting Characteristics
Pits continue to form with continued running, especiallyin the dedendum area. Observation on marked teeth willindicate the rate of progress which may be intermittent.A rapid increase, particularly in the root area, may causecomplete failure by increasing the stress there to thepoint where large pieces of teeth break away.
Causes
Essentially the gear material is generally overstressed,often by repeated shock loads. With destructive pittingthe propagating cracks branch at about the plane ofmaximum Hertzian shear stress; one follows the normalinitial pitting process but the other penetrates deeperinto the metal.
Remedial action is to remove the cause of the overloadby correcting alignment or using resilient couplings toremove the effect of shock loads. The life of a gear basedon surface fatigue is greatly influenced by surface stress.Thus, if the load is carried on only half the face width thelife will only be a small fraction of the normal value. Inslow and medium speed gears it may be possible toameliorate conditions by using a more viscous oil, butthis is generally ineffective with high speed gears.
In skin-hardened gears pits of very large area resem-bling case exfoliation may be formed by excessive surfacefriction due to the use of an oil lacking sufficientviscosity.
Dedendum attrition Characteristics
The dedendum is covered by a large number of small pitsand has a matt appearance. Both gears are equallyaffected and with continued running the dedenda areworn away and a step is formed at the pitch line to adepth of perhaps 0.5 mm. The metal may be detached aspit particles or as thin flakes. The wear may cease at thisstage but may run in cycles, the dedenda becomingsmooth before pitting restarts. If attrition is permitted tocontinue vibration and noise may become intolerable.Pitting may not necessarily be present in theaddendum.
Causes
The cause of this type of deterioration is not fullyunderstood but appears to be associated with vibration inthe gear unit. Damage may be mitigated by the use of amore viscous oil.
Progressive pitting on single helical gear teeth
Dedendum attrition on a large single helical gear
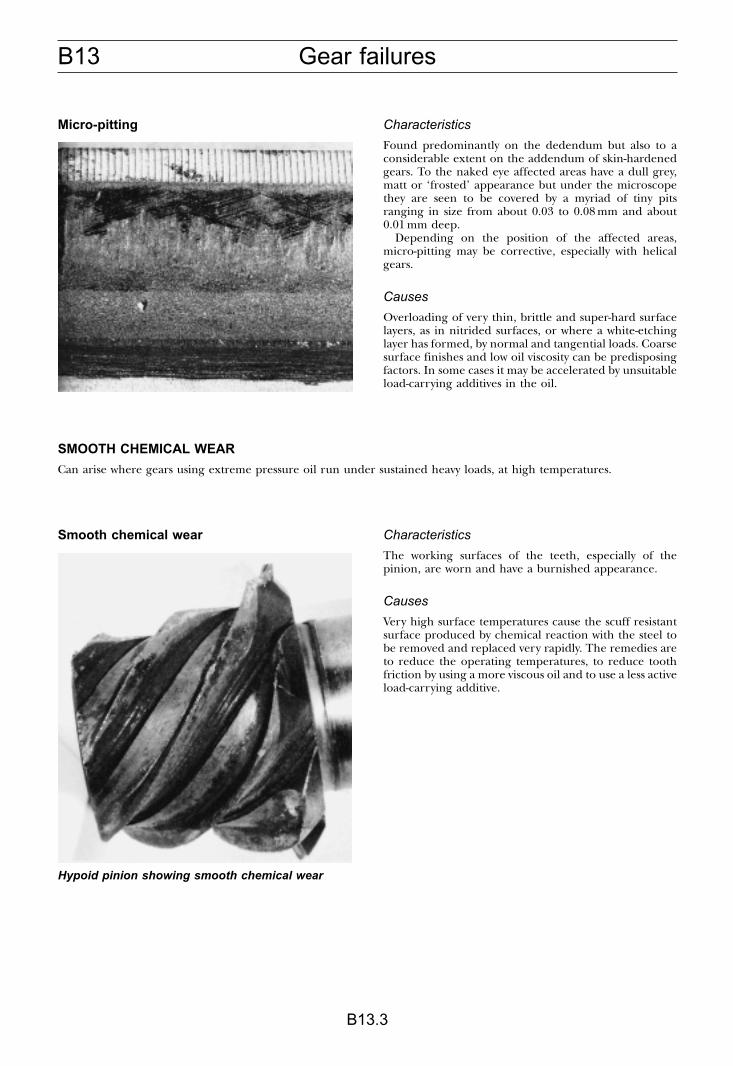
B13 Gear failures
B13.3
Micro-pitting Characteristics
Found predominantly on the dedendum but also to aconsiderable extent on the addendum of skin-hardenedgears. To the naked eye affected areas have a dull grey,matt or ‘frosted’ appearance but under the microscopethey are seen to be covered by a myriad of tiny pitsranging in size from about 0.03 to 0.08 mm and about0.01 mm deep.
Depending on the position of the affected areas,micro-pitting may be corrective, especially with helicalgears.
Causes
Overloading of very thin, brittle and super-hard surfacelayers, as in nitrided surfaces, or where a white-etchinglayer has formed, by normal and tangential loads. Coarsesurface finishes and low oil viscosity can be predisposingfactors. In some cases it may be accelerated by unsuitableload-carrying additives in the oil.
SMOOTH CHEMICAL WEAR
Can arise where gears using extreme pressure oil run under sustained heavy loads, at high temperatures.
Smooth chemical wear Characteristics
The working surfaces of the teeth, especially of thepinion, are worn and have a burnished appearance.
Causes
Very high surface temperatures cause the scuff resistantsurface produced by chemical reaction with the steel tobe removed and replaced very rapidly. The remedies areto reduce the operating temperatures, to reduce toothfriction by using a more viscous oil and to use a less activeload-carrying additive.
Hypoid pinion showing smooth chemical wear

B13Gear failures
B13.4
SCUFFING
Scuffing occurs at peripheral speeds above about 3 m/s and is the result of either the complete absence of a lubricantfilm or its disruption by overheating. Damage may range from a lightly etched appearance (slight scuffing) to severewelding and tearing of engaging teeth (heavy scuffing). Scuffing can lead to complete destruction if not arrested.
Light scuffing Characteristics
Tooth surfaces affected appear dull and slightly rough incomparison with unaffected areas. Low magnification ofa scuffed zone reveals small welded areas subsequentlytorn apart in the direction of sliding, usually at the tipand root of the engaging teeth where sliding speed is amaximum.
Causes
Disruption of the lubricant film occurs when the geartooth surfaces reach a critical temperature associatedwith a particular oil and direct contact between thesliding surfaces permits discrete welding to take place.Low viscosity plain oils are more liable to permit scuffingthan oils of higher viscosity. Extreme pressure oils almostalways prevent it.
Heavy scuffing Characteristics
Tooth surfaces are severely roughened and torn as theresult of unchecked adhesive wear.
Causes
This is the result of maintaining the conditions thatproduced light scuffing. The temperature of the contact-ing surfaces rises so far above the critical temperature forthe lubricant that continual welding and tearing of thegear material persists.
Spur, helical and bevel gears, may show so muchdisplacement of the metal that a groove is formed alongthe pitch line of the driving gear and a correspondingridge on that of the driven gear. It may be due to thecomplete absence of lubricant, even if only temporarily.Otherwise, the use of a more viscous oil, or one withextreme pressure properties is called for.
GENERAL COMMENTS ON GEAR TOOTHDAMAGE
Contact marking is the acceptance criterion for alltoothed gearing, and periodic examination of thisfeature until the running pattern has been established, isthe most satisfactory method of determining serviceperformance. It is therefore advisable to look at thetooth surfaces on a gear pair soon after it has been rununder normal working conditions. If any surface damageis found it is essential that the probable cause is
recognised quickly and remedial action taken if neces-sary, before serious damage has resulted. Finding theprincipal cause may be more difficult when more thanone form of damage is present, but it is usually possibleto consider each characteristic separately.
The most prolific sources of trouble are faulty lubrica-tion and misalignment. Both can be corrected if present,but unless scuffing has occurred, further periodicobservation of any damaged tooth surfaces should bemade before taking action which may not be imme-diately necessary.
Light scuffing
Heavy scuffing on a case hardened hypoid wheel
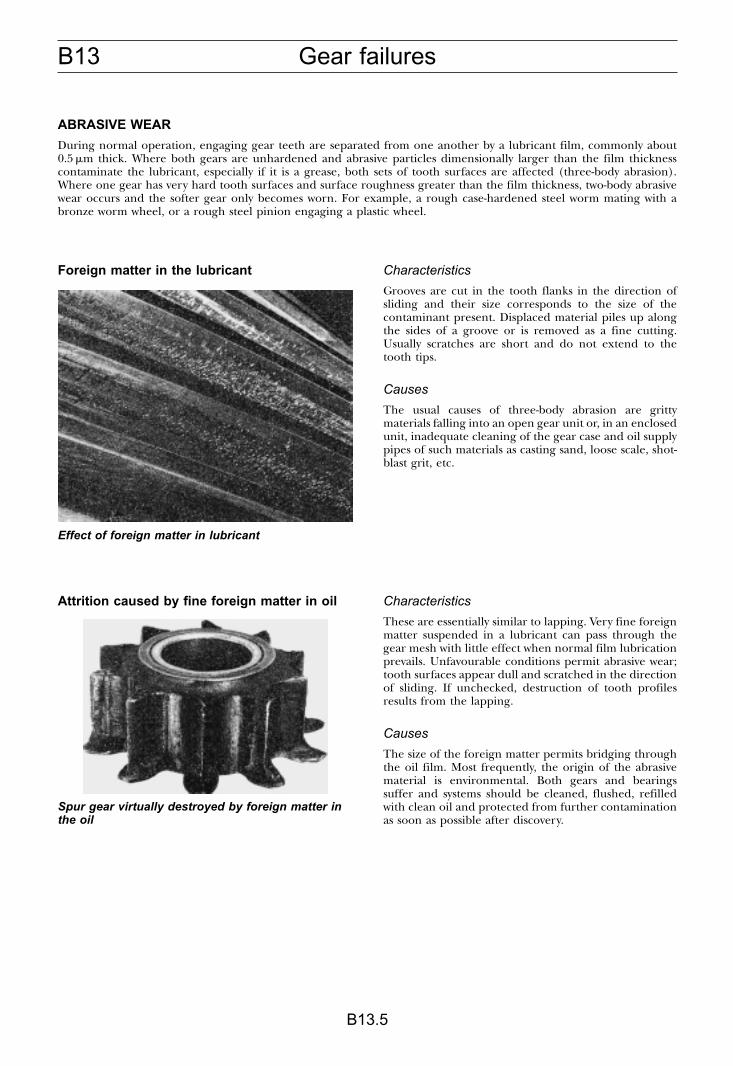
B13 Gear failures
B13.5
ABRASIVE WEAR
During normal operation, engaging gear teeth are separated from one another by a lubricant film, commonly about0.5 �m thick. Where both gears are unhardened and abrasive particles dimensionally larger than the film thicknesscontaminate the lubricant, especially if it is a grease, both sets of tooth surfaces are affected (three-body abrasion).Where one gear has very hard tooth surfaces and surface roughness greater than the film thickness, two-body abrasivewear occurs and the softer gear only becomes worn. For example, a rough case-hardened steel worm mating with abronze worm wheel, or a rough steel pinion engaging a plastic wheel.
Foreign matter in the lubricant Characteristics
Grooves are cut in the tooth flanks in the direction ofsliding and their size corresponds to the size of thecontaminant present. Displaced material piles up alongthe sides of a groove or is removed as a fine cutting.Usually scratches are short and do not extend to thetooth tips.
Causes
The usual causes of three-body abrasion are grittymaterials falling into an open gear unit or, in an enclosedunit, inadequate cleaning of the gear case and oil supplypipes of such materials as casting sand, loose scale, shot-blast grit, etc.
Attrition caused by fine foreign matter in oil Characteristics
These are essentially similar to lapping. Very fine foreignmatter suspended in a lubricant can pass through thegear mesh with little effect when normal film lubricationprevails. Unfavourable conditions permit abrasive wear;tooth surfaces appear dull and scratched in the directionof sliding. If unchecked, destruction of tooth profilesresults from the lapping.
Causes
The size of the foreign matter permits bridging throughthe oil film. Most frequently, the origin of the abrasivematerial is environmental. Both gears and bearingssuffer and systems should be cleaned, flushed, refilledwith clean oil and protected from further contaminationas soon as possible after discovery.
Effect of foreign matter in lubricant
Spur gear virtually destroyed by foreign matter inthe oil
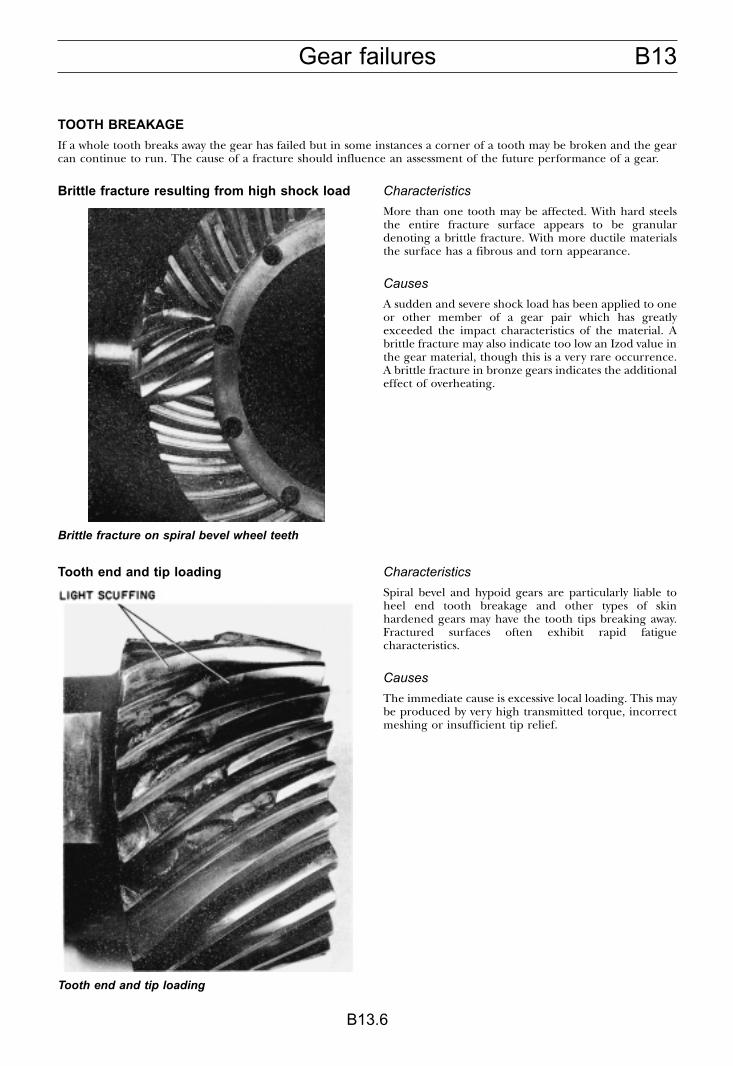
B13Gear failures
B13.6
TOOTH BREAKAGE
If a whole tooth breaks away the gear has failed but in some instances a corner of a tooth may be broken and the gearcan continue to run. The cause of a fracture should influence an assessment of the future performance of a gear.
Brittle fracture resulting from high shock load Characteristics
More than one tooth may be affected. With hard steelsthe entire fracture surface appears to be granulardenoting a brittle fracture. With more ductile materialsthe surface has a fibrous and torn appearance.
Causes
A sudden and severe shock load has been applied to oneor other member of a gear pair which has greatlyexceeded the impact characteristics of the material. Abrittle fracture may also indicate too low an Izod value inthe gear material, though this is a very rare occurrence.A brittle fracture in bronze gears indicates the additionaleffect of overheating.
Tooth end and tip loading Characteristics
Spiral bevel and hypoid gears are particularly liable toheel end tooth breakage and other types of skinhardened gears may have the tooth tips breaking away.Fractured surfaces often exhibit rapid fatiguecharacteristics.
Causes
The immediate cause is excessive local loading. This maybe produced by very high transmitted torque, incorrectmeshing or insufficient tip relief.
Brittle fracture on spiral bevel wheel teeth
Tooth end and tip loading
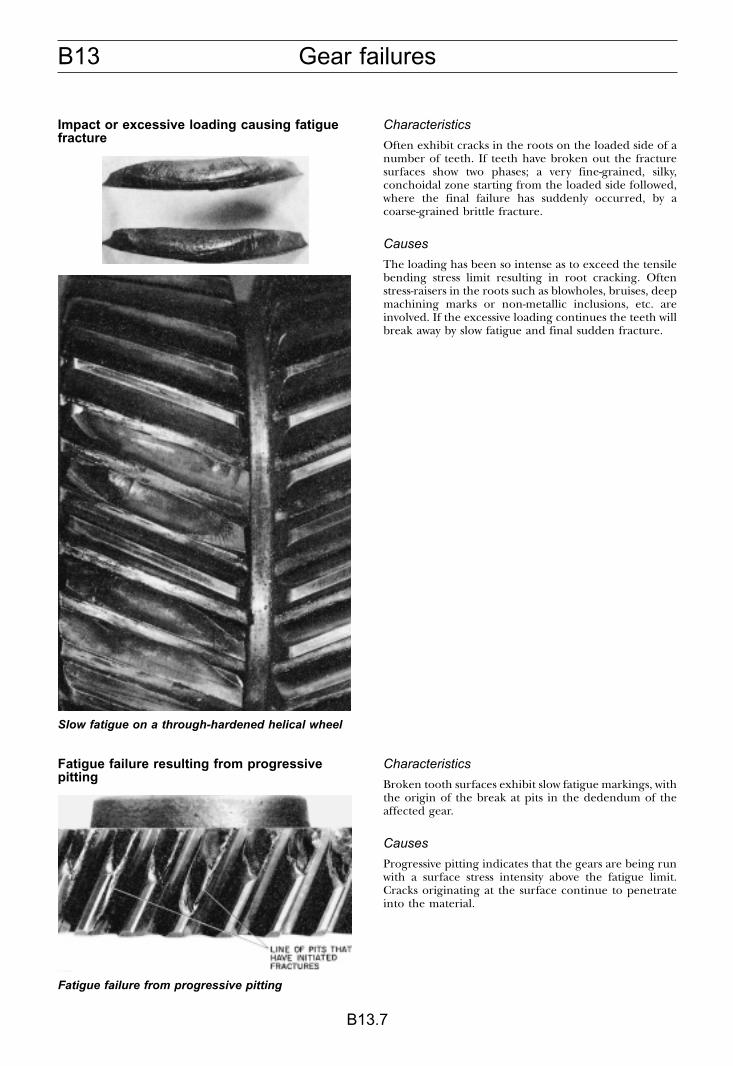
B13 Gear failures
B13.7
Impact or excessive loading causing fatiguefracture
Characteristics
Often exhibit cracks in the roots on the loaded side of anumber of teeth. If teeth have broken out the fracturesurfaces show two phases; a very fine-grained, silky,conchoidal zone starting from the loaded side followed,where the final failure has suddenly occurred, by acoarse-grained brittle fracture.
Causes
The loading has been so intense as to exceed the tensilebending stress limit resulting in root cracking. Oftenstress-raisers in the roots such as blowholes, bruises, deepmachining marks or non-metallic inclusions, etc. areinvolved. If the excessive loading continues the teeth willbreak away by slow fatigue and final sudden fracture.
Fatigue failure resulting from progressivepitting
Characteristics
Broken tooth surfaces exhibit slow fatigue markings, withthe origin of the break at pits in the dedendum of theaffected gear.
Causes
Progressive pitting indicates that the gears are being runwith a surface stress intensity above the fatigue limit.Cracks originating at the surface continue to penetrateinto the material.
Slow fatigue on a through-hardened helical wheel
Fatigue failure from progressive pitting
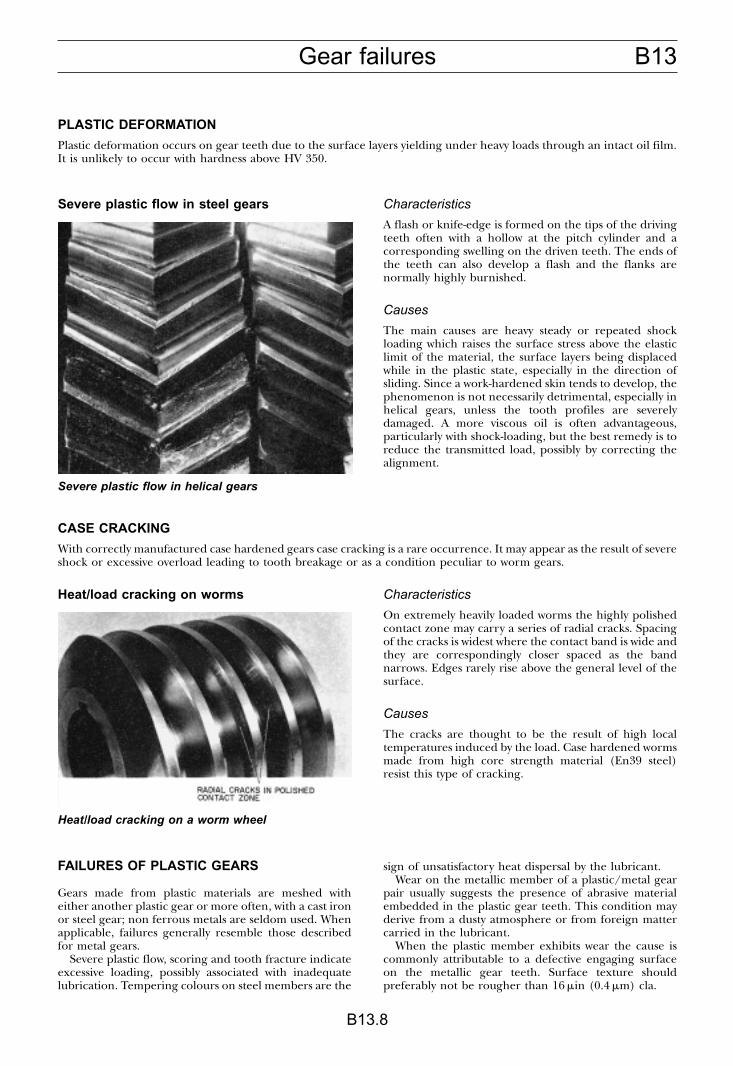
B13Gear failures
B13.8
PLASTIC DEFORMATION
Plastic deformation occurs on gear teeth due to the surface layers yielding under heavy loads through an intact oil film.It is unlikely to occur with hardness above HV 350.
Severe plastic flow in steel gears Characteristics
A flash or knife-edge is formed on the tips of the drivingteeth often with a hollow at the pitch cylinder and acorresponding swelling on the driven teeth. The ends ofthe teeth can also develop a flash and the flanks arenormally highly burnished.
Causes
The main causes are heavy steady or repeated shockloading which raises the surface stress above the elasticlimit of the material, the surface layers being displacedwhile in the plastic state, especially in the direction ofsliding. Since a work-hardened skin tends to develop, thephenomenon is not necessarily detrimental, especially inhelical gears, unless the tooth profiles are severelydamaged. A more viscous oil is often advantageous,particularly with shock-loading, but the best remedy is toreduce the transmitted load, possibly by correcting thealignment.
CASE CRACKING
With correctly manufactured case hardened gears case cracking is a rare occurrence. It may appear as the result of severeshock or excessive overload leading to tooth breakage or as a condition peculiar to worm gears.
Heat/load cracking on worms Characteristics
On extremely heavily loaded worms the highly polishedcontact zone may carry a series of radial cracks. Spacingof the cracks is widest where the contact band is wide andthey are correspondingly closer spaced as the bandnarrows. Edges rarely rise above the general level of thesurface.
Causes
The cracks are thought to be the result of high localtemperatures induced by the load. Case hardened wormsmade from high core strength material (En39 steel)resist this type of cracking.
FAILURES OF PLASTIC GEARS
Gears made from plastic materials are meshed witheither another plastic gear or more often, with a cast ironor steel gear; non ferrous metals are seldom used. Whenapplicable, failures generally resemble those describedfor metal gears.
Severe plastic flow, scoring and tooth fracture indicateexcessive loading, possibly associated with inadequatelubrication. Tempering colours on steel members are the
sign of unsatisfactory heat dispersal by the lubricant.Wear on the metallic member of a plastic/metal gear
pair usually suggests the presence of abrasive materialembedded in the plastic gear teeth. This condition mayderive from a dusty atmosphere or from foreign mattercarried in the lubricant.
When the plastic member exhibits wear the cause iscommonly attributable to a defective engaging surfaceon the metallic gear teeth. Surface texture shouldpreferably not be rougher than 16 �in (0.4 �m) cla.
Severe plastic flow in helical gears
Heat/load cracking on a worm wheel
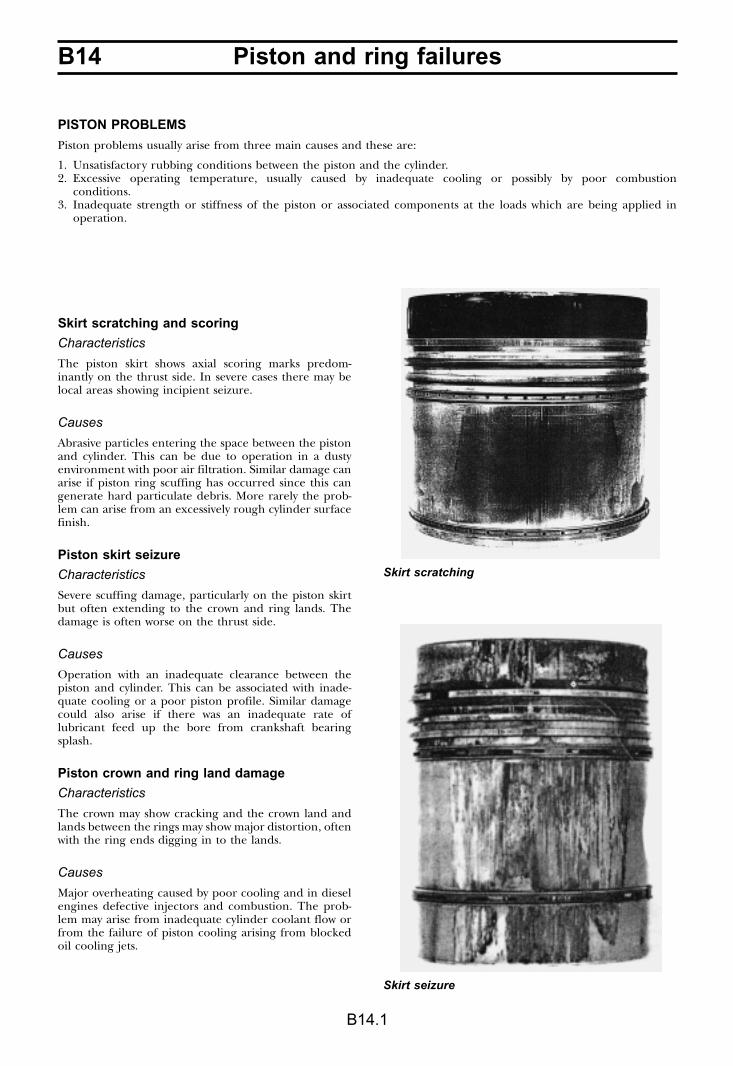
B14 Piston and ring failures
B14.1
PISTON PROBLEMS
Piston problems usually arise from three main causes and these are:
1. Unsatisfactory rubbing conditions between the piston and the cylinder.2. Excessive operating temperature, usually caused by inadequate cooling or possibly by poor combustion
conditions.3. Inadequate strength or stiffness of the piston or associated components at the loads which are being applied in
operation.
Skirt scratching and scoring
Characteristics
The piston skirt shows axial scoring marks predom-inantly on the thrust side. In severe cases there may belocal areas showing incipient seizure.
Causes
Abrasive particles entering the space between the pistonand cylinder. This can be due to operation in a dustyenvironment with poor air filtration. Similar damage canarise if piston ring scuffing has occurred since this cangenerate hard particulate debris. More rarely the prob-lem can arise from an excessively rough cylinder surfacefinish.
Piston skirt seizure
Characteristics
Severe scuffing damage, particularly on the piston skirtbut often extending to the crown and ring lands. Thedamage is often worse on the thrust side.
Causes
Operation with an inadequate clearance between thepiston and cylinder. This can be associated with inade-quate cooling or a poor piston profile. Similar damagecould also arise if there was an inadequate rate oflubricant feed up the bore from crankshaft bearingsplash.
Piston crown and ring land damage
Characteristics
The crown may show cracking and the crown land andlands between the rings may show major distortion, oftenwith the ring ends digging in to the lands.
Causes
Major overheating caused by poor cooling and in dieselengines defective injectors and combustion. The prob-lem may arise from inadequate cylinder coolant flow orfrom the failure of piston cooling arising from blockedoil cooling jets.
Skirt scratching
Skirt seizure

B14Piston and ring failures
B14.2
Misaligned pistons
Characteristics
The bedding on the skirt is not purely axial but showsdiagonal bedding.
Causes
Crankshaft deflections or connecting rod bending.Misalignment of rod or gudgeon pin bores.
Cracking inside the piston
Characteristics
Cracks near the gudgeon pin bosses and behind the ringgrooves.
Causes
Inadequate gudgeon pin stiffness can cause cracking inadjacent parts of the piston, or parts of the piston crosssection may be of inadequate area.
RING PROBLEMS
The most common problem with piston rings is scuffing of their running surfaces. Slight local scuffing is not uncommonin the first 20 to 50 hours of running from new when the rings are bedding in to an appropriate operating profile.However the condition of the ring surfaces should progressively improve and scuffing damage should not spread allround the rings.
Scuffing of cast iron rings
Characteristics
Local zones around the ring surface where there areaxial dragging marks and associated surface roughening.Detailed examination often shows thin surface layers ofmaterial with a hardness exceeding 1000 Hv and com-posed of non-etching fine grained martensite (whitelayer).
Causes
Can arise from an unsuitable initial finish on the cylindersurface. It can also arise if the rings tend to bed at the topof their running surface due to unsuitable profiling orfrom thermal distortion of the piston.
Diagonal skirt bedding
Scuffed cast iron rings
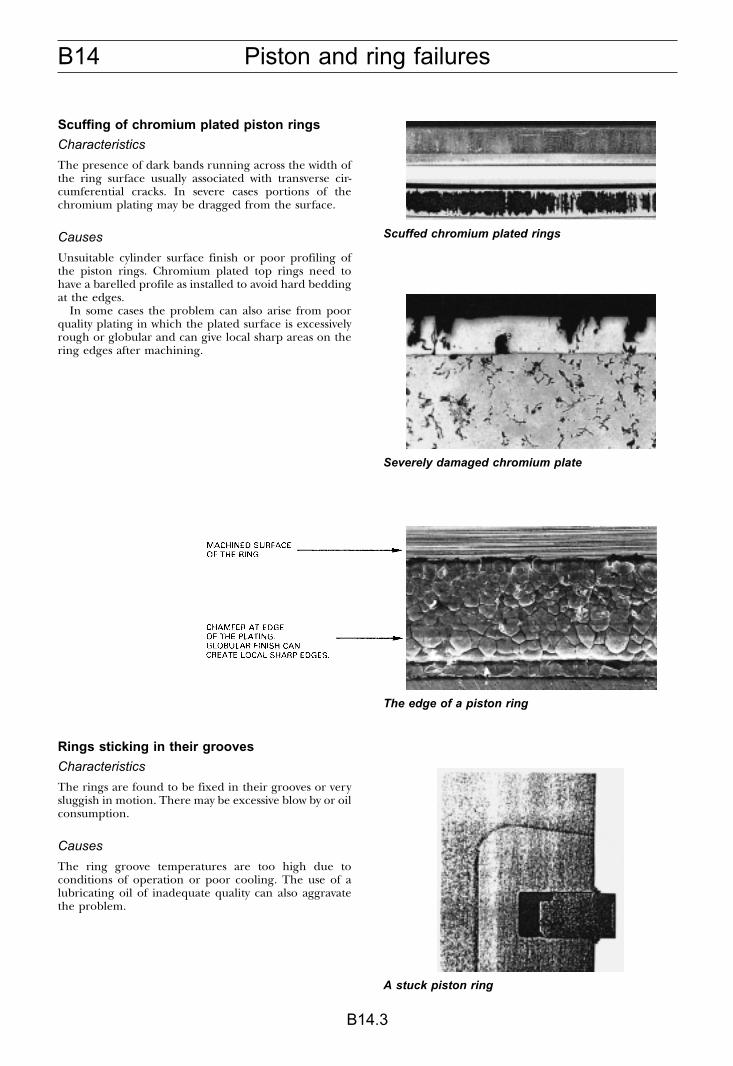
B14 Piston and ring failures
B14.3
Scuffing of chromium plated piston rings
Characteristics
The presence of dark bands running across the width ofthe ring surface usually associated with transverse cir-cumferential cracks. In severe cases portions of thechromium plating may be dragged from the surface.
Causes
Unsuitable cylinder surface finish or poor profiling ofthe piston rings. Chromium plated top rings need tohave a barelled profile as installed to avoid hard beddingat the edges.
In some cases the problem can also arise from poorquality plating in which the plated surface is excessivelyrough or globular and can give local sharp areas on thering edges after machining.
Rings sticking in their grooves
Characteristics
The rings are found to be fixed in their grooves or verysluggish in motion. There may be excessive blow by or oilconsumption.
Causes
The ring groove temperatures are too high due toconditions of operation or poor cooling. The use of alubricating oil of inadequate quality can also aggravatethe problem.
Scuffed chromium plated rings
Severely damaged chromium plate
The edge of a piston ring
A stuck piston ring
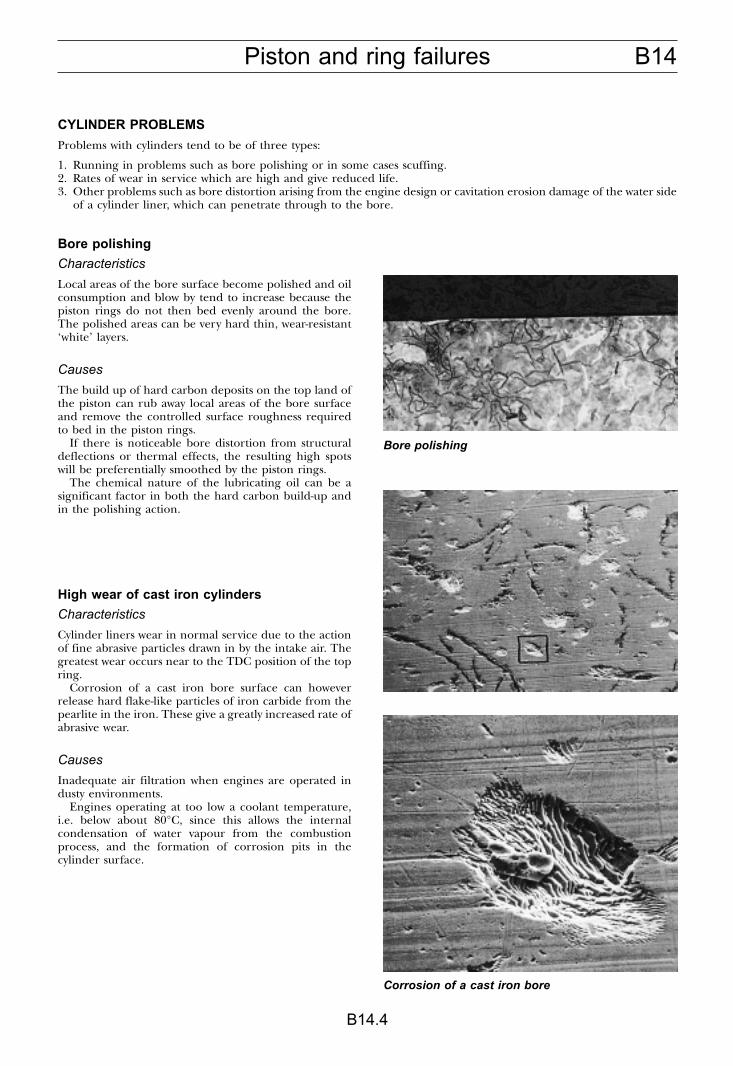
B14Piston and ring failures
B14.4
CYLINDER PROBLEMS
Problems with cylinders tend to be of three types:
1. Running in problems such as bore polishing or in some cases scuffing.2. Rates of wear in service which are high and give reduced life.3. Other problems such as bore distortion arising from the engine design or cavitation erosion damage of the water side
of a cylinder liner, which can penetrate through to the bore.
Bore polishing
Characteristics
Local areas of the bore surface become polished and oilconsumption and blow by tend to increase because thepiston rings do not then bed evenly around the bore.The polished areas can be very hard thin, wear-resistant‘white’ layers.
Causes
The build up of hard carbon deposits on the top land ofthe piston can rub away local areas of the bore surfaceand remove the controlled surface roughness requiredto bed in the piston rings.
If there is noticeable bore distortion from structuraldeflections or thermal effects, the resulting high spotswill be preferentially smoothed by the piston rings.
The chemical nature of the lubricating oil can be asignificant factor in both the hard carbon build-up andin the polishing action.
High wear of cast iron cylinders
Characteristics
Cylinder liners wear in normal service due to the actionof fine abrasive particles drawn in by the intake air. Thegreatest wear occurs near to the TDC position of the topring.
Corrosion of a cast iron bore surface can howeverrelease hard flake-like particles of iron carbide from thepearlite in the iron. These give a greatly increased rate ofabrasive wear.
Causes
Inadequate air filtration when engines are operated industy environments.
Engines operating at too low a coolant temperature,i.e. below about 80°C, since this allows the internalcondensation of water vapour from the combustionprocess, and the formation of corrosion pits in thecylinder surface.
Bore polishing
Corrosion of a cast iron bore
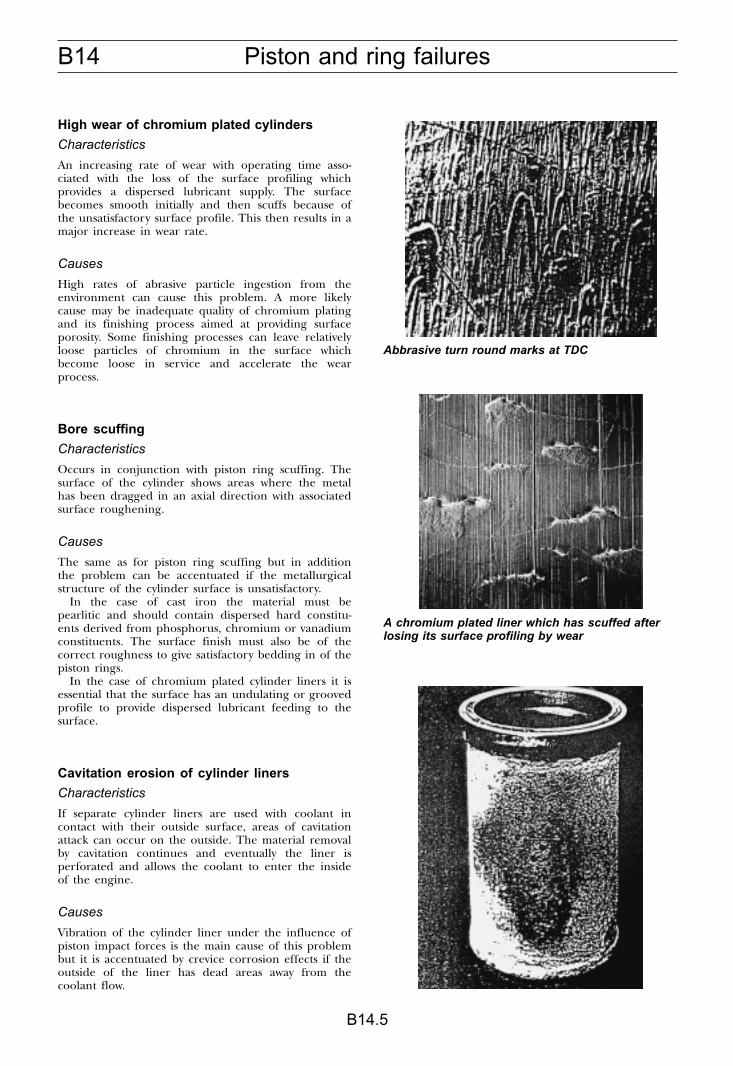
B14 Piston and ring failures
B14.5
High wear of chromium plated cylinders
Characteristics
An increasing rate of wear with operating time asso-ciated with the loss of the surface profiling whichprovides a dispersed lubricant supply. The surfacebecomes smooth initially and then scuffs because ofthe unsatisfactory surface profile. This then results in amajor increase in wear rate.
Causes
High rates of abrasive particle ingestion from theenvironment can cause this problem. A more likelycause may be inadequate quality of chromium platingand its finishing process aimed at providing surfaceporosity. Some finishing processes can leave relativelyloose particles of chromium in the surface whichbecome loose in service and accelerate the wearprocess.
Bore scuffing
Characteristics
Occurs in conjunction with piston ring scuffing. Thesurface of the cylinder shows areas where the metalhas been dragged in an axial direction with associatedsurface roughening.
Causes
The same as for piston ring scuffing but in additionthe problem can be accentuated if the metallurgicalstructure of the cylinder surface is unsatisfactory.
In the case of cast iron the material must bepearlitic and should contain dispersed hard constitu-ents derived from phosphorus, chromium or vanadiumconstituents. The surface finish must also be of thecorrect roughness to give satisfactory bedding in of thepiston rings.
In the case of chromium plated cylinder liners it isessential that the surface has an undulating or groovedprofile to provide dispersed lubricant feeding to thesurface.
Cavitation erosion of cylinder liners
Characteristics
If separate cylinder liners are used with coolant incontact with their outside surface, areas of cavitationattack can occur on the outside. The material removalby cavitation continues and eventually the liner isperforated and allows the coolant to enter the insideof the engine.
Causes
Vibration of the cylinder liner under the influence ofpiston impact forces is the main cause of this problembut it is accentuated by crevice corrosion effects if theoutside of the liner has dead areas away from thecoolant flow.
Abbrasive turn round marks at TDC
A chromium plated liner which has scuffed afterlosing its surface profiling by wear
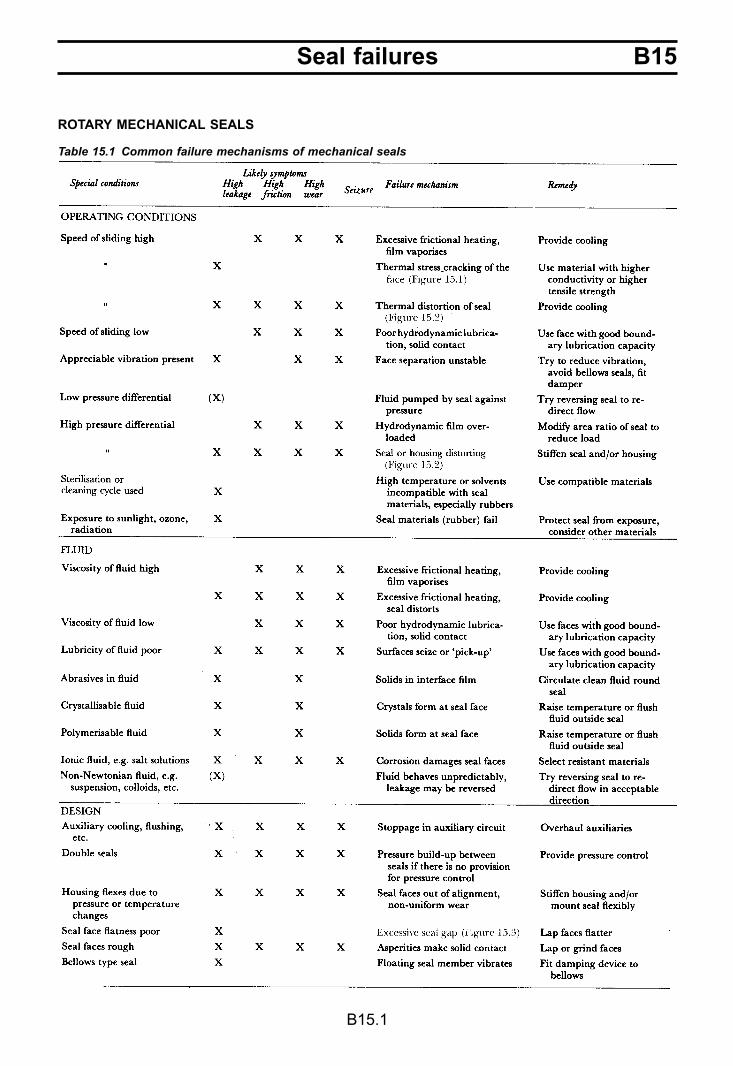
B15Seal failures
B15.1
ROTARY MECHANICAL SEALS
Table 15.1 Common failure mechanisms of mechanical seals
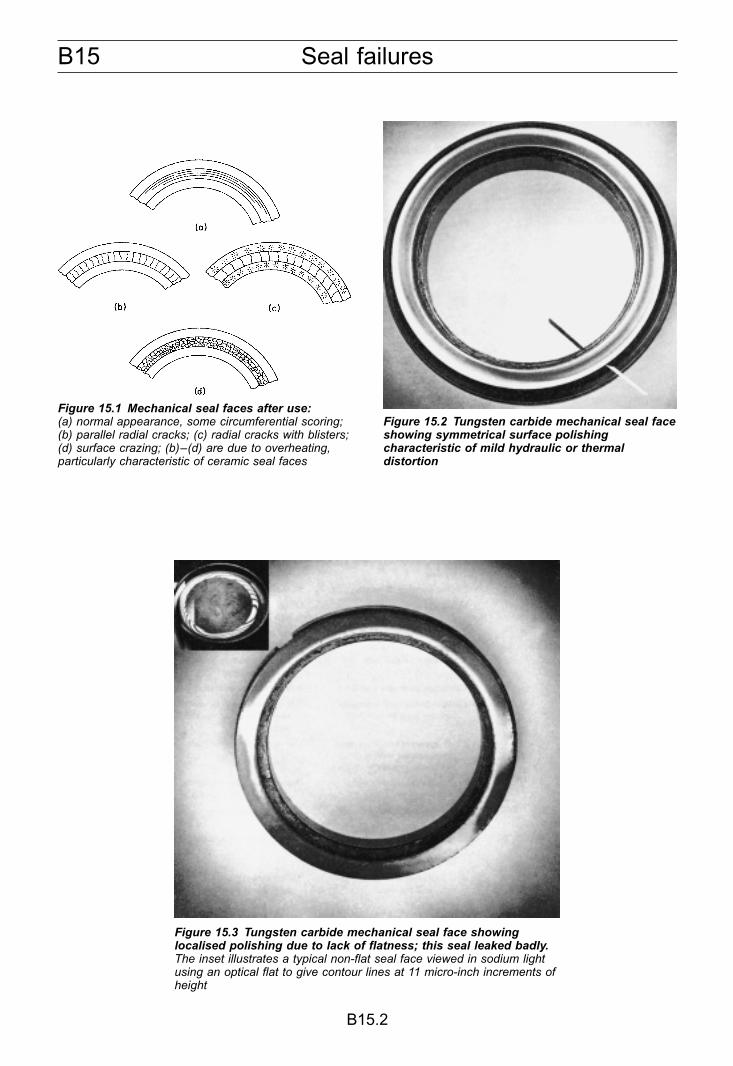
B15 Seal failures
B15.2
Figure 15.1 Mechanical seal faces after use:(a) normal appearance, some circumferential scoring;(b) parallel radial cracks; (c) radial cracks with blisters;(d) surface crazing; (b)–(d) are due to overheating,particularly characteristic of ceramic seal faces
Figure 15.2 Tungsten carbide mechanical seal faceshowing symmetrical surface polishingcharacteristic of mild hydraulic or thermaldistortion
Figure 15.3 Tungsten carbide mechanical seal face showinglocalised polishing due to lack of flatness; this seal leaked badly.The inset illustrates a typical non-flat seal face viewed in sodium lightusing an optical flat to give contour lines at 11 micro-inch increments ofheight
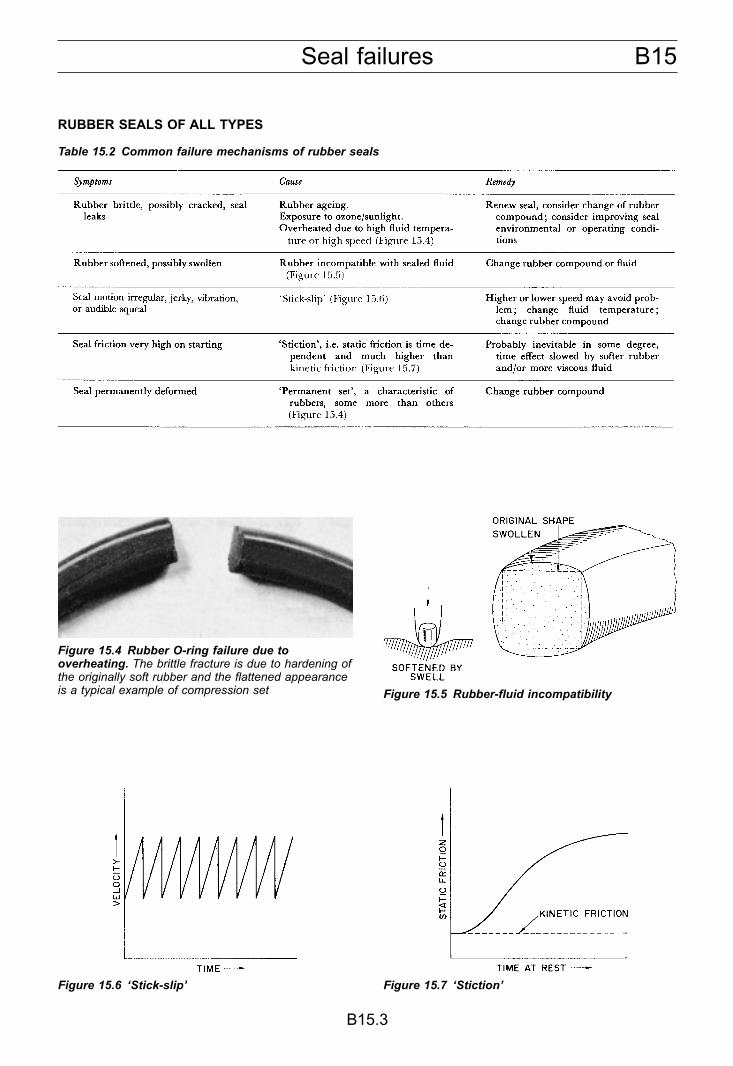
B15Seal failures
B15.3
RUBBER SEALS OF ALL TYPES
Table 15.2 Common failure mechanisms of rubber seals
Figure 15.4 Rubber O-ring failure due tooverheating. The brittle fracture is due to hardening ofthe originally soft rubber and the flattened appearanceis a typical example of compression set Figure 15.5 Rubber-fluid incompatibility
Figure 15.6 ‘Stick-slip’ Figure 15.7 ‘Stiction’
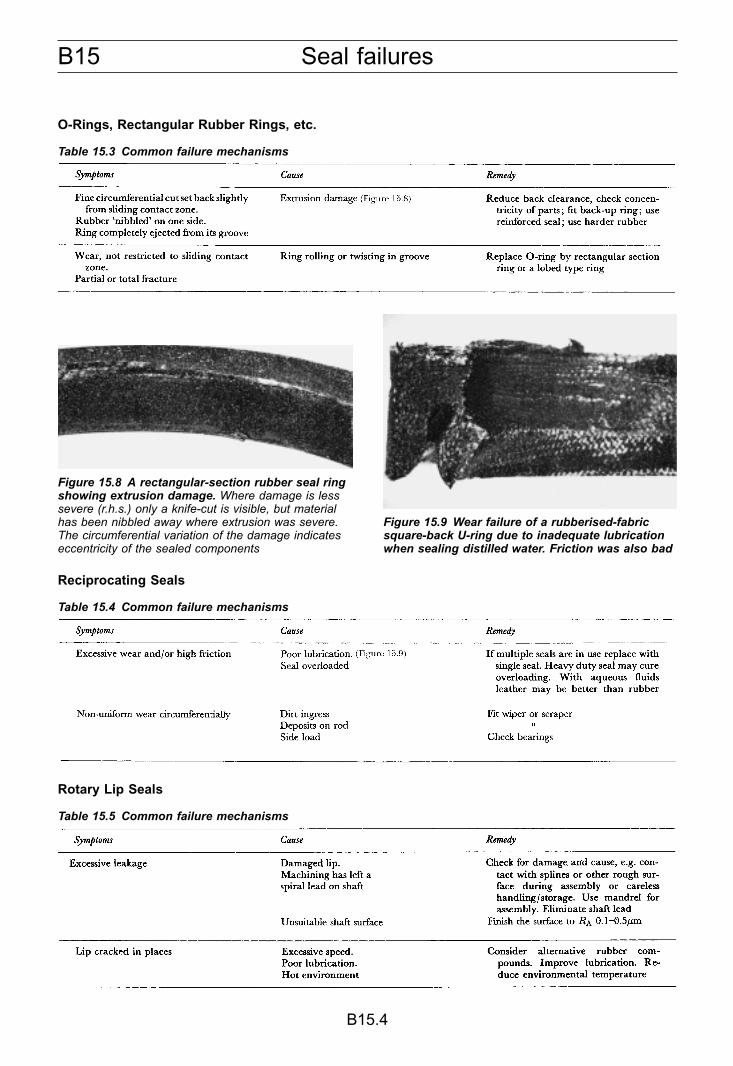
B15 Seal failures
B15.4
O-Rings, Rectangular Rubber Rings, etc.
Reciprocating Seals
Rotary Lip Seals
Table 15.3 Common failure mechanisms
Figure 15.8 A rectangular-section rubber seal ringshowing extrusion damage. Where damage is lesssevere (r.h.s.) only a knife-cut is visible, but materialhas been nibbled away where extrusion was severe.The circumferential variation of the damage indicateseccentricity of the sealed components
Figure 15.9 Wear failure of a rubberised-fabricsquare-back U-ring due to inadequate lubricationwhen sealing distilled water. Friction was also bad
Table 15.4 Common failure mechanisms
Table 15.5 Common failure mechanisms
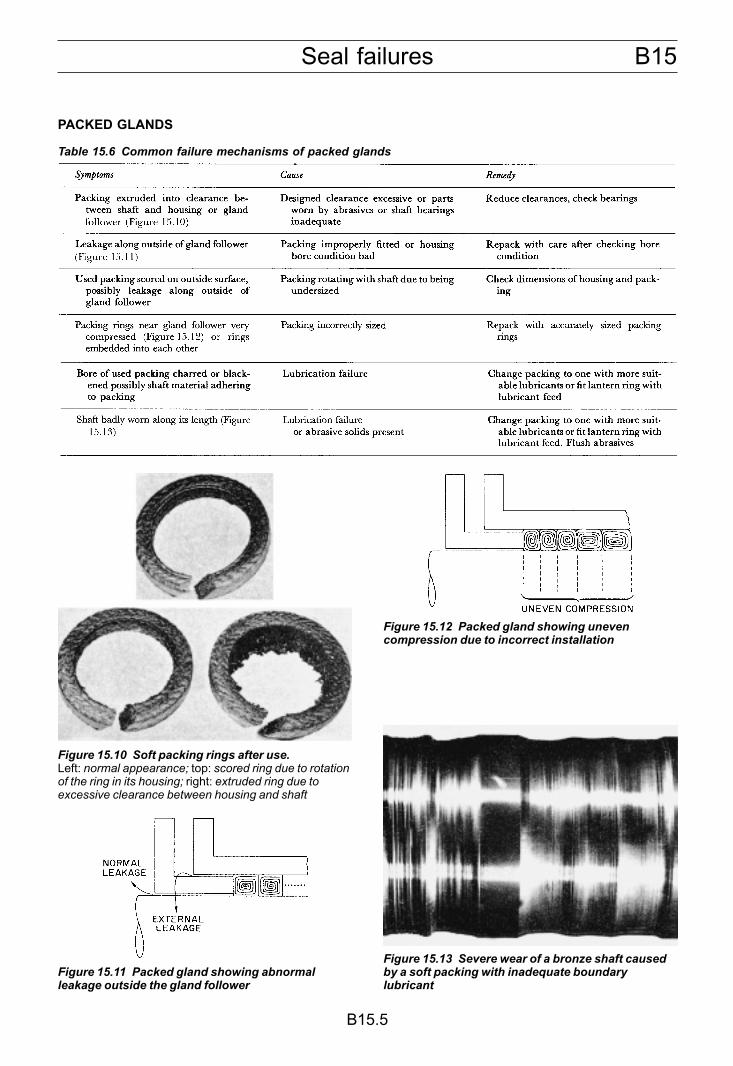
B15Seal failures
B15.5
PACKED GLANDS
Table 15.6 Common failure mechanisms of packed glands
Figure 15.10 Soft packing rings after use.Left: normal appearance; top: scored ring due to rotationof the ring in its housing; right: extruded ring due toexcessive clearance between housing and shaft
Figure 15.11 Packed gland showing abnormalleakage outside the gland follower
Figure 15.12 Packed gland showing unevencompression due to incorrect installation
Figure 15.13 Severe wear of a bronze shaft causedby a soft packing with inadequate boundarylubricant
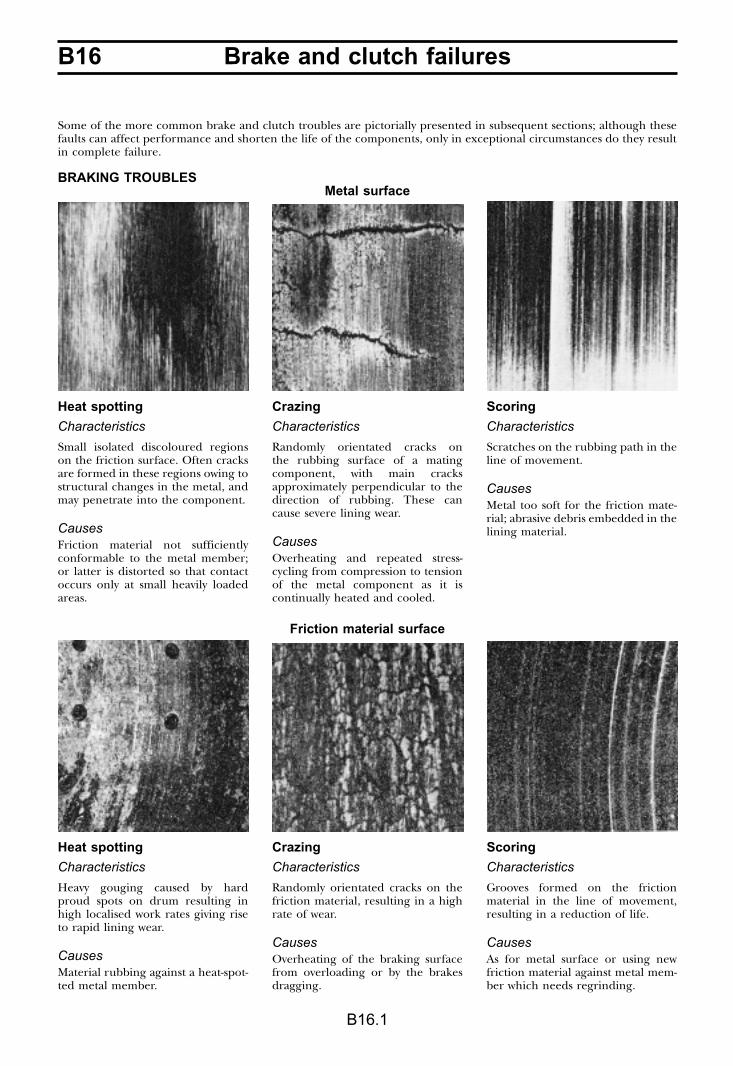
B16 Brake and clutch failures
B16.1
Some of the more common brake and clutch troubles are pictorially presented in subsequent sections; although thesefaults can affect performance and shorten the life of the components, only in exceptional circumstances do they resultin complete failure.
BRAKING TROUBLESMetal surface
Heat spotting
Characteristics
Small isolated discoloured regionson the friction surface. Often cracksare formed in these regions owing tostructural changes in the metal, andmay penetrate into the component.
CausesFriction material not sufficientlyconformable to the metal member;or latter is distorted so that contactoccurs only at small heavily loadedareas.
Heat spotting
Characteristics
Heavy gouging caused by hardproud spots on drum resulting inhigh localised work rates giving riseto rapid lining wear.
CausesMaterial rubbing against a heat-spot-ted metal member.
Crazing
Characteristics
Randomly orientated cracks onthe rubbing surface of a matingcomponent, with main cracksapproximately perpendicular to thedirection of rubbing. These cancause severe lining wear.
CausesOverheating and repeated stress-cycling from compression to tensionof the metal component as it iscontinually heated and cooled.
Crazing
Characteristics
Randomly orientated cracks on thefriction material, resulting in a highrate of wear.
CausesOverheating of the braking surfacefrom overloading or by the brakesdragging.
Scoring
Characteristics
Scratches on the rubbing path in theline of movement.
CausesMetal too soft for the friction mate-rial; abrasive debris embedded in thelining material.
Friction material surface
Scoring
Characteristics
Grooves formed on the frictionmaterial in the line of movement,resulting in a reduction of life.
CausesAs for metal surface or using newfriction material against metal mem-ber which needs regrinding.
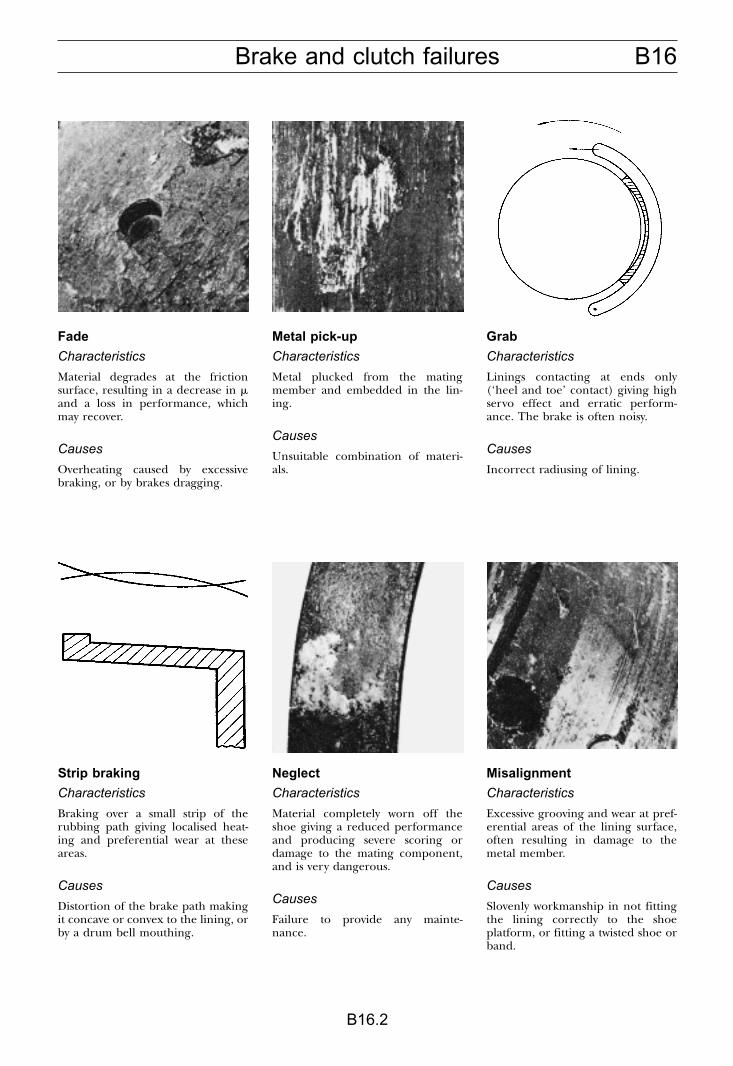
B16Brake and clutch failures
B16.2
Fade
Characteristics
Material degrades at the frictionsurface, resulting in a decrease in �and a loss in performance, whichmay recover.
Causes
Overheating caused by excessivebraking, or by brakes dragging.
Strip braking
Characteristics
Braking over a small strip of therubbing path giving localised heat-ing and preferential wear at theseareas.
Causes
Distortion of the brake path makingit concave or convex to the lining, orby a drum bell mouthing.
Metal pick-up
Characteristics
Metal plucked from the matingmember and embedded in the lin-ing.
Causes
Unsuitable combination of materi-als.
Neglect
Characteristics
Material completely worn off theshoe giving a reduced performanceand producing severe scoring ordamage to the mating component,and is very dangerous.
Causes
Failure to provide any mainte-nance.
Grab
Characteristics
Linings contacting at ends only(‘heel and toe’ contact) giving highservo effect and erratic perform-ance. The brake is often noisy.
Causes
Incorrect radiusing of lining.
Misalignment
Characteristics
Excessive grooving and wear at pref-erential areas of the lining surface,often resulting in damage to themetal member.
Causes
Slovenly workmanship in not fittingthe lining correctly to the shoeplatform, or fitting a twisted shoe orband.
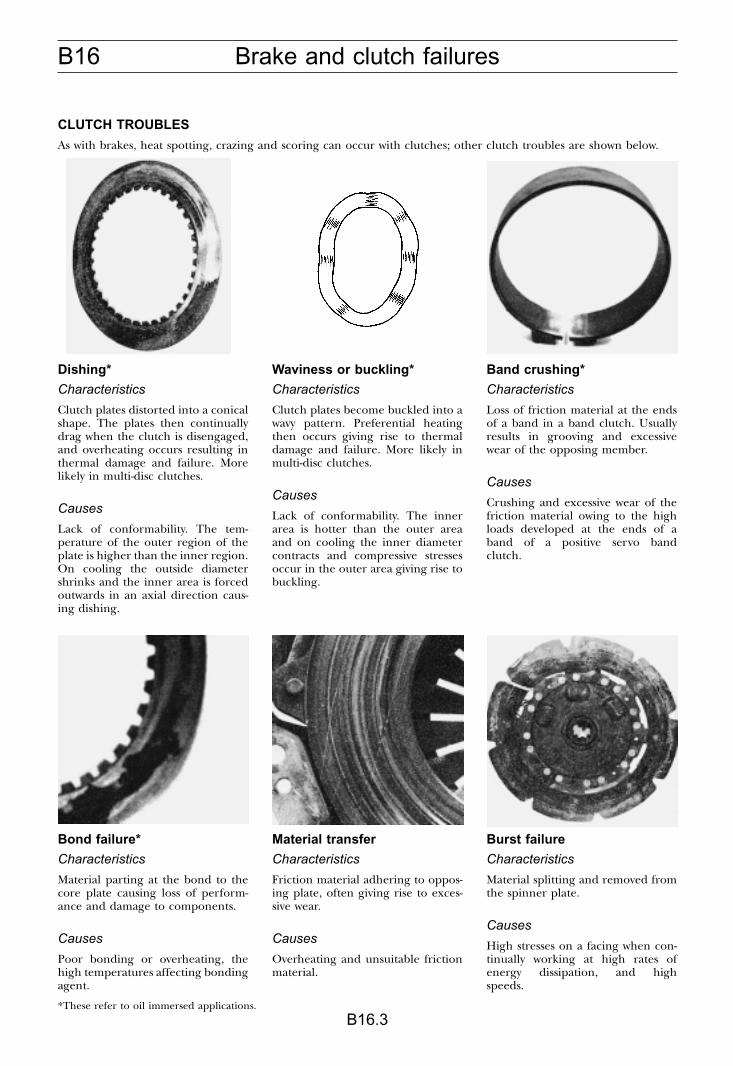
B16 Brake and clutch failures
B16.3
CLUTCH TROUBLES
As with brakes, heat spotting, crazing and scoring can occur with clutches; other clutch troubles are shown below.
Dishing*
Characteristics
Clutch plates distorted into a conicalshape. The plates then continuallydrag when the clutch is disengaged,and overheating occurs resulting inthermal damage and failure. Morelikely in multi-disc clutches.
Causes
Lack of conformability. The tem-perature of the outer region of theplate is higher than the inner region.On cooling the outside diametershrinks and the inner area is forcedoutwards in an axial direction caus-ing dishing.
Bond failure*
Characteristics
Material parting at the bond to thecore plate causing loss of perform-ance and damage to components.
Causes
Poor bonding or overheating, thehigh temperatures affecting bondingagent.
Waviness or buckling*
Characteristics
Clutch plates become buckled into awavy pattern. Preferential heatingthen occurs giving rise to thermaldamage and failure. More likely inmulti-disc clutches.
Causes
Lack of conformability. The innerarea is hotter than the outer areaand on cooling the inner diametercontracts and compressive stressesoccur in the outer area giving rise tobuckling.
Material transfer
Characteristics
Friction material adhering to oppos-ing plate, often giving rise to exces-sive wear.
Causes
Overheating and unsuitable frictionmaterial.
Band crushing*
Characteristics
Loss of friction material at the endsof a band in a band clutch. Usuallyresults in grooving and excessivewear of the opposing member.
Causes
Crushing and excessive wear of thefriction material owing to the highloads developed at the ends of aband of a positive servo bandclutch.
Burst failure
Characteristics
Material splitting and removed fromthe spinner plate.
Causes
High stresses on a facing when con-tinually working at high rates ofenergy dissipation, and highspeeds.
*These refer to oil immersed applications.
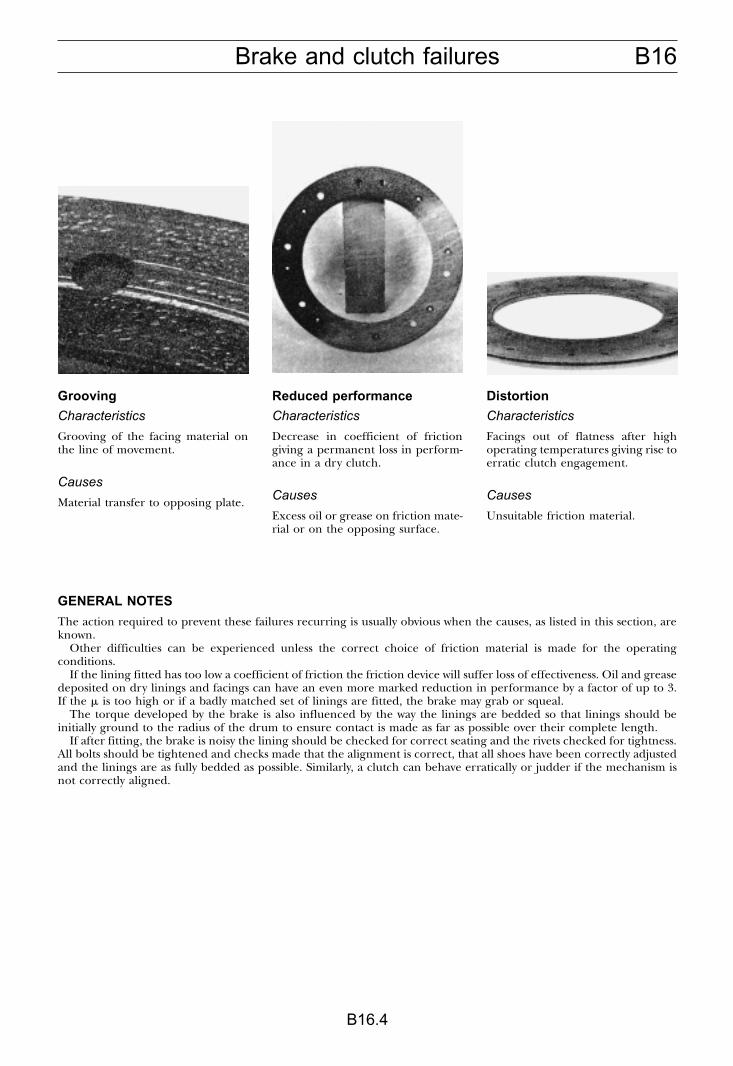
B16Brake and clutch failures
B16.4
Grooving
Characteristics
Grooving of the facing material onthe line of movement.
Causes
Material transfer to opposing plate.
Reduced performance
Characteristics
Decrease in coefficient of frictiongiving a permanent loss in perform-ance in a dry clutch.
Causes
Excess oil or grease on friction mate-rial or on the opposing surface.
Distortion
Characteristics
Facings out of flatness after highoperating temperatures giving rise toerratic clutch engagement.
Causes
Unsuitable friction material.
GENERAL NOTES
The action required to prevent these failures recurring is usually obvious when the causes, as listed in this section, areknown.
Other difficulties can be experienced unless the correct choice of friction material is made for the operatingconditions.
If the lining fitted has too low a coefficient of friction the friction device will suffer loss of effectiveness. Oil and greasedeposited on dry linings and facings can have an even more marked reduction in performance by a factor of up to 3.If the � is too high or if a badly matched set of linings are fitted, the brake may grab or squeal.
The torque developed by the brake is also influenced by the way the linings are bedded so that linings should beinitially ground to the radius of the drum to ensure contact is made as far as possible over their complete length.
If after fitting, the brake is noisy the lining should be checked for correct seating and the rivets checked for tightness.All bolts should be tightened and checks made that the alignment is correct, that all shoes have been correctly adjustedand the linings are as fully bedded as possible. Similarly, a clutch can behave erratically or judder if the mechanism isnot correctly aligned.

B17 Wire rope failures
B17.1
A wire rope is said to have failed when the condition of either the wire strands, core or termination has deteriorated toan unacceptable extent. Each application has to be considered individually in terms of the degree of degradationallowable; certain applications may allow for a greater degree of deterioration than others.
Complete wire rope failures rarely occur. The more common modes of failure/deterioration are described below.
DETERIORATION
Mechanical damage Characteristics
Damage to exposed wires or complete strands, oftenassociated with gross plastic deformation of the steelmaterial. Damage may be localised or distributed alongthe length of the rope.
Inspection by visual means only.
Causes
There are many potential causes of mechanical damage,such as:
� rubbing against a static structure whilst under load� impact or collision by a heavy object� misuse or bad handling practices
External wear Characteristics
Flattened areas formed on outer wires. Wear may bedistributed over the entire surface or concentrated innarrow axial zones. Severe loss of worn wires underdirect tension. Choice of rope construction can besignificant in increasing wear resistance (e.g. Lang’s layropes are usually superior to ordinary lay ropes).
Assess condition visually and also by measuring thereduction in rope diameter.
Causes
Abrasive wear between rope and pulleys, or betweensuccessive rope layers in multi-coiled applications, partic-ularly in dirty or contaminated conditions (e.g. mining).Small oscillations, as a result of vibration, can causelocalised wear at pulley positions.
Regular rope lubrication (dressings) can help toreduce this type of wear.
External fatigue Characteristics
Transverse fractures of individual wires which maysubsequently become worn. Fatigue failures of individualwires occur at the position of maximum rope diameter(‘crown’ fractures).
Condition is assessed by counting the number ofbroken wires over a given length of rope (e.g. one laylength, 10 diameters, 1 metre).
Causes
Fatigue failures of wires is caused by cyclic stressesinduced by bending, often superimposed on the directstress under tension. Tight bend radii on pulleys increa-ses the stresses and hence the risk of fatigue. LocalisedHertzian stresses resulting from ropes operating inoversize or undersize grooves can also promote pre-mature fatigue failures.
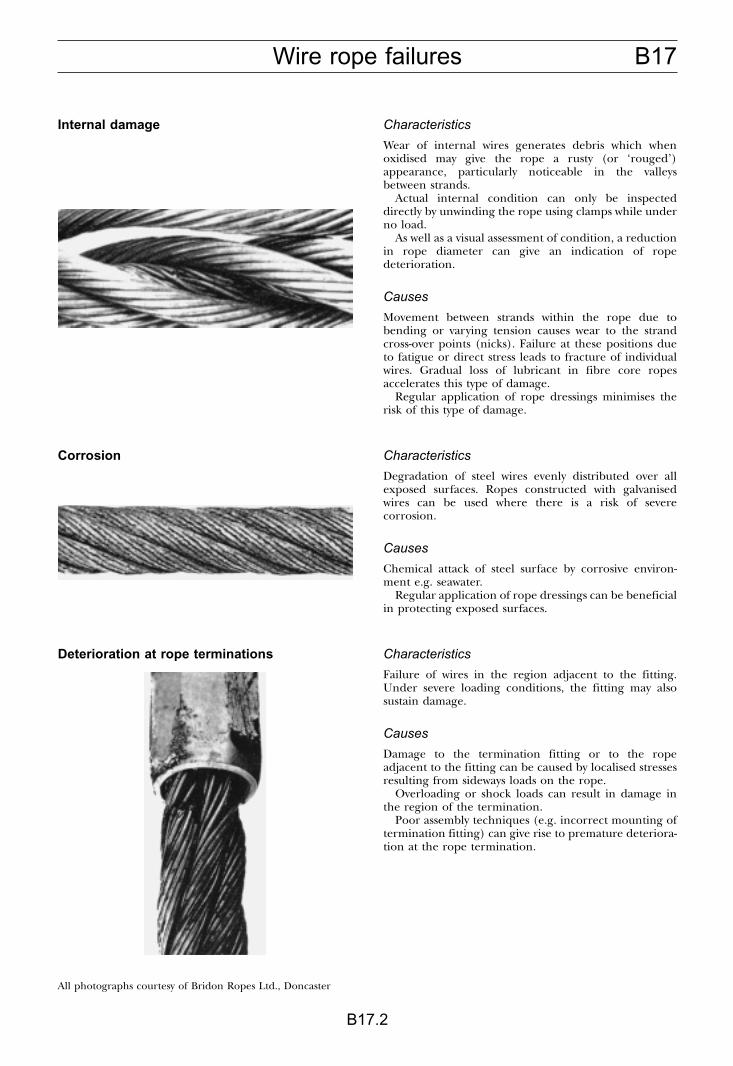
B17Wire rope failures
B17.2
Internal damage Characteristics
Wear of internal wires generates debris which whenoxidised may give the rope a rusty (or ‘rouged’)appearance, particularly noticeable in the valleysbetween strands.
Actual internal condition can only be inspecteddirectly by unwinding the rope using clamps while underno load.
As well as a visual assessment of condition, a reductionin rope diameter can give an indication of ropedeterioration.
Causes
Movement between strands within the rope due tobending or varying tension causes wear to the strandcross-over points (nicks). Failure at these positions dueto fatigue or direct stress leads to fracture of individualwires. Gradual loss of lubricant in fibre core ropesaccelerates this type of damage.
Regular application of rope dressings minimises therisk of this type of damage.
Corrosion Characteristics
Degradation of steel wires evenly distributed over allexposed surfaces. Ropes constructed with galvanisedwires can be used where there is a risk of severecorrosion.
Causes
Chemical attack of steel surface by corrosive environ-ment e.g. seawater.
Regular application of rope dressings can be beneficialin protecting exposed surfaces.
Deterioration at rope terminations Characteristics
Failure of wires in the region adjacent to the fitting.Under severe loading conditions, the fitting may alsosustain damage.
Causes
Damage to the termination fitting or to the ropeadjacent to the fitting can be caused by localised stressesresulting from sideways loads on the rope.
Overloading or shock loads can result in damage inthe region of the termination.
Poor assembly techniques (e.g. incorrect mounting oftermination fitting) can give rise to premature deteriora-tion at the rope termination.
All photographs courtesy of Bridon Ropes Ltd., Doncaster
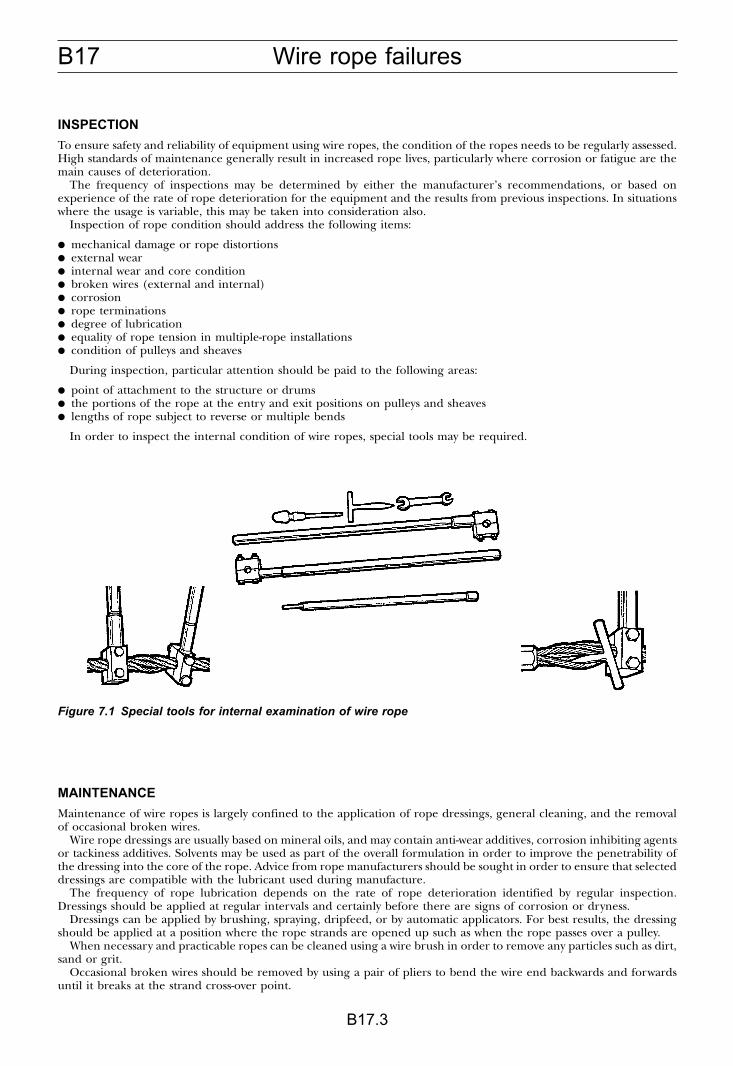
B17 Wire rope failures
B17.3
INSPECTION
To ensure safety and reliability of equipment using wire ropes, the condition of the ropes needs to be regularly assessed.High standards of maintenance generally result in increased rope lives, particularly where corrosion or fatigue are themain causes of deterioration.
The frequency of inspections may be determined by either the manufacturer’s recommendations, or based onexperience of the rate of rope deterioration for the equipment and the results from previous inspections. In situationswhere the usage is variable, this may be taken into consideration also.
Inspection of rope condition should address the following items:
� mechanical damage or rope distortions� external wear� internal wear and core condition� broken wires (external and internal)� corrosion� rope terminations� degree of lubrication� equality of rope tension in multiple-rope installations� condition of pulleys and sheaves
During inspection, particular attention should be paid to the following areas:
� point of attachment to the structure or drums� the portions of the rope at the entry and exit positions on pulleys and sheaves� lengths of rope subject to reverse or multiple bends
In order to inspect the internal condition of wire ropes, special tools may be required.
MAINTENANCE
Maintenance of wire ropes is largely confined to the application of rope dressings, general cleaning, and the removalof occasional broken wires.
Wire rope dressings are usually based on mineral oils, and may contain anti-wear additives, corrosion inhibiting agentsor tackiness additives. Solvents may be used as part of the overall formulation in order to improve the penetrability ofthe dressing into the core of the rope. Advice from rope manufacturers should be sought in order to ensure that selecteddressings are compatible with the lubricant used during manufacture.
The frequency of rope lubrication depends on the rate of rope deterioration identified by regular inspection.Dressings should be applied at regular intervals and certainly before there are signs of corrosion or dryness.
Dressings can be applied by brushing, spraying, dripfeed, or by automatic applicators. For best results, the dressingshould be applied at a position where the rope strands are opened up such as when the rope passes over a pulley.
When necessary and practicable ropes can be cleaned using a wire brush in order to remove any particles such as dirt,sand or grit.
Occasional broken wires should be removed by using a pair of pliers to bend the wire end backwards and forwardsuntil it breaks at the strand cross-over point.
Figure 7.1 Special tools for internal examination of wire rope
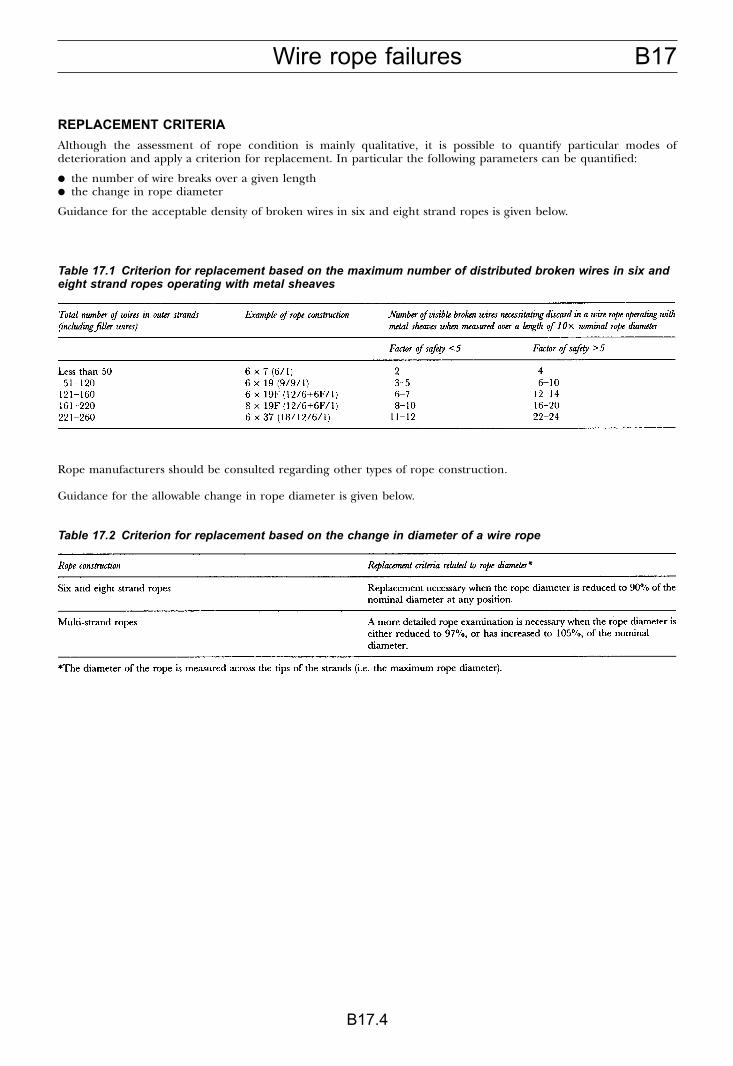
B17Wire rope failures
B17.4
REPLACEMENT CRITERIA
Although the assessment of rope condition is mainly qualitative, it is possible to quantify particular modes ofdeterioration and apply a criterion for replacement. In particular the following parameters can be quantified:
� the number of wire breaks over a given length� the change in rope diameter
Guidance for the acceptable density of broken wires in six and eight strand ropes is given below.
Rope manufacturers should be consulted regarding other types of rope construction.
Guidance for the allowable change in rope diameter is given below.
Table 17.1 Criterion for replacement based on the maximum number of distributed broken wires in six andeight strand ropes operating with metal sheaves
Table 17.2 Criterion for replacement based on the change in diameter of a wire rope
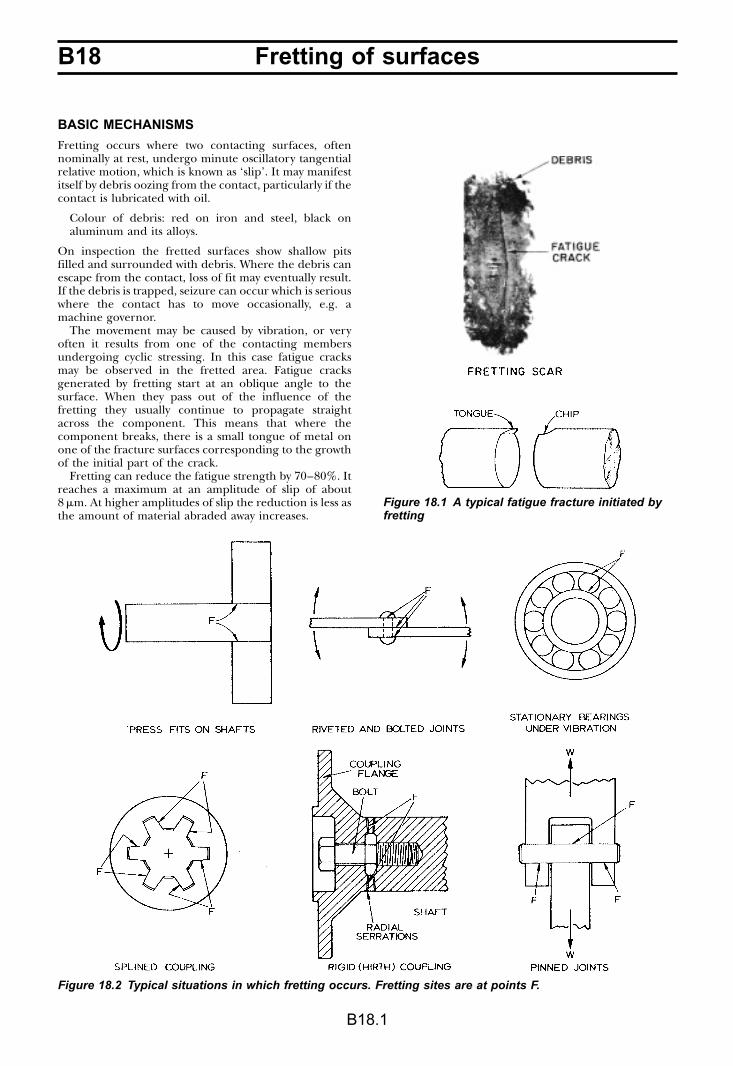
B18 Fretting of surfaces
B18.1
BASIC MECHANISMS
Fretting occurs where two contacting surfaces, oftennominally at rest, undergo minute oscillatory tangentialrelative motion, which is known as ‘slip’. It may manifestitself by debris oozing from the contact, particularly if thecontact is lubricated with oil.
Colour of debris: red on iron and steel, black onaluminum and its alloys.
On inspection the fretted surfaces show shallow pitsfilled and surrounded with debris. Where the debris canescape from the contact, loss of fit may eventually result.If the debris is trapped, seizure can occur which is seriouswhere the contact has to move occasionally, e.g. amachine governor.
The movement may be caused by vibration, or veryoften it results from one of the contacting membersundergoing cyclic stressing. In this case fatigue cracksmay be observed in the fretted area. Fatigue cracksgenerated by fretting start at an oblique angle to thesurface. When they pass out of the influence of thefretting they usually continue to propagate straightacross the component. This means that where thecomponent breaks, there is a small tongue of metal onone of the fracture surfaces corresponding to the growthof the initial part of the crack.
Fretting can reduce the fatigue strength by 70–80%. Itreaches a maximum at an amplitude of slip of about8 �m. At higher amplitudes of slip the reduction is less asthe amount of material abraded away increases.
Figure 18.1 A typical fatigue fracture initiated byfretting
Figure 18.2 Typical situations in which fretting occurs. Fretting sites are at points F.
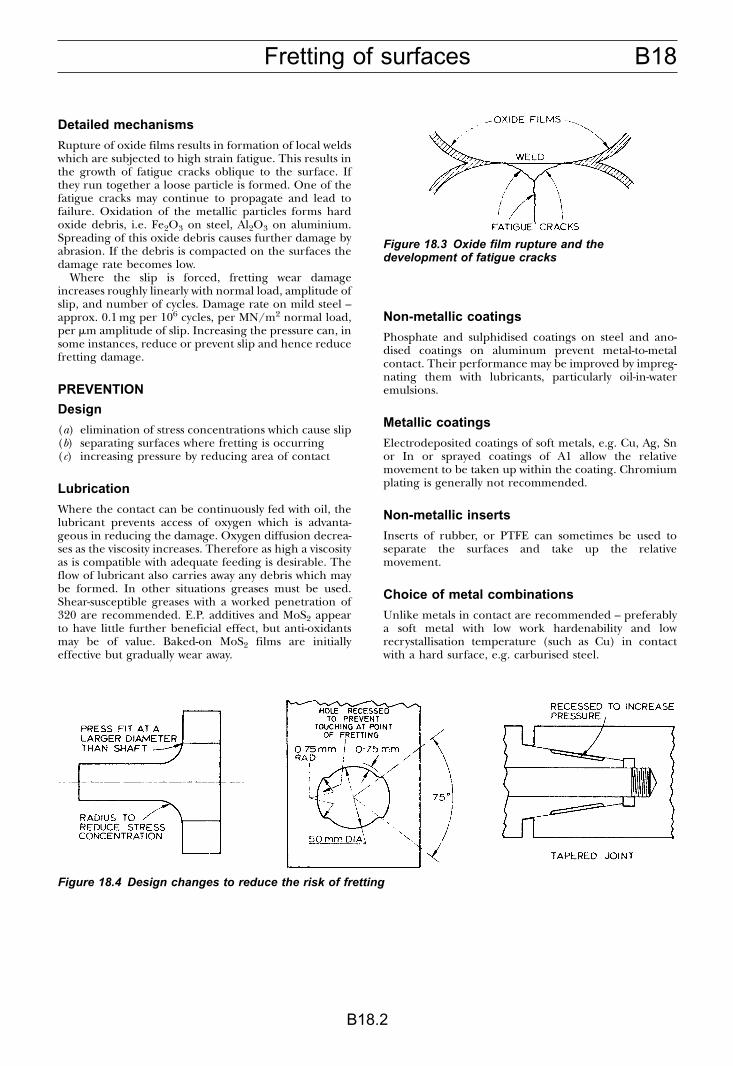
B18Fretting of surfaces
B18.2
Detailed mechanisms
Rupture of oxide films results in formation of local weldswhich are subjected to high strain fatigue. This results inthe growth of fatigue cracks oblique to the surface. Ifthey run together a loose particle is formed. One of thefatigue cracks may continue to propagate and lead tofailure. Oxidation of the metallic particles forms hardoxide debris, i.e. Fe2O3 on steel, Al2O3 on aluminium.Spreading of this oxide debris causes further damage byabrasion. If the debris is compacted on the surfaces thedamage rate becomes low.
Where the slip is forced, fretting wear damageincreases roughly linearly with normal load, amplitude ofslip, and number of cycles. Damage rate on mild steel –approx. 0.1 mg per 106 cycles, per MN/m2 normal load,per �m amplitude of slip. Increasing the pressure can, insome instances, reduce or prevent slip and hence reducefretting damage.
PREVENTION
Design
(a) elimination of stress concentrations which cause slip(b) separating surfaces where fretting is occurring(c) increasing pressure by reducing area of contact
Lubrication
Where the contact can be continuously fed with oil, thelubricant prevents access of oxygen which is advanta-geous in reducing the damage. Oxygen diffusion decrea-ses as the viscosity increases. Therefore as high a viscosityas is compatible with adequate feeding is desirable. Theflow of lubricant also carries away any debris which maybe formed. In other situations greases must be used.Shear-susceptible greases with a worked penetration of320 are recommended. E.P. additives and MoS2 appearto have little further beneficial effect, but anti-oxidantsmay be of value. Baked-on MoS2 films are initiallyeffective but gradually wear away.
Non-metallic coatings
Phosphate and sulphidised coatings on steel and ano-dised coatings on aluminum prevent metal-to-metalcontact. Their performance may be improved by impreg-nating them with lubricants, particularly oil-in-wateremulsions.
Metallic coatings
Electrodeposited coatings of soft metals, e.g. Cu, Ag, Snor In or sprayed coatings of A1 allow the relativemovement to be taken up within the coating. Chromiumplating is generally not recommended.
Non-metallic inserts
Inserts of rubber, or PTFE can sometimes be used toseparate the surfaces and take up the relativemovement.
Choice of metal combinations
Unlike metals in contact are recommended – preferablya soft metal with low work hardenability and lowrecrystallisation temperature (such as Cu) in contactwith a hard surface, e.g. carburised steel.
Figure 18.3 Oxide film rupture and thedevelopment of fatigue cracks
Figure 18.4 Design changes to reduce the risk of fretting
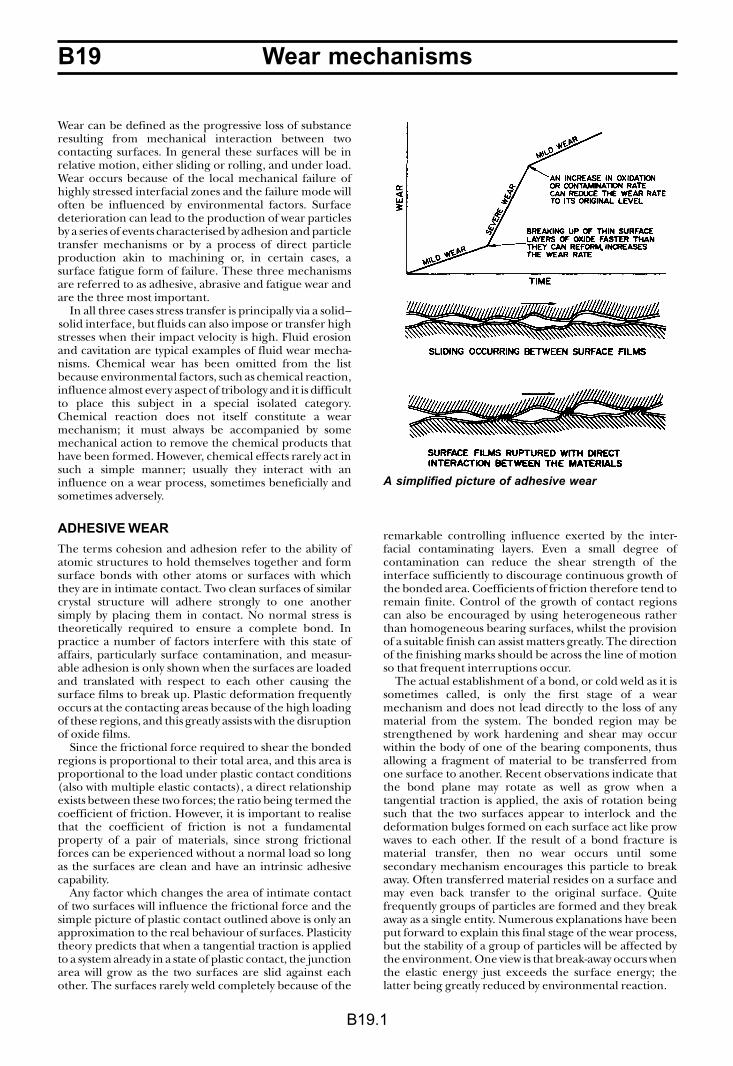
B19 Wear mechanisms
B19.1
Wear can be defined as the progressive loss of substanceresulting from mechanical interaction between twocontacting surfaces. In general these surfaces will be inrelative motion, either sliding or rolling, and under load.Wear occurs because of the local mechanical failure ofhighly stressed interfacial zones and the failure mode willoften be influenced by environmental factors. Surfacedeterioration can lead to the production of wear particlesby a series of events characterised by adhesion and particletransfer mechanisms or by a process of direct particleproduction akin to machining or, in certain cases, asurface fatigue form of failure. These three mechanismsare referred to as adhesive, abrasive and fatigue wear andare the three most important.
In all three cases stress transfer is principally via a solid–solid interface, but fluids can also impose or transfer highstresses when their impact velocity is high. Fluid erosionand cavitation are typical examples of fluid wear mecha-nisms. Chemical wear has been omitted from the listbecause environmental factors, such as chemical reaction,influence almost every aspect of tribology and it is difficultto place this subject in a special isolated category.Chemical reaction does not itself constitute a wearmechanism; it must always be accompanied by somemechanical action to remove the chemical products thathave been formed. However, chemical effects rarely act insuch a simple manner; usually they interact with aninfluence on a wear process, sometimes beneficially andsometimes adversely.
ADHESIVE WEAR
The terms cohesion and adhesion refer to the ability ofatomic structures to hold themselves together and formsurface bonds with other atoms or surfaces with whichthey are in intimate contact. Two clean surfaces of similarcrystal structure will adhere strongly to one anothersimply by placing them in contact. No normal stress istheoretically required to ensure a complete bond. Inpractice a number of factors interfere with this state ofaffairs, particularly surface contamination, and measur-able adhesion is only shown when the surfaces are loadedand translated with respect to each other causing thesurface films to break up. Plastic deformation frequentlyoccurs at the contacting areas because of the high loadingof these regions, and this greatly assists with the disruptionof oxide films.
Since the frictional force required to shear the bondedregions is proportional to their total area, and this area isproportional to the load under plastic contact conditions(also with multiple elastic contacts), a direct relationshipexists between these two forces; the ratio being termed thecoefficient of friction. However, it is important to realisethat the coefficient of friction is not a fundamentalproperty of a pair of materials, since strong frictionalforces can be experienced without a normal load so longas the surfaces are clean and have an intrinsic adhesivecapability.
Any factor which changes the area of intimate contactof two surfaces will influence the frictional force and thesimple picture of plastic contact outlined above is only anapproximation to the real behaviour of surfaces. Plasticitytheory predicts that when a tangential traction is appliedto a system already in a state of plastic contact, the junctionarea will grow as the two surfaces are slid against eachother. The surfaces rarely weld completely because of the
remarkable controlling influence exerted by the inter-facial contaminating layers. Even a small degree ofcontamination can reduce the shear strength of theinterface sufficiently to discourage continuous growth ofthe bonded area. Coefficients of friction therefore tend toremain finite. Control of the growth of contact regionscan also be encouraged by using heterogeneous ratherthan homogeneous bearing surfaces, whilst the provisionof a suitable finish can assist matters greatly. The directionof the finishing marks should be across the line of motionso that frequent interruptions occur.
The actual establishment of a bond, or cold weld as it issometimes called, is only the first stage of a wearmechanism and does not lead directly to the loss of anymaterial from the system. The bonded region may bestrengthened by work hardening and shear may occurwithin the body of one of the bearing components, thusallowing a fragment of material to be transferred fromone surface to another. Recent observations indicate thatthe bond plane may rotate as well as grow when atangential traction is applied, the axis of rotation beingsuch that the two surfaces appear to interlock and thedeformation bulges formed on each surface act like prowwaves to each other. If the result of a bond fracture ismaterial transfer, then no wear occurs until somesecondary mechanism encourages this particle to breakaway. Often transferred material resides on a surface andmay even back transfer to the original surface. Quitefrequently groups of particles are formed and they breakaway as a single entity. Numerous explanations have beenput forward to explain this final stage of the wear process,but the stability of a group of particles will be affected bythe environment. One view is that break-away occurs whenthe elastic energy just exceeds the surface energy; thelatter being greatly reduced by environmental reaction.
A simplified picture of adhesive wear
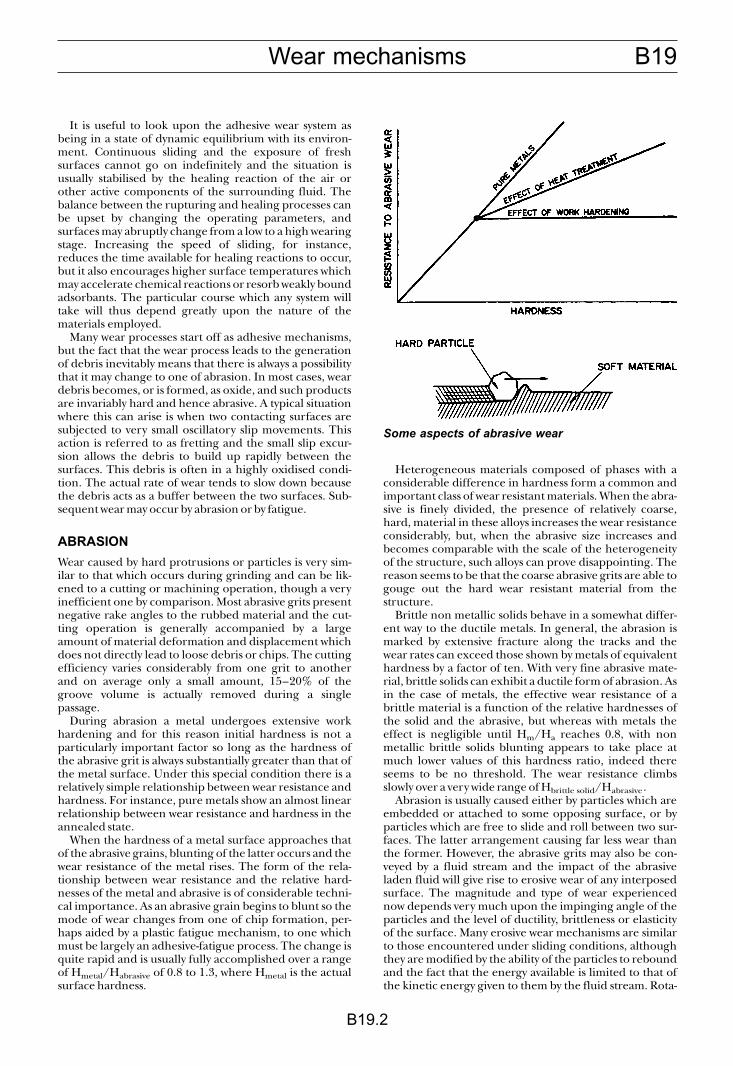
B19Wear mechanisms
B19.2
It is useful to look upon the adhesive wear system asbeing in a state of dynamic equilibrium with its environ-ment. Continuous sliding and the exposure of freshsurfaces cannot go on indefinitely and the situation isusually stabilised by the healing reaction of the air orother active components of the surrounding fluid. Thebalance between the rupturing and healing processes canbe upset by changing the operating parameters, andsurfaces may abruptly change from a low to a high wearingstage. Increasing the speed of sliding, for instance,reduces the time available for healing reactions to occur,but it also encourages higher surface temperatures whichmay accelerate chemical reactions or resorb weakly boundadsorbants. The particular course which any system willtake will thus depend greatly upon the nature of thematerials employed.
Many wear processes start off as adhesive mechanisms,but the fact that the wear process leads to the generationof debris inevitably means that there is always a possibilitythat it may change to one of abrasion. In most cases, weardebris becomes, or is formed, as oxide, and such productsare invariably hard and hence abrasive. A typical situationwhere this can arise is when two contacting surfaces aresubjected to very small oscillatory slip movements. Thisaction is referred to as fretting and the small slip excur-sion allows the debris to build up rapidly between thesurfaces. This debris is often in a highly oxidised condi-tion. The actual rate of wear tends to slow down becausethe debris acts as a buffer between the two surfaces. Sub-sequent wear may occur by abrasion or by fatigue.
ABRASION
Wear caused by hard protrusions or particles is very sim-ilar to that which occurs during grinding and can be lik-ened to a cutting or machining operation, though a veryinefficient one by comparison. Most abrasive grits presentnegative rake angles to the rubbed material and the cut-ting operation is generally accompanied by a largeamount of material deformation and displacement whichdoes not directly lead to loose debris or chips. The cuttingefficiency varies considerably from one grit to anotherand on average only a small amount, 15–20% of thegroove volume is actually removed during a singlepassage.
During abrasion a metal undergoes extensive workhardening and for this reason initial hardness is not aparticularly important factor so long as the hardness ofthe abrasive grit is always substantially greater than that ofthe metal surface. Under this special condition there is arelatively simple relationship between wear resistance andhardness. For instance, pure metals show an almost linearrelationship between wear resistance and hardness in theannealed state.
When the hardness of a metal surface approaches thatof the abrasive grains, blunting of the latter occurs and thewear resistance of the metal rises. The form of the rela-tionship between wear resistance and the relative hard-nesses of the metal and abrasive is of considerable techni-cal importance. As an abrasive grain begins to blunt so themode of wear changes from one of chip formation, per-haps aided by a plastic fatigue mechanism, to one whichmust be largely an adhesive-fatigue process. The change isquite rapid and is usually fully accomplished over a rangeof Hmetal/Habrasive of 0.8 to 1.3, where Hmetal is the actualsurface hardness.
Heterogeneous materials composed of phases with aconsiderable difference in hardness form a common andimportant class of wear resistant materials. When the abra-sive is finely divided, the presence of relatively coarse,hard, material in these alloys increases the wear resistanceconsiderably, but, when the abrasive size increases andbecomes comparable with the scale of the heterogeneityof the structure, such alloys can prove disappointing. Thereason seems to be that the coarse abrasive grits are able togouge out the hard wear resistant material from thestructure.
Brittle non metallic solids behave in a somewhat differ-ent way to the ductile metals. In general, the abrasion ismarked by extensive fracture along the tracks and thewear rates can exceed those shown by metals of equivalenthardness by a factor of ten. With very fine abrasive mate-rial, brittle solids can exhibit a ductile form of abrasion. Asin the case of metals, the effective wear resistance of abrittle material is a function of the relative hardnesses ofthe solid and the abrasive, but whereas with metals theeffect is negligible until Hm/Ha reaches 0.8, with nonmetallic brittle solids blunting appears to take place atmuch lower values of this hardness ratio, indeed thereseems to be no threshold. The wear resistance climbsslowly over a very wide range of Hbrittle solid/Habrasive.
Abrasion is usually caused either by particles which areembedded or attached to some opposing surface, or byparticles which are free to slide and roll between two sur-faces. The latter arrangement causing far less wear thanthe former. However, the abrasive grits may also be con-veyed by a fluid stream and the impact of the abrasiveladen fluid will give rise to erosive wear of any interposedsurface. The magnitude and type of wear experiencednow depends very much upon the impinging angle of theparticles and the level of ductility, brittleness or elasticityof the surface. Many erosive wear mechanisms are similarto those encountered under sliding conditions, althoughthey are modified by the ability of the particles to reboundand the fact that the energy available is limited to that ofthe kinetic energy given to them by the fluid stream. Rota-
Some aspects of abrasive wear
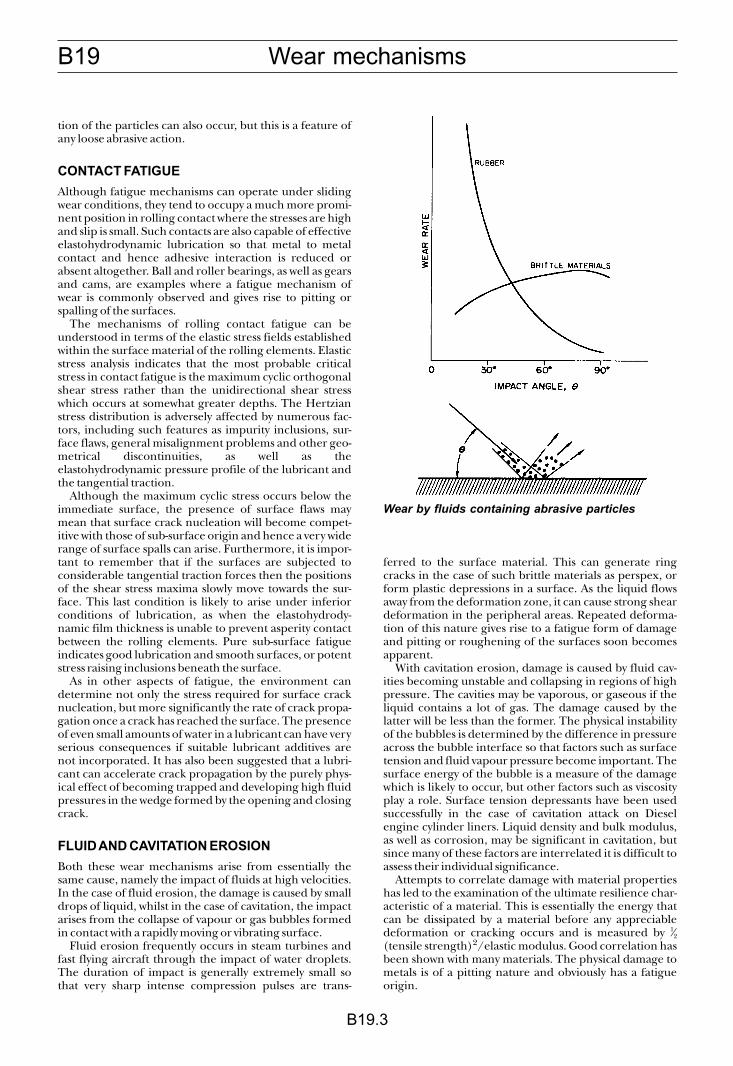
B19 Wear mechanisms
B19.3
tion of the particles can also occur, but this is a feature ofany loose abrasive action.
CONTACT FATIGUE
Although fatigue mechanisms can operate under slidingwear conditions, they tend to occupy a much more promi-nent position in rolling contact where the stresses are highand slip is small. Such contacts are also capable of effectiveelastohydrodynamic lubrication so that metal to metalcontact and hence adhesive interaction is reduced orabsent altogether. Ball and roller bearings, as well as gearsand cams, are examples where a fatigue mechanism ofwear is commonly observed and gives rise to pitting orspalling of the surfaces.
The mechanisms of rolling contact fatigue can beunderstood in terms of the elastic stress fields establishedwithin the surface material of the rolling elements. Elasticstress analysis indicates that the most probable criticalstress in contact fatigue is the maximum cyclic orthogonalshear stress rather than the unidirectional shear stresswhich occurs at somewhat greater depths. The Hertzianstress distribution is adversely affected by numerous fac-tors, including such features as impurity inclusions, sur-face flaws, general misalignment problems and other geo-metrical discontinuities, as well as theelastohydrodynamic pressure profile of the lubricant andthe tangential traction.
Although the maximum cyclic stress occurs below theimmediate surface, the presence of surface flaws maymean that surface crack nucleation will become compet-itive with those of sub-surface origin and hence a very widerange of surface spalls can arise. Furthermore, it is impor-tant to remember that if the surfaces are subjected toconsiderable tangential traction forces then the positionsof the shear stress maxima slowly move towards the sur-face. This last condition is likely to arise under inferiorconditions of lubrication, as when the elastohydrody-namic film thickness is unable to prevent asperity contactbetween the rolling elements. Pure sub-surface fatigueindicates good lubrication and smooth surfaces, or potentstress raising inclusions beneath the surface.
As in other aspects of fatigue, the environment candetermine not only the stress required for surface cracknucleation, but more significantly the rate of crack propa-gation once a crack has reached the surface. The presenceof even small amounts of water in a lubricant can have veryserious consequences if suitable lubricant additives arenot incorporated. It has also been suggested that a lubri-cant can accelerate crack propagation by the purely phys-ical effect of becoming trapped and developing high fluidpressures in the wedge formed by the opening and closingcrack.
FLUID AND CAVITATION EROSION
Both these wear mechanisms arise from essentially thesame cause, namely the impact of fluids at high velocities.In the case of fluid erosion, the damage is caused by smalldrops of liquid, whilst in the case of cavitation, the impactarises from the collapse of vapour or gas bubbles formedin contact with a rapidly moving or vibrating surface.
Fluid erosion frequently occurs in steam turbines andfast flying aircraft through the impact of water droplets.The duration of impact is generally extremely small sothat very sharp intense compression pulses are trans-
ferred to the surface material. This can generate ringcracks in the case of such brittle materials as perspex, orform plastic depressions in a surface. As the liquid flowsaway from the deformation zone, it can cause strong sheardeformation in the peripheral areas. Repeated deforma-tion of this nature gives rise to a fatigue form of damageand pitting or roughening of the surfaces soon becomesapparent.
With cavitation erosion, damage is caused by fluid cav-ities becoming unstable and collapsing in regions of highpressure. The cavities may be vaporous, or gaseous if theliquid contains a lot of gas. The damage caused by thelatter will be less than the former. The physical instabilityof the bubbles is determined by the difference in pressureacross the bubble interface so that factors such as surfacetension and fluid vapour pressure become important. Thesurface energy of the bubble is a measure of the damagewhich is likely to occur, but other factors such as viscosityplay a role. Surface tension depressants have been usedsuccessfully in the case of cavitation attack on Dieselengine cylinder liners. Liquid density and bulk modulus,as well as corrosion, may be significant in cavitation, butsince many of these factors are interrelated it is difficult toassess their individual significance.
Attempts to correlate damage with material propertieshas led to the examination of the ultimate resilience char-acteristic of a material. This is essentially the energy thatcan be dissipated by a material before any appreciabledeformation or cracking occurs and is measured by 1⁄2(tensile strength)2/elastic modulus. Good correlation hasbeen shown with many materials. The physical damage tometals is of a pitting nature and obviously has a fatigueorigin.
Wear by fluids containing abrasive particles
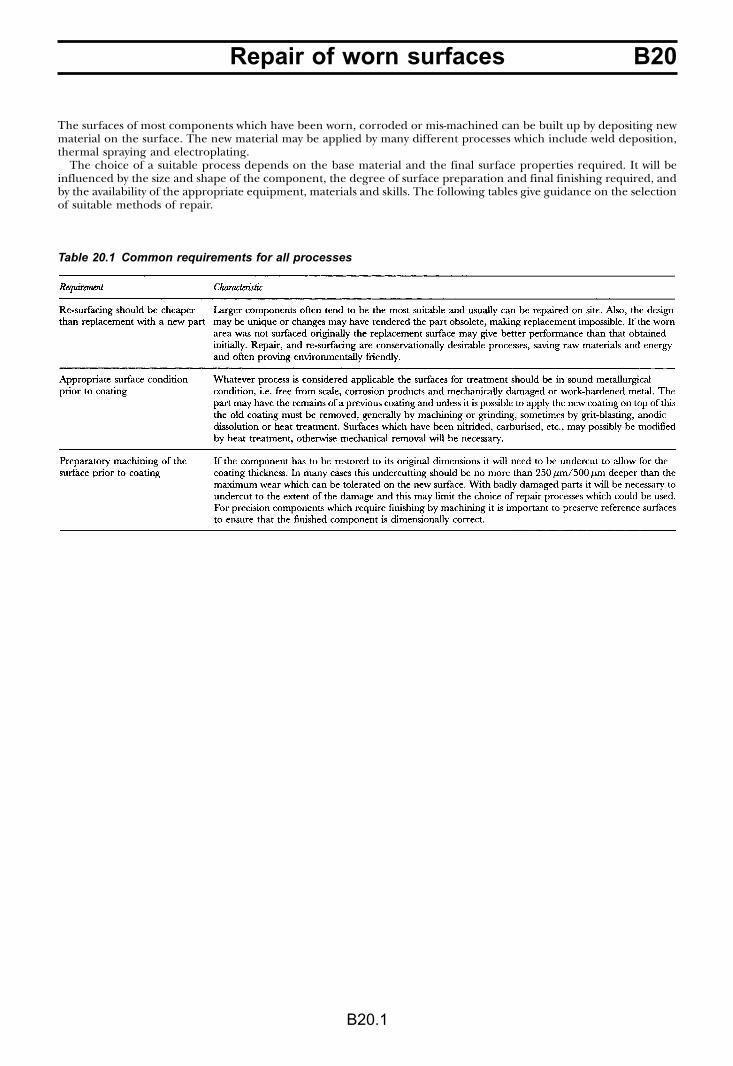
B20Repair of worn surfaces
B20.1
Table 20.1 Common requirements for all processes
The surfaces of most components which have been worn, corroded or mis-machined can be built up by depositing newmaterial on the surface. The new material may be applied by many different processes which include weld deposition,thermal spraying and electroplating.
The choice of a suitable process depends on the base material and the final surface properties required. It will beinfluenced by the size and shape of the component, the degree of surface preparation and final finishing required, andby the availability of the appropriate equipment, materials and skills. The following tables give guidance on the selectionof suitable methods of repair.
B20 Repair of worn surfaces
B20.2
Table 20.2 Factors affecting the choice of process
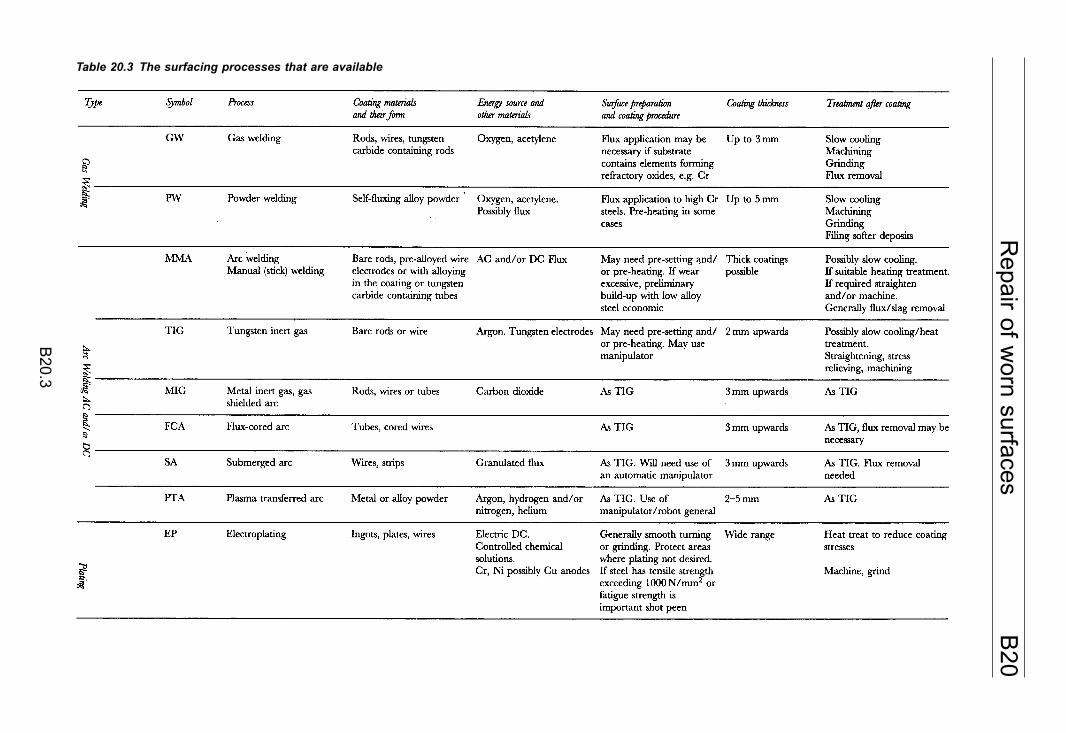
B20
Repair of w
orn surfaces
B20.3
Table 20.3 The surfacing processes that are available
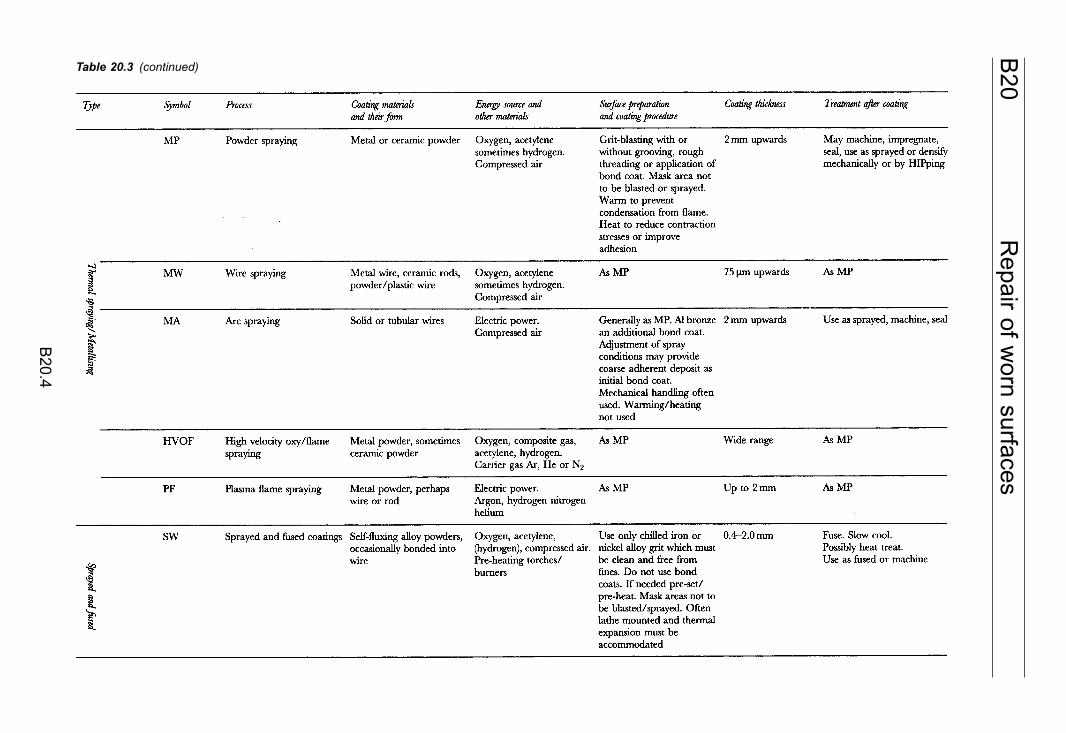
B20
Repair of w
orn surfaces
B20.4
Table 20.3 (continued)
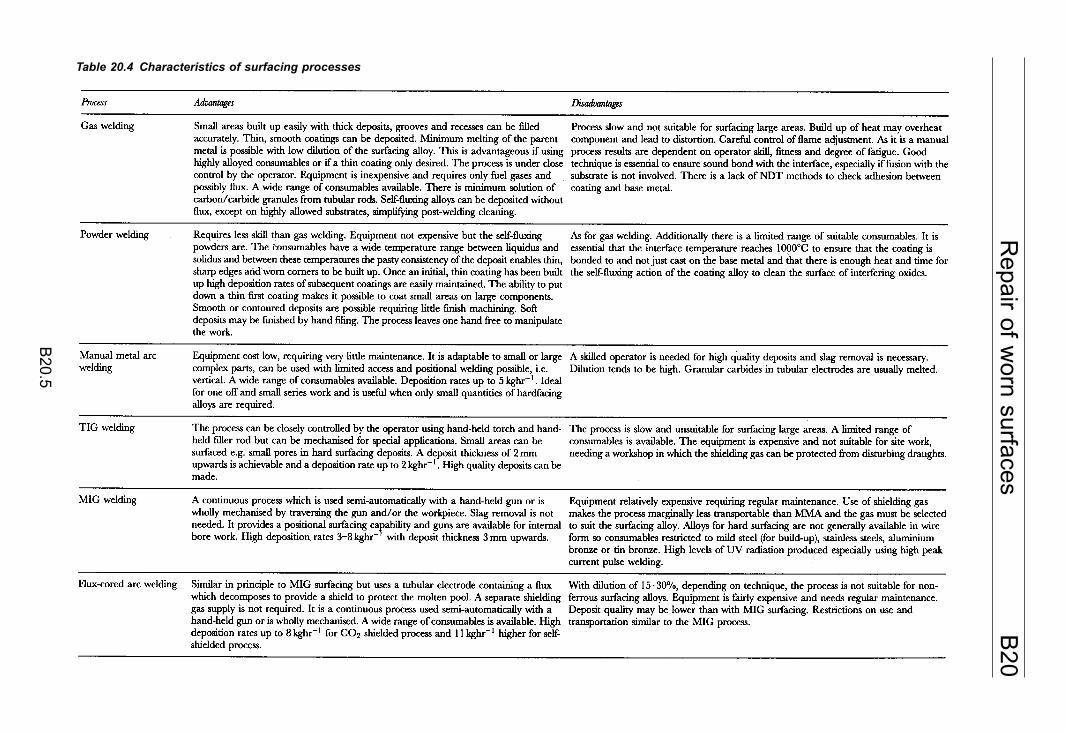
B20
Repair of w
orn surfaces
B20.5
Table 20.4 Characteristics of surfacing processes
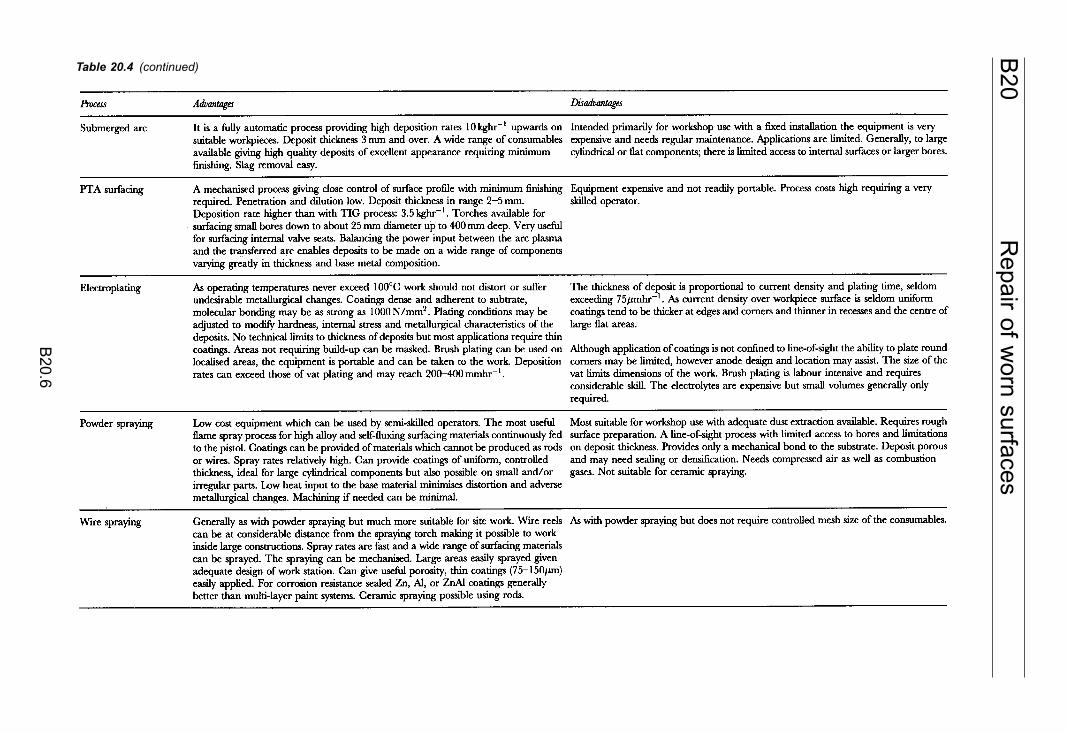
B20
Repair of w
orn surfaces
B20.6
Table 20.4 (continued)
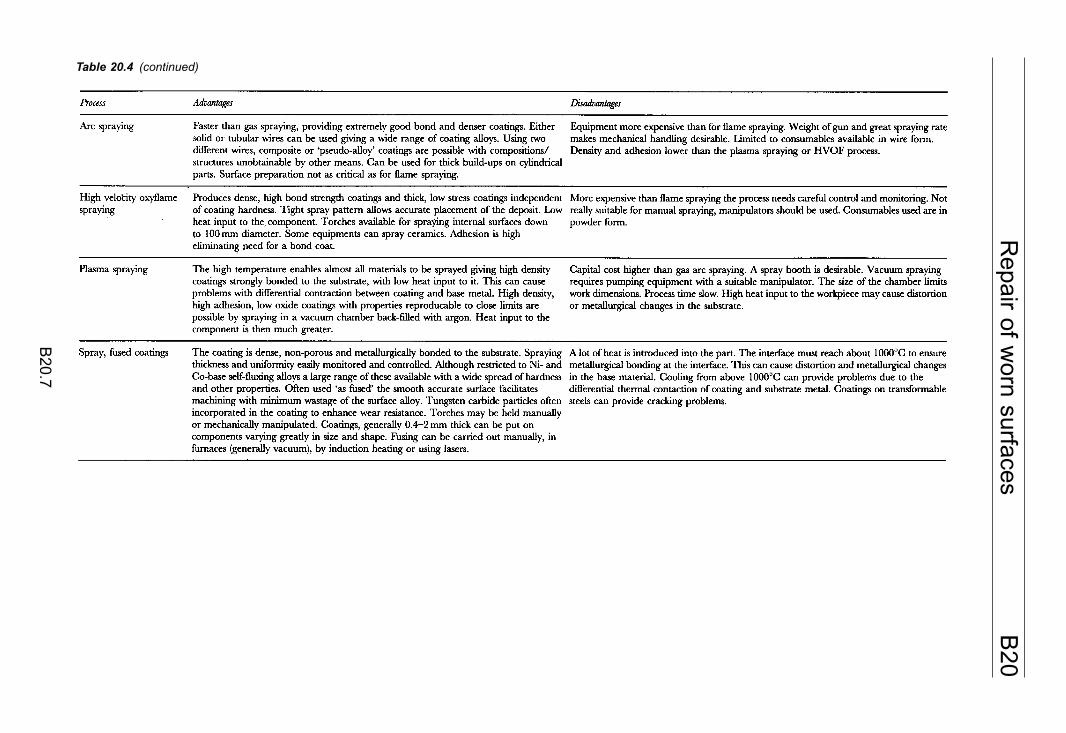
B20
Repair of w
orn surfaces
B20.7
Table 20.4 (continued)
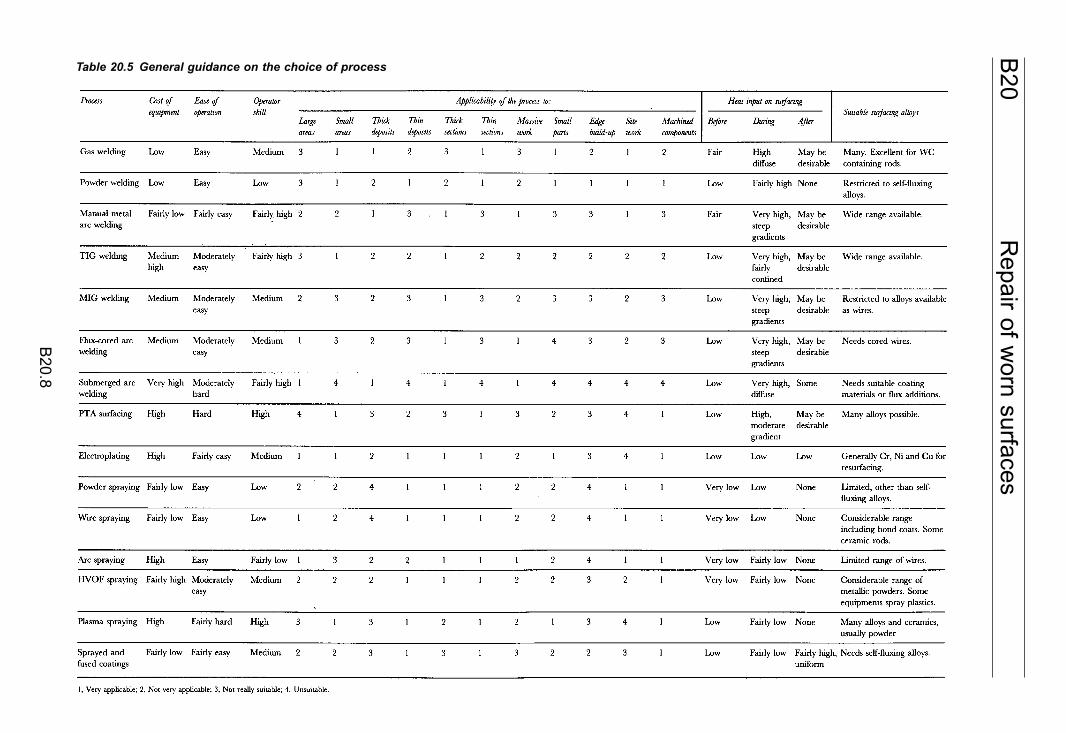
B20
Repair of w
orn surfaces
B20.8
Table 20.5 General guidance on the choice of process
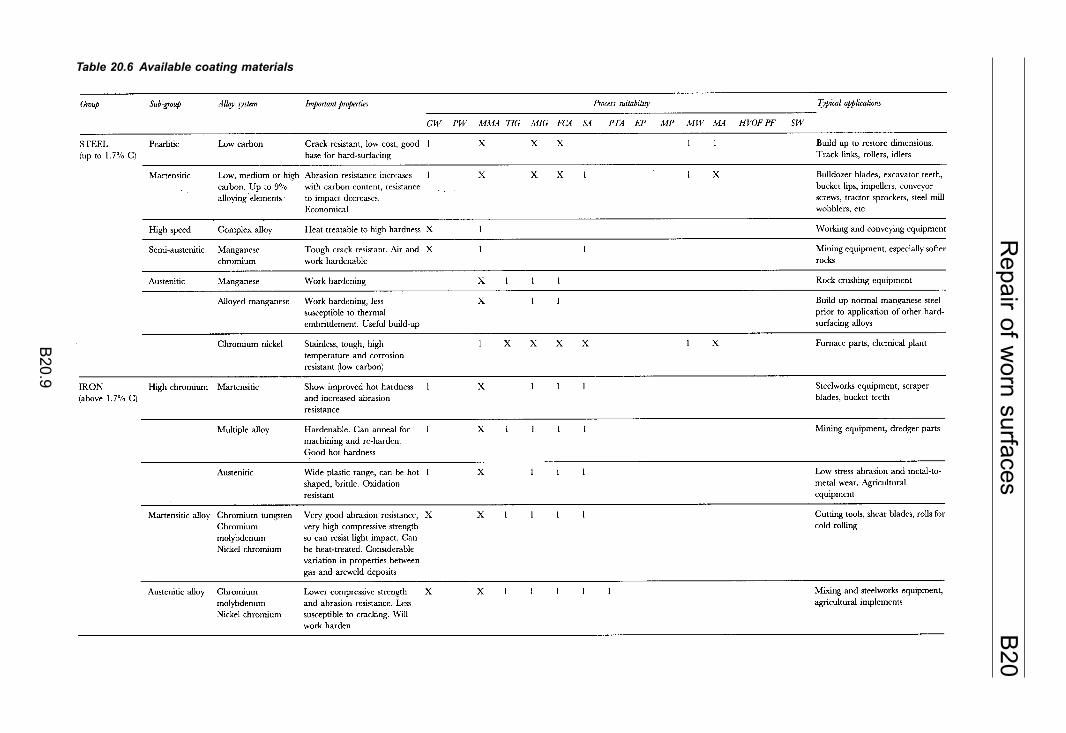
B20
Repair of w
orn surfaces
B20.9
Table 20.6 Available coating materials
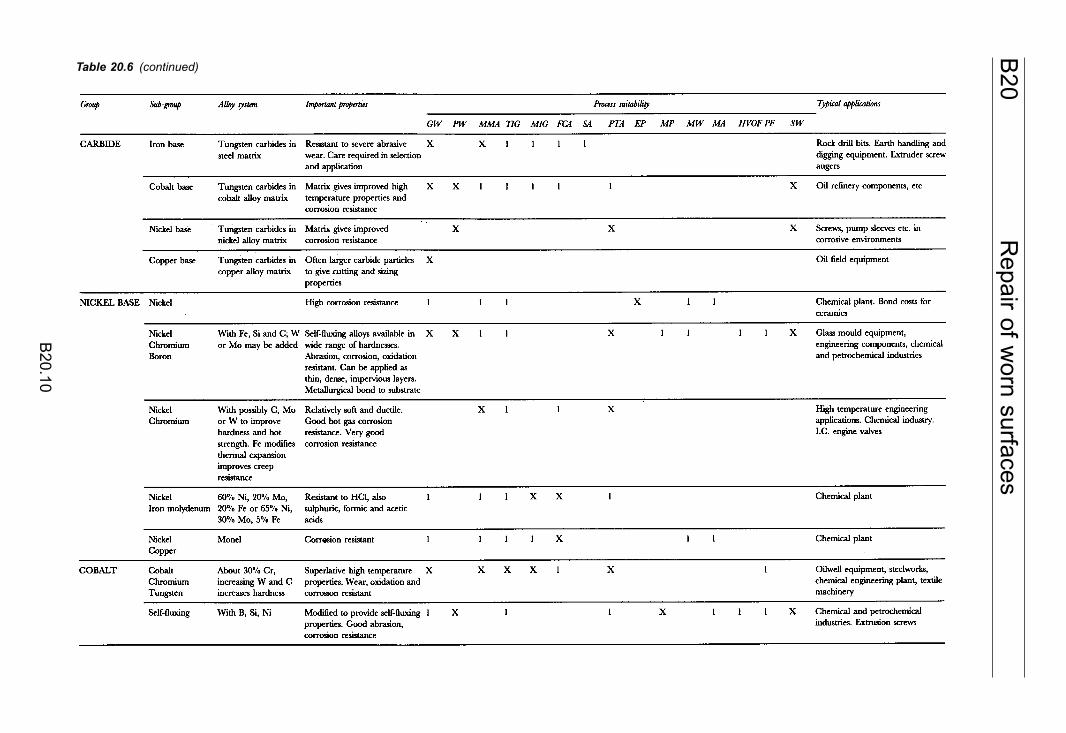
B20
Repair of w
orn surfaces
B20.10
Table 20.6 (continued)
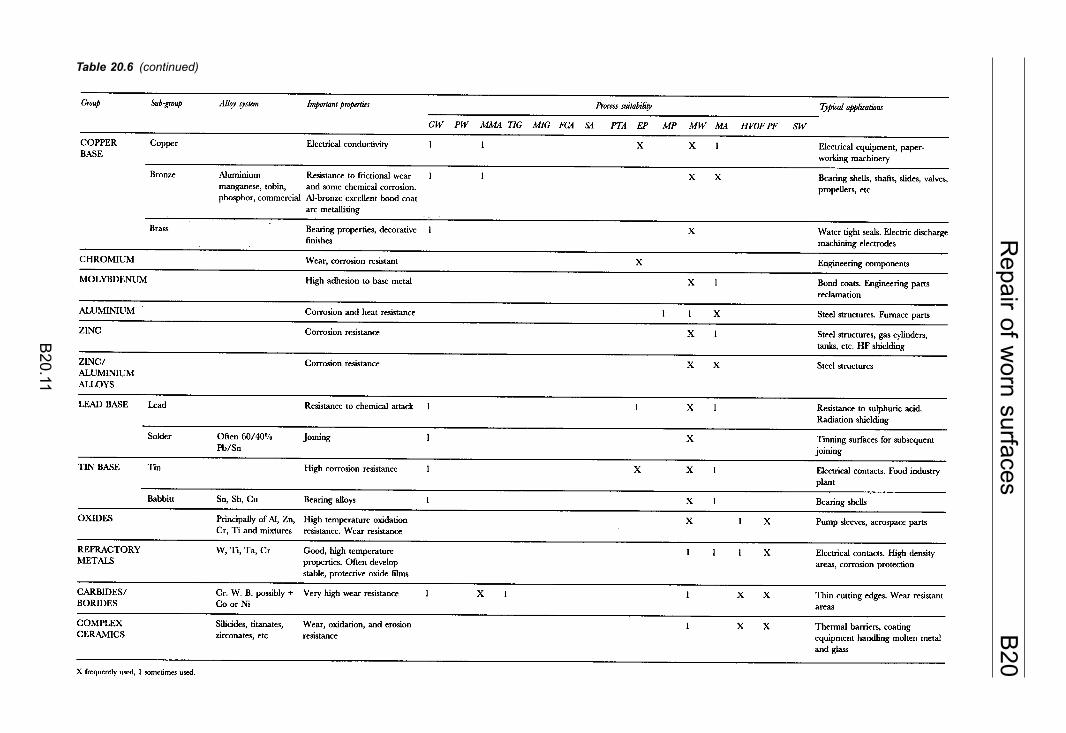
B20
Repair of w
orn surfaces
B20.11
Table 20.6 (continued)
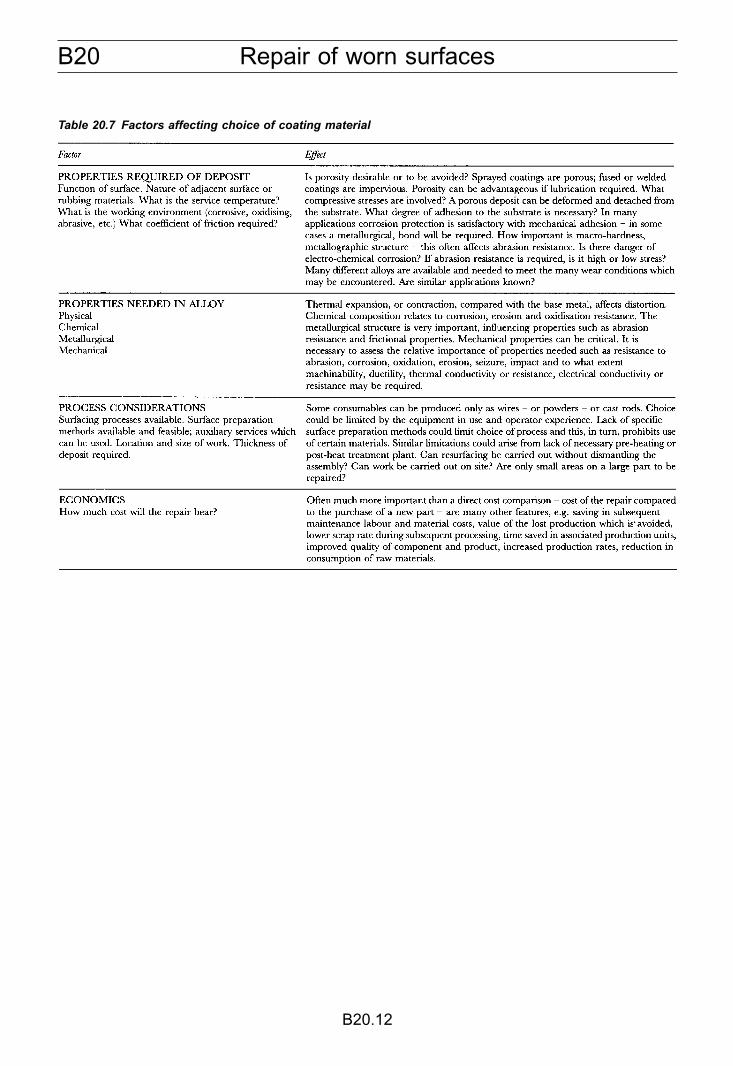
B20 Repair of worn surfaces
B20.12
Table 20.7 Factors affecting choice of coating material
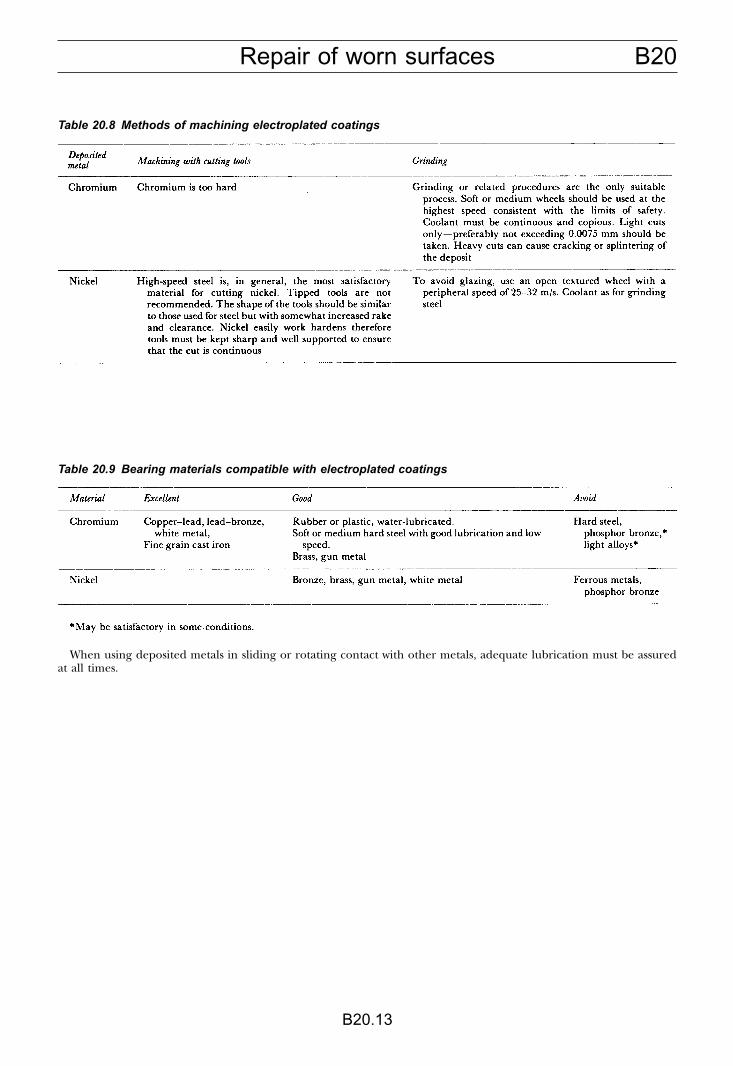
B20Repair of worn surfaces
B20.13
Table 20.8 Methods of machining electroplated coatings
Table 20.9 Bearing materials compatible with electroplated coatings
When using deposited metals in sliding or rotating contact with other metals, adequate lubrication must be assuredat all times.
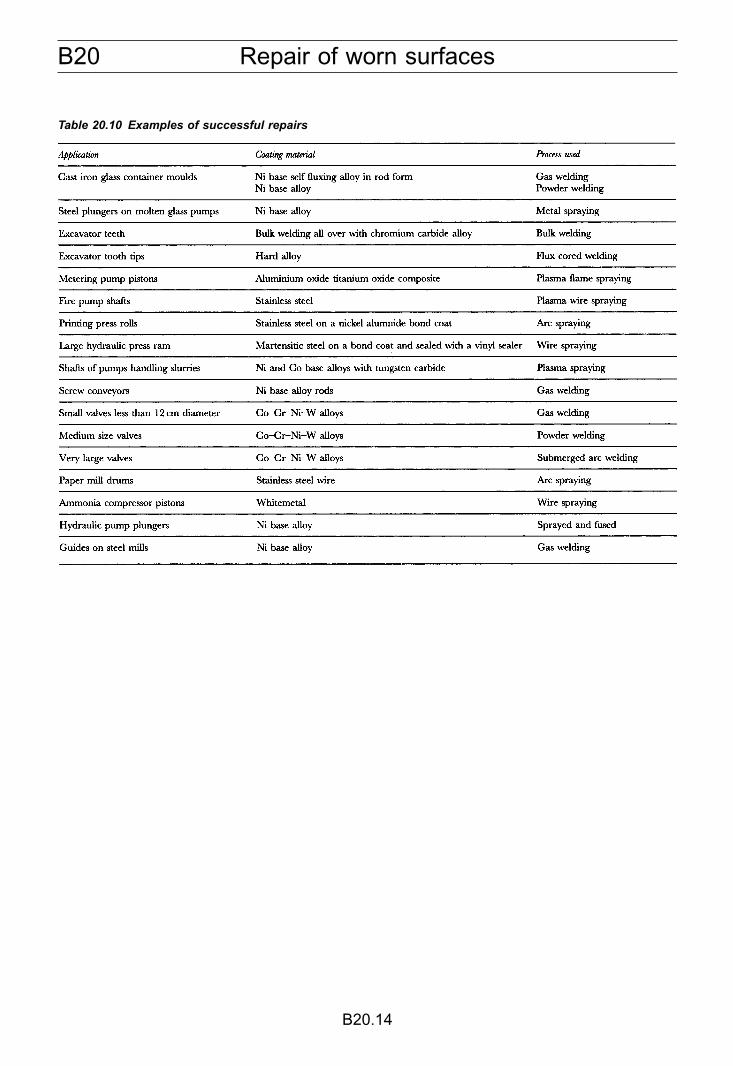
B20 Repair of worn surfaces
B20.14
Table 20.10 Examples of successful repairs
B21Wear resistant materials
B21.1
ABRASIVE WEAR
Abrasive wear is the loss of material from a surface thatresults from the motion of a hard material across thissurface.
There are several types of abrasive wear. Since theproperties required of a wear-resistant material willdepend on the type of wear the material has to withstand,a brief mention of these types of wear may be useful.
There are three main types of wear generally con-sidered: gouging abrasion (impact), Figure 21.1; high-stress abrasion (crushing), Figure 21.2; and low-stressabrasion (sliding), Figure 21.3. This classification ismade more on the basis of operating stresses than on theactual abrading action.
Gouging abrasion
This is wear that occurs when coarse material tears offsizeable particles from wearing surfaces. This normallyinvolves high imposed stresses and is most often encoun-tered when handling large lumps.
High-stress abrasion
This is encountered when two working surfaces rubtogether to crush granular abrasive materials. Grossloads may be low, while localised stresses are high.Moderate metal toughness is required; medium abrasionresistance is attainable.
Rubber now competes with metals as rod and ball milllinings with some success. Main advantages claimed arelonger life at a given cost, with no reduction inthroughput, lower noise level, reduced driving powerconsumption, less load on mill bearings and moreuniform wear on rods.
Low-stress abrasion
This occurs mainly where an abrasive material slidesfreely over a surface, such as in chutes, bunkers, hoppers,skip cars, or in erosive conditions. Toughness require-ments are low, and the attainable abrasion resistance ishigh.
Figure 21.1 Types of gouging abrasion
Figure 21.2 Types of high-stress abrasion: (a) rodand ball mills; (b) roll crushing
Figure 21.3 Low-stress abrasion
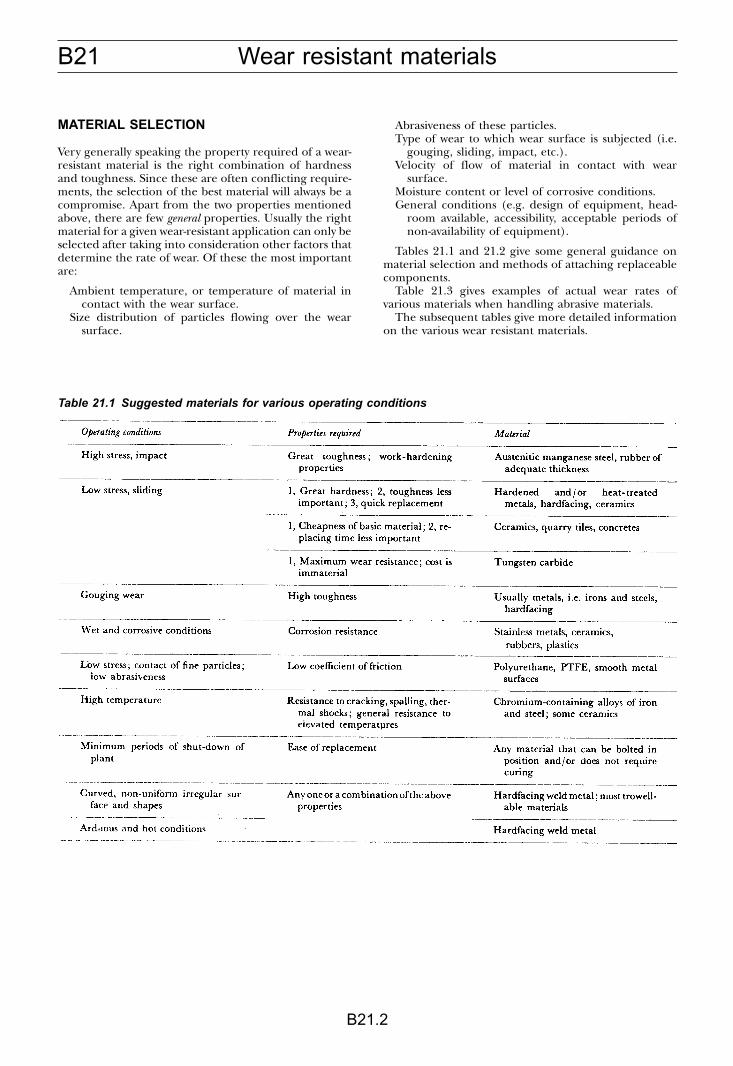
B21 Wear resistant materials
B21.2
MATERIAL SELECTION
Very generally speaking the property required of a wear-resistant material is the right combination of hardnessand toughness. Since these are often conflicting require-ments, the selection of the best material will always be acompromise. Apart from the two properties mentionedabove, there are few general properties. Usually the rightmaterial for a given wear-resistant application can only beselected after taking into consideration other factors thatdetermine the rate of wear. Of these the most importantare:
Ambient temperature, or temperature of material incontact with the wear surface.
Size distribution of particles flowing over the wearsurface.
Abrasiveness of these particles.Type of wear to which wear surface is subjected (i.e.
gouging, sliding, impact, etc.).Velocity of flow of material in contact with wear
surface.Moisture content or level of corrosive conditions.General conditions (e.g. design of equipment, head-
room available, accessibility, acceptable periods ofnon-availability of equipment).
Tables 21.1 and 21.2 give some general guidance onmaterial selection and methods of attaching replaceablecomponents.
Table 21.3 gives examples of actual wear rates ofvarious materials when handling abrasive materials.
The subsequent tables give more detailed informationon the various wear resistant materials.
Table 21.1 Suggested materials for various operating conditions
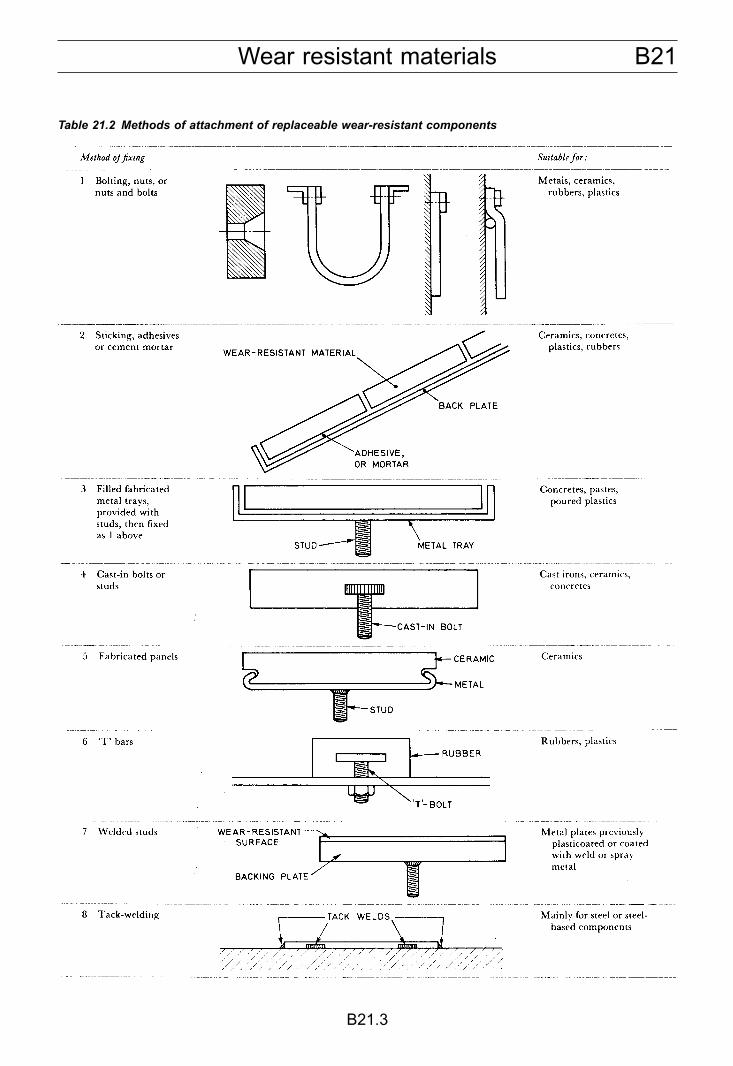
B21Wear resistant materials
B21.3
Table 21.2 Methods of attachment of replaceable wear-resistant components
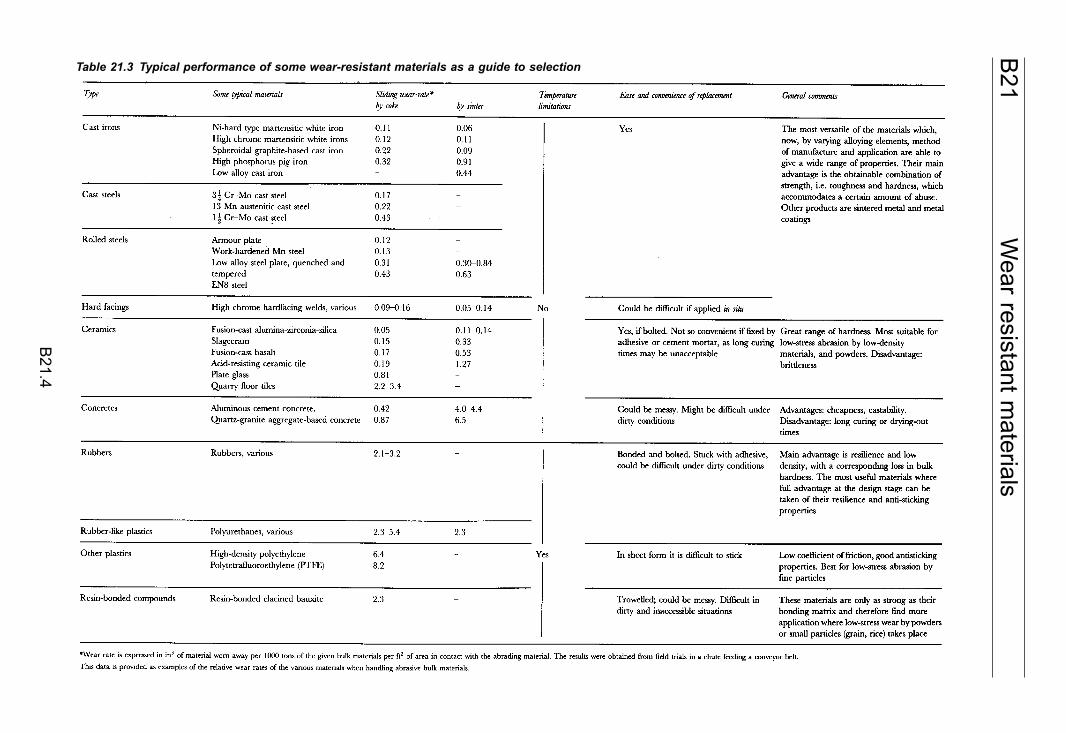
B21
Wear resistant m
aterials
B21.4
Table 21.3 Typical performance of some wear-resistant materials as a guide to selection
B21Wear resistant materials
B21.5
The following tables give more detailed information on the materials listed in Table 21.3 with examples of some typicalapplications in which they have been used successfully.
When selecting the materials for other applications, it is important to identify the wear mechanism involved as this isa major factor in the choice of an optimum material. Further guidance on this is given in Table 21.1.
Table 21.4 Cast irons
B21 Wear resistant materials
B21.6
Table 21.5 Cast steels
Table 21.6 Rolled steels
B21Wear resistant materials
B21.7
Table 21.7 Wear resistant coatings for steel
B21 Wear resistant materials
B21.8
Table 21.8 Some typical wear resistant hardfacing rods and electrodes
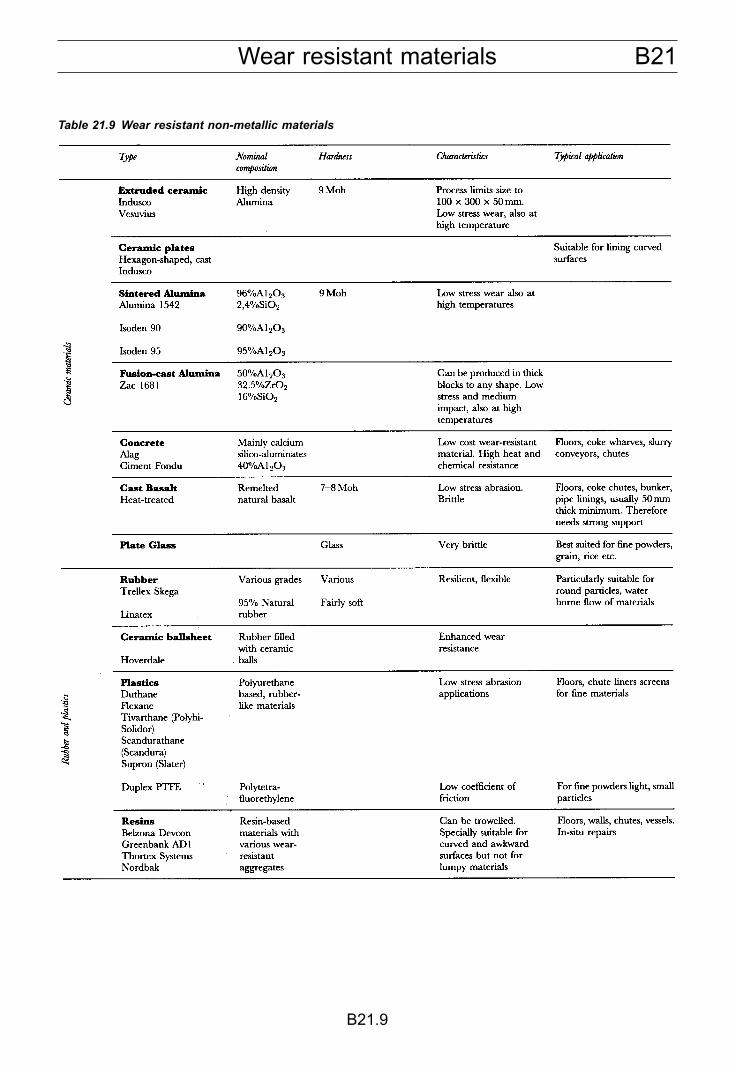
B21Wear resistant materials
B21.9
Table 21.9 Wear resistant non-metallic materials
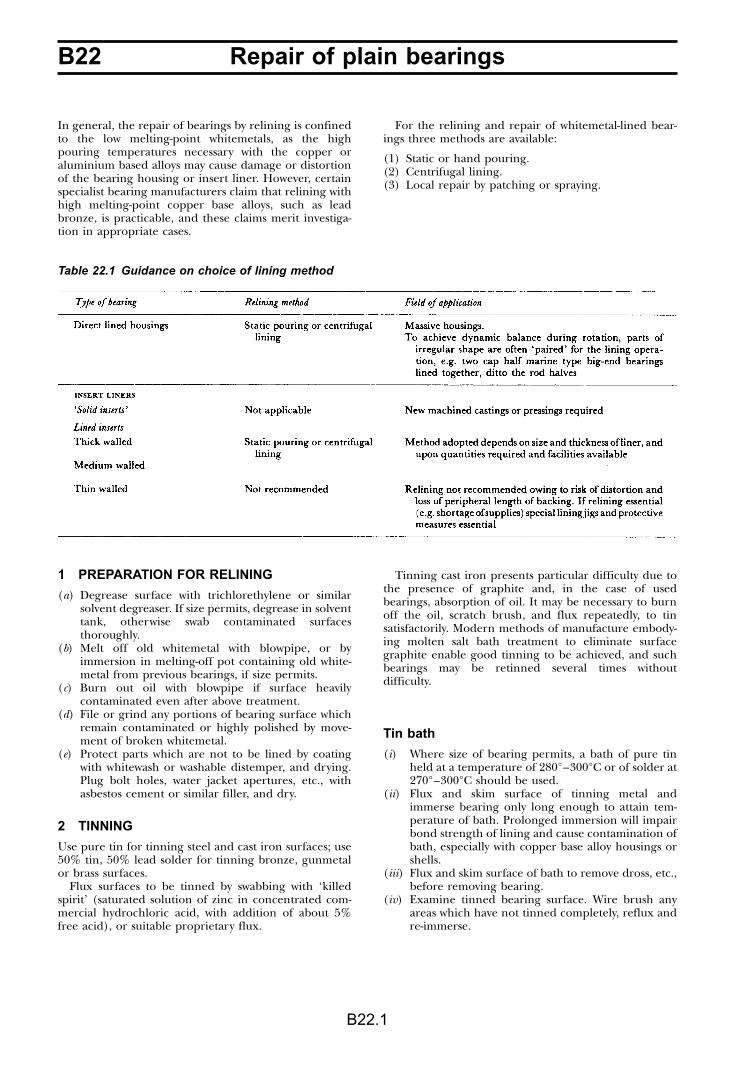
B22 Repair of plain bearings
B22.1
In general, the repair of bearings by relining is confinedto the low melting-point whitemetals, as the highpouring temperatures necessary with the copper oraluminium based alloys may cause damage or distortionof the bearing housing or insert liner. However, certainspecialist bearing manufacturers claim that relining withhigh melting-point copper base alloys, such as leadbronze, is practicable, and these claims merit investiga-tion in appropriate cases.
For the relining and repair of whitemetal-lined bear-ings three methods are available:
(1) Static or hand pouring.(2) Centrifugal lining.(3) Local repair by patching or spraying.
1 PREPARATION FOR RELINING
(a) Degrease surface with trichlorethylene or similarsolvent degreaser. If size permits, degrease in solventtank, otherwise swab contaminated surfacesthoroughly.
(b) Melt off old whitemetal with blowpipe, or byimmersion in melting-off pot containing old white-metal from previous bearings, if size permits.
(c) Burn out oil with blowpipe if surface heavilycontaminated even after above treatment.
(d) File or grind any portions of bearing surface whichremain contaminated or highly polished by move-ment of broken whitemetal.
(e) Protect parts which are not to be lined by coatingwith whitewash or washable distemper, and drying.Plug bolt holes, water jacket apertures, etc., withasbestos cement or similar filler, and dry.
2 TINNING
Use pure tin for tinning steel and cast iron surfaces; use50% tin, 50% lead solder for tinning bronze, gunmetalor brass surfaces.
Flux surfaces to be tinned by swabbing with ‘killedspirit’ (saturated solution of zinc in concentrated com-mercial hydrochloric acid, with addition of about 5%free acid), or suitable proprietary flux.
Tinning cast iron presents particular difficulty due tothe presence of graphite and, in the case of usedbearings, absorption of oil. It may be necessary to burnoff the oil, scratch brush, and flux repeatedly, to tinsatisfactorily. Modern methods of manufacture embody-ing molten salt bath treatment to eliminate surfacegraphite enable good tinning to be achieved, and suchbearings may be retinned several times withoutdifficulty.
Tin bath
(i) Where size of bearing permits, a bath of pure tinheld at a temperature of 280°–300°C or of solder at270°–300°C should be used.
(ii) Flux and skim surface of tinning metal andimmerse bearing only long enough to attain tem-perature of bath. Prolonged immersion will impairbond strength of lining and cause contamination ofbath, especially with copper base alloy housings orshells.
(iii) Flux and skim surface of bath to remove dross, etc.,before removing bearing.
(iv) Examine tinned bearing surface. Wire brush anyareas which have not tinned completely, reflux andre-immerse.
Table 22.1 Guidance on choice of lining method
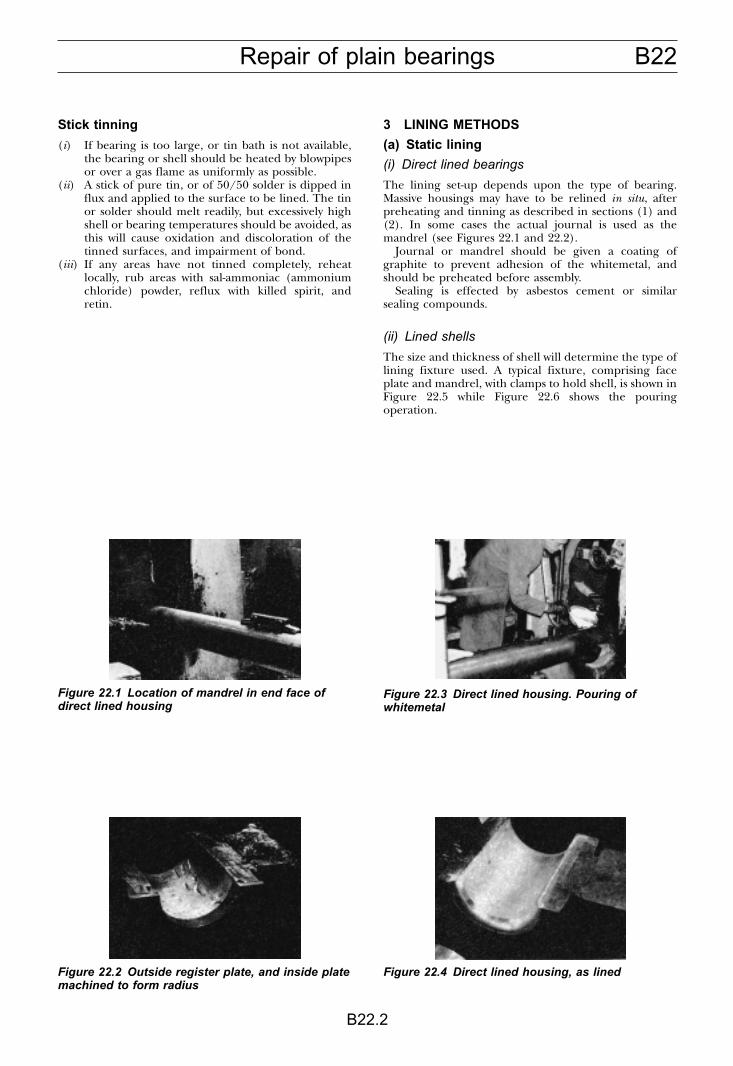
B22Repair of plain bearings
B22.2
Stick tinning
(i) If bearing is too large, or tin bath is not available,the bearing or shell should be heated by blowpipesor over a gas flame as uniformly as possible.
(ii) A stick of pure tin, or of 50/50 solder is dipped influx and applied to the surface to be lined. The tinor solder should melt readily, but excessively highshell or bearing temperatures should be avoided, asthis will cause oxidation and discoloration of thetinned surfaces, and impairment of bond.
(iii) If any areas have not tinned completely, reheatlocally, rub areas with sal-ammoniac (ammoniumchloride) powder, reflux with killed spirit, andretin.
3 LINING METHODS
(a) Static lining
(i) Direct lined bearings
The lining set-up depends upon the type of bearing.Massive housings may have to be relined in situ, afterpreheating and tinning as described in sections (1) and(2). In some cases the actual journal is used as themandrel (see Figures 22.1 and 22.2).
Journal or mandrel should be given a coating ofgraphite to prevent adhesion of the whitemetal, andshould be preheated before assembly.
Sealing is effected by asbestos cement or similarsealing compounds.
(ii) Lined shells
The size and thickness of shell will determine the type oflining fixture used. A typical fixture, comprising faceplate and mandrel, with clamps to hold shell, is shown inFigure 22.5 while Figure 22.6 shows the pouringoperation.
Figure 22.1 Location of mandrel in end face ofdirect lined housing
Figure 22.2 Outside register plate, and inside platemachined to form radius
Figure 22.3 Direct lined housing. Pouring ofwhitemetal
Figure 22.4 Direct lined housing, as lined
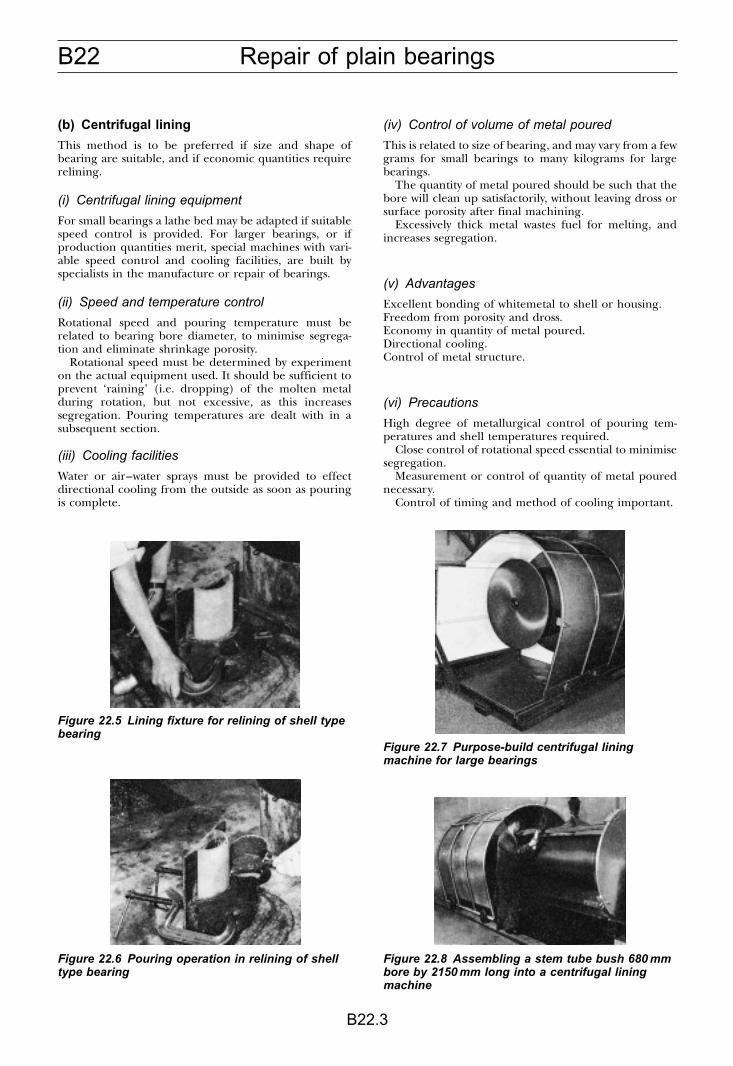
B22 Repair of plain bearings
B22.3
(b) Centrifugal lining
This method is to be preferred if size and shape ofbearing are suitable, and if economic quantities requirerelining.
(i) Centrifugal lining equipment
For small bearings a lathe bed may be adapted if suitablespeed control is provided. For larger bearings, or ifproduction quantities merit, special machines with vari-able speed control and cooling facilities, are built byspecialists in the manufacture or repair of bearings.
(ii) Speed and temperature control
Rotational speed and pouring temperature must berelated to bearing bore diameter, to minimise segrega-tion and eliminate shrinkage porosity.
Rotational speed must be determined by experimenton the actual equipment used. It should be sufficient toprevent ‘raining’ (i.e. dropping) of the molten metalduring rotation, but not excessive, as this increasessegregation. Pouring temperatures are dealt with in asubsequent section.
(iii) Cooling facilities
Water or air–water sprays must be provided to effectdirectional cooling from the outside as soon as pouringis complete.
(iv) Control of volume of metal poured
This is related to size of bearing, and may vary from a fewgrams for small bearings to many kilograms for largebearings.
The quantity of metal poured should be such that thebore will clean up satisfactorily, without leaving dross orsurface porosity after final machining.
Excessively thick metal wastes fuel for melting, andincreases segregation.
(v) Advantages
Excellent bonding of whitemetal to shell or housing.Freedom from porosity and dross.Economy in quantity of metal poured.Directional cooling.Control of metal structure.
(vi) Precautions
High degree of metallurgical control of pouring tem-peratures and shell temperatures required.
Close control of rotational speed essential to minimisesegregation.
Measurement or control of quantity of metal pourednecessary.
Control of timing and method of cooling important.
Figure 22.5 Lining fixture for relining of shell typebearing
Figure 22.6 Pouring operation in relining of shelltype bearing
Figure 22.7 Purpose-build centrifugal liningmachine for large bearings
Figure 22.8 Assembling a stem tube bush 680 mmbore by 2150 mm long into a centrifugal liningmachine
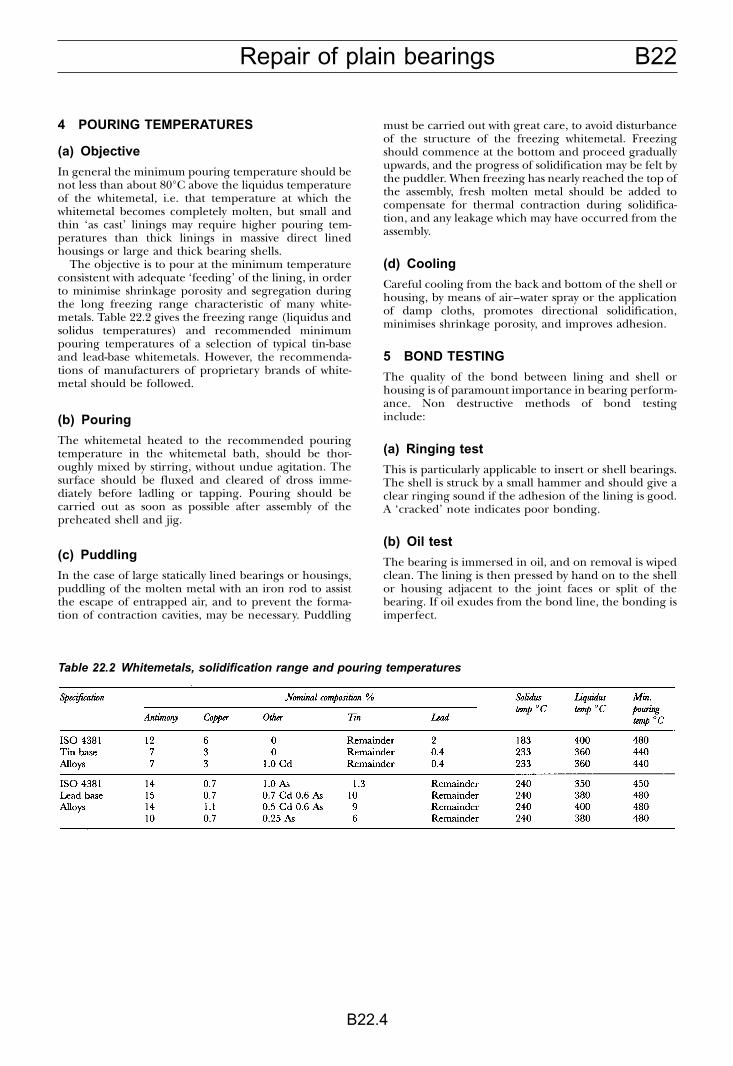
B22Repair of plain bearings
B22.4
4 POURING TEMPERATURES
(a) Objective
In general the minimum pouring temperature should benot less than about 80°C above the liquidus temperatureof the whitemetal, i.e. that temperature at which thewhitemetal becomes completely molten, but small andthin ‘as cast’ linings may require higher pouring tem-peratures than thick linings in massive direct linedhousings or large and thick bearing shells.
The objective is to pour at the minimum temperatureconsistent with adequate ‘feeding’ of the lining, in orderto minimise shrinkage porosity and segregation duringthe long freezing range characteristic of many white-metals. Table 22.2 gives the freezing range (liquidus andsolidus temperatures) and recommended minimumpouring temperatures of a selection of typical tin-baseand lead-base whitemetals. However, the recommenda-tions of manufacturers of proprietary brands of white-metal should be followed.
(b) Pouring
The whitemetal heated to the recommended pouringtemperature in the whitemetal bath, should be thor-oughly mixed by stirring, without undue agitation. Thesurface should be fluxed and cleared of dross imme-diately before ladling or tapping. Pouring should becarried out as soon as possible after assembly of thepreheated shell and jig.
(c) Puddling
In the case of large statically lined bearings or housings,puddling of the molten metal with an iron rod to assistthe escape of entrapped air, and to prevent the forma-tion of contraction cavities, may be necessary. Puddling
must be carried out with great care, to avoid disturbanceof the structure of the freezing whitemetal. Freezingshould commence at the bottom and proceed graduallyupwards, and the progress of solidification may be felt bythe puddler. When freezing has nearly reached the top ofthe assembly, fresh molten metal should be added tocompensate for thermal contraction during solidifica-tion, and any leakage which may have occurred from theassembly.
(d) Cooling
Careful cooling from the back and bottom of the shell orhousing, by means of air–water spray or the applicationof damp cloths, promotes directional solidification,minimises shrinkage porosity, and improves adhesion.
5 BOND TESTING
The quality of the bond between lining and shell orhousing is of paramount importance in bearing perform-ance. Non destructive methods of bond testinginclude:
(a) Ringing test
This is particularly applicable to insert or shell bearings.The shell is struck by a small hammer and should give aclear ringing sound if the adhesion of the lining is good.A ‘cracked’ note indicates poor bonding.
(b) Oil test
The bearing is immersed in oil, and on removal is wipedclean. The lining is then pressed by hand on to the shellor housing adjacent to the joint faces or split of thebearing. If oil exudes from the bond line, the bonding isimperfect.
Table 22.2 Whitemetals, solidification range and pouring temperatures
B22 Repair of plain bearings
B22.5
(c) Ultrasonic test
This requires specialised equipment. A probe is heldagainst the lined surface of the bearing, and the echopattern resulting from ultrasonic vibration of the probeis observed on a cathode ray tube. If the bond issatisfactory the echo occurs from the back of the shell orhousing, and its position is noted on the C.R.T. If thebond is imperfect, i.e. discontinuous, the echo occurs atthe interface between lining and backing, and thedifferent position on the C.R.T. is clearly observable.This is a very searching method on linings of appropriatethickness, and will detect small local areas of poorbonding. However, training of the operator in the use ofthe equipment, and advice regarding suitable bearingsizes and lining thicknesses, must be obtained from theequipment manufacturers.
This method of test which is applicable to steel backedbearings is described in ISO 4386-1 (BS 7585 Pt 1). It isnot very suitable for cast iron backed bearings becausethe cast iron dissipates the signal rather than reflecting it.For this material it is better to use a gamma ray sourcecalibrated by the use of step wedges.
(d) Galvanometer method
An electric current is passed through the lining byprobes pressed against the lining bore, and the resistancebetween intermediate probes is measured on an ohm-meter. Discontinuities at the bond line cause a change ofresistance. Again, specialised equipment and operatortraining and advice are required, but the method issearching and rapid within the scope laid down by theequipment manufacturers.
6 LOCAL REPAIR BY PATCHING ORSPRAYING
In the case of large bearings, localised repair of smallareas of whitemetal, which have cracked or broken out,may be carried out by patching using stick whitemetaland a blowpipe, or by spraying whitemetal into the cavityand remelting with a blowpipe. In both cases great caremust be taken to avoid disruption of the bond in thevicinity of the affected area, while ensuring that fusion ofthe deposited metal to the adjacent lining is achieved.
The surface to be repaired should be tinned asdescribed in section (2) prior to deposition of thepatching metal. Entrapment of flux must be avoided.
The whitemetal used for patching should, if possible,be of the same composition as the original lining.
Patching of areas situated in the positions of peakloadings of heavy duty bearings, such as main propulsiondiesel engine big-end bearings, is not recommended. Forsuch cases complete relining by one of the methodsdescribed previously is to be preferred.
THE PRINCIPLE OF REPLACEMENTBEARING SHELLS
Replacement bearing shells, usually steel-backed, andlined with whitemetal (tin or lead-base), copper lead,lead bronze, or aluminium alloy, are precision compo-nents, finish machined on the backs and joint faces toclose tolerances such that they may be fitted directly intoappropriate housings machined to specifieddimensions.
The bores of the shells may also be finish machined, inwhich case they are called ‘prefinished bearings’ readyfor assembly with shafts or journals of specified dimen-sions to provide the appropriate running clearance forthe given application.
In cases where it is desired to bore in situ, tocompensate for misalignment or housing distortion, theshells may be provided with a boring allowance and arethen known as ‘reboreable’ liners or shells.
The advantages of replacement bearing shells may besummarised as follows:
1 Elimination of hand fitting during assembly withconsequent labour saving, and greater precision ofbearing contour.
2 Close control of interference fit and runningclearance.
3 Easy replacement.4 Elimination of necessity for provision of relining and
machining facilities.5 Spares may be carried, with saving of bulk and
weight.6 Lower ultimate cost than that of direct lined housings
or rods.
Special note
‘Prefinished’ bearing shells must not be rebored in situunless specifically stated in the maker’s catalogue, asmany modern bearings have very thin linings to enhanceload carrying capacity, or may be of the overlay platedtype. In the first case reboring could result in completeremoval of the lining, while reboring of overlay-platedbearings would remove the overlay and change thecharacteristics of the bearing.
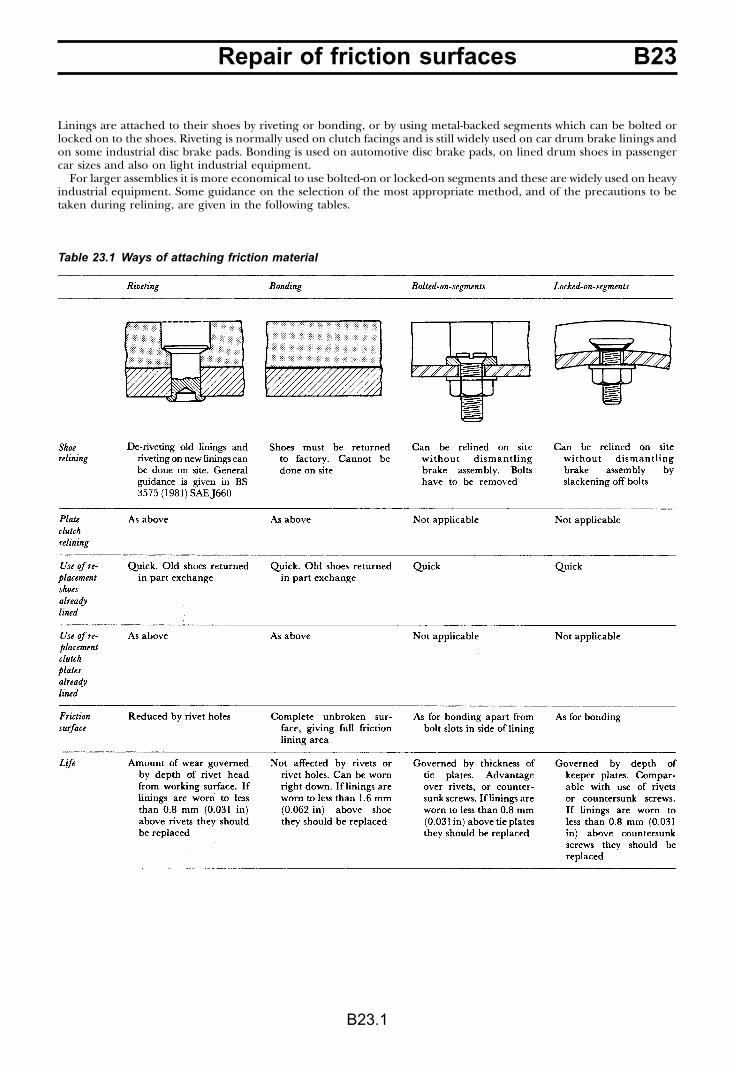
B23Repair of friction surfaces
B23.1
Table 23.1 Ways of attaching friction material
Linings are attached to their shoes by riveting or bonding, or by using metal-backed segments which can be bolted orlocked on to the shoes. Riveting is normally used on clutch facings and is still widely used on car drum brake linings andon some industrial disc brake pads. Bonding is used on automotive disc brake pads, on lined drum shoes in passengercar sizes and also on light industrial equipment.
For larger assemblies it is more economical to use bolted-on or locked-on segments and these are widely used on heavyindustrial equipment. Some guidance on the selection of the most appropriate method, and of the precautions to betaken during relining, are given in the following tables.
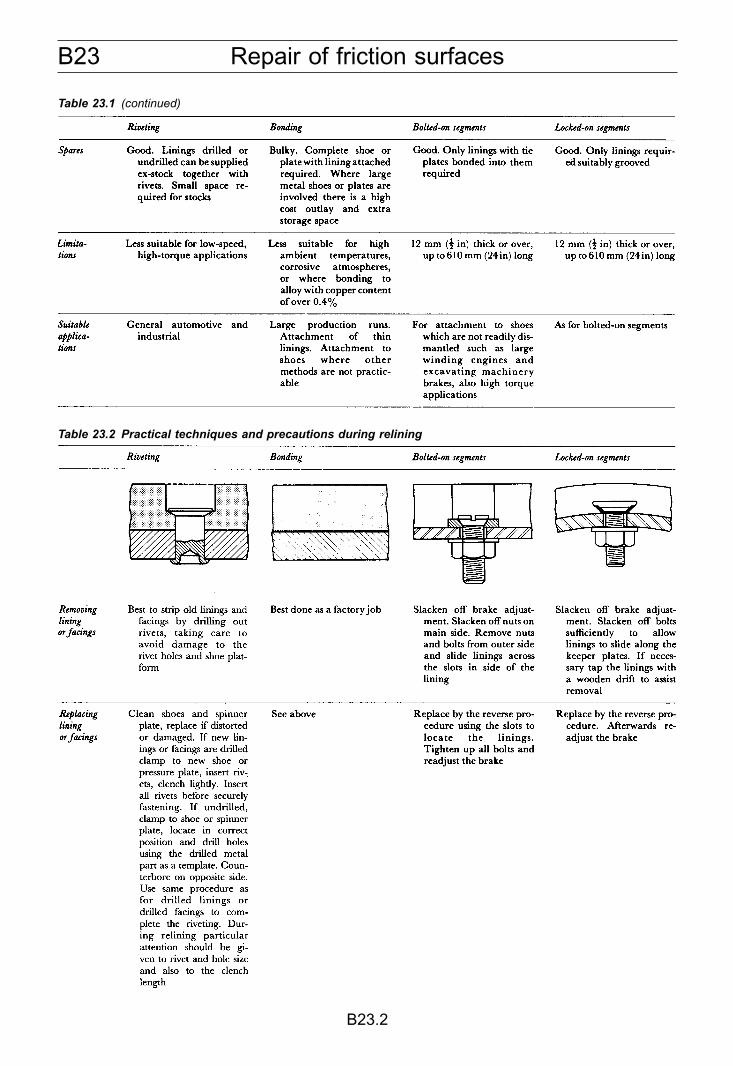
B23 Repair of friction surfaces
B23.2
Table 23.1 (continued)
Table 23.2 Practical techniques and precautions during relining
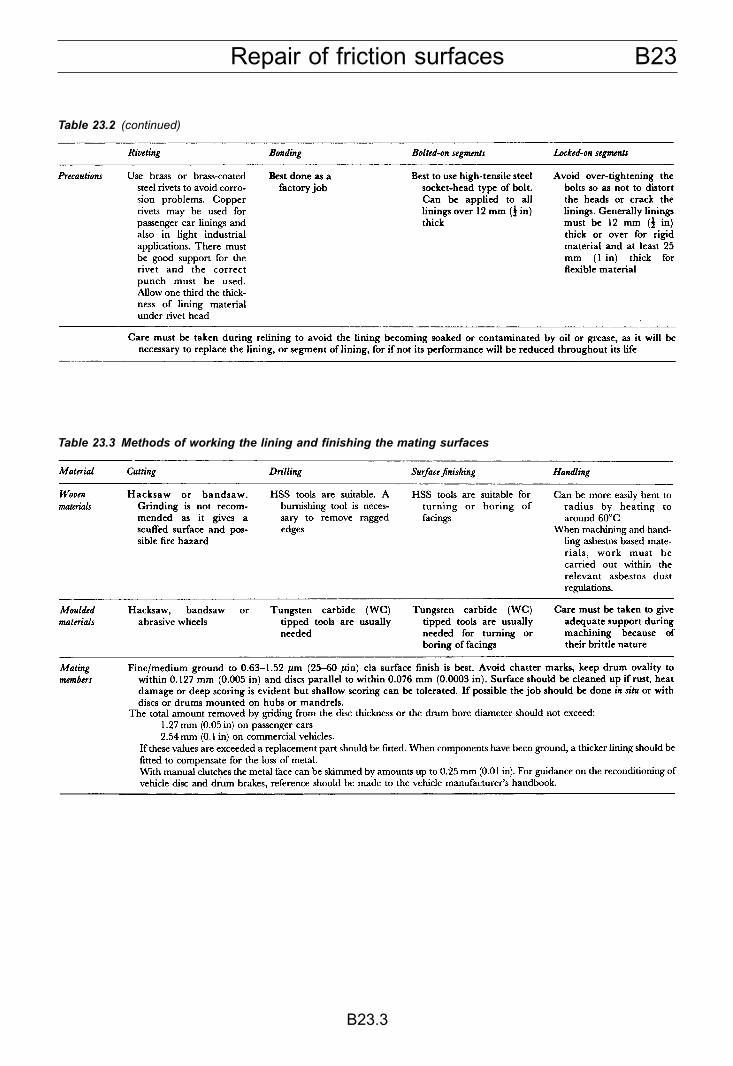
B23Repair of friction surfaces
B23.3
Table 23.2 (continued)
Table 23.3 Methods of working the lining and finishing the mating surfaces

This Page Intentionally Left Blank
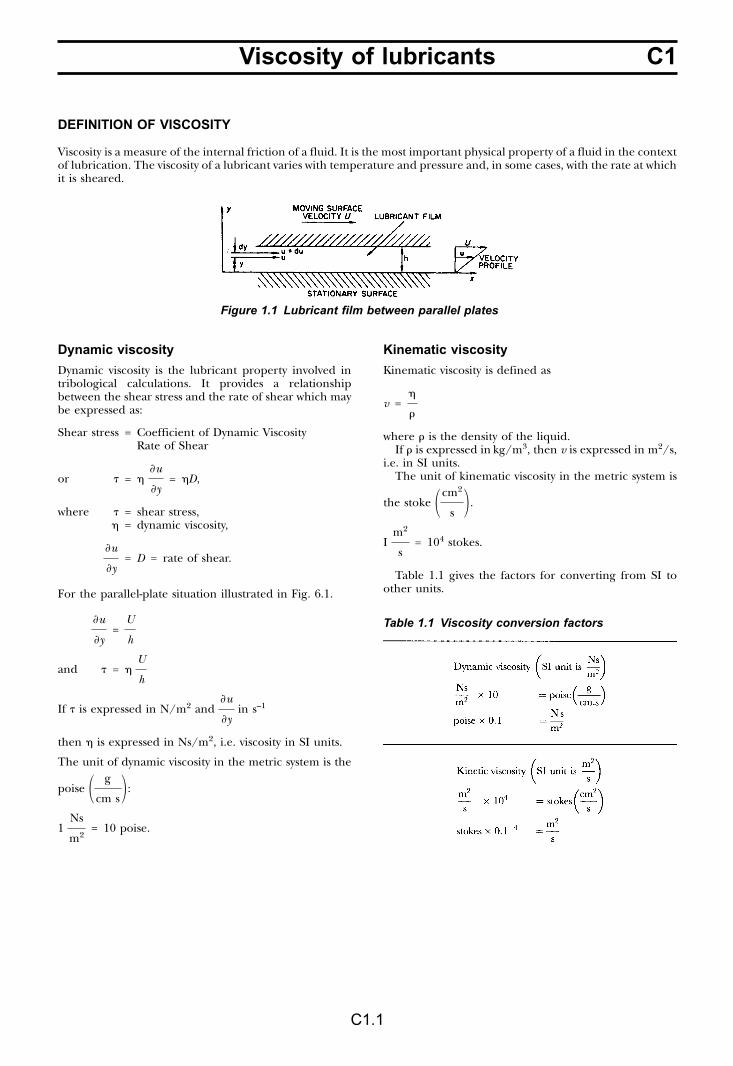
C1Viscosity of lubricants
C1.1
DEFINITION OF VISCOSITY
Viscosity is a measure of the internal friction of a fluid. It is the most important physical property of a fluid in the contextof lubrication. The viscosity of a lubricant varies with temperature and pressure and, in some cases, with the rate at whichit is sheared.
Dynamic viscosity
Dynamic viscosity is the lubricant property involved intribological calculations. It provides a relationshipbetween the shear stress and the rate of shear which maybe expressed as:
Shear stress = Coefficient of Dynamic Viscosity �Rate of Shear
or � = � u
y= �D,
where � = shear stress,� = dynamic viscosity,
u
y= D = rate of shear.
For the parallel-plate situation illustrated in Fig. 6.1.
u
y=
U
h
and � = �U
h
If � is expressed in N/m2 and u
yin s–1
then � is expressed in Ns/m2, i.e. viscosity in SI units.
The unit of dynamic viscosity in the metric system is the
poise � g
cm s� :
1Ns
m2= 10 poise.
Kinematic viscosity
Kinematic viscosity is defined as
v =�
�
where � is the density of the liquid.If � is expressed in kg/m3, then v is expressed in m2/s,
i.e. in SI units.The unit of kinematic viscosity in the metric system is
the stoke �cm2
s � .
Im2
s= 104 stokes.
Table 1.1 gives the factors for converting from SI toother units.
Figure 1.1 Lubricant film between parallel plates
Table 1.1 Viscosity conversion factors
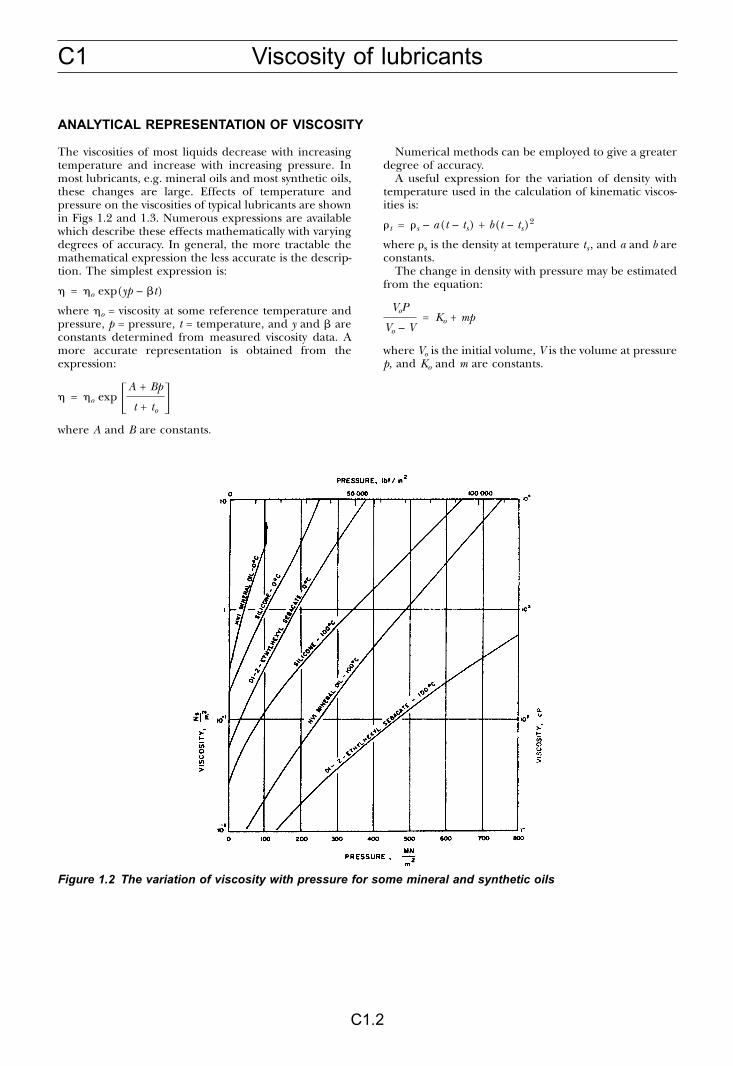
C1 Viscosity of lubricants
C1.2
ANALYTICAL REPRESENTATION OF VISCOSITY
The viscosities of most liquids decrease with increasingtemperature and increase with increasing pressure. Inmost lubricants, e.g. mineral oils and most synthetic oils,these changes are large. Effects of temperature andpressure on the viscosities of typical lubricants are shownin Figs 1.2 and 1.3. Numerous expressions are availablewhich describe these effects mathematically with varyingdegrees of accuracy. In general, the more tractable themathematical expression the less accurate is the descrip-tion. The simplest expression is:
� = �o exp(yp – �t)
where �o = viscosity at some reference temperature andpressure, p = pressure, t = temperature, and y and � areconstants determined from measured viscosity data. Amore accurate representation is obtained from theexpression:
� = �o exp �A + Bp
t + to �where A and B are constants.
Numerical methods can be employed to give a greaterdegree of accuracy.
A useful expression for the variation of density withtemperature used in the calculation of kinematic viscos-ities is:
�t = �s – a(t – ts) + b(t – ts)2
where �s is the density at temperature ts , and a and b areconstants.
The change in density with pressure may be estimatedfrom the equation:
VoP
Vo – V= Ko + mp
where Vo is the initial volume, V is the volume at pressurep, and Ko and m are constants.
Figure 1.2 The variation of viscosity with pressure for some mineral and synthetic oils
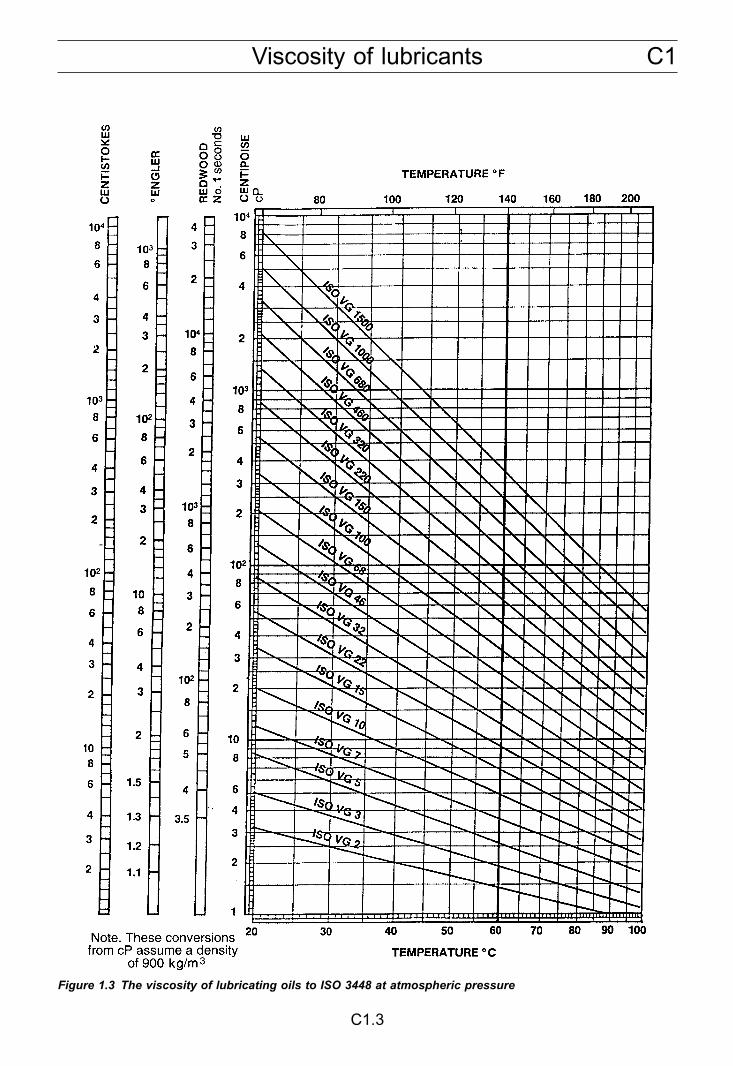
C1Viscosity of lubricants
C1.3
Figure 1.3 The viscosity of lubricating oils to ISO 3448 at atmospheric pressure
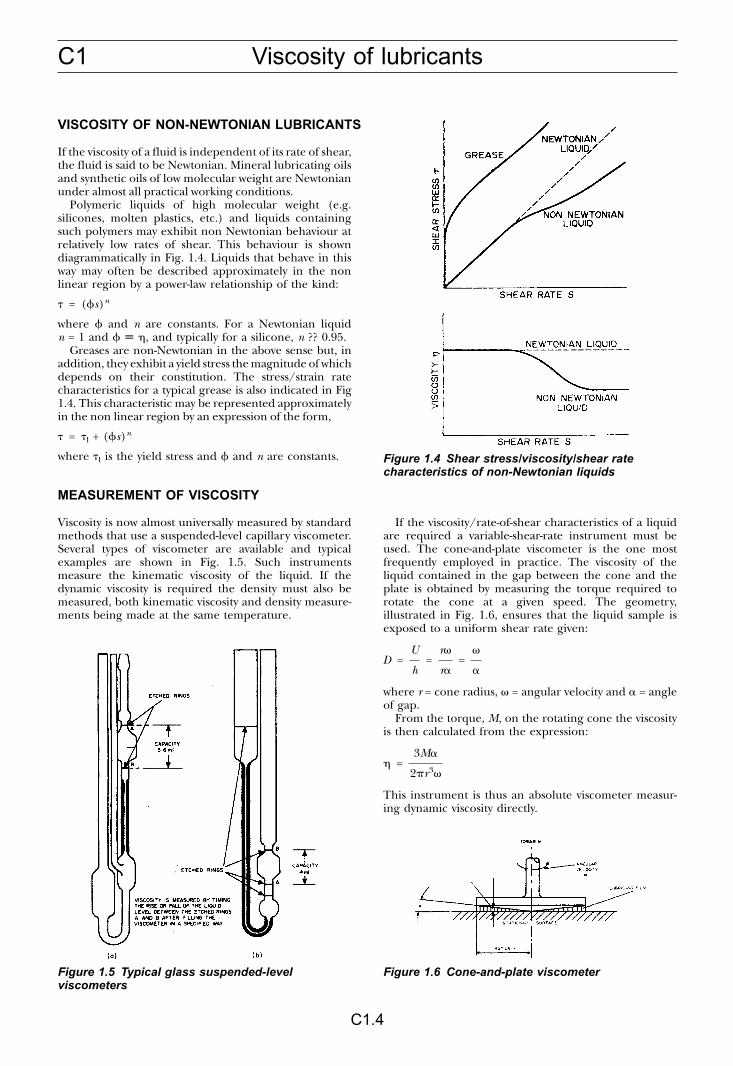
C1 Viscosity of lubricants
C1.4
VISCOSITY OF NON-NEWTONIAN LUBRICANTS
If the viscosity of a fluid is independent of its rate of shear,the fluid is said to be Newtonian. Mineral lubricating oilsand synthetic oils of low molecular weight are Newtonianunder almost all practical working conditions.
Polymeric liquids of high molecular weight (e.g.silicones, molten plastics, etc.) and liquids containingsuch polymers may exhibit non Newtonian behaviour atrelatively low rates of shear. This behaviour is showndiagrammatically in Fig. 1.4. Liquids that behave in thisway may often be described approximately in the nonlinear region by a power-law relationship of the kind:
� = (�s)n
where � and n are constants. For a Newtonian liquidn = 1 and � � �, and typically for a silicone, n ?? 0.95.
Greases are non-Newtonian in the above sense but, inaddition, they exhibit a yield stress the magnitude of whichdepends on their constitution. The stress/strain ratecharacteristics for a typical grease is also indicated in Fig1.4. This characteristic may be represented approximatelyin the non linear region by an expression of the form,
� = �l + (�s)n
where �l is the yield stress and � and n are constants.
MEASUREMENT OF VISCOSITY
Viscosity is now almost universally measured by standardmethods that use a suspended-level capillary viscometer.Several types of viscometer are available and typicalexamples are shown in Fig. 1.5. Such instrumentsmeasure the kinematic viscosity of the liquid. If thedynamic viscosity is required the density must also bemeasured, both kinematic viscosity and density measure-ments being made at the same temperature.
If the viscosity/rate-of-shear characteristics of a liquidare required a variable-shear-rate instrument must beused. The cone-and-plate viscometer is the one mostfrequently employed in practice. The viscosity of theliquid contained in the gap between the cone and theplate is obtained by measuring the torque required torotate the cone at a given speed. The geometry,illustrated in Fig. 1.6, ensures that the liquid sample isexposed to a uniform shear rate given:
D =U
h=
r�
r=
�
where r = cone radius, � = angular velocity and = angleof gap.
From the torque, M, on the rotating cone the viscosityis then calculated from the expression:
� =3M
2�r3�
This instrument is thus an absolute viscometer measur-ing dynamic viscosity directly.
Figure 1.4 Shear stress/viscosity/shear ratecharacteristics of non-Newtonian liquids
Figure 1.5 Typical glass suspended-levelviscometers
Figure 1.6 Cone-and-plate viscometer
C2 Surface hardness
C2.1
INTRODUCTION
The hardness of the surface of components is animportant property affecting their tribological perform-ance. For components with non conformal contacts suchas rolling bearings and gears, the hardness, and thecorresponding compressive strength, of the surfacematerial must be above a critical value. For componentswith conformal contacts such as plain bearings, the two
sides of the contact require a hardness difference typicallywith a hardness ratio of 3:1 and ideally with 5:1. Thecomponent with the surface, which extends outside theclose contact area, needs to be the hardest of the two, inorder to avoid any incipient indentation at the edge of thecontact. Shafts and thrust collars must therefore generallybe harder than their associated support bearings.
HARDNESS MEASUREMENT
The hardness of component surfaces is measured byindenting the surface with a small indenter made from aharder material.
The hardness can then be inferred from the width orarea of the indentation or from its depth.
The Brinell hardness test generally uses a steel ball10 mm diameter which is pressed into the surface undera load of 30 kN. In the Vickers hardness test, a pyramidshaped indenter is pressed into the surface, usuallyunder a load of 500 N. In both cases the hardness is theninferred from a comparison of the load and thedimensions of the indentation.
The Rockwell test infers the hardness from the depth ofpenetration and thus enables a direct reading of hardnessto be obtained from the instrument. Hard materials aremeasured on the Rockwell C scale using a diamondrounded tip cone indenter and a load of 1.5 kN. Softermetals are measured on the Rockwell B scale using a steelball of about 1.5 mm diameter and a load of 1 kN.
Table 2.1 gives a comparison of the various scales ofhardness measurement, for the convenience of conver-sion from one scale to another. The values are reason-able for most metals but conversion errors can occur ifthe material is prone to work hardening.
Table 2.1 Approximate comparison of scales of hardness
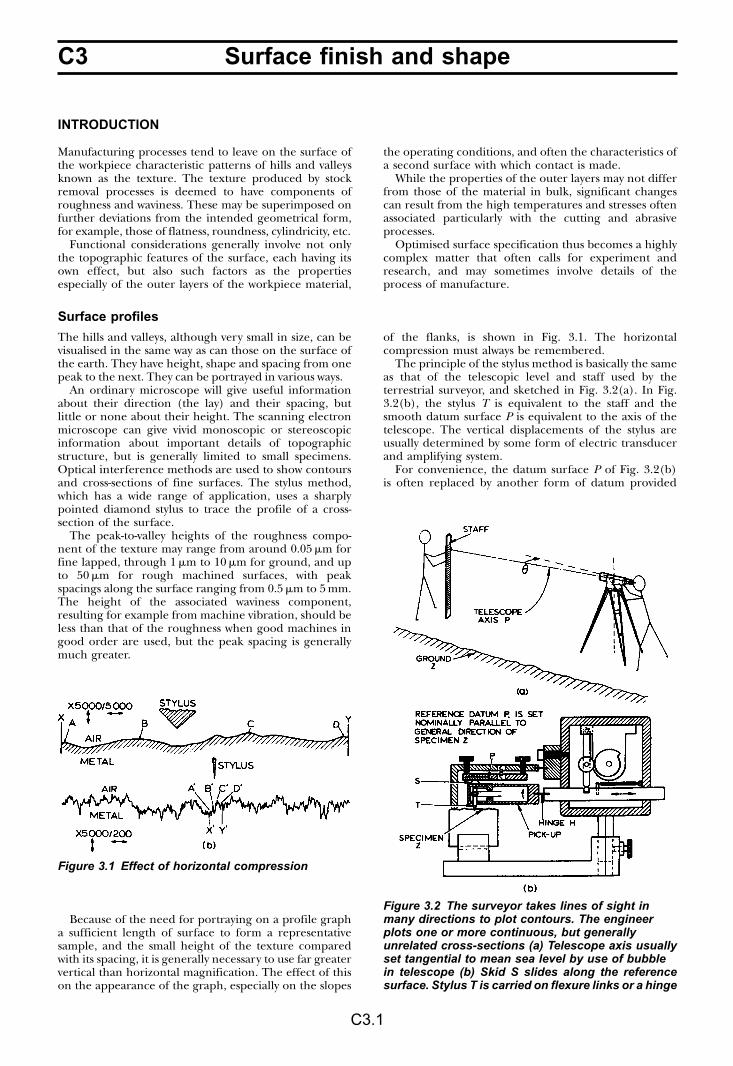
C3 Surface finish and shape
C3.1
INTRODUCTION
Manufacturing processes tend to leave on the surface ofthe workpiece characteristic patterns of hills and valleysknown as the texture. The texture produced by stockremoval processes is deemed to have components ofroughness and waviness. These may be superimposed onfurther deviations from the intended geometrical form,for example, those of flatness, roundness, cylindricity, etc.
Functional considerations generally involve not onlythe topographic features of the surface, each having itsown effect, but also such factors as the propertiesespecially of the outer layers of the workpiece material,
the operating conditions, and often the characteristics ofa second surface with which contact is made.
While the properties of the outer layers may not differfrom those of the material in bulk, significant changescan result from the high temperatures and stresses oftenassociated particularly with the cutting and abrasiveprocesses.
Optimised surface specification thus becomes a highlycomplex matter that often calls for experiment andresearch, and may sometimes involve details of theprocess of manufacture.
Surface profiles
The hills and valleys, although very small in size, can bevisualised in the same way as can those on the surface ofthe earth. They have height, shape and spacing from onepeak to the next. They can be portrayed in various ways.
An ordinary microscope will give useful informationabout their direction (the lay) and their spacing, butlittle or none about their height. The scanning electronmicroscope can give vivid monoscopic or stereoscopicinformation about important details of topographicstructure, but is generally limited to small specimens.Optical interference methods are used to show contoursand cross-sections of fine surfaces. The stylus method,which has a wide range of application, uses a sharplypointed diamond stylus to trace the profile of a cross-section of the surface.
The peak-to-valley heights of the roughness compo-nent of the texture may range from around 0.05 �m forfine lapped, through 1 �m to 10 �m for ground, and upto 50 �m for rough machined surfaces, with peakspacings along the surface ranging from 0.5 �m to 5 mm.The height of the associated waviness component,resulting for example from machine vibration, should beless than that of the roughness when good machines ingood order are used, but the peak spacing is generallymuch greater.
Because of the need for portraying on a profile grapha sufficient length of surface to form a representativesample, and the small height of the texture comparedwith its spacing, it is generally necessary to use far greatervertical than horizontal magnification. The effect of thison the appearance of the graph, especially on the slopes
of the flanks, is shown in Fig. 3.1. The horizontalcompression must always be remembered.
The principle of the stylus method is basically the sameas that of the telescopic level and staff used by theterrestrial surveyor, and sketched in Fig. 3.2(a). In Fig.3.2(b), the stylus T is equivalent to the staff and thesmooth datum surface P is equivalent to the axis of thetelescope. The vertical displacements of the stylus areusually determined by some form of electric transducerand amplifying system.
For convenience, the datum surface P of Fig. 3.2(b)is often replaced by another form of datum provided
Figure 3.1 Effect of horizontal compression
Figure 3.2 The surveyor takes lines of sight inmany directions to plot contours. The engineerplots one or more continuous, but generallyunrelated cross-sections (a) Telescope axis usuallyset tangential to mean sea level by use of bubblein telescope (b) Skid S slides along the referencesurface. Stylus T is carried on flexure links or a hinge
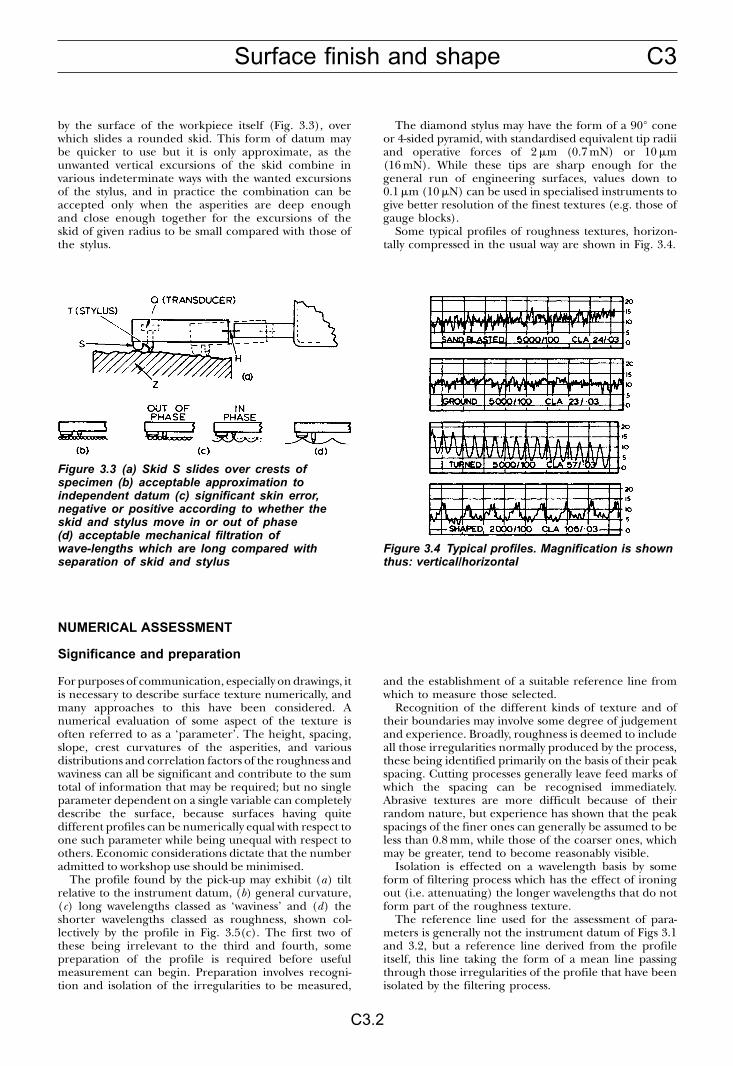
C3Surface finish and shape
C3.2
by the surface of the workpiece itself (Fig. 3.3), overwhich slides a rounded skid. This form of datum maybe quicker to use but it is only approximate, as theunwanted vertical excursions of the skid combine invarious indeterminate ways with the wanted excursionsof the stylus, and in practice the combination can beaccepted only when the asperities are deep enoughand close enough together for the excursions of theskid of given radius to be small compared with those ofthe stylus.
The diamond stylus may have the form of a 90° coneor 4-sided pyramid, with standardised equivalent tip radiiand operative forces of 2 �m (0.7 mN) or 10 �m(16 mN). While these tips are sharp enough for thegeneral run of engineering surfaces, values down to0.1 �m (10 �N) can be used in specialised instruments togive better resolution of the finest textures (e.g. those ofgauge blocks).
Some typical profiles of roughness textures, horizon-tally compressed in the usual way are shown in Fig. 3.4.
NUMERICAL ASSESSMENT
Significance and preparation
For purposes of communication, especially on drawings, itis necessary to describe surface texture numerically, andmany approaches to this have been considered. Anumerical evaluation of some aspect of the texture isoften referred to as a ‘parameter’. The height, spacing,slope, crest curvatures of the asperities, and variousdistributions and correlation factors of the roughness andwaviness can all be significant and contribute to the sumtotal of information that may be required; but no singleparameter dependent on a single variable can completelydescribe the surface, because surfaces having quitedifferent profiles can be numerically equal with respect toone such parameter while being unequal with respect toothers. Economic considerations dictate that the numberadmitted to workshop use should be minimised.
The profile found by the pick-up may exhibit (a) tiltrelative to the instrument datum, (b) general curvature,(c) long wavelengths classed as ‘waviness’ and (d) theshorter wavelengths classed as roughness, shown col-lectively by the profile in Fig. 3.5(c). The first two ofthese being irrelevant to the third and fourth, somepreparation of the profile is required before usefulmeasurement can begin. Preparation involves recogni-tion and isolation of the irregularities to be measured,
and the establishment of a suitable reference line fromwhich to measure those selected.
Recognition of the different kinds of texture and oftheir boundaries may involve some degree of judgementand experience. Broadly, roughness is deemed to includeall those irregularities normally produced by the process,these being identified primarily on the basis of their peakspacing. Cutting processes generally leave feed marks ofwhich the spacing can be recognised immediately.Abrasive textures are more difficult because of theirrandom nature, but experience has shown that the peakspacings of the finer ones can generally be assumed to beless than 0.8 mm, while those of the coarser ones, whichmay be greater, tend to become reasonably visible.
Isolation is effected on a wavelength basis by someform of filtering process which has the effect of ironingout (i.e. attenuating) the longer wavelengths that do notform part of the roughness texture.
The reference line used for the assessment of para-meters is generally not the instrument datum of Figs 3.1and 3.2, but a reference line derived from the profileitself, this line taking the form of a mean line passingthrough those irregularities of the profile that have beenisolated by the filtering process.
Figure 3.3 (a) Skid S slides over crests ofspecimen (b) acceptable approximation toindependent datum (c) significant skin error,negative or positive according to whether theskid and stylus move in or out of phase(d) acceptable mechanical filtration ofwave-lengths which are long compared withseparation of skid and stylus
Figure 3.4 Typical profiles. Magnification is shownthus: vertical/horizontal
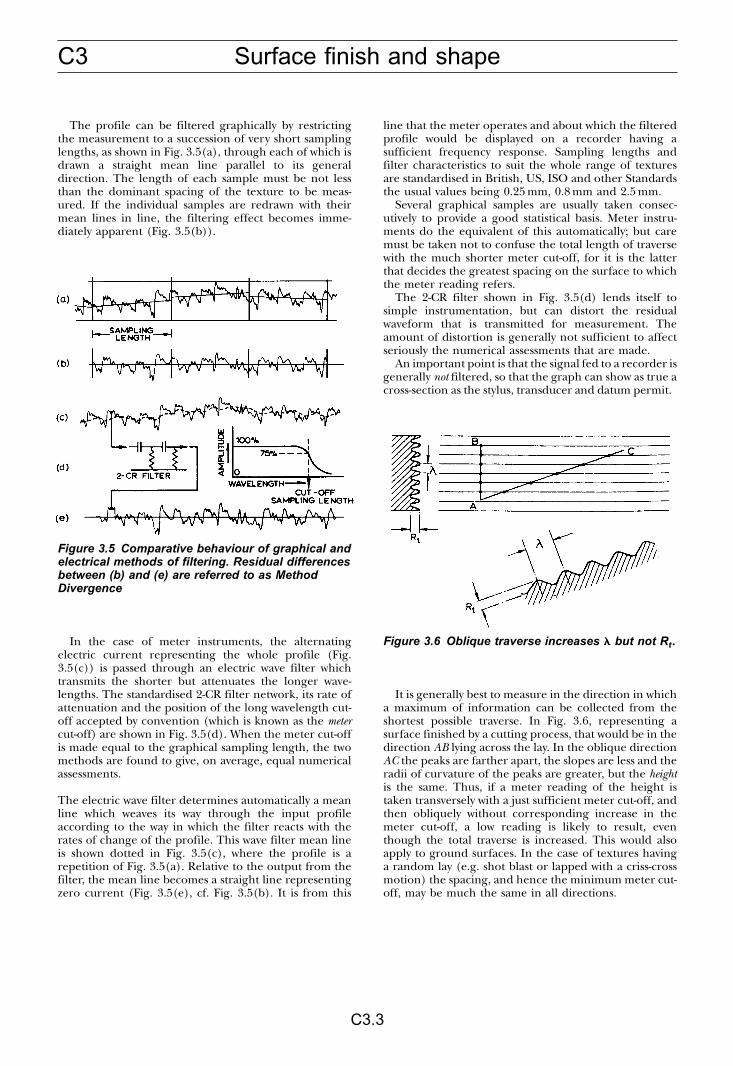
C3 Surface finish and shape
C3.3
The profile can be filtered graphically by restrictingthe measurement to a succession of very short samplinglengths, as shown in Fig. 3.5(a), through each of which isdrawn a straight mean line parallel to its generaldirection. The length of each sample must be not lessthan the dominant spacing of the texture to be meas-ured. If the individual samples are redrawn with theirmean lines in line, the filtering effect becomes imme-diately apparent (Fig. 3.5(b)).
In the case of meter instruments, the alternatingelectric current representing the whole profile (Fig.3.5(c)) is passed through an electric wave filter whichtransmits the shorter but attenuates the longer wave-lengths. The standardised 2-CR filter network, its rate ofattenuation and the position of the long wavelength cut-off accepted by convention (which is known as the metercut-off) are shown in Fig. 3.5(d). When the meter cut-offis made equal to the graphical sampling length, the twomethods are found to give, on average, equal numericalassessments.
The electric wave filter determines automatically a meanline which weaves its way through the input profileaccording to the way in which the filter reacts with therates of change of the profile. This wave filter mean lineis shown dotted in Fig. 3.5(c), where the profile is arepetition of Fig. 3.5(a). Relative to the output from thefilter, the mean line becomes a straight line representingzero current (Fig. 3.5(e), cf. Fig. 3.5(b). It is from this
line that the meter operates and about which the filteredprofile would be displayed on a recorder having asufficient frequency response. Sampling lengths andfilter characteristics to suit the whole range of texturesare standardised in British, US, ISO and other Standardsthe usual values being 0.25 mm, 0.8 mm and 2.5 mm.
Several graphical samples are usually taken consec-utively to provide a good statistical basis. Meter instru-ments do the equivalent of this automatically; but caremust be taken not to confuse the total length of traversewith the much shorter meter cut-off, for it is the latterthat decides the greatest spacing on the surface to whichthe meter reading refers.
The 2-CR filter shown in Fig. 3.5(d) lends itself tosimple instrumentation, but can distort the residualwaveform that is transmitted for measurement. Theamount of distortion is generally not sufficient to affectseriously the numerical assessments that are made.
An important point is that the signal fed to a recorder isgenerally not filtered, so that the graph can show as true across-section as the stylus, transducer and datum permit.
It is generally best to measure in the direction in whicha maximum of information can be collected from theshortest possible traverse. In Fig. 3.6, representing asurface finished by a cutting process, that would be in thedirection AB lying across the lay. In the oblique directionAC the peaks are farther apart, the slopes are less and theradii of curvature of the peaks are greater, but the heightis the same. Thus, if a meter reading of the height istaken transversely with a just sufficient meter cut-off, andthen obliquely without corresponding increase in themeter cut-off, a low reading is likely to result, eventhough the total traverse is increased. This would alsoapply to ground surfaces. In the case of textures havinga random lay (e.g. shot blast or lapped with a criss-crossmotion) the spacing, and hence the minimum meter cut-off, may be much the same in all directions.
Figure 3.5 Comparative behaviour of graphical andelectrical methods of filtering. Residual differencesbetween (b) and (e) are referred to as MethodDivergence
Figure 3.6 Oblique traverse increases � but not Rt.
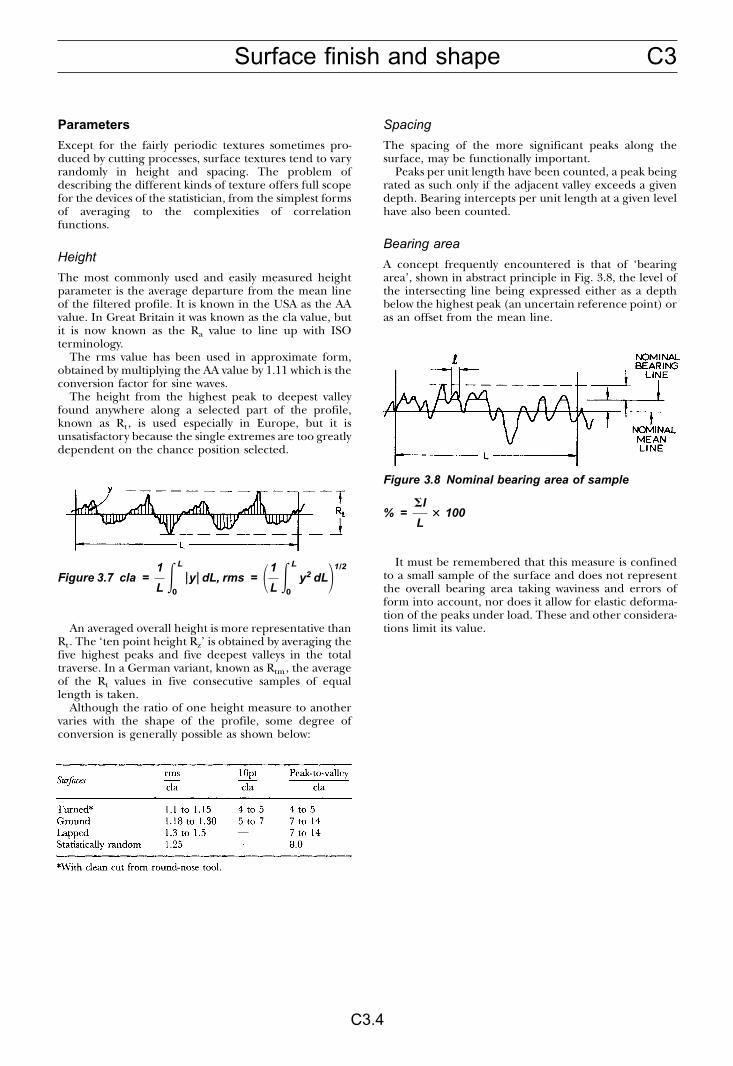
C3Surface finish and shape
C3.4
Parameters
Except for the fairly periodic textures sometimes pro-duced by cutting processes, surface textures tend to varyrandomly in height and spacing. The problem ofdescribing the different kinds of texture offers full scopefor the devices of the statistician, from the simplest formsof averaging to the complexities of correlationfunctions.
Height
The most commonly used and easily measured heightparameter is the average departure from the mean lineof the filtered profile. It is known in the USA as the AAvalue. In Great Britain it was known as the cla value, butit is now known as the Ra value to line up with ISOterminology.
The rms value has been used in approximate form,obtained by multiplying the AA value by 1.11 which is theconversion factor for sine waves.
The height from the highest peak to deepest valleyfound anywhere along a selected part of the profile,known as Rt, is used especially in Europe, but it isunsatisfactory because the single extremes are too greatlydependent on the chance position selected.
An averaged overall height is more representative thanRt. The ‘ten point height Rz’ is obtained by averaging thefive highest peaks and five deepest valleys in the totaltraverse. In a German variant, known as Rtm, the averageof the Rt values in five consecutive samples of equallength is taken.
Although the ratio of one height measure to anothervaries with the shape of the profile, some degree ofconversion is generally possible as shown below:
Spacing
The spacing of the more significant peaks along thesurface, may be functionally important.
Peaks per unit length have been counted, a peak beingrated as such only if the adjacent valley exceeds a givendepth. Bearing intercepts per unit length at a given levelhave also been counted.
Bearing area
A concept frequently encountered is that of ‘bearingarea’, shown in abstract principle in Fig. 3.8, the level ofthe intersecting line being expressed either as a depthbelow the highest peak (an uncertain reference point) oras an offset from the mean line.
It must be remembered that this measure is confinedto a small sample of the surface and does not representthe overall bearing area taking waviness and errors ofform into account, nor does it allow for elastic deforma-tion of the peaks under load. These and other considera-tions limit its value.
Figure 3.7 cla =1
LL
0
y dL, rms = �1
LL
0
y2 dL�1/2
Figure 3.8 Nominal bearing area of sample
% =�I
L� 100
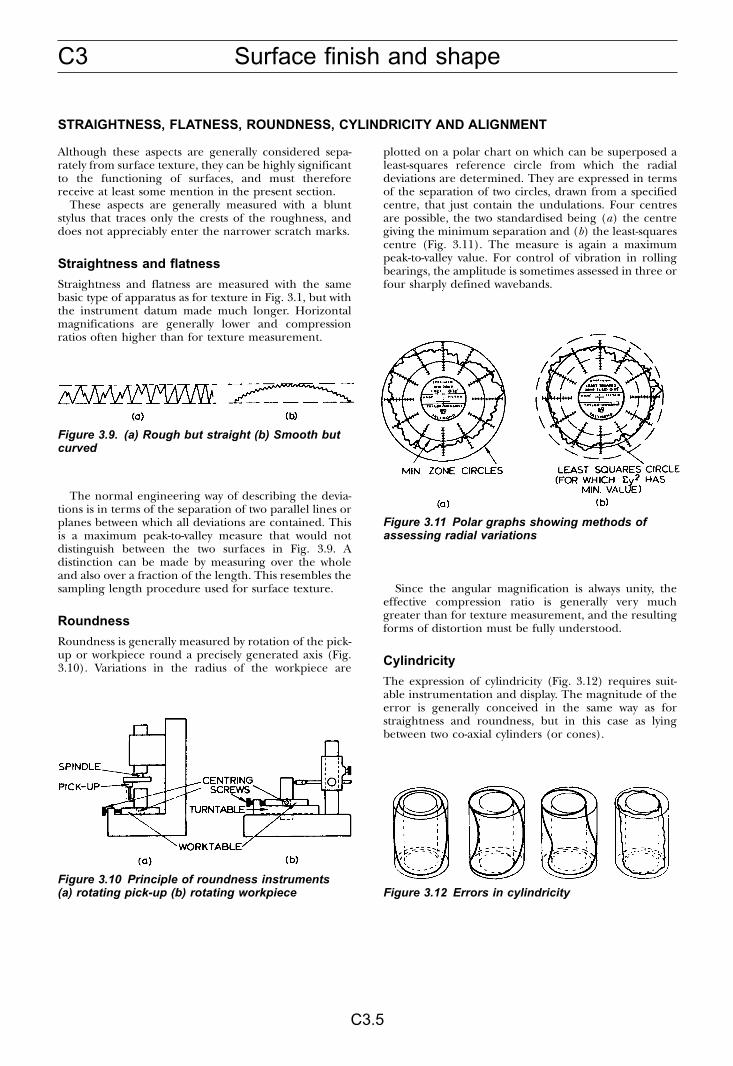
C3 Surface finish and shape
C3.5
STRAIGHTNESS, FLATNESS, ROUNDNESS, CYLINDRICITY AND ALIGNMENT
Although these aspects are generally considered sepa-rately from surface texture, they can be highly significantto the functioning of surfaces, and must thereforereceive at least some mention in the present section.
These aspects are generally measured with a bluntstylus that traces only the crests of the roughness, anddoes not appreciably enter the narrower scratch marks.
Straightness and flatness
Straightness and flatness are measured with the samebasic type of apparatus as for texture in Fig. 3.1, but withthe instrument datum made much longer. Horizontalmagnifications are generally lower and compressionratios often higher than for texture measurement.
The normal engineering way of describing the devia-tions is in terms of the separation of two parallel lines orplanes between which all deviations are contained. Thisis a maximum peak-to-valley measure that would notdistinguish between the two surfaces in Fig. 3.9. Adistinction can be made by measuring over the wholeand also over a fraction of the length. This resembles thesampling length procedure used for surface texture.
Roundness
Roundness is generally measured by rotation of the pick-up or workpiece round a precisely generated axis (Fig.3.10). Variations in the radius of the workpiece are
plotted on a polar chart on which can be superposed aleast-squares reference circle from which the radialdeviations are determined. They are expressed in termsof the separation of two circles, drawn from a specifiedcentre, that just contain the undulations. Four centresare possible, the two standardised being (a) the centregiving the minimum separation and (b) the least-squarescentre (Fig. 3.11). The measure is again a maximumpeak-to-valley value. For control of vibration in rollingbearings, the amplitude is sometimes assessed in three orfour sharply defined wavebands.
Since the angular magnification is always unity, theeffective compression ratio is generally very muchgreater than for texture measurement, and the resultingforms of distortion must be fully understood.
Cylindricity
The expression of cylindricity (Fig. 3.12) requires suit-able instrumentation and display. The magnitude of theerror is generally conceived in the same way as forstraightness and roundness, but in this case as lyingbetween two co-axial cylinders (or cones).
Figure 3.9. (a) Rough but straight (b) Smooth butcurved
Figure 3.10 Principle of roundness instruments(a) rotating pick-up (b) rotating workpiece
Figure 3.11 Polar graphs showing methods ofassessing radial variations
Figure 3.12 Errors in cylindricity
C3Surface finish and shape
C3.6
USE AND INTERPRETATION OF SURFACE MEASUREMENTS
The industrial requirement is (1) To investigate thecharacteristics of surfaces and identify the types that arefunctionally acceptable. (2) To specify the dominantrequirements on drawings. (3) To control manufacture.
Ideally, the most economical surface or surfaces for agiven application should be determined through themedium of experimental models closely allied to theintended method of manufacture. Surface texture tendsto change as the surfaces are run in, and initially smoothsurfaces are not necessarily best. The peaks can getsmoothed down even after the first pass, but the run-insurface may retain traces of the original valleys (whichmay assist the distribution of lubricant) throughout thelife of the machine. A recitation of the machining dataused for the most successful model, in conjunction withthe simplest topographic data (e.g. Ra) may provide aserviceable basis for manufacture, reflecting not only thetopographic, but also the probable physical character-istics of the surface. If it is subsequently found expedientto change the process of manufacture, it may beadvisable to reconsider both the functional conse-quences and the Ra value.
When the cost of fully experimental evolution cannotbe accepted, it may suffice to rely on general experience,in which case the problem may arise of knowing whatsurface texture values would be descriptive of surfacesalready familiar by sight and touch. Standard roughnesscomparison specimens can then be helpful. Electro-formed reproductions are available which show pro-gressive grades of roughness of the usual machiningprocesses, each grade having twice the Ra value of theprevious one. This is about the smallest increment thatcan readily be detected by touch, and is often thesmallest that matters functionally.
Sets of Roughness Comparison Specimens generallygive a fair idea of the range of Ra values that can beachieved by each process, though it is as well toremember that as the fine end is approached, the cost ofcomponent production may rise rapidly, and have to beoffset against other benefits that may accrue, for exam-ple in assembly or performance. The best surface ofwhich any process is capable will involve many factorssuch as the stiffness of the workpiece, the material beingworked, the condition of the machine and tool or wheel,the uniformity of the preceding process, the amount ofstock to be removed, the time allowed for appropriatelygentle cutting or grinding, and the care that is given toevery detail of the process. The last two factors maydetermine the economic limit.
Eventually it may be possible to select optimumcharacteristics from tables, as is done for dimensionaltolerances, but so many factors are involved that thisseems a long way off.
The simple Ra parameter must be interpreted with fullawareness of what it can and cannot tell about surfacetexture. It is best regarded as a practical index forcomparing the heights of similar profiles on a linear basis– twice the index, twice the height. To this extent it hasproved generally serviceable for process control. Itsability to compare dissimilar profiles is more limited. Itcorresponds with the sensory impression of roughnessonly for similar textures and over a limited range ofheights and peak spacings, as examination of sets ofroughness comparison specimens will show. It cannotprovide a direct measure of the functional quality of asurface, because this aspect depends on many factors andoften involves those of a second surface.
Statements of parameter values
A statement of height will have little meaning if it is notaccompanied by a statement of the maximum peakspacing (generally expressed by the meter cut-off) towhich it refers. The standard British way is to recite theheight value and the parameter, followed by the metercut-off in brackets. Thus, in metric units using micro-metres for height and millimetres for the cut-off, anexample would be 0.2 �m Ra (2.5). A standard cut-offvalue often found suitable for the finer surfaces is0.8 mm, and if this value was used or is to be used, thestandards allow it to be assumed and direct statementomitted; but this does not mean that its significance canbe ignored.
For fully co-ordinated control, the cut-off indicated ona drawing should be taken not only as the value to beused for inspection but also as the maximum significantspacing (e.g. traverse feed) that may result fromproduction.
A further point is that the Ra value given on a drawingis often taken not as a target figure but as an upper limit,anything smoother being acceptable unless a lower limitis also given, so that manufacture must aim at somethingless if half the product is not to be rejected. On the otherhand the Ra value marked on a roughness comparisonspecimen is the nominal value of the specimen. Thisdifference in usage must be allowed for when choosingthe required texture from a set of specimens, andindicating the choice on a drawing.

C4 Shape tolerances of components
C4.1
It is not possible to quote definite values for thetolerances of geometry maintainable by manufacturingprocess: values for any process can vary, not only fromworkshop to workshop, but within a workshop. The typeof shop, the rate and quantity of production, theexpected quality of work, the type of labour, thesequence of operations, the equipment available (and itscondition) are among factors which must be taken into
account. It is very difficult to apply values to theseinfluencing factors, but as general guidance it might beexpected to halve or double the maintainable tolerancesby either better or worse practice. There are obviously nohard and fast rules.
The working values tabulated below are in goodgeneral agreement with modern practice. Achievablevalues can be better: they can be worse.
EXPLANATION OF TOLERANCES
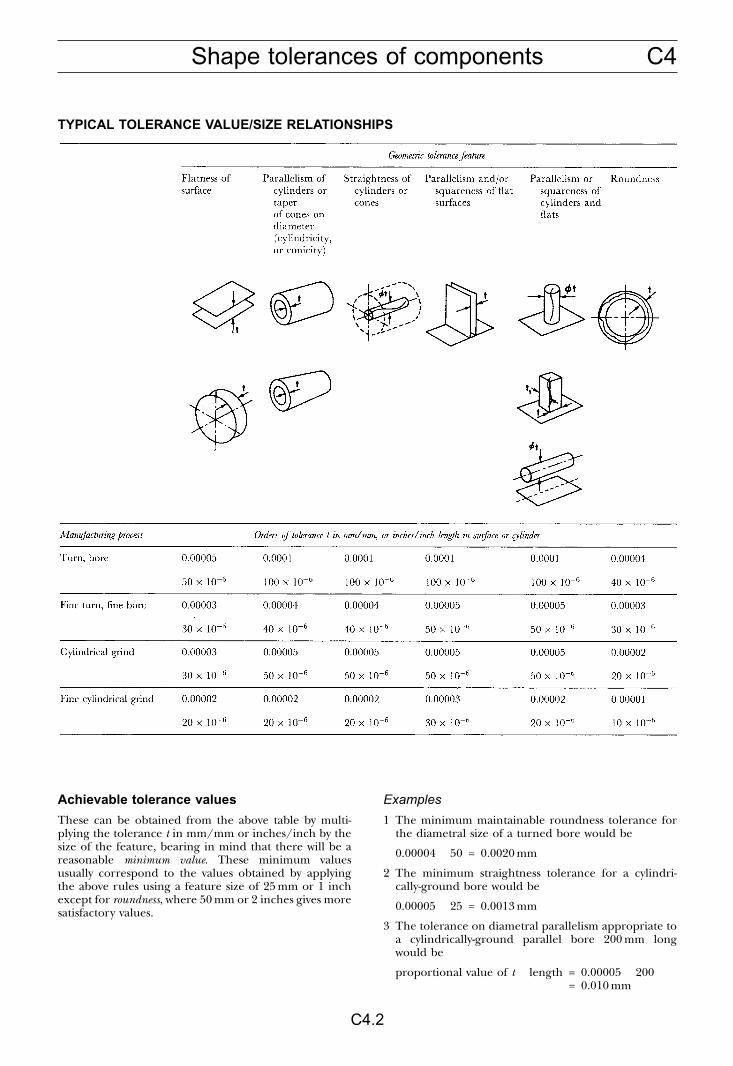
C4Shape tolerances of components
C4.2
TYPICAL TOLERANCE VALUE/SIZE RELATIONSHIPS
Achievable tolerance values
These can be obtained from the above table by multi-plying the tolerance t in mm/mm or inches/inch by thesize of the feature, bearing in mind that there will be areasonable minimum value. These minimum valuesusually correspond to the values obtained by applyingthe above rules using a feature size of 25 mm or 1 inchexcept for roundness, where 50 mm or 2 inches gives moresatisfactory values.
Examples
1 The minimum maintainable roundness tolerance forthe diametral size of a turned bore would be
0.00004 � 50 = 0.0020 mm
2 The minimum straightness tolerance for a cylindri-cally-ground bore would be
0.00005 � 25 = 0.0013 mm
3 The tolerance on diametral parallelism appropriate toa cylindrically-ground parallel bore 200 mm longwould be
proportional value of t � length = 0.00005 � 200= 0.010 mm
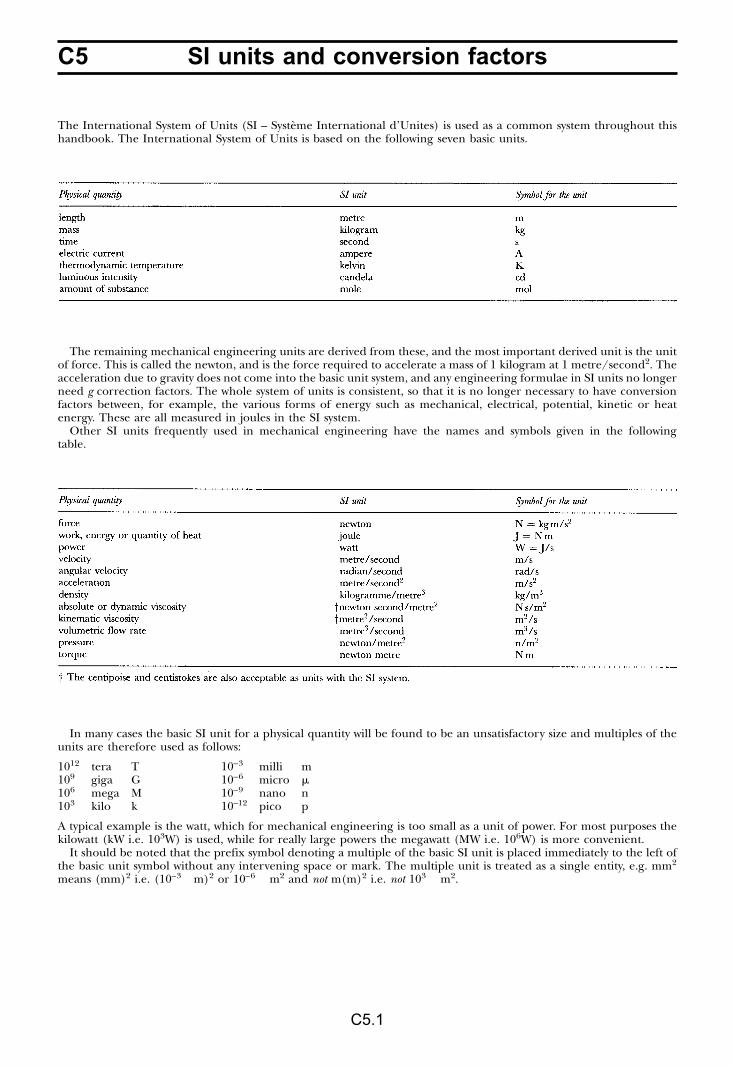
C5 SI units and conversion factors
C5.1
The International System of Units (SI – Systeme International d’Unites) is used as a common system throughout thishandbook. The International System of Units is based on the following seven basic units.
The remaining mechanical engineering units are derived from these, and the most important derived unit is the unitof force. This is called the newton, and is the force required to accelerate a mass of 1 kilogram at 1 metre/second2. Theacceleration due to gravity does not come into the basic unit system, and any engineering formulae in SI units no longerneed g correction factors. The whole system of units is consistent, so that it is no longer necessary to have conversionfactors between, for example, the various forms of energy such as mechanical, electrical, potential, kinetic or heatenergy. These are all measured in joules in the SI system.
Other SI units frequently used in mechanical engineering have the names and symbols given in the followingtable.
In many cases the basic SI unit for a physical quantity will be found to be an unsatisfactory size and multiples of theunits are therefore used as follows:
1012 tera T 10–3 milli m109 giga G 10–6 micro �106 mega M 10–9 nano n103 kilo k 10–12 pico p
A typical example is the watt, which for mechanical engineering is too small as a unit of power. For most purposes thekilowatt (kW i.e. 103W) is used, while for really large powers the megawatt (MW i.e. 106W) is more convenient.
It should be noted that the prefix symbol denoting a multiple of the basic SI unit is placed immediately to the left ofthe basic unit symbol without any intervening space or mark. The multiple unit is treated as a single entity, e.g. mm2
means (mm)2 i.e. (10–3 �m)2 or 10–6 � m2 and not m(m)2 i.e. not 103 � m2.
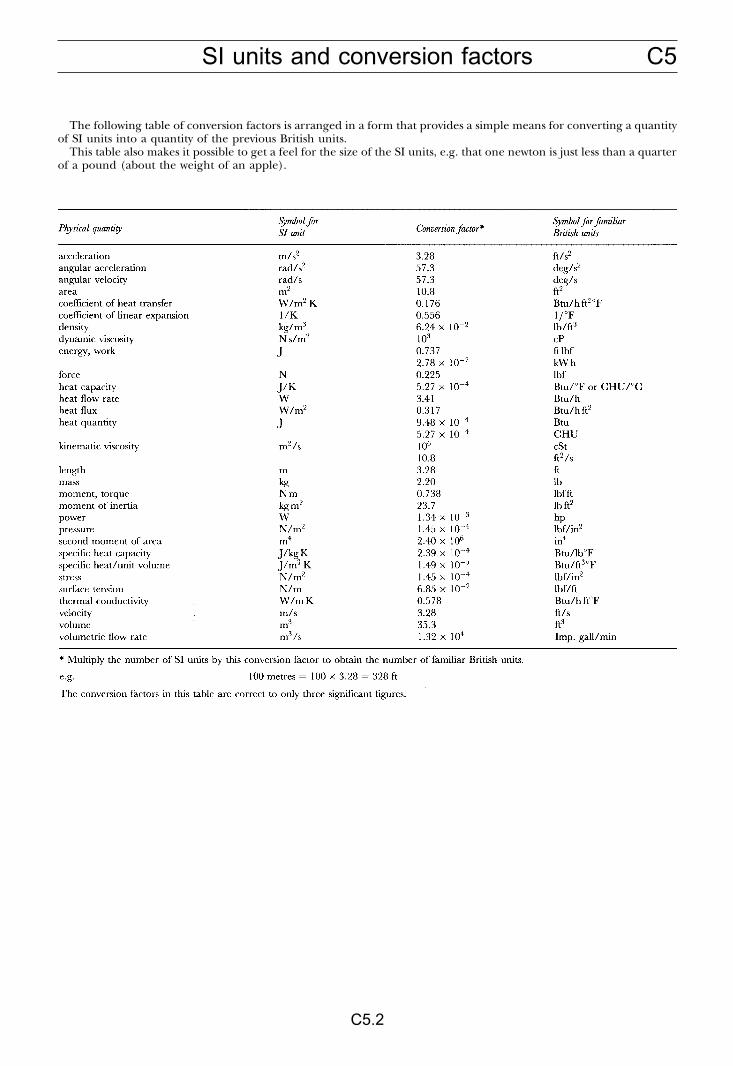
C5SI units and conversion factors
C5.2
The following table of conversion factors is arranged in a form that provides a simple means for converting a quantityof SI units into a quantity of the previous British units.
This table also makes it possible to get a feel for the size of the SI units, e.g. that one newton is just less than a quarterof a pound (about the weight of an apple).

This Page Intentionally Left Blank

Index
1
Abrasive wear, B21.1Acid treatment for oil refining, A2.2Acidity of oil, checking, B6.3Additives for oils, A2.6Additives, checking levels, B6.3Aerobic bacteria in oils, B7.1Aerosol systems, A17.1Aircompressor cylinder lubrication, A2.7,
A13.4Air filters, A28.3Aluminium tin, A7.3Anti-microbial:
inhibitors, B7.1procedures, B7.2
Anti-oxidants in oils, A1.2Anti-seize compounds, A5.5Anti-sludge holes incouplings, A11.2Antimony trioxide, A5.3Ash content of oil, checking, B6.3
Bacterial problems in oils, B7.1Baffles and weirs in tanks, A20.1Ball nut lubrication, A17.2Ball-bearing lubrication, A8.2Barium difluoride, A5.1Bath lubrication of bearings, A8.5Bath tub curve, B10.2Bearing materials for high temperature
use, A30.2Bearings, see Plain bearings; Rolling
bearingsBiocides, B7.2Biological deterioration of lubricants,
B7.1Bonded coatings, A5.1Brake problems:
crazing, B16.1fade, B16.2grab, B16.2heat spotting, B16.1metal pick-up, B16.2scoring, B16.1strip braking, B16.2
Brine, viscosity, A6.2Bulk modulus of oils, A3.1, A3.2Burnished films, A5.1, A5.2
solid lubricants, A5.1, A5.2, A5.3By-pass filtration, A22.3
Calcium difluoride, A5.1Calenders, lubrication, A19.1
Cams and followers:lubrication, A17.2running in, A27.1
Capillary tube flow rates, A24.7Centrifugal pumps in lubrication systems,
A21.3Centrifugal separation, A22.4Centrifuging limit for oils in couplings,
A11.2Chain drives, lubrication, A1.1, A13.4,
A17.4Chemical effects on materials, A31.1Circulation systems, A19.1
Cleaning and sterilising oil systems, B7.2Clutch problems:
band crushing, B16.3bond failure, B16.3burst failure, B16.3dishing, B16.3distortion, B16.4grooving, B16.4material transfer, B16.3waviness, B16.3
Coatings, A5.1Commission lubrication systems, A26.1Compressors, lubrication, A2.7, A13.4Condition monitoring:
benefits, B2.4introducing condition monitoring,
B2.2monitoring methods, B2.1problems, B2.3setting up, B2.3
Consistency of grease, A4.3Contaminants in oils, A2.6, A7.2, A31.1Control valves for lubrication systems,
A24.2Conveyor chain lubrication, A17.2Coolers, selection and operation, A20.2,
A23.3, A25.2Copper lead, A7.3Corrosion resistant materials, A31.1Corrosive atmospheres, A28.3Corrosive fluids, A31.1Cost of oils, A3.1, A3.2Couplings, lubrication, A11.1, A11.2,
A13.4Cryogenic temperatures, lubrication,
A30.4Cutting oils, A2.3Cylinder problems:
bore polishing, B14.4bore scuffing, B14.5cavitation erosion, B14.5wear, B14.4, B14.5
Cylinders and linersrunning in, A27.1
De-aeration screens, A20.2De-asphalting in oil refining, A2.2De-waxing in oil refining, A2.2Density of oils, A2.5, A3.1, A3.2Derv, viscosity, A6.4Di-ester oils, A3.2Diesel engines, lubrication, A2.7Diesel fuel, viscosity, A6.4Differential pressure switches, A25.3Dilution of oils by petroluem gases,
A29.2, A31.1Dip splash systems, A18.1Dip-sticks, A25.2Dispersions:
anti-stick agents, A5.5parting agents, A5.5
Dissolved gases in oils, A29.2Double-line oil systems, A19.3Drainage points and access on tanks,
A20.2
Drip feeds, A7.1, A8.5Dust contamination, A28.3Dynamic viscosity of oils, A2.3, A2.5, A7.3
grades, A2.4, A13.3
Earth treatment in oil refining, A2.2Engine oil consumption, A27.2Engine oils, A2.3Extreme pressure lubricants, A7.3
Failure analysis:cause of failure, B10.1investigating failures, B10.1
Failure patterns:availability, B10.1causes of failure, B10.1maintainability, B10.1reliability, B10.1repetitive failures, B10.1
Falex test, A5.3Fatigue life of rope, A10.1Ferrography, A27.3, B5.2Filter efficiency curves, A22.2Filters and centrifuges, A22.1Filtration methods, A22.1Flash point of oils, A2.5, A3.1, A3.2Flexible coupling lubrication, A11.2Flexible hoses for grease systems, A15.4Flow switches, A25.3Foaming of oils, B6.2Food processing machine lubricants,
A2.7Fretting problems:
basic mechanics, B18.1prevention, B18.2
Fuel oil viscosity, A6.5Full-flow filtration, A22.2, A22.3, A25.2Fungi in lubricants, B7.1
Gas oil, viscosity, A6.5Gear failures:
abrasive wear, B13.5case exfoliation, B13.1chemical wear, B13.3cracking of worms, B13.8dedendum attrition, B13.3fatigue fracture, B13.7initial pitting, B13.1micro-pitting, B13.3plastic deformation, B13.8plastic gears, B13.8progressive pitting, B13.2scuffing, B13.4tooth breakage, B13.6
Gear pumps, A21.3Gear lubrication:
lubricants, A1.1, A2.3, A2.7lubrication:
gearboxes, A9.1, A14.4, A19.2open gears, A9.2, A13.4running in, A27.1, A27.4spur and bevel gears, A17.4, A18.1worm gears, A17.2, A18.2

Index
2
Gland and seal lubrication, A13.4Graphite, A5.1Gravity feed lubrication systems, A19.3Grease lubrication, A7.1, A8.2Grease pressures in systems, A15.2Grease relief valves, A8.3Grease systems, A15.1, A16.1Grease types:
aluminium complex, A4.1calcium, A4.1, A8.2calcium EP, A8.2clay based, A4.1ester, A4.2lithium, A4.1, A8.2lithium EP, A8.2lithium complex, A4.1silicone, A4.2sodium, A8.2
Grease, pipe-flow calculations for, A15.3Grease, selection of, A4.3Grease, temperature limits, A1.3
Hand oiling of bearings, A7.1Hardness:
Brinell hardness, C2.1Rockwell hardness, C2.1Vickers hardness, C2.1
Header tanks, A25.3Heat transfer fluids, viscosity, A6.3Heaters and coolers, A20.2, A23.1Hermetically sealed refrigerators, A2.7High pressure effects, A29.1High temperature effects, A30.1High vacuum lubricants, A29.3Hinges, A1.1Hot hardness, A30.3Hydraulic oils, A2.3Hydraulic systems, A13.4Hydrotreating for oil refining, A2.2
Industrial process temperatures, A28.1Instrument pivots, A1.1Isentropic secant bulk modulus of oils,
A2.5
Kerosene, viscosity, A6.4Kilns, lubrication, A19.1Kinematic viscosity, A7.3Kinematic viscosity index of oils, A2.5Kinematic viscosity of oils, A2.3
Lead oxide, A5.1Lead phosphite, A5.3Lead sulphate, A5.1Lead-bronze, A7.3Level gauges, A20.2, A25.2Level switches, A25.2Linear roller bearings, A12.1Lobe pumps, A21.3Loss coefficients in pipes, A24.7Low temperature effects, A5.4Lubricant, change periods and tests, B6.1
Lubricant analysis:off-line analysis techniques, B5.9techniques for various types of
machine, B5.9Lubrication by oil mist:
nozzle sizes, A17.2pipe sizes, A17.2
Lubrication maintenance planning, A13.1
Machine tools, lubrication, A2.7, A19.2Maintenance methods:
breakdown maintenance, B1.2, B1.3condition-based maintenance, B1.2,
B1.3mean time between failures, B1.2, B1.3opportunistic maintenance, B1.2preventive maintenance, B1.2, B1.3reliability centred maintenance, B1.5total productive maintenance, B1.5
Mechanical seals:failure mechanisms, B15.1starting torque, B15.2
Microbial infection of lubricants, B7.1,B7.2
Mineral ores, A2.1Mist systems, A17.1Molybdenum disulphide, A5.1, A5.3Molybdenum trioxide, A5.1Multi-point lubricators, A19.1
Neutralisation value of oils, A2.5Nylon tube sizes, A15.4
Oil coolers, A23.2Oil emulsions, B7.1Oil grooves in plain bearings, A7.4Oil heaters, A23.1Oil life, A2.6Oil mist, A8.5, A17.1Oil pumps, selection, A21.1Orifice plates, A19.6Ostwald coefficients, A29.2Oxidation inhibitors, B6.3
Packed glands:failure mechanisms, B15.5
Paper machines, lubrication, A19.1Particle impingement, A5.1Particle sizes:
contaminants, A28.3filters, A22.1
Performance monitoring:monitoring of fixed components, B8.1monitoring of machines and systems,
B8.3monitoring of moving components,
B8.2temperature limits, B3.1
Petrol viscosity, A6.4Pipe material selection, A24.1Pipe size determination, A15.4, A24.4Piping design, A24.1
Piston problems:crown damage, B14.1internal cracking, B14.2misalignment, B14.2skirt scratching, B14.1skirt seizure, B14.1
Piston ring problems:ring sticking, B14.3scuffing, B14.2, B14.3
Piston rings:running in, A27.1
Plain bearing failures:bad bonding, B11.7cavitation erosion, B11.3corrosion, B11.4dirty assembly, B11.6electrical discharge, B11.5excessive interference, B11.2fatigue, B11.1faulty assembly, B11.6foreign matter, B11.1fretting, B11.2inadequate lubrication, B11.7incorrect journal grinding, B11.7misalignment, B11.2overheating, B11.6thermal cycling, B11.6wiping, B11.1wire wool damage, B11.5
Plain bearing lubrication:hydrodynamic, A1.1, A7.1, A14.4,
A27.1, A27.5, A31.4hydrostatic, A24.3, A27.1journal, A1.1, A7.1, A7.4, A17.2, A17.4,
A27.5porous metal, A27.1rubbing, A14.4, A27.1thrust, A7.1, A27.1
Planned lubrication, A13.1Plunger-type oil lubricators, A19.1Polyimides, A5.1Polytetrafluoroethylene, A5.1Polyurethanes, A5.1Positive-split oil systems, A19.2Pour point of oils, A1.2, A2.5Power stations, lubrication, A19.4Pressure control valve, A25.3Pressure gauges, A25.2Pressure losses per unit length in pipes,
A24.5Pressure switches, A25.2Pressure viscosity coefficient, A2.3, A2.5Pressure-drop calculations, A24.3Printing machines, lubrication, A19.2Protective devices, A25.2Pumping grease, A15.5Pumps oil, A21.2, A25.1
Rack and pinion lubrication, A17.2Rationalisation of lubricants, A13.3Record cards for lubrication, A13.5Refrigerants, viscosity, A6.2Relative humidity in industry, A28.2Relief-valves, A21.2, A25.3

Index
3
Relubrication of ball and roller bearings,A8.3
Repair of friction surfaces:attaching friction material, B23.1methods of working and finishing,
B23.3precautions during relining, B23.2
Repair of plain bearings:bond testing, B22.4centrifugal lining, B22.3pouring temperatures, B22.4preparation, B22.1replacement shells, B22.5static lining, B22.2tinning, B22.1whitemetals, B22.4
Repair of worn surfaces:characteristics of surfacing processes,
B20.5, B20.7choice of coating material, B20.12choice of process, B20.2coating materials available, B20.9,
B20.11electroplated coatings, B20.13examples of successful repairs, B20.14guidance on the choice of process,
B20.8surfacing processes, B20.3, B20.4
Reynolds No., A24.6Ring oiled bearings, A7.1Roll-neck bearing lubrication, A8.2Roller chain lubrication, A9.2, A17.2Rolling bearing failures:
abrasive wear, B12.4bruising, B12.1corrosion, B12.1damaged rollers, B12.3false brinelling, B12.1fatigue, B12.1fracture, B12.3fretting, B12.2grease failure, B12.4magnetic damage, B12.3misalignment, B12.2overheating, B12.4roller breakage, B12.3uneven wear, B12.3washboard marking, B12.4
Rolling bearing lubrication:lubricants, A1.1, A4.4, A8.1, A8.2lubrication systems, A14.4, A17.2,
A17.4Route cards for lubrication, A13.5Rubber seals:
extrusion, B15.4failure mechanisms, B15.3fluid incompatibility, B15.3overheating, B15.3wear, B15.4
Running-in additive in fuel, A27.3Running-in procedures, A27.1
Screw pumps, A21.3Screws, lubrication, A14.4Seals, running in, A27.5
Self-contained oil systems, A19.4Shape tolerances:
bearing tolerances, C4.2shaft tolerances, C4.2
Shear rate effects on viscosity, A1.3SI units and conversion factors:
conversion factors, C5.1SI units, C5.1
Silica, A5.1Silicate ester or disiloxane, A3.1Silicone, A1.2Silver, A7.3Slide bearings:
lubrication, A1.1, A12.1, A13.4, A14.3,A17.2
hydrostatic, A12.1Sludges, B6.1Solid lubricants, A5.1Solvent extraction for oil refining, A2.2Splash lubrication, A8.5, A17.1Spontaneous ignition of oils, A3.1, A3.2Spray lubrication, A9.1Steam and gas turbines lubrication, A2.7Steam engine cylinder lubrication, A2.7Steelworks lubrication, A19.4Storage of components, A8.2Storage tanks, design, A20.1Storing grease, A15.5Surface films in high vacuum, A29.4Surface finish and topography:
cylindricity, C3.5flatness, C3.5peak to valley height, C3.4roundness, C3.4straightness, C3.5surface bearing area, C3.4surface height distribution, C3.4surface measurement, C3.6
Survey of plant, A13.1Synthetic oil types:
chlorinated diphenyls, A3.1esters, A1.2fluorocarbon, A3.1inhibited esters, A3.2methyl silicones, A3.2perfluorinated polyethers, A3.2phenyl methyl silicones, A3.2phosphate esters, A1.2, A3.2, A29.3polyglycols, A3.2polyphenyl ethers, A1.2–A3.1
Tantalum disulphide, A5.1Temperature control valves, A25.3Temperature limitations of liquid
lubricants, A1.2, A1.3, A30.1Temperatures in industrial processes,
A28.1Terotechnology, B1.5Thermal capacity of oils, A2.5, A3.1, A3.2Thermal conductivity of oils, A2.5, A3.1,
A3.2Thermal decomposition and stability of
oils, A2.6, A27.5Thermometers, A25.3Timken test for coatings, A5.3
Tin-base white metal, A7.3Total acid number, A2.5Toxicity of oils, A3.1, A3.2Transmission and axle lubricants, A9.2Tungsten disulphide, A5.1Turbine oils, A2.3
Vacuum deposition, A5.1Vacuum, operation, A29.1Valve lubrication, A13.4Vane pumps, A21.3Ventilators, A20.2Vibration monitoring:
Cepstrum analysis, B4.2discrete frequency monitoring, B4.2,
B4.5Kurtosis measurement, B4.2overall level, B4.2, B4.3, B4.4shock pulse monitoring, B4.2signal averaging, B4.2, B4.6signal generation, B4.1signal transmission, B4.2spectral analysis, B4.2, B4.4
Viscosity index, A2.1Viscosity of liquids, A6.1Viscosity of lubricants:
cone-and-plate viscometer, C1.4dynamic viscosity, C1.1kinematic viscosity, C1.1non-Newtonian lubricants, C1.4viscosity conversion factors, C1.1viscosity of lubricating oils, A2.5, A3.1,
A3.2, C1.3viscosity measurement, C1.4viscosity variation with pressure, C1.2
Visual examination of used lubricatingoil, B6.2
Warning and protection devices, A25.1Water glycol, viscosity, A6.6Water in oil emulsion, viscosity, A6.6Wear debris generation, A27.3Wear debris monitoring:
atomic absorption spectroscopy, B5.2atomic emission spectroscopy, B5.2cutting wear debris, B5.2debris from filters, B5.3ferrography, B5.2monitoring methods, B5.2plasma emission spectroscopy, B5.2problems detected by wear debris
analysis, B5.7, B5.8rolling fatigue wear debris, B5.5rolling and sliding water debris, B5.5rotary particle depositor, B5.2rubbing wear debris, B5.4severe sliding wear debris, B5.6sources of materials found, B5.3wear debris shapes, B5.4X-ray fluorescence, B5.2
Wear limits:ball and roller bearings, B9.1plain bearings, B9.1

Index
4
Wear resistant materials:attachment of replaceable components,
B21.3cast irons, B21.5cast steels, B21.6hardfacing rods and electrodes, B21.8material selection, B21.2non-metallic materials, B21.9rolled steels, B21.6typical performance, B21.4wear resistant coatings for steel, B21.7
Weibull analysis, B10.3
Weibull probability graph paper, B10.4Wick feeds and lubricators, A7.1Wire rope deterioration:
corrosion, B17.2deterioration at terminations, B17.2external fatigue, B17.1external wear, B17.1internal damage, B17.2mechanical damage, B17.1
Wire rope inspection:dressings, B17.3frequency, B17.3
special tools, B17.3wire rope maintenance, B17.3
Wire rope lubrication, A10.1Wire rope lubrication system selection,
A14.1Wire rope replacement criteria:
broken wires, B17.4change in diameter, B17.4
Worm gears, A9.1, A17.4Woven wire mesh filters, A22.2
Yeasts, B7.1
Related Documents