6/28/2010 1 LTPP S l PV LTPP Solar PV Potential and Levelized Cost Potential and Levelized Cost of Energy (LCOE) June 28, 2010

Welcome message from author
This document is posted to help you gain knowledge. Please leave a comment to let me know what you think about it! Share it to your friends and learn new things together.
Transcript
6/28/2010
1
LTPP S l PVLTPP Solar PV
Potential and Levelized CostPotential and Levelized Cost of Energy (LCOE)
June 28, 2010

6/28/2010
2
Goals of Potential Analysis
D l PV P t ti l ti tDevelop PV Potential estimatesIdentify ‘Easy to connect’ and ‘harder to connect’
4 size and configuration categories0.5 – 2 MW Roof, 0.5 – 2 MW Ground, 2 – 5 MW Ground, 5 – 20 MW Ground
4 locations across CaliforniaC C S C
2
Desert, Central Valley, North Coast, South Coast
6/28/2010
3
PV Potential Estimation
Adj t d th 33% RPS I l t tiAdjusted the 33% RPS Implementation Analysis potential study approach
Same underlying proprietary utility substation loadings and locations as used previously
Same large rooftop potential with satellite imagery
Key changesAdded small roofs in rural areas
3
“Set aside” potential for current programs

6/28/2010
4
Screening Assumptions
‘E ’ I t ti‘Easy’ InterconnectionNameplate PV system is less than or equal to 30% of peak load at point of interconnection to avoid reverse flow
Participation33% of large roof owners will participate33% of large roof owners will participate
Penetration33% of feeders accommodate ground-mounted systems up to the ‘easy’ interconnection limits
33% of RETI identified large PV sites can be interconnected
4
33% of RETI identified large PV sites can be interconnected with a moderate transmission interconnection cost
10% of rural ‘easy’ interconnection potential in small roofs
6/28/2010
5
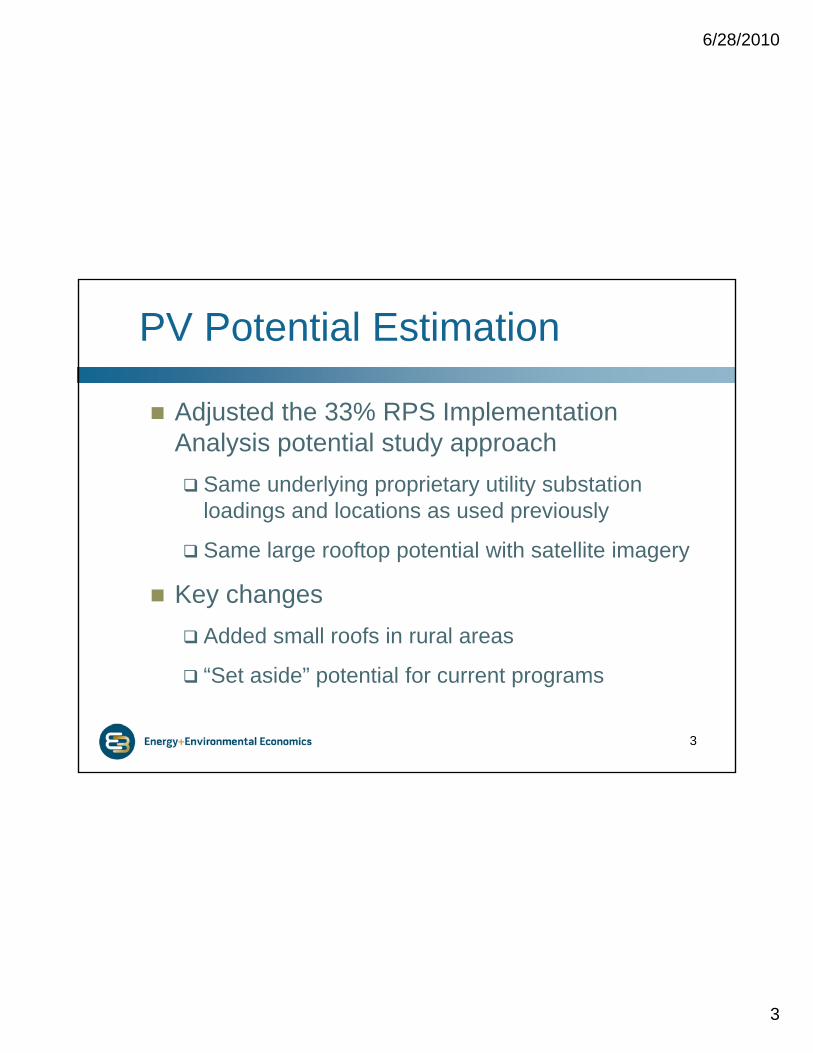
Distributed Solar PV
20 MW itIllustrative Example of Distributed Solar PV
20 MW sites near non-urban 69 kV substations
Smaller projects on rooftops, large commercial rooftops with 0.25 MW potential
20 MW near substationsLarge commercial rooftopsResidential rooftops
p
p
Limited by 30% peak load at a given substation
5

6/28/2010
6
Diagram of Interconnection Points
Sub-Trans.Distribution
3 4 6
ReferencePoint forCosting
$C
-$F
N i tiNetwork
$D
Direction of electricity flow
RETI 20MWGround Mounted2 – 20MW
Existing HighVoltageSystem
Renewable energyzone
SubstationSubstation
Gen Step-upSubstation2
$A $B
$C
230kV+69kV to138kV
4kV to21kV
Non-existingTransmission
NetworkTransmission
230kV+
RETI PV Projects AssumedTo flow in Opposite direction
6
5
-$EMeter
1Large Rooftop.5MW to 2MW

6/28/2010
7
RETI Ground Mounted PV
I iti l it i Example B&V Map for Solar PV Non-Urban ProjectsInitial criteria
near sub stations equal or less than 69 kV
agricultural or barren land
less than 5% slope
E i t l
69 kV substation
Example B&V Map for Solar PV Non Urban Projects
Environmental screen
Black out areas
Yellow out areas
Land parcel
a continuous 160 acre plot (20 MWp)
7
within 20 miles
Black out area Yellow out area
More than 5% slope area
Urban
Agricultural or barren land
Solar PV plant
Substation
6/28/2010
8
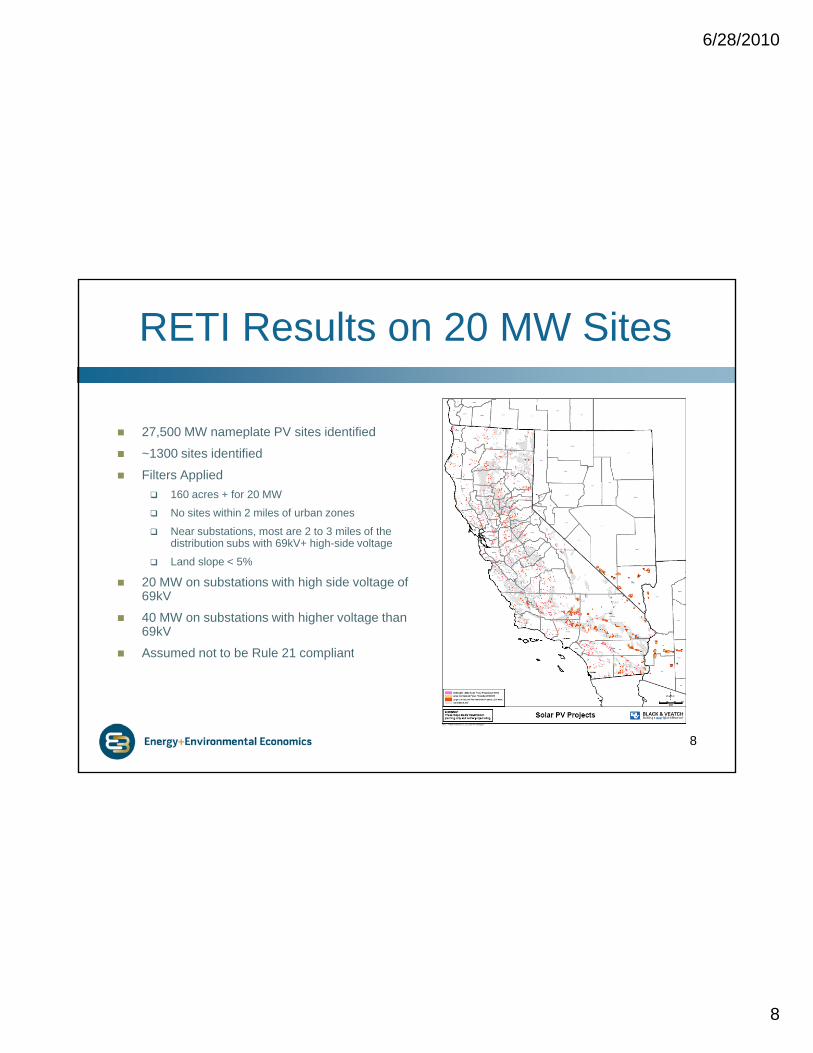
RETI Results on 20 MW Sites
27,500 MW nameplate PV sites identified
~1300 sites identified
Filters Applied160 acres + for 20 MW
No sites within 2 miles of urban zones
Near substations, most are 2 to 3 miles of the distribution subs with 69kV+ high-side voltage
Land slope < 5%
20 MW on substations with high side voltage of 69kV
40 MW on substations with higher voltage than 69kV
A d t t b R l 21 li t
8
Assumed not to be Rule 21 compliant
6/28/2010
9
Black and Veatch Rooftop Analysis
GIS d t id tif l f i CA d tGIS used to identify large roofs in CA and count available large roof area
Criteria
‘Urban’ areas with little available land
Flat roofs larger than ~1/3 acre
Assumes 65% usable space on roof
Within 3 miles of distribution substation
9

6/28/2010
10
Solar Photovoltaic Rooftop Identification
6/28/2010
11
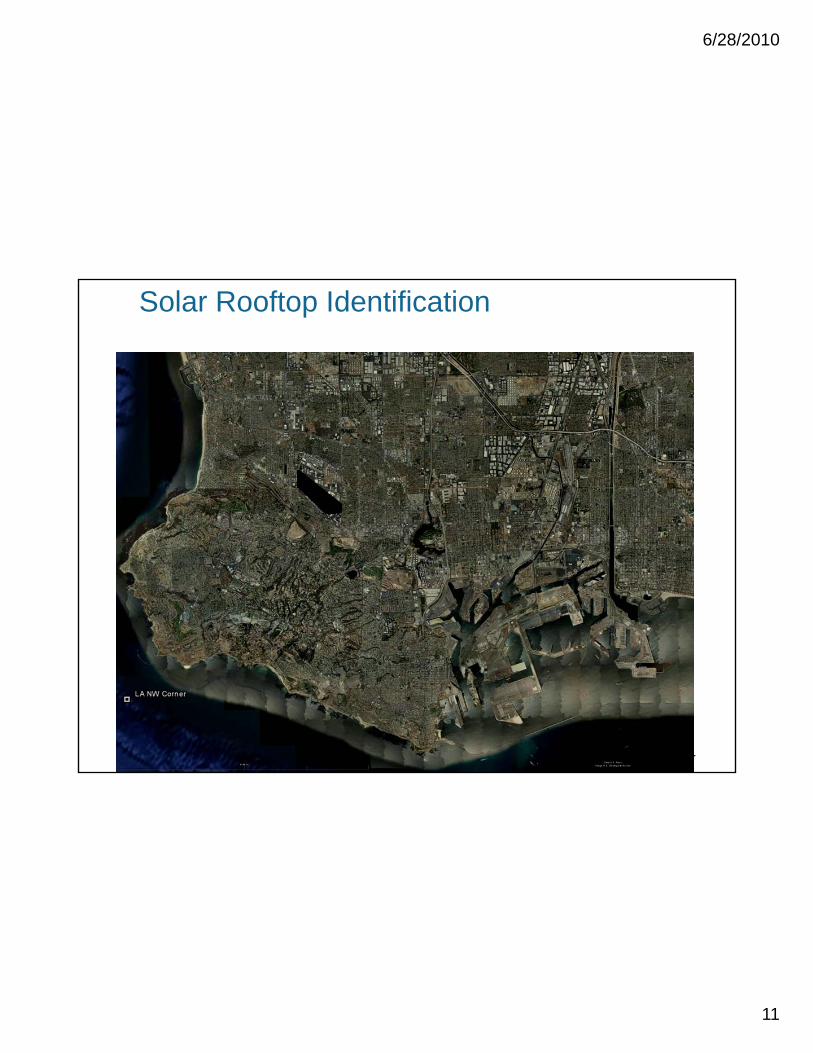
Solar Rooftop Identification
11July 31, 2009

6/28/2010
12
Solar Rooftop Identification

6/28/2010
13
East Bay Area Example
A l i t t thAnalysis automates the counting of roof space and tallies total acreage of large roof space.Also checks proximity to distribution substation (not shown d t fid ti lit )due to confidentiality).
1313July 31, 2009
6/28/2010
14
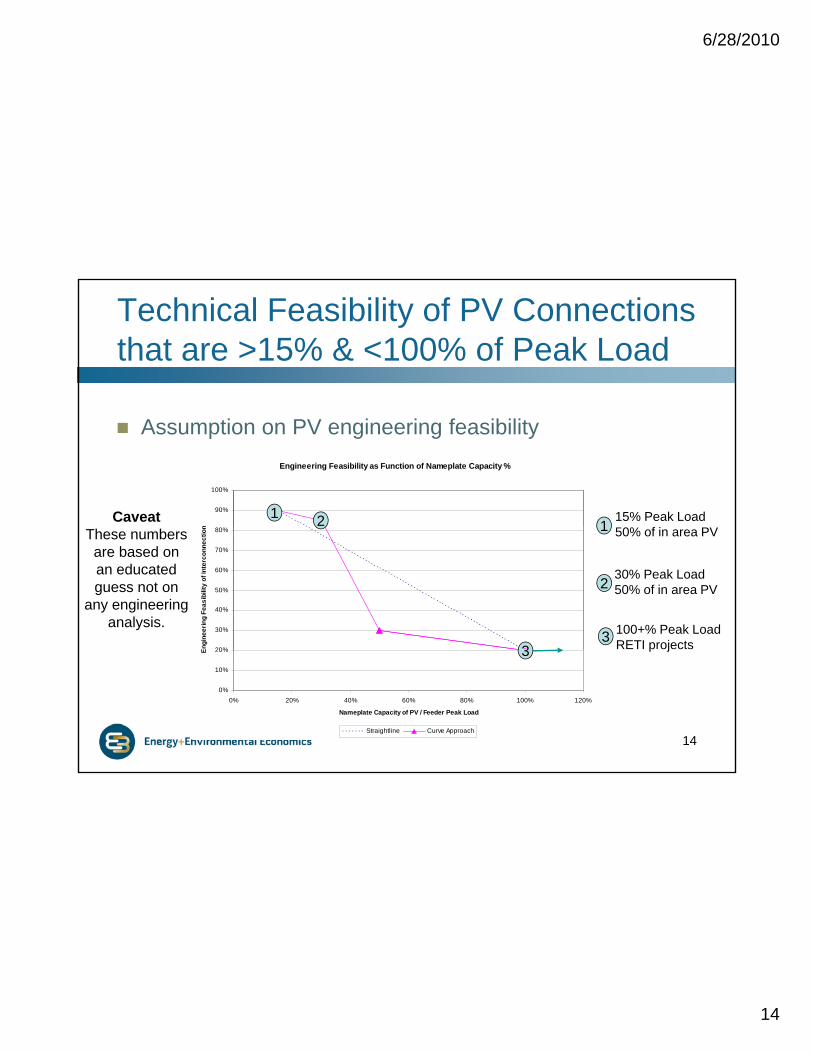
Technical Feasibility of PV Connections that are >15% & <100% of Peak Load
Engineering Feasibility as Function of Nameplate Capacity %
90%
100%
Assumption on PV engineering feasibility
1 2Caveat 115% Peak Load
20%
30%
40%
50%
60%
70%
80%
Engi
neer
ing
Feas
ibili
ty o
f Int
erco
nnec
tion
3
These numbers are based on an educated guess not on
any engineering analysis.
1
2
3
50% of in area PV
30% Peak Load50% of in area PV
100+% Peak LoadRETI projects
14
0%
10%
20%
0% 20% 40% 60% 80% 100% 120%
Nameplate Capacity of PV / Feeder Peak Load
E
Straightline Curve Approach
3 p j

6/28/2010
15
PG&E Example – Bay Area
Clusters of large roofs make it impossible to do every roof and be below the 30% peak load
PG&E Urban Large Roof Potential
150
200
250
ubst
atio
n (M
Wac
)
1,500
2,000
2,500
3,000
Pote
ntia
l (M
Wac
)load.
-
50
100
1 6 11 16 21 26 31 36 41 46 51 56 61 66 71 76 81 86 91 96 101
Substation
Pote
ntia
l per
Su
-
500
1,000
Cum
ulat
ive
P
Urban Potential (MWp) Large Rooftop Potential (MWp)C l i L R f P i l C l U b P i l (MW )
15
Cumulative Large Rooftop Potential Cumulate Urban Potential (MWp)

6/28/2010
16
PV Potential Screening Method
Peak Loading onRETI Id tifi d Peak Loading onEach Substation
RETI Identified20MW Projects
Urban Location
Large Roof Potential
Rural Location
30% ‘Easy’Interconnection
33% Participationof Roofs
30% of PeakLoad Screen
90% to GroundMounted
10% to SmallRoofs33% Penetration
at Moderate Cost
33% Penetration 2/3 RemainingPotential
16
Ground Mounted‘Easy’ Interconnect Large Rooftop Small RooftopGround Mounted
‘Hard’ Interconnect

6/28/2010
17
Screening Steps
R P t ti l (MW )Raw Potential (MWs):
After Screening (MWs):Hard-to-Interconnect Easy-to-Interconnect
RETI Identified Sites27,500
Substation Load Total39,323
After Removing Existing Programs (MWs):
Hard to Interconnect
Ground Mounted (>30% of peak load)
Ground Mounted (<30% of peak load)
Large Rooftop
Small Rooftop
Easy-to-Interconnect
Total9167 2350 3671 3235 9257 18424
TOTAL
Easy to Interconnect
17
Hard-to-Interconnect
Ground Mounted (>30% of peak load)
Ground Mounted (<30% of peak load)
Large Rooftop
Small Rooftop
Easy-to-Interconnect
Total9167 1728 3241 977 5947 15113
Easy-to-InterconnectTOTAL

6/28/2010
18
Modeled PV Potential (MW)
Harder to Interconnect TOTAL
Ground Mounted(5-20MW)
Ground Mounted(2-5MW)
Ground Mounted
(0.5-2MW)
Large Rooftop
Small Rooftop
RETI projects (>30%)
PG&E North Coast 151 46 13 779 18 1260 2266Central Valley 136 110 23 0 3 4267 4539
Easy to Interconnect
TOTAL 287 156 36 779 21 5527 6805SCE Mojave Desert 55 9 2 0 14 947 1027
Central Valley 99 14 2 0 420 467 1002South Coast 672 4 1 986 8 280 1951TOTAL 827 27 5 986 442 1693 3981
SDG&E South Coast 86 2 0 138 103 153 483Mojave Desert 45 1 0 72 54 80 252TOTAL 131 4 1 210 157 233 736
Other Central Valley 138 4 1 710 200 960 201326 1 0 133 38 180 377
18
North Coast 26 1 0 133 38 180 377Mojave Desert 82 2 0 424 120 573 1202TOTAL 246 7 1 1267 357 1713 3592
TOTAL 1492 193 43 3241 977 9167 15113

6/28/2010
19
Goals of PV LCOE Analysis
Create a publicly available pro-forma tool that calculates a levelized cost (LCOE)
Develop model inputsCapital Costs and Operating Costs
Performance parameters
Financing assumptions
19
Calculate levelized cost of solar PV
Standardize the LCOE presentation

6/28/2010
20
PV Financial Pro Forma Tool
B l l it li bilit fBalance complexity vs. applicability for a broad range of projects
Some of the features:Debt Ser ice Co erage Ratio (DSCR) limitDebt Service Coverage Ratio (DSCR) limit
Inverter replacement fund
Debt service reserve fund
Available on E3 website for download;
20
Available on E3 website for download;http://www.ethree.com/public_projects/cpuc6.html

6/28/2010
21
Example – Model Inputs
Location: Desert
System Cost & Performance Inputs: Financing Inputs:
InputsSystem Size (DC) (MW) 20
S t C t ($/ tt DC) $3 700
InputsPercent Financed with Equity 60%
Aft T WACC 8 25%
Location: DesertTechnology: 5-20 MW Ground Mounted
System Cost ($/watt DC) $3.700Annual DC Capacity Factor 21.3%
System lifetime (Years) 25Degradation Factor (%/yr) 1.00%
O&M Costs ($/kW) $20.0O&M Cost Escalator (%/yr) 2.0%
Inverter replacement cost ($/W) $0.250
After-Tax WACC 8.25%Debt Interest Rate 7.50%
Cost of Equity 10.79%Target minimum DSCR 1.40
Debt Period in Years 20Federal Tax Rate 35%
State Tax Rate 9%
21
Inverter replacement cost ($/W) $0.250Inverter replacement time (Years) 10
Insurance Expense ($/kW) $20.0Insurance Escalator (%/yr) 2.0%
%Tax Credit Rate 30%
MACRS Term 5Escalator 0%
6/28/2010
22
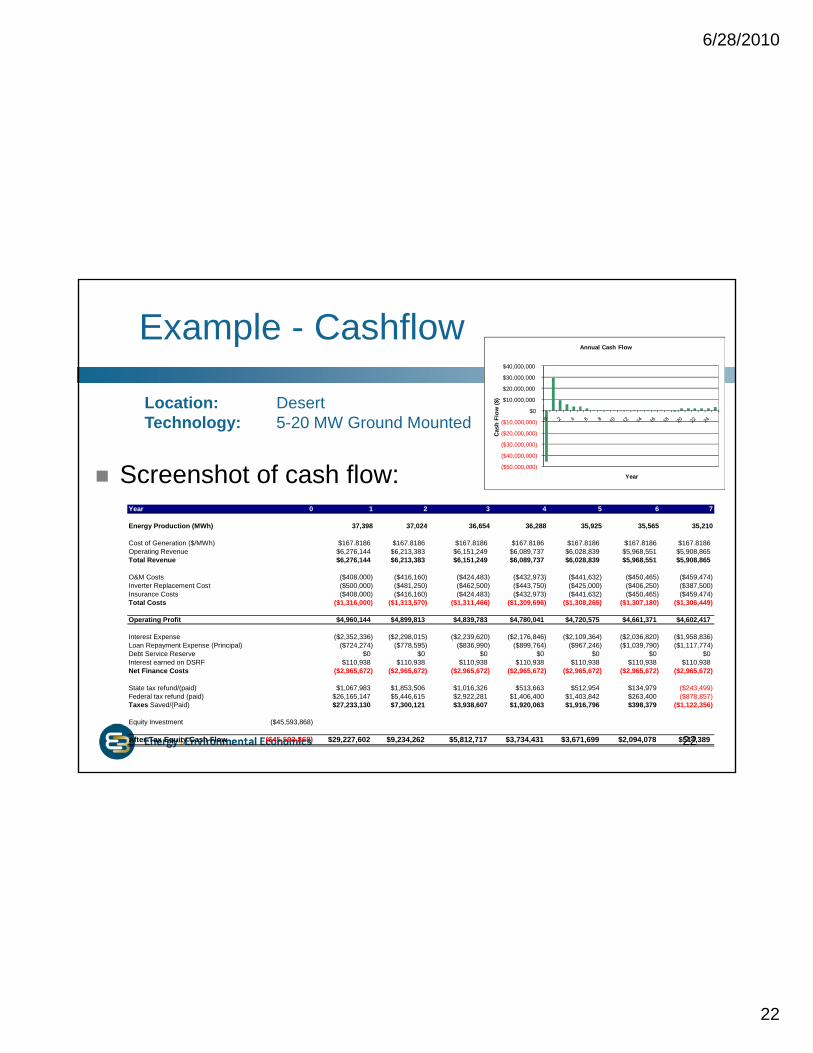
Example - Cashflow
$10,000,000
$20,000,000
$30,000,000
$40,000,000
$)
Annual Cash Flow
Location: Desert
Screenshot of cash flow: ($50,000,000)
($40,000,000)
($30,000,000)
($20,000,000)
($10,000,000)
$0
, ,
Cas
h Fl
ow ($
Year
Year 0 1 2 3 4 5 6 7
Energy Production (MWh) 37 398 37 024 36 654 36 288 35 925 35 565 35 210
Location: DesertTechnology: 5-20 MW Ground Mounted
Energy Production (MWh) 37,398 37,024 36,654 36,288 35,925 35,565 35,210
Cost of Generation ($/MWh) $167.8186 $167.8186 $167.8186 $167.8186 $167.8186 $167.8186 $167.8186Operating Revenue $6,276,144 $6,213,383 $6,151,249 $6,089,737 $6,028,839 $5,968,551 $5,908,865Total Revenue $6,276,144 $6,213,383 $6,151,249 $6,089,737 $6,028,839 $5,968,551 $5,908,865
O&M Costs ($408,000) ($416,160) ($424,483) ($432,973) ($441,632) ($450,465) ($459,474)Inverter Replacement Cost ($500,000) ($481,250) ($462,500) ($443,750) ($425,000) ($406,250) ($387,500)Insurance Costs ($408,000) ($416,160) ($424,483) ($432,973) ($441,632) ($450,465) ($459,474)Total Costs ($1,316,000) ($1,313,570) ($1,311,466) ($1,309,696) ($1,308,265) ($1,307,180) ($1,306,449)
Operating Profit $4,960,144 $4,899,813 $4,839,783 $4,780,041 $4,720,575 $4,661,371 $4,602,417
Interest Expense ($2,352,336) ($2,298,015) ($2,239,620) ($2,176,846) ($2,109,364) ($2,036,820) ($1,958,836)Loan Repayment Expense (Principal) ($724,274) ($778,595) ($836,990) ($899,764) ($967,246) ($1,039,790) ($1,117,774)
22
Debt Service Reserve $0 $0 $0 $0 $0 $0 $0Interest earned on DSRF $110,938 $110,938 $110,938 $110,938 $110,938 $110,938 $110,938Net Finance Costs ($2,965,672) ($2,965,672) ($2,965,672) ($2,965,672) ($2,965,672) ($2,965,672) ($2,965,672)
State tax refund/(paid) $1,067,983 $1,853,506 $1,016,326 $513,663 $512,954 $134,979 ($243,499)Federal tax refund (paid) $26,165,147 $5,446,615 $2,922,281 $1,406,400 $1,403,842 $263,400 ($878,857)Taxes Saved/(Paid) $27,233,130 $7,300,121 $3,938,607 $1,920,063 $1,916,796 $398,379 ($1,122,356)
Equity Investment ($45,593,868)
After-Tax Equity Cash Flow ($45,593,868) $29,227,602 $9,234,262 $5,812,717 $3,734,431 $3,671,699 $2,094,078 $514,389

6/28/2010
23
Levelized Cost of Energy from PV
$0.2000
$0.2500
$0.3000
/kW
h)
$0.0500
$0.1000
$0.1500
Leve
lized
Cos
t ($/
Mojave Desert (Daggett)
South Coast (Riverside)
Central Valley (Fresno)
North Coast (Oakland)
23
$0.00000.5 - 2 MWRooftop /Fixed Tilt
0.5 - 2 MWGround /Tracker
2 - 5 MWGround /Fixed-Tilt
5-20 MWGround /Fixed-Tilt
Utility Scale /Crystalline /
Tracker
Utility Scale /Thin-Film /Fixed-Tilt
6/28/2010
24
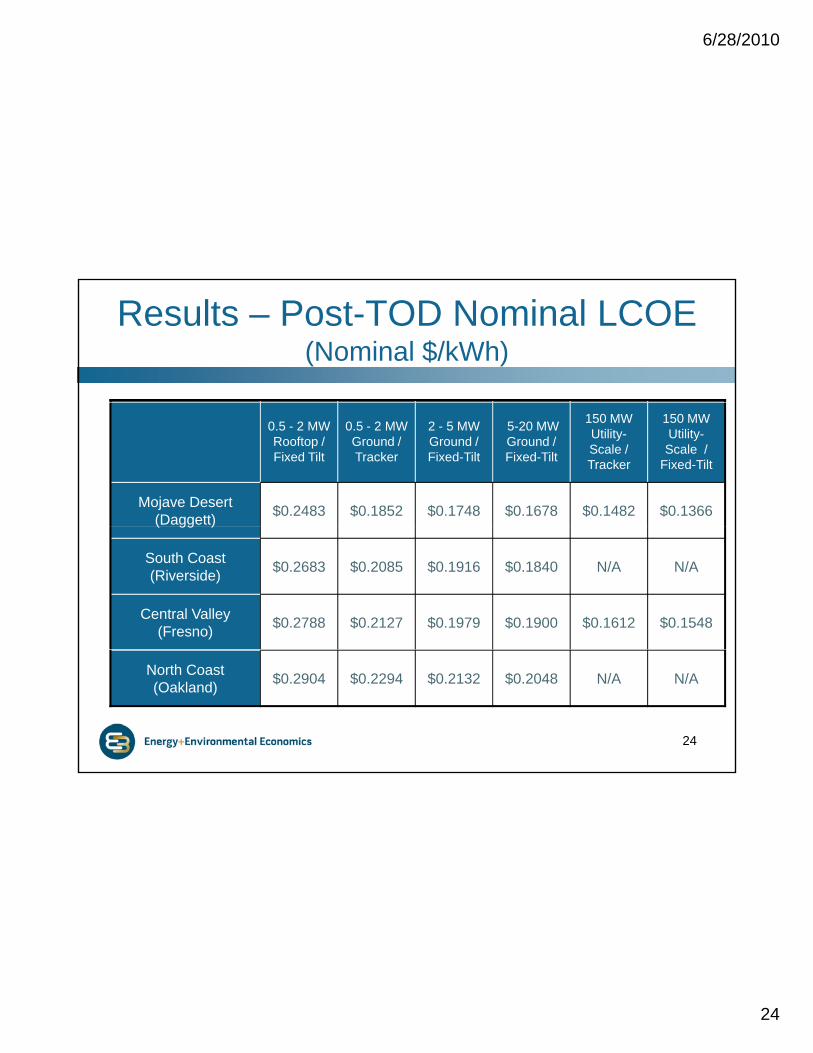
Results – Post-TOD Nominal LCOE(Nominal $/kWh)
0.5 - 2 MW Rooftop / Fixed Tilt
0.5 - 2 MW Ground / Tracker
2 - 5 MW Ground / Fixed-Tilt
5-20 MW Ground / Fixed-Tilt
150 MW Utility-Scale / Tracker
150 MW Utility-Scale /
Fixed-Tilt
Mojave Desert (Daggett) $0.2483 $0.1852 $0.1748 $0.1678 $0.1482 $0.1366( gg )
South Coast (Riverside) $0.2683 $0.2085 $0.1916 $0.1840 N/A N/A
Central Valley (Fresno) $0.2788 $0.2127 $0.1979 $0.1900 $0.1612 $0.1548
24
North Coast (Oakland) $0.2904 $0.2294 $0.2132 $0.2048 N/A N/A
6/28/2010
25
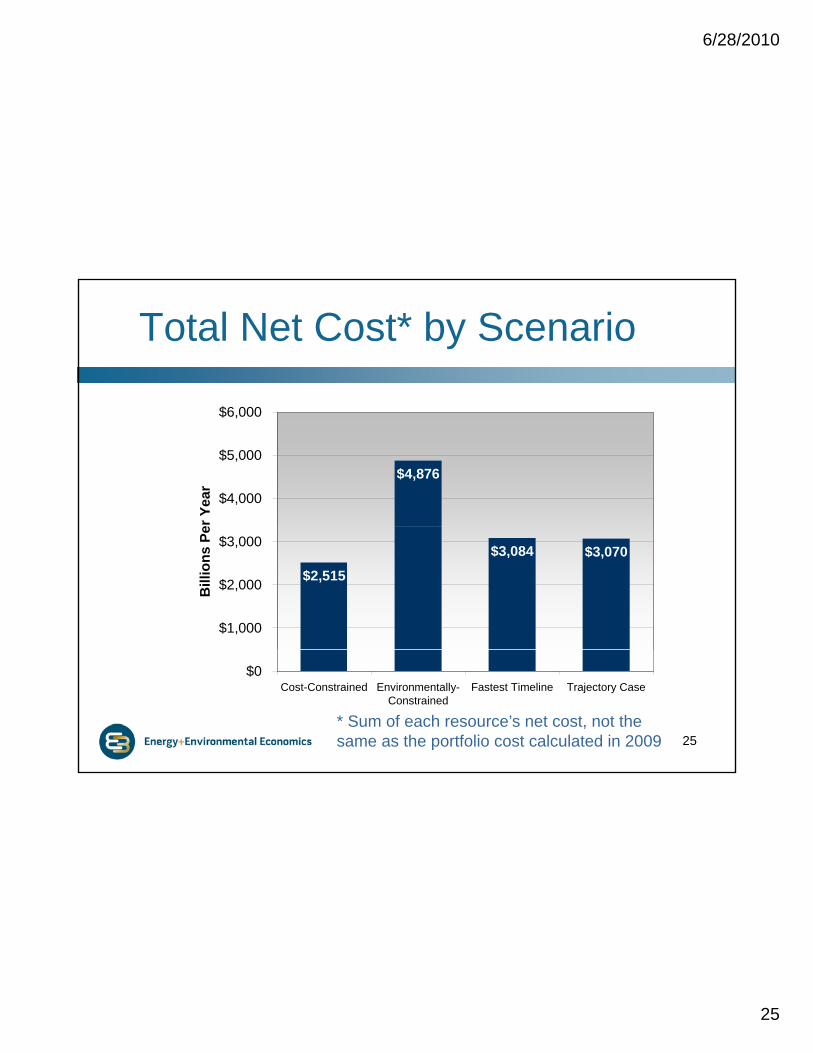
Total Net Cost* by Scenario
$4,876
$4,000
$5,000
$6,000
er Y
ear
$2,515
$3,084 $3,070
$1,000
$2,000
$3,000
Bill
ions
Pe
25* Sum of each resource’s net cost, not the same as the portfolio cost calculated in 2009
$0Cost-Constrained Environmentally-
ConstrainedFastest Timeline Trajectory Case
6/28/2010
26
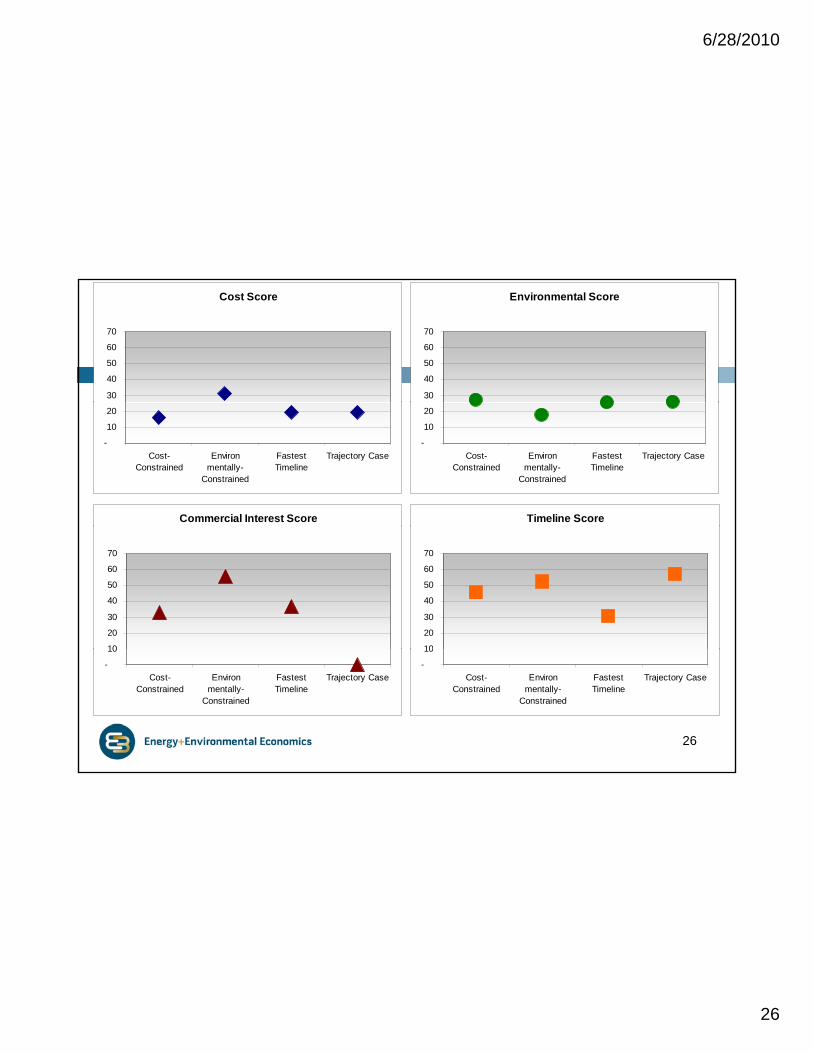
Environmental Score
30
40
50
60
70
Cost Score
30
40
50
60
70
-
10
20
Cost-Constrained
Environmentally-
Constrained
FastestTimeline
Trajectory Case
Commercial Interest Score
-
10
20
Cost-Constrained
Environmentally-
Constrained
FastestTimeline
Trajectory Case
Timeline Score
10
20
30
40
50
60
70
10
20
30
40
50
60
70
26
-
10
Cost-Constrained
Environmentally-
Constrained
FastestTimeline
Trajectory Case-
10
Cost-Constrained
Environmentally-
Constrained
FastestTimeline
Trajectory Case

6/28/2010
27
Appendix

6/28/2010
28
Avoided Capacity Cost Assumption
Distribution: $34/kW-yrUsed average of EE avoided costs
Subtransmission: $34/kW-yr
Issues
Timeframe vs. geographic specificity – must use long time frame for avoided cost valuey
Used average of EE avoided costs
Transmission: $0/kW-yrNetwork is more difficult
Set to zero for 33% RPS analysis
value
Cost of non-Rule 21 RETI 20MW PV Installations not studied
Network transmission costs of $65/kW-year
28
assumed for these resources
See EE avoided costs, R.04-04-025

6/28/2010
29
PV Bid Pricing vs. LCOE
The same $/kWh price can be presented in several different ways
PV bids typically reflect the price before Time of Day (TOD) factors are applied
Developers see the post-TOD value, which is the true cost of the PV system
Escalators can skew costs when compared to flat levelized costs
29
Results herein are post-TOD, flat nominal levelized
6/28/2010
30
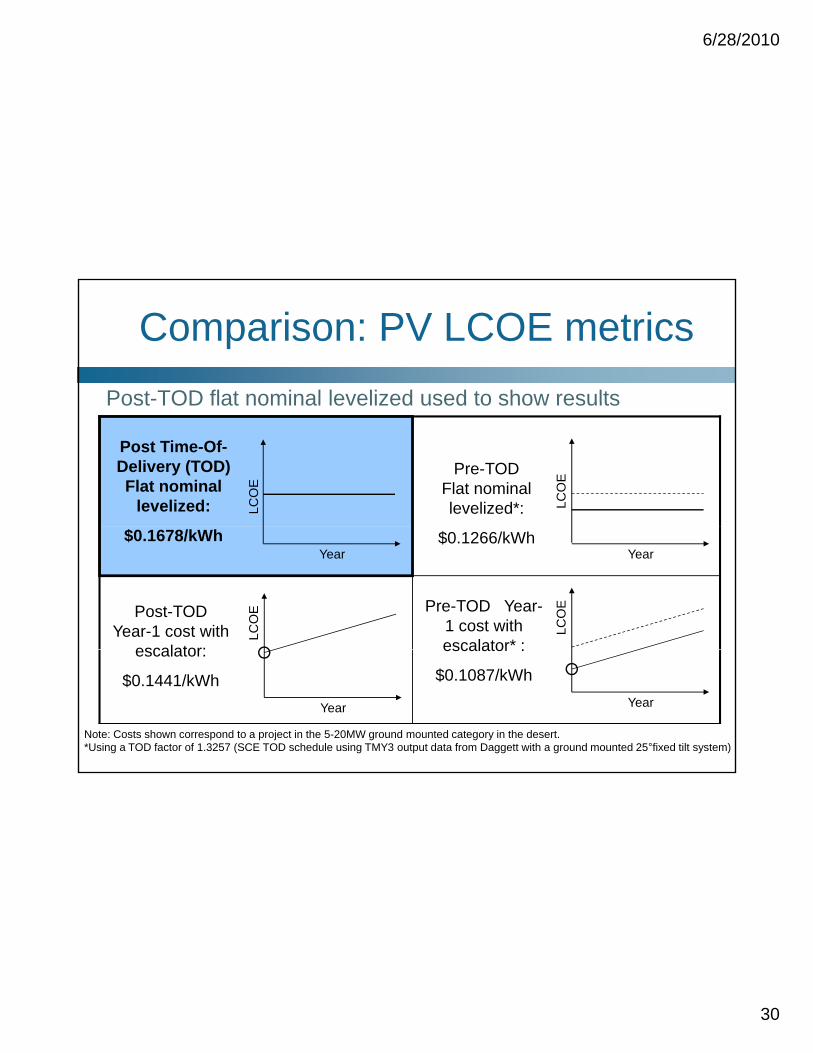
Comparison: PV LCOE metricsPost-TOD flat nominal levelized used to show resultsPost TOD flat nominal levelized used to show results
LCO
E
Post Time-Of-Delivery (TOD) Flat nominal
levelized: LCO
EPre-TOD Flat nominal levelized*:
Year$0.1678/kWh
LCO
EPost-TODYear-1 cost with
escalator:
Year$0.1266/kWh
LCO
EPre-TOD Year-1 cost with escalator* :
30
Year
escalator:
$0.1441/kWhYear
escalator :
$0.1087/kWh
Note: Costs shown correspond to a project in the 5-20MW ground mounted category in the desert.*Using a TOD factor of 1.3257 (SCE TOD schedule using TMY3 output data from Daggett with a ground mounted 25°fixed tilt system)
6/28/2010
31
PV LCOE Input Assumptions
C it l C tCapital Costs
Capacity Factors
Financing Assumptions
Operating Costs
31

6/28/2010
32
Black & Veatch Cost Estimates
1 MW rooftop $5.00/watt dc
1 MW tracking $4.75/watt dc
5 MW ground $3.90/watt dc
20 MW ground $3 70/watt dc
32
20 MW ground $3.70/watt dc
Based on configurations identified in B&V presentationAs stated previously, typical cost uncertainty is +/- 25%
6/28/2010
33
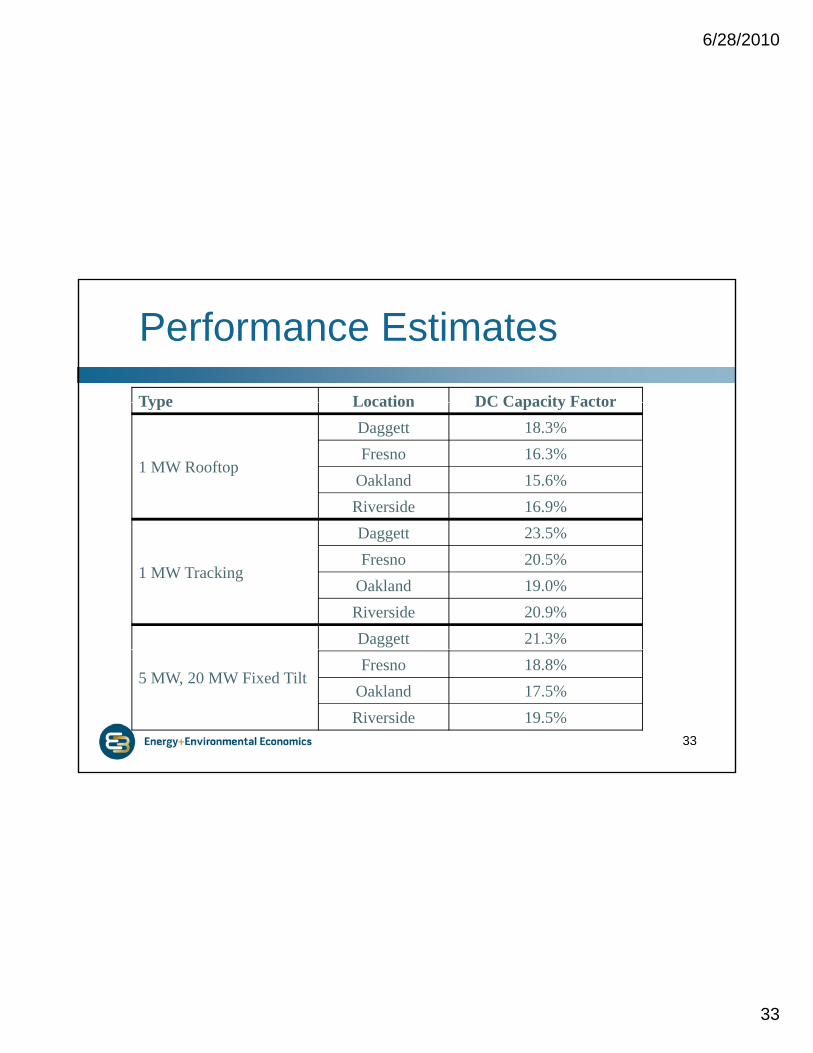
Performance EstimatesType Location DC Capacity FactorType Location DC Capacity Factor
1 MW Rooftop
Daggett 18.3%Fresno 16.3%
Oakland 15.6%Riverside 16.9%
1 MW Tracking
Daggett 23.5%Fresno 20.5%
Oakland 19.0%Riverside 20.9%Daggett 21.3%
33
5 MW, 20 MW Fixed TiltFresno 18.8%
Oakland 17.5%Riverside 19.5%
6/28/2010
34
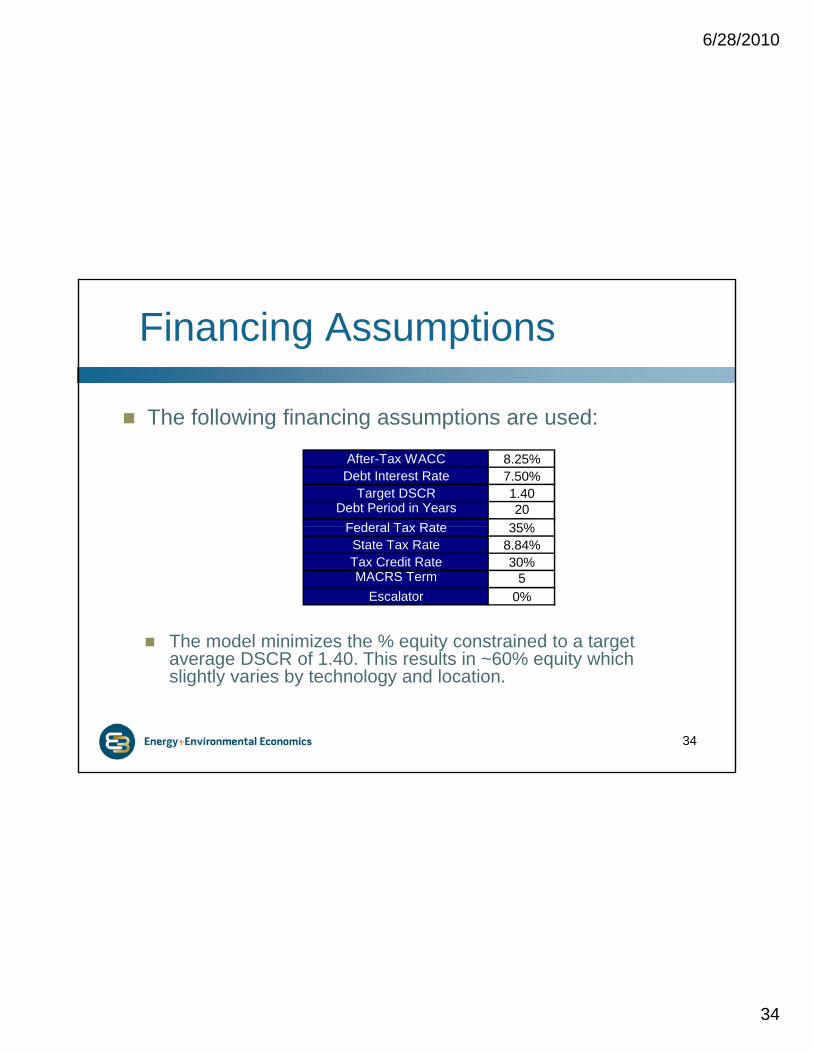
Financing Assumptions
The following financing assumptions are used:
After-Tax WACC 8.25%Debt Interest Rate 7.50%
Target DSCR 1.40Debt Period in Years 20
Federal Tax Rate 35%Federal Tax Rate 35%State Tax Rate 8.84%Tax Credit Rate 30%MACRS Term 5
Escalator 0%
The model minimizes the % equity constrained to a target
34
q y gaverage DSCR of 1.40. This results in ~60% equity which slightly varies by technology and location.
6/28/2010
35
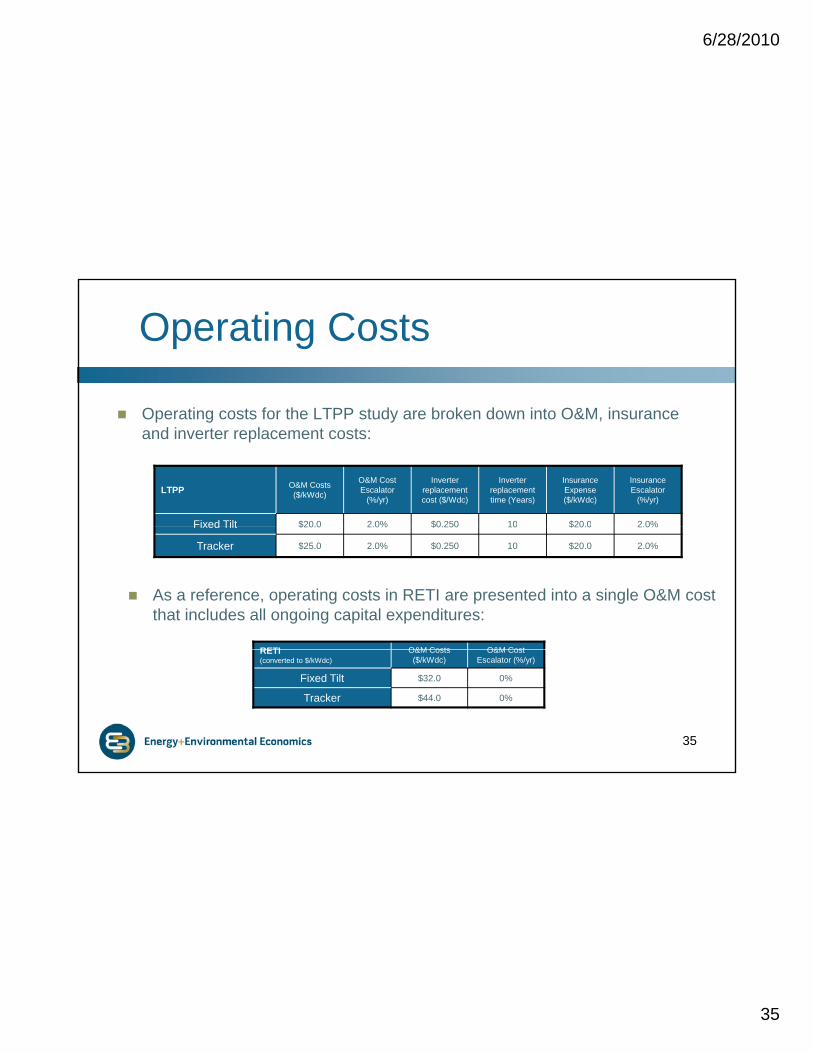
Operating Costs
Operating costs for the LTPP study are broken down into O&M, insurance and inverter replacement costs:
LTPP O&M Costs ($/kWdc)
O&M Cost Escalator
(%/yr)
Inverter replacement cost ($/Wdc)
Inverter replacement time (Years)
Insurance Expense ($/kWdc)
Insurance Escalator
(%/yr)
Fixed Tilt $20 0 2 0% $0 250 10 $20 0 2 0%Fixed Tilt $20.0 2.0% $0.250 10 $20.0 2.0%
Tracker $25.0 2.0% $0.250 10 $20.0 2.0%
RETI O&M Costs O&M Cost
As a reference, operating costs in RETI are presented into a single O&M cost that includes all ongoing capital expenditures:
35
RETI (converted to $/kWdc)
O&M Costs ($/kWdc)
O&M Cost Escalator (%/yr)
Fixed Tilt $32.0 0%
Tracker $44.0 0%

6/28/2010
36
Environmentally-Constrained Case: Resources by Location
Resources
Environmental Case Score RankCost Score 31 4 Environmental Score 18 1 Commercial Interest Score 56 3 Timing Score 52 3 Total Net Cost 4,876$ 4
Selected (GWh)
Environmental Score (0‐100)
Total (GWh and Average Score) 54,259 17.83 Distributed Solar ‐ Other 2,852 1.77 Distributed Solar ‐ SDGE 785 3.62 Distributed Solar ‐ SCE 4,596 4.54 Distributed Solar ‐ PG&E 3,280 5.79 Westlands 7,163 10.53 Riverside East 11,192 20.65 Pisgah 7,260 21.22 Remote DG ‐ SCE 348 21.62 R t DG Oth 283 21 62
Delivery Type GWh MWExisting Transmisssion 25,052 11,020Minor Upgrades 3,046 1,400New Corridors 20,296 8,666
Remote DG ‐ Other 283 21.62 Remote DG ‐ PG&E 929 21.62 Remote DG ‐ SDGE 40 21.62 Tehachapi 5,516 23.46 Arizona RECs 737 24.10 Carrizo South 2,092 25.08 Alberta RECs 1,230 26.76 Northwest RECs 1,376 26.76 Montana RECs 820 26.76 Utah‐Southern Idaho RECs 191 28.02 Palm Springs 222 29.14 San Bernardino ‐ Lucerne 121 31.91
36
New Corridors 20,296 8,666Out‐of‐State RECs 5,865 2,256Total 54,259 23,342
San Bernardino Lucerne 121 31.91 NonCREZ 1,333 33.71 San Diego South 156 34.08 Nevada N RECs 212 35.26 Round Mountain 226 35.37 New Mexico RECs 238 36.70 Nevada C RECs 1,062 40.79

6/28/2010
37
Environmentally-Constrained Case: Resources by Type
All Resources (GWh)In‐State Out‐of‐State Total
Biogas 84 0 84Biomass 938 238 1,176Geothermal 0 212 212Hydro 0 0 0Large Scale Solar PV 22,701 864 23,564Small Solar PV 13,112 0 13,112Solar Thermal 5,474 935 6,409Wind 6,085 3,616 9,701T t l 48 394 5 865 54 259
All Resources (GWh)
Project Status GWh MWDiscounted Core 21,162 8,146Commercial Non‐Core 2,805 1,154Theoretical 30,292 14,042Total 54,259 23,342
Key Indicators: Total 48,394 5,865 54,259Out‐of‐State Share of 33% Target: 10%
In‐State Out‐of‐State TotalBiogas 12 0 12Biomass 126 32 158Geothermal 0 30 30Hydro 0 0 0L S l S l PV 9 696 340 10 036
All Resources (MW)
Key Indicators:Total Solar MW: 19,500 (16,800 PV)
Out-of-State RECs: 10%
Earliest compliance year: 2020
Large-scale remote solar requires
37
Large Scale Solar PV 9,696 340 10,036Small Solar PV 6,828 0 6,828Solar Thermal 2,333 400 2,733Wind 2,091 1,454 3,545Total 21,086 2,256 23,342
new transmission corridors
Remote small-scale PV is the marginal resource – not all is picked

6/28/2010
38
Environmentally-Constrained Supply Curve
Discounted Core 2020 RPS Net Short
20
25
30
35
40
45
ing
Scor
e
0
5
10
15
20
0 8 16 24 32 40 48 56 64 72 80 88 96
Ran
ki
38
Cumulative TWh
Biogas Biomass Bundled Transmission GeothermalSmall Hydro Incremental Upgrade Small Solar PV Large Scale Solar PVSolar Thermal Wind
Related Documents