LSC COMMUNICATIONS New Segment Introduction October, 2018

Welcome message from author
This document is posted to help you gain knowledge. Please leave a comment to let me know what you think about it! Share it to your friends and learn new things together.
Transcript

LSC COMMUNICATIONS
New Segment Introduction
October, 2018

SAFE HARBOR AND NON-GAAP INFORMATION
2 | LSC COMMUNICATIONS
LSC Communications Cautionary Statement Regarding Forward-Looking Statements
This presentation includes certain "forward-looking statements" within the meaning of, and subject to the safe harbor created by, Section 21E of the Securities Exchange Act of 1934, as amended, with
respect to the business, strategy and plans of LSC Communications and its expectations relating to future financial condition and performance. Statements that are not historical facts, including statements
about LSC Communications management’s beliefs and expectations, are forward-looking statements. Words such as "believes," "anticipates," "estimates," "expects," "intends," "aims," "potential," "will,"
"would," "could," "considered," "likely," "estimate" and variations of these words and similar future or conditional expressions are intended to identify forward-looking statements but are not the exclusive
means of identifying such statements. While LSC Communications believes these expectations, assumptions, estimates and projections are reasonable, such forward-looking statements are only predictions
and involve known and unknown risks and uncertainties, many of which are beyond LSC Communications’ control. By their nature, forward-looking statements involve risk and uncertainty because they
relate to events and depend upon future circumstances that may or may not occur. Actual results may differ materially from LSC Communications’ current expectations depending upon a number of factors
affecting the business and risks associated with the performance of the business. These factors include such risks and uncertainties detailed in LSC Communications’ Form 10-K filed on February 22, 2018
and LSC Communications’ periodic filings with the SEC. LSC Communications does not undertake to and specifically declines any obligation to publicly release the results of any revisions to these forward-
looking statements that may be made to reflect future events or circumstances after the date of such statement or to reflect the occurrence of anticipated or unanticipated events.
Non-GAAP Financial Information
This presentation contains certain non-GAAP measures. The Company believes that these non-GAAP measures, such as non-GAAP adjusted EBITDA, non-GAAP adjusted EBITDA margin, non-GAAP net
income/loss and free cash flow, when presented in conjunction with comparable GAAP measures, provide useful information about the Company’s operating results and liquidity and enhance the overall
ability to assess the Company’s financial performance. The Company uses these measures, together with other measures of performance under GAAP, to compare the relative performance of operations in
planning, budgeting and reviewing the performance of its business. Non-GAAP adjusted EBITDA, non-GAAP adjusted EBITDA margin, non-GAAP net income/loss and free cash flow allow investors to make
a more meaningful comparison between the Company’s core business operating results over different periods of time. The Company believes that non-GAAP adjusted EBITDA, non-GAAP adjusted EBITDA
margin, non-GAAP net income/loss and free cash flow, when viewed with the Company’s results under GAAP and the accompanying reconciliations, provides useful information about the Company’s
business without regard to potential distortions. By eliminating potential differences in results of operations between periods caused by factors such as depreciation and amortization methods, historic cost
and age of assets, financing and capital structures, taxation positions or regimes, restructuring, impairment and other charges and gain or loss on certain equity investments and asset sales, the Company
believes that non-GAAP adjusted EBITDA, non-GAAP adjusted EBITDA margin and non-GAAP net income/loss can provide useful additional basis for comparing the current performance of the underlying
operations being evaluated. By adjusting for the level of capital investment in operations, the Company believes that free cash flow can provide useful additional basis for understanding the Company’s
ability to generate cash after capital investment and provides a comparison to peers with differing capital intensity.

Print86%
Office Products14%
Book28%
Magazines, Catalogs & Logistics
48%
Other10%
Office Products14%
$3.6BN2017 Sales
$3.6BN2017 Sales
3 | LSC COMMUNICATIONS
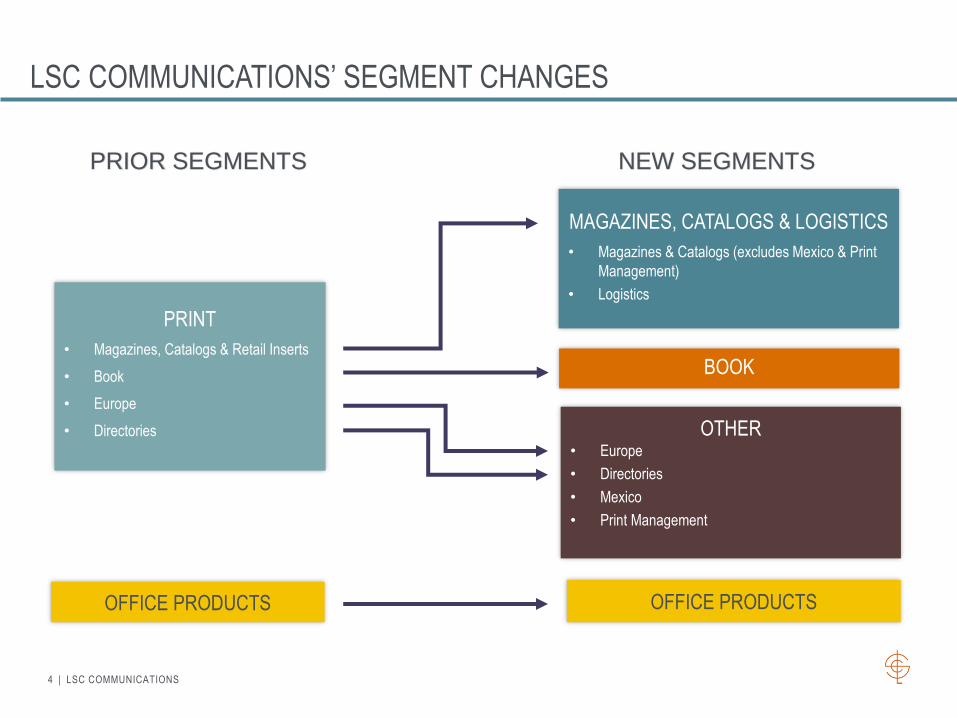
SEGMENTS REDEFINED AS BUSINESS EVOLVES
LSC COMMUNICATIONS’ NEW SEGMENTS
Strategy execution requires re-evaluating segment structure
• Acquisition of RR Donnelley’s print logistics business, combined with the acquisitions of Fairrington
and The Clark Group creates industry leading logistics capabilities
• Strategic divestiture of the European printing business and retail offset facilities
• Continued evolution of new product and service offerings and acquisition activity
4 | LSC COMMUNICATIONS
• Magazines, Catalogs & Retail Inserts
• Book
• Europe
• Directories
LSC COMMUNICATIONS’ SEGMENT CHANGES
OFFICE PRODUCTS OFFICE PRODUCTS
MAGAZINES, CATALOGS & LOGISTICS
• Magazines & Catalogs (excludes Mexico & Print
Management)
• Logistics
BOOK
OTHER• Europe
• Directories
• Mexico
• Print Management
PRIOR SEGMENTS NEW SEGMENTS

5 | LSC COMMUNICATIONS
NON-GAAP FINANCIAL MEASURES - CONSOLIDATED($ millions)
Total LSC Communications
Q2 2018 Q1 2018 Q4 2017 Q3 2017 Q2 2017 Q1 2017 FY 2017 FY 2016
Net sales $943 $929 $999 $935 $848 $821 $3,603 $3,654
GAAP Net income (loss) 8 (11) (58) (3) 5 (1) (57) 106
Restructuring, impairment and other
charges - net11 6 42 60 21 6 129 18
Separation-related expenses - - - 1 2 1 4 5
Pension settlement charge - - - - - - - 1
Acquisition-related expenses 1 1 2 2 1 - 5 -
Purchase accounting adjustments - 3 (2) 1 - - (1) -
Loss on debt extinguishment - - 3 - - - 3 -
Depreciation and amortization 34 38 42 39 39 40 160 171
Interest expense - net 18 20 20 19 16 17 72 18
Income tax expense (benefit) 5 (4) 36 (23) (2) 2 13 51
Non-GAAP Adjusted EBITDA $77 $53 $85 $96 $82 $65 $328 $370
Non-GAAP Adjusted EBITDA margin 8.2% 5.7% 8.5% 10.3% 9.7% 7.9% 9.1% 10.1%
Net cash (used by) provided by
operating activities($2) ($24) $147 ($20) $14 $64 $205 $231
Capital expenditures (17) (20) (9) (15) (15) (21) (60) (48)
Free cash flow ($19) ($44) $138 ($35) ($1) $43 $145 $183

6 | LSC COMMUNICATIONS
NON-GAAP FINANCIAL MEASURES – SEGMENTS ($ millions)
Magazines, Catalogs and Logistics
Q2 2018 Q1 2018 Q4 2017 Q3 2017 Q2 2017 Q1 2017 FY 2017 FY 2016
Net sales $401 $427 $484 $409 $341 $349 $1,583 $1,526
(Loss) income from operations (6) (14) (22) (41) (6) (4) (73) 28
Depreciation and amortization 15 16 20 18 17 17 72 76
Restructuring, impairment and other
charges - net6 4 31 51 2 2 86 4
Purchase accounting adjustments - - - 1 - - 1 -
Non-GAAP Adjusted EBITDA $15 $6 $29 $29 $13 $15 $86 $108
Non-GAAP Adjusted EBITDA margin 3.7% 1.4% 6.0% 7.1% 3.8% 4.3% 5.4% 7.1%
Capital expenditures $5 $9 $4 $6 $7 $7 $24 $19
Book
Q2 2018 Q1 2018 Q4 2017 Q3 2017 Q2 2017 Q1 2017 FY 2017 FY 2016
Net sales $266 $249 $245 $276 $262 $239 $1,022 $1,097
Income from operations 19 9 9 26 18 9 62 86
Depreciation and amortization 13 14 14 14 16 16 60 67
Restructuring, impairment and other
charges - net3 1 8 2 3 2 15 6
Non-GAAP Adjusted EBITDA $35 $24 $31 $42 $37 $27 $137 $159
Non-GAAP Adjusted EBITDA margin 13.2% 9.6% 12.7% 15.2% 14.1% 11.3% 13.4% 14.5%
Capital expenditures $9 $9 $1 $2 $3 $7 $13 $10
7 | LSC COMMUNICATIONS
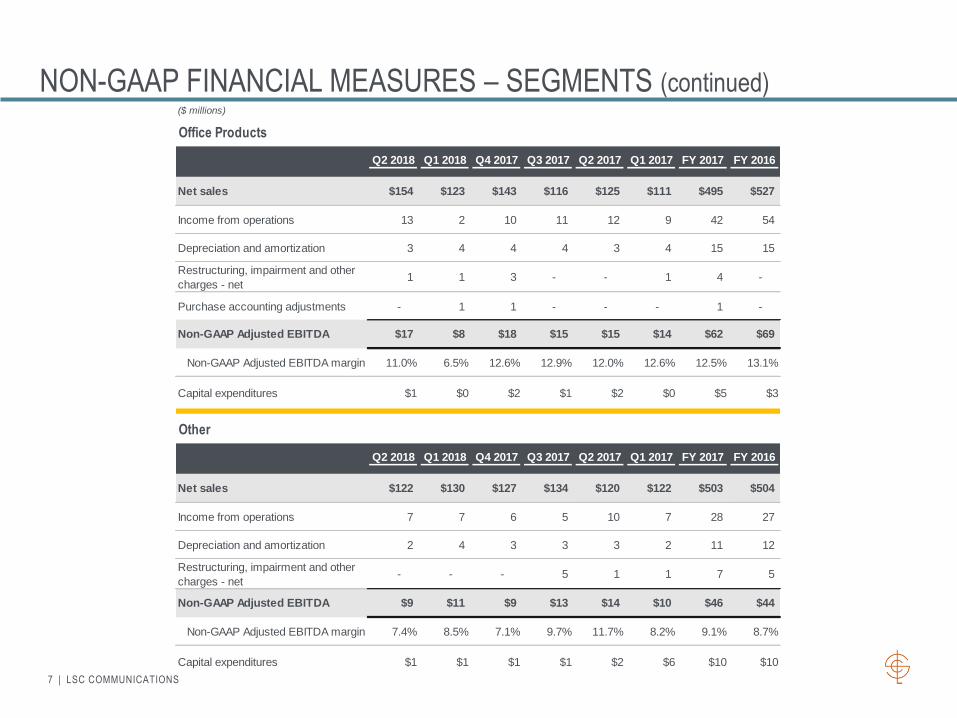
NON-GAAP FINANCIAL MEASURES – SEGMENTS (continued)($ millions)
Office Products
Q2 2018 Q1 2018 Q4 2017 Q3 2017 Q2 2017 Q1 2017 FY 2017 FY 2016
Net sales $154 $123 $143 $116 $125 $111 $495 $527
Income from operations 13 2 10 11 12 9 42 54
Depreciation and amortization 3 4 4 4 3 4 15 15
Restructuring, impairment and other
charges - net1 1 3 - - 1 4 -
Purchase accounting adjustments - 1 1 - - - 1 -
Non-GAAP Adjusted EBITDA $17 $8 $18 $15 $15 $14 $62 $69
Non-GAAP Adjusted EBITDA margin 11.0% 6.5% 12.6% 12.9% 12.0% 12.6% 12.5% 13.1%
Capital expenditures $1 $0 $2 $1 $2 $0 $5 $3
Other
Q2 2018 Q1 2018 Q4 2017 Q3 2017 Q2 2017 Q1 2017 FY 2017 FY 2016
Net sales $122 $130 $127 $134 $120 $122 $503 $504
Income from operations 7 7 6 5 10 7 28 27
Depreciation and amortization 2 4 3 3 3 2 11 12
Restructuring, impairment and other
charges - net- - - 5 1 1 7 5
Non-GAAP Adjusted EBITDA $9 $11 $9 $13 $14 $10 $46 $44
Non-GAAP Adjusted EBITDA margin 7.4% 8.5% 7.1% 9.7% 11.7% 8.2% 9.1% 8.7%
Capital expenditures $1 $1 $1 $1 $2 $6 $10 $10
8 | LSC COMMUNICATIONS
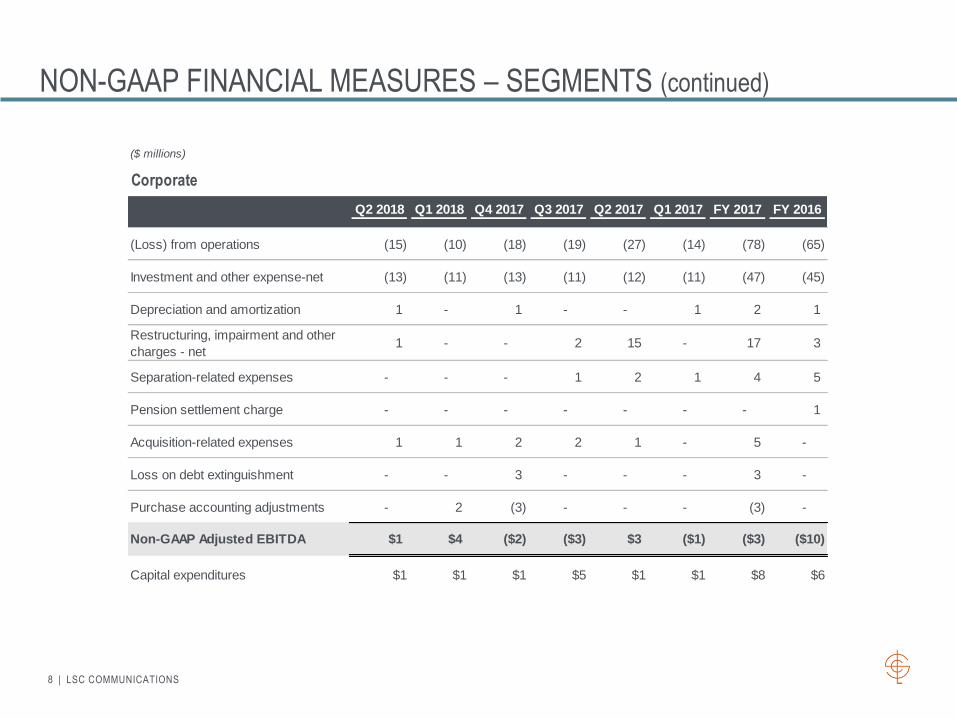
NON-GAAP FINANCIAL MEASURES – SEGMENTS (continued)
($ millions)
Corporate
Q2 2018 Q1 2018 Q4 2017 Q3 2017 Q2 2017 Q1 2017 FY 2017 FY 2016
(Loss) from operations (15) (10) (18) (19) (27) (14) (78) (65)
Investment and other expense-net (13) (11) (13) (11) (12) (11) (47) (45)
Depreciation and amortization 1 - 1 - - 1 2 1
Restructuring, impairment and other
charges - net1 - - 2 15 - 17 3
Separation-related expenses - - - 1 2 1 4 5
Pension settlement charge - - - - - - - 1
Acquisition-related expenses 1 1 2 2 1 - 5 -
Loss on debt extinguishment - - 3 - - - 3 -
Purchase accounting adjustments - 2 (3) - - - (3) -
Non-GAAP Adjusted EBITDA $1 $4 ($2) ($3) $3 ($1) ($3) ($10)
Capital expenditures $1 $1 $1 $5 $1 $1 $8 $6

9 | LSC COMMUNICATIONS
ORGANIC GROWTH RATES – Q2 YTD 2018
($ millions)
Magazines,
Catalogs &
Logistics
BookOffice
ProductsOther Total LSC
Q2 2017 YTD Net Sales as Reported $690 $501 $236 $242 $1,669
Adjustments (1)181 - 59 - 240
Q2 2017 YTD Net Sales Pro Forma $871 $501 $295 $242 $1,909
Q2 2018 YTD Net Sales as Reported $828 $515 $277 $252 $1,872
Adjustments (1)- - - - -
Q2 2018 YTD Net Sales Pro Forma $828 $515 $277 $252 $1,872
As Reported % Change 20.0% 2.8% 17.4% 4.1% 12.2%
Pro Forma % Change (4.9%) 2.8% (6.1%) 4.1% (1.9%)
Non-GAAP Adjustments:
Impact of changes in foreign exchange rates ("fx") ---% ---% 0.3% 6.0% 0.8%
Impact of pass-through paper sales 0.3% (0.4%) ---% (2.8%) (0.3%)
Impact of adoption of new revenue recognition standard (0.2%) 0.9% (2.7%) 0.1% (0.3%)
Impact of sale of disposition (2)(0.9%) ---% ---% ---% (0.4%)
Q2 2018 YTD Organic % Change (3)(4.1%) 2.3% (3.7%) 0.8% (1.7%)
The reported results of the Company include the results of acquired businesses from the acquisition dates forward. The Company has provided this schedule to
reconcile reported net sales for the six months ended June 30, 2018 and 2017 to pro forma net sales as if the acquisitions took place as of January 1, 2017 for
purposes of this schedule.
(1) Adjusted for net sales of acquired businesses: There were no acquisitions during the six months ended June 30, 2018. For the six months ended June 30,
2017, the adjustments to net sales of acquired businesses reflect the net sales of The Clark Group (acquired November 29, 2017), Quality Park (acquired
November 9, 2017), Publishers Press (acquired September 7, 2017), NECI, LLC (acquired August 21, 2017), CREEL Printing (acquired August 17, 2017),
Fairrington (acquired July 28, 2017), and HudsonYards (acquired March 1, 2017).
(2) Adjusted for the disposition of the Company’s retail offset printing facilities on June 5, 2018. There were no dispositions during the six months ended June 30,
2017.
(3) Adjusted for the impact of acquisitions and dispositions, changes in FX rates, pass-through paper sales and the Company’s adoption of Accounting Standards
Update No. 2014-09 “Revenue from Contracts with Customers (Topic 606)” during the six months ended June 30, 2018.
10 | LSC COMMUNICATIONS
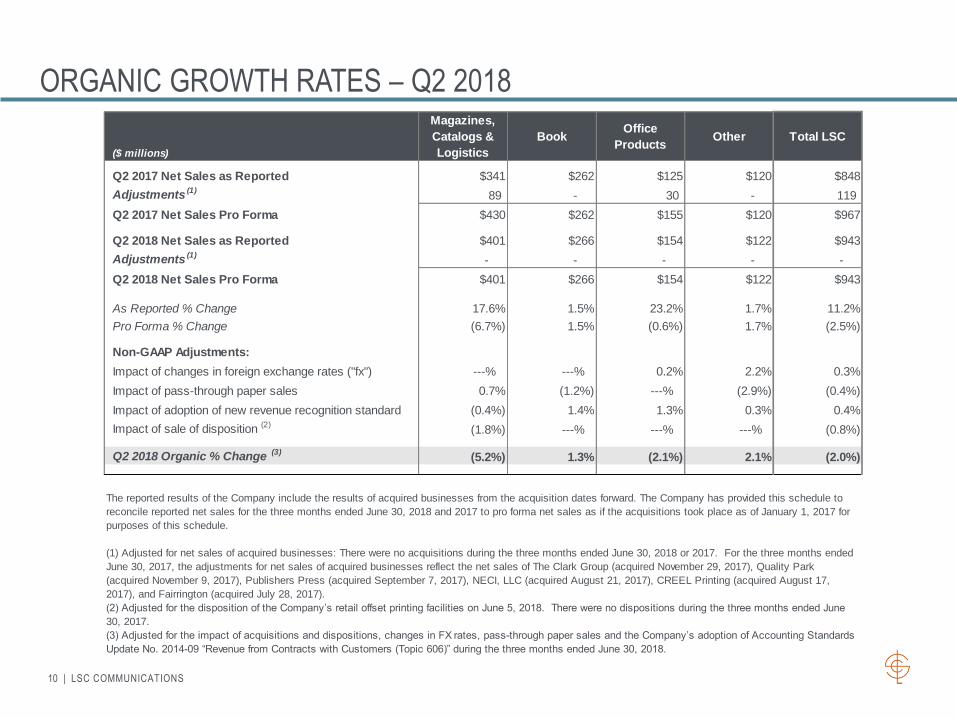
ORGANIC GROWTH RATES – Q2 2018
($ millions)
Magazines,
Catalogs &
Logistics
BookOffice
ProductsOther Total LSC
Q2 2017 Net Sales as Reported $341 $262 $125 $120 $848
Adjustments (1)89 - 30 - 119
Q2 2017 Net Sales Pro Forma $430 $262 $155 $120 $967
Q2 2018 Net Sales as Reported $401 $266 $154 $122 $943
Adjustments (1)- - - - -
Q2 2018 Net Sales Pro Forma $401 $266 $154 $122 $943
As Reported % Change 17.6% 1.5% 23.2% 1.7% 11.2%
Pro Forma % Change (6.7%) 1.5% (0.6%) 1.7% (2.5%)
Non-GAAP Adjustments:
Impact of changes in foreign exchange rates ("fx") ---% ---% 0.2% 2.2% 0.3%
Impact of pass-through paper sales 0.7% (1.2%) ---% (2.9%) (0.4%)
Impact of adoption of new revenue recognition standard (0.4%) 1.4% 1.3% 0.3% 0.4%
Impact of sale of disposition (2)(1.8%) ---% ---% ---% (0.8%)
Q2 2018 Organic % Change (3)(5.2%) 1.3% (2.1%) 2.1% (2.0%)
The reported results of the Company include the results of acquired businesses from the acquisition dates forward. The Company has provided this schedule to
reconcile reported net sales for the three months ended June 30, 2018 and 2017 to pro forma net sales as if the acquisitions took place as of January 1, 2017 for
purposes of this schedule.
(1) Adjusted for net sales of acquired businesses: There were no acquisitions during the three months ended June 30, 2018 or 2017. For the three months ended
June 30, 2017, the adjustments for net sales of acquired businesses reflect the net sales of The Clark Group (acquired November 29, 2017), Quality Park
(acquired November 9, 2017), Publishers Press (acquired September 7, 2017), NECI, LLC (acquired August 21, 2017), CREEL Printing (acquired August 17,
2017), and Fairrington (acquired July 28, 2017).
(2) Adjusted for the disposition of the Company’s retail offset printing facilities on June 5, 2018. There were no dispositions during the three months ended June
30, 2017.
(3) Adjusted for the impact of acquisitions and dispositions, changes in FX rates, pass-through paper sales and the Company’s adoption of Accounting Standards
Update No. 2014-09 “Revenue from Contracts with Customers (Topic 606)” during the three months ended June 30, 2018.

11 | LSC COMMUNICATIONS
ORGANIC GROWTH RATES – Q1 2018
($ millions)
Magazines,
Catalogs &
Logistics
BookOffice
ProductsOther Total LSC
Q1 2017 Net Sales as Reported $349 $239 $111 $122 $821
Adjustments (1)92 - 30 - 122
Q1 2017 Net Sales Pro Forma $441 $239 $141 $122 $943
Q1 2018 Net Sales as Reported $427 $249 $123 $130 $929
Adjustments (1)- - - - -
Q1 2018 Net Sales Pro Forma $427 $249 $123 $130 $929
As Reported % Change 22.3% 4.2% 10.8% 6.6% 13.2%
Pro Forma % Change (3.2%) 4.2% (12.8%) 6.6% (1.5%)
Non-GAAP Adjustments:
Impact of changes in foreign exchange rates ("fx") ---% ---% ---% 9.8% 1.3%
Impact of pass-through paper sales ---% 0.8% ---% (2.5%) (0.1%)
Impact of adoption of new revenue recognition standard (0.1%) 0.3% (7.0%) ---% (1.0%)
Q1 2018 Organic % Change (2)(3.1%) 3.1% (5.8%) (0.7%) (1.7%)
The reported results of the Company include the results of acquired businesses from the acquisition date forward. The Company has provided this schedule to
reconcile reported net sales for the three months ended March 31, 2018 and 2017 to pro forma net sales as if the acquisitions took place as of January 1, 2017 for
purposes of this schedule.
(1) Adjusted for net sales of acquired businesses: There were no acquisitions during the three months ended March 31, 2018. For the three months ended March
31, 2017, the adjustments for net sales of acquired businesses reflect the net sales of The Clark Group (acquired November 29, 2017), Quality Park (acquired
November 9, 2017), Publishers Press (acquired September 7, 2017), NECI, LLC (acquired August 21, 2017), CREEL Printing (acquired August 17, 2017),
Fairrington (acquired July 28, 2017), and HudsonYards Studios (acquired March 1, 2017).
(2) Adjusted for net sales of acquired businesses, the impact of changes in FX rates, pass-through paper sales and the Company’s adoption of Accounting
Standards Update No. 2014-09 “Revenue from Contracts with Customers (Topic 606)” during the three months ended March 31, 2018.

12 | LSC COMMUNICATIONS
ORGANIC GROWTH RATES – FULL YEAR 2017
($ millions)
Magazines,
Catalogs &
Logistics
BookOffice
ProductsOther Total LSC
Full Year 2016 Net Sales as Reported $1,526 $1,097 $527 $504 $3,654
Adjustments (1)400 - 137 44 581
Full Year 2016 Net Sales Pro Forma $1,926 $1,097 $664 $548 $4,235
Full Year 2017 Net Sales as Reported $1,583 $1,022 $495 $503 $3,603
Adjustments (1)243 - 95 - 338
Full Year 2017 Net Sales Pro Forma $1,826 $1,022 $590 $503 $3,941
As Reported % Change 3.7% (6.8%) (6.1%) (0.2%) (1.4%)
Pro Forma % Change (5.2%) (6.8%) (11.1%) (8.2%) (6.9%)
Non-GAAP Adjustments:
Impact of changes in foreign exchange rates ("fx") ---% ---% ---% 1.8% 0.2%
Impact of pass-through paper sales 0.2% (1.9%) ---% (1.8%) (0.7%)
Full Year 2017 Organic % Change (2)(5.4%) (4.9%) (11.1%) (8.2%) (6.4%)
The reported results of the Company include the results of acquired businesses from the acquisition date forward. The Company has provided this schedule to
reconcile reported net sales for the twelve months ended December 31, 2017 and 2016 to pro forma net sales as if the acquisitions took place as of January 1,
2016 for purposes of this schedule.
(1) Adjusted for net sales of acquired businesses: For the twelve months ended December 31, 2017, the adjustments for net sales of acquired businesses reflect
the net sales of Clark Group (acquired November 29, 2017), Quality Park (acquired November 9, 2017), Publishers Press (acquired September 7, 2017), NECI
(acquired August 21, 2017), CREEL (acquired August 17, 2017), Fairrington (acquired July 28, 2017), and HudsonYards (acquired March 1, 2017). For the twelve
months ended December 31, 2016, the adjustments for net sales of acquired businesses reflect the net sales of Continuum (acquired December 2, 2016), in
addition to the acquisitions noted above.
(2) Adjusted for net sales of acquired businesses, the impact of changes in FX rates and pass-through paper sales.

13 | LSC COMMUNICATIONS
ORGANIC GROWTH RATES – Q4 2017
($ millions)
Magazines,
Catalogs &
Logistics
BookOffice
ProductsOther Total LSC
Q4 2016 Net Sales as Reported $415 $256 $130 $118 $919
Adjustments (1)105 - 32 4 141
Q4 2016 Net Sales Pro Forma $520 $256 $162 $122 $1,060
Q4 2017 Net Sales as Reported $484 $245 $143 $127 $999
Adjustments (1)8 - 9 - 17
Q4 2017 Net Sales Pro Forma $492 $245 $152 $127 $1,016
As Reported % Change 16.6% (4.3%) 10.0% 7.6% 8.7%
Pro Forma % Change (5.4%) (4.3%) (6.2%) 4.1% (4.2%)
Non-GAAP Adjustments:
Impact of changes in foreign exchange rates ("fx") ---% ---% ---% 7.4% 0.8%
Impact of pass-through paper sales 0.2% (0.8%) ---% (2.5%) (0.4%)
Q4 2017 Organic % Change (2)(5.6%) (3.5%) (6.2%) (0.8%) (4.6%)
The reported results of the Company include the results of acquired businesses from the acquisition date forward. The Company has provided this schedule to
reconcile reported net sales for the three months ended December 31, 2017 and 2016 to pro forma net sales as if the acquisitions took place as of January 1,
2016 for purposes of this schedule.
(1) Adjusted for net sales of acquired businesses: For the three months ended December 31, 2017, the adjustments for net sales of acquired businesses reflect
the net sales of The Clark Group (acquired November 29, 2017) and Quality Park (acquired November 9, 2017). For the three months ended December 31, 2016,
the adjustments for net sales of acquired businesses reflect the net sales of Publishers Press (acquired September 7, 2017), NECI, LLC (acquired August 21,
2017), CREEL Printing (acquired August 17, 2017), and Fairrington (acquired July 28, 2017), HudsonYards Studios (acquired March 1, 2017) and Continuum
(acquired December 2, 2016), in addition to the acquisitions noted above.
(2) Adjusted for net sales of acquired businesses, the impact of changes in FX rates and pass-through paper sales.

14 | LSC COMMUNICATIONS
ORGANIC GROWTH RATES – Q3 2017
($ millions)
Magazines,
Catalogs &
Logistics
BookOffice
ProductsOther Total LSC
Q3 2016 Net Sales as Reported $379 $310 $127 $133 $949
Adjustments (1)89 - 2 12 103
Q3 2016 Net Sales Pro Forma $468 $310 $129 $145 $1,052
Q3 2017 Net Sales as Reported $409 $276 $116 $134 $935
Adjustments (1)42 - 1 - 43
Q3 2017 Net Sales Pro Forma $451 $276 $117 $134 $978
As Reported % Change 7.9% (11.0%) (8.7%) 0.8% (1.5%)
Pro Forma % Change (3.6%) (11.0%) (9.3%) (7.6%) (7.0%)
Non-GAAP Adjustments:
Impact of changes in foreign exchange rates ("fx") ---% ---% ---% 4.1% 0.6%
Impact of pass-through paper sales 1.1% (4.5%) ---% (1.4%) (1.0%)
Q3 2017 Organic % Change (2)(4.7%) (6.5%) (9.3%) (10.3%) (6.6%)
The reported results of the Company include the results of acquired businesses from the acquisition date forward. The Company has provided this schedule to
reconcile reported net sales for the three months ended September 30, 2017 and 2016 to pro forma net sales as if the acquisitions took place as of January 1,
2016 for purposes of this schedule.
(1) Adjusted for net sales of acquired businesses: For the three months ended September 30, 2017, the adjustments for net sales of acquired businesses reflect
the net sales of Publishers Press (acquired September 7, 2017), NECI, LLC (acquired August 21, 2017), CREEL Printing (acquired August 17, 2017), and
Fairrington (acquired July 28, 2017). For the three months ended September 30, 2016, the adjustments for net sales of acquired businesses reflect the net sales
of HudsonYards (acquired March 1, 2017) and Continuum (acquired December 2, 2016), in addition to the acquisitions noted above.
(2) Adjusted for net sales of acquired businesses, the impact of changes in FX rates and pass-through paper sales.
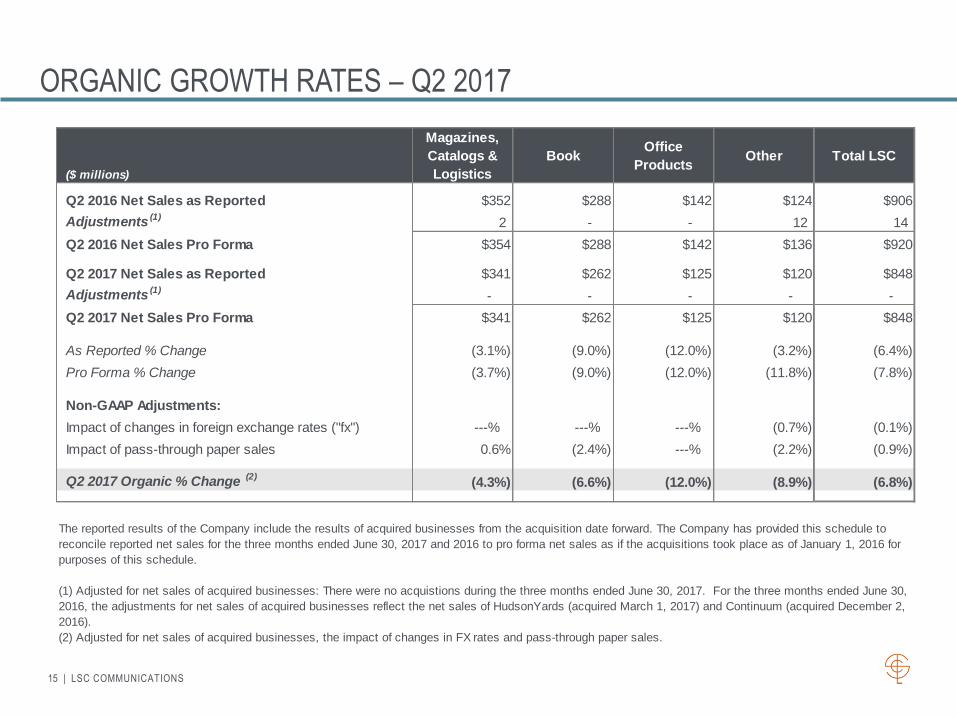
15 | LSC COMMUNICATIONS
ORGANIC GROWTH RATES – Q2 2017
($ millions)
Magazines,
Catalogs &
Logistics
BookOffice
ProductsOther Total LSC
Q2 2016 Net Sales as Reported $352 $288 $142 $124 $906
Adjustments (1)2 - - 12 14
Q2 2016 Net Sales Pro Forma $354 $288 $142 $136 $920
Q2 2017 Net Sales as Reported $341 $262 $125 $120 $848
Adjustments (1)- - - - -
Q2 2017 Net Sales Pro Forma $341 $262 $125 $120 $848
As Reported % Change (3.1%) (9.0%) (12.0%) (3.2%) (6.4%)
Pro Forma % Change (3.7%) (9.0%) (12.0%) (11.8%) (7.8%)
Non-GAAP Adjustments:
Impact of changes in foreign exchange rates ("fx") ---% ---% ---% (0.7%) (0.1%)
Impact of pass-through paper sales 0.6% (2.4%) ---% (2.2%) (0.9%)
Q2 2017 Organic % Change (2)(4.3%) (6.6%) (12.0%) (8.9%) (6.8%)
The reported results of the Company include the results of acquired businesses from the acquisition date forward. The Company has provided this schedule to
reconcile reported net sales for the three months ended June 30, 2017 and 2016 to pro forma net sales as if the acquisitions took place as of January 1, 2016 for
purposes of this schedule.
(1) Adjusted for net sales of acquired businesses: There were no acquistions during the three months ended June 30, 2017. For the three months ended June 30,
2016, the adjustments for net sales of acquired businesses reflect the net sales of HudsonYards (acquired March 1, 2017) and Continuum (acquired December 2,
2016).
(2) Adjusted for net sales of acquired businesses, the impact of changes in FX rates and pass-through paper sales.

16 | LSC COMMUNICATIONS
ORGANIC GROWTH RATES – Q1 2017
($ millions)
Magazines,
Catalogs &
Logistics
BookOffice
ProductsOther Total LSC
Q1 2016 Net Sales as Reported $380 $243 $128 $129 $880
Adjustments (1)2 - - 12 14
Q1 2016 Net Sales Pro Forma $382 $243 $128 $141 $894
Q1 2017 Net Sales as Reported $349 $239 $111 $122 $821
Adjustments (1)1 - - - 1
Q1 2017 Net Sales Pro Forma $350 $239 $111 $122 $822
As Reported % Change (8.2%) (1.6%) (13.3%) (5.4%) (6.7%)
Pro Forma % Change (8.4%) (1.6%) (13.3%) (13.5%) (8.1%)
Non-GAAP Adjustments:
Impact of changes in foreign exchange rates ("fx") ---% ---% ---% (2.8%) (0.4%)
Impact of pass-through paper sales (1.3%) 0.8% ---% (1.4%) (0.6%)
Q1 2017 Organic % Change (2)(7.1%) (2.4%) (13.3%) (9.3%) (7.1%)
The reported results of the Company include the results of acquired businesses from the acquisition date forward. The Company has provided this schedule to
reconcile reported net sales for the three months ended March 31, 2017 and 2016 to pro forma net sales as if the acquisitions took place as of January 1, 2016 for
purposes of this schedule.
(1) Adjusted for net sales of acquired businesses: For the three months ended March 31, 2017, the adjustments for net sales of acquired businesses reflect the
net sales of HudsonYards (acquired March 1, 2017). For the three months ended March 31, 2016, the adjustments for net sales of acquired businesses reflect
the net sales of HudsonYards (acquired March 1, 2017) and Continuum (acquired December 2, 2016).
(2) Adjusted for net sales of acquired businesses, the impact of changes in FX rates and pass-through paper sales.

[email protected] | 773-272-9275 | 191 N Wacker (Suite 1400), Chicago, Illinois 60606
Related Documents