Lowering the Cost of Capital A Discussion of SRF Pricing Results and Ideas for Improving Pricing Performance

Welcome message from author
This document is posted to help you gain knowledge. Please leave a comment to let me know what you think about it! Share it to your friends and learn new things together.
Transcript
Lowering the Cost of Capital A Discussion of SRF Pricing Results
and Ideas for Improving Pricing Performance
© 2015 Public Financial Management
A Discussion of SRF Pricing Results

General Market Conditions
3 © 2015 Public Financial Management
10yr Spot Rates & Volatility
MMD Rates over Time
5
15
25
35
45
1.50%
1.75%
2.00%
2.25%
2.50%
2.75%
Date
Consensus Median Yields
10-Year MMD AAA GO Yields
10-Year Treasury
Volatility Index (VIX)
0.0%
1.0%
2.0%
3.0%
4.0%
5.0%
6.0%
1 2 3 4 5 7 10 15 20 25 30
YIEL
D
MATURITY
MMD Range (over past 10 years)
Current MMD
Average MMD (over past 10 Years)
Rates remain near historical lows
Volatility remains heightened
Continued global economic
and geopolitical risks foster
investor uncertainty and
trepidation
2015 has seen big weekly, daily
and intraday rate movements
Successful bond sales are
able to anticipate
movements
While 2015 was a roller coaster
ride of volatility, it has been a
sideways market

SRF Pricing Results since 2013 for the most active States
4 © 2015 Public Financial Management
0 bps
5 bps
10 bps
15 bps
20 bps
25 bps
30 bps
35 bps
40 bps
45 bps
50 bps
SP
RE
AD
TO
IN
TE
RP
OLA
TE
D M
MD
SALE DATE
2013-2015 SRF Results: 10-Year Maturity Spread to Interpolate d MMD
Colorado (6)
Indiana (5)
Massachusetts (3)
New York (7)
Ohio (4)
Oklahoma (3)
Rhode Island (6)
* Spreads shown assume 5% coupon spreads to interpolated MMD
SRF credit spreads
can vary significantly
over time due to
market dynamics
Issuers can not rely
on historical pricing
results as a gauge of
where their bonds
should price in the
current market
environment

SRF Pricing Results & Market Volatility: NYSEFC Case Study
5 © 2015 Public Financial Management
10 %
11 %
12 %
13 %
14 %
15 %
16 %
17 %
18 %
19 %
20 %
0 bps
5 bps
10 bps
15 bps
20 bps
25 bps
30 bps
35 bps
40 bps
45 bps
50 bps
SPRE
AD
TO
MM
D
SALE DATE
New York State Environmental Facil ities Coroporation 2013-2015: Historical 10-Year Maturity Spread Analysis
10-Year Maturity NYSEFC Spread
Volatility Index (VIX)
* Spreads shown assume 5% coupon spreads to interpolated MMD
10 %
11 %
12 %
13 %
14 %
15 %
16 %
17 %
18 %
19 %
20 %
0 bps
5 bps
10 bps
15 bps
20 bps
25 bps
30 bps
35 bps
40 bps
45 bps
50 bps
SPRE
AD
TO
MM
D
SALE DATE
New York State Environmental Facil ities Coroporation 2013-2015: Historical 20-Year Maturity Spread Analysis
20-Year Maturity NYSEFC Spread
Volatility Index (VIX)
While SRF credit spreads (and
all municipal market spreads)
can vary significantly over time,
much of this variation can be
explained
Looking at NYSEFC issuance
over the past 3 years, credit
spreads are highly correlated to
market volatility (VIX Index)
SRF Pricing Results for 2015 by State
6 © 2015 Public Financial Management
0 bps
5 bps
10 bps
15 bps
20 bps
25 bps
30 bps
SP
RE
AD
TO
IN
TE
RP
OLA
TE
D M
MD
SALE DATE
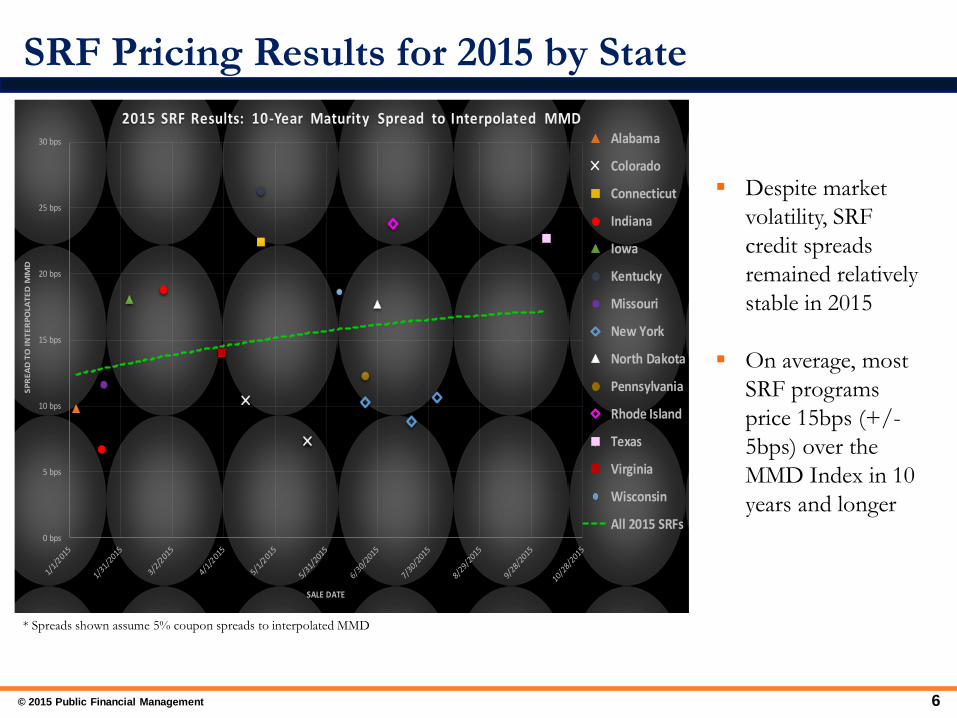
2015 SRF Results: 10-Year Maturity Spread to Interpolated MMDAlabama
Colorado
Connecticut
Indiana
Iowa
Kentucky
Missouri
New York
North Dakota
Pennsylvania
Rhode Island
Texas
Virginia
Wisconsin
All 2015 SRFs
* Spreads shown assume 5% coupon spreads to interpolated MMD
Despite market
volatility, SRF
credit spreads
remained relatively
stable in 2015
On average, most
SRF programs
price 15bps (+/-
5bps) over the
MMD Index in 10
years and longer

SRF Pricing Results for 2015 by Method of Sale
7 © 2015 Public Financial Management
0 bps
5 bps
10 bps
15 bps
20 bps
25 bps
30 bps
SPRE
AD T
O IN
TERP
OLA
TED
MM
D
SALE DATE
2015 SRF Results: 10-Year Maturity Spread to Interpolated MMD
Negotiated (9)
Competitive (6)
* Spreads shown assume 5% coupon spreads to interpolated MMD
0 bps
5 bps
10 bps
15 bps
20 bps
25 bps
30 bps
SPRE
AD T
O IN
TERP
OLA
TED
MM
D
SALE DATE
2015 SRF Results: 20-Year Maturity Spread to Interpolated MMD
Negotiated (8)
Competitive (3)
SRF Issuers were well
balanced between competitive
and negotiated methods of
sale
In the 10 year maturity, data
would suggest competitive
sales priced ≈3-5bps better
In the 20 year maturity, data
isn’t conclusive on method of
sale
Results may be skewed, since
all outliers were negotiated

SRF Pricing Results by Green Designation
8 © 2015 Public Financial Management
0 bps
5 bps
10 bps
15 bps
20 bps
25 bps
30 bps
35 bps
40 bps
45 bps
SP
RE
AD
TO
IN
TE
RP
OLA
TE
D M
MD
SALE DATE
Green Bond Analysis2014-2015: 10-Year Maturity Spread to Interpolated MMD
Green Designated Bonds (8)
Non-Designated Bonds (20)
* Spreads shown assume 5% coupon spreads to interpolated MMD
Green bonds are
relatively nascent
No green bond
certification exists
Currently, there are
no Environmentally
Friendly or Socially
Responsible
Municipals funds
To date, there has
been no meaningful
price impact for the
green designation

© Year Here Name of Company
Ohio Water Development Authority Bond Pricing Policies and Procedures

Underwriter Request for Qualifications (RFQ)
• Send RFQ to firms that have expressed interest in working with OWDA (typically 35 to 40 firms)
• As part of the RFQ, OWDA will ask firms to : – Provide case studies of recent and relevant SRF or pooling financing transactions – Provide ideas regarding two to three issues related to OWDA
• Interview a short-list of those firms for the Senior Manager role • Results of RFQ process
− Three to Four firms are selected to be in the Senior Manager rotation Firms with SRF Experience
Relevance and Quality of ideas presented MBE/WBE Preference
Ohio Presence − Two to Three firms are selected to be on the Co-Senior Manager rotation
− All other qualified firms are included on the Co-Manager rotation
• The life-cycle of the RFQ is typically three to four years • OWDA reserves the right to add or subtract firms from the various rotations
between RFQ cycles
Underwriter Selection Process
10 © 2015 Public Financial Management

Underwriter Selection for a transaction
• Select firms from the qualified list
− Senior Manager
− Co-Senior Manager
− Co-Manager
• Selection considerations
− Experience / Expertise with program
− Size of the transaction
− Type of transaction, i.e. fixed or variable rate
− Bond distribution/Sales capacity
− Rotation
− Other items
Ohio Firms
MBE/WBE
− Firm who brings an idea to OWDA are selected to be the Senior Manager
Underwriter Selection Process
11 © 2015 Public Financial Management

Pre-pricing
• Work with underwriters and financial advisor to establish pricing date
• Investor presentations / meetings
• Pre-Pricing level feed-back from
− Financial Advisor
− Underwriters
• Pre-marketing or whisper talk based upon spreads to MMD or UST
Day of Pricing
• Set pricing levels based upon market feedback and advice
• OWDA does not have specific goal or target for spread
• Set spread based on what is happening in current market in addition to
historical data and secondary market trade data
Pricing Practices
12 © 2015 Public Financial Management

Typical Allotment Policies
• Group Net Policy
− The allocation of all Underwriting Fees – Management Fee and Takedown—for
the Underwriting team is determined before bonds are sold
− Allocation of compensation for bonds sold to retail (less price sensitive) and
institutional (more price sensitive) investors is the same
• Net Designated Policy
− Traditional retail orders allotted to firm placing the order
− Non-retail investor who is allotted bonds determines the compensation to the
Underwriting
team based on parameters the issuer sets:
Specified Minimum Number of Firms to be designated
Maximum Designated Credit
Minimum Designated Credit (Optional)
Order Allotment Policy
13 © 2015 Public Financial Management

OWDA Allotment Policy
• Was Group Net
− Control compensation
• Now Net Designated
− Reward firms who sell bonds
• Priority Policy
− No more than 50% to 60% of order to one firm
− At least 3 firms designated
− Minimum designation of 10%
− No priority to institutional retail
− Definition of retail limited to “Mom and Pop” retail
Order Allotment Policy
14 © 2015 Public Financial Management
© Year Here Name of Company
Massachusetts Clean Water Trust Marketing to Investors

Massachusetts Clean Water Trust Series 18 Green Bonds
• The Trust sold $228 million of Green Bonds in a negotiated sale with JP Morgan
as the senior manager
• Why issue Green Bonds?
–Ability to tell a story about the bonds •Explain the essentiality of the projects we fund
– Market towards retail • Get the bonds in the hands of Massachusetts residents
–Broaden investor base
–Use this opportunity to rebrand •Recently changed our name and used this opportunity to get our name out
•Marketing Plan
–Preliminary Official Statement
–Investor Outreach
–Advertising Campaign
Green Bond Marketing
16 © Year Here Name of Company

The Trust used the POS as the first marketing item
• Followed the Green Bond Principles in the POS
–Use of Proceeds
–We highlighted four projects that exemplified the work we do
–Included an appendix with each loan being financed and the percent completed
–Project Evaluation and Selection Process
–Explained the IUP process and engineering review that goes into each project
–Proceeds Management
–Explained that the bond proceeds would be put in monitored segregated
accounts and in accordance with our investment policy
–Post-Issuance Reporting
–We report on the use of proceeds once a year in the EPA Annual Report
• Released the POS two weeks prior to pricing
Preliminary Official Statement (POS)
17 © Year Here Name of Company

Held an investor breakfast, retail call with syndicate and a conference
call with a retail broker firm
• Investor Breakfast with 16 investors
– More questions regarding the projects than the structure
– Six of the 16 placed orders
• Retail call with syndicate
– Allowed us to highlight the green component and point them to the pertinent
pages in the POS
• Lunch meeting with Fidelity
– Had a meeting with the Boston sales team and surrounding offices on the phone
to get focus on our upcoming deal
– Walked their sales team through the POS with a focus on the communities that
were receiving financing
Investor Outreach
18 © Year Here Name of Company

Used radio ads, online ads and an email blast to direct traffic to a website
specifically created for the sale
• Radio ads played on the morning and evening drive time starting a week prior
to retail pricing on local news radio
• Online ads were placed on CBSBoston.com, Boston.com, Bostonherald.com,
the Wall Street Journal Digital network and the Financial Times
– All digital channels were geographically targeted towards Massachusetts retail
investors
– Received 293 hits
• The email blast was sent the morning before the retail order period to 137,000
targeted recipients
– Received 2,883 hits
Advertising Campaign
19 © Year Here Name of Company

Was it worth selling Green Bonds?
• Selling Green Bonds was not more difficult than a normal bond sale
– What we do is tailored towards selling Green Bonds and allows for SRF’s to tell the
essentiality of the projects we finance
– We plan on selling our future bonds as Green Bonds
• Who purchased the sale?
– $29 million sold to priority retail sales
– $165 million sold to institutional investors
– $32 million sold to members of the syndicate
• Did Green Bond investors participate?
– $3.9 million of bonds were sold to retail green investors
– $250,000 of bonds were sold to institutional green investors
– The Trust received orders from nine new green investors
– One investor was investing in green bonds for the first time
– Four of the investors were new to JP Morgan in the Green Bond market
Results
20 © Year Here Name of Company
Questions??
Related Documents