Lower Yuba River Accord Monitoring and Evaluation Program Interim Report Jl 9 2012 Lower Yuba River Symposium July 9, 2012 1

Welcome message from author
This document is posted to help you gain knowledge. Please leave a comment to let me know what you think about it! Share it to your friends and learn new things together.
Transcript

Lower Yuba River AccordMonitoring and Evaluation Program Interim Report
J l 9 2012
Lower Yuba River Symposium
July 9, 2012
1
Express Requirements of the Fisheries Agreement (2005)Agreement (2005)
Monitoring and evaluating the effectiveness of the implementation of the Lower Yuba River Accordimplementation of the Lower Yuba River Accord
Evaluating the condition of fish resources in the Lower Yuba River
Evaluating the viability of Lower Yuba River fall-run Chinook salmon and any Sub-populations of the Central Valley steelhead and spring run Chinook salmonValley steelhead and spring-run Chinook salmon Evolutionarily Significant Units (ESUs) that may exist in the Lower Yuba River

Yuba Accord Implementation Monitoring and Evaluationg
2001 - 2004 – Technical Team developed Yuba Accord flow schedules, including water temperature considerations for Chinook salmon and steelhead.
2006 2007 Yuba Accord implemented on a “pilot program” basis including water2006 – 2007 – Yuba Accord implemented on a pilot program basis, including water temperature and fisheries monitoring.
2008 – SWRCB issued water right orders for the long-term implementation of the Yuba AccordAccord.
• Establishment of the Yuba Accord RMT• Yuba Accord M&E Program implemented
2008 through 2011 RMT published annual reports describing individual year results2008 through 2011 – RMT published annual reports describing individual year results.
2010 – RMT evaluated the Yuba Accord Water Temperature regime since 2006 and published the results.
2012 – RMT began evaluating multi-year trends and preparation of the MONITORING AND EVALUATION PROGRAM INTERIM REPORT.
3M&E Interim Report
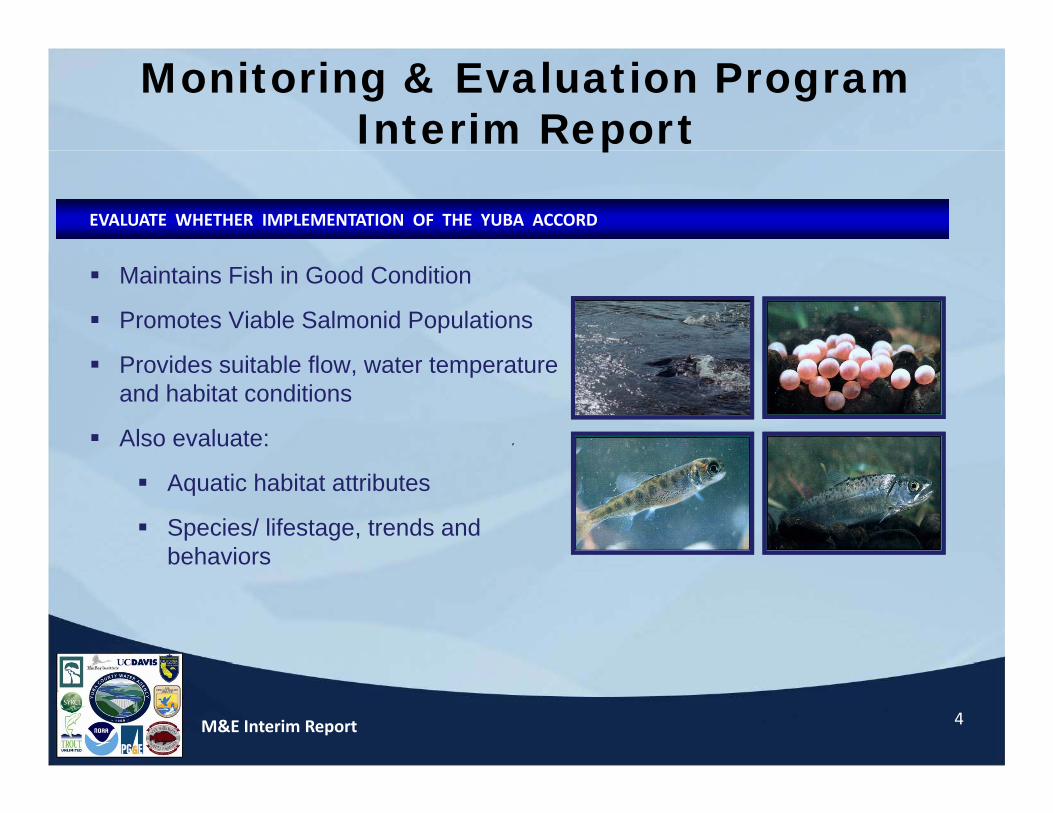
Monitoring & Evaluation Program Interim Reportp
EVALUATE WHETHER IMPLEMENTATION OF THE YUBA ACCORD
Maintains Fish in Good Condition
Promotes Viable Salmonid Populations
f Provides suitable flow, water temperature and habitat conditions
Also evaluate:
Aquatic habitat attributes
Species/ lifestage, trends and behaviorsbehaviors
4M&E Interim Report
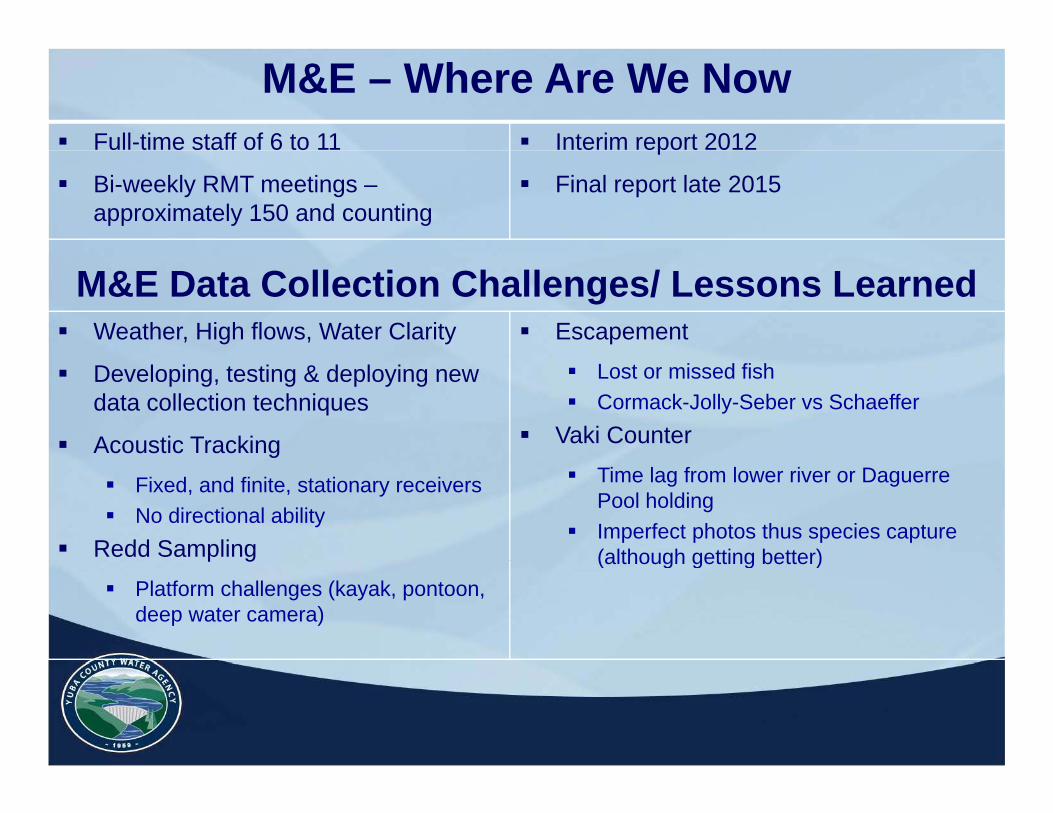
M&E – Where Are We Now Full-time staff of 6 to 11 Interim report 2012
Bi-weekly RMT meetings –approximately 150 and counting
p
Final report late 2015
M&E Data Collection Challenges/ Lessons Learned Weather, High flows, Water Clarity Escapement
Developing, testing & deploying new data collection techniques
Acoustic Tracking
Lost or missed fish Cormack-Jolly-Seber vs Schaeffer
Vaki Counterg Fixed, and finite, stationary receivers No directional ability
Redd Sampling
Time lag from lower river or Daguerre Pool holding
Imperfect photos thus species capture (although getting better)p g
Platform challenges (kayak, pontoon, deep water camera)
(although getting better)

M&E Interim Conclusions
The lower Yuba has highly functional spatial structure Diverse & Persistent Recurring functional flows Natural, complex river morphology
I l t ti f th A d id it bl fl Implementation of the Accord provides suitable flows and temperatures for all life stages for anadromous salmonids
The Lower Yuba has good habitat conditions Abundance of available, suitable habitats
The lower Yuba is ‘attractive’ (from standpoint of habitat) relative to other rivers

Functional Spatial Structure2D Modeling
G h l i U it M h bit t S b t t Geomorphologic Unit, Mesohabitat, Substrate, and Cover Mapping
Photo courtesy of Dr Greg Pasternack UCDPhoto courtesy of Dr. Greg Pasternack, UCD
7M&E Interim Report

Functional Spatial Structure2D Modeling
G h l i U it M h bit t S b t t Geomorphologic Unit, Mesohabitat, Substrate, and Cover Mapping
8M&E Interim Report

The River Provides an Array of AbundantFunctional Spatial Structure
The River Provides an Array of Abundant Habitats for Different Salmonid Life StagesLife Stage Holding Spawning RearingLife Stage Holding Spawning Rearing
MU Pool Riffle, Run, Riffle Transition
Slow Glide, Slackwater
Reach Percent Areas of Baseflow ChannelEnglebright 52 9 32
Timbuctoo 9 37 32
Parks Bar 5 48 27
Dry Creek 7 36 34
DPD 8 48 22
Hallwood 20 38 25Hallwood 20 38 25
Marysville 41 19 28
Total LYR 16 37 28

Spawning Site Selection Predictive Model Bioverification
Chi k S lChinook Salmon
830 cfs
= redd
830 cfsHigh
Medium
Low
Very PoorVery Poor
Non-habitat
10M&E Interim Report

2006 - 2007–Yuba Accord implemented on a “pilot program” basis, including
Water Temperature Considerationsp p p g , g
water temperature monitoring.
2008 – SWRCB issued water right orders for the long-term implementation of the Yuba Accordthe Yuba Accord.
• Establishment of the Yuba Accord RMT
• Yuba Accord M&E Program implemented
• Continued water temperature monitoring
2010 – RMT reviewed and updated
lifestage periodicitiesEvaluated the Appropriateness of
the Yuba Accord Water lifestage periodicities
water temperature suitability index values
water temperature occurrences
the Yuba Accord Water Temperature Regime since 2006
2011 - Present – Continued water temperature monitoring
11M&E Interim Report

Yuba Accord M&E Program
“Given the entire suite of considerations in this Technical Memorandum, the RMTl d h i l i f h Y b A d id i bl h lconcludes that implementation of the Yuba Accord provides a suitable thermal
regime for target species in the lower Yuba River” (Water Temperature ObjectivesMemo 2010).
12M&E Interim Report

Spring-Run Chinook SalmonModeled Water Temperature Exceedances
Modeled Water Temperature Exceedances for Spring-Run Chinook Salmon in the lower Yuba River atSmartsville (SMRT), Daguerre Point Dam (DPD), and Marysville (MRY) (Modified from Water TemperatureObjectives Memo 2010).Lifestage Gage WTI Jan Feb Mar Apr May Jun Jul Aug Sep Oct Nov Dec
Adult Immigration &Holding
SMRT 64°F 0% 0% 0% 0% 0%
DPD 64°F 0% 0% 0% 2% 2%
MRY 64°F 0% 0% 8% 11% 4%
SpawningSMRT 56°F 7% 1.4% 0%
Embryo Incubation SMRT 56°F 0% 0% 7% 1.4% 0% 0%SMRT 56 F 0% 0% 7% 1.4% 0% 0%
Juvenile Rearing & Downstream Movement
DPD 65°F 0% 0% 0% 0% 0% 0% 2% 1.4% 1.4% 0% 0% 0%
MRY 65°F 0% 0% 0% 0% 0% 6% 4% 3% 2% 0% 0% 0%
Yearling+ Smolt Emigration
DPD 63°F 0% 0% 0% 0% 0% 0% 0%
MRY 63°F 0% 0% 0% 0% 0% 0% 0%
13M&E Interim Report

Spring-Run Chinook SalmonWater Temperature Monitoring
14M&E Interim Report
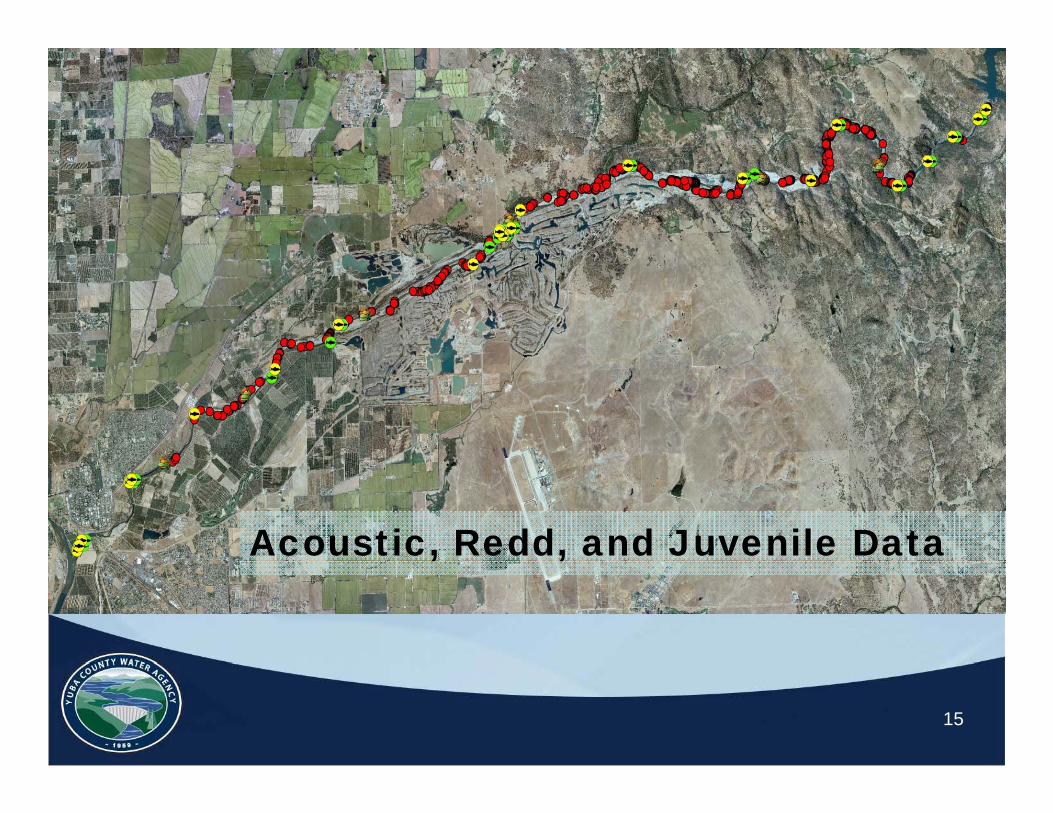
Acoustic, Redd, and Juvenile Data, ,
15

Adult Immigration and HoldingSpring-Run Chinook Salmonp g
DIVERSE PATTERN OF MOVEMENT AND HOLDING
• Most but not all fish migrate upstream ofMost, but not all, fish migrate upstream of Daguerre Point Dam
• Some fish migrate downstream, including into the Feather Riverinto the Feather River
• Daguerre Point Dam to the SR20 Bridge largely used as a migratory corridor
• Protracted temporal migrations to areas upstream of the SR20 Bridge
• Prolonged occupancy in pools throughout the river
• Extended holding in the Daguerre Point Dam plunge pool and the Narrows pool
Nelson and Bloom, CDFG, 2011
16M&E Interim Report

OutmigrationRotary Screw TrappingRotary Screw Trapping
SAMPLING
Seasonal (fall to summer) 1999‐2006
Year round 2007/08 2008/09Year‐round 2007/08 – 2008/09
• Capture Efficiency Tests
GENERAL RESULTSGENERAL RESULTS
Most Chinook emigrate as post‐emergent fry or YOY
Some Chinook 70 140mm captured fromSome Chinook 70‐140mm captured from October‐March
Steelhead exhibit variable emigration – YOY from spring through summerfrom spring through summer
Steelhead YOY movement associated with ramping rates
17M&E Interim Report
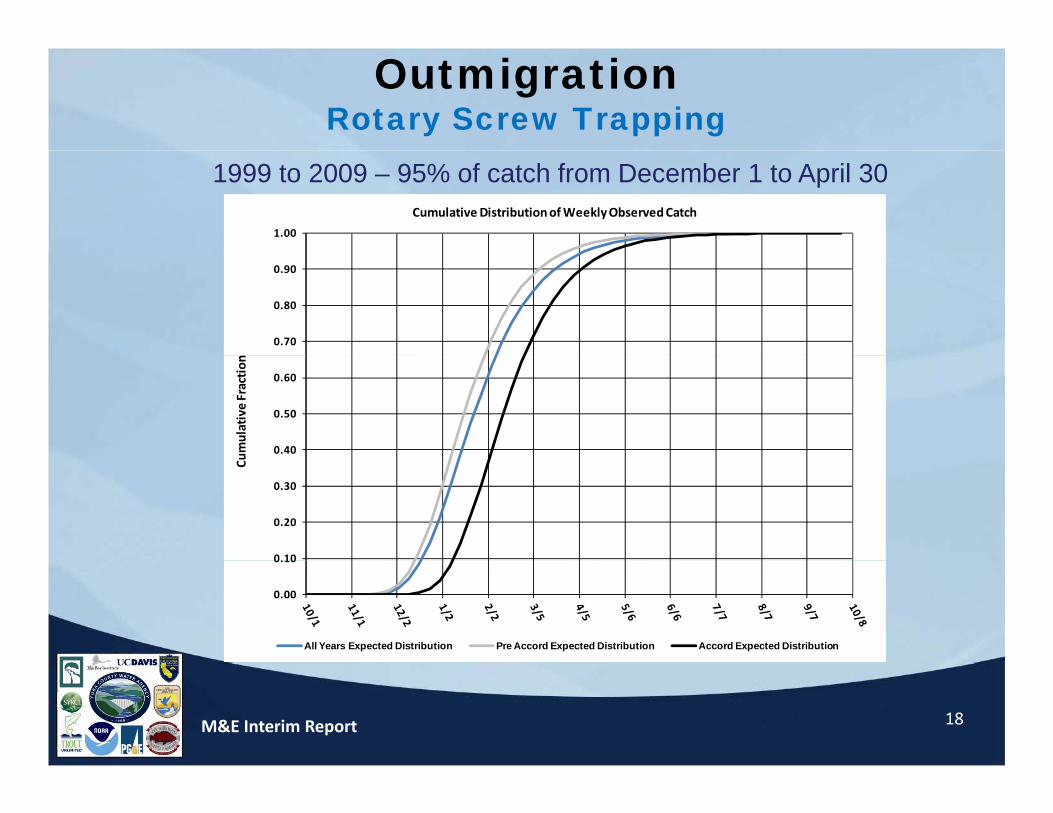
OutmigrationRotary Screw Trapping
1999 to 2009 – 95% of catch from December 1 to April 30
1.00
Cumulative Distribution of Weekly Observed Catch
0.70
0.80
0.90
0.40
0.50
0.60
umulative Fraction
0.10
0.20
0.30
Cu
0.00
0.10
All Years Expected Distribution Pre Accord Expected Distribution Accord Expected Distribution
18M&E Interim Report

Fitted temporal distribution of Chinook salmon carcass observations on the lower Yuba River, CA from 1999-
20102010.
0 9
1.0
0.7
0.8
0.9tio
nY =1/(1+e(-2.81903-0.37967*X))1/0.00754
0.4
0.5
0.6
Cum
ulat
ive F
ract
Accord Cumulative Fraction
Accord Fitted Logistic Curve
Pre Accord Cumulative Fraction
Pre‐Accord Fitted Logistic Curve
0.1
0.2
0.3
C
Y =1/(1+e(1.9768-0.51834*X))1/0.38609
0.0
1-Se
p
8-Se
p
15-S
ep
22-S
ep
29-S
ep
6-O
ct
13-O
ct
20-O
ct
27-O
ct
3-N
ov
10-N
ov
17-N
ov
24-N
ov
1-D
ec
8-D
ec
15-D
ec
22-D
ec
29-D
ec
5-Ja
n
12-J
an
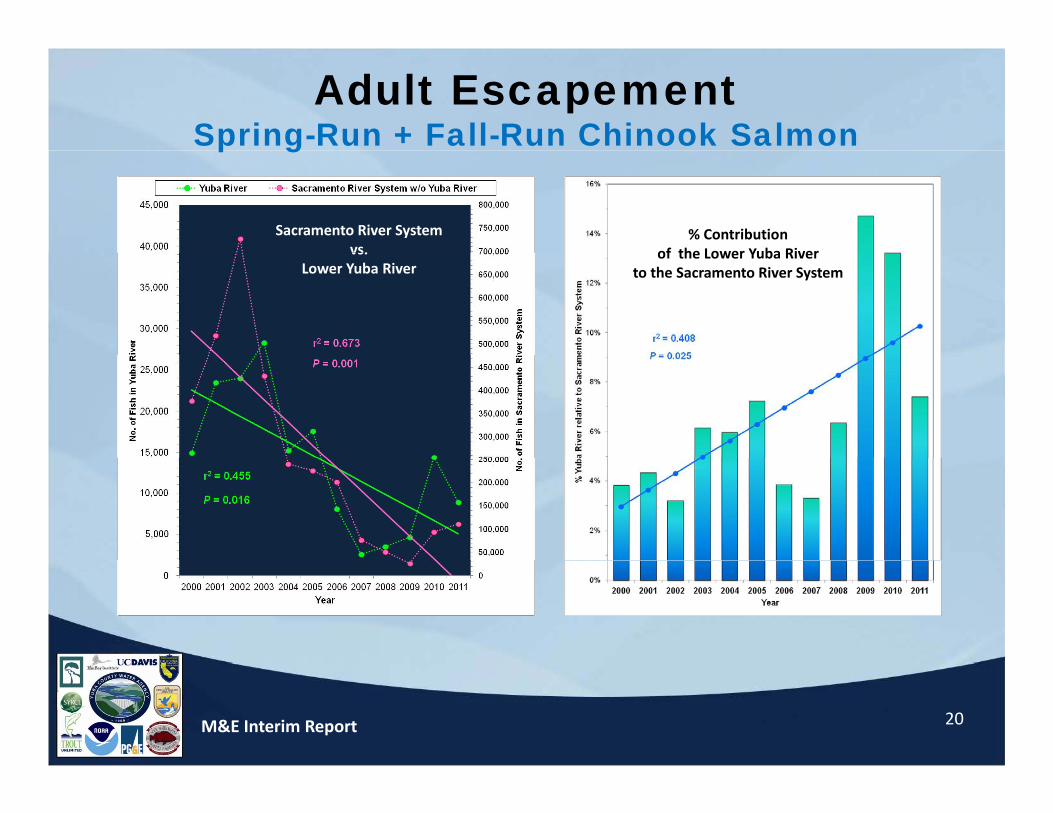
Adult EscapementSpring-Run + Fall-Run Chinook Salmonp g
Sacramento River Systemvs.
% Contributionof the Lower Yuba Rivervs.
Lower Yuba Riverof the Lower Yuba River
to the Sacramento River System
20M&E Interim Report

AbundanceSpring-Run Chinook Salmon
YearAll Spring-
Run Chinook Salmon
Ad Clipped Spring-Run
Chinook Salmon
Non-Ad clipped Spring-Run
Chinook Salmon
%
Ad-clipped
2004 531 60 471 11.3 %
2005 1 882 449 1 433 23 9 % All Spring-run2005 1,882 449 1,433 23.9 %
2006 374 36 338 9.6 %
2007 288 38 250 13.2 %
2008 370 13 357 3.5 %
2009 723 213 510 29 5 %
All Spring-run 2008-2010 TOTAL = 4,078 2008-2010 AVG = 1,359
2009 723 213 510 29.5 %
2010 2,985 1,816 1,169 60.8 %
2011 39 19 20 48.7 %
2011 1,159 323 836 27.9 %
2012* 689 447 242 65 %
Non - Ad Clipped Spring-run
* Only encompasses the period extending to June 25, 2012
2008-2010 TOTAL = 2,036 2008-2010 AVG = 679
21M&E Interim Report

M&E Interim Conclusions
The lower Yuba has highly functional spatial structure Implementation of the Accord provides suitable flows p p
and temperatures for all life stages for anadromous salmonidsThe Lower Yuba has good habitat conditions The Lower Yuba has good habitat conditions
The lower Yuba is ‘attractive’ (from standpoint of habitat) relative to other rivers
M&E Program – what next?M&E Program what next?
Common Challenges, Central Valley SalmonidsSalmonids
IntrogressionO i ll i t h t l l? Occurs in all rivers, to what level?
Hatchery InfluenceHatchery Influence Benefit or curse?
Ocean and Delta Impacts Non-river conditions play a huge role in cohort success
M&E Next Phase
Understand the interactions and interrelationships of the lower Yuba River in the regional contextlower Yuba River in the regional context
Understand the Yuba’s contribution to the systemUnderstand the Yuba s contribution to the system
Future directions for management of the Lower Yuba: Maximize the benefit of the lower Yuba, or Minimize the impact of the lower Yuba on the system?
Lower Yuba River AccordMonitoring and Evaluation Program Interim Report
J l 9 2012
Lower Yuba River Symposium
July 9, 2012
Related Documents


![Report.pptx [Repaired]](https://static.cupdf.com/doc/110x72/577cc6f51a28aba7119fa4da/reportpptx-repaired.jpg)
