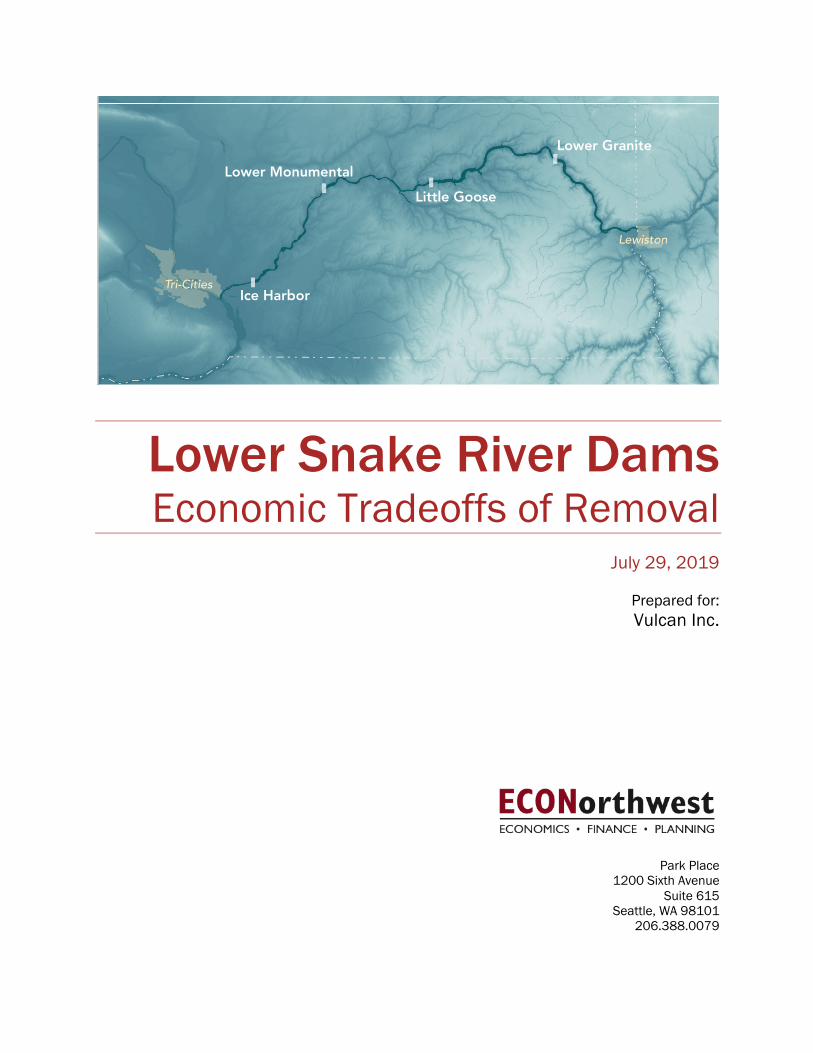
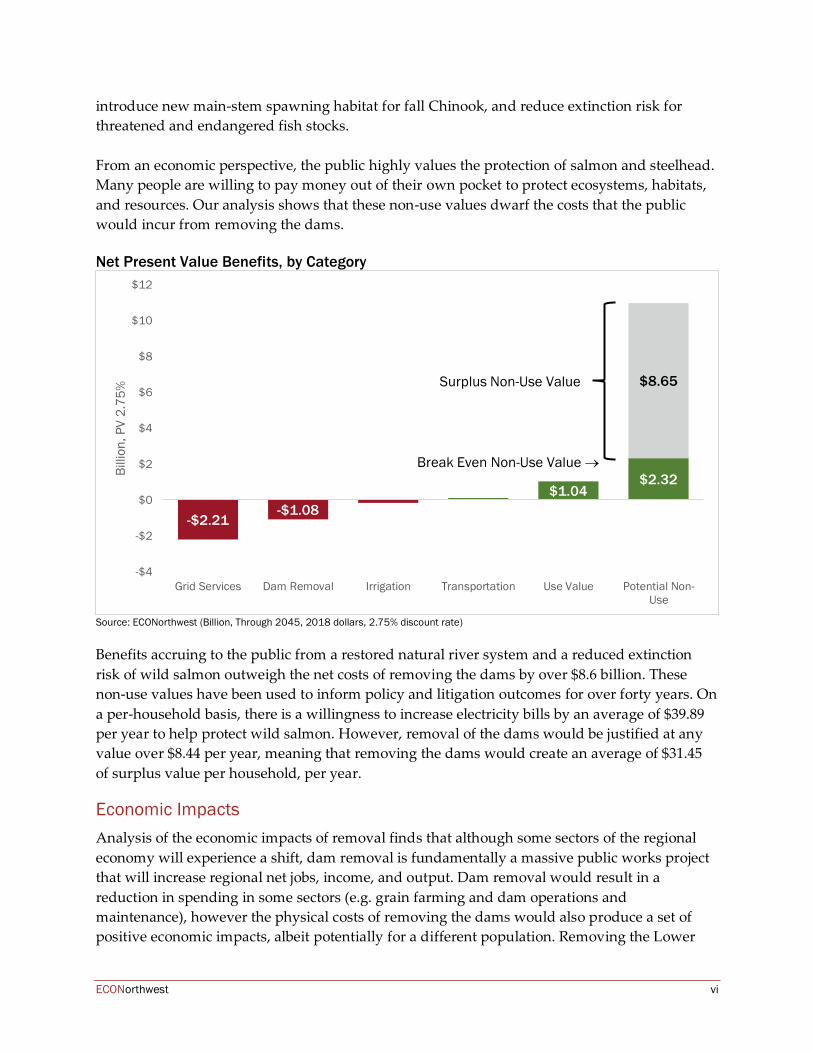
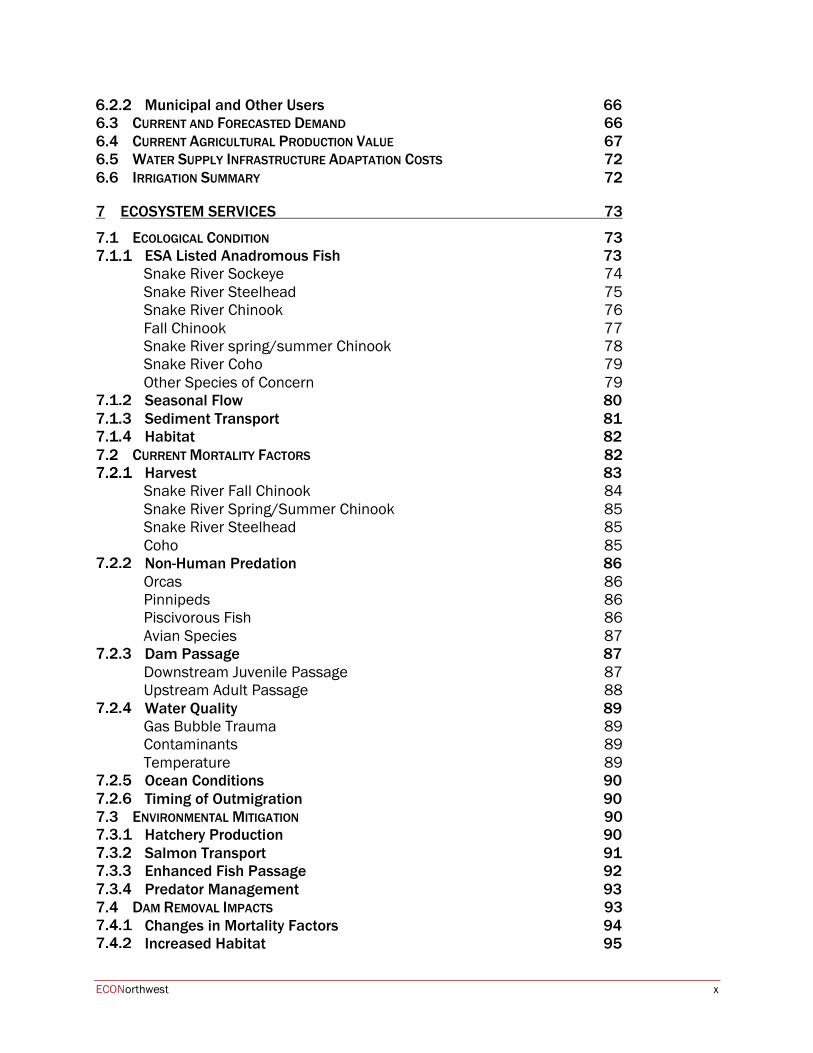
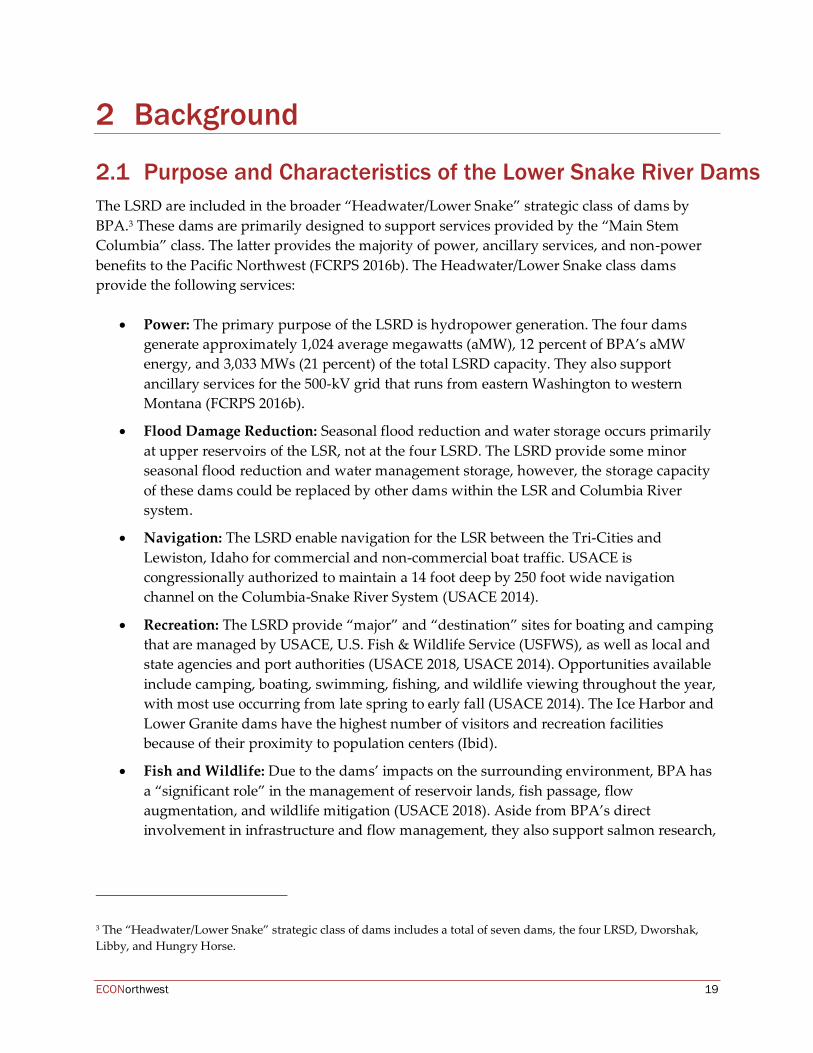
Lower Snake River Dams Economic Tradeoffs of Removal July 29, 2019 Prepared for: Vulcan Inc. Park Place 1200 Sixth Avenue Suite 615 Seattle, WA 98101 206.388.0079 Tri-Cities Lewiston Ice Harbor Lower Monumental Little Goose Lower Granite

Welcome message from author
This document is posted to help you gain knowledge. Please leave a comment to let me know what you think about it! Share it to your friends and learn new things together.
Transcript
Lower Snake River Dams Economic Tradeoffs of Removal
July 29, 2019
Prepared for: Vulcan Inc.
Park Place 1200 Sixth Avenue
Suite 615 Seattle, WA 98101
206.388.0079
Tri-Cities
Lewiston
Ice Harbor
Lower MonumentalLittle Goose
Lower Granite

ECONorthwest ii
This page intentionally blank
ECONorthwest iii
Acknowledgments For over 40 years ECONorthwest has helped its clients make sound decisions based on rigorous economic, planning, and financial analysis. For more information about ECONorthwest: www.econw.com. ECONorthwest prepared this report for Vulcan Inc. It received substantial assistance from Vulcan Inc. staff, Daniel Malarkey, Dennis Dauble, and Aspect Consulting. Dennis Dauble and Aspect Consulting completed their work independently and did not directly contribute to or review the main report, including sections referencing their work. They should not be considered responsible for any applications of their work by ECONorthwest. Other firms, agencies, and staff contributed to other research that this report relied on. That assistance notwithstanding, ECONorthwest is responsible for the content of this report. The staff at ECONorthwest prepared this report based on their general knowledge of economics, natural resources, agriculture, irrigation, transportation, power generation, and on information derived from government agencies, private statistical services, the reports of others, interviews of individuals, or other sources believed to be reliable. ECONorthwest has not independently verified the accuracy of all such information and makes no representation regarding its accuracy or completeness. Any statements nonfactual in nature constitute the authors’ current opinions, which may change as more information becomes available. ECONorthwest staff who contributed to this report include Adam Domanski, Mark Buckley, Matthew Kitchen, Marcy Shrader-Lauinger, Laura Marshall, Joel Ainsworth, Jared Rollier, and others. For more information about this report: Adam Domanski [email protected] Park Place 1200 Sixth Avenue Suite 615 Seattle, WA 98101 206.388.0079
ECONorthwest iv
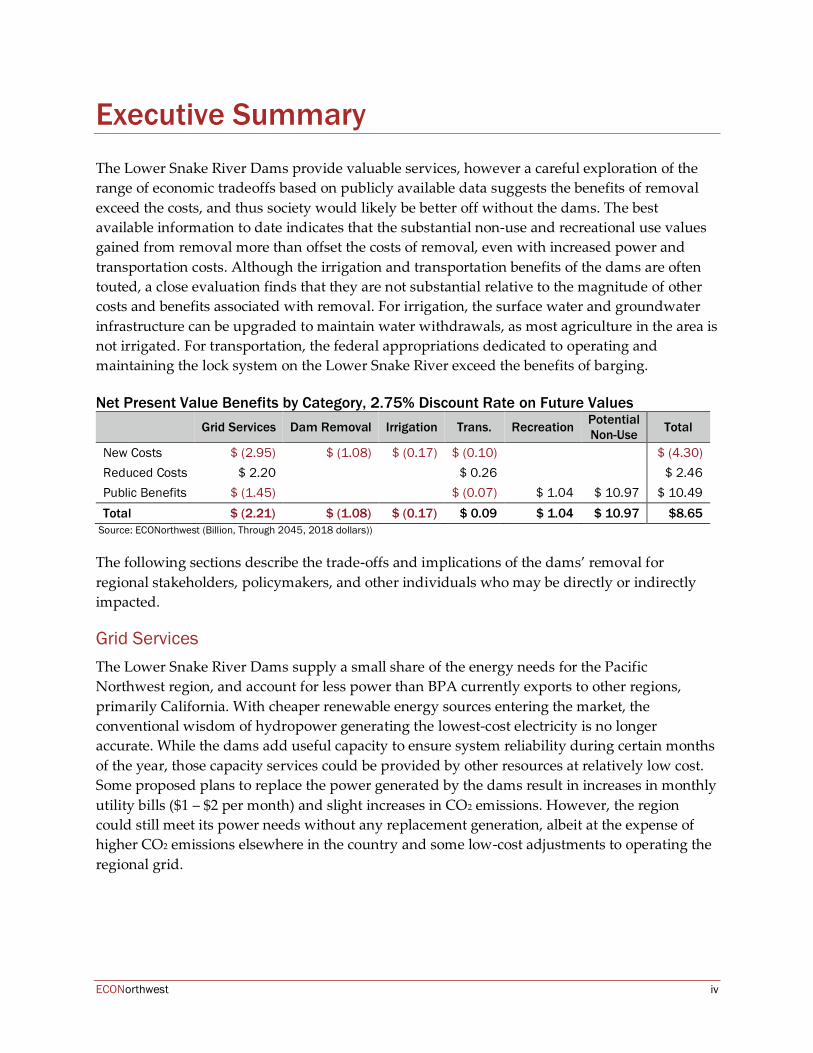
Executive Summary The Lower Snake River Dams provide valuable services, however a careful exploration of the range of economic tradeoffs based on publicly available data suggests the benefits of removal exceed the costs, and thus society would likely be better off without the dams. The best available information to date indicates that the substantial non-use and recreational use values gained from removal more than offset the costs of removal, even with increased power and transportation costs. Although the irrigation and transportation benefits of the dams are often touted, a close evaluation finds that they are not substantial relative to the magnitude of other costs and benefits associated with removal. For irrigation, the surface water and groundwater infrastructure can be upgraded to maintain water withdrawals, as most agriculture in the area is not irrigated. For transportation, the federal appropriations dedicated to operating and maintaining the lock system on the Lower Snake River exceed the benefits of barging. Net Present Value Benefits by Category, 2.75% Discount Rate on Future Values
Grid Services Dam Removal Irrigation Trans. Recreation Potential Non-Use Total
New Costs $ (2.95) $ (1.08) $ (0.17) $ (0.10) $ (4.30) Reduced Costs $ 2.20 $ 0.26 $ 2.46 Public Benefits $ (1.45) $ (0.07) $ 1.04 $ 10.97 $ 10.49 Total $ (2.21) $ (1.08) $ (0.17) $ 0.09 $ 1.04 $ 10.97 $8.65
Source: ECONorthwest (Billion, Through 2045, 2018 dollars))
The following sections describe the trade-offs and implications of the dams’ removal for regional stakeholders, policymakers, and other individuals who may be directly or indirectly impacted.
Grid Services The Lower Snake River Dams supply a small share of the energy needs for the Pacific Northwest region, and account for less power than BPA currently exports to other regions, primarily California. With cheaper renewable energy sources entering the market, the conventional wisdom of hydropower generating the lowest-cost electricity is no longer accurate. While the dams add useful capacity to ensure system reliability during certain months of the year, those capacity services could be provided by other resources at relatively low cost. Some proposed plans to replace the power generated by the dams result in increases in monthly utility bills ($1 – $2 per month) and slight increases in CO2 emissions. However, the region could still meet its power needs without any replacement generation, albeit at the expense of higher CO2 emissions elsewhere in the country and some low-cost adjustments to operating the regional grid.
ECONorthwest v
Transportation Approximately 2.2 million tons of agricultural products – mostly grain destined for export – move by barge through the four dams on the Lower Snake River each year. Although barge shipping is more cost-effective than truck or rail, significant federal appropriated funds are dedicated to maintaining the locks that allow barges to travel up and down the river. Even after accounting for the public costs of increased emissions, changes in accident costs, and the higher prices of shifting to truck and rail, the federal government still spends more money than the public gets back. The benefits produced by the lock system on the Lower Snake River do not justify its continued operation, even without removal of the Lower Snake River Dams.
Irrigation Only 13 percent of farmland within five miles of the Lower Snake River is irrigated. This land is mostly located at the downstream end near the confluence with the Columbia River where several other water storage and conveyance projects operate or are under development. The loss of irrigation to this area could result in substantial economic losses to some growers who irrigate. The costs of upgrading groundwater wells and surface diversions should be less than $200 million in total, based on an engineering cost analysis. The high rate of non-irrigated farming in the area suggests such practices are a reasonable choice for farmers. Furthermore, the growing demand for irrigated agriculture activity and storage capacity downstream along the Columbia River suggests any reduction in use of water along the Lower Snake River would likely be used by downstream water users. Depending on funding sources for upgrades to infrastructure and decisions to irrigate or not, impacts to the agricultural industry would most likely be distributional in nature.
Ecosystem Services Numerous recreational access points throughout the Lower Snake River provide opportunities for reservoir-based fishing, hunting, and boating. Some of these activities will no longer occur with removal of the dams, however, restoration of a natural river system will lead to an increase in higher value river recreation trips. These new environmental resources will benefit both the users that enjoy them, as well as the tourism based-businesses in Clarkston, Washington, and Lewiston, Idaho. The primary argument for removing the Lower Snake River Dams is to benefit endangered and threatened salmon and steelhead native to the river, along with the ecosystems that depend on them. Many factors have contributed to their decline, and there is ongoing scientific debate surrounding the actual population gains expected following dam removal without other interventions. Significant resources have been expended over the years to improve survival of juvenile and adult fish passing through the dams. Efforts include hatchery operations, trucking juvenile fish downstream of dams, improving habitat upstream of the dams, modifying flow through the turbines at specific times of the year, and culling predatory birds and sea lions. Despite these efforts, the wild populations of salmon continue to struggle. Removing the dams has the potential to improve fish passage, decrease the migration time for juvenile fish,
ECONorthwest vi
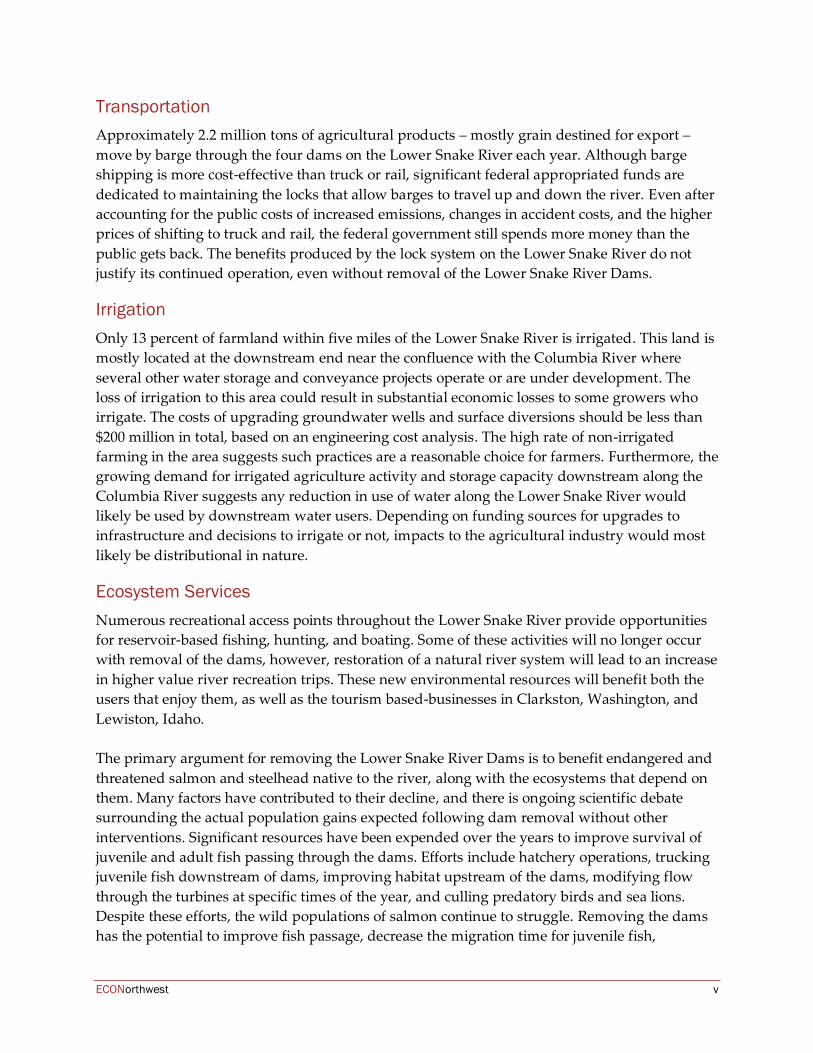
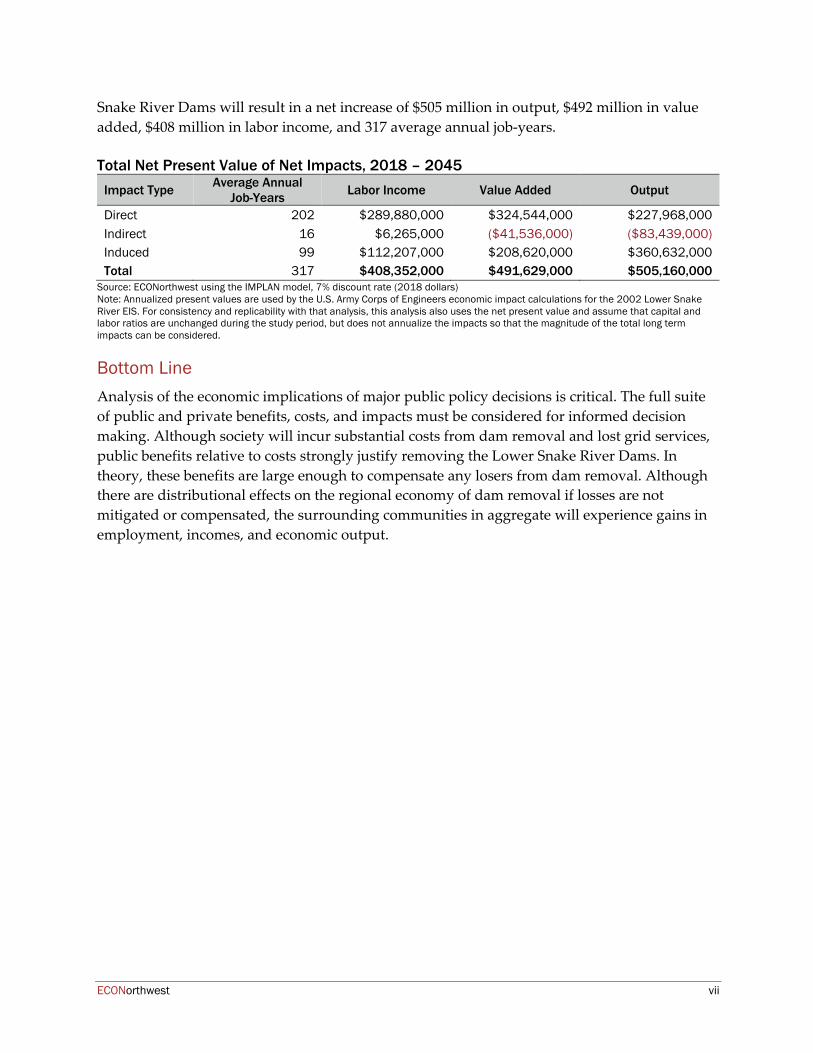
introduce new main-stem spawning habitat for fall Chinook, and reduce extinction risk for threatened and endangered fish stocks. From an economic perspective, the public highly values the protection of salmon and steelhead. Many people are willing to pay money out of their own pocket to protect ecosystems, habitats, and resources. Our analysis shows that these non-use values dwarf the costs that the public would incur from removing the dams. Net Present Value Benefits, by Category
Source: ECONorthwest (Billion, Through 2045, 2018 dollars, 2.75% discount rate)
Benefits accruing to the public from a restored natural river system and a reduced extinction risk of wild salmon outweigh the net costs of removing the dams by over $8.6 billion. These non-use values have been used to inform policy and litigation outcomes for over forty years. On a per-household basis, there is a willingness to increase electricity bills by an average of $39.89 per year to help protect wild salmon. However, removal of the dams would be justified at any value over $8.44 per year, meaning that removing the dams would create an average of $31.45 of surplus value per household, per year.
Economic Impacts Analysis of the economic impacts of removal finds that although some sectors of the regional economy will experience a shift, dam removal is fundamentally a massive public works project that will increase regional net jobs, income, and output. Dam removal would result in a reduction in spending in some sectors (e.g. grain farming and dam operations and maintenance), however the physical costs of removing the dams would also produce a set of positive economic impacts, albeit potentially for a different population. Removing the Lower
-$2.21-$1.08
$1.04$2.32
$8.65
-$4
-$2
$0
$2
$4
$6
$8
$10
$12
Grid Services Dam Removal Irrigation Transportation Use Value Potential Non-Use
Billi
on, P
V 2.
75%
Break Even Non-Use Value →
Surplus Non-Use Value
ECONorthwest vii
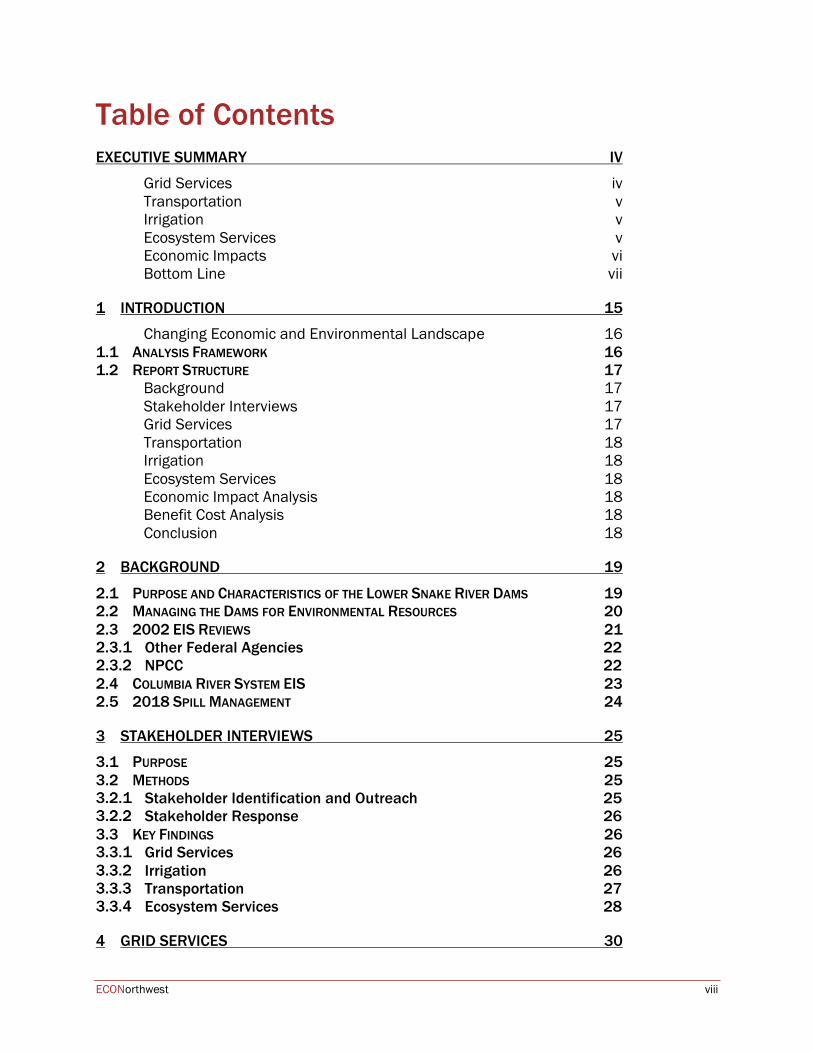
Snake River Dams will result in a net increase of $505 million in output, $492 million in value added, $408 million in labor income, and 317 average annual job-years. Total Net Present Value of Net Impacts, 2018 – 2045
Impact Type Average Annual Job-Years Labor Income Value Added Output
Direct 202 $289,880,000 $324,544,000 $227,968,000 Indirect 16 $6,265,000 ($41,536,000) ($83,439,000) Induced 99 $112,207,000 $208,620,000 $360,632,000 Total 317 $408,352,000 $491,629,000 $505,160,000
Source: ECONorthwest using the IMPLAN model, 7% discount rate (2018 dollars) Note: Annualized present values are used by the U.S. Army Corps of Engineers economic impact calculations for the 2002 Lower Snake River EIS. For consistency and replicability with that analysis, this analysis also uses the net present value and assume that capital and labor ratios are unchanged during the study period, but does not annualize the impacts so that the magnitude of the total long term impacts can be considered.
Bottom Line Analysis of the economic implications of major public policy decisions is critical. The full suite of public and private benefits, costs, and impacts must be considered for informed decision making. Although society will incur substantial costs from dam removal and lost grid services, public benefits relative to costs strongly justify removing the Lower Snake River Dams. In theory, these benefits are large enough to compensate any losers from dam removal. Although there are distributional effects on the regional economy of dam removal if losses are not mitigated or compensated, the surrounding communities in aggregate will experience gains in employment, incomes, and economic output.
ECONorthwest viii
Table of Contents EXECUTIVE SUMMARY IV
Grid Services iv Transportation v Irrigation v Ecosystem Services v Economic Impacts vi Bottom Line vii
1 INTRODUCTION 15 Changing Economic and Environmental Landscape 16
1.1 ANALYSIS FRAMEWORK 16 1.2 REPORT STRUCTURE 17
Background 17 Stakeholder Interviews 17 Grid Services 17 Transportation 18 Irrigation 18 Ecosystem Services 18 Economic Impact Analysis 18 Benefit Cost Analysis 18 Conclusion 18
2 BACKGROUND 19 2.1 PURPOSE AND CHARACTERISTICS OF THE LOWER SNAKE RIVER DAMS 19 2.2 MANAGING THE DAMS FOR ENVIRONMENTAL RESOURCES 20 2.3 2002 EIS REVIEWS 21
Other Federal Agencies 22 NPCC 22
2.4 COLUMBIA RIVER SYSTEM EIS 23 2.5 2018 SPILL MANAGEMENT 24
3 STAKEHOLDER INTERVIEWS 25 3.1 PURPOSE 25 3.2 METHODS 25
Stakeholder Identification and Outreach 25 Stakeholder Response 26
3.3 KEY FINDINGS 26 Grid Services 26 Irrigation 26 Transportation 27 Ecosystem Services 28
4 GRID SERVICES 30
ECONorthwest ix
4.1 ELECTRICITY GENERATION 30 Electricity Rates and Costs 31 Energy Demand Forecast 32 Northwest Energy Coalition Study 32
4.2 APPROACHES TO VALUING GRID SERVICES 33 Replacement Portfolios for LSRD Grid Services 34 Market Values for LSRD Grid Services 36
Energy 36 Reliability 37 Flexibility 37 Carbon Free Power 38
Costs of Keeping LSRD for Power Generation 39 Operations & Maintenance 39 Future Capital Costs 39 BPA overhead costs 40 Interest & Depreciation 40
4.3 GRID SERVICES SUMMARY 40
5 TRANSPORTATION 41 5.1 BACKGROUND 41
Barging Volumes 41 Projected Demand 44 Cost of Shipping 46 Inland Waterways Trust Fund 47 Lock Maintenance Closures 47 Alternatives to Barging 48
5.2 ESTIMATING A SHIFT TO TRUCK AND RAIL 49 Previous Estimates 49 Mode Choice Model 50
5.3 TRANSPORTATION COSTS OF DAM REMOVAL 52 Mitigation and Damage Costs from Reservoir Drawdown 53 Additional Rail and Roadway Infrastructure 54 Roadway Wear and Tear from Additional Heavy Vehicle Traffic 55 Changes in Shipping Costs 56 Changes in Emission Costs 57 Changes in Accident Costs 57 Transportation Operations and Maintenance Costs 58
5.4 TRANSPORTATION SUMMARY 59
6 IRRIGATION AND WATER SUPPLY 61 6.1 WATER SUPPLY CONTEXT 62
Washington State Basins 62 Forecasts and Potential Climate Change Impacts 64 Outside Influences 65
6.2 HISTORIC WATER USE 65 Agriculture 65
ECONorthwest x
Municipal and Other Users 66 6.3 CURRENT AND FORECASTED DEMAND 66 6.4 CURRENT AGRICULTURAL PRODUCTION VALUE 67 6.5 WATER SUPPLY INFRASTRUCTURE ADAPTATION COSTS 72 6.6 IRRIGATION SUMMARY 72
7 ECOSYSTEM SERVICES 73 7.1 ECOLOGICAL CONDITION 73
ESA Listed Anadromous Fish 73 Snake River Sockeye 74 Snake River Steelhead 75 Snake River Chinook 76 Fall Chinook 77 Snake River spring/summer Chinook 78 Snake River Coho 79 Other Species of Concern 79
Seasonal Flow 80 Sediment Transport 81 Habitat 82
7.2 CURRENT MORTALITY FACTORS 82 Harvest 83
Snake River Fall Chinook 84 Snake River Spring/Summer Chinook 85 Snake River Steelhead 85 Coho 85
Non-Human Predation 86 Orcas 86 Pinnipeds 86 Piscivorous Fish 86 Avian Species 87
Dam Passage 87 Downstream Juvenile Passage 87 Upstream Adult Passage 88
Water Quality 89 Gas Bubble Trauma 89 Contaminants 89 Temperature 89
Ocean Conditions 90 Timing of Outmigration 90
7.3 ENVIRONMENTAL MITIGATION 90 Hatchery Production 90 Salmon Transport 91 Enhanced Fish Passage 92 Predator Management 93
7.4 DAM REMOVAL IMPACTS 93 Changes in Mortality Factors 94 Increased Habitat 95
ECONorthwest xi
Alternatives to Dam Removal to Increase Anadromous Fish Populations 95 7.5 ECOSYSTEM SERVICE VALUES 96
Property Value Impacts 96 Recreational Use 97
Existing Uses 97 Potential Future Uses 97
Clarkston/Lewiston as an Outdoor Destination 100 Estimating Recreational Demand 103
Baseline Visitation 104 Visitation Growth 104 Trip Value and Change in Trips 104 Estimate of Welfare Gains 106
Non-Use/Existence Values 107 Cultural Values 112
8 SUMMARY OF ECONOMIC IMPACTS 114 8.1 OVERVIEW OF ECONOMIC IMPACT ANALYSIS 114 8.2 METHODOLOGY 115
Input-Output Modeling 116 Limitations of Input-Output Analysis 118
8.3 DATA INPUTS TO THE MODEL 119 Costs of Breaching LSRD 120 Study Area Overview 121
8.4 RESULTS 122 Transportation Impacts 122 Dam Removal Deconstruction Impacts 122 Irrigation Impacts 123 Grid Services Impacts 123 Household Spending Impacts 124 Visitor Spending Impacts 124 Total Net Impacts 125 Industry Specific Impacts 125
9 BENEFIT COST ANALYSIS 127 9.1 INCORPORATING FUTURE CHANGES 127 9.2 WELFARE EFFECTS OF REMOVAL OF THE LSRD 128
Grid Services 131 Transportation 131 Irrigation 132 Dam Removal 133 Ecosystem Services 133 Net Benefits 134
10 CONCLUSION 136 What is different between this analysis and the 2002 EIS? 137
ECONorthwest xii
11 APPENDICES 138 11.1 BIBLIOGRAPHY 138 11.2 STAKEHOLDER INTERVIEW QUESTIONS 167
Introduction: 167 Background Information 167 Interview Script 167 FAQ 169
11.3 STAKEHOLDER INTERVIEW REQUEST 170 11.4 IRRIGATION INFRASTRUCTURE REPLACEMENT COST 171
ECONorthwest xiii
List of Acronyms aMW – Average Megawatt BCA – Benefit-Cost Analysis BOR – U.S. Bureau of Reclamation
BPA – Bonneville Power Administration CWA – Clean Water Act CRITFC – Columbia River Inter-Tribal Fish Commission CRS - Congressional Research Service
DOI – Department of Interior
DREW – Drawdown Regional Economic Workgroup
EIA – Economic Impact Analysis
EIS – Environmental Impact Statement
EPA – U.S. Environmental Protection Agency
FCRPS – Federal Columbia River Power System
USFWS – U.S. Fish and Wildlife Service
GAO – General Accountability Office
GMA – Groundwater Management Area
IEAB – Independent Economic Analysis Board of the Northwest Power and Conservation Council
ISAB – Independent Scientific Advisory Board of the Northwest Power and Conservation Council
ISRP – Independent Scientific Review Panel of the Northwest Power and Conservation Council
IWTF – Inland Waterways Trust Fund
kCFS – Thousand cubic feet per second
LSRCP – Lower Snake River Compensation Plan
LSR – Lower Snake River LSRB – Lower Snake River Basin LSRD – Lower Snake River Dams NASEM – National Academy of Science, Engineering, Medicine NMFS – National Marine Fisheries Service
NPCC – Northwest Power and Conservation Planning Council NRDA – National Resources Damage Assessment PNWA – Pacific Northwest Waterways Association SAR – Smolt-to-Adult Return
SOS – Save Our Wild Salmon
TDG – Total Dissolved Gas
TIPU – Transportation, Information, and Public Utilities
TMDL – Total Maximum Daily Load USACE – U.S. Army Corps of Engineers USDOT – U.S. Department of Transportation
USGS – U.S. Geological Survey WA DOE – Washington Department of Ecology
ECONorthwest xiv
WDFW – Washington Department of Fish & Wildlife WRIA – Water Resource Inventory Area WTP – Willingness to Pay
ECONorthwest 15
1 Introduction The U.S. Army Corps of Engineers (USACE) constructed, operates, and maintains four dams on the Lower Snake River as part of the larger Columbia River System Operations (CRSO) collection of dam projects in the Columbia River Basin. The dams and associated USACE activities provide many services, including flood risk management, fish and wildlife enhancement, power generation, irrigation, navigation, and municipal and industrial water supply. The Bonneville Power Administration (BPA) transmits and markets the power generated by these Lower Snake River Dams (LSRD). The purpose of this study is to evaluate the costs, benefits, and economic consequences of potential LSRD removal. The LSRD have long been in the public eye, with numerous studies completed showing competing estimates of the impacts of these dams on local communities, power generation, the regional economy, and the environment. The LSRD support electricity production and grid-reliability, transportation of bulk goods via barge and ship, irrigation and water supply, and lake-based recreation. While serving as a source of economic activity for the region, they also cause negative environmental impacts on fish spawning and juvenile anadromous fish by limiting fish passage, altering water temperatures, increasing predation and disease risk, and restricting sediment transport. Numerous efforts have been implemented to mitigate the negative impacts and increase the populations of spawning salmon and steelhead. These efforts have resulted in varying levels of success over the years. In 1995, the federal agencies responsible for managing the CRSO analyzed the environmental effects of 13 alternative operating strategies as part of an Environmental Impact Statement (EIS), issued in 2002. The Final 2002 EIS considered four alternatives for the LSRD, one of which included dam breaching. For purposes of this report the terms “dam breaching” and “dam removal” are synonymous and refer to the definition of dam breaching provided by USACE in the 2002 EIS:
“Dam breaching would create a 140-mile stretch of river with near-natural flow by removing the earthen embankment section of each dam and eliminating the reservoirs at all four lower Snake River dams… All facilities for transporting fish would cease to operate, as would hydropower operation. The navigation locks would no longer be operational, and navigation for commercial and large recreation vessels would be curtailed.” (p.ES-9)
In part due to a federal court ruling in May of 2016, a new EIS is being prepared to evaluate, assess, and update long-term coordinated operation, maintenance, and configuration of the broader CRSO, including the LSRD. This new EIS will assess changes in environmental and operational conditions in the Columbia River Basin since the previous EIS was issued and include additional options for restoring endangered wild salmon and steelhead, including the potential breach and removal of the four LSRD.
ECONorthwest 16
Changing Economic and Environmental Landscape Although the LSRD have been heavily studied over the years, many changes have occurred to the economy and environment since previous efforts took place. The regional electrical grid has seen a shift in baseload power production through the shuttering of coal-fired power plants and the expansion of wind generation. This resulting shift to renewable resources has increased the demand for power that can adjust to meet peak demands. Meanwhile, a changing agricultural market has led to a change in transportation needs, while containerization and expanded domestic oil production has placed additional demand on regional rail infrastructure. Changes in the water supply system in the Pacific Northwest have required novel techniques to store, allocate, and distribute water rights. In addition, a shifting regional and national economy, changing outdoor recreation trends, and a better understanding of non-use values for wild salmon and restored ecosystems have changed the way economists and policymakers evaluate economic impacts and ecosystem services. Each of these changes motivates this new analysis of the costs and benefits of the LSRD.
1.1 Analysis Framework Evaluation of the benefits, costs, and economic consequences of LSRD removal is dependent on fully understanding the two potential states of the world: one with the dams and one without. This analysis aims to describe the trade-offs and implications of the dams’ removal for regional stakeholders, policymakers, and other individuals who may be directly or indirectly impacted by the removal of the dams. This study seeks to answer two complementary, but distinct, questions:
1. Do the economic benefits of a world without the LSRD exceed the cost of getting there?
2. How would the regional economy respond to removal of the LSRD, and how would the impacts be distributed across different population segments and industries?
The first question is best addressed with a benefit-cost analysis (BCA). This approach measures the beneficial and adverse effects associated with removal of the dams and can determine whether doing so yields net benefits at the national level. If the costs of removal are smaller than the benefits, then removing the dams would be the recommended policy action.
The second question in regard to the regional economy is best answered with an economic impact analysis (EIA). This approach measures regional changes in jobs, wages, and economic output. If the dams were to remain in place, the ongoing operation and maintenance (O&M) expenditures produce positive economic impacts to the region through direct spending and increased economic activity. Similarly, if the dams were removed, the physical costs of removing the dams would also produce a set of positive economic impacts, albeit potentially for a different population. This comparison informs the distribution of impacts but not necessarily the optimal policy outcome since any expenditure in the region is beneficial in an economic sense.
ECONorthwest 17
Both the BCA and EIA are necessary to fully understand the implications of dam removal. The BCA informs the optimal policy outcome and includes the social costs and benefits of changes in the ecological condition of the river system with dam removal. The EIA helps policymakers understand how changes in spending within the region will affect jobs, income, and economic activity in the area.
The Grid Services, Transportation, Irrigation, and Ecosystem Services sections of this report estimate the economic inputs that are used in the BCA and EIA calculations. At every stage of analysis, every attempt is made to use the best available information. In some cases, original analysis of new or existing data is applied. In other cases, the best available information can be reasonably drawn from the 2002 EIS. Unless otherwise noted, all values are updated to 2018 dollars using either the U.S. Bureau of Labor Statistics’ Consumer Price Index1 or the U.S. Bureau of Reclamation’s (BOR) Construction Cost Trends2, as appropriate. The dam removal scenario contained in this report presumes that removal would occur in 2025, with benefits and costs incurred accordingly. Values are discounted to present value using 2.75 percent and 7 percent discount rates, representing the BOR’s recommended interest rate for the formulation and evaluation of plans for water and related land resources and the Office of Management and Budget’s Circular A-94, respectively. Benefits and costs are measured through the year 2045. This framework of this analysis provides a general structure to evaluate the broad suite of benefits, costs, and economic impacts, and to allow policymakers and the public to make informed choices.
1.2 Report Structure In order to comprehensively inform the broad goal of this study, this report is organized into major topic areas, each with a distinct set of questions to be addressed.
Background • What is the history, purpose, and operating framework of the LSRD?
Stakeholder Interviews • What are the perspectives of those most directly affected by the removal of the LSRD?
Grid Services • What is the LSRD power generation capacity, including peak/off peak power generation
trends?
• What is the value of revenue supported by the LSRD, both total and as a share of BPA revenue?
1 https://www.bls.gov/cpi/ 2 https://www.usbr.gov/tsc/techreferences/mands/cct.html

ECONorthwest 18
• What is the cost of replacing the grid services provided by the LSRD, and what are the greenhouse gas implications of those replacements?
• What are the operations and maintenance costs of the LSRD?
Transportation • What is the baseline level of barge transportation on the LSR and what are the
implications of removing the LSRD for each of the alternative modes of transportation?
• What are the capital and operating costs of viable transportation alternatives if barge transportation were no longer feasible?
Irrigation • What are the implications of removing the LSRD on regional agricultural production?
• What are the potential infrastructure improvements necessary to maintain water rights?
Ecosystem Services • What are the capital and operating costs of salmon mitigation, including construction
upgrades, salmon transport, and fish hatcheries?
• What is the recreation value of a lake versus a natural river system?
• What is the potential scale of non-use values of a natural river system?
Economic Impact Analysis • What are the potential costs of removal of the LSRD?
• Given all of the estimated changes in regional spending from LSRD removal, how would the regional economy respond?
Benefit Cost Analysis • Using all of the economic values calculated throughout this report, how do the benefits
of removing the LSRD compare to the cost of doing so?
Conclusion • What are the key economic implications of LSRD removal?
ECONorthwest 19
2 Background
2.1 Purpose and Characteristics of the Lower Snake River Dams The LSRD are included in the broader “Headwater/Lower Snake” strategic class of dams by BPA.3 These dams are primarily designed to support services provided by the “Main Stem Columbia” class. The latter provides the majority of power, ancillary services, and non-power benefits to the Pacific Northwest (FCRPS 2016b). The Headwater/Lower Snake class dams provide the following services:
• Power: The primary purpose of the LSRD is hydropower generation. The four dams generate approximately 1,024 average megawatts (aMW), 12 percent of BPA’s aMW energy, and 3,033 MWs (21 percent) of the total LSRD capacity. They also support ancillary services for the 500-kV grid that runs from eastern Washington to western Montana (FCRPS 2016b).
• Flood Damage Reduction: Seasonal flood reduction and water storage occurs primarily at upper reservoirs of the LSR, not at the four LSRD. The LSRD provide some minor seasonal flood reduction and water management storage, however, the storage capacity of these dams could be replaced by other dams within the LSR and Columbia River system.
• Navigation: The LSRD enable navigation for the LSR between the Tri-Cities and Lewiston, Idaho for commercial and non-commercial boat traffic. USACE is congressionally authorized to maintain a 14 foot deep by 250 foot wide navigation channel on the Columbia-Snake River System (USACE 2014).
• Recreation: The LSRD provide “major” and “destination” sites for boating and camping that are managed by USACE, U.S. Fish & Wildlife Service (USFWS), as well as local and state agencies and port authorities (USACE 2018, USACE 2014). Opportunities available include camping, boating, swimming, fishing, and wildlife viewing throughout the year, with most use occurring from late spring to early fall (USACE 2014). The Ice Harbor and Lower Granite dams have the highest number of visitors and recreation facilities because of their proximity to population centers (Ibid).
• Fish and Wildlife: Due to the dams’ impacts on the surrounding environment, BPA has a “significant role” in the management of reservoir lands, fish passage, flow augmentation, and wildlife mitigation (USACE 2018). Aside from BPA’s direct involvement in infrastructure and flow management, they also support salmon research,
3 The “Headwater/Lower Snake” strategic class of dams includes a total of seven dams, the four LRSD, Dworshak, Libby, and Hungry Horse.

ECONorthwest 20
hatcheries, and other fish and wildlife mitigation programs throughout the LSR watershed.
• Irrigation: BPA does not consider irrigation a service provided by the LSRD, however, the pools do serve a secondary irrigation role for the surrounding area (USACE 2016). The LSRD reservoirs are not designed for long-term water storage and have limited storage volumes available. Water withdrawals have historically occurred for irrigation and industrial purposes, primarily from the reservoir above Ice Harbor Dam (USACE 2002d).
The Snake River drainage area comprises 42 percent of the overall drainage area of the Columbia River System and provides 18 percent of the water for the basin (USACE 2002d). The average annual flow for the LSR is 49.8 thousand cubic feet per second (kCFS), the monthly flow average peaks in June at 115 kCFS, with lowest flows (20 kCFS) occurring in September (Ibid). The reservoirs immediately above the LSRD are each approximately 100 feet deep at the dam site and 16 feet at the upper end. They range from 28 to 45 miles long, with the most upstream pool behind Lower Granite Dam extending 39.9 miles upstream on the Snake River and 2.6 miles into the Clearwater River. USACE is required to maintain certain pool elevation levels depending on the season for a combination of salmon, water temperature, and recreation management needs.
2.2 Managing the Dams for Environmental Resources Concerns about the environmental impacts of the LSRD have been raised since before their construction. The Lower Snake River Compensation Plan (LSRCP) was designed and implemented to offset the impacts from the dams on the riverine ecosystem. Since construction of the LSRD, many environmental impacts have varied from earlier projections, including the larger than expected decline of anadromous fish populations. In 1991, the National Marine Fisheries Service (NMFS) designated the Snake River sockeye salmon as endangered (56 FR 58619). Three additional populations of anadromous fish (spring/summer Chinook, fall Chinook, and steelhead; 56 FR 51684, 58 FR 68543) were listed as threatened. The Lower Snake River is designated as critical habitat for all four populations of salmonids. The critical habitat designations triggered a formal consultation process for the dams and a series of biological opinions. The decline of these populations and subsequent litigation motivated a large body of research on the LSR. The bulk of work originated from a 1991 Systems Configuration Study initiated by the Northwest Power and Conservation Council (NPPC), which evolved into a multiphase process completed by USACE to respond to NMFS’s Biological Opinions of 1995, 1998 and 2000, culminating in the federal management agencies releasing the 2002 EIS (USACE 2002b).
ECONorthwest 21
2.3 2002 EIS Reviews Ongoing concerns about the environmental implications of the LSRD have led to a number of outside groups reviewing and commenting on their conclusions from a variety of different perspectives. In response to the initial results from the 2002 EIS process, ECONorthwest analyzed the cost-benefit model developed by the Drawdown Regional Economic Workgroup (DREW) and reviewed mitigation options for Trout Unlimited (ECONorthwest 1999). The DREW analysis concluded that breach of the dams would lead to a loss of 0.2 percent of jobs in the region. However, the DREW analysis did not consider market response, local adaptation, trends in regional growth, and tribal or passive use benefits, which could lead to job gains (Ibid). The DREW analysis found that irrigated agriculture would incur the bulk of projected employment losses. However, subsidized irrigation sources, modified irrigation practices, or changes in crop selections could mitigate those employment and income losses (Ibid). Save Our Wild Salmon (SOS) produced a report reviewing the EIS and included additional costs and ecosystem service benefits that the 2002 EIS had omitted (SOS 2006). The report concluded that costs of operation, maintenance, and habitat programs would range from a total of $10.6 billion to $12.3 billion over the first ten years and $21.2 billion to $24.6 billion in the following twenty years. They estimated that dam removal, including investments in irrigation, shipping, and power alternatives would cost between $8.4 billion to $12.3 billion, and $15.0 billion to $22.5 billion over the respective ten-year and twenty-year time frames. The report did not include regional economic impacts resulting from increased freight costs and employment changes, or non-use values. A widely cited report by former USACE employee, Jim Waddle, reviewed the economic analysis from the 2002 study and provided a summary of key omissions, miscalculations, or assumptions (Waddle 2015). Particular emphasis was placed on re-estimating the cost of improved fish passage facilities, operation and maintenance, turbine rehabilitation, the LSRCP, navigation, and flow. The report asserts that USACE underestimated the average annual cost of keeping the dams in place by 284 percent and that a proper accounting of costs in the 2002 EIS would have resulted in the removal of the dams. Earth Economics performed evaluations of the regional and national economic impacts of the LSRD scenarios, relying on cost figures from Waddle and including updated statistics for some additional cost categories (Mojica 2016a, Mojica 2016b). The report included updated information on the status of power generation in the region, updated trends in navigation and shipping, and new information on recreation and non-use values. They found benefit-cost ratios of keeping versus removing the dams of 0.15 and 4.3 respectively, indicating a positive economic benefit from removal.
ECONorthwest 22
Other Federal Agencies During the 2002 EIS process, the Environmental Protection Agency raised concerns about USACE data and methodology (USACE 2002c; GAO 2000). EPA’s position, at the time, was that water temperature, including water discharged from a dam, should be regulated under the CWA.4 EPA’s temperature model of the LSR conflicted with the model created by USACE. The EPA modeling showed that even with no additional temperature augmentation from Dworshak Dam, located upstream of the LSRD, the breach scenario resulted in fewer days of temperature exceedance, meaning cooler overall water temperatures (USACE 2002d). The U.S. General Accountability Office (GAO) found in 2000 that the EIS processes “generally adhered” to requirements but found that some of the estimates of impacts to transportation and air quality were unreasonable (GAO 2000). While GAO deemed that the estimation of costs related to electricity was appropriate, they highlighted two concerns: 1) the EIS used a zero price elasticity of demand for power, implying that consumers and industries do not adjust their power consumption when prices change, and 2) the avoided costs of dam removal (O&M, juvenile salmon transport, and future capital) were not presented in relation to electrical costs. These resulted in the analysis conveying a greater cost of breaching. GAO states that USACE acknowledged these gaps in the power analysis but did not resolve them because of “considerable cost and effort [required] without a significant effect on the results” (Ibid). Similarly, in 2006, the GAO found that, more broadly, USACE’s studies on civil works’ projects and actions were, “fraught with errors, mistakes, and miscalculations, and used invalid assumptions and outdated data” (Mittal 2006). While this report did not explicitly analyze the USACE’s actions on the LSRD, it did identify specific errors in commodity price forecasts, quality control/process errors, and the frequent use of outdated data in other reports. GAO concluded that the errors caused several USACE studies to understate costs, overstate benefits, and not allow for a “reasonable basis for decision-making” (Ibid).
NPCC The Northwest Power and Conservation Council (NPCC) is a federally authorized organization that coordinates among the member states of Idaho, Montana, Oregon, and Washington to develop a regional power plan that balances the region’s environment and energy needs (16 U.S.C. §§ 839-839h). NPCC hosts three advisory groups, the Independent Economic Analysis Board (IEAB), Independent Scientific Advisory Board (ISAB), and the Independent Scientific Review Panel (ISRP), who provide analysis of academic and nongovernmental literature relating to power generation in the Northwest.
4 EPA stated in a draft TDML plan that, “Water temperature can be elevated above natural conditions by a number of human activities. The primary sources of elevated temperatures in the Columbia and Snake Rivers are point sources, nonpoint sources, and dams.. [sic].. Dams alter river temperature by changing the flow regime, stream geometry, current velocity and flood plain interactions of the river” (EPA 2003). This plan was never released in final form and is the basis for an ongoing lawsuit filed in US District Court against the EPA (Columbia Riverkeepers et v. Scott Pruitt, 2017 W.D. Wash. No. 2:17-cv-289).
ECONorthwest 23
The IEAB has provided reviews on the economic effectiveness of fish and wildlife programming, recommendations and guidance for economic analysis in watershed planning, and commentary on other economic papers pertaining to the Columbia River System. In their review of the 2002 EIS, the IEAB noted several potentially problematic issues, including a lack of analysis of replacement power for times of the year other than summer, a concern that the value of recreation benefits was overestimated, low sensitivity to infrastructure costs in replacement freight transportation, overlooking the adaptation of crops or sources of irrigation, and a lack of clarification of tribal benefits (IEAB 2000). The IEAB has also reviewed and commented on other groups’ reviews of the 2002 EIS. In particular, they disagreed with some of the claims in SOS’s review, specifically their estimate of hydropower replacement costs, the omission of a discount rate on future benefits from dam removal, the complexity of salmon restoration efforts in the entire Columbia Basin, and methodological concerns about non-use and fishery benefit data (IEAB 2007).
2.4 Columbia River System EIS The abundance of additional literature evaluating the 2002 EIS motivated the May 2016 decision by U.S. District Judge Michael Simon ordering the USACE to complete a new EIS that includes an analysis of partial or full removal of the LSRD. An additional April 2017 decision ordered actions to improve fish and wildlife management and transparency of ongoing LSRD infrastructure work.5 The federal managing agencies have since begun evaluating the economic implications of LSRD removal as part of the larger Columbia River System EIS, anticipated to be released as a draft in February 2020, including the following actions (BPA 2017e):
• Assess socioeconomic impacts resulting from changes in each LSRD operating scenario for:
o Power and transmission rates and energy demand modeling;
o Habitat restoration with a review of what mitigation activities should occur, operations and maintenance costs, new constructions costs, monitoring and evaluation of those conservation programs, and how those programs impact local economies;
o Fisheries (commercial, recreational, and tribal) and their direct, indirect and cumulative impacts of catch numbers on economies, as well as cultural experiences as a result; and
o Tribal interests and a specific look at impacts on the 19 federally recognized tribes in the region.
5 National Wildlife Federation et al. v National Marine Fisheries Service, et al., 2016 WL 2353647
ECONorthwest 24
• Assess the social cost of carbon – identify changes in greenhouse gas emissions that could result from each scenario, including a change in the power generation fuel mix, and transportation alternatives for commodity shipping.
• Perform an environmental justice analysis – identify the impacts on minority and low-income communities of actions, programs, policies and activities.
• Conduct an ecosystem services impact analysis on function goods and services for the human population, and intrinsic use of environmental resources apart from the benefits to human populations.
2.5 2018 Spill Management In 2017, as part of ongoing litigation involving the LSRD, but independent of the 2016 EIS decisions, a U.S. District Court ordered the federal managing agencies on the Lower Snake and Lower Columbia rivers to:
• Spill water earlier (April 3 through June 20) to improve survival rates for juvenile salmon and steelhead through the hydroelectric system,
• Operate bypass and PIT-tag juvenile detection systems at the dams beginning March 1, 2018, as opposed to mid-March, and
• Test the benefits of additional spill against impacts of dissolved oxygen and water flow patterns on juvenile survival rates.
This ruling was upheld by the Ninth District Court in April 2018 and was implemented in the spring of 2018. This new flow regime has allowances built in to ensure minimum levels of power generation and transmission reliability. Additionally, USACE may conduct short-term adjustments to address navigation safety concerns. These modifications could include changes in spill patterns or maintaining water levels above the minimum operating pool (USACE 2018).
ECONorthwest 25
3 Stakeholder Interviews
3.1 Purpose In order to gain qualitative information and provide context for this study, a series of stakeholder interviews were conducted by ECONorthwest. Stakeholders may have practical knowledge and insight that the project team would have otherwise overlooked. Information derived from these stakeholder interviews can contextualize the analysis and add additional inputs or sources of information. They can also provide information on how stakeholders will react to a change, in this case, LSRD removal. While the economic impact analysis of dam removal cannot include all potential factors because of the quantitative nature of the modeling techniques, these stakeholder interviews can acknowledge gaps and help frame the outputs correctly. These interviews were targeted at the irrigation and agriculture sectors to gain information on how water-users would react to a reduction in water rights. The politically sensitive nature of the LSRD made stakeholder interviews particularly relevant but also difficult to conduct. Some of the views gained through extended conversations were not common perspectives emphasized in either the media or research, while the political discourse and media attention clearly influenced other lines of discussion. The following sections describe the process for identifying stakeholders and conducting interviews. All information was compiled anonymously, and every attempt has been made to characterize the comments and concerns of all participants objectively. A number of stakeholders contacted chose not to participate. As such, the description below should not be considered a complete representation, and other perspectives not collected remain essential.
3.2 Methods
Stakeholder Identification and Outreach Interviewees were identified by a broad search of organizations, businesses, and officials in the Lower Snake Region. Based on this analysis’ topic areas (Grid Services, Irrigation, Transportation and Ecosystem Services) relevant public and private sector firms and individuals were found either via the internet or referrals. Initial contact was conducted electronically via email. These contacts occurred 10 to 16 days before interview dates. If no email address was available or there was no response to email solicitation, a first and second follow-up phone call was made three to eight days after initial contact. Potential interviewees were given an introduction of the project and a copy of the questions if requested. The opportunity to address any questions about the content or process via a phone call was also offered, and five stakeholder respondents had additional questions. The interview template is provided in Appendix 11.2 and an example email solicitation is provided in Appendix 11.3.
ECONorthwest 26
A total of 44 organizations/individuals were in the initial outreach effort. Through follow-up or while conducting the interviews, an additional ten contacts were solicited. Stakeholders fell into the following categories: 22 stakeholders were affiliated with agriculture or irrigation, nine were affiliated with business development, local government or industry organizations, eight represented interests in shipping or transportation, and five were associated with tourism.
Stakeholder Response The stakeholder interviews were not designed to serve as a representative sample, and the interview selection and interaction reflect the outcome of a more general information gathering process. There were interactions with 17 of the 50 stakeholder contacts, resulting in five non-responses to follow-up, four hard refusals for interviews, five completed interviews, two unavailable and one outstanding. The subject areas with the least responses to stakeholder interview requests were tourism and farm level agriculture/irrigators. With this limited response, while visiting the region along the river between Richland and Lewiston, 11 individuals/firms were approached informally resulting in six contacts that were locally associated with commercial interests or shipping, and five recreational users. These informal contacts were engaged in general conversation and were not presented with or asked the formal set of stakeholder questions.
3.3 Key Findings
Grid Services Power supply costs were mentioned as advantageous to doing business in the region by a number of stakeholders. This benefit was considered in terms of the general cost of living as well as business and industrial use. Concerns about the specific power demands of the Tri-Cities was raised, and the power capacity required in the summer months. Stakeholders stated that capacity provided by the LSRD makes up 40 percent of Tri-Cities’ use in the summer. Other items that were brought up include the sunk investment in the existing transmission infrastructure, concerns about the large-scale removal of that transmission infrastructure, the loss of power sources on the system, potential burdens on ratepayers for increased fish and wildlife costs, and/or potential rate increases if dams were removed. Interviewees expressed pride in the renewable and low-carbon energy source that the LSRD provide as well as the value of the fish in the region. Regarding future generation and the financial status of BPA, there was acknowledgment of 1) the BPA electricity rate in comparison to the price on the open market and how that will impact future power agreements that are coming up in 2028, and 2) the financial position of BPA and the rising costs of environmental mitigation actions.
Irrigation While over half of initial outreach was directed toward the agricultural and irrigation sectors, all direct water users declined requests for interviews. This was due to political sensitivity to the
ECONorthwest 27
potential interpretation and application of their input. Through other conversations and informal contacts with water users, minor concern was expressed regarding access to water for irrigation. Some growers have already begun adapting to reduced water consumption through more efficient irrigation management such as moving from spray to drip irrigation and monitoring soil moisture; these measures allow them to increase their irrigated acreage with the same amount of water. Anecdotally, views on how inexpensive water is and access to the water are seen as a right and a legacy that is well-established in the region. Outside forces that can change the operation of agriculture in the region, be it government regulation or changing weather patterns that affect stream levels and seasonality, are perceived as threats to a way of life and livelihood.
Transportation Wheat is the primary product being shipped downstream via barge to the Port of Portland. The main loading points are Clarkston, Washington at the Port of Wilma, as well as the Columbia Grain Elevator and Barge Loading Facility at Central Ferry near the Little Goose Dam. The products are primarily held in on-farm storage with some capacity in grain elevators, in port areas, and along the river. Farmers store their products for improved market conditions, and then ship the products from the storage elevators to loading areas via truck. In the stakeholders’ views, the downstream transport time and the ability of growers to respond to demand is a selling point, with delivery as quick as three days from notification to unloading at the Port of Portland. Stakeholders estimated that the user area of barge services extends in a roughly 50-mile diameter of Lewiston, Idaho, as well as the producers relatively adjacent to the river. There was no discussion of other products being shipped downstream via barge. There was agreement among stakeholders that there would not be the capacity to handle the wheat volumes on other modes of transportation if barging was no longer an option. Based upon an estimate of 120,000 bushels of wheat per barge, alternative transportation would require an equivalent 100 trucks (carrying 1,200 bushels) or 33 railcars (3,600 bushels) to transport it to market. The capacity to handle shipments from Lewiston is linked by a 97-mile-long short-line railroad from Forebay, Idaho to Ayer Junction, Washington owned by Watco Companies. Known as the Great Northwest Railroad, this line allows connection to Columbia barges or direct access to Portland or Seattle. This line does not have high capacity, and the current loading site in Lewiston does not have railcar storage capacity to accommodate the current volume of wheat. It is unclear from the stakeholders if the rail line would be able to handle the additional traffic even if other constraints were addressed. Other alternatives would increase truck traffic with similar infrastructure and loading constraints, such as trucks shipping from Lewiston to the Tri-Cities. The two-lane highway, Highway 12, currently supports semi-truck traffic, but the increased volume would necessitate increased infrastructure investment and the physical characteristics of the highway would require significant improvements. Availability of trucks, drivers, and current driving time limits were also a concern for growers. The region has already seen the impacts of the loss of container service (for lentils and legumes) at the Port of Portland, and that traffic has switched to truck
ECONorthwest 28
into the Port of Seattle which requires two days or two drivers (transfer of cars) in order to accommodate trucking regulations and access to Port facilities. Outside of the potential increased cost and needed infrastructure improvements (rail lines or expanded roadways), stakeholders stated that the pure competition for rail and trucks (actual cars and drivers) would be the major constraint on market access if barging of wheat ended. Barge transportation provides significant cost savings for agriculture producers in the region. Stakeholders suggest that rail or truck transportation costs could double the price of wheat, not including the additional handling and loading costs and potential timing and port access delays. The advantage of wheat in this area is that it is low cost, high quality, and can quickly respond to market demand. With the increased cost of shipping (by rail or truck) and the significant infrastructure investment to accommodate the volume, interviewees suggested the feasibility of wheat in this region would be put into question. Stakeholders mentioned two other products transported via barge upstream. The first, wood pulp, is being transported upstream to the Clearwater Paper Company located above the confluence of the Clearwater and Snake Rivers in Lewiston, Idaho. The second, shipments of large industrial equipment, known as “megaloads”, are destined for inland manufacturing centers and crude oil exploration/processing. Both of these products are barged up the Columbia and Snake rivers and then transported by truck on Highway 12 through Idaho and Montana. Highway 12 is a two-lane highway, which has no height limitations (overpasses) with access to the interior of the United States. This route reduces the time and expense of the current alternative which is shipping (from Asia) via the Panama Canal and north on roads through the central United States. These megaloads were initially deemed more attractive via Highway 12 even with slow travel requirements and road improvements required for large load permit approvals by state governments. Megaload shipments to Alberta were stopped due to environmental concerns following protests by local Native American tribes and residents in 2013 and have since been officially blocked by the courts in 2017. New rules have been instituted that will allow for oversized shipping, consistent with historical use, but not to the degree that will allow for continued large industrial equipment shipping that would also use barges.
Ecosystem Services The importance of the environment came up in all of the in-person interviews with varying emphasis. Respondents spoke about the importance of the clean energy provided by the dams, as well as fish and wildlife. Some interviewees had concerns about the potential pathways to recovery for the fish. Some interviewees believed that the low populations of salmon first occurred years before dam installation due to overfishing in the early 1900s and that the fish had benefited from the increased wildlife funding brought by dam construction. Recreationalists, engaged mostly in slack-water recreation such as fishing, were impressed by the accessibility of the Snake River. This sentiment was gathered through informal conversation at two points along the river where picnicking and boat facilities were available. Respondents
ECONorthwest 29
were a mixture of residents (two) and in-state tourists (three) who came from 100 – 150 miles away. Other stakeholders expressed both optimism in capturing fast-water tourism combined with existing vineyard-based trips or skepticism that the area could develop into such a fast-water or fishing destination. Concerns about regulations on fishing and the termination of airline access (Alaska Airlines ceased its Lewiston-Seattle, and Lewiston-Boise service) were brought up in the context of turning towards outdoor recreation as a main part of the regional economy. Dam removal could potentially impact the tourism generated from cruise and boat travel up and down the Snake and Columbia rivers. The dam locks are public and can be used by all travelers on the river. Depending on traffic a lock can be traversed within 20 minutes if 30-minute notification is given prior to arrival. Outside of individual or small craft travel, four cruise operators run trips from Oregon to Clarkston, Idaho offering seven to nine-day excursions which include trips to wineries, hikes, fast-water boating opportunities, and historical sites.
ECONorthwest 30
4 Grid Services
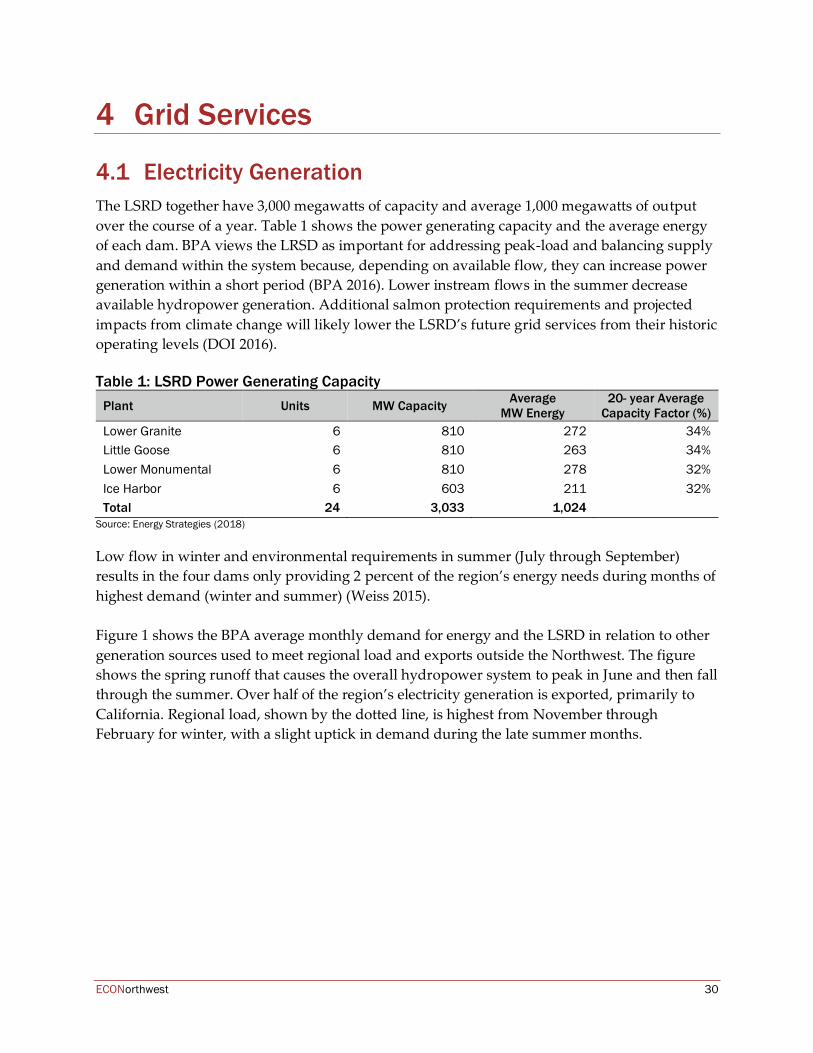
4.1 Electricity Generation The LSRD together have 3,000 megawatts of capacity and average 1,000 megawatts of output over the course of a year. Table 1 shows the power generating capacity and the average energy of each dam. BPA views the LRSD as important for addressing peak-load and balancing supply and demand within the system because, depending on available flow, they can increase power generation within a short period (BPA 2016). Lower instream flows in the summer decrease available hydropower generation. Additional salmon protection requirements and projected impacts from climate change will likely lower the LSRD’s future grid services from their historic operating levels (DOI 2016). Table 1: LSRD Power Generating Capacity
Plant Units MW Capacity Average MW Energy
20- year Average Capacity Factor (%)
Lower Granite 6 810 272 34% Little Goose 6 810 263 34% Lower Monumental 6 810 278 32% Ice Harbor 6 603 211 32% Total 24 3,033 1,024
Source: Energy Strategies (2018)
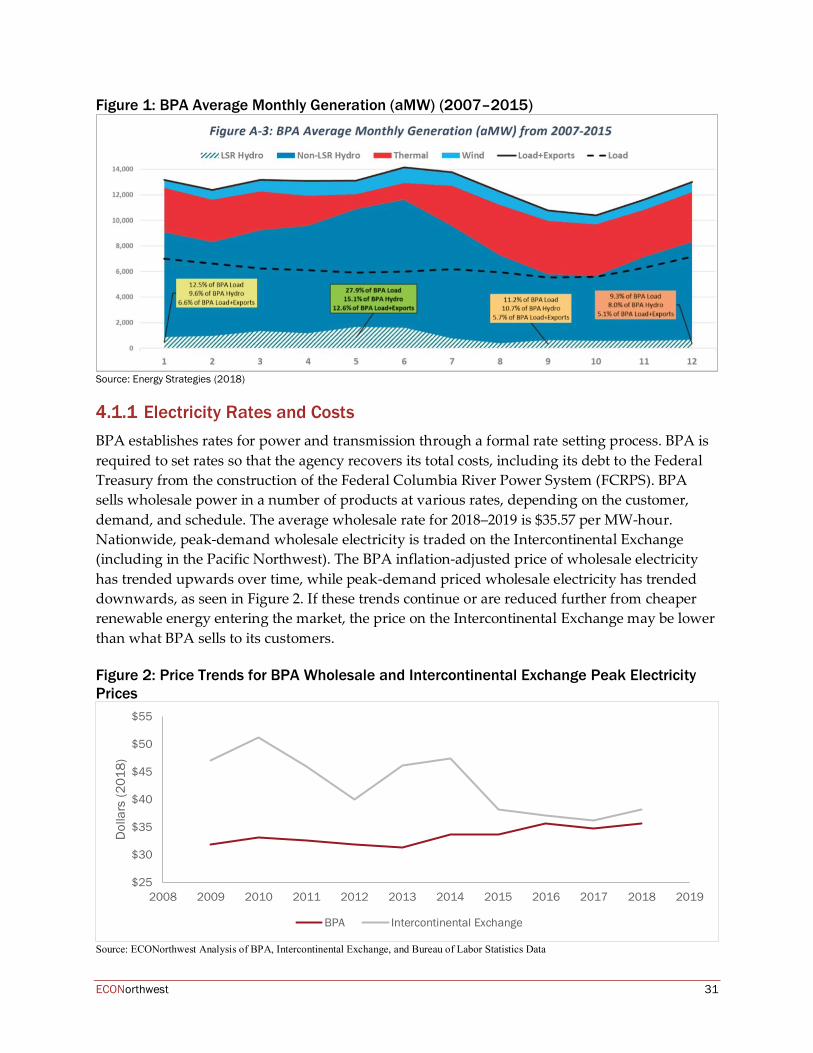
Low flow in winter and environmental requirements in summer (July through September) results in the four dams only providing 2 percent of the region’s energy needs during months of highest demand (winter and summer) (Weiss 2015). Figure 1 shows the BPA average monthly demand for energy and the LSRD in relation to other generation sources used to meet regional load and exports outside the Northwest. The figure shows the spring runoff that causes the overall hydropower system to peak in June and then fall through the summer. Over half of the region’s electricity generation is exported, primarily to California. Regional load, shown by the dotted line, is highest from November through February for winter, with a slight uptick in demand during the late summer months.
ECONorthwest 31
Figure 1: BPA Average Monthly Generation (aMW) (2007–2015)
Source: Energy Strategies (2018)
Electricity Rates and Costs BPA establishes rates for power and transmission through a formal rate setting process. BPA is required to set rates so that the agency recovers its total costs, including its debt to the Federal Treasury from the construction of the Federal Columbia River Power System (FCRPS). BPA sells wholesale power in a number of products at various rates, depending on the customer, demand, and schedule. The average wholesale rate for 2018–2019 is $35.57 per MW-hour. Nationwide, peak-demand wholesale electricity is traded on the Intercontinental Exchange (including in the Pacific Northwest). The BPA inflation-adjusted price of wholesale electricity has trended upwards over time, while peak-demand priced wholesale electricity has trended downwards, as seen in Figure 2. If these trends continue or are reduced further from cheaper renewable energy entering the market, the price on the Intercontinental Exchange may be lower than what BPA sells to its customers. Figure 2: Price Trends for BPA Wholesale and Intercontinental Exchange Peak Electricity Prices
Source: ECONorthwest Analysis of BPA, Intercontinental Exchange, and Bureau of Labor Statistics Data
$25
$30
$35
$40
$45
$50
$55
2008 2009 2010 2011 2012 2013 2014 2015 2016 2017 2018 2019
Dol
lars
(201
8)
BPA Intercontinental Exchange
ECONorthwest 32
Energy Demand Forecast The NPCC is required by the Northwest Power Act to forecast long-term electric demand, prices and capacity scenarios for the region (NPCC 2016). The power plan sets forth what needs can be addressed by existing capacity, assessments of potential resource development in a cost-effective and energy-efficient manner, and what levels can be met by energy efficiency alone (Ibid). The most recent forecast iteration, the Seventh Northwest Conservation and Electric Power Plan (“the seventh power plan”), lays out models for demand and generation, as well as addresses energy efficiency gains, and other outside influences on generation capacity and cost (environmental and carbon policy). The regional load for Oregon, Washington, Idaho, and Montana is expected to increase between 1,800 and 4,400 annual average MWs (aMW) between 2015 and 2035, a growth rate of 0.4 to 0.95 percent a year, with summer peak load increasing faster relative to the annual average (Ibid). Climate change could increase summer peak load for the Pacific Northwest by an additional 4,000 MWs by 2035 (Ibid). The contributing factors to these increases are residential and commercial growth, increased population, air conditioning use, new data centers, and indoor agriculture (Ibid). It is important to note that current and forecasted demand is below the historical peak for the region, which occurred in the early 2000s. The forecast will meet the historic peak of roughly 20,000 aMWs between 2025 and 2030. Outside of the primary focus of identifying base power, the seventh power plan needs to address changes in peak and within-hour generation flexibility, and the increased integration of more variable sources like wind and solar power generation (Ibid). The primary resource strategy for the NPCC is to improve energy efficiency as it is the least expensive resource available and avoids risks of fuel price volatility (NPCC 2016). NPCC hopes to gain an average of 4,300 MWs through efficiency actions by 2035, which could largely meet the future energy needs. The NPCC is also seeking to develop demand response resources for winter peaking capacity. This new capacity would reduce reliance on external market purchases and reliance on hydropower generation (NPCC 2016). The NPCC is also considering increasing existing natural gas capacity to address near-term retirements of coal resources and a modest development of new and more diverse renewable resources such as solar and geothermal (Ibid).
Northwest Energy Coalition Study The Lower Snake River Dams Power Replacement Study (“the power replacement study”), authored by Energy Strategies for the Northwest Energy Coalition provides the best current estimate of the cost of replacing the four dams’ grid services (Energy Strategies 2018). The power replacement study analyzes three alternatives for replacement: all natural gas, all demand-side reductions, and a balanced portfolio of renewables and demand-side reductions. The grid services from the four dams could be replaced at a cost of $400 million to $1.2 billion per year depending on the resource mix and other assumptions. These costs represent an increase in the regional revenue requirement of 2 percent to 3 percent or a monthly bill increase for the average household of $1 to $2 per month.
ECONorthwest 33
The power replacement study also evaluates the increases to our current baseline of greenhouse gas emissions that range from 1 percent for a balanced portfolio of wind, solar, energy storage, demand response, and energy efficiency to an 8 percent increase for an all-natural gas portfolio. The power replacement study should prove credible to experts and policymakers engaged in the forthcoming EIS regarding salmonid passage in the Columbia River System. However, the power replacement study does not represent the definitive estimate of the costs replacing grid services. The findings section of the power replacement study identifies several areas for additional research and analysis that could improve confidence in the cost estimates and potentially lower the cost of a balanced portfolio of resources. In particular, the power replacement study did not try to optimize the blend of resources nor did it consider purchasing some of the needed grid services from outside the region on the wholesale energy markets which could further lower costs. The power replacement study represents an essential input to a comprehensive benefit-cost analysis but limits itself to estimating the cost of replacing the grid services from breaching the dams. The study, therefore, does not address many of the relevant costs and benefits identified in the scope of this report, which include:
• The avoided costs of improving fish passage.
• The avoided costs of ongoing maintenance and repairs to the dams.
• The cost of breaching the dams and restoring the riparian environment.
• The cost of replacing lost transportation services from barge transport in the breach scenario.
• The cost of lost irrigation services from breaching.
• The net change in the value of environmental services from breaching.
The Energy Strategies power replacement study represents a credible effort to estimate the cost of replacing lost grid services from breaching the dams and serves as an input to the comprehensive benefit-cost analysis conducted in this study.
4.2 Approaches to Valuing Grid Services The benefits that the LSRD deliver to the electric grid fall into three main categories:
• Energy - the ability to do work over an hour, measured in megawatt-hours;
• Reliability - the ability to meet peak loads or provide power in case another generator trips offline; and
ECONorthwest 34
• Flexibility - the ability to quickly increase or decrease power output to keep the supply and demand for electricity in proper balance. If the LSRD are removed, the region will lose the economic value of these grid services.
Two methods are used for this analysis to inform the value of LSRD grid services. The first is to estimate the costs of a replacement portfolio of resources in the Pacific Northwest that would provide a similar level of grid services. Informed by the Energy Strategies power replacement study, the first method assumes a replacement portfolio that includes demand response, energy efficiency, solar and wind generation to replace the grid services that would be lost if the LSRD were removed. The second approach is to observe market values for LSRD grid services in markets where they are traded. The LSRD output is almost always less than the region’s exports of electricity and so it is reasonable to assume that all of the LSRD energy output is exported and value it at the wholesale market price. If the LSRD were removed, other generators, mostly in California, would increase their output to offset the loss of LSRD power which would cause an increase in carbon emissions, the social costs of which, must be accounted for. In addition, the BPA would need to replace the loss of reliability and flexibility from the LSRD. To generate that estimate, this approach considers prices for those services in California where capacity and flexibility markets are transparent.
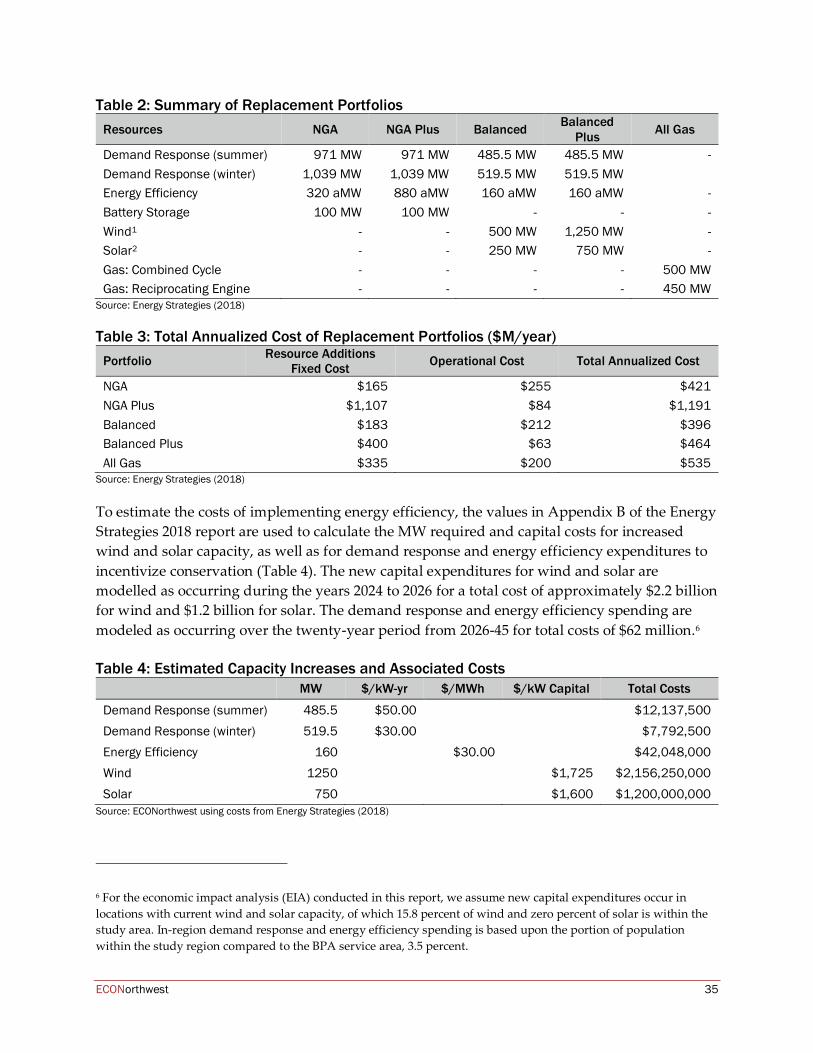
Replacement Portfolios for LSRD Grid Services In the 2018 power replacement study, Energy Strategies developed five alternative replacement portfolios for the LSRD. One portfolio consists entirely of natural gas generators (“All Gas”); two alternatives rely only on non-generating resources such as energy efficiency, demand response, and energy storage (“NGA” and “NGA Plus”); and two combine new solar and wind resources with non-generating resources (“Balanced” and “Balanced Plus”). Table 2 shows the composition of these five replacement portfolios and Table 3 shows their annual costs. The NGA Plus alternative is more than twice as expensive as any of the other portfolios because the aggressive increase in energy efficiency forces costs up a steep supply curve as estimated by the Northwest Power and Conservation Council. Given the high cost of this alternative relative to others, it is unlikely it would be selected. The region’s policy commitments to reducing carbon emissions also make the all-gas alternative highly unlikely, especially since it is more expensive than the other replacement portfolios. The analysis uses the annualized costs of $464 million from the Balanced Plus portfolio for the high valuation of LSRD grid services. The lower cost Balanced portfolio is also a probable replacement portfolio, but in the interest of anchoring a high estimate for grid service value, the analysis uses the Balanced Plus portfolio. The cost of the Balanced Plus portfolio thus represents a high estimate of the value of LSRD grid services.
ECONorthwest 35
Table 2: Summary of Replacement Portfolios Resources NGA NGA Plus Balanced Balanced
Plus All Gas
Demand Response (summer) 971 MW 971 MW 485.5 MW 485.5 MW - Demand Response (winter) 1,039 MW 1,039 MW 519.5 MW 519.5 MW
Energy Efficiency 320 aMW 880 aMW 160 aMW 160 aMW - Battery Storage 100 MW 100 MW - - - Wind1 - - 500 MW 1,250 MW - Solar2 - - 250 MW 750 MW - Gas: Combined Cycle - - - - 500 MW Gas: Reciprocating Engine - - - - 450 MW
Source: Energy Strategies (2018)
Table 3: Total Annualized Cost of Replacement Portfolios ($M/year) Portfolio Resource Additions
Fixed Cost Operational Cost Total Annualized Cost
NGA $165 $255 $421 NGA Plus $1,107 $84 $1,191 Balanced $183 $212 $396 Balanced Plus $400 $63 $464 All Gas $335 $200 $535
Source: Energy Strategies (2018)
To estimate the costs of implementing energy efficiency, the values in Appendix B of the Energy Strategies 2018 report are used to calculate the MW required and capital costs for increased wind and solar capacity, as well as for demand response and energy efficiency expenditures to incentivize conservation (Table 4). The new capital expenditures for wind and solar are modelled as occurring during the years 2024 to 2026 for a total cost of approximately $2.2 billion for wind and $1.2 billion for solar. The demand response and energy efficiency spending are modeled as occurring over the twenty-year period from 2026-45 for total costs of $62 million.6 Table 4: Estimated Capacity Increases and Associated Costs
MW $/kW-yr $/MWh $/kW Capital Total Costs
Demand Response (summer) 485.5 $50.00 $12,137,500 Demand Response (winter) 519.5 $30.00 $7,792,500 Energy Efficiency 160 $30.00 $42,048,000 Wind 1250 $1,725 $2,156,250,000 Solar 750 $1,600 $1,200,000,000
Source: ECONorthwest using costs from Energy Strategies (2018)
6 For the economic impact analysis (EIA) conducted in this report, we assume new capital expenditures occur in locations with current wind and solar capacity, of which 15.8 percent of wind and zero percent of solar is within the study area. In-region demand response and energy efficiency spending is based upon the portion of population within the study region compared to the BPA service area, 3.5 percent.
ECONorthwest 36
Market Values for LSRD Grid Services
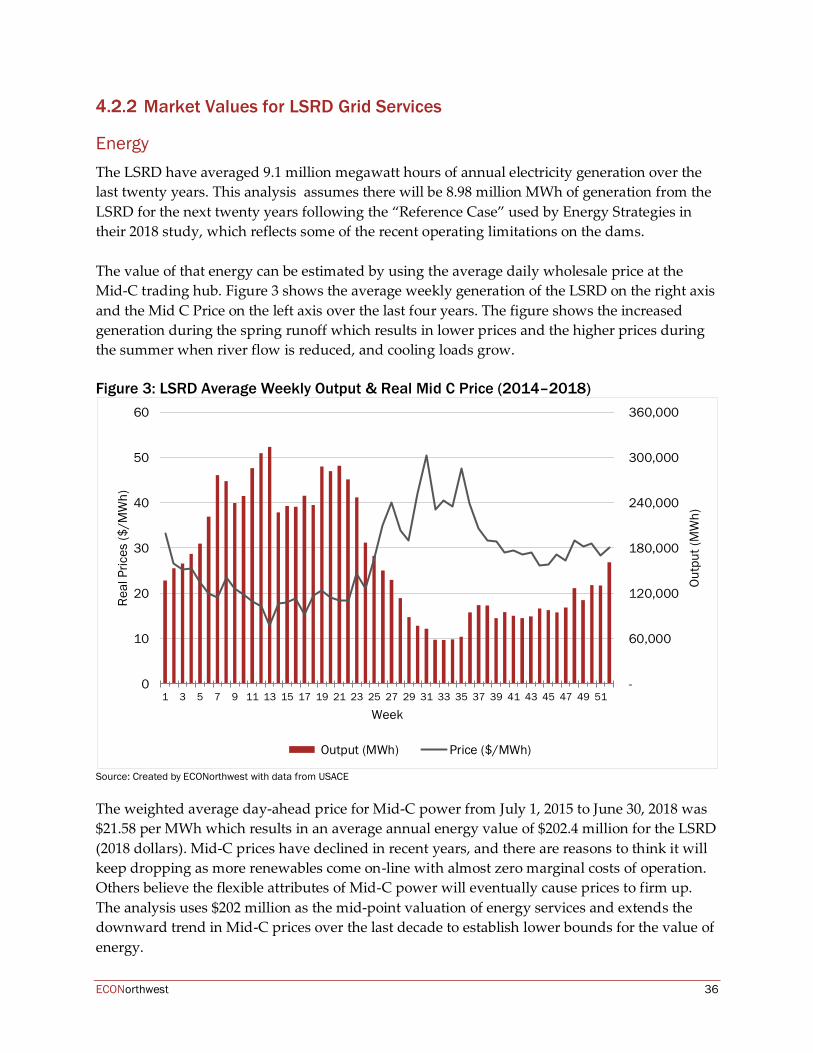
Energy The LSRD have averaged 9.1 million megawatt hours of annual electricity generation over the last twenty years. This analysis assumes there will be 8.98 million MWh of generation from the LSRD for the next twenty years following the “Reference Case” used by Energy Strategies in their 2018 study, which reflects some of the recent operating limitations on the dams. The value of that energy can be estimated by using the average daily wholesale price at the Mid-C trading hub. Figure 3 shows the average weekly generation of the LSRD on the right axis and the Mid C Price on the left axis over the last four years. The figure shows the increased generation during the spring runoff which results in lower prices and the higher prices during the summer when river flow is reduced, and cooling loads grow. Figure 3: LSRD Average Weekly Output & Real Mid C Price (2014–2018)
Source: Created by ECONorthwest with data from USACE
The weighted average day-ahead price for Mid-C power from July 1, 2015 to June 30, 2018 was $21.58 per MWh which results in an average annual energy value of $202.4 million for the LSRD (2018 dollars). Mid-C prices have declined in recent years, and there are reasons to think it will keep dropping as more renewables come on-line with almost zero marginal costs of operation. Others believe the flexible attributes of Mid-C power will eventually cause prices to firm up. The analysis uses $202 million as the mid-point valuation of energy services and extends the downward trend in Mid-C prices over the last decade to establish lower bounds for the value of energy.
-
60,000
120,000
180,000
240,000
300,000
360,000
0
10
20
30
40
50
60
1 3 5 7 9 11 13 15 17 19 21 23 25 27 29 31 33 35 37 39 41 43 45 47 49 51Ou
tput
(MW
h)
Real
Pric
es ($
/MW
h)
Week
Output (MWh) Price ($/MWh)
ECONorthwest 37
Reliability BPA is responsible for ensuring reliable power delivery for their public utility customers. If a generating plant goes off-line due to mechanical failure or if there is an expected surge in demand, BPA must have capacity resources ready that can provide power to meet that demand. In their 2018 power replacement study, Energy Strategies ran a simulation of the Pacific Northwest grid without the LSRD and noted how the loss of load probability changed for each month. Removing the LSRD increases the loss of load probability over 1 percent for four months: September, October, December, and January. There is no formal market for this reliability service in the Pacific Northwest, but in California utilities must contract for on-call capacity resources in what is called “resource adequacy.” To replace the reliability services provided by the LSRD, BPA could purchase a resource adequacy contracts from other regional generators or from large customers. In 2017, according to the California Public Utility Commission, 85 percent of the resource adequacy contracts in California were at or below $4.34 per kW per month (Chow & Brant 2017). The 1,000 MW of capacity for the four months when the LSRD are needed to provide regional reliability equates to a value of $17.4 million per year. This amount forms the mid-point of the value of grid services. For the low estimate, the analysis uses the average price in California of $2.57 per kW per month.
Flexibility California’s deregulated wholesale electricity markets also provide market information to allow us to estimate the value of the flexibility services from the LSRD. According to the California Independent System Operator’s 2016 annual report on market issues and performance, the costs of flexibility, also known as ancillary services, was 1.5 percent of the wholesale price of energy in 2016. The analysis applies this percentage to the LSRD energy values and estimate the value of flexibility services from LSRD at $3 million per year. The BPA reports the LSRD are used frequently for flexibility and so their share of flexibility service may be larger than their share of energy services which would make the system averages from the CAISO market too low. That said, the remaining dams in the Columbia River system could be recruited for more flexibility services at low or no cost, so the analysis uses the system averages from California. Table 5 summarizes the low, medium, and high estimates of the value of LSRD grid services. For the low-value scenario, the analysis takes 67 percent of the medium estimate which extends the linear trend in Mid-C prices that have occurred in the last ten years.
ECONorthwest 38
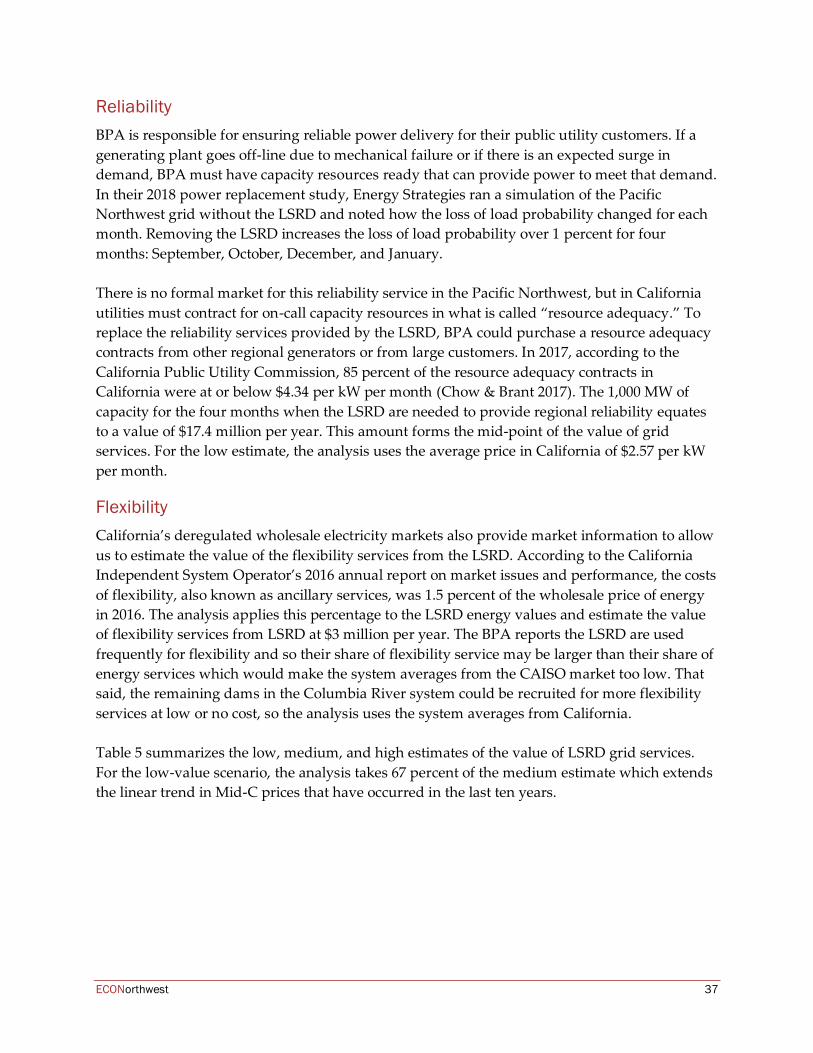
Table 5: Value of LSRD Grid Services
Annual Values for LSRD Low:
Market Prices (millions)
Medium (millions)
High: Replace with "Balanced
Plus" (millions)
Energy $202.40
Ancillary Services $3.00
Capacity $17.40
Value of Grid Services $178.20 $222.70 $464.00 Source: ECONorthwest (2018 dollars)
Carbon Free Power The LSRD generate electricity with no carbon emissions and if the dams are removed that energy would be replaced by power generating sources that emit some greenhouse gases. Since California is the primary market for the energy exported from the LSRD, this analysis assumes that the replacement energy will be generated there. Two values are used in this estimate for the range of possible emissions outcomes if the replacement power was generated with existing resources. The high emissions California-generated estimate (the mid-point) is 0.428 metric tons of carbon dioxide equivalent per megawatt hour. This value is drawn from the California Air Resources Board’s Regulation for the Mandatory Reporting of Greenhouse Gas for imported emissions from unspecified sources (CARB 2018). However, as California increases its share of renewable energy, the carbon emissions from the marginal energy source is going down. The low estimate is the carbon emissions factor for the PG&E service area of 0.131 MT CO2 e/MWh for 2020 that was developed by the California Public Utilities Commission.7 The commission is currently developing new plans that incorporate the state’s new goals for renewables, and if that analysis results in a new marginal emission rate, then that value should be used in any future analysis. The social value of the avoided carbon emissions is monetized and included in the analysis using the EPA’s social cost of carbon (EPA n.d.). In the benefit-cost accounting, the carbon emissions associated with replacing the power generated by the dams are considered a social cost from breaching rather than a grid service benefit. The high value of grid services associated with the Balanced Plus Replacement portfolio applies a small increase in carbon emissions for the clean energy portfolio. The medium and low valuation of grid services are driven by market prices, so the analysis uses the correspondingly higher estimate of greenhouse gases (GHGs) associated with replacing that power with California based resources that would emit more carbon dioxide than the Balanced Plus portfolio.
7 Emissions factor at https://www.pge.com/includes/docs/pdfs/shared/environment/calculator/pge_ghg_emission_factor_info_sheet.pdf
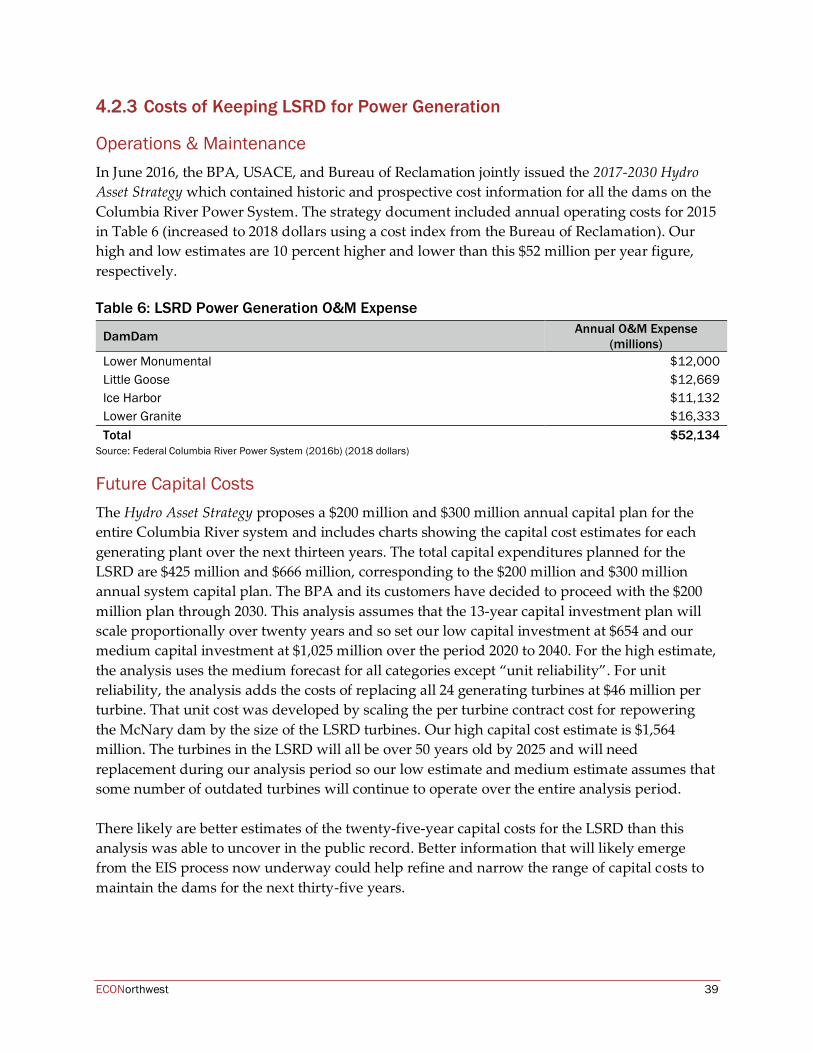
ECONorthwest 39
Costs of Keeping LSRD for Power Generation
Operations & Maintenance In June 2016, the BPA, USACE, and Bureau of Reclamation jointly issued the 2017-2030 Hydro Asset Strategy which contained historic and prospective cost information for all the dams on the Columbia River Power System. The strategy document included annual operating costs for 2015 in Table 6 (increased to 2018 dollars using a cost index from the Bureau of Reclamation). Our high and low estimates are 10 percent higher and lower than this $52 million per year figure, respectively. Table 6: LSRD Power Generation O&M Expense
Source: Federal Columbia River Power System (2016b) (2018 dollars)
Future Capital Costs The Hydro Asset Strategy proposes a $200 million and $300 million annual capital plan for the entire Columbia River system and includes charts showing the capital cost estimates for each generating plant over the next thirteen years. The total capital expenditures planned for the LSRD are $425 million and $666 million, corresponding to the $200 million and $300 million annual system capital plan. The BPA and its customers have decided to proceed with the $200 million plan through 2030. This analysis assumes that the 13-year capital investment plan will scale proportionally over twenty years and so set our low capital investment at $654 and our medium capital investment at $1,025 million over the period 2020 to 2040. For the high estimate, the analysis uses the medium forecast for all categories except “unit reliability”. For unit reliability, the analysis adds the costs of replacing all 24 generating turbines at $46 million per turbine. That unit cost was developed by scaling the per turbine contract cost for repowering the McNary dam by the size of the LSRD turbines. Our high capital cost estimate is $1,564 million. The turbines in the LSRD will all be over 50 years old by 2025 and will need replacement during our analysis period so our low estimate and medium estimate assumes that some number of outdated turbines will continue to operate over the entire analysis period. There likely are better estimates of the twenty-five-year capital costs for the LSRD than this analysis was able to uncover in the public record. Better information that will likely emerge from the EIS process now underway could help refine and narrow the range of capital costs to maintain the dams for the next thirty-five years.
DamDam Annual O&M Expense (millions)
Lower Monumental $12,000 Little Goose $12,669 Ice Harbor $11,132 Lower Granite $16,333 Total $52,134
ECONorthwest 40
BPA overhead costs If the LSRD dams are removed, this analysis assumes that some of the BPA’s overhead associated with managing the dams will also be reduced. In the BPA’s 2018 rate case, the overhead cost categories of Power Non-Generation Operations and General & Administrative total $170 million (BPA 2017d). To that amount, the analysis applies the share of LSRD output to the region’s total load and exports which ranges from 5.1 to 12.6 percent over a year. This approach results in a low estimate of overhead savings of $8.7 million, a medium estimate of $15.0 million, and a high estimate of $21.4 million.
Interest & Depreciation The Hydro Asset Strategy also reports the annual interest and depreciation associated with each of the dams. These costs are not included in our analysis since they remain the same whether the LSRD are removed or not. BPA will continue to pay on any outstanding bonds associated with the LSRD and in both scenarios the existing capital stock is fully depreciated. This analysis assumes that the residual value in 50-year-old dams in 2018 will be fully extinguished over the next thirty years. There is no precedent for debt forgiveness, but if that was authorized by the federal government it would decrease the cost for ratepayers.
4.3 Grid Services Summary If the LSRD are removed, BPA will play less for operations and maintenance, capital replacement, overhead, and fish mitigation. BPA will also lose the revenue from the sale of the LSRD power output to buyers outside the region and the value of capacity and flexibility services in the Northwest. If BPA replaces the LSRD with new generating assets in the Pacific Northwest, customers would experience an increase in electricity rates to cover the cost of a new generating portfolio. If the LSRD are removed and not replaced with new generating capacity and the costs of removing the dams are paid by federal taxpayers, then ratepayers would pay about the same as they currently do. However, if the LSRD are not replaced with a clean energy portfolio, then the 9,000,000 average annual megawatt hours would be replaced by other sources, primarily in California, that could include fossil fuel energy sources with higher carbon emissions.
ECONorthwest 41
5 Transportation
5.1 Background The dams and associated locks on the LSR connect an inland water way to allow freight barge traffic from the Port of Lewiston in Lewiston, Idaho, to access the Port of Portland 460 miles away or continue to the Ports of Seattle and Tacoma to connect to international markets. The LSRD, built between 1961 and 1975, introduced a modal alternative to truck and rail shipping for central Washington and Idaho agricultural products. The primary use of LSR barging is to transport grain produced in central Washington and Idaho downstream to bulk storage terminals in the Portland region. Removal of the LSRD would eliminate barging services on the Lower Snake, requiring growers and shippers to find alternative means of transporting products to export facilities in the Portland region. Alternatives would include trucking products to barge loading facilities on the Columbia River in the Tri-Cities area, or to train terminals for eventual transport to Portland or Seattle. For growers and shippers located near slack water in the LSR, these alternative modes of transportation will have higher shipping costs than barging. Generally, the transportation-related considerations of removing dams on the LSR include:
• Potentially higher shipping rates for local growers and shippers of produce (primarily wheat).
• The costs of investments in storage, loading, highway and rail infrastructure associated with higher shipping demands on those facilities.
• Costs associated with changes in emissions from a switch from barging to an increased reliance on truck and rail services.
• Some off-setting reduction in costs that will result in no longer maintaining barging services, in particular, the operation of locks, on the LSR.
Barging Volumes Historically, the Columbia-Snake inland waterway has carried over half of the exported wheat produced in central Washington and Idaho. Barges primarily serve downstream shipping of grains but also carry other items such as waste materials, chemicals and related materials, and crude materials other than fuels. Barges moving upstream contain commodities including fuel, manufacturing equipment, and machinery, as well as chemicals and associated products. Food and farm products (cereals and primarily wheat) constitute over 90 percent of the freight by tonnage barged downstream, and 75 percent of the tonnage barged downstream on the Columbia River. Although Washington produces a large volume of apples, they are not commonly barged and instead are transported via truck to Wenatchee or Yakima for processing
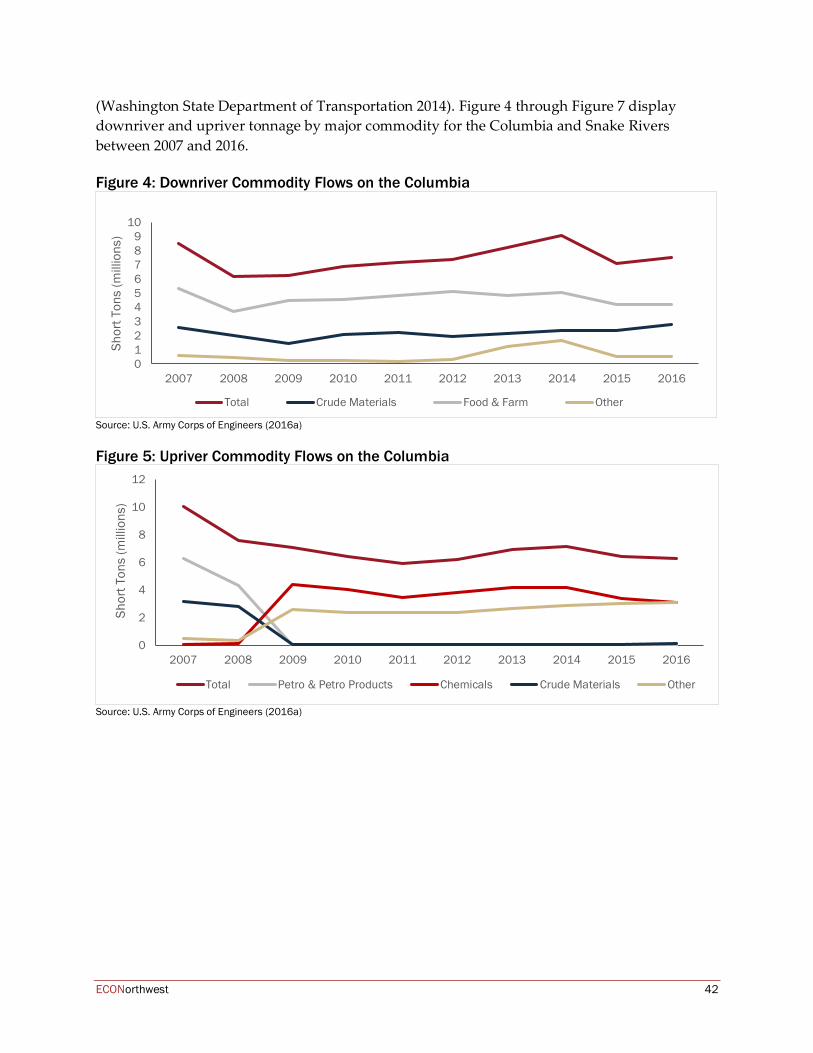
ECONorthwest 42
(Washington State Department of Transportation 2014). Figure 4 through Figure 7 display downriver and upriver tonnage by major commodity for the Columbia and Snake Rivers between 2007 and 2016. Figure 4: Downriver Commodity Flows on the Columbia
Source: U.S. Army Corps of Engineers (2016a)
Figure 5: Upriver Commodity Flows on the Columbia
Source: U.S. Army Corps of Engineers (2016a)
0123456789
10
2007 2008 2009 2010 2011 2012 2013 2014 2015 2016
Shor
t Ton
s (m
illio
ns)
Total Crude Materials Food & Farm Other
0
2
4
6
8
10
12
2007 2008 2009 2010 2011 2012 2013 2014 2015 2016
Shor
t Ton
s (m
illio
ns)
Total Petro & Petro Products Chemicals Crude Materials Other
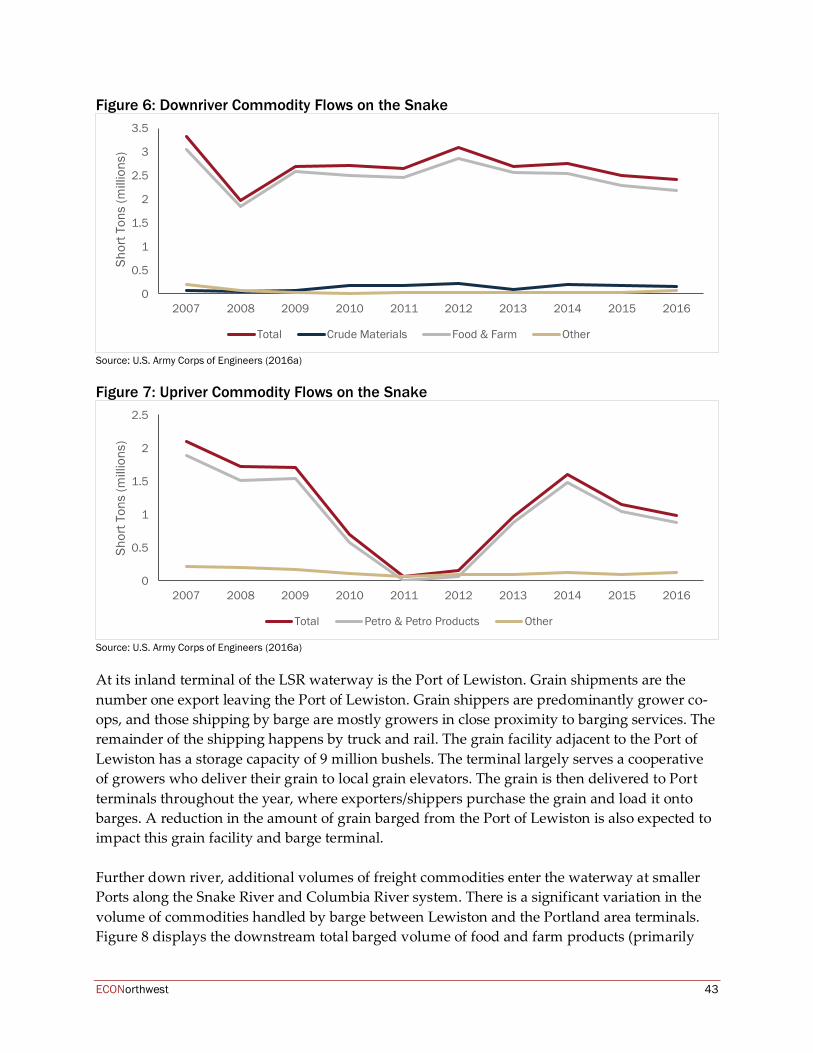
ECONorthwest 43
Figure 6: Downriver Commodity Flows on the Snake
Source: U.S. Army Corps of Engineers (2016a)
Figure 7: Upriver Commodity Flows on the Snake
Source: U.S. Army Corps of Engineers (2016a)
At its inland terminal of the LSR waterway is the Port of Lewiston. Grain shipments are the number one export leaving the Port of Lewiston. Grain shippers are predominantly grower co-ops, and those shipping by barge are mostly growers in close proximity to barging services. The remainder of the shipping happens by truck and rail. The grain facility adjacent to the Port of Lewiston has a storage capacity of 9 million bushels. The terminal largely serves a cooperative of growers who deliver their grain to local grain elevators. The grain is then delivered to Port terminals throughout the year, where exporters/shippers purchase the grain and load it onto barges. A reduction in the amount of grain barged from the Port of Lewiston is also expected to impact this grain facility and barge terminal. Further down river, additional volumes of freight commodities enter the waterway at smaller Ports along the Snake River and Columbia River system. There is a significant variation in the volume of commodities handled by barge between Lewiston and the Portland area terminals. Figure 8 displays the downstream total barged volume of food and farm products (primarily
0
0.5
1
1.5
2
2.5
3
3.5
2007 2008 2009 2010 2011 2012 2013 2014 2015 2016
Shor
t Ton
s (m
illio
ns)
Total Crude Materials Food & Farm Other
0
0.5
1
1.5
2
2.5
2007 2008 2009 2010 2011 2012 2013 2014 2015 2016
Shor
t Ton
s (m
illio
ns)
Total Petro & Petro Products Other
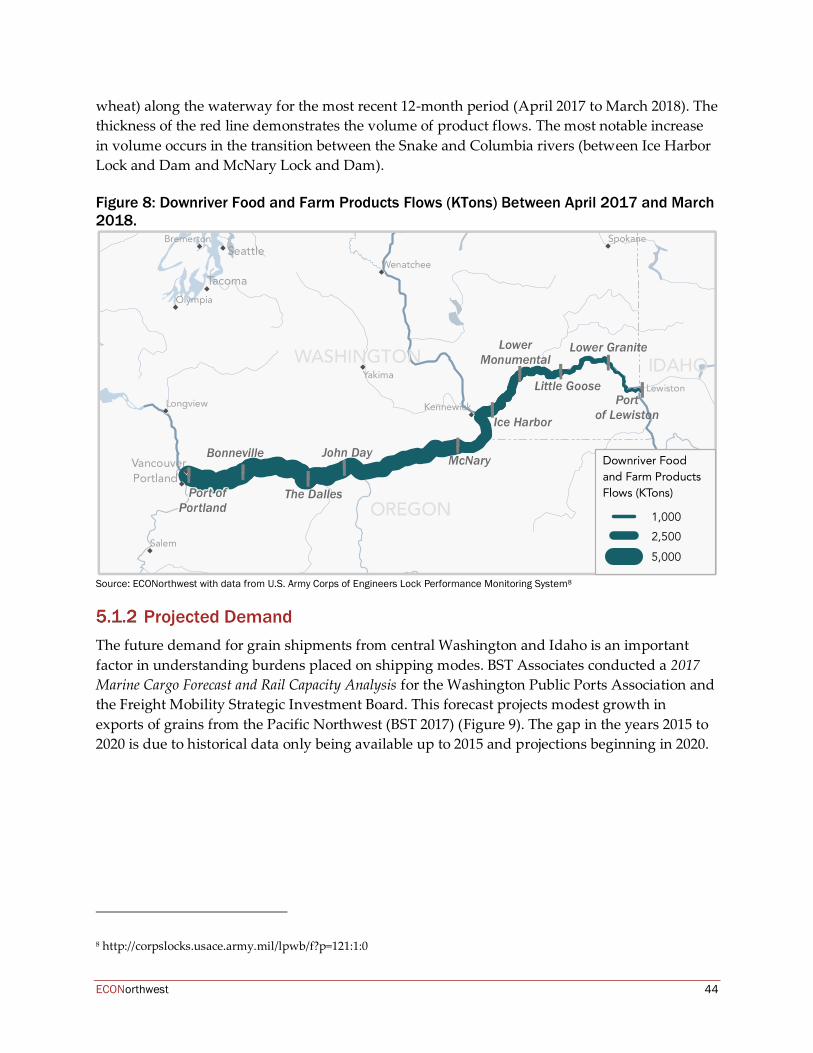
ECONorthwest 44
wheat) along the waterway for the most recent 12-month period (April 2017 to March 2018). The thickness of the red line demonstrates the volume of product flows. The most notable increase in volume occurs in the transition between the Snake and Columbia rivers (between Ice Harbor Lock and Dam and McNary Lock and Dam). Figure 8: Downriver Food and Farm Products Flows (KTons) Between April 2017 and March 2018.
Source: ECONorthwest with data from U.S. Army Corps of Engineers Lock Performance Monitoring System8
Projected Demand The future demand for grain shipments from central Washington and Idaho is an important factor in understanding burdens placed on shipping modes. BST Associates conducted a 2017 Marine Cargo Forecast and Rail Capacity Analysis for the Washington Public Ports Association and the Freight Mobility Strategic Investment Board. This forecast projects modest growth in exports of grains from the Pacific Northwest (BST 2017) (Figure 9). The gap in the years 2015 to 2020 is due to historical data only being available up to 2015 and projections beginning in 2020.
8 http://corpslocks.usace.army.mil/lpwb/f?p=121:1:0
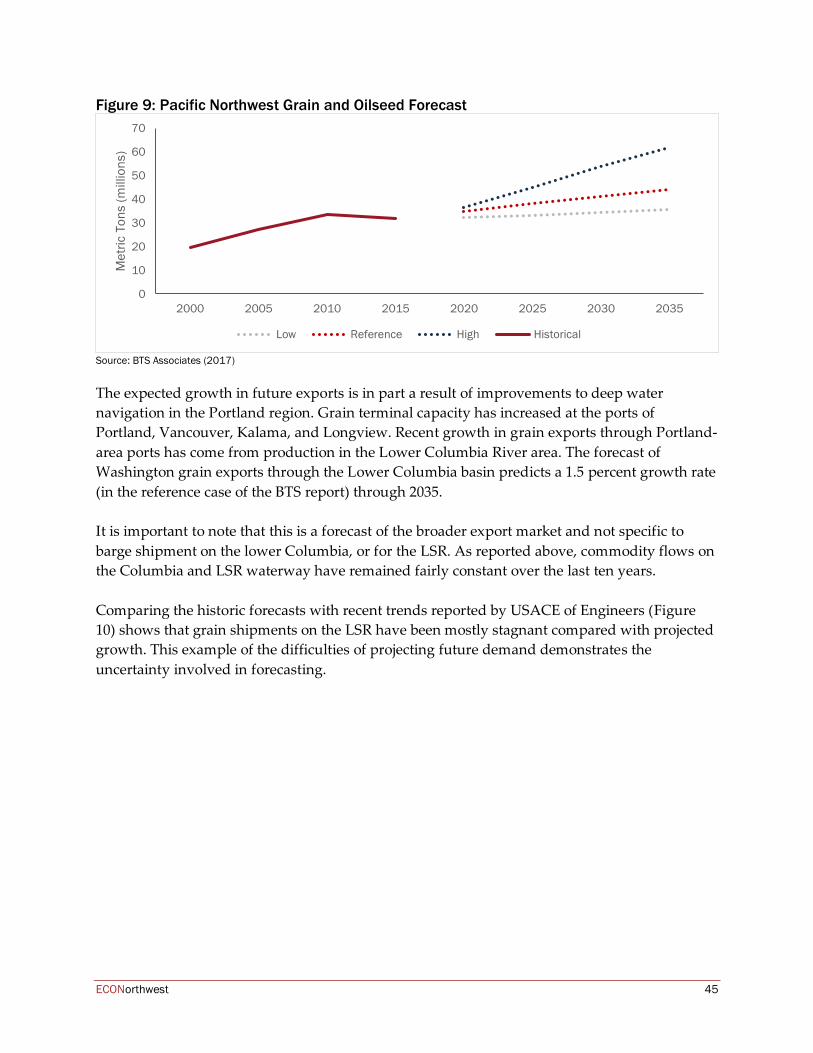
ECONorthwest 45
Figure 9: Pacific Northwest Grain and Oilseed Forecast
Source: BTS Associates (2017)
The expected growth in future exports is in part a result of improvements to deep water navigation in the Portland region. Grain terminal capacity has increased at the ports of Portland, Vancouver, Kalama, and Longview. Recent growth in grain exports through Portland-area ports has come from production in the Lower Columbia River area. The forecast of Washington grain exports through the Lower Columbia basin predicts a 1.5 percent growth rate (in the reference case of the BTS report) through 2035. It is important to note that this is a forecast of the broader export market and not specific to barge shipment on the lower Columbia, or for the LSR. As reported above, commodity flows on the Columbia and LSR waterway have remained fairly constant over the last ten years. Comparing the historic forecasts with recent trends reported by USACE of Engineers (Figure 10) shows that grain shipments on the LSR have been mostly stagnant compared with projected growth. This example of the difficulties of projecting future demand demonstrates the uncertainty involved in forecasting.
0
10
20
30
40
50
60
70
2000 2005 2010 2015 2020 2025 2030 2035
Met
ric T
ons
(mill
ions
)
Low Reference High Historical
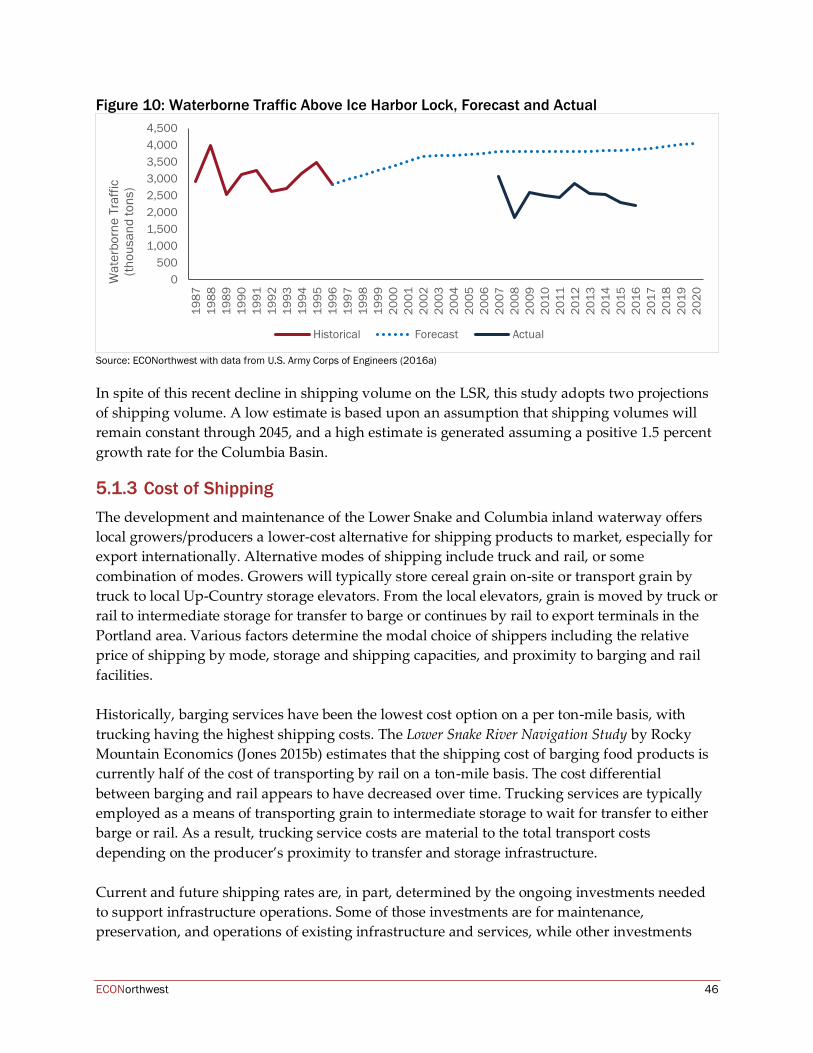
ECONorthwest 46
Figure 10: Waterborne Traffic Above Ice Harbor Lock, Forecast and Actual
Source: ECONorthwest with data from U.S. Army Corps of Engineers (2016a)
In spite of this recent decline in shipping volume on the LSR, this study adopts two projections of shipping volume. A low estimate is based upon an assumption that shipping volumes will remain constant through 2045, and a high estimate is generated assuming a positive 1.5 percent growth rate for the Columbia Basin.
Cost of Shipping The development and maintenance of the Lower Snake and Columbia inland waterway offers local growers/producers a lower-cost alternative for shipping products to market, especially for export internationally. Alternative modes of shipping include truck and rail, or some combination of modes. Growers will typically store cereal grain on-site or transport grain by truck to local Up-Country storage elevators. From the local elevators, grain is moved by truck or rail to intermediate storage for transfer to barge or continues by rail to export terminals in the Portland area. Various factors determine the modal choice of shippers including the relative price of shipping by mode, storage and shipping capacities, and proximity to barging and rail facilities. Historically, barging services have been the lowest cost option on a per ton-mile basis, with trucking having the highest shipping costs. The Lower Snake River Navigation Study by Rocky Mountain Economics (Jones 2015b) estimates that the shipping cost of barging food products is currently half of the cost of transporting by rail on a ton-mile basis. The cost differential between barging and rail appears to have decreased over time. Trucking services are typically employed as a means of transporting grain to intermediate storage to wait for transfer to either barge or rail. As a result, trucking service costs are material to the total transport costs depending on the producer’s proximity to transfer and storage infrastructure. Current and future shipping rates are, in part, determined by the ongoing investments needed to support infrastructure operations. Some of those investments are for maintenance, preservation, and operations of existing infrastructure and services, while other investments
0500
1,0001,5002,0002,5003,0003,5004,0004,500
1987
1988
1989
1990
1991
1992
1993
1994
1995
1996
1997
1998
1999
2000
2001
2002
2003
2004
2005
2006
2007
2008
2009
2010
2011
2012
2013
2014
2015
2016
2017
2018
2019
2020
Wat
erbo
rne
Traf
fic(th
ousa
nd to
ns)
Historical Forecast Actual
ECONorthwest 47
may be needed to address any increase in the demand. In this way, estimating future shipping rates is also dependent on some estimate of future demand by mode relative to that mode’s current shipping capacity.
Inland Waterways Trust Fund The Lower Snake and Columbia River inland waterway are supported by ongoing federal investments in maintenance and operations and major rehabilitation and construction. This federal funding source is known as the Inland Waterways Trust Fund (IWTF) and is funded through a tax on commercial barge diesel fuel. Over recent years federal funding for both construction and operations and maintenance have declined in real terms. The IWTF spending needs have exceeded tax receipts, so stopgap funding was provided by Congress under the American Recovery and Reinvestment Act of 2009. Still, there is a substantial backlog of authorized but unfunded capital projects and insufficient investments in operations and maintenance. In 2014 Congress authorized an increase to the barge fuel tax, but these taxes are restricted to capital investments, necessitating other funds be identified for operations. Approximately 90 percent of the costs for construction, operations, and maintenance of barge navigation infrastructure are paid from general federal tax revenues (NASEM 2015). The federal role and share of responsibility for funding waterborne transportation stands in sharp contrast to other modes (highway, rail, and air) of freight transportation, which have user taxes that cover a much larger portion of O&M costs (Ibid). The allocation of costs for construction of USACE investments is typically established upfront, or in the event of major changes in programs. Cost allocation is mostly relevant in determining how a dam breach might be financed, but allocation rules provide some insight into existing cost responsibility as well. Given the time elapsed since the publication of the EIS, and the various disputes about what costs are allocated to navigation, there is little doubt that the exact navigational cost savings associated with breaching the dams would need to be revisited in some detail.
Lock Maintenance Closures The navigational locks on the Columbia and LSR waterway require periodic maintenance that results in temporary closures and a disruption of barging services. Extended lock outages for maintenance were scheduled between December 2010 and March 2011. The 2010 to 2011 outage halted barge operations on much of the Columbia River and the entirety of the LSR. The Freight Policy Institute found that during the outage over 90 percent of the grain by volume was shipped by rail and that shippers experienced a nearly 40 percent increase in shipping and storage costs. After the outage period was over, the barge shipping volumes returned to normal. These outages demonstrate how the system of barge transport responds when barging in the LSR is eliminated.
ECONorthwest 48
Alternatives to Barging If barging services were not available on the LSR, local producers would need to utilize alternative modes of transporting commodities. These alternatives are currently available and used by some producers already. However, absent a barging option, new demands would be placed on other modes, and in some cases, new investments in shipping capacity would be required. One alternative to barging on the LSR is for local produce to be trucked to the Tri-Cities area for loading on barges at the nearest downstream loading facility. The longer truck shipments for barge access would result in higher total shipping costs for local growers and producers. Additional truck volumes on state highways and local roads would also likely necessitate additional road investments. A study done by HDR for Washington's Legislative Transportation Committee found “severe truck volume increases” would occur into the Tri-Cities region with removal of the LSRD (Fowler 1999). Another alternative to barging is for growers/shippers to truck grain to rail loading facilities for eventual transport to the Portland area export terminals. Railroads can address new demand by either making infrastructure improvements (if needed to serve the new demand) or by raising rates. Rate increases reflect shipper’s willingness to compete for existing transport capacity. Moreover, if economically viable, higher rates will result in new investments in infrastructure and services. Since railroads are privately held, investments in infrastructure are also a private decision not directly influenced by public policy. However, investments in railroad infrastructure would likely include track upgrades, loading facility improvements, and additional rail cars. In 2014 a new investment by two grower co-ops in Whitman County introduced another rail option to the region. The new unit-train loop and shipping facility at McCoy Terminal links to the P&L short line near McCoy (Sage et al. 2015). This line connects to the main line of Burlington Northern Santa Fe Railway and from there to export facilities. Given this potential additional capacity, there is a reason to believe the costs of non-barge transport are now lower compared with the 2002 EIS estimates. In summary, the costs to shippers associated with choosing an alternative to barging is a function of expected relative shipping rates by mode. The changes in rates reflect expected investments in infrastructure and services that support the demands placed on each mode. The base case is one where the ongoing maintenance and operating costs of the dam and lock systems is likely increasing, and where federal funding is also increasingly uncertain. Alternative modes to barging likely require additional investments to address increases in demand. Trucking services make use of public roads where the fees for the use of the roads (taxes on fuels, etc.) typically do not specifically reflect local investment levels. As such these investments may not result in higher costs to shippers. However, roads are congestible assets where the demand placed on them may introduce other costs in the form of congestion and lower levels of service generally that in turn affect the cost to shippers. Railroads are held by
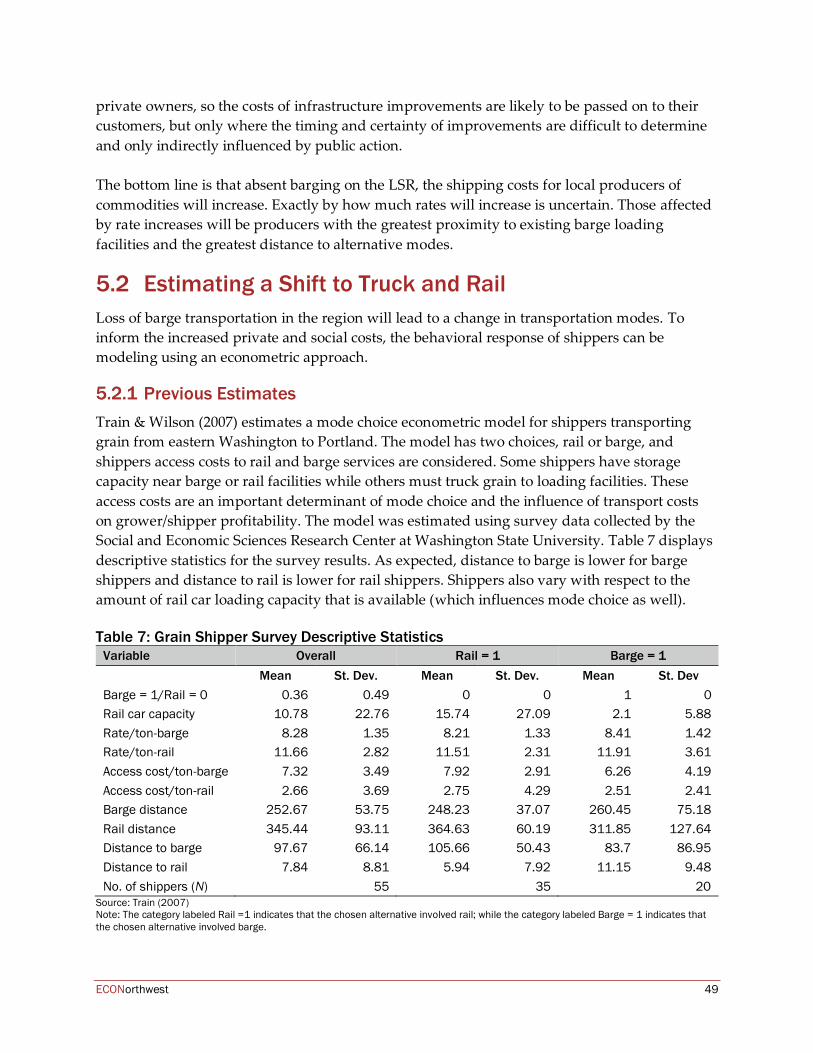
ECONorthwest 49
private owners, so the costs of infrastructure improvements are likely to be passed on to their customers, but only where the timing and certainty of improvements are difficult to determine and only indirectly influenced by public action. The bottom line is that absent barging on the LSR, the shipping costs for local producers of commodities will increase. Exactly by how much rates will increase is uncertain. Those affected by rate increases will be producers with the greatest proximity to existing barge loading facilities and the greatest distance to alternative modes.
5.2 Estimating a Shift to Truck and Rail Loss of barge transportation in the region will lead to a change in transportation modes. To inform the increased private and social costs, the behavioral response of shippers can be modeling using an econometric approach.
Previous Estimates Train & Wilson (2007) estimates a mode choice econometric model for shippers transporting grain from eastern Washington to Portland. The model has two choices, rail or barge, and shippers access costs to rail and barge services are considered. Some shippers have storage capacity near barge or rail facilities while others must truck grain to loading facilities. These access costs are an important determinant of mode choice and the influence of transport costs on grower/shipper profitability. The model was estimated using survey data collected by the Social and Economic Sciences Research Center at Washington State University. Table 7 displays descriptive statistics for the survey results. As expected, distance to barge is lower for barge shippers and distance to rail is lower for rail shippers. Shippers also vary with respect to the amount of rail car loading capacity that is available (which influences mode choice as well). Table 7: Grain Shipper Survey Descriptive Statistics
Variable Overall Rail = 1 Barge = 1 Mean St. Dev. Mean St. Dev. Mean St. Dev Barge = 1/Rail = 0 0.36 0.49 0 0 1 0 Rail car capacity 10.78 22.76 15.74 27.09 2.1 5.88 Rate/ton-barge 8.28 1.35 8.21 1.33 8.41 1.42 Rate/ton-rail 11.66 2.82 11.51 2.31 11.91 3.61 Access cost/ton-barge 7.32 3.49 7.92 2.91 6.26 4.19 Access cost/ton-rail 2.66 3.69 2.75 4.29 2.51 2.41 Barge distance 252.67 53.75 248.23 37.07 260.45 75.18 Rail distance 345.44 93.11 364.63 60.19 311.85 127.64 Distance to barge 97.67 66.14 105.66 50.43 83.7 86.95 Distance to rail 7.84 8.81 5.94 7.92 11.15 9.48 No. of shippers (N) 55 35 20
Source: Train (2007) Note: The category labeled Rail =1 indicates that the chosen alternative involved rail; while the category labeled Barge = 1 indicates that the chosen alternative involved barge.
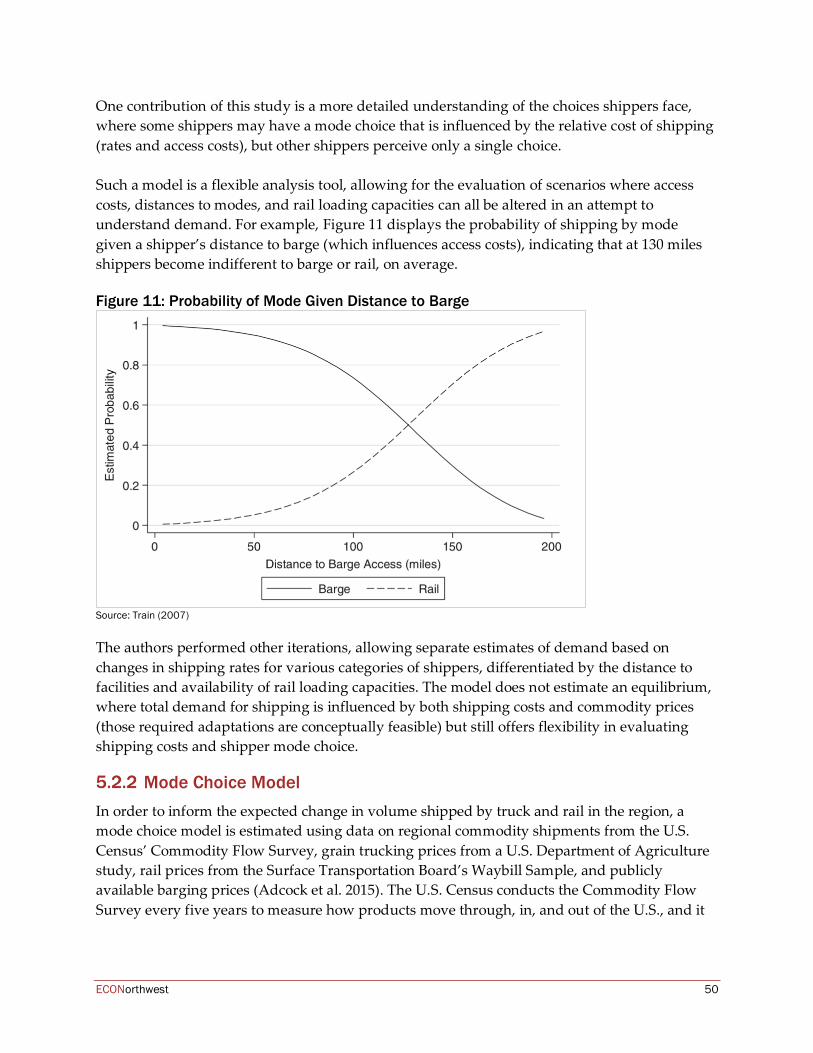
ECONorthwest 50
One contribution of this study is a more detailed understanding of the choices shippers face, where some shippers may have a mode choice that is influenced by the relative cost of shipping (rates and access costs), but other shippers perceive only a single choice. Such a model is a flexible analysis tool, allowing for the evaluation of scenarios where access costs, distances to modes, and rail loading capacities can all be altered in an attempt to understand demand. For example, Figure 11 displays the probability of shipping by mode given a shipper’s distance to barge (which influences access costs), indicating that at 130 miles shippers become indifferent to barge or rail, on average. Figure 11: Probability of Mode Given Distance to Barge
Source: Train (2007)
The authors performed other iterations, allowing separate estimates of demand based on changes in shipping rates for various categories of shippers, differentiated by the distance to facilities and availability of rail loading capacities. The model does not estimate an equilibrium, where total demand for shipping is influenced by both shipping costs and commodity prices (those required adaptations are conceptually feasible) but still offers flexibility in evaluating shipping costs and shipper mode choice.
Mode Choice Model In order to inform the expected change in volume shipped by truck and rail in the region, a mode choice model is estimated using data on regional commodity shipments from the U.S. Census’ Commodity Flow Survey, grain trucking prices from a U.S. Department of Agriculture study, rail prices from the Surface Transportation Board’s Waybill Sample, and publicly available barging prices (Adcock et al. 2015). The U.S. Census conducts the Commodity Flow Survey every five years to measure how products move through, in, and out of the U.S., and it
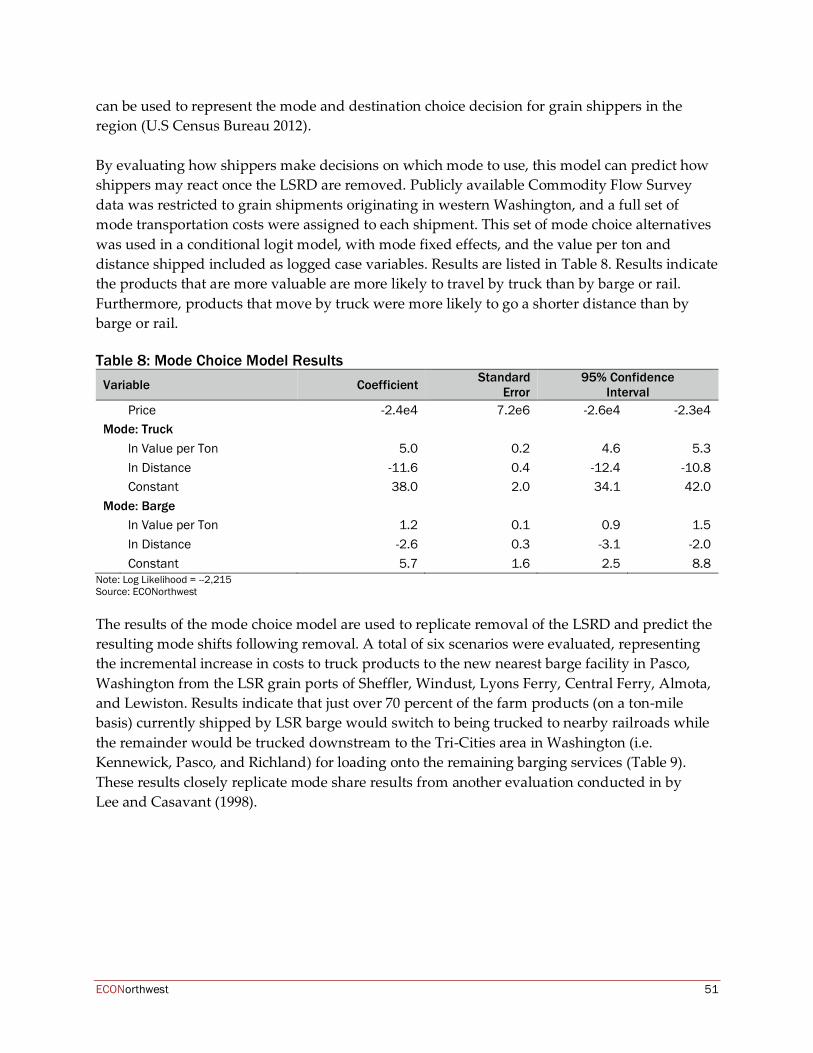
ECONorthwest 51
can be used to represent the mode and destination choice decision for grain shippers in the region (U.S Census Bureau 2012). By evaluating how shippers make decisions on which mode to use, this model can predict how shippers may react once the LSRD are removed. Publicly available Commodity Flow Survey data was restricted to grain shipments originating in western Washington, and a full set of mode transportation costs were assigned to each shipment. This set of mode choice alternatives was used in a conditional logit model, with mode fixed effects, and the value per ton and distance shipped included as logged case variables. Results are listed in Table 8. Results indicate the products that are more valuable are more likely to travel by truck than by barge or rail. Furthermore, products that move by truck were more likely to go a shorter distance than by barge or rail. Table 8: Mode Choice Model Results
Variable Coefficient Standard Error
95% Confidence Interval
Price -2.4e4 7.2e6 -2.6e4 -2.3e4 Mode: Truck ln Value per Ton 5.0 0.2 4.6 5.3 ln Distance -11.6 0.4 -12.4 -10.8 Constant 38.0 2.0 34.1 42.0 Mode: Barge ln Value per Ton 1.2 0.1 0.9 1.5 ln Distance -2.6 0.3 -3.1 -2.0 Constant 5.7 1.6 2.5 8.8
Note: Log Likelihood = --2,215 Source: ECONorthwest
The results of the mode choice model are used to replicate removal of the LSRD and predict the resulting mode shifts following removal. A total of six scenarios were evaluated, representing the incremental increase in costs to truck products to the new nearest barge facility in Pasco, Washington from the LSR grain ports of Sheffler, Windust, Lyons Ferry, Central Ferry, Almota, and Lewiston. Results indicate that just over 70 percent of the farm products (on a ton-mile basis) currently shipped by LSR barge would switch to being trucked to nearby railroads while the remainder would be trucked downstream to the Tri-Cities area in Washington (i.e. Kennewick, Pasco, and Richland) for loading onto the remaining barging services (Table 9). These results closely replicate mode share results from another evaluation conducted in by Lee and Casavant (1998).
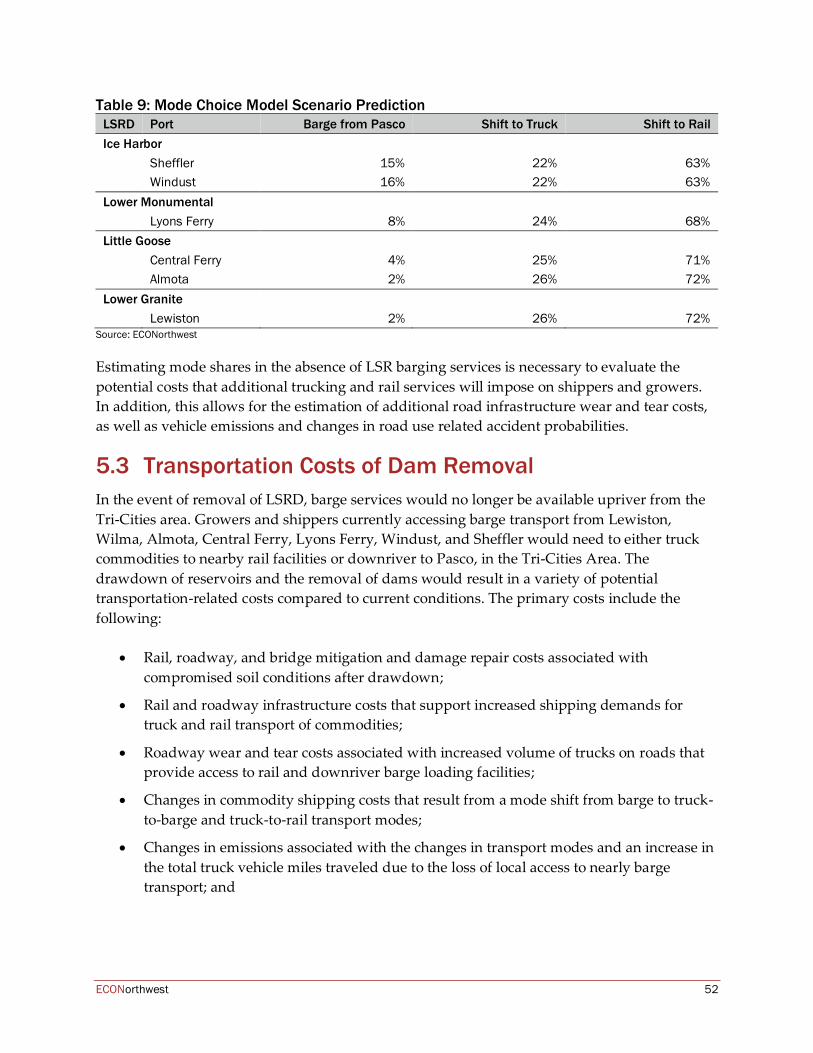
ECONorthwest 52
Table 9: Mode Choice Model Scenario Prediction LSRD Port Barge from Pasco Shift to Truck Shift to Rail Ice Harbor Sheffler 15% 22% 63% Windust 16% 22% 63% Lower Monumental Lyons Ferry 8% 24% 68% Little Goose Central Ferry 4% 25% 71% Almota 2% 26% 72% Lower Granite Lewiston 2% 26% 72%
Source: ECONorthwest
Estimating mode shares in the absence of LSR barging services is necessary to evaluate the potential costs that additional trucking and rail services will impose on shippers and growers. In addition, this allows for the estimation of additional road infrastructure wear and tear costs, as well as vehicle emissions and changes in road use related accident probabilities.
5.3 Transportation Costs of Dam Removal In the event of removal of LSRD, barge services would no longer be available upriver from the Tri-Cities area. Growers and shippers currently accessing barge transport from Lewiston, Wilma, Almota, Central Ferry, Lyons Ferry, Windust, and Sheffler would need to either truck commodities to nearby rail facilities or downriver to Pasco, in the Tri-Cities Area. The drawdown of reservoirs and the removal of dams would result in a variety of potential transportation-related costs compared to current conditions. The primary costs include the following:
• Rail, roadway, and bridge mitigation and damage repair costs associated with compromised soil conditions after drawdown;
• Rail and roadway infrastructure costs that support increased shipping demands for truck and rail transport of commodities;
• Roadway wear and tear costs associated with increased volume of trucks on roads that provide access to rail and downriver barge loading facilities;
• Changes in commodity shipping costs that result from a mode shift from barge to truck-to-barge and truck-to-rail transport modes;
• Changes in emissions associated with the changes in transport modes and an increase in the total truck vehicle miles traveled due to the loss of local access to nearly barge transport; and
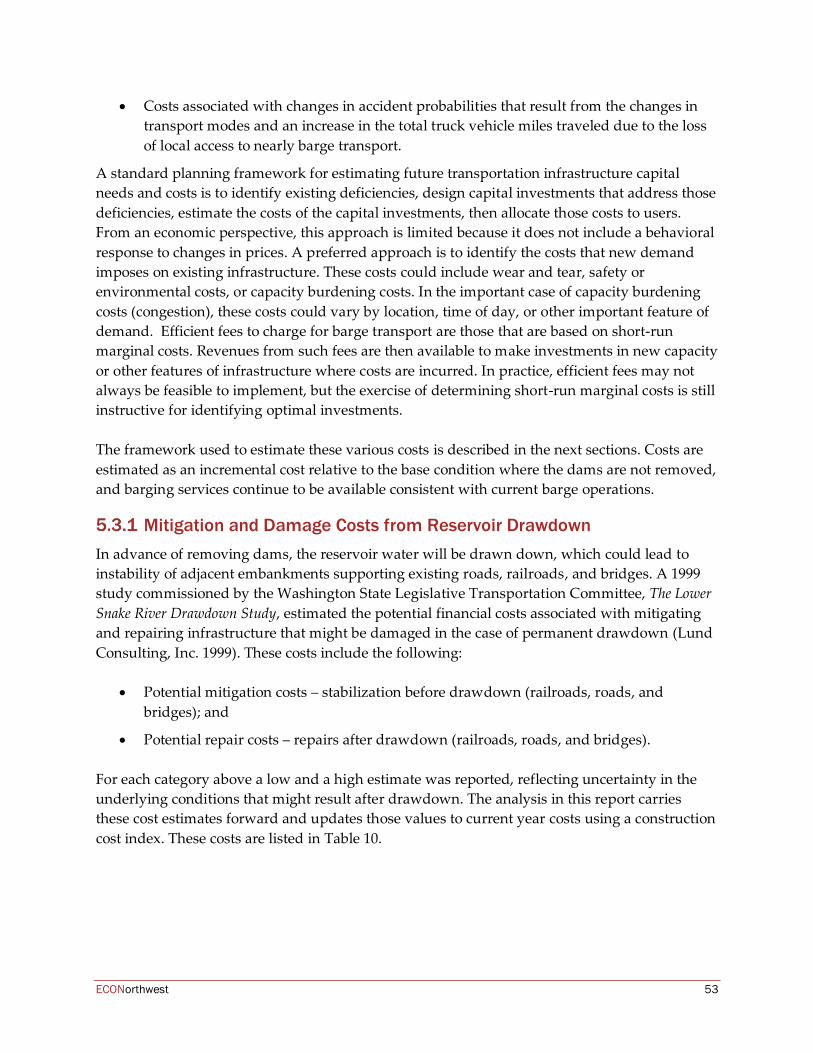
ECONorthwest 53
• Costs associated with changes in accident probabilities that result from the changes in transport modes and an increase in the total truck vehicle miles traveled due to the loss of local access to nearly barge transport.
A standard planning framework for estimating future transportation infrastructure capital needs and costs is to identify existing deficiencies, design capital investments that address those deficiencies, estimate the costs of the capital investments, then allocate those costs to users. From an economic perspective, this approach is limited because it does not include a behavioral response to changes in prices. A preferred approach is to identify the costs that new demand imposes on existing infrastructure. These costs could include wear and tear, safety or environmental costs, or capacity burdening costs. In the important case of capacity burdening costs (congestion), these costs could vary by location, time of day, or other important feature of demand. Efficient fees to charge for barge transport are those that are based on short-run marginal costs. Revenues from such fees are then available to make investments in new capacity or other features of infrastructure where costs are incurred. In practice, efficient fees may not always be feasible to implement, but the exercise of determining short-run marginal costs is still instructive for identifying optimal investments. The framework used to estimate these various costs is described in the next sections. Costs are estimated as an incremental cost relative to the base condition where the dams are not removed, and barging services continue to be available consistent with current barge operations.
Mitigation and Damage Costs from Reservoir Drawdown In advance of removing dams, the reservoir water will be drawn down, which could lead to instability of adjacent embankments supporting existing roads, railroads, and bridges. A 1999 study commissioned by the Washington State Legislative Transportation Committee, The Lower Snake River Drawdown Study, estimated the potential financial costs associated with mitigating and repairing infrastructure that might be damaged in the case of permanent drawdown (Lund Consulting, Inc. 1999). These costs include the following:
• Potential mitigation costs – stabilization before drawdown (railroads, roads, and bridges); and
• Potential repair costs – repairs after drawdown (railroads, roads, and bridges). For each category above a low and a high estimate was reported, reflecting uncertainty in the underlying conditions that might result after drawdown. The analysis in this report carries these cost estimates forward and updates those values to current year costs using a construction cost index. These costs are listed in Table 10.
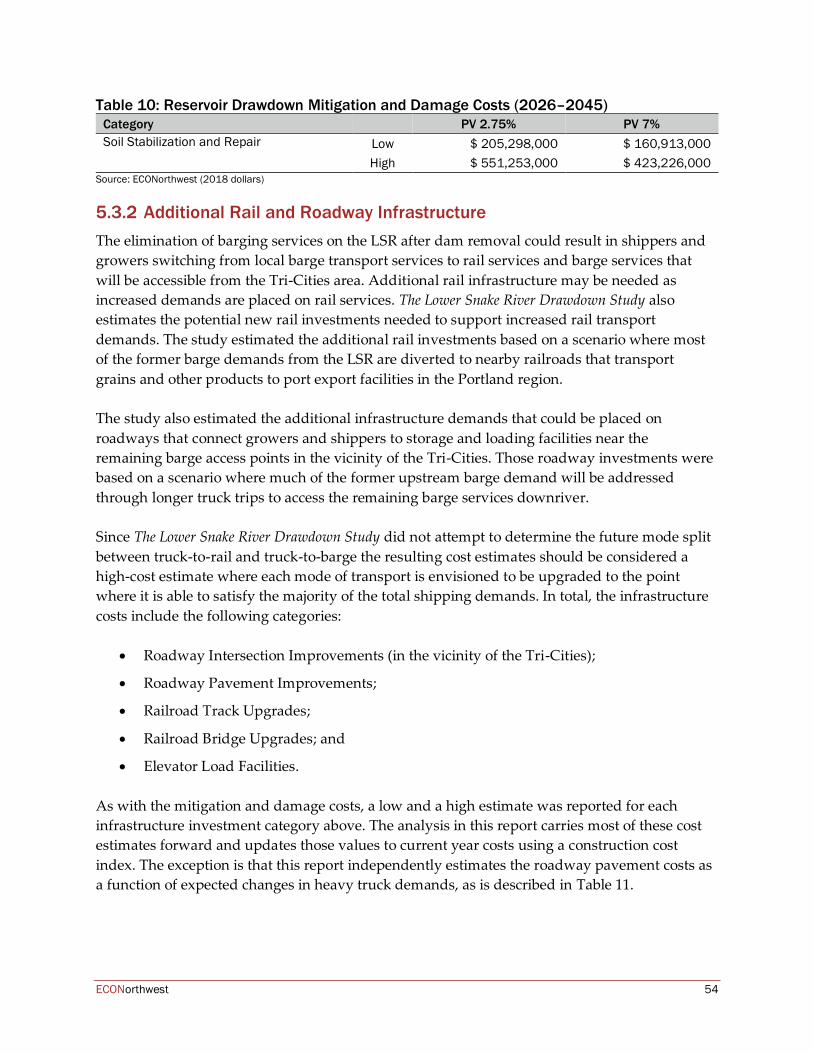
ECONorthwest 54
Table 10: Reservoir Drawdown Mitigation and Damage Costs (2026–2045) Category PV 2.75% PV 7% Soil Stabilization and Repair Low $ 205,298,000 $ 160,913,000
High $ 551,253,000 $ 423,226,000 Source: ECONorthwest (2018 dollars)
Additional Rail and Roadway Infrastructure The elimination of barging services on the LSR after dam removal could result in shippers and growers switching from local barge transport services to rail services and barge services that will be accessible from the Tri-Cities area. Additional rail infrastructure may be needed as increased demands are placed on rail services. The Lower Snake River Drawdown Study also estimates the potential new rail investments needed to support increased rail transport demands. The study estimated the additional rail investments based on a scenario where most of the former barge demands from the LSR are diverted to nearby railroads that transport grains and other products to port export facilities in the Portland region. The study also estimated the additional infrastructure demands that could be placed on roadways that connect growers and shippers to storage and loading facilities near the remaining barge access points in the vicinity of the Tri-Cities. Those roadway investments were based on a scenario where much of the former upstream barge demand will be addressed through longer truck trips to access the remaining barge services downriver. Since The Lower Snake River Drawdown Study did not attempt to determine the future mode split between truck-to-rail and truck-to-barge the resulting cost estimates should be considered a high-cost estimate where each mode of transport is envisioned to be upgraded to the point where it is able to satisfy the majority of the total shipping demands. In total, the infrastructure costs include the following categories:
• Roadway Intersection Improvements (in the vicinity of the Tri-Cities);
• Roadway Pavement Improvements;
• Railroad Track Upgrades;
• Railroad Bridge Upgrades; and
• Elevator Load Facilities.
As with the mitigation and damage costs, a low and a high estimate was reported for each infrastructure investment category above. The analysis in this report carries most of these cost estimates forward and updates those values to current year costs using a construction cost index. The exception is that this report independently estimates the roadway pavement costs as a function of expected changes in heavy truck demands, as is described in Table 11.
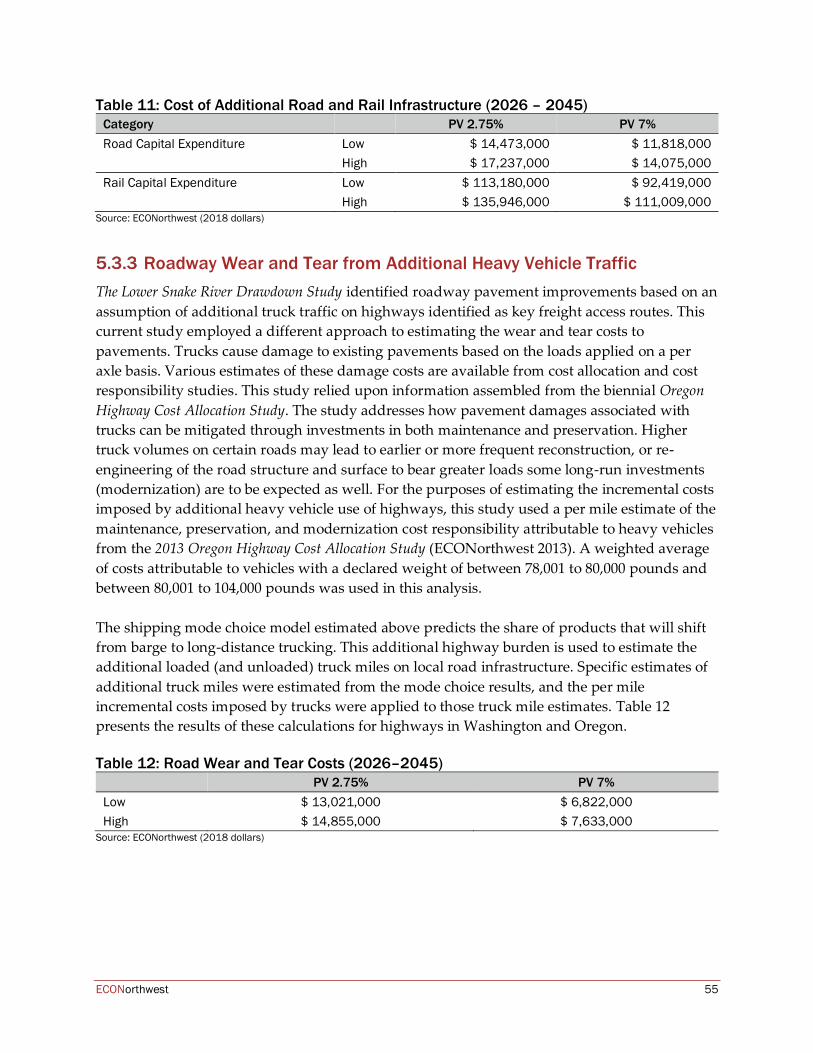
ECONorthwest 55
Table 11: Cost of Additional Road and Rail Infrastructure (2026 – 2045) Category PV 2.75% PV 7% Road Capital Expenditure Low $ 14,473,000 $ 11,818,000 High $ 17,237,000 $ 14,075,000 Rail Capital Expenditure Low $ 113,180,000 $ 92,419,000 High $ 135,946,000 $ 111,009,000
Source: ECONorthwest (2018 dollars)
Roadway Wear and Tear from Additional Heavy Vehicle Traffic The Lower Snake River Drawdown Study identified roadway pavement improvements based on an assumption of additional truck traffic on highways identified as key freight access routes. This current study employed a different approach to estimating the wear and tear costs to pavements. Trucks cause damage to existing pavements based on the loads applied on a per axle basis. Various estimates of these damage costs are available from cost allocation and cost responsibility studies. This study relied upon information assembled from the biennial Oregon Highway Cost Allocation Study. The study addresses how pavement damages associated with trucks can be mitigated through investments in both maintenance and preservation. Higher truck volumes on certain roads may lead to earlier or more frequent reconstruction, or re-engineering of the road structure and surface to bear greater loads some long-run investments (modernization) are to be expected as well. For the purposes of estimating the incremental costs imposed by additional heavy vehicle use of highways, this study used a per mile estimate of the maintenance, preservation, and modernization cost responsibility attributable to heavy vehicles from the 2013 Oregon Highway Cost Allocation Study (ECONorthwest 2013). A weighted average of costs attributable to vehicles with a declared weight of between 78,001 to 80,000 pounds and between 80,001 to 104,000 pounds was used in this analysis. The shipping mode choice model estimated above predicts the share of products that will shift from barge to long-distance trucking. This additional highway burden is used to estimate the additional loaded (and unloaded) truck miles on local road infrastructure. Specific estimates of additional truck miles were estimated from the mode choice results, and the per mile incremental costs imposed by trucks were applied to those truck mile estimates. Table 12 presents the results of these calculations for highways in Washington and Oregon. Table 12: Road Wear and Tear Costs (2026–2045)
PV 2.75% PV 7% Low $ 13,021,000 $ 6,822,000 High $ 14,855,000 $ 7,633,000
Source: ECONorthwest (2018 dollars)
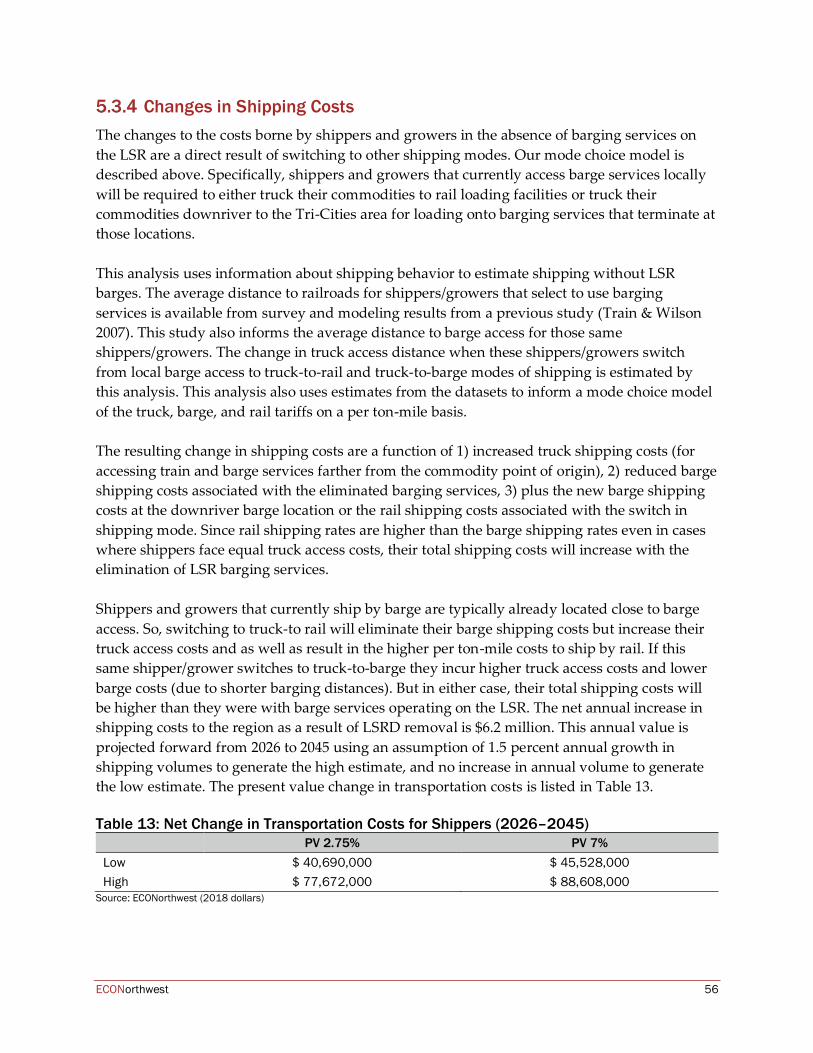
ECONorthwest 56
Changes in Shipping Costs The changes to the costs borne by shippers and growers in the absence of barging services on the LSR are a direct result of switching to other shipping modes. Our mode choice model is described above. Specifically, shippers and growers that currently access barge services locally will be required to either truck their commodities to rail loading facilities or truck their commodities downriver to the Tri-Cities area for loading onto barging services that terminate at those locations. This analysis uses information about shipping behavior to estimate shipping without LSR barges. The average distance to railroads for shippers/growers that select to use barging services is available from survey and modeling results from a previous study (Train & Wilson 2007). This study also informs the average distance to barge access for those same shippers/growers. The change in truck access distance when these shippers/growers switch from local barge access to truck-to-rail and truck-to-barge modes of shipping is estimated by this analysis. This analysis also uses estimates from the datasets to inform a mode choice model of the truck, barge, and rail tariffs on a per ton-mile basis. The resulting change in shipping costs are a function of 1) increased truck shipping costs (for accessing train and barge services farther from the commodity point of origin), 2) reduced barge shipping costs associated with the eliminated barging services, 3) plus the new barge shipping costs at the downriver barge location or the rail shipping costs associated with the switch in shipping mode. Since rail shipping rates are higher than the barge shipping rates even in cases where shippers face equal truck access costs, their total shipping costs will increase with the elimination of LSR barging services. Shippers and growers that currently ship by barge are typically already located close to barge access. So, switching to truck-to rail will eliminate their barge shipping costs but increase their truck access costs and as well as result in the higher per ton-mile costs to ship by rail. If this same shipper/grower switches to truck-to-barge they incur higher truck access costs and lower barge costs (due to shorter barging distances). But in either case, their total shipping costs will be higher than they were with barge services operating on the LSR. The net annual increase in shipping costs to the region as a result of LSRD removal is $6.2 million. This annual value is projected forward from 2026 to 2045 using an assumption of 1.5 percent annual growth in shipping volumes to generate the high estimate, and no increase in annual volume to generate the low estimate. The present value change in transportation costs is listed in Table 13. Table 13: Net Change in Transportation Costs for Shippers (2026–2045)
PV 2.75% PV 7% Low $ 40,690,000 $ 45,528,000 High $ 77,672,000 $ 88,608,000
Source: ECONorthwest (2018 dollars)
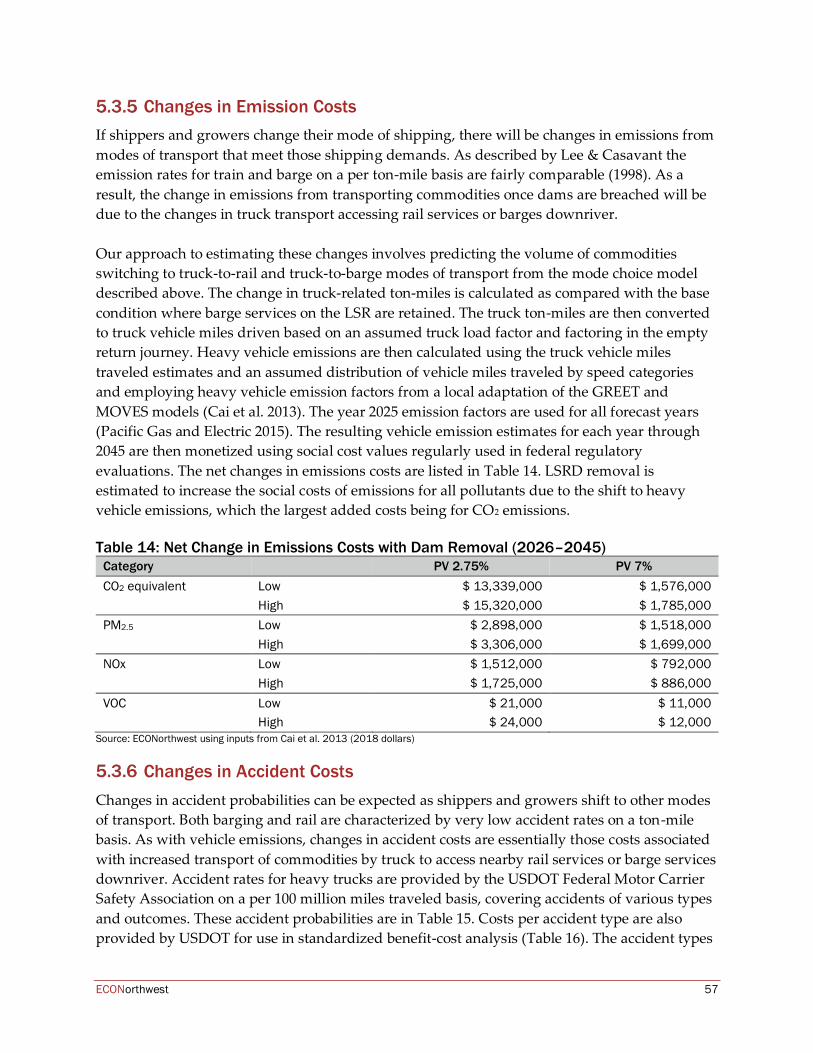
ECONorthwest 57
Changes in Emission Costs If shippers and growers change their mode of shipping, there will be changes in emissions from modes of transport that meet those shipping demands. As described by Lee & Casavant the emission rates for train and barge on a per ton-mile basis are fairly comparable (1998). As a result, the change in emissions from transporting commodities once dams are breached will be due to the changes in truck transport accessing rail services or barges downriver. Our approach to estimating these changes involves predicting the volume of commodities switching to truck-to-rail and truck-to-barge modes of transport from the mode choice model described above. The change in truck-related ton-miles is calculated as compared with the base condition where barge services on the LSR are retained. The truck ton-miles are then converted to truck vehicle miles driven based on an assumed truck load factor and factoring in the empty return journey. Heavy vehicle emissions are then calculated using the truck vehicle miles traveled estimates and an assumed distribution of vehicle miles traveled by speed categories and employing heavy vehicle emission factors from a local adaptation of the GREET and MOVES models (Cai et al. 2013). The year 2025 emission factors are used for all forecast years (Pacific Gas and Electric 2015). The resulting vehicle emission estimates for each year through 2045 are then monetized using social cost values regularly used in federal regulatory evaluations. The net changes in emissions costs are listed in Table 14. LSRD removal is estimated to increase the social costs of emissions for all pollutants due to the shift to heavy vehicle emissions, which the largest added costs being for CO2 emissions. Table 14: Net Change in Emissions Costs with Dam Removal (2026–2045)
Category PV 2.75% PV 7% CO2 equivalent Low $ 13,339,000 $ 1,576,000 High $ 15,320,000 $ 1,785,000 PM2.5 Low $ 2,898,000 $ 1,518,000 High $ 3,306,000 $ 1,699,000 NOx Low $ 1,512,000 $ 792,000 High $ 1,725,000 $ 886,000 VOC Low $ 21,000 $ 11,000 High $ 24,000 $ 12,000
Source: ECONorthwest using inputs from Cai et al. 2013 (2018 dollars)
Changes in Accident Costs Changes in accident probabilities can be expected as shippers and growers shift to other modes of transport. Both barging and rail are characterized by very low accident rates on a ton-mile basis. As with vehicle emissions, changes in accident costs are essentially those costs associated with increased transport of commodities by truck to access nearby rail services or barge services downriver. Accident rates for heavy trucks are provided by the USDOT Federal Motor Carrier Safety Association on a per 100 million miles traveled basis, covering accidents of various types and outcomes. These accident probabilities are in Table 15. Costs per accident type are also provided by USDOT for use in standardized benefit-cost analysis (Table 16). The accident types
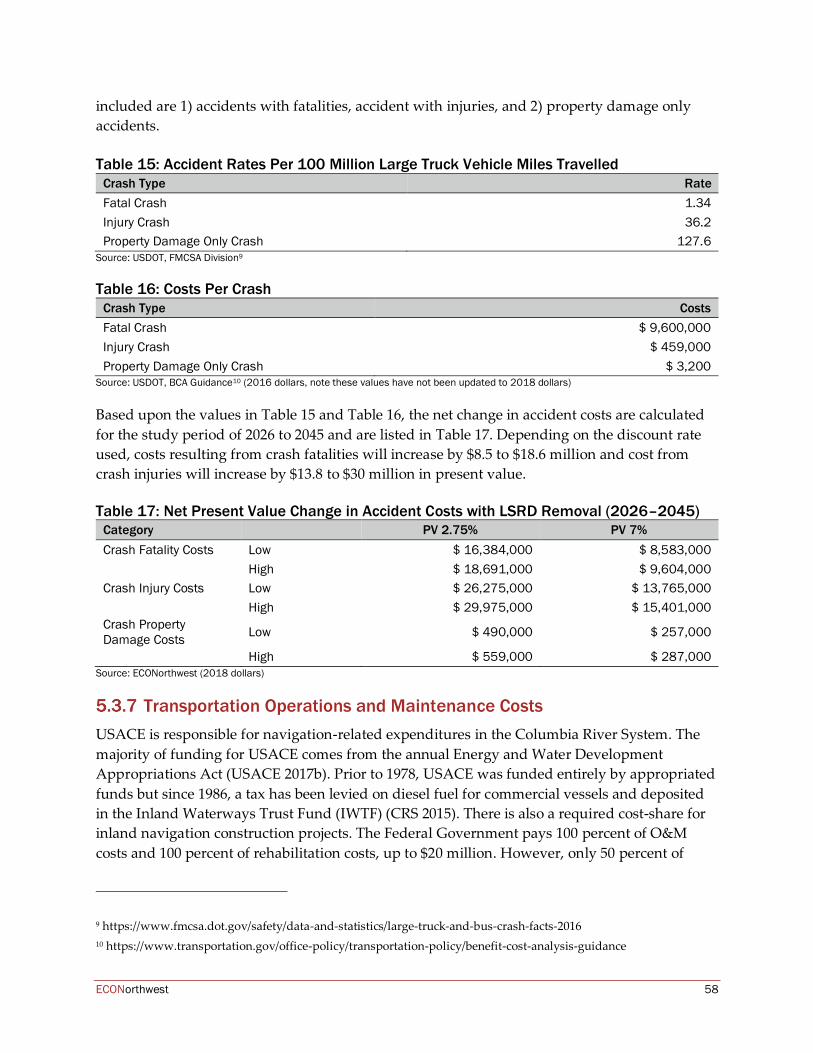
ECONorthwest 58
included are 1) accidents with fatalities, accident with injuries, and 2) property damage only accidents. Table 15: Accident Rates Per 100 Million Large Truck Vehicle Miles Travelled
Crash Type Rate Fatal Crash 1.34 Injury Crash 36.2 Property Damage Only Crash 127.6
Source: USDOT, FMCSA Division9
Table 16: Costs Per Crash Crash Type Costs Fatal Crash $ 9,600,000 Injury Crash $ 459,000 Property Damage Only Crash $ 3,200
Source: USDOT, BCA Guidance10 (2016 dollars, note these values have not been updated to 2018 dollars)
Based upon the values in Table 15 and Table 16, the net change in accident costs are calculated for the study period of 2026 to 2045 and are listed in Table 17. Depending on the discount rate used, costs resulting from crash fatalities will increase by $8.5 to $18.6 million and cost from crash injuries will increase by $13.8 to $30 million in present value. Table 17: Net Present Value Change in Accident Costs with LSRD Removal (2026–2045)
Category PV 2.75% PV 7% Crash Fatality Costs Low $ 16,384,000 $ 8,583,000 High $ 18,691,000 $ 9,604,000 Crash Injury Costs Low $ 26,275,000 $ 13,765,000 High $ 29,975,000 $ 15,401,000 Crash Property Damage Costs Low $ 490,000 $ 257,000
High $ 559,000 $ 287,000 Source: ECONorthwest (2018 dollars)
Transportation Operations and Maintenance Costs USACE is responsible for navigation-related expenditures in the Columbia River System. The majority of funding for USACE comes from the annual Energy and Water Development Appropriations Act (USACE 2017b). Prior to 1978, USACE was funded entirely by appropriated funds but since 1986, a tax has been levied on diesel fuel for commercial vessels and deposited in the Inland Waterways Trust Fund (IWTF) (CRS 2015). There is also a required cost-share for inland navigation construction projects. The Federal Government pays 100 percent of O&M costs and 100 percent of rehabilitation costs, up to $20 million. However, only 50 percent of
9 https://www.fmcsa.dot.gov/safety/data-and-statistics/large-truck-and-bus-crash-facts-2016 10 https://www.transportation.gov/office-policy/transportation-policy/benefit-cost-analysis-guidance
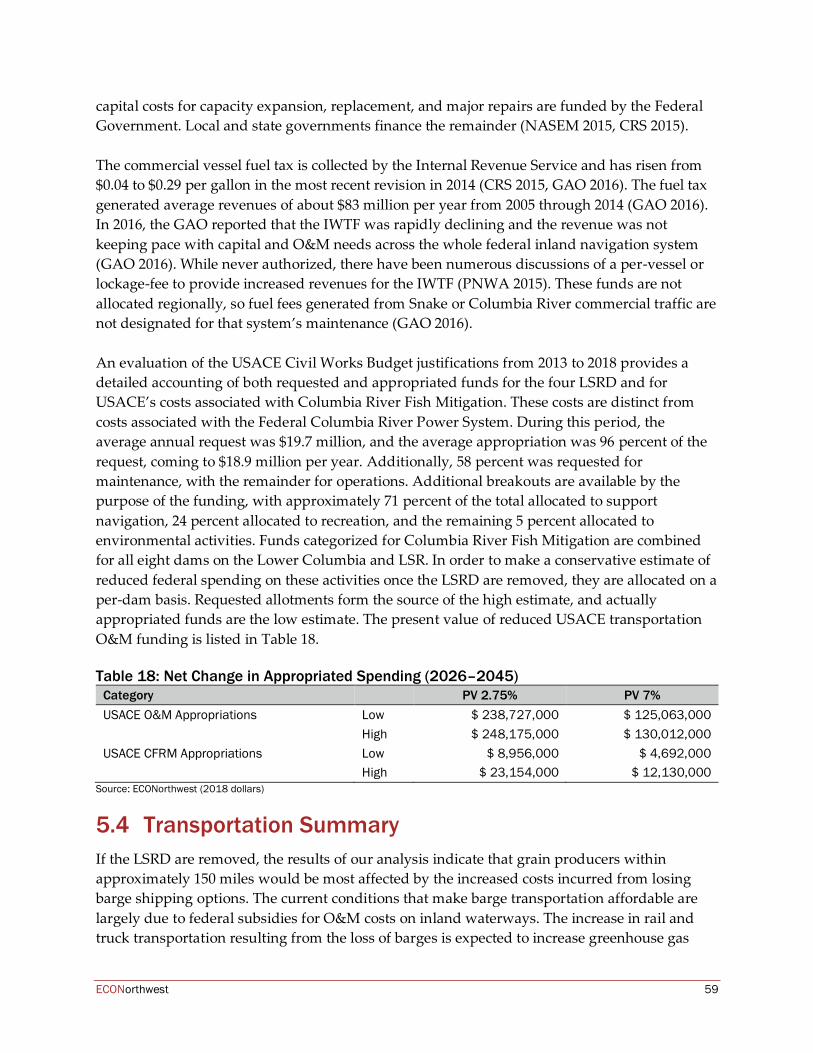
ECONorthwest 59
capital costs for capacity expansion, replacement, and major repairs are funded by the Federal Government. Local and state governments finance the remainder (NASEM 2015, CRS 2015). The commercial vessel fuel tax is collected by the Internal Revenue Service and has risen from $0.04 to $0.29 per gallon in the most recent revision in 2014 (CRS 2015, GAO 2016). The fuel tax generated average revenues of about $83 million per year from 2005 through 2014 (GAO 2016). In 2016, the GAO reported that the IWTF was rapidly declining and the revenue was not keeping pace with capital and O&M needs across the whole federal inland navigation system (GAO 2016). While never authorized, there have been numerous discussions of a per-vessel or lockage-fee to provide increased revenues for the IWTF (PNWA 2015). These funds are not allocated regionally, so fuel fees generated from Snake or Columbia River commercial traffic are not designated for that system’s maintenance (GAO 2016). An evaluation of the USACE Civil Works Budget justifications from 2013 to 2018 provides a detailed accounting of both requested and appropriated funds for the four LSRD and for USACE’s costs associated with Columbia River Fish Mitigation. These costs are distinct from costs associated with the Federal Columbia River Power System. During this period, the average annual request was $19.7 million, and the average appropriation was 96 percent of the request, coming to $18.9 million per year. Additionally, 58 percent was requested for maintenance, with the remainder for operations. Additional breakouts are available by the purpose of the funding, with approximately 71 percent of the total allocated to support navigation, 24 percent allocated to recreation, and the remaining 5 percent allocated to environmental activities. Funds categorized for Columbia River Fish Mitigation are combined for all eight dams on the Lower Columbia and LSR. In order to make a conservative estimate of reduced federal spending on these activities once the LSRD are removed, they are allocated on a per-dam basis. Requested allotments form the source of the high estimate, and actually appropriated funds are the low estimate. The present value of reduced USACE transportation O&M funding is listed in Table 18. Table 18: Net Change in Appropriated Spending (2026–2045)
Category PV 2.75% PV 7% USACE O&M Appropriations Low $ 238,727,000 $ 125,063,000 High $ 248,175,000 $ 130,012,000 USACE CFRM Appropriations Low $ 8,956,000 $ 4,692,000 High $ 23,154,000 $ 12,130,000
Source: ECONorthwest (2018 dollars)
5.4 Transportation Summary If the LSRD are removed, the results of our analysis indicate that grain producers within approximately 150 miles would be most affected by the increased costs incurred from losing barge shipping options. The current conditions that make barge transportation affordable are largely due to federal subsidies for O&M costs on inland waterways. The increase in rail and truck transportation resulting from the loss of barges is expected to increase greenhouse gas

ECONorthwest 60
emissions and accident costs due to the higher levels associated with these forms of transport. The projected increased demand for barge transport through 2035 is anticipated to be minimal but could exacerbate the effects of lost barge transport.
ECONorthwest 61
6 Irrigation and Water Supply The LSRD influence water availability for out-of-stream users by regulating downstream flows, changing the timing of water availability, and creating higher water pool elevations behind each dam compared with an undammed river. Furthermore, these heightened pool levels provide increased opportunity for groundwater infiltration, affecting the aquifer volumes and levels in the vicinity of the LSR. In addition to affecting water supply along the LSR, as a tributary to the Columbia River the LSR contributes to water used by municipalities including the Tri-Cities of Richland, Pasco, and Kennewick, as well as West Richland and downstream irrigators along the mainstem Columbia. Water supply is expected to become more scarce in the Columbia River Basin due to climate change and increasing population-driven demand (WA DOE 2016). Water that is not withdrawn provides instream benefits, particularly during warm summer periods of low flows when agricultural irrigation withdrawals are most concentrated. Downstream of the LSR, increasing water scarcity has motivated efforts to pump and store water from the mainstem Columbia River in the Walla Walla River Basin, Umatilla Basin, and the Horse Heaven region (Plaven 2017; Aspect & Anchor QEA 2012). For example, the Switzler Reservoir project under review by the Washington Department of Ecology is explicitly designed to store Columbia River water for summer irrigation use. This storage demonstrates demand for increased mainstem flows for the purpose of irrigation withdrawals downstream of the LSRD. Consequently, it is likely that any surplus water made available by a decrease in irrigation water withdrawal in the LSR due to dam removal could and would lead to increased usage downstream. Downstream consumption of water currently used for irrigation along the LSR could generate serious distributional effects in terms of downstream irrigation “winners” and upstream “losers”. Although distributional impacts could unequally harm current LSR water users, the overall net social benefits and economic activity are expected to remain relatively constant with dam removal since any water that was no longer used along the LSR is expected to be used downstream. Sale of water rights could mitigate the adverse distributional effects for the LSR irrigators if downstream users must purchase or seasonally lease water rights from the upstream water right holders as part of dam removal water right management. It is not easy to predict the overall effect of LSRD removal on water use, because the dams are not managed for water withdrawal purposes and the response would likely vary annually and by user. Of those withdrawing water that would be negatively affected, the best response could also vary. For any particular farmer, dam removal could have a number of potential outcomes:
• No interruption in water supply, any years;
• Interruption in water supply during drought years;
ECONorthwest 62
• Interruption in water supply only at lowest seasonal flows (late summer to early fall); or
• Total loss of access to water supply. Facing any of these interruptions, farmers would similarly have multiple options to address water constraints:
• Invest in infrastructure to restore permanent water access. This could be via surface water transport including purchase from others or coordination with others, extension of existing wells (well deepening), or new wells;
• Change crops to accommodate new water supply;
• Fallow during periods of water interruption; or
• Sell water rights to other users.
Farmers are accustomed to adapting crop choice and operations (e.g. groundwater, other storage) in response to changing market conditions. Some degree of crop shifting or accessing alternative water sources would likely be within the means of farmers in the area. There is also the potential that some farmers would relocate operations to areas of greater water availability. However, these decisions would result in higher costs for these farmers. This section focuses on the current water users and the effects for them, rather than other potential downstream beneficiaries. Initially, this analysis reviews the status of supply and demand for water in the region. It then considers the costs of adapting local irrigation systems to post-removal LSRD conditions to keep current irrigators at their current level of water use. Finally, it estimates the costs of loss of this water supply to farmers if they cannot or do not adapt irrigation systems. It is important to note that these analyses of adaptation costs and effects on farmers of non-adaptation are preliminary and any definitive analysis would require extensive modeling to predict hydrologic conditions with dam removal, and assessments for each withdrawal point and well. Furthermore, these are two separate approaches to calculating the costs to current irrigators, and are not additive (doing so would be double-counting). With these caveats, the analysis provides upper bounds for costs in order to take a conservative approach. Much of the existing infrastructure for accessing surface water withdrawals and many of the wells would still be functional without the dams.
6.1 Water Supply Context
Washington State Basins Washington State delineates its watersheds into Water Resource Inventory Areas (WRIAs) for organization and delineation of water resource management. There are two WRIAs of primary interest to the LSR. WRIA 33 is located in the Lower Snake Basin east of the confluence of the Snake River and Columbia River and upstream to where the Palouse River enters the Snake River. WRIA 35 is located along the Middle Snake, from the mouth of the Palouse River to the
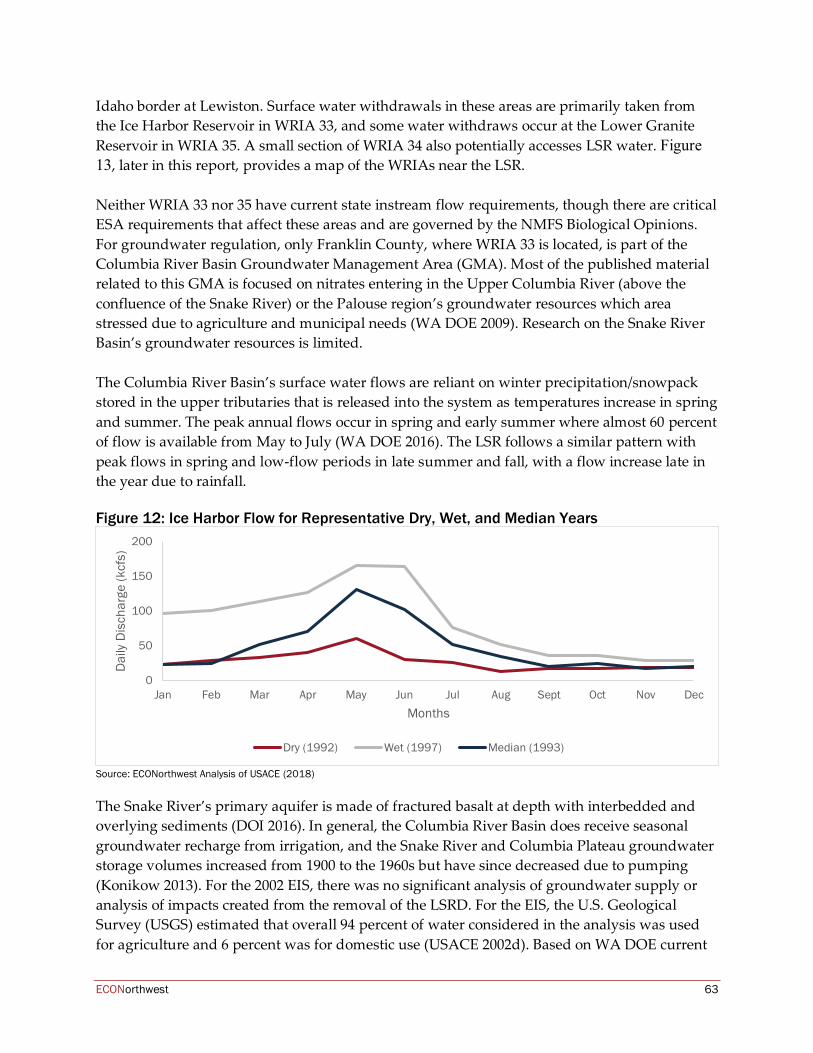
ECONorthwest 63
Idaho border at Lewiston. Surface water withdrawals in these areas are primarily taken from the Ice Harbor Reservoir in WRIA 33, and some water withdraws occur at the Lower Granite Reservoir in WRIA 35. A small section of WRIA 34 also potentially accesses LSR water. Figure 13, later in this report, provides a map of the WRIAs near the LSR. Neither WRIA 33 nor 35 have current state instream flow requirements, though there are critical ESA requirements that affect these areas and are governed by the NMFS Biological Opinions. For groundwater regulation, only Franklin County, where WRIA 33 is located, is part of the Columbia River Basin Groundwater Management Area (GMA). Most of the published material related to this GMA is focused on nitrates entering in the Upper Columbia River (above the confluence of the Snake River) or the Palouse region’s groundwater resources which area stressed due to agriculture and municipal needs (WA DOE 2009). Research on the Snake River Basin’s groundwater resources is limited. The Columbia River Basin’s surface water flows are reliant on winter precipitation/snowpack stored in the upper tributaries that is released into the system as temperatures increase in spring and summer. The peak annual flows occur in spring and early summer where almost 60 percent of flow is available from May to July (WA DOE 2016). The LSR follows a similar pattern with peak flows in spring and low-flow periods in late summer and fall, with a flow increase late in the year due to rainfall. Figure 12: Ice Harbor Flow for Representative Dry, Wet, and Median Years
Source: ECONorthwest Analysis of USACE (2018)
The Snake River’s primary aquifer is made of fractured basalt at depth with interbedded and overlying sediments (DOI 2016). In general, the Columbia River Basin does receive seasonal groundwater recharge from irrigation, and the Snake River and Columbia Plateau groundwater storage volumes increased from 1900 to the 1960s but have since decreased due to pumping (Konikow 2013). For the 2002 EIS, there was no significant analysis of groundwater supply or analysis of impacts created from the removal of the LSRD. For the EIS, the U.S. Geological Survey (USGS) estimated that overall 94 percent of water considered in the analysis was used for agriculture and 6 percent was for domestic use (USACE 2002d). Based on WA DOE current
0
50
100
150
200
Jan Feb Mar Apr May Jun Jul Aug Sept Oct Nov Dec
Dai
ly D
isch
arge
(kcf
s)
Months
Dry (1992) Wet (1997) Median (1993)
ECONorthwest 64
demand analysis, the overwhelming use in WRIA 33 is agriculture. At a comparably lower total volume, about half of WRIA 35 surface water withdrawals are for municipal uses and the remainder for agriculture (WA DOE 2016). High demand for all uses is summer and fall, with peak demand occurring in July. In the EIS, DREW analyzed the LSRD’s impact on water supply and irrigation. Of the four available scenarios, the only one that would significantly impact water supply and irrigation services was a dam breach. For this work, the EIS compiled data on users, uses, withdrawal volumes, and estimated costs of infrastructure improvements required for a breach scenario. DREW calculated the economic effect to water users if the dam was breached to be in a range of $308 to $375 million. This range includes loss of irrigated farmland values, as well as municipal and private infrastructure upgrades (DREW 1999).
Forecasts and Potential Climate Change Impacts Pacific Northwest climate change projections indicate a temperature increase in a range of 2 to 8.5 degrees F by the year 2100, with the most extreme change during in the summer months (DOI 2016). WA DOE expects rainfall not to vary significantly on average, though seasonality of precipitation will result in drier summers and other seasons becoming wetter. The National Climate Change Assessment expects Northwest precipitation to see anywhere from an 11 percent decrease to a 12 percent increase for 2030 to 2050 (Mote 2014). Future regional climates are expected to be more variable, which can include more frequent and severe droughts (Littell et al. 2014). This increase in variability means that preparations for or adaptations to drought conditions become more valuable. In the Yakima Basin, increased climate variability was found to increase the benefits of water supply availability and drought supply resilience capabilities (ECONorthwest 2012). Since the Snake River is dependent on snowpack and melting to sustain flows throughout the summer, the changes in precipitation and seasonality of that melt will lead to extended periods of lower flows occurring during the high-demand period for both out-of-stream and in-stream needs for power generation and fish (WA DOE 2016). At Brownlee Dam, upstream from the Lower Granite Dam on the Snake River, the U.S. Department of Interior (DOI) predicts that by 2040 the average April 1st Snow Water Equivalent will decrease between 66 and 42 percent from the 1980-2009 average, while average December to March runoff will increase 13 to 44 percent, and average April to July runoff is expected to range from down 7 to up 15 percent (DOI 2016). In WRIA 33, the water supply is likely to increase in the winter with a decrease from spring through fall with uncertainty on its magnitude. While in WRIA 35, surface water is expected to increase in late winter with slight declines in March and April. As briefly mentioned above, in the 2002 EIS USACE did little analysis on existing groundwater and potential impacts on groundwater supplies in a breach scenario. There is uncertainty how (without extensive modeling for the region) dam removals impact groundwater. From research on other dam removals, there is an indication that in the short-term, groundwater sources near reservoir pools decline if dams/reservoir pools are removed (Bethelote 2013, DOI 2013). This
ECONorthwest 65
result could also affect the usefulness of groundwater wells for irrigation and other uses, although effects on long-term groundwater aquifer level stability are uncertain and will depend on the balance of future withdrawals versus recharge and the specific underlying geology of the region.
Outside Influences The 1964 Columbia River Treaty (“the Treaty”) between the U.S. and Canada was negotiated to address both unregulated flood risk and increasing energy needs of the postwar economic boom (USACE 2013). It provided for the cooperative development of water resources in the Upper Columbia River Basin, and the construction of four dams to increase reservoir storage (USACE 2013; WA DOE 2016). The Treaty requires the Upper Columbia Basin to provide additional water storage for flood prevention. In the arrangement, the U.S. pays 50 percent of estimated potential damages from a flood, and Canada receives an entitlement to power benefits generated on the Columbia River in the U.S. (USACE 2014). Although these dams are located upstream from the confluence of the Columbia and the LSR, this treaty could directly change future surface water supplies in the basin and impact management of the LSR. In 2024, either Canada or the U.S. can choose to terminate some or all of the provisions of the agreement (USACE 2014). There is an ongoing process evaluating the future of the Treaty in the face of the complex issues outside of power and flood control such as future needs for anadromous and resident fish, irrigation, recreation, and municipal water supply (WA DOE 2016). Another uncertainty for future water supplies in the Columbia and LSR is management of tribal water rights. In particular, tribes in eastern Washington reserve the right to fish, hunt, and gather their traditional foods across usual, accustomed, and ceded areas outside of tribal and reservation lands which include stretches of the Columbia River and its tributaries (WA DOE 2016). There is ongoing litigation (Washington v. United States, 584 US, 2018) surrounding salmonid protection and tribal water rights associated with these unquantified fishing rights (WA DOE 2016). Outcomes from court proceedings could have impacts on water flows and availability for current water users.
6.2 Historic Water Use
Agriculture Irrigated activities along the LSR are focused in Franklin County and Walla Walla County, and as of 1999 withdrawals primarily occurred behind Ice Harbor Dam by 14 users who irrigate approximately 37,000 acres (DREW 1999). This area is about 12 percent of the irrigated acreage in Franklin and Walla Walla counties, and only 2 percent in all of Washington State (DREW 1999). Previously, the U.S. Department of Agriculture’s (USDA) Natural Resources Conservation Service estimated that there were 50,000 acres of irrigated farmland adjacent to Ice Harbor, but that number did not differentiate between surface water and groundwater users (USACE 1999).
ECONorthwest 66
DREW identified concerns about the technical feasibility of modifying existing pump stations to accommodate breach conditions (DREW 1999). The concerns were based on potential changes to stream channel due to meandering, stability of foundations of existing stations considering sediment, silt, and gravel which would be impacted by water flows, and transitions between systems on perennial agriculture crops (orchards). They also determined that substituting the surface water irrigation from groundwater sources did not appear to be feasible. For the 2002 EIS, USACE determined that a large central pumping station would be the most favorable solution to mitigate for irrigation impacts of removal of the LSRD because it could be located in an area with reduced risk from meandering and sediment concerns. This water would then be delivered to farms, requiring significant conveyance infrastructure. USACE estimated the cost for this infrastructure would be $452 million at that time. They also anticipated that both maintenance and energy costs would increase over time (DREW 1999). These cost estimates have been critiqued as overly high. For example, a project to build an entirely new 44,000 acre-feet off-channel reservoir with pumping and conveyance structures for supply in this region by the state of Washington, Switzler Reservoir just downstream of Snake-Columbia confluence, has capital cost estimates of $311 million (Aspect & Anchor QEA 2012). Cost estimates for comparable and greater acquisition or supply of water including structural investments in the nearby Yakima River Basin, a particularly water-scarce region relatively, similarly are also lower than those estimated for the LSR (ECONorthwest 2012).
Municipal and Other Users For the 2002 EIS, there were 228 wells identified within a mile of the Snake River (USACE 2002d). The dominant use was domestic consumption, followed by irrigation. To accommodate removal of the LSRD, these wells could need pump size and depth increases. The local irrigation district estimated that 40 percent of the wells would require some modifications with a total cost of $87.5 million (DREW 1999). There are six municipal and industrial pump stations located near the Lower Granite pool. These are used for municipal water system backup, golf course irrigation, and industrial process water for paper production and concrete aggregate washing (DREW 1999). The largest industrial user was the Potlatch Corporation, now called Clearwater Paper Mill, a forest product company that operates a pulp and paper mill near Lewiston, Idaho. DREW calculated the cost to update these pump stations at a range of $17.5 to $84.2 million with the overwhelming bulk and uncertainty of cost devoted to Potlatch Corporation’s discharge water cooling facility (DREW 1999).
6.3 Current and Forecasted Demand DOE water supply and flow modeling efforts estimate aggregate (irrigation and municipal) historical demand of WRIA 33 is 95,270 ac-ft/year and in WRIA 35 is 1,051 ac-ft/year. The forecast model for 2035 estimates a decline in demand to 87,202 ac-ft/year and 1,039 ac-ft/year, respectively (WA DOE 2016).
ECONorthwest 67
The projected decrease in demand is attributed to a warmer and wetter climate earlier in the growing season, resulting in a shorter irrigation season for most crops. Additionally, DOE projects that future agricultural practices will result in the adoption of crops that require less irrigation (WA DOE 2016). This model does not include the anticipated increase in double-cropping (two crop cycles per year), which would increase water requirements to adjust to growing cycles, nor does it include potential increases in irrigation efficiency, which would decrease water requirements (WA DOE 2016). For municipal uses, WRIA 33 is expected to increase in population by 9 percent from 2015 to 2035, which will result in an increased diversion of 88 ac-ft/year and increase in consumptive use of 23 ac-ft/year. WRIA 35’s population is expected to increase 6 percent, with an increase in diversion of 365 ac-ft/year and an increase in consumption of 119 ac-ft/year over the same period (DOE 2016). The municipal demand forecast remains relatively constant throughout the year and is consistent between LSRD scenarios. In Lewiston, Idaho (on the edge of WRIA 35), municipal demand is a larger proportion of total water demand, but the LSR is only a backup water source for the city. The City relies on one intake upstream in Clearwater River and groundwater wells for 90 percent of its water (City of Lewiston 2016). Forecasts are broken out into expected demand in 2035 for municipal, groundwater irrigation, surface water irrigation and water losses due to surface water irrigation transfer under four scenarios. Assuming no change in irrigated acreage, water demand in WRIA 33 will decrease from June – September and increase in April, May, and October; while in WRIA 35, the demand will increase in July and decrease the remainder of the season. DOE’s flow forecasts also provide a number of demand and climate scenarios for each WRIA (WA DOE 2016). Overall, climate and demand projections indicate decreases in summer precipitation and increases in summer demand for irrigation and early season precipitation. The change in temperature and precipitation could result in a temporal shift in the growing season to earlier in the year, where crops are planted and mature earlier when precipitation is higher. Higher summer temperature could increase demand for other uses, such as recreation and environmental flows (WA DOE 2016, DOI 2016).
6.4 Current Agricultural Production Value According to the Washington State Department of Agriculture (2017) there are 10,793 acres of irrigated lands in the associated WRIAs (33, 34, and 35) within one mile of the LSR (Table 19). Extending the area of consideration to five miles from the LSR, there are 52,607 acres of irrigated agriculture. As there are no major water conveyance projects in the area, this likely captures the range of agricultural land potentially affected by loss of the LSRD and encompasses the earlier estimates of irrigated acreage dependent on the LSR discussed above. Of irrigated acres, orchard tree fruits are the most common within one mile of the river, while vegetables are the most common irrigated acreage within five miles.
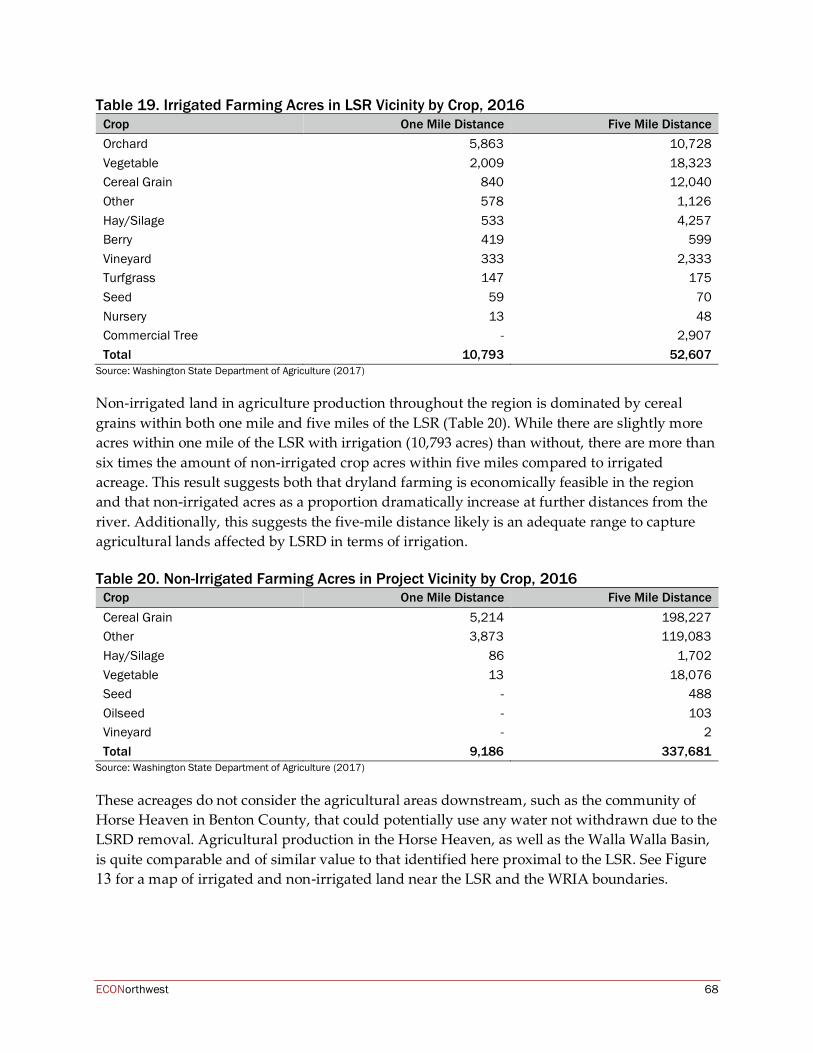
ECONorthwest 68
Table 19. Irrigated Farming Acres in LSR Vicinity by Crop, 2016 Crop One Mile Distance Five Mile Distance Orchard 5,863 10,728 Vegetable 2,009 18,323 Cereal Grain 840 12,040 Other 578 1,126 Hay/Silage 533 4,257 Berry 419 599 Vineyard 333 2,333 Turfgrass 147 175 Seed 59 70 Nursery 13 48 Commercial Tree - 2,907 Total 10,793 52,607
Source: Washington State Department of Agriculture (2017)
Non-irrigated land in agriculture production throughout the region is dominated by cereal grains within both one mile and five miles of the LSR (Table 20). While there are slightly more acres within one mile of the LSR with irrigation (10,793 acres) than without, there are more than six times the amount of non-irrigated crop acres within five miles compared to irrigated acreage. This result suggests both that dryland farming is economically feasible in the region and that non-irrigated acres as a proportion dramatically increase at further distances from the river. Additionally, this suggests the five-mile distance likely is an adequate range to capture agricultural lands affected by LSRD in terms of irrigation. Table 20. Non-Irrigated Farming Acres in Project Vicinity by Crop, 2016
Crop One Mile Distance Five Mile Distance Cereal Grain 5,214 198,227 Other 3,873 119,083 Hay/Silage 86 1,702 Vegetable 13 18,076 Seed - 488 Oilseed - 103 Vineyard - 2 Total 9,186 337,681
Source: Washington State Department of Agriculture (2017)
These acreages do not consider the agricultural areas downstream, such as the community of Horse Heaven in Benton County, that could potentially use any water not withdrawn due to the LSRD removal. Agricultural production in the Horse Heaven, as well as the Walla Walla Basin, is quite comparable and of similar value to that identified here proximal to the LSR. See Figure 13 for a map of irrigated and non-irrigated land near the LSR and the WRIA boundaries.
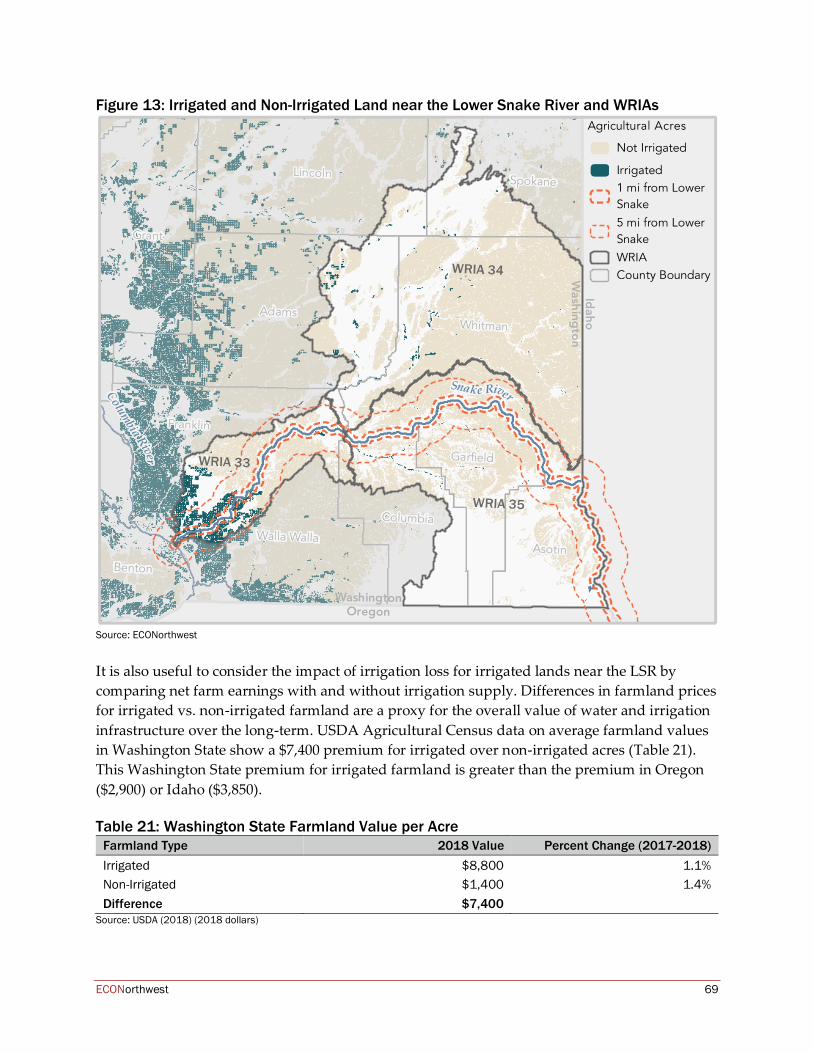
ECONorthwest 69
Figure 13: Irrigated and Non-Irrigated Land near the Lower Snake River and WRIAs
Source: ECONorthwest
It is also useful to consider the impact of irrigation loss for irrigated lands near the LSR by comparing net farm earnings with and without irrigation supply. Differences in farmland prices for irrigated vs. non-irrigated farmland are a proxy for the overall value of water and irrigation infrastructure over the long-term. USDA Agricultural Census data on average farmland values in Washington State show a $7,400 premium for irrigated over non-irrigated acres (Table 21). This Washington State premium for irrigated farmland is greater than the premium in Oregon ($2,900) or Idaho ($3,850). Table 21: Washington State Farmland Value per Acre
Farmland Type 2018 Value Percent Change (2017-2018) Irrigated $8,800 1.1% Non-Irrigated $1,400 1.4% Difference $7,400
Source: USDA (2018) (2018 dollars)
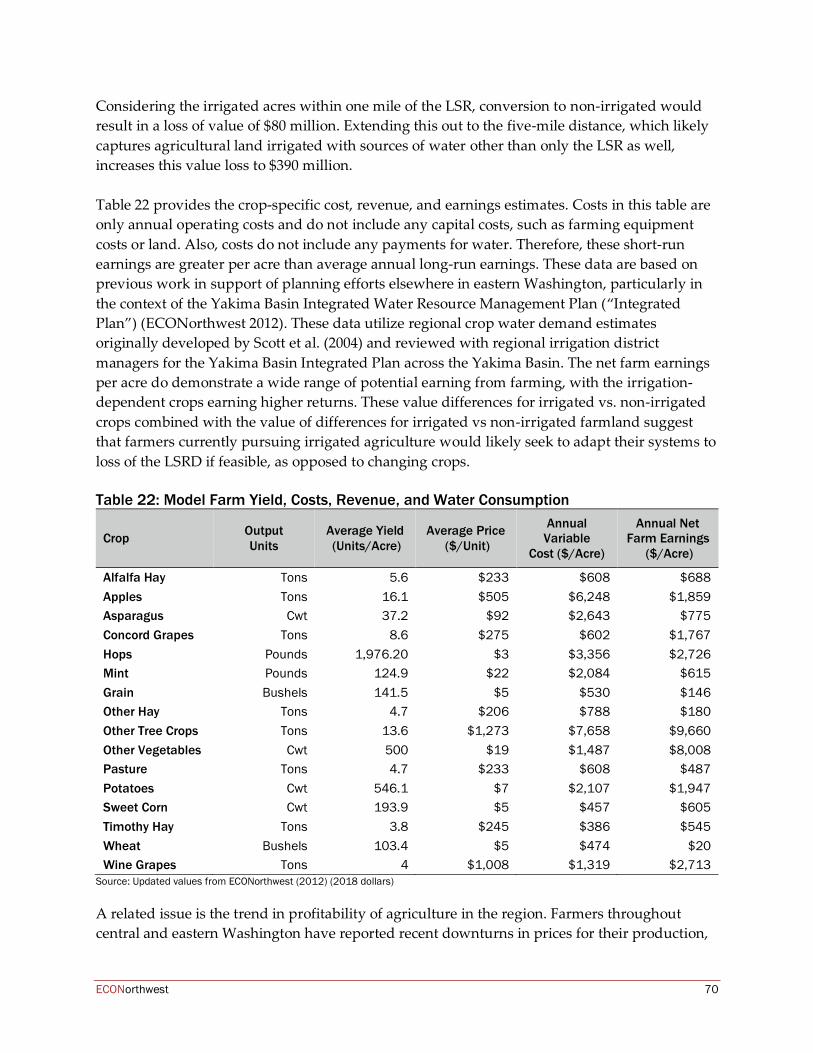
ECONorthwest 70
Considering the irrigated acres within one mile of the LSR, conversion to non-irrigated would result in a loss of value of $80 million. Extending this out to the five-mile distance, which likely captures agricultural land irrigated with sources of water other than only the LSR as well, increases this value loss to $390 million. Table 22 provides the crop-specific cost, revenue, and earnings estimates. Costs in this table are only annual operating costs and do not include any capital costs, such as farming equipment costs or land. Also, costs do not include any payments for water. Therefore, these short-run earnings are greater per acre than average annual long-run earnings. These data are based on previous work in support of planning efforts elsewhere in eastern Washington, particularly in the context of the Yakima Basin Integrated Water Resource Management Plan (“Integrated Plan”) (ECONorthwest 2012). These data utilize regional crop water demand estimates originally developed by Scott et al. (2004) and reviewed with regional irrigation district managers for the Yakima Basin Integrated Plan across the Yakima Basin. The net farm earnings per acre do demonstrate a wide range of potential earning from farming, with the irrigation-dependent crops earning higher returns. These value differences for irrigated vs. non-irrigated crops combined with the value of differences for irrigated vs non-irrigated farmland suggest that farmers currently pursuing irrigated agriculture would likely seek to adapt their systems to loss of the LSRD if feasible, as opposed to changing crops. Table 22: Model Farm Yield, Costs, Revenue, and Water Consumption
Crop Output Units
Average Yield (Units/Acre)
Average Price ($/Unit)
Annual Variable
Cost ($/Acre)
Annual Net Farm Earnings
($/Acre)
Alfalfa Hay Tons 5.6 $233 $608 $688 Apples Tons 16.1 $505 $6,248 $1,859 Asparagus Cwt 37.2 $92 $2,643 $775 Concord Grapes Tons 8.6 $275 $602 $1,767 Hops Pounds 1,976.20 $3 $3,356 $2,726 Mint Pounds 124.9 $22 $2,084 $615 Grain Bushels 141.5 $5 $530 $146 Other Hay Tons 4.7 $206 $788 $180 Other Tree Crops Tons 13.6 $1,273 $7,658 $9,660 Other Vegetables Cwt 500 $19 $1,487 $8,008 Pasture Tons 4.7 $233 $608 $487 Potatoes Cwt 546.1 $7 $2,107 $1,947 Sweet Corn Cwt 193.9 $5 $457 $605 Timothy Hay Tons 3.8 $245 $386 $545 Wheat Bushels 103.4 $5 $474 $20 Wine Grapes Tons 4 $1,008 $1,319 $2,713
Source: Updated values from ECONorthwest (2012) (2018 dollars)
A related issue is the trend in profitability of agriculture in the region. Farmers throughout central and eastern Washington have reported recent downturns in prices for their production,
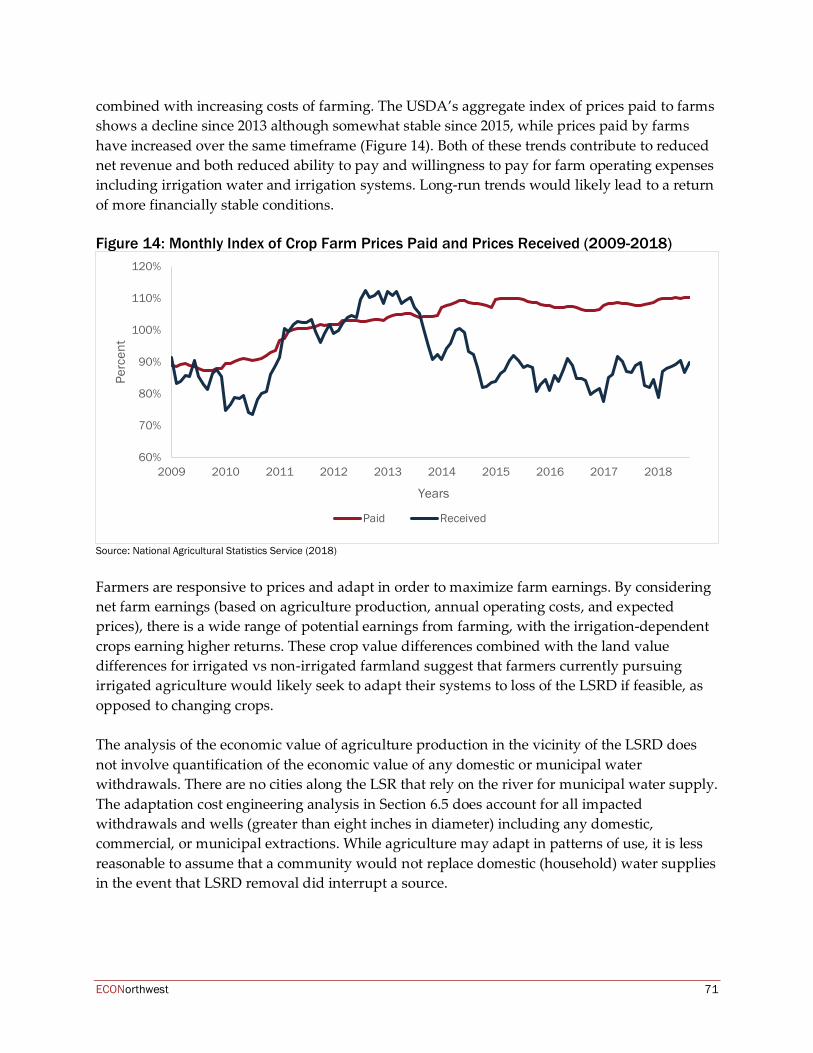
ECONorthwest 71
combined with increasing costs of farming. The USDA’s aggregate index of prices paid to farms shows a decline since 2013 although somewhat stable since 2015, while prices paid by farms have increased over the same timeframe (Figure 14). Both of these trends contribute to reduced net revenue and both reduced ability to pay and willingness to pay for farm operating expenses including irrigation water and irrigation systems. Long-run trends would likely lead to a return of more financially stable conditions. Figure 14: Monthly Index of Crop Farm Prices Paid and Prices Received (2009-2018)
Source: National Agricultural Statistics Service (2018)
Farmers are responsive to prices and adapt in order to maximize farm earnings. By considering net farm earnings (based on agriculture production, annual operating costs, and expected prices), there is a wide range of potential earnings from farming, with the irrigation-dependent crops earning higher returns. These crop value differences combined with the land value differences for irrigated vs non-irrigated farmland suggest that farmers currently pursuing irrigated agriculture would likely seek to adapt their systems to loss of the LSRD if feasible, as opposed to changing crops. The analysis of the economic value of agriculture production in the vicinity of the LSRD does not involve quantification of the economic value of any domestic or municipal water withdrawals. There are no cities along the LSR that rely on the river for municipal water supply. The adaptation cost engineering analysis in Section 6.5 does account for all impacted withdrawals and wells (greater than eight inches in diameter) including any domestic, commercial, or municipal extractions. While agriculture may adapt in patterns of use, it is less reasonable to assume that a community would not replace domestic (household) water supplies in the event that LSRD removal did interrupt a source.
60%
70%
80%
90%
100%
110%
120%
2009 2010 2011 2012 2013 2014 2015 2016 2017 2018
Perc
ent
Years
Paid Received
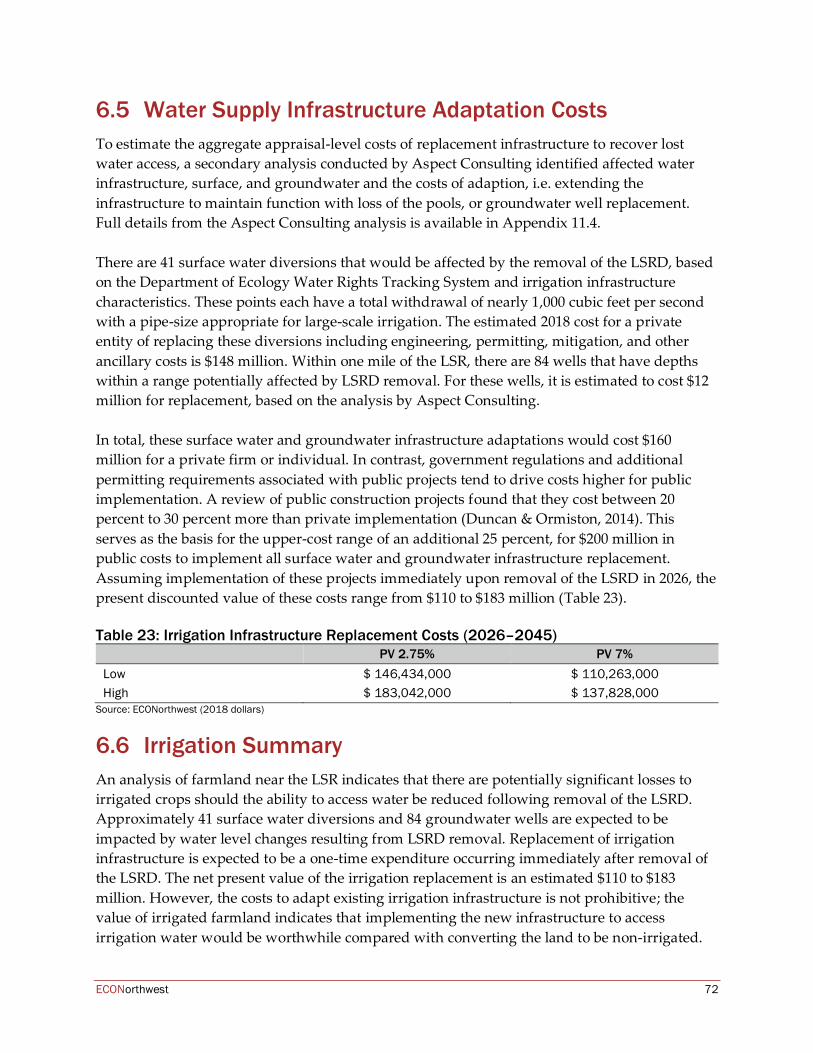
ECONorthwest 72
6.5 Water Supply Infrastructure Adaptation Costs To estimate the aggregate appraisal-level costs of replacement infrastructure to recover lost water access, a secondary analysis conducted by Aspect Consulting identified affected water infrastructure, surface, and groundwater and the costs of adaption, i.e. extending the infrastructure to maintain function with loss of the pools, or groundwater well replacement. Full details from the Aspect Consulting analysis is available in Appendix 11.4. There are 41 surface water diversions that would be affected by the removal of the LSRD, based on the Department of Ecology Water Rights Tracking System and irrigation infrastructure characteristics. These points each have a total withdrawal of nearly 1,000 cubic feet per second with a pipe-size appropriate for large-scale irrigation. The estimated 2018 cost for a private entity of replacing these diversions including engineering, permitting, mitigation, and other ancillary costs is $148 million. Within one mile of the LSR, there are 84 wells that have depths within a range potentially affected by LSRD removal. For these wells, it is estimated to cost $12 million for replacement, based on the analysis by Aspect Consulting. In total, these surface water and groundwater infrastructure adaptations would cost $160 million for a private firm or individual. In contrast, government regulations and additional permitting requirements associated with public projects tend to drive costs higher for public implementation. A review of public construction projects found that they cost between 20 percent to 30 percent more than private implementation (Duncan & Ormiston, 2014). This serves as the basis for the upper-cost range of an additional 25 percent, for $200 million in public costs to implement all surface water and groundwater infrastructure replacement. Assuming implementation of these projects immediately upon removal of the LSRD in 2026, the present discounted value of these costs range from $110 to $183 million (Table 23). Table 23: Irrigation Infrastructure Replacement Costs (2026–2045) PV 2.75% PV 7% Low $ 146,434,000 $ 110,263,000 High $ 183,042,000 $ 137,828,000
Source: ECONorthwest (2018 dollars)
6.6 Irrigation Summary An analysis of farmland near the LSR indicates that there are potentially significant losses to irrigated crops should the ability to access water be reduced following removal of the LSRD. Approximately 41 surface water diversions and 84 groundwater wells are expected to be impacted by water level changes resulting from LSRD removal. Replacement of irrigation infrastructure is expected to be a one-time expenditure occurring immediately after removal of the LSRD. The net present value of the irrigation replacement is an estimated $110 to $183 million. However, the costs to adapt existing irrigation infrastructure is not prohibitive; the value of irrigated farmland indicates that implementing the new infrastructure to access irrigation water would be worthwhile compared with converting the land to be non-irrigated.
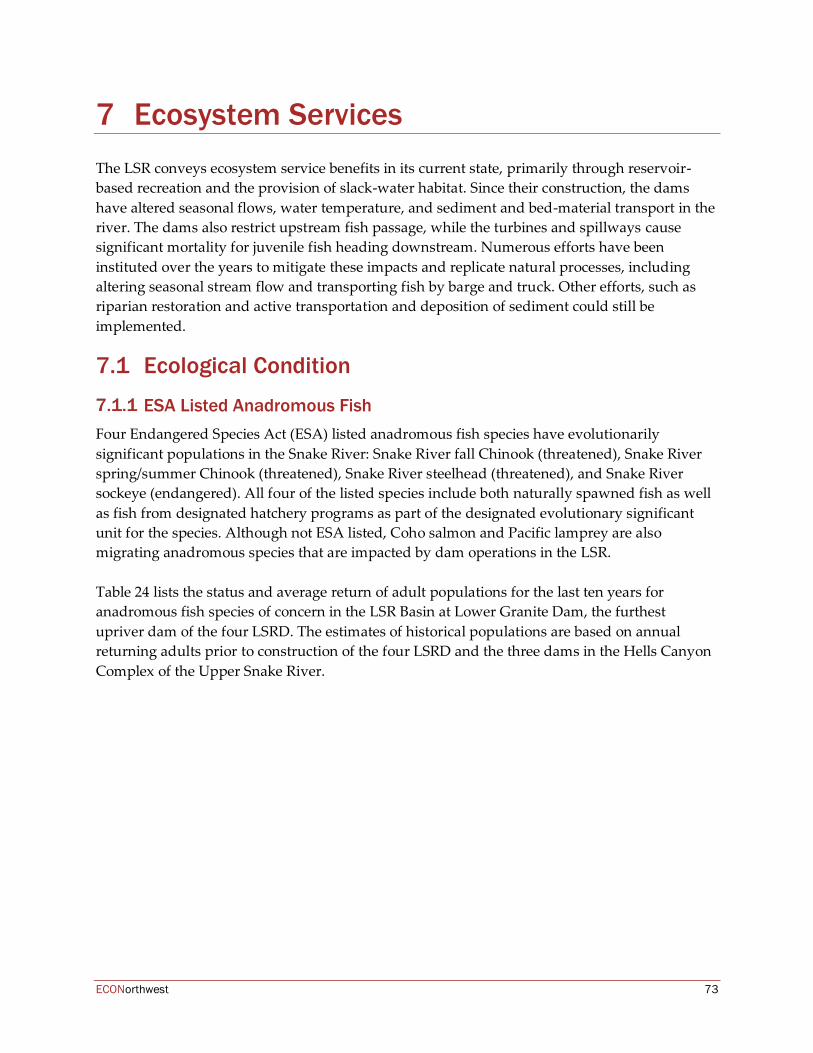
ECONorthwest 73
7 Ecosystem Services The LSR conveys ecosystem service benefits in its current state, primarily through reservoir-based recreation and the provision of slack-water habitat. Since their construction, the dams have altered seasonal flows, water temperature, and sediment and bed-material transport in the river. The dams also restrict upstream fish passage, while the turbines and spillways cause significant mortality for juvenile fish heading downstream. Numerous efforts have been instituted over the years to mitigate these impacts and replicate natural processes, including altering seasonal stream flow and transporting fish by barge and truck. Other efforts, such as riparian restoration and active transportation and deposition of sediment could still be implemented.
7.1 Ecological Condition
ESA Listed Anadromous Fish Four Endangered Species Act (ESA) listed anadromous fish species have evolutionarily significant populations in the Snake River: Snake River fall Chinook (threatened), Snake River spring/summer Chinook (threatened), Snake River steelhead (threatened), and Snake River sockeye (endangered). All four of the listed species include both naturally spawned fish as well as fish from designated hatchery programs as part of the designated evolutionary significant unit for the species. Although not ESA listed, Coho salmon and Pacific lamprey are also migrating anadromous species that are impacted by dam operations in the LSR. Table 24 lists the status and average return of adult populations for the last ten years for anadromous fish species of concern in the LSR Basin at Lower Granite Dam, the furthest upriver dam of the four LSRD. The estimates of historical populations are based on annual returning adults prior to construction of the four LSRD and the three dams in the Hells Canyon Complex of the Upper Snake River.
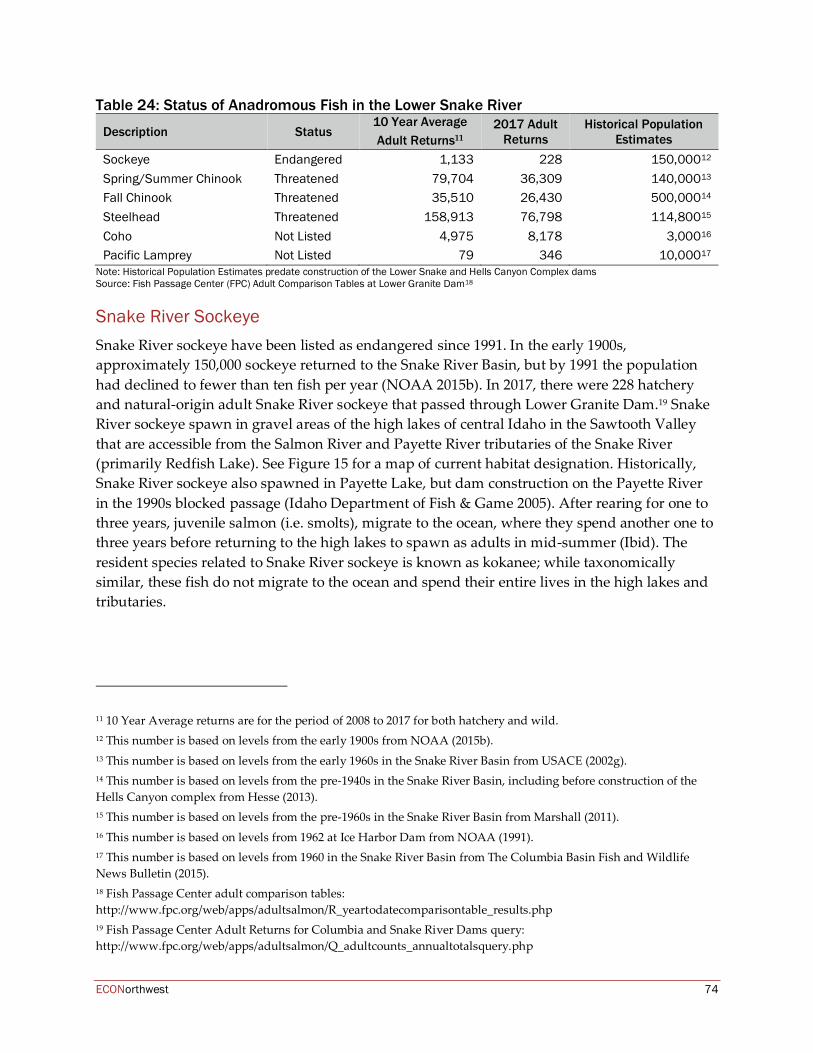
ECONorthwest 74
Table 24: Status of Anadromous Fish in the Lower Snake River
Description Status 10 Year Average Adult Returns11
2017 Adult Returns
Historical Population Estimates
Sockeye Endangered 1,133 228 150,00012 Spring/Summer Chinook Threatened 79,704 36,309 140,00013 Fall Chinook Threatened 35,510 26,430 500,00014 Steelhead Threatened 158,913 76,798 114,80015 Coho Not Listed 4,975 8,178 3,00016 Pacific Lamprey Not Listed 79 346 10,00017
Note: Historical Population Estimates predate construction of the Lower Snake and Hells Canyon Complex dams Source: Fish Passage Center (FPC) Adult Comparison Tables at Lower Granite Dam18
Snake River Sockeye Snake River sockeye have been listed as endangered since 1991. In the early 1900s, approximately 150,000 sockeye returned to the Snake River Basin, but by 1991 the population had declined to fewer than ten fish per year (NOAA 2015b). In 2017, there were 228 hatchery and natural-origin adult Snake River sockeye that passed through Lower Granite Dam.19 Snake River sockeye spawn in gravel areas of the high lakes of central Idaho in the Sawtooth Valley that are accessible from the Salmon River and Payette River tributaries of the Snake River (primarily Redfish Lake). See Figure 15 for a map of current habitat designation. Historically, Snake River sockeye also spawned in Payette Lake, but dam construction on the Payette River in the 1990s blocked passage (Idaho Department of Fish & Game 2005). After rearing for one to three years, juvenile salmon (i.e. smolts), migrate to the ocean, where they spend another one to three years before returning to the high lakes to spawn as adults in mid-summer (Ibid). The resident species related to Snake River sockeye is known as kokanee; while taxonomically similar, these fish do not migrate to the ocean and spend their entire lives in the high lakes and tributaries.
11 10 Year Average returns are for the period of 2008 to 2017 for both hatchery and wild. 12 This number is based on levels from the early 1900s from NOAA (2015b). 13 This number is based on levels from the early 1960s in the Snake River Basin from USACE (2002g). 14 This number is based on levels from the pre-1940s in the Snake River Basin, including before construction of the Hells Canyon complex from Hesse (2013). 15 This number is based on levels from the pre-1960s in the Snake River Basin from Marshall (2011). 16 This number is based on levels from 1962 at Ice Harbor Dam from NOAA (1991). 17 This number is based on levels from 1960 in the Snake River Basin from The Columbia Basin Fish and Wildlife News Bulletin (2015). 18 Fish Passage Center adult comparison tables: http://www.fpc.org/web/apps/adultsalmon/R_yeartodatecomparisontable_results.php 19 Fish Passage Center Adult Returns for Columbia and Snake River Dams query: http://www.fpc.org/web/apps/adultsalmon/Q_adultcounts_annualtotalsquery.php
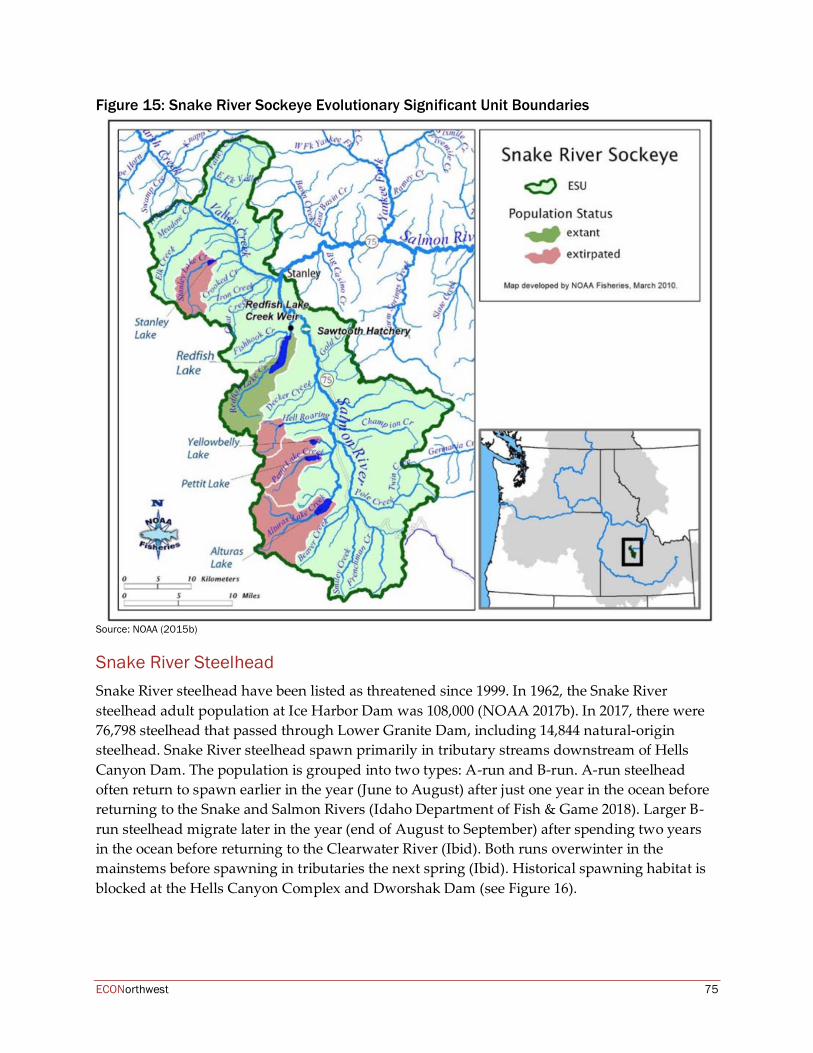
ECONorthwest 75
Figure 15: Snake River Sockeye Evolutionary Significant Unit Boundaries
Source: NOAA (2015b)
Snake River Steelhead Snake River steelhead have been listed as threatened since 1999. In 1962, the Snake River steelhead adult population at Ice Harbor Dam was 108,000 (NOAA 2017b). In 2017, there were 76,798 steelhead that passed through Lower Granite Dam, including 14,844 natural-origin steelhead. Snake River steelhead spawn primarily in tributary streams downstream of Hells Canyon Dam. The population is grouped into two types: A-run and B-run. A-run steelhead often return to spawn earlier in the year (June to August) after just one year in the ocean before returning to the Snake and Salmon Rivers (Idaho Department of Fish & Game 2018). Larger B-run steelhead migrate later in the year (end of August to September) after spending two years in the ocean before returning to the Clearwater River (Ibid). Both runs overwinter in the mainstems before spawning in tributaries the next spring (Ibid). Historical spawning habitat is blocked at the Hells Canyon Complex and Dworshak Dam (see Figure 16).
ECONorthwest 76
Figure 16: Snake River Steelhead Evolutionary Significant Unit Boundaries
Source: NOAA (2017a)
Snake River Chinook Chinook on the Snake River are classified into spring, summer, and fall chinook based on the dates at which they pass the dams migrating upstream in the system. The classification periods for the LSRD are shown in Figure 17. In 2017, a total of 81,318 Chinook passed Lower Granite Dam, inclusive of both fall and spring/summer Chinook.20
20 Source for Fish Passage Center Adult Returns for Columbia and Snake River Dams query is from http://www.fpc.org/web/apps/adultsalmon/Q_adultcounts_annualtotalsquery.php
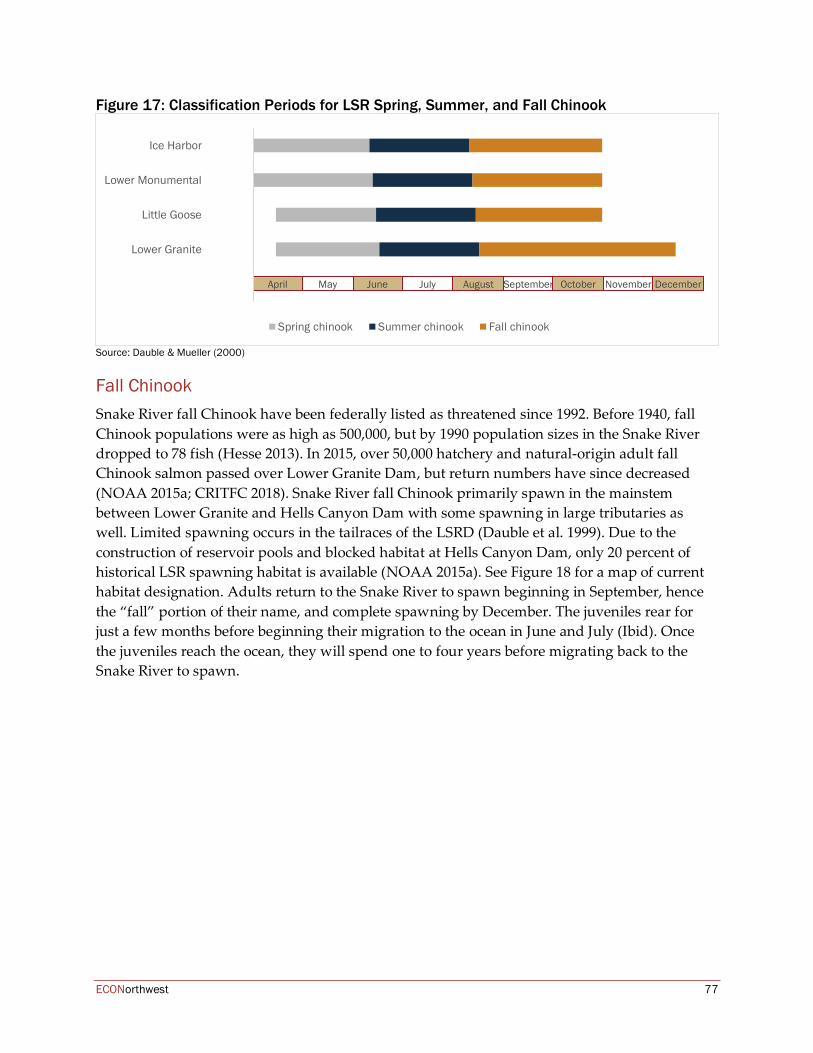
ECONorthwest 77
Figure 17: Classification Periods for LSR Spring, Summer, and Fall Chinook
Source: Dauble & Mueller (2000)
Fall Chinook Snake River fall Chinook have been federally listed as threatened since 1992. Before 1940, fall Chinook populations were as high as 500,000, but by 1990 population sizes in the Snake River dropped to 78 fish (Hesse 2013). In 2015, over 50,000 hatchery and natural-origin adult fall Chinook salmon passed over Lower Granite Dam, but return numbers have since decreased (NOAA 2015a; CRITFC 2018). Snake River fall Chinook primarily spawn in the mainstem between Lower Granite and Hells Canyon Dam with some spawning in large tributaries as well. Limited spawning occurs in the tailraces of the LSRD (Dauble et al. 1999). Due to the construction of reservoir pools and blocked habitat at Hells Canyon Dam, only 20 percent of historical LSR spawning habitat is available (NOAA 2015a). See Figure 18 for a map of current habitat designation. Adults return to the Snake River to spawn beginning in September, hence the “fall” portion of their name, and complete spawning by December. The juveniles rear for just a few months before beginning their migration to the ocean in June and July (Ibid). Once the juveniles reach the ocean, they will spend one to four years before migrating back to the Snake River to spawn.
April May June July August September October November December
Ice Harbor
Lower Monumental
Little Goose
Lower Granite
Spring chinook Summer chinook Fall chinook
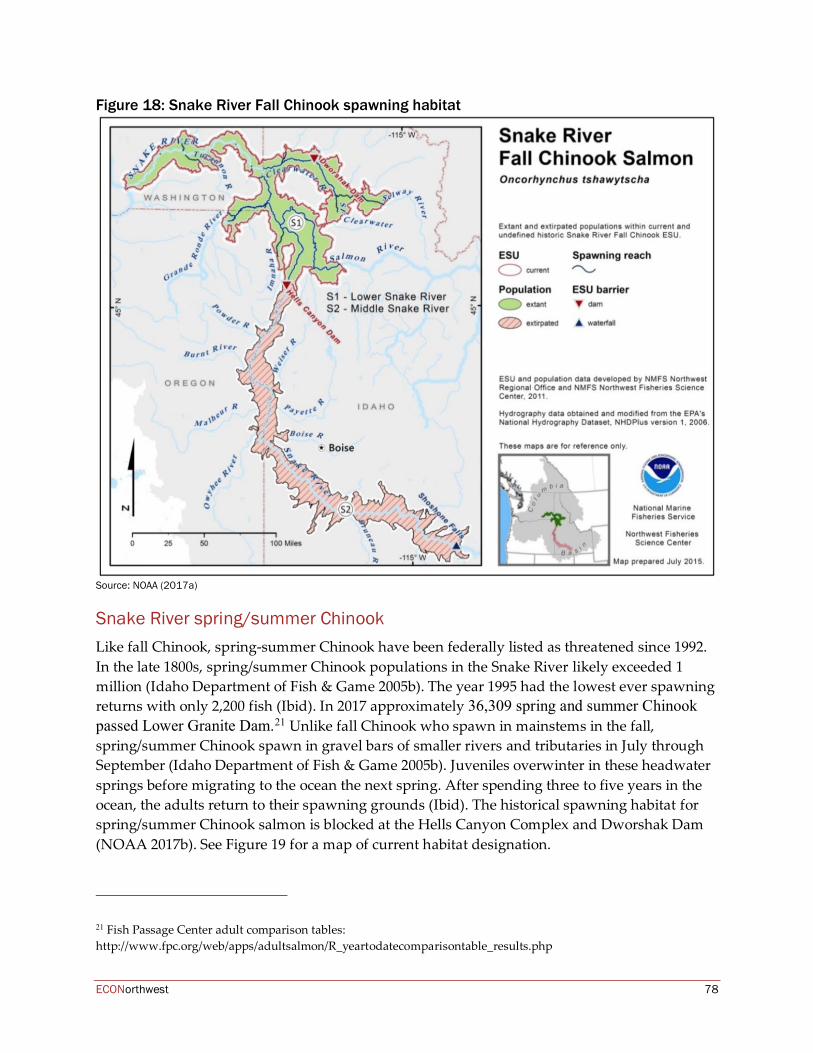
ECONorthwest 78
Figure 18: Snake River Fall Chinook spawning habitat
Source: NOAA (2017a)
Snake River spring/summer Chinook Like fall Chinook, spring-summer Chinook have been federally listed as threatened since 1992. In the late 1800s, spring/summer Chinook populations in the Snake River likely exceeded 1 million (Idaho Department of Fish & Game 2005b). The year 1995 had the lowest ever spawning returns with only 2,200 fish (Ibid). In 2017 approximately 36,309 spring and summer Chinook passed Lower Granite Dam.21 Unlike fall Chinook who spawn in mainstems in the fall, spring/summer Chinook spawn in gravel bars of smaller rivers and tributaries in July through September (Idaho Department of Fish & Game 2005b). Juveniles overwinter in these headwater springs before migrating to the ocean the next spring. After spending three to five years in the ocean, the adults return to their spawning grounds (Ibid). The historical spawning habitat for spring/summer Chinook salmon is blocked at the Hells Canyon Complex and Dworshak Dam (NOAA 2017b). See Figure 19 for a map of current habitat designation.
21 Fish Passage Center adult comparison tables: http://www.fpc.org/web/apps/adultsalmon/R_yeartodatecomparisontable_results.php
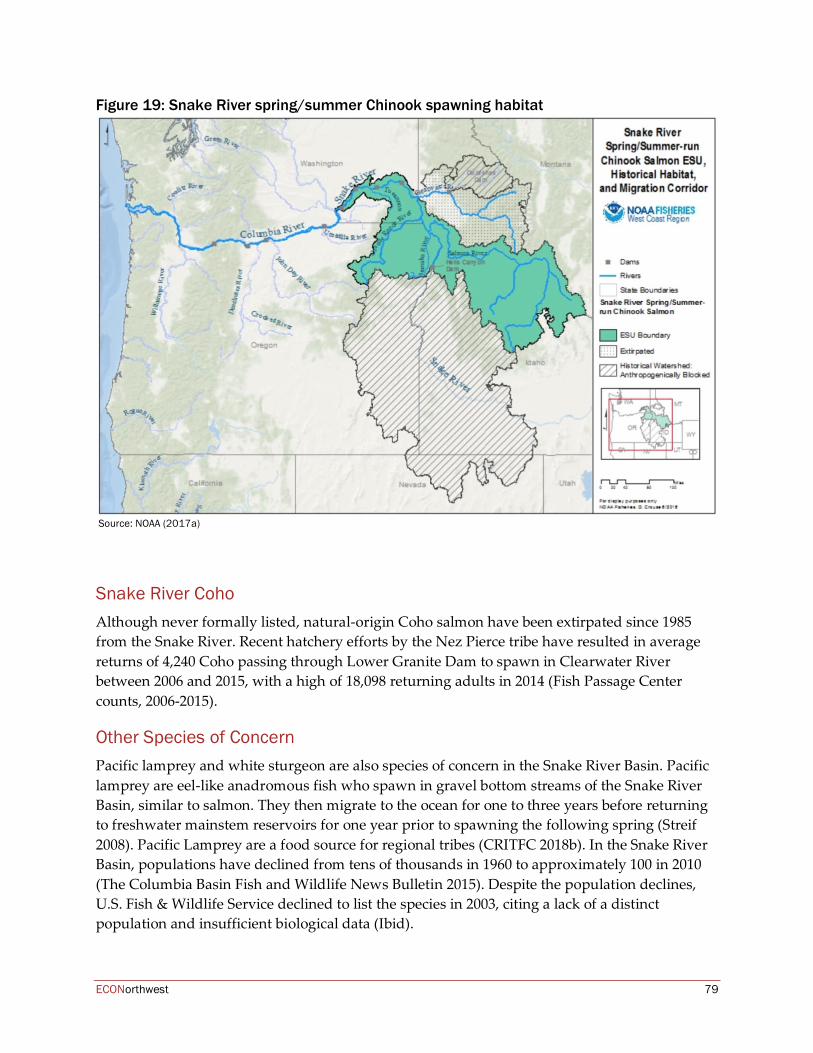
ECONorthwest 79
Figure 19: Snake River spring/summer Chinook spawning habitat
Source: NOAA (2017a)
Snake River Coho Although never formally listed, natural-origin Coho salmon have been extirpated since 1985 from the Snake River. Recent hatchery efforts by the Nez Pierce tribe have resulted in average returns of 4,240 Coho passing through Lower Granite Dam to spawn in Clearwater River between 2006 and 2015, with a high of 18,098 returning adults in 2014 (Fish Passage Center counts, 2006-2015).
Other Species of Concern Pacific lamprey and white sturgeon are also species of concern in the Snake River Basin. Pacific lamprey are eel-like anadromous fish who spawn in gravel bottom streams of the Snake River Basin, similar to salmon. They then migrate to the ocean for one to three years before returning to freshwater mainstem reservoirs for one year prior to spawning the following spring (Streif 2008). Pacific Lamprey are a food source for regional tribes (CRITFC 2018b). In the Snake River Basin, populations have declined from tens of thousands in 1960 to approximately 100 in 2010 (The Columbia Basin Fish and Wildlife News Bulletin 2015). Despite the population declines, U.S. Fish & Wildlife Service declined to list the species in 2003, citing a lack of a distinct population and insufficient biological data (Ibid).
ECONorthwest 80
White sturgeon are freshwater species whose populations in the Snake River have declined due to overfishing and lost habitat from dam construction that confines the fish between dam pools, as they cannot easily pass through dams due to their size (Idaho Department of Fish & Game 2005c). Populations have stabilized since implementation of catch and release fishing policies since 1972 and “low impact” fishing rules (Ibid). The state of Idaho designates Snake River White Sturgeon as critically imperiled, and the Hells Canyon Reach between Hells Canyon Dam and Lower Granite dam is one of only two river segments in Idaho (the other being in the upper Snake River) that is thought to be able to support viable populations of the species (Idaho Power 2015).
Seasonal Flow The unaltered hydrograph of the Columbia River is characterized by high spring runoff (April through mid-June), decreasing summer and fall flows (mid-June through December), and low winter flows (Budy et al. 2002). Through adaptation, the anadromous salmon based their migration pattern off these historical flows. With the construction of dams on the river system, this hydrograph has been modified from the historical trend, with moderated springtime flows and increased levels during the late-summer when water is needed for irrigation. Additional spill occurs both when turbine capacity is exceeded by flow and when agencies mandate spill in lieu of power production. These changes in flow resulting from dam spilling also affect the hydrological, thermal, and nutrient cycling processes in the streambed (Casas-Mulet et al. 2015). Climate change is expected to further change water quantity from early spring runoff peaking and decreased summer flows that are expected to further stress salmon populations. In addition to the four LSRD, there are 17 other upstream dams on the Snake River and its tributaries. These upriver dams include Dworshak Dam, operated by USACE, which blocks salmon passage to the Clearwater River, and the Hells Canyon Complex of Oxbow Dam, Brownlee Dam, and Hells Canyon Dam, owned by Idaho Power, which blocks fish passage to the upper Snake River below Shoshone Falls. Table 25 provides the dates and location of the large dams on the Snake River to illustrate when seasonal flow changed over time as the dams were built. Table 25: Construction of Dams on the Snake River
Dam Name River Mile Construction Start Construction End Brownlee 285 1955 1959 Oxbow 273 1957 1961 Hells Canyon 247 1964 1967 Dworshak Clearwater River 1966 1972 Lower Granite 107.5 1965 1975 Little Goose 70.3 1963 1970 Lower Monumental 41.6 1961 1969 Ice Harbor 9.7 1956 1961
Source: USACE
ECONorthwest 81
Sediment Transport From the energy conveyed through fluvial hydrology, rivers serve as a mechanism to distribute sand, silt, and clay sediment. Dams impede this movement and can result in large amounts of sediment accumulation due to the artificial barrier they impose. Chemical accumulation can also occur, and in the case of dam breaching can result in contamination downstream. For the LSRD, Lower Granite experiences the highest level of sediment and chemical accumulation due to its physical location as the most upstream dam in the reach (Clark et al. 2013). The U.S. Geological Survey estimates that Lower Granite reservoir received about 10 million tons of suspended sediment from the combined loads of the Snake and Clearwater rivers during water years 2009 to 2011. Average annual sediment inputs are approximately 2.3 million cubic yards (Ibid). Forest fires, heavy rain events, and rain-on-snow events can increase sedimentation. Dredging of the LSR pools has been conducted periodically to prevent sediment filling of the reservoir that might impair navigation and hydropower production. The USACE has also begun to manage sediment in upstream watersheds to prevent sediment accumulation before it reaches the reservoirs (Ibid). Sediment transport is a necessary part of river ecosystems as a mechanism for nutrient delivery. Downstream of dams, a lack of sediment can decrease food source diversity due to lack of nutrients and limit habitat options because of limited sediment types (Bednarek 2001). The water that is released from the reservoir is known as “clear water” because it is devoid of sediment which has settled in the reservoir. Efforts to increase sediment transport can occur through prescribed flooding or increased releases of water through dams that mimic natural peak flow timings (Ibid). When a dam is removed, the sudden flow of sediment results in high turbidity. The sediment can fill in spawning habitat and cover food sources. When the Conduit Dam was removed on the White Salmon River, the largest sediment release from dam removal in the United States, the downstream river was aggraded (i.e. filled with sediment) by 1.5 meters (Allen et al. 2016). To mitigate the short-term effects from lost spawning habitat on endangered salmon, fall Chinook salmon were transported to above the dam site before the dam removal. The Conduit Dam is 471 feet wide and 125 feet high – in comparison, the Lower Granite Dam is about 3,200 feet wide and 100 feet high, suggesting the potential sedimentation could be much larger. USACE estimated that water quality would be poor for up to three years after removal of the LSRD (USACE 2002d). Chemicals, from upstream agriculture and mining activities upstream, are a concern for the LSRD, as there have been high concentrations found of ammonia, DDT, manganese, and dioxin TEQ (Ibid). In the long term, water quality in the LSR is projected to improve with dam removal due to the improved nutrient dispersion from increased sediment transport.
ECONorthwest 82
Habitat Throughout the Columbia River system, spawning habitat for anadromous fish is limited by dam pools and blocked passage. On the Snake River, upstream fish passage is completely blocked by the Hells Canyon and Dworshak dams, as well as other upstream dams on tributaries. The Salmon River remains the largest free-flowing tributary within the Snake River system and one of the longest free-flowing river segments in the contiguous United States. Only about 58 percent of historical riverine habitats remain in the Snake River. However, 338 km of that habitat is upstream of Hells Canyon Complex which does not have fish ladders making it inaccessible to anadromous salmonids (Dauble et al. 2003), leaving only about 20 percent of historical spawning habitat available (NOAA 2015a). Fall Chinook salmon are most affected by habitat inundation from dams because they are mainstem spawners. Additionally, Chinook salmon are reliant on shoreline complexity (i.e., the littoral zone with varied pools, depths, and edges) for rearing (Dauble et al. 2003). Juvenile Coho, spring/summer Chinook and steelhead typically migrate as yearlings and tend to migrate further offshore in deeper water (Mains and Smith 1964; Smith 1974). There have been two large-scale dam removals in the Pacific Northwest that can inform expected outcomes for anadromous fish populations after removal. The Condit Dam was removed from the White Salmon River, also in the Columbia River Basin, in 2012. Upon removal, anadromous fish populations immediately utilized the over 30 miles of potential new spawning habitat. Similar results occurred in the two years after dam removal in the Elwha River, where over 75 percent of Chinook spawning occurred in previously blocked portions of the river (NPS 2013). These major dam removals occurred in systems where upstream passage was previously completely blocked by dams without fish ladders, but when removed anadromous fish quickly re-colonized historic spawning grounds. Although fish passage is possible at the LSRD, the dams have directly resulted in habitat loss from the conversion of 140 miles of river riverine habitat to slack water (USACE 2002b). In the 2002 EIS, USACE estimated that 3,550 acres of potential fall Chinook spawning habitat that had been inundated by the dams could be restored by removal. In addition to spawning habitat, USACE concluded that 770 acres of rearing habitat and about 160 miles of suitable shoreline habitat could be provided for fall Chinook salmon if the four dams were removed. With the dams in place, there is currently some fall Chinook spawning that occurs in the tailraces of the dams that would be lost if the dams are breached, although the loss could be offset by restoration (Dauble et al. 1999). Additional habitat and conversion from slack water to free-flow resulting from dam breaching would also benefit resident species, including Pacific lamprey and white sturgeon (Ibid).
7.2 Current Mortality Factors Smolt-to-Adult Return (SAR) is the primary statistic used to calculate the effectiveness of activities to increase anadromous fish survival. The SAR is a ratio of the number of juvenile fish making it to the ocean for every adult fish that spawns, effectively the number of offspring
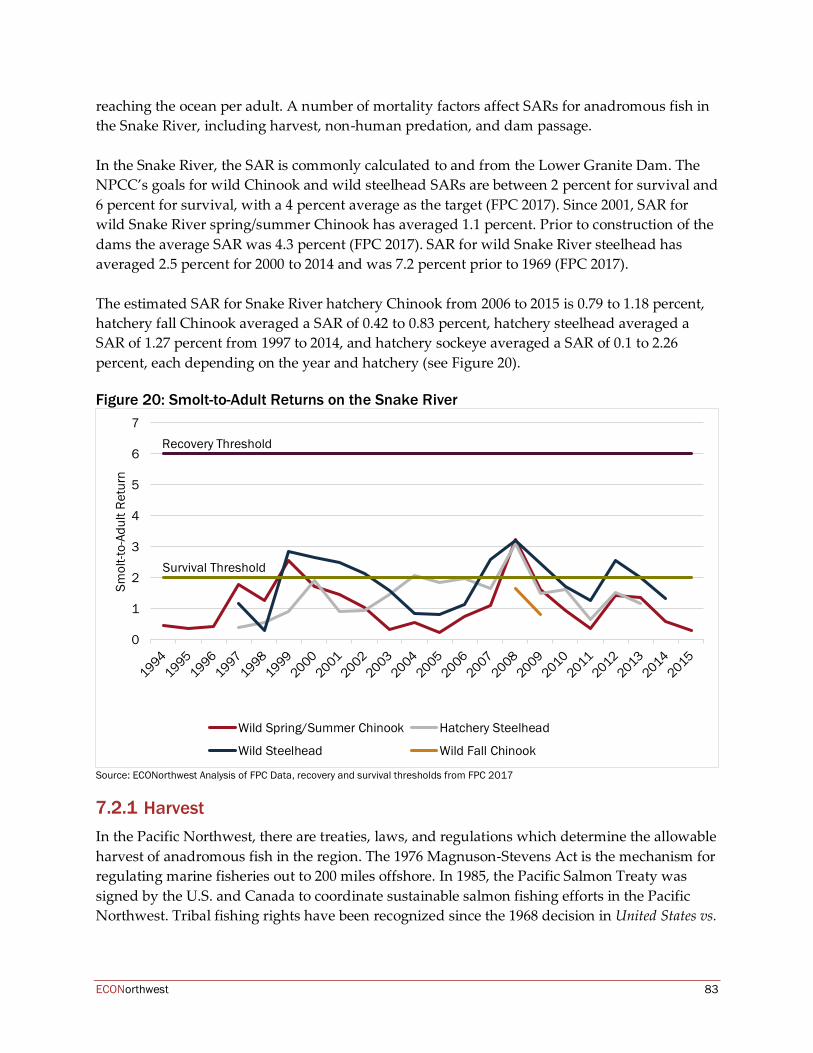
ECONorthwest 83
reaching the ocean per adult. A number of mortality factors affect SARs for anadromous fish in the Snake River, including harvest, non-human predation, and dam passage. In the Snake River, the SAR is commonly calculated to and from the Lower Granite Dam. The NPCC’s goals for wild Chinook and wild steelhead SARs are between 2 percent for survival and 6 percent for survival, with a 4 percent average as the target (FPC 2017). Since 2001, SAR for wild Snake River spring/summer Chinook has averaged 1.1 percent. Prior to construction of the dams the average SAR was 4.3 percent (FPC 2017). SAR for wild Snake River steelhead has averaged 2.5 percent for 2000 to 2014 and was 7.2 percent prior to 1969 (FPC 2017). The estimated SAR for Snake River hatchery Chinook from 2006 to 2015 is 0.79 to 1.18 percent, hatchery fall Chinook averaged a SAR of 0.42 to 0.83 percent, hatchery steelhead averaged a SAR of 1.27 percent from 1997 to 2014, and hatchery sockeye averaged a SAR of 0.1 to 2.26 percent, each depending on the year and hatchery (see Figure 20). Figure 20: Smolt-to-Adult Returns on the Snake River
Source: ECONorthwest Analysis of FPC Data, recovery and survival thresholds from FPC 2017
Harvest In the Pacific Northwest, there are treaties, laws, and regulations which determine the allowable harvest of anadromous fish in the region. The 1976 Magnuson-Stevens Act is the mechanism for regulating marine fisheries out to 200 miles offshore. In 1985, the Pacific Salmon Treaty was signed by the U.S. and Canada to coordinate sustainable salmon fishing efforts in the Pacific Northwest. Tribal fishing rights have been recognized since the 1968 decision in United States vs.
0
1
2
3
4
5
6
7
Smol
t-to-
Adul
t Ret
urn
Survival Threshold
Recovery Threshold
Wild Spring/Summer Chinook Hatchery Steelhead
Wild Steelhead Wild Fall Chinook
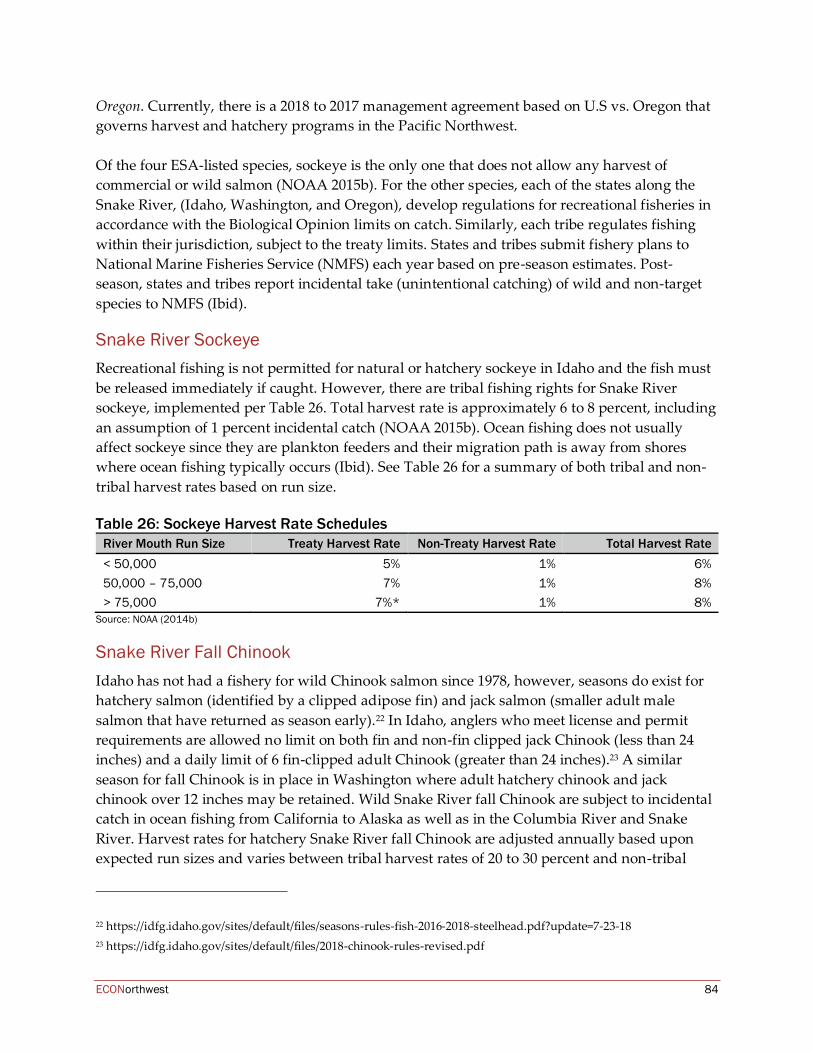
ECONorthwest 84
Oregon. Currently, there is a 2018 to 2017 management agreement based on U.S vs. Oregon that governs harvest and hatchery programs in the Pacific Northwest. Of the four ESA-listed species, sockeye is the only one that does not allow any harvest of commercial or wild salmon (NOAA 2015b). For the other species, each of the states along the Snake River, (Idaho, Washington, and Oregon), develop regulations for recreational fisheries in accordance with the Biological Opinion limits on catch. Similarly, each tribe regulates fishing within their jurisdiction, subject to the treaty limits. States and tribes submit fishery plans to National Marine Fisheries Service (NMFS) each year based on pre-season estimates. Post-season, states and tribes report incidental take (unintentional catching) of wild and non-target species to NMFS (Ibid).
Snake River Sockeye
Recreational fishing is not permitted for natural or hatchery sockeye in Idaho and the fish must be released immediately if caught. However, there are tribal fishing rights for Snake River sockeye, implemented per Table 26. Total harvest rate is approximately 6 to 8 percent, including an assumption of 1 percent incidental catch (NOAA 2015b). Ocean fishing does not usually affect sockeye since they are plankton feeders and their migration path is away from shores where ocean fishing typically occurs (Ibid). See Table 26 for a summary of both tribal and non-tribal harvest rates based on run size. Table 26: Sockeye Harvest Rate Schedules
River Mouth Run Size Treaty Harvest Rate Non-Treaty Harvest Rate Total Harvest Rate < 50,000 5% 1% 6% 50,000 – 75,000 7% 1% 8% > 75,000 7%* 1% 8%
Source: NOAA (2014b)
Snake River Fall Chinook Idaho has not had a fishery for wild Chinook salmon since 1978, however, seasons do exist for hatchery salmon (identified by a clipped adipose fin) and jack salmon (smaller adult male salmon that have returned as season early).22 In Idaho, anglers who meet license and permit requirements are allowed no limit on both fin and non-fin clipped jack Chinook (less than 24 inches) and a daily limit of 6 fin-clipped adult Chinook (greater than 24 inches).23 A similar season for fall Chinook is in place in Washington where adult hatchery chinook and jack chinook over 12 inches may be retained. Wild Snake River fall Chinook are subject to incidental catch in ocean fishing from California to Alaska as well as in the Columbia River and Snake River. Harvest rates for hatchery Snake River fall Chinook are adjusted annually based upon expected run sizes and varies between tribal harvest rates of 20 to 30 percent and non-tribal
22 https://idfg.idaho.gov/sites/default/files/seasons-rules-fish-2016-2018-steelhead.pdf?update=7-23-18 23 https://idfg.idaho.gov/sites/default/files/2018-chinook-rules-revised.pdf
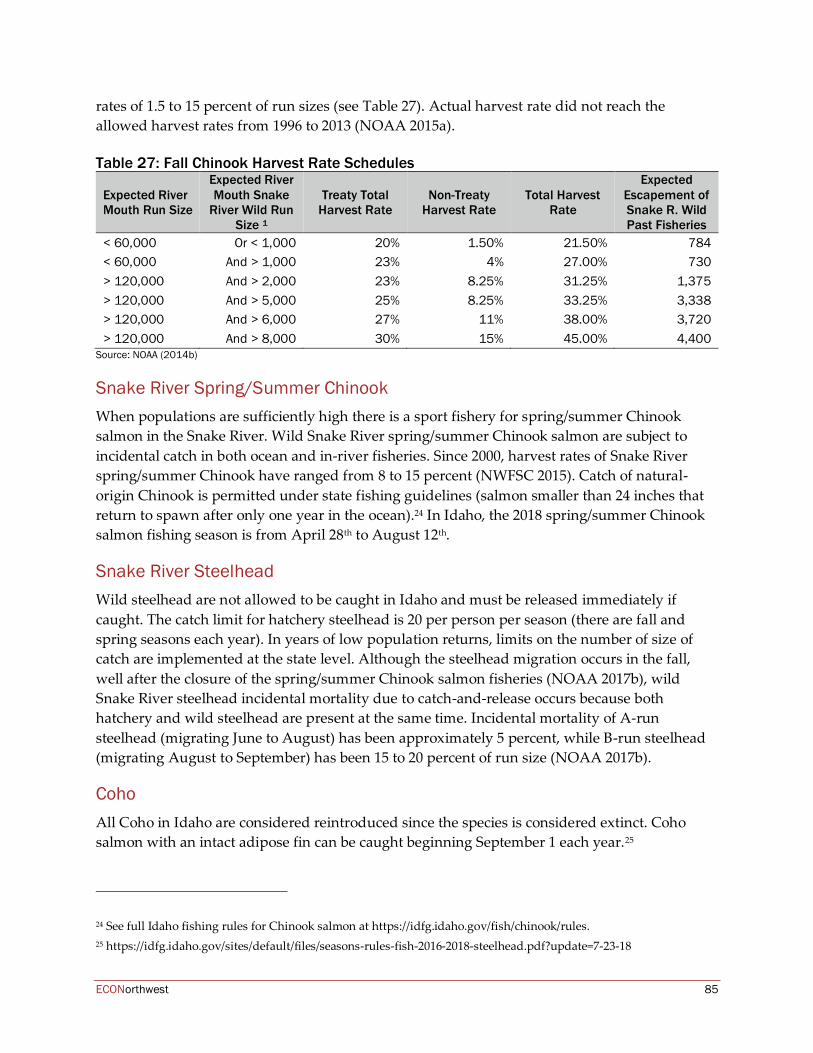
ECONorthwest 85
rates of 1.5 to 15 percent of run sizes (see Table 27). Actual harvest rate did not reach the allowed harvest rates from 1996 to 2013 (NOAA 2015a). Table 27: Fall Chinook Harvest Rate Schedules
Expected River Mouth Run Size
Expected River Mouth Snake
River Wild Run Size 1
Treaty Total Harvest Rate
Non-Treaty Harvest Rate
Total Harvest Rate
Expected Escapement of Snake R. Wild Past Fisheries
< 60,000 Or < 1,000 20% 1.50% 21.50% 784 < 60,000 And > 1,000 23% 4% 27.00% 730 > 120,000 And > 2,000 23% 8.25% 31.25% 1,375 > 120,000 And > 5,000 25% 8.25% 33.25% 3,338 > 120,000 And > 6,000 27% 11% 38.00% 3,720 > 120,000 And > 8,000 30% 15% 45.00% 4,400
Source: NOAA (2014b)
Snake River Spring/Summer Chinook When populations are sufficiently high there is a sport fishery for spring/summer Chinook salmon in the Snake River. Wild Snake River spring/summer Chinook salmon are subject to incidental catch in both ocean and in-river fisheries. Since 2000, harvest rates of Snake River spring/summer Chinook have ranged from 8 to 15 percent (NWFSC 2015). Catch of natural-origin Chinook is permitted under state fishing guidelines (salmon smaller than 24 inches that return to spawn after only one year in the ocean).24 In Idaho, the 2018 spring/summer Chinook salmon fishing season is from April 28th to August 12th.
Snake River Steelhead Wild steelhead are not allowed to be caught in Idaho and must be released immediately if caught. The catch limit for hatchery steelhead is 20 per person per season (there are fall and spring seasons each year). In years of low population returns, limits on the number of size of catch are implemented at the state level. Although the steelhead migration occurs in the fall, well after the closure of the spring/summer Chinook salmon fisheries (NOAA 2017b), wild Snake River steelhead incidental mortality due to catch-and-release occurs because both hatchery and wild steelhead are present at the same time. Incidental mortality of A-run steelhead (migrating June to August) has been approximately 5 percent, while B-run steelhead (migrating August to September) has been 15 to 20 percent of run size (NOAA 2017b).
Coho All Coho in Idaho are considered reintroduced since the species is considered extinct. Coho salmon with an intact adipose fin can be caught beginning September 1 each year.25
24 See full Idaho fishing rules for Chinook salmon at https://idfg.idaho.gov/fish/chinook/rules. 25 https://idfg.idaho.gov/sites/default/files/seasons-rules-fish-2016-2018-steelhead.pdf?update=7-23-18
ECONorthwest 86
Non-Human Predation For adult salmon and steelhead in the Columbia River Basin, the primary sources of predation are mammals, including humans, seals, sea lions, and whales. Adult salmon face predation in the ocean as well as their return migration through the freshwater system. Very little is known about the extent of ocean predation, although orcas, seals, and sea lions are all known to prey on anadromous fish. Juvenile salmon primarily face threats from fish-eating birds and predator fish species.
Orcas In the summer, the diet of Southern Resident Killer Whales primarily depends on salmon from the Fraser River in Canada (NOAA 2016b). They consume coho salmon in late summer and Puget Sound Chinook and chum salmon in fall (Ibid). They are also known to consume Columbia Basin salmon, as well as other stocks between Alaska and California (Ibid). This population segment of orcas has been federally listed as endangered since 2005. Although higher Chinook salmon populations would significantly contribute to the health of these orcas, NOAA has stated that the LSR would provide only a relatively small increase of the total Chinook available (Ibid).
Pinnipeds Between 2010 and 2015 the number of seals and sea lions at Bonneville Dam on the Columbia River has increased over 1,000 percent due to artificial opportunities to prey on salmon created by the dam, which has, in turn, has led to increased salmon mortality (ISAB 2016). Generally protected under the Marine Mammal Protection Act, since 2008 fish and wildlife agencies have received permits to use lethal methods to remove California sea lions that have been observed preying on salmon and steelhead. Since 2008, 191 California sea lions were euthanized, 15 were placed in zoos and aquariums, and 7 died accidentally in capture traps in the lower Columbia River (WDFW n.d.). A set of criteria have been in place in order for fishery managers to use lethal methods on sea lions including visual identification, observation eating salmon, presence of at least 5 days, and the animal must have subjected to but did not respond to non-lethal hazing (NOAA 2018). In 2019, the National Marine Fisheries Service announced new rules to relax some of the requirements for lethally removing sea lions in the Columbia River.
Piscivorous Fish The northern pikeminnow is a piscivorous fish that preys on juvenile salmonids in the Snake and Columbia rivers and is estimated to eat millions of fish from the Columbia River Basin every year (NPCC 2018). Pikeminnow target smolts in the tailraces of dams, where the fish are disoriented after passing through the dams (ISAB 2016). Annual mortality of juvenile salmonids just by the northern pikeminnow is estimated at 5 percent (Ibid). Since 1990, lethal removal of pikeminnow has decreased potential predation by up to 40 percent (ISAB 2016). Invasive fish species in the Columbia River Basin are also increasingly becoming significant sources of predation and include species of smallmouth bass, walleye, channel catfish, and
ECONorthwest 87
northern pike (Ibid). A study by Reiman et al. (1991) found that predation by other fish species of juvenile salmon and steelhead was as high as 2.7 million (between 7 and 61 percent of the smolt migration population) at John Day reservoir, a part of the Columbia River system. A recent study estimated the loss of subyearling fall Chinook salmon to smallmouth bass predation in the Lower Granite Reservoir in 2016 to be approximately 272,000 which is more than a four-fold increase since 1994 (estimated at 64 thousand) (Tiffan & Erhardt 2017). Furthermore, the authors estimate that between 3.6 and 14.8 percent of hatchery releases were consumed by smallmouth bass in 2016, representing an increase in both population and consumption rates of smallmouth bass.
Avian Species The avian predators for anadromous fish consist primarily of Caspian terns, double-crested cormorants, and gulls. These three species are estimated to kill between 15 to 20 million smolts per year, which is approximately 15 percent of all juvenile salmonids (ISAB 2016). Caspian terns predominantly nest on an artificial island (East Sand Island) in the mainstem of the Columbia and prey on smolts within the fly range of this locations. Cormorants and gulls prey on smolts in the tailraces of the dams and represent another source of population decline. There is evidence that smolts experience high levels of stress through barge or truck transportation and are more likely to experience avian predation because they will swim on the freshwater lens at the saltwater-freshwater interface, making them more visible (Budy et al. 2002).
Dam Passage
Downstream Juvenile Passage When migrating downstream, juvenile salmonids have various passage routes through dams, including via spillways, turbines, or through screens/bypasses. The different paths have varying impacts on juvenile mortality. A study by Muir et al. (2001) estimated survival rates for juvenile salmon through the LSRD as being the highest for spillways at 92.7 to 100 percent and lowest through turbines at 86.5 to 93.4 percent. These rates are often referred to as “at project” mortality. As part of the biological opinion issued for the Federal Columbia River Power System in 2002 and revisions thereafter, increased spill requirements were mandated for the LSRD. Augmented spill over the dams can increase the survival of smolts migrating to the ocean by reducing the number of fish passing through turbines and bypass systems. USACE also employs turbine diversion screens at all of the dams, thus reducing the number of fish passing through the turbines. Survival rates are even higher today due to fish passage and turbine operation upgrades at the dams since 2001. The 2008 Biological Opinion established standards for juvenile survival through dams at a rate of 96 percent for yearling Chinook and steelhead migrants and 93 percent for sub-yearling Chinook migrants through all eight of the Lower Snake and Lower Columbia River dams. Estimates of estimated survival from yearling Chinook ranged from 95.69 to 98.68 percent,
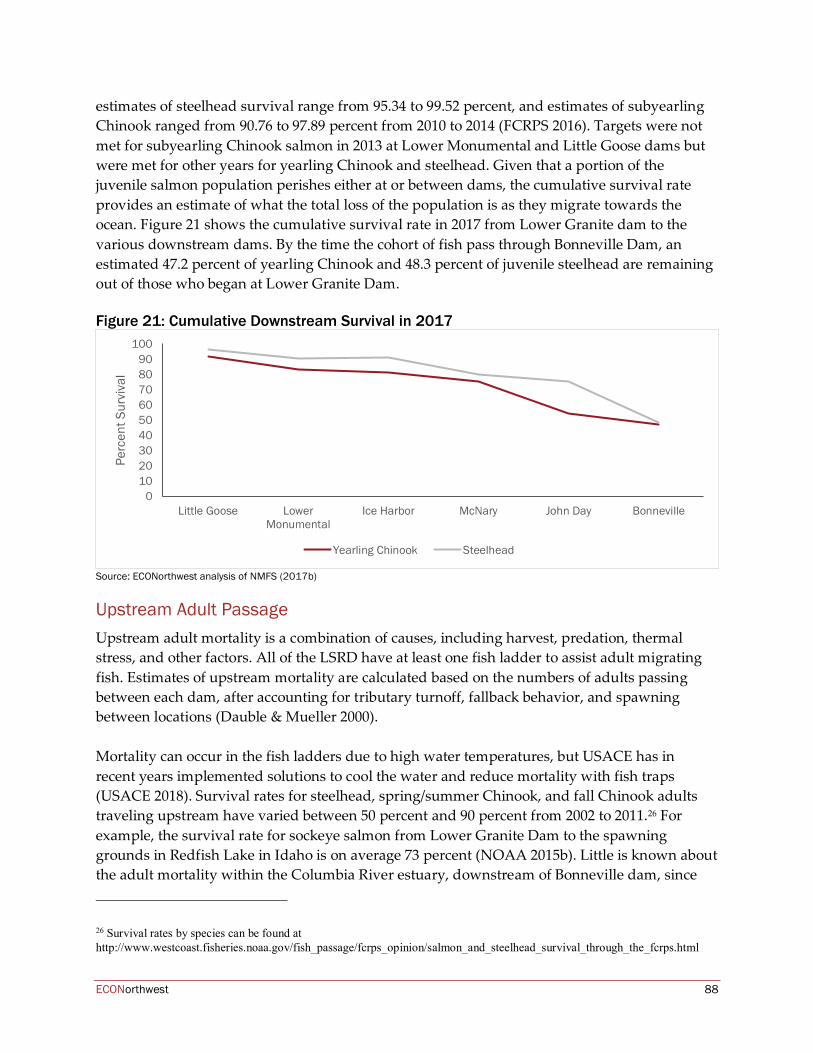
ECONorthwest 88
estimates of steelhead survival range from 95.34 to 99.52 percent, and estimates of subyearling Chinook ranged from 90.76 to 97.89 percent from 2010 to 2014 (FCRPS 2016). Targets were not met for subyearling Chinook salmon in 2013 at Lower Monumental and Little Goose dams but were met for other years for yearling Chinook and steelhead. Given that a portion of the juvenile salmon population perishes either at or between dams, the cumulative survival rate provides an estimate of what the total loss of the population is as they migrate towards the ocean. Figure 21 shows the cumulative survival rate in 2017 from Lower Granite dam to the various downstream dams. By the time the cohort of fish pass through Bonneville Dam, an estimated 47.2 percent of yearling Chinook and 48.3 percent of juvenile steelhead are remaining out of those who began at Lower Granite Dam. Figure 21: Cumulative Downstream Survival in 2017
Source: ECONorthwest analysis of NMFS (2017b)
Upstream Adult Passage Upstream adult mortality is a combination of causes, including harvest, predation, thermal stress, and other factors. All of the LSRD have at least one fish ladder to assist adult migrating fish. Estimates of upstream mortality are calculated based on the numbers of adults passing between each dam, after accounting for tributary turnoff, fallback behavior, and spawning between locations (Dauble & Mueller 2000). Mortality can occur in the fish ladders due to high water temperatures, but USACE has in recent years implemented solutions to cool the water and reduce mortality with fish traps (USACE 2018). Survival rates for steelhead, spring/summer Chinook, and fall Chinook adults traveling upstream have varied between 50 percent and 90 percent from 2002 to 2011.26 For example, the survival rate for sockeye salmon from Lower Granite Dam to the spawning grounds in Redfish Lake in Idaho is on average 73 percent (NOAA 2015b). Little is known about the adult mortality within the Columbia River estuary, downstream of Bonneville dam, since
26 Survival rates by species can be found at http://www.westcoast.fisheries.noaa.gov/fish_passage/fcrps_opinion/salmon_and_steelhead_survival_through_the_fcrps.html
0102030405060708090
100
Little Goose LowerMonumental
Ice Harbor McNary John Day Bonneville
Perc
ent S
urvi
val
Yearling Chinook Steelhead
ECONorthwest 89
there are no fish count mechanisms within the river, but a pilot study of radio-tagged fish in 2010 and 2011 suggested mortality rates from seawater to Bonneville Dam of 24 percent (Rub & Gilbreath 2010).
Water Quality
Gas Bubble Trauma Spilling of water from the LSRD has both benefits and drawbacks for juvenile salmon. Fish that pass in the spill avoid turbines but can be subjected to lethal conditions of total dissolved gas called gas bubble trauma. Gas bubble trauma occurs when nitrogen and oxygen gas bubbles form in the body tissue of the fish (WA DOE 2003). All the LSRD have been retrofitted with flow deflectors to minimize the production of TDG resulting from spills. Although the flow deflectors have been found to reduce TDG, they also increase juvenile fish mortality during a spill event (Muir et al. 2001). Long-term gas levels are expected to fall below the 110 percent standard after dam removal (USACE 2002d).
Contaminants The Environmental Protection Agency (EPA) has implemented Total Maximum Daily Loads (TDML) for the Snake River in Idaho that cover mercury, phosphorous, nuisance algae, pesticides, sediment, and temperature. Sections of the Snake River in Washington and Idaho have fish consumption advisories for resident fish due to the presence of mercury, however, no advisories apply to migratory fish in the river.
Temperature High water temperatures in the LSR have been well documented. The water quality standard set in the most recent biological opinion for temperature is 20C (68F) (FPC 2015). High temperatures increase the risk of mortality in salmon, but also contribute to migration delays, increased predation, and increased rates of disease. Length of exposure, access to cool water refuge, behavior, and life stage all factor into the effects of water temperature. Since 2003, releases of cold water have occurred from Dworshak Dam, upstream of the LSRD, in the late summer to reduce water temperatures in Lower Granite reservoir. This practice typically occurs in late summer to aid the survival of migrating adult Steelhead, Sockeye, and Chinook salmon. Despite these releases, water temperatures exceeding the 20C still occasionally occurs. In the summer of 2015, after a low snowpack winter, the water temperatures at all the FCRPS projects exceeded 68F during 35 to 46 percent of the adult passage season (April to August) (Ibid). Through computer simulations developed by the EPA, Shultz & Johnson (2015) predict that temperatures at the LSRD would be greatly reduced during the migration season with a free-flowing river. There is currently no total maximum daily load (TMDL) standard for
ECONorthwest 90
temperature in the Columbia River Basin. However, the EPA is currently in the process of establishing a TMDL for temperature in the Columbia River and Lower Snake River.27 Climate change is expected to increase the frequency of high water temperatures in the Columbia River Basin. Without considering changes to the timing of spring runoff and other hydrology variations, approximately 40 percent of salmon habitat in Oregon and Idaho and 22 percent of salmon habit in Washington will be lost by 2090 in a business as usual scenario with 5 degrees Celsius temperature increase by 2100 (ISAB 2007). These habitat losses could be offset if additional habitat was made available in higher river and stream reaches, which are often cooler due to the higher elevation. Increased water temperatures could also lead to smaller-sized juvenile salmon due to early maturation, higher adult mortality rates due to increased metabolic demand, and increased mortality from disease and parasites (Ibid).
Ocean Conditions Since late 2013, ocean temperatures have been abnormally warm in the north Pacific and this phenomenon, known as the “warm blob” is thought to have contributed to low survival rates for salmon (NOAA 2017). When juvenile salmon first migrate to the ocean, they are especially vulnerable due to the biological changes occurring when moving from freshwater to saltwater. The warm ocean temperatures are believed to lower the amount of nutritional food available to the juvenile salmon, and many are thought to have starved. Models of future ocean temperatures suggest warming ocean conditions are expected to continue. In 2015, there was also an El Niño weather pattern that caused warm air temperatures; due to the combination of the El Niño and the warm blob, adult salmon return populations are expected to be low through 2018 (Harrison 2018).
Timing of Outmigration The dams on the Snake River and Columbia River have altered former riverine habitats to a series of large, stair-step reservoirs. Smolts now take longer to migrate to the ocean due to reduced velocities in reservoirs (NOAA 2017b). Longer migration times may expose juvenile salmon to increased predation, depleted energy reserves, increased disease, and thermal stress. Transport of juvenile salmon by truck and barge is a way to increase migrating timing; however, depending on the development stage of the fish, can also result in premature sea-water entry for the juvenile salmon and decreased survival (Budy et al. 2002).
7.3 Environmental Mitigation
Hatchery Production Congress authorized the creation of the Lower Snake River Compensation Plan (LSRCP) in 1976 to construct fish hatcheries to compensate for the impacts of the dams on salmon and steelhead
27 https://www.epa.gov/columbiariver/managing-water-temperatures-columbia-and-lower-snake-rivers
ECONorthwest 91
populations. Ten hatcheries in Oregon, Washington, and Idaho supplied a total of 16.8 million juvenile salmon, steelhead, and trout to the LSR in 2002 (USFWS 2013). The goals of the program are to return 55,100 adult steelhead, 58,700 adult spring/summer Chinook salmon, and 18,300 fall Chinook salmon to the Snake River (Ibid). The LSRCP has an annual operating budget of $32 million and authorizes fish hatcheries to compensate for the lost Chinook and steelhead population resulting from dam activities. As of 2014, spring/summer Chinook are reared at six hatcheries (Tucannon, Lookingglass, Lyons Ferry, Sawtooth, McCall, Clearwater) to produce 6.75 million smolts, fall Chinook are reared at one hatchery (Lyons Ferry) to produce 4.6 million sub-yearling smolts, and steelhead are reared at five hatcheries (Wallowa, Irrigon, Magic Valley, McCall, Clearwater) to produce 5.35 million smolts. Separate from the LSRCP, there are also hatchery efforts for the endangered Snake River sockeye conducted in collaboration with NOAA, Idaho Department of Fish and Game, the Shoshone-Bannock Tribes of Idaho, and BPA. In 1991, only 16 Redfish lake sockeye returned to spawn. From the genetic material of those last surviving fish, the hatchery program has produced over 3.8 million eggs and over 4,300 adults (Northwest Fisheries Science Center 2018). Without the hatchery program, it is very likely that Snake River sockeye would now be extinct (Ibid). There has been significant research into hatchery programs over the last few decades. Concerns about hatchery programs are primarily focused on competition for resources and interbreeding of gene pools causing genetic changes that can make salmon less suitable to environmental conditions (Brannon et al. 2004). Despite these concerns, hatchery fish are widely viewed as necessary to preventing species extinction, providing a food source for species like orcas, and allowing for commercial and recreational fishing opportunities (Ibid). Both hatchery and wild fish are part of the evolutionarily significant units for all four of the Snake River listed anadromous fish.28
Salmon Transport USACE operates the Juvenile Fish Transportation Plan for the Snake River. This program was initiated in the 1970s and fully implemented by 1981. On their outmigration to the Pacific Ocean, juvenile salmon and steelhead are collected at three facilities (Lower Granite, Little Goose, and Lower Monumental dams) and are then transported via truck or barge and released below Bonneville Dam. Transporting the fish allows them to avoid passing through turbines, gas bubble trauma, water contamination, and predator species. Depending on river conditions,
28 https://www.westcoast.fisheries.noaa.gov/protected_species/salmon_steelhead/salmon_and_steelhead_listings/sal mon_and_steelhead_listings.html
ECONorthwest 92
the Walla Walla District transports between 15 to 22 million fish per year, with a target of transporting approximately 50 percent of juvenile steelhead.29 A study by McMichael et al. (2011) estimated survival of 2 percent for yearling Chinook from Lower Granite Dam to Bonneville Dam in 2010. The mortality rate for fish that migrate in-river is estimated to be much higher at over 50 percent (Budy et al. 2002). However, there are hypotheses that “delayed mortality” can occur for transported fish due to stressors that increase total mortality (Budy et al. 2002; McMichael et al. 2011). Despite the increased survival rate for transported fish, research has found evidence that delayed mortality occurs for transported fish that can offset the initial advantage. There is evidence that the stress from transportation can leave the smolts more susceptible to disease (Ibid). Transporting may also affect the salmon’s return migration to spawn because they have not imprinted in the river. Returning adult chinook and steelhead that have been transported as juveniles suffer from decreased “homing” through unaccounted loss and increased straying into non-natal basins. A study performed for the USACE in 2006 found a 10 percent decrease in homing for barged salmon at the Lower Granite Dam than fish that had migrated in-river.
Enhanced Fish Passage USACE has invested $1.8 billion in fish passage improvements in the FCRPS since 2001.30 Lower Granite Dam is in the process of upgrading fish passage facilities, which has already been done at the Ice Harbor, Lower Monumental, and Little Goose dams. Recent upgrades to these dams include elevated flumes, pressurized bypass systems, new passive integrated transponder tag detection, augmented fish ladder flow, enlarged fish passage channels, a new emergency bypass structure, and other upgrades (USACE 2016c). Spillway weirs were installed at all the LSRD from 2001 to 2009 to improve juvenile fish passage by raising the underwater passageway from 10 to 60 feet to match the swimming pattern closer to the water surface (Ibid). Since 2003, Idaho Power has been in the process of relicensing the Hells Canyon Complex, the Hells Canyon, Brownlee and Oxbow dams upstream of the LSRD. Because these dams are on the river between Idaho and Oregon, they are subject to the laws of both states. Oregon administrative rules (OAR 635-412-0010, ratified in 2006) requires fish passage for dams as part of a dam’s relicensing process (ODFW 2016). As a later consequence of Oregon’s approach to fish passage and relicensing, and at the request of the Idaho Water Users Association, Idaho passed HB 169 in 2017 which requires legislative approval for the reintroduction of any species into Idaho waters. These two state laws directly conflict, and spurred lawsuits to determine what fish passage requirements will be associated with the relicensing. Idaho Power is continuing to operate the Hells Canyon Complex on temporary annual licenses. In the 2005 Final Environmental Impact Statement, the conditions of the relicense did not consider or
29 http://www.nww.usace.army.mil/Missions/Fish-Programs/ 30 https://www.salmonrecovery.gov/Hydro/Structuralimprovements.aspx
ECONorthwest 93
require installation of fish passage at the Hells Canyon Complex because critical habitat has not been designated upstream of these dams – the listed species are considered extirpated from the Upper Snake River, despite this portion of the river being part of the historical habitat range (FERC 2007). In April 2019, the governors of Oregon and Idaho announced agreement that avoids reintroduction of populations that would trigger ESA on the requirement that the Idaho utility spend over $300 million on water quality and habitat improvements.31
Predator Management Efforts to manage levels of predation have been taken by fish and wildlife agencies in coordination with NOAA and USACE. According to the Northwest Power Conservation Council, current programs include:
• Lethal removal of northern pikeminnow through sport-fishing prizes; • Deterrents and lethal methods to remove avian predators, primarily ringed-bill gulls,
California gulls, and double-crested cormorants at dams; • Non-lethal and lethal efforts to reduce the number of Caspian terns and double-crested
cormorants on dredge spoil islands in the lower Columbia River and estuary; • Redistribution of Caspian terns from Goose and Crescent Island nesting colonies in the
mid-Columbia River to other nesting sites in the western United States; and • Non-lethal and lethal methods to control predation by pinnipeds, primarily California
sea lions at Bonneville Dam (2016).
Additionally, WDFW has lifted harvest regulations on smallmouth bass and walleye in an effort to reduce predation rates on juvenile salmonids.
7.4 Dam Removal Impacts Removal of the LSRD could increase salmon populations by lowering mortality risk and increasing available habitat. However, there are also alternatives to achieving their goals which could be accomplished through actions other than dam removal. This section will discuss how dam removal is expected to impact anadromous fish species. From the 2002 EIS, recovery goals for the species are defined as “60 percent of the average spawner counts from before the 1971 brood year.” In Table 4-4 of Appendix A from the 2002 EIS, dam breaching (Actions A3 and B1) is associated with 69 to 85 percent chance of meeting recovery goals for spring/summer Chinook, compared with only 47 to 65 percent for no breach scenarios (Actions A1 and A2). Based on these numbers, the chance of meeting the recovery goals is estimated to be approximately 20 percent higher with dam removal for spring/summer Chinook. For fall Chinook, a petition to delist the species was submitted in 2015 (NOAA 2016c). Although NOAA Fisheries declined the request to delist, citing genetic diversity risk and uncertainty, it is possible that fall Chinook will be delisted in the near future without additional
31 https://www.oregon.gov/newsroom/Pages/NewsDetail.aspx?newsid=3251
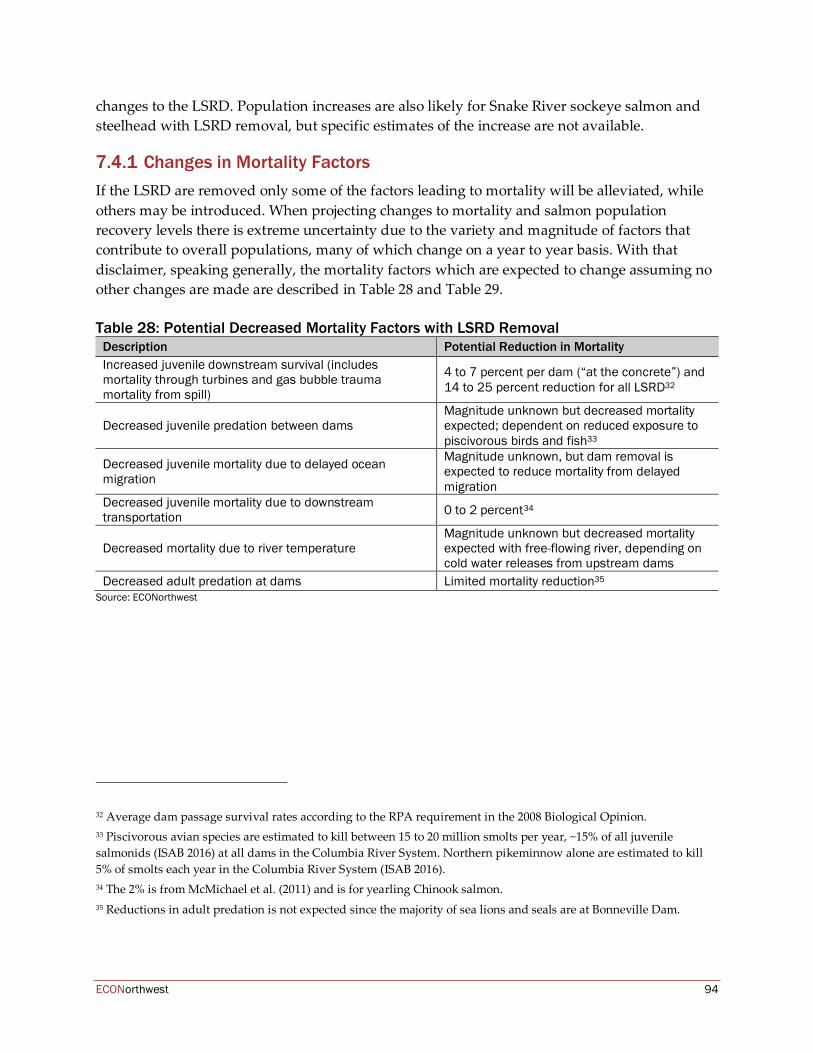
ECONorthwest 94
changes to the LSRD. Population increases are also likely for Snake River sockeye salmon and steelhead with LSRD removal, but specific estimates of the increase are not available.
Changes in Mortality Factors If the LSRD are removed only some of the factors leading to mortality will be alleviated, while others may be introduced. When projecting changes to mortality and salmon population recovery levels there is extreme uncertainty due to the variety and magnitude of factors that contribute to overall populations, many of which change on a year to year basis. With that disclaimer, speaking generally, the mortality factors which are expected to change assuming no other changes are made are described in Table 28 and Table 29. Table 28: Potential Decreased Mortality Factors with LSRD Removal
Description Potential Reduction in Mortality Increased juvenile downstream survival (includes mortality through turbines and gas bubble trauma mortality from spill)
4 to 7 percent per dam (“at the concrete”) and 14 to 25 percent reduction for all LSRD32
Decreased juvenile predation between dams Magnitude unknown but decreased mortality expected; dependent on reduced exposure to piscivorous birds and fish33
Decreased juvenile mortality due to delayed ocean migration
Magnitude unknown, but dam removal is expected to reduce mortality from delayed migration
Decreased juvenile mortality due to downstream transportation 0 to 2 percent34
Decreased mortality due to river temperature Magnitude unknown but decreased mortality expected with free-flowing river, depending on cold water releases from upstream dams
Decreased adult predation at dams Limited mortality reduction35 Source: ECONorthwest
32 Average dam passage survival rates according to the RPA requirement in the 2008 Biological Opinion. 33 Piscivorous avian species are estimated to kill between 15 to 20 million smolts per year, ~15% of all juvenile salmonids (ISAB 2016) at all dams in the Columbia River System. Northern pikeminnow alone are estimated to kill 5% of smolts each year in the Columbia River System (ISAB 2016). 34 The 2% is from McMichael et al. (2011) and is for yearling Chinook salmon. 35 Reductions in adult predation is not expected since the majority of sea lions and seals are at Bonneville Dam.
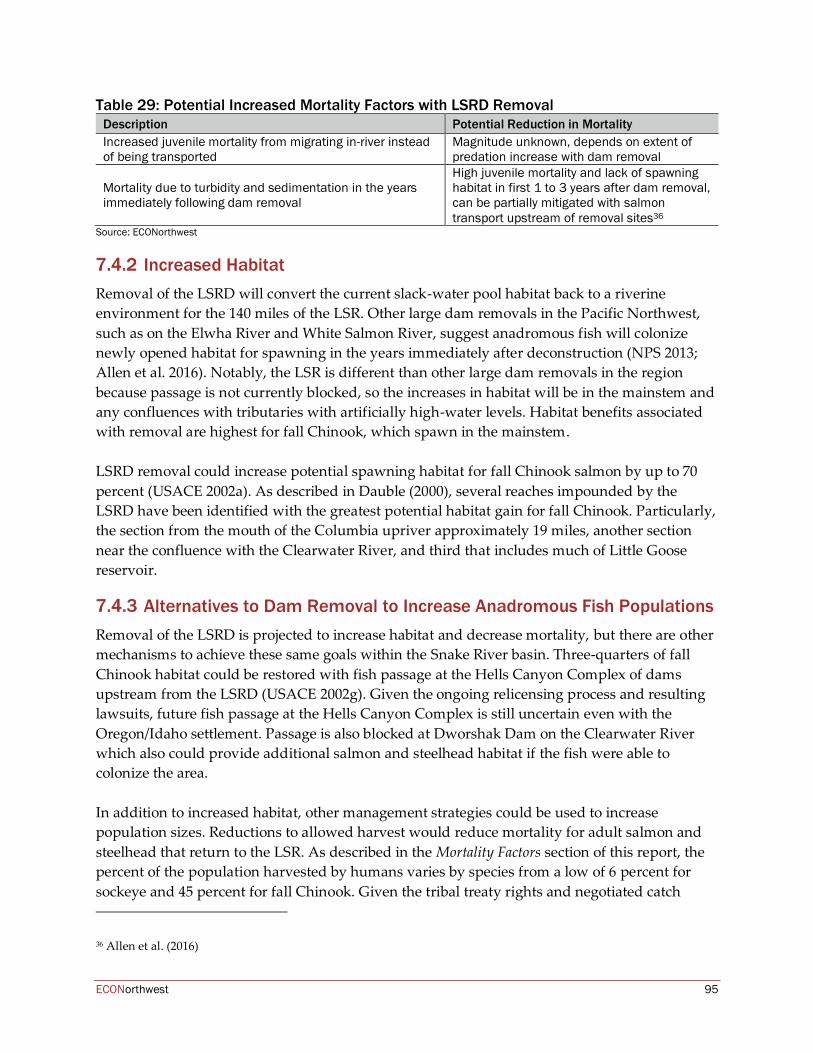
ECONorthwest 95
Table 29: Potential Increased Mortality Factors with LSRD Removal Description Potential Reduction in Mortality Increased juvenile mortality from migrating in-river instead of being transported
Magnitude unknown, depends on extent of predation increase with dam removal
Mortality due to turbidity and sedimentation in the years immediately following dam removal
High juvenile mortality and lack of spawning habitat in first 1 to 3 years after dam removal, can be partially mitigated with salmon transport upstream of removal sites36
Source: ECONorthwest
Increased Habitat Removal of the LSRD will convert the current slack-water pool habitat back to a riverine environment for the 140 miles of the LSR. Other large dam removals in the Pacific Northwest, such as on the Elwha River and White Salmon River, suggest anadromous fish will colonize newly opened habitat for spawning in the years immediately after deconstruction (NPS 2013; Allen et al. 2016). Notably, the LSR is different than other large dam removals in the region because passage is not currently blocked, so the increases in habitat will be in the mainstem and any confluences with tributaries with artificially high-water levels. Habitat benefits associated with removal are highest for fall Chinook, which spawn in the mainstem. LSRD removal could increase potential spawning habitat for fall Chinook salmon by up to 70 percent (USACE 2002a). As described in Dauble (2000), several reaches impounded by the LSRD have been identified with the greatest potential habitat gain for fall Chinook. Particularly, the section from the mouth of the Columbia upriver approximately 19 miles, another section near the confluence with the Clearwater River, and third that includes much of Little Goose reservoir.
Alternatives to Dam Removal to Increase Anadromous Fish Populations Removal of the LSRD is projected to increase habitat and decrease mortality, but there are other mechanisms to achieve these same goals within the Snake River basin. Three-quarters of fall Chinook habitat could be restored with fish passage at the Hells Canyon Complex of dams upstream from the LSRD (USACE 2002g). Given the ongoing relicensing process and resulting lawsuits, future fish passage at the Hells Canyon Complex is still uncertain even with the Oregon/Idaho settlement. Passage is also blocked at Dworshak Dam on the Clearwater River which also could provide additional salmon and steelhead habitat if the fish were able to colonize the area. In addition to increased habitat, other management strategies could be used to increase population sizes. Reductions to allowed harvest would reduce mortality for adult salmon and steelhead that return to the LSR. As described in the Mortality Factors section of this report, the percent of the population harvested by humans varies by species from a low of 6 percent for sockeye and 45 percent for fall Chinook. Given the tribal treaty rights and negotiated catch 36 Allen et al. (2016)
ECONorthwest 96
limits in the 2018-2027 United States v. Oregon Management Agreement, regulatory changes to fishing levels are unlikely. Mortality caused by birds, pinnipeds, and piscivorous fish could be minimized if these species were systematically removed from LSR salmon habitat. Population control efforts such as these have been in effect for years in the Columbia River Basin with mixed success, so the feasibility of and return from additional efforts is unclear. Another direct way to increase population sizes is through the hatchery programs. More hatchery production could increase population sizes up to the carrying capacity of the available habitat. However, abundance is not the only criteria needed to recover salmon populations. Delisting decisions are also made based on growth rate, spatial structure, and genetic diversity within the evolutionarily significant unit of the species (NMFS 2016c). Even if delisted, the Snake River anadromous fish can only recover to the extent to which they have habitat available and their ability to survive in the dammed river. Without removal of the LSRD or mechanisms implemented for upstream passage at Hells Canyon Complex or Dworshak Dam, the population sizes of Snake River species will be limited by carrying capacity of their current territory and the threats imposed by the dams.
7.5 Ecosystem Service Values The term “ecosystem services” carries a wide interpretation depending on the respective field of scientific study. The United Nation’s Millennium Ecosystem Assessment defines the term as “the benefits people obtain from ecosystems. These include provisioning services such as food and water; regulating services such as flood and disease control; cultural services such as spiritual, recreational, and cultural benefits; and supporting services, such as nutrient cycling, that maintain the conditions for life on Earth”. This report adheres to this same definition; however, delineations are made based on economic theory and empirical measurement techniques, focusing not on defining the specific flow of benefits but rather the tradeoffs that individuals make in relation to them. The ecosystem service values provided by the LSR (in any operational scenario) are broken out below into property value impacts, recreational use values, and non-use values.
Property Value Impacts Given the small amount of existing residential land adjacent to the LSR, it is unclear whether any change will occur because of any of the operational scenarios. It is conceivable that new residential demand may exist along the free-flowing stretches of the river. A handful of papers have attempted to measure the impacts of hydropower dams (and their removal) on property values. Bohlen and Lewis (2009) perform a GIS-linked hedonic property value model along the Penobscot and Kennebec Rivers in Maine and find a small premium for properties near a hydropower dam, but they caution that the statistical significance of their result is dependent on the specification used. A similar application and result are noted in Lewis et al. (2008). An
ECONorthwest 97
evaluation of small dams in Wisconsin in Provencher (2008) found small benefits to homes located along impoundments as opposed to free-flowing rivers.
Recreational Use
Existing Uses The USACE currently operates 58 recreational facilities along the LSR. These include visitor centers, parks, boat ramps, fishing sites, campgrounds, and habitat management areas which allow access for fishing, hunting, wildlife viewing, and other forms of general outdoor recreation. Some of the activities that are associated with a natural environment may benefit from the removal of the LSRD, while others (particularly lake-based motorized boating) that depend on the current reservoirs will be diminished. Generally, motorized boaters incur higher expenditures on boat maintenance, trailering, and use. At the same time, these users tend to travel shorter distances and have lower per-trip recreational use values than other types of recreational use.37 The U.S. Geological Survey maintains a database of empirically measured recreational use values, and for studies conducted in the contiguous United States, non-motorized boating and whitewater recreational use values are approximately 15 percent and 155 percent larger than motorized boating values, respectively. Although the per-trip net welfare gain may be positive from removal of the LSRD because of a switch from slack water to riverine recreation, if these user groups are mutually exclusive, then motorized boaters will incur welfare losses while non-motorized boaters will benefit. McKean et al. (2012, 2005) used a revealed preference approach to measure non-fishing recreational use at the LSR reservoirs and found a per-person per trip value of $7.41 – suggesting that motorized boaters would lose approximately this amount per person per trip if the LSRD are removed.
Potential Future Uses Underneath the reservoirs impounded by the LSRD lie potential whitewater recreational resources. Prior to the construction of the dams, the USACE surveyed and identified 63 named rapids between Lewiston, Idaho and the confluence with the Columbia River. Whitewater recreation occurs in kayaks, canoes, rafts, drift-boats and more recently, stand-up-paddle boards. Rivers are rated in difficulty depending on the skills required to navigate a river, the risk and consequences of making a mistake, and accessibility in case rescue is necessary. This widely accepted classification system rates rivers from class I to VI, with more difficult rivers requiring a unique set of skills and equipment, and easier rivers accessible to a broader user group.
37 Recreational use values, also known as consumer surplus, are a measure of an individual’s willingness to pay minus the amount actually paid. For recreational experiences, it represents the excess value of the trip realized by the recreational participant.
ECONorthwest 98
While the specific conditions that will recur following breach of the LSRD are difficult to predict, the gradient of the river can help generally determine the ultimate river classification. For example, the section of the Snake River from Hells Canyon Dam to Pittsburg Landing has an average gradient of 12 feet per mile over its 32-mile stretch and is classified as a Class III-IV run by American Whitewater. The section of the Snake River from the Heller Bar boat ramp to the confluence with the Clearwater River has an average gradient of 4 feet per mile and is rated as Class I to II. On the other hand, the “Golden Run” section of the south fork of the Clearwater River has an average gradient of 85 feet per mile and is rated Class IV to V. The rapids identified by the USACE prior to construction of the LSRD were not classified in difficulty. To understand the change in the river gradient and potential classification of the whitewater resources if the LSRD are removed, GIS analysis was performed based on historical topographical maps of the LSR created by the USACE in 1934 along with other maps created between 1950 and 1971.38 In-river elevation was identified based upon where the topographical line crossed the river and the associated river mile to create an elevation point. There were 65 elevation points over approximately 141 river miles, which were used to calculate the change in river gradient. The elevation change between points with elevation data was divided by the length of the river between the points to yield feet per mile. See Figure 22 for the results of the analysis.
38 Obtained from USGS TopoView: https://ngmdb.usgs.gov/topoview/viewer/#4/40.01/-100.06
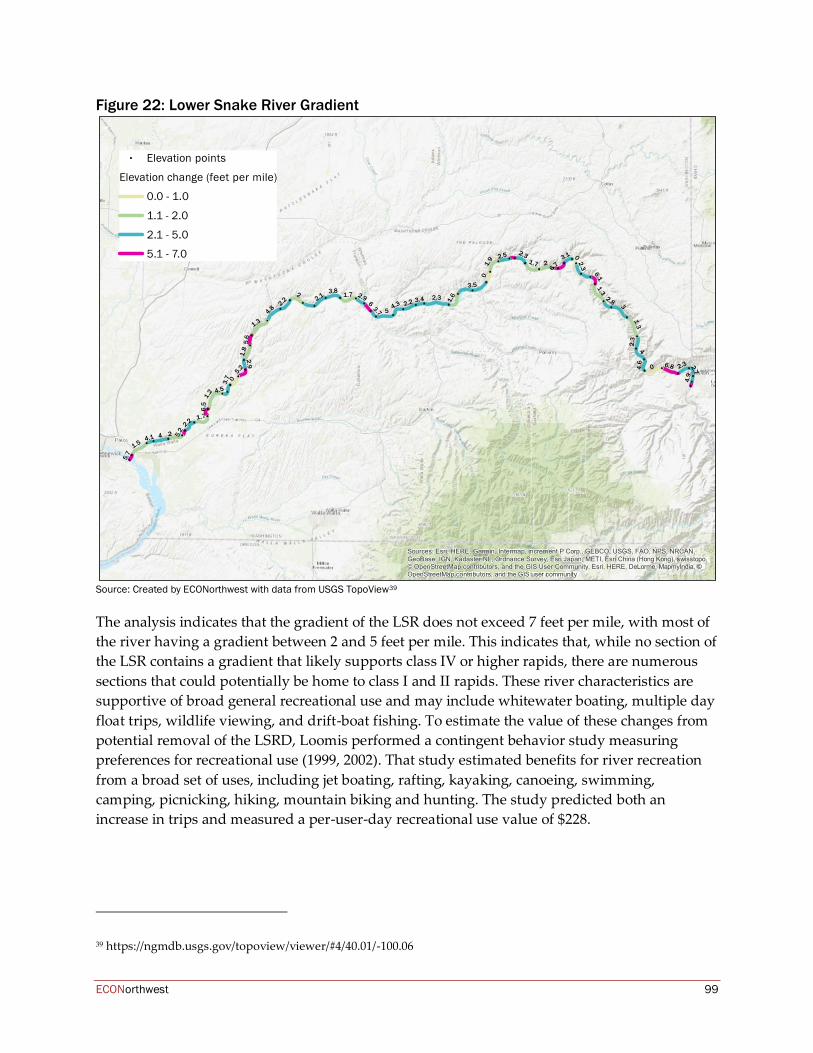
ECONorthwest 99
Figure 22: Lower Snake River Gradient
Source: Created by ECONorthwest with data from USGS TopoView39
The analysis indicates that the gradient of the LSR does not exceed 7 feet per mile, with most of the river having a gradient between 2 and 5 feet per mile. This indicates that, while no section of the LSR contains a gradient that likely supports class IV or higher rapids, there are numerous sections that could potentially be home to class I and II rapids. These river characteristics are supportive of broad general recreational use and may include whitewater boating, multiple day float trips, wildlife viewing, and drift-boat fishing. To estimate the value of these changes from potential removal of the LSRD, Loomis performed a contingent behavior study measuring preferences for recreational use (1999, 2002). That study estimated benefits for river recreation from a broad set of uses, including jet boating, rafting, kayaking, canoeing, swimming, camping, picnicking, hiking, mountain biking and hunting. The study predicted both an increase in trips and measured a per-user-day recreational use value of $228.
39 https://ngmdb.usgs.gov/topoview/viewer/#4/40.01/-100.06
5.7
5.2
4.9
0
4.5
4.13.7
3.7
6.7
3.4
6.5
6.1
3.1
2.9
6
2.9
5.6
2.8
2.75.2
0
2.5 2.3
2.2
0
4.6
2.3
2.3
2.3
4.3 2.22.2
2.1
4
2
24
21.9
3.8
1.8
3.5
1.7
6.8
1.7
5
1.6
1.7
4.8
0
3
1.5
1.3
1.31.3
1.2
2.3
Sources: Esri, HERE, Garmin, Intermap, increment P Corp., GEBCO, USGS, FAO, NPS, NRCAN,GeoBase, IGN, Kadaster NL, Ordnance Survey, Esri Japan, METI, Esri China (Hong Kong), swisstopo,© OpenStreetMap contributors, and the GIS User Community, Esri, HERE, DeLorme, MapmyIndia, ©OpenStreetMap contributors, and the GIS user community
Elevation points
Elevation change (feet per mile)
0.0 - 1.0
1.1 - 2.0
2.1 - 5.0
5.1 - 7.0
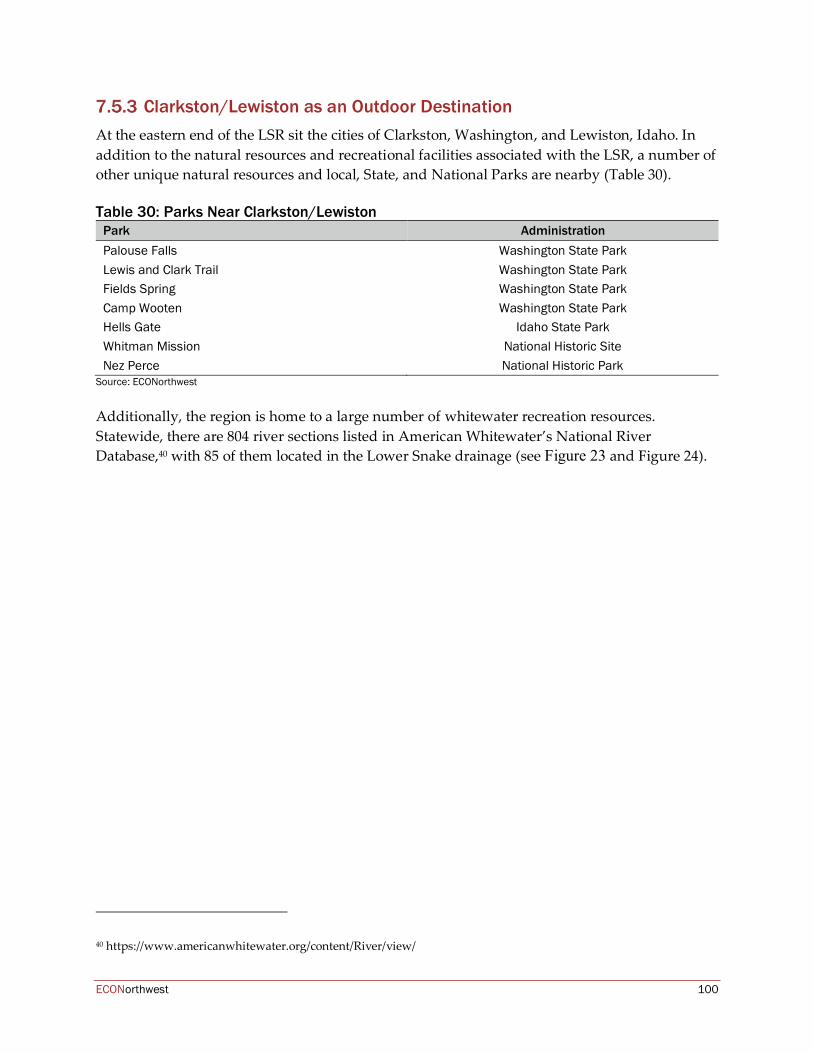
ECONorthwest 100
Clarkston/Lewiston as an Outdoor Destination At the eastern end of the LSR sit the cities of Clarkston, Washington, and Lewiston, Idaho. In addition to the natural resources and recreational facilities associated with the LSR, a number of other unique natural resources and local, State, and National Parks are nearby (Table 30). Table 30: Parks Near Clarkston/Lewiston
Park Administration Palouse Falls Washington State Park Lewis and Clark Trail Washington State Park Fields Spring Washington State Park Camp Wooten Washington State Park Hells Gate Idaho State Park Whitman Mission National Historic Site Nez Perce National Historic Park
Source: ECONorthwest
Additionally, the region is home to a large number of whitewater recreation resources. Statewide, there are 804 river sections listed in American Whitewater’s National River Database,40 with 85 of them located in the Lower Snake drainage (see Figure 23 and Figure 24).
40 https://www.americanwhitewater.org/content/River/view/
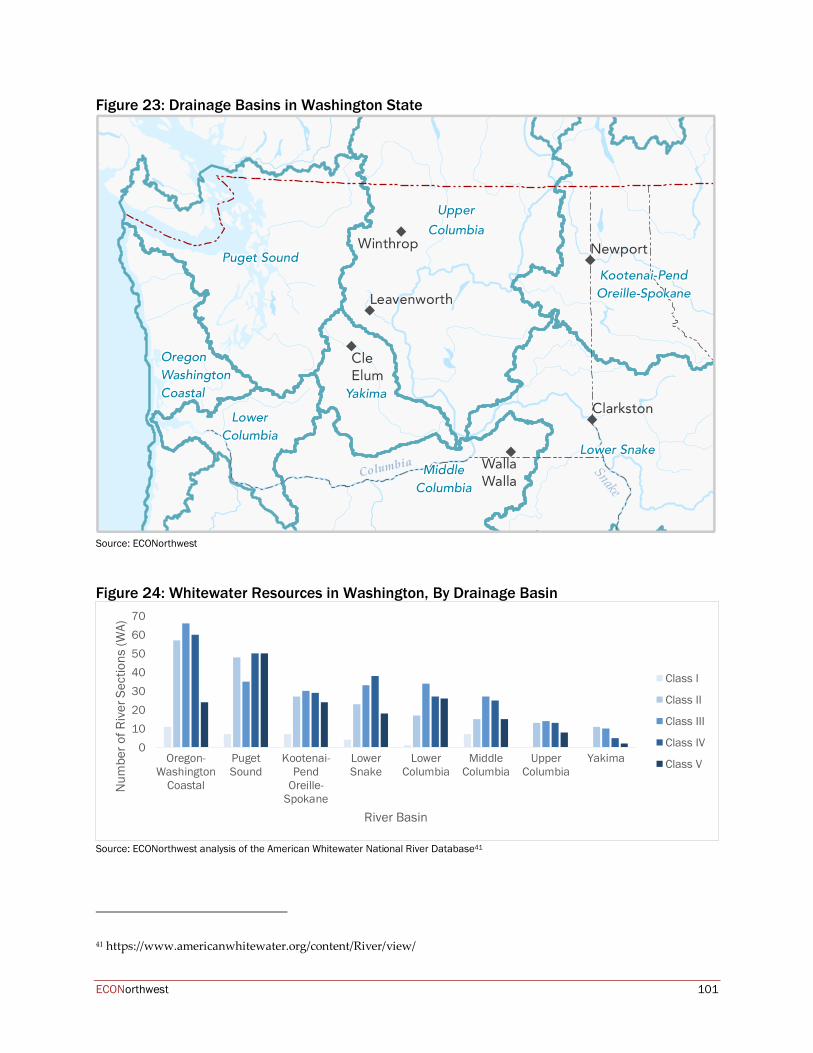
ECONorthwest 101
Figure 23: Drainage Basins in Washington State
Source: ECONorthwest
Figure 24: Whitewater Resources in Washington, By Drainage Basin
Source: ECONorthwest analysis of the American Whitewater National River Database41
41 https://www.americanwhitewater.org/content/River/view/
010203040506070
Oregon-Washington
Coastal
PugetSound
Kootenai-Pend
Oreille-Spokane
LowerSnake
LowerColumbia
MiddleColumbia
UpperColumbia
Yakima
Num
ber o
f Riv
er S
ectio
ns (W
A)
River Basin
Class I
Class II
Class III
Class IV
Class V
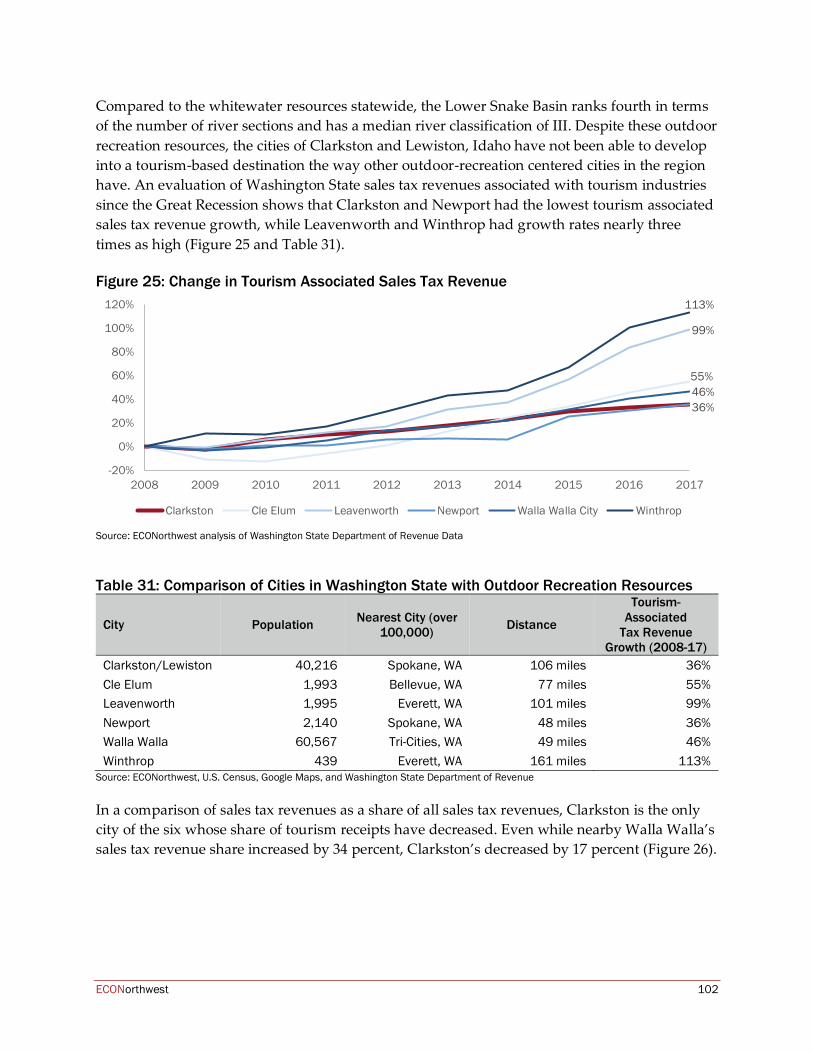
ECONorthwest 102
Compared to the whitewater resources statewide, the Lower Snake Basin ranks fourth in terms of the number of river sections and has a median river classification of III. Despite these outdoor recreation resources, the cities of Clarkston and Lewiston, Idaho have not been able to develop into a tourism-based destination the way other outdoor-recreation centered cities in the region have. An evaluation of Washington State sales tax revenues associated with tourism industries since the Great Recession shows that Clarkston and Newport had the lowest tourism associated sales tax revenue growth, while Leavenworth and Winthrop had growth rates nearly three times as high (Figure 25 and Table 31). Figure 25: Change in Tourism Associated Sales Tax Revenue
Source: ECONorthwest analysis of Washington State Department of Revenue Data
Table 31: Comparison of Cities in Washington State with Outdoor Recreation Resources
City Population Nearest City (over 100,000) Distance
Tourism-Associated
Tax Revenue Growth (2008-17)
Clarkston/Lewiston 40,216 Spokane, WA 106 miles 36% Cle Elum 1,993 Bellevue, WA 77 miles 55% Leavenworth 1,995 Everett, WA 101 miles 99% Newport 2,140 Spokane, WA 48 miles 36% Walla Walla 60,567 Tri-Cities, WA 49 miles 46% Winthrop 439 Everett, WA 161 miles 113%
Source: ECONorthwest, U.S. Census, Google Maps, and Washington State Department of Revenue
In a comparison of sales tax revenues as a share of all sales tax revenues, Clarkston is the only city of the six whose share of tourism receipts have decreased. Even while nearby Walla Walla’s sales tax revenue share increased by 34 percent, Clarkston’s decreased by 17 percent (Figure 26).
55%
99%
36%46%
113%
-20%
0%
20%
40%
60%
80%
100%
120%
2008 2009 2010 2011 2012 2013 2014 2015 2016 2017
Clarkston Cle Elum Leavenworth Newport Walla Walla City Winthrop
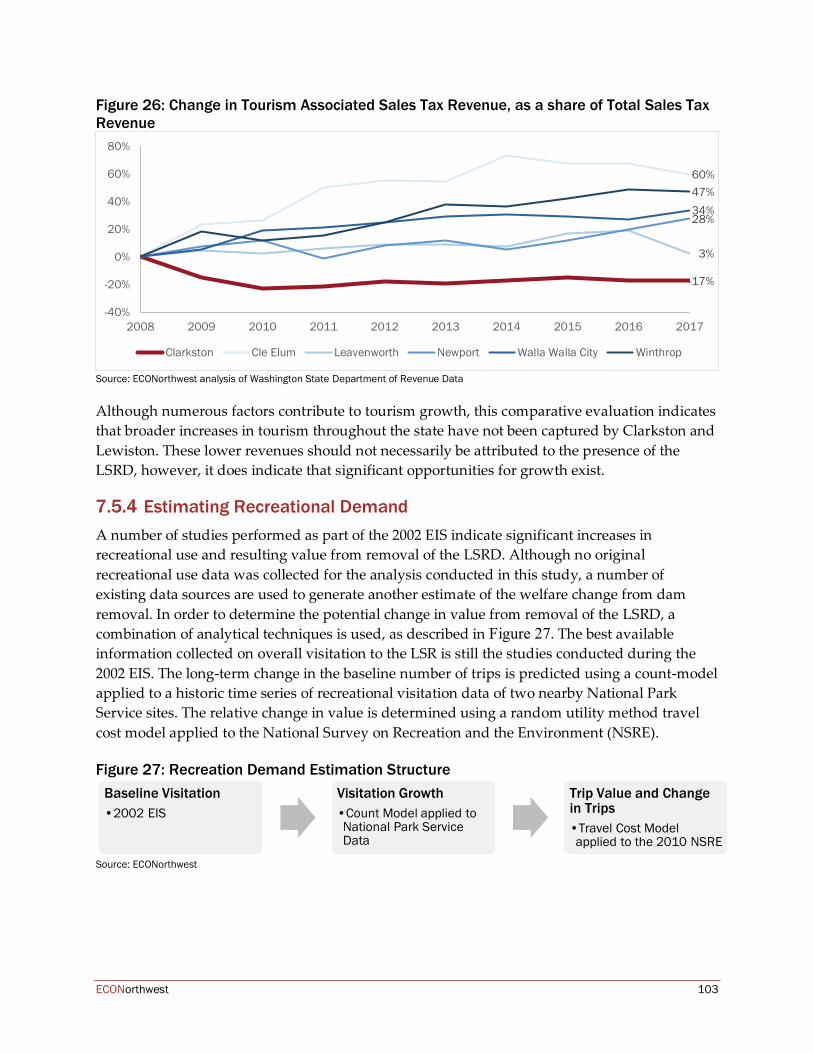
ECONorthwest 103
Figure 26: Change in Tourism Associated Sales Tax Revenue, as a share of Total Sales Tax Revenue
Source: ECONorthwest analysis of Washington State Department of Revenue Data
Although numerous factors contribute to tourism growth, this comparative evaluation indicates that broader increases in tourism throughout the state have not been captured by Clarkston and Lewiston. These lower revenues should not necessarily be attributed to the presence of the LSRD, however, it does indicate that significant opportunities for growth exist.
Estimating Recreational Demand A number of studies performed as part of the 2002 EIS indicate significant increases in recreational use and resulting value from removal of the LSRD. Although no original recreational use data was collected for the analysis conducted in this study, a number of existing data sources are used to generate another estimate of the welfare change from dam removal. In order to determine the potential change in value from removal of the LSRD, a combination of analytical techniques is used, as described in Figure 27. The best available information collected on overall visitation to the LSR is still the studies conducted during the 2002 EIS. The long-term change in the baseline number of trips is predicted using a count-model applied to a historic time series of recreational visitation data of two nearby National Park Service sites. The relative change in value is determined using a random utility method travel cost model applied to the National Survey on Recreation and the Environment (NSRE). Figure 27: Recreation Demand Estimation Structure
Source: ECONorthwest
-17%
60%
3%
28%34%47%
-40%
-20%
0%
20%
40%
60%
80%
2008 2009 2010 2011 2012 2013 2014 2015 2016 2017
Clarkston Cle Elum Leavenworth Newport Walla Walla City Winthrop
Baseline Visitation•2002 EIS
Visitation Growth•Count Model applied to National Park Service Data
Trip Value and Change in Trips•Travel Cost Model applied to the 2010 NSRE
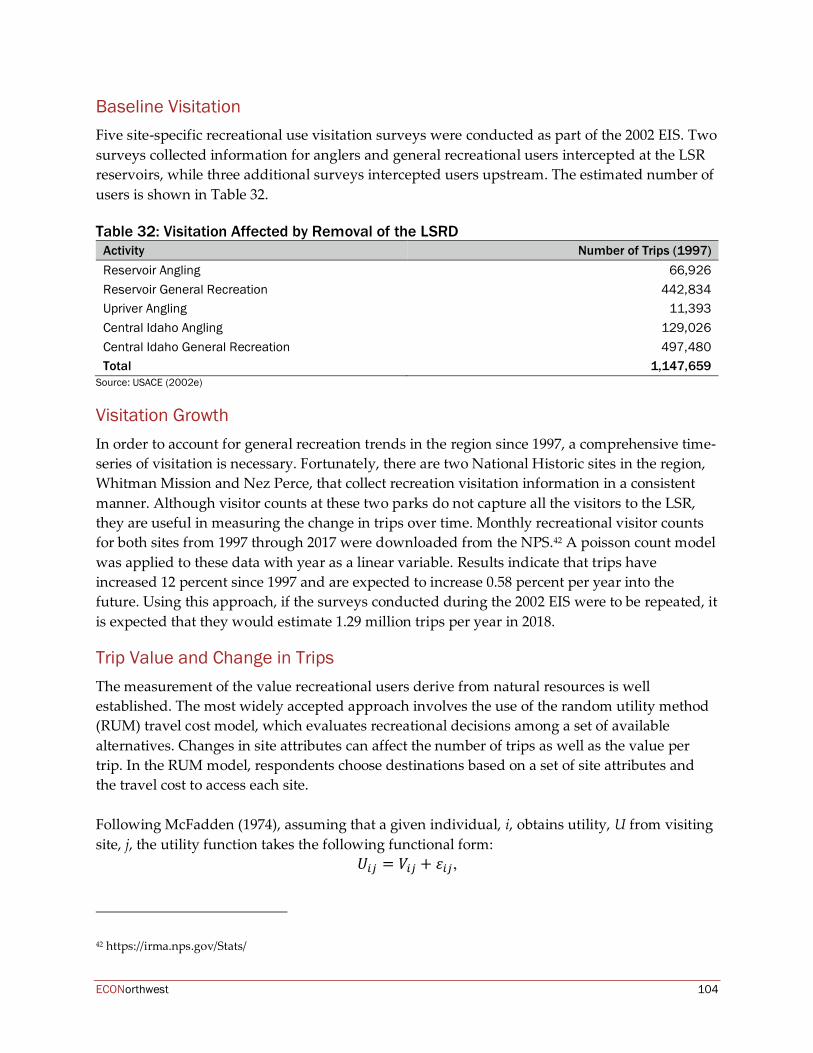
ECONorthwest 104
Baseline Visitation Five site-specific recreational use visitation surveys were conducted as part of the 2002 EIS. Two surveys collected information for anglers and general recreational users intercepted at the LSR reservoirs, while three additional surveys intercepted users upstream. The estimated number of users is shown in Table 32. Table 32: Visitation Affected by Removal of the LSRD
Activity Number of Trips (1997) Reservoir Angling 66,926 Reservoir General Recreation 442,834 Upriver Angling 11,393 Central Idaho Angling 129,026 Central Idaho General Recreation 497,480 Total 1,147,659
Source: USACE (2002e)
Visitation Growth In order to account for general recreation trends in the region since 1997, a comprehensive time-series of visitation is necessary. Fortunately, there are two National Historic sites in the region, Whitman Mission and Nez Perce, that collect recreation visitation information in a consistent manner. Although visitor counts at these two parks do not capture all the visitors to the LSR, they are useful in measuring the change in trips over time. Monthly recreational visitor counts for both sites from 1997 through 2017 were downloaded from the NPS.42 A poisson count model was applied to these data with year as a linear variable. Results indicate that trips have increased 12 percent since 1997 and are expected to increase 0.58 percent per year into the future. Using this approach, if the surveys conducted during the 2002 EIS were to be repeated, it is expected that they would estimate 1.29 million trips per year in 2018.
Trip Value and Change in Trips The measurement of the value recreational users derive from natural resources is well established. The most widely accepted approach involves the use of the random utility method (RUM) travel cost model, which evaluates recreational decisions among a set of available alternatives. Changes in site attributes can affect the number of trips as well as the value per trip. In the RUM model, respondents choose destinations based on a set of site attributes and the travel cost to access each site. Following McFadden (1974), assuming that a given individual, i, obtains utility, U from visiting site, j, the utility function takes the following functional form:
𝑈𝑖𝑗 = 𝑉𝑖𝑗 + 𝜀𝑖𝑗,
42 https://irma.nps.gov/Stats/
ECONorthwest 105
where 𝑉𝑖𝑗 is a set of observable variables while 𝜀𝑖𝑗 is unobservable and assumed to be independently and identically distributed. The probability that individual i chooses to visit destination j* can now be calculated as:
𝑃𝑖𝑗∗ = 𝑒𝑉𝑖𝑗∗
∑ 𝑒𝑉𝑖𝑗𝑗.
Changes in recreational-use values (i.e. consumer surplus), 𝐶𝑆, can be estimated using the log-sum formula (Hanemann 1978; Small & Rosen 1981):
∆Ε(𝐶𝑆𝑖) = 1𝛽𝑇𝐶
[ln (∑ 𝑒𝑉𝑖𝑗1
𝑗 ) − ln (∑ 𝑒𝑉𝑖𝑗0
𝑗 )],
Where the superscripts 0 and 1 indicates states of the world where the LSRD remain or are removed, respectively, and 𝛽𝑇𝐶 is the coefficient on travel cost. In order to estimate the welfare change from removal of the LSRD, this model is applied to data from the NSRE, a national recreation dataset. The NSRE is conducted periodically by the U.S. Forest Service to collect information on outdoor recreational behavior. Although this survey is not explicitly targeted at users of the LSR, the choices that recreational users make throughout the region can inform the welfare changes resulting from removal of the LSRD. In the 2010 NSRE, 1,062 respondents drawn from a national sample provided information on their recreational trips, including the destinations and activities for their three most recent trips. Of these respondents, 40 took at least one trip to a freshwater destination in Washington, Oregon, or Idaho. These respondents identified 63 freshwater sites, as well as the distance from each site to the nearest town. For scenario analysis, a 64th alternative site located in Lewiston, Idaho, is added to the dataset. The price to access each site is calculated as the out-of-pocket travel cost, plus the opportunity cost of time. Each origin/destination travel distance and time was determined by calculating the round-trip driving distance43 from the geographic centroid of the respondent’s home county to the nearest town to each recreation site, plus the additional round trip reported distance to the site.44 The marginal per-mile out-of-pocket costs are the per-mile gas, maintenance, tires, and depreciation reported by AAA in 2010, divided by the average party size reported in the NSRE. The opportunity cost of time is calculated as 1/3 the reported household income divided by the total full-time working hours in a year (2,080 hours), consistent with widely-accepted practices. Site-specific attributes can either be directly incorporated or can be captured using alternative specific constants. Due to the small number of trip takers and the wide variety of sites in this dataset, a comprehensive site specification cannot be incorporated into the model. Thus, only the travel cost, a state-specific identifier, and a variable indicating whether the site is located on
43 Driving distances were calculated using developer tools provided by HERE Technologies. www.here.com 44 Driving time from the nearest city to the site was calculated based on an assumed 55 mph average speed
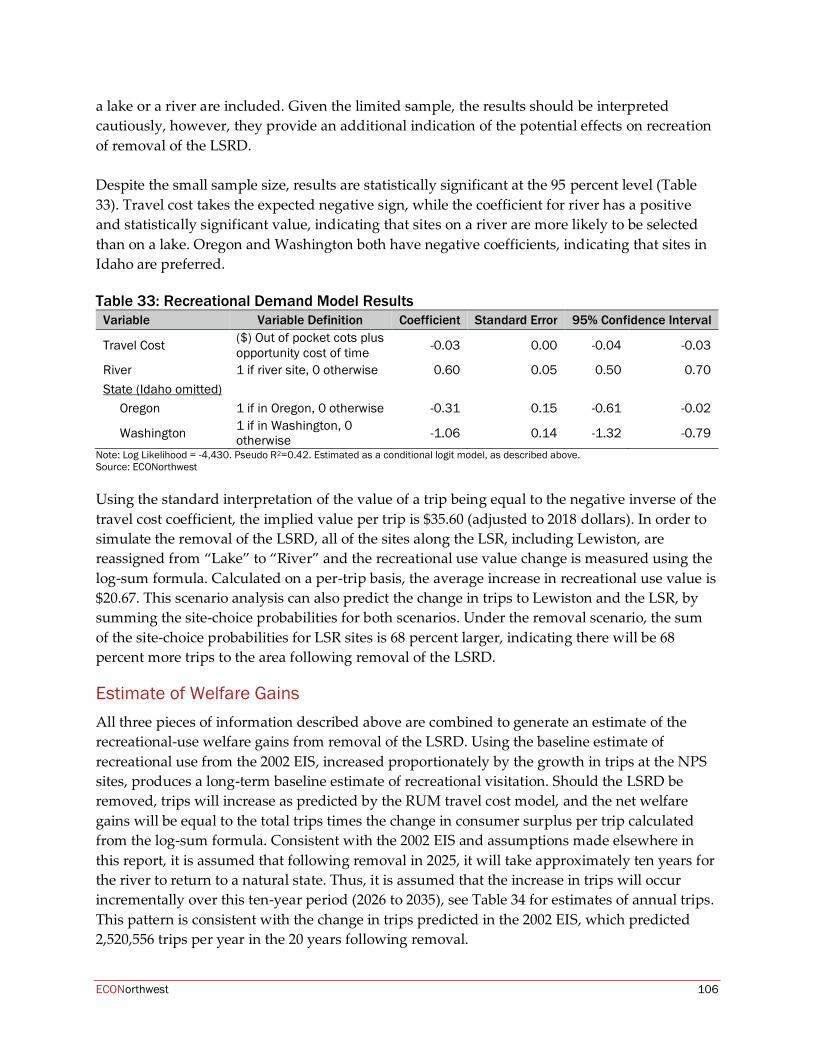
ECONorthwest 106
a lake or a river are included. Given the limited sample, the results should be interpreted cautiously, however, they provide an additional indication of the potential effects on recreation of removal of the LSRD. Despite the small sample size, results are statistically significant at the 95 percent level (Table 33). Travel cost takes the expected negative sign, while the coefficient for river has a positive and statistically significant value, indicating that sites on a river are more likely to be selected than on a lake. Oregon and Washington both have negative coefficients, indicating that sites in Idaho are preferred. Table 33: Recreational Demand Model Results
Variable Variable Definition Coefficient Standard Error 95% Confidence Interval
Travel Cost ($) Out of pocket cots plus opportunity cost of time -0.03 0.00 -0.04 -0.03
River 1 if river site, 0 otherwise 0.60 0.05 0.50 0.70 State (Idaho omitted)
Oregon 1 if in Oregon, 0 otherwise -0.31 0.15 -0.61 -0.02
Washington 1 if in Washington, 0 otherwise -1.06 0.14 -1.32 -0.79
Note: Log Likelihood = -4,430. Pseudo R2=0.42. Estimated as a conditional logit model, as described above. Source: ECONorthwest
Using the standard interpretation of the value of a trip being equal to the negative inverse of the travel cost coefficient, the implied value per trip is $35.60 (adjusted to 2018 dollars). In order to simulate the removal of the LSRD, all of the sites along the LSR, including Lewiston, are reassigned from “Lake” to “River” and the recreational use value change is measured using the log-sum formula. Calculated on a per-trip basis, the average increase in recreational use value is $20.67. This scenario analysis can also predict the change in trips to Lewiston and the LSR, by summing the site-choice probabilities for both scenarios. Under the removal scenario, the sum of the site-choice probabilities for LSR sites is 68 percent larger, indicating there will be 68 percent more trips to the area following removal of the LSRD.
Estimate of Welfare Gains All three pieces of information described above are combined to generate an estimate of the recreational-use welfare gains from removal of the LSRD. Using the baseline estimate of recreational use from the 2002 EIS, increased proportionately by the growth in trips at the NPS sites, produces a long-term baseline estimate of recreational visitation. Should the LSRD be removed, trips will increase as predicted by the RUM travel cost model, and the net welfare gains will be equal to the total trips times the change in consumer surplus per trip calculated from the log-sum formula. Consistent with the 2002 EIS and assumptions made elsewhere in this report, it is assumed that following removal in 2025, it will take approximately ten years for the river to return to a natural state. Thus, it is assumed that the increase in trips will occur incrementally over this ten-year period (2026 to 2035), see Table 34 for estimates of annual trips. This pattern is consistent with the change in trips predicted in the 2002 EIS, which predicted 2,520,556 trips per year in the 20 years following removal.
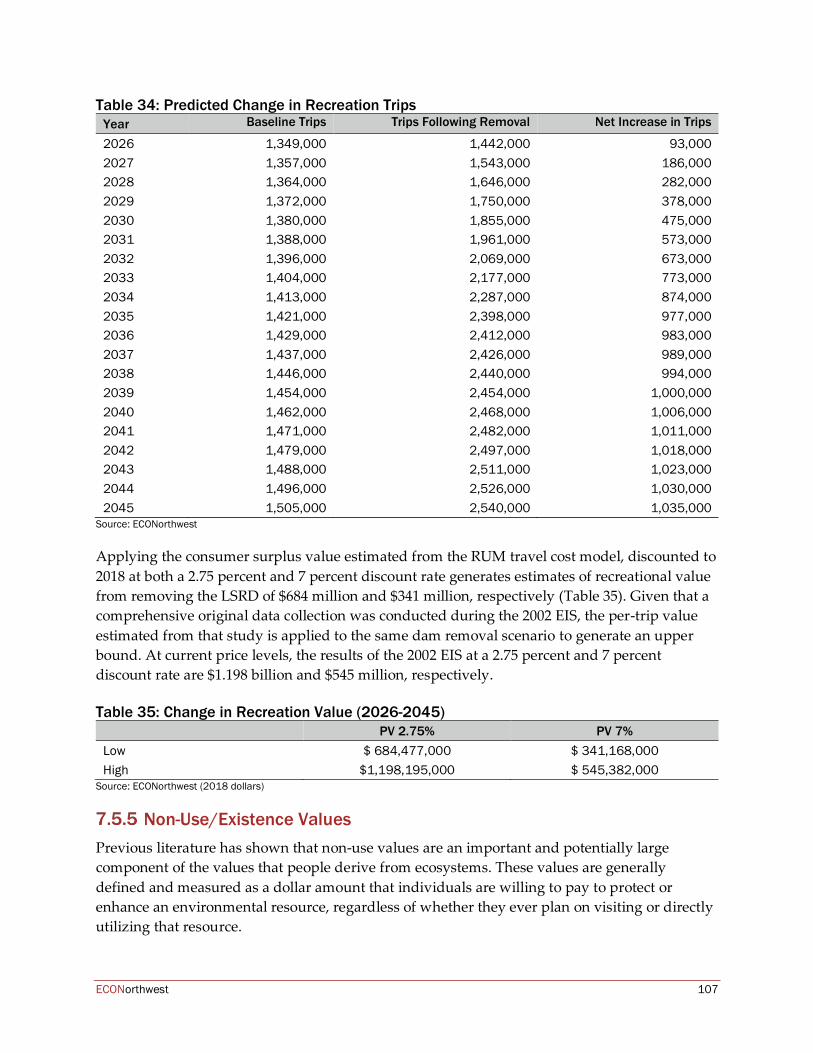
ECONorthwest 107
Table 34: Predicted Change in Recreation Trips Year Baseline Trips Trips Following Removal Net Increase in Trips
2026 1,349,000 1,442,000 93,000 2027 1,357,000 1,543,000 186,000 2028 1,364,000 1,646,000 282,000 2029 1,372,000 1,750,000 378,000 2030 1,380,000 1,855,000 475,000 2031 1,388,000 1,961,000 573,000 2032 1,396,000 2,069,000 673,000 2033 1,404,000 2,177,000 773,000 2034 1,413,000 2,287,000 874,000 2035 1,421,000 2,398,000 977,000 2036 1,429,000 2,412,000 983,000 2037 1,437,000 2,426,000 989,000 2038 1,446,000 2,440,000 994,000 2039 1,454,000 2,454,000 1,000,000 2040 1,462,000 2,468,000 1,006,000 2041 1,471,000 2,482,000 1,011,000 2042 1,479,000 2,497,000 1,018,000 2043 1,488,000 2,511,000 1,023,000 2044 1,496,000 2,526,000 1,030,000 2045 1,505,000 2,540,000 1,035,000
Source: ECONorthwest
Applying the consumer surplus value estimated from the RUM travel cost model, discounted to 2018 at both a 2.75 percent and 7 percent discount rate generates estimates of recreational value from removing the LSRD of $684 million and $341 million, respectively (Table 35). Given that a comprehensive original data collection was conducted during the 2002 EIS, the per-trip value estimated from that study is applied to the same dam removal scenario to generate an upper bound. At current price levels, the results of the 2002 EIS at a 2.75 percent and 7 percent discount rate are $1.198 billion and $545 million, respectively. Table 35: Change in Recreation Value (2026-2045)
PV 2.75% PV 7% Low $ 684,477,000 $ 341,168,000 High $1,198,195,000 $ 545,382,000
Source: ECONorthwest (2018 dollars)
Non-Use/Existence Values Previous literature has shown that non-use values are an important and potentially large component of the values that people derive from ecosystems. These values are generally defined and measured as a dollar amount that individuals are willing to pay to protect or enhance an environmental resource, regardless of whether they ever plan on visiting or directly utilizing that resource.
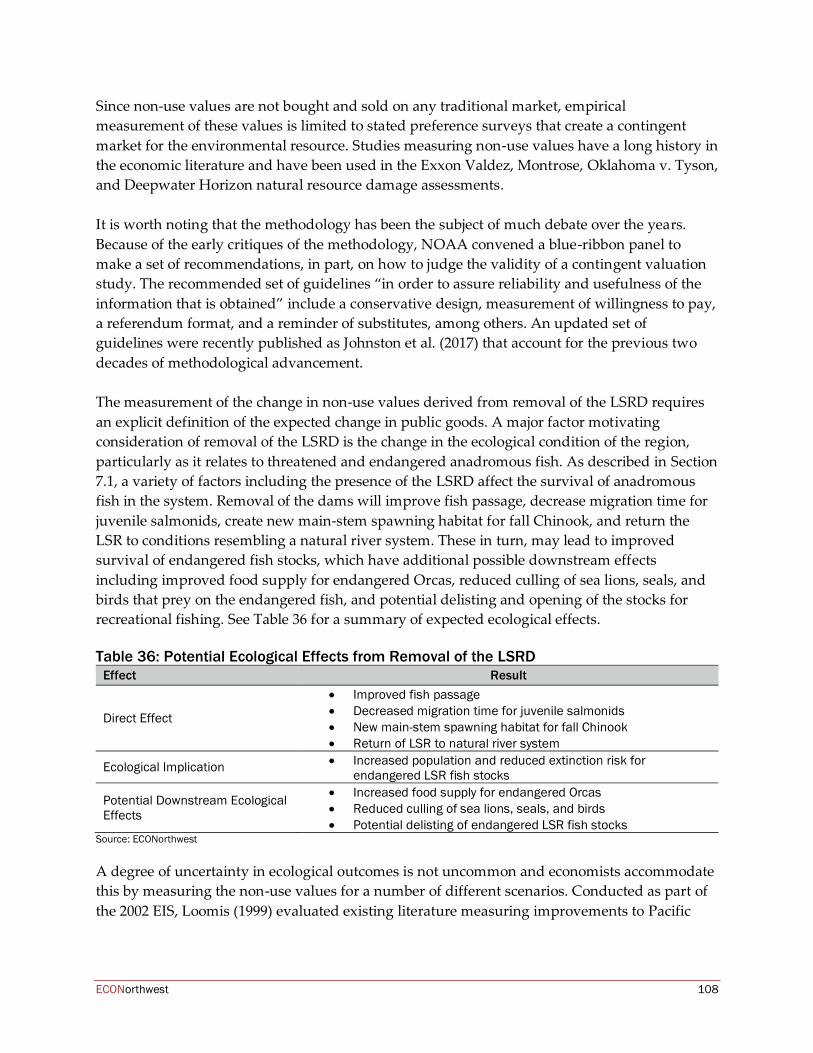
ECONorthwest 108
Since non-use values are not bought and sold on any traditional market, empirical measurement of these values is limited to stated preference surveys that create a contingent market for the environmental resource. Studies measuring non-use values have a long history in the economic literature and have been used in the Exxon Valdez, Montrose, Oklahoma v. Tyson, and Deepwater Horizon natural resource damage assessments. It is worth noting that the methodology has been the subject of much debate over the years. Because of the early critiques of the methodology, NOAA convened a blue-ribbon panel to make a set of recommendations, in part, on how to judge the validity of a contingent valuation study. The recommended set of guidelines “in order to assure reliability and usefulness of the information that is obtained” include a conservative design, measurement of willingness to pay, a referendum format, and a reminder of substitutes, among others. An updated set of guidelines were recently published as Johnston et al. (2017) that account for the previous two decades of methodological advancement. The measurement of the change in non-use values derived from removal of the LSRD requires an explicit definition of the expected change in public goods. A major factor motivating consideration of removal of the LSRD is the change in the ecological condition of the region, particularly as it relates to threatened and endangered anadromous fish. As described in Section 7.1, a variety of factors including the presence of the LSRD affect the survival of anadromous fish in the system. Removal of the dams will improve fish passage, decrease migration time for juvenile salmonids, create new main-stem spawning habitat for fall Chinook, and return the LSR to conditions resembling a natural river system. These in turn, may lead to improved survival of endangered fish stocks, which have additional possible downstream effects including improved food supply for endangered Orcas, reduced culling of sea lions, seals, and birds that prey on the endangered fish, and potential delisting and opening of the stocks for recreational fishing. See Table 36 for a summary of expected ecological effects. Table 36: Potential Ecological Effects from Removal of the LSRD
Effect Result
Direct Effect
• Improved fish passage • Decreased migration time for juvenile salmonids • New main-stem spawning habitat for fall Chinook • Return of LSR to natural river system
Ecological Implication • Increased population and reduced extinction risk for endangered LSR fish stocks
Potential Downstream Ecological Effects
• Increased food supply for endangered Orcas • Reduced culling of sea lions, seals, and birds • Potential delisting of endangered LSR fish stocks
Source: ECONorthwest
A degree of uncertainty in ecological outcomes is not uncommon and economists accommodate this by measuring the non-use values for a number of different scenarios. Conducted as part of the 2002 EIS, Loomis (1999) evaluated existing literature measuring improvements to Pacific
ECONorthwest 109
Northwest salmon populations and produced a range of non-use values from removing the LSRD. The more directly relevant non-use valuation study was conducted for the evaluation of removal of a set of dams on the Klamath River in California (Mansfield et al. 2012). A stated preference survey was administered to random samples of households both in the Klamath Basin and throughout the U.S. Multiple ecological outcomes were evaluated, including 30 percent, 100 percent, and 150 percent increases in wild Chinook and steelhead populations and a reduced risk for extinction of Coho salmon, which were the result of different “action plans.” The study found willingness to pay (WTP) values that were not statistically significant for increased wild Chinook and steelhead populations (which are not endangered in the Klamath basin), however 20-year average annual household WTP to reduce the extinction risk for Coho from “high” to “moderate” ranged between $54.59 for households in Oregon and California to $41.97 for households in the remainder of the U.S. Other studies have measured non-use values for benefits to other endangered species. Wallmo and Lew conducted a nationwide stated-preference choice experiment in 2009 and measured the economic value for down-listing or recovery of eight different endangered marine animals within 50 years (2012). Households were willing to pay $45.88 over ten years to recover Puget Sound Chinook salmon within 50 years. Additional work by the authors in 2010 evaluated WTP for down-listing and recovery of the Southern Resident Killer Whale population and found ten-year mean household WTP values of $57.65 and $84.38, respectively, for a national sample of households. A number of other studies evaluate other dam removal scenarios in the region and give an indication of the magnitude of non-use values. Loomis (1996) measured the household willingness to pay to remove two dams on the Elwha River in Washington and found aggregate benefits to households in Washington and the rest of U.S. to be $148 million and $3.2 to 6.4 billion, respectively. Stratus Consulting (2015) measured household willingness to pay for restoration actions designed to accelerate recovery of salmon and forests along the Elwha River and found mean values ranging from $264 to $356 for the various programs. An additional body of research has evaluated programs designed to only enhance salmon stocks, as opposed to dam removals which may convey multiple ecosystem service benefits. Bell et al. (2003) evaluated willingness to pay for restoration programs (unrelated to dam removal) designed to increase the catchable stock of Coho salmon in the Pacific Northwest. Values, depending on the community, range from $51 to $165 per household. Other studies have focused on measuring values for the preservation of natural, free-flowing rivers. Sanders et al. (2010) measured benefits from the protection of rivers in Colorado and found diminishing returns from the protection of additional rivers, indicating that economic concepts of substitution and satiation apply to non-use values. Protection of the Cachela,
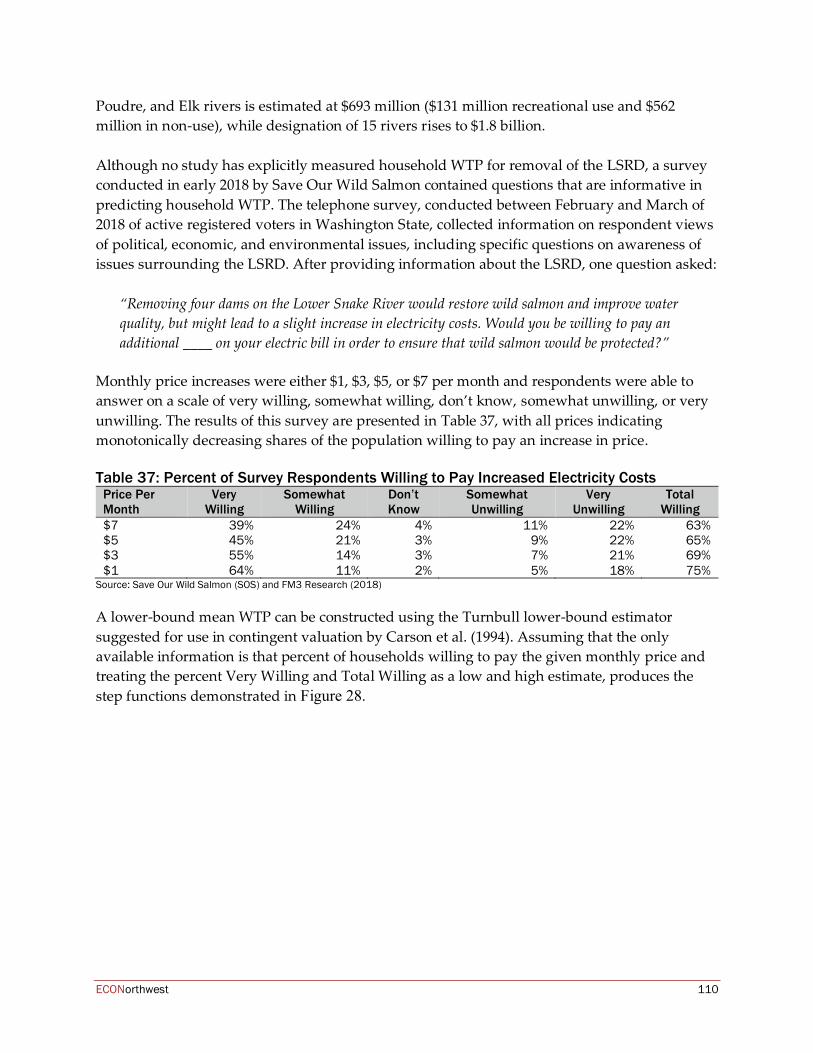
ECONorthwest 110
Poudre, and Elk rivers is estimated at $693 million ($131 million recreational use and $562 million in non-use), while designation of 15 rivers rises to $1.8 billion. Although no study has explicitly measured household WTP for removal of the LSRD, a survey conducted in early 2018 by Save Our Wild Salmon contained questions that are informative in predicting household WTP. The telephone survey, conducted between February and March of 2018 of active registered voters in Washington State, collected information on respondent views of political, economic, and environmental issues, including specific questions on awareness of issues surrounding the LSRD. After providing information about the LSRD, one question asked:
“Removing four dams on the Lower Snake River would restore wild salmon and improve water quality, but might lead to a slight increase in electricity costs. Would you be willing to pay an additional ____ on your electric bill in order to ensure that wild salmon would be protected?”
Monthly price increases were either $1, $3, $5, or $7 per month and respondents were able to answer on a scale of very willing, somewhat willing, don’t know, somewhat unwilling, or very unwilling. The results of this survey are presented in Table 37, with all prices indicating monotonically decreasing shares of the population willing to pay an increase in price. Table 37: Percent of Survey Respondents Willing to Pay Increased Electricity Costs
Price Per Month
Very Willing
Somewhat Willing
Don’t Know
Somewhat Unwilling
Very Unwilling
Total Willing
$7 39% 24% 4% 11% 22% 63% $5 45% 21% 3% 9% 22% 65% $3 55% 14% 3% 7% 21% 69% $1 64% 11% 2% 5% 18% 75%
Source: Save Our Wild Salmon (SOS) and FM3 Research (2018)
A lower-bound mean WTP can be constructed using the Turnbull lower-bound estimator suggested for use in contingent valuation by Carson et al. (1994). Assuming that the only available information is that percent of households willing to pay the given monthly price and treating the percent Very Willing and Total Willing as a low and high estimate, produces the step functions demonstrated in Figure 28.
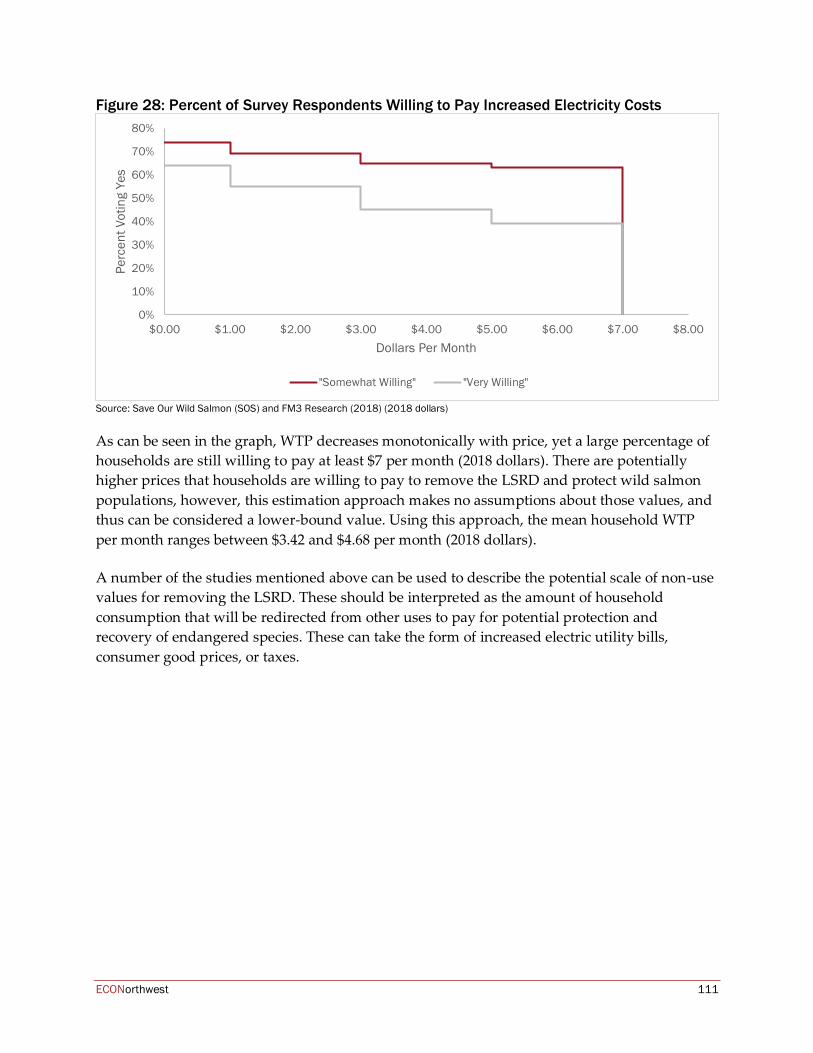
ECONorthwest 111
Figure 28: Percent of Survey Respondents Willing to Pay Increased Electricity Costs
Source: Save Our Wild Salmon (SOS) and FM3 Research (2018) (2018 dollars)
As can be seen in the graph, WTP decreases monotonically with price, yet a large percentage of households are still willing to pay at least $7 per month (2018 dollars). There are potentially higher prices that households are willing to pay to remove the LSRD and protect wild salmon populations, however, this estimation approach makes no assumptions about those values, and thus can be considered a lower-bound value. Using this approach, the mean household WTP per month ranges between $3.42 and $4.68 per month (2018 dollars). A number of the studies mentioned above can be used to describe the potential scale of non-use values for removing the LSRD. These should be interpreted as the amount of household consumption that will be redirected from other uses to pay for potential protection and recovery of endangered species. These can take the form of increased electric utility bills, consumer good prices, or taxes.
0%
10%
20%
30%
40%
50%
60%
70%
80%
$0.00 $1.00 $2.00 $3.00 $4.00 $5.00 $6.00 $7.00 $8.00
Perc
ent V
otin
g Ye
s
Dollars Per Month
"Somewhat Willing" "Very Willing"
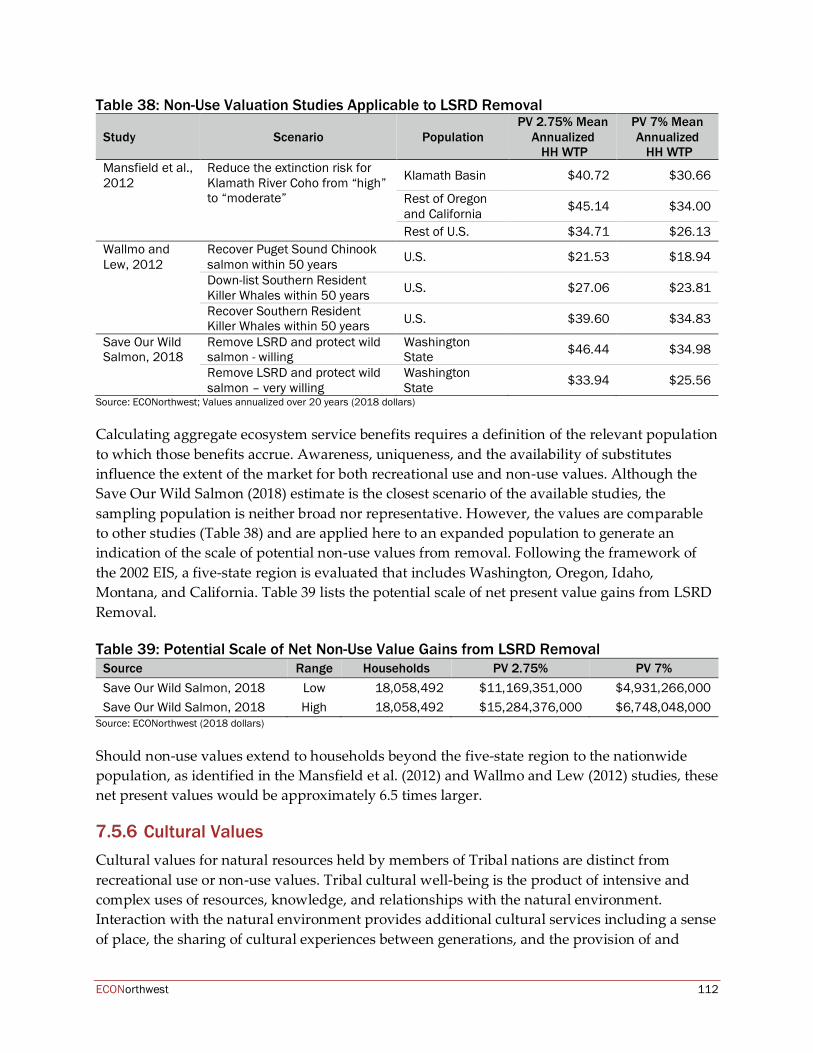
ECONorthwest 112
Table 38: Non-Use Valuation Studies Applicable to LSRD Removal
Study Scenario Population PV 2.75% Mean
Annualized HH WTP
PV 7% Mean Annualized HH WTP
Mansfield et al., 2012
Reduce the extinction risk for Klamath River Coho from “high” to “moderate”
Klamath Basin $40.72 $30.66
Rest of Oregon and California $45.14 $34.00
Rest of U.S. $34.71 $26.13 Wallmo and Lew, 2012
Recover Puget Sound Chinook salmon within 50 years U.S. $21.53 $18.94
Down-list Southern Resident Killer Whales within 50 years U.S. $27.06 $23.81
Recover Southern Resident Killer Whales within 50 years U.S. $39.60 $34.83
Save Our Wild Salmon, 2018
Remove LSRD and protect wild salmon - willing
Washington State $46.44 $34.98
Remove LSRD and protect wild salmon – very willing
Washington State $33.94 $25.56
Source: ECONorthwest; Values annualized over 20 years (2018 dollars)
Calculating aggregate ecosystem service benefits requires a definition of the relevant population to which those benefits accrue. Awareness, uniqueness, and the availability of substitutes influence the extent of the market for both recreational use and non-use values. Although the Save Our Wild Salmon (2018) estimate is the closest scenario of the available studies, the sampling population is neither broad nor representative. However, the values are comparable to other studies (Table 38) and are applied here to an expanded population to generate an indication of the scale of potential non-use values from removal. Following the framework of the 2002 EIS, a five-state region is evaluated that includes Washington, Oregon, Idaho, Montana, and California. Table 39 lists the potential scale of net present value gains from LSRD Removal. Table 39: Potential Scale of Net Non-Use Value Gains from LSRD Removal
Source Range Households PV 2.75% PV 7% Save Our Wild Salmon, 2018 Low 18,058,492 $11,169,351,000 $4,931,266,000 Save Our Wild Salmon, 2018 High 18,058,492 $15,284,376,000 $6,748,048,000
Source: ECONorthwest (2018 dollars)
Should non-use values extend to households beyond the five-state region to the nationwide population, as identified in the Mansfield et al. (2012) and Wallmo and Lew (2012) studies, these net present values would be approximately 6.5 times larger.
Cultural Values Cultural values for natural resources held by members of Tribal nations are distinct from recreational use or non-use values. Tribal cultural well-being is the product of intensive and complex uses of resources, knowledge, and relationships with the natural environment. Interaction with the natural environment provides additional cultural services including a sense of place, the sharing of cultural experiences between generations, and the provision of and

ECONorthwest 113
communication in native languages. No systematic cultural resource evaluations have been performed on the LSR. Given the uncertainty and complexity involved with identifying a monetary value for cultural values, they are considered in this report of significant importance but are only included qualitatively.
ECONorthwest 114
8 Summary of Economic Impacts
8.1 Overview of Economic Impact Analysis An economic impact analysis (EIA) can answer the question of how the regional economy would respond to removal of the LSRD and how the impacts would be distributed across different population segments and industries. An EIA measures regional changes in jobs, wages, and economic output. 45 If the dams were to remain in place, the ongoing operations and maintenance (O&M) expenditures produce positive economic impacts to the region through direct spending and increased economic activity. Similarly, if the dams are removed, the physical costs of removing the dams would also produce a set of positive economic impacts, albeit potentially for a different population. This comparison informs the distribution of impacts but not necessarily the optimal policy outcome, since any expenditure in the region is beneficial in an economic sense. An EIA accounts for the net gain or loss in spending across various industries against a baseline scenario (LSRD not removed). Through this construction, the analysis is able to utilize the marginal change in spending for each year if dam removal occurs as the inputs for the model.
Baseline – No Action, in which the dams would remain in place throughout the time period of analysis, 2018 to 2045. Alternative – Dam Removals, in which all four of the dams would be removed, with a planning period beginning in 2018, dam removal occurring in 2026, and the time period of analysis extending to 2045.
ECONorthwest used an economic input-output model to measure the economic impact of spending associated with each alternative. The analysis is based upon a geographic boundary for spending in eight counties in Washington and one county in Idaho, known as the “study region”. The nine counties that make up the study region are as follows:
• Benton County, Washington • Walla Walla County, Washington • Columbia County, Washington • Garfield County, Washington • Asotin County, Washington • Adams County, Washington • Franklin County, Washington
45 Economic output is the is the total value of goods and services produced. This is the broadest measure of economic activity and differs from gross domestic product (GDP) in that GDP subtracts intermediate demand, or goods that have already passed through the market once as a component of another good or service.
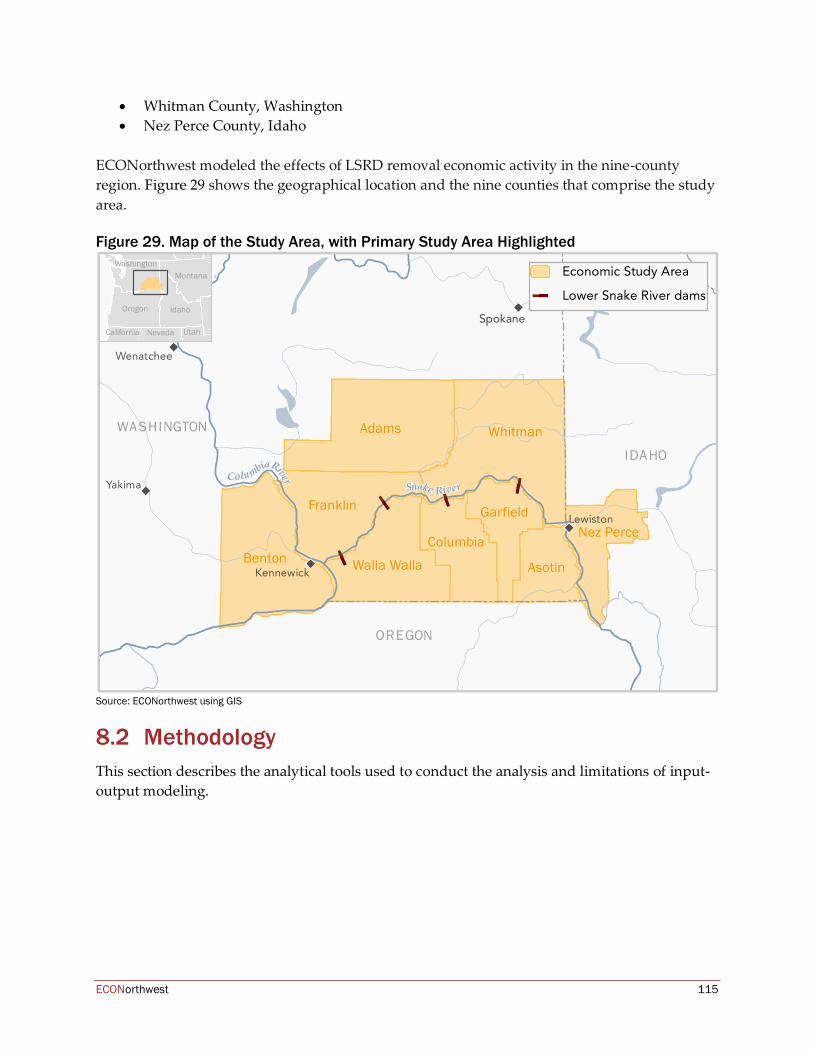
ECONorthwest 115
• Whitman County, Washington • Nez Perce County, Idaho
ECONorthwest modeled the effects of LSRD removal economic activity in the nine-county region. Figure 29 shows the geographical location and the nine counties that comprise the study area. Figure 29. Map of the Study Area, with Primary Study Area Highlighted
Source: ECONorthwest using GIS
8.2 Methodology This section describes the analytical tools used to conduct the analysis and limitations of input-output modeling.
ECONorthwest 116
Input-Output Modeling To calculate the economic impacts46 of LSRD removal, ECONorthwest used the 2016 version of IMPLAN, an input-output model that calculates the change in final demand for goods and services in the study region. This change in demand is measured through jobs, incomes, and economic output that happen as new spending for dam removal circulates through the economy and existing spending is shifted or reduced as a result of the dams no longer being in place. The initial change in final demand in the region has downstream supply-chain and consumption effects in other sectors of the economy, which results in a “multiplier effect” as changes in spending circulate throughout the economy.
Economic impact studies use specific terminology to identify different types of economic effects that can be modeled using input-output tools. More specifically, the IMPLAN model provides estimates of the effects of the expenditures on income and employment that follow from direct, indirect, and induced expenditures (See Figure 30).
• Direct effects are the output, jobs, and income associated with the immediate effects of final demand changes. These are typically described as the “inputs” to the model.
• Indirect effects are production changes in backward-linked industries caused by the changing input needs of directly affected industries. Suppliers to the directly involved industry will also purchase additional goods and services; spending leads to additional rounds of indirect effects. Because they represent interactions among businesses, these indirect effects are often referred to as supply-chain effects.
• Induced effects are the changes in regional household spending patterns caused by changes in household income. The direct and indirect changes in employment and income result in shifts in the overall purchasing power in the economy, thereby affecting further spending by households. For example, employees in the industries affected by the dam removal will increase or decrease consumption spending based on how the industry in which they work is affected by the dam removals.
46 The term “economic impact” is used throughout this memo to indicate that the analysis is quantifying net effects on the economy resulting from dam removal, not gross effects (“economic contribution”). To quantify net effects, the analysis deducts spending for dam operations that would occur regardless of dam removal. A net analysis attempts to account for the potential gain or loss from not having dams on the river.
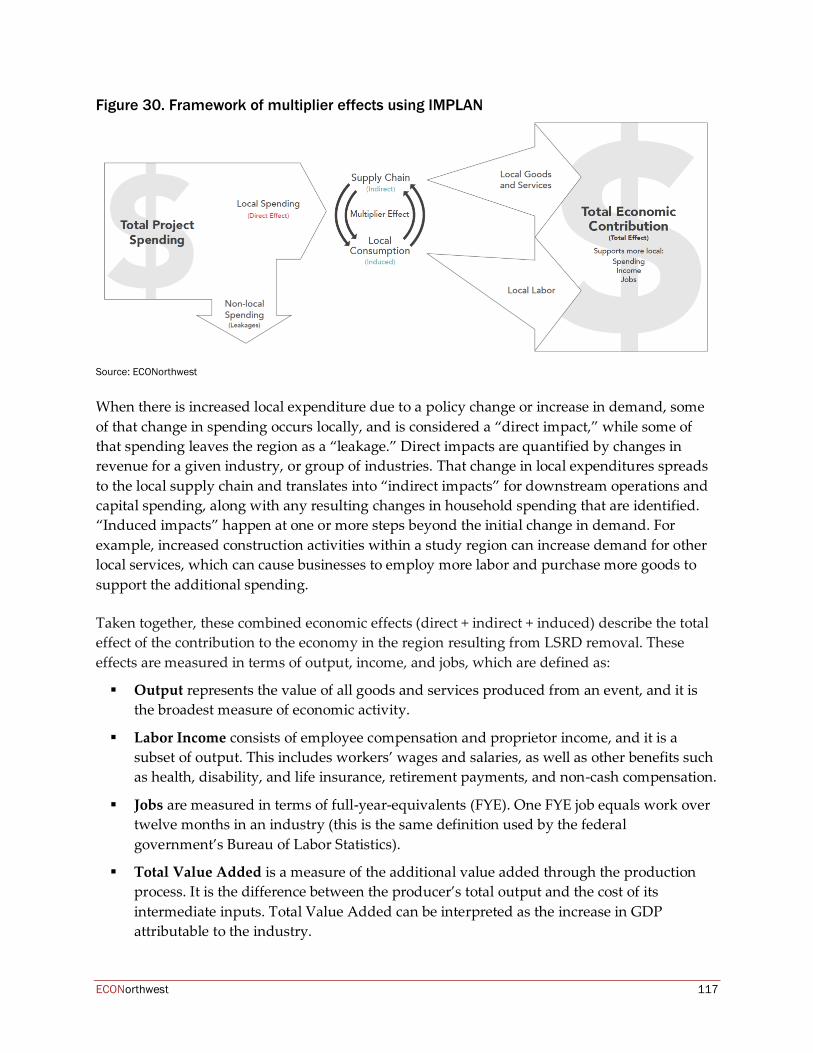
ECONorthwest 117
Figure 30. Framework of multiplier effects using IMPLAN
Source: ECONorthwest
When there is increased local expenditure due to a policy change or increase in demand, some of that change in spending occurs locally, and is considered a “direct impact,” while some of that spending leaves the region as a “leakage.” Direct impacts are quantified by changes in revenue for a given industry, or group of industries. That change in local expenditures spreads to the local supply chain and translates into “indirect impacts” for downstream operations and capital spending, along with any resulting changes in household spending that are identified. “Induced impacts” happen at one or more steps beyond the initial change in demand. For example, increased construction activities within a study region can increase demand for other local services, which can cause businesses to employ more labor and purchase more goods to support the additional spending.
Taken together, these combined economic effects (direct + indirect + induced) describe the total effect of the contribution to the economy in the region resulting from LSRD removal. These effects are measured in terms of output, income, and jobs, which are defined as:
▪ Output represents the value of all goods and services produced from an event, and it is the broadest measure of economic activity.
▪ Labor Income consists of employee compensation and proprietor income, and it is a subset of output. This includes workers’ wages and salaries, as well as other benefits such as health, disability, and life insurance, retirement payments, and non-cash compensation.
▪ Jobs are measured in terms of full-year‑equivalents (FYE). One FYE job equals work over twelve months in an industry (this is the same definition used by the federal government’s Bureau of Labor Statistics).
▪ Total Value Added is a measure of the additional value added through the production process. It is the difference between the producer’s total output and the cost of its intermediate inputs. Total Value Added can be interpreted as the increase in GDP attributable to the industry.
ECONorthwest 118
Not all of the initial spending is re-spent within the study region. Some spending leaks out of the economy from purchases made to counties outside the area.47 For example, LSRD removal might require purchases of some equipment and use of contractors from within the study region, but that business may buy additional supplies from a business outside the study area to meet the new demand. It is assumed that removal of the LSRD would likely involve a large amount of federal funds, but this analysis will only consider the net new funds to the study region in order to have a discrete unit of analysis. Federal spending on LSRD removal outside of the study region would be considered leakage and is not considered as part of this analysis.
Limitations of Input-Output Analysis Input-output models are static models that measure inputs and outputs in an economy at a point in time. With this information and the balanced accounting structure of an input-output model, an analyst can: 1) describe an economy at one time-period, 2) introduce a change to the economy, and then 3) evaluate the economy after it has accommodated that change.
This type of “partial equilibrium” analysis permits comparison of the economy in two separate conditions but does not describe how the economy moves from one equilibrium to the next. In partial equilibrium analysis, the researcher assumes that all other relationships in the economy remain the same (other than the initial economic stimulus).48
Contrary to dynamic models, static models such as the one used in this analysis, assume that there are no changes in wage rates, input prices, and property values. In addition, underlying economic relationships in input-output models are assumed constant; it is assumed that there are no changes in the productivity of labor and capital, and no changes in population migration or business location patterns. The model simulates the same structure of the underlying economy for 2045 as it does for 2018. This static structure is a limitation of the model. Additionally, inflation, population growth, wage growth, industry composition changes, and other macroeconomic effects that change the composition of the economy are not considered. Starting with the assumption that the economy will look somewhat similar and factor prices are the same, the results presented here are the expected outcome, all else being equal.
47 Buying goods and services from a business outside the region is one of three common types of leakages. The other two include money that is saved and the paying of taxes. 48 By using the present value of the spending through 2045 the analysis assumes that capital and labor ratios of production are constant throughout this time period. Although this assumption simplifies the analysis, in reality capital and labor ratios are expected to change with technology and restructuring of the economy over time. ECONorthwest recognizes that modeling long-run present values as if they were occurring in a single year is not a best practice when using partial equilibrium models like IMPLAN. Instead of annualizing the present values the analysis uses the total present value to understand the total scale of impacts. Annualized present values is the method used previously by USACE in the 2002 EIS and will likely continue to be used for future studies on the economic impact of LSRD removal, thus we have chosen to also use this method for consistency and replicability.
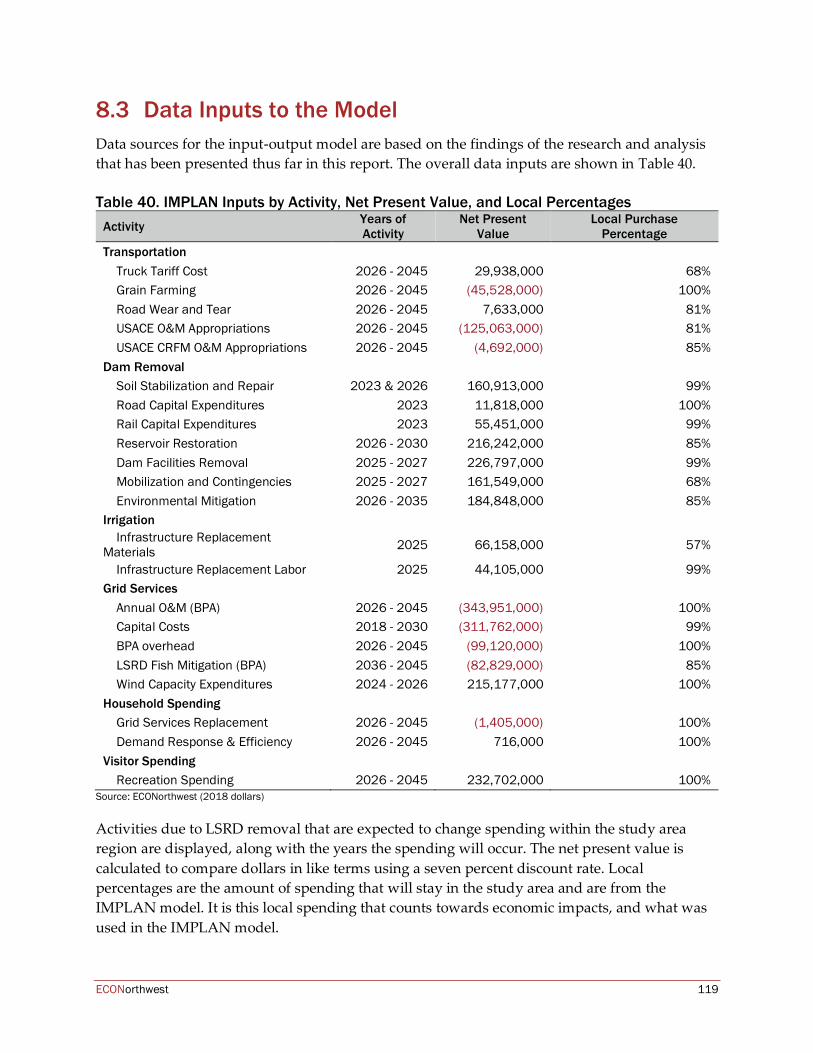
ECONorthwest 119
8.3 Data Inputs to the Model Data sources for the input-output model are based on the findings of the research and analysis that has been presented thus far in this report. The overall data inputs are shown in Table 40. Table 40. IMPLAN Inputs by Activity, Net Present Value, and Local Percentages
Activity Years of Activity
Net Present Value
Local Purchase Percentage
Transportation Truck Tariff Cost 2026 - 2045 29,938,000 68% Grain Farming 2026 - 2045 (45,528,000) 100% Road Wear and Tear 2026 - 2045 7,633,000 81% USACE O&M Appropriations 2026 - 2045 (125,063,000) 81% USACE CRFM O&M Appropriations 2026 - 2045 (4,692,000) 85%
Dam Removal Soil Stabilization and Repair 2023 & 2026 160,913,000 99% Road Capital Expenditures 2023 11,818,000 100% Rail Capital Expenditures 2023 55,451,000 99% Reservoir Restoration 2026 - 2030 216,242,000 85% Dam Facilities Removal 2025 - 2027 226,797,000 99% Mobilization and Contingencies 2025 - 2027 161,549,000 68% Environmental Mitigation 2026 - 2035 184,848,000 85%
Irrigation Infrastructure Replacement
Materials 2025 66,158,000 57%
Infrastructure Replacement Labor 2025 44,105,000 99% Grid Services
Annual O&M (BPA) 2026 - 2045 (343,951,000) 100% Capital Costs 2018 - 2030 (311,762,000) 99% BPA overhead 2026 - 2045 (99,120,000) 100% LSRD Fish Mitigation (BPA) 2036 - 2045 (82,829,000) 85% Wind Capacity Expenditures 2024 - 2026 215,177,000 100%
Household Spending Grid Services Replacement 2026 - 2045 (1,405,000) 100% Demand Response & Efficiency 2026 - 2045 716,000 100%
Visitor Spending Recreation Spending 2026 - 2045 232,702,000 100%
Source: ECONorthwest (2018 dollars)
Activities due to LSRD removal that are expected to change spending within the study area region are displayed, along with the years the spending will occur. The net present value is calculated to compare dollars in like terms using a seven percent discount rate. Local percentages are the amount of spending that will stay in the study area and are from the IMPLAN model. It is this local spending that counts towards economic impacts, and what was used in the IMPLAN model.
ECONorthwest 120
Costs of Breaching LSRD Breaching and removing the LSRD is a major capital project with many components. Previous estimates of removal include costs borne from efforts such as dam embankment removal, river channelization, temporary fish handling facilities, reservoir revegetation, and other project considerations. From 1995 to 2002, the Walla Walla District of USACE commissioned an extensive analysis to evaluate alternatives for improving fish passage through the hydropower system on the four dams. The Lower Snake River Juvenile Salmon Migration Feasibility Report/Environmental Impact Statement evaluated the costs and likely effects of four alternative scenarios aimed to improve fish passage including breaching the dams. The cost estimates for breaching the dams from that 2002 study were $859 million. Inflated to 2018 dollars using the BOR Construction Cost Trends index, the cost estimate in 2018 dollars is equal to $1.566 billion. Jim Waddell is a professional civil engineer who retired after a 35-year career with the USACE. His career with USACE included a period as the Deputy District Engineer for Programs at Walla Walla District for three years starting in 1999 during the time of the 2002 EIS. In 2016, after retirement from USACE, Mr. Waddell published a critique of the 2002 cost estimates for breaching the LSRD stating they were too high. His analysis indicates that the dams could be breached for $255 million in 1999 dollars which would be $465 million in 2018 dollars. If completed, removal of the LSRD would be the largest dam removal project ever conducted in the United States. The next largest would be the removal of a set of dams on the Klamath River, anticipated to begin in 2020. A comprehensive set of engineering cost studies have been completed for that project and serve as an additional indication of the potential cost of removing the LSRD. Despite being the largest planned dam removal to date, the Klamath dams are only a fraction of the size of the LSRD. The three major dams on the Klamath river bring removed are between 68 and 173 feet tall, and between 415 and 714 feet long, while the four LSRD are 100 feet tall each and between 2,655 and 3,791 feet long. Nevertheless, many of the engineering cost principles and assumptions can be scaled up to the larger size of the LSRD. Estimates for dam facilities removal, revegetation, mobilization, contingencies, engineering, environmental mitigation, and monitoring/adaptive management are transferred to the LSRD removal scenario. Costs are updated to reflect the BOR Construction Cost Trends index. Klamath based estimates for each category are described in Table 41. Costs that are more precisely captured elsewhere in this report (e.g. transportation infrastructure improvements) are excluded. Engineering cost estimates are included where appropriate.
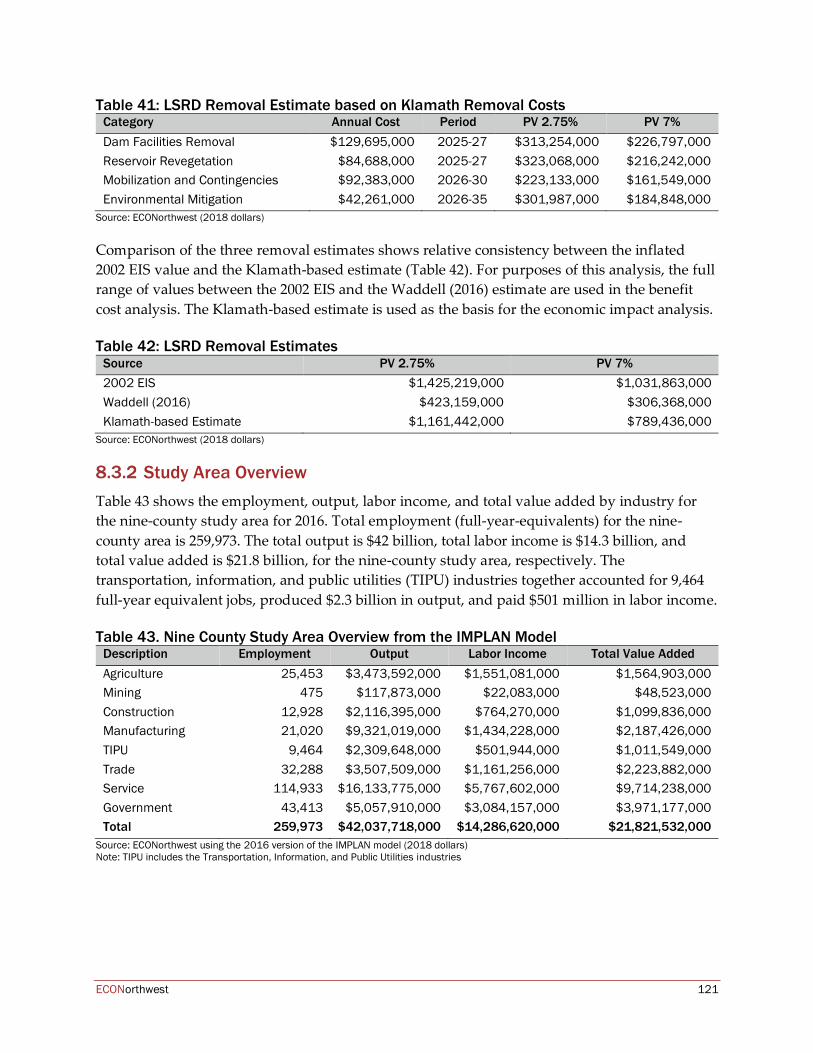
ECONorthwest 121
Table 41: LSRD Removal Estimate based on Klamath Removal Costs Category Annual Cost Period PV 2.75% PV 7% Dam Facilities Removal $129,695,000 2025-27 $313,254,000 $226,797,000 Reservoir Revegetation $84,688,000 2025-27 $323,068,000 $216,242,000 Mobilization and Contingencies $92,383,000 2026-30 $223,133,000 $161,549,000 Environmental Mitigation $42,261,000 2026-35 $301,987,000 $184,848,000
Source: ECONorthwest (2018 dollars)
Comparison of the three removal estimates shows relative consistency between the inflated 2002 EIS value and the Klamath-based estimate (Table 42). For purposes of this analysis, the full range of values between the 2002 EIS and the Waddell (2016) estimate are used in the benefit cost analysis. The Klamath-based estimate is used as the basis for the economic impact analysis. Table 42: LSRD Removal Estimates
Source PV 2.75% PV 7% 2002 EIS $1,425,219,000 $1,031,863,000 Waddell (2016) $423,159,000 $306,368,000 Klamath-based Estimate $1,161,442,000 $789,436,000
Source: ECONorthwest (2018 dollars)
Study Area Overview Table 43 shows the employment, output, labor income, and total value added by industry for the nine-county study area for 2016. Total employment (full-year-equivalents) for the nine-county area is 259,973. The total output is $42 billion, total labor income is $14.3 billion, and total value added is $21.8 billion, for the nine-county study area, respectively. The transportation, information, and public utilities (TIPU) industries together accounted for 9,464 full-year equivalent jobs, produced $2.3 billion in output, and paid $501 million in labor income. Table 43. Nine County Study Area Overview from the IMPLAN Model
Description Employment Output Labor Income Total Value Added Agriculture 25,453 $3,473,592,000 $1,551,081,000 $1,564,903,000 Mining 475 $117,873,000 $22,083,000 $48,523,000 Construction 12,928 $2,116,395,000 $764,270,000 $1,099,836,000 Manufacturing 21,020 $9,321,019,000 $1,434,228,000 $2,187,426,000 TIPU 9,464 $2,309,648,000 $501,944,000 $1,011,549,000 Trade 32,288 $3,507,509,000 $1,161,256,000 $2,223,882,000 Service 114,933 $16,133,775,000 $5,767,602,000 $9,714,238,000 Government 43,413 $5,057,910,000 $3,084,157,000 $3,971,177,000 Total 259,973 $42,037,718,000 $14,286,620,000 $21,821,532,000
Source: ECONorthwest using the 2016 version of the IMPLAN model (2018 dollars) Note: TIPU includes the Transportation, Information, and Public Utilities industries
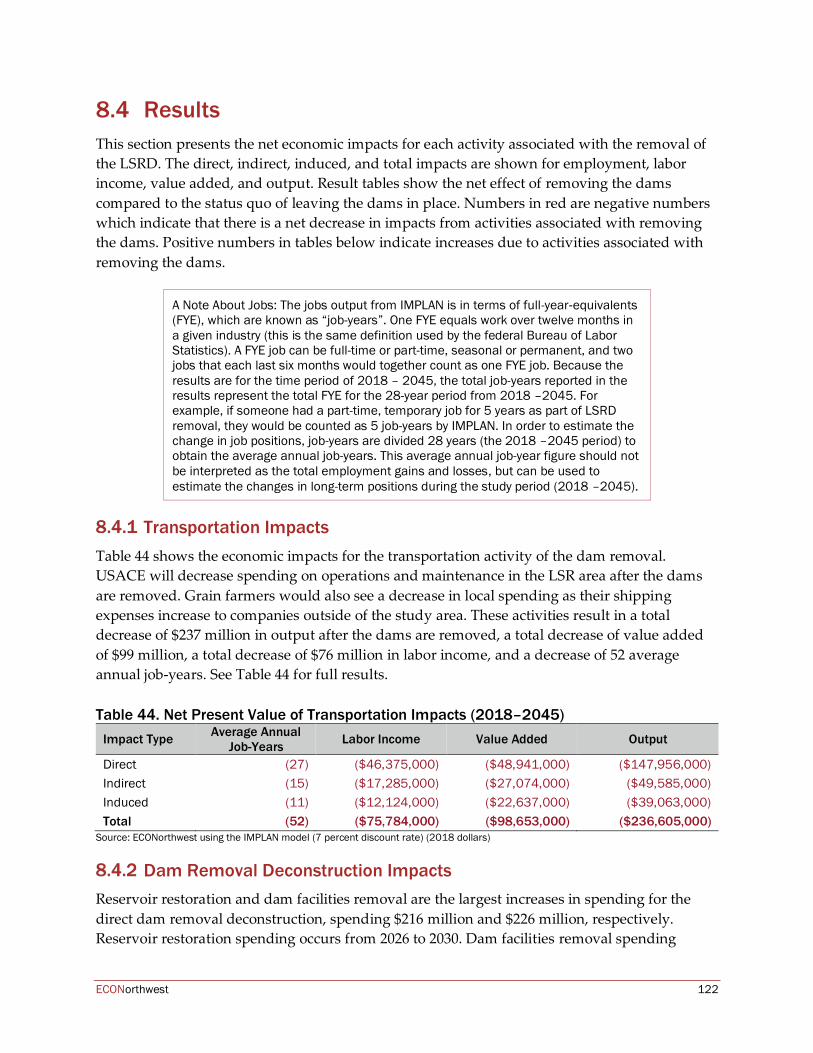
ECONorthwest 122
8.4 Results This section presents the net economic impacts for each activity associated with the removal of the LSRD. The direct, indirect, induced, and total impacts are shown for employment, labor income, value added, and output. Result tables show the net effect of removing the dams compared to the status quo of leaving the dams in place. Numbers in red are negative numbers which indicate that there is a net decrease in impacts from activities associated with removing the dams. Positive numbers in tables below indicate increases due to activities associated with removing the dams.
A Note About Jobs: The jobs output from IMPLAN is in terms of full-year‑equivalents (FYE), which are known as “job-years”. One FYE equals work over twelve months in a given industry (this is the same definition used by the federal Bureau of Labor Statistics). A FYE job can be full-time or part-time, seasonal or permanent, and two jobs that each last six months would together count as one FYE job. Because the results are for the time period of 2018 – 2045, the total job-years reported in the results represent the total FYE for the 28-year period from 2018 –2045. For example, if someone had a part-time, temporary job for 5 years as part of LSRD removal, they would be counted as 5 job-years by IMPLAN. In order to estimate the change in job positions, job-years are divided 28 years (the 2018 –2045 period) to obtain the average annual job-years. This average annual job-year figure should not be interpreted as the total employment gains and losses, but can be used to estimate the changes in long-term positions during the study period (2018 –2045).
Transportation Impacts Table 44 shows the economic impacts for the transportation activity of the dam removal. USACE will decrease spending on operations and maintenance in the LSR area after the dams are removed. Grain farmers would also see a decrease in local spending as their shipping expenses increase to companies outside of the study area. These activities result in a total decrease of $237 million in output after the dams are removed, a total decrease of value added of $99 million, a total decrease of $76 million in labor income, and a decrease of 52 average annual job-years. See Table 44 for full results.
Table 44. Net Present Value of Transportation Impacts (2018–2045)
Impact Type Average Annual Job-Years Labor Income Value Added Output
Direct (27) ($46,375,000) ($48,941,000) ($147,956,000) Indirect (15) ($17,285,000) ($27,074,000) ($49,585,000) Induced (11) ($12,124,000) ($22,637,000) ($39,063,000) Total (52) ($75,784,000) ($98,653,000) ($236,605,000)
Source: ECONorthwest using the IMPLAN model (7 percent discount rate) (2018 dollars)
Dam Removal Deconstruction Impacts Reservoir restoration and dam facilities removal are the largest increases in spending for the direct dam removal deconstruction, spending $216 million and $226 million, respectively. Reservoir restoration spending occurs from 2026 to 2030. Dam facilities removal spending
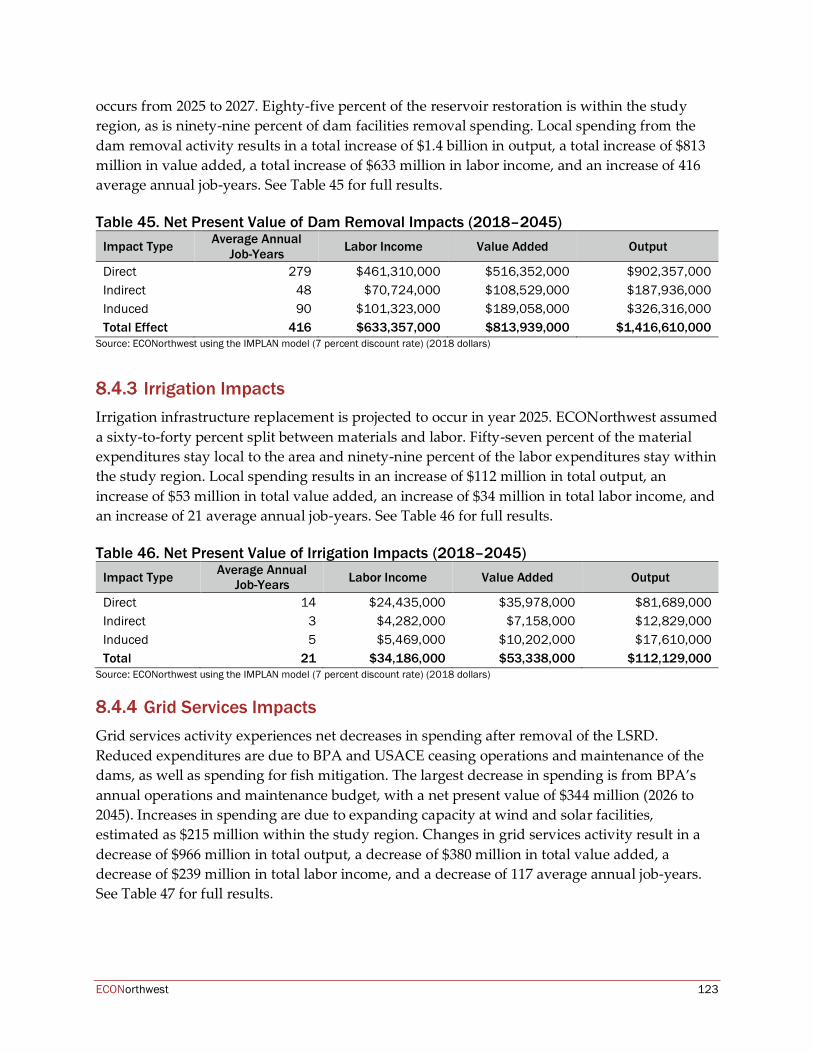
ECONorthwest 123
occurs from 2025 to 2027. Eighty-five percent of the reservoir restoration is within the study region, as is ninety-nine percent of dam facilities removal spending. Local spending from the dam removal activity results in a total increase of $1.4 billion in output, a total increase of $813 million in value added, a total increase of $633 million in labor income, and an increase of 416 average annual job-years. See Table 45 for full results. Table 45. Net Present Value of Dam Removal Impacts (2018–2045)
Impact Type Average Annual Job-Years Labor Income Value Added Output
Direct 279 $461,310,000 $516,352,000 $902,357,000 Indirect 48 $70,724,000 $108,529,000 $187,936,000 Induced 90 $101,323,000 $189,058,000 $326,316,000 Total Effect 416 $633,357,000 $813,939,000 $1,416,610,000
Source: ECONorthwest using the IMPLAN model (7 percent discount rate) (2018 dollars)
Irrigation Impacts Irrigation infrastructure replacement is projected to occur in year 2025. ECONorthwest assumed a sixty-to-forty percent split between materials and labor. Fifty-seven percent of the material expenditures stay local to the area and ninety-nine percent of the labor expenditures stay within the study region. Local spending results in an increase of $112 million in total output, an increase of $53 million in total value added, an increase of $34 million in total labor income, and an increase of 21 average annual job-years. See Table 46 for full results. Table 46. Net Present Value of Irrigation Impacts (2018–2045)
Impact Type Average Annual Job-Years Labor Income Value Added Output
Direct 14 $24,435,000 $35,978,000 $81,689,000 Indirect 3 $4,282,000 $7,158,000 $12,829,000 Induced 5 $5,469,000 $10,202,000 $17,610,000 Total 21 $34,186,000 $53,338,000 $112,129,000
Source: ECONorthwest using the IMPLAN model (7 percent discount rate) (2018 dollars)
Grid Services Impacts Grid services activity experiences net decreases in spending after removal of the LSRD. Reduced expenditures are due to BPA and USACE ceasing operations and maintenance of the dams, as well as spending for fish mitigation. The largest decrease in spending is from BPA’s annual operations and maintenance budget, with a net present value of $344 million (2026 to 2045). Increases in spending are due to expanding capacity at wind and solar facilities, estimated as $215 million within the study region. Changes in grid services activity result in a decrease of $966 million in total output, a decrease of $380 million in total value added, a decrease of $239 million in total labor income, and a decrease of 117 average annual job-years. See Table 47 for full results.
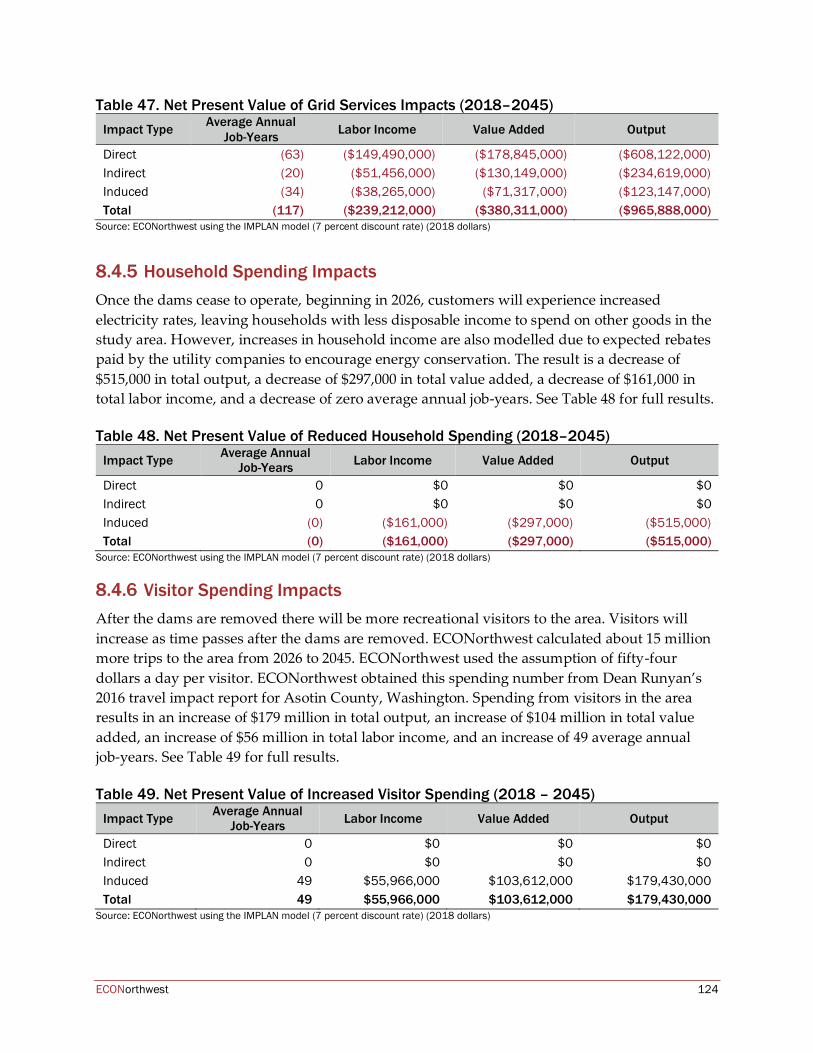
ECONorthwest 124
Table 47. Net Present Value of Grid Services Impacts (2018–2045) Impact Type Average Annual
Job-Years Labor Income Value Added Output
Direct (63) ($149,490,000) ($178,845,000) ($608,122,000) Indirect (20) ($51,456,000) ($130,149,000) ($234,619,000) Induced (34) ($38,265,000) ($71,317,000) ($123,147,000) Total (117) ($239,212,000) ($380,311,000) ($965,888,000)
Source: ECONorthwest using the IMPLAN model (7 percent discount rate) (2018 dollars)
Household Spending Impacts Once the dams cease to operate, beginning in 2026, customers will experience increased electricity rates, leaving households with less disposable income to spend on other goods in the study area. However, increases in household income are also modelled due to expected rebates paid by the utility companies to encourage energy conservation. The result is a decrease of $515,000 in total output, a decrease of $297,000 in total value added, a decrease of $161,000 in total labor income, and a decrease of zero average annual job-years. See Table 48 for full results. Table 48. Net Present Value of Reduced Household Spending (2018–2045)
Impact Type Average Annual Job-Years Labor Income Value Added Output
Direct 0 $0 $0 $0 Indirect 0 $0 $0 $0 Induced (0) ($161,000) ($297,000) ($515,000) Total (0) ($161,000) ($297,000) ($515,000)
Source: ECONorthwest using the IMPLAN model (7 percent discount rate) (2018 dollars)
Visitor Spending Impacts After the dams are removed there will be more recreational visitors to the area. Visitors will increase as time passes after the dams are removed. ECONorthwest calculated about 15 million more trips to the area from 2026 to 2045. ECONorthwest used the assumption of fifty-four dollars a day per visitor. ECONorthwest obtained this spending number from Dean Runyan’s 2016 travel impact report for Asotin County, Washington. Spending from visitors in the area results in an increase of $179 million in total output, an increase of $104 million in total value added, an increase of $56 million in total labor income, and an increase of 49 average annual job-years. See Table 49 for full results. Table 49. Net Present Value of Increased Visitor Spending (2018 – 2045)
Impact Type Average Annual Job-Years Labor Income Value Added Output
Direct 0 $0 $0 $0 Indirect 0 $0 $0 $0 Induced 49 $55,966,000 $103,612,000 $179,430,000 Total 49 $55,966,000 $103,612,000 $179,430,000
Source: ECONorthwest using the IMPLAN model (7 percent discount rate) (2018 dollars)
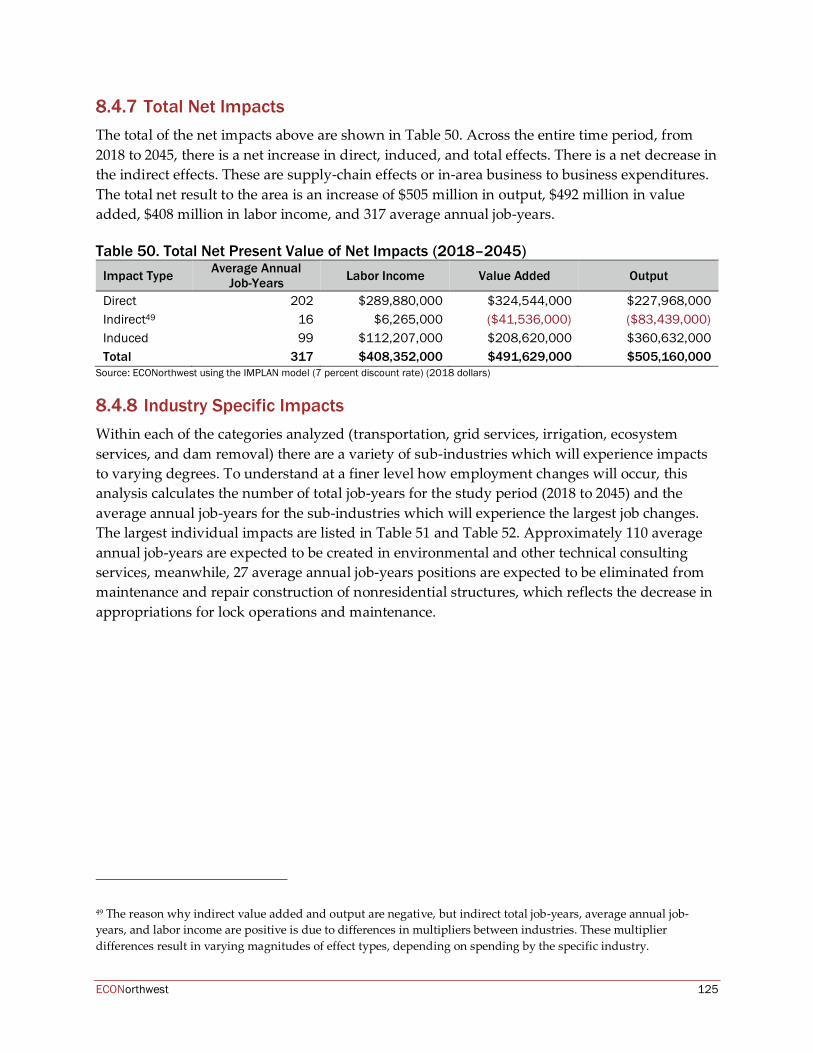
ECONorthwest 125
Total Net Impacts The total of the net impacts above are shown in Table 50. Across the entire time period, from 2018 to 2045, there is a net increase in direct, induced, and total effects. There is a net decrease in the indirect effects. These are supply-chain effects or in-area business to business expenditures. The total net result to the area is an increase of $505 million in output, $492 million in value added, $408 million in labor income, and 317 average annual job-years. Table 50. Total Net Present Value of Net Impacts (2018–2045)
Impact Type Average Annual Job-Years Labor Income Value Added Output
Direct 202 $289,880,000 $324,544,000 $227,968,000 Indirect49 16 $6,265,000 ($41,536,000) ($83,439,000) Induced 99 $112,207,000 $208,620,000 $360,632,000 Total 317 $408,352,000 $491,629,000 $505,160,000
Source: ECONorthwest using the IMPLAN model (7 percent discount rate) (2018 dollars)
Industry Specific Impacts Within each of the categories analyzed (transportation, grid services, irrigation, ecosystem services, and dam removal) there are a variety of sub-industries which will experience impacts to varying degrees. To understand at a finer level how employment changes will occur, this analysis calculates the number of total job-years for the study period (2018 to 2045) and the average annual job-years for the sub-industries which will experience the largest job changes. The largest individual impacts are listed in Table 51 and Table 52. Approximately 110 average annual job-years are expected to be created in environmental and other technical consulting services, meanwhile, 27 average annual job-years positions are expected to be eliminated from maintenance and repair construction of nonresidential structures, which reflects the decrease in appropriations for lock operations and maintenance.
49 The reason why indirect value added and output are negative, but indirect total job-years, average annual job-years, and labor income are positive is due to differences in multipliers between industries. These multiplier differences result in varying magnitudes of effect types, depending on spending by the specific industry.
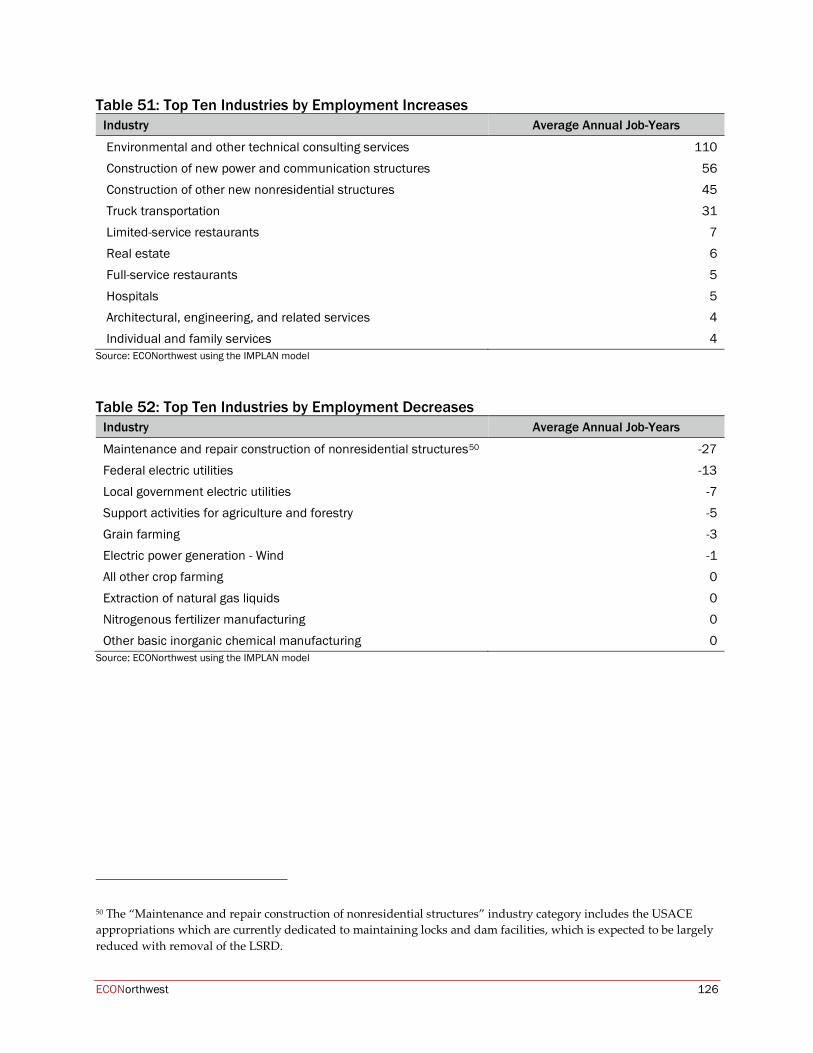
ECONorthwest 126
Table 51: Top Ten Industries by Employment Increases Industry Average Annual Job-Years
Environmental and other technical consulting services 110 Construction of new power and communication structures 56 Construction of other new nonresidential structures 45 Truck transportation 31 Limited-service restaurants 7 Real estate 6 Full-service restaurants 5 Hospitals 5 Architectural, engineering, and related services 4 Individual and family services 4
Source: ECONorthwest using the IMPLAN model
Table 52: Top Ten Industries by Employment Decreases
Industry Average Annual Job-Years
Maintenance and repair construction of nonresidential structures50 -27 Federal electric utilities -13 Local government electric utilities -7 Support activities for agriculture and forestry -5 Grain farming -3 Electric power generation - Wind -1 All other crop farming 0 Extraction of natural gas liquids 0 Nitrogenous fertilizer manufacturing 0 Other basic inorganic chemical manufacturing 0
Source: ECONorthwest using the IMPLAN model
50 The “Maintenance and repair construction of nonresidential structures” industry category includes the USACE appropriations which are currently dedicated to maintaining locks and dam facilities, which is expected to be largely reduced with removal of the LSRD.
ECONorthwest 127
9 Benefit Cost Analysis This section uses the analysis developed in this report to answer the question of whether LSRD removal produces a positive or negative net effect on social well-being. Removal of the LSRD can produce net benefits to society when, theoretically, the benefits are large enough for the winners to compensate the losers so that everyone is at or above their current level of well-being. The benefit-cost analysis (BCA) takes the broadest societal perspective. It is concerned with the utilization, or conservation of scarce resources (i.e. water or transportation) in the pursuit of societal goals and objectives. In this sense, BCA typically does not evaluate transfers of value from one sector of the economy to another when a government changes the way it spends tax dollars. If more benefits can be generated in one sector than a different one with the same expenditure, then society is considered better off as a whole. When economists evaluate changes that make individuals, households, or firms better or worse off, they rely on a set of frameworks embodied in what is called utility theory. This theory is based on the premise that individuals are their own best judge of their welfare, and economists can identify those factors that increase or decrease an individual’s welfare by observing how the individual makes choices among alternative goods and services. Some of these goods and services are rival, excludable, and efficiently provided in markets. These are called “private goods” and comprise almost all products you could buy in a store. On the other hand, environmental goods and services (i.e. clean air) are non-rival and non-excludable, meeting the classical definition of a “public good.” These are generally not directly bought or sold on a market, and individuals do not have the opportunity to choose a given quantity or quality at a particular price. Utility theory is useful in showing how individuals are made better or worse off with changes in prices, environmental quality, and income. For example, a decrease in environmental quality can be compensated with an increase in income so that the individual is indifferent to the change. When measured appropriately, and at an adequate aggregate scale, both private expenditures and public values can be combined to measure net benefits.
9.1 Incorporating Future Changes The measurement of benefits and costs is a function of current prices, environmental quality, and income, as well as expectations about how these elements could change in the future. Individuals make tradeoffs between income and consumption across time, often forgoing spending now with the plan of spending more in the future. This intertemporal component of utility is incorporated by evaluating changes in benefits and costs across multiple additive and separable time periods. To capture the cost of time, future benefits and costs are discounted by a rate multiplied by time in the future. A number of different discount rates are regularly used,
ECONorthwest 128
ranging from the cost of borrowing to the rate of return of U.S. Treasury securities, which is considered a riskless investment vehicle. For this analysis, all benefits and costs are evaluated over a 20-year time period following a hypothetical dam removal occurring in 2025 through 2045, at two discount rates. 1) A 2.75 percent discount rate based on Bureau of Reclamation’s recommended interest rate for the formulation and evaluation of plans for water and related land resources. 2) A 7 percent discount rate based on guidance from the Office of Management and Budget’s Circular A-94: “Constant-dollar benefit-cost analyses of proposed investments and regulations should report net present value and other outcomes determined using a real discount rate of 7 percent. This rate approximates the marginal pretax rate of return on an average investment in the private sector in recent years.” Use of both values account will show different tradeoffs between benefits and costs over time. Where space is limited, results based only on the 2.75 percent discount rate are reported.
9.2 Welfare Effects of Removal of the LSRD LSRD removal may lead to a range of potential changes to prices, environmental quality, and income. With the BCA, identifying how each of these changes intersect to affect the welfare effects and economic impacts is key to understanding the overall costs and benefits as well as the distribution of those impacts. The welfare effects identified in this study are measured as a comparison between two scenarios with a range of exogenous effects, producing a series of possible outcomes. The policy choices being considered by USACE are some combination of keeping /removing the LSRD and/or modifying operations of the dams and river system. Exogenous effects refer to other changes that may occur in the future that also affect the river system such as population growth, climate change, or electricity demand. Combining all of the potential outcomes of all possible variables can lead to an almost infinite number of scenarios. A traditional EIS process selects distinct scenarios and evaluates each of them independently, which eases the analytical burden. The original draft EIS evaluated four alternative scenarios:
• Alternative 1—Existing Conditions (No action), • Alternative 2—Maximum Transport of Juvenile Salmon, • Alternative 3—Major System Improvements (Adaptive Migration), and • Alternative 4—Dam Breaching.
For the 2002 EIS, USACE ultimately selected a modified Alternative 3 as the preferred alternative. This resulted in structural improvements to the LSRD, turbine replacement to enhance fish passage, increased spill during juvenile salmon migration, additional hatchery operations, and active fish transportation. Adaptive migration was selected because it provides greater flexibility to switch between in-river migration and barge or truck transportation as conditions required, and in response to subsequent biological opinions.
ECONorthwest 129
Based on current information released to the public by BPA and USACE, the ongoing Columbia River System EIS will develop five alternatives with a combination of single and/or multi-objective goals. Fish passage and operational flexibility are the primary goals, which are then further defined by a narrower set of goals listed below:
• Fish Passage and Survival o Adult Anadromous Fish Survival o ESA-Listed Resident Fish Survival o Juvenile Anadromous Fish Survival o LSRD Breach
• Operation Flexibility
o Hydropower Generation o Water Management o Water Supply
The various scenarios will be developed out of the goals listed above and may include a number of actions to achieve them, including:
• Change fish passage spill levels, ranging from no spill to 110/125 percent TDG, with additional changes within the fish migration season;
• Keep reservoir pool levels at different minimum operating pools through the season, • Reconfigure fish passage to include surface passage spillways and spillway weirs; • Modify hydropower generation targets from low/restricted to optimized for energy
production; • Increase water deliveries from Chief Joseph and Grand Coulee on the Columbia; and • Implement a sliding-scale summer draft at Libby and Hungry Horse Dams.
The last two would have little effect on the LSRD (because of their location) but do address fish passage and survival, as well as operational flexibility in the greater Columbia River Basin. USACE will select a preferred alternative based on each scenario’s performance against costs/resources, potential climate change impacts on hydrological variability, and additional mitigation measures that are needed to ensure that the Columbia River system fulfills its two goals of environmental stewardship and clean power. This analysis seeks to evaluate only one explicit scenario: the most likely set of conditions with the LSRD removed compared to the most likely set of conditions with the LSRD still in place. Both states of the world will likely include adaptive management to ensure the survival of endangered fish species. It is important to remember that a BCA does not consider the distributional effects what sector or individuals are incurring the cost versus earning the benefit, and instead illustrates the values to the whole of society. Table 53 summarizes the costs and benefits estimated throughout this study, using an assumption of LSRD removal occurring in 2025, with benefits calculated through 2045.
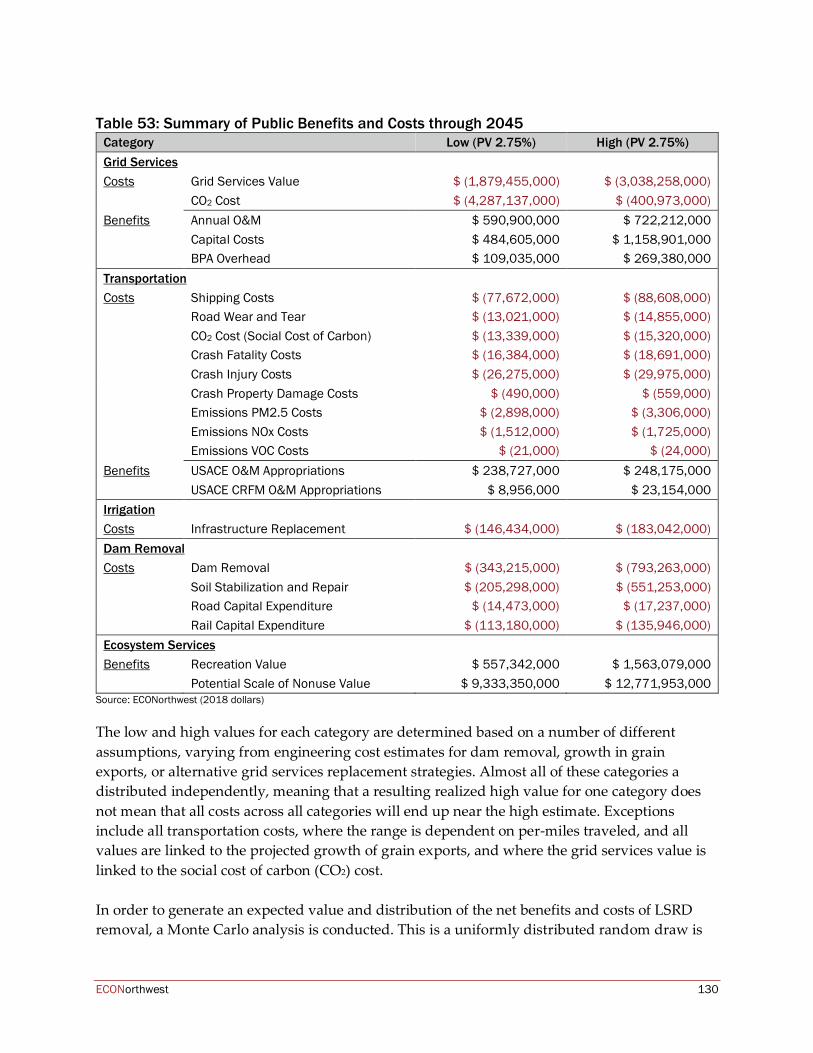
ECONorthwest 130
Table 53: Summary of Public Benefits and Costs through 2045
Category Low (PV 2.75%) High (PV 2.75%) Grid Services Costs Grid Services Value $ (1,879,455,000) $ (3,038,258,000) CO2 Cost $ (4,287,137,000) $ (400,973,000) Benefits Annual O&M $ 590,900,000 $ 722,212,000 Capital Costs $ 484,605,000 $ 1,158,901,000 BPA Overhead $ 109,035,000 $ 269,380,000 Transportation Costs Shipping Costs $ (77,672,000) $ (88,608,000) Road Wear and Tear $ (13,021,000) $ (14,855,000) CO2 Cost (Social Cost of Carbon) $ (13,339,000) $ (15,320,000) Crash Fatality Costs $ (16,384,000) $ (18,691,000) Crash Injury Costs $ (26,275,000) $ (29,975,000) Crash Property Damage Costs $ (490,000) $ (559,000) Emissions PM2.5 Costs $ (2,898,000) $ (3,306,000) Emissions NOx Costs $ (1,512,000) $ (1,725,000) Emissions VOC Costs $ (21,000) $ (24,000) Benefits USACE O&M Appropriations $ 238,727,000 $ 248,175,000 USACE CRFM O&M Appropriations $ 8,956,000 $ 23,154,000 Irrigation Costs Infrastructure Replacement $ (146,434,000) $ (183,042,000) Dam Removal Costs Dam Removal $ (343,215,000) $ (793,263,000) Soil Stabilization and Repair $ (205,298,000) $ (551,253,000) Road Capital Expenditure $ (14,473,000) $ (17,237,000) Rail Capital Expenditure $ (113,180,000) $ (135,946,000) Ecosystem Services Benefits Recreation Value $ 557,342,000 $ 1,563,079,000 Potential Scale of Nonuse Value $ 9,333,350,000 $ 12,771,953,000
Source: ECONorthwest (2018 dollars)
The low and high values for each category are determined based on a number of different assumptions, varying from engineering cost estimates for dam removal, growth in grain exports, or alternative grid services replacement strategies. Almost all of these categories a distributed independently, meaning that a resulting realized high value for one category does not mean that all costs across all categories will end up near the high estimate. Exceptions include all transportation costs, where the range is dependent on per-miles traveled, and all values are linked to the projected growth of grain exports, and where the grid services value is linked to the social cost of carbon (CO2) cost. In order to generate an expected value and distribution of the net benefits and costs of LSRD removal, a Monte Carlo analysis is conducted. This is a uniformly distributed random draw is
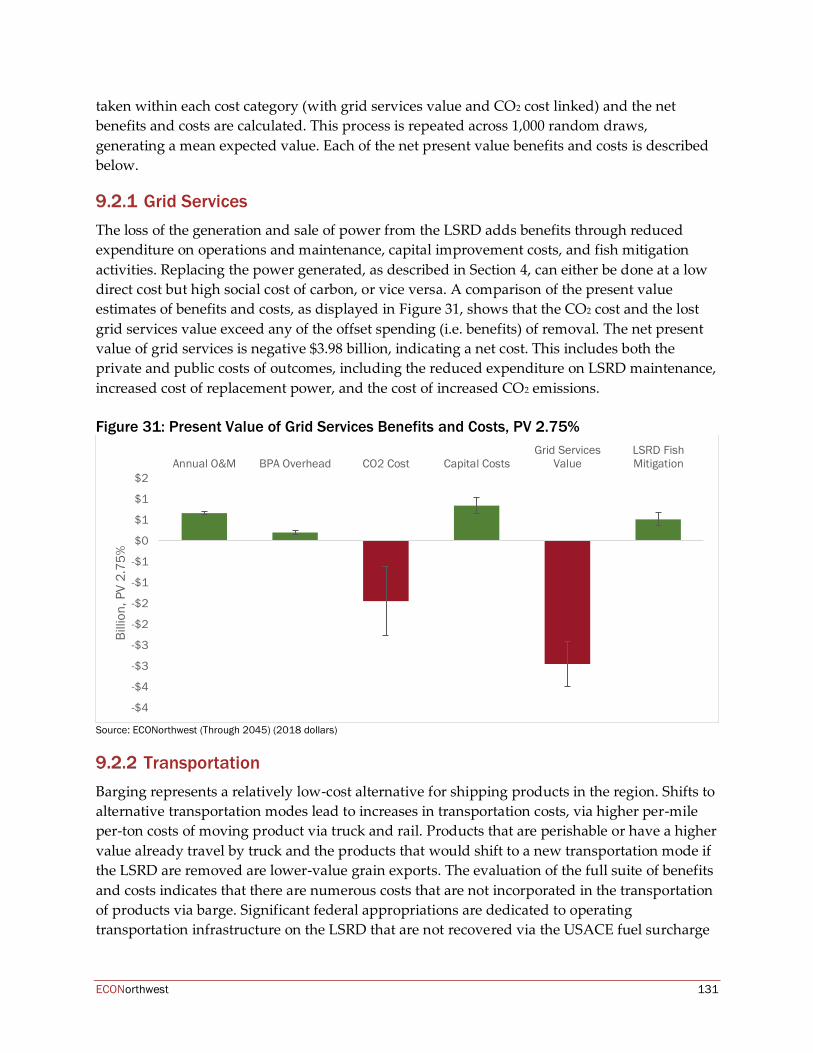
ECONorthwest 131
taken within each cost category (with grid services value and CO2 cost linked) and the net benefits and costs are calculated. This process is repeated across 1,000 random draws, generating a mean expected value. Each of the net present value benefits and costs is described below.
Grid Services The loss of the generation and sale of power from the LSRD adds benefits through reduced expenditure on operations and maintenance, capital improvement costs, and fish mitigation activities. Replacing the power generated, as described in Section 4, can either be done at a low direct cost but high social cost of carbon, or vice versa. A comparison of the present value estimates of benefits and costs, as displayed in Figure 31, shows that the CO2 cost and the lost grid services value exceed any of the offset spending (i.e. benefits) of removal. The net present value of grid services is negative $3.98 billion, indicating a net cost. This includes both the private and public costs of outcomes, including the reduced expenditure on LSRD maintenance, increased cost of replacement power, and the cost of increased CO2 emissions. Figure 31: Present Value of Grid Services Benefits and Costs, PV 2.75%
Source: ECONorthwest (Through 2045) (2018 dollars)
Transportation Barging represents a relatively low-cost alternative for shipping products in the region. Shifts to alternative transportation modes lead to increases in transportation costs, via higher per-mile per-ton costs of moving product via truck and rail. Products that are perishable or have a higher value already travel by truck and the products that would shift to a new transportation mode if the LSRD are removed are lower-value grain exports. The evaluation of the full suite of benefits and costs indicates that there are numerous costs that are not incorporated in the transportation of products via barge. Significant federal appropriations are dedicated to operating transportation infrastructure on the LSRD that are not recovered via the USACE fuel surcharge
-$4
-$4
-$3
-$3
-$2
-$2
-$1
-$1
$0
$1
$1
$2Annual O&M BPA Overhead CO2 Cost Capital Costs
Grid ServicesValue
LSRD FishMitigation
Billi
on, P
V 2.
75%
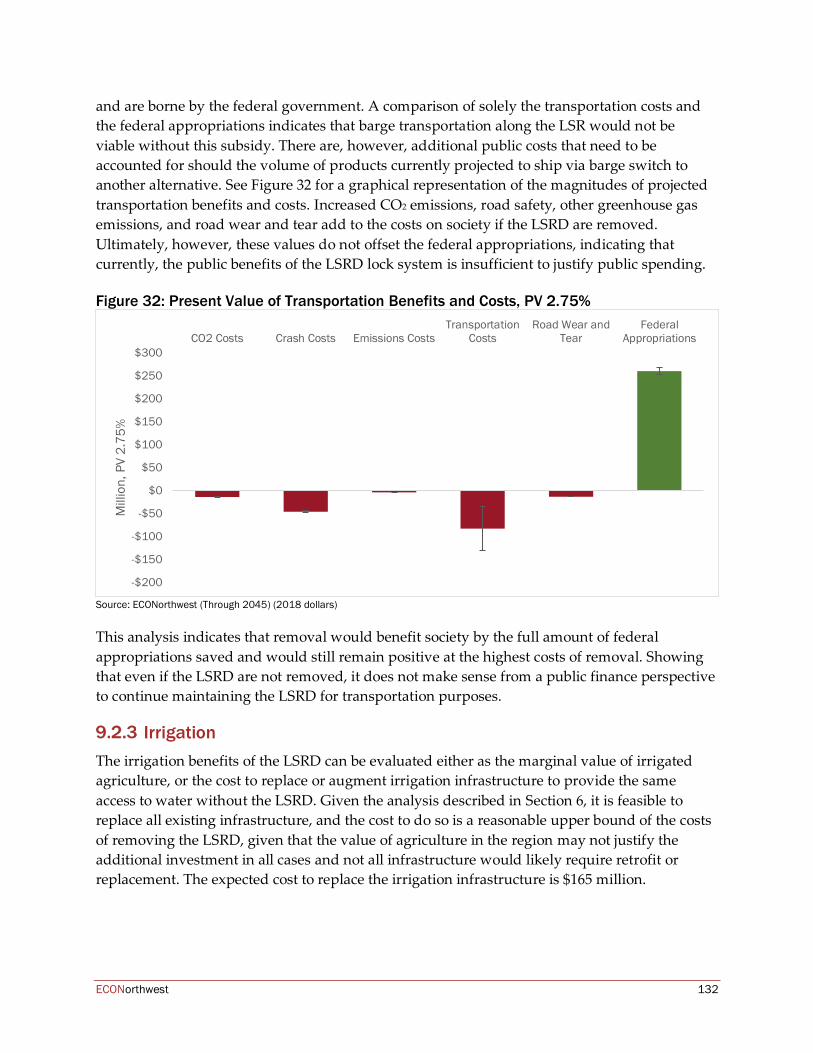
ECONorthwest 132
and are borne by the federal government. A comparison of solely the transportation costs and the federal appropriations indicates that barge transportation along the LSR would not be viable without this subsidy. There are, however, additional public costs that need to be accounted for should the volume of products currently projected to ship via barge switch to another alternative. See Figure 32 for a graphical representation of the magnitudes of projected transportation benefits and costs. Increased CO2 emissions, road safety, other greenhouse gas emissions, and road wear and tear add to the costs on society if the LSRD are removed. Ultimately, however, these values do not offset the federal appropriations, indicating that currently, the public benefits of the LSRD lock system is insufficient to justify public spending. Figure 32: Present Value of Transportation Benefits and Costs, PV 2.75%
Source: ECONorthwest (Through 2045) (2018 dollars)
This analysis indicates that removal would benefit society by the full amount of federal appropriations saved and would still remain positive at the highest costs of removal. Showing that even if the LSRD are not removed, it does not make sense from a public finance perspective to continue maintaining the LSRD for transportation purposes.
Irrigation The irrigation benefits of the LSRD can be evaluated either as the marginal value of irrigated agriculture, or the cost to replace or augment irrigation infrastructure to provide the same access to water without the LSRD. Given the analysis described in Section 6, it is feasible to replace all existing infrastructure, and the cost to do so is a reasonable upper bound of the costs of removing the LSRD, given that the value of agriculture in the region may not justify the additional investment in all cases and not all infrastructure would likely require retrofit or replacement. The expected cost to replace the irrigation infrastructure is $165 million.
-$200
-$150
-$100
-$50
$0
$50
$100
$150
$200
$250
$300CO2 Costs Crash Costs Emissions Costs
TransportationCosts
Road Wear andTear
FederalAppropriations
Mill
ion,
PV
2.75
%
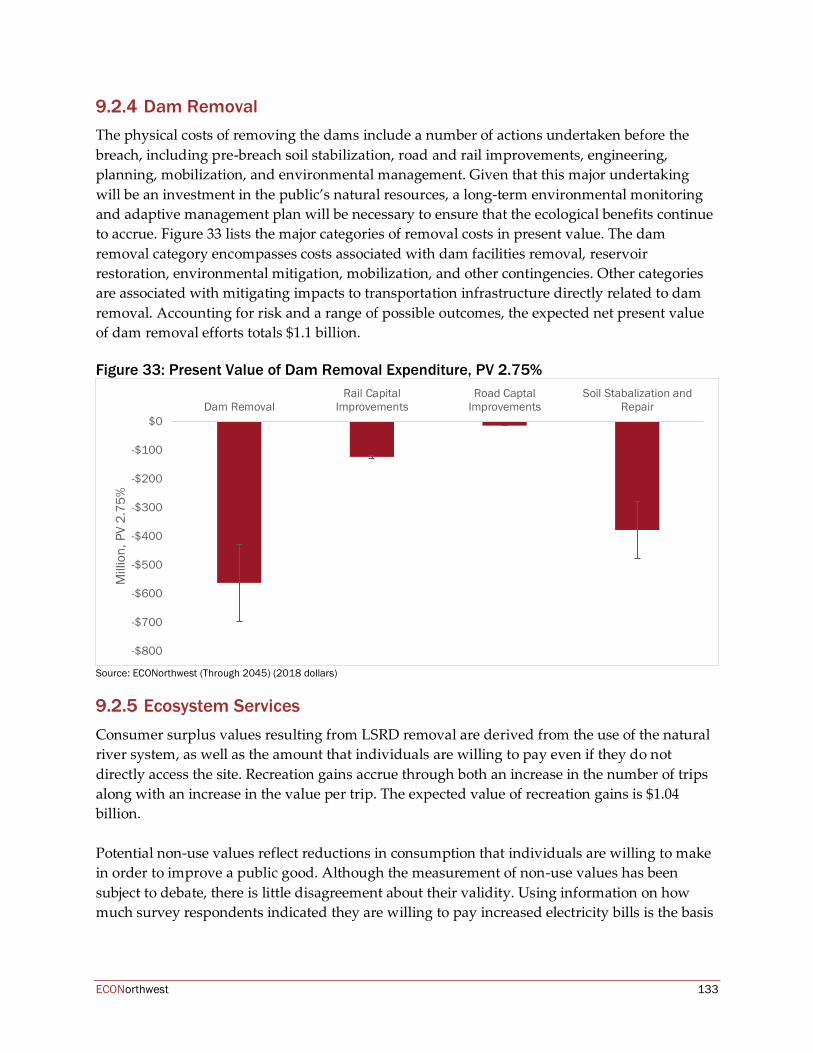
ECONorthwest 133
Dam Removal The physical costs of removing the dams include a number of actions undertaken before the breach, including pre-breach soil stabilization, road and rail improvements, engineering, planning, mobilization, and environmental management. Given that this major undertaking will be an investment in the public’s natural resources, a long-term environmental monitoring and adaptive management plan will be necessary to ensure that the ecological benefits continue to accrue. Figure 33 lists the major categories of removal costs in present value. The dam removal category encompasses costs associated with dam facilities removal, reservoir restoration, environmental mitigation, mobilization, and other contingencies. Other categories are associated with mitigating impacts to transportation infrastructure directly related to dam removal. Accounting for risk and a range of possible outcomes, the expected net present value of dam removal efforts totals $1.1 billion. Figure 33: Present Value of Dam Removal Expenditure, PV 2.75%
Source: ECONorthwest (Through 2045) (2018 dollars)
Ecosystem Services Consumer surplus values resulting from LSRD removal are derived from the use of the natural river system, as well as the amount that individuals are willing to pay even if they do not directly access the site. Recreation gains accrue through both an increase in the number of trips along with an increase in the value per trip. The expected value of recreation gains is $1.04 billion. Potential non-use values reflect reductions in consumption that individuals are willing to make in order to improve a public good. Although the measurement of non-use values has been subject to debate, there is little disagreement about their validity. Using information on how much survey respondents indicated they are willing to pay increased electricity bills is the basis
-$800
-$700
-$600
-$500
-$400
-$300
-$200
-$100
$0Dam Removal
Rail CapitalImprovements
Road CaptalImprovements
Soil Stabalization andRepair
Mill
ion,
PV
2.75
%
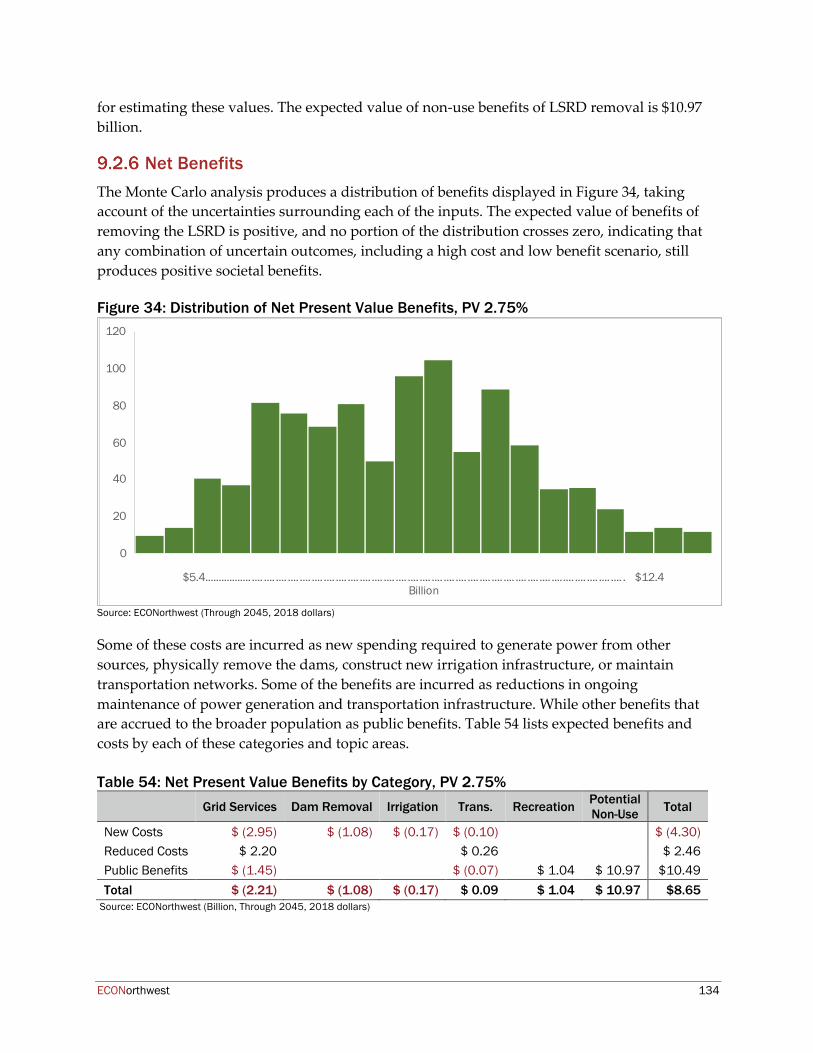
ECONorthwest 134
for estimating these values. The expected value of non-use benefits of LSRD removal is $10.97
billion.
Net Benefits The Monte Carlo analysis produces a distribution of benefits displayed in Figure 34, taking
account of the uncertainties surrounding each of the inputs. The expected value of benefits of
removing the LSRD is positive, and no portion of the distribution crosses zero, indicating that
any combination of uncertain outcomes, including a high cost and low benefit scenario, still
produces positive societal benefits.
Figure 34: Distribution of Net Present Value Benefits, PV 2.75%
Source: ECONorthwest (Through 2045, 2018 dollars)
Some of these costs are incurred as new spending required to generate power from other
sources, physically remove the dams, construct new irrigation infrastructure, or maintain
transportation networks. Some of the benefits are incurred as reductions in ongoing
maintenance of power generation and transportation infrastructure. While other benefits that
are accrued to the broader population as public benefits. Table 54 lists expected benefits and
costs by each of these categories and topic areas.
Table 54: Net Present Value Benefits by Category, PV 2.75% Grid Services Dam Removal Irrigation Trans. Recreation Potential
Non-Use Total
New Costs $ (2.95) $ (1.08) $ (0.17) $ (0.10) $ (4.30) Reduced Costs $ 2.20 $ 0.26 $ 2.46 Public Benefits $ (1.45) $ (0.07) $ 1.04 $ 10.97 $10.49 Total $ (2.21) $ (1.08) $ (0.17) $ 0.09 $ 1.04 $ 10.97 $8.65
Source: ECONorthwest (Billion, Through 2045, 2018 dollars)
$5.4................. .... .... .... .... .... .... .... .... .... .... .... .... .... .... .... .... .... .... .... .... .... .... .... .... .... ........ .... .... .... .... . $12.4Billion
0
20
40
60
80
100
120
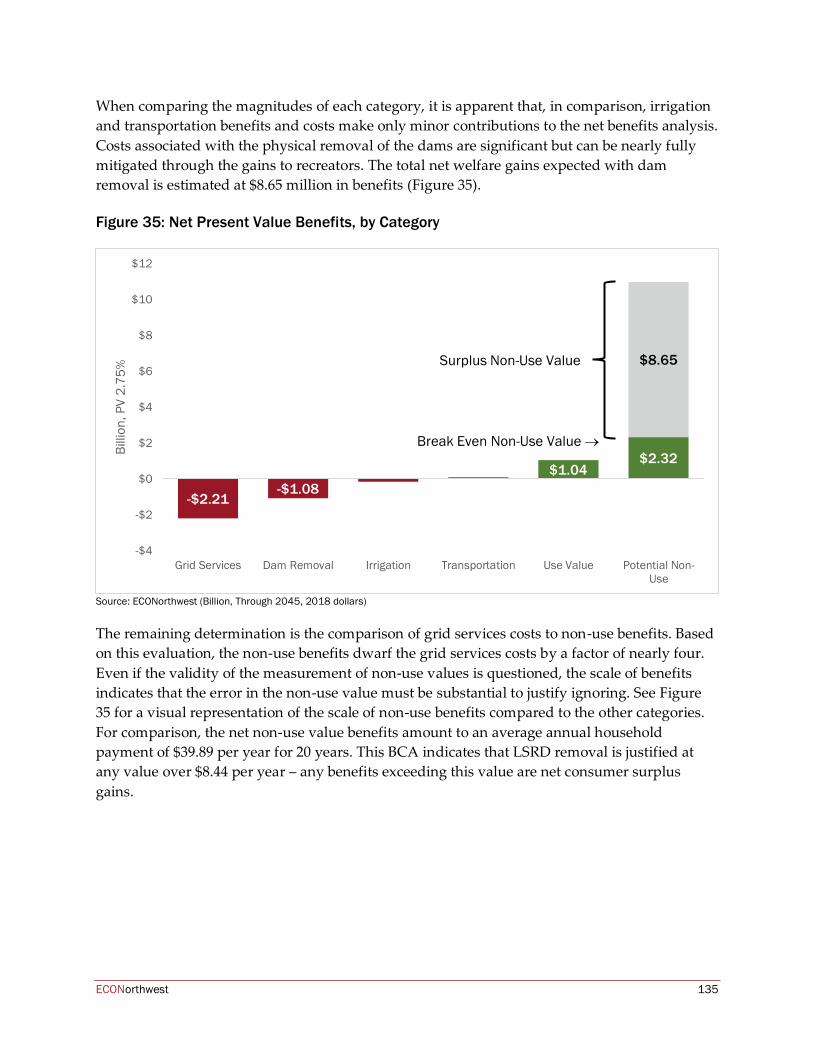
ECONorthwest 135
When comparing the magnitudes of each category, it is apparent that, in comparison, irrigation and transportation benefits and costs make only minor contributions to the net benefits analysis. Costs associated with the physical removal of the dams are significant but can be nearly fully mitigated through the gains to recreators. The total net welfare gains expected with dam removal is estimated at $8.65 million in benefits (Figure 35). Figure 35: Net Present Value Benefits, by Category
Source: ECONorthwest (Billion, Through 2045, 2018 dollars)
The remaining determination is the comparison of grid services costs to non-use benefits. Based on this evaluation, the non-use benefits dwarf the grid services costs by a factor of nearly four. Even if the validity of the measurement of non-use values is questioned, the scale of benefits indicates that the error in the non-use value must be substantial to justify ignoring. See Figure 35 for a visual representation of the scale of non-use benefits compared to the other categories. For comparison, the net non-use value benefits amount to an average annual household payment of $39.89 per year for 20 years. This BCA indicates that LSRD removal is justified at any value over $8.44 per year – any benefits exceeding this value are net consumer surplus gains.
-$2.21-$1.08
$1.04$2.32
$8.65
-$4
-$2
$0
$2
$4
$6
$8
$10
$12
Grid Services Dam Removal Irrigation Transportation Use Value Potential Non-Use
Billi
on, P
V 2.
75%
Break Even Non-Use Value →
Surplus Non-Use Value
ECONorthwest 136
10 Conclusion Throughout this study, every effort was made to incorporate available information in an objective, unbiased manner. In many instances, substantial public debate has occurred surrounding the specific costs of removal. For instance, separate analyses of the physical cost of removing the dams vary by nearly a factor of three. In other instances, inputs to this study were based on estimates from scientific fields in which we are not experts or sufficient data does not exist. For example, scientific uncertainty prevented us from make a determinate estimate of the timeline for salmon population recovery following dam removal. We did not seek to serve as the arbiter of disagreements or scientific uncertainty. Rather, we evaluated the quality of all available information, made judgments on the validity of estimates, and incorporated reasonable ranges where appropriate. Furthermore, we recognize that the topic of removing the Lower Snake River Dams has been the subject of much public debate. Many highly qualified individuals have studied individual aspects of the analysis reported herein. There may be disagreements with the outcome of our analysis, and there may be disagreements with the inputs used. Nevertheless, this report serves as our best estimate of the benefits, costs, and economic impacts of removing the Lower Snake River Dams. Beyond the specific values reported, there are several major conclusions worth noting. The lock system that supports shipments of goods by barge on the Lower Snake River operates at a net loss. Transporting goods along the Lower Snake River by barge is cheaper, produces less emissions, and is relatively safer than shipping goods by truck or rail. However, even when evaluating the additional private and public costs associated with alternative transportation modes, the costs do not exceed the federal appropriations dedicated to supporting navigational operations and maintenance of the four Lower Snake River Dams. Even if the dams were not removed, a benefit-cost analysis does not support ongoing operation of the locks. The cost to replace irrigation infrastructure is comparatively inexpensive. Irrigated farmland in the surrounding area could suffer substantial economic losses with removal of the dams if water supply is interrupted and no adaptation or alternative approach is pursued. Reasonable and financially feasible adaptation options do exist though. When compared to the magnitude of other elements, the cost to augment irrigation infrastructure following removal is relatively minor and does not serve as a driving determinant of whether the dams should be removed. However, there may be negative distributional impacts to individual irrigators that should also be considered.
ECONorthwest 137
Removing the Lower Snake River Dams will be expensive and will generate substantial positive economic impacts to the region. All previous and current proposed dam removal efforts pale in scale to the effort necessary to remove the dams on the Lower Snake River. Significant funds will need to be spent on engineering, construction, and environmental mitigation both during and long after removal. Undoubtedly a major cost to the broader region, a large share of those dollars will be spent within the counties surround the Lower Snake River. This influx of spending will create positive employment, income, and output through the region. However, not all economic sectors will benefit, and special attention must be paid to identify the winners and the losers of this massive public works project. The loss in grid services value is substantial. Clearly, the largest cost of removing the dams is the reduction in valuable renewable energy production. This electricity enables the comforts of modern life. However, the dams do not produce a critical share of the region’s power, nor do they operate without substantial costs. Bonneville Power Administration sells more power to other regions than the Lower Snake River Dams produce. Furthermore, regular payments are still being made to reimburse the U.S. Treasury for their construction and capital upgrades. Nevertheless, the value of the grid services produced by the dams makes up the largest share of costs incurred from removal. Non-use value gains significantly exceed the total cost of removal. Benefits accruing to the public from a restored natural river system and a reduced extinction risk of wild salmon outweigh the net costs of removing the dams by over $8.6 billion. These values have been used to inform policy and litigation outcomes for over forty years. The tools to measure these values are the subject of rigorous academic debate, however, the magnitude of the scale of benefits estimated in this report raise doubt that the positive net benefits of removing the Lower Snake River Dams is simply a function of measurement error. Our analysis indicates that the average household would be willing to pay nearly $40 per year to remove the dams. However, removal of the dams would be justified at any value over $8.44 per year.
What is different between this analysis and the 2002 EIS? Over sixteen years have passed since the Lower Snake River Dams were last evaluated in a comprehensive fashion. Since that time, renewable electricity has gotten cheaper, the economy has become wealthier, and the health of endangered fish populations on the Lower Snake River have continued to decline. One thing that has not changed since 2002 is the framework that the U.S. Army Corps of Engineers uses to evaluate investments in infrastructure. Their guidance on benefit-cost analysis does not include the consideration of non-use values. This policy is out of step with all other federal agencies, including the Bureau of Reclamation, which used an evaluation of non-use values as a basis for removing four dams on the Klamath River. Based on our analysis, the ongoing EIS is likely to come to the same conclusion as the 2002 EIS. If non-use values and resulting ecological benefits are ignored, then removal of the dams is not justified. However, it is clear now and was clear in 2002, that non-use values are the key to measuring the true benefits of dam removal. These values are valid and must be considered, and overwhelmingly provide a justification for removing the Lower Snake River Dams.
ECONorthwest 138
11 Appendices
11.1 Bibliography Citation
Cite
d
Gen
eral
LSR
Grid
Ser
vice
s
Irrig
atio
n
Tran
spor
tatio
n
Ecos
yste
m
Mis
c .
Notes
Abatzoglou, J. T., Rupp, D. E., & Mote, P. W. (2014). Seasonal Climate Variability and Change in the Pacific Northwest of the United States. Journal of Climate, 27(5), 2125–2142.
x climate change, precipitation, agriculture
Acker, T. L., Buechler, J. T., Knitter, K., Conway, K. J., & Noteboom, R. (2012). Wind Integration Impacts on Hydropower and System Balancing Operations in the Grant County PUD. Wind Engineering, 36(1), 81–96.
x
hydropower, renewable energy, load balancing, wind generation
Adcock, F., Welch, M. & Ellis, D. (2015). Estimating Regional Per-Mile Costs of Transporting Grains and Soybeans by Truck in the United States. Center Norther American Studies Technical Report CNAS-TR2015-1. Prepared for USDA Agricultural Marketing Services. Retrieved from: http://cnas.tamu.edu/Regional%20Transportation%20Cost%20Technical%20Report%20December%202015.pdf
x
x
trucking costs, wheat, shipping, USDA
Allen, M. B., Engle, R. O., Zendt, J. S., Shrier, F. C., Wilson, J. T., & Connolly, P. J. (2016). Salmon and steelhead in the White Salmon River after the removal of Condit Dam–Planning efforts and recolonization results. Fisheries, 41(4), 190-203.
x
x
salmon, habitat restoration, Columbia River, dam removal
American Automobile Association. (2010). “Your Driving Costs.” Retrieved from https://newsroom.aaa.com/auto/your-driving-costs/
x driving costs, transportation
American Community Survey. (2016). 2016 Summary File Data: Population Estimates. Retrieved from https://www.census.gov/programs-surveys/acs/data/summary-file.2016.html
x x
population, demographics
Arntzen, E. V., Miller, B. L., O'Toole, A. C., Niehus, S., Richmond, M. (2013). Evaluating greenhouse gas emissions from hydropower complexes on large rivers in Eastern Washington. Prepared for the U.S. Department of Energy under Contract DE-AC05-76RL01830.
x
x GHG emissions, hydropower, carbon policy,
Dept of Energy
Arrow, K., Solow, R., Portney, P. R., Leamer, E. E., Radner, R., & Schuman, H. (1993). Report of the NOAA panel on contingent valuation. Federal Register, 58(10), 4601-4614.
x
contingent valuation, NOAA
Aspect Consulting (2017). Walla Walla Basin Integrated Flow Enhancement Study.
x
water supply
ECONorthwest 139
Citation
Cite
d
Gen
eral
LSR
Grid
Ser
vice
s
Irrig
atio
n
Tran
spor
tatio
n
Ecos
yste
m
Mis
c .
Notes
Aspect Consulting & Anchor QEA. (2012). Phase 2 Report: Refined Engineering and Cost Estimate for Switzler Reservoir. Washington Department of Ecology. Retrieved from https://fortress.wa.gov/ecy/publications/documents/1712008.pdf
x
x
cost, water supply, irrigation, WA Dept of Ecology
Ball, T., & Casavant, K. (2003). Alternative evaluations of a river drawdown: Reassessing the environmental paradox. Journal of the Transportation Research Forum (Vol. 57, No. 4).
x
x GHG emissions, carbon policy, agriculture,
barge transport, economic impact, modelling
Bednarek, A. T. (2001). Undamming rivers: a review of the ecological impacts of dam removal. Environmental Management, 27(6), 803-814.
x
x x environmental flow, sediment, dam removal, salmon
Bell, K. P., Huppert, D., & Johnson, R. L. (2003). Willingness to Pay for Local Coho Salmon Enhancement in Coastal Communities. Marine Resource Economics, 18(1), 15–31.
x
x
salmon, habitat restoration, non-use valuation
Bellmore, R., Duda, J., Craig, L. S., Greene, S. L., Torgersen, C. E., Collins, M. J., & Vittum, K. (2017). Status and trends of dam removal research in the United States. Wiley Interdisciplinary Reviews: Water, 4(2).
x
x dam removal, economic impacts
Berthelote, A. R. (2013). Forecasting groundwater responses to dam removal. Ph.D. Dissertation. University of Montana. Retrieved from http://search.proquest.com/docview/1418033076/abstract/FC9148FE3E074DDBPQ/1
x
x
dam removal, water supply, groundwater, modelling
Bohlen, C., & Lewis, L. Y. (2009). Examining the economic impacts of hydropower dams on property values using GIS. Journal of Environmental Management, 90, S258–S269. https://doi.org/10.1016/j.jenvman.2008.07.026
x
x
economic impact, dam removal, property values
Bonneville Power Administration, U.S. Army Corps of Engineers, & Bureau of Reclaimation. (2013). Federal Columbia River Power System Improvements and Operations Under the Endangered Species Act - A Progress Report.
x
habitat restoration, costs, hydropower, economic impact, ESA, BPA
Bonneville Power Administration. (2016). Fact Sheet: A Northwest energy solution: Regional power benefits of the lower Snake River dams. Retrieved from https://www.bpa.gov/news/pubs/FactSheets/fs-201603-A-Northwest-energy-solution-Regional-power-benefits-of-the-lower-Snake-River-dams.pdf
x x x
power generation, renewable energy, costs, salmon, BPA
Bonneville Power Administration. (2017a). 2017 Pacific Northwest Loads and Resources Study. Retrieved from https://www.bpa.gov/p/Generation/White-Book/Pages/White-Book-2017.aspx
x
x
power generation, forecast, BPA
ECONorthwest 140
Citation
Cite
d
Gen
eral
LSR
Grid
Ser
vice
s
Irrig
atio
n
Tran
spor
tatio
n
Ecos
yste
m
Mis
c .
Notes
Bonneville Power Administration. (2017b). Annual Report 2017 Empowering the Northwest for 80 Years. Retrieved from https://www.bpa.gov/Finance/FinancialInformation/AnnualReports/Documents/AR2017.pdf
x x
salmon, power generation, costs, habitat restoration, USACE, BPA
Bonneville Power Administration. (2017c). BPA Facts, Fiscal Year 2016.
x
costs, maintenance, BPA Bonneville Power Administration (2017d). Power Revenue Requirement
Study. BP-18-FS-BPA-02 x x
spill cost, power generation, BPA
Bonneville Power Administration. (2017e). Statement of Work CRSO EIS NEPA Socioeconomic Analysis.
x x
EIS, dam removal, economic impact, costs, SOW, BPA
Braatne, J. H., Rood, S. B., Goater, L. A., & Blair, C. L. (2008). Analyzing the impacts of dams on riparian ecosystems: a review of research strategies and their relevance to the Snake River through Hells Canyon. Environmental Management, 41(2), 267–281. https://doi.org/10.1007/s00267-007-9048-4
x
x water supply, environmental flow, dam removal
Brannon, E. L., Amend, D. F., Cronin, M. A., Lannan, J. E., LaPatra, S., McNeil, W. J., ... & Westers, H. (2004). The controversy about salmon hatcheries. Fisheries, 29(9), 12-31.
x
salmon, hatcheries, recovery
Briand, G., Schuck, E. C., & Holland, D. W. (2008). Effects of flow augmentations in the Snake River basin on farms profitability. Journal of the American Water Resources Association, 44(2), 360-366.
x
agriculture, water supply, environmental flow, water rights
Brown, K. B., McIntosh, J. C., Rademacher, L. K., & Lohse, K. A. (2011). Impacts of agricultural irrigation recharge on groundwater quality in a basalt aquifer system (Washington, USA): a multi-tracer approach. Hydrogeology Journal, 19(5), 1039–1051. https://doi.org/10.1007/s10040-011-0736-z
x
stated preference survey, natural resource valuation, non-use valuation, salmon
BST Associates. (2017). 2017 Marine Cargo Forecast and Rail Capacity Analysis. Prepared for Washington Public Ports Association and the Freight Mobility Strategic Investment Board. Retrieved from http://washingtonports.org/wp-content/uploads/2017/10/Marine-Cargo-Forecast-2017-Final-10-2017.pdf
x
x
forecast, freight, agriculture, barge transport, rail transport, WA Ports Association
Budy, P., Thiede, G. P., Bouwes, N., Petrosky, C. E., & Schaller, H. (2002). Evidence linking delayed mortality of Snake River salmon to their earlier hydrosystem experience. North American Journal of Fisheries Management, 22(1), 35-51.
x x
x
salmon, habitat restoration
Bürger, G., Schulla, J., & Werner, A. T. (2011). Estimates of future flow, including extremes, of the Columbia River headwaters. Water Resources Research; Washington, 47(10). http://dx.doi.org.ezproxy.lib.vt.edu/10.1029/2010WR009716
x
x
water supply, environmental flow, climate change, forecast
ECONorthwest 141
Citation
Cite
d
Gen
eral
LSR
Grid
Ser
vice
s
Irrig
atio
n
Tran
spor
tatio
n
Ecos
yste
m
Mis
c .
Notes
Cai, H., Burnham, A., Wang, M. (2013). Updated Emission Factors of Air Pollutants from Vehicle Operations in GREET Using MOVES. Argonne National Laboratory. Retrieved from: https://greet.es.anl.gov/files/vehicles-13
x
x
GHG emissions, shipping, wheat
California Air Resources Board (CARB). (2018). Regulation for the Mandatory Reporting of Greenhouse Gas Emissions. March 6. Retrieved from https://ww3.arb.ca.gov/cc/reporting/ghg-rep/guidance/epe_webinar_2018.pdf
x x power generation, carbon emissions, costs
Carson, R., Mitchell, R., Hanemann, W., Kopp, R., Presser, S., & Ruud, P. (1992). A contingent valuation study of lost passive use values resulting from the Exxon Valdez oil spill (No. 6984). University Library of Munich, Germany.
x
non-use valuation, costs, economic impact
Carson, R., Hanemann, W., Mitchell, R., Presser, S., Ruud, P., Smith, V. (1994). Prospective Interim Lost Use Value Due to DDT and PCB Contamination in the Southern California Bight. NOAA Contract No. DBNC-1-00007. Retrieved from: http://econweb.ucsd.edu/~rcarson/papers/SCalDDT.pdf
x
x
lost-use valuation, NRDA, contingent valuation, survey, NOAA
Casas-Mulet, R., Knut, A., Byman, H., & Prasad, T.N., (2014). The effects of hydropeaking on hyporheic interactions based on field experiments. Hydrological Processes, 29(6), 1370–1384. https://doi.org/10.1002/hyp.10264
x
x
x environmental flow, renewable energy, sediment
Center for Transportation Research, University of Tennessee. (2017). The Impacts of Unscheduled Lock Changes. Prepared for The National Waterways Foundation and The U.S. Maritime Administration.
x
barge transport, agriculture, economic impact
Chance, E. W., Cobourn, K. M., & Thomas, V. A. (2018). Trend Detection for the Extent of Irrigated Agriculture in Idaho’s Snake River Plain, 1984–2016. Remote Sensing, 10(1), 145.
x
agriculture, groundwater, water supply
Christensen C., Grace S. & Waddell J. (2015). The Case for Breaching the Four Lower Snake River Dams to Recover Wild Snake River Salmon. Retrieved from https://www.orcanetwork.org/Main/PDF/Snake%20River%20Endangered%20Salmon%20White%20Paper%2011%204%2015.pdf
x
dam removal, salmon, habitat restoration, costs, EIS critique
Chow, L., & Brant, S. (2017). The 2016 Resource Adequacy Report. California Public Utilities Commission. Retrieved from: http://www.cpuc.ca.gov/WorkArea/DownloadAsset.aspx?id=6442453942
x
x
power generation, renewable energy, costs, power load
ECONorthwest 142
Citation
Cite
d
Gen
eral
LSR
Grid
Ser
vice
s
Irrig
atio
n
Tran
spor
tatio
n
Ecos
yste
m
Mis
c .
Notes
City of Lewiston Public Works Department. (2016). City of Lewiston 2016 Water Quality Report Lewiston Water System. Retrieved from http://www.cityoflewiston.org/filestorage/551/745/829/Water_Qualtiy_Report_2017_for_reporting_year_2016.pdf
x
x
municipal water, water supply, water quality
Clark, G. M., Fosness, R. L., & Wood, M. S. (2013). Sediment Transport in the Lower Snake and Clearwater River Basins, Idaho and Washington, 2008-11 (No. Scientific Investigations Report 2013-5083). U.S. Department of the Interior, U.S. Geological Survey.
x
x
sediment, costs, navigation, Dept of Interior
Columbia River Inter-Tribal Fish Commission (CRITFC). (2014). Clearwater River Coho. Retrieved from http://www.critfc.org/fish-and-watersheds/fish-and-habitat-restoration/restoration-successes/clearwater-river-coho/
x
x
salmon, recovery
Columbia River Inter-Tribal Fish Commission (CRITFC). (2018a). Snake River Fall Chinook Recovery. Retrieved from http://www.critfc.org/fish-and-watersheds/fish-and-habitat-restoration/restoration-successes/snake-river-fall-chinook/
x
x
salmon, recovery
Columbia River Inter-Tribal Fish Commission (CRITFC). (2018b). Pacific Lamprey: A Cultural Resource. Retrieved from http://www.critfc.org/fish-and-watersheds/columbia-river-fish-species/lamprey/
x
x
salmon, recovery
Committee on Water Resources Management, Instream Flows, and Salmon Survival in the Columbia River Basin. (2004). Managing the Columbia River: Instream Flows, Water Withdrawals, and Salmon Survival. The National Academies of Sciences, Engineering, Medicine. Retrieved from https://www.nap.edu/catalog/10962/managing-the-columbia-river-instream-flows-water-withdrawals-and-salmon
x
x salmon, environmental flows, agriculture,
climate change, water supply
Congressional Research Service. (2015). Inland Waterways Trust Fund. Retrieved from https://www.everycrsreport.com/reports/IF10020.html
x x
costs, navigation, barge transport, USACE
Connor, W. P., Mullins, F. L., Tiffan, K. F., Plumb, J. M., Perry, R. W., Erhardt, J. M., Hemingway, R. J., Bickford, B. K., & Rhodes, T. (2017). Research, monitoring, and evaluation of emerging issues and measures to recover the Snake River Fall Chinook Salmon ESU, 1/1/2016-12/31/2016. Bonneville Power Administration.
x
salmon, recovery
Constantz, J., & Hedeff, E. (2006). Influence of groundwater pumping on streamflow restoration following upstream dam removal. Hydrological Processes, 21(21), 2823–2834. https://doi.org/10.1002/hyp.6520
x
dam removal, water supply, groundwater, modelling
Columbia Basin Fish and Wildlife News Bulletin. (2015). Study Looks at Pacific Lamprey That Pass 8 Dams into Snake River Tributaries, Notes Good Habitat. March. Retrieved from http://www.cbbulletin.com/433373.aspx
x
x
salmon, dam passage
ECONorthwest 143
Citation
Cite
d
Gen
eral
LSR
Grid
Ser
vice
s
Irrig
atio
n
Tran
spor
tatio
n
Ecos
yste
m
Mis
c .
Notes
Cross, B. D., Kohfeld, K. E., Bailey, J., & Cooper, A. B. (2015). The Impacts of Wind Speed Trends and 30-Year Variability in Relation to Hydroelectric Reservoir Inflows on Wind Power in the Pacific Northwest. PloS one, 10(8), e0135730.
x
wind generation, forecast, PNW
Crozier, L. (2016). Impacts of Climate Change on Salmon of the Pacific Northwest. National Marine Fisheries Service. Retrieved from https://www.nwfsc.noaa.gov/assets/4/9042_02102017_105951_Crozier.2016-BIOP-Lit-Rev-Salmon-Climate-Effects-2015.pdf
x x salmon, climate change, recovery,
environmental flows
Dauble, D. (2000). Assessment of the Impacts of Development and Operation of the Columbia River Hydroelectric System on Mainstem Riverine Processes and Salmon Habitats, 1998-2000 Final Report, Project No. 199800402. Bonneville Power Administration. (BPA Report DOE/BP-08104-1).
x
x
salmon, hydroelectricity, recovery
Dauble, D. & Geist, D. (1992). Impacts of the Snake River Drawdown Experiment on Fisheries Resources in Little Goose and Lower Granite Reservoirs. U.S. Army Corps of Engineers – Walla Walla District.
x
salmon, recovery, water-levels
Dauble, D. D., & Geist, D. R. (2000). Comparison of mainstem spawning habitats for two populations of fall chinook salmon in the Columbia River basin. Regulated Rivers: Research & Management, 16(4), 345–361. https://doi.org/10.1002/1099-1646(200007/08)16:4<345::AID-RRR577>3.0.CO;2-R
x
salmon, habitats
Dauble, D. D., Hanrahan, T. P., Geist, D. R., & Parsley, M. J. (2003). Impacts of the Columbia River Hydroelectric System on Main-Stem Habitats of Fall Chinook Salmon. North American Journal of Fisheries Management, 23(3), 641–659. https://doi.org/10.1577/M02-013
x
x
salmon, habitats
Dauble, D. D., Johnson, R. L., & Garcia, A. P. (1999). Fall Chinook Salmon Spawning in the Tailraces of Lower Snake River Hydroelectric Projects. Transactions of the American Fisheries Society, 128(4), 672–679. https://doi.org/10.1577/1548-8659(1999)128<0672:FCSSIT>2.0.CO;2
x
salmon, habitats
Dauble, D., & Mueller, R. (2000). Upstream Passage Monitoring: Difficulties in Estimating Survival for Adult Chinook Salmon in the Columbia and Snake Rivers. Fisheries, 25(8), 24–34. https://doi.org/10.1577/1548-8446(2000)025<0024:UPMDIE>2.0.CO;2
x
x
salmon, habitats, dam passage
ECONorthwest 144
Citation
Cite
d
Gen
eral
LSR
Grid
Ser
vice
s
Irrig
atio
n
Tran
spor
tatio
n
Ecos
yste
m
Mis
c .
Notes
Dauble, D., & Watson, D. (1997). Status of Fall Chinook Salmon Populations in the Mid-Columbia River, 1948–1992. North American Journal of Fisheries Management, 17(2), 283–300. https://doi.org/10.1577/1548-8675(1997)017<0283:SOFCSP>2.3.CO;2 Federal Energy Regulatory Commission (FERC). (2007). Final Environmental Impact Statement (FEIS) evaluates relicensing of the 1,167-megawatt Hells Canyon Hydroelectric Project (P-1971-079) in Idaho and Oregon. August 31. Retrieved from https://www.ferc.gov/industries/hydropower/enviro/eis/2007/08-31-07.asp
x
salmon, recovery
Devadoss, S., & Manchu, V. (2007). A comprehensive analysis of farmland value determination: a county-level analysis. Applied Economics, 39(18), 2323-2330.
x
economic impact, agriculture, land-use
Dhungel, R., & Fiedler, F. (2014). Price Elasticity of Water Demand in a Small College Town: An Inclusion of System Dynamics Approach for Water Demand Forecast. Air, Soil and Water Research, 7, ASWR.S15395. https://doi.org/10.4137/ASWR.S15395
x
water supply, municipal supply, groundwater
Dickey, G. E. (1999). Grain transportation after partial removal of the four lower Snake River dams: An affordable and efficient transition plan. American Rivers.
x
dam removal, economic impact, barge transportation, agriculture, wheat
Dijksma, R., Brooks, E. S., & Boll, J. (2011). Groundwater recharge in Pleistocene sediments overlying basalt aquifers in the Palouse Basin, USA: modeling of distributed recharge potential and identification of water pathways. Hydrogeology Journal, 19(2), 489–500. https://doi.org/10.1007/s10040-010-0695-9
x
water supply, groundwater, modelling
Douglas, A. A., Osiensky, J. L., & Keller, C. K. (2007). Carbon-14 dating of ground water in the Palouse Basin of the Columbia river basalts. Journal of Hydrology, 334(3), 502–512. https://doi.org/10.1016/j.jhydrol.2006.10.028
x
water supply, groundwater
Drawdown Regional Economic Workgroup, U.S. Army Corps of Engineers. (1999). Water Supply Analysis. Retrieved from http://www.nww.usace.army.mil/Library/2002-LSR-Study/DREW/
x
x x
EIS, water supply, agriculture, costs, DREW
Duncan, K. & Ormiston, R. (2014). Prevailing Wage Laws: What Do We Know? Institute for Construction Economic Research. Retrieved from: http://iceres.org/wp-content/uploads/2014/10/prevailing-wage-review-duncan-ormiston.pdf
x
x
x wages, employment, construction
ECONorthwest 145
Citation
Cite
d
Gen
eral
LSR
Grid
Ser
vice
s
Irrig
atio
n
Tran
spor
tatio
n
Ecos
yste
m
Mis
c .
Notes
ECONorthwest (2012). Yakima River Basin Integrated Water Resource Management Plan: Four Accounts Analysis of the Integrated Plan. Bureau of Reclamation and Washington Department of Ecology. Retrieved from https://www.usbr.gov/pn/programs/yrbwep/reports/fouraccounts.pdf
x
x
water supply, agriculture, environmental flows, forecast, Bureau of Reclamation
ECONorthwest. (1999). An Economic Strategy for the Lower Snake River. Prepared for Trout Unlimited.
x x
economic impact, dam removal, salmon, employment, EIS critique
Energy Strategies. (2018). Lower Snake River Dams Power Replacement Study: Assessing the technical feasibility and costs of clean energy replacement portfolios. Prepared for NW Energy Coalition. Retrieved from https://nwenergy.org/wp-content/uploads/2018/04/LSRD_Report_Full_Final.pdf
x
x
renewable energy, forecast, costs, modelling, NW Energy Coalition
Envision Freight. (2014). The Transportation of Grain. Retrieved from http://www.envisionfreight.com/value/pdf/Grain.pdf
x
costs, barge transportation, rail transportation, freight, wheat
Federal Columbia River Power System. (2016a). 2016 Comprehensive Evaluation - Section 1. Retrieved from https://www.salmonrecovery.gov/doc/default-source/default-document-library/fcrps2016comprehensiveevaluationsection1.pdf?sfvrsn=0
x
x
salmon, biological opinion, recovery, habitat restoration, costs, USACE
Federal Columbia River Power System. (2016b). 2017-2030 Hydro Asset Strategy. Retrieved from https://www.bpa.gov/Finance/FinancialPublicProcesses/IPR/2016IPRDocuments/2016-IPR-CIR-Hydro-Draft-Asset-Strategy.pdf
x x
costs, power generation, hydropower, USACE
Federal Energy Regulatory Commission (FERC). (2007). Final Environmental Impact Statement (FEIS) evaluates relicensing of the 1,167-megawatt Hells Canyon Hydroelectric Project (P-1971-079) in Idaho and Oregon. August 31. Retrieved from https://www.ferc.gov/industries/hydropower/enviro/eis/2007/08-31-07.asp
x
x
EIS, Hells Canyon, FERC
Federal Information & News Dispatch, Inc. (2010). Change in Discount Rate for Water Resources Planning. Washington, D.C., United States. Retrieved from https://www.gpo.gov/fdsys/pkg/FR-2010-12-29/pdf/2010-32801.pdf
x
x discount rate, costs, water supply, forecast
Federal Information & News Dispatch, Inc. (2015). Change in Discount Rate for Water Resources Planning. Washington, D.C., United States. Retrieved from http://search.proquest.com/docview/1749685824/abstract/D6C2F256F3E4406PQ/1
x
x discount rate, costs, water supply, forecast
ECONorthwest 146
Citation
Cite
d
Gen
eral
LSR
Grid
Ser
vice
s
Irrig
atio
n
Tran
spor
tatio
n
Ecos
yste
m
Mis
c .
Notes
Fish Passage Center. (2015). Requested data summaries and actions regarding sockeye adult fish passage and water temperature issues in the Columbia and Snake rivers. Retrieved from http://www.fpc.org/documents/memos/159-15.pdf
x
x
x
salmon, temperature, recovery, water quality, BPA
Fish Passage Center. (2017). Comparative Survival Study of PIT-tagged Spring/Summer/Fall Chinook, Summer Steelhead, and Sockeye Draft 2017 Annual Report. BPA Contract #19960200. Retrieved from http://www.fpc.org/documents/CSS/CSS_2016_Final.pdf
x
x
salmon, recovery, biological opinion, hatcheries, BPA
Foster Wheeler Environmental Corporation. (1999). Lower Snake River Juvenile Salmon Migration Feasibility Study - Draft Social Analysis. Prepared for U.S. Army Corps of Engineers. Retrieved from http://www.nww.usace.army.mil/portals/28/docs/environmental/drew/social.pdf
x
salmon, economic impact, environmental flow, costs EIS, USACE
Fowler, C. (1999). A look at the impacts of removing dams. The Seattle Daily Journal of Commerce. Retrieved from http://www.djc.com/special/e99/10057229.htm
x
x
dam removal, barge transportation, costs, freight, agriculture
Gemitzi, A., Ajami, H., & Richnow, H. (2017). Developing empirical monthly groundwater recharge equations based on modeling and remote sensing data – Modeling future groundwater recharge to predict potential climate change impacts. Journal of Hydrology, 546, 1–13. https://doi.org/10.1016/j.jhydrol.2017.01.005
x
groundwater, modelling, climate change, environmental flows
Gissurarson, H. H. (2003). Private Property Rights in World Fisheries: Individual Transferable Quotas. Journal of Private Enterprise; Martin, 19(1), 54–72.
x
economic impact, salmon
Grizzetti, B., Lanzanova, D., Liquete, C., Reynaud, A., & Cardoso, A. C. (2016). Assessing water ecosystem services for water resource management. Environmental Science & Policy, 61, 194-203.
x
x
water supply, environmental flows, economic impact
Hanemann, M., Loomis, J., & Kanninen, B. (1991). Statistical efficiency of double-bounded dichotomous choice contingent valuation. American Journal of Agricultural Economics, 73(4), 1255-1263.
x
contingent valuation
Harrison, J. (2018). New Fish, Old Story. Northwest Power and Conservation Council. March 15. Retrieved from https://www.nwcouncil.org/news/new-fish-old-story
salmon, recovery
Hatten J. R., Batt T. R., Skalicky J. J., Engle R., Barton G. J., Fosness R. L., & Warren J. (2016). Effects of Dam Removal on Tule Fall Chinook salmon Spawning Habitat in the White Salmon River, Washington. River Research and Applications, 32(7), 1481–1492. https://doi.org/10.1002/rra.2982
x x dam removal, salmon, habitat restoration,
recovery
ECONorthwest 147
Citation
Cite
d
Gen
eral
LSR
Grid
Ser
vice
s
Irrig
atio
n
Tran
spor
tatio
n
Ecos
yste
m
Mis
c .
Notes
Henrickson, K. E. (2011). Spatial competition and geographic grain transportation demand on the Mississippi and Illinois rivers. Applied Economics, 43(10), 1257–1269. https://doi.org/10.1080/00036840802600392
x
barge transportation, costs, freight, wheat, modelling
Hesse, J. (2013). Lower Snake River Compensation Plan 2013 Snake River Fall Chinook Salmon Program Review Summary and Future Direction. Retrieved from https://www.fws.gov/lsnakecomplan/Meetings/2013%20Fall%20Chinook%20Symposium/Aug%207%20Reports/Hesse%202013%20Summary%20and%20Future%20Direction.pdf
x
x x salmon, hatcheries, recovery, FWS
Ho, M., Lall, U., Allaire, M., Devineni, N., Kwon, H. H., Pal, I., Raff, D., & Wegner, D. (2017). The future role of dams in the United States of America. Water Resources Research, 53(2), 982-998.
x dam removal
Huppert, D. D. (1999). Snake River salmon recovery: quantifying the costs. Contemporary Economic Policy, 17(4), 476-491.
x
salmon, recovery, costs, non-use valuation
Hurlbutt, B (2017). Columbia Riverkeeper v Scott Pruitt: Complaint. U.S. District Court Western District of Washington. Case 2:17-cv-00289.
x x
x
water quality, biological opinion, court case, EPA
Ibanez, E., Magee, T., Clement, M., Brinkman, G., Milligan, M., & Zagona, E. (2014). Enhancing hydropower modeling in variable generation integration studies. Energy, 74, 518–528. https://doi.org/10.1016/j.energy.2014.07.017
x
hydropower, renewable generation, load balancing
Idaho Department of Fish & Game. (2005a). Sockeye Salmon (Snake River). March. Retrieved from https://idfg.idaho.gov/conservation/sockeye
x
salmon, recovery
Idaho Department of Fish & Game. (2018). What is a steelhead?. Retrieved from https://idfg.idaho.gov/fish/steelhead/profile
x
salmon, recovery
Idaho Department of Fish & Game. (2005b). Chinook Salmon (Snake River spring/summer–run). Retrieved from https://idfg.idaho.gov/ifwis/cwcs/pdf/Chinook%20Salmon%20(Snake%20River%20spring_summer%20run).pdf
x
x
fish recovery, government management plan
Idaho Department of Fish & Wildlife. (2005c). White Sturgeon (Snake River system). August. Retrieved from https://idfg.idaho.gov/ifwis/cwcs/pdf/White%20Sturgeon%20%28Snake%20River%20System%29.pdf
x
x
fish recovery, government management plan
Idaho Power Company. (2015). Snake River White Sturgeon Conservation Plan: 2015–2020 Planning and Implementation. December.
x
fish recovery, government management plan
Independent Economic Analysis Board. (2000). Technical Review of Lower Snake River Juvenile Salmon Migration Feasibility Report/Environmental Impact Statement Appendix I – Economics. Northwest Power & Conservation Council.
x x
non-use valuation, salmon, recovery, costs, EIS critique, NPCC
ECONorthwest 148
Citation
Cite
d
Gen
eral
LSR
Grid
Ser
vice
s
Irrig
atio
n
Tran
spor
tatio
n
Ecos
yste
m
Mis
c .
Notes
Independent Economic Analysis Board. (2007). Review of the SOS Revenue Stream Report. Northwest Power & Conservation Council. Document IEAB 2007-1.
x x
dam removal, costs, EIS critique, NPCC
Independent Scientific Advisory Board. (2007). Climate Change Impacts on Columbia River Basin Fish and Wildlife. Northwest Power & Conservation Council. Document ISAB 2007-2.
x x
x climate change, salmon, water quality, NPCC
Independent Scientific Advisory Board. (2016). Predation Metrics Report. Northwest Power & Conservation Council. Document ISAB 2016-1.
x
x x salmon, predation, costs, NPCC
Independent Scientific Review Panel. (2014). Summary of ISRP Reviews of Steelhead and Spring and Fall Chinook Salmon Programs of the Lower Snake River Compensation Plan. Northwest Power & Conservation Council. Document ISAB 2014-6.
x x salmon, habitat restoration, costs, EIS critique,
NPCC
Johnston, R. J., Boyle, K. J., Adamowicz, W., Bennett, J., Brouwer, R., Cameron, T. A., ... & Tourangeau, R. (2017). Contemporary guidance for stated preference studies. Journal of the Association of Environmental and Resource Economists, 4(2), 319-405.
x
x
stated preference survey, natural resource valuation, non-use valuation
Jones, A. (2015a). Lower Snake River Dam Alternative Power Costs. Rocky Mountain Econometrics. Retrieved from https://www.wildsalmon.org/projects/restoring-the-lower-snake-river/recent-economic-analyses-of-the-lower-snake-river-dams.html
x
x
economic impacts, power generation, costs, EIS critique
Jones, A. (2015b). Lower Snake River Dam Navigation Study. Rocky Mountain Econometrics. Retrieved from https://www.wildsalmon.org/projects/restoring-the-lower-snake-river/recent-economic-analyses-of-the-lower-snake-river-dams.html
x
x
costs, navigation, barge transport, rail transport, EIS critique
Kao, S.-C., Sale, M. J., Ashfaq, M., Uria Martinez, R., Kaiser, D. P., Wei, Y., & Diffenbaugh, N. S. (2015). Projecting changes in annual hydropower generation using regional runoff data: An assessment of the United States federal hydropower plants. Energy, 80, 239–250. https://doi.org/10.1016/j.energy.2014.11.066
x
hydropower, renewable energy,, PNW, forecast, climate change
Kincic, S., & Papic, M. (2011). Impact of large wind penetration on power system operation. IEEE Transactions on Sustainable Energy. https://doi.org/10.1109/TSTE.2011.2163952
x
renewable energy, forecast, costs, modelling, wind generation
Kintner-Meyer, M., Balducci, P., Colella, W., Elizondo, M., Jin, C., Nguyen, T., Viswanathan, V., Zhang, Y. (2012). National Assessment of Energy Storage for Grid Balancing and Arbitrage: Phase 1, WECC. Prepared for U.S. Department of Energy. Retrieved from https://energyenvironment.pnnl.gov/pdf/PNNL-21388_National_Assessment_Storage_Phase_1_final.pdf
x
electricity storage, renewable energy, Dept of Energy
ECONorthwest 149
Citation
Cite
d
Gen
eral
LSR
Grid
Ser
vice
s
Irrig
atio
n
Tran
spor
tatio
n
Ecos
yste
m
Mis
c .
Notes
Kintner-Meyer, M., Balducci, P., Jin, C., Nguyen, T., Elizondo, M., Viswanahan, V., Guo, X., Tuffner, F. (2010). Energy Storage for Power Systems Applications: A Regional Assessment for the Northwest Power Pool (NWPP). Prepared for U.S. Department of Energy. Retrieved from https://www.pnnl.gov/main/publications/external/technical_reports/PNNL-19300.pdf
x
electricity storage, PNW, renewable energy, Dept of Energy
Konikow, L.F. (2013). Groundwater depletion in the United States (1900−2008). U.S. Geological Survey Scientific Investigations Report. Retrieved from http://pubs.usgs.gov/sir/2013/5079
x
x x
water supply, groundwater, agriculture, USGS
Kruse, S., Scholz, A. (2006). Preliminary Economic Assessment of Dam Removal: The Klamath River. Ecotrust. Retrieved from http://archive.ecotrust.org/workingpapers/WPS2_Klamath_Dam_Assess.pdf
x
x dam removal, economic impact
Kuby, M. J., Fagan, W. F., ReVelle, C. S., & Graf, W. L. (2005). A multiobjective optimization model for dam removal: an example trading off salmon passage with hydropower and water storage in the Willamette basin. Advances in Water Resources, 28(8), 845–855. https://doi.org/10.1016/j.advwatres.2004.12.015
x
x
water supply, salmon, renewable energy
Layton, D., Brown, G., & Plummer, M. (1999). Valuing multiple programs to improve fish populations. Dept. of Environmental Science and Policy, University of California, Davis, CA.
x
stated preference survey, valuation, natural resource valuation, non-use valuation
Lee, N. S., & Casavant, K. (1998). Impacts of a Snake River drawdown on energy consumption and environmental emissions in transporting eastern Washington wheat and barley. Washington State University.
x
x
freight, GHG emissions, carbon policy, wheat
Lee, S. Y., Hamlet, A. F., & Grossman, E. E. (2016). Impacts of climate change on regulated streamflow, hydrologic extremes, hydropower production, and sediment discharge in the Skagit river basin. Northwest Science, 90(1), 23-43.
x forecast, climate change, environmental flow,
sediment, hydropower
Lewis, L. Y., Bohlen, C., & Wilson, S. (2008). Dams, dam removal, and river restoration: A hedonic property value analysis. Contemporary Economic Policy, 26(2), 175-186.
x
x
dam removal, economic impact, property values
Ligon, F. K., Dietrich, W. E., & Trush, W. J. (1995). Downstream Ecological Effects of Dams. BioScience, 45(3), 183–192. https://doi.org/10.2307/1312557
x
sediment, water supply, environmental flow, dam removal

ECONorthwest 150
Citation
Cite
d
Gen
eral
LSR
Grid
Ser
vice
s
Irrig
atio
n
Tran
spor
tatio
n
Ecos
yste
m
Mis
c .
Notes
Littell, J.S., Mauger, G.S., Salathé, E.P., Hamlet, A.F., Lee, S-Y., Stumbaugh, M., Elsner, M.M., Norheim, R.A., Lutz, E.R., & Mantua, N.J. (2014). Uncertainty and Extreme Events in Future Climate and Hydrologic Projections for the Pacific Northwest: Providing a Basis for Vulnerability and Core/Corridor Assessments. Final report for Department of the Interior Pacific Northwest Climate Science Center. Climate Impacts Group, University of Washington, Seattle, WA.
x
x
x climate change, water supply, PNW, forecast, Dept of Interior
Loomis, J. (1999). Recreation and passive use values from removing the dams on the Lower Snake River to increase salmon. Prepared for U.S. Army Corps of Engineers.
x x
x
natural resource valuation, economic impact, recreation, EIS, USACE
Loomis, J. B. (1996). Measuring the Economic Benefits of Removing Dams and Restoring the Elwha River: Results of a Contingent Valuation Survey. Water Resources Research, 32(2), 441–447. https://doi.org/10.1029/95WR03243
x
x
dam removal, economic impact, costs, salmon
Loomis, J. B. (2002). Quantifying recreation use values from removing dams and restoring free-flowing rivers: A contingent behavior travel cost demand model for the Lower Snake River. Water Resources Research, 38(6), 2–1. https://doi.org/10.1029/2000WR000136
x
x
recreation, modelling, economic impact
Loomis, J., Sorg, C., & Donnelly, D. (1986). Economic Losses to Recreational Fisheries Due to Small-Head Hydro-power Development: A Case Study of the Hensy ’s Fork in Idaho. Journal of Environmental Management JEVMA Vol. 22, No. 1, p 85-94. Retrieved from http://search.proquest.com/docview/19017829/6F7D739A603D4C09PQ/16
x
recreation, economic impact, costs
Loomis, John, Kent, P., Strange, L., Fausch, K., & Covich, A. (2000). Measuring the total economic value of restoring ecosystem services in an impaired river basin: results from a contingent valuation survey. Ecological Economics, 33(1), 103–117. https://doi.org/10.1016/S0921-8009(99)00131-7
x
restoration, costs, economic impact
Lund Consulting, Inc. (1999). Lower Snake River Drawdown Study: Summary of Transportation Impacts. Prepared for: Washington State Legislative Transportation Committee. Retrieved from: http://leg.wa.gov/JTC/Documents/Studies/1999LowerSnakeRiverDrawdownStudySummary.pdf
x
x
shipping, barge transport, wheat
ECONorthwest 151
Citation
Cite
d
Gen
eral
LSR
Grid
Ser
vice
s
Irrig
atio
n
Tran
spor
tatio
n
Ecos
yste
m
Mis
c .
Notes
Marshall, S. (2010). A Brief History of the Lower Snake River Compensation Plan Hatchery Program for Spring & Summer Chinook Salmon. U.S. Fish & Wildlife Service. Retrieved from https://www.fws.gov/lsnakecomplan/Meetings/2010%20Spring%20Chinook%20Symposium/SLM%202010%20Spring%20Chinook%20Symposium%20paper%20-Brief%20History%20of%20the%20LSRCP%20-Final%2011-24-10.pdf
x
salmon, hatcheries, costs, recovery, FWS
Marshall, S. (2011). A Brief History of the Lower Snake River Compensation Plan Hatchery Program for Steelhead. U.S. Fish & Wildlife Service. Retrieved from https://www.fws.gov/lsnakecomplan/Meetings/2012%20Steelhead%20Program%20Review/Day%201%20Wed%20Jun%2020%20Ppts/Background%20of%20the%20LSRCP%20Steelhead%20Program.pdf
x
x
salmon, hatcheries, costs, recovery, FWS
McCoy, A. L., Holmes, S. R., & Boisjolie, B. A. (2018). Flow Restoration in the Columbia River Basin: An Evaluation of a Flow Restoration Accounting Framework. Environmental Management, 61(3), 506–519. https://doi.org/10.1007/s00267-017-0926-0
x
x
water rights, water supply, environmental flows
McKean, J. R., Johnson, D., & Taylor, R. G. (2005). Willingness to Pay for Non-Angler Recreation at the Lower Snake River Reservoirs. Journal of Leisure Research, 37(2), 178–194.
x
x
recreation, modelling, economic impact
McKean, J. R., Johnson, D., & Taylor, R. G. (2012). Three approaches to time valuation in recreation demand: A study of the Snake River recreation area in eastern Washington. Journal of Environmental Management, 112, 321–329. http://dx.doi.org.ezproxy.lib.vt.edu/10.1016/j.jenvman.2012.08.017
x
x
recreation, modelling, economic impact
McKern, J. (2016). The Case against Breaching the Four Lower Snake River Dams to Recover Wild Snake River Salmon. Fish Passage Solutions, LLC. Retrieved from http://portoflewiston.com/wp-content/uploads/2016/05/John-McKern-Case-Against-Snake-River-Dams-Breaching.pdf
x x dam removal, habitat restoration, salmon
McMichael, G. A., Skalski, J. R., & Deters, K. A. (2011). Survival of juvenile Chinook Salmon during barge transport. North American Journal of Fisheries Management, 31(6), 1187-1196.
x
x x salmon, hatcheries, recovery
Meixner, T., Manning, A. H., Stonestrom, D. A., Allen, D. M., Ajami, H., Blasch, K. W., ... & Flint, A. L. (2016). Implications of projected climate change for groundwater recharge in the western United States. Journal of Hydrology, 534, 124-138.
x
x water supply, groundwater, PNW, land-use,
climate change
ECONorthwest 152
Citation
Cite
d
Gen
eral
LSR
Grid
Ser
vice
s
Irrig
atio
n
Tran
spor
tatio
n
Ecos
yste
m
Mis
c .
Notes
Mittal, A. (2006). Observations on Planning and Project Management Processes for the Civil Works Program. U.S. Government Accountability Office. Testimony Before the Subcommittee on Energy and Resources, Committee on Government Reform, House of Representatives. Retrieved from https://www.gao.gov/assets/120/113080.pdf
x x
costs, salmon, USACE, GAO
Mojica, J., Cousins, K., & Briceno, T. (2016). National Economic Analysis of the Four Lower Snake River Dams: A Review of the 2002 Lower Snake Feasibility Report/Environmental Impact Statement Economic Appendix (I). Earth Economics, Tacoma, WA. Retrieved from: http://www.eartheconomics.org/all-publications/2016/3/24/national-and-regional-economic-analysis-of-the-four-lower-snake-river-dams
X X
dam removal, economic impact, costs, salmon, EIS critique
Mojica, J., Cousins, K., & Briceno, T. (2016). Regional Economic Analysis of the Four Lower Snake River Dams: A Review of the 2002 Lower Snake Feasibility Report/Environmental Impact Statement Economic Appendix (I). Earth Economics, Tacoma, WA. Retrieved from: http://www.eartheconomics.org/all-publications/2016/3/24/national-and-regional-economic-analysis-of-the-four-lower-snake-river-dams
X X
dam removal, economic impact, costs, salmon, EIS critique
Mote, P., Snover, A. K., Capalbo, S., Eigenbrode, S.D., Glick D., Littell, J., Raymondi, R., & Reeder, S. (2014). Chapter 21: Northwest. Climate Change Impacts in the United States: The Third National Climate Assessment. U.S. Global Change Research Program, 487-513. doi:10.7930/J04Q7RWX.
X
X X
climate change, water supply, PNW, forecast, Dept of Interior
Muir, W. D., Smith, S. G., Williams, J. G., & Sandford, B. P. (2001). Survival of juvenile salmonids passing through bypass systems, turbines, and spillways with and without flow deflectors at Snake River dams. North American Journal of Fisheries Management, 21(1), 135-146.
x
x
salmon, recovery
Naik, P. K., & Jay, D. A. (2011). Distinguishing human and climate influences on the Columbia River: Changes in mean flow and sediment transport. Journal of Hydrology, 404(3–4), 259–277. https://doi.org/10.1016/j.jhydrol.2011.04.035
x
x
climate change, water supply, sediment, environmental flow
National Academies of Sciences, Engineering, and Medicine. (2015). Chapter 3: Federal Role in the Inland Waterways System. In Funding and Managing the U.S. Inland Waterways System: What Policy Makers Need to Know. Washington, DC: The National Academies Press. https://doi.org/10.17226/21763.
x x
x
USACE, costs, navigation, barge transport
ECONorthwest 153
Citation
Cite
d
Gen
eral
LSR
Grid
Ser
vice
s
Irrig
atio
n
Tran
spor
tatio
n
Ecos
yste
m
Mis
c .
Notes
National Agricultural Statistics Service. (2018). Prices Paid and Received: Crop Farm Index by Month, US. Retrieved from https://www.nass.usda.gov/Charts_and_Maps/Agricultural_Prices/cropfarm.php.
x agricultural prices, national data
National Oceanic and Atmospheric Administration, National Marine Fisheries Service. (2014). Endangered Species Act Section 7(a)(2) Supplemental Biological Opinion: Consultation on Remand for Operation of the Federal Columbia River Power System. Retrieved from http://www.westcoast.fisheries.noaa.gov/fish_passage/fcrps_opinion/federal_columbia_river_power_system.html
x x
x
biological opinion, salmon, dam operations, NOAA
National Oceanic and Atmospheric Administration, National Marine Fisheries Service. (2014b). Snake River Harvest Module. Retrieved from https://www.westcoast.fisheries.noaa.gov/publications/recovery_planning/salmon_steelhead/domains/interior_columbia/snake/harvest_module_062514.pdf
x
x
salmon, recovery, ESA, NOAA
National Oceanic and Atmospheric Administration, National Marine Fisheries Service. (2015a). Proposed ESA Recovery Plan for Snake River Fall Chinook Salmon (Oncorhynchus tshawytscha). Retrieved from http://www.westcoast.fisheries.noaa.gov/publications/recovery_planning/salmon_steelhead/domains/interior_columbia/snake/proposed_snake_river_fall_chinook_recovery_plan.pdf
x
salmon, recovery, ESA, NOAA
National Oceanic and Atmospheric Administration, National Marine Fisheries Service. (2015b). Snake River Sockeye Salmon Recovery Plan Summary. Retrieved from http://www.westcoast.fisheries.noaa.gov/protected_species/salmon_steelhead/recovery_planning_and_implementation/snake_river/05_snake_river_sockeye_salmon_recovery_plan.html
x
salmon, recovery, ESA. NOAA
National Oceanic and Atmospheric Administration, National Marine Fisheries Service. (2016a). 2016 5-Year Review: Summary and Evaluation of Snake River Sockeye, Snake River Spring-Summer Chinook, Snake River Fall-Run Chinook, Snake River Basin Steelhead. Retrieved from https://www.fisheries.noaa.gov/resource/document/2016-5-year-review-summary-evaluation-snake-river-sockeye-snake-river-spring
X
salmon, recovery, costs, NOAA
National Oceanic and Atmospheric Administration, National Marine Fisheries Service. (2016b). Southern Resident Killer Whales and Snake River Dams. Retrieved from http://www.nww.usace.army.mil/Portals/28/docs/V2N/3.30.2016_srkw_factsheet.pdf?ver=2016-08-22-121418-493
x
x
salmon, ESA, killer whales, NOAA
ECONorthwest 154
Citation
Cite
d
Gen
eral
LSR
Grid
Ser
vice
s
Irrig
atio
n
Tran
spor
tatio
n
Ecos
yste
m
Mis
c .
Notes
National Oceanic and Atmospheric Administration, National Marine Fisheries Service. (2016c). Frequently Asked Questions on Snake River fall-run Chinook salmon delisting petition. Retrieved from https://www.westcoast.fisheries.noaa.gov/publications/protected_species/salmon_steelhead/5.24.2016_FAQ_delisting_petition_decision_sr_fall_chin.pdf
x
x
salmon, recovery, ESA, NOAA
National Oceanic and Atmospheric Administration, National Marine Fisheries Service. (2017). ESA Recovery Plan for Snake River Spring/Summer Chinook Salmon (Oncorhynchus tshawytscha) & Snake River Basin Steelhead (Oncorhynchus mykiss). Retrieved from http://www.westcoast.fisheries.noaa.gov/publications/recovery_planning/salmon_steelhead/domains/interior_columbia/snake/Final%20Snake%20Recovery%20Plan%20Docs/final_snake_river_spring-summer_chinook_salmon_and_snake_river_basin_steelhead_recovery_plan.pdf
x
x
salmon, recovery, ESA, NOAA
National Oceanic and Atmospheric Administration, National Marine Fisheries Service. (2017b). Survival Estimates for the Passage of Spring-Migrating Juvenile Salmonids through Snake and Columbia River Dams and Reservoirs, 2017. Prepared for Bonneville Power Administration. Retrieved from https://www.nwfsc.noaa.gov/assets/26/9359_02262018_135356_Widener.et.al.2018-Spring-Survival-2017.pdf
x
x
salmon, recovery, ESA, NOAA
National Wildlife Federation v. National Marine Fisheries Service. (2016). Opinion & Order. Case No. 3:01-cv-00640-S. U.S. District Court for the District of Oregon. Michael H. Simon, District Judge.
x x
biological opinion, salmon, dam operations, water quality
National Wildlife Federation v. National Marine Fisheries Service. (2017). Opinion & Order. Case No. 3:01-cv-00640-S. U.S. District Court for the District of Oregon. Michael H. Simon, District Judge.
x x
biological opinion, salmon, dam operations, water quality
National Wildlife Federation v. National Marine Fisheries Service. (2018). Order for Increased Spill Operations and 2018 Pit Monitoring. Case No. 3:01-cv-00640-S. U.S. District Court for the District of Oregon. Michael H. Simon, District Judge.
x x
biological opinion, salmon, dam operations, water quality
Natural Resource Damage Assessment, Inc. & Industrial Economics, Inc. (1994). Prospective Interim Lost Use Value due to DDT and PCB Contamination in the Southern California Bight: Volume II (Appendices). Prepared for NOAA. Contract No. 50-DGNC-1-00007. Retrieved from http://econweb.ucsd.edu/~rcarson/papers/SCalDDT.pdf
x
natural resource valuation, lost-use, NOAA
ECONorthwest 155
Citation
Cite
d
Gen
eral
LSR
Grid
Ser
vice
s
Irrig
atio
n
Tran
spor
tatio
n
Ecos
yste
m
Mis
c .
Notes
Newbold, S. C., & Massey, D. M. (2010). Recreation demand estimation and valuation in spatially connected systems. Resource and Energy Economics, 32(2), 222–240. https://doi.org/10.1016/j.reseneeco.2009.11.014
x
recreation, modelling, economic impact
Northwest Energy Coalition. (2016). A Fact Sheet. Retrieved from http://nwenergy.org/wp-content/uploads/2016/12/LSR.dam_.factsheet.website.pdf
x x
BPA, power generation, costs, NW Energy Coalition
Northwest Fisheries Science Center. (2015). Status review update for Pacific salmon and steelhead listed under the Endangered Species Act: Pacific Northwest. Retrieved from https://www.nwfsc.noaa.gov/assets/11/8623_03072016_124156_Ford-NWSalmonBioStatusReviewUpdate-Dec%2021-2015%20v2.pdf
x
x
salmon, ESA, recovery
Northwest Fisheries Science Center. (2018). Redfish Lake sockeye salmon captive broodstock. Retrieved from https://www.nwfsc.noaa.gov/research/divisions/efs/hatchery/salmon_captive/redfish.cfm
x
x
salmon, recovery, hatcheries
Northwest Power and Conservation Council. (2016). Seventh Northwest Conservation and Electric Power Plan. Document 2016-02. Retrieved from https://www.nwcouncil.org/energy/powerplan/7/plan/
x
x
costs, power generation, forecast, renewable energy, load balancing, NPCC
Northwest Power and Conservation Council. (2017). 2016 Columbia River Basin Fish & Wildlife Program Costs Report. Document 2017-02. Retrieved from https://www.nwcouncil.org/reports/financial-reports/2017-2/
x
x
salmon, habitat restoration, recovery, BPA, USACE, costs, LSCP, NPCC
Northwest Power and Conservation Council. (2018). Predation. Retrieved from https://www.nwcouncil.org/fw/issues/predation
x
x
salmon, predation
Null, S. E., Medellín-Azuara, J., Escriva-Bou, A., Lent, M., & Lund, J. R. (2014). Optimizing the dammed: Water supply losses and fish habitat gains from dam removal in California. Journal of Environmental Management, 136, 121–131. https://doi.org/10.1016/j.jenvman.2014.01.024
x
x
water supply, environmental flow, salmon, modelling, habitat restoration
O’Donnell, B., Goodchild, A., Cooper, J., & Ozawa, T. (2009). The relative contribution of transportation to supply chain greenhouse gas emissions: A case study of American wheat. Transport and Environment, 14(7), 487–492. https://doi.org/10.1016/j.trd.2009.05.003
x
x
climate change, GHG emissions, freight, wheat
Oregon Department of Fish & Wildlife. (2016). Oregon Administrative Rules. Division 412 Fish Passage. December 29. Retrieved from https://www.dfw.state.or.us/OARs/412.pdf
x
x
fish passage, law, Oregon
ECONorthwest 156
Citation
Cite
d
Gen
eral
LSR
Grid
Ser
vice
s
Irrig
atio
n
Tran
spor
tatio
n
Ecos
yste
m
Mis
c .
Notes
Pacific Gas and Electric Company. (2015). Greenhouse Gas Emissions Factors: Guidance for PG&E Customers. November. Retrieved from: https://www.pge.com/includes/docs/pdfs/shared/environment/calculator/pge_ghg_emission_factor_info_sheet.pdf
x
x
GHG emissions, price, cost of carbon
Pacific Northwest Waterways Association. (2015). Inland Waterways Trust Fund. Retrieved from http://www.pnwa.net/factsheets/IWTF.pdf
x x
USACE, costs, barge transport, navigation
Pant, R., Barker, K., & Landers, T. L. (2015). Dynamic impacts of commodity flow disruptions in inland waterway networks. Computers & Industrial Engineering, 89, 137-149.
x
barge transport, cost, modelling
Parsoon, A.A., & Hamidreza, K. (2013). Economical – environmental evaluation of natural gas and renewable energy systems. International Journal of Energy Research, 37(12), 1550–1561. https://doi.org/10.1002/er.2946
x
x
renewable energy, costs
Perkins, W. A., & Richmond, M. C. (2001). Long-term, one-dimensional simulation of Lower Snake River temperatures for current and unimpounded conditions. Report No. PNNL-13443, Pacific Northwest National Laboratory.
x
x
TMDL, ecology
Pernin, C. G., Bernstein, M. A., Mejia, A., Shih, H., & Rueter, F. (2002). Generating Electric Power in the Pacific Northwest. Implications of Alternative Technologies (No. RAND/MR-1604-PCT). Rand Corp, Santa Monica, CA.
renewable energy, dam removal, forecast
Piersol, M. W., & Sprenke, K. F. (2015). A Columbia River Basalt Group Aquifer in Sustained Drought: Insight from Geophysical Methods. Resources; Basel, 4(3), 577–596. http://dx.doi.org.ezproxy.lib.vt.edu/10.3390/resources4030577
x
water supply, agriculture, groundwater, modelling
Plaven, G. (2017). Oregon Water Coalition Addresses Shrinking Supply at Annual Meeting. May 25. East Oregonian. Retrieved from: http://www.eastoregonian.com/eo/local-news/20170525/oregon-water-coalition-addresses-shrinking-supply-at-annual-meeting
x
x
water supply
Provencher, B., Sarakinos, H., & Meyer, T. (2008). Does small dam removal affect local property values? An empirical analysis. Contemporary Economic Policy, 26(2), 187-197.
x
x
dam removal, property values
Rietmann, E. (2015). Alternative Solutions to Power Oversupply in the Pacific Northwest. Environmental Law, 207-234.
x
wind generation, BPA, load balancing, hydropower, cost
Robbins, J. L., & Lewis, L. Y. (2008). Demolish it and They Will Come: Estimating the Economic Impacts of Restoring a Recreational Fishery. Journal of the American Water Resources Association, 44(6), 1488–1499. https://doi.org/10.1111/j.1752-1688.2008.00253.x
x
dam removal, recreation, economic impact
ECONorthwest 157
Citation
Cite
d
Gen
eral
LSR
Grid
Ser
vice
s
Irrig
atio
n
Tran
spor
tatio
n
Ecos
yste
m
Mis
c .
Notes
RTI International. (2012). Klamath River Basin Restoration Nonuse Value Survey. Prepared for Klamath River Dams Project Office, U.S. Bureau of Reclamation. Retrieved from https://klamathrestoration.gov/sites/klamathrestoration.gov/files/DDDDD.Printable.Klamath%20Nonuse%20Survey%20Final%20Report%202012%5B1%5D.pdf
x
non-use valuation, dam removal, Bureau of Reclamation
Rub, A.M., and Gilbreath, L.G. (2010). Survival of Adult Spring Chinook from the Columbia River Estuary to Bonneville Dam. Northwest Fisheries Science Center. https://www.nwfsc.noaa.gov/research/divisions/fe/estuarine/adult-est-survival.cfm
x
x
salmon, recovery
Rupp, D. E., Abatzoglou, J. T., Hegewisch, K. C., & Mote, P. W. (2013). Evaluation of CMIP5 20th century climate simulations for the Pacific Northwest USA. Journal of Geophysical Research. Atmospheres; Washington, 118(19), 10,884-10,906. http://dx.doi.org.ezproxy.lib.vt.edu/10.1002/jgrd.50843
x climate change, forecast, PNW
Ryan, B. J., Duda, J. J., Craig, L. S., Greene S. L., Torgersen C. E., Collins M. J., & Vittum K. (2016). Status and trends of dam removal research in the United States. Wiley Interdisciplinary Reviews: Water, 4(2), e1164. https://doi.org/10.1002/wat2.1164
x dam removal
Sage, J., & Casavant, K. (2016). Palouse Regional Freight Study: 2016. Retrieved from http://www.palousertpo.org/index_htm_files/PRTPO%20FINAL_3_8_16.pdf
x
barge transportation, costs, freight, wheat
Sage, J., Casavant, K., & Eustice, J.B. (2015). Washington State Short Line Rail Inventory and Needs Assessment. Retrieved from http://www.wsdot.wa.gov/publications/fulltext/LegReports/ShortlineRailStudyFinalReport.pdf
x
x
rail transport, costs, freight, wheat
Sanders, L. D., Walsh, R. G., & Loomis, J. B. (2010). Toward empirical estimation of the total value of protecting rivers. Water Resources Research, 26(7), 1345–1357. https://doi.org/10.1029/WR026i007p01345
x
x
recreation, restoration, passive use
Save Our Wild Salmon (SOS). (2006). Revenue Stream: An Economic Analysis of the Costs and Benefits of Removing the Four Dams on the Lower Snake River.
x x
dam removal, costs, salmon, EIS critique
Save Our Wild Salmon (SOS) and FM3 Research. (2018). Washington Voter Views of Salmon and Dams on the Lower Snake River. .
x x dam removal, costs, salmon, survey
ECONorthwest 158
Citation
Cite
d
Gen
eral
LSR
Grid
Ser
vice
s
Irrig
atio
n
Tran
spor
tatio
n
Ecos
yste
m
Mis
c .
Notes
Scherberg, J., Baker, T., Selker, J. S., & Henry, R. (2014). Design of Managed Aquifer Recharge for Agricultural and Ecological Water Supply Assessed Through Numerical Modeling. Water Resources Management, 28(14), 4971–4984. https://doi.org/10.1007/s11269-014-0780-2
x
water supply, agriculture, environmental flows, modelling, groundwater
Schultz, B. (2002). Role of dams in irrigation, drainage and flood control. International Journal of water resources development, 18(1), 147-162.
x
water supply, flood control
Schwartz, M.S., Silva, A., Elasmar, N., Vesh, M., & Kenny, C. (2017). Action Effectiveness Monitoring for the Lower Columbia River Estuary Habitat Restoration Program. October 2015–September 2016, Project Number: 2003-007-00.
x x salmon, habitat restoration, Columbia River,
recovery
Scott, M.J., L.W. Vail, J. Jaksch, C.O. Stöckle, A. Kemanian. (2004). Water exchanges: Tools to beat El Niño climate variability in irrigated agriculture. JAWRA Journal of the American Water Resources Association 40 (1), 15-31.
x agriculture, climate, water supply
Scott, T., Kohr, J., Granger, R., Marshall, A., Gombert, D., Winkowski, M., Bosman Clark, E., & Vigg, S. (2016). Columbia River Instream Atlas (CRIA), FY2016. In Columbia River Basin 2016 Water Supply & Demand Forecast.
x
agriculture, land-use, water supply, environmental flows, salmon
Shultz, M., & Johnson, M. (2015). Computer modeling shows that Lower Snake River dams caused dangerously hot water for salmon in 2015. Columbia Riverkeeper White Paper. Retrieved from https://www.columbiariverkeeper.org/news/2017/8/computer-modeling-shows-lower-snake-river-dams-caused-dangerously-hot-water-salmon-2015
x
x
salmon, modelling, environmental flows, dam removal, water quality
Shutters, M. K., & Holecek, D. E. (2015). Snake River Juvenile Salmon Transportation Program: An Overview of a Hydropower Mitigation Effort. U.S. Army Corps of Engineers. Presentation. Retrieved from http://www.cbr.washington.edu/sites/default/files/AFS2015/AFS2015_Tuesday_A107_1400_Marvin_Shutters.pdf
x
salmon, hatcheries, hydropower
Silva, C. G. (2017). The impact of dam removal on the construction, and the leisure and hospitality sectors in the United States: An event-study approach using county level data. New Mexico State University.
x
dam removal, economic impact, recreation
Simmons, S., Casavant, K., & Sage, J. (2013). Real-Time Assessment of the Columbia-Snake River Extended Lock Outage: Process and Impacts. Transportation Research Record: Journal of the Transportation Research Board, (2330), 95-102.
x
x
barge transport, cost
ECONorthwest 159
Citation
Cite
d
Gen
eral
LSR
Grid
Ser
vice
s
Irrig
atio
n
Tran
spor
tatio
n
Ecos
yste
m
Mis
c .
Notes
Slaughter, R. A., Hamlet, A. F., Huppert, D., Hamilton, J., & Mote, P. W. (2010). Mandates vs markets: addressing over-allocation of Pacific Northwest River Basins. Water Policy; Oxford, 12(3), 305–317. http://dx.doi.org.ezproxy.lib.vt.edu/10.2166/wp.2009.152
x
water supply, water rights, PNW
Snake River Waterkeeper. (2017). Lower Snake Temperature TMDL Lawsuit Filed Against New EPA Administrator Scott Pruitt. Retrieved from https://www.snakeriverwaterkeeper.org/lower-snake-temperature-tmdl-lawsuit-filed-against-new-epa-administrator-scott-pruitt/
x
x
salmon, lawsuit, TMDL
Stöckle, C. O., Nelson, R. L., Higgins, S., Brunner, J., Grove, G., Boydston, R., Whiting, M., & Kruger, C. (2010). Assessment of climate change impact on Eastern Washington agriculture. Climatic Change, 102(1–2), 77–102. https://doi.org/10.1007/s10584-010-9851-4
x
agriculture, climate change, water supply, land-use, forecast
Stratus Consulting. (2015). Economic Valuation of Restoration Actions for Salmon and Forests and Associated Wildlife in and along the Elwha River. Prepared for National Oceanic and Atmospheric Administration.
x
x
salmon, habitat restoration, valuation, NOAA
Streif, B. (2008). Pacific Lamprey Fact Sheet. U.S. Fish & Wildlife Service. January
x
x
salmon, recovery
Su, Y., Kern, J. D., & Characklis, G. W. (2017). The impact of wind power growth and hydrological uncertainty on financial losses from oversupply events in hydropower-dominated systems. Applied Energy, 194, 172-183.
x
modelling, wind generation, hydropower
Tarroja, B., AghaKouchak, A., & Samuelsen, S. (2016). Quantifying climate change impacts on hydropower generation and implications on electric grid greenhouse gas emissions and operation. Energy, 111, 295–305. https://doi.org/10.1016/j.energy.2016.05.131
x
hydropower, GHG emissions, climate change
Tohver, I. M., Hamlet, A. F., & Lee, S.-Y. (2014). Impacts of 21st-Century Climate Change on Hydrologic Extremes in the Pacific Northwest Region of North America. Journal of the American Water Resources Association; Middleburg, 50(6), 1461.
x
climate change, water supply, PNW, agriculture, land-use
Train, K., & Wilson, W. W. (2007). Spatially Generated Transportation Demands. Research in Transportation Economics, 20, 97–118. https://doi.org/10.1016/S0739-8859(07)20004-6
x
x
modelling, freight, costs, barge transport, rail transport
Tullos, D. D., Collins, M. J., Bellmore, J. R., Bountry, J. A., Connolly, P. J., Shafroth, P. B., & Wilcox, A. C. (2016). Synthesis of common management concerns associated with dam removal. Journal of the American Water Resources Association, 52(5), 1179-1206.
x
x dam removal, sediment, environmental flows
ECONorthwest 160
Citation
Cite
d
Gen
eral
LSR
Grid
Ser
vice
s
Irrig
atio
n
Tran
spor
tatio
n
Ecos
yste
m
Mis
c .
Notes
U.S. Army Corps of Engineers & Bonneville Power Administration. (2013). Columbia River Treaty 2014/2024 Review. Retrieved from https://www.crt2014-2024review.gov/Files/Columbia%20River%20Treaty%20Review%20-%20Purpose%20and%20Future%20Fact%20Sheet-FOR%20PRINT.PDF
x x
Columbia River Treaty, water supply, hydropower, USACE
U.S. Army Corps of Engineers & Bonneville Power Administration. (2014). Columbia River Treaty History and 2014/2024 Review. Retrieved from https://www.bpa.gov/news/pubs/GeneralPublications/crt-Columbia-River-Treaty-History-and-2010-2024-Review.pdf
x x
Columbia River Treaty, water supply, hydropower, USACE
U.S. Army Corps of Engineers. (2002a). Fish and Wildlife Coordination Act Report. In Lower Snake River Juvenile Salmon Migration Feasibility Report/Environmental Impact Statement (Appendix M). Retrieved from http://www.nww.usace.army.mil/Library/2002-LSR-Study/
x x
EIS, salmon, costs, USACE
U.S. Army Corps of Engineers. (2002b). Improving Salmon Passage. In Lower Snake River Juvenile Salmon Migration Feasibility Report/Environmental Impact Statement (Summary). Retrieved from http://www.nww.usace.army.mil/Library/2002-LSR-Study/
x
EIS, salmon, water supply, dam removal, sediment, costs, USACE
U.S. Army Corps of Engineers. (2002c). Response to Public Comments. In Lower Snake River Juvenile Salmon Migration Feasibility Report/Environmental Impact Statement (Appendix U). Retrieved from http://www.nww.usace.army.mil/Library/2002-LSR-Study/
x x
EIS, dam removal, EIS critique, EPA, USACE
U.S. Army Corps of Engineers. (2002d). Water Quality. In Lower Snake River Juvenile Salmon Migration Feasibility Report/Environmental Impact Statement (Appendix C). Retrieved from http://www.nww.usace.army.mil/Library/2002-LSR-Study/
x x
EIS, salmon, environmental flow, water supply, USACE
U.S. Army Corps of Engineers. (2002e). Improving Salmon Passage. In Lower Snake River Juvenile Salmon Migration Feasibility Report/Environmental Impact Statement (Appendix I). Retrieved from http://www.nww.usace.army.mil/Library/2002-LSR-Study/
x x
EIS, costs, USACE
U.S. Army Corps of Engineers. (2002f). Economics. In Lower Snake River Juvenile Salmon Migration Feasibility Report/Environmental Impact Statement (Appendix I). Retrieved from http://www.nww.usace.army.mil/Library/2002-LSR-Study/
x x EIS, salmon, environmental flow, recreation, USACE
U.S. Army Corps of Engineers. (2002g). Anadromous Fish Modelling. In Lower Snake River Juvenile Salmon Migration Feasibility Report/Environmental Impact Statement (Appendix I). Retrieved from http://www.nww.usace.army.mil/Library/2002-LSR-Study/
x x EIS, salmon, environmental flow, fish populations, USACE
ECONorthwest 161
Citation
Cite
d
Gen
eral
LSR
Grid
Ser
vice
s
Irrig
atio
n
Tran
spor
tatio
n
Ecos
yste
m
Mis
c .
Notes
U.S. Army Corps of Engineers. (2003). Water Quality Plan for Total Dissolved Gas and Water Temperature in the Mainstem Columbia and Snake Rivers. Retrieved from http://pweb.crohms.org/tmt/wq/studies/wq_plan/wq200611.pdf
salmon, environmental flows, water quality, USACE
U.S. Army Corps of Engineers. (2014). Final 2014 Water Quality Plan for Total Dissolved Gas and Water Temperature in the Mainstem Columbia and Snake Rivers. Retrieved from http://pweb.crohms.org/tmt/wq/studies/wq_plan/wq2014.pdf
x x
x
salmon, environmental flows, water quality, USACE
U.S. Army Corps of Engineers. (2015a). 2015 Fish Passage Plan. Lower Columbia & Lower Snake River Hydropower Projects. Retrieved from http://pweb.crohms.org/tmt/documents/fpp/2015/final/FPP15_Final_110415.pdf
x
salmon, recovery, costs, USACE
U.S. Army Corps of Engineers. (2015b). Water Intake Facility Easement Renewals. Retrieved from http://www.nww.usace.army.mil/Portals/28/docs/environmental/Water%20Intake%20leases/WaterIntakeBA.pdf
x
x
water supply, agriculture, USACE
U.S. Army Corps of Engineers. (2016a). Final Waterborne Commerce Statistics for Calendar Year 2016. Retrieved from http://www.navigationdatacenter.us/wcsc/pdf/2016-Final.pdf
x
x
barge transport, cost, USACE
U.S. Army Corps of Engineers. (2016b). Fiscal Year 2016 United States Army Annual Financial Report. Retrieved from https://www.oversight.gov/sites/default/files/oig-reports/DODIG-2017-010.pdf
x x
costs, navigation, USACE
U.S. Army Corps of Engineers. (2016c). Lower Granite Lock and Dam Juvenile Bypass System Improvements. Retrieved from http://www.nww.usace.army.mil/Portals/28/docs/programsandprojects/Granite%20JBS/2016-05-31%20FS_LowerGranite_JBS_Upgrade.pdf?ver=2016-05-31-112303-687
x
salmon, recovery, USACE
U.S. Army Corps of Engineers. (2016c). U.S. Army Corps of Engineers Update to the Total Dissolved Gas Abatement Plan. Lower Columbia River & Lower Snake River Projects. Retrieved from http://pweb.crohms.org/tmt/wqnew/gas_abatement/2016/USACE_update.pdf
x
x
salmon, water quality, USACE
U.S. Army Corps of Engineers. (2017). FY 2017 Work Plan - Operation and Maintence. Retrieved from https://cdm16021.contentdm.oclc.org/digital/collection/p16021coll6/id/2033
x x
x
sediment, navigation, costs, USACE
ECONorthwest 162
Citation
Cite
d
Gen
eral
LSR
Grid
Ser
vice
s
Irrig
atio
n
Tran
spor
tatio
n
Ecos
yste
m
Mis
c .
Notes
U.S. Army Corps of Engineers. (2018). 2018 Spring Fish Operations Plan. Retrieved from http://pweb.crohms.org/tmt/documents/fpp/2018/final/FPP18_AppE.pdf
x x
dam operations, hydropower, environmental flow, salmon, USACE
U.S. Census Bureau. (2012). 2012 Data. Commodity Flow Survey. Retrieved from: http://cnas.tamu.edu/Regional%20Transportation%20Cost%20Technical%20Report%20December%202015.pdf
x
x
shipping, barge transport, USCB
U.S. Department of Agriculture, National Agricultural Statistics Service. (2018). Land Values 2018 Summary. August. Retrieved from http://usda.mannlib.cornell.edu/usda/current/AgriLandVa/AgriLandVa-08-02-2018.pdf
x x agriculture, land values
U.S. Department of the Interior, Bureau of Reclamation & California Department of Fish & Wildlife. (2012). Klamath Facilities Removal Final Environmental Impact Statement/Environmental Impact Report. Retrieved from https://klamathrestoration.gov/Draft-EIS-EIR/download-draft-eis-eir
X
dam removal, Dept of Interior
U.S. Department of the Interior, Bureau of Reclamation. (2012). Detailed Plan for Dam Removal - Klamath River Dams. Retrieved from https://klamathrestoration.gov/sites/klamathrestoration.gov/files/Klamath_DetailedPlan2011.pdf
x
x
dam removal, Dept of Interior
U.S. Department of the Interior, Bureau of Reclamation. (2016). Columbia River Basin Climate Impact Assessment. Retrieved from https://www.usbr.gov/pn/climate/crbia/
x
x
climate change, water supply, agriculture, land-use, Dept of Interior
U.S. Department of Interior, National Park Service (NPS). (2013). "Finding Their Way: Survey reveals Elwha River Chinook are readily colonizing new habitats below Glines Canyon Dam in Olympic National Park". Retrieved from https://www.nps.gov/olym/learn/news/finding-their-way.htm
x
x
dam removal, salmon, habitat restoration, recovery
U.S. Department of the Interior, U.S. Department of Commerce, & National Marine Fisheries Service. (2013). Klamath Dam Removal Overview Report for the Secretary of the Interior: An Assessment of Science and Technical Information.
x
dam removal, Dept of Interior
U.S. Environmental Protection Agency. (2003). Columbia/Snake Rivers Preliminary Draft Temperature TMDL July 2003. Retrieved from https://www.columbiariverkeeper.org/sites/default/files/2017/08/17.pdf
x
environmental flows, water quality, salmon, EPA
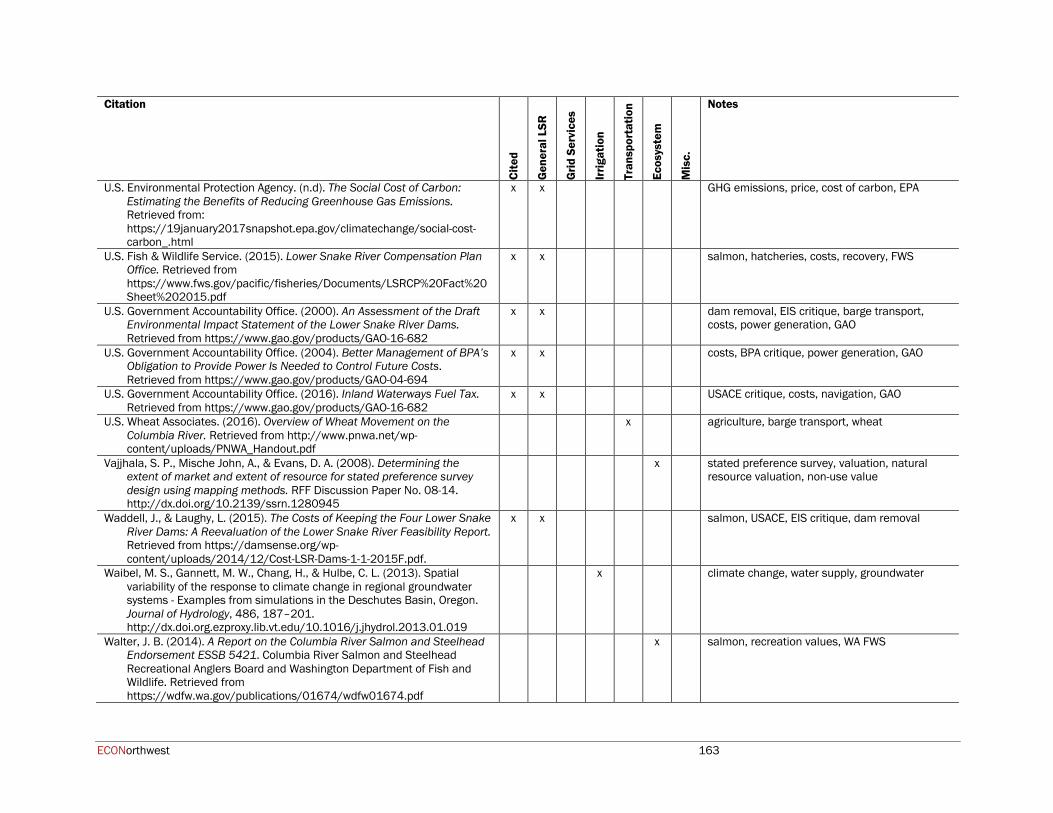
ECONorthwest 163
Citation
Cite
d
Gen
eral
LSR
Grid
Ser
vice
s
Irrig
atio
n
Tran
spor
tatio
n
Ecos
yste
m
Mis
c .
Notes
U.S. Environmental Protection Agency. (n.d). The Social Cost of Carbon: Estimating the Benefits of Reducing Greenhouse Gas Emissions. Retrieved from: https://19january2017snapshot.epa.gov/climatechange/social-cost-carbon_.html
x x
GHG emissions, price, cost of carbon, EPA
U.S. Fish & Wildlife Service. (2015). Lower Snake River Compensation Plan Office. Retrieved from https://www.fws.gov/pacific/fisheries/Documents/LSRCP%20Fact%20Sheet%202015.pdf
x x
salmon, hatcheries, costs, recovery, FWS
U.S. Government Accountability Office. (2000). An Assessment of the Draft Environmental Impact Statement of the Lower Snake River Dams. Retrieved from https://www.gao.gov/products/GAO-16-682
x x
dam removal, EIS critique, barge transport, costs, power generation, GAO
U.S. Government Accountability Office. (2004). Better Management of BPA’s Obligation to Provide Power Is Needed to Control Future Costs. Retrieved from https://www.gao.gov/products/GAO-04-694
x x
costs, BPA critique, power generation, GAO
U.S. Government Accountability Office. (2016). Inland Waterways Fuel Tax. Retrieved from https://www.gao.gov/products/GAO-16-682
x x
USACE critique, costs, navigation, GAO
U.S. Wheat Associates. (2016). Overview of Wheat Movement on the Columbia River. Retrieved from http://www.pnwa.net/wp-content/uploads/PNWA_Handout.pdf
x
agriculture, barge transport, wheat
Vajjhala, S. P., Mische John, A., & Evans, D. A. (2008). Determining the extent of market and extent of resource for stated preference survey design using mapping methods. RFF Discussion Paper No. 08-14. http://dx.doi.org/10.2139/ssrn.1280945
x
stated preference survey, valuation, natural resource valuation, non-use value
Waddell, J., & Laughy, L. (2015). The Costs of Keeping the Four Lower Snake River Dams: A Reevaluation of the Lower Snake River Feasibility Report. Retrieved from https://damsense.org/wp-content/uploads/2014/12/Cost-LSR-Dams-1-1-2015F.pdf.
x x
salmon, USACE, EIS critique, dam removal
Waibel, M. S., Gannett, M. W., Chang, H., & Hulbe, C. L. (2013). Spatial variability of the response to climate change in regional groundwater systems - Examples from simulations in the Deschutes Basin, Oregon. Journal of Hydrology, 486, 187–201. http://dx.doi.org.ezproxy.lib.vt.edu/10.1016/j.jhydrol.2013.01.019
x
climate change, water supply, groundwater
Walter, J. B. (2014). A Report on the Columbia River Salmon and Steelhead Endorsement ESSB 5421. Columbia River Salmon and Steelhead Recreational Anglers Board and Washington Department of Fish and Wildlife. Retrieved from https://wdfw.wa.gov/publications/01674/wdfw01674.pdf
x
salmon, recreation values, WA FWS
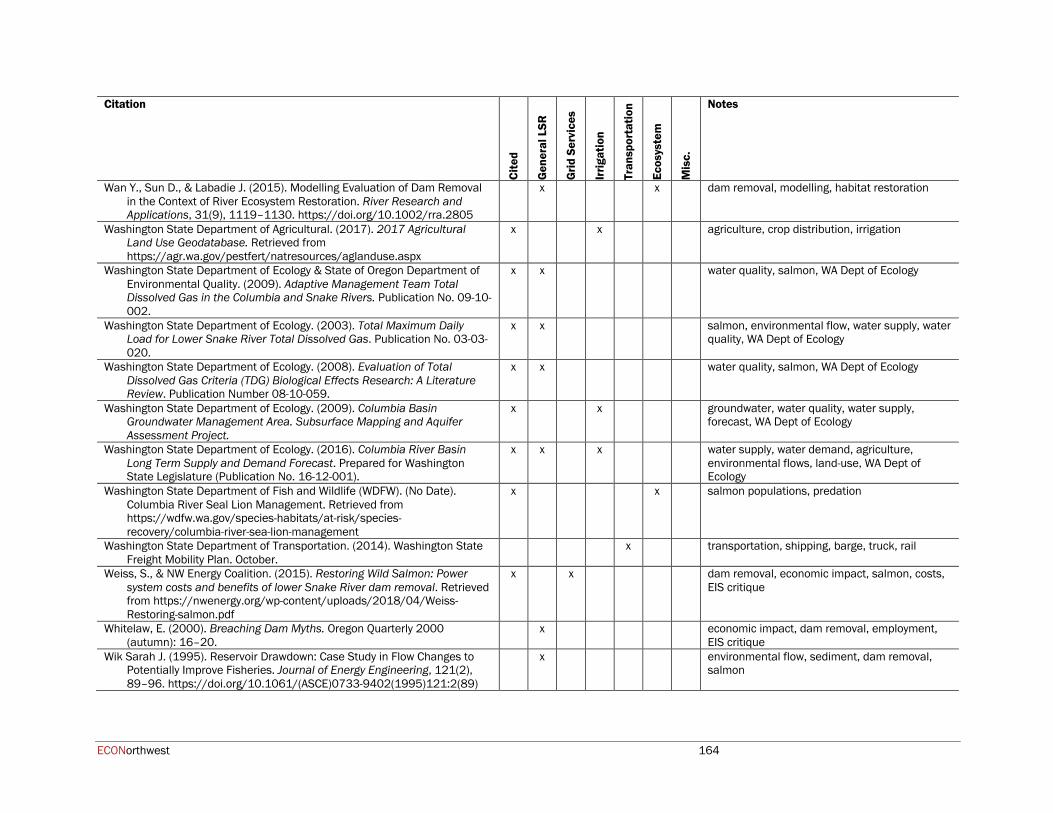
ECONorthwest 164
Citation
Cite
d
Gen
eral
LSR
Grid
Ser
vice
s
Irrig
atio
n
Tran
spor
tatio
n
Ecos
yste
m
Mis
c .
Notes
Wan Y., Sun D., & Labadie J. (2015). Modelling Evaluation of Dam Removal in the Context of River Ecosystem Restoration. River Research and Applications, 31(9), 1119–1130. https://doi.org/10.1002/rra.2805
x
x
dam removal, modelling, habitat restoration
Washington State Department of Agricultural. (2017). 2017 Agricultural Land Use Geodatabase. Retrieved from https://agr.wa.gov/pestfert/natresources/aglanduse.aspx
x
x
agriculture, crop distribution, irrigation
Washington State Department of Ecology & State of Oregon Department of Environmental Quality. (2009). Adaptive Management Team Total Dissolved Gas in the Columbia and Snake Rivers. Publication No. 09-10-002.
x x
water quality, salmon, WA Dept of Ecology
Washington State Department of Ecology. (2003). Total Maximum Daily Load for Lower Snake River Total Dissolved Gas. Publication No. 03-03-020.
x x
salmon, environmental flow, water supply, water quality, WA Dept of Ecology
Washington State Department of Ecology. (2008). Evaluation of Total Dissolved Gas Criteria (TDG) Biological Effects Research: A Literature Review. Publication Number 08-10-059.
x x
water quality, salmon, WA Dept of Ecology
Washington State Department of Ecology. (2009). Columbia Basin Groundwater Management Area. Subsurface Mapping and Aquifer Assessment Project.
x
x
groundwater, water quality, water supply, forecast, WA Dept of Ecology
Washington State Department of Ecology. (2016). Columbia River Basin Long Term Supply and Demand Forecast. Prepared for Washington State Legislature (Publication No. 16-12-001).
x x
x
water supply, water demand, agriculture, environmental flows, land-use, WA Dept of Ecology
Washington State Department of Fish and Wildlife (WDFW). (No Date). Columbia River Seal Lion Management. Retrieved from https://wdfw.wa.gov/species-habitats/at-risk/species-recovery/columbia-river-sea-lion-management
x x salmon populations, predation
Washington State Department of Transportation. (2014). Washington State Freight Mobility Plan. October.
x transportation, shipping, barge, truck, rail
Weiss, S., & NW Energy Coalition. (2015). Restoring Wild Salmon: Power system costs and benefits of lower Snake River dam removal. Retrieved from https://nwenergy.org/wp-content/uploads/2018/04/Weiss-Restoring-salmon.pdf
x
x
dam removal, economic impact, salmon, costs, EIS critique
Whitelaw, E. (2000). Breaching Dam Myths. Oregon Quarterly 2000 (autumn): 16–20.
x
economic impact, dam removal, employment, EIS critique
Wik Sarah J. (1995). Reservoir Drawdown: Case Study in Flow Changes to Potentially Improve Fisheries. Journal of Energy Engineering, 121(2), 89–96. https://doi.org/10.1061/(ASCE)0733-9402(1995)121:2(89)
x
environmental flow, sediment, dam removal, salmon
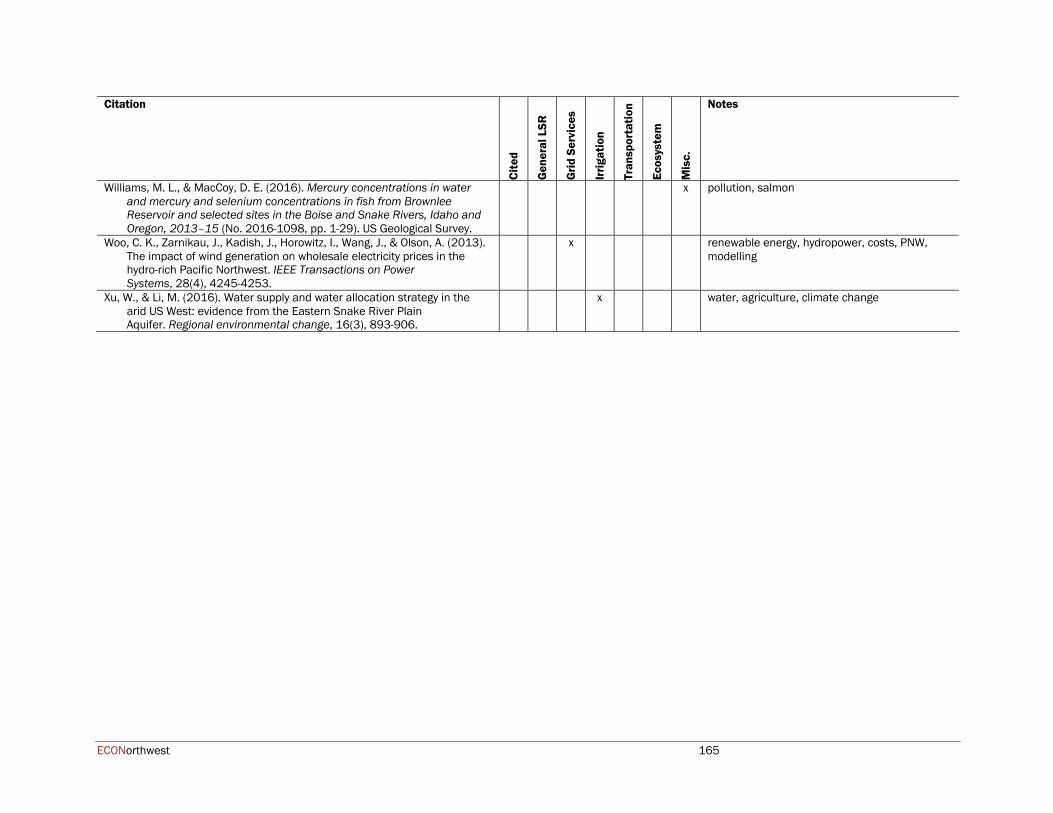
ECONorthwest 165
Citation
Cite
d
Gen
eral
LSR
Grid
Ser
vice
s
Irrig
atio
n
Tran
spor
tatio
n
Ecos
yste
m
Mis
c .
Notes
Williams, M. L., & MacCoy, D. E. (2016). Mercury concentrations in water and mercury and selenium concentrations in fish from Brownlee Reservoir and selected sites in the Boise and Snake Rivers, Idaho and Oregon, 2013–15 (No. 2016-1098, pp. 1-29). US Geological Survey.
x pollution, salmon
Woo, C. K., Zarnikau, J., Kadish, J., Horowitz, I., Wang, J., & Olson, A. (2013). The impact of wind generation on wholesale electricity prices in the hydro-rich Pacific Northwest. IEEE Transactions on Power Systems, 28(4), 4245-4253.
x
renewable energy, hydropower, costs, PNW, modelling
Xu, W., & Li, M. (2016). Water supply and water allocation strategy in the arid US West: evidence from the Eastern Snake River Plain Aquifer. Regional environmental change, 16(3), 893-906.
x
water, agriculture, climate change

ECONorthwest 166
This page intentionally blank
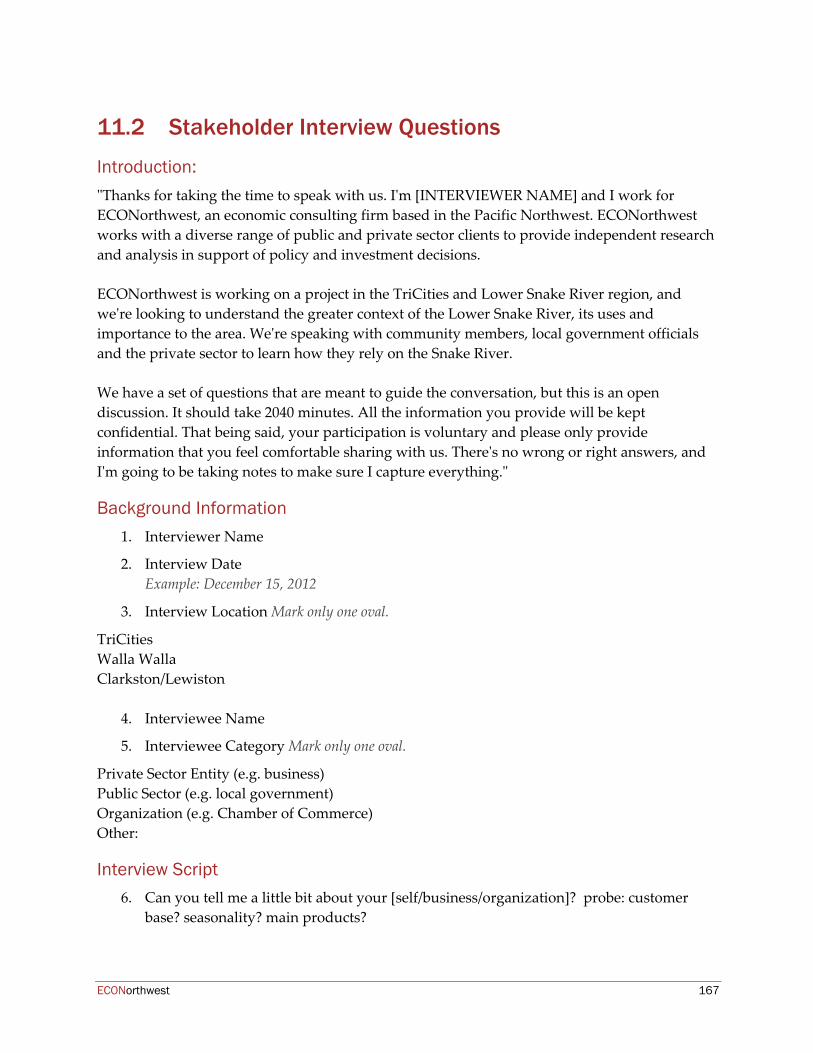
ECONorthwest 167
11.2 Stakeholder Interview Questions
Introduction: "Thanks for taking the time to speak with us. I'm [INTERVIEWER NAME] and I work for ECONorthwest, an economic consulting firm based in the Pacific Northwest. ECONorthwest works with a diverse range of public and private sector clients to provide independent research and analysis in support of policy and investment decisions. ECONorthwest is working on a project in the TriCities and Lower Snake River region, and we're looking to understand the greater context of the Lower Snake River, its uses and importance to the area. We're speaking with community members, local government officials and the private sector to learn how they rely on the Snake River. We have a set of questions that are meant to guide the conversation, but this is an open discussion. It should take 2040 minutes. All the information you provide will be kept confidential. That being said, your participation is voluntary and please only provide information that you feel comfortable sharing with us. There's no wrong or right answers, and I'm going to be taking notes to make sure I capture everything."
Background Information 1. Interviewer Name
2. Interview Date Example: December 15, 2012
3. Interview Location Mark only one oval.
TriCities Walla Walla Clarkston/Lewiston
4. Interviewee Name
5. Interviewee Category Mark only one oval.
Private Sector Entity (e.g. business) Public Sector (e.g. local government) Organization (e.g. Chamber of Commerce) Other:
Interview Script 6. Can you tell me a little bit about your [self/business/organization]? probe: customer
base? seasonality? main products?
ECONorthwest 168
7. In your opinion, what are major factors that affect the cost of doing business in the region?
8. How do you rely on state/interstate transport [state/interstate highways, rail and barge]? probe: quality? adequate supply?
9. What is your perception of the region’s environmental quality? probe: air quality? recreational access?
TRANSITION “The next few questions are about the Lower Snake River”
10. How does the Lower Snake River, and the Lower Snake River dams impact your [business/organization]?
11. Do you [your organization, your community, etc.] use water from the Snake River? If yes, please describe.
a. [If mentions irrigation] what kinds of crops do you irrigate? Are there uses beyond irrigation? Please describe.
b. How do you expect these uses to change (if at all) over the next 20 years? Changes in demand? Changes in supply?
12. Are you aware of the most recent discussions about Lower Snake River dam removal? Mark only one oval.
13. Do you have any thoughts on how removal of the dams might affect your business or the region?
a. [for direct water user] How would removal of the dams affect your use of water from the Lower Snake? probe: Seasonal interruptions? Loss of access with current infrastructure?
b. [for direct water user] Do you expect that you would need to make new investments? What would they be? probe: New infrastructure? Infrastructure upgrades? Purchase or shift to new water sources? Do you have a sense of the costs of these adaptive investments?
14. Are you aware of the Environmental Impact Study that BPA/USACE is conducting?
15. Do you generally trust BPA/USACE will make the right decision?
TRANSITION “We're almost done. My last few questions are specific to your [self/business/organization]"
16. How long have you been [in business/operating] in the region?
17. How many [employees/members/constituents] do you [have/serve]?
18. What is your business's annual revenue?
19. Is there anything else that you would like to share?
20. Are there any other individuals that you think would be useful for me to speak with?
ECONorthwest 169
CLOSING "Thanks for talking with us today. The information you shared is very helpful. We are compiling all of this information to help us understand the economic drivers in the region. I have your contact information, and we may reach back out to you if we have any other questions. Certainly, please feel free to reach out to us if you have any additional thoughts, suggestions, or questions."
FAQ Who is funding this research? We're working behalf of a company that may have an interest in the outcome of the lower snake river dam review process, but I'm not able to disclose our client at this time.
Will I see the product of these interviews? Our analysis is designed to help inform our client, but I cannot guarantee that the result will be shared or available to the public.
Does ECONorthwest have a position on the LSRD removal? No, we have not taken a position on removal of the LSRD. We pride ourselves on our history of objective quantitative analysis and are only looking to better understand the issue and answer specific client questions.

ECONorthwest 170
11.3 Stakeholder Interview Request
ECONorthwest 171
11.4 Irrigation Infrastructure Replacement Cost Attached.
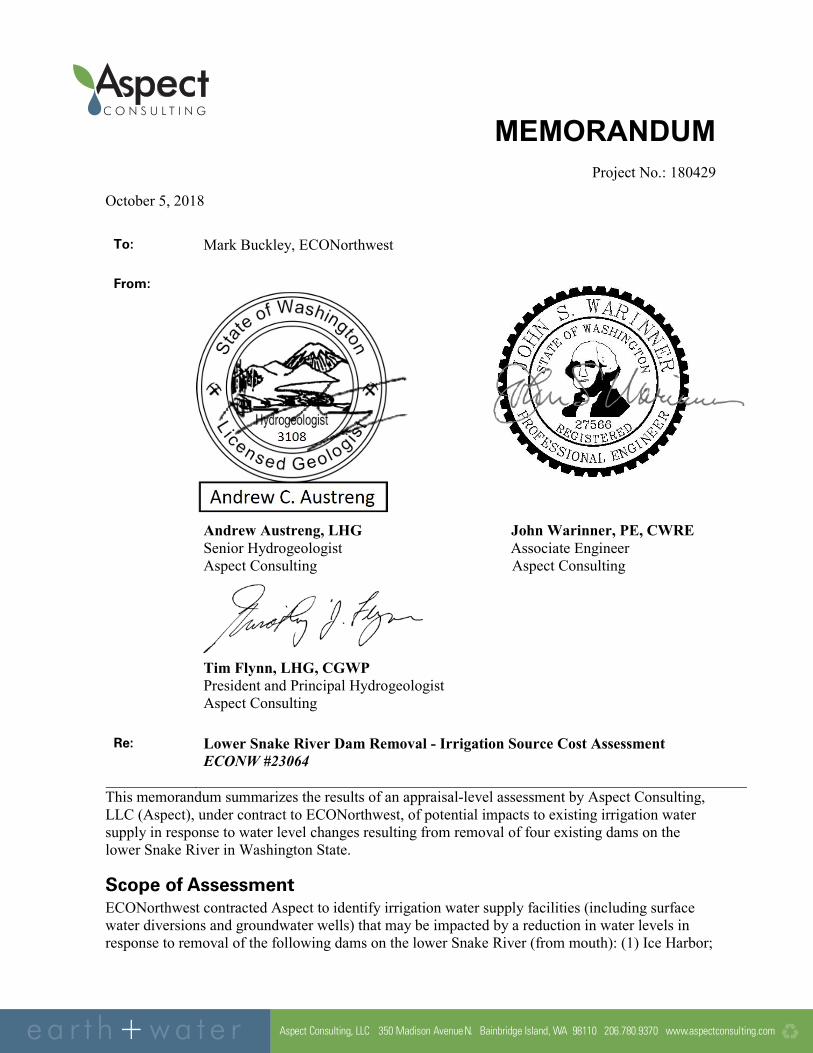
MEMORANDUM Project No.: 180429
October 5, 2018
To: Mark Buckley, ECONorthwest
From:
Andrew Austreng, LHG John Warinner, PE, CWRE Senior Hydrogeologist Associate Engineer Aspect Consulting Aspect Consulting
Tim Flynn, LHG, CGWP President and Principal Hydrogeologist Aspect Consulting
Re: Lower Snake River Dam Removal - Irrigation Source Cost Assessment ECONW #23064
This memorandum summarizes the results of an appraisal-level assessment by Aspect Consulting, LLC (Aspect), under contract to ECONorthwest, of potential impacts to existing irrigation water supply in response to water level changes resulting from removal of four existing dams on the lower Snake River in Washington State.
Scope of Assessment ECONorthwest contracted Aspect to identify irrigation water supply facilities (including surface water diversions and groundwater wells) that may be impacted by a reduction in water levels in response to removal of the following dams on the lower Snake River (from mouth): (1) Ice Harbor;
ea r t h+wa t e r Aspect Consulting, LLC 350 Madison Avenue N. Bainbridge Island, WA 98110 206.780.9370 www.aspectconsulting.com
MEMORANDUM October 5, 2018 Project No.: 180429
Page 2
(2) Lower Monumental; (3) Lower Goose; and (4) Lower Granite. Aspect estimated aggregate appraisal-level costs to modify or replace these water supply facilities. Aspect’s scope of work was limited to assessing the magnitude of cost to retrofit or replace existing irrigation source facilities, relying on prior cost analysis for similar projects, and did not evaluate individual facility-specific characteristics, which would be necessary to better estimate actual costs. A summary of findings is presented first, followed by the methodology, assumptions, and data sources used for this assessment.
Summary of Findings Table 1 summarizes Aspect’s appraisal-level estimate of the aggregate costs to replace existing irrigation water sources potentially impacted under a dam-removal scenario. Surface water sources were conservatively assumed to require replacement due to the large change in water surface elevation, as describe in the following section. Wells were also conservatively assumed to require replacement due to uncertainty in age and well condition (i.e., uncertainty if well diameter and integrity could accommodate deepening).
Table 1. Summary of Potentially Impacted Irrigation Water Sources
Source Type
Number of
Sources
Total Source
Capacity (cfs) Estimated Replacement Costs, in millions2
Surface Water Diversions 41 995 $ 1483
Groundwater Wells 84 --1 Ice Harbor Lower
Monumental Little Goose Lower Granite
Pump Replacement $ 29,000 $ 18,000 $ 20,000 $ 16,000
Well & Pump Replacement $6,600,000 $ 1,900,000 $ 1,400,000 $ 1,800,000
Total Estimated Cost for Groundwater Wells $ 124
Total Estimated Replacement Cost $ 160 1. Groundwater sources were identified from well logs, as opposed to water rights, so no estimate of total capacity is provided. 2. Estimates do not include added costs for contracting by public agencies (e.g., prevailing wage). 3. Costs include engineering, permitting, mitigation, and other ancillary costs associated with replacement. 4. Includes capital costs for drilling, well construction and completion, and pump replacement. cfs = cubic feet per second
Methodology and Assumptions The following sections describe the methodology used to approximate the aggregate cost to replace the existing irrigation sources that would be impacted under a dam removal scenario.
Identification Surface Water Diversions Potentially Requiring Replacement The following general steps were used to identify surface water diversions potentially requiring replacement after dam removal due to reduced water levels.
1. The Washington Department of Ecology (Ecology) Water Rights Tracking System (WRTS) and Geographic Water Information System (GWIS) databases were linked and queried using
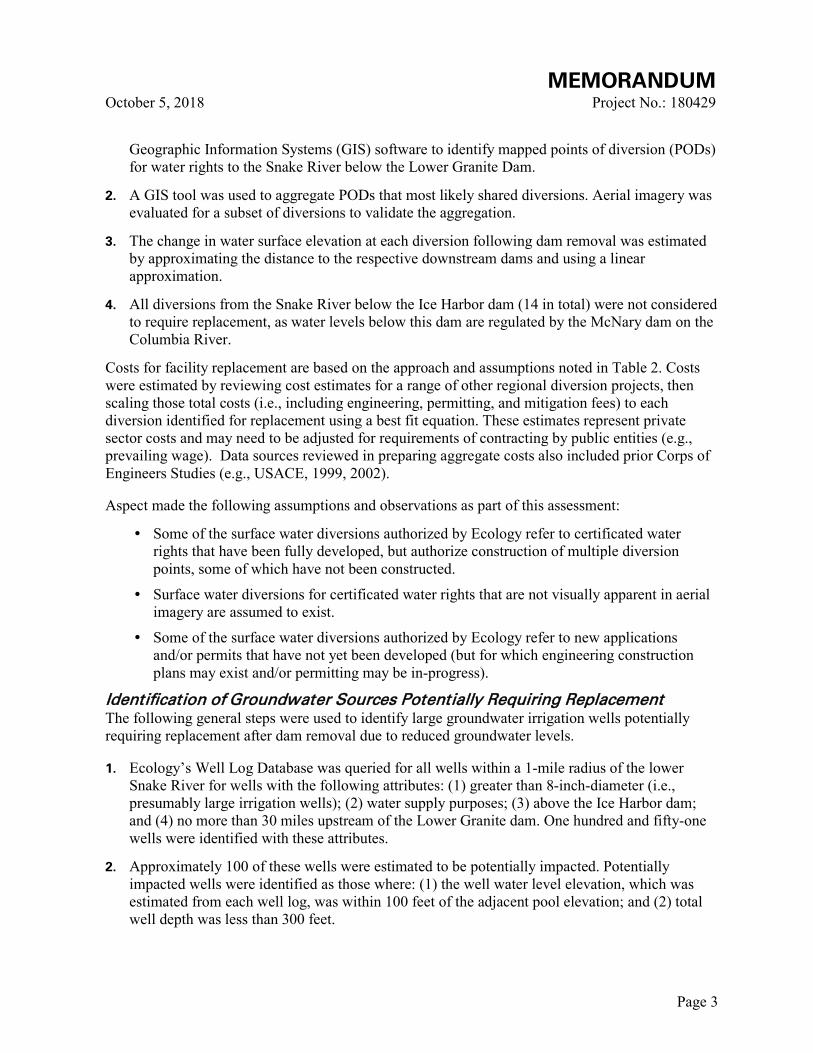
MEMORANDUM October 5, 2018 Project No.: 180429
Page 3
Geographic Information Systems (GIS) software to identify mapped points of diversion (PODs) for water rights to the Snake River below the Lower Granite Dam.
2. A GIS tool was used to aggregate PODs that most likely shared diversions. Aerial imagery was evaluated for a subset of diversions to validate the aggregation.
3. The change in water surface elevation at each diversion following dam removal was estimated by approximating the distance to the respective downstream dams and using a linear approximation.
4. All diversions from the Snake River below the Ice Harbor dam (14 in total) were not considered to require replacement, as water levels below this dam are regulated by the McNary dam on the Columbia River.
Costs for facility replacement are based on the approach and assumptions noted in Table 2. Costs were estimated by reviewing cost estimates for a range of other regional diversion projects, then scaling those total costs (i.e., including engineering, permitting, and mitigation fees) to each diversion identified for replacement using a best fit equation. These estimates represent private sector costs and may need to be adjusted for requirements of contracting by public entities (e.g., prevailing wage). Data sources reviewed in preparing aggregate costs also included prior Corps of Engineers Studies (e.g., USACE, 1999, 2002).
Aspect made the following assumptions and observations as part of this assessment:
y Some of the surface water diversions authorized by Ecology refer to certificated water rights that have been fully developed, but authorize construction of multiple diversion points, some of which have not been constructed.
y Surface water diversions for certificated water rights that are not visually apparent in aerial imagery are assumed to exist.
y Some of the surface water diversions authorized by Ecology refer to new applications and/or permits that have not yet been developed (but for which engineering construction plans may exist and/or permitting may be in-progress).
Identification of Groundwater Sources Potentially Requiring Replacement The following general steps were used to identify large groundwater irrigation wells potentially requiring replacement after dam removal due to reduced groundwater levels.
1. Ecology’s Well Log Database was queried for all wells within a 1-mile radius of the lower Snake River for wells with the following attributes: (1) greater than 8-inch-diameter (i.e., presumably large irrigation wells); (2) water supply purposes; (3) above the Ice Harbor dam; and (4) no more than 30 miles upstream of the Lower Granite dam. One hundred and fifty-one wells were identified with these attributes.
2. Approximately 100 of these wells were estimated to be potentially impacted. Potentially impacted wells were identified as those where: (1) the well water level elevation, which was estimated from each well log, was within 100 feet of the adjacent pool elevation; and (2) total well depth was less than 300 feet.
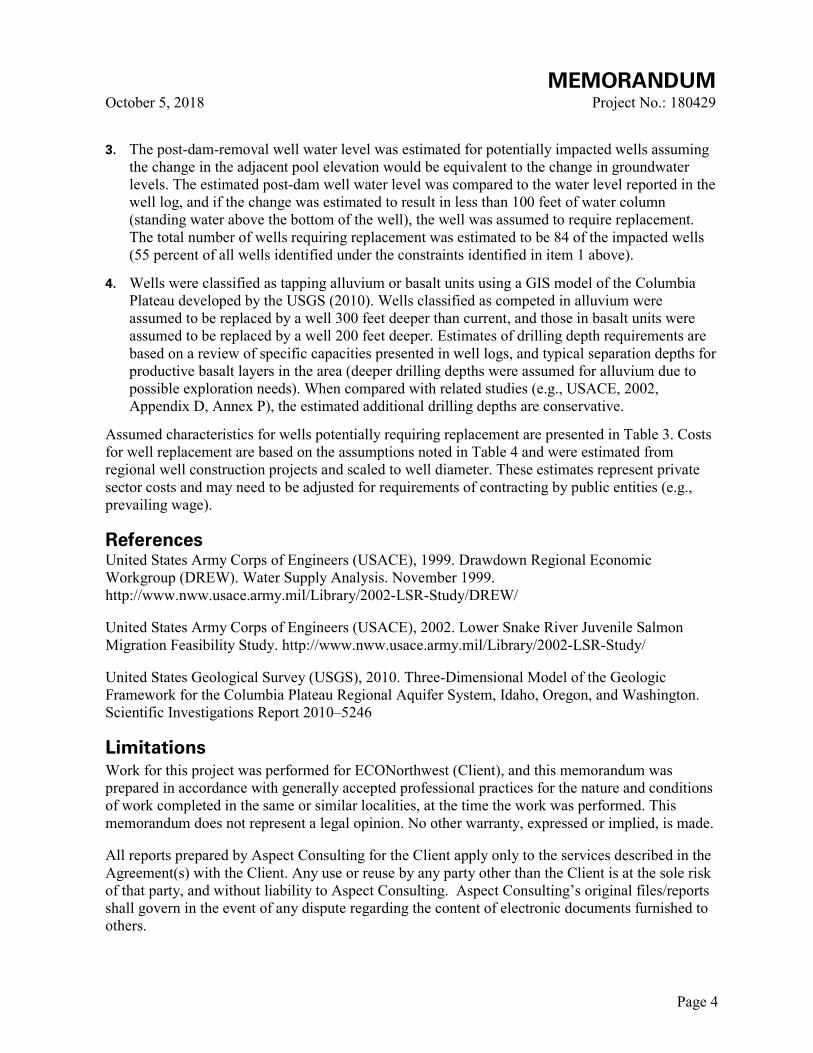
MEMORANDUM October 5, 2018 Project No.: 180429
Page 4
3. The post-dam-removal well water level was estimated for potentially impacted wells assuming the change in the adjacent pool elevation would be equivalent to the change in groundwater levels. The estimated post-dam well water level was compared to the water level reported in the well log, and if the change was estimated to result in less than 100 feet of water column (standing water above the bottom of the well), the well was assumed to require replacement. The total number of wells requiring replacement was estimated to be 84 of the impacted wells (55 percent of all wells identified under the constraints identified in item 1 above).
4. Wells were classified as tapping alluvium or basalt units using a GIS model of the Columbia Plateau developed by the USGS (2010). Wells classified as competed in alluvium were assumed to be replaced by a well 300 feet deeper than current, and those in basalt units were assumed to be replaced by a well 200 feet deeper. Estimates of drilling depth requirements are based on a review of specific capacities presented in well logs, and typical separation depths for productive basalt layers in the area (deeper drilling depths were assumed for alluvium due to possible exploration needs). When compared with related studies (e.g., USACE, 2002, Appendix D, Annex P), the estimated additional drilling depths are conservative.
Assumed characteristics for wells potentially requiring replacement are presented in Table 3. Costs for well replacement are based on the assumptions noted in Table 4 and were estimated from regional well construction projects and scaled to well diameter. These estimates represent private sector costs and may need to be adjusted for requirements of contracting by public entities (e.g., prevailing wage).
References United States Army Corps of Engineers (USACE), 1999. Drawdown Regional Economic Workgroup (DREW). Water Supply Analysis. November 1999. http://www.nww.usace.army.mil/Library/2002-LSR-Study/DREW/
United States Army Corps of Engineers (USACE), 2002. Lower Snake River Juvenile Salmon Migration Feasibility Study. http://www.nww.usace.army.mil/Library/2002-LSR-Study/
United States Geological Survey (USGS), 2010. Three-Dimensional Model of the Geologic Framework for the Columbia Plateau Regional Aquifer System, Idaho, Oregon, and Washington. Scientific Investigations Report 2010–5246
Limitations Work for this project was performed for ECONorthwest (Client), and this memorandum was prepared in accordance with generally accepted professional practices for the nature and conditions of work completed in the same or similar localities, at the time the work was performed. This memorandum does not represent a legal opinion. No other warranty, expressed or implied, is made.
All reports prepared by Aspect Consulting for the Client apply only to the services described in the Agreement(s) with the Client. Any use or reuse by any party other than the Client is at the sole risk of that party, and without liability to Aspect Consulting. Aspect Consulting’s original files/reports shall govern in the event of any dispute regarding the content of electronic documents furnished to others.
MEMORANDUM October 5, 2018 Project No.: 180429
Page 5
Attachments
Table 1 – Summary of Potentially Impacted Irrigation Water Sources (in text) Table 2 – Pump Station Replacement Estimates
Table 3 – Characteristics of Wells Identified for Modification
Table 4 – Estimated Costs for Well Modifications
V:\180429 Lower Snake River Dam Removal\Deliverables\Irrigation Source Cost Assessment Memo_20181005.docx
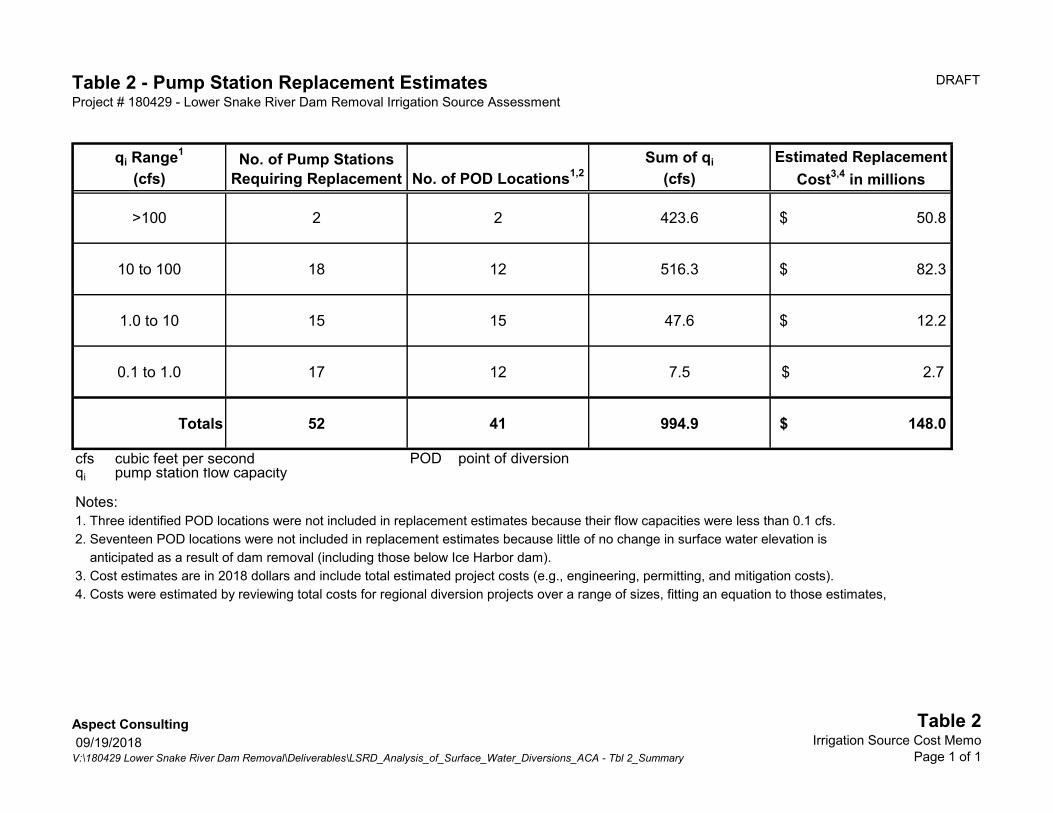
Table 2 - Pump Station Replacement EstimatesProject # 180429 - Lower Snake River Dam Removal Irrigation Source Assessment
DRAFT
qi Range1
(cfs)No. of Pump Stations
Requiring Replacement No. of POD Locations1,2Sum of qi
(cfs)Estimated Replacement
Cost3,4 in millions
>100 2 2 423.6 $ 50.8
10 to 100 18 12 516.3 $ 82.3
1.0 to 10 15 15 47.6 $ 12.2
0.1 to 1.0 17 12 7.5 $ 2.7
Totals 52 41 994.9 $ 148.0
cfs cubic feet per second POD point of diversionqi pump station flow capacity
Notes: 1. Three identified POD locations were not included in replacement estimates because their flow capacities were less than 0.1 cfs.2. Seventeen POD locations were not included in replacement estimates because little of no change in surface water elevation is anticipated as a result of dam removal (including those below Ice Harbor dam).3. Cost estimates are in 2018 dollars and include total estimated project costs (e.g., engineering, permitting, and mitigation costs).4. Costs were estimated by reviewing total costs for regional diversion projects over a range of sizes, fitting an equation to those estimates,
Aspect Consulting 09/19/2018V:\180429 Lower Snake River Dam Removal\Deliverables\LSRD_Analysis_of_Surface_Water_Diversions_ACA - Tbl 2_Summary
Table 2Irrigation Source Cost Memo
Page 1 of 1
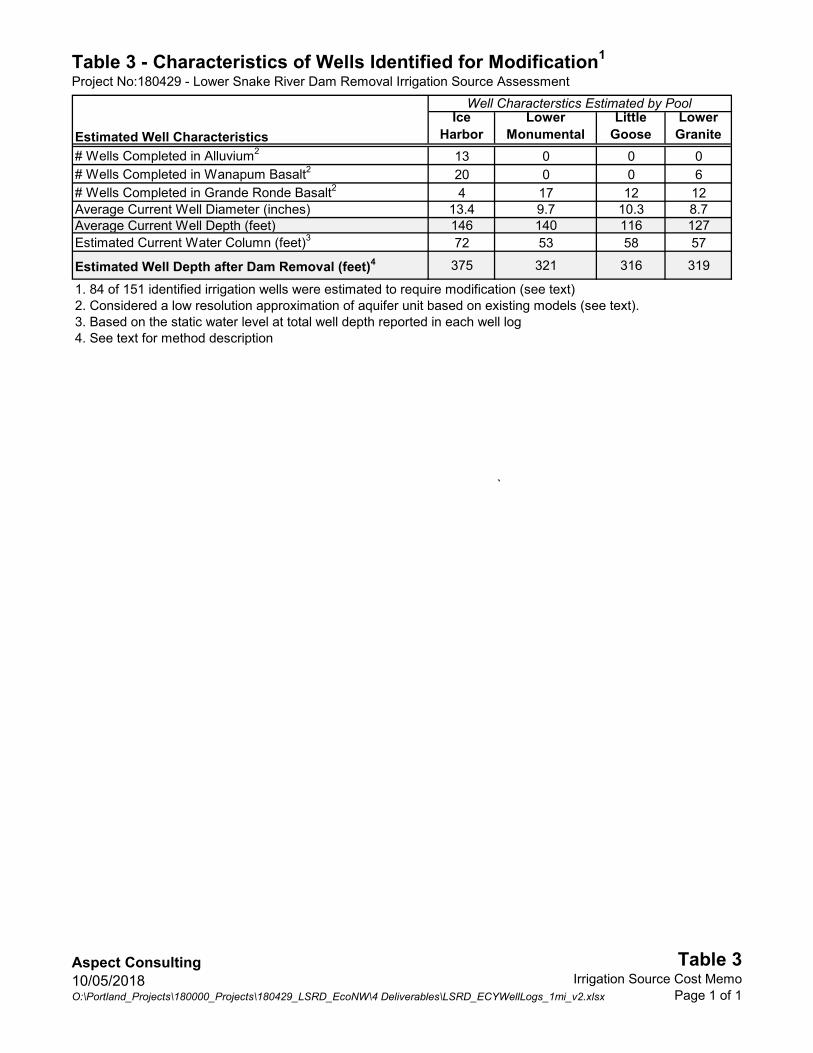
Table 3 - Characteristics of Wells Identified for Modification1
Project No:180429 - Lower Snake River Dam Removal Irrigation Source Assessment
Ice Harbor
LowerMonumental
LittleGoose
LowerGranite
# Wells Completed in Alluvium2 13 0 0 0# Wells Completed in Wanapum Basalt2 20 0 0 6# Wells Completed in Grande Ronde Basalt2 4 17 12 12Average Current Well Diameter (inches) 13.4 9.7 10.3 8.7Average Current Well Depth (feet) 146 140 116 127Estimated Current Water Column (feet)3 72 53 58 57
Estimated Well Depth after Dam Removal (feet)4 375 321 316 319
1. 84 of 151 identified irrigation wells were estimated to require modification (see text)2. Considered a low resolution approximation of aquifer unit based on existing models (see text).3. Based on the static water level at total well depth reported in each well log4. See text for method description
`
Estimated Well Characteristics
Well Characterstics Estimated by Pool
Aspect Consulting 10/05/2018O:\Portland_Projects\180000_Projects\180429_LSRD_EcoNW\4 Deliverables\LSRD_ECYWellLogs_1mi_v2.xlsx
Table 3Irrigation Source Cost Memo
Page 1 of 1
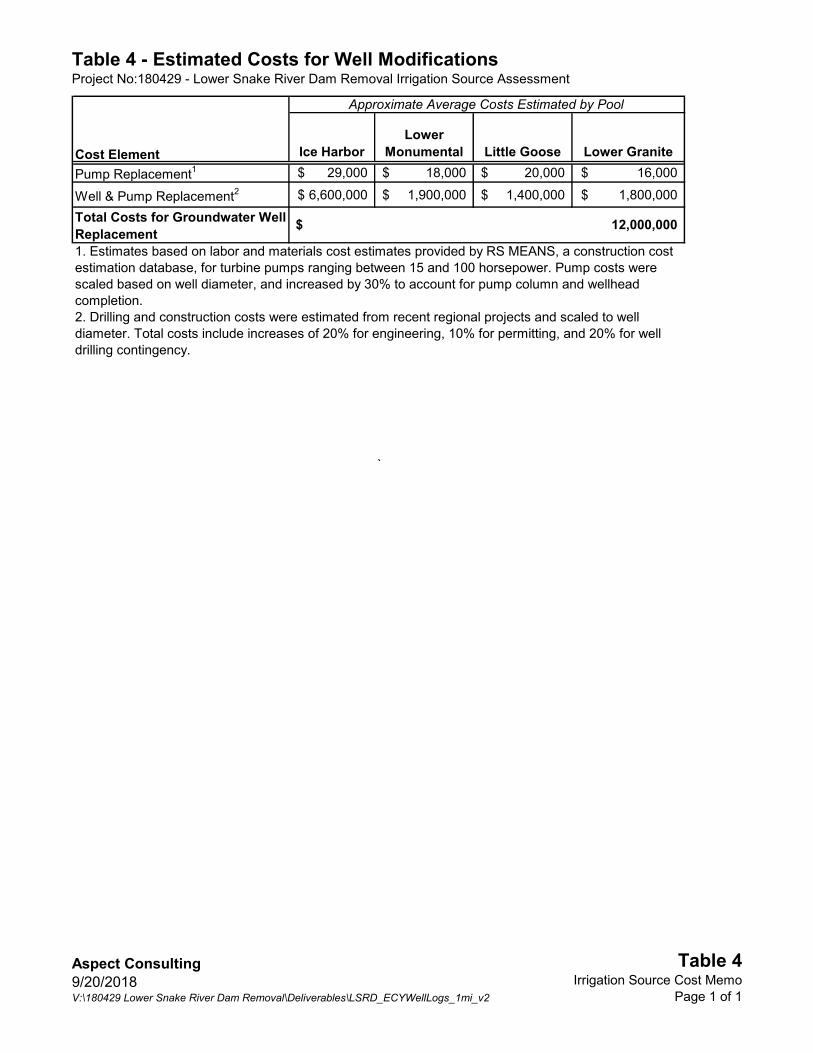
Table 4 - Estimated Costs for Well ModificationsProject No:180429 - Lower Snake River Dam Removal Irrigation Source Assessment
Ice HarborLower
Monumental Little Goose Lower Granite
Pump Replacement1 29,000$ 18,000$ 20,000$ 16,000$
Well & Pump Replacement2 6,600,000$ 1,900,000$ 1,400,000$ 1,800,000$
Total Costs for Groundwater Well Replacement
`
12,000,000$
Cost Element
Approximate Average Costs Estimated by Pool
1. Estimates based on labor and materials cost estimates provided by RS MEANS, a construction cost estimation database, for turbine pumps ranging between 15 and 100 horsepower. Pump costs were scaled based on well diameter, and increased by 30% to account for pump column and wellhead completion.2. Drilling and construction costs were estimated from recent regional projects and scaled to well diameter. Total costs include increases of 20% for engineering, 10% for permitting, and 20% for well drilling contingency.
Aspect Consulting9/20/2018V:\180429 Lower Snake River Dam Removal\Deliverables\LSRD_ECYWellLogs_1mi_v2
Table 4Irrigation Source Cost Memo
Page 1 of 1
Related Documents