Behavioural Brain Research 205 (2009) 249–258 Contents lists available at ScienceDirect Behavioural Brain Research journal homepage: www.elsevier.com/locate/bbr Research report Lower risk taking and exploratory behavior in alcohol-preferring sP rats than in alcohol non-preferring sNP rats in the multivariate concentric square field TM (MCSF) test Erika Roman a,∗ , Giancarlo Colombo b a Department of Pharmaceutical Biosciences, Division of Pharmacology, Uppsala University, P.O. Box 591, SE-751 24 Uppsala, Sweden b C.N.R. Institute of Neuroscience, Viale Diaz, 182 I-09126 Cagliari (CA), Italy article info Article history: Received 30 April 2009 Received in revised form 7 August 2009 Accepted 17 August 2009 Available online 22 August 2009 Keywords: Anxiety-like behavior Elevated plus maze Sardinian alcohol-preferring (sP) Sardinian alcohol non-preferring (sNP) Principal component analysis Selective breeding Repeated trial Behavioral profile abstract The present investigation continues previous behavioral profiling studies of selectively bred alcohol- drinking and alcohol non-drinking rats. In this study, alcohol-naïve adult Sardinian alcohol-preferring (sP) and non-preferring (sNP) rats were tested in the multivariate concentric square field TM (MCSF) test. The MCSF test has an ethoexperimental approach and measures general activity, exploration, risk assessment, risk taking, and shelter seeking in laboratory rodents. The multivariate design enables behavioral profiling in one and the same test situation. Age-matched male Wistar rats were included as a control group. Five weeks after the first MCSF trial, a repeated testing was done to explore differences in acquired experience. The results revealed distinct differences in exploratory strategies and behavioral profiles between sP and sNP rats. The sP rats were characterized by lower activity, lower exploratory drive, higher risk assessment, and lower risk taking behavior than in sNP rats. In the repeated trial, risk-taking behavior was almost abolished in sP rats. When comparing the performance of sP and sNP rats with that of Wistar rats, the principal component analysis revealed that the sP rats were the most divergent group. The vigilant behavior observed in sP rats with low exploratory drive and low risk-taking behavior is interpreted here as high innate anxiety-related behaviors and may be related to their propensity for high voluntary alcohol intake and preference. We suggest that the different lines of alcohol-preferring rats with different behavioral characteristics constitute valuable animal models that mimic the heterogeneity in human alcohol dependence. © 2009 Elsevier B.V. All rights reserved. 1. Introduction Alcohol dependence in humans is a complex disorder deter- mined by the combination of genetic and environmental factors that also influence personality trait characteristics [e.g. 19,28,29,41,45]. Furthermore, there is co-aggregation of a number of psychiatric disorders with alcohol dependence [e.g. 27,39,41]. Additionally, several types and typologies of alcohol-dependent individuals have been described [5,12,32,41], which further sup- ports the theories of personality traits and co-morbidity being associated with alcohol dependence. Because it is almost impossible in clinical studies to differentiate environmental factors from genetic determinants in vulnerabil- ity to psychiatric disorders, including alcohol dependence, animal models are valuable for providing a better understanding of the mechanisms underlying disorders and associated behavioral traits. Obviously, no animal model is totally homologous to conditions ∗ Corresponding author. Tel.: +46 18 4714632; fax: +46 18 4714847. E-mail address: [email protected] (E. Roman). in humans, and perhaps each animal model can represent, at best, a few aspects of the human disease. With outbred animals, it is difficult to determine whether a certain behavioral trait is highly stable or state-dependent, and the degree to which it is heritable. For this purpose, selective breeding is a useful strat- egy [e.g. 35,36,46,59,60,64]. With regard to selective breeding for high alcohol intake and preference [36,38], some rodent lines display some behavioral traits that resemble the diagnostic cri- teria of human alcohol dependence. Several different lines of rodents have been selectively bred for high and low oral alcohol preference and intake. These lines include the Indiana alcohol- preferring/non-preferring (P/NP) rats [6,42], the two replicate lines of high/low alcohol-drinking (HAD1-2/LAD1-2) rats [33,34,42], the Alko alcohol/non-alcohol (AA/ANA) rats [20,23,57], the Sardinian alcohol-preferring/non-preferring (sP/sNP) rats [15], the University of Chile alcohol-drinking/non-drinking (UChB/UChA) rats [37,51], and the Warsaw high-/low-preferring (WHP/WLP) rats [18]. The rat lines listed were bred for the same phenotype, i.e. high or low alcohol preference and consumption under the standard, home- cage, two-bottle “alcohol (10%, v/v) versus water” choice paradigm with continuous access for 24 h a day. For all these rat lines, 0166-4328/$ – see front matter © 2009 Elsevier B.V. All rights reserved. doi:10.1016/j.bbr.2009.08.020

Welcome message from author
This document is posted to help you gain knowledge. Please leave a comment to let me know what you think about it! Share it to your friends and learn new things together.
Transcript
R
Lts
Ea
b
a
ARRAA
KAESSPSRB
1
mf1oAipa
eimmO
0d
Behavioural Brain Research 205 (2009) 249–258
Contents lists available at ScienceDirect
Behavioural Brain Research
journa l homepage: www.e lsev ier .com/ locate /bbr
esearch report
ower risk taking and exploratory behavior in alcohol-preferring sP ratshan in alcohol non-preferring sNP rats in the multivariate concentricquare fieldTM (MCSF) test
rika Romana,∗, Giancarlo Colombob
Department of Pharmaceutical Biosciences, Division of Pharmacology, Uppsala University, P.O. Box 591, SE-751 24 Uppsala, SwedenC.N.R. Institute of Neuroscience, Viale Diaz, 182 I-09126 Cagliari (CA), Italy
r t i c l e i n f o
rticle history:eceived 30 April 2009eceived in revised form 7 August 2009ccepted 17 August 2009vailable online 22 August 2009
eywords:nxiety-like behaviorlevated plus mazeardinian alcohol-preferring (sP)ardinian alcohol non-preferring (sNP)
a b s t r a c t
The present investigation continues previous behavioral profiling studies of selectively bred alcohol-drinking and alcohol non-drinking rats. In this study, alcohol-naïve adult Sardinian alcohol-preferring (sP)and non-preferring (sNP) rats were tested in the multivariate concentric square fieldTM (MCSF) test. TheMCSF test has an ethoexperimental approach and measures general activity, exploration, risk assessment,risk taking, and shelter seeking in laboratory rodents. The multivariate design enables behavioral profilingin one and the same test situation. Age-matched male Wistar rats were included as a control group.Five weeks after the first MCSF trial, a repeated testing was done to explore differences in acquiredexperience. The results revealed distinct differences in exploratory strategies and behavioral profilesbetween sP and sNP rats. The sP rats were characterized by lower activity, lower exploratory drive,higher risk assessment, and lower risk taking behavior than in sNP rats. In the repeated trial, risk-taking
rincipal component analysiselective breedingepeated trialehavioral profile
behavior was almost abolished in sP rats. When comparing the performance of sP and sNP rats withthat of Wistar rats, the principal component analysis revealed that the sP rats were the most divergentgroup. The vigilant behavior observed in sP rats with low exploratory drive and low risk-taking behavioris interpreted here as high innate anxiety-related behaviors and may be related to their propensity forhigh voluntary alcohol intake and preference. We suggest that the different lines of alcohol-preferring rats
charaence
with different behavioralin human alcohol depend
. Introduction
Alcohol dependence in humans is a complex disorder deter-ined by the combination of genetic and environmental
actors that also influence personality trait characteristics [e.g.9,28,29,41,45]. Furthermore, there is co-aggregation of a numberf psychiatric disorders with alcohol dependence [e.g. 27,39,41].dditionally, several types and typologies of alcohol-dependent
ndividuals have been described [5,12,32,41], which further sup-orts the theories of personality traits and co-morbidity beingssociated with alcohol dependence.
Because it is almost impossible in clinical studies to differentiatenvironmental factors from genetic determinants in vulnerabil-
ty to psychiatric disorders, including alcohol dependence, animalodels are valuable for providing a better understanding of theechanisms underlying disorders and associated behavioral traits.bviously, no animal model is totally homologous to conditions
∗ Corresponding author. Tel.: +46 18 4714632; fax: +46 18 4714847.E-mail address: [email protected] (E. Roman).
166-4328/$ – see front matter © 2009 Elsevier B.V. All rights reserved.oi:10.1016/j.bbr.2009.08.020
cteristics constitute valuable animal models that mimic the heterogeneity.
© 2009 Elsevier B.V. All rights reserved.
in humans, and perhaps each animal model can represent, atbest, a few aspects of the human disease. With outbred animals,it is difficult to determine whether a certain behavioral trait ishighly stable or state-dependent, and the degree to which it isheritable. For this purpose, selective breeding is a useful strat-egy [e.g. 35,36,46,59,60,64]. With regard to selective breeding forhigh alcohol intake and preference [36,38], some rodent linesdisplay some behavioral traits that resemble the diagnostic cri-teria of human alcohol dependence. Several different lines ofrodents have been selectively bred for high and low oral alcoholpreference and intake. These lines include the Indiana alcohol-preferring/non-preferring (P/NP) rats [6,42], the two replicate linesof high/low alcohol-drinking (HAD1-2/LAD1-2) rats [33,34,42], theAlko alcohol/non-alcohol (AA/ANA) rats [20,23,57], the Sardinianalcohol-preferring/non-preferring (sP/sNP) rats [15], the Universityof Chile alcohol-drinking/non-drinking (UChB/UChA) rats [37,51],
and the Warsaw high-/low-preferring (WHP/WLP) rats [18]. Therat lines listed were bred for the same phenotype, i.e. high or lowalcohol preference and consumption under the standard, home-cage, two-bottle “alcohol (10%, v/v) versus water” choice paradigmwith continuous access for 24 h a day. For all these rat lines,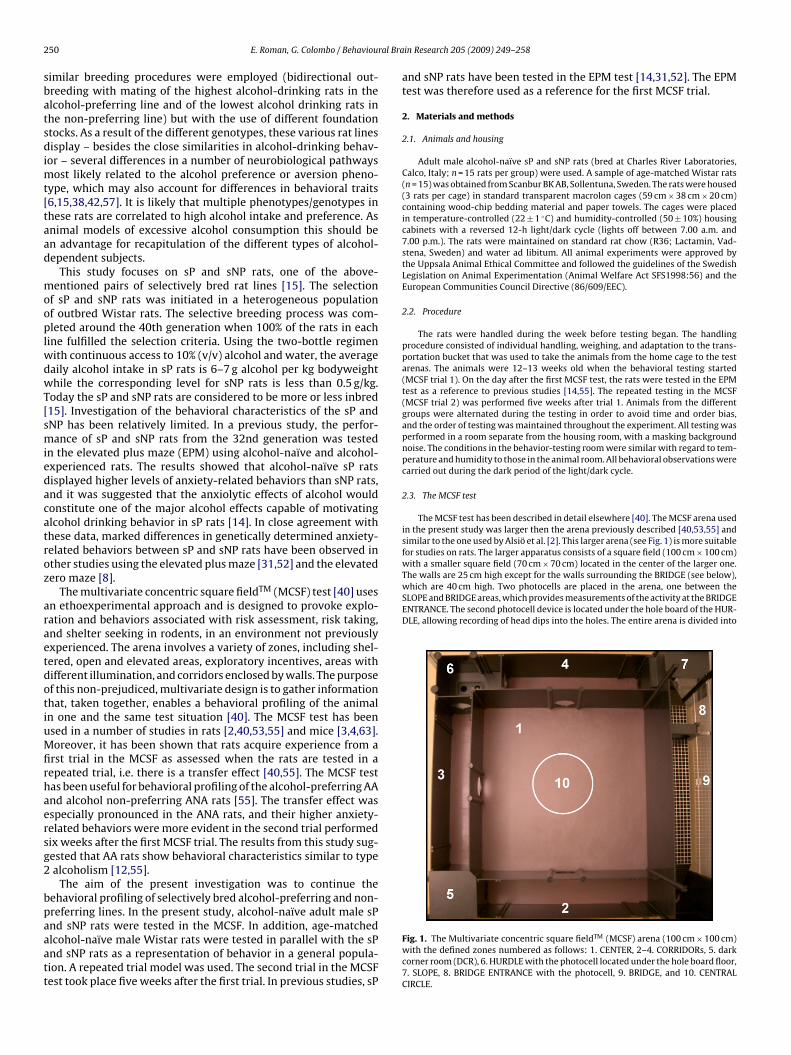
2 ral Bra
sbatsdimt[taad
mooplwdwT[smiedacatroz
araetdotiuMfirhaersg2
bpaaatt
with a smaller square field (70 cm × 70 cm) located in the center of the larger one.The walls are 25 cm high except for the walls surrounding the BRIDGE (see below),which are 40 cm high. Two photocells are placed in the arena, one between theSLOPE and BRIDGE areas, which provides measurements of the activity at the BRIDGEENTRANCE. The second photocell device is located under the hole board of the HUR-DLE, allowing recording of head dips into the holes. The entire arena is divided into
50 E. Roman, G. Colombo / Behaviou
imilar breeding procedures were employed (bidirectional out-reeding with mating of the highest alcohol-drinking rats in thelcohol-preferring line and of the lowest alcohol drinking rats inhe non-preferring line) but with the use of different foundationtocks. As a result of the different genotypes, these various rat linesisplay – besides the close similarities in alcohol-drinking behav-
or – several differences in a number of neurobiological pathwaysost likely related to the alcohol preference or aversion pheno-
ype, which may also account for differences in behavioral traits6,15,38,42,57]. It is likely that multiple phenotypes/genotypes inhese rats are correlated to high alcohol intake and preference. Asnimal models of excessive alcohol consumption this should ben advantage for recapitulation of the different types of alcohol-ependent subjects.
This study focuses on sP and sNP rats, one of the above-entioned pairs of selectively bred rat lines [15]. The selection
f sP and sNP rats was initiated in a heterogeneous populationf outbred Wistar rats. The selective breeding process was com-leted around the 40th generation when 100% of the rats in each
ine fulfilled the selection criteria. Using the two-bottle regimenith continuous access to 10% (v/v) alcohol and water, the averageaily alcohol intake in sP rats is 6–7 g alcohol per kg bodyweighthile the corresponding level for sNP rats is less than 0.5 g/kg.
oday the sP and sNP rats are considered to be more or less inbred15]. Investigation of the behavioral characteristics of the sP andNP has been relatively limited. In a previous study, the perfor-ance of sP and sNP rats from the 32nd generation was tested
n the elevated plus maze (EPM) using alcohol-naïve and alcohol-xperienced rats. The results showed that alcohol-naïve sP ratsisplayed higher levels of anxiety-related behaviors than sNP rats,nd it was suggested that the anxiolytic effects of alcohol wouldonstitute one of the major alcohol effects capable of motivatinglcohol drinking behavior in sP rats [14]. In close agreement withhese data, marked differences in genetically determined anxiety-elated behaviors between sP and sNP rats have been observed inther studies using the elevated plus maze [31,52] and the elevatedero maze [8].
The multivariate concentric square fieldTM (MCSF) test [40] usesn ethoexperimental approach and is designed to provoke explo-ation and behaviors associated with risk assessment, risk taking,nd shelter seeking in rodents, in an environment not previouslyxperienced. The arena involves a variety of zones, including shel-ered, open and elevated areas, exploratory incentives, areas withifferent illumination, and corridors enclosed by walls. The purposef this non-prejudiced, multivariate design is to gather informationhat, taken together, enables a behavioral profiling of the animaln one and the same test situation [40]. The MCSF test has beensed in a number of studies in rats [2,40,53,55] and mice [3,4,63].oreover, it has been shown that rats acquire experience from a
rst trial in the MCSF as assessed when the rats are tested in aepeated trial, i.e. there is a transfer effect [40,55]. The MCSF testas been useful for behavioral profiling of the alcohol-preferring AAnd alcohol non-preferring ANA rats [55]. The transfer effect wasspecially pronounced in the ANA rats, and their higher anxiety-elated behaviors were more evident in the second trial performedix weeks after the first MCSF trial. The results from this study sug-ested that AA rats show behavioral characteristics similar to typealcoholism [12,55].
The aim of the present investigation was to continue theehavioral profiling of selectively bred alcohol-preferring and non-referring lines. In the present study, alcohol-naïve adult male sP
nd sNP rats were tested in the MCSF. In addition, age-matchedlcohol-naïve male Wistar rats were tested in parallel with the sPnd sNP rats as a representation of behavior in a general popula-ion. A repeated trial model was used. The second trial in the MCSFest took place five weeks after the first trial. In previous studies, sPin Research 205 (2009) 249–258
and sNP rats have been tested in the EPM test [14,31,52]. The EPMtest was therefore used as a reference for the first MCSF trial.
2. Materials and methods
2.1. Animals and housing
Adult male alcohol-naïve sP and sNP rats (bred at Charles River Laboratories,Calco, Italy; n = 15 rats per group) were used. A sample of age-matched Wistar rats(n = 15) was obtained from Scanbur BK AB, Sollentuna, Sweden. The rats were housed(3 rats per cage) in standard transparent macrolon cages (59 cm × 38 cm × 20 cm)containing wood-chip bedding material and paper towels. The cages were placedin temperature-controlled (22 ± 1 ◦C) and humidity-controlled (50 ± 10%) housingcabinets with a reversed 12-h light/dark cycle (lights off between 7.00 a.m. and7.00 p.m.). The rats were maintained on standard rat chow (R36; Lactamin, Vad-stena, Sweden) and water ad libitum. All animal experiments were approved bythe Uppsala Animal Ethical Committee and followed the guidelines of the SwedishLegislation on Animal Experimentation (Animal Welfare Act SFS1998:56) and theEuropean Communities Council Directive (86/609/EEC).
2.2. Procedure
The rats were handled during the week before testing began. The handlingprocedure consisted of individual handling, weighing, and adaptation to the trans-portation bucket that was used to take the animals from the home cage to the testarenas. The animals were 12–13 weeks old when the behavioral testing started(MCSF trial 1). On the day after the first MCSF test, the rats were tested in the EPMtest as a reference to previous studies [14,55]. The repeated testing in the MCSF(MCSF trial 2) was performed five weeks after trial 1. Animals from the differentgroups were alternated during the testing in order to avoid time and order bias,and the order of testing was maintained throughout the experiment. All testing wasperformed in a room separate from the housing room, with a masking backgroundnoise. The conditions in the behavior-testing room were similar with regard to tem-perature and humidity to those in the animal room. All behavioral observations werecarried out during the dark period of the light/dark cycle.
2.3. The MCSF test
The MCSF test has been described in detail elsewhere [40]. The MCSF arena usedin the present study was larger then the arena previously described [40,53,55] andsimilar to the one used by Alsiö et al. [2]. This larger arena (see Fig. 1) is more suitablefor studies on rats. The larger apparatus consists of a square field (100 cm × 100 cm)
Fig. 1. The Multivariate concentric square fieldTM (MCSF) arena (100 cm × 100 cm)with the defined zones numbered as follows: 1. CENTER, 2–4. CORRIDORs, 5. darkcorner room (DCR), 6. HURDLE with the photocell located under the hole board floor,7. SLOPE, 8. BRIDGE ENTRANCE with the photocell, 9. BRIDGE, and 10. CENTRALCIRCLE.
ral Bra
zmftwdHcb
arhuCttTrouDoip
2
1cduoFg
2
idwSWicsvcad
2
m
auepob
MttsacAt
ut(
Cs
The results of the EPM test are shown in Table 1. sP rats madefewer visits to the center, and to the open and closed arms than sNPrats, which resulted in a lower general activity score in sP rats. Onthe closed arms, sP rats had a longer duration and longer percent-
Table 1Results of the elevated plus maze (EPM) test with adult male Sardinian alcohol-preferring (sP) and non-preferring (sNP) rats.
Parameters sNP sP
Closed armsLAT 20 ± 4 40 ± 15FRQ 14 ± 1 10 ± 1**
DUR 434 ± 15 502 ± 24**
DUR/FRQ 33 ± 3 73 ± 23***
%DUR 72 ± 3 84 ± 4**
Open armsLAT 11 ± 4 129 ± 73FRQ 7 ± 1 2 ± 0.5***
DUR 75 ± 9 68 ± 29DUR/FRQ 11 ± 1 43 ± 28%DUR 12 ± 2 5 ± 3**
OCC 14/15 7/15#
CenterFRQ 21 ± 2 11 ± 1****
DUR 97 ± 9 67 ± 15*
DUR/FRQ 5 ± 1 6 ± 1%DUR 16 ± 2 11 ± 3*
TOTACT 41 ± 3 22 ± 2****
TOT SAP 3 ± 0.5 2 ± 1OCC SAP 10/15 8/15TOT DIP 11 ± 2 4 ± 1***
GROOMING 4 ± 0.5 2 ± 0.5**
TOT REARING 22 ± 2 14 ± 2**
OCC BOLI 7/15 1/15#
OCC URINE 8/15 0/15##
Behavioral parameters recorded during a 10-min trial in the EPM test. Values repre-sent mean ± SEM. Occurrence (OCC) is shown for the zones that were not visited byall animals in each group or the behaviors that were not performed by all animals
E. Roman, G. Colombo / Behaviou
ones (Fig. 1), which forms the basis of the description and the variables of the ani-als’ performance in this test. The animal to be tested was transferred in a bucket
rom the home cage to the MCSF apparatus and released in the CENTER field facinghe wall without openings (Fig. 1). The test sessions lasted 20 min. Dimmed lightas used during the testing, except for the BRIDGE area. The approximate light con-itions (lx) in the MCSF arena were as follows: DCR: 0; CENTER, CORRIDORS andURDLE: <10; BRIDGE: 600–650. After each test, the floor was wiped with a clothontaining 10% alcohol solution and sufficient time was allowed for the floor to dryefore the next animal was placed in the arena.
The defined zones (Fig. 1) have been described in detail elsewhere [40,53,55]nd were: CENTER (#1), the center field of the arena; CORRIDORs (#2–4), the cor-idors surrounding the center field; DCR (#5), the covered room; HURDLE (#6), theigh passage to a hole board with a photocell device; SLOPE (#7), the slope leadingp to the BRIDGE; BRIDGE (#9), the elevated and illuminated bridge construction;ENTRAL CIRCLE (#10), the circular zone (Ø 22 cm) in the middle of the CENTER. Inhis study an additional zone was scored, i.e. the BRIDGE ENTRANCE (#8), which ishe area in front of the photocell and is used as an additional risk-assessment area.he numbers of stretched attend postures (SAPs) from the CORRIDORs into CENTER,earing actions, grooming actions, fecal boli, and urinations were recorded. The sumf frequencies to CORRIDORs A–C (FRQ TOTCORR) and to all zones (TOTACT) wassed for assessment of general locomotor activity. The total time spent in CORRI-ORs A–C was given the denomination DUR TOTCORR. An operational categorizationf the various parameters generated from the MCSF with regard to function is usedn the interpretation of results. The functional interpretation has been adapted fromrevious studies [3,4,53,55].
.4. The EPM test
The EPM test used has been described in detail elsewhere [53,55]. The test lasted0 min and dimmed light was used. After each rat, the EPM was wiped with a clothontaining 10% alcohol solution and sufficient time was allowed for the apparatus tory before the next animal was tested. The sum of visits to all zones (TOTACT) weresed a measure of general locomotor activity. The number of head dips from thepen end of the closed arms, the open arms, and the center (TOT DIP) was recorded.urthermore, the numbers of stretched attend postures (TOT SAP), rearing actions,rooming actions, fecal boli, and urinations were recorded.
.5. Behavioral recordings
The animals were monitored with a TV-video set-up. Recordings of DIPs (onlyn the EPM test), SAPs, rearing, grooming, fecal boli, and urinations were done byirect observation. Manual scoring of the behavior in the MCSF and the EPM testsas performed using the software Score 3.3 (Pär Nyström, Copyright Soldis, Uppsala,
weden), and the Ethovision system (version 2.3; Noldus Information Technology,ageningen, the Netherlands) was used for recording of the distance (cm) moved
n the MCSF arena (TOTARENA and CENTER). A person blind to the subject conditiononducted the behavioral scoring. Visits to the defined zones were only scored asuch if both hind legs had crossed over into that section. The latency (LAT, s) of firstisiting a zone, frequency (FRQ) of visits, and duration (DUR, s) of time spent in aertain zone, and also the number of animals visiting each zone (OCCURRENCE) werell registered. The mean duration per visit to a zone (DUR/FRQ, s) and the percentageuration were calculated.
.6. Statistical analysis
Body weight data were normally distributed and were analyzed using the para-etric t-test.
The majority of the behavioral data did not show a normal distribution andnalysis was done using non-parametric statistics. The Mann–Whitney U-test wassed for comparison of sP and sNP rats in the EPM test. When an animal did notnter a zone this was considered to be a missing value, except for the comparison ofercentage duration of visits to each zone. The Chi-square test was used for analysisf occurrence, i.e. the number of animals entering a zone or performing a certainehavior.
The performance of sP and sNP rats in the MCSF test was analyzed using theann–Whitney U-test. When an animal did not enter a zone this was considered
o be a missing value, except for the comparison of percentage duration of visitso each zone, and comparisons between trials for dependent variables. The Chi-quare test was used for analysis of occurrence, i.e. the number of animals enteringzone or performing a behavior. The Wilcoxon matched pairs test was used for
omparison of the performance in the first and the second MCSF trials. The FriedmanNOVA followed by the Wilcoxon matched pairs test was used for comparison of
otal activity over time.Differences were considered statistically significant at p ≤ 0.05. Even so, when
sing non-parametric statistics (due to the scales of measurements used) we choseo describe the average and variability in terms of mean ± standard error of the meanSEM). Statistica 8.0 (StatSoft Inc., Tulsa, OK) was used for the statistical analyses.
In addition to the comparison of sP and sNP rats in the MCSF test, a Principalomponent Analysis (PCA) [21,25] was performed in order to illustrate the relation-hip between sP, sNP, and Wistar rats. The PCA is a multivariate projection-based
in Research 205 (2009) 249–258 251
approach designed to extract and display the systemic variation in a data set. Themost important use of PCA is to obtain an overview of the data, e.g. groups ofobservations, trends and outliers, and also to uncover the relationships betweenobservations and variables, and among the variables themselves. The PCA createsa score plot showing a summary of the relationship between the individuals, anda loading plot identifying variables important for creating these relationships, i.e.parameters recorded in the MCSF. The direction of the score plot corresponds to thedirection in the loading plot. When an animal did not enter a zone, this was con-sidered to be a missing value in the PCA. SIMCA-P+ software version 12.0 (UmetricsAB, Umeå, Sweden) was used.
3. Results
There was a difference in body weight (mean ± SEM) betweenthe groups at the time of the first MCSF trial, and at the time oftrial 2 in the MCSF. In trial 1, the sP rats weighed 575 ± 13 g, whichwas significantly more (t = −4.3, p < 0.001) than for the sNP rats(491 ± 14 g). At the time of trial 2 in the MCSF, the sP rats weighed605 ± 18 g, which was significantly more (t = −2.3, p < 0.05) than forthe sNP rats (545 ± 20 g). Higher body weights have been repeat-edly observed in adult age-matched sP rats (compared to sNP rats)over the course of their selective breeding (C.N.R. Institute of Neu-roscience, Cagliari, Italy; unpublished results).
3.1. The EPM test
in each group. *p ≤ 0.05, **p < 0.01, ***p < 0.001, ****p < 0.0001 compared to sNP rats(Mann–Whitney U-test); #p ≤ 0.05, ##p < 0.01 compared to sNP rats (Chi-squaredtest).Abbreviations: DIP, head dip; DUR, duration (s); %DUR, percentage duration;DUR/FRQ, duration per visit (s); FRQ, frequency; LAT, latency (s); OCC, occurrence;SAP, stretched attend posture; TOTACT, total activity, i.e. the sum of all frequencies.
2 ral Brain Research 205 (2009) 249–258
atrrrOg
3
sSDDsDta
(DlttmsOf
aSltatEto
F2a*
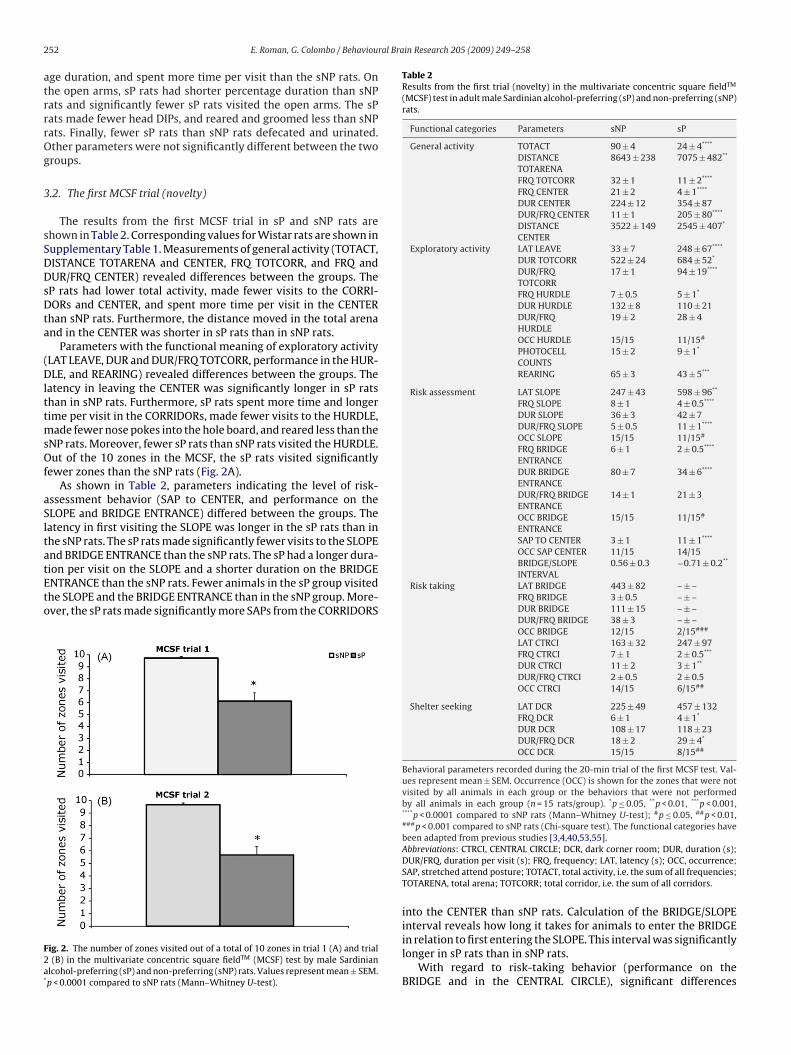
Table 2Results from the first trial (novelty) in the multivariate concentric square fieldTM
(MCSF) test in adult male Sardinian alcohol-preferring (sP) and non-preferring (sNP)rats.
Functional categories Parameters sNP sP
General activity TOTACT 90 ± 4 24 ± 4****
DISTANCETOTARENA
8643 ± 238 7075 ± 482**
FRQ TOTCORR 32 ± 1 11 ± 2****
FRQ CENTER 21 ± 2 4 ± 1****
DUR CENTER 224 ± 12 354 ± 87DUR/FRQ CENTER 11 ± 1 205 ± 80****
DISTANCECENTER
3522 ± 149 2545 ± 407*
Exploratory activity LAT LEAVE 33 ± 7 248 ± 67****
DUR TOTCORR 522 ± 24 684 ± 52*
DUR/FRQTOTCORR
17 ± 1 94 ± 19****
FRQ HURDLE 7 ± 0.5 5 ± 1*
DUR HURDLE 132 ± 8 110 ± 21DUR/FRQHURDLE
19 ± 2 28 ± 4
OCC HURDLE 15/15 11/15#
PHOTOCELLCOUNTS
15 ± 2 9 ± 1*
REARING 65 ± 3 43 ± 5***
Risk assessment LAT SLOPE 247 ± 43 598 ± 96**
FRQ SLOPE 8 ± 1 4 ± 0.5****
DUR SLOPE 36 ± 3 42 ± 7DUR/FRQ SLOPE 5 ± 0.5 11 ± 1****
OCC SLOPE 15/15 11/15#
FRQ BRIDGEENTRANCE
6 ± 1 2 ± 0.5****
DUR BRIDGEENTRANCE
80 ± 7 34 ± 6****
DUR/FRQ BRIDGEENTRANCE
14 ± 1 21 ± 3
OCC BRIDGEENTRANCE
15/15 11/15#
SAP TO CENTER 3 ± 1 11 ± 1****
OCC SAP CENTER 11/15 14/15
52 E. Roman, G. Colombo / Behaviou
ge duration, and spent more time per visit than the sNP rats. Onhe open arms, sP rats had shorter percentage duration than sNPats and significantly fewer sP rats visited the open arms. The sPats made fewer head DIPs, and reared and groomed less than sNPats. Finally, fewer sP rats than sNP rats defecated and urinated.ther parameters were not significantly different between the tworoups.
.2. The first MCSF trial (novelty)
The results from the first MCSF trial in sP and sNP rats arehown in Table 2. Corresponding values for Wistar rats are shown inupplementary Table 1. Measurements of general activity (TOTACT,ISTANCE TOTARENA and CENTER, FRQ TOTCORR, and FRQ andUR/FRQ CENTER) revealed differences between the groups. The
P rats had lower total activity, made fewer visits to the CORRI-ORs and CENTER, and spent more time per visit in the CENTER
han sNP rats. Furthermore, the distance moved in the total arenand in the CENTER was shorter in sP rats than in sNP rats.
Parameters with the functional meaning of exploratory activityLAT LEAVE, DUR and DUR/FRQ TOTCORR, performance in the HUR-LE, and REARING) revealed differences between the groups. The
atency in leaving the CENTER was significantly longer in sP ratshan in sNP rats. Furthermore, sP rats spent more time and longerime per visit in the CORRIDORs, made fewer visits to the HURDLE,
ade fewer nose pokes into the hole board, and reared less than theNP rats. Moreover, fewer sP rats than sNP rats visited the HURDLE.ut of the 10 zones in the MCSF, the sP rats visited significantly
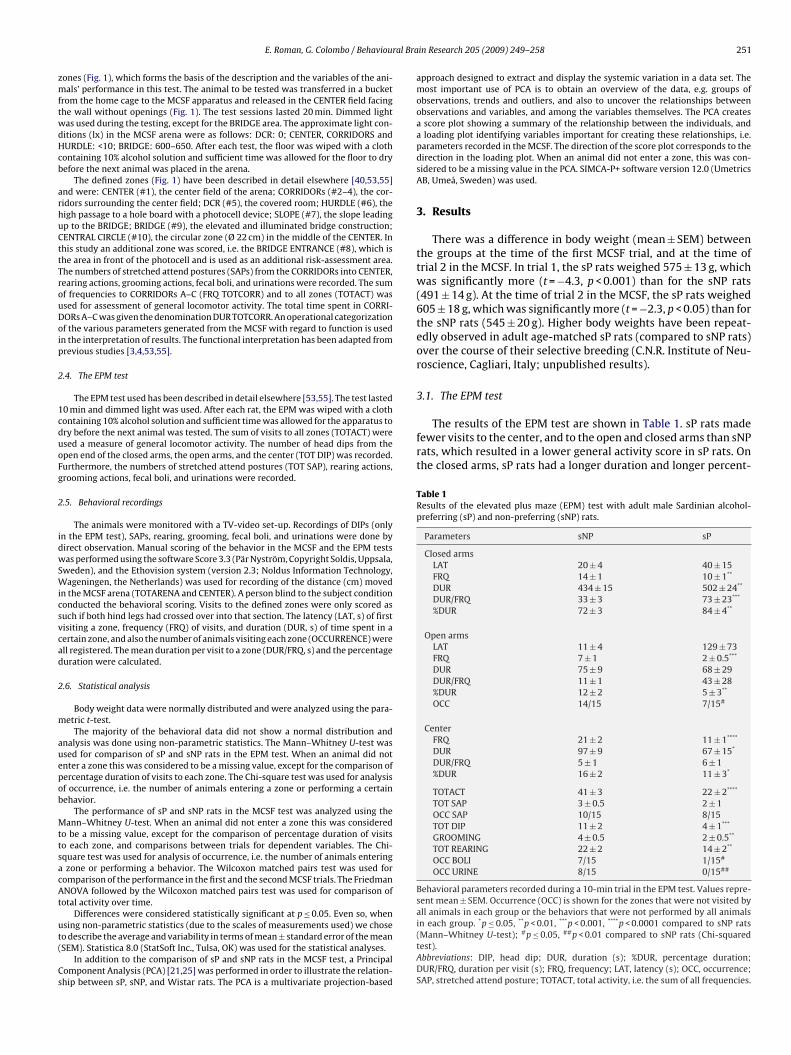
ewer zones than the sNP rats (Fig. 2A).As shown in Table 2, parameters indicating the level of risk-
ssessment behavior (SAP to CENTER, and performance on theLOPE and BRIDGE ENTRANCE) differed between the groups. Theatency in first visiting the SLOPE was longer in the sP rats than inhe sNP rats. The sP rats made significantly fewer visits to the SLOPEnd BRIDGE ENTRANCE than the sNP rats. The sP had a longer dura-
ion per visit on the SLOPE and a shorter duration on the BRIDGENTRANCE than the sNP rats. Fewer animals in the sP group visitedhe SLOPE and the BRIDGE ENTRANCE than in the sNP group. More-ver, the sP rats made significantly more SAPs from the CORRIDORSig. 2. The number of zones visited out of a total of 10 zones in trial 1 (A) and trial(B) in the multivariate concentric square fieldTM (MCSF) test by male Sardinian
lcohol-preferring (sP) and non-preferring (sNP) rats. Values represent mean ± SEM.p < 0.0001 compared to sNP rats (Mann–Whitney U-test).
BRIDGE/SLOPEINTERVAL
0.56 ± 0.3 −0.71 ± 0.2**
Risk taking LAT BRIDGE 443 ± 82 – ± –FRQ BRIDGE 3 ± 0.5 – ± –DUR BRIDGE 111 ± 15 – ± –DUR/FRQ BRIDGE 38 ± 3 – ± –OCC BRIDGE 12/15 2/15###
LAT CTRCI 163 ± 32 247 ± 97FRQ CTRCI 7 ± 1 2 ± 0.5***
DUR CTRCI 11 ± 2 3 ± 1**
DUR/FRQ CTRCI 2 ± 0.5 2 ± 0.5OCC CTRCI 14/15 6/15##
Shelter seeking LAT DCR 225 ± 49 457 ± 132FRQ DCR 6 ± 1 4 ± 1*
DUR DCR 108 ± 17 118 ± 23DUR/FRQ DCR 18 ± 2 29 ± 4*
OCC DCR 15/15 8/15##
Behavioral parameters recorded during the 20-min trial of the first MCSF test. Val-ues represent mean ± SEM. Occurrence (OCC) is shown for the zones that were notvisited by all animals in each group or the behaviors that were not performedby all animals in each group (n = 15 rats/group). *p ≤ 0.05, **p < 0.01, ***p < 0.001,****p < 0.0001 compared to sNP rats (Mann–Whitney U-test); #p ≤ 0.05, ##p < 0.01,###p < 0.001 compared to sNP rats (Chi-square test). The functional categories havebeen adapted from previous studies [3,4,40,53,55].
Abbreviations: CTRCI, CENTRAL CIRCLE; DCR, dark corner room; DUR, duration (s);DUR/FRQ, duration per visit (s); FRQ, frequency; LAT, latency (s); OCC, occurrence;SAP, stretched attend posture; TOTACT, total activity, i.e. the sum of all frequencies;TOTARENA, total arena; TOTCORR; total corridor, i.e. the sum of all corridors.into the CENTER than sNP rats. Calculation of the BRIDGE/SLOPE
interval reveals how long it takes for animals to enter the BRIDGEin relation to first entering the SLOPE. This interval was significantlylonger in sP rats than in sNP rats.With regard to risk-taking behavior (performance on theBRIDGE and in the CENTRAL CIRCLE), significant differences
E. Roman, G. Colombo / Behavioural Brain Research 205 (2009) 249–258 253
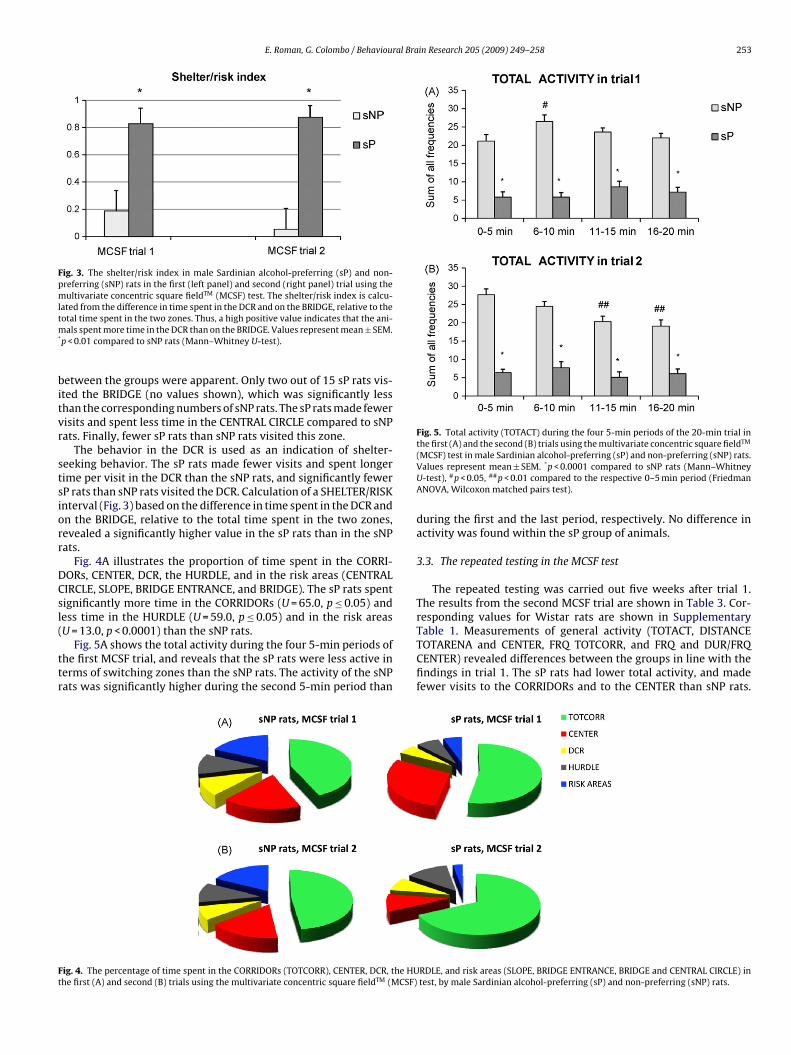
Fig. 3. The shelter/risk index in male Sardinian alcohol-preferring (sP) and non-preferring (sNP) rats in the first (left panel) and second (right panel) trial using themultivariate concentric square fieldTM (MCSF) test. The shelter/risk index is calcu-lated from the difference in time spent in the DCR and on the BRIDGE, relative to thetm*
bitvr
stsiorr
DCsl(
ttr
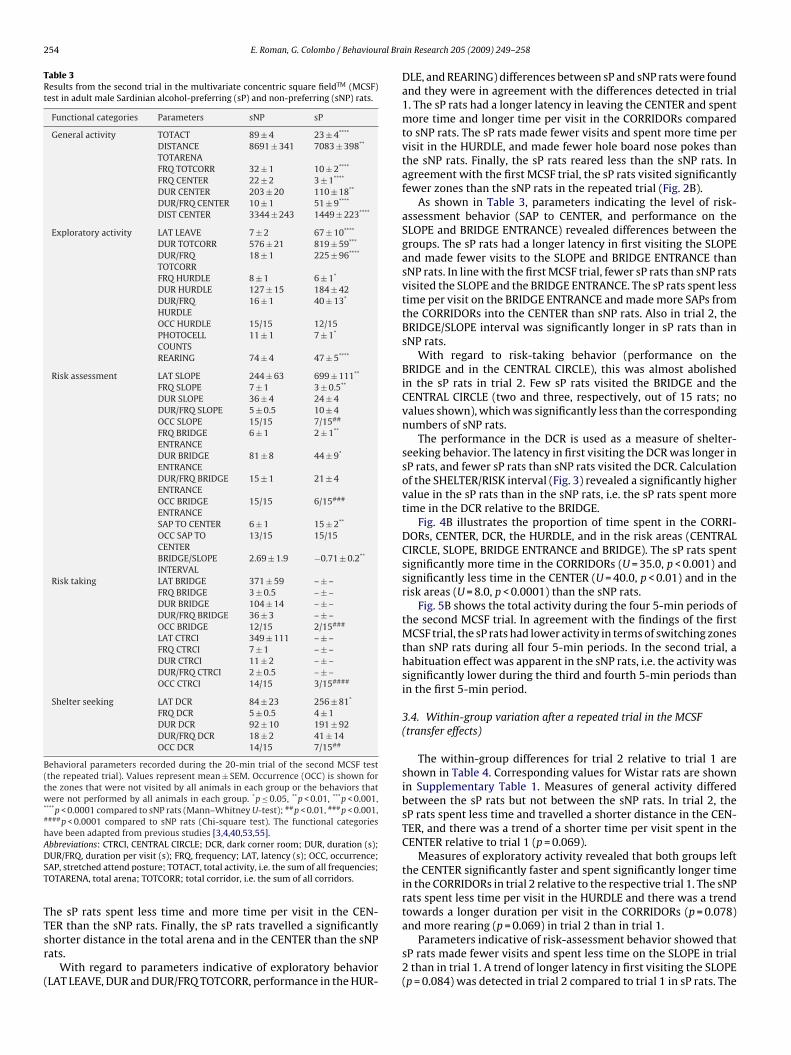
Fig. 5. Total activity (TOTACT) during the four 5-min periods of the 20-min trial inthe first (A) and the second (B) trials using the multivariate concentric square fieldTM
Table 1. Measurements of general activity (TOTACT, DISTANCE
Ft
otal time spent in the two zones. Thus, a high positive value indicates that the ani-als spent more time in the DCR than on the BRIDGE. Values represent mean ± SEM.
p < 0.01 compared to sNP rats (Mann–Whitney U-test).
etween the groups were apparent. Only two out of 15 sP rats vis-ted the BRIDGE (no values shown), which was significantly lesshan the corresponding numbers of sNP rats. The sP rats made fewerisits and spent less time in the CENTRAL CIRCLE compared to sNPats. Finally, fewer sP rats than sNP rats visited this zone.
The behavior in the DCR is used as an indication of shelter-eeking behavior. The sP rats made fewer visits and spent longerime per visit in the DCR than the sNP rats, and significantly fewerP rats than sNP rats visited the DCR. Calculation of a SHELTER/RISKnterval (Fig. 3) based on the difference in time spent in the DCR andn the BRIDGE, relative to the total time spent in the two zones,evealed a significantly higher value in the sP rats than in the sNPats.
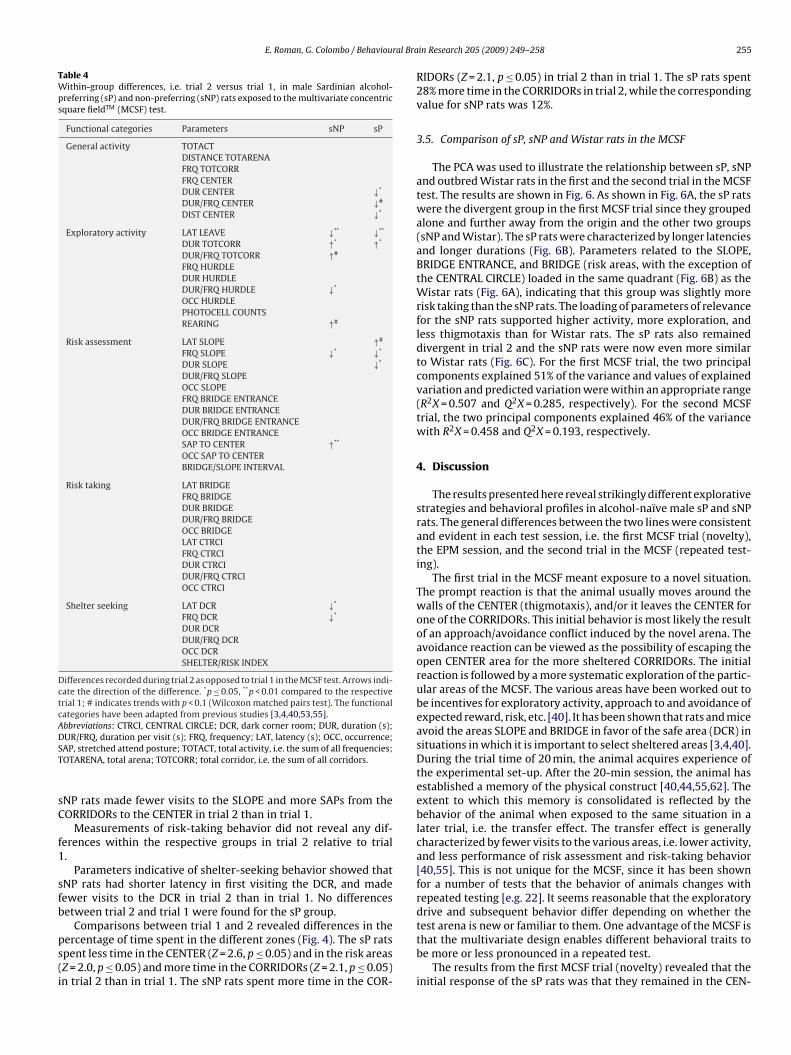
Fig. 4A illustrates the proportion of time spent in the CORRI-ORs, CENTER, DCR, the HURDLE, and in the risk areas (CENTRALIRCLE, SLOPE, BRIDGE ENTRANCE, and BRIDGE). The sP rats spentignificantly more time in the CORRIDORs (U = 65.0, p ≤ 0.05) andess time in the HURDLE (U = 59.0, p ≤ 0.05) and in the risk areasU = 13.0, p < 0.0001) than the sNP rats.
Fig. 5A shows the total activity during the four 5-min periods ofhe first MCSF trial, and reveals that the sP rats were less active inerms of switching zones than the sNP rats. The activity of the sNPats was significantly higher during the second 5-min period than
ig. 4. The percentage of time spent in the CORRIDORs (TOTCORR), CENTER, DCR, the HUhe first (A) and second (B) trials using the multivariate concentric square fieldTM (MCSF)
(MCSF) test in male Sardinian alcohol-preferring (sP) and non-preferring (sNP) rats.Values represent mean ± SEM. *p < 0.0001 compared to sNP rats (Mann–WhitneyU-test), #p < 0.05, ##p < 0.01 compared to the respective 0–5 min period (FriedmanANOVA, Wilcoxon matched pairs test).
during the first and the last period, respectively. No difference inactivity was found within the sP group of animals.
3.3. The repeated testing in the MCSF test
The repeated testing was carried out five weeks after trial 1.The results from the second MCSF trial are shown in Table 3. Cor-responding values for Wistar rats are shown in Supplementary
TOTARENA and CENTER, FRQ TOTCORR, and FRQ and DUR/FRQCENTER) revealed differences between the groups in line with thefindings in trial 1. The sP rats had lower total activity, and madefewer visits to the CORRIDORs and to the CENTER than sNP rats.
RDLE, and risk areas (SLOPE, BRIDGE ENTRANCE, BRIDGE and CENTRAL CIRCLE) intest, by male Sardinian alcohol-preferring (sP) and non-preferring (sNP) rats.
254 E. Roman, G. Colombo / Behavioural Bra
Table 3Results from the second trial in the multivariate concentric square fieldTM (MCSF)test in adult male Sardinian alcohol-preferring (sP) and non-preferring (sNP) rats.
Functional categories Parameters sNP sP
General activity TOTACT 89 ± 4 23 ± 4****
DISTANCETOTARENA
8691 ± 341 7083 ± 398**
FRQ TOTCORR 32 ± 1 10 ± 2****
FRQ CENTER 22 ± 2 3 ± 1****
DUR CENTER 203 ± 20 110 ± 18**
DUR/FRQ CENTER 10 ± 1 51 ± 9****
DIST CENTER 3344 ± 243 1449 ± 223****
Exploratory activity LAT LEAVE 7 ± 2 67 ± 10****
DUR TOTCORR 576 ± 21 819 ± 59***
DUR/FRQTOTCORR
18 ± 1 225 ± 96****
FRQ HURDLE 8 ± 1 6 ± 1*
DUR HURDLE 127 ± 15 184 ± 42DUR/FRQHURDLE
16 ± 1 40 ± 13*
OCC HURDLE 15/15 12/15PHOTOCELLCOUNTS
11 ± 1 7 ± 1*
REARING 74 ± 4 47 ± 5****
Risk assessment LAT SLOPE 244 ± 63 699 ± 111**
FRQ SLOPE 7 ± 1 3 ± 0.5**
DUR SLOPE 36 ± 4 24 ± 4DUR/FRQ SLOPE 5 ± 0.5 10 ± 4OCC SLOPE 15/15 7/15##
FRQ BRIDGEENTRANCE
6 ± 1 2 ± 1**
DUR BRIDGEENTRANCE
81 ± 8 44 ± 9*
DUR/FRQ BRIDGEENTRANCE
15 ± 1 21 ± 4
OCC BRIDGEENTRANCE
15/15 6/15###
SAP TO CENTER 6 ± 1 15 ± 2**
OCC SAP TOCENTER
13/15 15/15
BRIDGE/SLOPEINTERVAL
2.69 ± 1.9 −0.71 ± 0.2**
Risk taking LAT BRIDGE 371 ± 59 – ± –FRQ BRIDGE 3 ± 0.5 – ± –DUR BRIDGE 104 ± 14 – ± –DUR/FRQ BRIDGE 36 ± 3 – ± –OCC BRIDGE 12/15 2/15###
LAT CTRCI 349 ± 111 – ± –FRQ CTRCI 7 ± 1 – ± –DUR CTRCI 11 ± 2 – ± –DUR/FRQ CTRCI 2 ± 0.5 – ± –OCC CTRCI 14/15 3/15####
Shelter seeking LAT DCR 84 ± 23 256 ± 81*
FRQ DCR 5 ± 0.5 4 ± 1DUR DCR 92 ± 10 191 ± 92DUR/FRQ DCR 18 ± 2 41 ± 14OCC DCR 14/15 7/15##
Behavioral parameters recorded during the 20-min trial of the second MCSF test(the repeated trial). Values represent mean ± SEM. Occurrence (OCC) is shown forthe zones that were not visited by all animals in each group or the behaviors thatwere not performed by all animals in each group. *p ≤ 0.05, **p < 0.01, ***p < 0.001,****p < 0.0001 compared to sNP rats (Mann–Whitney U-test); ##p < 0.01, ###p < 0.001,####p < 0.0001 compared to sNP rats (Chi-square test). The functional categorieshave been adapted from previous studies [3,4,40,53,55].ADST
TTsr
(
bbreviations: CTRCI, CENTRAL CIRCLE; DCR, dark corner room; DUR, duration (s);UR/FRQ, duration per visit (s); FRQ, frequency; LAT, latency (s); OCC, occurrence;AP, stretched attend posture; TOTACT, total activity, i.e. the sum of all frequencies;OTARENA, total arena; TOTCORR; total corridor, i.e. the sum of all corridors.
he sP rats spent less time and more time per visit in the CEN-
ER than the sNP rats. Finally, the sP rats travelled a significantlyhorter distance in the total arena and in the CENTER than the sNPats.With regard to parameters indicative of exploratory behaviorLAT LEAVE, DUR and DUR/FRQ TOTCORR, performance in the HUR-
in Research 205 (2009) 249–258
DLE, and REARING) differences between sP and sNP rats were foundand they were in agreement with the differences detected in trial1. The sP rats had a longer latency in leaving the CENTER and spentmore time and longer time per visit in the CORRIDORs comparedto sNP rats. The sP rats made fewer visits and spent more time pervisit in the HURDLE, and made fewer hole board nose pokes thanthe sNP rats. Finally, the sP rats reared less than the sNP rats. Inagreement with the first MCSF trial, the sP rats visited significantlyfewer zones than the sNP rats in the repeated trial (Fig. 2B).
As shown in Table 3, parameters indicating the level of risk-assessment behavior (SAP to CENTER, and performance on theSLOPE and BRIDGE ENTRANCE) revealed differences between thegroups. The sP rats had a longer latency in first visiting the SLOPEand made fewer visits to the SLOPE and BRIDGE ENTRANCE thansNP rats. In line with the first MCSF trial, fewer sP rats than sNP ratsvisited the SLOPE and the BRIDGE ENTRANCE. The sP rats spent lesstime per visit on the BRIDGE ENTRANCE and made more SAPs fromthe CORRIDORs into the CENTER than sNP rats. Also in trial 2, theBRIDGE/SLOPE interval was significantly longer in sP rats than insNP rats.
With regard to risk-taking behavior (performance on theBRIDGE and in the CENTRAL CIRCLE), this was almost abolishedin the sP rats in trial 2. Few sP rats visited the BRIDGE and theCENTRAL CIRCLE (two and three, respectively, out of 15 rats; novalues shown), which was significantly less than the correspondingnumbers of sNP rats.
The performance in the DCR is used as a measure of shelter-seeking behavior. The latency in first visiting the DCR was longer insP rats, and fewer sP rats than sNP rats visited the DCR. Calculationof the SHELTER/RISK interval (Fig. 3) revealed a significantly highervalue in the sP rats than in the sNP rats, i.e. the sP rats spent moretime in the DCR relative to the BRIDGE.
Fig. 4B illustrates the proportion of time spent in the CORRI-DORs, CENTER, DCR, the HURDLE, and in the risk areas (CENTRALCIRCLE, SLOPE, BRIDGE ENTRANCE and BRIDGE). The sP rats spentsignificantly more time in the CORRIDORs (U = 35.0, p < 0.001) andsignificantly less time in the CENTER (U = 40.0, p < 0.01) and in therisk areas (U = 8.0, p < 0.0001) than the sNP rats.
Fig. 5B shows the total activity during the four 5-min periods ofthe second MCSF trial. In agreement with the findings of the firstMCSF trial, the sP rats had lower activity in terms of switching zonesthan sNP rats during all four 5-min periods. In the second trial, ahabituation effect was apparent in the sNP rats, i.e. the activity wassignificantly lower during the third and fourth 5-min periods thanin the first 5-min period.
3.4. Within-group variation after a repeated trial in the MCSF(transfer effects)
The within-group differences for trial 2 relative to trial 1 areshown in Table 4. Corresponding values for Wistar rats are shownin Supplementary Table 1. Measures of general activity differedbetween the sP rats but not between the sNP rats. In trial 2, thesP rats spent less time and travelled a shorter distance in the CEN-TER, and there was a trend of a shorter time per visit spent in theCENTER relative to trial 1 (p = 0.069).
Measures of exploratory activity revealed that both groups leftthe CENTER significantly faster and spent significantly longer timein the CORRIDORs in trial 2 relative to the respective trial 1. The sNPrats spent less time per visit in the HURDLE and there was a trendtowards a longer duration per visit in the CORRIDORs (p = 0.078)
and more rearing (p = 0.069) in trial 2 than in trial 1.Parameters indicative of risk-assessment behavior showed thatsP rats made fewer visits and spent less time on the SLOPE in trial2 than in trial 1. A trend of longer latency in first visiting the SLOPE(p = 0.084) was detected in trial 2 compared to trial 1 in sP rats. The
E. Roman, G. Colombo / Behavioural Bra
Table 4Within-group differences, i.e. trial 2 versus trial 1, in male Sardinian alcohol-preferring (sP) and non-preferring (sNP) rats exposed to the multivariate concentricsquare fieldTM (MCSF) test.
Functional categories Parameters sNP sP
General activity TOTACTDISTANCE TOTARENAFRQ TOTCORRFRQ CENTERDUR CENTER ↓*
DUR/FRQ CENTER ↓#
DIST CENTER ↓*
Exploratory activity LAT LEAVE ↓** ↓**
DUR TOTCORR ↑* ↑*
DUR/FRQ TOTCORR ↑#
FRQ HURDLEDUR HURDLEDUR/FRQ HURDLE ↓*
OCC HURDLEPHOTOCELL COUNTSREARING ↑#
Risk assessment LAT SLOPE ↑#
FRQ SLOPE ↓* ↓*
DUR SLOPE ↓*
DUR/FRQ SLOPEOCC SLOPEFRQ BRIDGE ENTRANCEDUR BRIDGE ENTRANCEDUR/FRQ BRIDGE ENTRANCEOCC BRIDGE ENTRANCESAP TO CENTER ↑**
OCC SAP TO CENTERBRIDGE/SLOPE INTERVAL
Risk taking LAT BRIDGEFRQ BRIDGEDUR BRIDGEDUR/FRQ BRIDGEOCC BRIDGELAT CTRCIFRQ CTRCIDUR CTRCIDUR/FRQ CTRCIOCC CTRCI
Shelter seeking LAT DCR ↓*
FRQ DCR ↓*
DUR DCRDUR/FRQ DCROCC DCRSHELTER/RISK INDEX
Differences recorded during trial 2 as opposed to trial 1 in the MCSF test. Arrows indi-cate the direction of the difference. *p ≤ 0.05, **p < 0.01 compared to the respectivetrial 1; # indicates trends with p < 0.1 (Wilcoxon matched pairs test). The functionalcategories have been adapted from previous studies [3,4,40,53,55].Abbreviations: CTRCI, CENTRAL CIRCLE; DCR, dark corner room; DUR, duration (s);DST
sC
f1
sfb
ps(i
test arena is new or familiar to them. One advantage of the MCSF is
UR/FRQ, duration per visit (s); FRQ, frequency; LAT, latency (s); OCC, occurrence;AP, stretched attend posture; TOTACT, total activity, i.e. the sum of all frequencies;OTARENA, total arena; TOTCORR; total corridor, i.e. the sum of all corridors.
NP rats made fewer visits to the SLOPE and more SAPs from theORRIDORs to the CENTER in trial 2 than in trial 1.
Measurements of risk-taking behavior did not reveal any dif-erences within the respective groups in trial 2 relative to trial.
Parameters indicative of shelter-seeking behavior showed thatNP rats had shorter latency in first visiting the DCR, and madeewer visits to the DCR in trial 2 than in trial 1. No differencesetween trial 2 and trial 1 were found for the sP group.
Comparisons between trial 1 and 2 revealed differences in the
ercentage of time spent in the different zones (Fig. 4). The sP ratspent less time in the CENTER (Z = 2.6, p ≤ 0.05) and in the risk areasZ = 2.0, p ≤ 0.05) and more time in the CORRIDORs (Z = 2.1, p ≤ 0.05)n trial 2 than in trial 1. The sNP rats spent more time in the COR-in Research 205 (2009) 249–258 255
RIDORs (Z = 2.1, p ≤ 0.05) in trial 2 than in trial 1. The sP rats spent28% more time in the CORRIDORs in trial 2, while the correspondingvalue for sNP rats was 12%.
3.5. Comparison of sP, sNP and Wistar rats in the MCSF
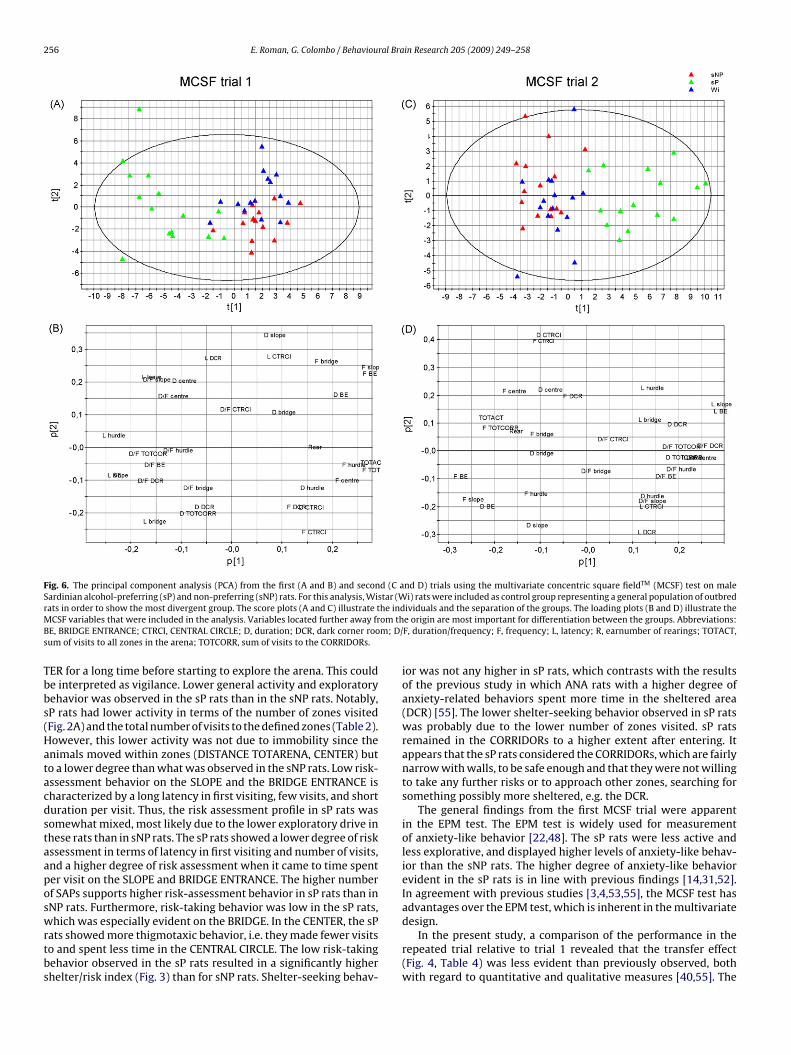
The PCA was used to illustrate the relationship between sP, sNPand outbred Wistar rats in the first and the second trial in the MCSFtest. The results are shown in Fig. 6. As shown in Fig. 6A, the sP ratswere the divergent group in the first MCSF trial since they groupedalone and further away from the origin and the other two groups(sNP and Wistar). The sP rats were characterized by longer latenciesand longer durations (Fig. 6B). Parameters related to the SLOPE,BRIDGE ENTRANCE, and BRIDGE (risk areas, with the exception ofthe CENTRAL CIRCLE) loaded in the same quadrant (Fig. 6B) as theWistar rats (Fig. 6A), indicating that this group was slightly morerisk taking than the sNP rats. The loading of parameters of relevancefor the sNP rats supported higher activity, more exploration, andless thigmotaxis than for Wistar rats. The sP rats also remaineddivergent in trial 2 and the sNP rats were now even more similarto Wistar rats (Fig. 6C). For the first MCSF trial, the two principalcomponents explained 51% of the variance and values of explainedvariation and predicted variation were within an appropriate range(R2X = 0.507 and Q2X = 0.285, respectively). For the second MCSFtrial, the two principal components explained 46% of the variancewith R2X = 0.458 and Q2X = 0.193, respectively.
4. Discussion
The results presented here reveal strikingly different explorativestrategies and behavioral profiles in alcohol-naïve male sP and sNPrats. The general differences between the two lines were consistentand evident in each test session, i.e. the first MCSF trial (novelty),the EPM session, and the second trial in the MCSF (repeated test-ing).
The first trial in the MCSF meant exposure to a novel situation.The prompt reaction is that the animal usually moves around thewalls of the CENTER (thigmotaxis), and/or it leaves the CENTER forone of the CORRIDORs. This initial behavior is most likely the resultof an approach/avoidance conflict induced by the novel arena. Theavoidance reaction can be viewed as the possibility of escaping theopen CENTER area for the more sheltered CORRIDORs. The initialreaction is followed by a more systematic exploration of the partic-ular areas of the MCSF. The various areas have been worked out tobe incentives for exploratory activity, approach to and avoidance ofexpected reward, risk, etc. [40]. It has been shown that rats and miceavoid the areas SLOPE and BRIDGE in favor of the safe area (DCR) insituations in which it is important to select sheltered areas [3,4,40].During the trial time of 20 min, the animal acquires experience ofthe experimental set-up. After the 20-min session, the animal hasestablished a memory of the physical construct [40,44,55,62]. Theextent to which this memory is consolidated is reflected by thebehavior of the animal when exposed to the same situation in alater trial, i.e. the transfer effect. The transfer effect is generallycharacterized by fewer visits to the various areas, i.e. lower activity,and less performance of risk assessment and risk-taking behavior[40,55]. This is not unique for the MCSF, since it has been shownfor a number of tests that the behavior of animals changes withrepeated testing [e.g. 22]. It seems reasonable that the exploratorydrive and subsequent behavior differ depending on whether the
that the multivariate design enables different behavioral traits tobe more or less pronounced in a repeated test.
The results from the first MCSF trial (novelty) revealed that theinitial response of the sP rats was that they remained in the CEN-
256 E. Roman, G. Colombo / Behavioural Brain Research 205 (2009) 249–258
Fig. 6. The principal component analysis (PCA) from the first (A and B) and second (C and D) trials using the multivariate concentric square fieldTM (MCSF) test on maleSardinian alcohol-preferring (sP) and non-preferring (sNP) rats. For this analysis, Wistar (Wi) rats were included as control group representing a general population of outbredr he indM om thB m; D/s
Tbbs(Hatacdstaaposwrtbs
ats in order to show the most divergent group. The score plots (A and C) illustrate tCSF variables that were included in the analysis. Variables located further away fr
E, BRIDGE ENTRANCE; CTRCI, CENTRAL CIRCLE; D, duration; DCR, dark corner rooum of visits to all zones in the arena; TOTCORR, sum of visits to the CORRIDORs.
ER for a long time before starting to explore the arena. This coulde interpreted as vigilance. Lower general activity and exploratoryehavior was observed in the sP rats than in the sNP rats. Notably,P rats had lower activity in terms of the number of zones visitedFig. 2A) and the total number of visits to the defined zones (Table 2).owever, this lower activity was not due to immobility since thenimals moved within zones (DISTANCE TOTARENA, CENTER) buto a lower degree than what was observed in the sNP rats. Low risk-ssessment behavior on the SLOPE and the BRIDGE ENTRANCE isharacterized by a long latency in first visiting, few visits, and shorturation per visit. Thus, the risk assessment profile in sP rats wasomewhat mixed, most likely due to the lower exploratory drive inhese rats than in sNP rats. The sP rats showed a lower degree of riskssessment in terms of latency in first visiting and number of visits,nd a higher degree of risk assessment when it came to time spenter visit on the SLOPE and BRIDGE ENTRANCE. The higher numberf SAPs supports higher risk-assessment behavior in sP rats than inNP rats. Furthermore, risk-taking behavior was low in the sP rats,
hich was especially evident on the BRIDGE. In the CENTER, the sPats showed more thigmotaxic behavior, i.e. they made fewer visitso and spent less time in the CENTRAL CIRCLE. The low risk-takingehavior observed in the sP rats resulted in a significantly higherhelter/risk index (Fig. 3) than for sNP rats. Shelter-seeking behav-
ividuals and the separation of the groups. The loading plots (B and D) illustrate thee origin are most important for differentiation between the groups. Abbreviations:F, duration/frequency; F, frequency; L, latency; R, earnumber of rearings; TOTACT,
ior was not any higher in sP rats, which contrasts with the resultsof the previous study in which ANA rats with a higher degree ofanxiety-related behaviors spent more time in the sheltered area(DCR) [55]. The lower shelter-seeking behavior observed in sP ratswas probably due to the lower number of zones visited. sP ratsremained in the CORRIDORs to a higher extent after entering. Itappears that the sP rats considered the CORRIDORs, which are fairlynarrow with walls, to be safe enough and that they were not willingto take any further risks or to approach other zones, searching forsomething possibly more sheltered, e.g. the DCR.
The general findings from the first MCSF trial were apparentin the EPM test. The EPM test is widely used for measurementof anxiety-like behavior [22,48]. The sP rats were less active andless explorative, and displayed higher levels of anxiety-like behav-ior than the sNP rats. The higher degree of anxiety-like behaviorevident in the sP rats is in line with previous findings [14,31,52].In agreement with previous studies [3,4,53,55], the MCSF test hasadvantages over the EPM test, which is inherent in the multivariate
design.In the present study, a comparison of the performance in therepeated trial relative to trial 1 revealed that the transfer effect(Fig. 4, Table 4) was less evident than previously observed, bothwith regard to quantitative and qualitative measures [40,55]. The
ral Bra
strttItefsslmatrrno
telactaip
BiwgtwoaiaWi
dAsiTiaahtvubidarbaaria
E. Roman, G. Colombo / Behaviou
P rats left the CENTER faster than in trial 1 and spent most of theirime in the CORRIDORs. In previous studies, general activity andisk-taking behavior has been observed to decrease in the secondrial relative to the first [40,55]. In contrast, no difference in risk-aking behavior was observed in sNP rats in trial 2 relative to trial 1.n the second trial (Table 3) the behavior of the sP rats, as comparedo sNP rats, was generally similar to that observed in trial 1, with thexception that risk taking behavior was almost abolished with veryew sP rats visiting the risk areas. This is in line with the previoustudy in which risk-taking behavior was almost abolished in theecond trial in ANA rats [55]. Thus, the more vigilant and anxiety-ike profile of sP rats (present study) and ANA rats [55] was even
ore evident in the second trial. It has previously been shown thatctivity generally declines over time, especially when comparinghe first 5-min period with the last 5-min period [40,55]. For the sPats, the activity remained low both in trial 1 and trial 2. sNP ratsemained active during the first trial and a habituation effect wasot evident until in trial 2 (Fig. 5B), which is in line with previousbservations [55].
Taken together, the results from the current investigation revealhat the behavioral profile of sP rats is characterized by low gen-ral activity, low exploratory drive, high risk assessment and veryow risk-taking behavior, which contrasts with the behavior of theirlcohol non-preferring counterparts, the sNP rats. The behavioralharacteristics of the sP rats were even more evident in the repeatedrial. The low level of exploration and the behavior in areas associ-ted with risk and shelter of the sP rats is interpreted here as highnnate anxiety-related behaviors, which gives further support torevious findings [reviewed in 15].
The results showed marked differences between sP and sNP rats.y the inclusion of Wistar rats in the “sP versus sNP” comparison,
t was possible to tell which of the two selectively bred rat linesas the most divergent. The Wistar rats can be viewed as a control
roup representing a general population of outbred rats; further,he foundation stock from which sP and sNP rats have been derivedas made of Wistar rats. The PCA is useful in obtaining an overview
f the multivariate data, for instance groups of observations, trendsnd outliers. As shown in Fig. 6, the sP rats were the divergent groupn both the first and the second MCSF trials since they grouped alonend further away from the origin and the other two groups (sNP andistar). The sNP rats were more similar to Wistar rats, especially
n the second MCSF trial.Clinical studies have indicated a relationship between anxiety
isorders and increased alcohol consumption [e.g. 11,39,41,50].ccording to the classification of subgroups of alcohol-dependentubjects, some individuals are characterized by personality traitsncluding a high degree of anxiety and harm avoidance [5,12,32,41].he tension-reduction hypothesis for excessive alcohol drinkings based on the assumption that individuals with basal innatenxiety or stress are more sensitive to the anxiolytic effects oflcohol and therefore show a higher predisposition for high alco-ol consumption [10,49,50]. In animal experimental research,he relationship between high anxiety-related behaviors and ele-ated alcohol intake is more controversial. It has been found thatnselected animals classified as “anxious” on the basis of theirehavior when exposed to the EPM also showed higher alcohol
ntake and preference [58], while other workers have failed toemonstrate such a relationship [30]. With regard to studies inlcohol-preferring and non-preferring rats, the alcohol-preferring Pats have repeatedly been found to exhibit higher anxiety-relatedehaviors than the alcohol non-preferring NP rats [24,47,61] and
n anxiolytic effect of voluntarily consumed [47] or injected [61]lcohol was detected in the P rats. As mentioned above, similaresults have been obtained in the sP and sNP rats [14]. In addition,t has been shown that voluntarily consumed [13] or injected [1]lcohol could increase general locomotor activity in sP rats, whichin Research 205 (2009) 249–258 257
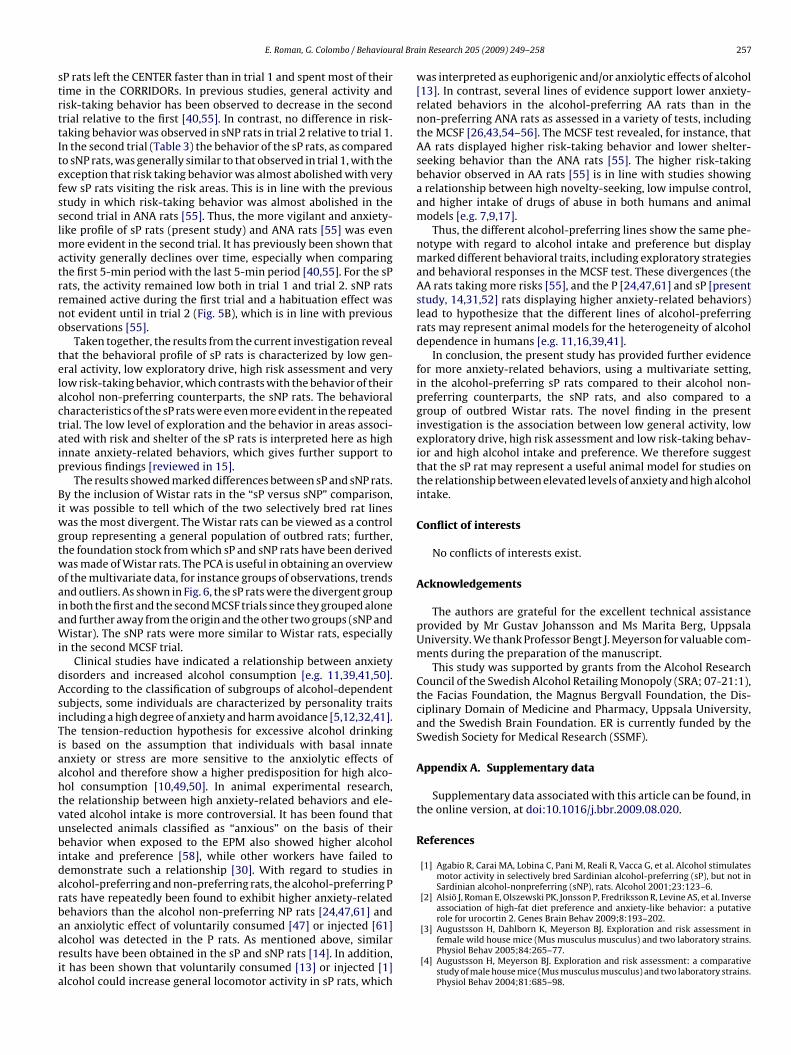
was interpreted as euphorigenic and/or anxiolytic effects of alcohol[13]. In contrast, several lines of evidence support lower anxiety-related behaviors in the alcohol-preferring AA rats than in thenon-preferring ANA rats as assessed in a variety of tests, includingthe MCSF [26,43,54–56]. The MCSF test revealed, for instance, thatAA rats displayed higher risk-taking behavior and lower shelter-seeking behavior than the ANA rats [55]. The higher risk-takingbehavior observed in AA rats [55] is in line with studies showinga relationship between high novelty-seeking, low impulse control,and higher intake of drugs of abuse in both humans and animalmodels [e.g. 7,9,17].
Thus, the different alcohol-preferring lines show the same phe-notype with regard to alcohol intake and preference but displaymarked different behavioral traits, including exploratory strategiesand behavioral responses in the MCSF test. These divergences (theAA rats taking more risks [55], and the P [24,47,61] and sP [presentstudy, 14,31,52] rats displaying higher anxiety-related behaviors)lead to hypothesize that the different lines of alcohol-preferringrats may represent animal models for the heterogeneity of alcoholdependence in humans [e.g. 11,16,39,41].
In conclusion, the present study has provided further evidencefor more anxiety-related behaviors, using a multivariate setting,in the alcohol-preferring sP rats compared to their alcohol non-preferring counterparts, the sNP rats, and also compared to agroup of outbred Wistar rats. The novel finding in the presentinvestigation is the association between low general activity, lowexploratory drive, high risk assessment and low risk-taking behav-ior and high alcohol intake and preference. We therefore suggestthat the sP rat may represent a useful animal model for studies onthe relationship between elevated levels of anxiety and high alcoholintake.
Conflict of interests
No conflicts of interests exist.
Acknowledgements
The authors are grateful for the excellent technical assistanceprovided by Mr Gustav Johansson and Ms Marita Berg, UppsalaUniversity. We thank Professor Bengt J. Meyerson for valuable com-ments during the preparation of the manuscript.
This study was supported by grants from the Alcohol ResearchCouncil of the Swedish Alcohol Retailing Monopoly (SRA; 07-21:1),the Facias Foundation, the Magnus Bergvall Foundation, the Dis-ciplinary Domain of Medicine and Pharmacy, Uppsala University,and the Swedish Brain Foundation. ER is currently funded by theSwedish Society for Medical Research (SSMF).
Appendix A. Supplementary data
Supplementary data associated with this article can be found, inthe online version, at doi:10.1016/j.bbr.2009.08.020.
References
[1] Agabio R, Carai MA, Lobina C, Pani M, Reali R, Vacca G, et al. Alcohol stimulatesmotor activity in selectively bred Sardinian alcohol-preferring (sP), but not inSardinian alcohol-nonpreferring (sNP), rats. Alcohol 2001;23:123–6.
[2] Alsiö J, Roman E, Olszewski PK, Jonsson P, Fredriksson R, Levine AS, et al. Inverseassociation of high-fat diet preference and anxiety-like behavior: a putativerole for urocortin 2. Genes Brain Behav 2009;8:193–202.
[3] Augustsson H, Dahlborn K, Meyerson BJ. Exploration and risk assessment infemale wild house mice (Mus musculus musculus) and two laboratory strains.Physiol Behav 2005;84:265–77.
[4] Augustsson H, Meyerson BJ. Exploration and risk assessment: a comparativestudy of male house mice (Mus musculus musculus) and two laboratory strains.Physiol Behav 2004;81:685–98.
2 ral Bra
[
[
[
[
[
[
[
[
[
[
[
[
[
[
[
[[
[
[
[
[
[
[
[
[
[
[
[
[
[
[
[
[
[
[
[
[
[
[
[
[
[
[
[
[
[
[
[
[
[
[
[
[[
58 E. Roman, G. Colombo / Behaviou
[5] Babor TF, Hofmann M, DelBoca FK, Hesselbrock V, Meyer RE, Dolinsky ZS, etal. Types of alcoholics. I. Evidence for an empirically derived typology basedon indicators of vulnerability and severity. Arch Gen Psychiatry 1992;49:599–608.
[6] Bell RL, Rodd ZA, Lumeng L, Murphy JM, McBride WJ. The alcohol-preferring P rat and animal models of excessive alcohol drinking. Addict Biol2006;11:270–88.
[7] Brewer JA, Potenza MN. The neurobiology and genetics of impulse controldisorders: relationships to drug addictions. Biochem Pharmacol 2008;75:63–75.
[8] Cagiano R, Cassano T, Coluccia A, Gaetani S, Giustino A, Steardo L, et al. Geneticfactors involved in the effects of developmental low-level alcohol inducedbehavioral alterations in rats. Neuropsychopharmacology 2002;26:191–203.
[9] Cain ME, Saucier DA, Bardo MT. Novelty seeking and drug use: contribution ofan animal model. Exp Clin Psychopharmacol 2005;13:367–75.
10] Cappell H, Herman CP. Alcohol and tension reduction. A review. Q J Stud Alcohol1972;33:33–64.
11] Castle DJ. Anxiety and substance use: layers of complexity. Expert Rev Neu-rother 2008;8:493–501.
12] Cloninger CR, Sigvardsson S, Bohman M. Type I and type II alcoholism: anupdate. Alcohol Health Res World 1996;20:18–23.
13] Colombo G, Agabio R, Lobina C, Reali R, Vacca G, Gessa GL. Stimulation of loco-motor activity by voluntarily consumed ethanol in Sardinian alcohol-preferringrats. Eur J Pharmacol 1998;357:109–13.
14] Colombo G, Agabio R, Lobina C, Reali R, Zocchi A, Fadda F, et al. Sardinianalcohol-preferring rats: a genetic animal model of anxiety. Physiol Behav1995;57:1181–5.
15] Colombo G, Lobina C, Carai MA, Gessa GL. Phenotypic characterization of genet-ically selected Sardinian alcohol-preferring (sP) and -non-preferring (sNP) rats.Addict Biol 2006;11:324–38.
16] Dawe S, Loxton NJ. The role of impulsivity in the development of substance useand eating disorders. Neurosci Biobehav Rev 2004;28:343–51.
17] Dellu F, Piazza PV, Mayo W, Le Moal M, Simon H. Novelty-seekingin rats—biobehavioral characteristics and possible relationship with thesensation-seeking trait in man. Neuropsychobiology 1996;34:136–45.
18] Dyr W, Kostowski W. Warsaw high-preferring (WHP) and Warsawlow-preferring (WLP) lines of rats selectively bred for high and low vol-untary ethanol intake: preliminary phenotypic characterization. Alcohol2008;42:161–70.
19] Edenberg HJ, Foroud T. The genetics of alcoholism: identifying specific genesthrough family studies. Addict Biol 2006;11:386–96.
20] Eriksson K. Genetic selection for voluntary alcohol consumption in the albinorat. Science 1968;159:739–41.
21] Eriksson L, Johansson E, Kettaneh-Wold N, Trygg J, Wikström C, Wold S. Multi-and megavariate data analysis. Part I: Basic principles and applications. 2ndrevised and enlarged ed. Umetrics AB; 2006.
22] File SE, Lippa AS, Beer B, Lippa MT. Animal tests of anxiety. Curr Protoc Neurosci2004 (Chapter 8: Unit 8.3).
23] Hilakivi L, Eriksson CJP, Sarviharju M, Sinclair JD. Revitalization of the AA andANA rat lines: effects on some line characteristics. Alcohol 1984;1:71–5.
24] Hwang BH, Stewart R, Zhang JK, Lumeng L, Li TK. Corticotropin-releasing fac-tor gene expression is down-regulated in the central nucleus of the amygdalaof alcohol-preferring rats which exhibit high anxiety: a comparison betweenrat lines selectively bred for high and low alcohol preference. Brain Res2004;1026:143–50.
25] Jackson JE. A user’s guide to principal components. Wiley-Interscience; 2003.26] Knapp DJ, Kampov-Polevoy AB, Overstreet DH, Breese GR, Rezvani AH. Ultra-
sonic vocalization behavior differs between lines of ethanol-preferring andnonpreferring rats. Alcohol Clin Exp Res 1997;21:1232–40.
27] Kranzler HR, Rosenthal RN. Dual diagnosis: alcoholism and co-morbid psychi-atric disorders. Am J Addict 2003;12(Suppl. 1):S26–40.
28] Kreek MJ, Nielsen DA, LaForge KS. Genes associated with addiction: alcoholism,opiate, and cocaine addiction. Neuromol Med 2004;5:85–108.
29] Langeland W, Draijer N, van den Brink W. Psychiatric comorbidity in treatment-seeking alcoholics: the role of childhood trauma and perceived parentaldysfunction. Alcohol Clin Exp Res 2004;28:441–7.
30] Langen B, Fink H. Anxiety as a predictor of alcohol preference in rats? ProgNeuropsychopharmacol Biol Psychiatry 2004;28:961–8.
31] Leggio B, Masi F, Grappi S, Nanni G, Gambarana C, Colombo G, et al. Sardinianalcohol-preferring and non-preferring rats show different reactivity to aver-sive stimuli and a similar response to a natural reward. Brain Res 2003;973:275–84.
32] Lesch OM, Walter H. Subtypes of alcoholism and their role in therapy. AlcoholAlcohol Suppl 1996;1:63–7.
33] Li TK, Lumeng L, Doolittle DP. Selective breeding for alcohol preference andassociated responses. Behav Genet 1993;23:163–70.
34] Li TK, Lumeng L, McBride WJ, Murphy JM. Rodent lines selected for factorsaffecting alcohol consumption. Alcohol Alcohol Suppl 1987;1:91–6.
35] Liebsch G, Montkowski A, Holsboer F, Landgraf R. Behavioural profiles of twoWistar rat lines selectively bred for high or low anxiety-related behaviour.Behav Brain Res 1998;94:301–10.
36] Lumeng L, Murphy JM, McBride WJ, Li TK. Genetic influences on alcohol prefer-ence in animals. In: Bergleiter H, Kissin B, editors. The genetics of alcoholism.New York: Oxford University Press; 1995. p. 165–201.
[
in Research 205 (2009) 249–258
37] Mardones J, Segovia-Riquelme N. Thirty-two years of selection of rats byethanol preference: UChA and UChB strains. Neurobehav Toxicol Teratol1983;5:171–8.
38] McBride WJ, Li TK. Animal models of alcoholism: neurobiology of high alcohol-drinking behavior in rodents. Crit Rev Neurobiol 1998;12:339–69.
39] Merikangas KR, Mehta RL, Molnar BE, Walters EE, Swendsen JD, Aguilar-GaziolaS, et al. Comorbidity of substance use disorders with mood and anxiety dis-orders: results of the International Consortium in Psychiatric Epidemiology.Addict Behav 1998;23:893–907.
40] Meyerson BJ, Augustsson H, Berg M, Roman E. The concentric square field: amultivariate test arena for analysis of explorative strategies. Behav Brain Res2006;168:100–13.
41] Moss HB, Chen CM, Yi HY. Subtypes of alcohol dependence in a nationallyrepresentative sample. Drug Alcohol Depend 2007;91:149–58.
42] Murphy JM, Stewart RB, Bell RL, Badia-Elder NE, Carr LG, McBride WJ, etal. Phenotypic and genotypic characterization of the Indiana University ratlines selectively bred for high and low alcohol preference. Behav Genet2002;32:363–88.
43] Möller C, Wiklund L, Thorsell A, Hyytiä P, Heilig M. Decreased measures ofexperimental anxiety in rats bred for high alcohol preference. Alcohol Clin ExpRes 1997;21:656–60.
44] O’Keefe J, Dostrovsky J. The hippocampus as a spatial map. Preliminary evidencefrom unit activity in the freely-moving rat. Brain Res 1971;34:171–5.
45] Oroszi G, Goldman D. Alcoholism: genes and mechanisms. Pharmacogenomics2004;5:1037–48.
46] Overstreet DH, Friedman E, Mathe AA, Yadid G. The Flinders Sensitive Line rat:a selectively bred putative animal model of depression. Neurosci Biobehav Rev2005;29:739–59.
47] Pandey SC, Zhang H, Roy A, Xu T. Deficits in amygdaloid cAMP-responsiveelement-binding protein signaling play a role in genetic predisposition to anx-iety and alcoholism. J Clin Invest 2005;115:2762–73.
48] Pellow S, Chopin P, File SE, Briley M. Validation of open:closed arm entries inan elevated plus-maze as a measure of anxiety in the rat. J Neurosci Methods1985;14:149–67.
49] Pohorecky LA. The interaction of alcohol and stress. A review. Neurosci Biobe-hav Rev 1981;5:209–29.
50] Pohorecky LA. Stress and alcohol interaction: an update of human research.Alcohol Clin Exp Res 1991;15:438–59.
51] Quintanilla ME, Israel Y, Sapag A, Tampier L. The UChA and UChB rat lines:metabolic and genetic differences influencing ethanol intake. Addict Biol2006;11:310–23.
52] Richter RM, Zorrilla EP, Basso AM, Koob GF, Weiss F. Altered amygdalarCRF release and increased anxiety-like behavior in Sardinian alcohol-preferring rats: a microdialysis and behavioral study. Alcohol Clin Exp Res2000;24:1765–72.
53] Roman E, Gustafsson L, Berg M, Nylander I. Behavioral profiles and stress-induced corticosteroid secretion in male Wistar rats subjected to short andprolonged periods of maternal separation. Horm Behav 2006;50:736–47.
54] Roman E, Gustafsson L, Hyytiä P, Nylander I. Short and prolonged periodsof maternal separation and voluntary ethanol intake in male and femaleethanol-preferring AA and ethanol-avoiding ANA rats. Alcohol Clin Exp Res2005;29:591–601.
55] Roman E, Meyerson BJ, Hyytiä P, Nylander I. The multivariate concentricsquare field test reveals different behavioural profiles in male AA and ANArats with regard to risk taking and environmental reactivity. Behav Brain Res2007;183:195–205.
56] Sandbak T, Murison R, Sarviharju M, Hyytiä P. Defensive burying and stress gas-tric erosions in alcohol-preferring AA and alcohol-avoiding ANA rats. AlcoholClin Exp Res 1998;22:2050–4.
57] Sommer W, Hyytiä P, Kiianmaa K. The alcohol-preferring AA and alcohol-avoiding ANA rats: neurobiology of the regulation of alcohol drinking. AddictBiol 2006;11:289–309.
58] Spanagel R, Montkowski A, Allingham K, Stohr T, Shoaib M, Holsboer F, et al.Anxiety: a potential predictor of vulnerability to the initiation of ethanol self-administration in rats. Psychopharmacology (Berl) 1995;122:369–73.
59] Stead JD, Clinton S, Neal C, Schneider J, Jama A, Miller S, et al. Selective breed-ing for divergence in novelty-seeking traits: heritability and enrichment inspontaneous anxiety-related behaviors. Behav Genet 2006;36:697–712.
60] Steimer T, Driscoll P. Divergent stress responses and coping stylesin psychogenetically selected Roman high-(RHA) and low-(RLA) avoid-ance rats: behavioural, neuroendocrine and developmental aspects. Stress2003;6:87–100.
61] Stewart RB, Gatto GJ, Lumeng L, Li TK, Murphy JM. Comparison of alcohol-preferring (P) and nonpreferring (NP) rats on tests of anxiety and for theanxiolytic effects of ethanol. Alcohol 1993;10:1–10.
62] Tolman EC. Cognitive maps in rats and men. Psychol Rev 1948;55:189–208.63] Wallén-Mackenzie A, Nordenankar K, Fejgin K, Lagerström MC, Emilsson L,
Fredriksson R, et al. Restricted cortical and amygdaloid removal of vesicular
glutamate transporter 2 in preadolescent mice impacts dopaminergic activityand neuronal circuitry of higher brain function. J Neurosci 2009;29:2238–51.64] Weiss JM, West CH, Emery MS, Bonsall RW, Moore JP, Boss-Williams KA. Ratsselectively-bred for behavior related to affective disorders: proclivity for intakeof alcohol and drugs of abuse, and measures of brain monoamines. BiochemPharmacol 2008;75:134–59.
Related Documents


