Revised Regional Total Maximum Daily Load Evaluation of Fecal Coliform Bacteria Impairments In the Lower Mississippi River Basin in Minnesota Final Report – January 2006 For Submission to: U.S. Environmental Protection Agency Region 5 Chicago, Illinois Submitted by: Minnesota Pollution Control Agency wq-iw9-02b

Welcome message from author
This document is posted to help you gain knowledge. Please leave a comment to let me know what you think about it! Share it to your friends and learn new things together.
Transcript

Revised Regional Total Maximum Daily Load Evaluation of Fecal Coliform Bacteria Impairments
In the Lower Mississippi River Basin in Minnesota
Final Report – January 2006
For Submission to:
U.S. Environmental Protection Agency Region 5
Chicago, Illinois
Submitted by:
Minnesota Pollution Control Agency
wq-iw9-02b

CONTENTS Section Page
EXECUTIVE SUMMARY……………………………………………………………..4 1.0 INTRODUCTION AND DISCUSSION OF ASSESSMENT DATA.………………7 2.0 BASIN CHARACTERISTICS………………………………………………………..16 3.0 DESCRIPTION OF APPLICABLE WATER QUALITY STANDARDS AND
ASSESSMENT PROCEDURES…………………………………………………....19 3.1 APPLICABLE MINNESOTA WATER QUALITY STANDARDS...……….19 3.2 IMPAIRMENT ASSESSMENT……..……………………………………….20 3.3 MPCA NON-DEGRADATION POLICY…………………………………….21
4.0 DESCRIPTION OF FECAL COLIFORM BACTERIA AND ITS SOURCES……22 5.0 LOAD ALLOCATIONS (LA), WASTELOAD ALLOCATIONS (WLA), and MARGINS
OF SAFETY (MOS)
5.1 APPROACH TO ALLOCATIONS NEEDED TO SATISFY THE TMDL…………………………………………………………………………..28
5.2 TMDL ALLOCATIONS FOR INDIVIDUAL IMPAIRED REACHES.……..32 5.3 IMPACTS OF GROWTH ON ALLOCATIONS…………………………...114
6.0 MARGIN OF SAFETY……………………………………………………………...115 7.0 SEASONAL VARIATION……………………………………………………………115 8.0 MONITORING PLAN
8.1 GOALS OF THE MONITORING PLAN……………………………………115 8.2 MONITORING ACTIVITIES, SCHEDULE AND RESPONSIBILITY……115
9.0 IMPLEMENTATION
9.1 CURRENT IMPLEMENTATION THROUGH BASINWIDE SOURCE
REDUCTION STRATEGIES………………………………………………...116 9.2 REVIEW AND REVISION OF CURRENT IMPLEMENTATION PLAN…119
2

10.0 REASONABLE ASSURANCE
10.1 EVIDENCE OF BMP IMPLEMENTABILITY………………………………120 10.2 NON-REGULATORY, REGULATORY, AND INCENTIVE-BASED
APPROACHES……………………….……………………………………...121 11.0 PUBLIC PARTICIPATION
11.1 DESCRIPTION OF PUBLIC PARTICIPATION PROCESSES……..…...121
12.0 REFERENCES……………………………………………………………………….122
FIGURES Figure Page
Figure 1.1 Lower Mississippi River Basin Fecal Coliform Impairments………9 Figure 1.2 Assessment Data for Straight River; Maple Cr. to Crane Cr…….14 Figure 1.3 Assessment Data for Logan Branch Whitewater River…………...14 Figure 1.4 Assessment Data for Root River; Thompson Cr. to Miss. R……..15
TABLES Table Page Table 1.1 Lower Mississippi River Basin Impaired Reach Descriptions and
Assessment Summaries……………………………………………….……10 Table 2.1 Land Use/Land Cover for Lower Mississippi Basin Impaired Reach
Watersheds…………………………………………………………………..17 Section 5.2 contains the following tables for each impaired reach:
• Wastewater Treatment Facilities • Livestock Facilities with NPDES Permits • Municipal Separate Storm Sewer System (MS4) Communities • Monthly Fecal Coliform Loading Capacities and Allocations
APPENDICES:
Appendix A: Loading Capacity Determination Appendix B: U.S. District Court Order Appendix C: Letter from USEPA Appendix D: E-mail from USEPA Appendix E: Responses to Comments Received During Public Notice Period
3

Executive Summary
In 2002, a report titled Regional Total Maximum Daily Study of Fecal Coliform Bacteria Impairments in the Lower Mississippi River Basin in Minnesota was submitted by the Minnesota Pollution Control Agency (MPCA) to the U.S. Environmental Protection Agency (EPA). The purpose of the study and report submittal was to meet requirements of the federal Clean Water Act (CWA) for 20 stream and river reaches in the Lower Mississippi and Cedar river basins that had been listed as impaired for swimming use due to fecal coliform levels that violated Minnesota water quality standards. The study described the magnitude of the problem and provided direction for improving water quality at the listed reaches, as well as in many other streams and rivers that had not been formally assessed but are believed to exhibit similar water quality conditions. The report was approved by the EPA in November 2002, although the approval was challenged by the Minnesota Center for Environmental Advocacy (MCEA). Despite the legal challenge, a wide range of efforts to reduce fecal coliform bacteria levels in the streams and rivers of the basin have been undertaken based on an implementation plan developed subsequent to the study. The 2002 TMDL report and implementation plan are at available at: http://www.pca.state.mn.us/water/tmdl/index.html#finaltmdl In June of 2005, ruling on the legal challenge from the MCEA, the United States District Court for Minnesota remanded the total maximum daily load (TMDL) report to the EPA for revision “in accordance with the requirements of the CWA and the regulations set forth thereunder.” Specifics of the order included the following (see Appendix B for complete court order).
• The revised TMDL shall be established at a level necessary to implement the applicable water quality standards for each reach impaired with fecal coliform contamination.
• The revised TMDL shall contain a margin of safety that accounts for lack of knowledge concerning the relationship between effluent limitations and water quality.
• The revised TMDL shall properly account for straight pipe septic systems in the wasteload allocation of the TMDL.
• The State of Minnesota is allowed 90 days from the date of entry of final judgment in this case to give pubic notice of, and to seek comment on, a proposed amended or replacement Regional TMDL Evaluation of Fecal Coliform Bacteria Impairments in the Lower Mississippi River Basin in Minnesota. In the event that the State of Minnesota does not give public notice of such proposed TMDL within this 90-day period, within 30 days thereafter, EPA shall establish a replacement TMDL for the reaches that have been added to the 303(d) list, consistent with MPCA’s representations made at oral argument on this matter.
4

• The existing SE TMDL shall remain in force and effect pending completion of the recalculated TMDL.
Prior to the court order, the MPCA had been working on revisions in two other areas. First, a number of stream/river reaches have been added to the impaired waters list since the original report. This revised report addresses 39 reaches. Secondly, municipal separate storm sewer systems (MS4’s) and livestock facilities that are issued NPDES permits, will be included in the wasteload allocation, rather than the load allocation, portion of the TMDL. In order to meet the provisions of the court order, the approach in this revised report is somewhat different from that taken in the original. In particular, fecal coliform loading capacities have been calculated for each individual impaired reach, and those capacities are allocated among point sources (wasteload allocation), nonpoint sources (load allocation), and a margin of safety. A loading capacity (i.e. TMDL) is the product of streamflow at each impaired reach and the monthly fecal coliform water quality standard. Five flow zones, ranging from low flow to high flow are utilized, so that the entire range of conditions are accounted for in the TMDL. The loading capacity and allocation vary by impaired reach, and by flow zone for a given reach. Due to the nature of the court order, this revised TMDL focuses more on the fecal coliform loading capacity and general allocations necessary to meet water quality standards at individual impaired river or stream reaches, than on precise loading reductions that may be required from specific sources. Upon approval of this revised TMDL, a public process for reviewing and updating the current implementation plan, including source-specific load reduction estimates, will be initiated. It is anticipated that many of the current implementation goals and strategies will continue. The 39 stream reaches listed as impaired for swimming designated use (primary contact recreation) under Section 303(d) of the Clean Water Act are all within the Upper Mississippi River Basin, Lower Portion, and the Cedar River Basin. These river basins are collectively referred to as the Lower Mississippi River Basin in this document. The Lower Mississippi River Basin in southeastern Minnesota is endowed with a rich variety of landscapes and land uses. Landscapes range from the hills and bluffs of the Driftless Area ecoregion close to the Mississippi River, where land use remains relatively varied and cold-water streams frequently support trout, to the prairie landscape on the western side of the basin which is dominated by row-crop agriculture and hog production. The entire 7,266 square mile region is drained by a network of 11,556 miles of rivers and streams. These streams differ significantly in size, condition of the aquatic environment, and economic uses of the water resource. The recreational potential offered by the region’s rivers and streams is high for such activities as fishing, boating and hiking, but limited by various forms of aquatic and terrestrial habitat degradation. Water quality monitoring over several decades has shown widespread exceedances of state and federal water quality standards throughout the basin
5

for fecal coliform bacteria. This problem adversely affects the recreational suitability of the area’s streams. The sources of this problem number in the thousands and are widely distributed over the rural, suburban, and urban landscape. Sources pertinent to fecal coliform include noncompliant residential septic systems, unprotected feedlots or manured fields, and pet waste that enter surface water through urban stormwater runoff.
6

1.0 INTRODUCTION AND DISCUSSION OF ASSESSMENT DATA Section 303(d) of the Clean Water Act (CWA) provides authority for completing Total Maximum Daily Loads (TMDLs) to achieve state water quality standards and/or designated uses. A TMDL is a calculation of the maximum amount of pollutant that a water body can receive and still meet water quality standards and/or designated uses. It is the sum of the loads of a single pollutant from all contributing point and nonpoint sources. TMDLs must include the following eight elements to be approved by the U.S. Environmental Protection Agency (EPA): The TMDL must:
1. Be designed to implement applicable water quality criteria; 2. Include a total allowable load, as well as individual waste load allocations; 3. Consider the impacts of background pollutant contributions; 4. Consider critical environmental conditions; 5. Consider seasonal environmental variations; 6. Include a margin of safety; 7. Provide opportunity for public participation; and 8. Have a reasonable assurance that the TMDL can be met.
In general, the TMDL is developed according to the following relationship:
TMDL = WLA + LA + MOS Where:
TMDL = Total Maximum Daily Load (may be seasonal, for critical conditions, or other constraints.)
WLA = Waste Load Allocation (point source) LA = Load Allocation (nonpoint source) MOS = Margin of Safety (may be implicit and factored into conservative
WLA or LA, or explicit.) Sources that are part of the waste load allocation, with the exception of “straight-pipe” septic systems, are largely controlled through National Pollutant Discharge Elimination System (NPDES) permits. Load allocation sources are controlled through a variety of regulatory and non-regulatory efforts at the local, state, and federal level.
This document provides the information used to develop TMDLs for 39 impaired stream reaches on Minnesota’s 2004 303(d) list that lie within the Lower Mississippi River Basin and the Cedar River Basin within Minnesota. These reaches were listed as impaired for failure to meet their swimming designated beneficial uses due to excessive fecal coliform concentrations. Figure 1 shows these reaches, along with other impairments (e.g. turbidity), and other reaches.
7

The protocol for this assessment is outlined in MPCA “Listing Methodology” publications found at: http://www.pca.state.mn.us/water/tmdl/index.html#support. The applicable water body classifications and water quality standards are specified in Minnesota Rules Chapter 7050. Minn. R. ch. 7050.0407 lists water body classifications and Minn. R. ch. 7050.0222, subp. 5 lists applicable water quality standards for the impaired reaches. Assessment summary information for the 39 reaches is listed in Table 1.1. The assessment protocol includes pooling of data by month over a 10-year period. Thirty-five of the reaches had two or more months with a least five fecal coliform observations (i.e. water samples). Of these 35 reaches, the geometric mean water quality standard of 200 orgs./100ml was violated in at least two months for all but one reach, where it was violated once. Four reaches did not have any months with five or more fecal coliform observations. However, these reaches were included on the impaired waters list due to violations of the “single sample” standard of 400 or 2000 orgs./100 ml, depending on the surface water classification. Figures 1.2 - 1.4 are graphical examples of the data used in the assessments for three of the impaired reaches. The highly variable nature of individual fecal coliform observations is apparent (i.e. the need to use logarithmic scaling). Even the geometric mean values vary a great deal between months and among sites. The 2002 TMDL report documented monthly geometric means ranging from less than 200 orgs./100ml to over 2000 orgs./100ml for the stream/river reaches assessed at that time. There are a number of reasons for this variability including weather/climate effects, differences in watershed terrain and land use, the nature and distribution of sources relative to an impaired reach, and the size and other characteristics of the stream or river. Additionally, the data used in the assessments of the 39 impaired reaches came from a variety of monitoring programs. A program more focused on storm event runoff monitoring may tend to produce data with higher fecal coliform concentrations than a program collecting samples on a set or random schedule. Nevertheless, the number of months where the water quality standard is violated (Table 1.1) and the magnitude of violations, suggest serious water quality impairments that will require substantial efforts to remedy. Completion of this revised TMDL should allow clean-up efforts already underway to continue, and may also result in new and different remediation approaches. Ideally, sufficient data would exist to calculate current actual fecal coliform loads to compare directly to the TMDLs, which would allow for load reduction projections. However, the amount of data required for load calculations is much greater than that required for simple impairment assessment. General reduction estimates are included in the current implementation plan and will be reviewed and possibly revised following approval of this TMDL.
8

Figure 1.1: Lower Mississippi River Basin Water Quality Impairments
N
May, 2004
Mississippi River Basin: St. Croix River to Iowa Border and Cedar River Basin
2004 Impaired Waters: Conventional Parameters(per Section 303(d) Clean Water Act)
Freeborn
Mower
Rice
Fillmore
Goodhue
Winona
Olmsted
Houston
Stee le
Dakota
Wabasha
Dodge
Lesueur
Waseca
Scott
Root R, S Br (F, T) Root R, S Br (F, T)Root R, S Br (F, T) Root R, S Br (F, T) Mississippi R (T)
Money Cr (F)
Stockton Valley Cr (F)
Mississippi R (F)
Whitewater R (T)
Whitewater R, M Fk (F, T)
Zumbro R, S Fk (F)
Zumbro R, S Fk (F)
Zumbro R (F)
Zumbro R (F, T)
Cannon R (T)
Vermillion R (T)
Chub Cr (F)
Cannon R (F, T)
Logan Br (F, T)
Unnamed Cr (F)
Unnamed Cr (F)
Straight R (F, T)
Straight R (F, T)
Rush Cr (F)
Maple Cr (F)
Turtle Cr (F)
Straight R (F)
Crane Cr (F)
Cannon R (T)
Whitewater R, S Fk (F, T)
Mississippi R (F)
Mississippi R (F)
Mississippi R (T)
Mississippi R (T)
Whitewater R, N Fk (F, T)
Prairie Cr (F*, T)
Prairie Cr (F*, T)
Cannon R (F*, T)
Straight R (F*, T)
Robinson Cr (F*)
Zumbro R, S Fk (F*, T)
Garvin Br (F*, T)
Root R (F*, T)
Whitewater R, S Fk (F*, T)
Whitewater R, N Fk (F*, T)
Shell Rock R (F*, T) Cedar R (F*, T)
Cedar R (F*, T)
Vermillion R (F*)
Salem Cr (F*)
Affected Use
Pollutant, Stressor or Indicator:A - AmmoniaB - BiotaC - ChlorideF - Fecal coliformO - Low oxygenP - pHT - TurbidityTm - Temperature
CountyWatershed
Aquatic Recreation
Open WaterStream/River
Aquatic Life
Aq Life & Recreation
20 0 20 40 60 Miles
9

Table 1.1. Lower Mississippi Basin Impaired Reach Descriptions and Assessment Summaries Impaired Reach
Year Listed
Assessment Unit ID
Reach Length (miles)
Monitoring Stations Used in Assessment
Obs. # months with ≥ 5 obs.
# months exceeding geometric mean of 200 orgs./100ml
Years of Data
Vermillion River; S Br Vermillion R to the Hastings Dam
96 07040001-506 11.51 Vermillion River 2.7 (MetC), 05346000
322 8 6 85-95
Vermillion River; Below trout stream portion to South Br Vermillion R
94 07040001-507 8.96 S000-896 (VR-32.5), 05345000
84 8 3 83-93
Cannon River; Pine Cr to Belle Cr
94 07040002-502 11.29 S000-003 (CA-13) 73 8 2 83-93
Straight River; Maple Cr to Crane Cr
94 07040002-503 5.43 S000-047 (ST-18) 44 7 6 88-93
Prairie Creek; Headwaters to Cannon R (Lk Byllesby)
94 07040002-504 26.02 S001-186 (PRA-0.5), S001-197 (PRA-1.5), S001-198 (PRA-2.6)
38 2 2 89-93
Rush Creek; Headwaters to Straight R
02 07040002-505 12.41 S000-502 23 3 3 99-00
Cannon River; Northfield Dam to Lk Byllesby inlet
04 07040002-509 10.21 S001-280 (MS318), S001-582
17 0 na 98,01,02
Unnamed Creek; Headwaters to Prairie Cr
02 07040002-512 2.72 S001-240 20 3 3 97-98
Unnamed Tributary to Prairie Creek; Unnamed Cr to Unnamed Cr
02 07040002-513 4.69 S001-246 15 3 3 1998
Straight River; Rush Cr to Cannon R
02 07040002-515 12.68 S003-627 24 4 2 99-00
10

Impaired Reach
Year Listed
Assessment Unit ID
Reach Length (miles)
Monitoring Stations Used in Assessment
Obs. # months with ≥ 5 obs.
# months exceeding geometric mean of 200 orgs./100ml
Years of Data
Crane Creek; Headwaters (Watkins Lk) to Straight R
02 07040002-516 15.47 S003-009 26 5 4 99-00
Straight River; CD #25 to Turtle Cr
02 07040002-517 10.45 S001-343 24 4 2 99-00
Turtle Creek; Headwaters to Straight R
02 07040002-518 16.5 S003-628 24 4 4 99-00
Maple Creek; Headwaters to Straight R
02 07040002-519 11.73 S003-011 27 5 4 99-00
Chub Creek; Headwaters to Cannon R
04 07040002-528 19.51 S001-666 (CHB23), S001-670 (CHB3), S001-668 (CHB47), S001-669 (CHBRD)
132 5 5 99-00
Straight River; Turtle Cr to Owatonna Dam
04 07040002-535 7.4 S003-015 11 0 na 00-02
Whitewater River, South Fork; Headwaters to trout stream portion
94 07040003-505 20.37 S000-288 (WWR-26) 74 8 6 83-93
Whitewater River, South Fork; trout stream portion above N Fk Whitewater R
02 07040003-512 11.24 SWR: not yet in STORET, from GJohnson spreadsheet
56 3 3 00-02
Whitewater River, Middle Fork; trout stream portion
02 07040003-514 12.1 MWR: not yet in STORET, from GJohnson spreadsheet
53 3 3 00-02
Garvin Brook; Class 1B,2A,3B portion
94 07040003-542 13.99 S000-828 (GB-4.5) 74 8 6 83-93
11

Impaired Reach
Year Listed
Assessment Unit ID
Reach Length (miles)
Monitoring Stations Used in Assessment
Obs. # months with ≥ 5 obs.
# months exceeding geometric mean of 200 orgs./100ml
Years of Data
Logan Branch; End trout stream portion to North Fk Whitewater R
02 07040003-536
10.1
LOG: not yet in STORET, from GJohnson spreadsheet
53 3 3 00-02
Whitewater River, North Fork; Unnamed Cr to Unnamed Cr (below Class 7)
02 07040003-553 7.65 CSP: not yet in STORET, from GJohnson spreadsheet
53 3 3 00-02
Whitewater River, North Fk; Unnamed Cr to Mid Fk Whitewater R
96 07040003-554 10.49 05376000 30 2 1 85-93
Stockton Valley Creek; Trout stream portion to Garvin Br
02 07040003-559 6.38 SVC: not yet in STORET, from GJohnson spreadsheet
55 3 3 00-02
Zumbro River; West Indian Cr to Mississippi R
04 07040004-501 23.43 S000-816 10 2 2 2002
Zumbro River; Cold Cr to West Indian Cr
04 07040004-502 23.4 S000-818, S000-819, S001-905
29 2 2 2002
Salem Creek; Lower 15 miles (Class 2C portion) to South Fk Zumbro R
94 07040004-503 17.28 S001-191 (SAL-7.2), S001-206 (SAL-9.1), S001-207 (SAL-9.9)
35 3 3 89-93
Zumbro River, South Fk; Cascade Cr to Zumbro Lk
94 07040004-507 12.42 S000-268 (ZSF-5.7) 74 8 3 83-93
Zumbro River, South Fork; Silver Lk Dam to Cascade Cr
04 07040004-533 0.19 S000-334 18 3 3 2001
12

Impaired Reach
Year Listed
Assessment Unit ID
Reach Length (miles)
Monitoring Stations Used in Assessment
Obs. # months with ≥ 5 obs.
# months exceeding geometric mean of 200 orgs./100ml
Years of Data
Zumbro River, South Fork; Bear Cr to Oakwood Dam
04 07040004-535 0.53 S002-032 18 3 3 2001
Zumbro River, South Fork; Salem Cr to Bear Cr
04 07040004-536 8.67 S002-033 18 3 3 2001
Root River; Thompson Cr to Mississippi R
94 07040008-501 5.73 S000-065 (RT-3) 73 8 6 83-93
Robinson Creek; Headwaters to N Br Root R
94 07040008-503 10.35 S001-138 (ROB-0.03), S001-189 (ROB-0.15), S001-190 (ROB-0.4)
53 8 5 87-93
Money Creek; End of trout stream portion to Root R
04 07040008-521 16.89 S001-820 (Zephyr), S003-623 (SS-3)
10 0 na 2002
Root River, South Branch; Canfield Cr to Willow Cr
04 07040008-555 11.37 S001-320 18 0 na 99-02
Root River, South Branch; Headwaters to Class 1B,2A,3B
04 07040008-586 25.22 S001-318, S001-539, S001-945
32 3 3 99-01
Cedar River; Rose Cr to Woodbury Cr
98 07080201-501 10.25 S000-136 (CD-10) 62 8 4 86-94
Cedar River; Roberts Cr to Upper Austin Dam
98 07080201-502 4.84 S000-137 (CD-24) 63 8 4 86-94
Shell Rock River; Albert Lea Lk to Goose Cr
94 07080202-501 11.83 S000-084 (SR-1.2) 75 8 8 83-93
13

Figure 1.2. Assessment Data for Straight River; Maple Creek to Crane Creek (AUID: 07040002-503)
1
10
100
1000
10000
10000010
/18/
1983
4/18
/198
4
10/1
8/19
84
4/18
/198
5
10/1
8/19
85
4/18
/198
6
10/1
8/19
86
4/18
/198
7
10/1
8/19
87
4/18
/198
8
10/1
8/19
88
4/18
/198
9
10/1
8/19
89
4/18
/199
0
10/1
8/19
90
4/18
/199
1
10/1
8/19
91
4/18
/199
2
10/1
8/19
92
4/18
/199
3
Date
Feca
l Col
iform
Bac
teria
(org
s./1
00m
l)
Figure 1.3. Assessment Data for Logan Branch Whitewater River (AUID: 07040003-536)
1
10
100
1000
10000
100000
1000000
6/1/
2000
7/1/
2000
8/1/
2000
9/1/
2000
10/1
/200
0
11/1
/200
0
12/1
/200
0
1/1/
2001
2/1/
2001
3/1/
2001
4/1/
2001
5/1/
2001
6/1/
2001
7/1/
2001
8/1/
2001
9/1/
2001
10/1
/200
1
11/1
/200
1
12/1
/200
1
1/1/
2002
2/1/
2002
3/1/
2002
4/1/
2002
5/1/
2002
6/1/
2002
7/1/
2002
8/1/
2002
Date
Feca
l Col
iform
Bac
teria
(org
./100
ml)
14

Figure 1.4. Assessment Data for Root River; Thompson Creek to Mississippi River (AUID: 07040008-501)
1
10
100
1000
10000
100000
10/3
/198
3
4/3/
1984
10/3
/198
4
4/3/
1985
10/3
/198
5
4/3/
1986
10/3
/198
6
4/3/
1987
10/3
/198
7
4/3/
1988
10/3
/198
8
4/3/
1989
10/3
/198
9
4/3/
1990
10/3
/199
0
4/3/
1991
10/3
/199
1
4/3/
1992
10/3
/199
2
4/3/
1993
Date
Feca
l Col
iform
Bac
teria
(org
s./1
00m
l)
15

2.0 BASIN CHARACTERISTICS: The Lower Mississippi River Basin, which includes the Cedar River Basin for planning purposes, is located in southeastern Minnesota. It includes all or part of 17 counties and has 12 major watersheds covering about 7,266 square miles (4,650,100 acres). Land use is diverse. On the western side, lands are primarily cultivated, while the eastern landscapes are dominated by steep forested hill slopes. About two-thirds of the land in the basin is under cultivation, while about 13 percent is forested. Roughly 17 percent of the land use is open or pasture lands. Major agricultural crops include corn, soybeans, and hay. Animal production includes dairy and beef cattle, hogs, sheep and lambs. The total human population of the basin is estimated to be 638,020. Of this total, 77 percent is urban and 23 percent is rural. Major population centers include the southern metropolitan area of Dakota County, in addition to Austin, Albert Lea, Faribault, Owatonna, Rochester, Red Wing, and Winona. These and other urban areas are experiencing rapid population growth and commercial development. Substantial variation among impaired reach watersheds is apparent (Table 2.1). The percent of cultivated land, for example, ranges from less than 50 percent to over 90 percent. Urban and rural developed land comprises between 10 percent and over 30 percent of the South Zumbro and Vermillion watersheds, respectively, but only a few percent of the rest of the watersheds. Limestone bluffs, springs, caves, and numerous trout streams abound in the eastern basin, where steep topography and erosive soils increase the potential for pollutant runoff and sedimentation of streams. Sinkholes and disappearing streams highlight the close connection between surface water and ground water in this part of the basin. The presence of fractured limestone bedrock lying close below the land surface, which is often referred to as karst topography,1 presents a widespread risk of ground water contamination in the eastern basin. In the southwestern basin, Mississippi tributaries emerge as small streams out of a prairie landscape once rich in wetlands, but now extensively drained to support a productive agriculture. Further to the north, in the western Cannon River Watershed, remnants of the Big Woods hardwood forest intermingle with mixed crop and livestock farming in a rolling terrain interspersed with lakes and wetlands.
1 Karst is a geologic term used to describe a landscape created over soluble rock with efficient underground drainage. The underlying rock dissolves over time as surface water percolates through the soil and carbon dioxide from the air and from biological activity in the soil combine with the water. The water and carbon dioxide chemically form a weak carbonic acid that reacts with calcite and dolomite, causing the rock to dissolve slowly to produce joints and cracks.
16

Table 2.1 Land Use/Land Cover for Lower Mississippi Basin Impaired Reach Watersheds Land Use/Land Cover Percentage Impaired Reach
(indentation indicates subwatershed) Cult. = Cultivated
Drainage Area (mi2)
Cult. Grass Forest Water/ Wetland
Residential, Urban, Industrial
Other
Cannon River; Pine Cr to Belle Cr 1,386 70 10 12 4 4 (Prairie Creek; Headwaters to Cannon R (Lk Byllesby)) 80 76 10 11 <1 3 (Unnamed Creek; Headwaters to Prairie Cr) 17 84 11 3 <1 2 (Unnamed Tributary to Prairie Creek; Unnamed Cr to Unnamed Cr) 13 84 11 3 <1 2 (Chub Creek; Headwaters to Cannon R) 64 48 31 15 2 4 Cannon River; Northfield Dam to Lk Byllesby inlet 957 72 10 8 5 5 Straight River; Rush Cr to Cannon R 461 80 7 6 2 5 (Rush Creek; Headwaters to Straight R) 22 89 3 6 <1 2 (Crane Creek; Headwaters (Watkins Lk) to Straight R) 106 81 7 4 4 4 Straight River; Maple Cr to Crane Cr 252 82 7 5 1 5 (Maple Creek; Headwaters to Straight R) 38 77 11 5 <1 7 Straight River; Turtle Cr to Owatonna Dam 204 83 7 5 1 4 (Turtle Creek; Headwaters to Straight R) 44 82 9 6 1 2 Straight River; CD #25 to Turtle Cr 135 87 6 4 1 2 Root River; Thompson Cr to Mississippi R 1,660 60 15 22 <1 3 (Robinson Creek; Headwaters to N Br Root R) 17 92 5 2 <1 2 (Money Creek; End of trout stream portion to Root R) 77 36 18 44 <1 2 Root River, South Branch; Canfield Cr to Willow Cr 143 76 9 13 <1 2 Root River, South Branch; Headwaters to Class 1B,2A,3B 61 84 8 6 <1 2 Whitewater River, Middle Fork; trout stream portion 54 69 18 10 <1 2 Whitewater River, South Fork; trout stream portion above N Fk Whitewater R 93 64 16 15 <1 5 (Whitewater River, South Fork; Headwaters to trout stream portion) 55 67 18 8 <1 7 Whitewater River, North Fk; Unnamed Cr to Mid Fk Whitewater R 104 70 17 9 <1 3 (Logan Branch; End trout stream portion to North Fk Whitewater R) 17 68 23 7 <1 2 (Whitewater River, North Fork; Unnamed Cr to Unnamed Cr (below Class 7)) 20 76 12 10 <1 2 Garvin Brook; Class 1B,2A,3B portion 49 46 14 37 <1 3 Stockton Valley Creek; Trout stream portion to Garvin Br 20 48 15 34 <1 2
17

Land Use/Land Cover Percentage Impaired Reach Drainage
Area (mi2)
Cult. Grass Forest Water/ Wetland
Residential, Urban, Industrial
Other
Zumbro River; West Indian Creek to Mississippi River 1,488 67 12 11 <1 5 4 Zumbro River; Cold Cr to West Indian Cr 1,401 67 13 9 <1 6 5 Zumbro River, South Fk; Cascade Cr to Zumbro Lk 349 57 20 8 <1 13 2 Zumbro River, South Fork; Silver Lk Dam to Cascade Cr 260 62 20 7 <1 10 Zumbro River, South Fork; Bear Cr to Oakwood Dam 239 62 20 8 <1 9 Zumbro River, South Fork; Salem Cr to Bear Cr 157 68 18 7 <1 6 Salem Creek; Lower 15 miles (Class 2C portion) to South Fk Zumbro R 62 80 12 5 <1 3 Cedar River; Rose Cr to Woodbury Cr 544 87 5 4 1 4 Cedar River; Roberts Cr to Upper Austin Dam 185 89 4 4 <1 3 Shell Rock River; Albert Lea Lk to Goose Cr 195 76 9 5 4 5 Vermillion River; S Br Vermillion R to the Hastings Dam 273 52 9 8 4 26 Vermillion River; Below trout stream portion to South Br Vermillion R 142 43 9 7 9 32
18

3.0 DESCRIPTION OF APPLICABLE WATER QUALITY STANDARDS AND ASSESSMENT PROCEDURES
All waters of Minnesota are assigned classes, based on their suitability for the following beneficial uses:
1. Domestic consumption 2. Aquatic life and recreation 3. Industrial consumption 4. Agriculture and wildlife 5. Aesthetic enjoyment and navigation 6. Other uses 7. Limited resource value
All surface waters of the state that are not specifically listed in Chapter 7050 and are not wetlands, which includes most lakes and streams in Minnesota, are classified as Class 2B, 3B, 4A, 4B, 5 and 6 waters. (Minn. R. ch. 7050.0430). According to Minn. R. ch. 7050.0407, the designated beneficial use for the different use classes is as follows:
Class 1B: For domestic consumption following approved disinfection, such as simple chlorination or its equivalent. Class 2A: Aquatic life support refers to cold water sport or commercial fish and associated aquatic life, and their habitats. Recreation support refers to aquatic recreation of all kinds, including bathing, for which the waters may be usable. Class 2A also is protected as a source of drinking water. Class 2B: Aquatic life support refers to cool or warm water sport and commercial fish and associated aquatic life. Recreation support refers to aquatic recreation of all kinds, including bathing. Class 2C: Aquatic life support and recreation includes boating and other forms of recreation for which the water may be suitable (i.e., swimming). Class 2C waters may also support indigenous aquatic life, but not necessarily sport or commercial fish. Class 3B: General industrial purposes, except for food processing, with only a moderate degree of treatment. Similar to Class 1D waters of the state used for domestic consumption.
Relative to the fecal coliform standard, all of the waters covered in this report are assigned either Class 2A, 2B, or 2C. 3.1 Applicable Minnesota Water Quality Standards Minn. R. ch. 7050.0222 subp. 4 and 5, fecal coliform water quality standard for class 2B and 2C waters states that fecal coliforms shall not exceed 200 organisms per 100 milliliters
19

as a geometric mean2 of not less than five samples in any calendar month, nor shall more than ten percent of all samples taken during any calendar month individually exceed 2,000 organisms per 100 milliliters. The standard applies only between April 1 and October 31. Minn. R. ch. 7050.0222, subp. 2, for Class 2A waters, states that fecal coliforms shall not exceed 200 organisms per 100 milliliters as a geometric mean of not less than five samples in any calendar month, nor shall more than ten percent of all samples taken during any calendar month individually exceed 400 organisms per 100 milliliters. The standard applies only between April 1 and October 31. Minn. R. ch 7050.0221 subp. 2, describes water quality standards for Class 1B waters. Such waters shall be such that with approved disinfection, such as simple chlorination or its equivalent, the treated water will meet both the primary (maximum contaminant levels) and secondary drinking water standards issued by the Unites States Environmental Protection Agency (US EPA) as contained in Code of Federal Regulations, title 40, part 141, subparts B and G, and part 143, (1992); except that the bacteriological standards shall not apply. This TMDL study focuses on 200 organisms/100 ml monthly geometric mean as an environmental endpoint for impaired reaches. Establishing TMDLs to meet the geometric mean of 200 organisms/100mL rather than the no exceedance of either 400 or 2000 (depending on use classification) organisms per 100 mL in more than 10% of single samples is consistent with EPA’s recent promulgation of water quality criteria for coastal recreational waters. The preamble of the coastal recreational water rule states: “the geometric mean is the more relevant value for ensuring that appropriate actions are taken to protect and improve water quality because it is a more reliable measure, being less subject to random variation” (EPA, 2004). The same source-reduction measures that are required to attain compliance with the “chronic” standard also will lead to attainment of compliance with the “acute” standard of 2000 or 400 organisms/100ml cited above. The TMDL requires compliance with both parts of the standard. 3.2 Impairment Assessment Impairment assessment is based on the procedures found at: http://www.pca.state.mn.us/water/tmdl/index.html#support
For support of swimming and recreation, the fecal coliform methodology (303(d) listing) is as follows: Data are aggregated over a ten-year period by month and by reach. If the geometric mean of at least five samples for each appropriate month (all years combined) exceeded 200 organisms per 100 ml, that reach was placed on the 1998 303(d) list. In addition, if at least 10 percent of the entire data set for a reach during the ten-year period exceeded 2000 (or 400) organisms per 100 ml,
2 The term geometric mean is used throughout this report to describe fecal coliform data. This statistical function is appropriate for summarizing the central tendency of environmental data that is not normally distributed (Helsel and Hirsch, 1991), which is the case for the fecal coliform data.
20

then that reach was also placed on the list. The methodology focuses on monthly analysis of the 200 organisms/100 ml standard and brings in the aspect that stream reaches showing a minimum threshold number of high individual values have impaired use and are included on the list.
Tables 1.1 provides summary information on the data used to determine the impairment status of the 39 stream/river reaches included in this report. 3.3: MPCA Non-degradation Policy Non-degradation is an important component of water quality standards in Minnesota. MPCA policy distinguishes non-degradation for all waters from non-degradation for Outstanding Resource Value Waters (ORVW), as follows: Minn. R. ch. 7050.0185, subp. 1, Non-degradation for All Waters. The potential capacity of the water to assimilate additional wastes and the beneficial uses inherent in water resources are valuable public resources. It is the policy of the state of Minnesota to protect all waters from significant degradation from point and nonpoint sources and wetland alterations, and to maintain existing water uses, aquatic and wetland habitats, and the level of water quality necessary to protect these uses. Minn. R. ch. 7050.0180, subp. 1-2. The agency recognizes that the maintenance of existing high quality in some waters of outstanding resource value to the state is essential to their function as exceptional recreational, cultural aesthetic, or scientific resources. To preserve the value of these special waters, the agency will prohibit or stringently control new or expanded discharges from either point or nonpoint sources to outstanding resource value waters. In the Lower Mississippi River Basin, the following water body is designated ORVW: Cannon River from the northern city limits of Faribault to its confluence with the Mississippi River. Both of the Cannon River impaired reaches included in this report fall under the ORVW designation.
21

4.0 DESCRIPTION OF FECAL COLIFORM BACTERIA AND ITS SOURCES Certain types of bacteria pose a potential health risk to those who come into contact with surface water. These bacteria come from a variety of sources, including agricultural runoff, inadequately treated domestic sewage, and even wildlife. Some of these bacteria may cause disease. Other potential pathogens (disease-causing agents) from these sources include viruses, protozoa, and worms. Perhaps of greatest concern are bacteria from human feces. The limitations of available monitoring tools make it difficult to determine whether bacterial contamination in a water body is from human or animal sources. It is, however, possible to determine whether the bacteria originated in the intestinal tract of a mammal. These kinds of bacteria are called fecal coliforms. If fecal coliform bacteria levels exceed state water quality standards, it’s an indication that fecal matter is entering the stream in quantities that pose a potential threat to public health. There are many types of fecal coliform bacteria, and not all of them cause disease in humans, but where there are coliform bacteria there may be pathogens of concern. Thus, widespread violation of the fecal coliform standard in the Lower Mississippi River Basin indicates serious pollution and a possible health concern, but it doesn’t necessarily mean there is an immediate health threat in any particular area. Bacterial contamination of surface and ground water by antibiotic-resistant micro-organisms has been expressed as a public concern in southeastern Minnesota; however, this issue has not been widely studied and is not addressed in this report. Further work is needed in this area. The relationship between land use and fecal coliform concentrations found in streams is complex, involving both pollutant transport and rate of survival in different types of aquatic environments. Intensive sampling at several of the sites listed above in southeastern Minnesota shows a strongly positive correlation between stream flow, precipitation, and fecal coliform bacteria concentrations. In the Vermillion River watershed, storm-event samples often showed concentrations in the thousands of organisms per 100 milliliters, far above non-storm-event samples. A study of the Straight River watershed divided sources into continuous (failing individual sewage treatment systems, unsewered communities, industrial and institutional sources, wastewater treatment facilities) and weather-driven (feedlot runoff, manured fields, urban stormwater categories). The study hypothesized that when precipitation and stream flows are high, the influence of continuous sources is overshadowed by weather-driven sources, which generate extremely high fecal coliform concentrations. However, during drought, low-flow conditions continuous sources can generate high concentrations of fecal coliform, the study indicated. Besides precipitation and flow, factors such as temperature, livestock management practices, wildlife activity, fecal deposit age, and channel and bank storage also affect bacterial concentrations in runoff (Baxter-Potter and Gilliland, 1988).
22

Several studies have found a strong correlation between livestock grazing and fecal coliform levels in streams running through pastures. Several samples taken in the Grindstone River in the St. Croix River Basin, downstream of cattle observed to be in the stream, were found to contain a geometric mean of 11,000 organisms/100 ml, with individual samples ranging as high as 110,000/100ml. However, carefully managed grazing can be beneficial to stream water quality. A study of southeastern Minnesota streams by Sovell, et. al., found that fecal coliform, as well as turbidity, were consistently higher at continuously grazed sites than at rotationally grazed sites where cattle exposure to the stream corridor was greatly reduced. This study and several others indicate that sediment-embededness, turbidity, and fecal coliform concentrations are positively related. Fine sediment particles in the streambed can serve as a substrate harboring fecal coliform bacteria. “Extended survival of fecal bacteria in sediment can obscure the source and extent of fecal contamination in agricultural settings,” (Howell et. al., 1996). Hydrogeologic features in southeastern Minnesota may favor the survival of fecal coliform bacteria. Cold ground water, shaded streams, and sinkholes may protect fecal coliform from light, heat, drying, and predation (MPCA 1999). Sampling in the South Branch of the Root River watershed showed concentrations of up to 2,000 organisms/100 ml coming from springs, pointing to a strong connection between surface water and ground water (Fillmore County 1999 & 2000). The presence of fecal coliform bacteria has been detected in private well water in southeastern Minnesota. However, many such detections have been traced to problems of well construction, wellhead management, or flooding, not from widespread contamination of the deeper aquifers used for drinking water. One study from Kentucky showed that rainfall on well-structured soil with a sod surface could generate fecal coliform contamination of the shallow ground water through preferential flow (McMurry et. al., 1998). Finally, fecal coliform survival appears to be shortened through exposure to sunlight. This is purported to be the reason why, at several sampling sites downstream of reservoirs, fecal coliform concentrations were markedly lower than at monitoring sites upstream of the reservoirs. This has been demonstrated at Lake Byllesby on the Cannon River and the Silver Creek Reservoir on the South Branch of the Zumbro River in Rochester. Despite the complexity of the relationship between sources and in-stream concentrations of fecal coliform, the following can be considered major source categories: Wastewater Treatment Facilities The great majority of the urban population in the Lower Mississippi River basin is served by centralized sewage treatment, which includes disinfection at the final treatment stage. All permitted wastewater treatment facilities are required to monitor their effluent
23

to ensure that concentrations of specific pollutants remain within levels specified in the discharge permit. Effluent limits require that fecal coliform concentrations remain below 200 organisms per 100 milliliters from April 1 through October 31. This is accomplished through disinfection of the wastewater at the final treatment stage, through chlorination or equivalent processes. The MPCA regularly reviews the Discharge Monitoring Reports from wastewater treatment facilities to determine whether permit violations have occurred. The previous TMDL study found relatively few violations. This was confirmed in a review of information for 2004 and 2005. Emergency bypasses at wastewater treatment facilities are an occasional source of bacteria and other pollutants. These bypasses are also referred to as sanitary sewer overflows (SSO’s). Wastewater treatment plants and sanitary sewer systems are designed to handle at least 100 gallons of water per person per day, as well as the additional flow generated by commercial and industrial establishments. If the amount of water entering a system exceeds the design capacity of the system, some of the untreated wastewater is discharged to the environment. This event is called a bypass because the wastewater has bypassed part or all of the treatment process. Efforts to minimize or eliminate wastewater bypasses are managed through the NPDES program. As part of the previous TMDL, wastewater treatment facility reports for 2001 were examined to identify cities where one or more bypasses had occurred. In calendar year 2001, 24 cities in the Lower Mississippi River Basin reported one or more bypasses. Most of these cities (21) experienced bypasses one or two times. These were judged to be isolated occurrences triggered by extreme rainfall events, particularly flooding that occurred early in May and June. As such, bypasses are not expected to reoccur at these facilities unless caused by extreme weather and flooding. For three of the cities, bypasses occurred three or more times, signifying structural problems that needs to be corrected. The most common structural problem contributing to wastewater bypasses is inflow and infiltration into the wastewater collection system. This problem can be compounded by limited hydraulic capacity at the wastewater treatment facility. Based on these criteria, three cities were considered to have a chronic bypass problem: Claremont, Kasson, and West Concord. Each of these cities has upgraded their wastewater treatment facilities since 2001 and no longer have chronic bypass problems. A review of information for 2004 and 2005 revealed no facilities with chronic bypass issues. No facilities in the basin are known to currently have combined storm and sanitary sewer systems, which may lead to combined sewer overflow (CSO) discharges to surface waters. The City of Red Wing on the Mississippi River did correct such interconnections several years ago.
24

Livestock Facilities with NPDES Permits The MPCA currently uses the federal definition of a Concentrated Animal Feeding Operations (CAFO) in its regulation of animal feedlots. In Minnesota, the following types of livestock facilities are issued, and must operate under, a National Pollutant Discharge Elimination System (NPDES) permit: a) all federally defined (CAFOs), some of which are under 1000 animal units in size; and b) all CAFOs and non-CAFOs which have 1000 or more animal units. There are presently 137 livestock facilities or feedlots operating under NPDES permits in the Lower Mississippi River Basin of Minnesota; 103 within the impaired reach watersheds covered in this report. These feedlots must be designed to totally contain runoff, and manure management planning requirements are more stringent than for smaller feedlots. In accordance with the State of Minnesota’s agreement with EPA, CAFO’s with state-issued General NPDES permits must be inspected twice during every five year permitting cycle and CAFO’s with state issued Individual NPDES permits are inspected annually. The vast majority of livestock facilities in the Lower Mississippi River Basin in Minnesota are not CAFO’s subject to NPDES permit requirements. Nevertheless, they are subject to state feedlot rules which include provisions for registration, inspection, permitting, and upgrading. Much of this work is accomplished through delegation of authority from the state to county government. Individual Sewage Treatment Systems Of the rural population of the Lower Mississippi River basin, an estimated 65,314 – or 44 percent – have inadequate treatment of their household wastewater. This includes individual residences and unsewered communities, both incorporated and unincorporated. Nonconforming septic systems are considered to be an important source of fecal coliform bacteria, particularly during periods of low precipitation and runoff when this continuous source may dominate fecal coliform loads. Unsewered or undersewered communities include older individual systems that are generally failing, and/or collection systems that discharge directly to surface water. This may result in locally high concentations of wastewater contaminants in surface water, including fecal coliform bacteria, in locations close to population centers where risk of exposure is relatively high. The court decision leading to this revised TMDL included the following language related to septic systems that discharge directly to surface waters: “MCEA describes a straight pipe septic system as a system of disposing untreated sewage directly via a pipe to rivers, lakes, drain tiles, or ditches. Such systems are illegal pursuant to Minnesota Statute. Minn. Stat. §§ 115.55 and 115.56.”
25

The MPCA concurs that these are illegal and un-permitted systems, and would expand the definition slightly to include partially treated, as well as untreated, sewage. The majority of these systems likely have some form of rudimentary settling which may provide partial, but inadequate, treatment. The Minnesota Rules Chapter 7080 definition of septic systems posing an imminent threat to public health or safety includes “surface or surface water discharges and sewage backup into a dwelling or other establishment.” Straight pipe septic systems clearly meet this definition. An MPCA evaluation for the Minnesota River Basin suggests that improper Individual Sewage Treatment Systems (ISTS) may be responsible for approximately 74 fecal coliform bacteria organisms per 100 milliliter sample within larger rivers. 3 However, transport and survival of fecal coliform bacteria are not well understood, particularly as they are affected by the interaction of surface and ground water flows in the karst geology found throughout the Lower Mississippi Basin. Livestock Manure Runoff from livestock feedlots, pastures, and land application areas has the potential to be a significant source of fecal coliform bacteria and other pollutants. There is considerable spatial variation in the type and density of livestock across the basin. Swine accounts for the major share of livestock animal units in several counties in the west and south-central part of the basin: Freeborn, Mower, Steele, and Waseca Counties. Swine facilities tend to confine livestock under a roof, with a pit for liquid manure beneath a slated floor. Thus, feedlot runoff tends not to be a common occurrence with most facilities, but land application of manure can be a major source of nonpoint pollution runoff. Liquid swine manure is commonly incorporated into the soil during, or shortly after, land application. This greatly reduces the pollution for bacteria runoff Dairy and beef cattle predominate livestock numbers in the eastern and, especially, the southeastern counties, including Wabasha, Winona, Fillmore, Goodhue, Houston, and Olmsted Counties. The majority of cattle operations are relatively small, with open feedlots, presenting the potential for polluted runoff much of the year. Considerable grazing of cattle still occurs in the eastern basin. Where over-grazing occurs, serious erosion and manure runoff can result. This includes grazing of woodland, which can result in severe erosion. However, properly managed pasture can increase infiltration of precipitation into the soil profile, reducing runoff and improving water quality. In Dakota, Rice, and Dodge Counties, livestock are about evenly divided between swine and cattle. For a number of reasons, cattle manure is generally less likely to be incorporated into the soil than swine manure. Manure that is not incorporated has a higher potential for runoff. 3 David Morrison, “Contributions from Septic Systems and Undersewered Communities,” presented at Bacteria in the Minnesota River , Mankato, Minnesota, Feb 16, 1999
26

Rice, Steele, Dodge, and Olmsted counties have a significant amount of poultry production, accounting for around 10% of the total animal units in these counties. While there is little runoff potential from the enclosed poultry facilities themselves, open stockpiling of poultry manure is a common practice. These stockpiles, as well as land application areas, are potential sources of bacteria runoff. Urban and Rural Stormwater Untreated stormwater from cities, small towns, and rural residential or commercial areas can be a source for many pollutants including fecal coliform bacteria and associated pathogens. Fecal coliform concentrations in urban runoff can be as great or greater than those found in cropland runoff, and feedlot runoff (USEPA 2001). Sources of fecal coliform in urban and residential stormwater include pet and wildlife waste that can be directly conveyed to streams and rivers via impervious surfaces and storm sewer systems. Newer urban development often includes stormwater treatment in the form of such practices as sedimentation basins, infiltration areas, and vegetated filter strips. Several communities within the watersheds of the impaired reaches included in this report are required to obtain Municipal Separate Storm Sewer System (MS4) permits. These permits require a range of actions that will ultimately reduce the impact of stormwater from these communities on downstream water bodies. Smaller communities or even rural residences not covered under MS4 permits may still need to take action to reduce stormwater, and associated bacteria, runoff.
27

5.0 LOAD ALLOCATIONS (LA), WASTELOAD ALLOCATIONS (WLA), and MARGINS OF SAFETY (MOS)
5.1 Approach to Allocations Needed to Satisfy the TMDLs The TMDLs developed for the 39 reaches in this report consist of three main components; WLA, LA, and MOS as defined in section 1.0. The WLA includes four sub-categories: permitted wastewater treatment facilities; communities subject to Stormwater MS4 NPDES permit requirements; livestock facilities requiring NPDES permits, and “straight pipe” septic systems. The LA, reported as a single category includes manure runoff from farm fields, pastures, and smaller non-NPDES-permitted feedlots, runoff from smaller non-MS4 communities, and fecal coliform contributions from wildlife. The LA includes land-applied manure from livestock facilities requiring NPDES permits, provided the manure is applied in accordance with the permit. The third component, MOS, is the part of the allocation that accounts for uncertainty that the allocations will result in attainment of water quality standards. The three TMDL components (WLA, LA, and MOS) were calculated as total monthly loads of fecal coliform organisms. Two different approaches were evaluated for expressing the monthly fecal coliform loads: 1) the number of fecal coliform organisms per month for each month from April to October; and 2) the number of fecal coliform organisms per month for a each of series of five flow zones ranging from low flow to high flow. Respectively, these are referred to as the monthly approach and the duration curve approach. Both approaches utilize long-term flow records from 14 current and historical U.S. Geological Survey gage stations located throughout the Lower Mississippi basin (Appendix A). Flow values from the most appropriate USGS site were normalized for the contributing drainage areas of each of the 39 impaired reaches. One advantage of the monthly approach is its direct correspondence to the monthly period of the fecal coliform standard as it is written in Minnesota water quality rules. A second advantage may be the potential for easier communication to the public. However, this approach required selecting specific flows to represent each month. While monthly “average” flows can be calculated from any given period of record, they do not represent the full range of monthly flows that may be observed over many years. Allocations based on average monthly flows will ensure that water quality standards are achieved at or above the average flow, but not at lower flows. If a minimum monthly flow is chosen, allocations set to achieve standards for this volume of water will be overprotective at all higher flows, raising question about attainability of the allocations, particularly at higher flows where fecal coliform loads are dominated by surface runoff. To overcome the apparent arbitrariness involved in making decisions on monthly flow values, and in concurrence with USEPA recommendations (Appendix D), the duration curve approach was chosen. Under this approach, allocations for each listed stream reach are developed for the full range of flows experienced during the April 1 – Oct 31 period of the fecal coliform standard. By adjusting the wasteload allocation, load
28

allocation and margin of safety to a range of five discrete flow intervals at each reach, a closer correspondence is obtained between the (flow-specific) loading capacity and the TMDL components (WLA + LA + MOS), at the range of flow conditions experienced historically at each site. This approach also makes it possible to relate fecal coliform sources to allocations more specifically. For example, continuous discharges such as failing ISTS will be more prominent at lower flows, and manure runoff will be more prominent at higher flows. This kind of distinction is easier to make with the duration curve approach than with a monthly approach. A more complete presentation of the two different approaches for expressing fecal coliform load is provided in Appendix A. In particular, Figure A-4 provides an example (for the Vermillion River) of the relationship between monthly flows and flow zones, and how the complete range of monthly flows is encompassed in the five flow zones. The fecal coliform loading expression utilized for the TMDLs contained in this report is organisms per month, which are shown for each of a range of five flow intervals at each impaired reach. For a given impaired reach, flow-specific loading capacities were obtained by multiplying the median flow of each of five flow zones by the geometric mean water quality criterion of 200 organisms per 100 ml. This generally produces loading capacities in the trillions of organisms per month (tera- or T-org/month). For each impaired reach and flow condition, the total loading capacity (TMDL) was divided into its component wasteload allocation, load allocation, and margin of safety (MOS). The process was as follows: WASTELOAD ALLOCATION
• Wastewater treatment facility (WWTF) allocations were calculated by multiplying wet-weather design flows for all facilities in an impaired reach watershed by the permitted discharge limit (200 organisms per 100ml) that applies to all WWTFs. As long as WWTFs discharge at or below this permit limit, they will not cause violations of the fecal coliform water quality standard regardless of their fecal coliform load.
• A number of smaller NPDES-permitted WWTF’s are stabilization ponds systems. Unlike the larger (and some smaller) mechanical treatment systems which have continuous discharges, pond systems typically discharge over a 1-2 week period in the spring and in the fall. Because the discharge volumes from these pond systems are small, and to provide an extra margin of safety in the event they needed to discharge outside of the spring or fall window, the WWTF wasteload allocation assumed that these facilities could discharge for an entire month under any flow conditions.
• Straight-pipe septic systems are illegal and un-permitted, and as such are assigned a zero wasteload allocation.
• Since wet-weather design flows represent a “maximum” flow for a facility, the WWTF allocations are conservative in that they are substantially greater than what is actually required.
29

• For two of the impaired reaches (Vermillion and Shell Rock Rivers) WWTF design flows exceed minimum stream flow for the low and dry flow zones. For the lower reach of the Vermillion, this also occurred for the low flow zone when MOS was considered. Of course, actual WWTF flow can never exceed stream flow as it is a component of stream flow. To account for these three unique situations only, the wasteload and load allocations are expressed as an equation rather than an absolute number. That equation is simply:
Allocation = (flow contribution from a given source) X (200 orgs./100ml.)
In essence, this amounts to assigning a concentration-based limit to MS4 communities and nonpoint source load allocation sources. While this might be seen as quite stringent, these sources tend not to be significant contributors under dry and low flow conditions. The contribution of fecal coliform from straight-pipe septic systems could be substantial under these conditions; however these systems are still assigned a zero allocation, as are livestock facilities with NPDES permits.
• Livestock facilities that have been issued NPDES permits are assigned a zero wasteload allocation. This is consistent with the conditions of the permits, which allow no pollutant discharge from the livestock housing facilities and associated site. Discharge of fecal coliform from fields where manure has been land applied may occur at times. Such discharges are covered under the load allocation portion of the TMDLs, provided the manure is applied in accordance with the permit.
• The WWTF allocation and MOS were subtracted from the total loading capacity. The remaining capacity was divided between municipal separate storm sewer system (MS4) permits (wasteload allocation) and all nonpoint sources (load allocation) based on the percentage of land in an impaired reach watershed covered by MS4 permits. For example, if 10% of an impaired reach watershed is covered by one or more MS4 permits, 10% of the remaining capacity is allocated to those permits. In addition to being a practical way to allocate between MS4 permits and all other nonpoint sources, it is also equitable from the standpoint of rural and urban fecal coliform sources being held to the same “standard.”
MARGIN OF SAFETY
• Margins of safety (MOS) were calculated based on the difference between the median flow and minimum flow in each zone as described in appendix A. For the low flow zone, this reflects the lowest monthly April-October flow observed over the past 30 years (or period of record if less than 30 years) at the specific USGS site used to develop allocations for each impaired reach.
• The purpose of the MOS is to account for uncertainty that the allocations will result in attainment of water quality standards. Because the allocations are a direct function of monthly flow, accounting for potential flow variability is the appropriate way to address the MOS. This is done within each of 5 flow zones.
30

As stated above, the absolute minimum monthly flows over long periods of record at the USGS gage sites define the MOS for the low flow zone.
LOAD ALLOCATION
• Once the WLA and MOS were determined for a given reach and flow zone, the remaining loading capacity was considered load allocation. The load allocation includes nonpoint pollution sources that are not subject to NPDES permit requirements, as well as “natural background” sources such as wildlife. The nonpoint pollution sources are largely related to livestock production, inadequate human wastewater treatment, and municipal stormwater systems. Portions of the latter two sources, straight-pipe septic systems and communities covered by MS4 NPDES permits, are included in the wasteload allocation.
31

5.2 TMDL Allocations for Individual Impaired Reaches 5.21 Cannon River, Pine Creek to Belle Creek (AUID: 07040002-502) The 11-mile reach of the Cannon River from Pine Creek to Belle Creek was added to the Section 303(d) Clean Water Act impaired waters list in 1994. The primary source of data that led to this listing was the MPCA Milestone long-term monitoring program. The drainage area to the downstream end of this impaired reach is 1,386 square miles. This represents over 90% of the entire Cannon River watershed. Land use in the watershed upstream of the impairment (Table 2.1) is dominated by cultivated land (70%), but exhibits a relatively high percentage water and wetlands (4%) which are located primarily in the western portion of the Cannon River watershed upstream of the confluence with the Straight River. The watershed includes 14 communities and a highway rest area served by permitted wastewater treatment facilities (Table 5.21A); and 32 livestock facilities that have been issued NPDES permits (Table 5.21B). Approximately 24,000 acres, or 3% of the watershed, will require coverage under MS4 permits. This includes the cities of Faribault, Owatonna, Northfield, and Waseca (Table 5.21C). An additional 1% of the watershed area contains smaller towns and rural residences. Table 5.21D describes the monthly fecal coliform loading capacities for this reach of the Cannon River to achieve water quality standards, as well as the component wasteload allocations, load allocations, and margins of safety. The loading capacities for five flow zones were developed using flow data from the USGS gage site on the Cannon River at Welch as described in Appendix A. Substantial reductions in fecal coliform loading from straight-pipe septic systems, and a variety of nonpoint sources will likely be required to meet the allocations. It is possible that Lake Byllesby, as well as other lakes and wetlands in the upper Cannon watershed, function to reduce downstream bacteria loading. As such, some focus on sources downstream of Lake Byllesby may lead to greater water quality improvements on the impaired reach. Table 5.21A. Wastewater Treatment Facilities Name/Location Permit
Number Design Flow (mgd)
WLA (t-orgs./mo.)
Cannon Falls WWTP MN0022993 0.92 0.21 Dennison WWTP MN0022195 0.029 0.01 Ellendale WWTP MN0041564 0.1003 0.02 Elysian WWTP MN0041114 0.0186 0.004 Faribault WWTP MN0030121 7 1.59 Geneva WWTP MN0021008 0.069 0.02 Kilkenny WWTP MNG580084 0.0228 0.01 Lonsdale WWTP MN0031241 0.2418 0.05 MNDOT Straight River Rest Area
MN0049514 0.0093 0.002
32

Medford WWTP MN0024112 0.09 0.02 Morristown WWTP MN0025895 0.21 0.05 Nerstrand WWTP MN0065668 0.042 0.01 Northfield WWTP MN0024368 5.2 1.18 Owatonna WWTP MN0051284 5 1.14 Waterville WWTP MN0025208 0.271 0.06
Totals 19.22 4.37 Table 5.21B. Livestock Facilities with NPDES Permits Facility ID Number Description Matthew Hanson Farm 131-104880 3,300 Swine - 55 lbs. or More Fern Peterson Farm 049-73087 100,000 Turkeys Hovel Farms - Sec 33 049-82020 2,600 Swine - 55 lbs. or More Randall S Rauk Farm 049-50008 3,300 Swine - 55 lbs. or More Scott Gustafson Farm 049-50005 4,440 Swine - 55 lbs. or More Tim and Marvin D Donkers Farm 049-72775 2,800 Swine - 55 lbs. or More Gibbs Farms Inc 079-80335 4,000 Swine - 55 lbs. or More Koppelman Farm's Inc 079-50006 3,300 Swine - 55 lbs. or More MN Dak Farms 079-66313 2,500 Swine - 55 lbs. or More Eastgate Farms - Sec 32 - Main 131-93622 99,000 Turkeys Jennie-O Turkey Store - Lakeview 131-93683 211,800 Chickens - broilers, Jennie-O Turkey Store - Valleyview 131-50007 78,000 Turkeys Kent Holden Farm 131-93843 4,730 Swine - 55 lbs. or More Jennie-O Turkey Store - Hillcrest Farm 131-50006 144,000 Turkeys Ahlman Hog Farm Sec 11 147-50002 4,000 Swine - 55 lbs. or More Heers Family Farm 147-50006 4,000 Swine - 55 lbs. or More Jennie-O Turkey Store - Merton Farm 147-50008 144,000 Turkeys Steven Jaster Farm 147-50005 4,000 Swine - 55 lbs. or More Charles Zimmerman Farm - Sec 15 131-93142 230,000 Chickens - broilers, Holden Farms - Fallbro - Sec 17 131-93606 216,000 Chickens - broilers, Holden Farms Inc - Fallingbrook Facility 131-50005 60,000 Turkeys P & J Products Co - Site III 131-50004 73,500 Turkeys
Bruce Peterson Farm - Sec 34 131-93620 2,280 Swine – 55 lbs. or More + some beef and dairy
Chad Johnson Farm 047-102279 3,120 Swine - 55 lbs. or More Brian Waage Farm 147-50003 4,000 Swine - 55 lbs. or More J&K Farms LLC 147-92330 4,800 Swine - 55 lbs. or More Jeff Ptacek Farm - Sec 36 147-92217 4,000 Swine - 55 lbs. or More Shane & Rod Wagner Farm - Sec 15 147-92127 4,400 Swine - 55 lbs. or More Brian J Kosel Farm - Sec 23 147-92323 2,720 Swine - 55 lbs. or More Jennie-O Turkey Store - Deerfield Farm 147-50007 144,000 Turkeys Wingspan LLP 161-50012 7,200 Swine - 55 lbs. or More
Woodville Pork 161-50011 2,400 Swine – 55 lbs. or More 1,800 Swine – under 55 lbs.
33

Table 5.21C. Municipal Separate Storm Sewer System (MS4) Communities Community Population
Estimate Category
Faribault 20,818 Designated by rule; > 10,000 population Owatonna 22,434 Designated by rule; > 10,000 population Northfield 17,147 Designated by rule; > 10,000 population Waseca 8,493 Designated by rule; > 10,000 population and
within ½ mile of an impaired water (Clear Lake)
Table 5.21D. Monthly Fecal Coliform Loading Capacities and Allocations - Cannon River, Pine Creek to Belle Creek (AUID: 07040002-502) Drainage Area (square miles): 1,386USGS gage used to develop flow zones and loading capacities:
Cannon River at Welch% MS4 Urban: 3%Total WWTF Flow (mgd): 19.2238 Flow Zone
High Moist Mid Dry Lowvalues expressed as trillion organisms per month (tera- or T-org./month)
TOTAL MONTHLY LOADING CAPACITY 395.39 143.11 66.89 31.63 14.55Wasteload Allocation
Permitted Wastewater Treatment Facilities 4.37 4.37 4.37 4.37 4.37Communities Subject to MS4 NPDES Requirements 6.86 2.52 1.12 0.39 0.15Livestock Facilities Requiring NPDES Permits 0 0 0 0 0"Straight Pipe" Septic Systems 0 0 0 0 0
Load Allocation 247.07 90.61 40.16 14.14 5.42Margin of Safety 137.10 45.62 21.25 12.73 4.61
values expressed as percent of total month loading capacityTOTAL MONTHLY LOADING CAPACITY 100% 100% 100% 100% 100%Wasteload Allocation
Permitted Wastewater Treatment Facilities 1.1% 3.1% 6.5% 13.8% 30.0%Communities Subject to MS4 NPDES Requirements 1.7% 1.8% 1.7% 1.2% 1.0%Livestock Facilities Requiring NPDES Permits 0.0% 0.0% 0.0% 0.0% 0.0%"Straight Pipe" Septic Systems 0.0% 0.0% 0.0% 0.0% 0.0%
Load Allocation 62.5% 63.3% 60.0% 44.7% 37.3%Margin of Safety 34.7% 31.9% 31.8% 40.2% 31.7%
34

5.22 Prairie Creek, Headwaters to Cannon River (Lake Byllesby) (AUID: 07040002-504) The entire 26-mile length of Prairie Creek, a tributary of the Cannon River that flows into Lake Byllesby near Cannon Falls, was added to the Section 303(d) Clean Water Act impaired waters list in 1994. The primary source of data that led to this listing was the MPCA Milestone long-term monitoring program. The drainage area to the downstream end of this impaired reach is 80 square miles, encompassing land in both Rice and Goodhue counties. Land use in the watershed upstream of the impairment (Table 2.1) is dominated by cultivated land (76%). The watershed includes one community (Dennison) served by a permitted wastewater treatment facility (Table 5.22A); and five livestock facilities that have been issued NPDES permits (Table 5.22B). At the present time, none of the watershed requires coverage under a MS4 permit (Table 5.22C). Table 5.22D describes the monthly fecal coliform loading capacities for Prairie Creek to achieve water quality standards, as well as the component wasteload allocations, load allocations, and margins of safety. The loading capacities for five flow zones were developed using flow data from the USGS gage site on the Straight River near Faribault as described in Appendix A. Substantial reductions in fecal coliform loading from straight-pipe septic systems, and a variety of nonpoint sources will likely be required to meet the allocations. Table 5.22A. Wastewater Treatment Facilities Name/Location Permit
Number Design Flow (mgd)
WLA (t-orgs./mo.)
Dennison WWTP MN0022195 0.029 0.01 Table 5.22B. Livestock Facilities with NPDES Permits Facility ID Number Description Charles Zimmerman Farm - Sec 15 131-93142 230,000 Chickens - broilers, Holden Farms - Fallbro - Sec 17 131-93606 216,000 Chickens - broilers, Holden Farms Inc - Fallingbrook Facility 131-50005 60,000 Turkeys P & J Products Co - Site III 131-50004 73,500 Turkeys
Bruce Peterson Farm - Sec 34 131-93620 2,280 Swine – 55 lbs. or More + some beef and dairy
Table 5.22C. Municipal Separate Storm Sewer System (MS4) Communities Community Population
Estimate Category
none
35

Table 5.22D. Monthly Fecal Coliform Loading Capacities and Allocations - Prairie Creek, Headwaters to Cannon River (Lake Byllesby) (AUID: 07040002-504) Drainage Area (square miles): 80USGS gage used to develop flow zones and loading capacities:
Straight River near Faribault% MS4 Urban: 0%Total WWTF Design Flow (mgd): 0.029 Flow Zone
High Moist Mid Dry Lowvalues expressed as trillion organisms per month (tera- or T-org./month)
TOTAL MONTHLY LOADING CAPACITY 29.65 13.31 6.22 2.36 0.87Wasteload Allocation
Permitted Wastewater Treatment Facilities 0.01 0.01 0.01 0.01 0.01Communities Subject to MS4 NPDES Requirements 0.00 0.00 0.00 0.00 0.00Livestock Facilities Requiring NPDES Permits 0 0 0 0 0"Straight Pipe" Septic Systems 0 0 0 0 0
Load Allocation 22.10 8.41 4.06 1.11 0.41Margin of Safety 7.54 4.89 2.15 1.24 0.45
values expressed as percent of total month loading capacityTOTAL MONTHLY LOADING CAPACITY 100% 100% 100% 100% 100%Wasteload Allocation
Permitted Wastewater Treatment Facilities 0.0% 0.0% 0.1% 0.3% 0.8%Communities Subject to MS4 NPDES Requirements 0.0% 0.0% 0.0% 0.0% 0.0%Livestock Facilities Requiring NPDES Permits 0.0% 0.0% 0.0% 0.0% 0.0%"Straight Pipe" Septic Systems 0.0% 0.0% 0.0% 0.0% 0.0%
Load Allocation 74.5% 63.2% 65.3% 47.2% 47.5%Margin of Safety 25.4% 36.7% 34.6% 52.5% 51.7%
36

5.23 Unnamed Creek, Headwaters to Prairie Creek (AUID: 07040002-512) Prairie Creek, a tributary of the Cannon River that flows into Lake Byllesby near Cannon Falls, was added to the Section 303(d) Clean Water Act impaired waters list in 1994. This 3-mile unnamed tributary to Prairie Creek was added to the list in 2002. The primary source of data that led to this listing was a fecal coliform special study conducted by the MPCA in 1997 and 1998 (Markus, 1999). Figure 1.1 shows two unnamed tributaries to Prairie Creek; this tributary is north (closer to Lake Byllesby) of the other, and straddles the Rice/Goodhue county line. The drainage area to the downstream end of this impaired reach is 17 square miles. Land use in the watershed upstream of the impairment (Table 2.1) is dominated by cultivated land (84%). The watershed includes one community (Dennison) served by a permitted wastewater treatment facility (Table 5.23A); but no livestock facilities have been issued NPDES permits (Table 5.23B). At the present time, none of the watershed requires coverage under a MS4 permit (Table 5.23C). Table 5.23D describes the monthly fecal coliform loading capacities for this Unnamed Creek to achieve water quality standards, as well as the component wasteload allocations, load allocations, and margins of safety. The loading capacities were developed using flow data from the USGS gage site on the Straight River near Faribault as described in Appendix A. Substantial reductions in fecal coliform loading from straight-pipe septic systems, and a variety of nonpoint sources will likely be required to meet the allocations. Table 5.23A. Wastewater Treatment Facilities Name/Location Permit
Number Design Flow (mgd)
WLA (t-orgs./mo.)
Dennison WWTP MN0022195 0.029 0.01 Table 5.23B. Livestock Facilities with NPDES Permits Facility ID Number Description none Table 5.23C. Municipal Separate Storm Sewer System (MS4) Communities Community Population
Estimate Category
none
37

Table 5.23D. Monthly Fecal Coliform Loading Capacities and Allocations - Unnamed Creek, Headwaters to Prairie Creek (AUID: 07040002-512) Drainage Area (square miles): 17USGS gage used to develop flow zones and loading capacities:
Straight River near Faribault% MS4 Urban: 0%Total WWTF Design Flow (mgd): 0.029 Flow Zone
High Moist Mid Dry Lowvalues expressed as trillion organisms per month (tera- or T-org./month)
TOTAL MONTHLY LOADING CAPACITY 6.53 2.93 1.37 0.52 0.19Wasteload Allocation
Permitted Wastewater Treatment Facilities 0.01 0.01 0.01 0.01 0.01Communities Subject to MS4 NPDES Requirements 0.00 0.00 0.00 0.00 0.00Livestock Facilities Requiring NPDES Permits 0 0 0 0 0"Straight Pipe" Septic Systems 0 0 0 0 0
Load Allocation 4.86 1.84 0.89 0.24 0.08Margin of Safety 1.66 1.08 0.47 0.27 0.10
values expressed as percent of total month loading capacityTOTAL MONTHLY LOADING CAPACITY 100% 100% 100% 100% 100%Wasteload Allocation
Permitted Wastewater Treatment Facilities 0.1% 0.2% 0.5% 1.3% 3.5%Communities Subject to MS4 NPDES Requirements 0.0% 0.0% 0.0% 0.0% 0.0%Livestock Facilities Requiring NPDES Permits 0.0% 0.0% 0.0% 0.0% 0.0%"Straight Pipe" Septic Systems 0.0% 0.0% 0.0% 0.0% 0.0%
Load Allocation 74.5% 62.9% 65.2% 46.8% 43.9%Margin of Safety 25.4% 36.9% 34.3% 51.9% 52.6%
38

5.24 Unnamed Tributary, Headwaters to Prairie Creek (AUID: 07040002-513) Prairie Creek, a tributary of the Cannon River that flows into Lake Byllesby near Cannon Falls, was added to the Section 303(d) Clean Water Act impaired waters list in 1994. This 5-mile unnamed tributary to Prairie Creek was added to the list in 2002. The primary source of data that led to this listing was a fecal coliform special study conducted by the MPCA in 1997 and 1998 (Markus, 1999). Figure 1.1 shows two unnamed tributaries to Prairie Creek; this tributary is south (further from Lake Byllesby) of the other, and lies completely in Rice County. The drainage area to the downstream end of this impaired reach is 13 square miles. Land use in the watershed upstream of the impairment (Table 2.1) is dominated by cultivated land (84%). The watershed contains no communities served by permitted wastewater treatment facilities (Table 5.24A) or livestock facilities that have been issued NPDES permits (Table 5.24B). At the present time, none of the watershed requires coverage under a MS4 permit (Table 5.24C). Table 5.24D describes the monthly fecal coliform loading capacities for this Unnamed Creek to achieve water quality standards, as well as the component wasteload allocations, load allocations, and margins of safety. The loading capacities were developed using flow data from the USGS gage site on the Straight River near Faribault as described in Appendix A. Substantial reductions in fecal coliform loading from straight-pipe septic systems, and a variety of nonpoint sources will likely be required to meet the allocations. Table 5.24A. Wastewater Treatment Facilities Name/Location Permit
Number Design Flow (mgd)
WLA (t-orgs./mo.)
none Table 5.24B. Livestock Facilities with NPDES Permits Facility ID Number Description none Table 5.24C. Municipal Separate Storm Sewer System (MS4) Communities Community Population
Estimate Category
none
39

Table 5.24D. Monthly Fecal Coliform Loading Capacities and Allocations - Unnamed Tributary, Headwaters to Prairie Creek (AUID: 07040002-513) Drainage Area (square miles): 13USGS gage used to develop flow zones and loading capacities:
Straight River near Faribault% MS4 Urban: 0%Total WWTF Design Flow (mgd): 0 Flow Zone
High Moist Mid Dry Lowvalues expressed as trillion organisms per month (tera- or T-org./month)
TOTAL MONTHLY LOADING CAPACITY 4.66 2.09 0.98 0.37 0.14Wasteload Allocation
Permitted Wastewater Treatment Facilities 0.00 0.00 0.00 0.00 0.00Communities Subject to MS4 NPDES Requirements 0.00 0.00 0.00 0.00 0.00Livestock Facilities Requiring NPDES Permits 0 0 0 0 0"Straight Pipe" Septic Systems 0 0 0 0 0
Load Allocation 3.47 1.32 0.64 0.18 0.07Margin of Safety 1.19 0.77 0.34 0.19 0.07
values expressed as percent of total month loading capacityTOTAL MONTHLY LOADING CAPACITY 100% 100% 100% 100% 100%Wasteload Allocation
Permitted Wastewater Treatment Facilities 0.0% 0.0% 0.0% 0.0% 0.0%Communities Subject to MS4 NPDES Requirements 0.0% 0.0% 0.0% 0.0% 0.0%Livestock Facilities Requiring NPDES Permits 0.0% 0.0% 0.0% 0.0% 0.0%"Straight Pipe" Septic Systems 0.0% 0.0% 0.0% 0.0% 0.0%
Load Allocation 74.5% 63.2% 65.3% 48.6% 50.0%Margin of Safety 25.5% 36.8% 34.7% 51.4% 50.0%
40

5.25 Chub Creek, Headwaters to Cannon River (Lake Byllesby) (AUID: 07040002-528) The entire 20-mile length of Chub Creek, a tributary of the Cannon River with the confluence just at the upstream end of Lake Byllesby, was added to the Section 303(d) Clean Water Act impaired waters list in 2004. The primary source of data that led to this listing was monitoring carried out by Dakota County in 1999 and 2000. The drainage area to the downstream end of this impaired reach is 64 square miles, all of which falls within Dakota County. Land use in the watershed upstream of the impairment (Table 2.1) about one-half cultivated, but includes a high percentage of grassland (31%) and forest (15%) for this part of the state. The watershed contains no communities served by permitted wastewater treatment facilities (Table 5.25A) and no livestock facilities that have been issued NPDES permits (Table 5.25B). At the present time, none of the watershed requires coverage under a MS4 permit (Table 5.25C). Table 5.25D describes the monthly fecal coliform loading capacities for Chub Creek to achieve water quality standards, as well as the component wasteload allocations, load allocations, and margins of safety. The loading capacities were developed using flow data from the USGS gage site on the Straight River near Faribault as described in Appendix A. Substantial reductions in fecal coliform loading from straight-pipe septic systems, and a variety of nonpoint sources will likely be required to meet the allocations. Table 5.25A. Wastewater Treatment Facilities Name/Location Permit
Number Design Flow (mgd)
WLA (t-orgs./mo.)
none Table 5.25B. Livestock Facilities with NPDES Permits Facility ID Number Description none Table 5.25C. Municipal Separate Storm Sewer System (MS4) Communities Community Population
Estimate Category
none
41

Table 5.25D. Monthly Fecal Coliform Loading Capacities and Allocations - Chub Creek, Headwaters to Cannon River (Lake Byllesby) (AUID: 07040002-528) Drainage Area (square miles): 64USGS gage used to develop flow zones and loading capacities:
Straight River near Faribault% MS4 Urban: 0%Total WWTF Design Flow (mgd): 0 Flow Zone
High Moist Mid Dry Lowvalues expressed as trillion organisms per month (tera- or T-org./month)
TOTAL MONTHLY LOADING CAPACITY 23.79 10.68 4.99 1.90 0.70Wasteload Allocation
Permitted Wastewater Treatment Facilities 0.00 0.00 0.00 0.00 0.00Communities Subject to MS4 NPDES Requirements 0.00 0.00 0.00 0.00 0.00Livestock Facilities Requiring NPDES Permits 0 0 0 0 0"Straight Pipe" Septic Systems 0 0 0 0 0
Load Allocation 17.74 6.76 3.27 0.91 0.34Margin of Safety 6.05 3.92 1.72 0.99 0.36
values expressed as percent of total month loading capacityTOTAL MONTHLY LOADING CAPACITY 100% 100% 100% 100% 100%Wasteload Allocation
Permitted Wastewater Treatment Facilities 0.0% 0.0% 0.0% 0.0% 0.0%Communities Subject to MS4 NPDES Requirements 0.0% 0.0% 0.0% 0.0% 0.0%Livestock Facilities Requiring NPDES Permits 0.0% 0.0% 0.0% 0.0% 0.0%"Straight Pipe" Septic Systems 0.0% 0.0% 0.0% 0.0% 0.0%
Load Allocation 74.6% 63.3% 65.5% 47.9% 48.6%Margin of Safety 25.4% 36.7% 34.5% 52.1% 51.4%
42

5.26 Cannon River, Northfield Dam to Lake Byllesby Inlet (AUID: 07040002-509) The 10-mile reach of the Cannon River from the Northfield dam to the inlet of Lake Byllesby was added to the Section 303(d) Clean Water Act impaired waters list in 2004. The primary source of data that led to this listing was monitoring work carried out by the Cannon River Watershed Partnership in 1998, 2001, and 2002 The drainage area to the downstream end of this impaired reach is 957 square miles. This represents about two-thirds of the entire Cannon River watershed. Land use in the watershed upstream of the impairment (Table 2.1) is dominated by cultivated land (72%), but exhibits the highest percentage water and wetlands (5%) among the impaired reach watersheds included in this report. These lakes and wetlands are located primarily in the western portion of the Cannon River watershed upstream of the confluence with the Straight River. The watershed includes 11 communities and a highway rest area served by permitted wastewater treatment facilities (Table 5.26A); and 21 livestock facilities that have been issued NPDES permits (Table 5.26B). Approximately 24,000 acres, or 4% of the watershed, will require coverage under MS4 permits. This includes the cities of Faribault, Owatonna, Northfield, and Waseca (Table 5.26C). An additional 1% of the watershed area contains smaller towns and rural residences. Table 5.26D describes the monthly fecal coliform loading capacities for this reach of the Cannon River to achieve water quality standards, as well as the component wasteload allocations, load allocations, and margins of safety. The loading capacities were developed using flow data from the USGS gage site on the Cannon River near Welch as described in Appendix A. Substantial reductions in fecal coliform loading from straight-pipe septic systems, and a variety of nonpoint sources will likely be required to meet the allocations. Table 5.26A. Wastewater Treatment Facilities Name/Location Permit
Number Design Flow (mgd)
WLA (t-orgs./mo.)
Ellendale WWTP MN0041564 0.1003 0.02 Elysian WWTP MN0041114 0.0186 0.004 Faribault WWTP MN0030121 7 1.59 Geneva WWTP MN0021008 0.069 0.02 Kilkenny WWTP MNG580084 0.0228 0.01 Lonsdale WWTP MN0031241 0.2418 0.05 MNDOT Straight River Rest Area
MN0049514 0.0093 0.002
Medford WWTP MN0024112 0.09 0.02 Morristown WWTP MN0025895 0.21 0.05 Northfield WWTP MN0024368 5.2 1.18 Owatonna WWTP MN0051284 5 1.14
43

Waterville WWTP MN0025208 0.271 0.06 Totals 18.23 4.14
Table 5.26B. Livestock Facilities with NPDES Permits Facility ID Number Description Gibbs Farms Inc 079-80335 4,000 Swine - 55 lbs. or More Koppelman Farm's Inc 079-50006 3,300 Swine - 55 lbs. or More MN Dak Farms 079-66313 2,500 Swine - 55 lbs. or More Eastgate Farms - Sec 32 - Main 131-93622 99,000 Turkeys Jennie-O Turkey Store - Lakeview 131-93683 211,800 Chickens - broilers, Jennie-O Turkey Store - Valleyview 131-50007 78,000 Turkeys Kent Holden Farm 131-93843 4,730 Swine - 55 lbs. or More Jennie-O Turkey Store - Hillcrest Farm 131-50006 144,000 Turkeys Ahlman Hog Farm Sec 11 147-50002 4,000 Swine - 55 lbs. or More Heers Family Farm 147-50006 4,000 Swine - 55 lbs. or More Jennie-O Turkey Store - Merton Farm 147-50008 144,000 Turkeys Steven Jaster Farm 147-50005 4,000 Swine - 55 lbs. or More Chad Johnson Farm 047-102279 3,120 Swine - 55 lbs. or More Brian Waage Farm 147-50003 4,000 Swine - 55 lbs. or More J&K Farms LLC 147-92330 4,800 Swine - 55 lbs. or More Jeff Ptacek Farm - Sec 36 147-92217 4,000 Swine - 55 lbs. or More Shane & Rod Wagner Farm - Sec 15 147-92127 4,400 Swine - 55 lbs. or More Brian J Kosel Farm - Sec 23 147-92323 2,720 Swine - 55 lbs. or More Jennie-O Turkey Store - Deerfield Farm 147-50007 144,000 Turkeys Wingspan LLP 161-50012 7,200 Swine - 55 lbs. or More
Woodville Pork 161-50011 2,400 Swine – 55 lbs. or More 1,800 Swine – under 55 lbs.
Table 5.26C. Municipal Separate Storm Sewer System (MS4) Communities Community Population
Estimate Category
Faribault 20,818 Designated by rule; > 10,000 population Owatonna 22,434 Designated by rule; > 10,000 population Northfield 17,147 Designated by rule; > 10,000 population Waseca 8,493 Designated by rule; > 10,000 population and
within ½ mile of an impaired water (Clear Lake)
44

Table 5.26D. Monthly Fecal Coliform Loading Capacities and Allocations - Cannon River, Northfield Dam to Lake Byllesby Inlet (AUID: 07040002-509) Drainage Area (square miles): 957USGS gage used to develop flow zones and loading capacities:
Cannon River at Welch% MS4 Urban: 4%Total WWTF Design Flow (mgd): 18.2328 Flow Zone
High Moist Mid Dry Lowvalues expressed as trillion organisms per month (tera- or T-org./month)
TOTAL MONTHLY LOADING CAPACITY 273.01 98.81 46.19 21.84 10.05Wasteload Allocation
Permitted Wastewater Treatment Facilities 4.14 4.14 4.14 4.14 4.14Communities Subject to MS4 NPDES Requirements 6.82 2.47 1.07 0.35 0.11Livestock Facilities Requiring NPDES Permits 0 0 0 0 0"Straight Pipe" Septic Systems 0 0 0 0 0
Load Allocation 167.38 60.70 26.31 8.56 2.62Margin of Safety 94.67 31.50 14.67 8.79 3.18
values expressed as percent of total month loading capacityTOTAL MONTHLY LOADING CAPACITY 100% 100% 100% 100% 100%Wasteload Allocation
Permitted Wastewater Treatment Facilities 1.5% 4.2% 9.0% 19.0% 41.2%Communities Subject to MS4 NPDES Requirements 2.5% 2.5% 2.3% 1.6% 1.1%Livestock Facilities Requiring NPDES Permits 0.0% 0.0% 0.0% 0.0% 0.0%"Straight Pipe" Septic Systems 0.0% 0.0% 0.0% 0.0% 0.0%
Load Allocation 61.3% 61.4% 57.0% 39.2% 26.1%Margin of Safety 34.7% 31.9% 31.8% 40.2% 31.6%
45

5.27 Straight River, Rush Creek to Cannon River (AUID: 07040002-515) The 13-mile reach of the Straight River from Rush Creek to the Cannon River was added to the Section 303(d) Clean Water Act impaired waters list in 2002. The primary source of data that led to this listing was monitoring work carried out by the Cannon River Watershed Partnership and MPCA in 1999 and 2000. The drainage area to the downstream end of this impaired reach is 461 square miles. Land use in the watershed upstream of the impairment (Table 2.1) is dominated by cultivated land (80%), much of which has surface (ditches) and subsurface (tile) drainage. The watershed includes five communities and a highway rest area served by permitted wastewater treatment facilities (Table 5.27A); and 14 livestock facilities that have been issued NPDES permits (Table 5.27B). Approximately 11,000 acres, or 4% of the watershed, will require coverage under MS4 permits. This includes the City of Owatonna, and about 40% of the City of Faribault (Table 5.27C). Stormwater from the remainder of Faribault enters the Cannon River downstream of the confluence with the Straight. An additional 1% of the watershed area contains smaller towns and rural residences. Table 5.27D describes the monthly fecal coliform loading capacities for this reach of the Straight River to achieve water quality standards, as well as the component wasteload allocations, load allocations, and margins of safety. The loading capacities were developed using flow data from the USGS gage site on the Straight River near Faribault as described in Appendix A. Substantial reductions in fecal coliform loading from straight-pipe septic systems, and a variety of nonpoint sources will likely be required to meet the other allocations. Table 5.27A. Wastewater Treatment Facilities Name/Location Permit
Number Design Flow (mgd)
WLA (t-orgs./mo.)
Ellendale WWTP MN0041564 0.1003 0.02 Faribault WWTP MN0030121 7 1.59 Geneva WWTP MN0021008 0.069 0.02 MNDOT Straight River Rest Area
MN0049514 0.0093 0.002
Medford WWTP MN0024112 0.09 0.02 Owatonna WWTP MN0051284 5 1.14
Totals 12.27 2.79 Table 5.27B. Livestock Facilities with NPDES Permits Facility ID Number Description Jennie-O Turkey Store - Hillcrest Farm 131-50006 144,000 Turkeys Ahlman Hog Farm Sec 11 147-50002 4,000 Swine - 55 lbs. or More Heers Family Farm 147-50006 4,000 Swine - 55 lbs. or More Jennie-O Turkey Store - Merton Farm 147-50008 144,000 Turkeys Steven Jaster Farm 147-50005 4,000 Swine - 55 lbs. or More
46

Chad Johnson Farm 047-102279 3,120 Swine - 55 lbs. or More Brian Waage Farm 147-50003 4,000 Swine - 55 lbs. or More J&K Farms LLC 147-92330 4,800 Swine - 55 lbs. or More Jeff Ptacek Farm - Sec 36 147-92217 4,000 Swine - 55 lbs. or More Shane & Rod Wagner Farm - Sec 15 147-92127 4,400 Swine - 55 lbs. or More Brian J Kosel Farm - Sec 23 147-92323 2,720 Swine - 55 lbs. or More Jennie-O Turkey Store - Deerfield Farm 147-50007 144,000 Turkeys Wingspan LLP 161-50012 7,200 Swine - 55 lbs. or More
Woodville Pork 161-50011 2,400 Swine – 55 lbs. or More 1,800 Swine – under 55 lbs.
Table 5.27C. Municipal Separate Storm Sewer System (MS4) Communities Community Population
Estimate Category
Faribault 20,818 Designated by rule; > 10,000 population Owatonna 22,434 Designated by rule; > 10,000 population Table 5.27D. Monthly Fecal Coliform Loading Capacities and Allocations - Straight River, Rush Creek to Cannon River (AUID: 07040002-515) Drainage Area (square miles): 461USGS gage used to develop flow zones and loading capacities:
Straight River near Faribault% MS4 Urban: 4%Total WWTF Design Flow (mgd): 12.2686 Flow Zone
High Moist Mid Dry *Lowvalues expressed as trillion organisms per month (tera- or T-org./month)
TOTAL MONTHLY LOADING CAPACITY 171.86 77.15 36.03 13.70 5.06Wasteload Allocation
Permitted Wastewater Treatment Facilities 2.79 2.79 2.79 2.79 2.79Communities Subject to MS4 NPDES Requirements 4.84 1.78 0.80 0.14 0.00Livestock Facilities Requiring NPDES Permits 0 0 0 0 0"Straight Pipe" Septic Systems 0 0 0 0 0
Load Allocation 120.52 44.27 19.99 3.60 0.00Margin of Safety 43.72 28.32 12.45 7.17 2.27
values expressed as percent of total month loading capacityTOTAL MONTHLY LOADING CAPACITY 100% 100% 100% 100% 100%Wasteload Allocation
Permitted Wastewater Treatment Facilities 1.6% 3.6% 7.7% 20.3% 55.1%Communities Subject to MS4 NPDES Requirements 2.8% 2.3% 2.2% 1.1% 0.0%Livestock Facilities Requiring NPDES Permits 0.0% 0.0% 0.0% 0.0% 0.0%"Straight Pipe" Septic Systems 0.0% 0.0% 0.0% 0.0% 0.0%
Load Allocation 70.1% 57.4% 55.5% 26.3% 0.0%Margin of Safety 25.4% 36.7% 34.6% 52.3% 44.9%*note - WWTF design flow exceeded minimum low flow; see section 5.1 for description of approach to allocation
47

5.28 Rush Creek, Headwaters to Straight River (AUID: 07040002-505) The 12-mile reach of Rush Creek was added to the Section 303(d) Clean Water Act impaired waters list in 2002. The primary source of data that led to this listing was monitoring work carried out by the Cannon River Watershed Partnership and MPCA in 1999 and 2000. The drainage area to the downstream end of this impaired reach is 22 square miles, all of which falls in Rice County. Cultivated land accounts for 89% of the watershed upstream of the impaired reach, a figure which is second highest among all impaired reach watersheds included in this report (Table 2.1). The watershed has no communities served by permitted wastewater treatment facilities (Table 5.28A), and no livestock facilities that have been issued NPDES permits (Table 5.28B). At the present time, none of the watershed requires coverage under a MS4 permit (Table 5.28C). Table 5.28D describes the monthly fecal coliform loading capacities for Rush Creek to achieve water quality standards, as well as the component wasteload allocations, load allocations, and margins of safety. The loading capacities were developed using flow data from the USGS gage site on the Straight River near Faribault as described in Appendix A. Substantial reductions in fecal coliform loading from straight-pipe septic systems, and a variety of nonpoint sources will likely be required to meet the allocations. Table 5.28A. Wastewater Treatment Facilities Name/Location Permit
Number Design Flow (mgd)
WLA (t-orgs./mo.)
none Table 5.28B. Livestock Facilities with NPDES Permits Facility ID Number Description none Table 5.28C. Municipal Separate Storm Sewer System (MS4) Communities Community Population
Estimate Category
none
48

Table 5.28D. Monthly Fecal Coliform Loading Capacities and Allocations - Rush Creek, Headwaters to Straight River (AUID: 07040002-505) Drainage Area (square miles): 22USGS gage used to develop flow zones and loading capacities:
Straight River near Faribault% MS4 Urban: 0%Total WWTF Design Flow (mgd): 0 Flow Zone
High Moist Mid Dry Lowvalues expressed as trillion organisms per month (tera- or T-org./month)
TOTAL MONTHLY LOADING CAPACITY 8.35 3.75 1.75 0.67 0.25Wasteload Allocation
Permitted Wastewater Treatment Facilities 0.00 0.00 0.00 0.00 0.00Communities Subject to MS4 NPDES Requirements 0.00 0.00 0.00 0.00 0.00Livestock Facilities Requiring NPDES Permits 0 0 0 0 0"Straight Pipe" Septic Systems 0 0 0 0 0
Load Allocation 6.22 2.37 1.14 0.32 0.12Margin of Safety 2.13 1.38 0.61 0.35 0.13
values expressed as percent of total month loading capacityTOTAL MONTHLY LOADING CAPACITY 100% 100% 100% 100% 100%Wasteload Allocation
Permitted Wastewater Treatment Facilities 0.0% 0.0% 0.0% 0.0% 0.0%Communities Subject to MS4 NPDES Requirements 0.0% 0.0% 0.0% 0.0% 0.0%Livestock Facilities Requiring NPDES Permits 0.0% 0.0% 0.0% 0.0% 0.0%"Straight Pipe" Septic Systems 0.0% 0.0% 0.0% 0.0% 0.0%
Load Allocation 74.5% 63.2% 65.1% 47.8% 48.0%Margin of Safety 25.5% 36.8% 34.9% 52.2% 52.0%
49

5.29 Crane Creek, Headwaters to Straight River (AUID: 07040002-516) The 16-mile reach of Crane Creek was added to the Section 303(d) Clean Water Act impaired waters list in 2002. The primary source of data that led to this listing was monitoring work carried out by the Cannon River Watershed Partnership and MPCA in 1999 and 2000. The drainage area to the downstream end of this impaired reach is 106 square miles, including land in Waseca and Steele counties. Land use in the watershed upstream of the impairment (Table 2.1) is dominated by cultivated land (81%), much of which has surface (ditches) and subsurface (tile) drainage. A good portion of Crane Creek itself is a drainage ditch. The watershed has no communities served by permitted wastewater treatment facilities (Table 5.29A), but contains four livestock facilities that have been issued NPDES permits (Table 5.29B). Approximately 3,000 acres of the City of Waseca, or 5% of the watershed, will require coverage under an MS4 permit (Table 5.29C). Unlike it’s stormwater, wastewater from the City of Waseca is discharged to the Minnesota River Basin. An additional 1% of the watershed area contains smaller towns and rural residences. Table 5.29D describes the monthly fecal coliform loading capacities for Crane Creek to achieve water quality standards, as well as the component wasteload allocations, load allocations, and margins of safety. The loading capacities were derived using flow data from the USGS gage site on the Straight River near Faribault as described in Appendix A. Substantial reductions in fecal coliform loading from straight-pipe septic systems, and a variety of nonpoint sources will likely be required to meet the allocations. Table 5.29A. Wastewater Treatment Facilities Name/Location Permit
Number Design Flow (mgd)
WLA (t-orgs./mo.)
none Table 5.29B. Livestock Facilities with NPDES Permits Facility ID Number Description Brian J Kosel Farm - Sec 23 147-92323 2,720 Swine - 55 lbs. or More Jennie-O Turkey Store - Deerfield Farm 147-50007 144,000 Turkeys Wingspan LLP 161-50012 7,200 Swine - 55 lbs. or More
Woodville Pork 161-50011 2,400 Swine – 55 lbs. or More 1,800 Swine – under 55 lbs.
Table 5.29C. Municipal Separate Storm Sewer System (MS4) Communities Community Population
Estimate Category
Waseca 8,493 Designated by rule; > 10,000 population and within ½ mile of an impaired water (Clear Lake)
50

Table 5.29D. Monthly Fecal Coliform Loading Capacities and Allocations - Crane Creek, Headwaters to Straight River (AUID: 07040002-516) Drainage Area (square miles): 106USGS gage used to develop flow zones and loading capacities:
Straight River near Faribault% MS4 Urban: 5%Total WWTF Design Flow (mgd): 0 Flow Zone
High Moist Mid Dry Lowvalues expressed as trillion organisms per month (tera- or T-org./month)
TOTAL MONTHLY LOADING CAPACITY 39.38 17.68 8.26 3.14 1.16Wasteload Allocation
Permitted Wastewater Treatment Facilities 0.00 0.00 0.00 0.00 0.00Communities Subject to MS4 NPDES Requirements 1.37 0.52 0.25 0.07 0.03Livestock Facilities Requiring NPDES Permits 0 0 0 0 0"Straight Pipe" Septic Systems 0 0 0 0 0
Load Allocation 27.99 10.67 5.16 1.43 0.53Margin of Safety 10.02 6.49 2.85 1.64 0.60
values expressed as percent of total month loading capacityTOTAL MONTHLY LOADING CAPACITY 100% 100% 100% 100% 100%Wasteload Allocation
Permitted Wastewater Treatment Facilities 0.0% 0.0% 0.0% 0.0% 0.0%Communities Subject to MS4 NPDES Requirements 3.5% 3.0% 3.1% 2.2% 2.3%Livestock Facilities Requiring NPDES Permits 0.0% 0.0% 0.0% 0.0% 0.0%"Straight Pipe" Septic Systems 0.0% 0.0% 0.0% 0.0% 0.0%
Load Allocation 71.1% 60.3% 62.4% 45.5% 46.0%Margin of Safety 25.4% 36.7% 34.5% 52.2% 51.7%
51

5.30 Straight River, Maple Creek to Crane Creek (AUID: 07040002-503) The 5-mile reach of the Straight River from Maple Creek to Crane Creek was added to the Section 303(d) Clean Water Act impaired waters list in 1994. The primary source of data that led to this listing was the MPCA Milestone long-term monitoring program, although more recent monitoring was conducted by the MPCA and Cannon River Watershed Partnership. The drainage area to the downstream end of this impaired reach is 252 square miles, almost all of which is within Steele County. Land use in the watershed upstream of the impairment (Table 2.1) is dominated by cultivated land (82%), much of which has surface (ditches) and subsurface (tile) drainage. The watershed includes three communities and a highway rest area served by permitted wastewater treatment facilities (Table 5.30A), and five livestock facilities that have been issued NPDES permits (Table 5.30B). Approximately 8,000 acres of the City of Owatonna, or 5% of the watershed, will require coverage under MS4 permits (Table 5.30C). Table 5.30D describes the monthly fecal coliform loading capacities for this reach of the Straight River to achieve water quality standards, as well as the component wasteload allocations, load allocations, and margins of safety. The loading capacities were developed using flow data from the USGS gage site on the Straight River near Faribault as described in Appendix A. Substantial reductions in fecal coliform loading from straight-pipe septic systems, and a variety of nonpoint sources will likely be required to meet the allocations. Table 5.30A. Wastewater Treatment Facilities Name/Location Permit
Number Design Flow (mgd)
WLA (t-orgs./mo.)
Ellendale WWTP MN0041564 0.1003 0.02 Geneva WWTP MN0021008 0.069 0.02 MNDOT Straight River Rest Area
MN0049514 0.0093 0.002
Owatonna WWTP MN0051284 5 1.14 Totals 5.18 1.18
Table 5.30B. Livestock Facilities with NPDES Permits Facility ID Number Description Chad Johnson Farm 047-102279 3,120 Swine - 55 lbs. or More Brian Waage Farm 147-50003 4,000 Swine - 55 lbs. or More J&K Farms LLC 147-92330 4,800 Swine - 55 lbs. or More Jeff Ptacek Farm - Sec 36 147-92217 4,000 Swine - 55 lbs. or More Shane & Rod Wagner Farm - Sec 15 147-92127 4,400 Swine - 55 lbs. or More
52

Table 5.30C. Municipal Separate Storm Sewer System (MS4) Communities Community Population
Estimate Category
Owatonna 22,434 Designated by rule; > 10,000 population Table 5.30D. Monthly Fecal Coliform Loading Capacities and Allocations - Straight River, Maple Creek to Crane Creek (AUID: 07040002-503) Drainage Area (square miles): 252USGS gage used to develop flow zones and loading capacities:
Straight River near Faribault% MS4 Urban: 5%Total WWTF Design Flow (mgd): 5.1786 Flow Zone
High Moist Mid Dry Lowvalues expressed as trillion organisms per month (tera- or T-org./month)
TOTAL MONTHLY LOADING CAPACITY 93.99 42.19 19.71 7.49 2.77Wasteload Allocation
Permitted Wastewater Treatment Facilities 1.18 1.18 1.18 1.18 1.18Communities Subject to MS4 NPDES Requirements 3.46 1.28 0.59 0.12 0.01Livestock Facilities Requiring NPDES Permits 0 0 0 0 0"Straight Pipe" Septic Systems 0 0 0 0 0
Load Allocation 65.45 24.24 11.14 2.27 0.16Margin of Safety 23.91 15.49 6.81 3.92 1.43
values expressed as percent of total month loading capacityTOTAL MONTHLY LOADING CAPACITY 100% 100% 100% 100% 100%Wasteload Allocation
Permitted Wastewater Treatment Facilities 1.3% 2.8% 6.0% 15.7% 42.5%Communities Subject to MS4 NPDES Requirements 3.7% 3.0% 3.0% 1.6% 0.3%Livestock Facilities Requiring NPDES Permits 0.0% 0.0% 0.0% 0.0% 0.0%"Straight Pipe" Septic Systems 0.0% 0.0% 0.0% 0.0% 0.0%
Load Allocation 69.6% 57.5% 56.5% 30.4% 5.6%Margin of Safety 25.4% 36.7% 34.6% 52.3% 51.6%
53

5.31 Maple Creek, Headwaters to Straight River (AUID: 07040002-519) The 12-mile reach of Maple Creek was added to the Section 303(d) Clean Water Act impaired waters list in 2002. The primary source of data that led to this listing was monitoring work carried out by the Cannon River Watershed Partnership and MPCA in 1999 and 2000. The drainage area to the downstream end of this impaired reach is 38 square miles, lying completely in Steele County. Land use in the watershed upstream of the impairment (Table 2.1) is dominated by cultivated land (81%), although it has a higher percentage of grassland (11%) than any other Straight River subwatershed. The watershed has no communities served by permitted wastewater treatment facilities (Table 5.31A) and no livestock facilities that have been issued NPDES permits (Table 5.31B). Approximately 3,600 acres (roughly 45% of the City of Owatonna), or 15% of the watershed, will require coverage under a MS4 permit (Table 5.31C). Table 5.31D describes the monthly fecal coliform loading capacities for Maple Creek to achieve water quality standards, as well as the component wasteload allocations, load allocations, and margins of safety. The loading capacity was derived using flow data from the USGS gage site on the Straight River near Faribault as described in Appendix A. Substantial reductions in fecal coliform loading from straight-pipe septic systems, and a variety of nonpoint sources will likely be required to meet the allocations. Table 5.31A. Wastewater Treatment Facilities Name/Location Permit
Number Design Flow (mgd)
WLA (t-orgs./mo.)
none Table 5.31B. Livestock Facilities with NPDES Permits Facility ID Number Description none Table 5.31C. Municipal Separate Storm Sewer System (MS4) Communities Community Population
Estimate Category
Owatonna 22,434 Designated by rule; > 10,000 population
54

Table 5.31D. Monthly Fecal Coliform Loading Capacities and Allocations - Maple Creek, Headwaters to Straight River (AUID: 07040002-519) Drainage Area (square miles): 38USGS gage used to develop flow zones and loading capacities:
Straight River near Faribault% MS4 Urban: 15%Total WWTF Design Flow (mgd): 0 Flow Zone
High Moist Mid Dry Lowvalues expressed as trillion organisms per month (tera- or T-org./month)
TOTAL MONTHLY LOADING CAPACITY 14.36 6.45 3.01 1.14 0.42Wasteload Allocation
Permitted Wastewater Treatment Facilities 0.00 0.00 0.00 0.00 0.00Communities Subject to MS4 NPDES Requirements 1.58 0.60 0.29 0.08 0.03Livestock Facilities Requiring NPDES Permits 0 0 0 0 0"Straight Pipe" Septic Systems 0 0 0 0 0
Load Allocation 9.13 3.48 1.68 0.46 0.17Margin of Safety 3.65 2.37 1.04 0.60 0.22
values expressed as percent of total month loading capacityTOTAL MONTHLY LOADING CAPACITY 100% 100% 100% 100% 100%Wasteload Allocation
Permitted Wastewater Treatment Facilities 0.0% 0.0% 0.0% 0.0% 0.0%Communities Subject to MS4 NPDES Requirements 11.0% 9.4% 9.7% 7.0% 7.0%Livestock Facilities Requiring NPDES Permits 0.0% 0.0% 0.0% 0.0% 0.0%"Straight Pipe" Septic Systems 0.0% 0.0% 0.0% 0.0% 0.0%
Load Allocation 63.5% 53.9% 55.8% 40.4% 40.6%Margin of Safety 25.4% 36.7% 34.6% 52.6% 52.4%
55

5.32 Straight River, Turtle Creek to Owatonna Dam (AUID: 07040002-535) The 7-mile reach of the Straight River was added to the Section 303(d) Clean Water Act impaired waters list in 2004. The primary source of data that led to this listing was monitoring work carried out by Steele County Environmental Services in 2000-2002. The drainage area to the downstream end of this impaired reach is 204 square miles, almost all of which is within Steele County. Land use in the watershed upstream of the impairment (Table 2.1) is dominated by cultivated land (83%), much of which has surface (ditches) and subsurface (tile) drainage. The watershed has two small communities and a highway rest area with permitted facilities contributing wastewater to the impaired reach (Table 5.32A); and contains five livestock facilities that have been issued NPDES permits (Table 5.32B). Approximately 2,700 acres (roughly 1/3 of the City of Owatonna), or 2% of the watershed, will require coverage under a MS4 permit (Table 5.32C). Table 5.32D describes the monthly fecal coliform loading capacities for this reach of the Straight River to achieve water quality standards, as well as the component wasteload allocations, load allocations, and margins of safety. The loading capacities were derived using flow data from the USGS gage site on the Straight River near Faribault as described in Appendix A. Substantial reductions in fecal coliform loading from straight-pipe septic systems, and a variety of nonpoint sources will likely be required to meet the allocations. Table 5.32A. Wastewater Treatment Facilities Name/Location Permit
Number Design Flow (mgd)
WLA (t-orgs./mo.)
Ellendale WWTP MN0041564 0.1003 0.02 Geneva WWTP MN0021008 0.069 0.02 MNDOT Straight River Rest Area
MN0049514 0.0093 0.002
Totals 0.18 0.042 Table 5.32B. Livestock Facilities with NPDES Permits Facility ID Number Description Chad Johnson Farm 047-102279 3,120 Swine - 55 lbs. or More Brian Waage Farm 147-50003 4,000 Swine - 55 lbs. or More J&K Farms LLC 147-92330 4,800 Swine - 55 lbs. or More Jeff Ptacek Farm - Sec 36 147-92217 4,000 Swine - 55 lbs. or More Shane & Rod Wagner Farm - Sec 15 147-92127 4,400 Swine - 55 lbs. or More Table 5.32C. Municipal Separate Storm Sewer System (MS4) Communities Community Population
Estimate Category
Owatonna 22,434 Designated by rule; > 10,000 population
56

Table 5.32D. Monthly Fecal Coliform Loading Capacities and Allocations - Straight River, Turtle Creek to Owatonna Dam (AUID: 07040002-535) Drainage Area (square miles): 204USGS gage used to develop flow zones and loading capacities:
Straight River near Faribault% MS4 Urban: 2%Total WWTF Design Flow (mgd): 0.1786 Flow Zone
High Moist Mid Dry Lowvalues expressed as trillion organisms per month (tera- or T-org./month)
TOTAL MONTHLY LOADING CAPACITY 76.05 34.14 15.94 6.06 2.24Wasteload Allocation
Permitted Wastewater Treatment Facilities 0.04 0.04 0.04 0.04 0.04Communities Subject to MS4 NPDES Requirements 1.17 0.45 0.21 0.06 0.02Livestock Facilities Requiring NPDES Permits 0 0 0 0 0"Straight Pipe" Septic Systems 0 0 0 0 0
Load Allocation 55.49 21.12 10.17 2.79 1.03Margin of Safety 19.35 12.53 5.51 3.17 1.15
values expressed as percent of total month loading capacityTOTAL MONTHLY LOADING CAPACITY 100% 100% 100% 100% 100%Wasteload Allocation
Permitted Wastewater Treatment Facilities 0.1% 0.1% 0.3% 0.7% 1.8%Communities Subject to MS4 NPDES Requirements 1.5% 1.3% 1.3% 1.0% 1.0%Livestock Facilities Requiring NPDES Permits 0.0% 0.0% 0.0% 0.0% 0.0%"Straight Pipe" Septic Systems 0.0% 0.0% 0.0% 0.0% 0.0%
Load Allocation 73.0% 61.9% 63.8% 46.0% 45.9%Margin of Safety 25.4% 36.7% 34.6% 52.3% 51.3%
57

5.33 Turtle Creek, Headwaters to Straight River (AUID: 07040002-518) The 17-mile reach of Turtle Creek was added to the Section 303(d) Clean Water Act impaired waters list in 2002. The primary source of data that led to this listing was monitoring work carried out by the Cannon River Watershed Partnership and MPCA in 1999 and 2000. The drainage area to the downstream end of this impaired reach is 44 square miles, all of which falls in Steele County. Land use in the watershed upstream of the impairment (Table 2.1) is dominated by cultivated land (82%), much of which has surface (ditches) and subsurface (tile) drainage. The watershed has no communities served by wastewater treatment facilities (Table 5.33A), but contains two livestock facilities that have been issued NPDES permits (Table 5.33B). At the present time, none of the watershed requires coverage under a MS4 permit (Table 5.33C). Table 5.33D describes the monthly fecal coliform loading capacities for Turtle Creek to achieve water quality standards, as well as the component wasteload allocations, load allocations, and margins of safety. The loading capacity was derived using flow data from the USGS gage site on the Straight River near Faribault as described in Appendix A. Substantial reductions in fecal coliform loading from straight-pipe septic systems, and a variety of nonpoint sources will likely be required to meet the allocations Table 5.33A. Wastewater Treatment Facilities Name/Location Permit
Number Design Flow (mgd)
WLA (t-orgs./mo.)
none Table 5.33B. Livestock Facilities with NPDES Permits Facility ID Number Description Jeff Ptacek Farm - Sec 36 147-92217 4,000 Swine - 55 lbs. or More Shane & Rod Wagner Farm - Sec 15 147-92127 4,400 Swine - 55 lbs. or More Table 5.33C. Municipal Separate Storm Sewer System (MS4) Communities Community Population
Estimate Category
none
58

Table 5.33D. Monthly Fecal Coliform Loading Capacities and Allocations - Turtle Creek, Headwaters to Straight River (AUID: 07040002-518) Drainage Area (square miles): 44USGS gage used to develop flow zones and loading capacities:
Straight River near Faribault% MS4 Urban: 0%Total WWTF Design Flow (mgd): 0 Flow Zone
High Moist Mid Dry Lowvalues expressed as trillion organisms per month (tera- or T-org./month)
TOTAL MONTHLY LOADING CAPACITY 16.41 7.37 3.44 1.31 0.48Wasteload Allocation
Permitted Wastewater Treatment Facilities 0.00 0.00 0.00 0.00 0.00Communities Subject to MS4 NPDES Requirements 0.00 0.00 0.00 0.00 0.00Livestock Facilities Requiring NPDES Permits 0 0 0 0 0"Straight Pipe" Septic Systems 0 0 0 0 0
Load Allocation 12.23 4.67 2.25 0.63 0.23Margin of Safety 4.18 2.70 1.19 0.68 0.25
values expressed as percent of total month loading capacityTOTAL MONTHLY LOADING CAPACITY 100% 100% 100% 100% 100%Wasteload Allocation
Permitted Wastewater Treatment Facilities 0.0% 0.0% 0.0% 0.0% 0.0%Communities Subject to MS4 NPDES Requirements 0.0% 0.0% 0.0% 0.0% 0.0%Livestock Facilities Requiring NPDES Permits 0.0% 0.0% 0.0% 0.0% 0.0%"Straight Pipe" Septic Systems 0.0% 0.0% 0.0% 0.0% 0.0%
Load Allocation 74.5% 63.4% 65.4% 48.1% 47.9%Margin of Safety 25.5% 36.6% 34.6% 51.9% 52.1%
59

5.34 Straight River, County Ditch 25 to Turtle Creek (AUID: 07040002-517) The 10-mile reach of the Straight River was added to the Section 303(d) Clean Water Act impaired waters list in 2002. The primary source of data that led to this listing was monitoring work carried out by the Cannon River Watershed Partnership and MPCA in 1999 and 2000. The drainage area to the downstream end of this impaired reach is 135 square miles, almost all of which is within Steele County. Land use in the watershed upstream of the impairment (Table 2.1) is dominated by cultivated land (87%), much of which has surface (ditches) and subsurface (tile) drainage. The watershed has two small communities and a highway rest area with permitted facilities contributing wastewater to the impaired reach (Table 5.34A); and contains three livestock facilities that have been issued NPDES permits (Table 5.34B). At the present time, none of the watershed requires coverage under an MS4 permit (Table 5.34C). A prominent feature in the upper portion of this watershed is the large “Straight River Marsh” wetland restoration project. Table 5.34D describes the monthly fecal coliform loading capacities for this reach of the Straight River to achieve water quality standards, as well as the component wasteload allocations, load allocations, and margins of safety. The loading capacities were derived using flow data from the USGS gage site on the Straight River near Faribault as described in Appendix A. Substantial reductions in fecal coliform loading from straight-pipe septic systems, and a variety of nonpoint sources will likely be required to meet the allocations. Table 5.34A. Wastewater Treatment Facilities Name/Location Permit
Number Design Flow (mgd)
WLA (t-orgs./mo.)
Ellendale WWTP MN0041564 0.1003 0.02 Geneva WWTP MN0021008 0.069 0.02 MNDOT Straight River Rest Area
MN0049514 0.0093 0.002
Totals 0.18 0.042 Table 5.34B. Livestock Facilities with NPDES Permits Facility ID Number Description Chad Johnson Farm 047-102279 3,120 Swine - 55 lbs. or More Brian Waage Farm 147-50003 4,000 Swine - 55 lbs. or More J&K Farms LLC 147-92330 4,800 Swine - 55 lbs. or More Table 5.34C. Municipal Separate Storm Sewer System (MS4) Communities Community Population
Estimate Category
none
60

Table 5.34D. Monthly Fecal Coliform Loading Capacities and Allocations - Straight River, County Ditch 25 to Turtle Creek (AUID: 07040002-517) Drainage Area (square miles): 135USGS gage used to develop flow zones and loading capacities:
Straight River near Faribault% MS4 Urban: 0%Total WWTF Design Flow (mgd): 0.1786 Flow Zone
High Moist Mid Dry Lowvalues expressed as trillion organisms per month (tera- or T-org./month)
TOTAL MONTHLY LOADING CAPACITY 50.27 22.57 10.54 4.01 1.48Wasteload Allocation
Permitted Wastewater Treatment Facilities 0.04 0.04 0.04 0.04 0.04Communities Subject to MS4 NPDES Requirements 0.00 0.00 0.00 0.00 0.00Livestock Facilities Requiring NPDES Permits 0 0 0 0 0"Straight Pipe" Septic Systems 0 0 0 0 0
Load Allocation 37.44 14.25 6.86 1.87 0.68Margin of Safety 12.79 8.28 3.64 2.10 0.76
values expressed as percent of total month loading capacityTOTAL MONTHLY LOADING CAPACITY 100% 100% 100% 100% 100%Wasteload Allocation
Permitted Wastewater Treatment Facilities 0.1% 0.2% 0.4% 1.0% 2.7%Communities Subject to MS4 NPDES Requirements 0.0% 0.0% 0.0% 0.0% 0.0%Livestock Facilities Requiring NPDES Permits 0.0% 0.0% 0.0% 0.0% 0.0%"Straight Pipe" Septic Systems 0.0% 0.0% 0.0% 0.0% 0.0%
Load Allocation 74.5% 63.1% 65.1% 46.6% 45.9%Margin of Safety 25.4% 36.7% 34.5% 52.4% 51.4%
61

5.35 Root River, Thompson Creek to the Mississippi River (AUID: 07040008-501) The 6-mile reach of the Root River from Thompson Creek to the Mississippi was added to the Section 303(d) Clean Water Act impaired waters list in 1994. The primary source of data that led to this listing was the MPCA Milestone long-term monitoring program. The drainage area to the downstream end of this impaired reach is 1,660 square miles (the entire Root River watershed). Even in this large of a watershed, pollution sources in the uppermost portions of the watershed can influence water quality near the mouth. Land use (Table 2.1) is primarily a mix of cultivated land, forest, and grassland. The watershed includes 17 communities and 2 highway rest areas served by permitted wastewater treatment facilities (Table 5.35A); and 19 livestock facilities that have been issued NPDES permits (Table 5.35B). There are no communities that will require coverage under MS4 permits at this time (Table 5.35C). Table 5.35D describes the monthly fecal coliform loading capacities for this reach of the Cannon River to achieve water quality standards, as well as the component wasteload allocations, load allocations, and margins of safety. The loading capacities were developed for five flow zones using flow data from the USGS gage site on the Root River near Houston as described in Appendix A. Flows from the wastewater treatment facilities in the watershed are small relative to river flows, even during drier time periods. As such, the wasteload allocations provided to these facilities is relatively small. Substantial reductions in fecal coliform loading from straight-pipe septic systems, and a variety of nonpoint sources will likely be required to meet the allocations. Table 5.35A. Wastewater Treatment Facilities Name/Location Permit
Number Design Flow (mgd)
WLA (t-orgs./mo.)
Canton WWTP MN0023001 0.065 0.01 Chatfield WWTP MN0021857 0.2725 0.06 Dexter WWTP MN0023183 0.0454 0.01 Grand Meadow WWTP MN0023558 0.12 0.03 Haven Hutterian Brethren MNG580071 0.0112 0.003 Hokah WWTP MN0021458 0.1 0.02 Houston WWTP MN0023736 0.25 0.06 Lanesboro WWTP MN0020044 0.096 0.02 MNDOT Enterprise Rest Area MN0048844 0.0026 0.001 MNDOT High Forest Rest Area MN0044377 0.0033 0.001 Mabel WWTP MN0020877 0.136 0.03 Ostrander WWTP MN0024449 0.0394 0.01 Peterson WWTP MN0024490 0.025 0.01 Preston WWTP MN0020745 0.317 0.07 Racine WWTP MN0024554 0.039 0.01 Rushford WWTP MN0024678 0.15 0.03 Spring Valley WWTP MN0051934 0.936 0.21 Stewartville WWTP MN0020681 1.111 0.25 Wykoff WWTP MN0020826 0.049 0.01
Totals 3.77 0.86
62

Table 5.35B. Livestock Facilities with NPDES Permits Facility ID Number Description Allen & Kevin Marzolf Farm - Sec 30 045-90428 4,000 Swine - 55 lbs. or More Helen Anderson Farm - Sec 36 045-91101 1,196 Other Cattle Hellickson Farms 045-63730 3,300 Swine - 55 lbs. or More Jennie-O Turkey Store - Benson Farm 045-50004 63,700 Turkeys Jennie-O Turkey Store - Chatfield Farm 045-50003 107,841 Turkeys Jennie-O Turkey Store - Fay Farm 045-50002 63,600 Turkeys Marzolf Farm 045-60160 4,000 Swine - 55 lbs. or More Palmer Growout Farm - Sec 14 045-101381 107,841 Turkeys Palmer Growout Farm - Sec 8 045-101373 63,000 Turkeys Palmer Growout Farm - Sec 8 NW 045-101374 63,700 Turkeys Paul Schmidt Farm - Sec 20 045-90124 4,000 Swine - 55 lbs. or More Ridge Land Farm 045-50001 4,000 Swine - 55 lbs. or More John Oehlke Pork Farm 099-83512 3,600 Swine - 55 lbs. or More Larson Products Inc - Sec 5 099-61683 60,000 Turkeys Vance Larson Farm 1 099-95037 68,000 Turkeys Lo-Mill Farms 109-79271 2,800 Swine - 55 lbs. or More Jennie-O Turkey Store - Lingenfelter 169-50005 69,750 Turkeys Smith Farms of Rushford Inc 169-50001 4,150 Swine - 55 lbs. or More Smith Farms of Rushford LLP 169-102822 3,600 Swine - 55 lbs. or More Table 5.35C. Municipal Separate Storm Sewer System (MS4) Communities Community Population
Estimate Category
none Table 5.35D. Monthly Fecal Coliform Loading Capacities and Allocations - Root River, Thompson Creek to the Mississippi River (AUID: 07040008-501) Drainage Area (square miles): 1,660USGS gage used to develop flow zones and loading capacities:
Root River near Houston% MS4 Urban: 0%Total WWTF Design Flow (mgd): 3.7684 Flow Zone
High Moist Mid Dry Lowvalues expressed as trillion organisms per month (tera- or T-org./month)
TOTAL MONTHLY LOADING CAPACITY 413.07 201.09 132.33 88.11 55.45Wasteload Allocation
Permitted Wastewater Treatment Facilities 0.86 0.86 0.86 0.86 0.86Communities Subject to MS4 NPDES Requirements 0.00 0.00 0.00 0.00 0.00Livestock Facilities Requiring NPDES Permits 0 0 0 0 0"Straight Pipe" Septic Systems 0 0 0 0 0
Load Allocation 329.40 155.76 113.32 63.96 40.65Margin of Safety 82.81 44.47 18.15 23.29 13.94
values expressed as percent of total month loading capacityTOTAL MONTHLY LOADING CAPACITY 100% 100% 100% 100% 100%Wasteload Allocation
Permitted Wastewater Treatment Facilities 0.2% 0.4% 0.6% 1.0% 1.5%Communities Subject to MS4 NPDES Requirements 0.0% 0.0% 0.0% 0.0% 0.0%Livestock Facilities Requiring NPDES Permits 0.0% 0.0% 0.0% 0.0% 0.0%"Straight Pipe" Septic Systems 0.0% 0.0% 0.0% 0.0% 0.0%
Load Allocation 79.7% 77.5% 85.6% 72.6% 73.3%Margin of Safety 20.0% 22.1% 13.7% 26.4% 25.1%
63

5.36 Robinson Creek, Headwaters to North Branch Root River (AUID: 07040008-503) Robinson Creek was added to the Section 303(d) Clean Water Act impaired waters list in 1994. The primary source of data that led to this listing was the MPCA Milestone long-term monitoring program. The drainage area to the downstream end of this impaired reach is 17 square miles. Most of which falls within Mower County, although the confluence with the North Branch Root River is in Olmsted County. Land use in the watershed upstream of the impairment (Table 2.1) is 92% cultivated, highest of all impaired stream and river reaches included in this report. The watershed contains no communities served by permitted wastewater treatment facilities (Table 5.36A); and no livestock facilities that have been issued NPDES permits (Table 5.36B). At the present time, none of the watershed requires coverage under a MS4 permit (Table 5.36C). Table 5.36D describes the monthly fecal coliform loading capacities for Robinson Creek to achieve water quality standards, as well as the component wasteload allocations, load allocations, and margins of safety. The loading capacities were developed using flow data from the USGS gage site on the South Fork Zumbro River at Rochester as described in Appendix A. Substantial reductions in fecal coliform loading from straight-pipe septic systems, and a variety of nonpoint sources will likely be required to meet the allocations. Table 5.36A. Wastewater Treatment Facilities Name/Location Permit
Number Design Flow (mgd)
WLA (t-orgs./mo.)
none Table 5.36B. Livestock Facilities with NPDES Permits Facility ID Number Description none Table 5.36C. Municipal Separate Storm Sewer System (MS4) Communities Community Population Estimate Category none
64

Table 5.36D. Monthly Fecal Coliform Loading Capacities and Allocations - Robinson Creek, Headwaters to North Branch Root River (AUID: 07040008-503) Drainage Area (square miles): 17USGS gage used to develop flow zones and loading capacities:
South Fork Zumbro River at Rochester% MS4 Urban: 0%Total WWTF Design Flow (mgd): 0 Flow Zone
High Moist Mid Dry Lowvalues expressed as trillion organisms per month (tera- or T-org./month)
TOTAL MONTHLY LOADING CAPACITY 5.93 2.64 1.42 0.81 0.29Wasteload Allocation
Permitted Wastewater Treatment Facilities 0.00 0.00 0.00 0.00 0.00Communities Subject to MS4 NPDES Requirements 0.00 0.00 0.00 0.00 0.00Livestock Facilities Requiring NPDES Permits 0 0 0 0 0"Straight Pipe" Septic Systems 0 0 0 0 0
Load Allocation 4.72 1.80 1.15 0.49 0.16Margin of Safety 1.21 0.84 0.27 0.32 0.13
values expressed as percent of total month loading capacityTOTAL MONTHLY LOADING CAPACITY 100% 100% 100% 100% 100%Wasteload Allocation
Permitted Wastewater Treatment Facilities 0.0% 0.0% 0.0% 0.0% 0.0%Communities Subject to MS4 NPDES Requirements 0.0% 0.0% 0.0% 0.0% 0.0%Livestock Facilities Requiring NPDES Permits 0.0% 0.0% 0.0% 0.0% 0.0%"Straight Pipe" Septic Systems 0.0% 0.0% 0.0% 0.0% 0.0%
Load Allocation 79.6% 68.2% 81.0% 60.5% 55.2%Margin of Safety 20.4% 31.8% 19.0% 39.5% 44.8%
65

5.37 Money Creek; End of Trout Stream portion to Root River (AUID: 07040008-521) Money Creek was added to the Section 303(d) Clean Water Act impaired waters list in 1994. The primary source of data that led to this listing was a special study conducted by the Winona County Environmental Services Department. The drainage area to the downstream end of this impaired reach is 77 square miles, all of which falls within Winona County. Land use in the watershed upstream of the impairment (Table 2.1) is a mix of forest (44%), cultivated land, and grassland. The percentage of cultivated land (36%) is the lowest of all the impaired stream and river reaches included in the report. The watershed contains no communities served by permitted wastewater treatment facilities (Table 5.37A) and no livestock facilities that have been issued NPDES permits (Table 5.37B). At the present time, none of the watershed requires coverage under a MS4 permit (Table 5.37C). Table 5.37D describes the monthly fecal coliform loading capacities for Money Creek to achieve water quality standards, as well as the component wasteload allocations, load allocations, and margins of safety. The loading capacities were developed using historic flow data from a USGS gage site on the Rush Creek near Rushford as described in Appendix A. Substantial reductions in fecal coliform loading from straight-pipe septic systems, and a variety of nonpoint sources will likely be required to meet the allocations. Table 5.37A. Wastewater Treatment Facilities Name/Location Permit
Number Design Flow (mgd)
WLA (t-orgs./mo.)
none Table 5.37B. Livestock Facilities with NPDES Permits Facility ID Number Description none Table 5.37C. Municipal Separate Storm Sewer System (MS4) Communities Community Population Estimate Category none
66

Table 5.37D. Monthly Fecal Coliform Loading Capacities and Allocations - Money Creek, End of Trout Stream portion to Root River (AUID: 07040008-521) Drainage Area (square miles): 77USGS gage used to develop flow zones and loading capacities:
Rush Creek near Rushford% MS4 Urban: 0%Total WWTF Design Flow (mgd): 0 Flow Zone
High Moist Mid Dry Lowvalues expressed as trillion organisms per month (tera- or T-org./month)
TOTAL MONTHLY LOADING CAPACITY 7.66 4.99 3.81 3.25 2.72Wasteload Allocation
Permitted Wastewater Treatment Facilities 0.00 0.00 0.00 0.00 0.00Communities Subject to MS4 NPDES Requirements 0.00 0.00 0.00 0.00 0.00Livestock Facilities Requiring NPDES Permits 0 0 0 0 0"Straight Pipe" Septic Systems 0 0 0 0 0
Load Allocation 6.10 4.14 3.55 2.95 2.42Margin of Safety 1.56 0.85 0.26 0.30 0.30
values expressed as percent of total month loading capacityTOTAL MONTHLY LOADING CAPACITY 100% 100% 100% 100% 100%Wasteload Allocation
Permitted Wastewater Treatment Facilities 0.0% 0.0% 0.0% 0.0% 0.0%Communities Subject to MS4 NPDES Requirements 0.0% 0.0% 0.0% 0.0% 0.0%Livestock Facilities Requiring NPDES Permits 0.0% 0.0% 0.0% 0.0% 0.0%"Straight Pipe" Septic Systems 0.0% 0.0% 0.0% 0.0% 0.0%
Load Allocation 79.6% 83.0% 93.2% 90.8% 89.0%Margin of Safety 20.4% 17.0% 6.8% 9.2% 11.0%
67

5.38 South Branch Root River, Canfield Creek to Willow Creek (AUID: 07040008-555) The 11-mile reach of the South Branch Root River from Canfield Creek to Willow Creek was added to the Section 303(d) Clean Water Act impaired waters list in 2004. The primary source of data that led to this listing was the locally-led South Branch Root River watershed project. The drainage area to the downstream end of this impaired reach is 143 square miles. This watershed includes land in Mower and Fillmore counties and encompasses Forestville/Mystery Cave State Park. Land use (Table 2.1) is dominated by cultivated land (76%), but includes substantial areas of forest and grassland. The watershed includes one community (Ostrander) served by a permitted wastewater treatment facility (Table 5.38A), and three livestock facilities that have been issued NPDES permits (Table 5.38B). There are no communities that will require coverage under a MS4 permit at this time (Table 5.38C). Table 5.38D describes the monthly fecal coliform loading capacities for this reach of the South Branch Root River to achieve water quality standards, as well as the component wasteload allocations, load allocations, and margins of safety. The loading capacities were developed using historic flow data from a USGS gage site on the South Fork Root River near Houston as described in Appendix A. Substantial reductions in fecal coliform loading from straight-pipe septic systems, and a variety of nonpoint sources will likely be required to meet the allocations. Table 5.38A. Wastewater Treatment Facilities Name/Location Permit
Number Design Flow (mgd)
WLA (t-orgs./mo.)
Ostrander WWTP MN0024449 0.0394 0.01 Table 5.38B. Livestock Facilities with NPDES Permits Facility ID Number Description Hellickson Farms 045-63730 3,300 Swine - 55 lbs. or More Paul Schmidt Farm - Sec 20 045-90124 4,000 Swine - 55 lbs. or More Ridge Land Farm 045-50001 4,000 Swine - 55 lbs. or More Table 5.38C. Municipal Separate Storm Sewer System (MS4) Communities Community Population
Estimate Category
none
68

Table 5.38D. Monthly Fecal Coliform Loading Capacities and Allocations - South Branch Root River, Canfield Creek to Willow Creek (AUID: 07040008-555) Drainage Area (square miles): 143USGS gage used to develop flow zones and loading capacities:
South Fork Root River near Houston% MS4 Urban: 0%Total WWTF Design Flow (mgd): 0.0394 Flow Zone
High Moist Mid Dry Lowvalues expressed as trillion organisms per month (tera- or T-org./month)
TOTAL MONTHLY LOADING CAPACITY 23.16 12.77 9.48 7.10 5.59Wasteload Allocation
Permitted Wastewater Treatment Facilities 0.01 0.01 0.01 0.01 0.01Communities Subject to MS4 NPDES Requirements 0.00 0.00 0.00 0.00 0.00Livestock Facilities Requiring NPDES Permits 0 0 0 0 0"Straight Pipe" Septic Systems 0 0 0 0 0
Load Allocation 18.00 10.54 8.61 5.98 4.61Margin of Safety 5.15 2.22 0.86 1.11 0.97
values expressed as percent of total month loading capacityTOTAL MONTHLY LOADING CAPACITY 100% 100% 100% 100% 100%Wasteload Allocation
Permitted Wastewater Treatment Facilities 0.0% 0.1% 0.1% 0.1% 0.2%Communities Subject to MS4 NPDES Requirements 0.0% 0.0% 0.0% 0.0% 0.0%Livestock Facilities Requiring NPDES Permits 0.0% 0.0% 0.0% 0.0% 0.0%"Straight Pipe" Septic Systems 0.0% 0.0% 0.0% 0.0% 0.0%
Load Allocation 77.7% 82.5% 90.8% 84.2% 82.5%Margin of Safety 22.2% 17.4% 9.1% 15.6% 17.4%
69
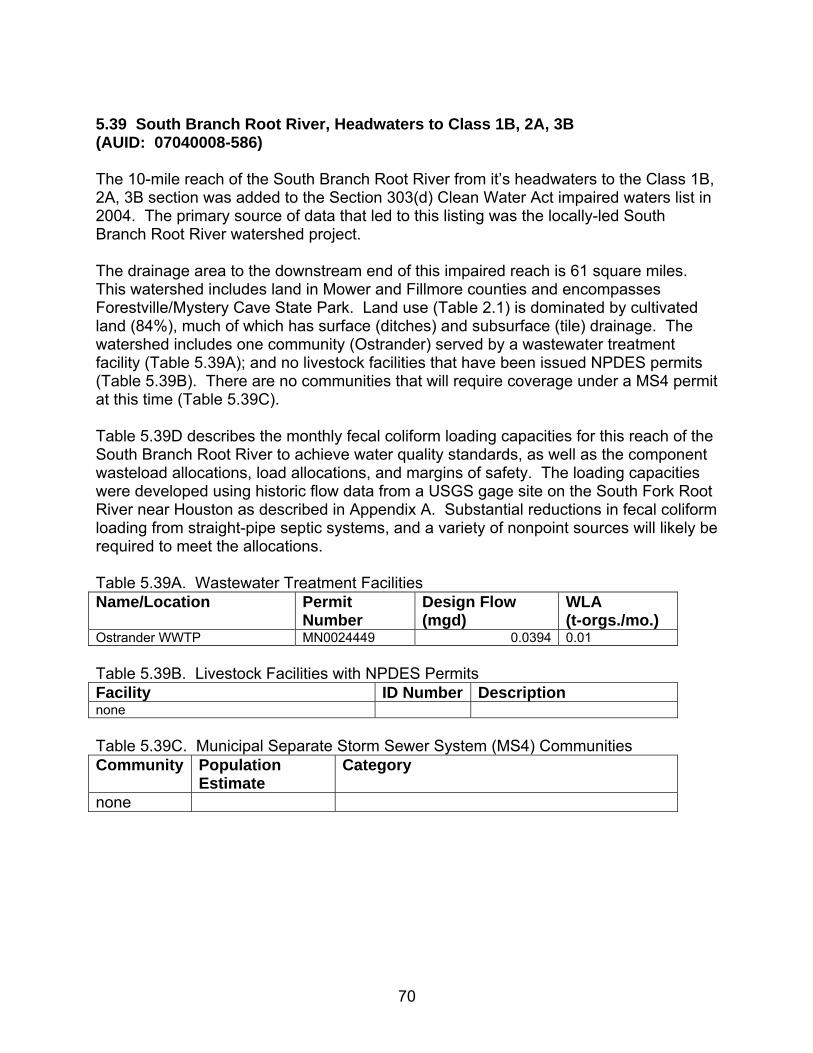
5.39 South Branch Root River, Headwaters to Class 1B, 2A, 3B (AUID: 07040008-586) The 10-mile reach of the South Branch Root River from it’s headwaters to the Class 1B, 2A, 3B section was added to the Section 303(d) Clean Water Act impaired waters list in 2004. The primary source of data that led to this listing was the locally-led South Branch Root River watershed project. The drainage area to the downstream end of this impaired reach is 61 square miles. This watershed includes land in Mower and Fillmore counties and encompasses Forestville/Mystery Cave State Park. Land use (Table 2.1) is dominated by cultivated land (84%), much of which has surface (ditches) and subsurface (tile) drainage. The watershed includes one community (Ostrander) served by a wastewater treatment facility (Table 5.39A); and no livestock facilities that have been issued NPDES permits (Table 5.39B). There are no communities that will require coverage under a MS4 permit at this time (Table 5.39C). Table 5.39D describes the monthly fecal coliform loading capacities for this reach of the South Branch Root River to achieve water quality standards, as well as the component wasteload allocations, load allocations, and margins of safety. The loading capacities were developed using historic flow data from a USGS gage site on the South Fork Root River near Houston as described in Appendix A. Substantial reductions in fecal coliform loading from straight-pipe septic systems, and a variety of nonpoint sources will likely be required to meet the allocations. Table 5.39A. Wastewater Treatment Facilities Name/Location Permit
Number Design Flow (mgd)
WLA (t-orgs./mo.)
Ostrander WWTP MN0024449 0.0394 0.01 Table 5.39B. Livestock Facilities with NPDES Permits Facility ID Number Description none Table 5.39C. Municipal Separate Storm Sewer System (MS4) Communities Community Population
Estimate Category
none
70

Table 5.39D. Monthly Fecal Coliform Loading Capacities and Allocations - South Branch Root River, Headwaters to Class 1B, 2A, 3B (AUID: 07040008-586) Drainage Area (square miles): 61USGS gage used to develop flow zones and loading capacities:
South Fork Root River near Houston% MS4 Urban: 0%Total WWTF Design Flow (mgd): 0.0394 Flow Zone
High Moist Mid Dry Lowvalues expressed as trillion organisms per month (tera- or T-org./month)
TOTAL MONTHLY LOADING CAPACITY 9.86 5.43 4.03 3.02 2.38Wasteload Allocation
Permitted Wastewater Treatment Facilities 0.01 0.01 0.01 0.01 0.01Communities Subject to MS4 NPDES Requirements 0.00 0.00 0.00 0.00 0.00Livestock Facilities Requiring NPDES Permits 0 0 0 0 0"Straight Pipe" Septic Systems 0 0 0 0 0
Load Allocation 7.66 4.48 3.65 2.54 1.96Margin of Safety 2.19 0.94 0.37 0.47 0.41
values expressed as percent of total month loading capacityTOTAL MONTHLY LOADING CAPACITY 100% 100% 100% 100% 100%Wasteload Allocation
Permitted Wastewater Treatment Facilities 0.1% 0.2% 0.2% 0.3% 0.4%Communities Subject to MS4 NPDES Requirements 0.0% 0.0% 0.0% 0.0% 0.0%Livestock Facilities Requiring NPDES Permits 0.0% 0.0% 0.0% 0.0% 0.0%"Straight Pipe" Septic Systems 0.0% 0.0% 0.0% 0.0% 0.0%
Load Allocation 77.7% 82.5% 90.6% 84.1% 82.4%Margin of Safety 22.2% 17.3% 9.2% 15.6% 17.2%
71

5.40 Whitewater River, Middle Fork; trout stream portion (AUID: 07040003-514) The 12-mile reach of the Middle Fork Whitewater River was added to the Section 303(d) Clean Water Act impaired waters list in 2002. The primary source of data that led to this listing was a 2000-2002 cooperative monitoring efforts involving the Whitewater River watershed project and Winona State University. The drainage area to the downstream end of this impaired reach is 54 square miles in Olmsted and Winona counties. Land use (Table 2.1) is primarily cultivated (69%), but includes substantial areas of grassland and forest. The watershed does not contain any communities served by permitted wastewater treatment systems (Table 5.40A). One livestock facility is covered under and NPDES permit (Table 5.40B). There are no communities that will require coverage under a MS4 permit at this time (Table 5.40C). Table 5.40D describes the monthly fecal coliform loading capacities for this reach of the Whitewater River to achieve water quality standards, as well as the component wasteload allocations, load allocations, and margins of safety. The loading capacities were developed using historic flow data from a USGS gage site on the South Fork Whitewater River near Altura as described in Appendix A. Substantial reductions in fecal coliform loading from straight-pipe septic systems, and a variety of nonpoint sources will likely be required to meet the allocations. Table 5.40A. Wastewater Treatment Facilities Name/Location Permit
Number Design Flow (mgd)
WLA (t-orgs./mo.)
none Table 5.40B. Livestock Facilities with NPDES Permits Facility ID Number Description Holden Farms Inc. 169-60300 3,200 Swine - 55 lbs. or More Table 5.40C. Municipal Separate Storm Sewer System (MS4) Communities Community Population Estimate Category none
72

Table 5.40D. Monthly Fecal Coliform Loading Capacities and Allocations - Whitewater River, Middle Fork; trout stream portion (AUID: 07040003-514) Drainage Area (square miles): 54USGS gage used to develop flow zones and loading capacities:
South Fork Whitewater near Altura% MS4 Urban: 0%Total WWTF Design Flow (mgd): 0 Flow Zone
High Moist Mid Dry Lowvalues expressed as trillion organisms per month (tera- or T-org./month)
TOTAL MONTHLY LOADING CAPACITY 6.74 3.27 2.04 1.46 1.14Wasteload Allocation
Permitted Wastewater Treatment Facilities 0.00 0.00 0.00 0.00 0.00Communities Subject to MS4 NPDES Requirements 0.00 0.00 0.00 0.00 0.00Livestock Facilities Requiring NPDES Permits 0 0 0 0 0"Straight Pipe" Septic Systems 0 0 0 0 0
Load Allocation 4.95 2.35 1.77 1.27 0.92Margin of Safety 1.79 0.92 0.27 0.19 0.22
values expressed as percent of total month loading capacityTOTAL MONTHLY LOADING CAPACITY 100% 100% 100% 100% 100%Wasteload Allocation
Permitted Wastewater Treatment Facilities 0% 0% 0% 0% 0%Communities Subject to MS4 NPDES Requirements 0% 0% 0% 0% 0%Livestock Facilities Requiring NPDES Permits 0% 0% 0% 0% 0%"Straight Pipe" Septic Systems 0% 0% 0% 0% 0%
Load Allocation 73% 72% 87% 87% 81%Margin of Safety 27% 28% 13% 13% 19%
73

5.41 Whitewater River, South Fork; trout stream portion above North Fork Whitewater River (AUID: 07040003-512) The 11-mile reach of the South Fork Whitewater River was added to the Section 303(d) Clean Water Act impaired waters list in 2002. The primary source of data that led to this listing was a 2000-2002 cooperative monitoring efforts involving the Whitewater River watershed project and Winona State University. The drainage area to the downstream end of this impaired reach is 93 square miles in Olmsted and Winona counties. Land use (Table 2.1) is primarily cultivated (64%), but includes substantial areas of grassland and forest. The watershed contains three communities served by permitted wastewater treatment systems (Table 5.41A); and two livestock facilities that have been issued NPDES permits (Table 5.41B). There are no communities that will require coverage under a MS4 permit at this time (Table 5.41C). Table 5.41D describes the monthly fecal coliform loading capacities for this reach of the Whitewater River to achieve water quality standards, as well as the component wasteload allocations, load allocations, and margins of safety. The loading capacities were developed using historic flow data from a USGS gage site on the South Fork Whitewater River near Altura as described in Appendix A. Substantial reductions in fecal coliform loading from straight-pipe septic systems, and a variety of nonpoint sources will likely be required to meet the allocations. Table 5.41A. Wastewater Treatment Facilities Name/Location Permit
Number Design Flow (mgd)
WLA (t-orgs./mo.)
Altura WWTP MN0021831 0.2693 0.06 Utica WWTP MNG580069 0.04 0.01 Whitewater River Pollution Control Facility MN0046868 1.12 0.25
Totals 1.43 0.32 Table 5.41B. Livestock Facilities with NPDES Permits Facility ID Number Description Gar-Lin Dairy Site 1 109-82692 918 Mature Dairy Cows Daley Farms of Lewiston LLP 169-50002 1,426 Mature Dairy Cows Table 5.41C. Municipal Separate Storm Sewer System (MS4) Communities Community Population Estimate Category none
74

Table 5.41D. Monthly Fecal Coliform Loading Capacities and Allocations - Whitewater River, South Fork; trout stream portion above North Fork Whitewater River (AUID: 07040003-512) Drainage Area (square miles): 93USGS gage used to develop flow zones and loading capacities:
South Fork Whitewater near Altura% MS4 Urban: 0%Total WWTF Design Flow (mgd): 1.4293 Flow Zone
High Moist Mid Dry Lowvalues expressed as trillion organisms per month (tera- or T-org./month)
TOTAL MONTHLY LOADING CAPACITY 11.68 5.66 3.53 2.53 1.98Wasteload Allocation
Permitted Wastewater Treatment Facilities 0.32 0.32 0.32 0.32 0.32Communities Subject to MS4 NPDES Requirements 0.00 0.00 0.00 0.00 0.00Livestock Facilities Requiring NPDES Permits 0 0 0 0 0"Straight Pipe" Septic Systems 0 0 0 0 0
Load Allocation 8.25 3.74 2.75 1.88 1.28Margin of Safety 3.11 1.60 0.46 0.33 0.38
values expressed as percent of total month loading capacityTOTAL MONTHLY LOADING CAPACITY 100% 100% 100% 100% 100%Wasteload Allocation
Permitted Wastewater Treatment Facilities 3% 6% 9% 13% 16%Communities Subject to MS4 NPDES Requirements 0% 0% 0% 0% 0%Livestock Facilities Requiring NPDES Permits 0% 0% 0% 0% 0%"Straight Pipe" Septic Systems 0% 0% 0% 0% 0%
Load Allocation 71% 66% 78% 74% 64%Margin of Safety 27% 28% 13% 13% 19%
75

5.42 Whitewater River, South Fork; headwaters to trout stream portion (AUID: 07040003-505) The 20-mile reach of the South Fork Whitewater River was added to the Section 303(d) Clean Water Act impaired waters list in 1994. The primary source of data that led to this listing was the MPCA Milestone long-term monitoring program. The drainage area to the downstream end of this impaired reach is 55 square miles in Olmsted and Winona counties. Land use (Table 2.1) is primarily cultivated (64%), but includes substantial areas of grassland and forest. The watershed contains one community (St. Charles) served by a permitted wastewater treatment facility (Table 5.42A), and one livestock facility that has been issued a NPDES permit (Table 5.42B). There are no communities that will require coverage under a MS4 permit at this time (Table 5.42C). Table 5.42D describes the monthly fecal coliform loading capacities for this reach of the Whitewater River to achieve water quality standards, as well as the component wasteload allocations, load allocations, and margins of safety. The loading capacities were developed using historic flow data from a USGS gage site on the South Fork Whitewater River near Altura as described in Appendix A. Substantial reductions in fecal coliform loading from straight-pipe septic systems, and a variety of nonpoint sources will likely be required to meet the allocations. Table 5.42A. Wastewater Treatment Facilities Name/Location Permit
Number Design Flow (mgd)
WLA (t-orgs./mo.)
Whitewater River Pollution Control Facility MN0046868 1.12 0.25 Table 5.42B. Livestock Facilities with NPDES Permits Facility ID Number Description Gar-Lin Dairy Site 1 109-82692 918 Mature Dairy Cows Table 5.42C. Municipal Separate Storm Sewer System (MS4) Communities Community Population Estimate Category none
76

Table 5.42D. Monthly Fecal Coliform Loading Capacities and Allocations - Whitewater River, South Fork; headwaters to trout stream portion (AUID: 07040003-505) Drainage Area (square miles): 55USGS gage used to develop flow zones and loading capacities:
South Fork Whitewater near Altura% MS4 Urban: 0%Total WWTF Design Flow (mgd): 1.12 Flow Zone
High Moist Mid Dry Lowvalues expressed as trillion organisms per month (tera- or T-org./month)
TOTAL MONTHLY LOADING CAPACITY 6.93 3.36 2.10 1.50 1.18Wasteload Allocation
Permitted Wastewater Treatment Facilities 0.25 0.25 0.25 0.25 0.25Communities Subject to MS4 NPDES Requirements 0.00 0.00 0.00 0.00 0.00Livestock Facilities Requiring NPDES Permits 0 0 0 0 0"Straight Pipe" Septic Systems 0 0 0 0 0
Load Allocation 4.84 2.16 1.57 1.05 0.71Margin of Safety 1.84 0.95 0.28 0.20 0.22
values expressed as percent of total month loading capacityTOTAL MONTHLY LOADING CAPACITY 100% 100% 100% 100% 100%Wasteload Allocation
Permitted Wastewater Treatment Facilities 4% 8% 12% 17% 22%Communities Subject to MS4 NPDES Requirements 0% 0% 0% 0% 0%Livestock Facilities Requiring NPDES Permits 0% 0% 0% 0% 0%"Straight Pipe" Septic Systems 0% 0% 0% 0% 0%
Load Allocation 70% 64% 75% 70% 60%Margin of Safety 27% 28% 13% 13% 19%
77

5.43 Whitewater River, North Fork; unnamed creek to Middle Fork Whitewater River (AUID: 07040003-554) The 10-mile reach of the North Fork Whitewater River was added to the Section 303(d) Clean Water Act impaired waters list in 1996. The primary source of data that led to this listing was USGS monitoring from 1985 to 1993. The drainage area to the downstream end of this impaired reach is 104 square miles, including land in Olmsted, Winona, and Wabasha counties. Land use (Table 2.1) is primarily cultivated (70%), but includes substantial areas of grassland and forest. The watershed contains one community served by a permitted wastewater treatment facility (Table 5.43A); and no livestock facilities that have been issued NPDES permits (Table 5.43B). There are no communities that will require coverage under a MS4 permit at this time (Table 5.43C). Table 5.43D describes the monthly fecal coliform loading capacities for this reach of the Whitewater River to achieve water quality standards, as well as the component wasteload allocations, load allocations, and margins of safety. The loading capacities were developed using historic flow data from a USGS gage site on the North Fork Whitewater River near Elba as described in Appendix A. Substantial reductions in fecal coliform loading from straight-pipe septic systems, and a variety of nonpoint sources will likely be required to meet the allocations. Table 5.43A. Wastewater Treatment Facilities Name/Location Permit
Number Design Flow (mgd)
WLA (t-orgs./mo.)
Plainview-Elgin Sanitary District WWTP MN0055361 1.421 0.32 Table 5.43B. Livestock Facilities with NPDES Permits Facility ID Number Description none Table 5.43C. Municipal Separate Storm Sewer System (MS4) Communities Community Population Estimate Category none
78

Table 5.43D. Monthly Fecal Coliform Loading Capacities and Allocations - Whitewater River, North Fork; unnamed creek to Middle Fork Whitewater River (AUID: 07040003-554) Drainage Area (square miles): 104USGS gage used to develop flow zones and loading capacities:
Norht Fork Whitewater near Elba% MS4 Urban: 0%Total WWTF Design Flow (mgd): 1.421 Flow Zone
High Moist Mid Dry Lowvalues expressed as trillion organisms per month (tera- or T-org./month)
TOTAL MONTHLY LOADING CAPACITY 18.25 8.42 5.69 4.40 2.70Wasteload Allocation
Permitted Wastewater Treatment Facilities 0.32 0.32 0.32 0.32 0.32Communities Subject to MS4 NPDES Requirements 0.00 0.00 0.00 0.00 0.00Livestock Facilities Requiring NPDES Permits 0 0 0 0 0"Straight Pipe" Septic Systems 0 0 0 0 0
Load Allocation 13.31 6.31 4.92 2.89 1.72Margin of Safety 4.62 1.79 0.45 1.19 0.66
values expressed as percent of total month loading capacityTOTAL MONTHLY LOADING CAPACITY 100% 100% 100% 100% 100%Wasteload Allocation
Permitted Wastewater Treatment Facilities 2% 4% 6% 7% 12%Communities Subject to MS4 NPDES Requirements 0% 0% 0% 0% 0%Livestock Facilities Requiring NPDES Permits 0% 0% 0% 0% 0%"Straight Pipe" Septic Systems 0% 0% 0% 0% 0%
Load Allocation 73% 75% 86% 66% 64%Margin of Safety 25% 21% 8% 27% 24%
79

5.44 Logan Branch; End trout stream portion to North Fork Whitewater River (AUID: 07040003-536) The 10-mile reach of the Logan Branch was added to the Section 303(d) Clean Water Act impaired waters list in 2002. The primary source of data that led to this listing was the locally-led Whitewater River watershed project. The drainage area to the downstream end of this impaired reach is 17 square miles, all in Olmsted County. Land use (Table 2.1) is primarily cultivated (68%), but includes substantial areas of grassland and forest. The watershed has no communities served by permitted wastewater treatment facilities (Table 5.44A) and no livestock facilities have been issued NPDES permits (Table 5.44B). There are no communities that will require coverage under a MS4 permit at this time (Table 5.44C). Table 5.44D describes the monthly fecal coliform loading capacities for this reach of the Whitewater River system to achieve water quality standards, as well as the component wasteload allocation, load allocation, and margin of safety. The loading capacities were derived using historic flow data from a USGS gage site on the North Fork Whitewater River near Elba as described in Appendix A. Substantial reductions in fecal coliform loading from straight-pipe septic systems, and a variety of nonpoint sources will likely be required to meet the allocations. Table 5.44A. Wastewater Treatment Facilities Name/Location Permit
Number Design Flow (mgd)
WLA (t-orgs./mo.)
none Table 5.44B. Livestock Facilities with NPDES Permits Facility ID Number Description none Table 5.44C. Municipal Separate Storm Sewer System (MS4) Communities Community Population Estimate Category none
80

Table 5.44D. Monthly Fecal Coliform Loading Capacities and Allocations - Logan Branch; End trout stream portion to North Fork Whitewater River (AUID: 07040003-536) Drainage Area (square miles): 17USGS gage used to develop flow zones and loading capacities:
North Fork Whitewater near Elba% MS4 Urban: 0%Total WWTF Design Flow (mgd): 0 Flow Zone
High Moist Mid Dry Lowvalues expressed as trillion organisms per month (tera- or T-org./month)
TOTAL MONTHLY LOADING CAPACITY 3.01 1.39 0.94 0.73 0.45Wasteload Allocation
Permitted Wastewater Treatment Facilities 0.00 0.00 0.00 0.00 0.00Communities Subject to MS4 NPDES Requirements 0.00 0.00 0.00 0.00 0.00Livestock Facilities Requiring NPDES Permits 0 0 0 0 0"Straight Pipe" Septic Systems 0 0 0 0 0
Load Allocation 2.25 1.09 0.87 0.53 0.34Margin of Safety 0.76 0.30 0.07 0.20 0.11
values expressed as percent of total month loading capacityTOTAL MONTHLY LOADING CAPACITY 100% 100% 100% 100% 100%Wasteload Allocation
Permitted Wastewater Treatment Facilities 0% 0% 0% 0% 0%Communities Subject to MS4 NPDES Requirements 0% 0% 0% 0% 0%Livestock Facilities Requiring NPDES Permits 0% 0% 0% 0% 0%"Straight Pipe" Septic Systems 0% 0% 0% 0% 0%
Load Allocation 75% 78% 93% 73% 76%Margin of Safety 25% 22% 7% 27% 24%
81

5.45 Whitewater River, North Fork; Unnamed Creek to Unnamed Creek (AUID: 07040003-553) The 8-mile reach of the North Fork Whitewater River was added to the Section 303(d) Clean Water Act impaired waters list in 2002. The primary source of data that led to this listing was a 2000-2002 cooperative monitoring efforts involving the Whitewater River watershed project and Winona State University. The drainage area to the downstream end of this impaired reach is 20 square miles, including land in Olmsted and Wabasha counties. Land use (Table 2.1) is primarily cultivated (76%), but includes substantial areas of grassland and forest. The watershed has no communities served by permitted wastewater treatment facilities (Table 5.45A), and no livestock facilities have been issued NPDES permits (Table 5.45B). There are no communities that will require coverage under a MS4 permit at this time (Table 5.45C). Table 5.45D describes the monthly fecal coliform loading capacities for this reach of the Whitewater River to achieve water quality standards, as well as the component wasteload allocations, load allocations, and margins of safety. The loading capacities were derived using historic flow data from a USGS gage site on the North Fork Whitewater River near Elba as described in Appendix A. Substantial reductions in fecal coliform loading from straight-pipe septic systems, and a variety of nonpoint sources will likely be required to meet the allocations. Table 5.45A. Wastewater Treatment Facilities Name/Location Permit
Number Design Flow (mgd)
WLA (t-orgs./mo.)
none Table 5.45B. Livestock Facilities with NPDES Permits Facility ID Number Description none Table 5.45C. Municipal Separate Storm Sewer System (MS4) Communities Community Population Estimate Category none
82

Table 5.45D. Monthly Fecal Coliform Loading Capacities and Allocations - Whitewater River, North Fork; Unnamed Creek to Unnamed Creek (AUID: 07040003-553) Drainage Area (square miles): 20USGS gage used to develop flow zones and loading capacities:
North Fork Whitewater near Elba% MS4 Urban: 0%Total WWTF Design Flow (mgd): 0 Flow Zone
High Moist Mid Dry Lowvalues expressed as trillion organisms per month (tera- or T-org./month)
TOTAL MONTHLY LOADING CAPACITY 3.49 1.61 1.09 0.84 0.52Wasteload Allocation
Permitted Wastewater Treatment Facilities 0.00 0.00 0.00 0.00 0.00Communities Subject to MS4 NPDES Requirements 0.00 0.00 0.00 0.00 0.00Livestock Facilities Requiring NPDES Permits 0 0 0 0 0"Straight Pipe" Septic Systems 0 0 0 0 0
Load Allocation 2.61 1.27 1.00 0.61 0.39Margin of Safety 0.88 0.34 0.09 0.23 0.13
values expressed as percent of total month loading capacityTOTAL MONTHLY LOADING CAPACITY 100% 100% 100% 100% 100%Wasteload Allocation
Permitted Wastewater Treatment Facilities 0% 0% 0% 0% 0%Communities Subject to MS4 NPDES Requirements 0% 0% 0% 0% 0%Livestock Facilities Requiring NPDES Permits 0% 0% 0% 0% 0%"Straight Pipe" Septic Systems 0% 0% 0% 0% 0%
Load Allocation 75% 79% 92% 73% 75%Margin of Safety 25% 21% 8% 27% 25%
83

5.46 Garvin Brook; Class 1B, 2A,3B portion (AUID: 07040003-542) The 14-mile reach of Garvin Brook was added to the Section 303(d) Clean Water Act impaired waters list in 1994. The primary source of data that led to this listing was the MPCA Milestone long-term monitoring program. The drainage area to the downstream end of this impaired reach is 49 square miles, all in Winona County. Land use (Table 2.1) is just under 50% cultivated, and nearly 40% forested (the second highest among watersheds included in this report). The watershed contains one community (Stockton) served by a permitted wastewater treatment facility (Table 5.46A). There are no livestock facilities requiring NPDES permits (Table 5.46B). There are no communities that will require coverage under a MS4 permit at this time (Table 5.46C). Table 5.46D describes the monthly fecal coliform loading capacities for this reach of Garvin Brook to achieve water quality standards, as well as the component wasteload allocations, load allocations, and margins of safety. The loading capacities were developed using historic flow data from a USGS gage site on Garvin Brook near Minnesota City as described in Appendix A. Substantial reductions in fecal coliform loading from straight-pipe septic systems, and a variety of nonpoint sources will likely be required to meet the allocations. Table 5.46A. Wastewater Treatment Facilities Name/Location Permit
Number Design Flow (mgd)
WLA (t-orgs./mo.)
Stockton WWTP MNG580079 0.07 0.02 Table 5.46B. Livestock Facilities with NPDES Permits Facility ID Number Description none Table 5.46C. Municipal Separate Storm Sewer System (MS4) Communities Community Population Estimate Category none
84

Table 5.46D. Monthly Fecal Coliform Loading Capacities and Allocations - Garvin Brook; Class 1B, 2A,3B portion (AUID: 07040003-542) Drainage Area (square miles): 49USGS gage used to develop flow zones and loading capacities:
Garvin Brook near Minnesota City% MS4 Urban: 0%Total WWTF Design Flow (mgd): 0.07 Flow Zone
High Moist Mid Dry Lowvalues expressed as trillion organisms per month (tera- or T-org./month)
TOTAL MONTHLY LOADING CAPACITY 7.55 5.84 5.22 4.85 3.56Wasteload Allocation
Permitted Wastewater Treatment Facilities 0.02 0.02 0.02 0.02 0.02Communities Subject to MS4 NPDES Requirements 0.00 0.00 0.00 0.00 0.00Livestock Facilities Requiring NPDES Permits 0 0 0 0 0"Straight Pipe" Septic Systems 0 0 0 0 0
Load Allocation 6.28 5.53 5.13 3.95 3.20Margin of Safety 1.25 0.29 0.07 0.88 0.34
values expressed as percent of total month loading capacityTOTAL MONTHLY LOADING CAPACITY 100% 100% 100% 100% 100%Wasteload Allocation
Permitted Wastewater Treatment Facilities 0.2% 0.3% 0.3% 0.3% 0.4%Communities Subject to MS4 NPDES Requirements 0.0% 0.0% 0.0% 0.0% 0.0%Livestock Facilities Requiring NPDES Permits 0.0% 0.0% 0.0% 0.0% 0.0%"Straight Pipe" Septic Systems 0.0% 0.0% 0.0% 0.0% 0.0%
Load Allocation 83.2% 94.8% 98.4% 81.5% 90.0%Margin of Safety 16.6% 5.0% 1.3% 18.1% 9.6%
85

5.47 Stockton Valley Creek; Trout stream portion to Garvin Brook (AUID: 07040003-559) Garvin Brook was added to the Section 303(d) Clean Water Act impaired waters list in 1994. This 6-mile reach of Stockton Valley Creek, a tributary to Garvin Brook, was added to the list in 2002. The primary source of data that led to this listing was a 2000-2002 cooperative monitoring effort between Winona State University and the MPCA. The drainage area to the downstream end of this impaired reach is 20 square miles, all in Winona County. Land use (Table 2.1) is less than 50% cultivated (third lowest of all watersheds included in this report), with the remainder forest and grassland. The watershed contains no communities served by permitted wastewater treatment facilities (Table 5.47A); and no livestock facilities have been issued NPDES permits (Table 5.47B). There are no communities that will require coverage under a MS4 permit at this time (Table 5.47C). Table 5.47D describes the monthly fecal coliform loading capacities for this reach of Stockton Valley Creek to achieve water quality standards, as well as the component wasteload allocations, load allocations, and margins of safety. The loading capacities were developed using historic flow data from a USGS gage site on Straight Valley Creek near Rollingstone as described in Appendix A. Substantial reductions in fecal coliform loading from straight-pipe septic systems, and a variety of nonpoint sources will likely be required to meet the allocations. Table 5.47A. Wastewater Treatment Facilities Name/Location Permit
Number Design Flow (mgd)
WLA (t-orgs./mo.)
none Table 5.47B. Livestock Facilities with NPDES Permits Facility ID Number Description none Table 5.47C. Municipal Separate Storm Sewer System (MS4) Communities Community Population Estimate Category none
86

Table 5.47D. Monthly Fecal Coliform Loading Capacities and Allocations - Stockton Valley Creek; Trout stream portion to Garvin Brook (AUID: 07040003-559) Drainage Area (square miles): 20USGS gage used to develop flow zones and loading capacities:
Straight Valley Creek near Rollingstone% MS4 Urban: 0%Total WWTF Design Flow (mgd): 0 Flow Zone
High Moist Mid Dry Lowvalues expressed as trillion organisms per month (tera- or T-org./month)
TOTAL MONTHLY LOADING CAPACITY 2.20 1.41 1.10 0.95 0.68Wasteload Allocation
Permitted Wastewater Treatment Facilities 0.00 0.00 0.00 0.00 0.00Communities Subject to MS4 NPDES Requirements 0.00 0.00 0.00 0.00 0.00Livestock Facilities Requiring NPDES Permits 0 0 0 0 0"Straight Pipe" Septic Systems 0 0 0 0 0
Load Allocation 1.95 1.22 1.05 0.78 0.56Margin of Safety 0.25 0.19 0.05 0.17 0.12
values expressed as percent of total month loading capacityTOTAL MONTHLY LOADING CAPACITY 100% 100% 100% 100% 100%Wasteload Allocation
Permitted Wastewater Treatment Facilities 0% 0% 0% 0% 0%Communities Subject to MS4 NPDES Requirements 0% 0% 0% 0% 0%Livestock Facilities Requiring NPDES Permits 0% 0% 0% 0% 0%"Straight Pipe" Septic Systems 0% 0% 0% 0% 0%
Load Allocation 89% 87% 95% 82% 82%Margin of Safety 11% 13% 5% 18% 18%
87

5.48 Zumbro River; West Indian Creek to Mississippi River (AUID: 07040004-501) The 23-mile reach of the Zumbro River from West Indian Creek to the Mississippi River was added to the Section 303(d) Clean Water Act impaired waters list in 2004. The primary source of data that led to this listing was a special study carried out by MPCA in 2002. The drainage area to the downstream end of this impaired reach is 1,488 square miles (the entire Zumbro River watershed). Land use in the watershed upstream of the impairment (Table 2.1) is dominated by cultivated land (67%), but exhibits substantial areas of forest and grassland, particularly in the eastern portion. The watershed includes 21 communities served by permitted wastewater treatment facilities (Table 5.48A), and 36 livestock facilities that have been issued NPDES permits (Table 5.48B). Approximately 26,000 acres, or 3% of the watershed, will require coverage under MS4 permits. This includes the City of Rochester and adjacent township areas (Table 5.48C). An additional 2% of the watershed area contains smaller towns and rural residences. Table 5.48D describes the monthly fecal coliform loading capacities for this reach of the Zumbro River to achieve water quality standards, as well as the component wasteload allocations, load allocations, and margins of safety. The loading capacities were developed using historic flow data from a USGS gage site on the Zumbro River at Kellogg as described in Appendix A. Substantial reductions in fecal coliform loading from straight-pipe septic systems, and a variety of nonpoint sources will likely be required to meet the allocations. Table 5.48A. Wastewater Treatment Facilities Name/Location Permit
Number Design Flow (mgd)
WLA (t-orgs./mo.)
Bellechester WWTP MN0022764 0.0245 0.01 Byron WWTP MN0049239 0.52 0.12 Camp Victory WWTP MN0067032 0.03 0.01 Claremont WWTP MN0022187 0.076 0.02 Dodge Center WWTP MN0021016 0.973 0.22 Goodhue WWTP MN0020958 0.0999 0.02 Hallmark Terrace Inc MNG580070 0.018 0.004 Hammond WWTP MN0066940 0.02971 0.01 Hayfield WWTP MN0023612 0.41 0.09 Kasson WWTP MN0050725 0.84 0.19 Kellogg WWTP MNG580027 0.06 0.01 Kenyon WWTP MN0021628 0.357 0.08 Mantorville WWTP MN0021059 0.0621 0.01 Mazeppa WWTP MN0046752 0.0723 0.02 Pine Island WWTP MN0024511 0.665 0.15
88

Rochester WWTP/Water Reclamation Plant
MN0024619 19.1 4.34
Wanamingo WWTP MN0022209 0.458 0.10 West Concord WWTP MN0025241 0.095 0.02 Zumbro Falls WWTP MN0051004 0.0297 0.01 Zumbro Ridge Estates Mobile Home Park
MN0038661 0.025 0.01
Zumbrota WWTP MN0025330 0.807 0.18 Totals 24.75221 5.620303
Table 5.48B. Livestock Facilities with NPDES Permits Facility ID Number Description Craig and Caryl Bendix Farm - Sec 10 039-81804 3,000 Swine - 55 lbs. or More Craig and Caryl Benedix Farm 039-81805 3,000 Swine - 55 lbs. or More Craig and Caryl Benedix Farm - Sec 4 039-81794 3,300 Swine - 55 lbs. or More Daley Farms - Pine Island 039-81902 1,050 Mature Dairy Cows Durst Bros Dairy - Site I 039-50010 1,286 Mature Dairy Cows Grandview Hogs of Dodge Center LLP 039-50005 2,554 Swine - 55 lbs. or More Hutton Farms Inc 039-50002 250,000 Chickens - broilers, Jennie-O Turkey Store - Claremont East 039-50006 100,000 Turkeys Jennie-O Turkey Store - Claremont West 039-50008 60,000 Turkeys Ripley Dairy LLP 039-81909 2,115 Mature Dairy Cows Toden Farms - Milton Yard 039-81850 1,298 Other Cattle Toquam Hogs - Barn 2 039-81920 3,920 Swine - 55 lbs. or More VZ Hogs LLP 039-50004 4,980 Swine - 55 lbs. or More Wilbert Kern Farm 039-80286 4,300 Swine - 55 lbs. or More Belvidere Group Partners Farm 049-72978 4,000 Swine - 55 lbs. or More Bombay Dairy Company Farm 049-72726 710 Mature Dairy Cows Darvin J Amundson Farm 049-72585 2,500 Swine - 55 lbs. or More Donnie L Dohrn Farm 049-73262 1,075 Other Cattle Gene Knott Farm 049-72619 4,000 Swine - 55 lbs. or More Knott Farms 049-50007 4,000 Swine - 55 lbs. or More Kohlnhofer Farms Inc - Site I 049-50002 4,000 Swine - 55 lbs. or More Kohlnhofer Farms Inc - Site III 049-50004 4,500 Swine - 55 lbs. or More Mike Kohlnhofer Farm 049-72976 4,500 Swine - 55 lbs. or More Minnesota Family Farms Coop 049-50001 3,050 Swine - 55 lbs. or More Jerome Foods Inc 3 109-78747 343,000 Turkeys Manco of FMT Inc 109-50005 3,000 Swine - 55 lbs. or More Manco of FMT Inc 2 109-82696 3,000 Swine - 55 lbs. or More Schoenfelder Farms 10 109-79242 1,980 Other Cattle, 6,900 Swine Schoenfelder Farms LLP - Roch 109-87100 2,280 Other Cattle, 5,915 Swine David C Johnson Farm 131-50001 3,750 Swine - 55 lbs. or More Jon W Brower Farm Sec 36 147-61682 4,000 Swine - 55 lbs. or More Shane Wagner Farm - Sec 23 147-92125 3,000 Swine - 55 lbs. or More Dan & Matt Arendt Farm 157-94002 3,300 Swine - 55 lbs. or More Gary Lehnertz Farm 157-86816 730 Mature Dairy Cows McNallan Dairy 157-94000 710 Mature Dairy Cows
Kenneth Schumacher Farm 157-86651 1,013 Animal Units; cattle, heifers, and calves
89

Table 5.48C. Municipal Separate Storm Sewer System (MS4) Communities Community Population
Estimate Category
City of Rochester and surrounding townships
98,064 Mandatory
Table 5.48D. Monthly Fecal Coliform Loading Capacities and Allocations - Zumbro River; West Indian Creek to Mississippi River (AUID: 07040004-501) Drainage Area (square miles): 1,488USGS gage used to develop flow zones and loading capacities:
Zumbro River at Kellogg% MS4 Urban: 3%Total WWTF Design Flow (mgd): 24.75221 Flow Zone
High Moist Mid Dry Lowvalues expressed as trillion organisms per month (tera- or T-org./month)
TOTAL MONTHLY LOADING CAPACITY 383.01 187.37 106.91 73.11 48.69Wasteload Allocation
Permitted Wastewater Treatment Facilities 5.62 5.62 5.62 5.62 5.62Communities Subject to MS4 NPDES Requirements 7.31 3.40 2.35 1.38 1.05Livestock Facilities Requiring NPDES Permits 0 0 0 0 0"Straight Pipe" Septic Systems 0 0 0 0 0
Load Allocation 262.72 122.09 84.54 49.57 37.92Margin of Safety 107.36 56.26 14.40 16.54 4.10
values expressed as percent of total month loading capacityTOTAL MONTHLY LOADING CAPACITY 100% 100% 100% 100% 100%Wasteload Allocation
Permitted Wastewater Treatment Facilities 1% 3% 5% 8% 12%Communities Subject to MS4 NPDES Requirements 2% 2% 2% 2% 2%Livestock Facilities Requiring NPDES Permits 0% 0% 0% 0% 0%"Straight Pipe" Septic Systems 0% 0% 0% 0% 0%
Load Allocation 69% 65% 79% 68% 78%Margin of Safety 28% 30% 13% 23% 8%
90

5.49 Zumbro River; Cold Creek to West Indian Creek (AUID: 07040004-502) The 23-mile reach of the Zumbro River from Cold Creek to West Indian Creek was added to the Section 303(d) Clean Water Act impaired waters list in 2004. The primary source of data that led to this listing was a special study carried out by MPCA in 2002. The drainage area to the downstream end of this impaired reach is 1,401 square miles, roughly 95% of the entire Zumbro River watershed. Land use in the watershed upstream of the impairment (Table 2.1) is dominated by cultivated land (67%), but exhibits substantial areas of forest and grassland, particularly in the eastern portion. The watershed includes 20 communities served by permitted wastewater treatment facilities (Table 5.49A), and 34 livestock facilities that have been issued NPDES permits (Table 5.49B). Approximately 26,000 acres, or 3% of the watershed, will require coverage under MS4 permits. This includes the City of Rochester and adjacent township areas (Table 5.49C). An additional 2% of the watershed area contains smaller towns and rural residences. Table 5.49D describes the monthly fecal coliform loading capacities for this reach of the Zumbro River to achieve water quality standards, as well as the component wasteload allocations, load allocations, and margins of safety. The loading capacities were developed using historic flow data from a USGS gage site on the Zumbro River at Kellogg as described in Appendix A. Substantial reductions in fecal coliform loading from straight-pipe septic systems, and a variety of nonpoint sources will likely be required to meet the allocations. Table 5.49A. Wastewater Treatment Facilities Name/Location Permit
Number Design Flow (mgd)
WLA (t-orgs./mo.)
Bellechester WWTP MN0022764 0.0245 0.01 Byron WWTP MN0049239 0.52 0.12 Camp Victory WWTP MN0067032 0.03 0.01 Claremont WWTP MN0022187 0.076 0.02 Dodge Center WWTP MN0021016 0.973 0.22 Goodhue WWTP MN0020958 0.0999 0.02 Hallmark Terrace Inc MNG580070 0.018 0.004 Hammond WWTP MN0066940 0.02971 0.01 Hayfield WWTP MN0023612 0.41 0.09 Kasson WWTP MN0050725 0.84 0.19 Kenyon WWTP MN0021628 0.357 0.08 Mantorville WWTP MN0021059 0.0621 0.01 Mazeppa WWTP MN0046752 0.0723 0.02 Pine Island WWTP MN0024511 0.665 0.15 Rochester WWTP/Water Reclamation Plant
MN0024619 19.1 4.34
Wanamingo WWTP MN0022209 0.458 0.10
91

West Concord WWTP MN0025241 0.095 0.02 Zumbro Falls WWTP MN0051004 0.0297 0.01 Zumbro Ridge Estates Mobile Home Park
MN0038661 0.025 0.01
Zumbrota WWTP MN0025330 0.807 0.18 Totals 24.69 5.61
Table 5.49B. Livestock Facilities with NPDES Permits Facility ID Number Description Craig and Caryl Bendix Farm - Sec 10 039-81804 3,000 Swine - 55 lbs. or More Craig and Caryl Benedix Farm 039-81805 3,000 Swine - 55 lbs. or More Craig and Caryl Benedix Farm - Sec 4 039-81794 3,300 Swine - 55 lbs. or More Daley Farms - Pine Island 039-81902 1,050 Mature Dairy Cows Durst Bros Dairy - Site I 039-50010 1,286 Mature Dairy Cows Grandview Hogs of Dodge Center LLP 039-50005 2,554 Swine - 55 lbs. or More Hutton Farms Inc 039-50002 250,000 Chickens - broilers, Jennie-O Turkey Store - Claremont East 039-50006 100,000 Turkeys Jennie-O Turkey Store - Claremont West 039-50008 60,000 Turkeys Ripley Dairy LLP 039-81909 2,115 Mature Dairy Cows Toden Farms - Milton Yard 039-81850 1,298 Other Cattle Toquam Hogs - Barn 2 039-81920 3,920 Swine - 55 lbs. or More VZ Hogs LLP 039-50004 4,980 Swine - 55 lbs. or More Wilbert Kern Farm 039-80286 4,300 Swine - 55 lbs. or More Belvidere Group Partners Farm 049-72978 4,000 Swine - 55 lbs. or More Bombay Dairy Company Farm 049-72726 710 Mature Dairy Cows Darvin J Amundson Farm 049-72585 2,500 Swine - 55 lbs. or More Donnie L Dohrn Farm 049-73262 1,075 Other Cattle Gene Knott Farm 049-72619 4,000 Swine - 55 lbs. or More Knott Farms 049-50007 4,000 Swine - 55 lbs. or More Kohlnhofer Farms Inc - Site I 049-50002 4,000 Swine - 55 lbs. or More Kohlnhofer Farms Inc - Site III 049-50004 4,500 Swine - 55 lbs. or More Mike Kohlnhofer Farm 049-72976 4,500 Swine - 55 lbs. or More Minnesota Family Farms Coop 049-50001 3,050 Swine - 55 lbs. or More Jerome Foods Inc 3 109-78747 343,000 Turkeys Manco of FMT Inc 109-50005 3,000 Swine - 55 lbs. or More Manco of FMT Inc 2 109-82696 3,000 Swine - 55 lbs. or More Schoenfelder Farms 10 109-79242 1,980 Other Cattle, 6,900 Sw Schoenfelder Farms LLP - Roch 109-87100 2,280 Other Cattle, 5,915 Sw David C Johnson Farm 131-50001 3,750 Swine - 55 lbs. or More Jon W Brower Farm Sec 36 147-61682 4,000 Swine - 55 lbs. or More Shane Wagner Farm - Sec 23 147-92125 3,000 Swine - 55 lbs. or More Dan & Matt Arendt Farm 157-94002 3,300 Swine - 55 lbs. or More
Kenneth Schumacher Farm 157-86651 1,013 Animal Units; cattle, heifers, and calves
92

Table 5.49C. Municipal Separate Storm Sewer System (MS4) Communities Community Population Estimate Category City of Rochester and surrounding townships
98,064 Mandatory
Table 5.49D. Monthly Fecal Coliform Loading Capacities and Allocations - Zumbro River; Cold Creek to West Indian Creek (AUID: 07040004-502) Drainage Area (square miles): 1,401USGS gage used to develop flow zones and loading capacities:
Zumbro River at Kellogg% MS4 Urban: 3%Total WWTF Design Flow (mgd): 24.69221 Flow Zone
High Moist Mid Dry Lowvalues expressed as trillion organisms per month (tera- or T-org./month)
TOTAL MONTHLY LOADING CAPACITY 360.62 176.42 100.66 68.83 45.84Wasteload Allocation
Permitted Wastewater Treatment Facilities 5.61 5.61 5.61 5.61 5.61Communities Subject to MS4 NPDES Requirements 7.30 3.39 2.34 1.37 1.05Livestock Facilities Requiring NPDES Permits 0 0 0 0 0"Straight Pipe" Septic Systems 0 0 0 0 0
Load Allocation 246.63 114.46 79.15 46.27 35.33Margin of Safety 101.09 52.97 13.56 15.58 3.86
values expressed as percent of total month loading capacityTOTAL MONTHLY LOADING CAPACITY 100% 100% 100% 100% 100%Wasteload Allocation
Permitted Wastewater Treatment Facilities 2% 3% 6% 8% 12%Communities Subject to MS4 NPDES Requirements 2% 2% 2% 2% 2%Livestock Facilities Requiring NPDES Permits 0% 0% 0% 0% 0%"Straight Pipe" Septic Systems 0% 0% 0% 0% 0%
Load Allocation 68% 65% 79% 67% 77%Margin of Safety 28% 30% 13% 23% 8%
93

5.50 South Fork Zumbro River; Cascade Creek to Lake Zumbro (AUID: 07040004-507) The 12-mile reach of the South Fork Zumbro River from Cascade Creek to Lake Zumbro was added to the Section 303(d) Clean Water Act impaired waters list in 1994. The primary source of data that led to this listing was the MPCA Milestone long-term monitoring program. The drainage area to the downstream end of this impaired reach is 349 square miles. Land use in the watershed upstream of the impairment (Table 2.1) includes 57% cultivated land, 20% grassland, and 13% urban/industrial. The watershed includes three communities served by permitted wastewater treatment facilities (Table 5.50A), and five livestock facilities that have been issued NPDES permits (Table 5.50B). Approximately 26,000 acres, or 12% of the watershed, will require coverage under MS4 permits. This includes the City of Rochester and adjacent township areas (Table 5.50C). Table 5.50D describes the monthly fecal coliform loading capacities for this reach of the Zumbro River to achieve water quality standards, as well as the component wasteload allocations, load allocations, and margins of safety. The loading capacities were developed using flow data from the USGS gage site on the Zumbro River at Rochester. The City of Rochester WWTF combined with the relatively high percentage of MS4 area result in large wasteload allocations. Substantial reductions in fecal coliform loading from straight-pipe septic systems, and a variety of nonpoint sources will likely be required to meet the allocations. Table 5.50A. Wastewater Treatment Facilities Name/Location Permit
Number Design Flow (mgd)
WLA (t-orgs./mo.)
Hallmark Terrace Inc MNG580070 0.018 0.004 Rochester WWTP/Water Reclamation Plant
MN0024619 19.1 4.34
Zumbro Ridge Estates Mobile Home Park
MN0038661 0.025 0.01
Totals 19.14 4.35 Table 5.50B. Livestock Facilities with NPDES Permits Facility ID Number Description Jerome Foods Inc 3 109-78747 343,000 Turkeys Manco of FMT Inc 109-50005 3,000 Swine - 55 lbs. or More Manco of FMT Inc 2 109-82696 3,000 Swine - 55 lbs. or More Schoenfelder Farms 10 109-79242 1,980 Other Cattle, 6,900 Sw Schoenfelder Farms LLP - Roch 109-87100 2,280 Other Cattle, 5,915 Sw
94

Table 5.50C. Municipal Separate Storm Sewer System (MS4) Communities Community Population Estimate Category City of Rochester and surrounding townships
98,064 Mandatory
Table 5.50D. Monthly Fecal Coliform Loading Capacities and Allocations - South Fork Zumbro River; Cascade Creek to Lake Zumbro (AUID: 07040004-507) Drainage Area (square miles): 349USGS gage used to develop flow zones and loading capacities:
South Fork Zumbro River at Rochester% MS4 Urban: 12%Total WWTF Design Flow (mgd): 19.143 Flow Zone
High Moist Mid Dry Low*values expressed as trillion organisms per month (tera- or T-org./month)
TOTAL MONTHLY LOADING CAPACITY 121.66 54.27 29.21 16.70 6.00Wasteload Allocation
Permitted Wastewater Treatment Facilities 4.35 4.35 4.35 4.35 4.35Communities Subject to MS4 NPDES Requirements 10.68 3.76 2.23 0.67 0.00Livestock Facilities Requiring NPDES Permits 0 0 0 0 0"Straight Pipe" Septic Systems 0 0 0 0 0
Load Allocation 81.84 28.84 17.08 5.17 0.00Margin of Safety 24.80 17.32 5.55 6.51 1.65
values expressed as percent of total month loading capacityTOTAL MONTHLY LOADING CAPACITY 100% 100% 100% 100% 100%Wasteload Allocation
Permitted Wastewater Treatment Facilities 4% 8% 15% 26% 73%Communities Subject to MS4 NPDES Requirements 9% 7% 8% 4% 0%Livestock Facilities Requiring NPDES Permits 0% 0% 0% 0% 0%"Straight Pipe" Septic Systems 0% 0% 0% 0% 0%
Load Allocation 67% 53% 58% 31% 0%Margin of Safety 20% 32% 19% 39% 27%*note - WWTF design flow exceeded minimum flow; see section 5.1 for description of approach to allocation
95

5.51 South Fork Zumbro River; Silver Lake Dam to Cascade Creek (AUID: 07040004-533) The 0.2-mile reach of the South Fork Zumbro River from Cascade Creek to Lake Zumbro was added to the Section 303(d) Clean Water Act impaired waters list in 2004. The primary source of data that led to this listing was a special study conducted by the MPCA in 2001. The drainage area to the downstream end of this impaired reach is 260 square miles. Land use in the watershed upstream of the impairment (Table 2.1) includes 62% cultivated land, 20% grassland, and 10% urban/industrial The watershed does not include any permitted wastewater treatment facility discharges (Table 5.51A), but does contain five livestock facilities that have been issued NPDES permits (Table 5.51B). Approximately 13,000 acres, or 8% of the watershed, will require coverage under MS4 permits. This includes portions of the City of Rochester and adjacent township areas (Table 5.51C). Table 5.51D describes the monthly fecal coliform loading capacities for this reach of the Zumbro River to achieve water quality standards, as well as the component wasteload allocations, load allocations, and margins of safety. The loading capacities were developed using flow data from the USGS gage site on the Zumbro River at Rochester as described in Appendix A. Substantial reductions in fecal coliform loading from straight-pipe septic systems, and a variety of nonpoint sources will likely be required to meet the allocations. Table 5.51A. Wastewater Treatment Facilities Name/Location Permit
Number Design Flow (mgd)
WLA (t-orgs./mo.)
none Table 5.51B. Livestock Facilities with NPDES Permits Facility ID Number Description Jerome Foods Inc 3 109-78747 343,000 Turkeys Manco of FMT Inc 109-50005 3,000 Swine - 55 lbs. or More Manco of FMT Inc 2 109-82696 3,000 Swine - 55 lbs. or More Schoenfelder Farms 10 109-79242 1,980 Other Cattle, 6,900 Sw Schoenfelder Farms LLP - Roch 109-87100 2,280 Other Cattle, 5,915 Sw Table 5.51C. Municipal Separate Storm Sewer System (MS4) Communities Community Population
Estimate Category
City of Rochester and surrounding townships
98,064 Mandatory
96

Table 5.51D. Monthly Fecal Coliform Loading Capacities and Allocations - South Fork Zumbro River; Silver Lake Dam to Cascade Creek (AUID: 07040004-533) Drainage Area (square miles): 260USGS gage used to develop flow zones and loading capacities:
South Fork Zumbro River at Rochester% MS4 Urban: 8%Total WWTF Design Flow (mgd): 0 Flow Zone
High Moist Mid Dry Lowvalues expressed as trillion organisms per month (tera- or T-org./month)
TOTAL MONTHLY LOADING CAPACITY 90.63 40.43 21.76 12.43 4.47Wasteload Allocation
Permitted Wastewater Treatment Facilities 0.00 0.00 0.00 0.00 0.00Communities Subject to MS4 NPDES Requirements 5.74 2.19 1.40 0.60 0.20Livestock Facilities Requiring NPDES Permits 0 0 0 0 0"Straight Pipe" Septic Systems 0 0 0 0 0
Load Allocation 66.42 25.34 16.22 6.98 2.32Margin of Safety 18.47 12.91 4.14 4.85 1.95
values expressed as percent of total month loading capacityTOTAL MONTHLY LOADING CAPACITY 100% 100% 100% 100% 100%Wasteload Allocation
Permitted Wastewater Treatment Facilities 0% 0% 0% 0% 0%Communities Subject to MS4 NPDES Requirements 6% 5% 6% 5% 4%Livestock Facilities Requiring NPDES Permits 0% 0% 0% 0% 0%"Straight Pipe" Septic Systems 0% 0% 0% 0% 0%
Load Allocation 73% 63% 75% 56% 52%Margin of Safety 20% 32% 19% 39% 44%
97

5.52 South Fork Zumbro River; Bear Creek to Oakwood Dam (AUID: 07040004-535) The 0.5-mile reach of the South Fork Zumbro River from Bear Creek to Oakwood Dam was added to the Section 303(d) Clean Water Act impaired waters list in 2004. Oakwood Dam is no longer present; the location is approximately the upper end of Silver Lake. The primary source of data that led to this listing was a special study conducted by the MPCA in 2001. The drainage area to the downstream end of this impaired reach is 239 square miles. Land use in the watershed upstream of the impairment (Table 2.1) includes 62% cultivated land, 20% grassland, and 9% urban/industrial The watershed does not include any permitted wastewater treatment facility discharges (Table 5.52A), but does contain five livestock facilities that have been issued NPDES permits (Table 5.52B). Approximately 12,000 acres, or 8% of the watershed, will require coverage under MS4 permits. This includes portions of the City of Rochester and adjacent township areas (Table 5.52C). Table 5.52D describes the monthly fecal coliform loading capacities for this reach of the Zumbro River to achieve water quality standards, as well as the component wasteload allocations, load allocations, and margins of safety. The loading capacities were developed using flow data from the USGS gage site on the Zumbro River at Rochester as described in Appendix A. Substantial reductions in fecal coliform loading from straight-pipe septic systems, and a variety of nonpoint sources will likely be required to meet the allocations. Table 5.52A. Wastewater Treatment Facilities Name/Location Permit
Number Design Flow (mgd)
WLA (t-orgs./mo.)
none Table 5.52B. Livestock Facilities with NPDES Permits Facility ID Number Description Jerome Foods Inc 3 109-78747 343,000 Turkeys Manco of FMT Inc 109-50005 3,000 Swine - 55 lbs. or More Manco of FMT Inc 2 109-82696 3,000 Swine - 55 lbs. or More Schoenfelder Farms 10 109-79242 1,980 Other Cattle, 6,900 Sw Schoenfelder Farms LLP - Roch 109-87100 2,280 Other Cattle, 5,915 Sw Table 5.52C. Municipal Separate Storm Sewer System (MS4) Communities Community Population
Estimate Category
City of Rochester and surrounding townships
98,064 Mandatory
98

5.52D. Monthly Fecal Coliform Loading Capacities and Allocations - South Fork Zumbro River; Bear Creek to Oakwood Dam (AUID: 07040004-535) Drainage Area (square miles): 239USGS gage used to develop flow zones and loading capacities:
South Fork Zumbro River at Rochester% MS4 Urban: 8%Total WWTF Design Flow (mgd): 0 Flow Zone
High Moist Mid Dry Lowvalues expressed as trillion organisms per month (tera- or T-org./month)
TOTAL MONTHLY LOADING CAPACITY 83.37 37.18 20.01 11.44 4.10Wasteload Allocation
Permitted Wastewater Treatment Facilities 0.00 0.00 0.00 0.00 0.00Communities Subject to MS4 NPDES Requirements 5.17 1.97 1.26 0.54 0.18Livestock Facilities Requiring NPDES Permits 0 0 0 0 0"Straight Pipe" Septic Systems 0 0 0 0 0
Load Allocation 61.20 23.34 14.94 6.44 2.12Margin of Safety 17.00 11.87 3.81 4.45 1.80
values expressed as percent of total month loading capacityTOTAL MONTHLY LOADING CAPACITY 100% 100% 100% 100% 100%Wasteload Allocation
Permitted Wastewater Treatment Facilities 0% 0% 0% 0% 0%Communities Subject to MS4 NPDES Requirements 6% 5% 6% 5% 4%Livestock Facilities Requiring NPDES Permits 0% 0% 0% 0% 0%"Straight Pipe" Septic Systems 0% 0% 0% 0% 0%
Load Allocation 73% 63% 75% 56% 52%Margin of Safety 20% 32% 19% 39% 44%
99

5.53 South Fork Zumbro River; Salem Creek to Bear Creek (AUID: 07040004-536) The 9-mile reach of the South Fork Zumbro River from Salem Creek to Bear Creek was added to the Section 303(d) Clean Water Act impaired waters list in 2004. The primary source of data that led to this listing was a special study conducted by the MPCA in 2001. The drainage area to the downstream end of this impaired reach is 157 square miles. Land use in the watershed upstream of the impairment (Table 2.1) includes 68% cultivated land, 18% grassland, and 6% urban/industrial. The watershed does not include any permitted wastewater treatment facility discharges (Table 5.53A), but does contain two livestock facilities that have been issued NPDES permits (Table 5.53B). Approximately 4,000 acres, or 4% of the watershed, will require coverage under MS4 permits. This includes portions of the City of Rochester and adjacent township areas (Table 5.53C). Table 5.53D describes the monthly fecal coliform loading capacities for this reach of the Zumbro River to achieve water quality standards, as well as the component wasteload allocations, load allocations, and margins of safety. The loading capacities were developed using flow data from the USGS gage site on the Zumbro River at Rochester as described in Appendix A. Substantial reductions in fecal coliform loading from straight-pipe septic systems, and a variety of nonpoint sources will likely be required to meet the allocations. Table 5.53A. Wastewater Treatment Facilities Name/Location Permit
Number Design Flow (mgd)
WLA (t-orgs./mo.)
none Table 5.53B. Livestock Facilities with NPDES Permits Facility ID Number Description Manco of FMT Inc 109-50005 3,000 Swine - 55 lbs. or More Manco of FMT Inc 2 109-82696 3,000 Swine - 55 lbs. or More Table 5.53C. Municipal Separate Storm Sewer System (MS4) Communities Community Population
Estimate Category
City of Rochester and surrounding townships
98,064 Mandatory
100

5.53D. Monthly Fecal Coliform Loading Capacities and Allocations - South Fork Zumbro River; Salem Creek to Bear Creek (AUID: 07040004-536) Drainage Area (square miles): 157USGS gage used to develop flow zones and loading capacities:
South Fork Zumbro River at Rochester% MS4 Urban: 4%Total WWTF Design Flow (mgd): 0 Flow Zone
High Moist Mid Dry Lowvalues expressed as trillion organisms per month (tera- or T-org./month)
TOTAL MONTHLY LOADING CAPACITY 54.78 24.43 13.15 7.51 2.69Wasteload Allocation
Permitted Wastewater Treatment Facilities 0.00 0.00 0.00 0.00 0.00Communities Subject to MS4 NPDES Requirements 1.80 0.68 0.44 0.19 0.06Livestock Facilities Requiring NPDES Permits 0 0 0 0 0"Straight Pipe" Septic Systems 0 0 0 0 0
Load Allocation 41.82 15.94 10.21 4.40 1.45Margin of Safety 11.16 7.81 2.49 2.92 1.18
values expressed as percent of total month loading capacityTOTAL MONTHLY LOADING CAPACITY 100% 100% 100% 100% 100%Wasteload Allocation
Permitted Wastewater Treatment Facilities 0% 0% 0% 0% 0%Communities Subject to MS4 NPDES Requirements 3% 3% 3% 3% 2%Livestock Facilities Requiring NPDES Permits 0% 0% 0% 0% 0%"Straight Pipe" Septic Systems 0% 0% 0% 0% 0%
Load Allocation 76% 65% 78% 59% 54%Margin of Safety 20% 32% 19% 39% 44%
101

5.54 Salem Creek; lower 15 miles; class 2C portion to South Fork Zumbro River (AUID: 07040004-503) The 17-mile reach of Salem Creek to the confluence with the South Fork Zumbro River was added to the Section 303(d) Clean Water Act impaired waters list in 1994. The primary source of data that led to this listing was the MPCA Milestone long-term monitoring program. The drainage area to the downstream end of this impaired reach is 62 square miles. Land use in the watershed upstream of the impairment (Table 2.1) is dominated by cultivated land (80%), and contains just 3% rural and suburban residential/commercial. The watershed does not include any permitted wastewater treatment facility discharges (Table 5.54A) or livestock facilities that have been issued NPDES permits (Table 5.54B). There are no communities that will require coverage under MS4 permits at this time (Table 5.54C). Table 5.54D describes the monthly fecal coliform loading capacities for this reach of the Zumbro River to achieve water quality standards, as well as the component wasteload allocations, load allocations, and margins of safety. The loading capacities were developed using flow data from the USGS gage site on the Zumbro River at Rochester as described in Appendix A. Substantial reductions in fecal coliform loading from straight-pipe septic systems, and a variety of nonpoint sources will likely be required to meet the allocations. Table 5.54A. Wastewater Treatment Facilities Name/Location Permit
Number Design Flow (mgd)
WLA (t-orgs./mo.)
none Table 5.54B. Livestock Facilities with NPDES Permits Facility ID Number Description none Table 5.54C. Municipal Separate Storm Sewer System (MS4) Communities Community Population
Estimate Category
none
102

5.54D. Monthly Fecal Coliform Loading Capacities and Allocations - Salem Creek; lower 15 miles; class 2C portion to South Fork Zumbro River (AUID: 07040004-503) Drainage Area (square miles): 62USGS gage used to develop flow zones and loading capacities:
South Fork Zumbro River at Rochester% MS4 Urban: 0%Total WWTF Design Flow (mgd): 0 Flow Zone
High Moist Mid Dry Lowvalues expressed as trillion organisms per month (tera- or T-org./month)
TOTAL MONTHLY LOADING CAPACITY 21.73 9.69 5.22 2.98 1.07Wasteload Allocation
Permitted Wastewater Treatment Facilities 0.00 0.00 0.00 0.00 0.00Communities Subject to MS4 NPDES Requirements 0.00 0.00 0.00 0.00 0.00Livestock Facilities Requiring NPDES Permits 0 0 0 0 0"Straight Pipe" Septic Systems 0 0 0 0 0
Load Allocation 17.30 6.59 4.23 1.82 0.60Margin of Safety 4.43 3.10 0.99 1.16 0.47
values expressed as percent of total month loading capacityTOTAL MONTHLY LOADING CAPACITY 100% 100% 100% 100% 100%Wasteload Allocation
Permitted Wastewater Treatment Facilities 0% 0% 0% 0% 0%Communities Subject to MS4 NPDES Requirements 0% 0% 0% 0% 0%Livestock Facilities Requiring NPDES Permits 0% 0% 0% 0% 0%"Straight Pipe" Septic Systems 0% 0% 0% 0% 0%
Load Allocation 80% 68% 81% 61% 56%Margin of Safety 20% 32% 19% 39% 44%
103

5.55 Cedar River, Rose Creek to Woodbury Creek (AUID: 07080201-501) The 10-mile reach of the Cedar River from Rose Creek to Woodbury Creek was added to the Section 303(d) Clean Water Act impaired waters list in 1998. The primary source of data that led to this listing was the MPCA Milestone long-term monitoring program. The drainage area to the downstream end of this impaired reach is 544 square miles. This represents most of the Cedar River watershed in Minnesota and includes portions of Mower, Freeborn, and Steele counties. Land use in the watershed upstream of the impairment (Table 2.1) is dominated by cultivated land (87%), much of which has surface (ditches) and subsurface (tile) drainage. The watershed includes 10 communities served by permitted wastewater treatment facilities (Table 5.55A); and 13 livestock facilities that have been issued NPDES permits (Table 5.55B). Approximately 7,000 acres of the City of Austin, or 2% of the watershed, will require coverage under MS4 permits (Table 5.55C). An additional 2% of the watershed area contains smaller towns and rural residences. Table 5.55D describes the monthly fecal coliform loading capacities for this reach of the Cedar River to achieve water quality standards, as well as the component wasteload allocations, load allocations, and margins of safety. The loading capacities were developed using flow data from the USGS gage site on the Cedar River near Austin as described in Appendix A. Substantial reductions in fecal coliform loading from straight-pipe septic systems, and a variety of nonpoint sources will likely be required to meet the allocations Table 5.55A. Wastewater Treatment Facilities Name/Location Permit
Number Design Flow (mgd)
WLA (t-orgs./mo.)
Lansing Township WWT Improvements
MN0063461 0.026 0.006
Blooming Prairie WWTP MN0021822 0.899 0.20 Brownsdale WWTP MN0022934 0.184 0.04 Elkton WWTP MNG580013 0.017 0.004 Hollandale WWTP MN0048992 0.0427 0.01 Austin WWTP MN0022683 8.475 1.92 Oakland Sanitary District WWTP
MN0040631 0.0121 0.003
Sargeant WWTP MN0021601 0.0106 0.002 Waltham WWTP MN0025186 0.027 0.01 Rose Creek WWTP MNG580072 0.065 0.01
Totals 9.76 2.22 Table 5.55B. Livestock Facilities with NPDES Permits Facility ID Number Description Roland Kittleson Farm 039-50003 3,600 Swine - 55 lbs. or More
104

Dennis Magnuson & MHF Free Co - Sec 35 047-96992 11,500 Swine - 55 lbs. or More Dennis Magnuson Farm 047-50008 8,350 Swine - 55 lbs. or More Dennis Magnuson Farm - Sec 35 NE 047-96991 14,780 Swine Under 55 lbs. Hanson Hog Farm 047-96951 3,000 Swine - 55 lbs. or More Natural Pork Production II LLP - Austin 047-50005 3,830 Swine - 55 lbs. or More North Farm 047-50007 8,350 Swine - 55 lbs. or More Bob Bartel Farm Sec 22 099-60649 4,800 Swine - 55 lbs. or More Geo A Hormel & Co Farm 099-83267 6,000 Swine - 55 lbs. or More John Nielsen Farm - Site 2 099-93981 3,600 Swine - 55 lbs. or More Paul Meany Farm - Sec 15 099-50001 3,840 Swine - 55 lbs. or More Yunker Farms 099-83464 4,000 Swine - 55 lbs. or More MJC Farms 147-50001 3,180 Swine - 55 lbs. or More Table 5.55C. Municipal Separate Storm Sewer System (MS4) Communities Community Population
Estimate Category
Austin 23,314 Designated by rule; > 10,000 population Table 5.55D. Monthly Fecal Coliform Loading Capacities and Allocations - Cedar River, Rose Creek to Woodbury Creek (AUID: 07080201-501) Drainage Area (square miles): 544USGS gage used to develop flow zones and loading capacities:
Cedar River near Austin% MS4 Urban: 2%Total WWTF Design Flow (mgd): 9.7584 Flow Zones
High Moist Mid Dry Lowvalues expressed as trillion organisms per month (tera- or T-org./month)
TOTAL MONTHLY LOADING CAPACITY 195.38 73.42 34.36 17.30 9.45Wasteload Allocation
Permitted Wastewater Treatment Facilities 2.22 2.22 2.22 2.22 2.22Communities Subject to MS4 NPDES Requirements 2.92 0.88 0.47 0.18 0.08Livestock Facilities Requiring NPDES Permits 0 0 0 0 0"Straight Pipe" Septic Systems 0 0 0 0 0
Load Allocation 143.88 43.16 23.13 8.80 4.17Margin of Safety 46.36 27.17 8.54 6.11 2.98
values expressed as percent of total month loading capacityTOTAL MONTHLY LOADING CAPACITY 100% 100% 100% 100% 100%Wasteload Allocation
Permitted Wastewater Treatment Facilities 1.1% 3.0% 6.4% 12.8% 23.4%Communities Subject to MS4 NPDES Requirements 1.5% 1.2% 1.4% 1.0% 0.9%Livestock Facilities Requiring NPDES Permits 0.0% 0.0% 0.0% 0.0% 0.0%"Straight Pipe" Septic Systems 0.0% 0.0% 0.0% 0.0% 0.0%
Load Allocation 73.6% 58.8% 67.3% 50.8% 44.1%Margin of Safety 23.7% 37.0% 24.9% 35.3% 31.5%
105

5.56 Cedar River, Roberts Creek to Upper Austin Dam (AUID: 07080201-502) The 5-mile reach of the Cedar River from Roberts Creek to the Upper Austin Dam was added to the Section 303(d) Clean Water Act impaired waters list in 1998. The primary source of data that led to this listing was the MPCA Milestone long-term monitoring program. The drainage area to the downstream end of this impaired reach is 185 square miles. This represents about 1/3 of the entire Cedar River watershed in Minnesota and includes portions of Mower, Freeborn, and Steele counties. Land use in the watershed upstream of the impairment (Table 2.1) is dominated by cultivated land (89%), much of which has surface (ditches) and subsurface (tile) drainage. The watershed includes 3 communities served by permitted wastewater treatment facilities (Table 5.56A); and 3 livestock facilities that have been issued NPDES permits (Table 5.56B). There are no communities that will require coverage under a MS4 permit at this time (Table 5.56C), although 3% of the watershed consists of small towns and rural residential land. Table 5.56D describes the monthly fecal coliform loading capacities for this reach of the Cedar River to achieve water quality standards, as well as the component wasteload allocations, load allocations, and margins of safety. The loading capacities were developed using flow data from the USGS gage site on the Cedar River near Austin as described in Appendix A. Substantial reductions in fecal coliform loading from straight-pipe septic systems, and a variety of nonpoint sources will likely be required to meet the allocations Table 5.56A. Wastewater Treatment Facilities Name/Location Permit
Number Design Flow (mgd)
WLA (t-orgs./mo.)
Lansing Township WWT Improvements
MN0063461 0.026 0.006
Blooming Prairie WWTP MN0021822 0.899 0.20 Waltham WWTP MN0025186 0.027 0.01
Totals 0.95 0.22 Table 5.56B. Livestock Facilities with NPDES Permits Facility ID Number Description Roland Kittleson Farm 039-50003 3,600 Swine - 55 lbs. or More Bob Bartel Farm Sec 22 099-60649 4,800 Swine - 55 lbs. or More MJC Farms 147-50001 3,180 Swine - 55 lbs. or More Table 5.56C. Municipal Separate Storm Sewer System (MS4) Communities Community Population
Estimate Category
none
106

Table 5.56D. Monthly Fecal Coliform Loading Capacities and Allocations - Cedar River, Roberts Creek to Upper Austin Dam (AUID: 07080201-502) Drainage Area (square miles): 185USGS gage used to develop flow zones and loading capacities:
Cedar River near Austin% MS4 Urban: 0%Total WWTF Design Flow (mgd): 0.952 Flow Zone
High Moist Mid Dry Lowvalues expressed as trillion organisms per month (tera- or T-org./month)
TOTAL MONTHLY LOADING CAPACITY 66.38 24.95 11.67 5.88 3.21Wasteload Allocation
Permitted Wastewater Treatment Facilities 0.22 0.22 0.22 0.22 0.22Communities Subject to MS4 NPDES Requirements 0.00 0.00 0.00 0.00 0.00Livestock Facilities Requiring NPDES Permits 0 0 0 0 0"Straight Pipe" Septic Systems 0 0 0 0 0
Load Allocation 50.41 15.50 8.55 3.58 1.98Margin of Safety 15.75 9.23 2.90 2.08 1.01
values expressed as percent of total month loading capacityTOTAL MONTHLY LOADING CAPACITY 100% 100% 100% 100% 100%Wasteload Allocation
Permitted Wastewater Treatment Facilities 0.3% 0.9% 1.9% 3.7% 6.7%Communities Subject to MS4 NPDES Requirements 0.0% 0.0% 0.0% 0.0% 0.0%Livestock Facilities Requiring NPDES Permits 0.0% 0.0% 0.0% 0.0% 0.0%"Straight Pipe" Septic Systems 0.0% 0.0% 0.0% 0.0% 0.0%
Load Allocation 75.9% 62.1% 73.3% 60.9% 61.8%Margin of Safety 23.7% 37.0% 24.9% 35.4% 31.5%
107

5.57 Shell Rock River; Albert Lea Lake to Goose Creek (AUID: 07080202-501) The 12-mile reach of the Shell Rock River from Albert Lea Lake to Goose Creek was added to the Section 303(d) Clean Water Act impaired waters list in 1994. The primary source of data that led to this listing was the MPCA Milestone long-term monitoring program. The drainage area to the downstream end of this impaired reach is 195 square miles. Land use in the watershed upstream of the impairment (Table 2.1) is dominated by cultivated land (76%), but compared to the other impaired reach watersheds in the basin, exhibits a relatively high percentage of water and wetlands. The watershed includes 4 communities and a state park served by permitted wastewater treatment facilities (Table 5.57A). No livestock facilities that have been issued NPDES permits are located in the watershed (Table 5.57B). Approximately 8,000 acres of the City of Albert Lea, or 6% of the watershed, will require coverage under MS4 permits (Table 5.57C). Table 5.57D describes the monthly fecal coliform loading capacities for this reach of the Shell Rock River to achieve water quality standards, as well as the component wasteload allocations, load allocations, and margins of safety. The loading capacities were developed using flow data from the USGS gage site on the Shell Rock River near Northwood, IA as described in Appendix A. Substantial reductions in fecal coliform loading from straight-pipe septic systems, and a variety of nonpoint sources will likely be required to meet the allocations. It is possible that Albert Lea Lake functions to reduce downstream bacteria loading. As such, some focus on sources downstream of Albert Lea Lake may lead to greater water quality improvements on the impaired river reach. Table 5.57A. Wastewater Treatment Facilities Name/Location Permit
Number Design Flow (mgd)
Facility Class
Clarks Grove WWTP MNG580067 0.1164 0.026 Albert Lea WWTP MN0041092 18.38 4.17 Glenville WWTP MN0021245 0.13 0.03 Hayward WWTP MN0041122 0.045 0.010 MDNR Myre Big Island State Park
MN0033740 0.01 0.002
Totals 18.68 4.24 Table 5.57B. Livestock Facilities with NPDES Permits Facility ID Number Description none
108

Table 5.57C. Municipal Separate Storm Sewer System (MS4) Communities Community Population Estimate Category Albert Lea 18,356 mandatory Table 5.57D. Monthly Fecal Coliform Loading Capacities and Allocations - Shell Rock River; Albert Lea Lake to Goose Creek (AUID: 07080202-501) Drainage Area (square miles): 195USGS gage used to develop flow zones and loading capacities:
Shell Rock River near Northwood, IA% MS4 Urban: 6%Total WWTF Design Flow (mgd): 18.6814 Flow Zone
High Moist Mid *Dry *Lowvalues expressed as trillion organisms per month (tera- or T-org./month)
TOTAL MONTHLY LOADING CAPACITY 56.33 25.28 11.55 3.88 1.63Wasteload Allocation
Permitted Wastewater Treatment Facilities 4.24 4.24 4.24 * *Communities Subject to MS4 NPDES Requirements 2.70 0.72 0.25 * *Livestock Facilities Requiring NPDES Permits 0 0 0 0.00 0.00"Straight Pipe" Septic Systems 0 0 0 0.00 0.00
Load Allocation 39.39 10.47 3.60 * *Margin of Safety 9.99 9.85 3.46 na na
values expressed as percent of total month loading capacityTOTAL MONTHLY LOADING CAPACITY 100% 100% 100% 100% 100%Wasteload Allocation
Permitted Wastewater Treatment Facilities 7.5% 16.8% 36.7% * *Communities Subject to MS4 NPDES Requirements 4.8% 2.8% 2.1% * *Livestock Facilities Requiring NPDES Permits 0.0% 0.0% 0.0% 0.0% 0.0%"Straight Pipe" Septic Systems 0.0% 0.0% 0.0% 0.0% 0.0%
Load Allocation 69.9% 41.4% 31.2% * *Margin of Safety 17.7% 39.0% 30.0% na na*note - WWTF design flow exceeded dry and low flow; Allocation = (flow contribution from source) X (200 orgs./100ml.); see Sect. 5.1
109

5.58 Vermillion River; South Br. Vermillion River to the Hastings Dam (AUID: 07040001-506) The 12-mile reach of the Vermillion River from the confluence with the South Branch to the Hastings Dam was added to the Section 303(d) Clean Water Act impaired waters list in 1996. The primary source of data that led to this listing was the Metropolitan Council water monitoring program. The drainage area to the downstream end of this impaired reach is 273 square miles. Land use in the watershed upstream of the impairment (Table 2.1) is just over 50% cultivated, and 26% residential, urban, and industrial. The balance is grassland, forest, water and wetland. The watershed includes four communities served by permitted wastewater treatment facilities (Table 5.58A), including the very large Empire facility. No livestock facilities that have been issued NPDES permits are located in the watershed (Table 5.58B). Approximately 32,000 acres, or 18% of the watershed, will require coverage under MS4 permits. This includes portions of a number of Twin Cities suburban communities, as well as some of the City of Hastings (Table 5.58C). Table 5.58D describes the monthly fecal coliform loading capacities for this reach of the Vermillion River to achieve water quality standards, as well as the component wasteload allocations, load allocations, and margins of safety. The loading capacities were developed using flow data from the USGS gage site on the Vermillion River near Empire as described in Appendix A. Substantial reductions in fecal coliform loading from straight-pipe septic systems, and a variety of nonpoint sources will likely be required to meet the allocations. Table 5.58A. Wastewater Treatment Facilities Name/Location Permit
Number Design Flow (mgd)
WLA (t-orgs./mo.)
Elko/New Market WWTP MN0056219 0.98 0.22 Hampton WWTP MN0021946 0.101 0.02 Met Council - Empire WWTP MN0045845 28.61 6.50 Vermillion 0.054 0.01
Totals 29.745 6.75 Table 5.58B. Livestock Facilities with NPDES Permits Facility ID Number Description none
110

Table 5.58C. Municipal Separate Storm Sewer System (MS4) Communities Community Population
Estimate Category
Portions of the following communities fall within the impaired reach watershed: Apple Valley mandatory Burnsville mandatory Eagan mandatory Farmington mandatory Hastings Designated by rule; > 10,000 population Inver Grove Heights
mandatory
Lakeville mandatory Rosemount mandatory Empire Townsip
mandatory
Table 5.58D. Monthly Fecal Coliform Loading Capacities and Allocations - Vermillion River; South Br. Vermillion River to the Hastings Dam (AUID: 07040001-506) Drainage Area (square miles): 273USGS gage used to develop flow zones and loading capacities:
Vermillion River near Empire% MS4 Urban: 18%Total WWTF Design Flow (mgd): 29.745 Flow Zone
High Moist Mid Dry Low*values expressed as trillion organisms per month (tera- or T-org./month)
TOTAL MONTHLY LOADING CAPACITY 66.71 32.50 19.74 11.75 6.98Wasteload Allocation
Permitted Wastewater Treatment Facilities 6.75 6.75 6.75 6.75 *Communities Subject to MS4 NPDES Requirements 8.62 3.09 1.57 0.30 *Livestock Facilities Requiring NPDES Permits 0 0 0 0 0.00"Straight Pipe" Septic Systems 0 0 0 0 0.00
Load Allocation 38.41 13.76 7.02 1.32 *Margin of Safety 12.93 8.90 4.39 3.38 na
values expressed as percent of total month loading capacityTOTAL MONTHLY LOADING CAPACITY 100% 100% 100% 100% 100%Wasteload Allocation
Permitted Wastewater Treatment Facilities 10.1% 20.8% 34.2% 57.4% *Communities Subject to MS4 NPDES Requirements 12.9% 9.5% 8.0% 2.5% *Livestock Facilities Requiring NPDES Permits 0.0% 0.0% 0.0% 0.0% 0.0%"Straight Pipe" Septic Systems 0.0% 0.0% 0.0% 0.0% 0.0%
Load Allocation 57.6% 42.3% 35.6% 11.3% *Margin of Safety 19.4% 27.4% 22.2% 28.8% na* note - WWTF design flow exceeded low flow minus MOS; Allocation = (flow contribution from source) X (200 orgs./100ml.); see Sect. 5.1
111

5.59 Vermillion River; Below trout stream portion to South Br. Vermillion River (AUID: 07040001-507) The 9-mile reach of the Vermillion River below the trout stream portions to the South Branch of the Vermillion River was added to the Section 303(d) Clean Water Act impaired waters list in 1994. The primary source of data that led to this listing was the MPCA Milestone long-term monitoring program. The drainage area to the downstream end of this impaired reach is 142 square miles. Land use in the watershed upstream of the impairment (Table 2.1) is the most urban/suburban (33%) of impaired reach watershed covered in this report, although there is still a significant amount (42%) of cultivated land. The watershed includes two communities served by permitted wastewater treatment facilities (Table 5.59A), including the very large Empire facility. No livestock facilities that have been issued NPDES permits are located in the watershed (Table 5.59B). Approximately 26,000 acres, or 28% of the watershed, will require coverage under MS4 permits. This includes portions of a number of Twin Cities suburban communities, as well as some of the City of Hastings (Table 5.59C). Table 5.59D describes the monthly fecal coliform loading capacities for this reach of the Vermillion River to achieve water quality standards, as well as the component wasteload allocations, load allocations, and margins of safety. The loading capacities were developed using flow data from the USGS gage site on the Vermillion River near Empire as described in Appendix A. Substantial reductions in fecal coliform loading from straight-pipe septic systems, and a variety of nonpoint sources will likely be required to meet the allocations. Table 5.59A. Wastewater Treatment Facilities Name/Location Permit
Number Design Flow (mgd)
WLA (t-orgs./mo.)
Elko/New Market WWTP MN0056219 0.98 0.22 Met Council - Empire WWTP MN0045845 28.61 6.50
Totals 29.59 6.72 Table 5.59B. Livestock Facilities with NPDES Permits Facility ID Number Description none
112

Table 5.59C. Municipal Separate Storm Sewer System (MS4) Communities Community Population
Estimate Category
Portions of the following communities fall within the impaired reach watershed: Apple Valley mandatory Burnsville mandatory Eagan mandatory Farmington mandatory Inver Grove Heights
mandatory
Lakeville mandatory Rosemount mandatory Empire Township
mandatory
5.59D. Monthly Fecal Coliform Loading Capacities and Allocations - Vermillion River; Below trout stream portion to South Br. Vermillion River (AUID: 07040001-507) Drainage Area (square miles): 142USGS gage used to develop flow zones and loading capacities:
Vermillion River near Empire% MS4 Urban: 28%Total WWTF Design Flow (mgd): 29.59 Flow Zone
High Moist Mid Dry* Low*values expressed as trillion organisms per month (tera- or T-org./month)
TOTAL MONTHLY LOADING CAPACITY 34.79 16.95 10.29 6.13 3.64Wasteload Allocation
Permitted Wastewater Treatment Facilities 6.72 6.72 6.72 * *Communities Subject to MS4 NPDES Requirements 5.99 1.57 0.36 * *Livestock Facilities Requiring NPDES Permits 0 0 0 0.00 0.00"Straight Pipe" Septic Systems 0 0 0 0.00 0.00
Load Allocation 15.34 4.02 0.92 * *Margin of Safety 6.74 4.64 2.29 na na
values expressed as percent of total month loading capacityTOTAL MONTHLY LOADING CAPACITY 100% 100% 100% 100% 100%Wasteload Allocation
Permitted Wastewater Treatment Facilities 19.3% 39.6% 65.3% * *Communities Subject to MS4 NPDES Requirements 17.2% 9.3% 3.5% * *Livestock Facilities Requiring NPDES Permits 0.0% 0.0% 0.0% 0.0% 0.0%"Straight Pipe" Septic Systems 0.0% 0.0% 0.0% 0.0% 0.0%
Load Allocation 44.1% 23.7% 9.0% * *Margin of Safety 19.4% 27.4% 22.3% na na*note - WWTF design flow exceeded dry and low flow; Allocation = (flow contribution from source) X (200 orgs./100ml.); see Sect. 5.1
113

5.3 Impacts of Growth on Allocations Straight-Pipe Septic Systems As a result of state and local rules, ordinances, and programs, the number of straight pipe septic systems will decrease over time. Because these systems constitute illegal discharges, they are not provided a load allocation for any of the impaired reaches covered in this report. As such, other elements of the TMDL allocation will not change as these systems are eliminated. Wastewater Treatment Facilities Flows at some wastewater treatment facilities are likely to increase over time with increases in the populations they serve. As long as current fecal coliform discharge limits are met at these facilities, however, such increases will not impact the allocation provided to other sources. This is because increased flows from wastewater treatment facilities add to the overall loading capacity by increasing river flows. Municipal Separate Storm Sewer Systems Expansion of some or all of the current MS4 communities in the basin is likely to take place. The City of Rochester, for example, predicts a 30-50% growth in population by 2030. Seventeen of the 39 impaired reach watersheds covered in this report contain at least a portion of a community required to have MS4 permit coverage. As expansion of these communities occurs, MS4 wasteload allocations may also need to be increased. If this occurs, the nonpoint source load allocation will need to be reduced proportionally. This makes sense, because expansion of urban areas effectively reduces the amount of agricultural and other land which contributes nonpoint source runoff. Livestock Along with humans, the other major source of fecal coliform in the basin is livestock. While there have been changes in the sizes and types of facilities, there do not appear to be clear trends in overall livestock numbers. With changes in facility size and type, a continuing shift in focus from the facilities themselves to land application practices may be warranted in the future. If growth in livestock numbers does occur, newer regulations for facility location and construction, manure storage design, and land application practices should help mitigate potential increases in fecal coliform loading to the streams and rivers of the basin. For the reasons discussed above, no explicit adjustments were made to the waste load or load allocations to account for human or livestock population growth. The MPCA will monitor population growth, urban expansion, and changes in agriculture, and reopen the TMDLs covered in this report if and when adjustments to allocations may be required.
114

6.0 MARGIN OF SAFETY Under section 303(d) of the Clean Water Act, a “margin of safety” (MOS) is required as part of a TMDL. The purpose of the MOS is to account for uncertainty that the allocations will result in attainment of water quality standards. For the 39 impaired reaches covered in this report, an explicit margin of safety is provided for each of the flow periods for each listed reach. As described in section 5 and Appendix A of this document, the MOS is based on the difference between the loading capacity as calculated at the mid-point of each of the five flow ranges, and the loading capacity calculated at the minimum flow in each zone. Given that the loading capacity is typically much less at the minimum flow of a zone as compared to the mid-point, a substantial MOS is provided. The MOS ensures that allocations will not exceed the load associated with the minimum flow in each zone. Because the allocations are a direct function of monthly flow, accounting for potential flow variability is the appropriate way to address the MOS. The minimum monthly flows over long periods of record at the USGS gage sites define the MOS for the low flow zone.
7.0 SEASONAL VARIATION The flow duration approach utilized in this TMDL captures the full range of flow conditions over the April-October period when the fecal coliform water quality standard applies. Appendix A includes figures depicting the relationship between months (seasons) and the five flow zones for which wasteload allocations, load allocations, and margins of safety were calculated. In particular, Figure A-4 provides an example (for the Vermillion River) of the relationship between monthly flows and flow zones, and how the complete range of monthly flows is encompassed in the five flow zones.
8.0: MONITORING PLAN 8.1: Goals of the Monitoring Plan The goal of this monitoring plan is to determine the effectiveness of the source reduction strategies that are implemented to attain water quality standards and designated uses. Even after these TMDLs are approved, the impaired reaches will effectively remain listed, as category 4A waters, until water quality standards for fecal coliform are met. Category 4A indicates that the waters are impaired but no longer need a TMDL. 8.2: Monitoring Activities, Schedule, and Responsibility
The MPCA maintains 10 long-term Minnesota Milestone sites in the basin. Grab sample monitoring at these stations occurs every three years at a frequency of once a month in order to collect a total of 16 samples over a five-year period. These sites will be
115

monitored in 2006. Seven are tributary sites and three are main stem Mississippi River sites. A water quality assessment (305b), based on monitoring data collected within the previous ten years at these and other sites (maintained by Met Council, Corps of Engineers, etc.), is scheduled for 2009 and at five-year intervals thereafter. This baseline monitoring system will be used to assess whether streams of the basin are in full support, partial support, or nonsupport of designated water uses, based on concentrations of fecal coliform bacteria and other parameters. A monitoring system for the Regional Fecal Coliform TMDL also will be used to evaluate progress in ambient water quality. This has a basinwide and targeted watershed component. The basinwide component consists of a repetition of intensive monitoring of fecal coliform bacteria concentrations at Minnesota Milestone sites that took place in 1997/1998. This monitoring was conducted five times per month during the recreational use season, with monthly geometric means calculated to determine whether the standard of 200 org./100 ml was being exceeded or not. This will be repeated in 2007/2008 as part of the implementation plan. In addition, targeted watersheds will be monitored in 2008/2009. In addition to comparing geometric monthly means from both time periods, a comparison will be made of samples taken at lower flows during dry weather periods, when continuous sources such as ISTS are believed to dominate fecal coliform loadings. This will be done in the following watersheds: Prairie Creek, Straight River, Vermillion River, Whitewater River, South Branch Root River, and Cedar River watersheds. The MPCA will be responsible for implementing this monitoring plan, with assistance from partners in the target watersheds listed above.
9.0 IMPLEMENTATION
9.1: Current Implementation through Basinwide Source Reduction Strategies: Directly pertinent to this project, BALMM (Basin Alliance for the Lower Mississippi in Minnesota) has embraced a basinwide goal of achieving water quality standards for fecal coliform bacteria. BALMM participants have developed detailed action strategies in the following areas to work toward this water quality goal:
Feedlot Runoff Reduction: This strategy is being implemented in several ways. For feedlots of 300 animal units and smaller, the BALMM strategy consists mainly of maximizing participation in the Open Lot Agreement. This feature of state feedlot rules provides a framework for eligible producers to
116

phase into compliance by October 2005, achieve a 50 percent reduction in runoff and, by October 2010, achieve full compliance with runoff rules. Section 319 grants have been obtained to support participation in this program in the following counties: Dodge, Fillmore, Goodhue, Houston, Mower, Olmsted, Rice, Wabasha, and Winona. The projects are designed to provide counties with technical, educational and financial support to enroll 90 percent of eligible livestock farmers in the Open Lot Agreement, and ensure that effective feedlot fixes are designed and implemented. An estimated 2,200 farmers have been enrolled to date. Farmers also will be informed of manure management record-keeping and planning requirements, and of resources available to assist in these activities. Other counties in the basin are pursuing the same objectives using their own and other resources.
Residential Wastewater Treatment. The BALMM strategy for Individual
Sewage Treatment Systems (ISTS) calls for increasing the percentage of the population with properly functioning systems. This strategy is being implemented through several Section 319 grants. The projects address the impact of human sources of bacteria through a combination of education, technical assistance, and financial assistance to owners of failing ISTS. To this end, the BALMM, the Southeast Minnesota Water Resources Board, the Cannon River Watershed Partnership, and the University of Minnesota Extension Service have formed a partnership that will involve 12 of the 14 counties in the basin. The goal is to double the average rate at which ISTS classified as Imminent Public Health Threats (straight-pipes) are being corrected through local efforts across the basin, from 300 to 600 per year. By 2012, a sustained effort of this magnitude should achieve the target source reduction of 65 percent, cited in the original Regional Fecal Coliform TMDL. Both individual residents and unsewered communities will be addressed through the project. Additional funding has been sought to help to initiate county-based revolving loan programs to help to assist ISTS repairs, and to cost-share engineering studies needed to evaluate the feasibility of alternative community wastewater treatment options. Fillmore County is participating in a state-sponsored pilot project whose purpose is to identify and correct straight-pipe septics within 10 years. Lessons learned from this project will be shared with other counties in the basin.
Accelerated Adoption of Rotational Grazing – This BALMM Strategy is being
implemented in part through Section 319 grants. By assisting producers in the writing of managed rotational grazing plans, the projects will increase estimated acreage of this practice from 7,500 to almost 20,000 acres. It will also train local resource managers to continue helping beef and dairy farmers to convert from conventional to rotational grazing, with the goal of the latter becoming the dominant pasture management practice in the region.
117

Manure Management Planning – New feedlot rules require that manure management plans be developed for any feedlots that need a permit. These include the following categories of feedlots:
Those with more than 300 animal units that are planning new construction or expansion;
There is a pollution hazard that has not been corrected through the Open Lot Agreement;
Feedlot has been designated as a CAFO (more than 1000 animal units or direct man-made conveyance to waters)
Feedlot has more than 300 animal units and is applying manure in sensitive areas, including: a) soil P levels exceeding 120/150 ppm Olsen/Bray, or half those values within 300 feet of public waters; b) vulnerable drinking water supply management areas; or c) slopes exceeding 6 percent within 300 feet of waters.
The development of manure management plans for these feedlots should result in at least half the volume of manure in the basin being subject to manure management planning by 2005. This percentage will continue to increase thereafter. Practices that reduce fecal coliform runoff will be promoted for manure management plans within the project area, and may be required for CAFOs. The MPCA conducts annual inspections of NPDES permittees. This will include inspections of manure application records and manure management plans. For feedlots with 300 to 999 animal units, with interim permits or construction permits, counties are responsible for inspections of manure application records and manure management plans. Funding to support technical assistance and to provide producer incentives will be sought to maximize producer adoption of manure management plans.
Landscape Buffer Initiative: This BALMM strategy includes as areas targeted
for grass buffers agricultural fields that have been designated for manure application. The Conservation Reserve Enhancement Program (CREP) provides federal and state funding for 51,000 acres of conservation easements. These include riparian buffers which can play a crucial role in reducing polluted runoff from fields where manure is applied.
Conservation Tillage Strategy: Conservation tillage is a cost-effective way to reduce field runoff. Where manure is applied to cropland, the need for prompt incorporation must be balanced against the need to maintain surface residue cover for erosion control. With support from a Section 319 Grant, the University of Minnesota in spring 2002 published a document entitled, “Tillage Best Management Practices for Water Quality Protection in Southeastern Minnesota.” This publication is being used to promote conservation tillage in the context of manure management to reduce field runoff.
Urban Stormwater: BALMM Strategy 4A, page 102-103, Basin Plan Scoping Document, describes a comprehensive strategy for stormwater runoff control in the basin.
118

Municipal Wastewater Treatment: All permitted facilities are required to disinfect wastewater effluent to meet discharge standards. Biosolids management requirements are designed to minimize the potential for runoff to surface water or infiltration into ground water of pollutants, including fecal coliform bacteria. In addition to these standard measures, the MPCA has identified facilities where sewage bypasses following storm events are a recurring problem. These are: Claremont, Kasson, and West Concord - all in the Middle Fork Zumbro River watershed. These facilities have been upgraded and no longer experience chronic bypass problems.
9.2: Review and Revision of Current Implementation Plan: Upon approval of this revised TMDL study, the MPCA will review and update the current Implementation Plan. This process of review and update will include additional data analysis, as well as input from the public and other stakeholders. Key elements of this process will include:
• Additional reach-by-reach data analysis to help define the magnitude and timing of needed fecal coliform reductions, and the specific sources that will need to make these reductions. Local stakeholder involvement will be critical as most reductions will likely need to come from “load allocation” sources where local programs and watershed projects have a greater influence that state-level regulation. A proposal is being considered by the Southeast Minnesota Water Resources Board (SEMWRB) whereby Local Water Plans could be amended to reflect targets established as part of the TMDL implementation plan.
• State and local level planning to address “straight-pipe” septic systems, which are now considered point sources. The proposal being considered by the SEMWRB would convene a work team that will develop recommendations by June 2006. This team would draw on the experience of the three counties currently involved in a pilot project to inventory, and require compliance of, septic systems that pose an imminent threat to public health or safety. All “straight-pipe” septic systems fall into this category.
• A process to ensure that Stormwater Pollution Prevention Plans (SWPPPs), as required by Municipal Separate Storm Sewer System (MS4) permits, contain appropriate provisions to address fecal coliform bacteria impairments. A team that would operate in parallel to the one addressing “straight-pipe” septic systems is also being proposed. The new State Stormwater Manual, found at (http://www.pca.state.mn.us/water/stormwater/stormwater-manual.html) will be an important resource for this work.
• The establishment of specific goals, with timelines and progress report dates, for the ultimate elimination of “straight-pipe” septic systems, and the improvement of open feedlots with pollution hazards as required by state feedlot rules.
119

10.0 REASONABLE ASSURANCE
10.1 Evidence of BMP Implementability The source-reduction strategies listed above have been shown to be efficacious in reducing pathogen transport and survival, and to be capable of widespread adoption by land owners and local resource managers.
Feedlot runoff controls – these are evaluated by professional engineers through the Feedlot Evaluation Model referenced in Minn. R. ch. 7080. These rules are implemented by MPCA staff and by local staff of counties via a delegation agreement with the Agency. All counties except one (Olmsted) in the basin are so delegated. Olmsted County Extension is implementing certain facets of the new feedlot rules – Registration and Certification for the Open Lot Agreement.
Individual Sewage Treatment Systems – ISTS with proper drain fields provide virtually complete treatment of fecal coliform bacteria. Straight-pipe septics discharge untreated wastewater to surface water. Acceptable designs are described in Minn. R. ch. 7020. All counties in the basin are delegated to implement these rules, which require conformance with state standards for new construction and disclosure of the state of the ISTS when property transfers ownership. Several counties require ISTS upgrades at property transfer.
Municipal Wastewater Disinfection – Disinfection with chlorine or ultraviolet radiation is required of all NPDES permittees. In pond systems, which must meet the same fecal coliform discharge limit as other wastewater treatment systems, disinfection is generally passive with sunlight providing the ultraviolet radiation.
Land Application of Manure – Buffer strips, immediate incorporation, and maintenance of surface residue have been demonstrated to reduce manure and pathogen runoff (Environmental Quality Board, General Environmental Impact Statement for Feedlots). The new state feedlots rules (Minn. R. ch. 7020) require manure application record-keeping and manure management planning, with the exact requirements differing according to size of operation and pollution risk of application, based on method, time and place of application.
Erosion Control and Sediment Reduction – Conservation tillage and riparian buffer strips have been demonstrated to be effective in reducing sediment delivery to streams. Since embedded sediment can serve as a substrate for fecal coliform survival, reduction of sediment sources is considered an effective measure for controlling fecal coliform bacteria in streams.
Planned Rotational Grazing: Sovell, et. al. 2000, demonstrated that rotational grazing, in contrast to conventional grazing, significantly reduces both
120

sedimentation and fecal coliform concentrations in water downstream of study sites in southeastern Minnesota.
Urban Stormwater Management: Practices such as runoff detention, infiltration, and street sweeping have been shown to be effective in reducing urban runoff and associated pollutants. Twenty-six MS4 communities in the basin will be required to have a Phase II Stormwater Management Plan.
10.2 Non-Regulatory, Regulatory, and Incentive-Based Approaches The above implementation strategies are included in the BALMM Basin Plan Scoping Document and are in the process of being implemented, often with support from federal grants. Several of the strategies build upon a solid foundation of state rules (feedlots, manure management, ISTS, stormwater, and municipal wastewater and biosolids) and county-delegated programs as a delivery system for technical and financial support and rule enforcement. Others will be pursued through strictly voluntary programs, such as promotion of buffers, rotational grazing, and conservation tillage. In the latter cases, BALMM strategies work through local delivery systems for technical and financial assistance, and are based on effective inter-agency collaboration. For these reasons, there is a high degree of “reasonable assurance” that source reduction strategies for this TMDL will be implemented within the near to mid-term future – the BALMM Basin Plan Scoping Document, on which all the strategies are based, calls for full implementation by 2010.
11.0 PUBLIC PARTICIPATION 11.1 Description of Public Participation Processes Opportunity for public participation in developing the Revised TMDL will be afforded through a 30-day public comment period extending from Sept. 12 – Oct. 12, 2005. An extensive list of local and state level stakeholders were informed by a public notice mailing. A news release was issued to major media in the state. The public also was notified through an announcement in the State Register. The Revised TMDL was posted on the MPCA web site. The MPCA will provide responses to all written comments received before the close of the public notice period. These responses will be included in the Appendix.
121

12.0 REFERENCES Basin Alliance for the Lower Mississippi in Minnesota, 2001. “Lower Mississippi River Basin Plan Scoping Document,” Minnesota Pollution Control Agency, St. Paul. Baxter-Potter, W, and M. Gilliland. 1988 “Bacterial Pollution in Runoff From Agricultural Lands,” J. Environmental Quality, 17(1): 27-34. Cannon River Watershed Partnership, Minnesota Pollution Control Agency, Minnesota Center for Environmental Advocacy, and Steele County. 2001. A computation of the Straight River’s TMDL of Fecal Coliform Bacteria. Chapman, Allen K., 2000. Fecal Coliform Pollution in the Straight River: An Information Assessment, Minnesota Center for Environmental Advocacy, November 2000. Dakota County Soil and Water Conservation District. 2004. Vermillion River Watershed Fecal Coliform Bacteria Study. Fillmore County, “Watershed News: South Branch of the Root River Watershed Project,” Fall 1999, April 2000, and November 2000 issues. Helsel, D.R., and R.M. Hirsch 1991. Statistical Methods in Water Resources. U.S. Geological Survey. Howell, J. et al. 1996. “Effect of Sediment Particle Size and Temperature on Fecal Bacteria Mortality Rates and the Fecal Coliform/Fecal Streptococci Ratio”. J. Environmental Quality. 25: 1216 - 1220 McMurry, S., et al. 1998. “Fecal Coliform Transport Through Intact Soil Blocks Amended with Poultry Manure,” J. Environ. Quality. 27: 86 – 92. Minnesota Environmental Quality Board. 2002. Generic Environmental Impact Statement on Animal Agriculture. Minnesota Pollution Control Agency, 2002. Regional Total Maximum Daily Load Evaluation of Fecal Coliform Bacteria Impairments in the Lower Mississippi River Basin in Minnesota. Minnesota Pollution Control Agency, 1999. Fecal Coliform Bacteria in Rivers, January 1999. Minnesota Pollution Control Agency, 1997. Lake Byllesby Assessment, 1996, Byllesby Reservoir,” Publication ID #19-0006, December 1997
122

Morrison, David, 1999. “Vermillion River Watershed Citizen Monitoring Fecal Coliform Bacteria Monitoring Project, May-September 1999,” unpublished presentation. Morrison, David, 1999. “Contributions from Septic Systems and Undersewered Communities.” Presented at Bacteria in the Minnesota River, Mankato, Minnesota, February 16, 1999. Sovell, Laurie, et al., 2000 “Impacts of Rotational Grazing and Riparian Buffers on Physicochemical and Biological Characteristics of Southeastern Minnesota, USA, Streams” Environmental Management, 26(6) 629 – 641. University of Minnesota, “Lower Mississippi River Basin Information Page”, Department of Soil, Water and Climate. http://www.soils.agri.umn.edu/research/seminn/ University of Minnesota. 2002. Tillage Best Management Practices for Water Quality Protection in Southeastern Minnesota. U.S. Environmental Protection Agency 2004. Water Quality Standards for Coastal and Great Lakes Recreation Water. U.S. Environmental Protection Agency. 2001. Protocol for Developing Pathogen TMDLs. EPA 841-J-00-002. Office of Water (4503F), United States Environmental Protection Agency, Washington, DC. 132 pp. Waters, Tom, 1977, Streams and Rivers of Minnesota, University of Minnesota Press, Minneapolis
APPENDIX A: Loading Capacity Determination APPENDIX B: U.S. District Court Decision APPENDIX C: Letter from USEPA APPENDIX D: E-mail from USEPA APPENDIX E: Responses to Comments Received During Public Notice Period
123
Related Documents