Delaware River Basin Commission Page 196 Lower Delaware Scenic and Recreational River: Significant Resource Waters

Welcome message from author
This document is posted to help you gain knowledge. Please leave a comment to let me know what you think about it! Share it to your friends and learn new things together.
Transcript
Delaware River Basin Commission Page 196
Lower Delaware Scenic and Recreational River:
Significant Resource Waters

Delaware River Basin Commission Page 197
2074 ICP Delaware River at Portland Footbridge

Delaware River Basin Commission Page 198
2074 ICP Delaware River at Portland Footbridge Warren County, NJ – Northampton County, PA; Latitude 40.92417 Longitude -75.09611 by GPS NAD83 decimal degrees.
USGS/NJDEP site no 01443000.
Watershed Population figures were not calculated for main-stem Delaware River sites.
Drainage Area: 4,165 square miles, Delaware River Zone 1D
Site Specific EWQ defined 2000-2004 by the DRBC/NPS Scenic Rivers Monitoring Program.
Classified by DRBC as Significant Resource Waters
Nearest upstream Interstate Control Point: 2115 ICP Delaware River at Kittatinny Visitor Center off I-80
Nearest downstream Interstate Control Point: 1978 ICP Delaware River at Belvidere Bridge
Known dischargers within watershed: Undefined
Tributaries to upstream reach: Major tributaries 2114 BCP Dunnfield Creek, NJ, 2095 BCP Slateford Creek, PA; minor
tributaries 208.8 Stony Brook, NJ, 207.5 Jacoby Creek, PA.
No Stream Stats web site data available (drainage area too large to calculate on web site).
Flow Statistics Associated with Water Quality Samples (calculated by drainage area weighting from USGS gage data):
Max Flow (CFS)
90% Flow (CFS)
75% Flow (CFS)
60% Flow (CFS)
50% Flow (CFS)
40% Flow (CFS)
25% Flow (CFS)
10% Flow (CFS)
Min Flow (CFS)
193,785 15,705 9,111 6,254 4,904 3,903 2,737 2,021 1,039
Delaware River Basin Commission Page 199
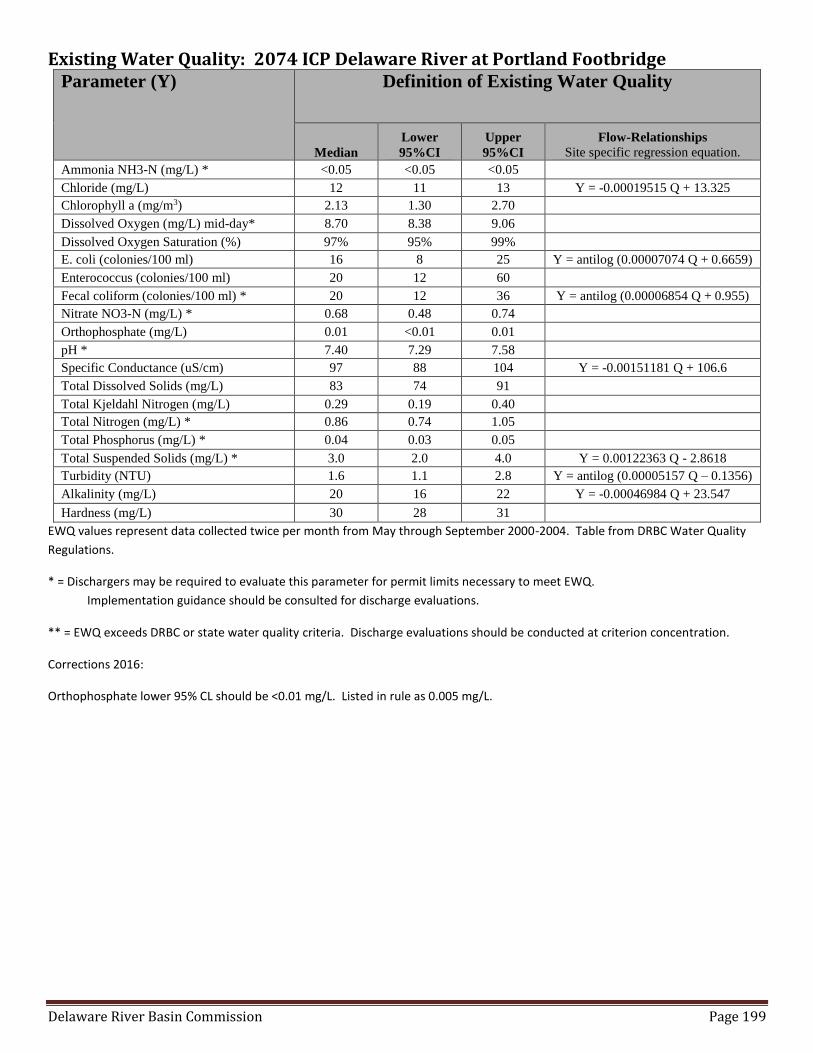
Existing Water Quality: 2074 ICP Delaware River at Portland Footbridge Parameter (Y) Definition of Existing Water Quality
Median
Lower
95%CI
Upper
95%CI
Flow-Relationships
Site specific regression equation.
Ammonia NH3-N (mg/L) * <0.05 <0.05 <0.05
Chloride (mg/L) 12 11 13 Y = -0.00019515 Q + 13.325
Chlorophyll a (mg/m3) 2.13 1.30 2.70
Dissolved Oxygen (mg/L) mid-day* 8.70 8.38 9.06
Dissolved Oxygen Saturation (%) 97% 95% 99%
E. coli (colonies/100 ml) 16 8 25 Y = antilog (0.00007074 Q + 0.6659)
Enterococcus (colonies/100 ml) 20 12 60
Fecal coliform (colonies/100 ml) * 20 12 36 Y = antilog (0.00006854 Q + 0.955)
Nitrate NO3-N (mg/L) * 0.68 0.48 0.74
Orthophosphate (mg/L) 0.01 <0.01 0.01
pH * 7.40 7.29 7.58
Specific Conductance (uS/cm) 97 88 104 Y = -0.00151181 Q + 106.6
Total Dissolved Solids (mg/L) 83 74 91
Total Kjeldahl Nitrogen (mg/L) 0.29 0.19 0.40
Total Nitrogen (mg/L) * 0.86 0.74 1.05
Total Phosphorus (mg/L) * 0.04 0.03 0.05
Total Suspended Solids (mg/L) * 3.0 2.0 4.0 Y = 0.00122363 Q - 2.8618
Turbidity (NTU) 1.6 1.1 2.8 Y = antilog (0.00005157 Q – 0.1356)
Alkalinity (mg/L) 20 16 22 Y = -0.00046984 Q + 23.547
Hardness (mg/L) 30 28 31
EWQ values represent data collected twice per month from May through September 2000-2004. Table from DRBC Water Quality
Regulations.
* = Dischargers may be required to evaluate this parameter for permit limits necessary to meet EWQ.
Implementation guidance should be consulted for discharge evaluations.
** = EWQ exceeds DRBC or state water quality criteria. Discharge evaluations should be conducted at criterion concentration.
Corrections 2016:
Orthophosphate lower 95% CL should be <0.01 mg/L. Listed in rule as 0.005 mg/L.
Delaware River Basin Commission Page 200
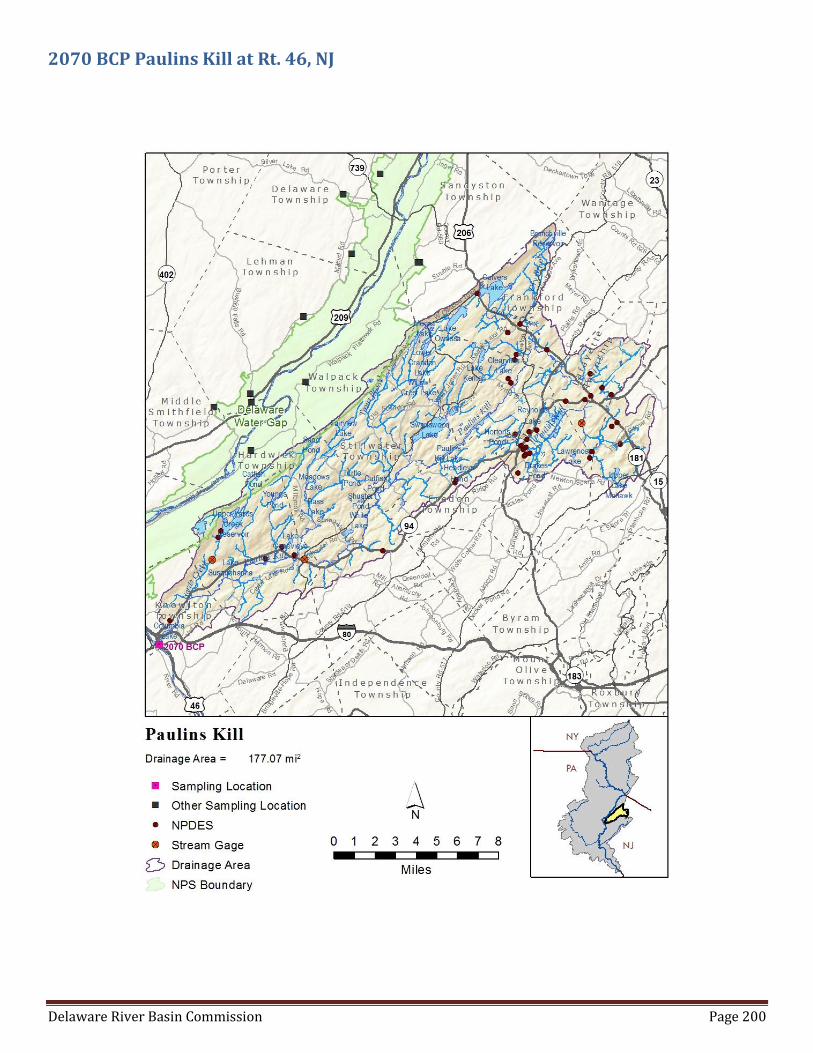
2070 BCP Paulins Kill at Rt. 46, NJ
Delaware River Basin Commission Page 201
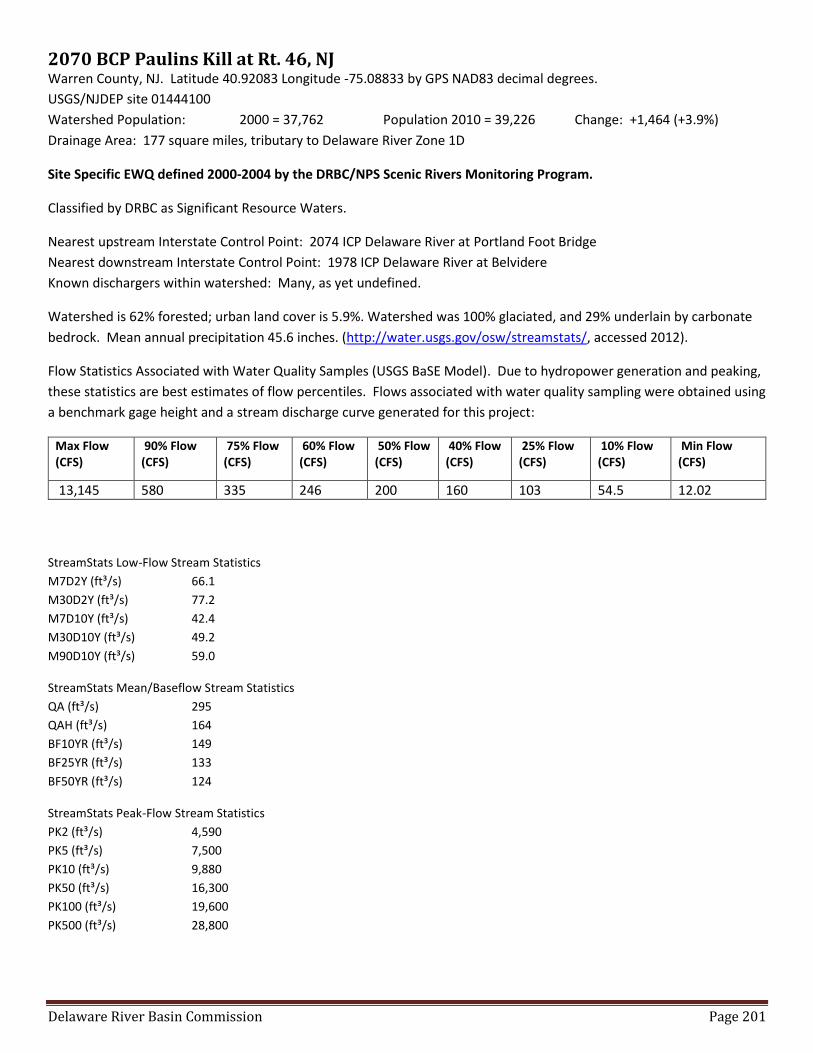
2070 BCP Paulins Kill at Rt. 46, NJ Warren County, NJ. Latitude 40.92083 Longitude -75.08833 by GPS NAD83 decimal degrees.
USGS/NJDEP site 01444100
Watershed Population: 2000 = 37,762 Population 2010 = 39,226 Change: +1,464 (+3.9%)
Drainage Area: 177 square miles, tributary to Delaware River Zone 1D
Site Specific EWQ defined 2000-2004 by the DRBC/NPS Scenic Rivers Monitoring Program.
Classified by DRBC as Significant Resource Waters.
Nearest upstream Interstate Control Point: 2074 ICP Delaware River at Portland Foot Bridge
Nearest downstream Interstate Control Point: 1978 ICP Delaware River at Belvidere
Known dischargers within watershed: Many, as yet undefined.
Watershed is 62% forested; urban land cover is 5.9%. Watershed was 100% glaciated, and 29% underlain by carbonate
bedrock. Mean annual precipitation 45.6 inches. (http://water.usgs.gov/osw/streamstats/, accessed 2012).
Flow Statistics Associated with Water Quality Samples (USGS BaSE Model). Due to hydropower generation and peaking,
these statistics are best estimates of flow percentiles. Flows associated with water quality sampling were obtained using
a benchmark gage height and a stream discharge curve generated for this project:
Max Flow (CFS)
90% Flow (CFS)
75% Flow (CFS)
60% Flow (CFS)
50% Flow (CFS)
40% Flow (CFS)
25% Flow (CFS)
10% Flow (CFS)
Min Flow (CFS)
13,145 580 335 246 200 160 103 54.5 12.02
StreamStats Low-Flow Stream Statistics
M7D2Y (ft³/s) 66.1
M30D2Y (ft³/s) 77.2
M7D10Y (ft³/s) 42.4
M30D10Y (ft³/s) 49.2
M90D10Y (ft³/s) 59.0
StreamStats Mean/Baseflow Stream Statistics
QA (ft³/s) 295
QAH (ft³/s) 164
BF10YR (ft³/s) 149
BF25YR (ft³/s) 133
BF50YR (ft³/s) 124
StreamStats Peak-Flow Stream Statistics
PK2 (ft³/s) 4,590
PK5 (ft³/s) 7,500
PK10 (ft³/s) 9,880
PK50 (ft³/s) 16,300
PK100 (ft³/s) 19,600
PK500 (ft³/s) 28,800
Delaware River Basin Commission Page 202
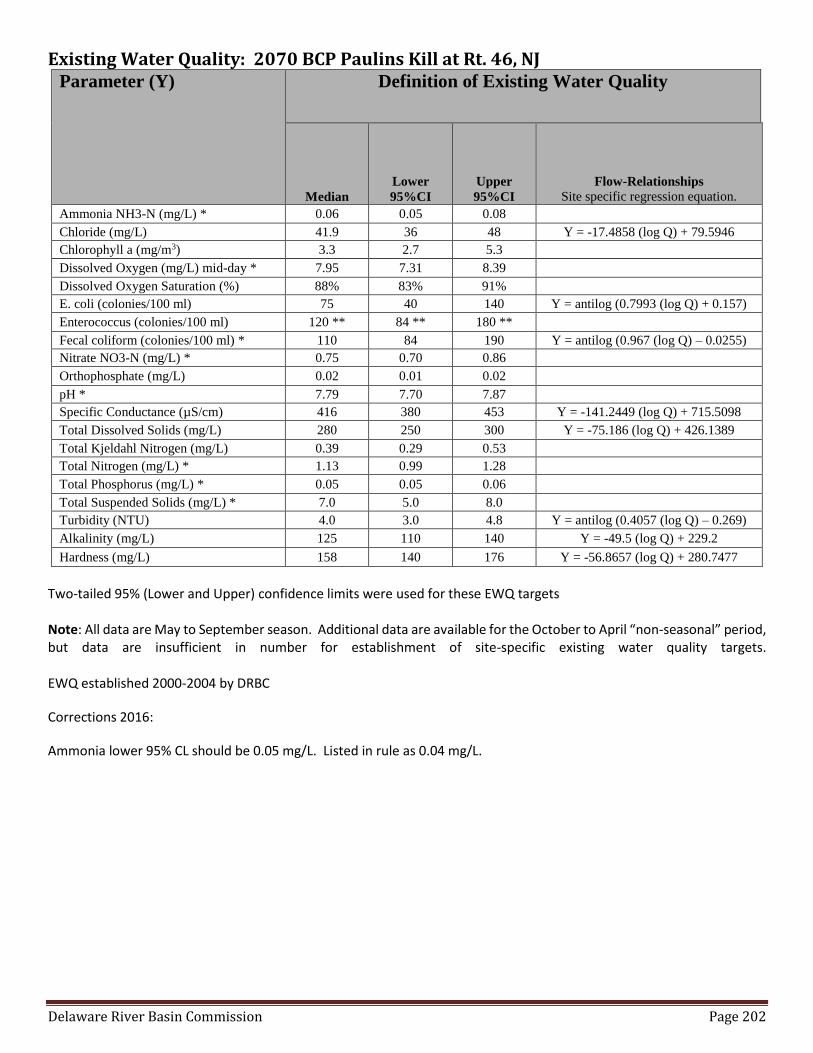
Existing Water Quality: 2070 BCP Paulins Kill at Rt. 46, NJ Parameter (Y) Definition of Existing Water Quality
Median
Lower
95%CI
Upper
95%CI
Flow-Relationships
Site specific regression equation.
Ammonia NH3-N (mg/L) * 0.06 0.05 0.08
Chloride (mg/L) 41.9 36 48 Y = -17.4858 (log Q) + 79.5946
Chlorophyll a (mg/m3) 3.3 2.7 5.3
Dissolved Oxygen (mg/L) mid-day * 7.95 7.31 8.39
Dissolved Oxygen Saturation (%) 88% 83% 91%
E. coli (colonies/100 ml) 75 40 140 Y = antilog (0.7993 (log Q) + 0.157)
Enterococcus (colonies/100 ml) 120 ** 84 ** 180 **
Fecal coliform (colonies/100 ml) * 110 84 190 Y = antilog (0.967 (log Q) – 0.0255)
Nitrate NO3-N (mg/L) * 0.75 0.70 0.86
Orthophosphate (mg/L) 0.02 0.01 0.02
pH * 7.79 7.70 7.87
Specific Conductance (µS/cm) 416 380 453 Y = -141.2449 (log Q) + 715.5098
Total Dissolved Solids (mg/L) 280 250 300 Y = -75.186 (log Q) + 426.1389
Total Kjeldahl Nitrogen (mg/L) 0.39 0.29 0.53
Total Nitrogen (mg/L) * 1.13 0.99 1.28
Total Phosphorus (mg/L) * 0.05 0.05 0.06
Total Suspended Solids (mg/L) * 7.0 5.0 8.0
Turbidity (NTU) 4.0 3.0 4.8 Y = antilog (0.4057 (log Q) – 0.269)
Alkalinity (mg/L) 125 110 140 Y = -49.5 (log Q) + 229.2
Hardness (mg/L) 158 140 176 Y = -56.8657 (log Q) + 280.7477
Two-tailed 95% (Lower and Upper) confidence limits were used for these EWQ targets Note: All data are May to September season. Additional data are available for the October to April “non-seasonal” period, but data are insufficient in number for establishment of site-specific existing water quality targets. EWQ established 2000-2004 by DRBC
Corrections 2016:
Ammonia lower 95% CL should be 0.05 mg/L. Listed in rule as 0.04 mg/L.

Delaware River Basin Commission Page 203
1978 ICP Delaware River at Belvidere, NJ/PA
Delaware River Basin Commission Page 204
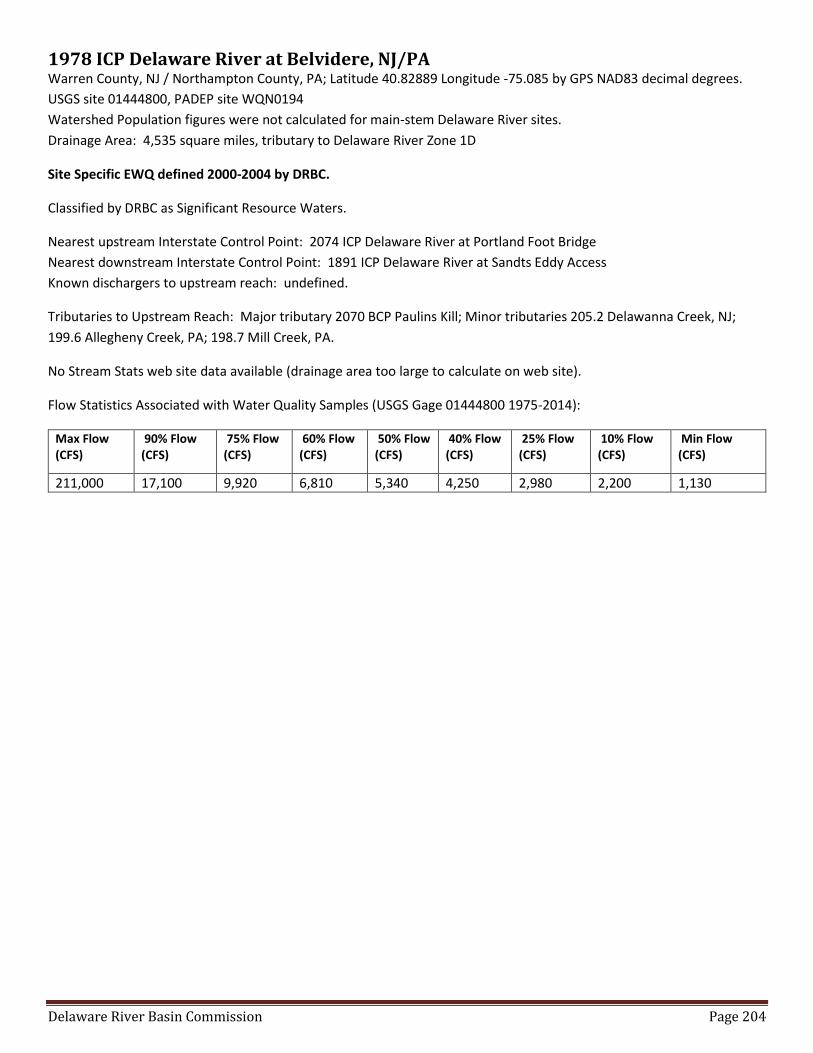
1978 ICP Delaware River at Belvidere, NJ/PA Warren County, NJ / Northampton County, PA; Latitude 40.82889 Longitude -75.085 by GPS NAD83 decimal degrees.
USGS site 01444800, PADEP site WQN0194
Watershed Population figures were not calculated for main-stem Delaware River sites.
Drainage Area: 4,535 square miles, tributary to Delaware River Zone 1D
Site Specific EWQ defined 2000-2004 by DRBC.
Classified by DRBC as Significant Resource Waters.
Nearest upstream Interstate Control Point: 2074 ICP Delaware River at Portland Foot Bridge
Nearest downstream Interstate Control Point: 1891 ICP Delaware River at Sandts Eddy Access
Known dischargers to upstream reach: undefined.
Tributaries to Upstream Reach: Major tributary 2070 BCP Paulins Kill; Minor tributaries 205.2 Delawanna Creek, NJ;
199.6 Allegheny Creek, PA; 198.7 Mill Creek, PA.
No Stream Stats web site data available (drainage area too large to calculate on web site).
Flow Statistics Associated with Water Quality Samples (USGS Gage 01444800 1975-2014):
Max Flow (CFS)
90% Flow (CFS)
75% Flow (CFS)
60% Flow (CFS)
50% Flow (CFS)
40% Flow (CFS)
25% Flow (CFS)
10% Flow (CFS)
Min Flow (CFS)
211,000 17,100 9,920 6,810 5,340 4,250 2,980 2,200 1,130

Delaware River Basin Commission Page 205
Existing Water Quality: 1978 ICP Delaware River at Belvidere, NJ/PA Delaware River at Belvidere-Riverton Bridge, NJ/PA, River Mile 197.84
Parameter (Y) Definition of Existing Water Quality
Median
Lower
95%CI
Upper
95%CI
Flow-Relationships
Site specific regression equation.
Ammonia NH3-N (mg/L) * <0.05 <0.05 <0.05
Chloride (mg/L) 14 12 15 Y = -0.00020113 Q + 14.872
Chlorophyll a (mg/m3) 1.9 1.3 2.7
Dissolved Oxygen (mg/L) mid-day* 8.52 8.00 8.95
Dissolved Oxygen Saturation (%) 94% 92% 96%
E. coli (colonies/100 ml) 20 5 30 Y = antilog (0.00005716 Q + 0.8244)
Enterococcus (colonies/100 ml) 50 35 68
Fecal coliform (colonies/100 ml) * 30 20 50 Y = antilog (0.00006282 Q + 1.0055)
Nitrate NO3-N (mg/L) * 0.53 0.47 0.71
Orthophosphate (mg/L) <0.01 <0.01 0.02
pH * 7.49 7.25 7.60
Specific Conductance (uS/cm) 111.5 105 125 Y = -0.00185194 Q + 125.8
Total Dissolved Solids (mg/L) 98 86 100
Total Kjeldahl Nitrogen (mg/L) 0.33 0.24 0.40
Total Nitrogen (mg/L) * 0.89 0.82 1.11
Total Phosphorus (mg/L) * 0.04 0.04 0.05
Total Suspended Solids (mg/L) * 3.0 2.0 4.0 Y = 0.00120841 Q – 3.003
Turbidity (NTU) 1.7 1.2 2.5 Y = antilog (0.00003844 Q + 0.0483)
Alkalinity (mg/L) 26 24 28 Y = -0.00046346 Q + 29.199
Hardness (mg/L) 35 33 36
EWQ values represent data collected twice per month from May through September 2000-2004.
* = Dischargers may be required to evaluate this parameter for permit limits necessary to meet EWQ.
Implementation guidance should be consulted for discharge evaluations.
** = EWQ exceeds DRBC or state water quality criteria. Discharge evaluations should be conducted at criterion concentration.
EWQ established 2000-2004 by DRBC
Corrections 2016:
Alkalinity median should be 25 mg/L. Listed in rule as 26 mg/L.
Delaware River Basin Commission Page 206
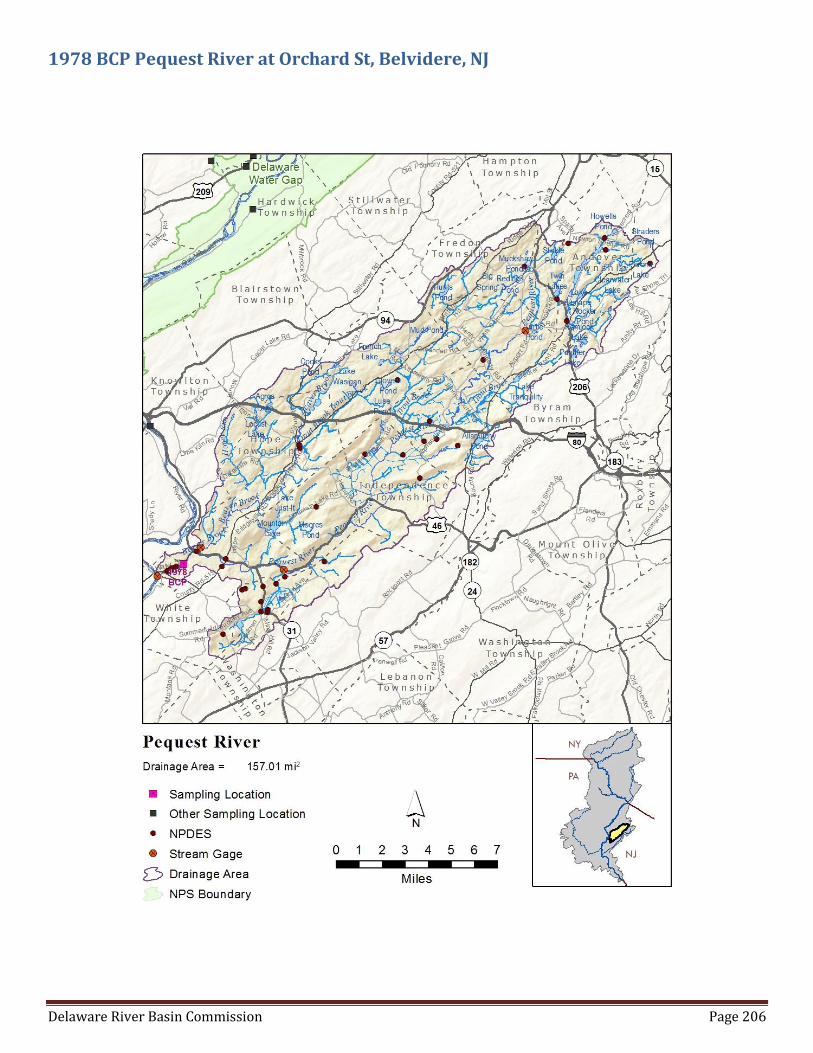
1978 BCP Pequest River at Orchard St, Belvidere, NJ
Delaware River Basin Commission Page 207
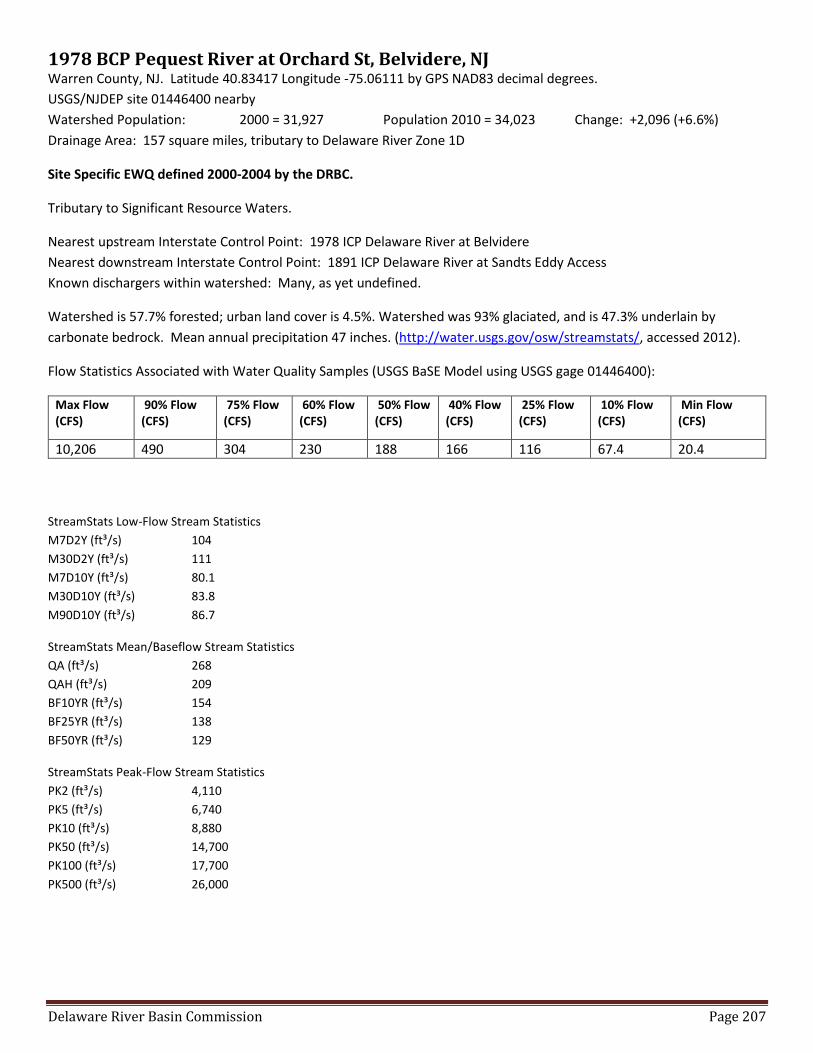
1978 BCP Pequest River at Orchard St, Belvidere, NJ Warren County, NJ. Latitude 40.83417 Longitude -75.06111 by GPS NAD83 decimal degrees.
USGS/NJDEP site 01446400 nearby
Watershed Population: 2000 = 31,927 Population 2010 = 34,023 Change: +2,096 (+6.6%)
Drainage Area: 157 square miles, tributary to Delaware River Zone 1D
Site Specific EWQ defined 2000-2004 by the DRBC.
Tributary to Significant Resource Waters.
Nearest upstream Interstate Control Point: 1978 ICP Delaware River at Belvidere
Nearest downstream Interstate Control Point: 1891 ICP Delaware River at Sandts Eddy Access
Known dischargers within watershed: Many, as yet undefined.
Watershed is 57.7% forested; urban land cover is 4.5%. Watershed was 93% glaciated, and is 47.3% underlain by
carbonate bedrock. Mean annual precipitation 47 inches. (http://water.usgs.gov/osw/streamstats/, accessed 2012).
Flow Statistics Associated with Water Quality Samples (USGS BaSE Model using USGS gage 01446400):
Max Flow (CFS)
90% Flow (CFS)
75% Flow (CFS)
60% Flow (CFS)
50% Flow (CFS)
40% Flow (CFS)
25% Flow (CFS)
10% Flow (CFS)
Min Flow (CFS)
10,206 490 304 230 188 166 116 67.4 20.4
StreamStats Low-Flow Stream Statistics
M7D2Y (ft³/s) 104
M30D2Y (ft³/s) 111
M7D10Y (ft³/s) 80.1
M30D10Y (ft³/s) 83.8
M90D10Y (ft³/s) 86.7
StreamStats Mean/Baseflow Stream Statistics
QA (ft³/s) 268
QAH (ft³/s) 209
BF10YR (ft³/s) 154
BF25YR (ft³/s) 138
BF50YR (ft³/s) 129
StreamStats Peak-Flow Stream Statistics
PK2 (ft³/s) 4,110
PK5 (ft³/s) 6,740
PK10 (ft³/s) 8,880
PK50 (ft³/s) 14,700
PK100 (ft³/s) 17,700
PK500 (ft³/s) 26,000

Delaware River Basin Commission Page 208
Existing Water Quality: 1978 BCP Pequest River, NJ Pequest River, New Jersey, River Mile 197.80 – 1.48
Boundary Control Point is located at Orchard Street Bridge, Belvidere
Parameter (Y) Definition of Existing Water Quality
Median
Lower
95%CI
Upper
95%CI
Flow-Relationships
Site specific regression equation.
Ammonia NH3-N (mg/L) * <0.05 <0.05 0.05
Chloride (mg/L) 35.9 34.0 38.0 Y = -12.7769 (log Q) + 62.875
Chlorophyll a (mg/m3) 2.14 2.00 2.70
Dissolved Oxygen (mg/L) mid-day * 9.89 9.37 10.37
Dissolved Oxygen Saturation (%) 103% 99% 107%
E. coli (colonies/100 ml) 130 110 160 Y = antilog (0.6728 (log Q) + 0.7112)
Enterococcus (colonies/100 ml) 250 ** 140 ** 460 **
Fecal coliform (colonies/100 ml) * 180 150 230 **
Nitrate NO3-N (mg/L) * 1.29 1.13 1.45
Orthophosphate (mg/L) <0.05 <0.05 0.07
pH * 8.20 8.10 8.30
Specific Conductance (µS/cm) 491 472 511 Y = -0.18929204 Q + 517.8326
Total Dissolved Solids (mg/L) 330 310 340 Y = -75.8279 (log Q) + 479.4783
Total Kjeldahl Nitrogen (mg/L) 0.47 0.32 0.55
Total Nitrogen (mg/L) * 1.69 1.54 2.00
Total Phosphorus (mg/L) * 0.10 0.08 0.11 **
Total Suspended Solids (mg/L) * 6.5 4.0 11.0
Turbidity (NTU) 3.4 2.1 5.8 Y = antilog (1.0964 (log Q) - 1.87)
Alkalinity (mg/L) 189 180 200 Y = -64.33 (log Q) + 319.85
Hardness (mg/L) 228 220 230 Y = -50.0952 (log Q) + 329.8323
EWQ values represent data collected twice per month from May through September 2000-2004.
* = Dischargers may be required to evaluate this parameter for permit limits necessary to meet EWQ.
Implementation guidance should be consulted for discharge evaluations.
** = EWQ exceeds DRBC or state water quality criteria. Discharge evaluations should be conducted at criterion concentration.
EWQ established 2000-2004 by DRBC Corrections 2016:
None

Delaware River Basin Commission Page 209
1907 BCP Martins Creek at Little Creek Road, PA
Delaware River Basin Commission Page 210
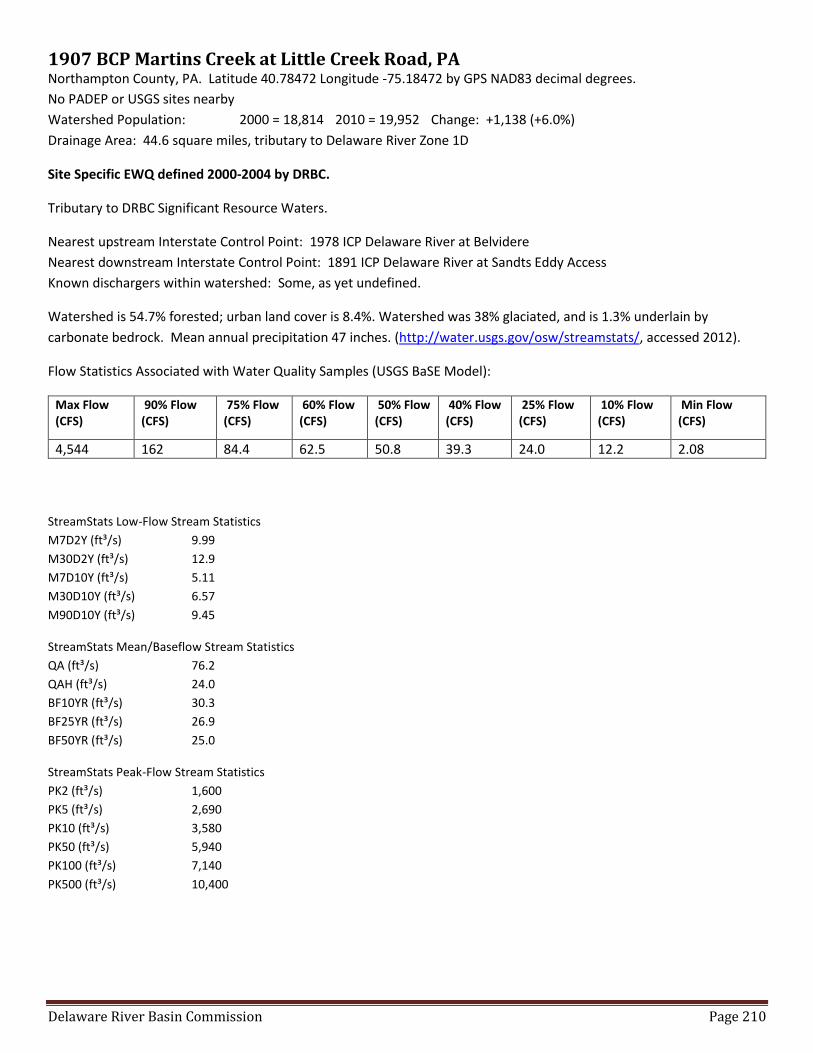
1907 BCP Martins Creek at Little Creek Road, PA Northampton County, PA. Latitude 40.78472 Longitude -75.18472 by GPS NAD83 decimal degrees.
No PADEP or USGS sites nearby
Watershed Population: 2000 = 18,814 2010 = 19,952 Change: +1,138 (+6.0%)
Drainage Area: 44.6 square miles, tributary to Delaware River Zone 1D
Site Specific EWQ defined 2000-2004 by DRBC.
Tributary to DRBC Significant Resource Waters.
Nearest upstream Interstate Control Point: 1978 ICP Delaware River at Belvidere
Nearest downstream Interstate Control Point: 1891 ICP Delaware River at Sandts Eddy Access
Known dischargers within watershed: Some, as yet undefined.
Watershed is 54.7% forested; urban land cover is 8.4%. Watershed was 38% glaciated, and is 1.3% underlain by
carbonate bedrock. Mean annual precipitation 47 inches. (http://water.usgs.gov/osw/streamstats/, accessed 2012).
Flow Statistics Associated with Water Quality Samples (USGS BaSE Model):
Max Flow (CFS)
90% Flow (CFS)
75% Flow (CFS)
60% Flow (CFS)
50% Flow (CFS)
40% Flow (CFS)
25% Flow (CFS)
10% Flow (CFS)
Min Flow (CFS)
4,544 162 84.4 62.5 50.8 39.3 24.0 12.2 2.08
StreamStats Low-Flow Stream Statistics
M7D2Y (ft³/s) 9.99
M30D2Y (ft³/s) 12.9
M7D10Y (ft³/s) 5.11
M30D10Y (ft³/s) 6.57
M90D10Y (ft³/s) 9.45
StreamStats Mean/Baseflow Stream Statistics
QA (ft³/s) 76.2
QAH (ft³/s) 24.0
BF10YR (ft³/s) 30.3
BF25YR (ft³/s) 26.9
BF50YR (ft³/s) 25.0
StreamStats Peak-Flow Stream Statistics
PK2 (ft³/s) 1,600
PK5 (ft³/s) 2,690
PK10 (ft³/s) 3,580
PK50 (ft³/s) 5,940
PK100 (ft³/s) 7,140
PK500 (ft³/s) 10,400
Delaware River Basin Commission Page 211
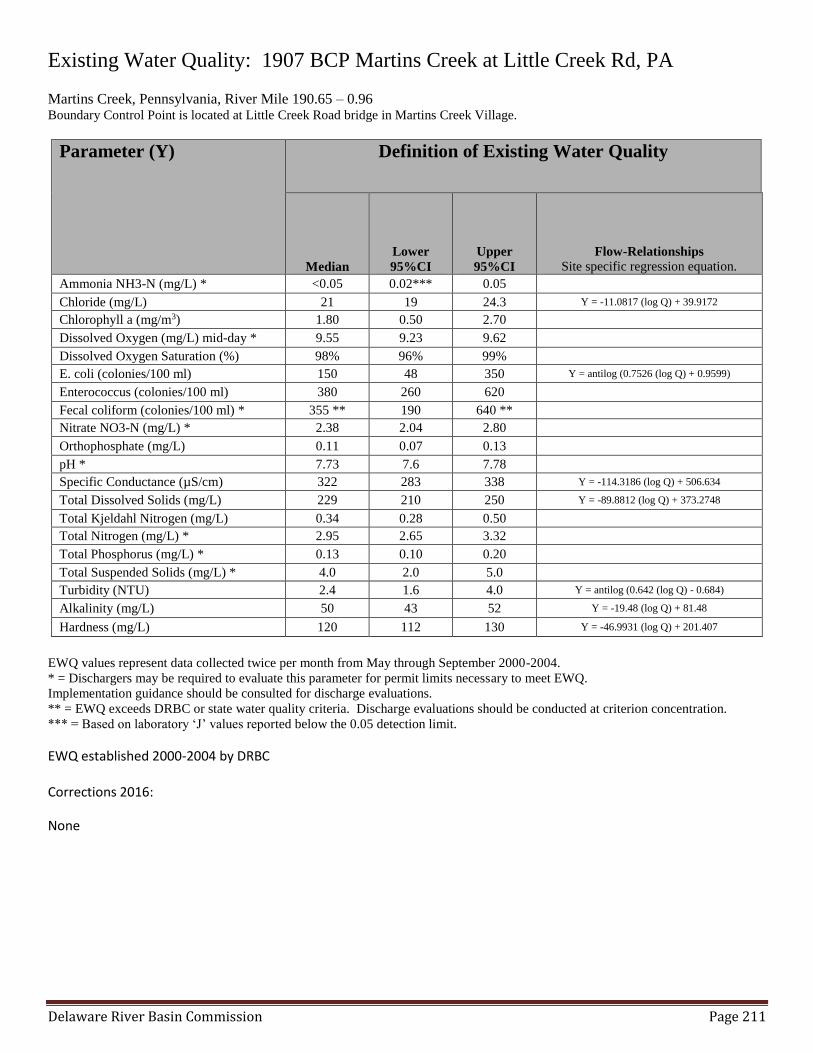
Existing Water Quality: 1907 BCP Martins Creek at Little Creek Rd, PA Martins Creek, Pennsylvania, River Mile 190.65 – 0.96 Boundary Control Point is located at Little Creek Road bridge in Martins Creek Village.
Parameter (Y) Definition of Existing Water Quality
Median
Lower
95%CI
Upper
95%CI
Flow-Relationships
Site specific regression equation.
Ammonia NH3-N (mg/L) * <0.05 0.02*** 0.05
Chloride (mg/L) 21 19 24.3 Y = -11.0817 (log Q) + 39.9172
Chlorophyll a (mg/m3) 1.80 0.50 2.70
Dissolved Oxygen (mg/L) mid-day * 9.55 9.23 9.62
Dissolved Oxygen Saturation (%) 98% 96% 99%
E. coli (colonies/100 ml) 150 48 350 Y = antilog (0.7526 (log Q) + 0.9599)
Enterococcus (colonies/100 ml) 380 260 620
Fecal coliform (colonies/100 ml) * 355 ** 190 640 **
Nitrate NO3-N (mg/L) * 2.38 2.04 2.80
Orthophosphate (mg/L) 0.11 0.07 0.13
pH * 7.73 7.6 7.78
Specific Conductance (µS/cm) 322 283 338 Y = -114.3186 (log Q) + 506.634
Total Dissolved Solids (mg/L) 229 210 250 Y = -89.8812 (log Q) + 373.2748
Total Kjeldahl Nitrogen (mg/L) 0.34 0.28 0.50
Total Nitrogen (mg/L) * 2.95 2.65 3.32
Total Phosphorus (mg/L) * 0.13 0.10 0.20
Total Suspended Solids (mg/L) * 4.0 2.0 5.0
Turbidity (NTU) 2.4 1.6 4.0 Y = antilog (0.642 (log Q) - 0.684)
Alkalinity (mg/L) 50 43 52 Y = -19.48 (log Q) + 81.48
Hardness (mg/L) 120 112 130 Y = -46.9931 (log Q) + 201.407
EWQ values represent data collected twice per month from May through September 2000-2004.
* = Dischargers may be required to evaluate this parameter for permit limits necessary to meet EWQ.
Implementation guidance should be consulted for discharge evaluations.
** = EWQ exceeds DRBC or state water quality criteria. Discharge evaluations should be conducted at criterion concentration.
*** = Based on laboratory ‘J’ values reported below the 0.05 detection limit.
EWQ established 2000-2004 by DRBC Corrections 2016:
None
Delaware River Basin Commission Page 212
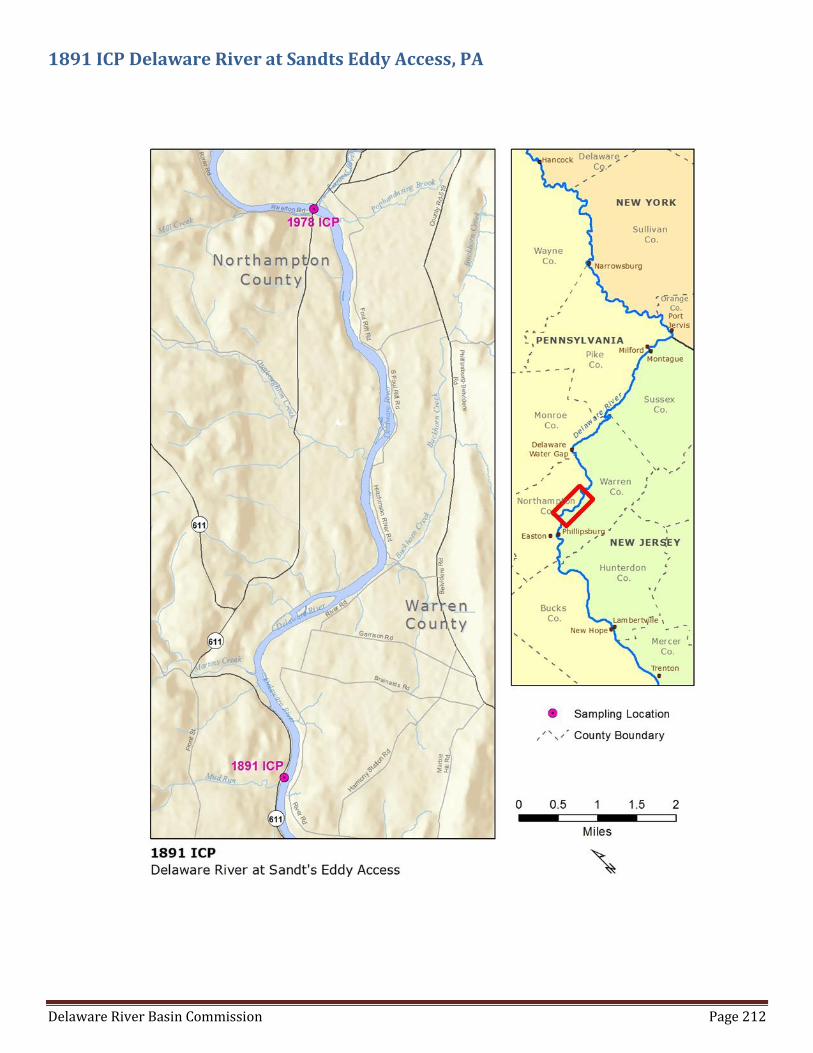
1891 ICP Delaware River at Sandts Eddy Access, PA

Delaware River Basin Commission Page 213
1891 ICP Delaware River at Sandts Eddy Access, PA Northampton County, PA (site is sampled by wading to mid-river from PA shore, except for high water conditions)
Latitude 40.758252 Longitude -75.187719 by GPS NAD83 decimal degrees.
No USGS or State monitoring sites nearby. The closest is PADEP WQN 0148 at Martins Creek Railroad Bridge.
Watershed Population figures were not calculated for main-stem Delaware River sites.
Drainage Area: 4,610 square miles, Delaware River Zone 1D
Site Specific EWQ defined 2009-2013 by the DRBC/NPS Scenic Rivers Monitoring Program.
This site is located in the Lower Delaware Scenic and Recreational River.
Classified by DRBC as Significant Resource Waters
Nearest upstream Interstate Control Point: 1978 ICP Delaware River at Belvidere
Nearest downstream Interstate Control Point: 1838 ICP Delaware River at Easton
Known dischargers to upstream reach: Undefined
Tributaries to upstream reach: Major tributaries 1978 BCP Pequest River, NJ; 1907 BCP Martins Creek, PA; small
tributaries 197.5 Pophandusing Brook, NJ; , 194.1 Oughoughton Creek, PA; 1929 BCP Buckhorn Creek, NJ.
No Stream Stats web site data available (drainage area too large to calculate on web site).
Flow Statistics Associated with Water Quality Samples (calculated by drainage area weighting from USGS gage data):
Max Flow (CFS)
90% Flow (CFS)
75% Flow (CFS)
60% Flow (CFS)
50% Flow (CFS)
40% Flow (CFS)
25% Flow (CFS)
10% Flow (CFS) Min Flow (CFS)
214,500 17,400 10,100 6,920 5,430 4,320 3,030 2,240 1,150

Delaware River Basin Commission Page 214
Existing Water Quality: 1891 ICP Delaware River at Sandts Eddy Access, PA Parameter N median L95CL U95CL Flow
Relation Period of Record (May-Sep data)
Alkalinity as CaCO3, Total mg/L 49 36.1 33.1 38.1 None 2009-2013 SRMP
Aluminum, Dissolved mg/L 14 0.006 0.005 0.009 None 2009-2010 SRMP archived*
Ammonia-Nitrogen as N, Total mg/L * 47 0.009 0.006 0.011 None 2009-2013 SRMP (14 non-detect)
Barium, Dissolved mg/L 14 0.017 0.012 0.023 None 2009-2010 SRMP archived*
Calcium, Dissolved mg/L 14 8.66 7.18 9.77 None 2009-2010 SRMP archived*
Chloride, Total mg/L 49 16.8 15.8 17.2 Inverse 2009-2013 SRMP
Dissolved Oxygen (DO) mg/L * 47 9.35 8.85 9.55 None 2009-2013 SRMP mid-day
Dissolved Oxygen Saturation % 46 106.8 100.5 109.8 None 2009-2013 SRMP mid-day
Enterococcus #/100mL {1} 28 47 27 90 None 2009-2011 SRMP
Escherichia coli #/100mL 29 21 14 50 Positive 2009-2011 SRMP
Fecal coliform #/100mL * 29 29 20 50 Positive 2009-2011 SRMP
Hardness as CaCO3, Total mg/L 49 52 48.8 55 None 2009-2013 SRMP
Magnesium, Dissolved mg/L 14 3.04 1.89 3.55 Inverse 2009-2010 SRMP archived*
Manganese, Dissolved μg/L 14 2.6 1.4 4.5 Positive 2009-2010 SRMP archived*
Nitrate + Nitrite as N, Total mg/L * 49 0.323 0.286 0.429 None 2009-2013 SRMP
Nitrogen, Kjeldahl as N, Total mg/L 49 0.229 0.217 0.251 None 2009-2013 SRMP
Nitrogen as N, Total mg/L * 49 0.605 0.521 0.680 None 2009-2013 SRMP
Orthophosphate as P, Total mg/L 49 0.018 0.016 0.021 None 2009-2013 SRMP
pH units * 47 7.96 7.75 8.20 Inverse 2009-2013 SRMP mid-day
Phosphorus as P, Total mg/L * 49 0.028 0.024 0.031 None 2009-2013 SRMP
Potassium, Dissolved mg/L 14 0.95 0.70 1.10 Inverse 2009-2010 SRMP archived*
Sodium, Dissolved mg/L 14 8.79 6.79 9.29 Inverse 2009-2010 SRMP archived*
Specific Conductance µS/cm 47 166 159 172 Inverse 2009-2013 SRMP mid-day
Strontium, Dissolved mg/L 14 0.045 0.035 0.05 Inverse 2009-2010 SRMP archived*
Sulfate as SO4, Total mg/L 14 9.39 6.67 11.30 Inverse 2009-2010 SRMP archived*
Temperature, Water, degrees C 47 21.4 20.6 22.5 None 2009-2013 SRMP mid-day
Total Dissolved Solids (TDS) mg/L 49 83 81 87 None 2009-2013 SRMP
Total Suspended Solids (TSS) mg/L * 49 1.8 1.5 3.0 Positive 2009-2013 SRMP
Turbidity NTU 70 1.10 0.99 1.38 Positive 2009-2013 SRMP
Two-tailed 95% lower (L95CL) and upper (U95CL) confidence limits were used for these EWQ targets * = Dischargers may be required to evaluate this parameter for permit limits necessary to meet EWQ. Implementation guidance should be consulted for discharge evaluations.
Note: All data are May to September season.
Note: Parameters denoted “archived” were 2009-2010 frozen samples analyzed in 2011 in anticipation of establishing
background water quality conditions prior to natural gas development.
*Insufficient number of data to establish Existing Water Quality.
{1}: Median enterococcus concentrations exceed outdated NJ freshwater criterion.

Delaware River Basin Commission Page 215
1841 BCP Bushkill Creek at Rt. 611, Easton, PA

Delaware River Basin Commission Page 216
1841 BCP Bushkill Creek at Rt. 611, Easton, PA Northampton County, PA. Latitude 40.695767 Longitude -75.205612 by GPS NAD83 decimal degrees.
No USGS or PADEP sites nearby. Closest is USGS 01446900 by Penn Pump Park in Forks Township above Easton
Watershed Population: 2000 = 59,221 2010 = 70,864 Change: +11,643 (+19.7%)
Drainage Area: 80 square miles, tributary to Delaware River Zone 1D
Site Specific EWQ defined 2000-2004 by DRBC.
Tributary to DRBC Significant Resource Waters.
Nearest upstream Interstate Control Point: 1891 ICP Delaware River at Sandts Eddy Access
Nearest downstream Interstate Control Point: 1838 ICP Delaware River at Northampton St., Easton
Known dischargers within watershed: Many, as yet undefined.
Watershed is 31% forested; urban land cover is 15.1%. Watershed was not glaciated, and is 37.8% underlain by
carbonate bedrock. Mean annual precipitation 45 inches. (http://water.usgs.gov/osw/streamstats/, accessed 2012).
Flow Statistics from USGS BaSE Model:
Max Flow (CFS)
90% Flow (CFS)
75% Flow (CFS)
60% Flow (CFS)
50% Flow (CFS)
40% Flow (CFS)
25% Flow (CFS)
10% Flow (CFS)
Min Flow (CFS)
5,700 233 146 102 82.8 67.2 47.4 27.0 5.58
BaSE model low flows are rarely, if ever encountered. An upstream quarry dewatering operation supports Bushkill
Creek’s flow at a minimum around the 40th flow percentile, or about 67 cfs. The quarry pumps about 60 cfs continually
to the stream unless the pumps are out of operation, which is very rare.
StreamStats Low-Flow Stream Statistics
M7D2Y (ft³/s) 36.1
M30D2Y (ft³/s) 42.9
M7D10Y (ft³/s) 20.5
M30D10Y (ft³/s) 25.0
M90D10Y (ft³/s) 32.1
StreamStats Mean/Baseflow Stream Statistics
QA (ft³/s) 121
QAH (ft³/s) 72.8
BF10YR (ft³/s) 55.1
BF25YR (ft³/s) 48.5
BF50YR (ft³/s) 44.8
StreamStats Peak-Flow Stream Statistics
PK2 (ft³/s) 2,890
PK5 (ft³/s) 4,810
PK10 (ft³/s) 6,330
PK50 (ft³/s) 10,400
PK100 (ft³/s) 12,400
PK500 (ft³/s) 17,900

Delaware River Basin Commission Page 217
Existing Water Quality: 1841 BCP Bushkill Creek at Rt. 611, Easton, PA Bushkill Creek, Northampton County, Pennsylvania, River Mile 184.10 – 0.05 Boundary Control Point is located at Route 611 bridge, Easton.
Parameter (Y) Definition of Existing Water Quality
Median
Lower
95%CI
Upper
95%CI
Flow-Relationships
Site specific regression equation.
Ammonia NH3-N (mg/L) * 0.10 0.07 0.13
Chloride (mg/L) 27 25 28.4 Y = -13.4942 (log Q) + 54.7837
Chlorophyll a (mg/m3) n/a n/a n/a n/a
Dissolved Oxygen (mg/L) mid-day * 10.10 9.69 10.30
Dissolved Oxygen Saturation (%) 102% 100% 104%
E. coli (colonies/100 ml) 330 220 620
Enterococcus (colonies/100 ml) 350 280 540
Fecal coliform (colonies/100 ml) * 540 ** 370 ** 880 **
Nitrate NO3-N (mg/L) * 3.90 3.63 4.26
Orthophosphate (mg/L) 0.02 0.02 0.03
pH * 8.00 7.99 8.08
Specific Conductance (µS/cm) 578 542 615 Y = -1.32108663 Q + 751.3559
Total Dissolved Solids (mg/L) 410 360 440 Y = -394.9208 (log Q) + 1231.0249
Total Kjeldahl Nitrogen (mg/L) 0.40 0.29 0.50
Total Nitrogen (mg/L) * 4.37 4.11 4.73
Total Phosphorus (mg/L) * 0.05 0.04 0.07
Total Suspended Solids (mg/L) * 5.0 3.0 8.0
Turbidity (NTU) 3.0 2.5 5.1
Alkalinity (mg/L) 140 130 155 Y = -152.34 (log Q) + 459
Hardness (mg/L) 218 210 225 Y = -159.4372 (log Q) + 549.8009
EWQ values represent data collected twice per month from May through September 2000-2004.
* = Dischargers may be required to evaluate this parameter for permit limits necessary to meet EWQ.
Implementation guidance should be consulted for discharge evaluations.
** = EWQ exceeds DRBC or state water quality criteria. Discharge evaluations should be conducted at criterion concentration.
EWQ established 2000-2004 by DRBC Corrections 2016:
Total Nitrogen median should be 4.37 mg/L. Listed in rules as 4.41 mg/L. Total Phosphorus upper 95% CL should be 0.07 mg/L. Listed in rule as 0.06 mg/L.
Delaware River Basin Commission Page 218
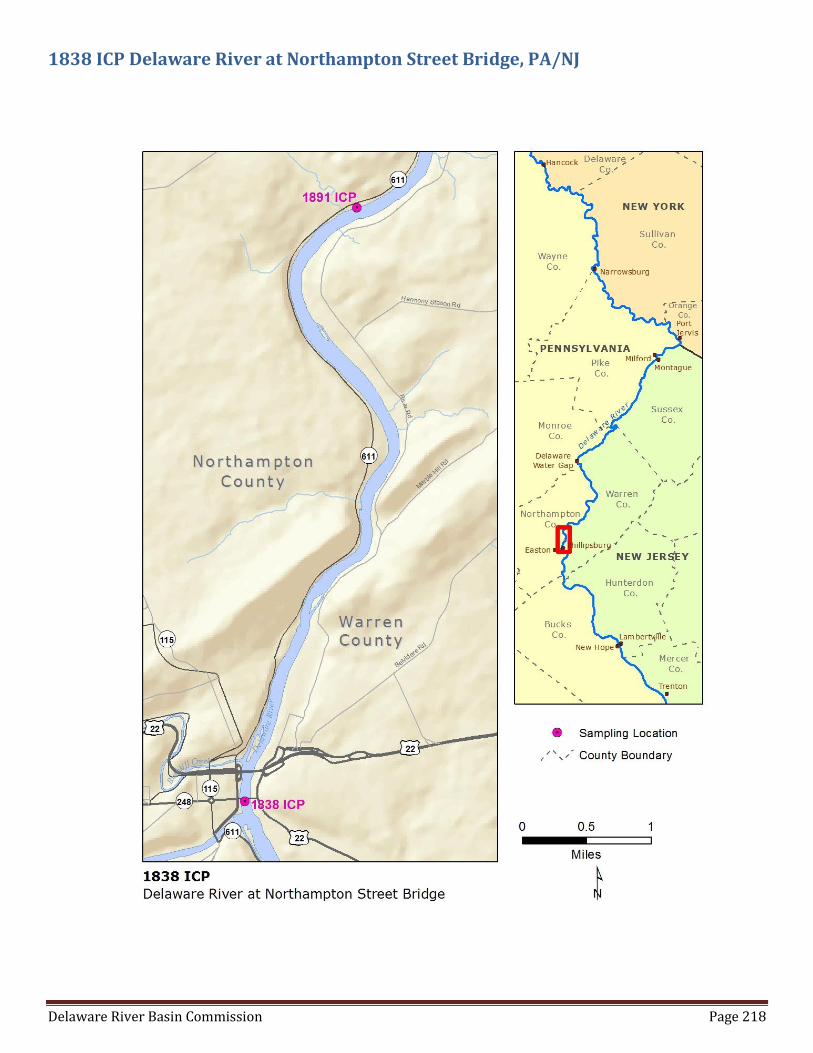
1838 ICP Delaware River at Northampton Street Bridge, PA/NJ
Delaware River Basin Commission Page 219
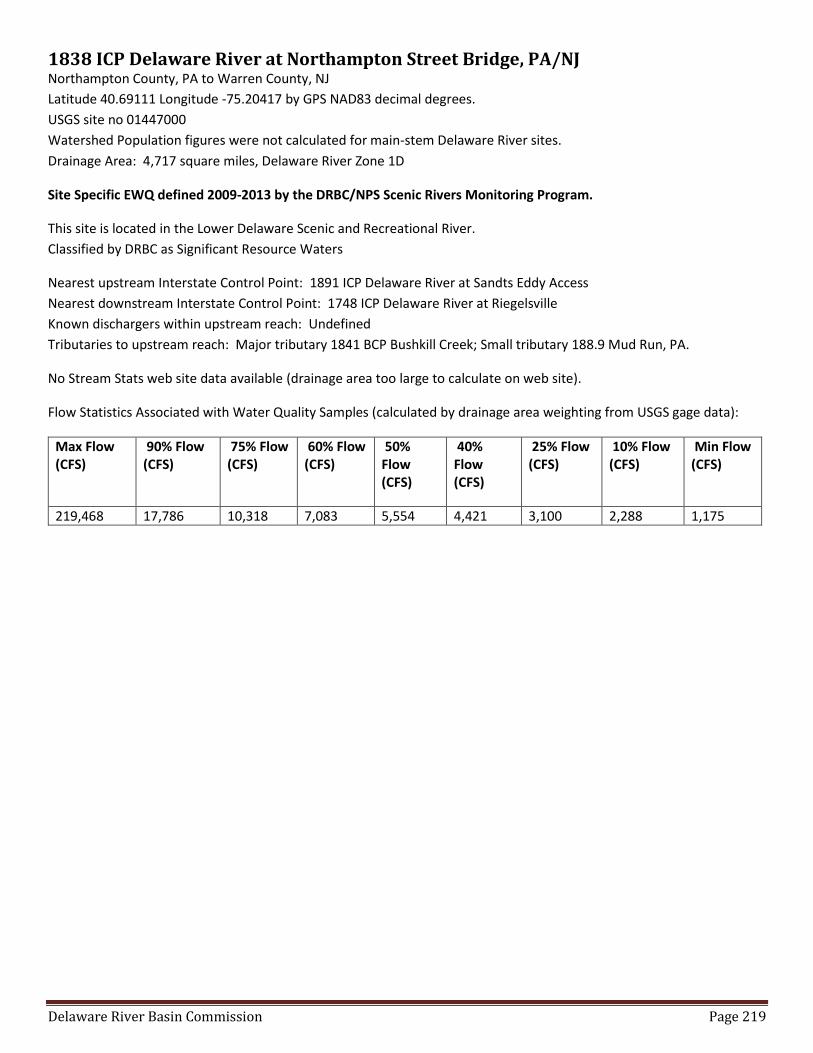
1838 ICP Delaware River at Northampton Street Bridge, PA/NJ Northampton County, PA to Warren County, NJ
Latitude 40.69111 Longitude -75.20417 by GPS NAD83 decimal degrees.
USGS site no 01447000
Watershed Population figures were not calculated for main-stem Delaware River sites.
Drainage Area: 4,717 square miles, Delaware River Zone 1D
Site Specific EWQ defined 2009-2013 by the DRBC/NPS Scenic Rivers Monitoring Program.
This site is located in the Lower Delaware Scenic and Recreational River.
Classified by DRBC as Significant Resource Waters
Nearest upstream Interstate Control Point: 1891 ICP Delaware River at Sandts Eddy Access
Nearest downstream Interstate Control Point: 1748 ICP Delaware River at Riegelsville
Known dischargers within upstream reach: Undefined
Tributaries to upstream reach: Major tributary 1841 BCP Bushkill Creek; Small tributary 188.9 Mud Run, PA.
No Stream Stats web site data available (drainage area too large to calculate on web site).
Flow Statistics Associated with Water Quality Samples (calculated by drainage area weighting from USGS gage data):
Max Flow (CFS)
90% Flow (CFS)
75% Flow (CFS)
60% Flow (CFS)
50% Flow (CFS)
40% Flow (CFS)
25% Flow (CFS)
10% Flow (CFS)
Min Flow (CFS)
219,468 17,786 10,318 7,083 5,554 4,421 3,100 2,288 1,175
Delaware River Basin Commission Page 220
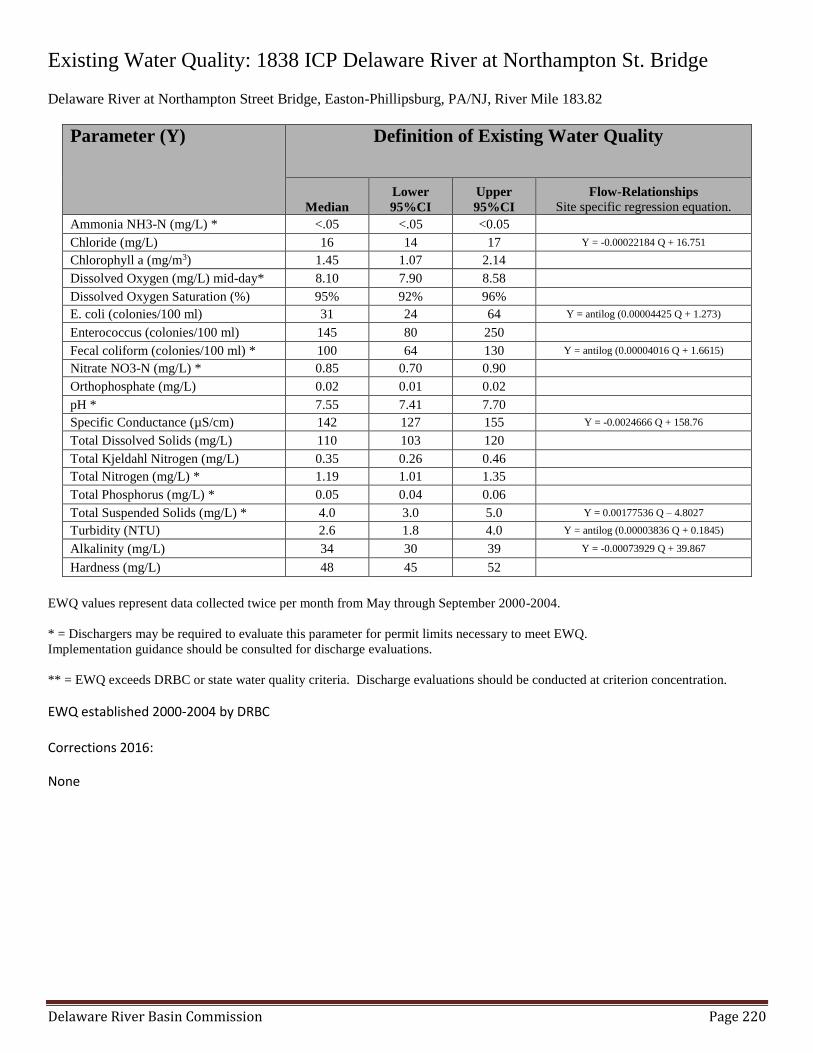
Existing Water Quality: 1838 ICP Delaware River at Northampton St. Bridge Delaware River at Northampton Street Bridge, Easton-Phillipsburg, PA/NJ, River Mile 183.82
Parameter (Y) Definition of Existing Water Quality
Median
Lower
95%CI
Upper
95%CI
Flow-Relationships
Site specific regression equation.
Ammonia NH3-N (mg/L) * <.05 <.05 <0.05
Chloride (mg/L) 16 14 17 Y = -0.00022184 Q + 16.751
Chlorophyll a (mg/m3) 1.45 1.07 2.14
Dissolved Oxygen (mg/L) mid-day* 8.10 7.90 8.58
Dissolved Oxygen Saturation (%) 95% 92% 96%
E. coli (colonies/100 ml) 31 24 64 Y = antilog (0.00004425 Q + 1.273)
Enterococcus (colonies/100 ml) 145 80 250
Fecal coliform (colonies/100 ml) * 100 64 130 Y = antilog (0.00004016 Q + 1.6615)
Nitrate NO3-N (mg/L) * 0.85 0.70 0.90
Orthophosphate (mg/L) 0.02 0.01 0.02
pH * 7.55 7.41 7.70
Specific Conductance (µS/cm) 142 127 155 Y = -0.0024666 Q + 158.76
Total Dissolved Solids (mg/L) 110 103 120
Total Kjeldahl Nitrogen (mg/L) 0.35 0.26 0.46
Total Nitrogen (mg/L) * 1.19 1.01 1.35
Total Phosphorus (mg/L) * 0.05 0.04 0.06
Total Suspended Solids (mg/L) * 4.0 3.0 5.0 Y = 0.00177536 Q – 4.8027
Turbidity (NTU) 2.6 1.8 4.0 Y = antilog (0.00003836 Q + 0.1845)
Alkalinity (mg/L) 34 30 39 Y = -0.00073929 Q + 39.867
Hardness (mg/L) 48 45 52
EWQ values represent data collected twice per month from May through September 2000-2004.
* = Dischargers may be required to evaluate this parameter for permit limits necessary to meet EWQ.
Implementation guidance should be consulted for discharge evaluations.
** = EWQ exceeds DRBC or state water quality criteria. Discharge evaluations should be conducted at criterion concentration.
EWQ established 2000-2004 by DRBC Corrections 2016:
None

Delaware River Basin Commission Page 221
1837 BCP Lehigh River at Rt. 611, Easton, PA

Delaware River Basin Commission Page 222
1837 BCP Lehigh River at Rt. 611, Easton, PA Multiple PA Counties: Northampton; Bucks; Lehigh; Berks; Carbon; Schuylkill; Luzerne; Lackawanna; Wayne
Latitude 40.66917 Longitude -75.23667 by GPS NAD83 decimal degrees.
USGS site 01454720, upstream gage USGS 01454700; PADEP site WQN0123
Watershed Population: 2000 = 604,954 2010 = 676,939 Change: +71,985 (+11.9%)
Drainage Area: 1362 square miles, tributary to Delaware River Zone 1E
Site Specific EWQ defined 2000-2004 by DRBC.
Tributary to DRBC Significant Resource Waters.
Nearest upstream Interstate Control Point: 1838 ICP Delaware River at Northampton St. Bridge, Easton
Nearest downstream Interstate Control Point: 1748 ICP Delaware River at Riegelsville
Known dischargers within watershed: Many, as yet undefined.
Watershed is 60.3% forested; urban land cover is 9.9%. Watershed was 28% glaciated, and is 16% underlain by
carbonate bedrock. Mean annual precipitation 46 inches. (http://water.usgs.gov/osw/streamstats/, accessed 2012).
Flow Statistics Associated with Water Quality Samples (Using USGS Lehigh River gage 01454700 at Glendon, PA):
Max Flow (CFS)
90% Flow (CFS)
75% Flow (CFS)
60% Flow (CFS)
50% Flow (CFS)
40% Flow (CFS)
25% Flow (CFS)
10% Flow (CFS)
Min Flow (CFS)
99,966 5,488 3,183 2,500 2,100 1,730 1,037 626 171
StreamStats Low-Flow Stream Statistics
M7D2Y (ft³/s) 542
M30D2Y (ft³/s) 631
M7D10Y (ft³/s) 372
M30D10Y (ft³/s) 429
M90D10Y (ft³/s) 512
StreamStats Mean/Baseflow Stream Statistics
QA (ft³/s) 2,520
QAH (ft³/s) 1,250
BF10YR (ft³/s) 1,080
BF25YR (ft³/s) 965
BF50YR (ft³/s) 899
StreamStats Peak-Flow Stream Statistics
PK2 (ft³/s) 29,500
PK5 (ft³/s) 46100
PK10 (ft³/s) 59,300
PK50 (ft³/s) 94,900
PK100 (ft³/s) 113,000
PK500 (ft³/s) 162,000

Delaware River Basin Commission Page 223
Existing Water Quality: 1837 BCP Lehigh River at Rt. 611, PA Lehigh River, Pennsylvania, River Mile 183.66 – 0.27 Boundary Control Point is located at Route 611 bridge, Easton.
Parameter (Y) Definition of Existing Water Quality
Median
Lower
95%CI
Upper
95%CI
Flow-Relationships
Site specific regression equation.
Ammonia NH3-N (mg/L) * 0.08 0.06 0.09
Chloride (mg/L) 21 19 24 Y = -16.5077 (log Q) + 76.7534
Chlorophyll a (mg/m3) 2.70 1.80 3.60
Dissolved Oxygen (mg/L) mid-day * 8.85 8.39 9.20
Dissolved Oxygen Saturation (%) 97% 94% 98%
E. coli (colonies/100 ml) 49 36 120 Y = antilog (1.5045 (log Q) – 3.0132)
Enterococcus (colonies/100 ml) 110 56 210
Fecal coliform (colonies/100 ml) * 120 70 200 Y = antilog (1.4387 (log Q) – 2.5712)
Nitrate NO3-N (mg/L) * 1.80 1.70 2.00
Orthophosphate (mg/L) 0.11 0.09 0.15
pH * 7.60 7.50 7.70
Specific Conductance (µS/cm) 264 218 292 Y = -186.4602 (log Q) + 870.6296
Total Dissolved Solids (mg/L) 180 158 195 Y = -93.4568 (log Q) + 482.4929
Total Kjeldahl Nitrogen (mg/L) 0.50 0.41 0.58
Total Nitrogen (mg/L) * 2.43 2.13 2.74
Total Phosphorus (mg/L) * 0.17 0.15 0.24
Total Suspended Solids (mg/L) * 4.0 3.0 6.0
Turbidity (NTU) 3.1 2.2 6.0 Y = antilog (0.901 (log Q) – 2.335)
Alkalinity (mg/L) 55 49 69 Y = -51.44 (log Q) + 227.86
Hardness (mg/L) 94 77 105 Y = -58.1224 (log Q) + 285.2788
EWQ values represent data collected twice per month from May through September 2000-2004.
* = Dischargers may be required to evaluate this parameter for permit limits necessary to meet EWQ.
Implementation guidance should be consulted for discharge evaluations.
** = EWQ exceeds DRBC or state water quality criteria. Discharge evaluations should be conducted at criterion concentration.
EWQ established 2000-2004 by DRBC Corrections 2016:
None
Delaware River Basin Commission Page 224
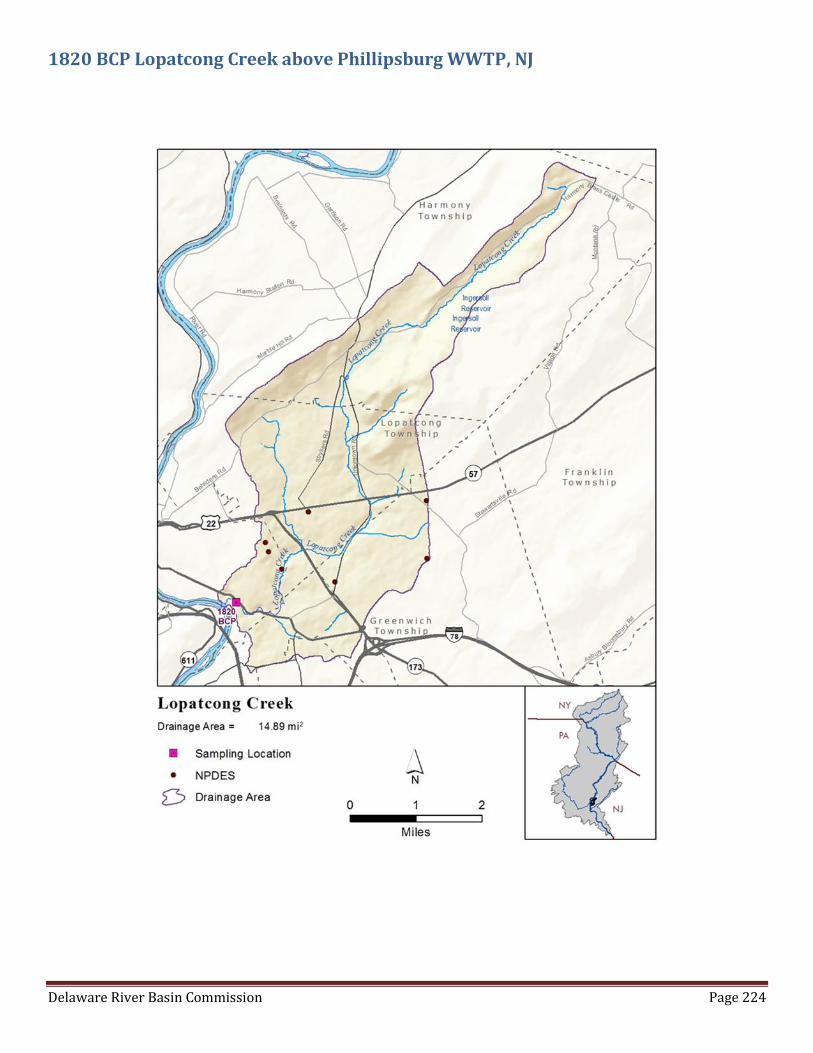
1820 BCP Lopatcong Creek above Phillipsburg WWTP, NJ
Delaware River Basin Commission Page 225
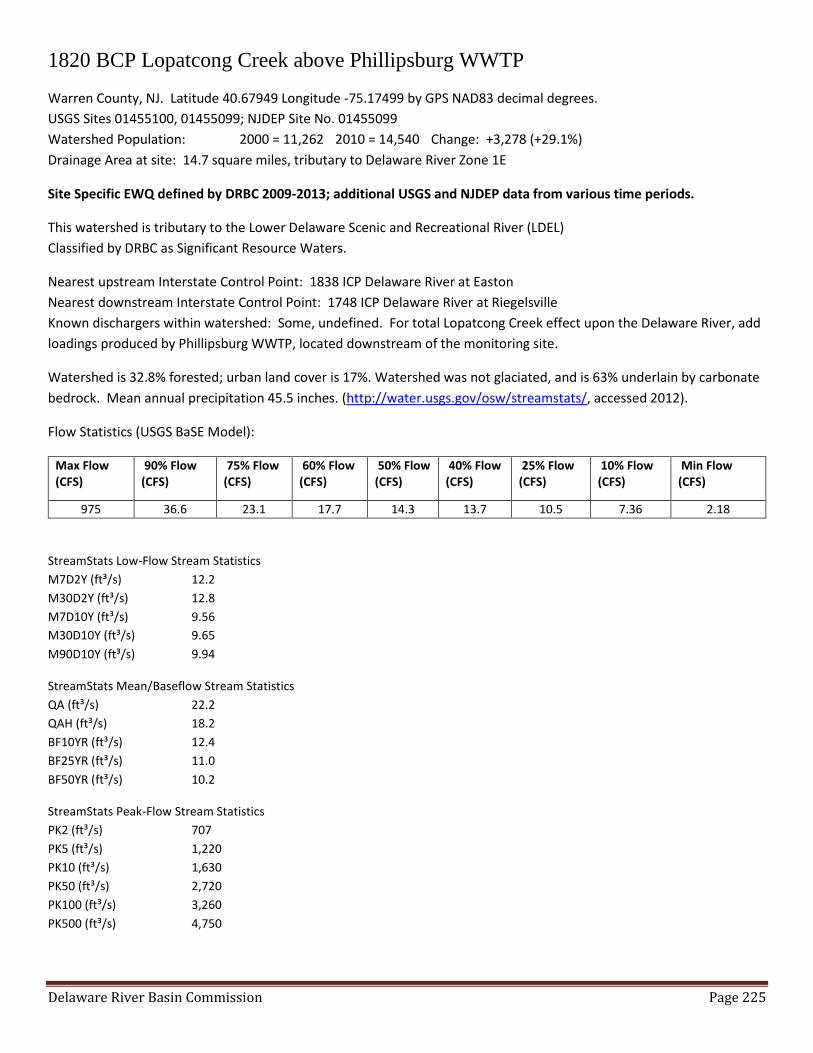
1820 BCP Lopatcong Creek above Phillipsburg WWTP
Warren County, NJ. Latitude 40.67949 Longitude -75.17499 by GPS NAD83 decimal degrees.
USGS Sites 01455100, 01455099; NJDEP Site No. 01455099
Watershed Population: 2000 = 11,262 2010 = 14,540 Change: +3,278 (+29.1%)
Drainage Area at site: 14.7 square miles, tributary to Delaware River Zone 1E
Site Specific EWQ defined by DRBC 2009-2013; additional USGS and NJDEP data from various time periods.
This watershed is tributary to the Lower Delaware Scenic and Recreational River (LDEL)
Classified by DRBC as Significant Resource Waters.
Nearest upstream Interstate Control Point: 1838 ICP Delaware River at Easton
Nearest downstream Interstate Control Point: 1748 ICP Delaware River at Riegelsville
Known dischargers within watershed: Some, undefined. For total Lopatcong Creek effect upon the Delaware River, add
loadings produced by Phillipsburg WWTP, located downstream of the monitoring site.
Watershed is 32.8% forested; urban land cover is 17%. Watershed was not glaciated, and is 63% underlain by carbonate
bedrock. Mean annual precipitation 45.5 inches. (http://water.usgs.gov/osw/streamstats/, accessed 2012).
Flow Statistics (USGS BaSE Model):
Max Flow (CFS)
90% Flow (CFS)
75% Flow (CFS)
60% Flow (CFS)
50% Flow (CFS)
40% Flow (CFS)
25% Flow (CFS)
10% Flow (CFS)
Min Flow (CFS)
975 36.6 23.1 17.7 14.3 13.7 10.5 7.36 2.18
StreamStats Low-Flow Stream Statistics
M7D2Y (ft³/s) 12.2
M30D2Y (ft³/s) 12.8
M7D10Y (ft³/s) 9.56
M30D10Y (ft³/s) 9.65
M90D10Y (ft³/s) 9.94
StreamStats Mean/Baseflow Stream Statistics
QA (ft³/s) 22.2
QAH (ft³/s) 18.2
BF10YR (ft³/s) 12.4
BF25YR (ft³/s) 11.0
BF50YR (ft³/s) 10.2
StreamStats Peak-Flow Stream Statistics
PK2 (ft³/s) 707
PK5 (ft³/s) 1,220
PK10 (ft³/s) 1,630
PK50 (ft³/s) 2,720
PK100 (ft³/s) 3,260
PK500 (ft³/s) 4,750
Delaware River Basin Commission Page 226
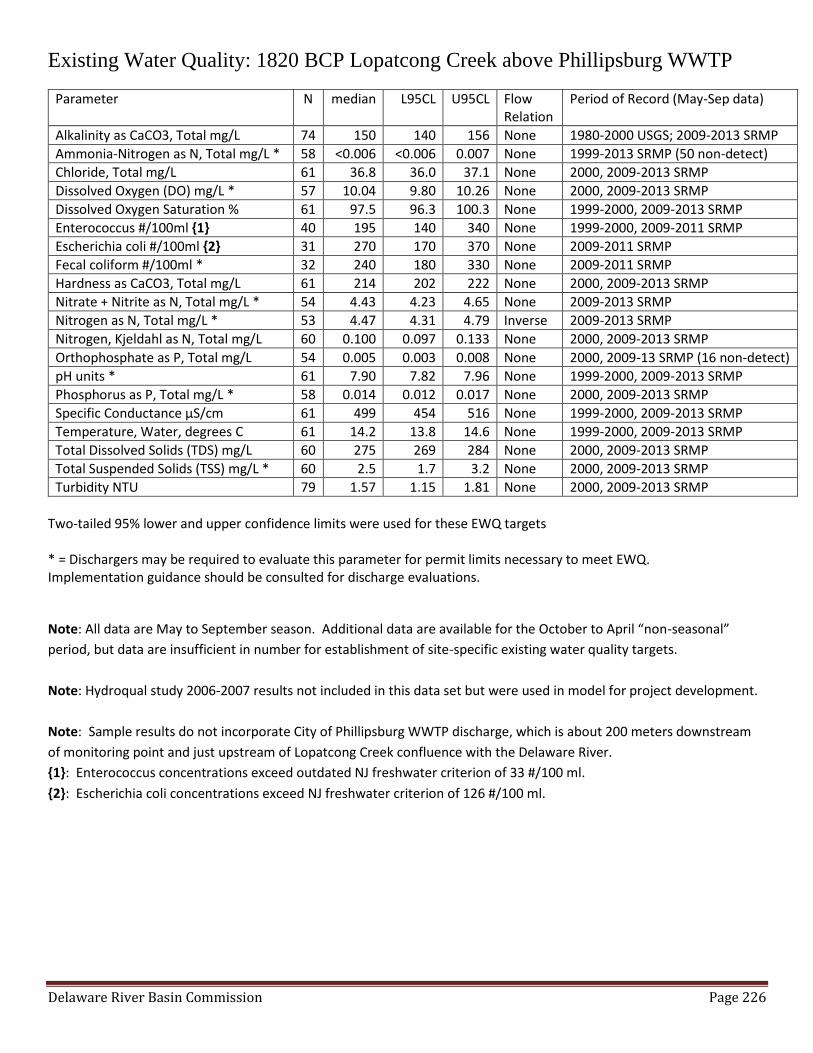
Existing Water Quality: 1820 BCP Lopatcong Creek above Phillipsburg WWTP
Parameter N median L95CL U95CL Flow Relation
Period of Record (May-Sep data)
Alkalinity as CaCO3, Total mg/L 74 150 140 156 None 1980-2000 USGS; 2009-2013 SRMP
Ammonia-Nitrogen as N, Total mg/L * 58 <0.006 <0.006 0.007 None 1999-2013 SRMP (50 non-detect)
Chloride, Total mg/L 61 36.8 36.0 37.1 None 2000, 2009-2013 SRMP
Dissolved Oxygen (DO) mg/L * 57 10.04 9.80 10.26 None 2000, 2009-2013 SRMP
Dissolved Oxygen Saturation % 61 97.5 96.3 100.3 None 1999-2000, 2009-2013 SRMP
Enterococcus #/100ml {1} 40 195 140 340 None 1999-2000, 2009-2011 SRMP
Escherichia coli #/100ml {2} 31 270 170 370 None 2009-2011 SRMP
Fecal coliform #/100ml * 32 240 180 330 None 2009-2011 SRMP
Hardness as CaCO3, Total mg/L 61 214 202 222 None 2000, 2009-2013 SRMP
Nitrate + Nitrite as N, Total mg/L * 54 4.43 4.23 4.65 None 2009-2013 SRMP
Nitrogen as N, Total mg/L * 53 4.47 4.31 4.79 Inverse 2009-2013 SRMP
Nitrogen, Kjeldahl as N, Total mg/L 60 0.100 0.097 0.133 None 2000, 2009-2013 SRMP
Orthophosphate as P, Total mg/L 54 0.005 0.003 0.008 None 2000, 2009-13 SRMP (16 non-detect)
pH units * 61 7.90 7.82 7.96 None 1999-2000, 2009-2013 SRMP
Phosphorus as P, Total mg/L * 58 0.014 0.012 0.017 None 2000, 2009-2013 SRMP
Specific Conductance µS/cm 61 499 454 516 None 1999-2000, 2009-2013 SRMP
Temperature, Water, degrees C 61 14.2 13.8 14.6 None 1999-2000, 2009-2013 SRMP
Total Dissolved Solids (TDS) mg/L 60 275 269 284 None 2000, 2009-2013 SRMP
Total Suspended Solids (TSS) mg/L * 60 2.5 1.7 3.2 None 2000, 2009-2013 SRMP
Turbidity NTU 79 1.57 1.15 1.81 None 2000, 2009-2013 SRMP
Two-tailed 95% lower and upper confidence limits were used for these EWQ targets * = Dischargers may be required to evaluate this parameter for permit limits necessary to meet EWQ. Implementation guidance should be consulted for discharge evaluations.
Note: All data are May to September season. Additional data are available for the October to April “non-seasonal”
period, but data are insufficient in number for establishment of site-specific existing water quality targets.
Note: Hydroqual study 2006-2007 results not included in this data set but were used in model for project development.
Note: Sample results do not incorporate City of Phillipsburg WWTP discharge, which is about 200 meters downstream
of monitoring point and just upstream of Lopatcong Creek confluence with the Delaware River.
{1}: Enterococcus concentrations exceed outdated NJ freshwater criterion of 33 #/100 ml.
{2}: Escherichia coli concentrations exceed NJ freshwater criterion of 126 #/100 ml.

Delaware River Basin Commission Page 227
1774 BCP Pohatcong Creek at River Road, NJ
Delaware River Basin Commission Page 228
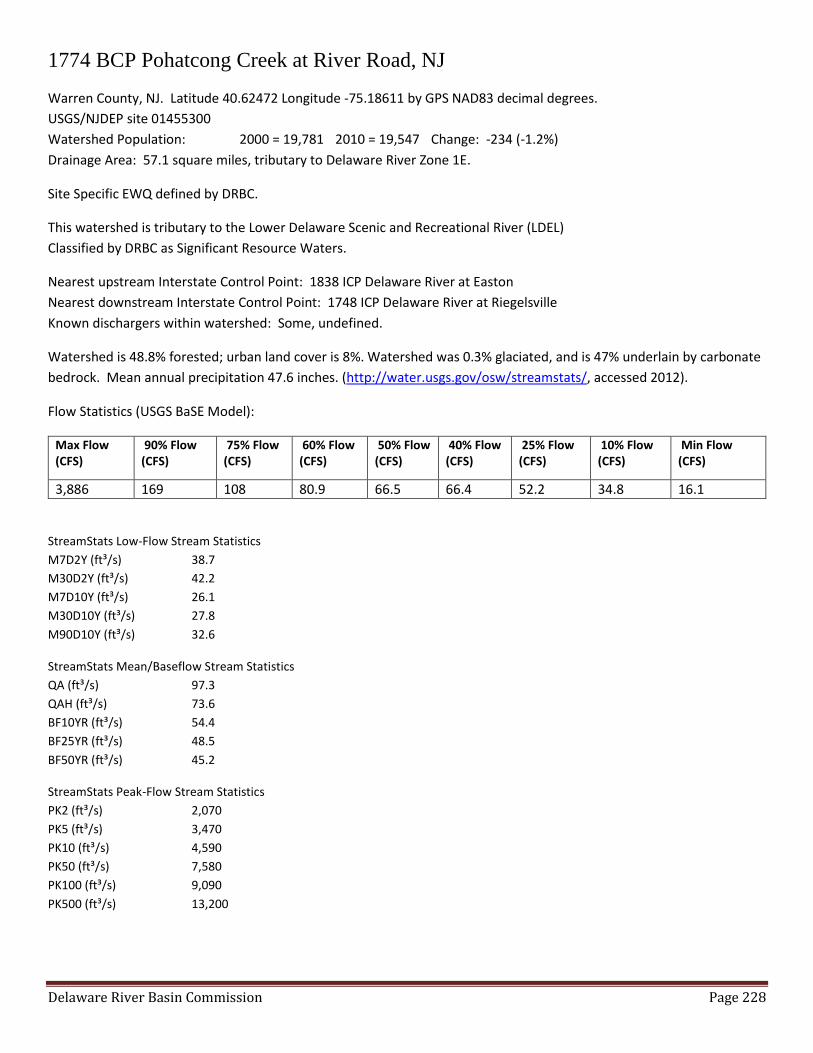
1774 BCP Pohatcong Creek at River Road, NJ
Warren County, NJ. Latitude 40.62472 Longitude -75.18611 by GPS NAD83 decimal degrees.
USGS/NJDEP site 01455300
Watershed Population: 2000 = 19,781 2010 = 19,547 Change: -234 (-1.2%)
Drainage Area: 57.1 square miles, tributary to Delaware River Zone 1E.
Site Specific EWQ defined by DRBC.
This watershed is tributary to the Lower Delaware Scenic and Recreational River (LDEL)
Classified by DRBC as Significant Resource Waters.
Nearest upstream Interstate Control Point: 1838 ICP Delaware River at Easton
Nearest downstream Interstate Control Point: 1748 ICP Delaware River at Riegelsville
Known dischargers within watershed: Some, undefined.
Watershed is 48.8% forested; urban land cover is 8%. Watershed was 0.3% glaciated, and is 47% underlain by carbonate
bedrock. Mean annual precipitation 47.6 inches. (http://water.usgs.gov/osw/streamstats/, accessed 2012).
Flow Statistics (USGS BaSE Model):
Max Flow (CFS)
90% Flow (CFS)
75% Flow (CFS)
60% Flow (CFS)
50% Flow (CFS)
40% Flow (CFS)
25% Flow (CFS)
10% Flow (CFS)
Min Flow (CFS)
3,886 169 108 80.9 66.5 66.4 52.2 34.8 16.1
StreamStats Low-Flow Stream Statistics
M7D2Y (ft³/s) 38.7
M30D2Y (ft³/s) 42.2
M7D10Y (ft³/s) 26.1
M30D10Y (ft³/s) 27.8
M90D10Y (ft³/s) 32.6
StreamStats Mean/Baseflow Stream Statistics
QA (ft³/s) 97.3
QAH (ft³/s) 73.6
BF10YR (ft³/s) 54.4
BF25YR (ft³/s) 48.5
BF50YR (ft³/s) 45.2
StreamStats Peak-Flow Stream Statistics
PK2 (ft³/s) 2,070
PK5 (ft³/s) 3,470
PK10 (ft³/s) 4,590
PK50 (ft³/s) 7,580
PK100 (ft³/s) 9,090
PK500 (ft³/s) 13,200

Delaware River Basin Commission Page 229
Existing Water Quality: 1774 BCP Pohatcong Creek at River Road, NJ Pohatcong Creek, New Jersey, River Mile 177.36 – 0.35 Boundary Control Point is located at River Road bridge.
Parameter (Y) Definition of Existing Water Quality
Median
Lower
95%CI
Upper
95%CI
Flow-Relationships
Site specific regression equation.
Ammonia NH3-N (mg/L) * <.05 <.05 <0.05
Chloride (mg/L) 20 19 21
Chlorophyll a (mg/m3) n/a n/a n/a n/a
Dissolved Oxygen (mg/L) mid-day * 9.50 9.20 9.90
Dissolved Oxygen Saturation (%) 97% 96% 100%
E. coli (colonies/100 ml) 305 190 550 Y = antilog (1.0503 (log Q) + 0.976)
Enterococcus (colonies/100 ml) 610 ** 380 ** 820 **
Fecal coliform (colonies/100 ml) * 580 ** 420 ** 810 **
Nitrate NO3-N (mg/L) * 2.61 2.30 2.88
Orthophosphate (mg/L) 0.05 0.05 0.07
pH * 7.90 7.88 7.95
Specific Conductance (µS/cm) 340 316 352 Y = -0.84542072 Q + 365.5539
Total Dissolved Solids (mg/L) 220 211 260 Y = -99.9173 (log Q) + 381.5349
Total Kjeldahl Nitrogen (mg/L) 0.33 0.19 0.36
Total Nitrogen (mg/L) * 3.14 2.87 3.26
Total Phosphorus (mg/L) * 0.10 0.08 0.11 **
Total Suspended Solids (mg/L) * 6.5 5.0 8.0
Turbidity (NTU) 4.6 2.1 5.1 Y = antilog (0.867 (log Q) – 0.69)
Alkalinity (mg/L) 116 104 120 Y = -81.8 (log Q) + 238.83
Hardness (mg/L) 140 135 160 Y = -76.5277 (log Q) + 261.5315
EWQ values represent data collected twice per month from May through September 2000-2004.
* = Dischargers may be required to evaluate this parameter for permit limits necessary to meet EWQ.
Implementation guidance should be consulted for discharge evaluations.
** = EWQ exceeds DRBC or state water quality criteria. Discharge evaluations should be conducted at criterion concentration.
EWQ established 2000-2004 by DRBC Corrections 2016:
Alkalinity median should be 116 mg/L. Listed in rule as 113 mg/L.
Delaware River Basin Commission Page 230
1748 ICP Delaware River at Riegelsville Bridge, PA/NJ
Delaware River Basin Commission Page 231
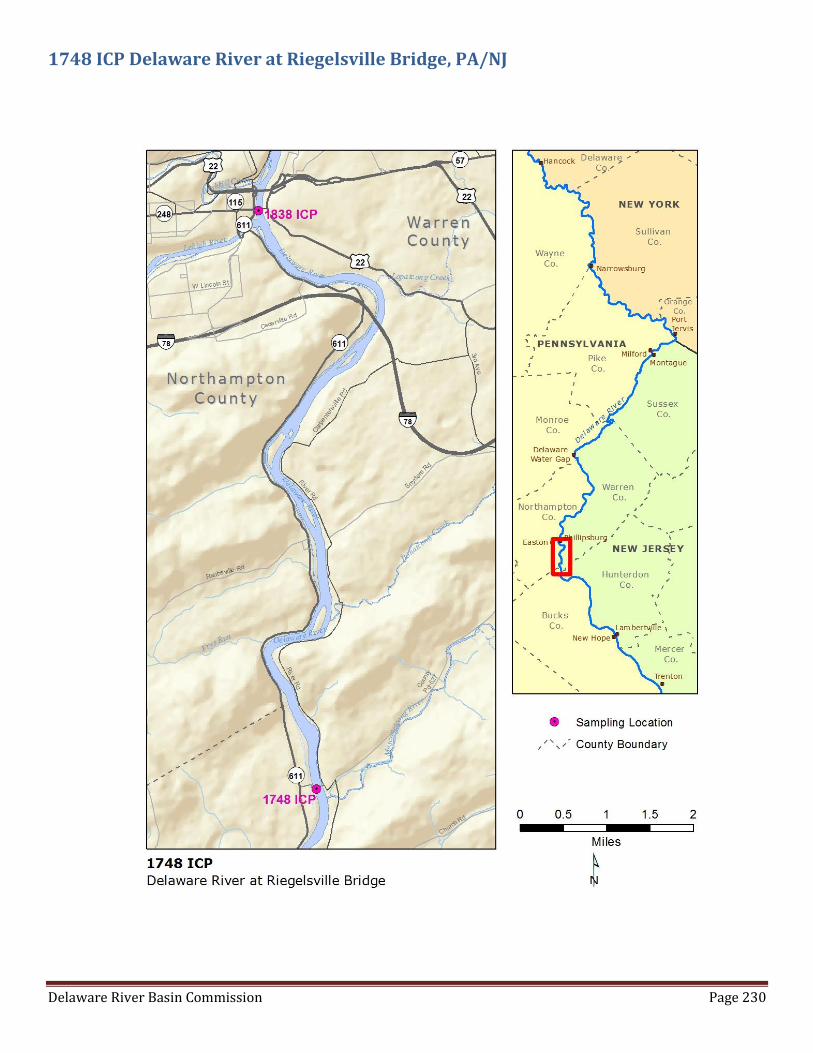
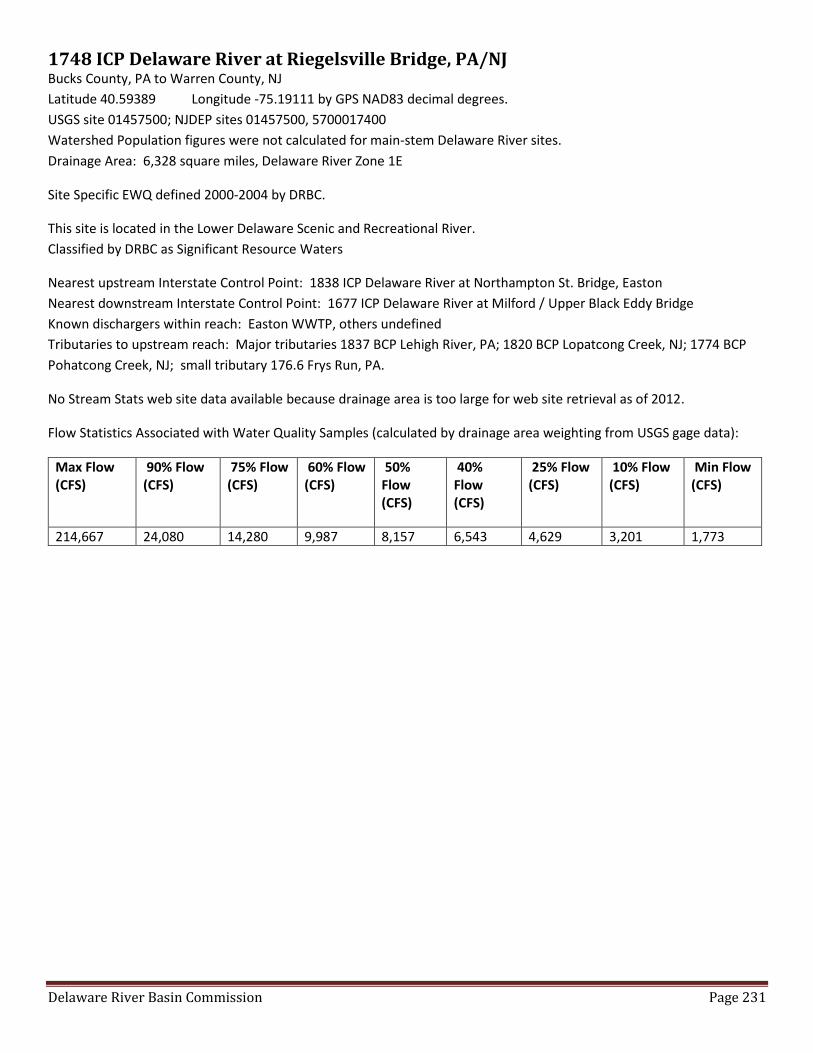
1748 ICP Delaware River at Riegelsville Bridge, PA/NJ Bucks County, PA to Warren County, NJ
Latitude 40.59389 Longitude -75.19111 by GPS NAD83 decimal degrees.
USGS site 01457500; NJDEP sites 01457500, 5700017400
Watershed Population figures were not calculated for main-stem Delaware River sites.
Drainage Area: 6,328 square miles, Delaware River Zone 1E
Site Specific EWQ defined 2000-2004 by DRBC.
This site is located in the Lower Delaware Scenic and Recreational River.
Classified by DRBC as Significant Resource Waters
Nearest upstream Interstate Control Point: 1838 ICP Delaware River at Northampton St. Bridge, Easton
Nearest downstream Interstate Control Point: 1677 ICP Delaware River at Milford / Upper Black Eddy Bridge
Known dischargers within reach: Easton WWTP, others undefined
Tributaries to upstream reach: Major tributaries 1837 BCP Lehigh River, PA; 1820 BCP Lopatcong Creek, NJ; 1774 BCP
Pohatcong Creek, NJ; small tributary 176.6 Frys Run, PA.
No Stream Stats web site data available because drainage area is too large for web site retrieval as of 2012.
Flow Statistics Associated with Water Quality Samples (calculated by drainage area weighting from USGS gage data):
Max Flow (CFS)
90% Flow (CFS)
75% Flow (CFS)
60% Flow (CFS)
50% Flow (CFS)
40% Flow (CFS)
25% Flow (CFS)
10% Flow (CFS)
Min Flow (CFS)
214,667 24,080 14,280 9,987 8,157 6,543 4,629 3,201 1,773

Delaware River Basin Commission Page 232
Existing Water Quality: 1748 ICP Delaware River at Riegelsville Bridge, PA/NJ Delaware River at Riegelsville Bridge, PA/NJ, River Mile 174.80
Parameter (Y) Definition of Existing Water Quality
Median
Lower
95%CI
Upper
95%CI
Flow-Relationships
Site specific regression equation.
Ammonia NH3-N (mg/L) * <0.05 <0.05 0.05
Chloride (mg/L) 17 15 19 Y = -0.00026948 Q + 19.644
Chlorophyll a (mg/m3) 2.42 1.80 3.60
Dissolved Oxygen (mg/L) mid-day * 8.80 8.20 9.05
Dissolved Oxygen Saturation (%) 97% 95% 98%
E. coli (colonies/100 ml) 40 20 80 Y = antilog (0.0000513 Q + 0.9973)
Enterococcus (colonies/100 ml) 80 52 110
Fecal coliform (colonies/100 ml) * 84 54 160 Y = antilog (0.00003636 Q + 1.5438)
Nitrate NO3-N (mg/L) * 1.17 1.02 1.23
Orthophosphate (mg/L) 0.04 <0.04 0.07
pH * 7.60 7.48 7.80
Specific Conductance (µS/cm) 183 155 197 Y = -0.00298102 Q + 207.26
Total Dissolved Solids (mg/L) 140 130 150 Y = -0.00168753 Q + 152.78
Total Kjeldahl Nitrogen (mg/L) 0.31 0.22 0.46
Total Nitrogen (mg/L) * 1.44 1.31 1.62
Total Phosphorus (mg/L) * 0.09 0.07 0.12
Total Suspended Solids (mg/L) * 4.5 3.5 6.5 Y = 0.00061523 Q + 0.2725
Turbidity (NTU) 2.7 2.1 3.5 Y = antilog (0.00002645 Q + 0.2252)
Alkalinity (mg/L) 42 36 48 Y = -0.0008322 Q + 50.44
Hardness (mg/L) 65 54 70 Y = -0.00121951 Q + 73.708
EWQ values represent data collected twice per month from May through September 2000-2004.
* = Dischargers may be required to evaluate this parameter for permit limits necessary to meet EWQ.
Implementation guidance should be consulted for discharge evaluations.
** = EWQ exceeds DRBC or state water quality criteria. Discharge evaluations should be conducted at criterion concentration.
EWQ established 2000-2004 by DRBC Corrections 2016:
None

Delaware River Basin Commission Page 233
1746 BCP Musconetcong River at River Road, NJ

Delaware River Basin Commission Page 234
1746 BCP Musconetcong River at River Road, NJ
Multiple NJ Counties: Warren, Sussex, Hunterdon and Morris
Site location Warren County, NJ. Latitude 40.5925 Longitude -75.18667 by GPS NAD83 decimal degrees.
USGS site 01457400, upstream USGS gage 01457100 Bloomsbury; NJDEP sites 01457400, 8983200070
Watershed Population: 2000 = 84,699 2010 = 89358 Change: +4,659 (+5.5%)
Drainage Area at site: 156 square miles, tributary to Delaware River Zone 1E
Site Specific EWQ defined by DRBC 2000-2004.
The Musconetcong River is a National Wild and Scenic designated river.
This watershed is tributary to the Lower Delaware Scenic and Recreational River (LDEL)
Tributary to DRBC Significant Resource Waters.
Nearest upstream Interstate Control Point: 1748 ICP Delaware River at Riegelsville
Nearest downstream Interstate Control Point: 1677 ICP Delaware River at Milford / Upper Black Eddy Bridge
Known dischargers within watershed: Many, undefined.
Watershed is 57.6% forested; urban land cover is 11.3%. Watershed was 48% glaciated, and is 25.4% underlain by
carbonate bedrock. Mean annual precipitation 49 inches. (http://water.usgs.gov/osw/streamstats/, accessed 2012).
Flow Statistics (USGS BaSE Model calculation from USGS Musconetcong River gage 01457100 at Bloomsbury, NJ):
Max Flow (CFS)
90% Flow (CFS)
75% Flow (CFS)
60% Flow (CFS)
50% Flow (CFS)
40% Flow (CFS)
25% Flow (CFS)
10% Flow (CFS)
Min Flow (CFS)
11,848 569 341 257 212 191 144 91.3 32.0
StreamStats Low-Flow Stream Statistics
M7D2Y (ft³/s) 88.0
M30D2Y (ft³/s) 98.5
M7D10Y (ft³/s) 59.6
M30D10Y (ft³/s) 65.0
M90D10Y (ft³/s) 77.8
StreamStats Mean/Baseflow Stream Statistics
QA (ft³/s) 302
QAH (ft³/s) 187
BF10YR (ft³/s) 152
BF25YR (ft³/s) 136
BF50YR (ft³/s) 128
StreamStats Peak-Flow Stream Statistics
PK2 (ft³/s) 4,130
PK5 (ft³/s) 6,770
PK10 (ft³/s) 8,920
PK50 (ft³/s) 14,800
PK100 (ft³/s) 17,700
PK500 (ft³/s) 26,000

Delaware River Basin Commission Page 235
Existing Water Quality: 1746 BCP Musconetcong River at River Road, NJ Musconetcong River, New Jersey, River Mile 174.60 – 0.15 Boundary Control Point is located at River Road (Rt. 627) bridge
Parameter (Y) Definition of Existing Water Quality
Median
Lower
95%CI
Upper
95%CI
Flow-Relationships
Site specific regression equation.
Ammonia NH3-N (mg/L) * 0.06 0.05 0.08
Chloride (mg/L) 43 42 45
Chlorophyll a (mg/m3) 3.20 2.56 3.71
Dissolved Oxygen (mg/L) mid-day * 9.10 8.90 9.60
Dissolved Oxygen Saturation (%) 99% 97% 100%
E. coli (colonies/100 ml) 125 70 240 Y = antilog (1.0008 (log Q) – 0.0526)
Enterococcus (colonies/100 ml) 210 ** 150 ** 360 **
Fecal coliform (colonies/100 ml) * 270 ** 190 400 **
Nitrate NO3-N (mg/L) * 2.09 1.85 2.30
Orthophosphate (mg/L) 0.02 0.02 0.03
pH * 7.90 7.80 8.00
Specific Conductance (µS/cm) 396 375 426 Y = -0.23045946 Q + 440.1906
Total Dissolved Solids (mg/L) 255 240 270 Y = -0.0954 Q + 272.5773
Total Kjeldahl Nitrogen (mg/L) 0.49 0.37 0.87
Total Nitrogen (mg/L) * 2.56 2.36 2.91
Total Phosphorus (mg/L) * 0.07 0.05 0.09
Total Suspended Solids (mg/L) * 7.0 5.5 11.0
Turbidity (NTU) 3.5 2.3 5.4 Y = antilog (0.86 (log Q) – 1.294)
Alkalinity (mg/L) 103 97 118 Y = -79.84 (log Q) + 298.41
Hardness (mg/L) 149 130 160 Y = -67.6003 (log Q) + 297.8314
EWQ values represent data collected twice per month from May through September 2000-2004.
* = Dischargers may be required to evaluate this parameter for permit limits necessary to meet EWQ.
Implementation guidance should be consulted for discharge evaluations.
** = EWQ exceeds DRBC or state water quality criteria. Discharge evaluations should be conducted at criterion concentration.
EWQ established 2000-2004 by DRBC Corrections 2016:
pH lower 95% CL should be 7.80. Listed in rules as 7.90.
Delaware River Basin Commission Page 236
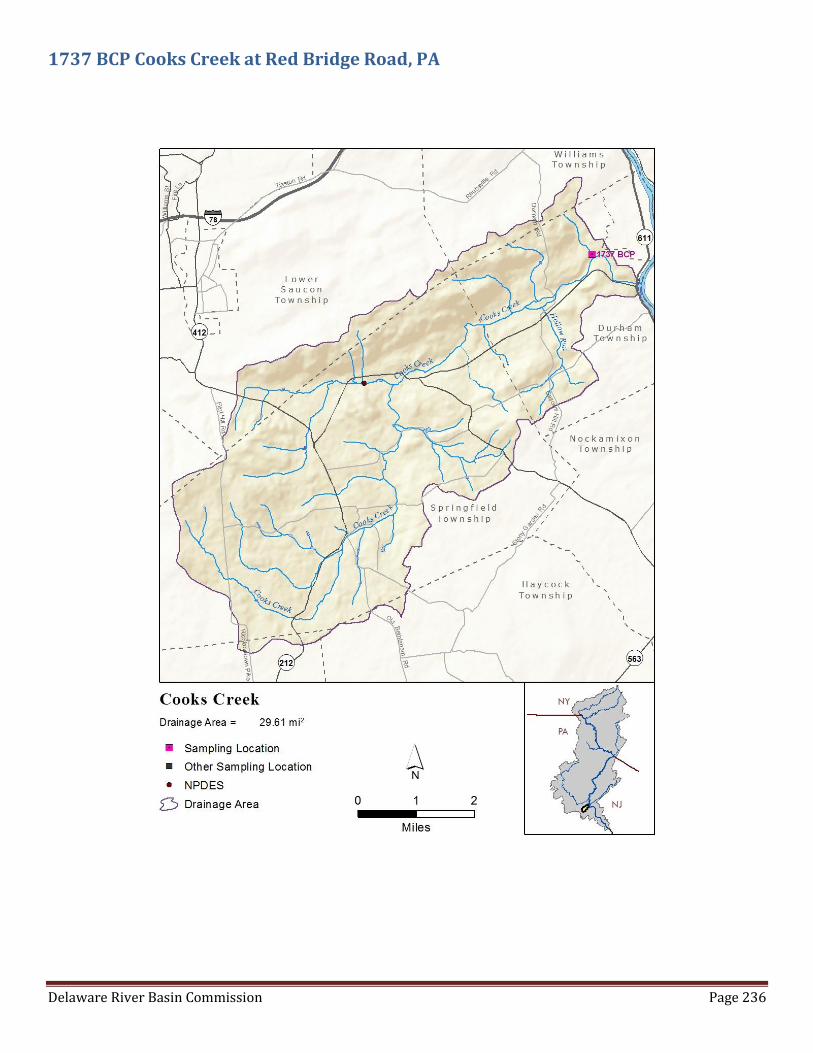
1737 BCP Cooks Creek at Red Bridge Road, PA
Delaware River Basin Commission Page 237
1737 BCP Cooks Creek at Red Bridge Road, PA
Bucks County and Northampton County, PA
Site location Bucks County, PA. Latitude 40.58737 Longitude -75.21157 by GPS NAD83 decimal degrees.
USGS Sites 01457800, 01457790; PADEP Site WQN0187
Watershed Population: 2000 = 4,744 2010 = 4,813 Change: +69 (+1.4%)
Watershed Drainage Area: 29.6 square miles, tributary to Delaware River Zone 1E
Drainage Area at site: 28.9 square miles
Site Specific EWQ defined by DRBC 2000-2004.
This watershed is tributary to the Lower Delaware Scenic and Recreational River (LDEL)
Tributary to DRBC Significant Resource Waters.
Nearest upstream Interstate Control Point: 1748 ICP Delaware River at Riegelsville
Nearest downstream Interstate Control Point: 1677 ICP Delaware River at Milford / Upper Black Eddy Bridge
Known dischargers within watershed: Few, undefined.
Watershed is 59.9% forested; urban land cover is 1.3%. Watershed was not glaciated, and is 35.5% underlain by
carbonate bedrock. Mean annual precipitation 45 inches. (http://water.usgs.gov/osw/streamstats/, accessed 2012).
Flow Statistics (USGS BaSE Model from nearby gage):
Max Flow (CFS)
90% Flow (CFS)
75% Flow (CFS)
60% Flow (CFS)
50% Flow (CFS)
40% Flow (CFS)
25% Flow (CFS)
10% Flow (CFS)
Min Flow (CFS)
2,268 80.3 47.8 34.9 28.3 26.4 17.5 9.65 3.12
StreamStats Low-Flow Stream Statistics
M7D2Y (ft³/s) 8.20
M30D2Y (ft³/s) 10.0
M7D10Y (ft³/s) 4.33
M30D10Y (ft³/s) 5.35
M90D10Y (ft³/s) 7.53
StreamStats Mean/Baseflow Stream Statistics
QA (ft³/s) 44.5
QAH (ft³/s) 24.1
BF10YR (ft³/s) 24.4
BF25YR (ft³/s) 21.6
BF50YR (ft³/s) 20.1
StreamStats Peak-Flow Stream Statistics
PK2 (ft³/s) 1,210
PK5 (ft³/s) 2,060
PK10 (ft³/s) 2,740
PK50 (ft³/s) 4,550
PK100 (ft³/s) 5,460
PK500 (ft³/s) 7,960

Delaware River Basin Commission Page 238
Existing Water Quality: 1737 BCP Cooks Creek at Red Bridge Road, PA Cooks Creek, Pennsylvania, River Mile 173.70 – 1.06 Boundary Control Point is located at Red Bridge Road bridge.
Parameter (Y) Definition of Existing Water Quality
Median
Lower
95%CI
Upper
95%CI
Flow-Relationships
Site specific regression equation.
Ammonia NH3-N (mg/L) * <0.05 <0.05 <0.05
Chloride (mg/L) 9.7 8.9 10.9
Chlorophyll a (mg/m3) n/a n/a n/a n/a
Dissolved Oxygen (mg/L) mid-day * 9.93 9.70 10.30
Dissolved Oxygen Saturation (%) 102% 98% 108%
E. coli (colonies/100 ml) 110 80 200 Y = antilog (1.1307 (log Q) + 0.6483)
Enterococcus (colonies/100 ml) 380 250 520
Fecal coliform (colonies/100 ml) * 210 ** 140 360 **
Nitrate NO3-N (mg/L) * 1.80 1.70 1.90
Orthophosphate (mg/L) 0.01 0.01 0.02
pH * 8.04 7.94 8.19
Specific Conductance (µS/cm) 258 244 278 Y = -0.94618228 Q + 290.6508
Total Dissolved Solids (mg/L) 180 161 194 Y = -0.7015 Q + 197.6165
Total Kjeldahl Nitrogen (mg/L) 0.21 0.13 0.34
Total Nitrogen (mg/L) * 2.01 1.95 2.32
Total Phosphorus (mg/L) * 0.04 0.03 0.06
Total Suspended Solids (mg/L) * 2.5 2.0 4.0
Turbidity (NTU) 1.5 1.1 2.3 Y = antilog (0.888 (log Q) – 0.981)
Alkalinity (mg/L) 98 89 104 Y = -50.25 (log Q) + 168.52
Hardness (mg/L) 120 110 125 Y = -40.8625 (log Q) + 175.8628
EWQ values represent data collected twice per month from May through September 2000-2004.
* = Dischargers may be required to evaluate this parameter for permit limits necessary to meet EWQ.
Implementation guidance should be consulted for discharge evaluations.
** = EWQ exceeds DRBC or state water quality criteria. Discharge evaluations should be conducted at criterion concentration.
EWQ established 2000-2004 by DRBC Corrections 2016:
None
Delaware River Basin Commission Page 239
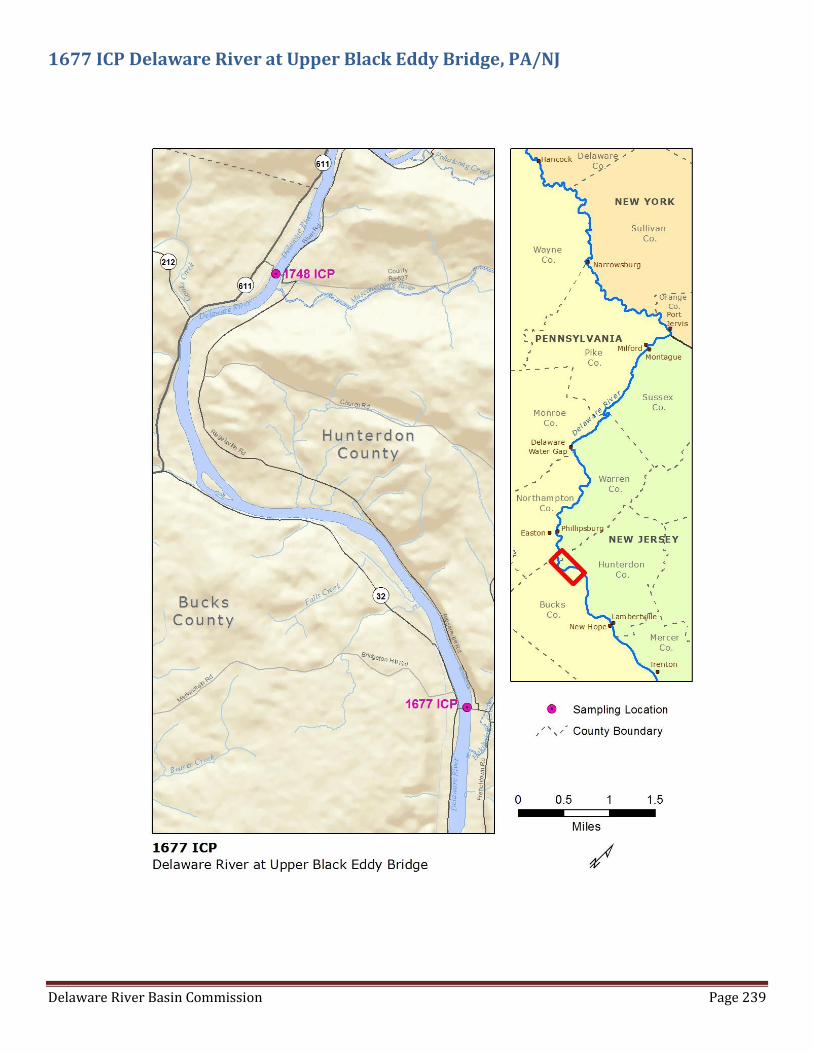
1677 ICP Delaware River at Upper Black Eddy Bridge, PA/NJ
Delaware River Basin Commission Page 240
1677 ICP Delaware River at Upper Black Eddy Bridge, PA/NJ Bucks County, PA and Hunterdon County, NJ
Latitude 40.566667 Longitude -75.098611 by GPS NAD83 decimal degrees.
USGS site 01458000, no PADEP or NJDEP sites at bridge.
Watershed Population figures were not calculated for main-stem Delaware River sites.
Drainage Area: 6,381 square miles, Delaware River Zone 1E
Site Specific EWQ defined 2000-2004 by DRBC.
This site is located in the Lower Delaware Scenic and Recreational River.
Classified by DRBC as Significant Resource Waters
Nearest upstream Interstate Control Point: 1748 ICP Delaware River at Riegelsville
Nearest downstream Interstate Control Point: 1554 ICP Delaware River at Bulls Island Foot Bridge
Known dischargers to upstream reach: Undefined
Tributaries to upstream reach: Major tributaries 1746 BCP Musconetcong River, NJ; 1737 BCP Cooks Creek, PA; small
tributaries 173.5 Rodges Run, PA; 171.8 Gallows Run, PA; 170.3 Falls Creek, PA.
No Stream Stats web site data available because drainage area is too large for web site retrieval.
Flow Statistics Associated with Water Quality Samples (calculated by drainage area weighting from USGS gage data):
Max Flow (CFS)
90% Flow (CFS)
75% Flow (CFS)
60% Flow (CFS)
50% Flow (CFS)
40% Flow (CFS)
25% Flow (CFS)
10% Flow (CFS)
Min Flow (CFS)
216,465 24,282 14,400 10,070 8,226 6,597 4,668 3,228 1,788

Delaware River Basin Commission Page 241
Existing Water Quality: 1677 ICP Delaware River at Upper Black Eddy, PA/NJ Delaware River at Milford-U. Black Eddy Bridge, NJ/PA, River Mile 167.70
Parameter (Y) Definition of Existing Water Quality
Median
Lower
95%CI
Upper
95%CI
Flow-Relationships
Site specific regression equation.
Ammonia NH3-N (mg/L) * <0.05 <0.05 0.05
Chloride (mg/L) 17 15 20 Y = -0.00027835 Q + 20.221
Chlorophyll a (mg/m3) 1.80 0.90 2.70
Dissolved Oxygen (mg/L) mid-day * 8.74 8.20 8.96
Dissolved Oxygen Saturation (%) 96% 95% 97%
E. coli (colonies/100 ml) 28 15 60 Y = antilog (0.00004814 Q + 0.905)
Enterococcus (colonies/100 ml) 45 28 98
Fecal coliform (colonies/100 ml) * 60 40 120 Y = antilog (0.00004177 Q + 1.2688)
Nitrate NO3-N (mg/L) * 1.09 0.96 1.25
Orthophosphate (mg/L) 0.04 0.04 0.07
pH * 7.58 7.44 7.80
Specific Conductance (µS/cm) 189 159 203 Y = -0.00313416 Q + 212.42
Total Dissolved Solids (mg/L) 149 130 160 Y = -0.00270722 Q + 173.806
Total Kjeldahl Nitrogen (mg/L) 0.34 0.26 0.46
Total Nitrogen (mg/L) * 1.48 1.23 1.68
Total Phosphorus (mg/L) * 0.09 0.07 0.12
Total Suspended Solids (mg/L) * 6.0 4.5 7.0 Y = 0.0006379 Q + 0.3729
Turbidity (NTU) 2.9 2.2 3.8 Y = antilog (0.00002693 Q + 0.1674)
Alkalinity (mg/L) 44 37 49 Y = -0.00087657 Q + 51.613
Hardness (mg/L) 67 55 73 Y = -0.0011369 Q + 74.63
EWQ values represent data collected twice per month from May through September 2000-2004.
* = Dischargers may be required to evaluate this parameter for permit limits necessary to meet EWQ.
Implementation guidance should be consulted for discharge evaluations.
** = EWQ exceeds DRBC or state water quality criteria. Discharge evaluations should be conducted at criterion concentration.
Site Specific EWQ defined 2000-2004 by DRBC.
Corrections 2016:
None

Delaware River Basin Commission Page 242
1672 BCP Hakihokake Creek at Bridge St., Milford, NJ

Delaware River Basin Commission Page 243
1672 BCP Hakihokake Creek at Bridge St., Milford, NJ
Hunterdon County, NJ. Latitude 40.568444 Longitude -75.095167 by GPS NAD83 decimal degrees.
USGS/NJDEP site 01458100; NJDEP BA200: NJDEP AN0077
Watershed Population: 2000 = 4,262 2010 = 4,325 Change: +63 (+1.5%)
Watershed Drainage Area: 17.6 square miles, tributary to Delaware River Zone 1E
Site Specific EWQ definition underway by DRBC 2014-present; with additional USGS/NJDEP available data.
This watershed is tributary to the Lower Delaware Scenic and Recreational River (LDEL)
Tributary to DRBC Significant Resource Waters.
Nearest upstream Interstate Control Point: 1677 ICP Delaware River at Milford / Upper Black Eddy Bridge
Nearest downstream Interstate Control Point: 1554 ICP Delaware River at Bulls Island Foot Bridge
Known dischargers within watershed: Few, undefined.
Watershed is 53.7% forested; urban land cover is 5.8%. Watershed was not glaciated, and is 1.5% underlain by
carbonate bedrock. Mean annual precipitation 46.9 inches. (http://water.usgs.gov/osw/streamstats/, accessed 2014).
Flow Statistics (USGS BaSE Model):
Max Flow (CFS)
90% Flow (CFS)
75% Flow (CFS)
60% Flow (CFS)
50% Flow (CFS)
40% Flow (CFS)
25% Flow (CFS)
10% Flow (CFS)
Min Flow (CFS)
1,909 56.9 30.8 22.5 18.5 18.2 12.8 7.35 2.91
StreamStats Low-Flow Stream Statistics
M7D2Y (ft³/s) 6.89
M30D2Y (ft³/s) 8.10
M7D10Y (ft³/s) 3.91
M30D10Y (ft³/s) 4.63
M90D10Y (ft³/s) 5.94
StreamStats Mean/Baseflow Stream Statistics
QA (ft³/s) 28.5
QAH (ft³/s) 8.84
BF10YR (ft³/s) 11.9
BF25YR (ft³/s) 10.6
BF50YR (ft³/s) 9.79
StreamStats Peak-Flow Stream Statistics
PK2 (ft³/s) 763
PK5 (ft³/s) 1,310
PK10 (ft³/s) 1,750
PK50 (ft³/s) 2,930
PK100 (ft³/s) 3,530
PK500 (ft³/s) 5,170
Delaware River Basin Commission Page 244
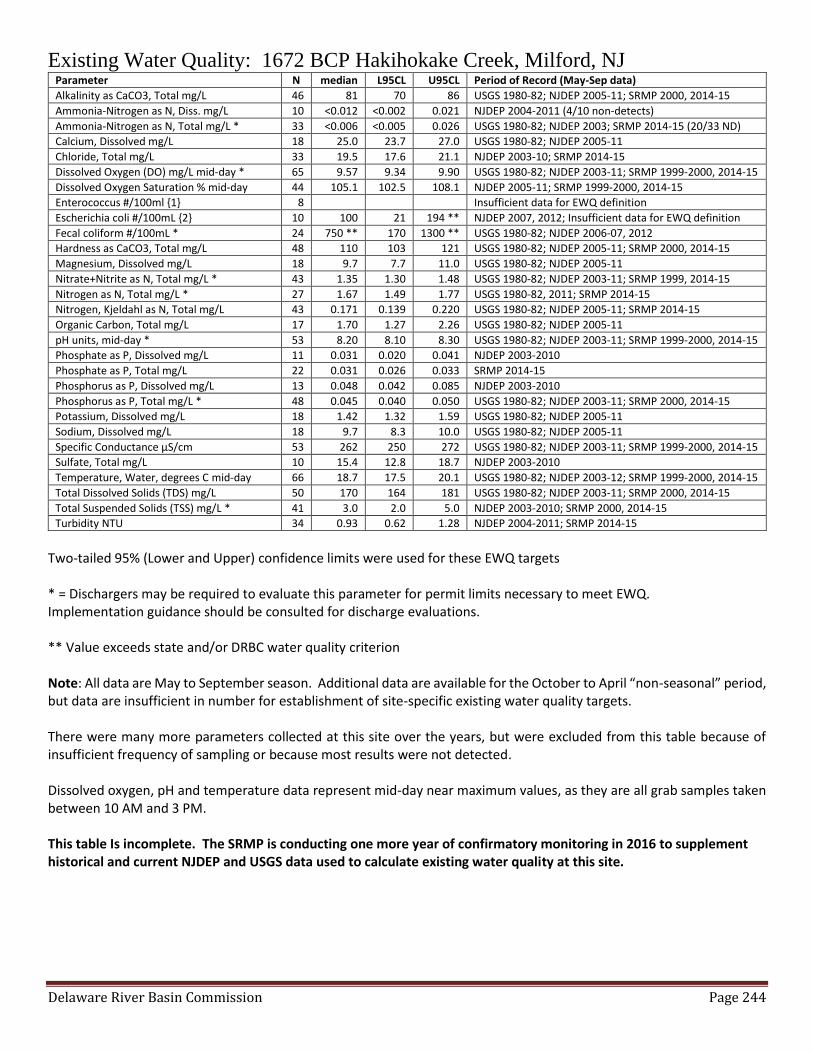
Existing Water Quality: 1672 BCP Hakihokake Creek, Milford, NJ Parameter N median L95CL U95CL Period of Record (May-Sep data)
Alkalinity as CaCO3, Total mg/L 46 81 70 86 USGS 1980-82; NJDEP 2005-11; SRMP 2000, 2014-15
Ammonia-Nitrogen as N, Diss. mg/L 10 <0.012 <0.002 0.021 NJDEP 2004-2011 (4/10 non-detects)
Ammonia-Nitrogen as N, Total mg/L * 33 <0.006 <0.005 0.026 USGS 1980-82; NJDEP 2003; SRMP 2014-15 (20/33 ND)
Calcium, Dissolved mg/L 18 25.0 23.7 27.0 USGS 1980-82; NJDEP 2005-11
Chloride, Total mg/L 33 19.5 17.6 21.1 NJDEP 2003-10; SRMP 2014-15
Dissolved Oxygen (DO) mg/L mid-day * 65 9.57 9.34 9.90 USGS 1980-82; NJDEP 2003-11; SRMP 1999-2000, 2014-15
Dissolved Oxygen Saturation % mid-day 44 105.1 102.5 108.1 NJDEP 2005-11; SRMP 1999-2000, 2014-15
Enterococcus #/100ml {1} 8 Insufficient data for EWQ definition
Escherichia coli #/100mL {2} 10 100 21 194 ** NJDEP 2007, 2012; Insufficient data for EWQ definition
Fecal coliform #/100mL * 24 750 ** 170 1300 ** USGS 1980-82; NJDEP 2006-07, 2012
Hardness as CaCO3, Total mg/L 48 110 103 121 USGS 1980-82; NJDEP 2005-11; SRMP 2000, 2014-15
Magnesium, Dissolved mg/L 18 9.7 7.7 11.0 USGS 1980-82; NJDEP 2005-11
Nitrate+Nitrite as N, Total mg/L * 43 1.35 1.30 1.48 USGS 1980-82; NJDEP 2003-11; SRMP 1999, 2014-15
Nitrogen as N, Total mg/L * 27 1.67 1.49 1.77 USGS 1980-82, 2011; SRMP 2014-15
Nitrogen, Kjeldahl as N, Total mg/L 43 0.171 0.139 0.220 USGS 1980-82; NJDEP 2005-11; SRMP 2014-15
Organic Carbon, Total mg/L 17 1.70 1.27 2.26 USGS 1980-82; NJDEP 2005-11
pH units, mid-day * 53 8.20 8.10 8.30 USGS 1980-82; NJDEP 2003-11; SRMP 1999-2000, 2014-15
Phosphate as P, Dissolved mg/L 11 0.031 0.020 0.041 NJDEP 2003-2010
Phosphate as P, Total mg/L 22 0.031 0.026 0.033 SRMP 2014-15
Phosphorus as P, Dissolved mg/L 13 0.048 0.042 0.085 NJDEP 2003-2010
Phosphorus as P, Total mg/L * 48 0.045 0.040 0.050 USGS 1980-82; NJDEP 2003-11; SRMP 2000, 2014-15
Potassium, Dissolved mg/L 18 1.42 1.32 1.59 USGS 1980-82; NJDEP 2005-11
Sodium, Dissolved mg/L 18 9.7 8.3 10.0 USGS 1980-82; NJDEP 2005-11
Specific Conductance µS/cm 53 262 250 272 USGS 1980-82; NJDEP 2003-11; SRMP 1999-2000, 2014-15
Sulfate, Total mg/L 10 15.4 12.8 18.7 NJDEP 2003-2010
Temperature, Water, degrees C mid-day 66 18.7 17.5 20.1 USGS 1980-82; NJDEP 2003-12; SRMP 1999-2000, 2014-15
Total Dissolved Solids (TDS) mg/L 50 170 164 181 USGS 1980-82; NJDEP 2003-11; SRMP 2000, 2014-15
Total Suspended Solids (TSS) mg/L * 41 3.0 2.0 5.0 NJDEP 2003-2010; SRMP 2000, 2014-15
Turbidity NTU 34 0.93 0.62 1.28 NJDEP 2004-2011; SRMP 2014-15
Two-tailed 95% (Lower and Upper) confidence limits were used for these EWQ targets * = Dischargers may be required to evaluate this parameter for permit limits necessary to meet EWQ. Implementation guidance should be consulted for discharge evaluations. ** Value exceeds state and/or DRBC water quality criterion Note: All data are May to September season. Additional data are available for the October to April “non-seasonal” period, but data are insufficient in number for establishment of site-specific existing water quality targets. There were many more parameters collected at this site over the years, but were excluded from this table because of insufficient frequency of sampling or because most results were not detected. Dissolved oxygen, pH and temperature data represent mid-day near maximum values, as they are all grab samples taken between 10 AM and 3 PM. This table Is incomplete. The SRMP is conducting one more year of confirmatory monitoring in 2016 to supplement historical and current NJDEP and USGS data used to calculate existing water quality at this site.
Delaware River Basin Commission Page 245
1641 BCP Nishisakawick Creek at Kingwood Ave., Frenchtown, NJ
Delaware River Basin Commission Page 246
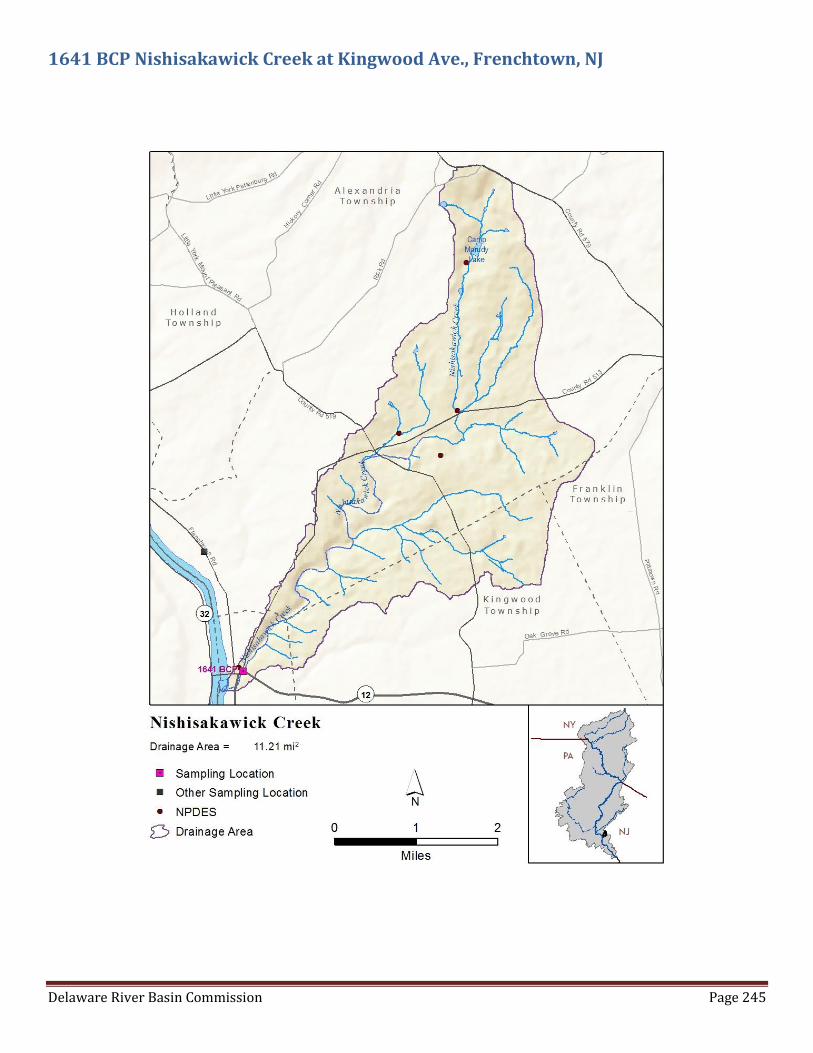
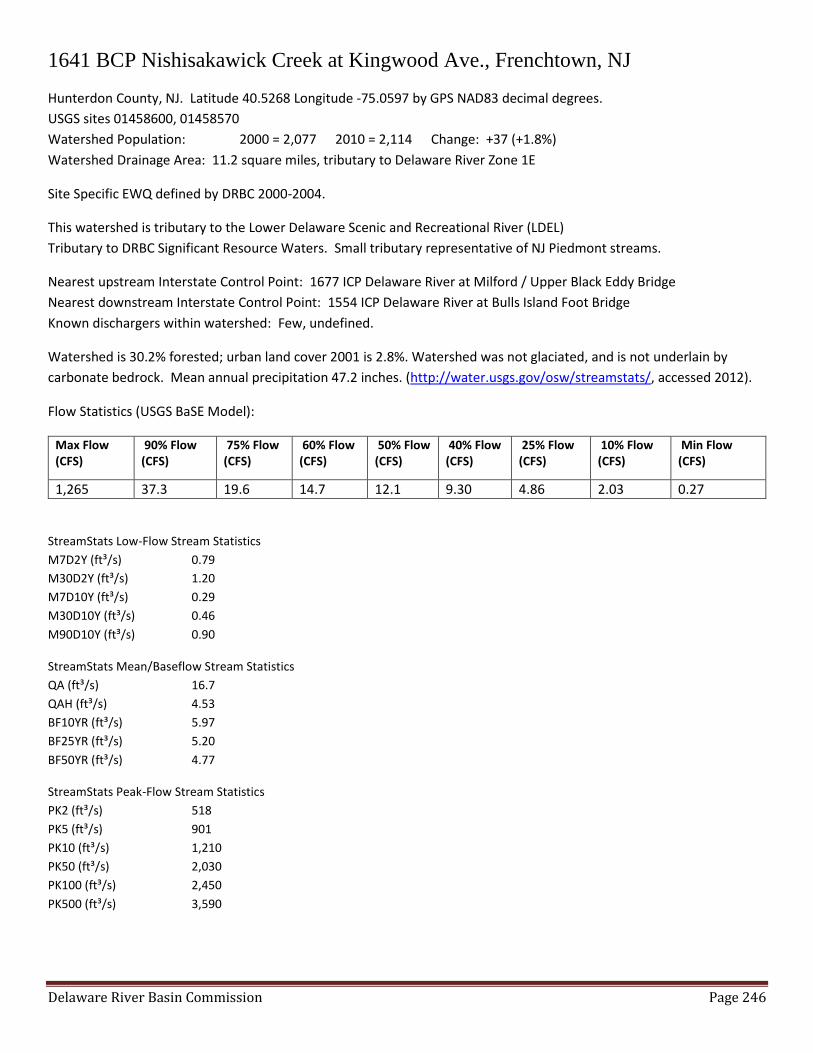
1641 BCP Nishisakawick Creek at Kingwood Ave., Frenchtown, NJ
Hunterdon County, NJ. Latitude 40.5268 Longitude -75.0597 by GPS NAD83 decimal degrees.
USGS sites 01458600, 01458570
Watershed Population: 2000 = 2,077 2010 = 2,114 Change: +37 (+1.8%)
Watershed Drainage Area: 11.2 square miles, tributary to Delaware River Zone 1E
Site Specific EWQ defined by DRBC 2000-2004.
This watershed is tributary to the Lower Delaware Scenic and Recreational River (LDEL)
Tributary to DRBC Significant Resource Waters. Small tributary representative of NJ Piedmont streams.
Nearest upstream Interstate Control Point: 1677 ICP Delaware River at Milford / Upper Black Eddy Bridge
Nearest downstream Interstate Control Point: 1554 ICP Delaware River at Bulls Island Foot Bridge
Known dischargers within watershed: Few, undefined.
Watershed is 30.2% forested; urban land cover 2001 is 2.8%. Watershed was not glaciated, and is not underlain by
carbonate bedrock. Mean annual precipitation 47.2 inches. (http://water.usgs.gov/osw/streamstats/, accessed 2012).
Flow Statistics (USGS BaSE Model):
Max Flow (CFS)
90% Flow (CFS)
75% Flow (CFS)
60% Flow (CFS)
50% Flow (CFS)
40% Flow (CFS)
25% Flow (CFS)
10% Flow (CFS)
Min Flow (CFS)
1,265 37.3 19.6 14.7 12.1 9.30 4.86 2.03 0.27
StreamStats Low-Flow Stream Statistics
M7D2Y (ft³/s) 0.79
M30D2Y (ft³/s) 1.20
M7D10Y (ft³/s) 0.29
M30D10Y (ft³/s) 0.46
M90D10Y (ft³/s) 0.90
StreamStats Mean/Baseflow Stream Statistics
QA (ft³/s) 16.7
QAH (ft³/s) 4.53
BF10YR (ft³/s) 5.97
BF25YR (ft³/s) 5.20
BF50YR (ft³/s) 4.77
StreamStats Peak-Flow Stream Statistics
PK2 (ft³/s) 518
PK5 (ft³/s) 901
PK10 (ft³/s) 1,210
PK50 (ft³/s) 2,030
PK100 (ft³/s) 2,450
PK500 (ft³/s) 3,590
Delaware River Basin Commission Page 247
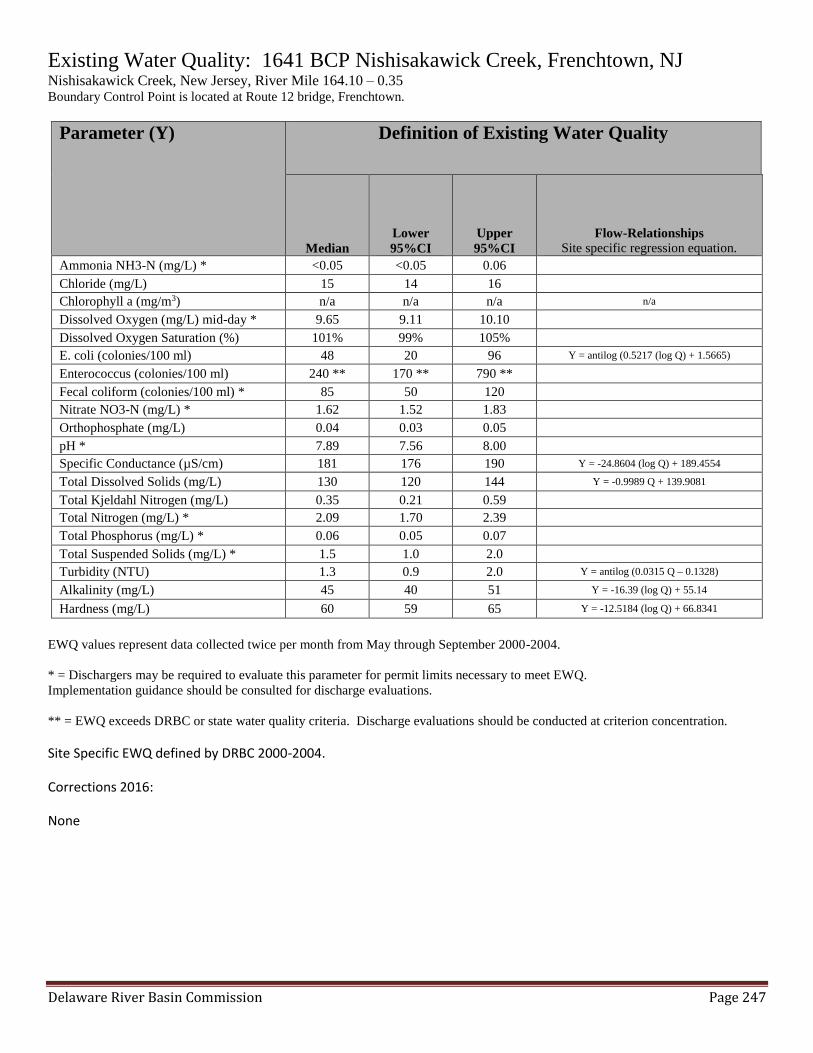
Existing Water Quality: 1641 BCP Nishisakawick Creek, Frenchtown, NJ
Nishisakawick Creek, New Jersey, River Mile 164.10 – 0.35 Boundary Control Point is located at Route 12 bridge, Frenchtown.
Parameter (Y) Definition of Existing Water Quality
Median
Lower
95%CI
Upper
95%CI
Flow-Relationships
Site specific regression equation.
Ammonia NH3-N (mg/L) * <0.05 <0.05 0.06
Chloride (mg/L) 15 14 16
Chlorophyll a (mg/m3) n/a n/a n/a n/a
Dissolved Oxygen (mg/L) mid-day * 9.65 9.11 10.10
Dissolved Oxygen Saturation (%) 101% 99% 105%
E. coli (colonies/100 ml) 48 20 96 Y = antilog (0.5217 (log Q) + 1.5665)
Enterococcus (colonies/100 ml) 240 ** 170 ** 790 **
Fecal coliform (colonies/100 ml) * 85 50 120
Nitrate NO3-N (mg/L) * 1.62 1.52 1.83
Orthophosphate (mg/L) 0.04 0.03 0.05
pH * 7.89 7.56 8.00
Specific Conductance (µS/cm) 181 176 190 Y = -24.8604 (log Q) + 189.4554
Total Dissolved Solids (mg/L) 130 120 144 Y = -0.9989 Q + 139.9081
Total Kjeldahl Nitrogen (mg/L) 0.35 0.21 0.59
Total Nitrogen (mg/L) * 2.09 1.70 2.39
Total Phosphorus (mg/L) * 0.06 0.05 0.07
Total Suspended Solids (mg/L) * 1.5 1.0 2.0
Turbidity (NTU) 1.3 0.9 2.0 Y = antilog (0.0315 Q – 0.1328)
Alkalinity (mg/L) 45 40 51 Y = -16.39 (log Q) + 55.14
Hardness (mg/L) 60 59 65 Y = -12.5184 (log Q) + 66.8341
EWQ values represent data collected twice per month from May through September 2000-2004.
* = Dischargers may be required to evaluate this parameter for permit limits necessary to meet EWQ.
Implementation guidance should be consulted for discharge evaluations.
** = EWQ exceeds DRBC or state water quality criteria. Discharge evaluations should be conducted at criterion concentration.
Site Specific EWQ defined by DRBC 2000-2004.
Corrections 2016:
None

Delaware River Basin Commission Page 248
1616 BCP Tinicum Creek above Rt. 32, PA

Delaware River Basin Commission Page 249
1616 BCP Tinicum Creek above Rt. 32, PA
Bucks County, PA. Latitude 40.4857 Longitude -75.0725 by GPS NAD83 decimal degrees.
USGS Sites 01458920. 01458900 nearby
Watershed Population: 2000 = 3,297 2010 = 3,103 Change: -194 (-5.9%)
Drainage Area at site: 24 square miles, tributary to Delaware River Zone 1E
Site Specific EWQ defined by DRBC 2000-2004.
Tinicum Creek is a designated national Wild and Scenic River.
This watershed is tributary to the Lower Delaware Scenic and Recreational River (LDEL)
Tributary to DRBC Significant Resource Waters.
Nearest upstream Interstate Control Point: 1677 ICP Delaware River at Milford / Upper Black Eddy Bridge
Nearest downstream Interstate Control Point: 1554 ICP Delaware River at Bulls Island Foot Bridge
Known dischargers within watershed: Few, undefined.
Watershed is 76.8% forested; urban land cover is 0.8%. Watershed was not glaciated, and is not underlain by carbonate
bedrock. Mean annual precipitation 45.1 inches. (http://water.usgs.gov/osw/streamstats/, accessed 2012).
Flow Statistics (USGS BaSE Model):
Max Flow (CFS)
90% Flow (CFS)
75% Flow (CFS)
60% Flow (CFS)
50% Flow (CFS)
40% Flow (CFS)
25% Flow (CFS)
10% Flow (CFS)
Min Flow (CFS)
2,594 75.1 35.9 28.2 23.0 18.3 9.70 4.35 0.58
StreamStats Low-Flow Stream Statistics
M7D2Y (ft³/s) 3.82
M30D2Y (ft³/s) 5.07
M7D10Y (ft³/s) 1.76
M30D10Y (ft³/s) 2.39
M90D10Y (ft³/s) 3.78
StreamStats Mean/Baseflow Stream Statistics
QA (ft³/s) 36.8
QAH (ft³/s) 10.9
BF10YR (ft³/s) 17.2
BF25YR (ft³/s) 15.3
BF50YR (ft³/s) 14.3
StreamStats Peak-Flow Stream Statistics
PK2 (ft³/s) 1,010
PK5 (ft³/s) 1,730
PK10 (ft³/s) 2,300
PK50 (ft³/s) 3,830
PK100 (ft³/s) 4,600
PK500 (ft³/s) 6,710
Delaware River Basin Commission Page 250
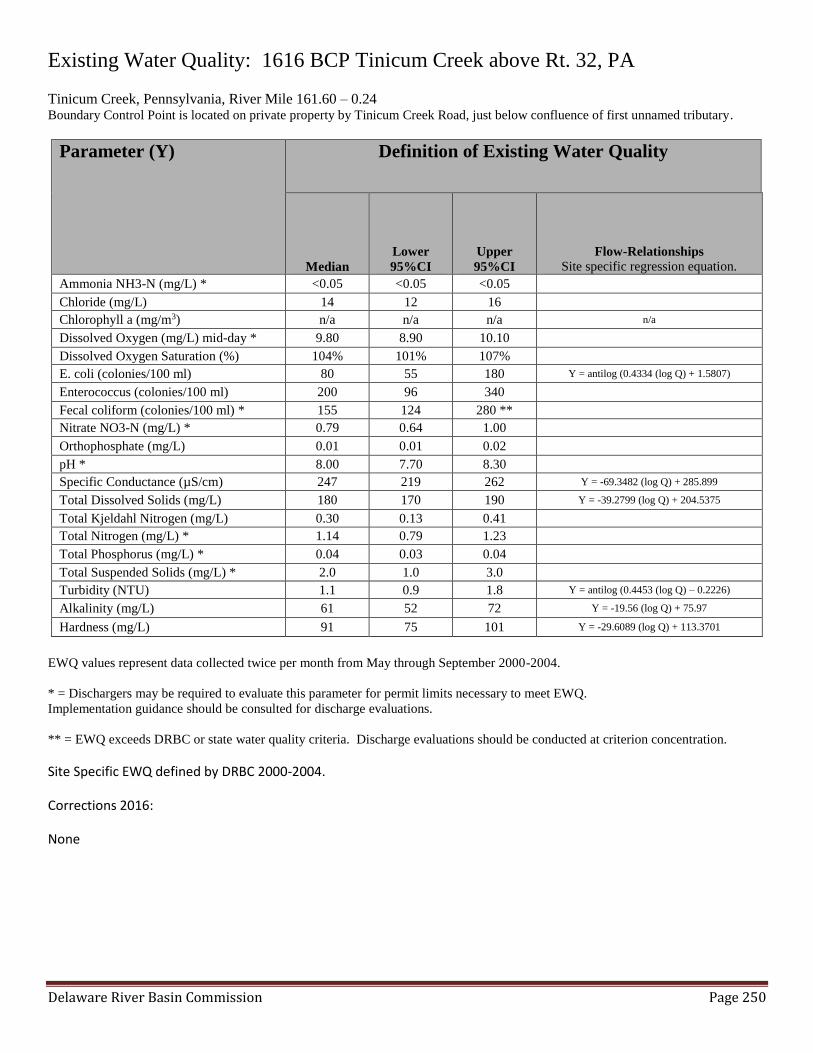
Existing Water Quality: 1616 BCP Tinicum Creek above Rt. 32, PA Tinicum Creek, Pennsylvania, River Mile 161.60 – 0.24 Boundary Control Point is located on private property by Tinicum Creek Road, just below confluence of first unnamed tributary.
Parameter (Y) Definition of Existing Water Quality
Median
Lower
95%CI
Upper
95%CI
Flow-Relationships
Site specific regression equation.
Ammonia NH3-N (mg/L) * <0.05 <0.05 <0.05
Chloride (mg/L) 14 12 16
Chlorophyll a (mg/m3) n/a n/a n/a n/a
Dissolved Oxygen (mg/L) mid-day * 9.80 8.90 10.10
Dissolved Oxygen Saturation (%) 104% 101% 107%
E. coli (colonies/100 ml) 80 55 180 Y = antilog (0.4334 (log Q) + 1.5807)
Enterococcus (colonies/100 ml) 200 96 340
Fecal coliform (colonies/100 ml) * 155 124 280 **
Nitrate NO3-N (mg/L) * 0.79 0.64 1.00
Orthophosphate (mg/L) 0.01 0.01 0.02
pH * 8.00 7.70 8.30
Specific Conductance (µS/cm) 247 219 262 Y = -69.3482 (log Q) + 285.899
Total Dissolved Solids (mg/L) 180 170 190 Y = -39.2799 (log Q) + 204.5375
Total Kjeldahl Nitrogen (mg/L) 0.30 0.13 0.41
Total Nitrogen (mg/L) * 1.14 0.79 1.23
Total Phosphorus (mg/L) * 0.04 0.03 0.04
Total Suspended Solids (mg/L) * 2.0 1.0 3.0
Turbidity (NTU) 1.1 0.9 1.8 Y = antilog (0.4453 (log Q) – 0.2226)
Alkalinity (mg/L) 61 52 72 Y = -19.56 (log Q) + 75.97
Hardness (mg/L) 91 75 101 Y = -29.6089 (log Q) + 113.3701
EWQ values represent data collected twice per month from May through September 2000-2004.
* = Dischargers may be required to evaluate this parameter for permit limits necessary to meet EWQ.
Implementation guidance should be consulted for discharge evaluations.
** = EWQ exceeds DRBC or state water quality criteria. Discharge evaluations should be conducted at criterion concentration.
Site Specific EWQ defined by DRBC 2000-2004.
Corrections 2016:
None
Delaware River Basin Commission Page 251
1570 BCP Tohickon Creek at Aqueduct below Rt. 32, PA

Delaware River Basin Commission Page 252
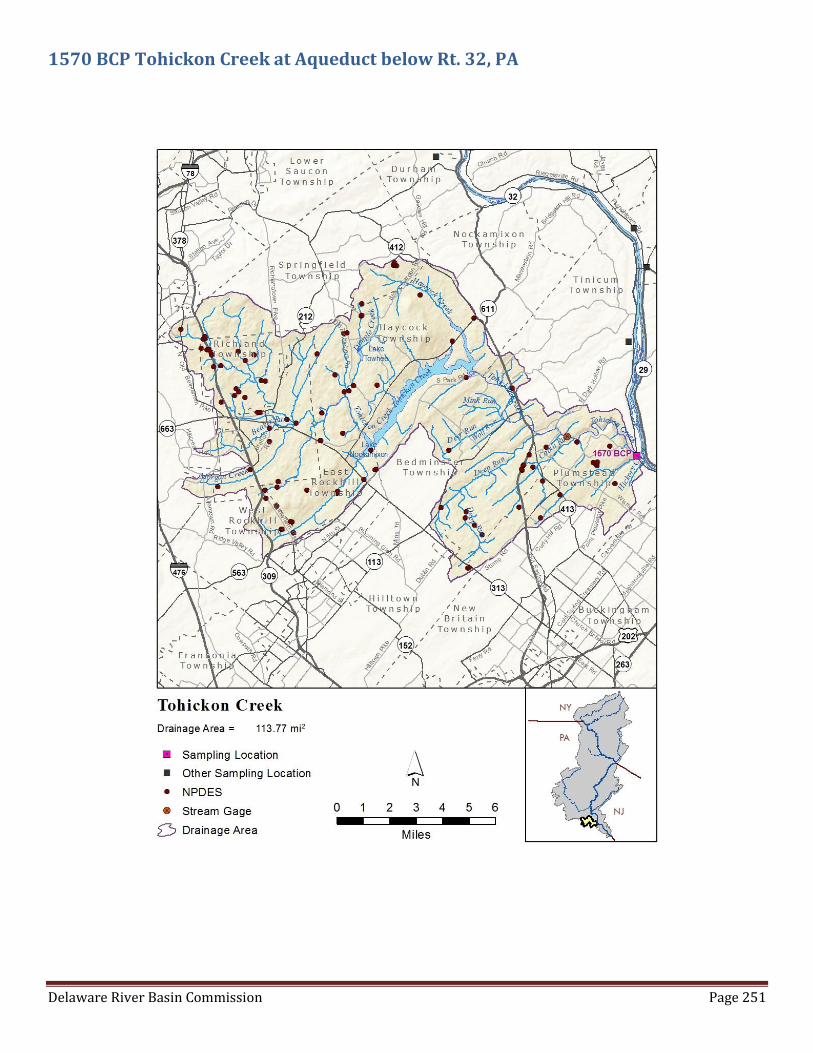
1570 BCP Tohickon Creek at Aqueduct below Rt. 32, PA
Bucks County, PA. Latitude 40.42306 Longitude -75.06667 by GPS NAD83 decimal degrees.
USGS sites 01459500 Pipersville gage, 01460000 water quality site near BCP
Watershed Population: 2000 = 38,249 2010 = 42,600 Change: +4,351 (+11.4%)
Drainage Area: 113.9 square miles, tributary to Delaware River Zone 1E
Site Specific EWQ defined by DRBC 2000-2004.
The lower Tohickon Creek is a designated national Wild and Scenic River.
This watershed is tributary to the Lower Delaware Scenic and Recreational River (LDEL)
Tributary to DRBC Significant Resource Waters.
Nearest upstream Interstate Control Point: 1677 ICP Delaware River at Milford / Upper Black Eddy Bridge
Nearest downstream Interstate Control Point: 1554 ICP Delaware River at Bulls Island Foot Bridge
Known dischargers within watershed: Many, undefined. Nockamixon Reservoir controls flow.
Watershed is 57.3% forested; urban land cover is 4.4%. Watershed was not glaciated, and is not underlain by carbonate
bedrock. Mean annual precipitation 45 inches. (http://water.usgs.gov/osw/streamstats/, accessed 2012).
Flow Statistics (USGS BaSE Model estimates based on USGS Tohickon Creek gage 01459500 at Pipersville, PA):
Max Flow (CFS)
90% Flow (CFS)
75% Flow (CFS)
60% Flow (CFS)
50% Flow (CFS)
40% Flow (CFS)
25% Flow (CFS)
10% Flow (CFS)
Min Flow (CFS)
7,875 450 159 141 52.0 85.1 17.3 5.77 0.69
StreamStats Low-Flow Stream Statistics
M7D2Y (ft³/s) 8.05
M30D2Y (ft³/s) 12.3
M7D10Y (ft³/s) 3.16
M30D10Y (ft³/s) 4.93
M90D10Y (ft³/s) 10.5
StreamStats Mean/Baseflow Stream Statistics
QA (ft³/s) 174
QAH (ft³/s) 53.5
BF10YR (ft³/s) 70.2
BF25YR (ft³/s) 62.2
BF50YR (ft³/s) 57.6
StreamStats Peak-Flow Stream Statistics
PK2 (ft³/s) 3,480
PK5 (ft³/s) 5,740
PK10 (ft³/s) 7,560
PK50 (ft³/s) 12,500
PK100 (ft³/s) 14,900
PK500 (ft³/s) 21,800

Delaware River Basin Commission Page 253
Existing Water Quality: 1570 BCP Tohickon Creek at Aqueduct below Rt. 32, PA Tohickon Creek, Pennsylvania, River Mile 157.00 – 0.19 Boundary Control Point is located at the Delaware Canal Aqueduct crossing in Point Pleasant.
Parameter (Y) Definition of Existing Water Quality
Median
Lower
95%CI
Upper
95%CI
Flow-Relationships
Site specific regression equation.
Ammonia NH3-N (mg/L) * <0.05 <0.05 <0.05
Chloride (mg/L) 27 25 29 Y = -4.6046 (log Q) + 34.3562
Chlorophyll a (mg/m3) 2.14 1.07 3.20
Dissolved Oxygen (mg/L) mid-day * 9.06 8.60 9.20
Dissolved Oxygen Saturation (%) 100% 98% 103%
E. coli (colonies/100 ml) 38 20 60 Y = antilog (0.8609 (log Q) + 0.2319)
Enterococcus (colonies/100 ml) 540 250 980
Fecal coliform (colonies/100 ml) * 90 60 170 Y = antilog (0.6939 (log Q) + 0.9399)
Nitrate NO3-N (mg/L) * 0.63 0.52 0.72
Orthophosphate (mg/L) 0.015 0.01 0.02
pH * 8.00 7.80 8.20
Specific Conductance (µS/cm) 218 212 226 Y = -27.1873 (log Q) + 261.345
Total Dissolved Solids (mg/L) 162 150 170 Y = -27.494 (log Q) + 204.9618
Total Kjeldahl Nitrogen (mg/L) 0.37 0.34 0.49
Total Nitrogen (mg/L) * 1.03 0.87 1.16
Total Phosphorus (mg/L) * 0.04 0.04 0.05
Total Suspended Solids (mg/L) * 2.0 1.0 2.5
Turbidity (NTU) 1.3 0.9 2.0 Y = antilog (0.5292 (log Q) – 0.6216)
Alkalinity (mg/L) 46 40 49 Y = -8.96 (log Q) + 60
Hardness (mg/L) 64 62 68 Y = -10.6687 (log Q) + 81.5734
EWQ values represent data collected twice per month from May through September 2000-2004.
* = Dischargers may be required to evaluate this parameter for permit limits necessary to meet EWQ.
Implementation guidance should be consulted for discharge evaluations.
** = EWQ exceeds DRBC or state water quality criteria. Discharge evaluations should be conducted at criterion concentration.
Site Specific EWQ defined by DRBC 2000-2004.
Corrections 2016:
None

Delaware River Basin Commission Page 254
1556 BCP Paunacussing Creek at Rt. 32, PA

Delaware River Basin Commission Page 255
1556 BCP Paunacussing Creek at Rt. 32, PA
Bucks County. PA. Latitude 40.4076 Longitude -75.0416 by GPS NAD83 decimal degrees.
No USGS or PADEP sites nearby
Watershed Population: 2000 = 2,359 2010 = 2,558 Change = +199 (+8.4%)
Drainage Area at site: 7.9 square miles, tributary to Delaware River Zone 1E
Site Specific EWQ defined by DRBC 2000-2004.
Paunacussing Creek is a designated National Wild and Scenic River.
This watershed is tributary to the Lower Delaware Scenic and Recreational River (LDEL)
Tributary to DRBC Significant Resource Waters.
Nearest upstream Interstate Control Point: 1677 ICP Delaware River at Milford / Upper Black Eddy Bridge
Nearest downstream Interstate Control Point: 1554 ICP Delaware River at Bulls Island Foot Bridge
Known dischargers within watershed: None.
Watershed is 49.7% forested; urban land cover is 0.9%. Watershed was not glaciated, and is not underlain by carbonate
bedrock. Mean annual precipitation 45 inches. (http://water.usgs.gov/osw/streamstats/, accessed 2012).
Flow Statistics from flow duration curve associated with water quality samples (USGS BaSE Model):
Max Flow (CFS)
90% Flow (CFS)
75% Flow (CFS)
60% Flow (CFS)
50% Flow (CFS)
40% Flow (CFS)
25% Flow (CFS)
10% Flow (CFS)
Min Flow (CFS)
911 23.2 11.0 8.78 7.13 5.78 2.99 1.33 0.17
StreamStats Low-Flow Stream Statistics
M7D2Y (ft³/s) 0.87
M30D2Y (ft³/s) 1.25
M7D10Y (ft³/s) 0.34
M30D10Y (ft³/s) 0.51
M90D10Y (ft³/s) 0.95
StreamStats Mean/Baseflow Stream Statistics
QA (ft³/s) 11.0
QAH (ft³/s) 2.84
BF10YR (ft³/s) 4.48
BF25YR (ft³/s) 3.93
BF50YR (ft³/s) 3.62
StreamStats Peak-Flow Stream Statistics
PK2 (ft³/s) 411
PK5 (ft³/s) 720
PK10 (ft³/s) 968
PK50 (ft³/s) 1,620
PK100 (ft³/s) 1,950
PK500 (ft³/s) 2,860

Delaware River Basin Commission Page 256
Existing Water Quality: 1556 BCP Paunacussing Creek at Rt. 32, PA Paunacussing Creek, Pennsylvania, River Mile 155.90 – 0.12 Boundary Control Point is located at Route 32 bridge, Lumberville.
Parameter (Y) Definition of Existing Water Quality
Median
Lower
95%CI
Upper
95%CI
Flow-Relationships
Site specific regression equation.
Ammonia NH3-N (mg/L) * <0.05 <0.05 <0.05
Chloride (mg/L) 24 23 25
Chlorophyll a (mg/m3) n/a n/a n/a n/a
Dissolved Oxygen (mg/L) mid-day * 9.42 8.90 9.81
Dissolved Oxygen Saturation (%) 98% 96% 101%
E. coli (colonies/100 ml) 28 15 84 Y = antilog (0.742 (log Q) + 1.3102)
Enterococcus (colonies/100 ml) 320 160 520
Fecal coliform (colonies/100 ml) * 80 60 130 Y = antilog (0.5676 (log Q) + 1.7382)
Nitrate NO3-N (mg/L) * 2.58 2.15 2.75
Orthophosphate (mg/L) 0.05 0.04 0.05
pH * 7.60 7.47 7.72
Specific Conductance (µS/cm) 229 218 242 Y = -18.8373 (log Q) + 238.7433
Total Dissolved Solids (mg/L) 130 120 144 Y = -24.3907 (log Q) + 154.9198
Total Kjeldahl Nitrogen (mg/L) 0.30 0.17 0.36
Total Nitrogen (mg/L) * 2.96 2.83 3.15
Total Phosphorus (mg/L) * 0.07 0.06 0.08
Total Suspended Solids (mg/L) * 1.0 1.0 2.0
Turbidity (NTU) 0.8 0.5 1.6
Alkalinity (mg/L) 47 42 55 Y = -13.64 (log Q) + 52.88
Hardness (mg/L) 80 75 85 Y = -12.1905 (log Q) + 84.3707
EWQ values represent data collected twice per month from May through September 2000-2004.
* = Dischargers may be required to evaluate this parameter for permit limits necessary to meet EWQ.
Implementation guidance should be consulted for discharge evaluations.
** = EWQ exceeds DRBC or state water quality criteria. Discharge evaluations should be conducted at criterion concentration.
Site Specific EWQ defined by DRBC 2000-2004.
Corrections 2016:
None
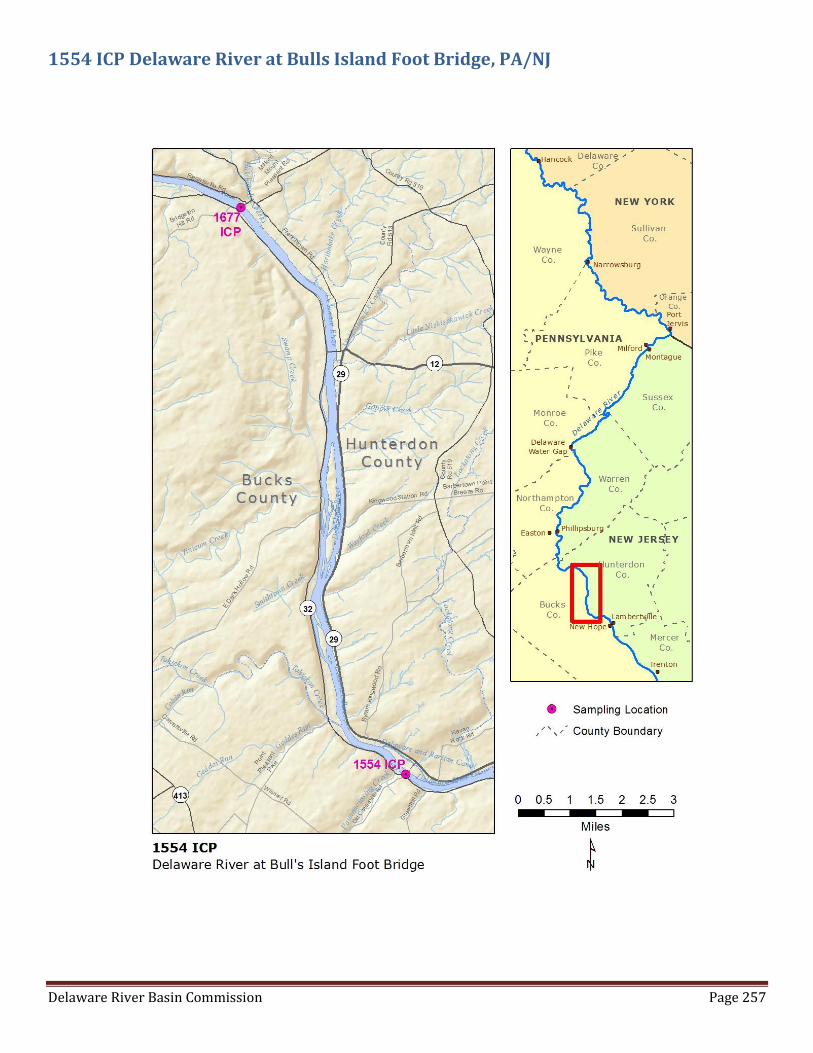
Delaware River Basin Commission Page 257
1554 ICP Delaware River at Bulls Island Foot Bridge, PA/NJ

Delaware River Basin Commission Page 258
1554 ICP Delaware River at Bulls Island Foot Bridge, PA/NJ Hunterdon County, NJ and Bucks County, PA
Latitude 40.4075 Longitude -75.03778 by GPS NAD83 decimal degrees.
USGS sites 01461000, 01460820; NJDEP site 01461000
Watershed Population figures were not calculated for main-stem Delaware River sites.
Drainage Area: 6,598 square miles, Delaware River Zone 1E
Site Specific EWQ defined 2000-2004 by DRBC.
This site is located in the Lower Delaware Scenic and Recreational River.
Classified by DRBC as Significant Resource Waters
Nearest upstream Interstate Control Point: 1677 ICP Delaware River at Milford / Upper Black Eddy Bridge
Nearest downstream Interstate Control Point: 1487 ICP Delaware River at Lambertville
Known dischargers within upstream reach: Undefined
Tributaries to upstream reach: Major tributaries 1672 BCP Hakihokake Creek, NJ; 1641 BCP Nishisakawick Creek, NJ;
1616 BCP Tinicum Creek, PA; 1570 BCP Tohickon Creek, PA; 1556 BCP Paunacussing Creek, PA. Small tributaries 165.7
Harihokake Creek, NJ; 164.9 Little Nishisakawick Creek, NJ; 162.9 Copper Creek, NJ; 161.1 Warford Creek, NJ; 160.6
Smithtown Creek, PA; 160.2 Warsaw Creek, NJ.
No Stream Stats web site data available because drainage area too large for web site retrieval.
Flow Statistics Associated with Water Quality Samples (calculated by drainage area weighting from USGS gage data):
Max Flow (CFS)
90% Flow (CFS)
75% Flow (CFS)
60% Flow (CFS)
50% Flow (CFS)
40% Flow (CFS)
25% Flow (CFS)
10% Flow (CFS)
Min Flow (CFS)
223,826 25,107 14,889 10,413 8,505 6,822 4,827 3,338 1,849

Delaware River Basin Commission Page 259
Existing Water Quality: 1554 ICP Delaware River at Bulls Island Foot Bridge Delaware River at Bulls Island (Lumberville-Raven Rock) Foot Bridge, PA/NJ, River Mile 155.40
Parameter (Y) Definition of Existing Water Quality
Median
Lower
95%CI
Upper
95%CI
Flow-Relationships
Site specific regression equation.
Ammonia NH3-N (mg/L) * <0.05 <0.05 <0.05
Chloride (mg/L) 17 15 20 Y = -0.00044266 Q + 21.906
Chlorophyll a (mg/m3) 2.70 1.07 3.20
Dissolved Oxygen (mg/L) mid-day * 8.80 8.40 9.30
Dissolved Oxygen Saturation (%) 98% 95% 100%
E. coli (colonies/100 ml) 40 23 80 Y = antilog (0.00003626 Q + 1.0914)
Enterococcus (colonies/100 ml) 49 32 100
Fecal coliform (colonies/100 ml) * 71 36 90 Y = antilog (0.00003537 Q + 1.3646)
Nitrate NO3-N (mg/L) * 1.00 0.88 1.23
Orthophosphate (mg/L) 0.04 0.04 0.06
pH * 7.60 7.50 7.74
Specific Conductance (µS/cm) 186 170 202 Y = -0.00482529 Q + 229.19
Total Dissolved Solids (mg/L) 140 130 160 Y = -0.00277475 Q + 169.368
Total Kjeldahl Nitrogen (mg/L) 0.32 0.27 0.55
Total Nitrogen (mg/L) * 1.48 1.26 1.59
Total Phosphorus (mg/L) * 0.10 0.07 0.12
Total Suspended Solids (mg/L) * 5.0 4.0 7.0 Y = 0.0007482 Q - 0.48
Turbidity (NTU) 3.8 2.2 6.0
Alkalinity (mg/L) 45 38 51 Y = -0.00129755 Q + 56.978
Hardness (mg/L) 68 60 72 Y = -0.00134498 Q + 78.78
EWQ values represent data collected twice per month from May through September 2000-2004.
* = Dischargers may be required to evaluate this parameter for permit limits necessary to meet EWQ.
Implementation guidance should be consulted for discharge evaluations.
** = EWQ exceeds DRBC or state water quality criteria. Discharge evaluations should be conducted at criterion concentration.
Site Specific EWQ defined 2000-2004 by DRBC.
Corrections 2016:
None

Delaware River Basin Commission Page 260
1540 BCP Lockatong Creek at Raven Rock-Rosemont Rd., NJ
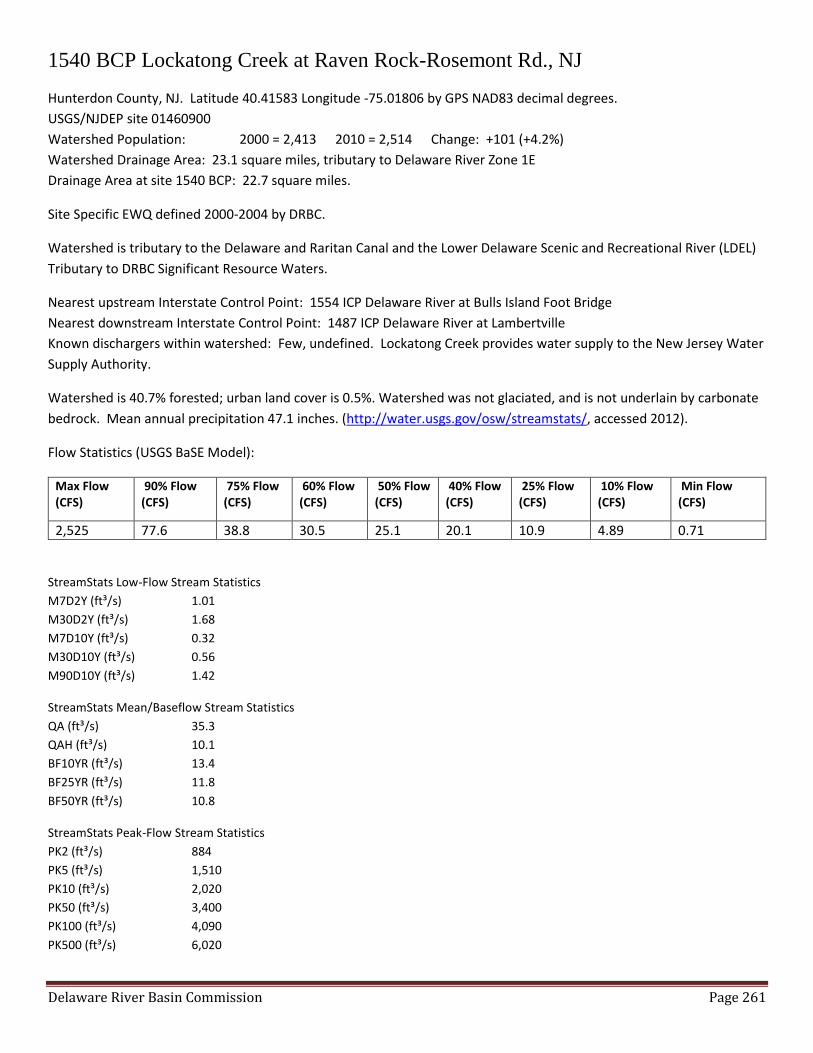
Delaware River Basin Commission Page 261
1540 BCP Lockatong Creek at Raven Rock-Rosemont Rd., NJ
Hunterdon County, NJ. Latitude 40.41583 Longitude -75.01806 by GPS NAD83 decimal degrees.
USGS/NJDEP site 01460900
Watershed Population: 2000 = 2,413 2010 = 2,514 Change: +101 (+4.2%)
Watershed Drainage Area: 23.1 square miles, tributary to Delaware River Zone 1E
Drainage Area at site 1540 BCP: 22.7 square miles.
Site Specific EWQ defined 2000-2004 by DRBC.
Watershed is tributary to the Delaware and Raritan Canal and the Lower Delaware Scenic and Recreational River (LDEL)
Tributary to DRBC Significant Resource Waters.
Nearest upstream Interstate Control Point: 1554 ICP Delaware River at Bulls Island Foot Bridge
Nearest downstream Interstate Control Point: 1487 ICP Delaware River at Lambertville
Known dischargers within watershed: Few, undefined. Lockatong Creek provides water supply to the New Jersey Water
Supply Authority.
Watershed is 40.7% forested; urban land cover is 0.5%. Watershed was not glaciated, and is not underlain by carbonate
bedrock. Mean annual precipitation 47.1 inches. (http://water.usgs.gov/osw/streamstats/, accessed 2012).
Flow Statistics (USGS BaSE Model):
Max Flow (CFS)
90% Flow (CFS)
75% Flow (CFS)
60% Flow (CFS)
50% Flow (CFS)
40% Flow (CFS)
25% Flow (CFS)
10% Flow (CFS)
Min Flow (CFS)
2,525 77.6 38.8 30.5 25.1 20.1 10.9 4.89 0.71
StreamStats Low-Flow Stream Statistics
M7D2Y (ft³/s) 1.01
M30D2Y (ft³/s) 1.68
M7D10Y (ft³/s) 0.32
M30D10Y (ft³/s) 0.56
M90D10Y (ft³/s) 1.42
StreamStats Mean/Baseflow Stream Statistics
QA (ft³/s) 35.3
QAH (ft³/s) 10.1
BF10YR (ft³/s) 13.4
BF25YR (ft³/s) 11.8
BF50YR (ft³/s) 10.8
StreamStats Peak-Flow Stream Statistics
PK2 (ft³/s) 884
PK5 (ft³/s) 1,510
PK10 (ft³/s) 2,020
PK50 (ft³/s) 3,400
PK100 (ft³/s) 4,090
PK500 (ft³/s) 6,020
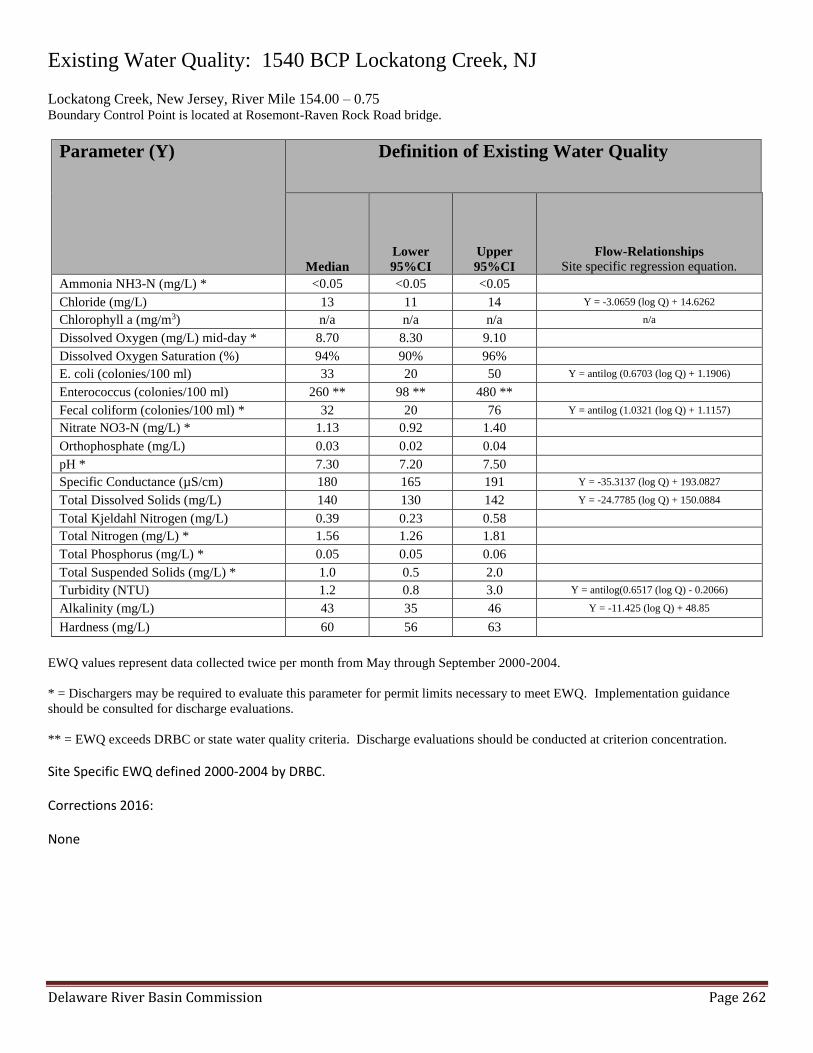
Delaware River Basin Commission Page 262
Existing Water Quality: 1540 BCP Lockatong Creek, NJ Lockatong Creek, New Jersey, River Mile 154.00 – 0.75 Boundary Control Point is located at Rosemont-Raven Rock Road bridge.
Parameter (Y) Definition of Existing Water Quality
Median
Lower
95%CI
Upper
95%CI
Flow-Relationships
Site specific regression equation.
Ammonia NH3-N (mg/L) * <0.05 <0.05 <0.05
Chloride (mg/L) 13 11 14 Y = -3.0659 (log Q) + 14.6262
Chlorophyll a (mg/m3) n/a n/a n/a n/a
Dissolved Oxygen (mg/L) mid-day * 8.70 8.30 9.10
Dissolved Oxygen Saturation (%) 94% 90% 96%
E. coli (colonies/100 ml) 33 20 50 Y = antilog (0.6703 (log Q) + 1.1906)
Enterococcus (colonies/100 ml) 260 ** 98 ** 480 **
Fecal coliform (colonies/100 ml) * 32 20 76 Y = antilog (1.0321 (log Q) + 1.1157)
Nitrate NO3-N (mg/L) * 1.13 0.92 1.40
Orthophosphate (mg/L) 0.03 0.02 0.04
pH * 7.30 7.20 7.50
Specific Conductance (µS/cm) 180 165 191 Y = -35.3137 (log Q) + 193.0827
Total Dissolved Solids (mg/L) 140 130 142 Y = -24.7785 (log Q) + 150.0884
Total Kjeldahl Nitrogen (mg/L) 0.39 0.23 0.58
Total Nitrogen (mg/L) * 1.56 1.26 1.81
Total Phosphorus (mg/L) * 0.05 0.05 0.06
Total Suspended Solids (mg/L) * 1.0 0.5 2.0
Turbidity (NTU) 1.2 0.8 3.0 Y = antilog(0.6517 (log Q) - 0.2066)
Alkalinity (mg/L) 43 35 46 Y = -11.425 (log Q) + 48.85
Hardness (mg/L) 60 56 63
EWQ values represent data collected twice per month from May through September 2000-2004.
* = Dischargers may be required to evaluate this parameter for permit limits necessary to meet EWQ. Implementation guidance
should be consulted for discharge evaluations.
** = EWQ exceeds DRBC or state water quality criteria. Discharge evaluations should be conducted at criterion concentration.
Site Specific EWQ defined 2000-2004 by DRBC.
Corrections 2016:
None
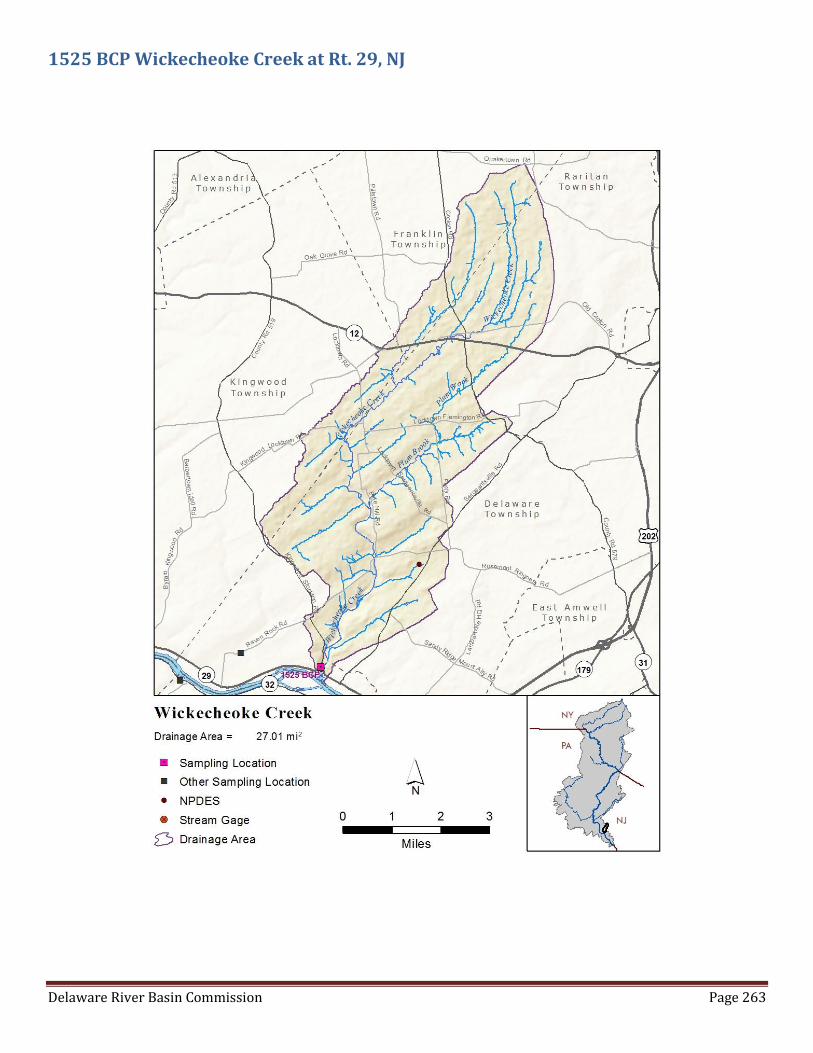
Delaware River Basin Commission Page 263
1525 BCP Wickecheoke Creek at Rt. 29, NJ
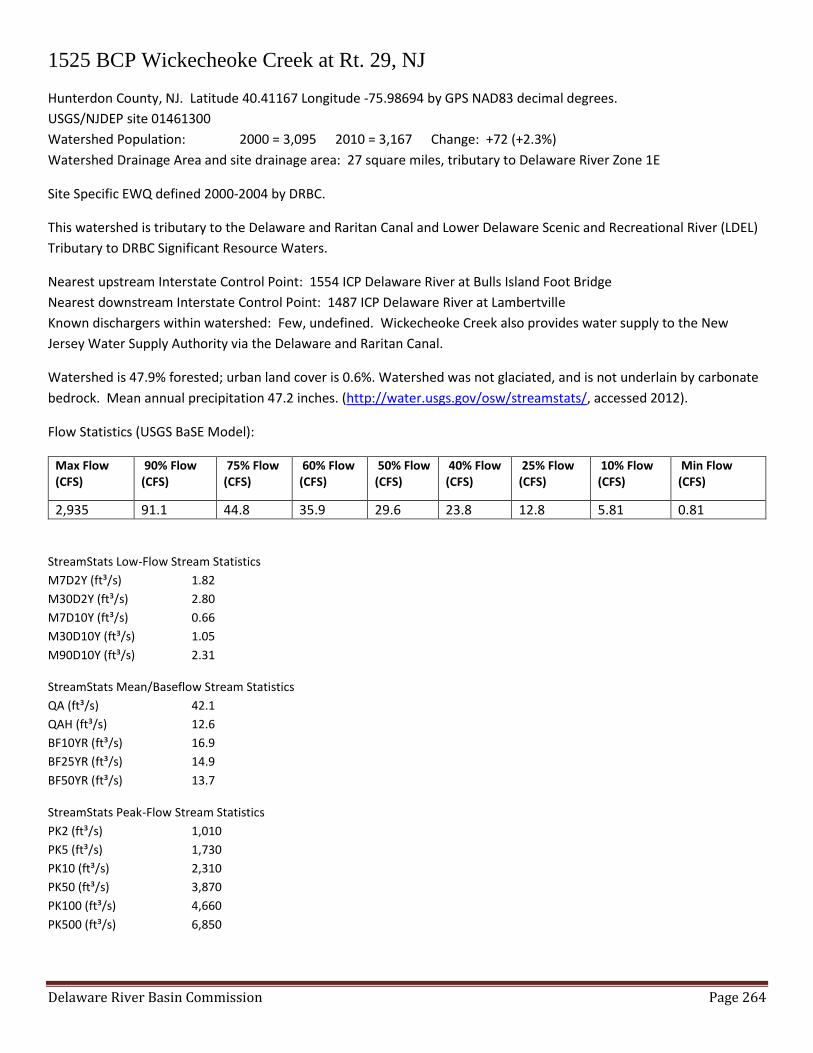
Delaware River Basin Commission Page 264
1525 BCP Wickecheoke Creek at Rt. 29, NJ
Hunterdon County, NJ. Latitude 40.41167 Longitude -75.98694 by GPS NAD83 decimal degrees.
USGS/NJDEP site 01461300
Watershed Population: 2000 = 3,095 2010 = 3,167 Change: +72 (+2.3%)
Watershed Drainage Area and site drainage area: 27 square miles, tributary to Delaware River Zone 1E
Site Specific EWQ defined 2000-2004 by DRBC.
This watershed is tributary to the Delaware and Raritan Canal and Lower Delaware Scenic and Recreational River (LDEL)
Tributary to DRBC Significant Resource Waters.
Nearest upstream Interstate Control Point: 1554 ICP Delaware River at Bulls Island Foot Bridge
Nearest downstream Interstate Control Point: 1487 ICP Delaware River at Lambertville
Known dischargers within watershed: Few, undefined. Wickecheoke Creek also provides water supply to the New
Jersey Water Supply Authority via the Delaware and Raritan Canal.
Watershed is 47.9% forested; urban land cover is 0.6%. Watershed was not glaciated, and is not underlain by carbonate
bedrock. Mean annual precipitation 47.2 inches. (http://water.usgs.gov/osw/streamstats/, accessed 2012).
Flow Statistics (USGS BaSE Model):
Max Flow (CFS)
90% Flow (CFS)
75% Flow (CFS)
60% Flow (CFS)
50% Flow (CFS)
40% Flow (CFS)
25% Flow (CFS)
10% Flow (CFS)
Min Flow (CFS)
2,935 91.1 44.8 35.9 29.6 23.8 12.8 5.81 0.81
StreamStats Low-Flow Stream Statistics
M7D2Y (ft³/s) 1.82
M30D2Y (ft³/s) 2.80
M7D10Y (ft³/s) 0.66
M30D10Y (ft³/s) 1.05
M90D10Y (ft³/s) 2.31
StreamStats Mean/Baseflow Stream Statistics
QA (ft³/s) 42.1
QAH (ft³/s) 12.6
BF10YR (ft³/s) 16.9
BF25YR (ft³/s) 14.9
BF50YR (ft³/s) 13.7
StreamStats Peak-Flow Stream Statistics
PK2 (ft³/s) 1,010
PK5 (ft³/s) 1,730
PK10 (ft³/s) 2,310
PK50 (ft³/s) 3,870
PK100 (ft³/s) 4,660
PK500 (ft³/s) 6,850

Delaware River Basin Commission Page 265
Existing Water Quality: 1525 BCP Wickecheoke Creek at Rt. 29, NJ Wickecheoke Creek, New Jersey, River Mile 152.51 – 0.21 Boundary Control Point is located at Route 29 bridge, Stockton.
Parameter (Y) Definition of Existing Water Quality
Median
Lower
95%CI
Upper
95%CI
Flow-Relationships
Site specific regression equation.
Ammonia NH3-N (mg/L) * <0.05 <0.05 <0.05
Chloride (mg/L) 17 15 18
Chlorophyll a (mg/m3) n/a n/a n/a
Dissolved Oxygen (mg/L) mid-day * 9.45 8.95 9.90
Dissolved Oxygen Saturation (%) 101% 96% 104%
E. coli (colonies/100 ml) 52 40 76 Y = antilog (0.5393 (log Q) + 1.4795)
Enterococcus (colonies/100 ml) 170 ** 84 ** 300 **
Fecal coliform (colonies/100 ml) * 92 65 190
Nitrate NO3-N (mg/L) * 1.83 1.69 2.20
Orthophosphate (mg/L) 0.03 0.03 0.04
pH * 7.53 7.40 7.70
Specific Conductance (µS/cm) 183 175 200 Y = -28.7787 (log Q) + 199.7338
Total Dissolved Solids (mg/L) 130 120 134 Y = -30.5576 (log Q) + 148.5061
Total Kjeldahl Nitrogen (mg/L) 0.44 0.30 0.70
Total Nitrogen (mg/L) * 2.12 1.99 2.65
Total Phosphorus (mg/L) * 0.06 0.05 0.07
Total Suspended Solids (mg/L) * 1.0 <0.5 1.5
Turbidity (NTU) 1.2 0.7 2.0 Y = antilog(0.5729 (log Q) - 0.2123)
Alkalinity (mg/L) 40 33 43 Y = -9.35 (log Q) + 45.46
Hardness (mg/L) 58 51 62
EWQ values represent data collected twice per month from May through September 2000-2004.
* = Dischargers may be required to evaluate this parameter for permit limits necessary to meet EWQ.
Implementation guidance should be consulted for discharge evaluations.
** = EWQ exceeds DRBC or state water quality criteria. Discharge evaluations should be conducted at criterion concentration.
Site Specific EWQ defined 2000-2004 by DRBC.
Corrections 2016:
None

Delaware River Basin Commission Page 266
1495 BCP Alexauken Creek at Rt. 29, NJ
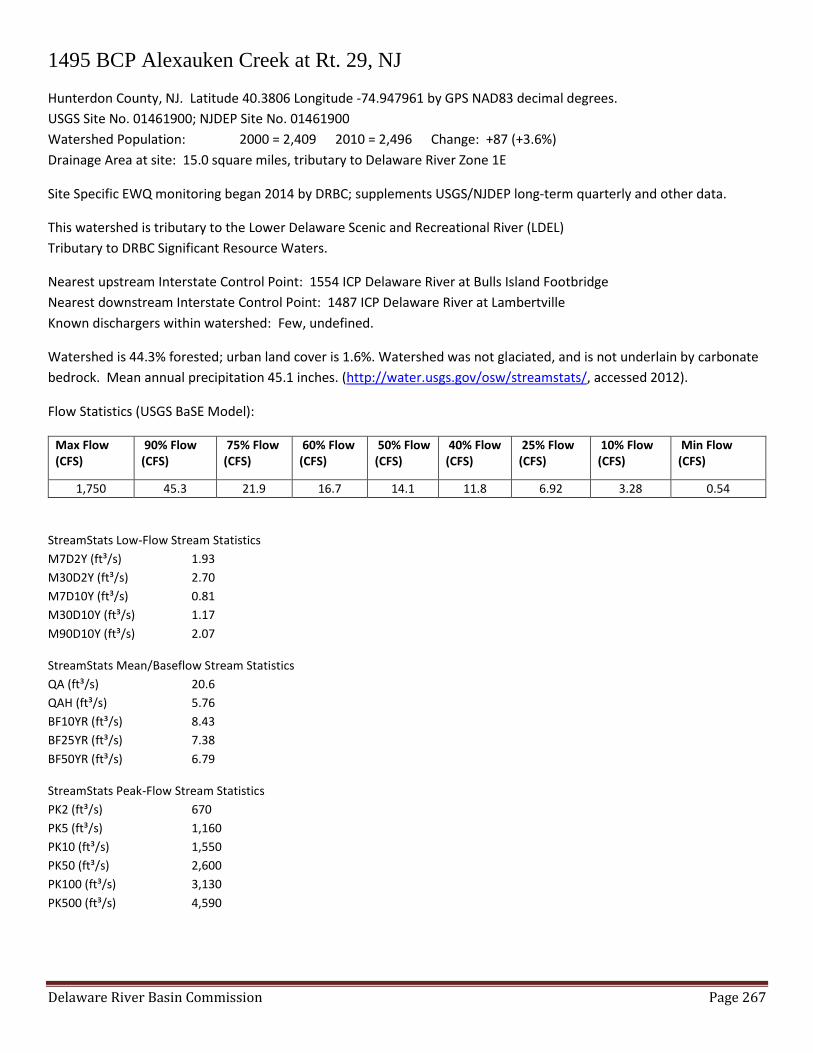
Delaware River Basin Commission Page 267
1495 BCP Alexauken Creek at Rt. 29, NJ
Hunterdon County, NJ. Latitude 40.3806 Longitude -74.947961 by GPS NAD83 decimal degrees.
USGS Site No. 01461900; NJDEP Site No. 01461900
Watershed Population: 2000 = 2,409 2010 = 2,496 Change: +87 (+3.6%)
Drainage Area at site: 15.0 square miles, tributary to Delaware River Zone 1E
Site Specific EWQ monitoring began 2014 by DRBC; supplements USGS/NJDEP long-term quarterly and other data.
This watershed is tributary to the Lower Delaware Scenic and Recreational River (LDEL)
Tributary to DRBC Significant Resource Waters.
Nearest upstream Interstate Control Point: 1554 ICP Delaware River at Bulls Island Footbridge
Nearest downstream Interstate Control Point: 1487 ICP Delaware River at Lambertville
Known dischargers within watershed: Few, undefined.
Watershed is 44.3% forested; urban land cover is 1.6%. Watershed was not glaciated, and is not underlain by carbonate
bedrock. Mean annual precipitation 45.1 inches. (http://water.usgs.gov/osw/streamstats/, accessed 2012).
Flow Statistics (USGS BaSE Model):
Max Flow (CFS)
90% Flow (CFS)
75% Flow (CFS)
60% Flow (CFS)
50% Flow (CFS)
40% Flow (CFS)
25% Flow (CFS)
10% Flow (CFS)
Min Flow (CFS)
1,750 45.3 21.9 16.7 14.1 11.8 6.92 3.28 0.54
StreamStats Low-Flow Stream Statistics
M7D2Y (ft³/s) 1.93
M30D2Y (ft³/s) 2.70
M7D10Y (ft³/s) 0.81
M30D10Y (ft³/s) 1.17
M90D10Y (ft³/s) 2.07
StreamStats Mean/Baseflow Stream Statistics
QA (ft³/s) 20.6
QAH (ft³/s) 5.76
BF10YR (ft³/s) 8.43
BF25YR (ft³/s) 7.38
BF50YR (ft³/s) 6.79
StreamStats Peak-Flow Stream Statistics
PK2 (ft³/s) 670
PK5 (ft³/s) 1,160
PK10 (ft³/s) 1,550
PK50 (ft³/s) 2,600
PK100 (ft³/s) 3,130
PK500 (ft³/s) 4,590

Delaware River Basin Commission Page 268
Existing Water Quality: 1495 BCP Alexauken Creek at Rt. 29, NJ Parameter N median L95CL U95CL Period of Record (May-Sep data)
Alkalinity as CaCO3, Total mg/L 35 61 55 66 USGS 1980-82; SRMP 2014-15
Ammonia-Nitrogen as N, Total mg/L * 28 0.005 0.004 0.044 USGS 1980-82; NJDEP 2003; SRMP 2014-15 (16/28 ND)
Calcium, Dissolved mg/L 10 24.5 20 31 USGS 1980-82, 2000
Chloride, Total mg/L 23 62.6 53.1 84.5 NJDEP 2003-04; SRMP 2014-15
Dissolved Oxygen (DO) mg/L mid-day * 42 8.71 8.10 9.17 USGS 1980-82; NJDEP 2003-11; SRMP 1999, 2014-15
Dissolved Oxygen Saturation % mid-day 26 94.9 87.3 106.0 USGS 2000, NJDEP 2004; SRMP 1999, 2014-15
Enterococcus #/100ml {1} 3 40 Insufficient data for EWQ definition
Escherichia coli #/100mL {2} 0 No Data
Fecal coliform #/100mL * 8 Insufficient data for EWQ definition
Hardness as CaCO3, Total mg/L 30 117 107 128 USGS 1980-82, 2000; SRMP 2014-15
Magnesium, Dissolved mg/L 10 8.5 7.1 10.0 USGS 1980-82, 2000
Nitrate+Nitrite as N, Total mg/L * 30 0.197 0.140 0.588 USGS 1980-82; NJDEP 2003-04; SRMP 2014-15
Nitrogen as N, Total mg/L * 26 0.463 0.289 0.720 USGS 1980-82, 2000; SRMP 2014-15
Nitrogen, Kjeldahl as N, Total mg/L 31 0.203 0.150 0.272 USGS 1980-82, 2000; NJDEP 2004; SRMP 2014-15
Nitrogen, Organic as N, Total mg/L 9 0.26 0.18 0.61 USGS 1980-82, 2000
Organic Carbon, Total mg/L 7 1.6 0.1 5.9 USGS 1980-82
pH units, mid-day * 40 7.61 7.53 7.78 USGS 1980-82, 2000; NJDEP 2001-11; SRMP 1999, 2014-15
Phosphate as P, Total mg/L 20 0.033 0.025 0.040 SRMP 2014-15
Phosphorus as P, Total mg/L * 32 0.047 0.038 0.060 USGS 1980-82; NJDEP 2003-11; SRMP 2000, 2014-15
Potassium, Dissolved mg/L 10 2.2 2.0 2.5 USGS 1980-82, 2000
Silica, Dissolved mg/L 10 9.9 7.5 12.5 USGS 1980-82, 2000
Sodium, Dissolved mg/L 10 11.0 8.6 14.0 USGS 1980-82, 2000
Specific Conductance µS/cm 40 326 288 406 USGS 1980-82, 2000; NJDEP 2001-11; SRMP 1999, 2014-15
Sulfate, Dissolved mg/L 10 38.7 32.0 57.0 USGS 1980-82, 2000
Temperature, Water, degrees C mid-day 43 20.3 19.3 22.0 USGS 1980-82, 2000; NJDEP 2001-13; SRMP 1999, 2014-15
Total Dissolved Solids (TDS) mg/L 32 226 176 270 USGS 1980-82, 2000; NJDEP 2003-04; SRMP 2014-15
Total Suspended Solids (TSS) mg/L * 22 3.5 1.0 4.0 NJDEP 2003-04; SRMP 2014-15
Turbidity NTU 23 0.55 0.33 0.71 USGS 2000; NJDEP 2004; SRMP 2014-15
Two-tailed 95% (Lower and Upper) confidence limits were used for these EWQ targets * = Dischargers may be required to evaluate this parameter for permit limits necessary to meet EWQ. Implementation guidance should be consulted for discharge evaluations. ** Value exceeds state and/or DRBC water quality criterion Note: All data are May to September season. Additional data are available for the October to April “non-seasonal” period, but data are insufficient in number for establishment of site-specific existing water quality targets. There were many more parameters collected at this site over the years, but were excluded from this table because of insufficient frequency of sampling or because most results were not detected. Dissolved oxygen, pH and temperature data represent mid-day near maximum values, as they are all grab samples taken between 10 AM and 3 PM. This table Is incomplete. The SRMP is conducting one more year of confirmatory monitoring in 2016 to supplement
historical and current NJDEP and USGS data used to calculate existing water quality at this site.

Delaware River Basin Commission Page 269
1487 ICP Delaware River at Lambertville Bridge, PA/NJ
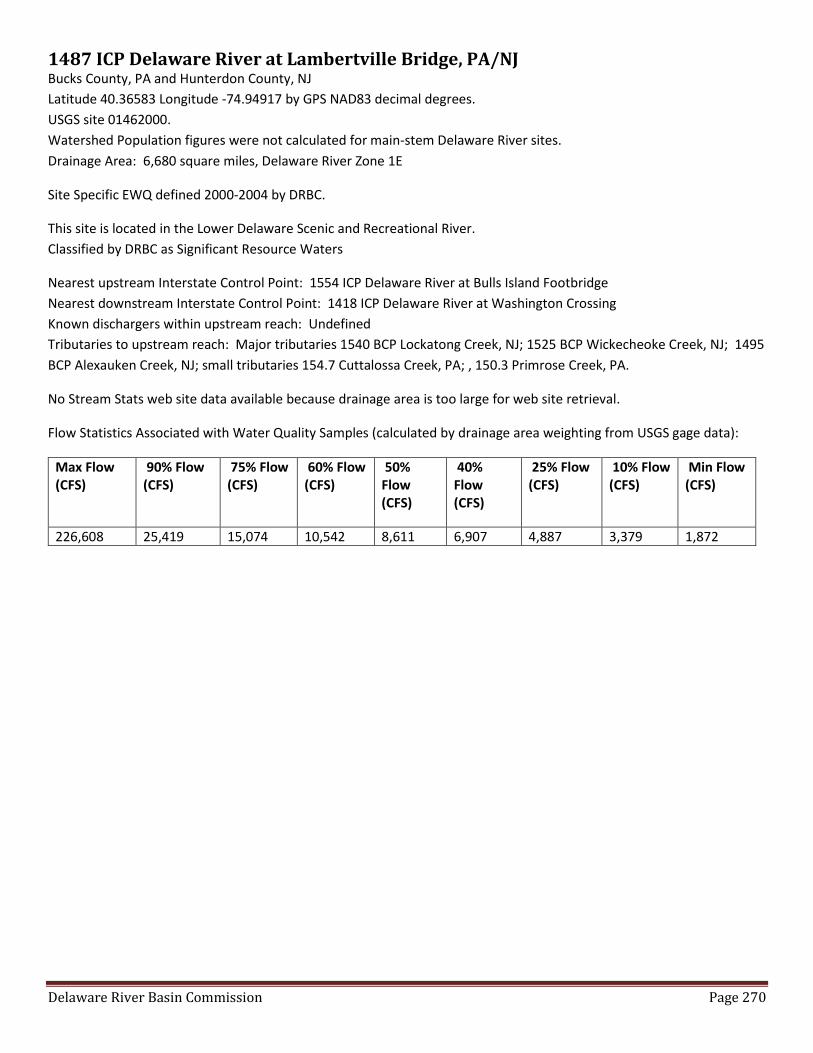
Delaware River Basin Commission Page 270
1487 ICP Delaware River at Lambertville Bridge, PA/NJ Bucks County, PA and Hunterdon County, NJ
Latitude 40.36583 Longitude -74.94917 by GPS NAD83 decimal degrees.
USGS site 01462000.
Watershed Population figures were not calculated for main-stem Delaware River sites.
Drainage Area: 6,680 square miles, Delaware River Zone 1E
Site Specific EWQ defined 2000-2004 by DRBC.
This site is located in the Lower Delaware Scenic and Recreational River.
Classified by DRBC as Significant Resource Waters
Nearest upstream Interstate Control Point: 1554 ICP Delaware River at Bulls Island Footbridge
Nearest downstream Interstate Control Point: 1418 ICP Delaware River at Washington Crossing
Known dischargers within upstream reach: Undefined
Tributaries to upstream reach: Major tributaries 1540 BCP Lockatong Creek, NJ; 1525 BCP Wickecheoke Creek, NJ; 1495
BCP Alexauken Creek, NJ; small tributaries 154.7 Cuttalossa Creek, PA; , 150.3 Primrose Creek, PA.
No Stream Stats web site data available because drainage area is too large for web site retrieval.
Flow Statistics Associated with Water Quality Samples (calculated by drainage area weighting from USGS gage data):
Max Flow (CFS)
90% Flow (CFS)
75% Flow (CFS)
60% Flow (CFS)
50% Flow (CFS)
40% Flow (CFS)
25% Flow (CFS)
10% Flow (CFS)
Min Flow (CFS)
226,608 25,419 15,074 10,542 8,611 6,907 4,887 3,379 1,872
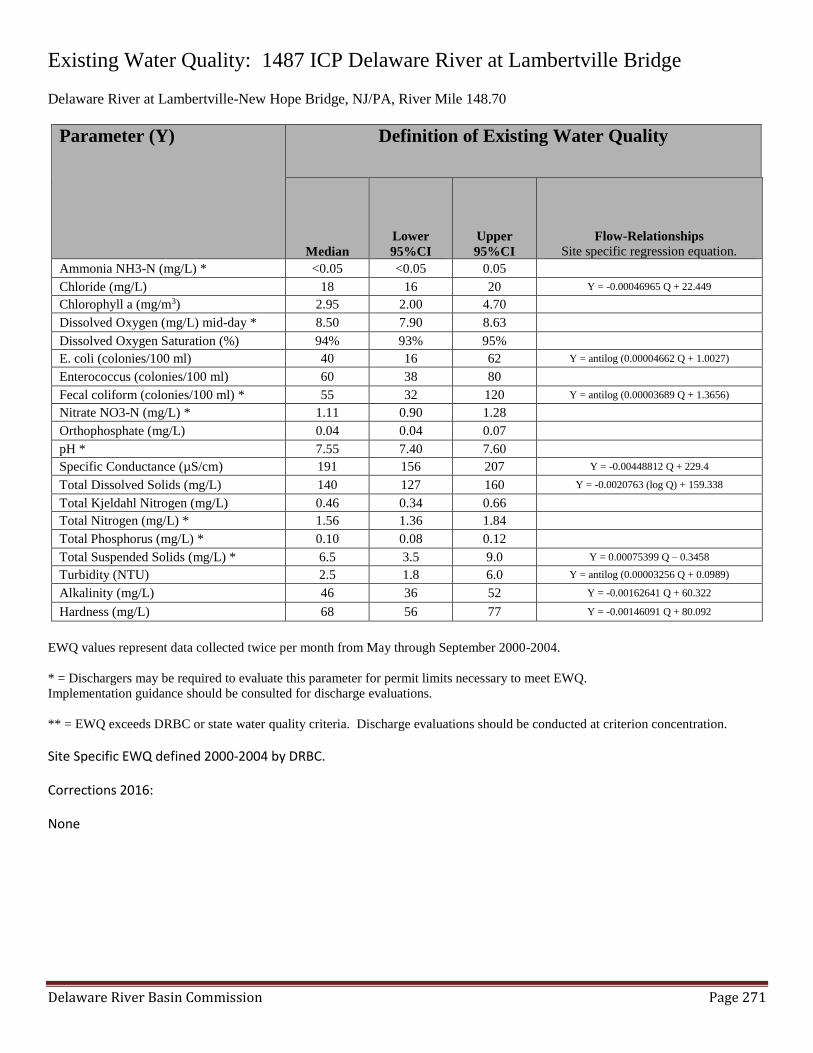
Delaware River Basin Commission Page 271
Existing Water Quality: 1487 ICP Delaware River at Lambertville Bridge Delaware River at Lambertville-New Hope Bridge, NJ/PA, River Mile 148.70
Parameter (Y) Definition of Existing Water Quality
Median
Lower
95%CI
Upper
95%CI
Flow-Relationships
Site specific regression equation.
Ammonia NH3-N (mg/L) * <0.05 <0.05 0.05
Chloride (mg/L) 18 16 20 Y = -0.00046965 Q + 22.449
Chlorophyll a (mg/m3) 2.95 2.00 4.70
Dissolved Oxygen (mg/L) mid-day * 8.50 7.90 8.63
Dissolved Oxygen Saturation (%) 94% 93% 95%
E. coli (colonies/100 ml) 40 16 62 Y = antilog (0.00004662 Q + 1.0027)
Enterococcus (colonies/100 ml) 60 38 80
Fecal coliform (colonies/100 ml) * 55 32 120 Y = antilog (0.00003689 Q + 1.3656)
Nitrate NO3-N (mg/L) * 1.11 0.90 1.28
Orthophosphate (mg/L) 0.04 0.04 0.07
pH * 7.55 7.40 7.60
Specific Conductance (µS/cm) 191 156 207 Y = -0.00448812 Q + 229.4
Total Dissolved Solids (mg/L) 140 127 160 Y = -0.0020763 (log Q) + 159.338
Total Kjeldahl Nitrogen (mg/L) 0.46 0.34 0.66
Total Nitrogen (mg/L) * 1.56 1.36 1.84
Total Phosphorus (mg/L) * 0.10 0.08 0.12
Total Suspended Solids (mg/L) * 6.5 3.5 9.0 Y = 0.00075399 Q – 0.3458
Turbidity (NTU) 2.5 1.8 6.0 Y = antilog (0.00003256 Q + 0.0989)
Alkalinity (mg/L) 46 36 52 Y = -0.00162641 Q + 60.322
Hardness (mg/L) 68 56 77 Y = -0.00146091 Q + 80.092
EWQ values represent data collected twice per month from May through September 2000-2004.
* = Dischargers may be required to evaluate this parameter for permit limits necessary to meet EWQ.
Implementation guidance should be consulted for discharge evaluations.
** = EWQ exceeds DRBC or state water quality criteria. Discharge evaluations should be conducted at criterion concentration.
Site Specific EWQ defined 2000-2004 by DRBC.
Corrections 2016:
None

Delaware River Basin Commission Page 272
1463 BCP Pidcock Creek at BHWP Stone Bridge, PA
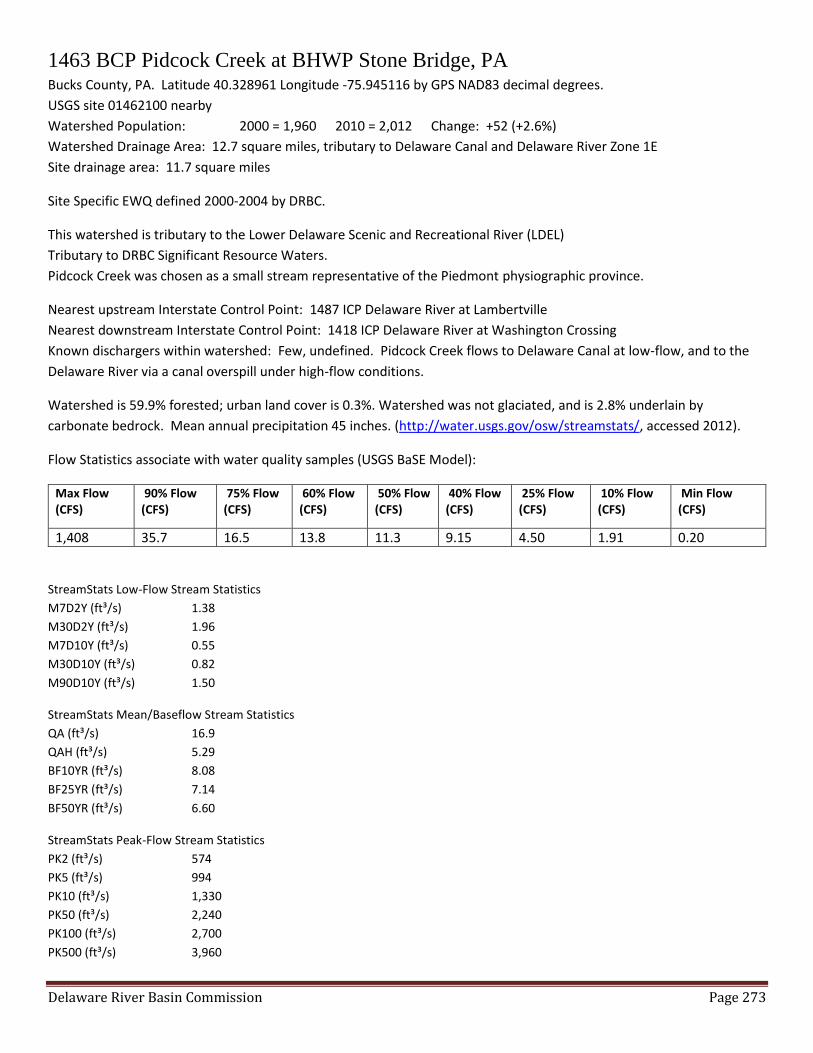
Delaware River Basin Commission Page 273
1463 BCP Pidcock Creek at BHWP Stone Bridge, PA Bucks County, PA. Latitude 40.328961 Longitude -75.945116 by GPS NAD83 decimal degrees.
USGS site 01462100 nearby
Watershed Population: 2000 = 1,960 2010 = 2,012 Change: +52 (+2.6%)
Watershed Drainage Area: 12.7 square miles, tributary to Delaware Canal and Delaware River Zone 1E
Site drainage area: 11.7 square miles
Site Specific EWQ defined 2000-2004 by DRBC.
This watershed is tributary to the Lower Delaware Scenic and Recreational River (LDEL)
Tributary to DRBC Significant Resource Waters.
Pidcock Creek was chosen as a small stream representative of the Piedmont physiographic province.
Nearest upstream Interstate Control Point: 1487 ICP Delaware River at Lambertville
Nearest downstream Interstate Control Point: 1418 ICP Delaware River at Washington Crossing
Known dischargers within watershed: Few, undefined. Pidcock Creek flows to Delaware Canal at low-flow, and to the
Delaware River via a canal overspill under high-flow conditions.
Watershed is 59.9% forested; urban land cover is 0.3%. Watershed was not glaciated, and is 2.8% underlain by
carbonate bedrock. Mean annual precipitation 45 inches. (http://water.usgs.gov/osw/streamstats/, accessed 2012).
Flow Statistics associate with water quality samples (USGS BaSE Model):
Max Flow (CFS)
90% Flow (CFS)
75% Flow (CFS)
60% Flow (CFS)
50% Flow (CFS)
40% Flow (CFS)
25% Flow (CFS)
10% Flow (CFS)
Min Flow (CFS)
1,408 35.7 16.5 13.8 11.3 9.15 4.50 1.91 0.20
StreamStats Low-Flow Stream Statistics
M7D2Y (ft³/s) 1.38
M30D2Y (ft³/s) 1.96
M7D10Y (ft³/s) 0.55
M30D10Y (ft³/s) 0.82
M90D10Y (ft³/s) 1.50
StreamStats Mean/Baseflow Stream Statistics
QA (ft³/s) 16.9
QAH (ft³/s) 5.29
BF10YR (ft³/s) 8.08
BF25YR (ft³/s) 7.14
BF50YR (ft³/s) 6.60
StreamStats Peak-Flow Stream Statistics
PK2 (ft³/s) 574
PK5 (ft³/s) 994
PK10 (ft³/s) 1,330
PK50 (ft³/s) 2,240
PK100 (ft³/s) 2,700
PK500 (ft³/s) 3,960

Delaware River Basin Commission Page 274
Existing Water Quality: 1463 BCP Pidcock Creek at BHWP Stone Bridge, PA Pidcock Creek, Pennsylvania, River Mile 146.30 – 0.90 Boundary Control Point is located at stone foot bridge within Bowman’s Hill Wildflower Preserve.
Parameter (Y) Definition of Existing Water Quality
Median
Lower
95%CI
Upper
95%CI
Flow-Relationships
Site specific regression equation.
Ammonia NH3-N (mg/L) * <0.05 <0.05 0.06
Chloride (mg/L) 19 17 21
Chlorophyll a (mg/m3) n/a n/a n/a
Dissolved Oxygen (mg/L) mid-day * 7.45 7.20 8.50
Dissolved Oxygen Saturation (%) 81% 78% 86%
E. coli (colonies/100 ml) 91 64 170 Y = antilog (0.6675 (log Q) + 1.5652)
Enterococcus (colonies/100 ml) 485 170 720
Fecal coliform (colonies/100 ml) * 195 130 310 ** Y = antilog (0.6669 (log Q) + 1.8192)
Nitrate NO3-N (mg/L) * 0.99 0.90 1.28
Orthophosphate (mg/L) 0.07 0.05 0.08
pH * 7.39 7.20 7.44
Specific Conductance (µS/cm) 255 243 276 Y = -45.1671 (log Q) + 281.0884
Total Dissolved Solids (mg/L) 185 170 190
Total Kjeldahl Nitrogen (mg/L) 0.50 0.28 0.72
Total Nitrogen (mg/L) * 1.63 1.46 2.09
Total Phosphorus (mg/L) * 0.10 0.08 0.12
Total Suspended Solids (mg/L) * 3.0 2.0 4.0
Turbidity (NTU) 3.7 2.5 5.3 Y = antilog (0.6463 (log Q) + 0.163)
Alkalinity (mg/L) 77 64 87 Y = -27.32 (log Q) + 92.67
Hardness (mg/L) 108 97 110 Y = -15.6248 (log Q) + 112.7103
EWQ values represent data collected twice per month from May through September 2000-2004.
* = Dischargers may be required to evaluate this parameter for permit limits necessary to meet EWQ.
Implementation guidance should be consulted for discharge evaluations.
** = EWQ exceeds DRBC or state water quality criteria. Discharge evaluations should be conducted at criterion concentration.
Site Specific EWQ defined 2000-2004 by DRBC.
Corrections 2016:
None

Delaware River Basin Commission Page 275
1418 ICP Delaware River at Washington Crossing Bridge, PA/NJ
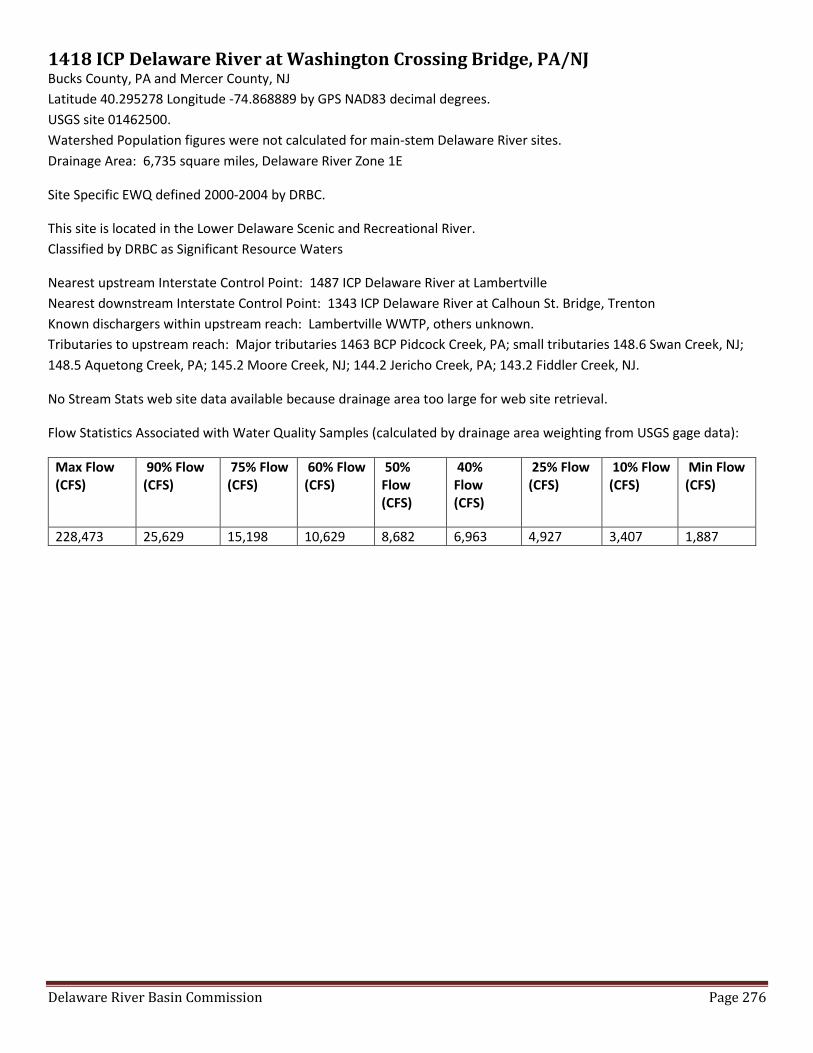
Delaware River Basin Commission Page 276
1418 ICP Delaware River at Washington Crossing Bridge, PA/NJ Bucks County, PA and Mercer County, NJ
Latitude 40.295278 Longitude -74.868889 by GPS NAD83 decimal degrees.
USGS site 01462500.
Watershed Population figures were not calculated for main-stem Delaware River sites.
Drainage Area: 6,735 square miles, Delaware River Zone 1E
Site Specific EWQ defined 2000-2004 by DRBC.
This site is located in the Lower Delaware Scenic and Recreational River.
Classified by DRBC as Significant Resource Waters
Nearest upstream Interstate Control Point: 1487 ICP Delaware River at Lambertville
Nearest downstream Interstate Control Point: 1343 ICP Delaware River at Calhoun St. Bridge, Trenton
Known dischargers within upstream reach: Lambertville WWTP, others unknown.
Tributaries to upstream reach: Major tributaries 1463 BCP Pidcock Creek, PA; small tributaries 148.6 Swan Creek, NJ;
148.5 Aquetong Creek, PA; 145.2 Moore Creek, NJ; 144.2 Jericho Creek, PA; 143.2 Fiddler Creek, NJ.
No Stream Stats web site data available because drainage area too large for web site retrieval.
Flow Statistics Associated with Water Quality Samples (calculated by drainage area weighting from USGS gage data):
Max Flow (CFS)
90% Flow (CFS)
75% Flow (CFS)
60% Flow (CFS)
50% Flow (CFS)
40% Flow (CFS)
25% Flow (CFS)
10% Flow (CFS)
Min Flow (CFS)
228,473 25,629 15,198 10,629 8,682 6,963 4,927 3,407 1,887
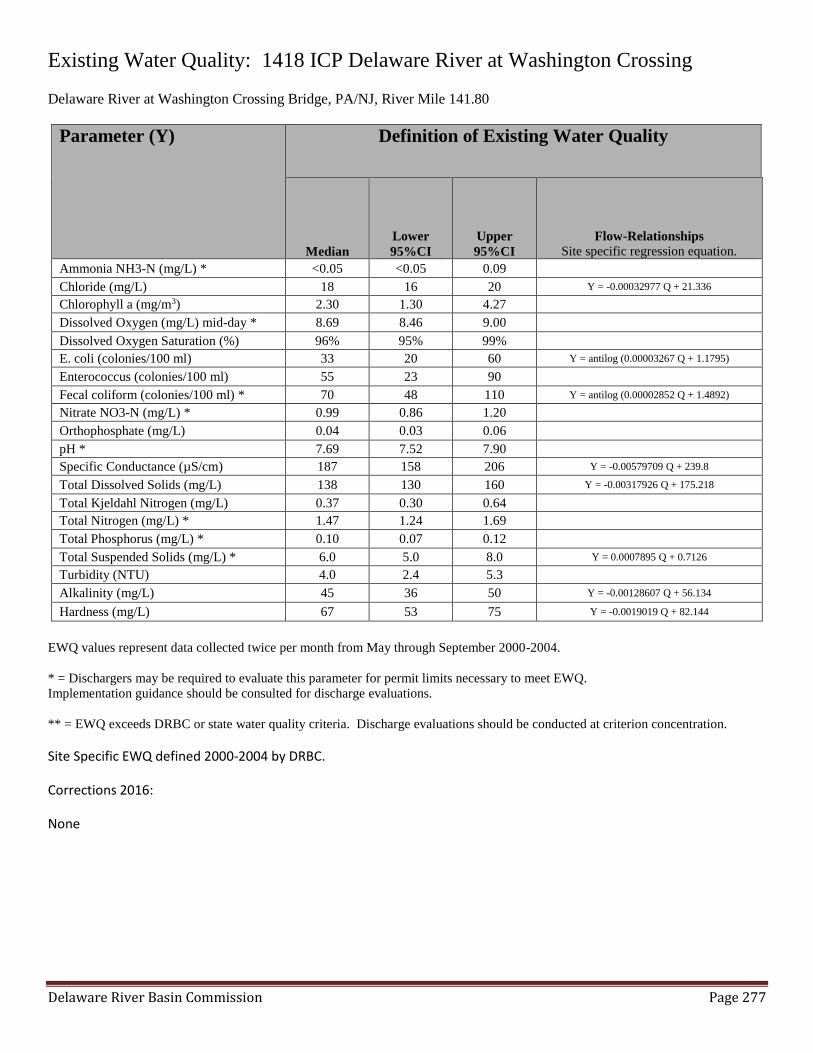
Delaware River Basin Commission Page 277
Existing Water Quality: 1418 ICP Delaware River at Washington Crossing Delaware River at Washington Crossing Bridge, PA/NJ, River Mile 141.80
Parameter (Y) Definition of Existing Water Quality
Median
Lower
95%CI
Upper
95%CI
Flow-Relationships
Site specific regression equation.
Ammonia NH3-N (mg/L) * <0.05 <0.05 0.09
Chloride (mg/L) 18 16 20 Y = -0.00032977 Q + 21.336
Chlorophyll a (mg/m3) 2.30 1.30 4.27
Dissolved Oxygen (mg/L) mid-day * 8.69 8.46 9.00
Dissolved Oxygen Saturation (%) 96% 95% 99%
E. coli (colonies/100 ml) 33 20 60 Y = antilog (0.00003267 Q + 1.1795)
Enterococcus (colonies/100 ml) 55 23 90
Fecal coliform (colonies/100 ml) * 70 48 110 Y = antilog (0.00002852 Q + 1.4892)
Nitrate NO3-N (mg/L) * 0.99 0.86 1.20
Orthophosphate (mg/L) 0.04 0.03 0.06
pH * 7.69 7.52 7.90
Specific Conductance (µS/cm) 187 158 206 Y = -0.00579709 Q + 239.8
Total Dissolved Solids (mg/L) 138 130 160 Y = -0.00317926 Q + 175.218
Total Kjeldahl Nitrogen (mg/L) 0.37 0.30 0.64
Total Nitrogen (mg/L) * 1.47 1.24 1.69
Total Phosphorus (mg/L) * 0.10 0.07 0.12
Total Suspended Solids (mg/L) * 6.0 5.0 8.0 Y = 0.0007895 Q + 0.7126
Turbidity (NTU) 4.0 2.4 5.3
Alkalinity (mg/L) 45 36 50 Y = -0.00128607 Q + 56.134
Hardness (mg/L) 67 53 75 Y = -0.0019019 Q + 82.144
EWQ values represent data collected twice per month from May through September 2000-2004.
* = Dischargers may be required to evaluate this parameter for permit limits necessary to meet EWQ.
Implementation guidance should be consulted for discharge evaluations.
** = EWQ exceeds DRBC or state water quality criteria. Discharge evaluations should be conducted at criterion concentration.
Site Specific EWQ defined 2000-2004 by DRBC.
Corrections 2016:
None
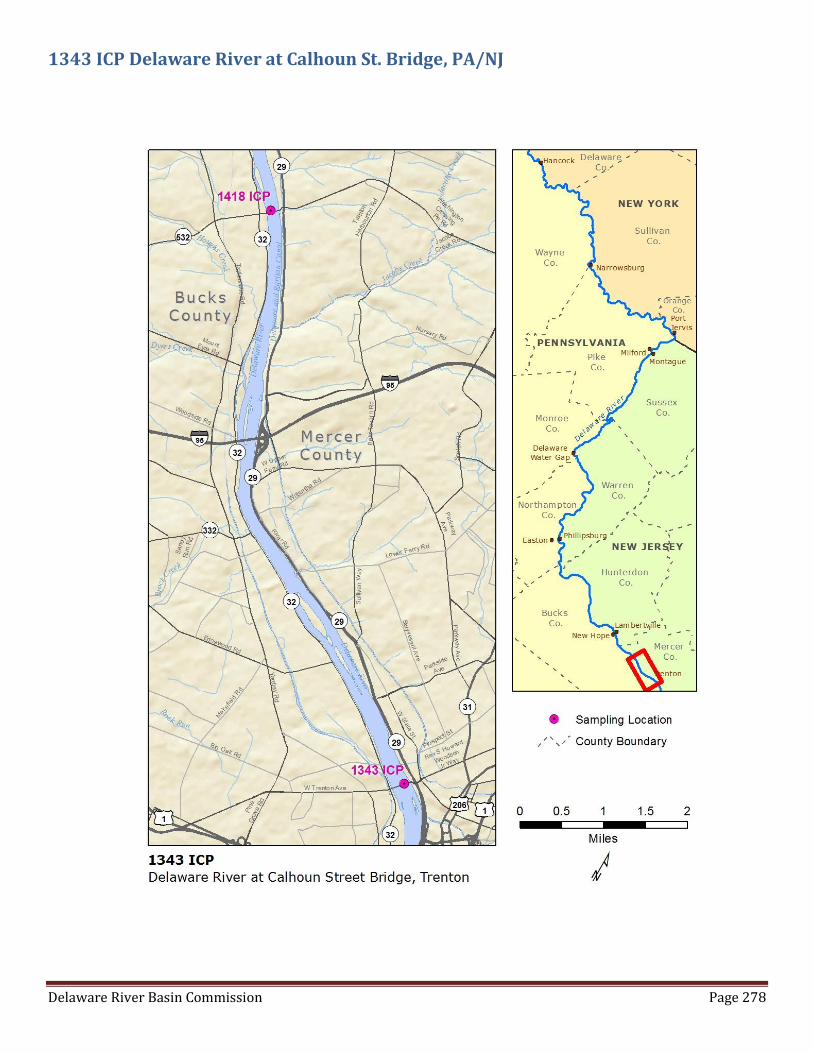
Delaware River Basin Commission Page 278
1343 ICP Delaware River at Calhoun St. Bridge, PA/NJ
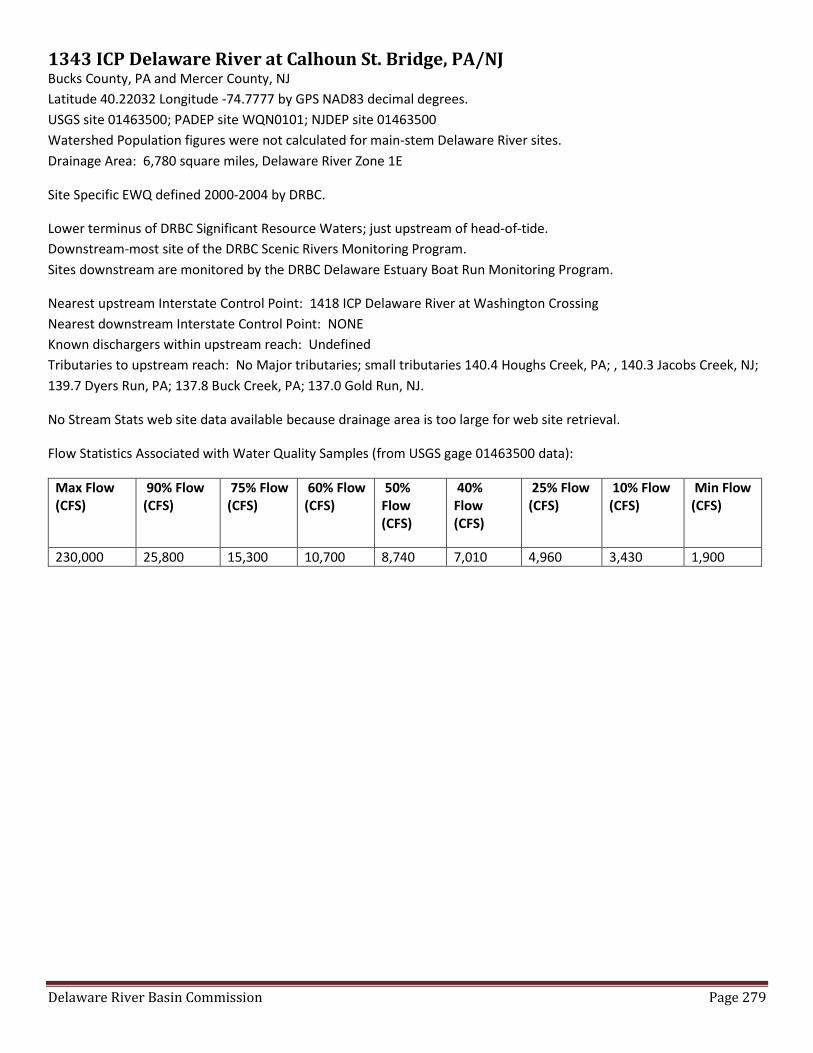
Delaware River Basin Commission Page 279
1343 ICP Delaware River at Calhoun St. Bridge, PA/NJ Bucks County, PA and Mercer County, NJ
Latitude 40.22032 Longitude -74.7777 by GPS NAD83 decimal degrees.
USGS site 01463500; PADEP site WQN0101; NJDEP site 01463500
Watershed Population figures were not calculated for main-stem Delaware River sites.
Drainage Area: 6,780 square miles, Delaware River Zone 1E
Site Specific EWQ defined 2000-2004 by DRBC.
Lower terminus of DRBC Significant Resource Waters; just upstream of head-of-tide.
Downstream-most site of the DRBC Scenic Rivers Monitoring Program.
Sites downstream are monitored by the DRBC Delaware Estuary Boat Run Monitoring Program.
Nearest upstream Interstate Control Point: 1418 ICP Delaware River at Washington Crossing
Nearest downstream Interstate Control Point: NONE
Known dischargers within upstream reach: Undefined
Tributaries to upstream reach: No Major tributaries; small tributaries 140.4 Houghs Creek, PA; , 140.3 Jacobs Creek, NJ;
139.7 Dyers Run, PA; 137.8 Buck Creek, PA; 137.0 Gold Run, NJ.
No Stream Stats web site data available because drainage area is too large for web site retrieval.
Flow Statistics Associated with Water Quality Samples (from USGS gage 01463500 data):
Max Flow (CFS)
90% Flow (CFS)
75% Flow (CFS)
60% Flow (CFS)
50% Flow (CFS)
40% Flow (CFS)
25% Flow (CFS)
10% Flow (CFS)
Min Flow (CFS)
230,000 25,800 15,300 10,700 8,740 7,010 4,960 3,430 1,900
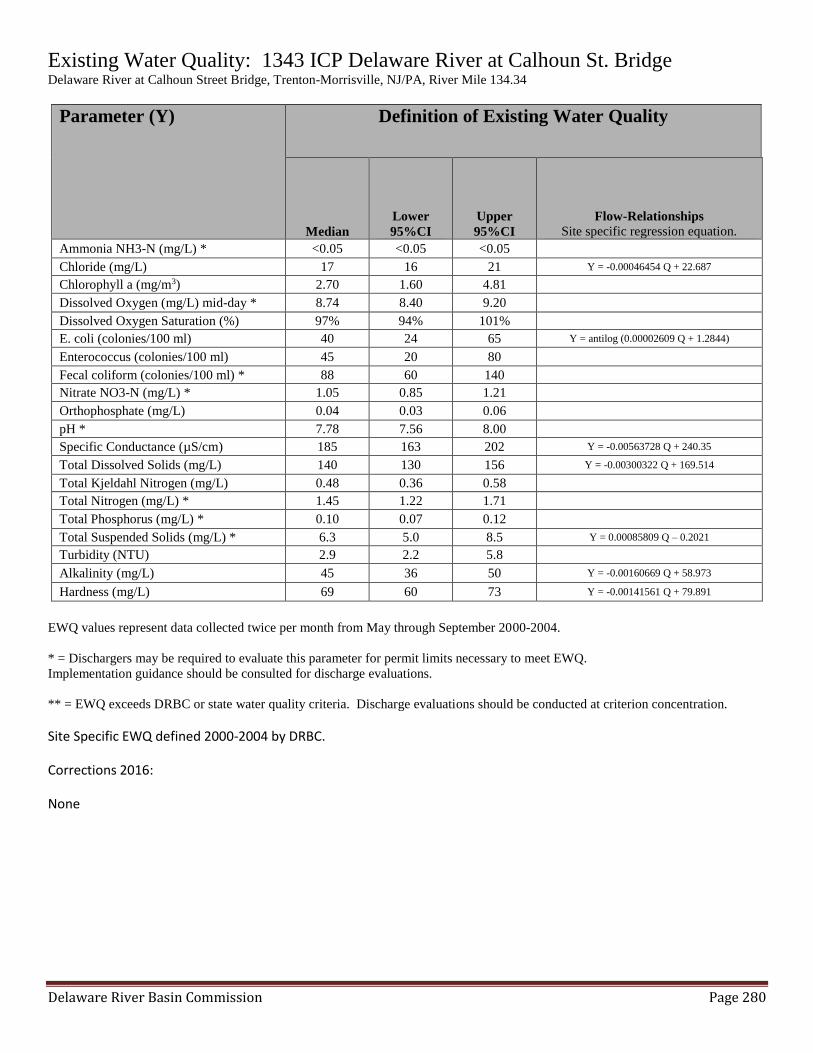
Delaware River Basin Commission Page 280
Existing Water Quality: 1343 ICP Delaware River at Calhoun St. Bridge
Delaware River at Calhoun Street Bridge, Trenton-Morrisville, NJ/PA, River Mile 134.34
Parameter (Y) Definition of Existing Water Quality
Median
Lower
95%CI
Upper
95%CI
Flow-Relationships
Site specific regression equation.
Ammonia NH3-N (mg/L) * <0.05 <0.05 <0.05
Chloride (mg/L) 17 16 21 Y = -0.00046454 Q + 22.687
Chlorophyll a (mg/m3) 2.70 1.60 4.81
Dissolved Oxygen (mg/L) mid-day * 8.74 8.40 9.20
Dissolved Oxygen Saturation (%) 97% 94% 101%
E. coli (colonies/100 ml) 40 24 65 Y = antilog (0.00002609 Q + 1.2844)
Enterococcus (colonies/100 ml) 45 20 80
Fecal coliform (colonies/100 ml) * 88 60 140
Nitrate NO3-N (mg/L) * 1.05 0.85 1.21
Orthophosphate (mg/L) 0.04 0.03 0.06
pH * 7.78 7.56 8.00
Specific Conductance (µS/cm) 185 163 202 Y = -0.00563728 Q + 240.35
Total Dissolved Solids (mg/L) 140 130 156 Y = -0.00300322 Q + 169.514
Total Kjeldahl Nitrogen (mg/L) 0.48 0.36 0.58
Total Nitrogen (mg/L) * 1.45 1.22 1.71
Total Phosphorus (mg/L) * 0.10 0.07 0.12
Total Suspended Solids (mg/L) * 6.3 5.0 8.5 Y = 0.00085809 Q – 0.2021
Turbidity (NTU) 2.9 2.2 5.8
Alkalinity (mg/L) 45 36 50 Y = -0.00160669 Q + 58.973
Hardness (mg/L) 69 60 73 Y = -0.00141561 Q + 79.891
EWQ values represent data collected twice per month from May through September 2000-2004.
* = Dischargers may be required to evaluate this parameter for permit limits necessary to meet EWQ.
Implementation guidance should be consulted for discharge evaluations.
** = EWQ exceeds DRBC or state water quality criteria. Discharge evaluations should be conducted at criterion concentration.
Site Specific EWQ defined 2000-2004 by DRBC.
Corrections 2016:
None
Related Documents