LOW COST G U ID E WAYS U.S. D e p a rtm ent of Transportation Federal Railroad A d m in is tra tio n FOR MAGLEV National Maglev Initiative Washington, DC 20590 ■ i j k DOT/FRA/NMI-92/16 October 1992 This document is available to the Final Report U.S. public through the National Technical Information Service, Springfield, Virginia 22161 r 11 - Advanced Systems

Welcome message from author
This document is posted to help you gain knowledge. Please leave a comment to let me know what you think about it! Share it to your friends and learn new things together.
Transcript
L O W C O S T G U ID E W A Y SU.S. D e p a rtm e n t o f T ra n s p o rta tio n
F e d e ra l R a ilro a d A d m in is tra tio n
F O R M A G L E V
National Maglev Initiative Washington, DC 20590
■i
jk DOT/FRA/NMI-92/16 October 1992 This document is available to the
Final Report U.S. public through the NationalTechnical Information Service,Springfield, Virginia 22161
r
11 - Advanced Systems
1. Report No. DOT/FRA/NMI - 92/16
2. Government Accession No. 3. Recipient's Catalog No.
4. Title and Subtitle LOW COST GUIDEW AYS FOR MAGLEV
5. Report Date October 1992
6. Performing Organization Code
7. Authors(s)R.S. Phelan, R.D. Thornton, J.J. Connor, T.Triantafillou
8. Performing Organization Report No.
9. Performing Organization Name and Address Massachusetts Institute of Technology 77 Massachusetts Avenue Cambridge, M A 02139
10. Work Unit No. (TRAIS)
11. Contract or Grant No. DTFR53-91-C-00076
12. Sponsoring Agency Name and Address U. S. Department of Transportation National Maglev Initiative 400 7th Street, S.W., Room 5106 Washington, D.C. 20590
13. Type of Report and Period Covered Final ReportJune, 1991 - August, 1992
14. Sponsoring Agency Code 5023
15. Supplementary Notes
16. Abstract:
This report presents results o f research aimed at developing structural requirements for a guideway to be used for maglev systems. The work progresses from initial conceptual design to refined structural and cost analyses. The design begins by identifying structural requirements including criteria for geometry, loads deflections, durability, toughness, fatigue and magnetic inertness. Proposed construction methods are analyzed to determine the impact that the choice of method has on both the cost and structural design of the guideway. A conceptual design follows in which the candidate cross sectional shapes and materials are compared. Results o f these comparisons are then used for the optimal preliminary analysis and design. This analysis and design process, based on American Concrete Institute design procedures, is incorporated into a spreadsheet analysis program. This spreadsheet program is then used to determine preliminary design specifications and cost estimates. Sensitivity analyses are also carried out to determine optimal design specifications. A refined analysis is conducted focusing on how the dynamic behavior o f the beam effects the preliminary design choices. A cost comparison is made based on the results o f the refined analysis. Additional work includes discussions o f automated control and magnetic forces on metallic components o f guideways. Also, hybrid reinforced concrete beams reinforced with fiber reinforced plastic, (FRP), rods were cast and tested to address the possibilities o f using FRP rods in maglev guideways. Results o f these tests are presented.
17. KeyWordsmaglev, guideways, reinforced concrete design, structural design, dynamic beam analysis, fiber reinforced plastic, spreadsheet analysis program, magnetic field calculation.
18. Distribution StatementDocument is available to the U.S. Public through the National Technical Information Service Springfield, V A 22161
19. Security Class.(of this report) Unclassified
20. Security Class, (of this page) Unclassified
21. No. of Pages 22. Price 145
Tab le o f Contents
Acknowledgments..................................................................................................................iList of Tables....................................................................................................... ..................iiList of Figures...................................................................................................... ............ :.... iiiList of Symbols.......................................................................................................................v
"■ 1.0 Introduction.................................................................................................................... 12.0 Objectives.......................................................................................................................3
« 3.0 Approach.........................................................................................................................44.0 Task Reports................................................................................................................. 6
4.1 Structural design requirements:.................... ................................................64.1.1 Overview.......................................................................................... 64.1.2 Geometry......................................................................................... 64.1.3 Loads................................................................................................ 94.1.4 Deflections........................ ,............................................................134.1.5 Durability, toughness, fatigue.....................;.................................144.1.6 Magnetic inertness........................................................................... 14
4.2 Construction methods comparison.................................... .............................164.2.1 Overview...........................................................................................164.2.2 Bridge designs................................................................................. 164.2.3 Construction methods..................................................................... 184.2.4 Construction costs............................................................................ 194.2.5 Design philosophy.......................................................................... 21
4.3 Conceptual guideway design and selection of materials .............................224.3.1 Overview.......................................................................................... 224.3.2 Cross-sectional shapes.................................................................... 224.3.3 Structural support mechanisms...................................................... 244.3.4 Influence of switching mechanisms...............................................274.3.5 Material selection criteria............................................................... 284.3.6 Candidate materials............................................................... 29
4.4 Design variable identification........................................................................ 334.4.1 Overview...........................................................................................334.4.2 Box beam formulas (reinforced concrete)....................................334.4.3 Hybrid FRP reinforcement design.................................................474.4.4 Cost Functions................................................................................. 53
* 4.5 Optimal preliminary design............................................................................564.5.1 Overview............................,..................................................... ......56
; 4.5.2 Spreadsheet example............ ......................................................... 564.5.3 Sensitivity analyses.......................................................................... 77
4.6 Dynamic analysis............................................................................................. 824.6.1 Overview...........................................................................................824.6.2 Fundamental guideway beam dynamic behavior........................ 824.6.3 Dynamic amplification factor.........................................................854.6.4 Residual vibration............................................................................90
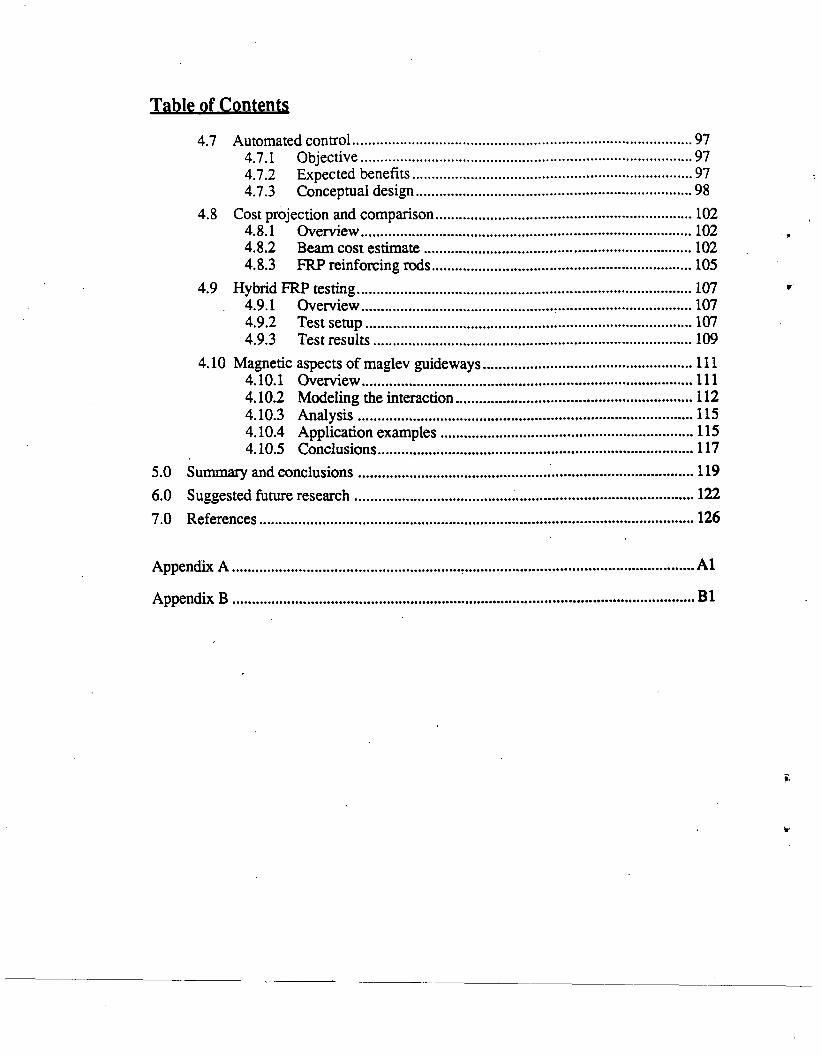
Tab le o f Contents
4.7 Automated control............................................................................................. 974.7.1 Objective.................................................................................. .......974.7.2 Expected benefits.............................................................................974.7.3 Conceptual design............................................................................98
4.8 Cost projection and comparison.......................................................................1024.8.1 Overview........................................................................................... 1024.8.2 Beam cost estimate..........................................................................1024.8.3 FRP reinforcing rods........................................................................105
4.9 Hybrid FRP testing............................................................................................ 1074.9.1 Overview.................................................... 1074.9.2 Test setup..........................................................................................1074.9.3 Test results...................................... 109
4.10 Magnetic aspects of maglev guide ways.........................................................I l l4.10.1 Overview...........................................................................................I l l4.10.2 Modeling the interaction................................................................ 1124.10.3 Analysis........................................................... 1154.10.4 Application examples .....................................................................1154.10.5 Conclusions......................................................................................117
5.0 Summary and conclusions............................................................................................ 1196.0 Suggested future research........................................... 1227.0 References....................................................................................................................... 126
Appendix A ............................................................................................................................. A1
Appendix B ..............................................................................................................................B1
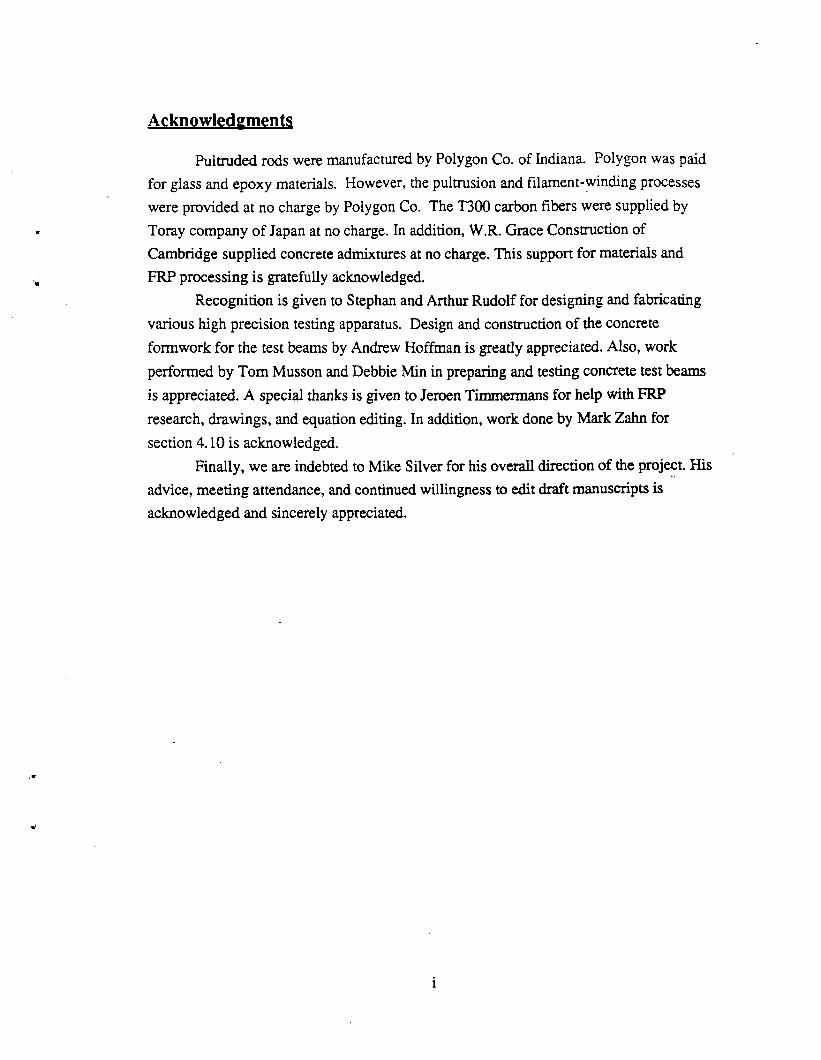
Acknowledgm ents
Pultruded rods were manufactured by Polygon Co. of Indiana. Polygon was paid for glass and epoxy materials. However, the pultrusion and filament-winding processes were provided at no charge by Polygon Co. The T300 carbon fibers were supplied by Toray company of Japan at no charge. In addition, W.R. Grace Construction of Cambridge supplied concrete admixtures at no charge. This support for materials and FRP processing is gratefully acknowledged.
Recognition is given to Stephan and Arthur Rudolf for designing and fabricating various high precision testing apparatus. Design and construction of the concrete formwork for the test beams by Andrew Hoffman is greatly appreciated. Also, work performed by Tom Musson and Debbie Min in preparing and testing concrete test beams is appreciated. A special thanks is given to Jenoen Timmermans for help with FRP research, drawings, and equation editing. In addition, work done by Mark Zahn for
section 4.10 is acknowledged.Finally, we are indebted to Mike Silver for his overall direction of the project. His
advice, meeting attendance, and continued willingness to edit draft manuscripts is acknowledged and sincerely appreciated.
1
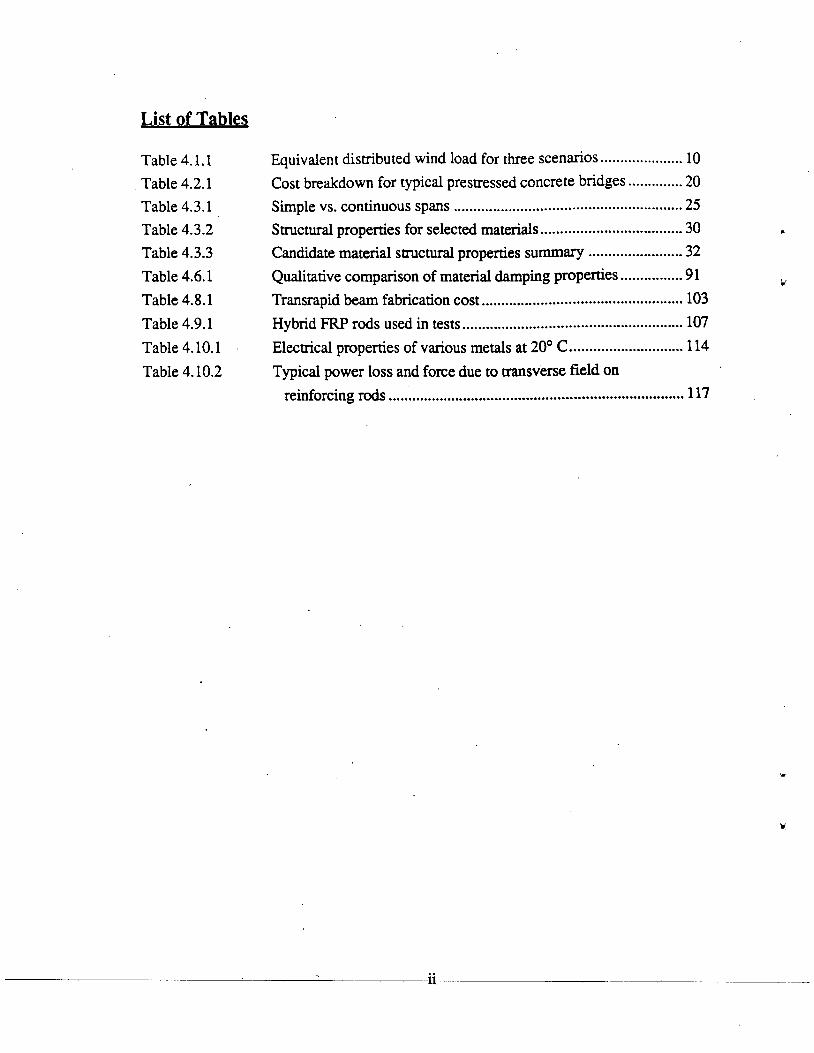
List o f Tables
Table 4.1.1 Equivalent distributed wind load for three scenarios........................10Table 4.2.1 Cost breakdown for typical prestressed concrete bridges................20Table 4.3.1 Simple vs. continuous spans................................................................25Table 4.3.2 Structural properties for selected materials........................................ 30Table 4.3.3 Candidate material structural properties summary...........................32Table 4.6.1 Qualitative comparison of material damping properties.................. 91Table 4.8.1 Transrapid beam fabrication cost........................................................ 103Table 4.9.1 Hybrid FRP rods used in tests..............................................................107Table 4.10.1 Electrical properties of various metals at 20° C.................................114Table 4.10.2 Typical power loss and force due to transverse field on
reinforcing rods................................................................................ 117
w
W
11
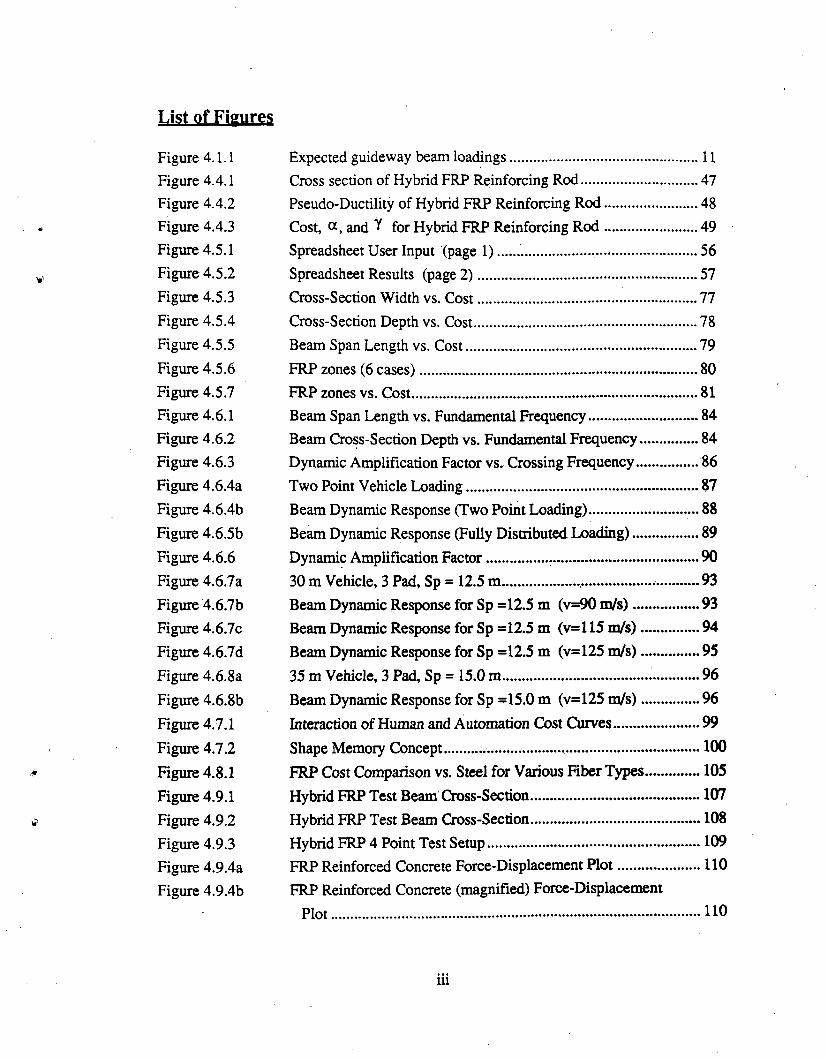
L is t o f F igu re s
Figure 4.1.1 Expected guideway beam loadings.................................................11Figure 4.4.1 Cross section of Hybrid FRP Reinforcing Rod.............................. 47Figure 4.4.2 Pseudo-Ductility of Hybrid FRP Reinforcing Rod........................ 48Figure 4.4.3 Cost, and Y for Hybrid FRP Reinforcing Rod........................ 49Figure 4.5.1 Spreadsheet User Input (page 1)....................... .......................... 56Figure 4.5.2 Spreadsheet Results (page 2 )........................................................ 57Figure 4.5.3 Cross-Section Width vs. Cost........................................................77Figure 4.5.4 Cross-Section Depth vs. Cost.........................................................78Figure 4.5.5 Beam Span Length vs. Cost...........................................................79Figure 4.5.6 FRP zones (6 cases)...................................................................... 80Figure 4.5.7 FRP zones vs. Cost........................................................................ 81Figure 4.6.1 Beam Span Length vs. Fundamental Frequency............................ 84Figure 4.6.2 Beam Cross-Section Depth vs. Fundamental Frequency................84Figure 4.6.3 Dynamic Amplification Factor vs. Crossing Frequency.................86Figure 4.6.4a Two Point Vehicle Loading........................................................... 87Figure 4.6.4b Beam Dynamic Response (Two Point Loading)......................... 88Figure 4.6.5b Beam Dynamic Response (Fully Distributed Loading)..................89Figure 4.6.6 Dynamic Amplification Factor..................................................... 90Figure 4.6.7a 30 m Vehicle, 3 Pad, Sp = 12.5 m.................... 93Figure 4.6.7b Beam Dynamic Response for Sp =12.5 m (v=90 m /s)..................93Figure 4.6.7c Beam Dynamic Response for Sp =12.5 m (v=l 15 m /s)................94Figure 4.6.7d Beam Dynamic Response for Sp =12.5 m (v=125 m /s)................95Figure 4.6.8a 35 m Vehicle, 3 Pad, Sp = 15.0 m.................................................. 96Figure 4.6.8b Beam Dynamic Response for Sp =15.0 m (v=125 m /s)................96Figure 4.7.1 Interaction of Human and Automation Cost Curves.......................99Figure 4.7.2 Shape Memory Concept.............................. 100Figure 4.8.1 FRP Cost Comparison vs. Steel for Various Fiber Types...............105Figure 4.9.1 Hybrid FRP Test Beam'Cross-Section............................................107Figure 4.9.2 Hybrid FRP Test Beam Cross-Section............................................108Figure 4.9.3 Hybrid FRP 4 Point Test Setup.......................................................109Figure 4.9.4a FRP Reinforced Concrete Force-Displacement Plot...................... 110Figure 4.9.4b FRP Reinforced Concrete (magnified) Force-Displacement
Plot............................................................................................HO
in

L ist of F igu res (cont.l
Figure 4.10.1 Transverse field in cylindrical conductors.......... ...........................112Figure 4.10.2 Axial field in cylindrical conductors.............................................. 113
I V
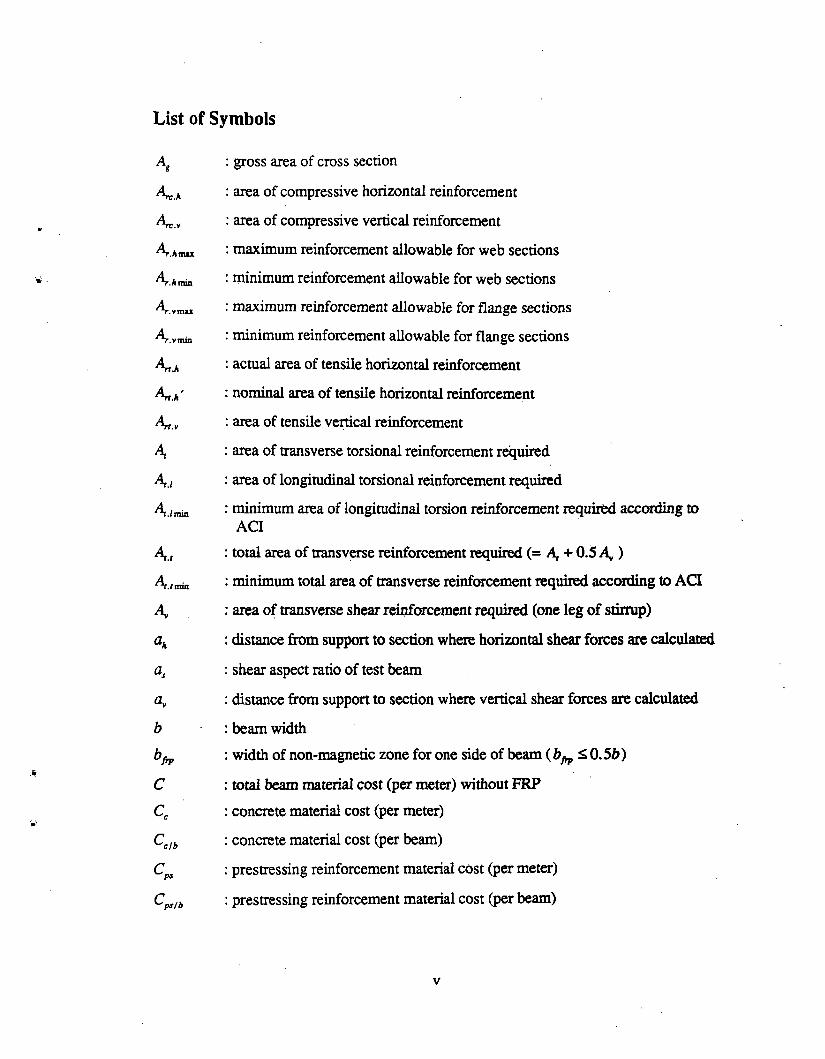
L is t of Sym bo ls
Ag : gross area of cross section
A.* : area of compressive horizontal reinforcement
A.v : area of compressive vertical reinforcement
A-.Amix : maximum reinforcement allowable for web sections
A.Amin : minimum reinforcement allowable for web sections
•' maximum reinforcement allowable for flange sections
A.vmin : minimum reinforcement allowable for flange sections
A .a : actual area of tensile horizontal reinforcement
An h' : nominal area of tensile horizontal reinforcement
A v : area of tensile vertical reinforcement
A : area of transverse torsional reinforcement required
A.i : area of longitudinal torsional reinforcement required
A (min •’ minimum area of longitudinal torsion reinforcement required according to ACI
A., : total area of transverse reinforcement required (= A + 0-5 A )
A.,min : minimum total area of transverse reinforcement required according to ACI
A : area of transverse shear reinforcement required (one leg of stirrup)
ah : distance from support to section where horizontal shear forces are calculated
as : shear aspect ratio of test beam
av : distance from support to section where vertical shear forces are calculated
b : beam widthbfiP : width of non-magnetic zone for one side of beam ( b ^ <.Q.5b)
C : total beam material cost (per meter) without FRPCc : concrete material cost (per meter)
Cclb : concrete material cost (per beam)
: prestressing reinforcement material cost (per meter)
Cps/b : prestressing reinforcement material cost (per beam)
v

Cfo : additional beam material cost (per meter) due to use of FRP
Cfrplb : additional beam material cost (per beam) due to use of FRP
Cr : mild reinforcement material cost (per meter) without FRP
: mild reinforcement material cost (per beam) without FRP
CWJai : total material cost per meter for guideway beam element
Db : diameter of longitudinal reinforcing bar
Dgfrp : diameter of GFRP in pultruded hybrid FRP rod
dv : "effective" depth (top of beam to neutral axis of lower tensile reinforcement)
dh : "effective" horizontal width
dpk : distance from horizontal extreme compression fiber to O.S»b at section a*
dp v : distance from vertical extreme compression fiber to vertical centroid ofprestressing tendons at section av
Ec : concrete modulus
EWrp : modulus of the hybrid FRP reinforcement
: modulus of the pultruded high strength FRP (e.g. GFRP)
Ehn.fib '• modulus of the high modulus fibers (e.g. carbon)
: modulus of the high strength fibers (e.g. glass)
Em : modulus of resin matrix in pultruded hybrid FRP rod
Er : concrete tensile reinforcement moduluse : midspan eccentricity of parabolic tendon profile
ea : eccentricity of prestress at section av
eh : eccentricity between the centers of gravity of the vehicle and the guideway
ema : maximum amount of eccentricity available for prestressing for the givensection
Fj : force in rod just before carbon fiber rupture
Fav : fraction of beam depth, h, where Fm»h equals av
: fraction of beam width, b, where F ^ b equals ah
Fd : dead load uncertainty multiplying factor
Fh : horizontal load uncertainty multiplying factor
F ^ : ratio of hybrid FRP cost to steel on a stiffness basis
vi

•*
: long tenn strength loss fraction due to relaxation of prestressing tendons
Fw ti : ratio of compressive horizontal reinforcement, Arc.h, to required horizontal tensile reinforcement, Arth
Fw v : ratio of compressive vertical reinforcement, Arc.v, to required vertical tensile reinforcement, Art,v
Fp : force in rod just after carbon fiber rupture
Fm : fraction of reinforcement allowed with respect to area of section
Ft : factor used to calculate minimum amounts of stirrup and torsionreinforcement required
Fu : ultimate load carrying capacity of rod
Fv : vertical load uncertainty multiplying factor
f x : first fundamental frequency of beam
f cc : maximum compression allowable for concrete section
f c ‘ : maximum tension allowable for concrete section
f ivn.fib '■ tensile strength of the high modulus fibers
fks.fib '■ tensile strength of the high strength fibers
h : beam depth
h fn> : depth of non-magnetic zone for one side of beam ( h ^ < h )
Ig h : horizontal moment of inertia for the box section
l gv : vertical moment of inertia for the box section
: horizontal deflection constraint
kAv : vertical deflection constraint
L : length of the beam
Lv : actual vehicle length
L* : "convergent" length of fully distributed vehicle where no residual beam vibrations occur
Mcr h : net horizontal cracking moment at section ah
Mcr v : net vertical cracking moment at section av
M d : unfactored moment due to dead loadM . : maximum vertical moment due to factored loads at section ahimx.n
v u

Mm*.* •' maximum vertical moment due to factored loads at section av
Mn h : required horizontal bending moment
M, v : required vertical bending momentn : ratio of reinforcement modulus to concrete modulusP : amount of prestressing force required to satisfy deflection and tension
constraintsPe : minimum amount of prestressing force required to control deflection
considering maximum possible eccentricity of sectionPh : concentrated horizontal midspan load
PAmax : maximum amount of prestressing force allowed to limit compressive stress in concrete section under horizontal bending
PAmin : minimum amount of prestressing force required to limit tensile stress in concrete section under horizontal bending
Pv : concentrated vertical midspan load
Pvmax : maximum amount of prestressing force allowed to limit compressive stress in concrete section under vertical bending
Pvmin : minimum amount of prestressing force required to limit tensile stress in concrete section under vertical bending
Sp : actual vehicle pad spacing
S ‘ : "convergent" vehicle pad spacing where no residual beam vibrations occur
s : stirrup spacing
r„ : nominal (required) torsion to be resisted by beam
Tn mix : maximum allowable torsion capacity of the beam
Tu : factored torsion
1 : thickness of box beamtCFRP : thickness of CFRP overwrap in pultruded hybrid FRP rod
uc : unit cost of concrete
u^p : unit cost of the hybrid FRP reinforcement
Uftm.fib '• UHitcost °f high modulus fibers
Uiu.fib ’■ unh cost of the high strength fibers
un : unit cost of the resin matrix
ur : unit cost of concrete tensile reinforcement (e.g. steel)
v m
I
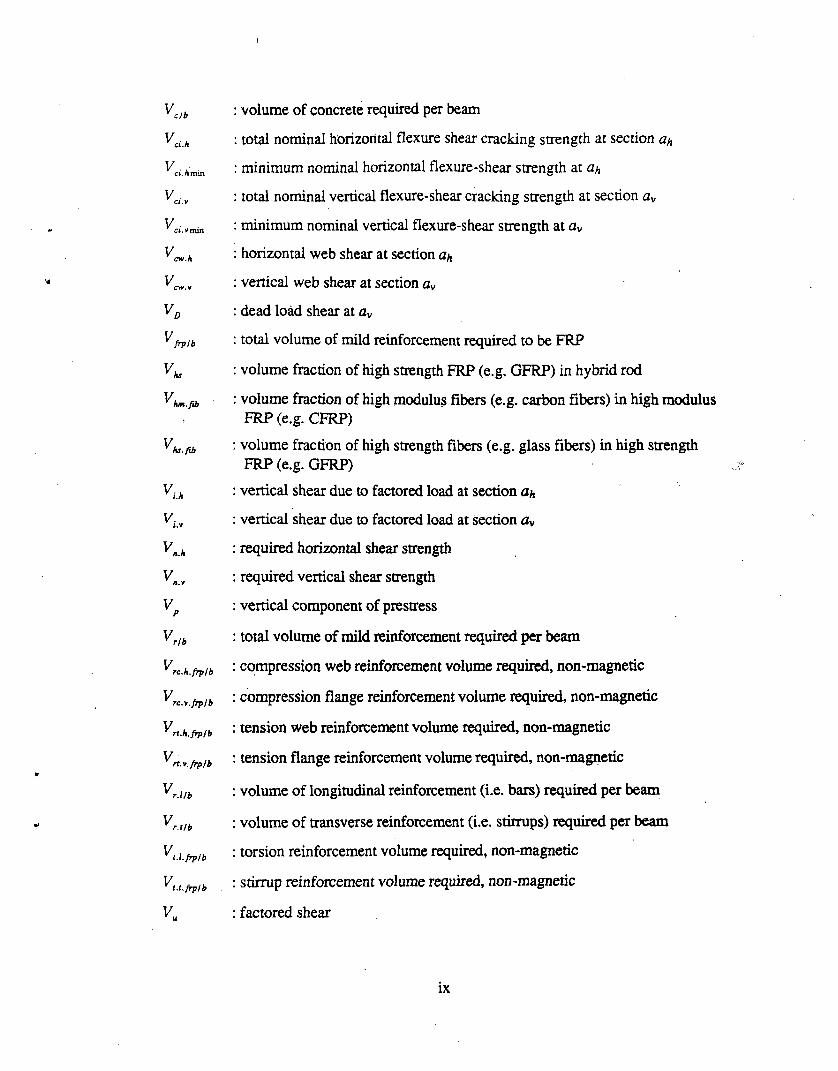
V clb
yv ci.h
V ■ci. Amin
V.,Vcw.h
V .
Vr
Vfrplb
hs
fun.fib
ks.fib
V;i.h
V:,
n.h
V .
rib
rc.h.frpfb
rc.v.frpfb
rt.h.frpfb
rt. v. frplb
r.lfb
r.t/b
v ,1./. frplb
l.l. frplb
v„
: volume of concrete required per beam
: total nominal horizontal flexure shear cracking strength at section a/,
: minimum nominal horizontal flexure-shear strength at
: total nominal vertical flexure-shear cracking strength at section av
: minimum nominal vertical flexure-shear strength at av
: horizontal web shear at section
: vertical web shear at section av
: dead load shear at av
: total volume of mild reinforcement required to be FRP
: volume fraction of high strength FRP (e.g. GFRP) in hybrid rod
: volume fraction of high modulus fibers (e.g. carbon fibers) in high modulus FRP (e.g. CFRP)
: volume fraction of high strength fibers (e.g. glass fibers) in high strength FRP (e.g. GFRP)
: vertical shear due to factored load at section a*
: vertical shear due to factored load at section av
: required horizontal shear strength
: required vertical shear strength
: vertical component of prestress
: total volume of mild reinforcement required per beam
: compression web reinforcement volume required, non-magnetic
: compression flange reinforcement volume required, non-magnetic
: tension web reinforcement volume required, non-magnetic
: tension flange reinforcement volume required, non-magnetic
: volume of longitudinal reinforcement (i.e. bars) required per beam
: volume of transverse reinforcement (i.e. stirrups) required per beam
: torsion reinforcement volume required, non-magnetic
: stirrup reinforcement volume required, non-magnetic
: factored shear
IX

v : velocity of vehiclewD : dead load
wh : distributed horizontal load
wm : distributed magnetic motor winding load
w, mix : maximum tension allowable in section
wv : distributed vertical load
X x : horizontal distance between edges of stirrup confinement cage
Yj : vertical distance between edges of stirrup confinement cage
yc h : horizontal distance from side of section to mass center
y c v : vertical distance from top of section to mass center
y l h : horizontal distance from bending neutral axis to the extreme tension fiber inthe cross section
y ,,v : vertical distance from the bending neutral axis to the extreme tension fiber inthe cross section
a : ratio of Fx to Fp of hybrid FRP rod
a ra„ : maximum value of a for hybrid FRP rod to ensure ductility
a r : fraction of yield strain permissible during service load
a , : torsional strength coefficient
j3x : strength reduction factor for concrete based on the working stress blockdesign
y : ratio of Fu to F{ of hybrid FRP rod
: minimum value of y for hybrid FRP rod to ensure reserve strength capacity
Yps^i.psi ' prestress factors
e * : ultimate strain of concrete in compression
e ] : ultimate strain of the high modulus fibers and yield strain of hybrid FRP rod
: ultimate strain of the high strength fibers and the hybrid FRP rod
£° : concrete tensile reinforcement (e.g. steel) strain during service load
e / : mild (e.g. steel) reinforcement strain before yield
(j) : material uncertainty reduction factor due to bending
0' : material uncertainty reduction factor due to shear and torsion
x
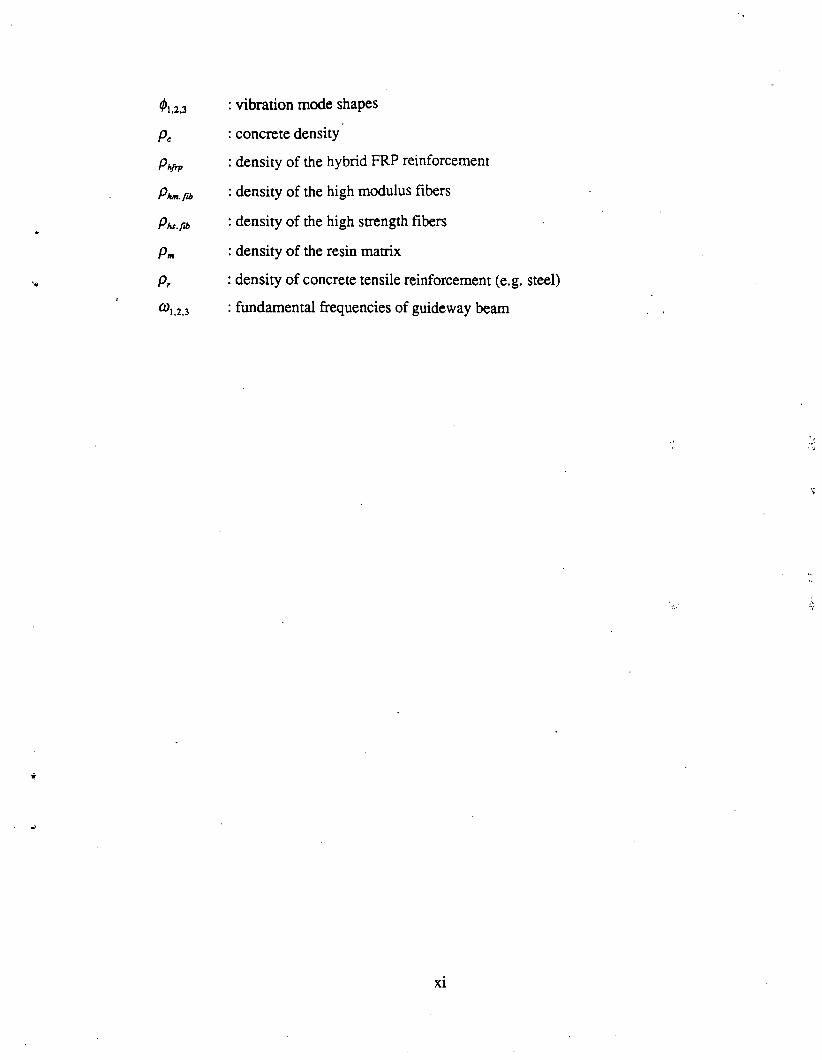
01,2,3 : vibration mode shapes
p c : concrete density
p ^ : density of the hybrid FRP reinforcement
Pkm.ru, '• density of the high modulus fibers
Phi.fib ’ density of the high strength fibers
p m : density of the resin matrix
p r : density of concrete tensile reinforcement (e.g. steel)
2,3 : fundamental frequencies of guideway beam
xi
1.0 In troduction
Successful implementation of maglev technology in the U.S. depends gready on a low cost guideway system. Guideway construction costs are estimated to represent from 50% to 70% of all capital costs for a high speed maglev system.1 Consequently, low cost guideway design is a top initial priority for a national maglev system. Many maglev concepts today appear to have considered guideway design only after vehicle design was well developed, leading to expensive guideway systems with litde possibility for cost reduction by the structural engineer. This report focuses on the investigation of a low cost maglev design, specifically a low cost narrow beam guideway system. A narrow beam is selected with the objective of reducing the overall cost of the guideway system. A narrow box beam guideway design is applicable to both electro-dynamic suspension, EDS, and electro-mechanical suspension, EMS, systems, though an EDS system is assumed.
Design and use of non-magnetic fiber reinforced plastic, FRP, reinforcement is presented in this report. The expected requirement of non-magnetic concrete reinforcement for maglev systems, results from the conviction that EDS systems will prove to be the more economical suspension system. Because steel girders cannot be used with EDS systems and because the use of mild steel reinforcement in concrete near high magnetic fields will be limited or not allowed, a non magnetic substitute for steel reinforcement is required. This report provides a design approach for using non-magnetic fiber reinforced plastic, FRP, as concrete reinforcement. Results of load-displacement tests performed on several FRP reinforced concrete beams are given. A theoretical approach for determining the interaction of magnetic fields with metals is also presented.
The development and use of a simplified spreadsheet analysis program for evaluating overall material costs for a reinforced concrete hollow box guideway beam under a variety of vehicle loading conditions, beam span lengths, widths, depths, material properties, and costs are included along with a step by step example demonstrating the use of the spreadsheet. In addition to cost analysis, beam dynamic behavior under a variety of vehicle lengths and pad ditributions is analyzed. The concept of designing for "convergent" vehicle lengths and pad distribution cases whereby beam residual vibrations are canceled completely without damping is presented. This report provides a preliminary
1 Phelan, R.S. and J.M. Sussman, "Maglev Technology: A Look at Guideway and Maintenance Concerns’', Applications of Advanced Technologies in Transportation Engineering, Proceedings of the Second International Conference, American Society of Civil Engineers, 1991, p. 193-197.
1

look at the potential of automation of construction and maintenance procedures for theguideway system.
w
2
2.0 Objectives
Primary objectives are as follows:1establish standard beam width for low cost maglev guideway develop non-magnetic reinforcement design methodology using fiber reinforced plastic (FRP)develop an analysis program for guideway beam material costs and perform sensitivity analyses using the programpropose optimized guideway beam cross section using FRP reinforcement investigate dynamic behavior of the guideway beam element under high speed vehicle loadingsprovide a preliminary approach for automation of construction and maintenance of the guideway systempresent an approach for calculating forces and power losses resulting from interaction between metals and magnetic fields develop and test the hybrid FRP concrete reinforcing rod concept
1 Other specific objectives are listed in the statement of work for the contract
3
3 . 0 A p p r o a c h
The study is divided into ten tasks as listed in the following section. Tasks are numbered to correspond with contract task numbers. Subsections 4.1 to 4.3 describe overall maglev guideway structural design requirements, conventional elevated bridge construction techniques and costs, and the rationale for using a narrow box beam cross section and for the use of hybrid FRP material in selected portions of the beam cross section.
A major focus of this research is the development and use of a simplified spreadsheet analysis program for evaluating overall material costs for a reinforced concrete hollow box guideway beam under a variety of: vehicle loading conditions, beam span lengths, widths, depths, material properties, and costs. The primary use of the program is to allow quick calculations for a variety of scenarios, so that recommendations for standard beam widths, lengths, and depths can be made. Governing equations used in the program along with design assumptions are detailed in 4.4. The analysis program is included with this report along with a step by step example demonstrating its use in 4.5. Beam cost and frequency sensitivity analyses shown in this report are based on results from the analysis program. Overall material costs for the beam are calculated for cases both with and without FRP concrete reinforcement.
Dynamic analysis of the guideway beam when subjected to the passage of high speed vehicles is presented in 4.6. Dynamic analysis is performed using the ADINA dynamic finite element analysis program. Only the force of the traveling vehicle on a simply-supported span is modeled in this report.1 Both the dynamic amplification factor and the residual vibration behavior of the beam are analyzed for simple spans. A close interaction between vehicle speed, vehicle pad distribution, and beam frequency with respect to beam residual vibration for various vehicle load distributions is demonstrated.
The potential for cost reduction through better design of specific guideway components and the implementation of automated production, erection, and monitoring techniques is covered. The potential for guideway maintenance automation is discussed in 4.7. A cost comparison between the narrow hollow box beam and a "standard" maglev guideway beam, along with the potential for FRP cost reduction, is presented in 4.8. Tests performed on hybrid FRP reinforced concrete beams are presented in 4.9. Power losses and forces between steel rods of various diameters when exposed to both static and
1 Additional research into dynamic effects of vehicle mass and continuous support mechanisms is recommended in section 6.0.
A

traveling magnetic fields is discussed in 4.10. Quantitative predictions are given along with specific recommendations to reduce interactions.
The report concludes with a summary of research and a listing of major conclusions in section 5.0, and suggestions for neeed future research in section 6.0.
4 .0 T ask R ep orts
4.1 S tru ctu ra l d esign req u irem en ts:
4.1.1 OverviewThe design of an acceptable maglev structural system must satisfy a range of
functional requirements--not only traditional primary requirements such as structural strength and stiffness, but also secondary requirements, such as dynamic response, fatigue, durability, maintainability, and the magnetic interference of the structure. For high speed maglev structural systems, these secondary design issues may become controlling constraints.
The intent of Task 4.1 is to outline various design requirements so that reasonable design criteria can be determined. Design requirements include geometry o f the structure, structural loads, load effects, durability, and magnetic interference of the structural system. Geometric design constraints include limits on span length, beam width, and depth as well as minimum elevation requirements. Loads include the weight o f the beam, vehicle loads, wind and snow loads, earthquake loads, and thermal stresses due to temperature fluctuations. Load effect constraints (e.g. deflection and vibration limits) influence not only material selection and cross sectional shape, but even more fundamentally, initial conception and design of specific structural systems. Durability requirements are concerned primarily with corrosion resistibility both of the exterior structure and embedded materials. Specific maglev structural requirements are discussed in detail in the following sections.
4.1.2 GeometrySpan length
In general, an optimal span length exists for elevated structures. Shorter spans
reduce beam cost, but increase overall column, footing, and earthwork costs. Beam costs vary approximately with the square of the span length, whereas column and foundation costs (for a given height) are proportional to the number of columns required, Le. to the inverse of beam length. The number of columns, in turn, is determined by the length of the span. A typical maglev corridor will traverse several hundred kilometers. For such large distances, it is more economical to use standard span lengths for the entire guideway system than to design site-specific structural elements. Significant cost savings for beam elements using off-site fabrication and automation are possible. Thus, standardization of the beam length is desirable. Substantial cost savings resulting from
6
automation will be more difficult for column and footing designs as design and construction of these elements are generally site-specific.
For high speed maglev design, intermediate spans (20-30m) are likely to be required.1 For elevated sections (i.e. elevated higher than 6 m), a 1985 Canadian Institute of Guided Ground Transportation, CIGGT, study considers a beam length of approximately 25 m as standard.2 The Transrapid test track at Emsland, Germany has used a variety of spans concentrating primarily on 25 m spans as standard, though some spans range as high as 37 m.3
Though a 25 m span appears desirable, it may not always be feasible. Other factors such as heavy vehicle and/or payload weight as well as the weight of the beam itself can limit the practical span length due to excessive deflections and cost. Constraints such as these appear to have limited the standard span length selected for the new Japanese Yamanaski maglev test track. This track, scheduled to be completed in the late 1990s, has standard span lengths of 15.8 m. The choice o f such a short span length is likely the result o f the high dead load of the U-shaped channel guideway.
In general, shorter, variable span lengths are less aesthetically pleasing than longer, uniform span lengths. For the present analysis, 25 m is used as the standard span length. A sensitivity analysis is performed for spans ranging from 12.5 m to 35 m in section 4.5 to help determine which span length best meets all objectives.
Beam widthBeam width limits are determined primarily by the dimensions o f the vehicle and
the relationship between the guideway and the vehicle. For example, because the Japanese MLU-002 vehicle has a width of 3.0 nr4 and must ride inside a U-shaped guideway, the guideway is 4.0 m in width.5 Other maglev conceptual systems designed to
ride within guideway walls will have similar beam widths. The German Transrapid system, though wrapping around the guideway, also has relatively large width requirements as practically the entire width of the vehicle rests on the beam element. Nonetheless, the Transrapid system's 3.0 m guideway beam width is less than the MLU
1 Span length also influences the choice of continuity of the structural system (e.g. continuous vs. simply supported), and this is discussed in section 4.3.2 CIGGT 9.2, Maglev Technology Assessment, Task 9.2: Review, Validation and Revision of the Capital and Operating Costs for a Transrapid TR-06 Maglev System and for a TGV System in the Las Vegas- Southern California Corridor, Super-Speed Ground Transportation System Las Vegas/Southem California Corridor Phase II, The Canadian Institute of Guided Ground Transport, July 28,1989.3 Heinrich, I.K and I Jt. Kretzschmar, Transrapid Maglev System, p. 21-44, HESTRA-VERLAG, 1989. _4 Takeda, H. "Japanese Superconducting Maglev: Present State and Future Perspective", Magnetic Levitation Technology for Advanced Transit Systems, SAE SP-792, Aug, 1989, p. 57-62.5 The 4.0m width is estimated from a scale drawing and is dependent on a) the vehicle width of 3.0 m, b) the airgap, c) the magnet width and d) the width of vertical beam cantilever (i.e. the wall width).
7
system's. The Japanese HSST guideway system consists of twin metal rails projected out from and attached to a concrete hollow box beam. The width of the concrete beam is approximately 1.4 m; with the metal rails the total width of the beam is 2.5 m.6
Though current guideway designs for the most promising maglev systems have
beam width requirements equal to or in excess of 3.0 m, it is felt that a minimum cost guideway can be achieved using a narrower beam element. A maglev system operating on a narrow, hollow box beam guideway has been discussed as a method for significantly reducing overall guideway costs.7 Currently, it is felt that a guideway system with a beam width of 1.2 m to 1.6 m is feasible and, unless otherwise determined impractical, a maximum beam width criterion of 1.6 m should be considered. However, the sensitivity analyses will examine a range of beam widths (1.0m to 2.0m) for a variety of loading patterns.
Beam depthWe assume that the structure is to be elevated in order to pass over other
structures within its right of way (i.e. rivers, highways, railways, etc.). Therefore, beam depth requirements are not as significant as other geometrical considerations such as beam width and span length. For larger capacity, the depth of the beam is increased. For stability concerns, the depth to thickness ratio must be constrained. Also, as with any elevated structure subjected to significant wind forces, the depth is constrained as much as is practically possible in order to reduce wind load and to increase torsional stability. With the expectation of relatively large torsional moments and stringent wind resistant behavior, it is assumed the beam depth should not exceed approximately 1.5 times its width (i.e. approximately 2.1 m for a 1.4 m wide beam) to adequately resist torsion and
bending. Again, though depth should be minimized, an analysis package should be capable of studying a variety of imposed depth constraints. As discussed in Task 4.4, maximizing the depth tends to minimize the mild steel required—and thus minimizes the cost. Therefore, from a cost standpoint, maximizing the depth may be advantageous.
6 Hayashi A. and A. Ohishi, "HSST MAGLEV Train at Yokohama Expo "89, Magnetic Levitation Technology for Advanced Transit Systems, SAE SP-792, Aug, 1989, p. 23-32.7 Thornton, R.D., "Monorail Maglev", Magnetic Levitation and Transportation Strategies, Future Transportation Technology Conference and Display, San Diego, CA August 13-16,1990, SAE Publication SP-834, Paper #90479, p. 61-67.

4.1.3 LoadsDead weight
Both the weight of the beam (e.g. concrete, steel) and the weight the structure attached to the beam (e.g. the aluminum suspension, propulsion, and guidance system) constitute the beam dead weight loading. This loading can be considered uniformly distributed. Normally, this dead load would result in a deflection in the beam. To improve ride quality, minimal dead load deflection is desirable. Prestressed tendons can be arranged in order to compensate for the dead load resulting in either zero dead load deflection or a slight upward camber. For a typical 25 m narrow span, the dead load would be approximately 20-30 N/m (mass of 2.0-3.0 tonnes/m).
Vehicle toadVehicle loads can range from uniformly distributed to concentrated depending on
the pad distribution of the vehicle.8 Though any vehicle pad distribution can be accommodated through structural design, generally the more distributed the load, the lower the cost of the guideway, as size and strength requirements for the guideway are directly influenced by the distribution of the vehicle loading. An example o f two cases is helpful. For a span length, L, a concentrated midspan load of coL, where (0 is the uniformly distributed load (e.g. 20 kN/m), has a midspan deflection 60% greater than that resulting from a distributed loading of ( 0 for a simply supported structure (i.e. tuL4/48 vs. 5coL4/384, respectively). In addition, the midspan bending moment for the
concentrated loading is 2 times greater than for a fully distributed loading. Therefore, from an economical guideway design perspective, a loading that is almost or completely
distributed is desirable.It is expected that a vehicle loading will be approximately 20 kN/m, however, it is
unknown how completely this load will be distributed. According to ACI code, live loads are multiplied by a factor of 1.7 to account for uncertainties in the actual live load. The analysis performed has incorporated the 1.7 live load uncertainty factor in its calculations. Because load w ill be controlled on a maglev system, the 1.7 live load factor is conservative. Future refined analyses will likely use a less severe factor.
Note the approximate 20 kN/m distributed loading is structurally less demanding than typical high speed rail, HSR, loading requirements. For example, both the French TGV and the German ICE trainsets carry approximately 200 kN per axle load.9
8 See section 4.6.9 Kuiz, D.E., “Beyond the IC-Express”, Railway Gazette International, May 1991, pp. 299-303.
9

Wind loadsWind loads are also considered live loads and thus, estimated values (shown
below) are multiplied by a 1.7 safety factor when analyzed. Preliminary unfactored load estimations are presented for three cases.10 The first case is for a vehicle traveling at full speed in a 27m/s wind. The second case is for a stationary vehicle on the guideway in a 54 m/s wind. The third case is for the guideway with no vehicle in a 90 m/s wind. Each of these three scenarios produces a different uniform horizontal pressure on the guideway and the moving vehicle produces a concentrated horizontal force on the guideway near the nose of the vehicle. The three scenarios, along with the equivalent horizontal wind loads are:
1) 27 m/s (60 mph) wind (vehicle @ 134 m/s) = 89.24 kN concentrated + 2.94 kN/m distributed—cqmvdlent distributed load= 10.10 kN/m (1.03 tonnelm mass)
2) 54 m/s (120 mph) horizontal wind load (vehicle stationary)
= 14.71 kN/m (150 tonnelm mass)3) 90 m/s (200 mph) horizontal wind load (no vehicle)
= 22.06 kN/m (225 tonnelm mass)These three scenarios are summarized in Table 4.1.1.
4,1.1 Equivalent distributed wind load for three scenarios
wind speed(m/s)
vehicle on euidewav?
vehiclemoving?
concentrated load (kN)
distributed load (kN/m)
equivalent distributed load (kN/m)
27 ves ves 89.24 2.94 10.1054 ves no 0 14.71 14.7190 no no 0 2106 2106
Currently, the 90 m/s wind scenario with no vehicle on the guideway appears to be the worst case design scenario for strength. Considering deflection constraints, however, the 27 m/s wind scenario will probably be the controlling case since deflection criteria is likely to be set for passenger comfort in a moving vehicle. Nonetheless, the 54 m/s wind scenario, with the higher expected loading, and with stiffness constraints for a moving vehicle (even though the vehicle is not moving) is used in this analysis to generate a
conservative estimate.In addition to side sway, wind loads produce torsion in the guideway due to the
eccentricity between beam and vehicle centers of gravity. For example, the distributed 54 m/s wind load, produces a 14.71 kN/m distributed horizontal load acting with a 3.00 m
10 Horizontal wind load estimates have been supplied by Tim Barrows, Draper Labs, Cambridge MA.
10
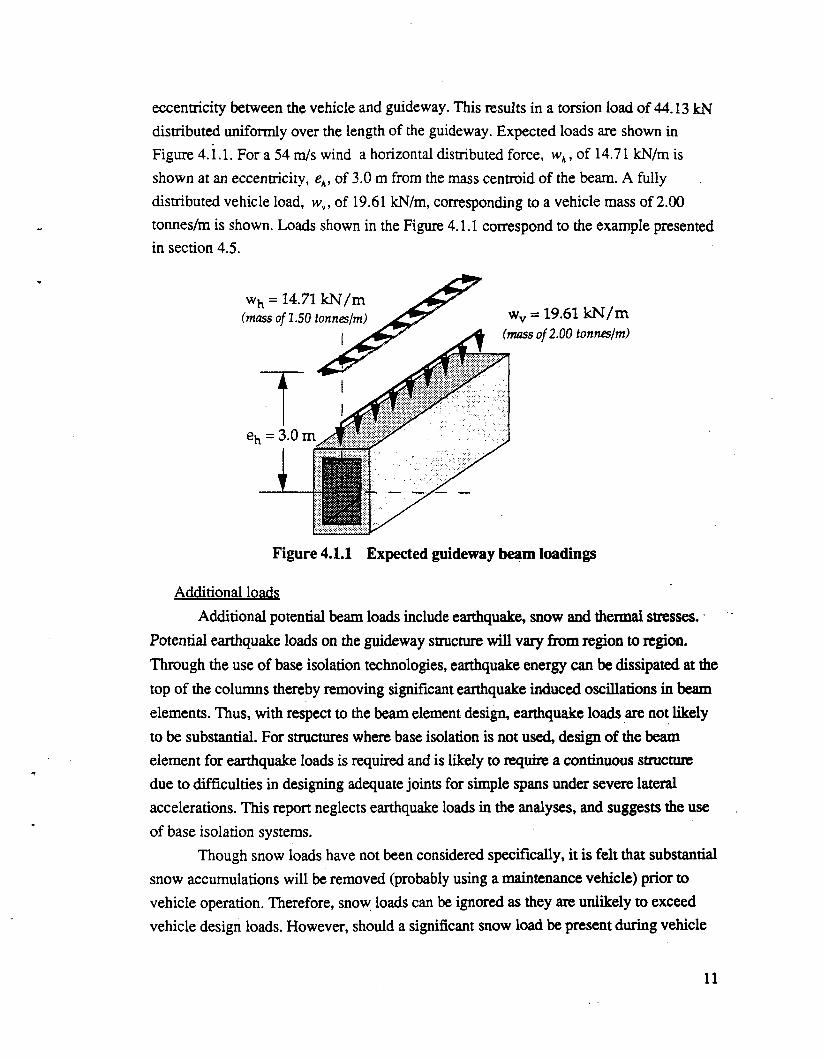
eccentricity between the vehicle and guide way. This results in a torsion load of 44.13 kN distributed uniformly over the length of the guideway. Expected loads are shown in Figure 4.1.1. For a 54 m/s wind a horizontal distributed force, wh, of 14.71 kN/m is shown at an eccentricity, ek, of 3.0 m from the mass centroid of the beam. A fully distributed vehicle load, wv, of 19.61 kN/m, corresponding to a vehicle mass of 2.00 tonnes/m is shown. Loads shown in the Figure 4.1.1 correspond to the example presented in section 4.5.
wh = 14.71 k N /m (mass of 1.50 tonnes/m) wv = 19.61 kN /m
(mass of 2.00 tonnes/m)
Figure 4.1.1 Expected guideway beam loadings
Additional loads
Additional potential beam loads include earthquake, snow and thermal stresses. Potential earthquake loads on the guideway structure will vary from region to region. Through the use of base isolation technologies, earthquake energy can be dissipated at the
top of the columns thereby removing significant earthquake induced oscillations in beam elements. Thus, with respect to the beam element design, earthquake loads are not likely to be substantial. For structures where base isolation is not used, design of the beam element for earthquake loads is required and is likely to require a continuous structure due to difficulties in designing adequate joints for simple spans under severe lateral accelerations. This report neglects earthquake loads in the analyses, and suggests the use
of base isolation systems.Though snow loads have not been considered specifically, it is felt that substantial
snow accumulations will be removed (probably using a maintenance vehicle) prior to vehicle operation. Therefore, snow loads can be ignored as they are unlikely to exceed vehicle design loads. However, should a significant snow load be present during vehicle
11
operation, it would be considered as an additional live load with a 1.7 design safety factor
imposed.Temperature effect loadings include stresses induced by strains resulting from
temperature fluctuations. The coefficient of thermal expansion for steel and concrete is approximately 11 x 10'6 /°C, while for aluminum it is 23 x 10'6/°C. If beam endpoints are constrained, changes in temperature induce thermal stresses. An unconstrained 25 m steel reinforced concrete beam element cast at 20°C will contract by 6.9 mm at -5°C and no stresses will be induced. In contrast, an unconstrained solid aluminum beam of equal span subjected to the same temperature fluctuation would contract 14.4 mm. We propose a simply supported beam in 4.3. With joints at each support, no thermal stresses due to expansion and contraction of the beam will be induced.
Structural elements with materials of similar temperature expansion coefficients expand and contract uniformly (e.g. steel and concrete). However, structural elements containing materials with significant differences in thermal expansion coefficients expand and contract nonuniformly, possibly leading to induced thermals stresses and bowing of the element. To reduce the cracking of concrete due to expansion and contraction, dispersed composite fibers are added to the matrix of the concrete. The fibers act to transfer stresses across microcracks, thus reducing the growth of microcracks. If FRP rods are used, the resulting matrix will experience thermal cracking due to the differences in coefficients o f thermal expansion of concrete and FRP. Consequently, dispersed composite fibers can be added, along with the FRP rods, to reduce the effects of thermal cracking. Though these state of the art technologies represent a marginal cost increase for the concrete material, the increase is not likely to be a significant compared to overall guideway costs (e.g. less than a 1-2% overall cost increase is expected).
Some concern has been raised as to the transverse deflections a beam will experience due to gradient in temperature over the depth. Such deflections are due to uneven heating and cooling of the upper bridge deck with respect to the lower flange. For
a narrow beam box section with relatively thin webs, this is not expected to be a significant problem as the heat will more quickly dissipate through the thin webs. In addition, there is smaller upper surface area on the top of the beam to subject to the heating.
Static forces and momentsStatic forces induce shear, tensile, and compressive stresses in the beam.
According to elementary beam theory, vertical bending typically produces tension forces in the lower portion of the beam and compression forces in the upper portion. These
12
forces vary along the span and usually reach a maximum at the beam midspan. By contrast, shear stresses and torsion are typically greatest near beam supports. For a conservative first order approximation, the largest forces and moments experienced along any portion of the beam can be considered the design criteria for the entire beam.
To resist wind loads the member must have equal resistance to tension and compression on either side. In addition, the member must resist shear stresses and torsion resulting from both vertical and horizontal loads.
Dynamic forces and momentsDynamic forces and moments will be similar to static bending, shearing, and
torsional forces and moments with the addition of "negative" conditions which result from oscillations of the element. Thus, in addition to compression during positive bending, the upper portion of the beam experiences tension during negative bending (though the amount of tension will be somewhat less than that experienced by the lower portion of the beam during positive bending). Furthermore, the lower portion of the beam will be subjected to compression during negative bending conditions. Dynamic forces will result in higher deflections than those computed using static forces. Typically, a dynamic amplification factor is used to convert a static analysis to a dynamic one.
Fatigue loading of the structure also must be considered. Fatigue is a failure mode resulting from the dynamic oscillatory motion of the vibrating guideway. Fatigue failure must be evaluated based on the expected number of vehicle passes throughout the design life of the structure and the residual vibration that occurs after each vehicle pass. Thus, two dynamic effects are critical to guideway beam design: 1) the dynamic amplification factor and 2) the residual vibration of the beam. These two effects are discussed in detail
in section 4.6.
4.1.4 DeflectionsStatic deflections due to beam dead weight as well as all live loads must be
controlled. Typical deflection criteria are presented with respect to span length. ACI code for conventional construction (i.e. buildings, etc.) uses deflection criterion as high as L/480 with 17360 being typical. The deflection criterion for guideway structures is generally more stringent. For the example in section 4.5, a constraint o f171000 is used for both vertical and horizontal midspan deflection. However, due to the economics of increased depth, the resulting design has a maximum vertical deflection o f approximately 173000, i.e. the 171000 constraint is not exercised.
Dead load deflection will be zero in order to enhance passenger comfort. The dead load deflection is zeroed by initially cambering the beam with prestressing. Live load
13
deflection control of 171000 should be viewed as a guide. Some designs are calling for control of 174000 and higher. Though deflections resulting from dynamic loads are likely to be larger than those for static loads, the increase can be limited to less than 1.2 times the static load through proper load distribution.11 For certain vehicle load distribution patterns and vehicle speeds, the dynamic deflection criteria becomes secondary to damping of the beam element. Damping mechanisms and material behavior must be such that the beam element either 1) resumes a resting position before the next vehicle approaches or, if small beam vibrations remain, 2) oscillates out o f phase of approaching vehicles.
Deflection criterion must include restrictions for both short and long-term behavior. Short-term behavior is fairly easy to predict. However, due to material creep, shrinkage, and/or relaxation, long term deflections must also be considered.
4.1.5 Durability, toughness, fatigueThe structure must be relatively resistant to acidic conditions (on the order of
atmospheric acidity levels) as well as to vandalism and impact loads. Corrosion and other types of material deterioration must be prevented on both the exterior of the structure and the embedded materials. In addition, many materials can deteriorate when exposed to certain environments (e.g. glass in concrete). Obviously for long term durability, this must be prevented. The structure also must resist unexpected impact loads such as truck impact and vandalism. Though the structure may not remain in service after certain impacts, it must be designed to ensure passenger safety for likely scenarios.
Due to the dynamic behavior of the beam from multiple vehicle passes, the
structure must be designed to resist fatigue. Mild steel is fatigue resistant at relatively
high stress levels. Carbon is practically fatigue resistant. Glass, however, is highly sensitive to fatigue loadings. Nonetheless, due to expected low levels o f stress in the glass (and in the concrete) for the beam design, fatigue loading is not expected to significantly alter the overall design.
4.1.6 Magnetic inertnessA relatively unique design requirement for EDS maglev guideways is that
significant portions of the structure must be magnetically and electrically non-conducting. This will challenge the civil engineering design and construction industry as "magnetic inertness" is not a normal design criterion.12
11 The actual dynamic amplification factor depends on beam frequency, vehicle speed, and vehicle pad distribution-see 4.6.12 An exception is magnetic resonance imaging, MRI, facilities in hospitals.
14
Though EMS systems do not appear to be effected substantially by structures made of magnetically conducting materials (e.g. steel), the magnetic field strengths of EDS systems (on the order of a Telsa) are likely to demand that such a criterion be imposed. It is expected that the restriction on magnetic inertness can be relaxed for all but the upper portions of the guideway beam.13 For the example, only non-magnetic reinforcement is used within 0.30 m of a EDS winding.14
The analyses approach includes: 1) designing a base case beam box section where a complete relaxation of the magnetic inertness criterion is assumed, 2) designing a completely magnetically inert beam element, and finally, 3) developing a general analysis technique so that only a certain cross-sectional area (e.g. the top third of the beam) is designed with non-magnetic reinforcement.
13 This is discussed more in subsection 4.10.14 See 4.10
15
4 .2 C on stru ctio n m eth od s com p arison
4.2.1 OverviewThe particular construction method selected for a given project depends primarily
on the type of structure being erected. Other considerations include site conditions, local work force quality, equipment availability and local cost of materials and resources. Typically, "design optimization" refers to material or weight minimization and not to construction cost minimization. Focus on cost minimization through construction modification generally does not occur until the design process is well under way. Yet, for projects expected to have significant construction costs, efforts aimed at minimizing these costs must begin early in the design process; since once a design is relatively complete, less than 10% of the total cost can be reduced through optimized construction methods.1 The implication is that substantially lower construction costs can only be achieved through better initial design.
Construction of a maglev guideway support structure (i.e. beams, columns and footings) represents at least 40-45% of all implementation costs o f the entire maglev system including terminal stations, rolling stock, power substations, magnetic windings, and maintenance facilities.2 Other guide way components attached to the support structure (e.g. suspension, guidance and propulsion windings) constitute another 25% resulting in a total guideway cost of 70% of total capital costs. Other estimates have placed the guideway construction cost as high as 70-90%.3 Vehicle costs are estimated to be less than 15% of capital costs.4 Obviously, the design of a low cost maglev system must place considerable emphasis on the guideway construction phase during the initial design process. Following a brief presentation of basic structural bridge designs, both current and recent innovative construction methods are presented and compared.
4.2.2 Bridge designsBridge design is based both on method of support (i.e. simply supported vs.
continuously spanning) and type of structure (e.g. arched, suspension, cable-stayed, girder etc.) Design is also influenced by local material quality and availability. Materials
1 Albano, L. and J. Connor, "Performance Based Design", MIT, 1991.2 Phelan, R.S. and J.M. Sussman, "Maglev Technology: A Look at Guideway and Maintenance Concerns", Applications of Advanced Technologies in Transportation Engineering, Proceedings of the Second International Conference, American Society of Civil Engineers, 1991, p. 193-197.3 Assessment of the Potential for Magnetic Levitation Transportation Systems in the United States—A Report to Congress, Federal Railroad Administration, June 1990.4 Ibid., Phelan and Sussman.
16
considered for structural systems generally include concrete and steel, and occasionally wood or plastic.
It is impossible to completely separate decisions about the design of the structure from the method of construction. For example, in designing a reinforced concrete section using prestressed tendons, a designer assumes that prestressing materials are available and that local labor crews are familiar with the necessary construction procedures. Also important in the design process is developing an adequate plan for transportation of the required materials to the construction site. Ease of transportation of both materials and work crews to the site influences the economic viability of a project as well the quality of the completed facility. Following is a discussion of basic bridge structural systems.
GirderThe girder approach is the most basic in that it essentially connects two columns
by a girder (or beam). The girder can have either a uniform or variable cross section. Optimization based on the structural system typically results in a variable cross section while fabrication and construction cost optimization would dictate a uniform cross section. Flexural bending moments are typically high in uniform cross section girder systems. Girder spans are typically 20 to 100m.
ArchedAn arched structure allows most forces to be resisted by compression in the
members. Common examples include masonry and stone bridges. The arch allows the use of typically less expensive building materials. For smooth passage o f vehicles along
the bridge structure, a flat gilder is either placed above or suspended below the arch.Cross sectional requirements for a girder acting in conjunction with an arch are much less
than those for the girder system acting alone. Implications are that potential span lengths for arched systems are much greater than that for girder systems. Efficient arch bridge
spans range from 100 - 300m.
SuspensionA suspension type structure has a girder (or deck) suspended by supports
connected to relatively large piers. Vertical supports transfer forces from the girder to an overhead suspension system. The geometry of the overhead suspension system is matched to offset bending moments generated in the supported girder system. A suspension bridge design allows significant reduction in cross sectional dimensions o f the suspended girder. Therefore for relatively long spans, significant cost savings are
possible. Suspensions systems are used for 200-350m spans.
17
Cable stayed
Somewhat a derivative of the suspension system is the cable stayed system where the girder system is supported by cables directly attached to supporting piers. Cable stayed brides are considered state of the art. They generally are considered aesthetically pleasing as there is a minimum amount of material used. Relatively long spans are both possible and relatively economical. Spans of 150-450 m are possible with cable stayed structures.
With respect to the potential aerodynamic interference between the cables and the passing vehicle, suspension and cable-stayed bridges are not expected to be applicable-- except in unusual circumstances. The guideway design is more likely to be free of extensions above the top of the beam surface (i.e. the top of the beam will be flat and open). For ease of manufacture and assembly a single beam having a uniform cross section is likely to be utilized.
4.2.3 Construction methodsCast-in-place
Cast-in-place offers versatility in design, but requires high labor content Quality of the completed structure depends on site weather conditions during the construction process and the skill level of the labor. These uncertainties lead to overdesigned structures. For relatively long spans, falsework is often required to support the structure during erection. Formwork and falsework are not the same. Falsework is placed in positions where support is needed until design strength of the structure is developed. Formwork primarily provides the shape of the completed structure. Achievable tolerances for cast-in-place structures are not expected to be adequate for maglev applications.5
Cantilever
Cantilever construction provides potential cost savings by initially placing columns and allowing connecting beams to be "cantilevered" from the columns until the span is completed. This method uses the column as support during beam construction and thereby eliminates the need for a significant amount of falsework.6
Segmental
Segmental construction techniques take the cantilever method one step further by attempting to design particular beam segments to be identical from span to span, i.e. to
5 See 4.7.6 Collins, Mi*, and D. Mitchell, Prestressed Concrete Structures, 1991, p. 613.
18
modularize the design. This repetition allows cost savings by providing the ability for off-site fabrication. Thus, segmental construction offers the potential for superior and more consistent material properties. Connection design becomes an important design criteria with segmental construction. Due to the large widths of typical highway bridge decks, a single highway beam typically consists of a number of individual segments. For a narrow beam maglev guideway system, each segment would be an entire beam.
Launching system
A fairly recent innovation is the so-called launching truss where individual girders or girder elements are both transported and placed by using a launching truss. The truss allows assembly line type of erection where once a beam element is placed, it becomes a platform for placing the subsequent beam elements. This method is also referred to as "end on" construction. A launching system is desirable for high column elevations and where local ground access is difficult or impossible. A launching system delivers an economy of scale for corridors of substantial lengths—approximately greater than 50 km. That is, as the number of beam segments that must be placed increases, the overhead cost per beam of the launching assembly is reduced. The reduction in labor required per beam results in reduced construction cost
In addition, a launching system eliminates constraints on beam and material deliveries to remote construction sites as placed beam elements become the delivery network. Thus, design and delivery of structural elements are not limited by highway or other network constraints as the beams are transported to the jobsite using the (just completed) guideway structure. Such a delivery scheme is possible since vehicle loads are only slightly less than the beam dead weight and deflection criteria can be relaxed somewhat during beam transport Longer spans are therefore possible using such an assembly line process. An off-site precast plant could cast and send structural elements continually and efficiently.
4.2.4 Construction costsConstruction cost is measured primarily by the amount of material, labor and
equipment needed for fabrication and erection of the structure. Christian Menn breaks the construction cost of prestressed concrete bridges into the following four main cost components:7
• mobilization♦ structure
7 Menn, Christian, Prestressed Concrete Bridges, 1991, pp. 49-64.
19
• accessories• design and construction management
Mobilization costs include site preparation and provisions for access by personnel, materials and equipment. Structure costs include both the substructure (piers, foundations) and the superstructure (columns, beams). Accessories include expansion joints, water drainage, and walkway railings. Design and construction management includes the costs for the creation and execution of the project.8 Based on cost records for a variety of completed prestressed concrete bridges, structure costs account for 78% of the total structure construction cost while mobilization and accessory cost 8% and 14% respectively of the total.9
A further breakdown shows the substructure to represent approximately 30% of the overall structure cost while approximately 70% of overall structure cost is spent on the superstructure. The superstructure cost can be broken into formwork (& falsework) and material costs-where material costs include concrete, mild steel and prestressing steel. Menn makes an overall breakdown as follows:
Table 4.2.1 Cost breakdown for typical prestressed concrete bridges10MobilizationStructureSubstructure
Foundations 18%Piers, abutments 5.5%
23.5%Superstructure
Formwork, falsework 20%Concrete 10%Mild steel 13.3%Prestressing Steel 11.2%
54.5%Accessories
n %
1 4 %
Menn mentions that though a variety of bridge types and site conditions were used, percentages for major construction cost components do not vary significantly and can therefore be used for a preliminary analysis.11 Other cost comparisons support
8 Though not given a specific percentage by Menn, the designer and construction manager typically receive 6% each.9 Ibid., Menn, p. 5210 Ibid., Menn., note these percentages do not include design and construction management fees.11 Ibid., Menn, p. 56.
20

Menn's breakdown.12 Some of the costs reported by Menn, in particular formwork and falsework costs, may not be applicable for a maglev system where structural elements will be manufactured in large quantities. Typically, precast concrete bridges are one-of- a-kind projects. Significant cost savings using repeatable elements and forms is not always possible. As shown in the breakdown of cost, formwork and falsework represent the highest cost category. As discussed in the next section, an objective of the maglev guideway design will be to eliminate the need for all falsework and most formwork.
4.2.5 Design philosophyClearly based on the percentages presented in the previous section, it is
advantageous to eliminate major cost components where possible through innovation. A truly optimized design attempts not only to minimize structural materials, but also to minimize labor and equipment requirements. Because the intent of this research is to determine a standard design and not necessarily one that is all encompassing, it appears that some type of girder system offers the most potential for construction cost savings. Near site fabrication, as opposed to cast in place, gives increased material reliability and could allow for material savings as less "overdesign" is required. Also, a launching type of erection system will likely result in labor cost savings.
Though savings in fabrication and construction costs are expected, use of uniform cross section girders will likely increase material costs as the section is not optimized solely to carry load. (Note that if a simply supported section were optimized for load, it would have maximum stiffness only at the midpoint of the span.) Also, the use of a launching system and near site fabrication will likely increase mobilization costs. However, if near site modularization, combined with a launching erection scheme can effectively eliminate most formwork and falsework requirements, a direct savings of up to 20% from estimates based on traditional construction practices are possible as indicated in Table 4.2.1. This savings is possible through design and is in addition to savings possible from improved work crew efficiency.
12 Ibid., Collins,, p. 609-613. (Numbers used by Collins were adapted from Schlaich, J. and H. Scheef, "Concrete Box Girder Bridges", Structural Engineering Documents, International Association for Bridge and Structural Engineering, Zurich, 1982, p.108.)
21
4.3 Conceptual guideway design and selection of materials
4.3.1 OverviewDesign of an appropriate conceptual guideway system follows from an accurate
and thorough analysis of structural design requirements (section 4.1) and a comparative assessment of available construction methods (section 4.2). The intent of this section is to develop such a conceptual design. Following a summary of major points discussed in the two previous tasks, a discussion of potential cross-sectional shapes is presented as well as a comparison of various support mechanisms and material properties. This report concentrates on the beam design, as it comprises approximately half of the total support structure cost. Much of the design approach is equally applicable for column and foundation design.
Due to magnetic field effects in areas near EDS windings, steel reinforcement will not be possible in all portions of the guideway. Fiber reinforced plastic material, FRP, using both glass and carbon fibers could serve as reinforcement for concrete in such areas. To gain a better understanding of the flexural behavior of concrete reinforced with FRP, seven T-shaped concrete beams, each reinforced with a single glass and carbon "hybrid" rod, were tested in 4 point bending. Results of the tests are reported in section 4.9.
The approach is to first investigate the potential for various cross sectional beam shapes for expected loading conditions and different support mechanisms, i.e. simply- supported vs. continuous spans. Prestressing techniques and FRP design related issues are discussed. A brief overview of the effect of the switching mechanism on the beam shape and design is given as well as an overview of material selection criteria. The task concludes with a suggested overall beam cross sectional shape, method of support as well as candidate structural materials.
4.3.2 Cross-sectional shapesThe cross sectional shape of a structural element depends both on loads the
element must resist and properties of materials used. For example, to withstand vertical bending moments and shear forces using an isotropic material having high tensile, compressive and shear (e.g. steel) strength characteristics, an I beam is the optimal section due to the concentration of material in the flanges, distant from the neutral axis. However, for a material having high compressive, but low tensile and shear strength, such as concrete, the compressive zones tend to be maximized (e.g. concrete in the compressive flange of a reinforced concrete, R/C, beam). When concrete is combined
22
with steel, where steel is used to reinforce tensile areas, a T shape section is optimal (where the upper flange is concrete and the web is reinforced both longitudinally and laterally with steel).
When torsion is present, the optimal section for an isotropic material such as steel is usually a hollow circular shaft. The most important design consideration to resist torsion is that the section should be closed, meaning the section has no exterior appendages, such as cantilevered extensions. Closed sections significantly reduce shear stresses resulting from torsion. Examples of closed sections include solid sections, hollow circular shafts, hollow rectangular or "box" shapes or hollow trapezoidal shapes, etc.Open sections include I beams, T beams, inverted V, inverted T shapes, U, and semicircular channel shapes. The torsional strength for a typical open section is an order of magnitude less than that for a comparable closed section.
For concrete in bending, a circular shape usually is not desirable due to the small compressive area at the extreme compressive fiber. Considering the combination of biaxial bending, shear and torsion-and using reinforced concrete-a hollow box beam becomes a potential optimal shape. The hollow box has the following attributes. It 1) is a closed shape, 2) efficiently resists bending, 3) has a large compression zone in the flanges to resist vertical bending, and 4) large compressive zones in the webs to resist horizontal bending moments. Though a rectangular box beam is the focus of this report, a more generalized hollow trapezoidal shape may be desirable. The trapezoidal shape should be considered when either a) the vertical positive bending significantly exceeds the vertical negative bending or b) a vehicle wrap around effect is desired to prevent the vehicle from completely separating from the guideway.1
Open channel systems, such as U shapes, in general, and reinforced concrete open channel sections in particular, are inefficient in their use of given materials and are severely susceptible to torsional warping. For primary bending moments, the most efficient reinforced concrete section is one where the upper portion of the cross section maximizes the amount of concrete while the lower portion is minimized as much as possible (to reduce weight), resulting in an inverted U shape section. (A T beam has similar properties, but is weak in resisting torsion.) Note that the efficient (except for negative bending) inverted U open section is opposite of an open channel section (which is weak in positive vertical bending, horizontal bending and torsion) and points to structural deficiencies inherent with designs based on channel shapes. Though there are
1 Realistically, a hollow box beam is simply, a special case of the more general trapezoidal shape.
23
likely other benefits to open channel section designs, guideway structural efficiency is not one of them.
When negative bending moments become significant, the rectangular hollow box beam shape is more efficient than either the T or the inverted U shape sections as the box provides the negative compressive zone (i.e. the lower flange) and increases torsional stability. Similarly, the box section provides web compressive zones for horizontal bending where the T shape does not. For optimal torsion resistance, the lower portions of an inverted U section would logically be connected, which would form a hollow box or trapezoidal design (which would be optimal).
In addition to excess material required over a closed section, another major drawback to an open section design is that the width dimension of an open channel determines vehicle width for the life of the system. Snow removal and water runoff for open channel systems also present design difficulties.
A narrow hollow box beam is not expected to have significant snow or drainage problems. Some drawbacks to the box section are 1) possibly more difficult switching, 2) potentially more difficult passenger exiting under emergency conditions and 3) no inherent noise deflection capability. The switching difficulties are not prohibitive however and several schemes are presented in the next section, including the only known high speed switching mechanism in operation today. Also, a number of passenger exiting scenarios can be envisioned including using the guideway or exit ramps from the vehicle to the ground. Finally, noise deflection devices could easily be added to the lower portion of the box beam if required. In summary, considering a variety of cross section shapes and vehicle operation scenarios, the hollow box section appears the logical choice for a low cost guideway design and is used as the basis for the remaining analysis of this work.
4.3.3 Structural support mechanismsSim ply-supported vs. continuous spans
Considering the method of support, the choice basically centers upon either a simply-supported structure or a continuous span. Table 4.3.1 compares the attributes of both structural support mechanisms in relation to maglev guideway design. Continuous spans are more effective in reducing deflection and provide a smoother guideway surface than do simple spans. However, moment redistribution over columns due to foundation settlement becomes of greater concern with continuous spans.
Continuous spans have other disadvantages, some of which may be critical for maglev design. For example, because a continuous girder cannot expand longitudinally if fixed at support, thermal stresses can cause the beam to bow. Thermal stresses in
24

continuous spans are normally relieved using expansion joints. The use of expansion joints, however, will: 1) present difficulties in the automation of the construction process, and 2) possibly adversely affect ride quality. Note that bowing due to thermal expansion is different than bowing due to thermal gradient differentials. Temperature gradients result from uneven heating and cooling of the cross section due to daily temperature fluctuations and can result in distortions in the beam, e.g. bowing.Table 4.3.1 Simple vs. continuous spans
Simple ContinuousMaterial cost additional stiffness required for
same deflection controlmore shallow beams are possible, thereby reducing required material and beam weight ✓
Construction easier transportation, less Field labor required
✓
"closure" pours plus final post tensioning operations are difficult and expensive
Maintenance single beams can be removed and replaced quickly
✓
repairs require intensive labor as adjacent beams are affected
Thermal Expansion allowances for expansion can be made easily at supports
✓
requires joints that can provide significant expansion; may handicap automation processes
Guidewayroughness
inflection points over supports effect ride comfort
smooth transition over supports
✓Prestressing allows prestressing to be confined
to lower portion of the beam (i.e. all steel prestressing) ✓
requires FRP prestressing of beam over supports where moment redistribution occurs
Aesthetics shorter, deeper spans are not generally considered aesthetically pleasing
longer, more slender spans typically are viewed as less obtrusive to the environment t /
Resistance to seismic loading
base isolation is likely required along with some type of lateral fix joint
seismic response is more efficient as adjacent beams and columns behave as a system ✓
✓ indicates adesirable quality for maglevSimple spans, though easier to construct and replace, tend to have more guideway
roughness due to inflection points in the deflection profile at the supports. Also, in general, simple spans are inferior to continuous spans when subjected to seismic loadings due to the concentration of forces at connections for simple spans. Seismic forces generally are more distributed through the fixed connections of a continuous system.
When considering efficient transportation, placement and repair of beam elements, some attention must be given to beam length limits. For example, if 25 m spans are considered a minimum, a 3 span continuous beam would be 75 m in length. Such a length presents formidable transportation and placement problems Though a closure pour of three simple 25 m spans results in an effective 75 m continuous girder, the procedure is highly labor intensive. Thermal expansion of long girders require more clearance at joints and/or supports. In addition, repairs will be difficult and expensive as embedded reinforcement from neighboring beams must be removed and regrouted. Another
25
difficulty with continuous spans is that they will require substantial amounts of mild and prestressing tensile reinforcement in the upper portion of the beam over the column due to negative moments in these areas. This is likely to substantially increase the reliance on FRP reinforcement if magnetic inertness of the reinforcing material is required. Finally, should an automated alignment system be desired, a three-span continuous system requires at least two distinct aligning mechanisms. One mechanism would be for the hinged ends and another for the fixed ends.
The major drawback to a simply supported beam structure is the need for greaterstiffness to control deflections as compared with continuous beams. Thus, simple spans/are deeper than continuous spans for given lengths. Also guideway roughness is expected to be higher with simple spans. Finally, as mentioned previously and is assumed in the analyses of this report, resisting earthquake loads with simple spans is likely to require base isolation technology. The cost of base isolation technology is not known at this time, but is estimated to be less than 2% of total installation costs.
Simply supported structures provide easier placement and replacement as well as simplified alignment mechanisms. More importantly, prestressing tendons can be confined to the lower portion of the beam element, thus allowing steel to be used exclusively, if desired. A simply-supported system also eliminates the potential for a dynamic traveling wave effect to propagate through the beam ahead of the vehicle. This could produce undesirable beam oscillations prior to vehicle arrival. Therefore one can assume that if sufficient damping is provided-either passively through the use of materials or actively with controllable adjustment mechanisms--a simply supported beam will be stationary as a vehicle approaches.
Continuous spans offer better structural efficiency and seismic response.However, simple spans will likely be less expensive to construct, maintain, and repair. Therefore, considering the above issues and considering low cost and adjustability as primary objectives, a simply supported structure is chosen as the more desirable support mechanism.
Prestressing, internal o r external, p re o r p o s t tensioned
With expected span lengths of 25 meters and zero dead load deflection requirements, prestressing will be required. Post tensioning can be administered to compensate for creep shrinkage and relaxation behavior of the concrete and prestressing materials over time. Internal post tensioning has the advantage of corrosion protection for the tendons and the ability to "mirror" the bending moment behavior of a distributed loading (i.e. a parabolic tendon shape). However, if the tendons are grouted, additional
26
prestress cannot be added later to account for losses. External prestressing offers the benefit of relative ease of inspection and potentially lower cost due to a reduction of required web cross section area. Stresses in external tendons can be monitored and (conceptually at least) the tension adjusted if needed.
High strength steel prestressing offers known long term material behavior at relatively low cost. FRP prestressing offers corrosion resistance (for external prestressing) and superior relaxation behavior at relatively higher cost. Currently, it is felt that for internal prestressing, high strength steel is superior and for external applications, FRP is desirable. FRP allows a fiber optic cable to be placed inside the tendons to provide continuous monitoring of stresses in the tendon. The primary difficulties in utilizing FRP tendons lies in 1) devising reliable anchorages as the tendons are weak in shear2 and 2) determining reliable predictions of long term material behavior. For internal prestressing, durability and fatigue of the fibers are significant concerns for glass FRP.
4.3.4 Influence of switching mechanismsThough the intent of this report is not directed specifically at addressing the
switching problem, some thought must go into possible switching procedures to ensure safe and efficient operation of the vehicle at all times. Switching limitations of the box beam are presented along with feasible solutions. Also a flat deck switching concept is presented to allow full speed switching along the guideway.
Though the box beam is highly efficient structurally, one possible limitation of the design is that it restricts some switching options. Either a flexible beam switch or an alternating beam switch (e.g. a straight section and curved section are interchanged) are possible. Vertical switching remains feasible for box sections. Obviously, an optimal switching mechanism would allow the vehicle to shift from left to right to enter a turn. Other designs may be more conducive to horizontal shifts (e.g. "U" channel or semicircular open channel) however they have major constraints of their own, some of which have been discussed.
For the flexible beam switch in an EDS system, a steel beam cannot be used due to magnetic interference. And since concrete beams will be difficult to bend sufficiently, other beam materials should be considered. A glass or carbon pultruded FRP box beam is a possible solution. If a concrete beam is used, the alternative switch where curved and straight sections are interchanged is more appropriate. Other ideas are also possible. The important aspect for this report, is that design of the hollow box beam guideway can
2 This is not a trivial problem and though anchorage methods are being proposed, until these can be assured, steel reinforcement is likely to be the choice for prestressing tendons irrespective of the fact that FRP has superior long term relaxation properties for prestressed concrete.
27

proceed essentially independent of switch selection as a number of switching alternatives are available.
4.3.5 Material selection criteriaStrength, stiffness and damping
Of the three primary structural properties, strength, stiffness and damping, stiffness is expected to dominate any static analysis and is considered the primary design constraint. Dynamic loading effects will increase the importance of structural damping characteristics for the overall guideway design. The tendency for damping constraints to exceed stiffness constraints will depend on the particular dynamic behavior experienced by the guideway-which has not been determined. Passive damping of 5% should be achievable through proper material selection. The potential amount of damping possible using active mechanisms is not known presently, but is estimated to be less than 10%.
Corrosion resistance, magnetic inertness
Because the section is prestressed, cracking is prevented. Thus water seepage through the concrete is minimized and corrosion resistance of embedded steel reinforcement is not as significant a concern as it would be without prestressing. The magnetic inertness criteria will apply to any material within a specified distance of a given magnetic field (e.g. no steel rebars within 30 cm of a 4 Telsa magnetic field). Such a specification would eliminate the use of steel reinforcement in such areas. Candidate materials for tensile reinforcement for such areas include boron, carbon, glass and aramid fibers.
D urability, toughness, fa tigue
The guideway system must be not only functional, but also tough, durable and fatigue resistant. Thus, the structure must be relatively resistant to acidic conditions (on the order of atmospheric acidity levels) and resistant to unexpected impact loads (e.g. truck impacts) and vandalism. Durability concerns includes corrosion resistance and long term material behavior such as creep, shrinkage and relaxation. Durability of concrete sections can be increased using high strength concrete, concrete additives, and surface treatments such as sealants.
Glass fibers are relatively inert However, when in direct contact with concrete, the alkaline properties of the concrete reacts with the glass causing the glass fibers to deteriorate over time. Thus, for use in concrete structures, glass fibers need to be as alkaline resistant as possible or coated in some way to prevent contact with the concrete. Interestingly, steel actually has better long term behavior when exposed to alkaline
28
environments. Corrosion of steel occurs when water or air is able to seep through microcracks in concrete and oxidize the embedded steel.
4.3.6 Candidate materialsM etals
The primary metals used in construction are steel and alloys of steel. Steel has excellent tensile and compressive behavior and is relatively inexpensive. Mild steel, having a tensile strength of approximately 410 MPa, can be used alone as a structural element or combined with some other material (e.g. concrete). Alloy, or high strength, steel, with tensile strengths up to approximately 1.9 GPa, can be used as prestressing elements. Steel has thermal expansion characteristics similar to that of concrete and therefore is an excellent reinforcing material for concrete. Major problems associated with steel structures are corrosion and magnetic interference potential.
CeramicsCeramic type materials are generally hard and brittle. Examples of ceramic
materials are porcelain and concrete. Concrete, like other ceramics, is excellent in compression, but poor in tension. High strength concrete is desirable for use in maglev guideways in that it has higher strength to mass and stiffness to mass ratios than does ordinary concrete. Though tensile properties of concrete can be improved substantially through the use of embedded fibers or polymers in the matrix, these approaches typically have not been implemented due to their higher cost. For maglev design, where tolerances are more stringent and the dynamic behavior more pronounced, the use of fibers in the concrete matrix may be justified. Reinforced concrete members uses longitudinal bars of material having good tensile and stiffness properties, e.g. steel bars, placed in the tension zones of the member.
C om posites
Fiber reinforced plastic, FRP, is the most promising of composite materials for use in structural applications. FRP can be produced in any number of forms including (1) pultruded shapes including rods, I-beams or box beams, etc., (2) laminates and (3) molded shapes. Fibers typically used are boron, carbon, glass and aramid. Boron and carbon are extremely expensive. Aramid is somewhat less expensive but has low compressive strength. Glass is relatively inexpensive, has high strength, but is only one quarter as stiff as mild steel.
FRP glass rods, when properly developed to produce a mechanical bond have been used as a replacement for steel reinforcement in a number of applications including
29
highway pavements, MRI rooms in hospitals as well as chemical and marine environment construction. A difficulty with the glass fibers is that over time, the fibers deteriorate when exposed to the alkaline environment of concrete. In addition, glass (as well as carbon, boron and aramid) FRP fails in a brittle manner.
Table 4.3.2 shows GFRP to have roughly three times the strength of mild steel though only a quarter of the stiffness. To provide a given strength without regard to stiffness, the cost of GFRP is much less than steel. However, on a stiffness basis, GFRP is at least 2 times the cost of mild steel. For flexural design of maglev guideways, stiffness is likely to be the primary base of comparison between materials. In contrast, CFRP, especially high modulus (HM) CFRP, though roughly equal to mild steel in stiffness, has three to four times the strength. The drawback to CFRP is its estimated cost which is approximately three to eight times the cost of epoxy-coated steel on a strength basis. On a stiffness basis, CFRP is currently 10 to 25 times the cost of mild steel.
Table 4.3.2 Structural properties for selected materials3Strength ct (MPa)
<T (ksi) Stiffness E (GPa)
E^ k si)^ e*
P(Tce/m^)
cost($/kg)
Mild Steel(60 ksi)
415 60 200 29,000 0.002 7850 0.55
Mild Steelw/ epoxy coating
415 60 200 29,000 0.002 7850 0.75
Prestress Steel(270 ksi)
1860 270 200 29,000 0.009 7850 2.20
Glass-FRP * 1200 174 50 7,000 T O T ^ o a T " ^ 5 < P
Carbon-FRP-HS *(high strength)
1600 230 129 19,000 0.012 1500 35.00
Carbon-FRP-HM *(high modulus)
1280 186 192 28,000 0.067 1600 90.00
* Fiber reinforced plastic, FRP, consists of 0.70 fiber volume fraction, Vf inan epoxy matrix
A.method of improving the failure mechanism, durability and stiffness properties of a glass FRP rod, has been developed by researchers for this project. The concept is based on surrounding glass fibers with a thin layer of carbon fibers to form a glass/carbon hybrid FRP rod. Because carbon fibers are inert to alkaline environments, they are extremely durable in concrete. Also, because of the higher modulus of carbon with respect to glass, the hybrid FRP rod can possess the property of failing in a pseudo- ductile manner. Test results of the hybrid FRP reinforced concrete beams is discussed in section 4.9.
As shown in Table 4.3.3, steel is usually an excellent structural material for concrete reinforcement. However, for maglev guideway design, steel is less desirable
3 Charles, J.A. and F.A.A. Crane, Selection and use of Engineering Materials, Second Edition, 1989.
30

because it reacts with magnetic fields. GFRP is not a superior material for structural design purposes due primarily to its low modulus.4 However, it has very high strength properties and is economical. Also, glass fibers are highly sensitive to fatigue loadings. Because of the surrounding epoxy matrix, GFRP will not be as sensitive to fatigue as are glass fibers alone. However, GFRP is likely to be limited to use at low stress levels.5 The primary limitation to using GFRP as a reinforcement material within concrete is the high susceptibility of the glass fibers to the concrete alkaline environment.6 CFRP is an excellent structural material though it is very expensive currendy. With low cost as an objective, present carbon fiber prices exclude CFRP from being considered a viable replacement for steel. Due to its high content of GFRP, the hybrid FRP rod is relatively low cost compared to all CFRP. It is inert to the concrete matrix and it can be engineered to have a pseudo-ductile failure.
4 The low modulus of GFRP actually is a beneficial property for prestressing materials as it results in lower prestress losses. However, due to the low fatigue life of the glass and the difficulty in developing adequate anchorage devices, the potential for GFRP prestressing remains questionable.5 For stiffness based designs, GFRP likely will be constrained to low stress levels anyway, so a requirement for low GFRP stress may not impose undue constraint on a design using GFRP.6 Some manufacturers claim to have developed GFRP that is resistant to alkaline environments through the use of 1) superior glass fibers, 2) enhanced fiber treatments or 3) improved resin mixtures. Others claim to have produced alkaline free concrete. Either approach is desirable. However, long term behavior remains a significant concern and until such behavior of these advanced approaches can be substantiated, the use of an outer protective layer of CFRP seems the conservative approach.
31
Table 4.3.3 Candidate material structural properties summary
SteelGlass
(GFRP)Carbon(CFRP)
Hybrid GFRP/ CFRP
Magnetic interference high inert✓
inert✓
inert✓
Cost(stiffness basis)
low✓
3-4 times cost of steel ✓
10-25 times cost of steel
5-8 times cost of steel ✓
Strength high✓
high✓
high✓
high✓
Modulus high✓
low high✓
relatively low
Density high low✓
low✓
low✓
Resistance to Alkaline Environments
excellent✓
poor excellent✓
excellent✓
Corrosion Resistance poor excellent✓
excellent✓
excellent✓
Long-term properties reliable✓
sensitive to fatigue loading
insensitive tc fatigue ✓
sensitive to fatigue
Damping poor relatively good excellent✓
good✓
Shear strength excellent✓
poor poor poor
Failure mode ductile✓
brittle brittle pseudo-ductile is possible ✓
✓ indicates a desirable quality as concrete tensile reinforcement fo r maglev
Currently, the hybrid rod is projected to cost 5.5 to 8.5 times the cost of steel on a stiffness comparison basis7-which is how the FRP must be compared with steel (i.e. not by weight or strength), since the beam design is based more on stiffness than on strength. The high cost factor of the FRP should be reduced with mass production, but an expected range of reduction is not known presently. Future research focused at reducing the cost of FRP is needed. Section 4.9 details test procedures taken in this contract to develop a better understanding of FRP reinforced concrete in bending.
7 See Figure 4.4.3.
32
4 .4 D esign v a ria b le id en tific a tio n
4.4.1 OverviewIdentification of design variables is possible once functional requirements are
identified and candidate materials are selected. For a box beam section, typical "overall" design variables are associated with shape and include beam width, depth, length and wall thickness. A complete listing of design variables is more extensive. This task presents the design approach taken, along with assumptions and governing equations due to loads and constraints described in subsection 4.4.1. These equations are used in the spreadsheet analysis program and accompanying example presented in 4.5.
Formulas are derived for horizontal and vertical bending, deflection, shear, and torsion for a hollow box reinforced concrete guideway beam. The design approach is based on American Concrete Institute (ACI) reinforced concrete design procedures.1 In4.4.3, a hybrid FRP reinforcement design concept is presented along with hybrid FRP material property calculation formulas. Cost functions for overall beam material costs are presented in 4.4.4. The cost functions are generalized to account for both hybrid FRP and steel reinforcement.
4.4.2 Box beam formulas (reinforced concrete)
Bending moment resistanceThe strength of a simply supported beam element must be sufficient to withstand ...
both bending moments and shear forces resulting from given loads. It is assumed that realistic loading patterns can be approximated by the combination of a fully distributed load and a concentrated midspan load. The beam element must have the capacity to withstand the required vertical bending moment, M^v, and the horizontal bending moment, M, A
where L
F,
F h
1 American Concrete Institute, ACI Committee 318, Building Code Requirements for Reinforced Concrete, 1989 edition.
as computed in the following formula.
| X ,1 f M
1---o
---1
< __l
'L '
oo I
1--- O l__ 3 p». _2 _[4.4.1]
beam lengthvertical load uncertainty multiplying factor (1.4)
horizontal load uncertainty multiplying factor (1.7)
33
0 material uncertainty reduction factor due to bending (0.90)
w„, wh : distributed vertical and horizontal loads
Pv, Pk concentrated vertical and horizontal midspan loads
Bending constraints:Based on using concrete and steel, the following constraints are imposed as the
minimum cross sectional area of steel for the primary tensile steel in the lower flange, A„ v, and the nominal cross sectional area of steel in each web, Art/ .
r k , 1f
F p ' 1 b £' 1 k 0 ‘- 1
I X . /k v J 0 I x J
where
e / reinforcement strain before yield (e.g. 0 .002)
a r fraction of yield strain permissible during service load (e.g. 0 .6)
e° reinforcement strain during service load, era r (e.g. 0 .0012)
e* ultimate strain of concrete in compression (e.g. 0.003)
/?, strength reduction factor for concrete based on the working stressblock design
Er reinforcement modulus (in Pa, N/m2)
dv "effective" depth (i.e. from the top of the beam to the neutral axisof the lower tensile reinforcement)
dh "effective" width
Due to physical spacing requirements for reinforcing bars and stirrups, the absolute steel to concrete ratio is limited approximately to less than 8%. Generally, however, less than 3% steel volume to concrete volume is used in reinforced concrete design. For purposes of design, the absolute maximum amount of tensile reinforcement possible is used as a constraint for a given section as indicated in the following equation.
where
A’.vmix = F t‘ b '
Am**r.h max. ra _h-2t
[4.4.3]
maximum fraction of reinforcement possible with respect to area of section (e.g. 0.08)
34

4 .
4 .
vm ax ’
A max *
t
b
h
maximum reinforcement allowable for flange sections
maximum reinforcement allowable for web sections thickness of the box beam
beam width beam depth
Minimum reinforcement constraints result from the need to adequately distribute reinforcement in the tension zone of the concrete. Without proper distribution, 1) large cracks will develop in the section and 2) the reinforcing bars will tend to pull out prematurely. According to ACI code, the following minimum constraint is placed on reinforcement distribution. Since this leads to a minimum requirement for reinforcement, the following constraint is imposed:
r.vmin _ Db2Kt2f E £ Vr b I_ r.Amin _ 8 h - 2t_
where
vmin : minimum reinforcement allowable for flange sections
A.* mu, ; minimum reinforcement allowable for web sections
Db : diameter of longitudinal reinforcing bar (in m)
wt.mn '■ maximum tension allowable in section (e.g. 25,400,000 N/m = 145 kips/in)
The amount of reinforcement in the upper flange is dependent on the actual dynamic response of the beam. The dynamic response will result in beam oscillations and thus negative beam deflections (i.e. downward deflection is considered positive). Thus, as a preliminary estimate, the compressive vertical reinforcement is assumed equal to a fraction, Fv v> of the required vertical tensile reinforcement (e.g. 0.25). The actual value of F„ y used in practice will depend on the dynamic amplification factor imposed by a particular vehicle on the beam. In addition, a similar approach is followed to determine required reinforcement for the opposite web when subjected to horizontal dynamic loads. For unprotected sections (i.e. when no other structure, such as a nearby building, is present that will significantly shield one side of the guideway from wind), the horizontal negative reinforcement factor, , equals 1.0 .
Ac.v = max{F„ A.v-A.vnrin} [4.4.5]
35
whereF„ v : fraction of compressive (negative) vertical reinforcement, Arcv,
with respect to required vertical tensile reinforcement, Arl v.
A". y : amount of reinforcement for the negative vertical reinforcement inupper flange
When calculating reinforcement requirements using the above formula, the amount required for comers of the box section is computed for both horizontal and vertical directions and is thus redundant. Therefore, the amount of horizontal, or web, reinforcement calculated in the previous equation is reduced to the amount of reinforcement inside each web, A^ h. The reduction is made primarily for cost calculations and the resulting amount of reinforcement is that required for horizontal bending resistance minus the reinforcement found in comer sections required for vertical bending moment resistance according to the following equation. Note that the horizontal reinforcement is not considered when analyzing vertical bending capacity. Similarly vertical reinforcement is not considered when analyzing horizontal bending capacity. This approach gives a conservative first order design.
where
F„ h : fraction of compressive (negative) vertical reinforcement, Aa h,with respect to required vertical tensile reinforcement, A^^.
An h : actual cross sectional area of reinforcement in web for positivehorizontal bending
A". k : amounts of reinforcement in web for negative horizontal bending
Deflection criterion:The vertical, Ig v, and the horizontal, Igh, moments of inertia for the transformed
box section are computed using the following equations. For simplicity in computing the section moment of inertia, it is assumed 1) the thickness of the section, t, is uniform for each flange and web and 2) that web and flange longitudinal reinforcement is centered at a distance of tt2 from the exterior.
[4.4.6]
and
[4.4.7]
36
section mass centroid:vertical
th(b - 2t) + (n -1)y ‘ -’ = 2t(b-2l) + ( n - 1)[A„ + An , } + 2th
+ th[4.4.8a]
horizontal
t b (h -2 t ) + ( n - l )
yc.k =ArAA At.a| 2 + tb
2 r ( / . - 2 ; ) + ( n - l ) [ A „ Jl + A „ J1] + 2j*[4.4.8b]
section moment of inertia:vertical
horizontal
+(b~ > , ) ’] + (^r)[A - 2f]
[4.4.9a]
+ {dh- y e.h)2[(h-2t)t + (n - l)A rt_h] [4.4.9b]
where
yt*
yc.k
n
vertical distance from top of section to mass center [ ytv = h - ye J .
horizontal distance from side of section to mass center (should equalb/2) [yIJt= b - y cJ .
ratio of reinforcement modulus to concrete modulus, EJEe.
vertical moment of inertia,
horizontal moment of inertia.
To control deflection, the following minimum constraints are imposed on thevertical, / , and the horizontal, Ieh, moments of inertia.
s r l 2 }
1---o
>
L^_ --
-,
< ___1
"5 L '
L w l 3 8 4 £ e J
—i
5j*o
.wh ph_ _ 8 _[4.4.10]
where
37
modulus of the concrete
vertical deflection constraint (e.g. L/1000 —> kAy =1000)
horizontal deflection criteria (e.g. L/1000 —> kM =1000)
Prestressing:The amount of prestressing is limited by the maximum compressive and tensile
stresses induced on the concrete according the following formula.
where
y,..
y,.H '
f :J c . t
p vmin •
PA m in *
r p . iVRUfl 4 , )P
_ A m in .
f \
i Tg •»
M „ . a ) Y a _1
VL J J
[4.4.11]
gross area of the cross section
long term strength loss due to relaxation of the prestressing tendons
vertical distance from the neutral axis to the extreme tension fiber in the cross section (= h - ye„)
horizontal distance from the neutral axis to the extreme tension fiber in the cross section (= b - y e h)
maximum tension allowable for concrete section ( ACI code allows
500-777, where f e is in Pa)
amount of prestressing force required to limit tensile stress in concrete section under vertical bending
amount of prestressing force required to limit tensile stress in concrete section under horizontal bending
The prestressing force is calculated to be sufficient to negate dead load deflection. The dead load, wD, is calculated using the following equation. Note that the contribution due to prestressing cable weight is not including in the beam dead load equation. The weight contribution of the prestressing cables typically should not be significant, but when desired, an estimate can be added to the load used for the magnetic windings, wm.
w D = Agp e + (A„v + A,c.v + Arlh + Anh )(p r - p e) + wm [4.4.12]
where
38

Pc
Pr
concrete density (N/m3)
reinforcement density (N/m3)
distributed magnetic motor winding load
The minimum amount of prestressing permissible in the beam is controlled by the maximum midspan eccentricity permissible in the section as represented in the following equation.
where
Mr
p«.nun
P = Mr [4.4.13]
unfactored moment due to dead weight loading (= wDL2 / 8)
maximum amount of eccentricity available for prestressing for the given section (= y, v - 21)
amount of prestressing force required to control deflection considering maximum available eccentricity of section
Thus, the amount of prestressing required is the maximum value of P¥aia, Pham-> and Pe tnin as indicated below.
whereP
P = max- * kmmp4.1ran
[4.4.14]
amount of prestressing force required to satisfy deflection and tension in section constraints
To limit the amount of compressive forces, maximum amounts of prestressing forces are represented in the following equation.
where
* '
_ Amax. l - F ,
/ \ M n_vy e_v '
T I/ *J c.c 1
— i »
M H.„ y c.h
V L ^ J>
[4.4.15]
39

f ‘ee : maximum compression allowable for concrete section (ACI codeallows 0.45 f c)
Pvmtx '• maximum amount of prestressing force allowed to limitcompressive stress in concrete section under vertical bending
Pkmtx: maximum amount of prestressing force allowed to limitcompressive stress in concrete section under horizontal bending
Once an acceptable prestressing force is determined, a midspan eccentricity is chosen to give a zero dead load deflection. The profile of the prestressing tendons is considered parabolic for analysis. Though a draped profile may be desired for actual construction, the effect on eccentricity calculations will be minimal. The eccentricity is:
wheree
e = M d
P iX -F " )
midspan eccentricity of parabolic tendon profile
[4.4.16]
Torsion and shear design:The required vertical shear strength, Vnv, horizontal shear strength, and
torsion capacity to be resisted by the beam, Tn, is computed as folio,wis:
V H.h
T.
(0 .5 }FdwdL
0
0
Fv 0 00 Fh 0O O F *
w „
w \
wkek Pkeh_
~L'2
[4.4.17]
whereFd : dead load uncertainty multiplying factor (e.g. = 1.4)
0 ' material uncertainty reduction factor due to shear and torsion
ek eccentricity between the centers of gravity of the vehicle and theguideway
X '
J u .
where
Vu : factored shear (= max{Vn w0 ' , Vnh<f>'})
Tu : factored torsion (= Tn<p')
(max{V^.Vnll})<P'Tn
[4.4.18]
40
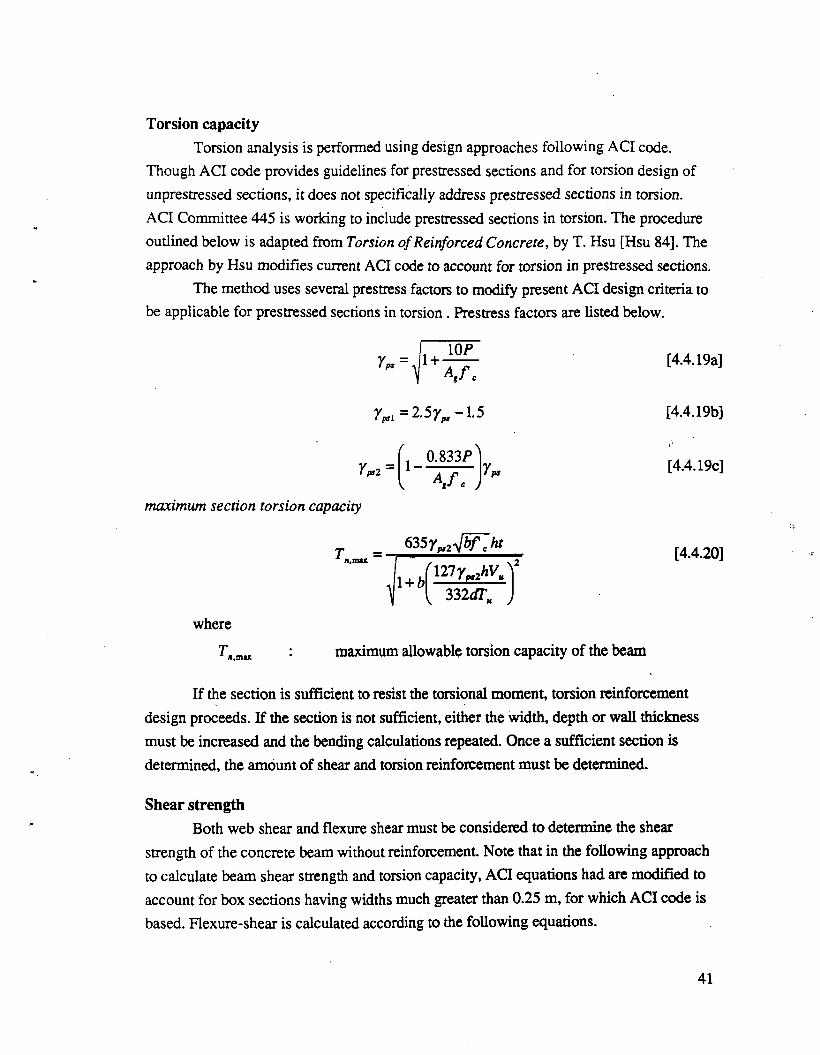
Torsion capacityTorsion analysis is performed using design approaches following ACI code.
Though ACI code provides guidelines for prestressed sections and for torsion design of unprestressed sections, it does not specifically address prestressed sections in torsion.ACI Committee 445 is working to include prestressed sections in torsion. The procedure outlined below is adapted from Torsion of Reinforced Concrete, by T. Hsu [Hsu 84]. The approach by Hsu modifies current ACI code to account for torsion in prestressed sections.
The method uses several prestress factors to modify present ACI design criteria to be applicable for prestressed sections in torsion. Prestress factors are listed below.
r„ = 1 +1 0 P
t V «
ym 1= 2 .5 /^ -1 .5
Yps 2 =0.833/^
V V1 P*
emaximum section torsion capacity
635r„21/ ? f >
U f 127w v-332dT,
where
[4.4.19a]
[4.4.19b]
[4.4.19c]
[4.4.20]
maximum allowable torsion capacity of the beam
If the section is sufficient to resist the torsional moment, torsion reinforcement design proceeds. If the section is not sufficient, either the width, depth or wall thickness must be increased and the bending calculations repeated. Once a sufficient section is determined, the amount of shear and torsion reinforcement must be determined.
Shear strengthBoth web shear and flexure shear must be considered to determine the shear
strength of the concrete beam without reinforcement. Note that in the following approach to calculate beam shear strength and torsion capacity, ACI equations had are modified to account for box sections having widths much greater than 0.25 m, for which ACI code is based. Flexure-shear is calculated according to the following equations.
41
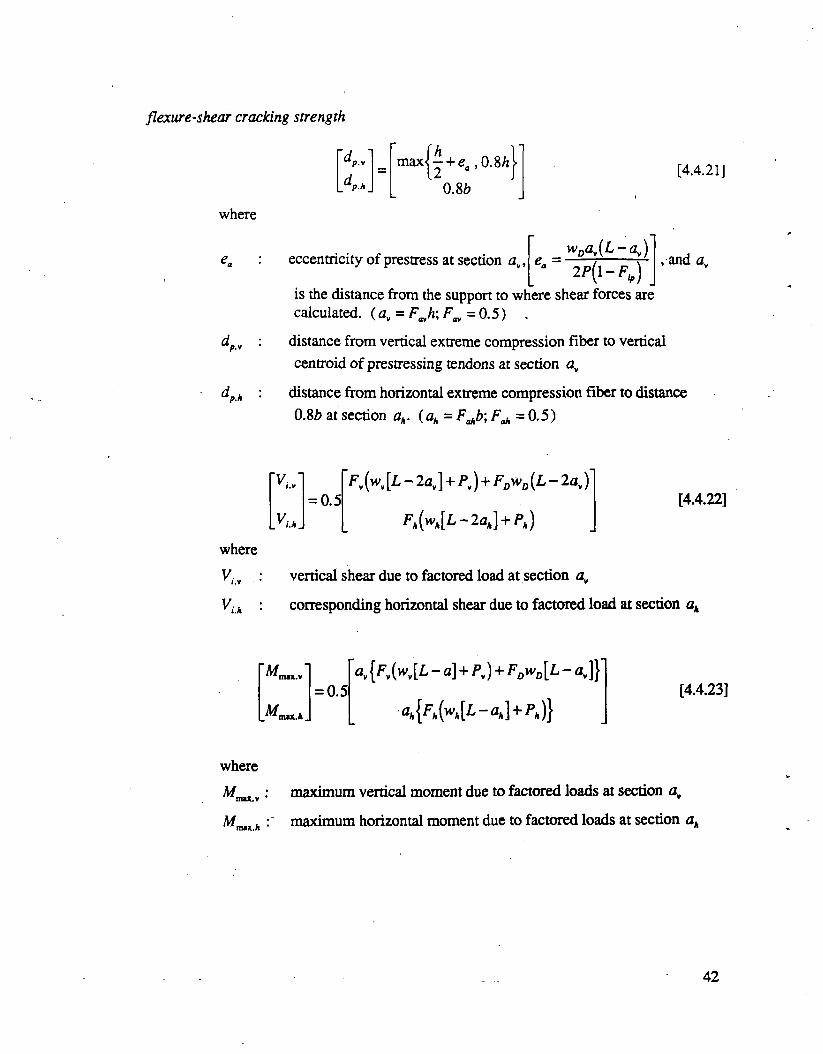
flexure-shear cracking strength
p.v maxi — + ea , 0 .8/zl
1----
> 1___ 12 a j
0.86
where
[4.4.21]
dP,
eccentricity of prestress at section av, eawDa ,{L -a v)2 />(l-F»,)
is the distance from the support to where shear forces are calculated. ( av = FJx\ Fm = 0.5) .
, and av
distance from vertical extreme compression fiber to vertical centroid of prestressing tendons at section av
distance from horizontal extreme compression fiber to distance 0.86 at section ah. (ah = F^b; Fah= 0.5)
V;.
lVlmj
= 0.5Fv (w, [L - 2 av\ + Pv) + Fdwd( L - 2 av)
Fh(wh[L -2 a h} + Ph)[4.4.22]
whereVu vertical shear due to factored load at section av
Vi h corresponding horizontal shear due to factored load at section ak
'Af.= 0.5
M,mu. A.
av{F,(wv[L - a] + Pv) + Fdwd[L - av]}[4.4.23]
where; maximum vertical moment due to factored loads at section av
M_. : maximum horizontal moment due to factored loads at section ahmax.a °
42
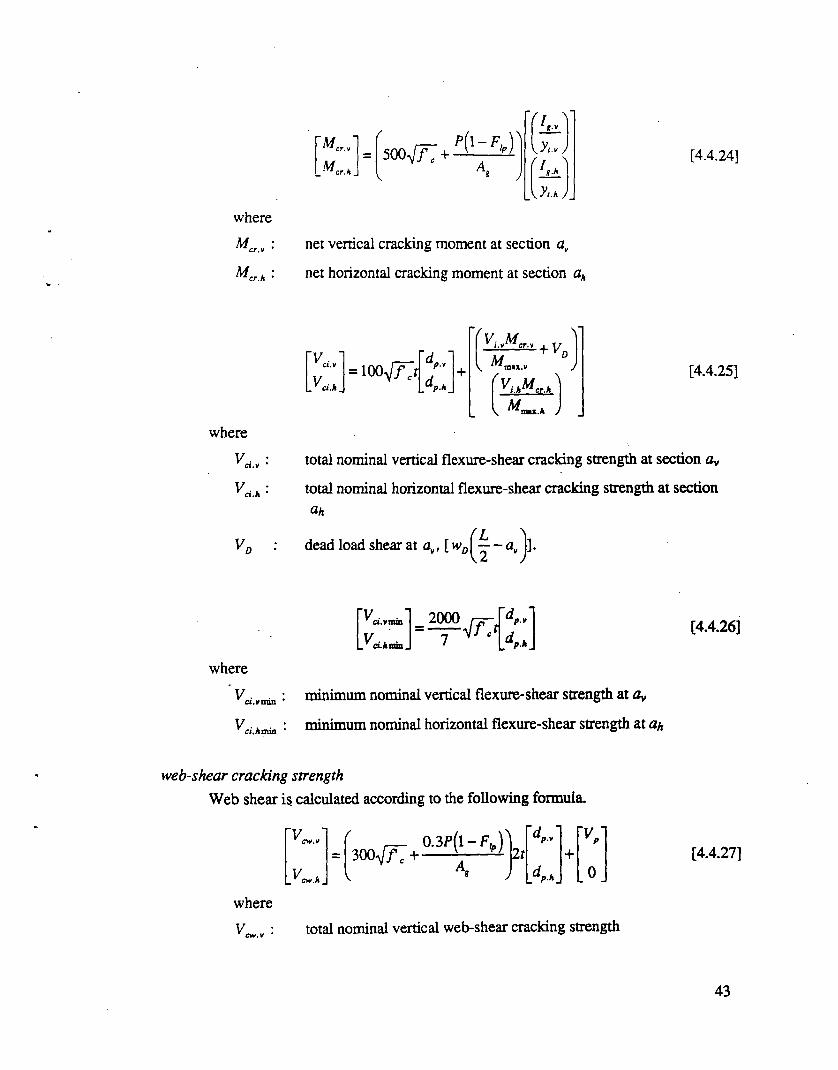
[4.4.24]
where
K r , ::
X , * '{
V
500V77 +
\*■»
' L l
)_
net vertical cracking moment at section av
net horizontal cracking moment at section ak
where
V D
VcL,
m r ci.h_= i o o V 7 7 r
( v M \i.v1 *cr.v 1 \rM D•mtx.v
( V M ^v i.km cr.k
/
K. a.k J
[4.4.25]
total nominal vertical flexure-shear cracking strength at section Oy
total nominal horizontal flexure-shear cracking strength at sectionah
( L ^dead load shear at av, [ wD\ --av ].
v 2 ^
where
V ■a.yarnv_ ct.h mm.
2 0 0 0
7
Ka.vmin: minimum nominal vertical flexure-shear strength at fly
V ci hmia : minimum nominal horizontal flexure-shear strength at ah
[4.4.26]
w eb-shear cracking strength
Web shear is calculated according to the following formula.
cw.k300^77+
0 . 3 P ( l - F f c )dp. y ' V
2 1y 1
<
______1
+
_ o _
[4.4.27]
wheretotal nominal vertical web-shear cracking strength
43
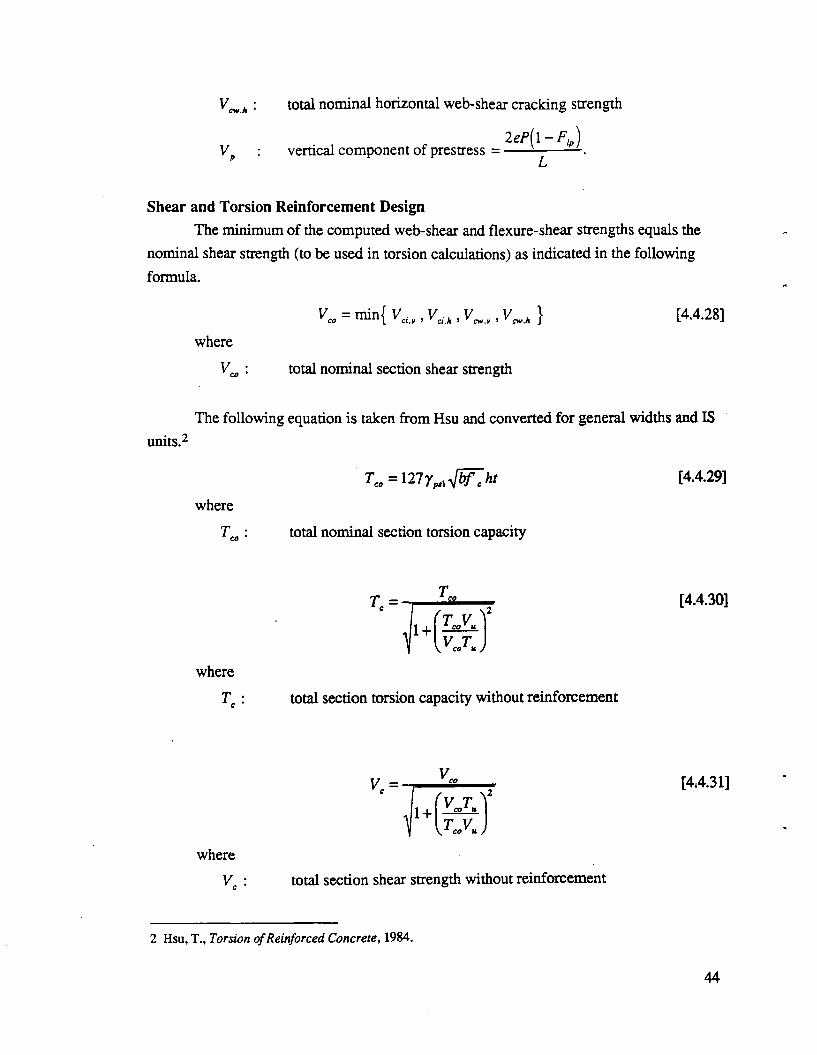
c w .k
v p
total nominal horizontal web-shear cracking strength
vertical component of prestress L
Shear and Torsion Reinforcement DesignThe minimum of the computed web-shear and flexure-shear strengths equals the
nominal shear strength (to be used in torsion calculations) as indicated in the following formula.
= nrin{ Vtl. , , , V„., , VnJ, } [4.4.28]where
Vco : total nominal section shear strength
The following equation is taken from Hsu and converted for general widths and ISunits.2
T„=inyr.lJbT'ht [4.4.29]
whereTeo: total nominal section torsion capacity
Tc =
1 +
/ \2[4.4.30]
wheretotal section torsion capacity without reinforcement
where
V =■
11 +
f V T ^ 2r CO u
yTC0Vuj
total section shear strength without reinforcement
[ 4 A 3 1 ]
2 Hsu, T., Torsion of Reinforced Concrete, 1984.
44

Once the shear strength and torsional capacity of the concrete section is determined, the procedure for determining adequate reinforcement is rather straightforward. The following equations illustrate the method.
Tn~Tcmax{Vn,y„.k}-Vc_
where
Ts : torsion to be resisted by reinforcement
V, : shear to be resisted by reinforcement
XV,
[4.4.32]
If Tn < 1660' bth, then — = 0 , otherwise — is found according to thes s
following procedure. This procedure is used by ACI and is discussed in detail by Hsu.3
where
Xx
Yi
X . -(A *+2C «) [4.4.33]
: horizontal distance between edges of stirrup confinement cage
: vertical distance between edges of stirrup confinement cage
where
a, =.66+.3 H £ 1 . 5
torsional strength coefficient
[4.4.34]
where
A
A
‘o , W , 0 V\T>]. 0 d j t f J I k \
[4.4.35]
: area of transverse torsional reinforcement required
: area of transverse shear reinforcement required (one leg of stirrup)
3 Ibid., Hsu.
45

transverse torsional reinforcement
where
A , : total area of transverse reinforcement required (= A, + 0.5/^)
r m h i f i r ;
whereFt : factor used to calculate minimum amounts of stirrup and torsion
reinforcement required
where
A ,
A.fmins
= F. 1 + 12-A.fcgj c
minimum total area of transverse reinforcement required according to ACI
wheres
s = minA .1 j ,0.30,
4 ’ 2 ’ 2 J
: stirrup spacing
longitudinal torsional reinforcement
Aj=2( t ) Xi+y,)where
A.i ; area of longitudinal torsional reinforcement required
* . + r .
s
where
A./min (4F,S)
V
r 2bhV„1 u '
\
[ 2 4 *
“ “ W
3 d,v yy
[4.4.36]
[4.4.37]
[4.4.38]
[4.4.39]
[4.4.40]
[4.4.41]
46
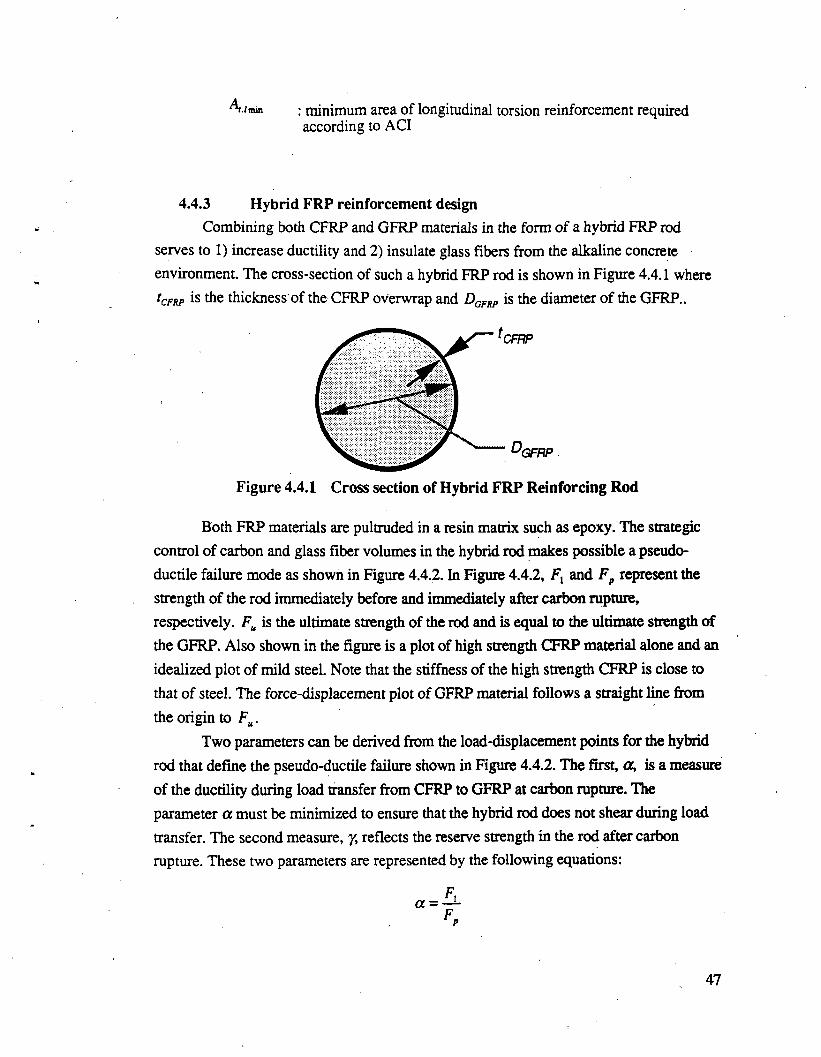
’./min : minimum area of longitudinal torsion reinforcement required according to ACI
4.4.3 Hybrid FRP reinforcement designCombining both CFRP and GFRP materials in the form of a hybrid FRP rod
serves to 1) increase ductility and 2) insulate glass fibers from the alkaline concrete environment. The cross-section of such a hybrid FRP rod is shown in Figure 4.4.1 where tCFRp is the thickness of the CFRP overwrap and DCFRP is the diameter of the GFRP..
Figure 4.4.1 Cross section of Hybrid FRP Reinforcing Rod
Both FRP materials are pultruded in a resin matrix such as epoxy. The strategic control of carbon and glass fiber volumes in the hybrid rod makes possible a pseudo- ductile failure mode as shown in Figure 4.4.2. In Figure 4.4.2, Fx and Fp represent the strength of the rod immediately before and immediately after carbon rupture, respectively. Fu is the ultimate strength of the rod and is equal to the ultimate strength of the GFRP. Also shown in the figure is a plot of high strength CFRP material alone and an idealized plot of mild steel. Note that the stiffness of the high strength CFRP is close to that of steel. The force-displacement plot of GFRP material follows a straight line from the origin to Fu.
Two parameters can be derived from the load-displacement points for the hybrid rod that define the pseudo-ductile failure shown in Figure 4.4.2. The first, a, is a measure of the ductility during load transfer from CFRP to GFRP at carbon rupture. The parameter a must be minimized to ensure that the hybrid rod does not shear during load transfer. The second measure, y, reflects the reserve strength in the rod after carbon rupture. These two parameters are represented by the following equations:
47

whereF:: Force in rod just before high modulus fiber rupture
Fp: Force in rod just after high modulus fiber rupture
Fu: Ultimate carrying capacity of rod
Figure 4.4.2 Pseudo-Ductility o f H ybrid FR P R einforcing R od
One can infer from Figure 4.4.2, that the amount of CFRP must be minimized to achieve a pseudo-ductile failure mode from the two brittle materials. If the amount of CFRP is not minimized to an acceptable level, y becomes less than 1.0 and the rod will not have.sufficient reserve strength.4 There is no significant advantage in having extremely high values of y, though it must be greater than 1.0. Before carbon rupture, both GFRP and CFRP contribute to the strength and stiffness of the rod. After carbon rupture, the rod follows the stiffness characteristics of the GFRP only. Thus, the strategic integration of two brittle FRP materials having significant differences in stiffness characteristics can produce a hybrid FRP reinforcement material possessing a pseudo- ductile failure mode.
Mechanical properties of hybrid rods for various cross-sectional area fractions of GFRP to CFRP are determined by the relative material properties and contents. Figure
4 Research is needed to determine h o w great an impact load can be transferred to the G F R P during carbon rupture without failure of the glass fibers as this will limit the value of a that can be used in the design of an acceptable hybrid F R P rod.
48
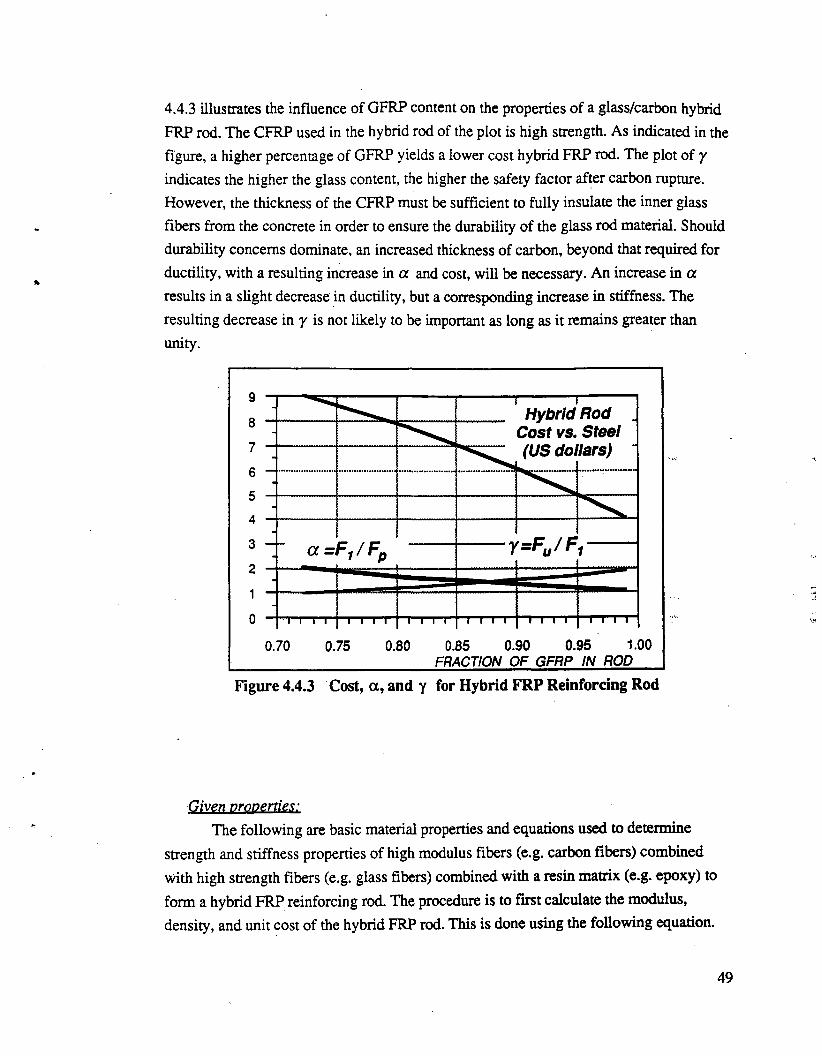
4.4.3 illustrates the influence of GFRP content on the properties of a glass/carbon hybrid FRP rod. The CFRP used in the hybrid rod of the plot is high strength. As indicated in the figure, a higher percentage of GFRP yields a lower cost hybrid FRP rod. The plot of y indicates the higher the glass content, the higher the safety factor after carbon rupture. However, the thickness of the CFRP must be sufficient to fully insulate the inner glass fibers from the concrete in order to ensure the durability of the glass rod material. Should durability concerns dominate, an increased thickness of carbon, beyond that required for ductility, with a resulting increase in a and cost, will be necessary. An increase in a results in a slight decrease in ductility, but a corresponding increase in stiffness. The resulting decrease in y is not likely to be important as long as it remains greater than unity.
FRACTION O F GFRP IN R O D
Figure 4.4.3 Cost, a , and y for H ybrid FR P R einforcing Rod
Given properties:The following are basic material properties and equations used to determine
strength and stiffness properties of high modulus fibers (e.g. carbon fibers) combined with high strength fibers (e.g. glass fibers) combined with a resin matrix (e.g. epoxy) to form a hybrid FRP reinforcing rod. The procedure is to first calculate the modulus, density, and unit cost of the hybrid FRP rod. This is done using the following equation.
49

f1 _1 &hs.fib
Phfrp yv hs.fib Phs.fib
Uhfrp _ _ Uhs.fib _Vhs.fib ) ?
fr__
__1
vY hm.fib
hm.fib
Phm.fib + (l 'hm.fib )X jPm
_*m_ hm.fib _ _W«J.[4.4.42]
where
Vt>
Phfrp
Uhfrp
Ehs.fil
Phs.fib
U,hs.fib''hm.fi
Phm.i.fu
w,hm.fil
E_
u.
hs.fil
hm.fi
: modulus of the hybrid FRP reinforcement
: density of the hybrid FRP reinforcement (kg/m3)
: unit cost of the hybrid FRP reinforcement ($/kg)
: modulus of the high strength fibers (e.g. glass)
: density of the high strength fibers
: unit cost of the high strength fibers
: modulus of the high modulus fibers (e.g. carbon)
: density of the high modulus fibers
: unit cost of the high modulus fibers
: modulus of the resin matrix (e.g. epoxy)
: density of the resin matrix
: unit cost of the resin matrix
: volume fraction of high strength FRP (e.g. GFRP) in hybrid rod
: volume fraction of high strength fibers (e.g. glass fibers) in high strength FRP (e.g. GFRP)
: volume fraction of high modulus fibers (e.g. carbon fibers) in high modulus FRP (e.g. CFRP)
The yield and ultimate strains for the hybrid FRP rod are computed as follows:
where
ehs
"hm
r eChs.fib 0 ■-1 fhs.fib^hm. 0 E‘hm.Jib_ _fhm.fib _
[4.4.43]
ultimate strain of the high strength fibers and the hybrid FRP rod
ultimate strain of the high modulus fibers and yield strain of hybrid FRP rod
50

fkt.fit ' tensile strength of the high strength fibers
fkm.fi. ' tensile strength of the high modulus fibers
The modulus of the high strength pultruded FRP is computed as follows:
* Efa = ks.fibks.fib + (l _ ks.fib)m [4.4.44]where
* Eks : modulus of the pultruded high strength FRP (e.g. GFRP)
The parameters a and y , as discussed previously, serve as checks to ensure ductility and reserve load capacity. The a parameter must be less than a maximum set value (e.g. 1.4) according to the following:
whereE -V *
£ O' [4.4.45]
: maximum load transfer factor for hybrid FRP rod
The y parameter must be greater than a set value to ensure reserve load capacity (e.g. 1.0).
where
v _/ r ' r _* ___• - /nE\ EffoS czehm
[4.4.46]
minimum reserve load capacity factor for hybrid FRP rod
Finally, the cost of the hybrid rod with respect to steel reinforcement on a stiffness basis is found using the following equation.
[4.4.47]\Pr A Ur J
whereFhfrp '■ ratio of hybrid FRP cost to steel on a stiffness basis
longitudinal FRP reinforcement required (all three equations can apply)
51
The volume of mild reinforcement required depends on the areas of the beam element under high magnetic flux fields. The areas of the beam cross-section required to have non-magnetic reinforcement are indicated by the parameters b^ and . These parameters are defined in the following equation used to determine the volume of reinforcement per beam in the top flange of the box section that must be non-magnetic. Note all three of the following equations may apply to a give section depending on the value of hfrp-
when hfrp > 0
where
rc.v.frplbf r P
f r P
rc.v.frp/bf .min
,L\
\ y[4.4.48a]
: compression flange reinforcement volume required non-magnetic
: width of non-magnetic zone for one side of beam ( < 0.5b)
: depth of non-magnetic zone for one side of beam (hfrp < h)
when h-t>hfrp>trv iV re.h.frplb 1
1 J min {b^t}'v_ r rt.b.frplb __ U - 2 f J IA * J tv y
where
[4.4.48b]
Vrc.k.frp/b '• compression web reinforcement volume required non-magnetic
Vr<.h.ftpib '• tension web reinforcement volume required non-magnetic
when hfoth-t
v',,w l = ( ^ k , 4 hfrp + t - b ^ [4.4.48c]
whereVrt.v.frpib ‘ tension flange reinforcement volume required non-magnetic
lateral FRP reinforcement required (only one of three equations will apply)The volume of stirrup and torsional reinforcement per beam required to be non
magnetic is found using one of the following three equations depending on the value of
V
when hfo < t
52
[4.4.49a]
wherevv t.t.frplbVy t.t.frplb
^t.t.frplb f 2V ^ i \V,,lb]y t.t.frplb _ v. A ;La .i^J
stirrup reinforcement volume required non-magnetic
torsion reinforcement volume required non-magnetic
when t<hfrp<h-t~vv t.t.frplb '2 bfrpt + (hfrp-t)m m {2 b frp,2 tY \Vr,lb1v_v t.t.frplb _ Af(. * y
. A / ^ .
when h-t^hfo~vv t.t.frplb 2bfn>(hfrp + 2r - h) + (h - 2 t)miri{2 bfr,2 t}\vrtlby t.t.frplb _ , A J - A A
[4.4.49b]
[4.4.49c]
4.4.4 Cost FunctionsOnce all material quantities are determined, beam costs can be calculated. Beam
material costs are computed for all steel reinforcement and for a mixture of steel and hybrid FRP reinforcement according to the following equations.
Beam cost without FRP reinforcement:
X,,b'
.V r.„b_
where
Vr.,/b : volume of transverse reinforcement (i.e. stirrups) required per beam
Vrl/b : volume of longitudinal reinforcement (i.e. bars) required per beam
Vrn=VrM + Vrm [4.4.51]
where
Vr/b ; total volume of mild reinforcement required per beam
V„, = V - V ,» [4.4.52]
where
2A .,(j](X 1+ l'1)
(At., + Ac.,+ At.* + Ac.*+ A ,i)L[4.4.50]
53
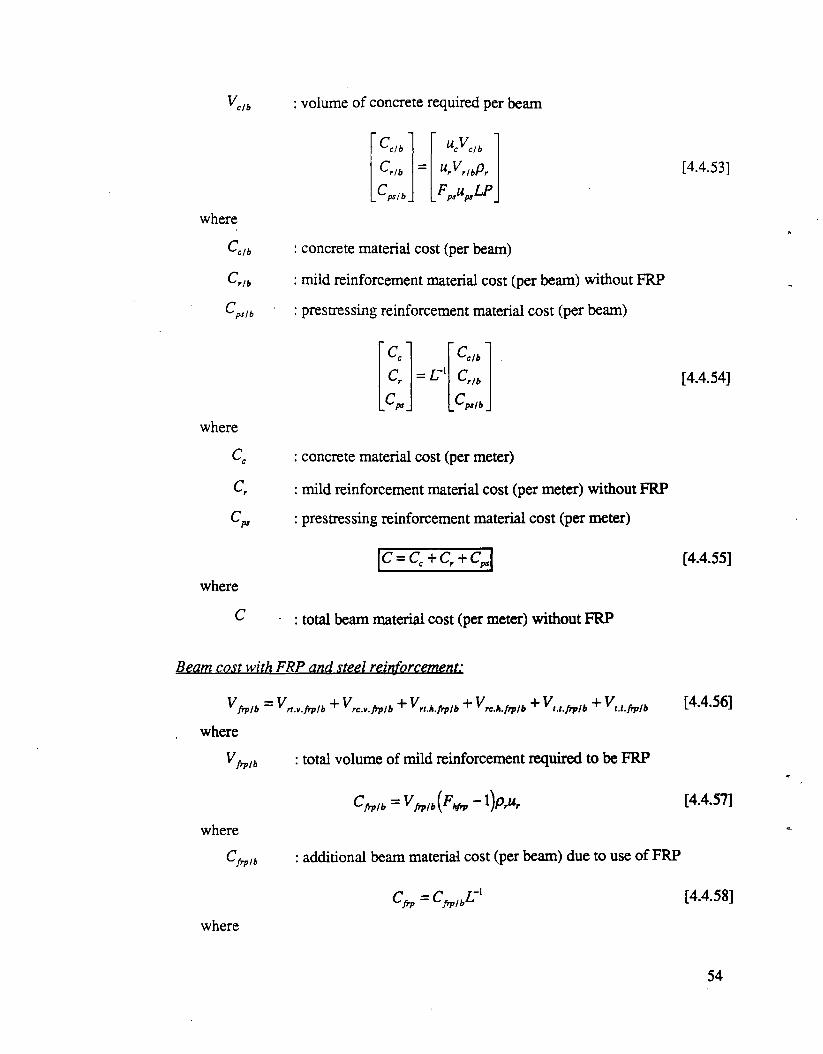
: volume of concrete required per beamc/b
where
c / b
" r f b
* p s lb
where
where
C
~ c e l b ' " u e V e / > '
C r / b - r V r l b P r
S ' p s l b _ F u L PL p * ps
[4.4.53]
: concrete material cost (per beam)
: mild reinforcement material cost (per beam) without FRP
: prestressing reinforcement material cost (per beam)
1t______
1
Cr II 1 Crib1--
------
-
1------
---
1____
_
[4.4.54]
: concrete material cost (per meter)
: mild reinforcement material cost (per meter) without FRP
: prestressing reinforcement material cost (per meter)
C = C e + C r + Cp, [4.4.55]
: total beam material cost (per meter) without FRP
Beam cost with FRP and steel reinforcement:
Vfrplb = rt.v.frplb + Vrc.v.frplb + rt.h.frp/b + re.h.frplb + t.t.frplb + t.l.frplb [4.4.56]where
Vfrpib : total volume of mild reinforcement required to be FRP
where
C f r p / b
where
Cfrplb -Vfrplb{Fhfrp l)prUr
additional beam material cost (per beam) due to use of FRP
Cfrp = Cfrp/bL
[4.4.57]
[4.4.58]
54
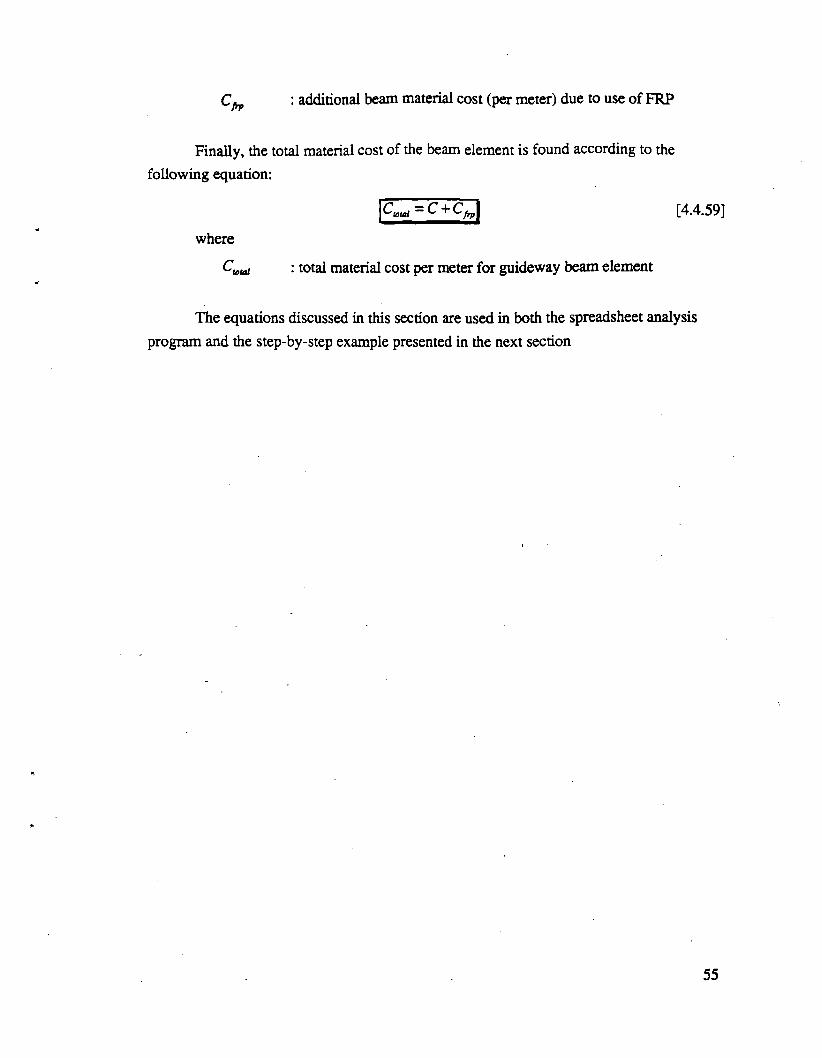
: additional beam material cost (per meter) due to use of FRP
Finally, the total material cost of the beam element is found according to the following equation:
C ^ C + C j J [4.4.59]
where
Cutal : total material cost per meter for guideway beam element
The equations discussed in this section are used in both the spreadsheet analysis program and the step-by-step example presented in the next section
55
4 . 5 O p t i m a l p r e l i m i n a r y d e s i g n
4.5.1 OverviewUsing equations presented in section 4.4, this section illustrates an analysis of a
reinforced concrete hollow box beam with a step-by-step example. In addition, several sensitivity analyses are presented for a variety of span widths, depths, and lengths as they relate to overall material costs. The analysis presented is based primarily on static loading conditions as shown in Figure 4.1.1, though preliminary dynamic effects are also considered. The influence of beam geometric properties and vehicle loadings on guideway beam dynamics is presented in section 4.6.
4.5.2 Spreadsheet exampleDescription
A complete copy of the spreadsheet analysis program is included in Appendix A. The first page of the program is shown in Figure 4.5.1. Cells that are "bold" indicate values input by the user. Other cell locations, shown in Figure 4.5.1, Figure 4.5.2, and Appendix A, are used specifically for either intermediate calculations or for verification by the user.
User I r f f lili. . . ) j 1 | page 1material data i................... I ................... deflection constraints.... 1...................
ltAtY.JDljJI.SswiwH.wM....^ aaa ***~‘”**~**‘‘"‘***~***<‘liiilUllIliUIL.mnyM.........ilillflflliHMMWM.uMMHHwimload factors s................... *...................
xjta.canc..=...i_____23.QC|fltIS[/ra^j.... iakayi____ _rjtjQ jsin=......!______________________________S.conc = $90.00l(S/mA31 \okap!
....WH.nj.HMWI......F!h“= !
£ .re in= 1 $0.55i<jS/kgi \okdy! nepative reinforcement fractions$ ns = $2.25i('S!/lc{h ! okav! F.nr v =s | OJSj
F.nr.h = 1...........1-001 ...................fro data • ■ lakav!.......... bar and clearance dimensions
D .stir = O.Q127.(MK(m)....... ......h .fm = 0.40-:fm> 1 ........ Cj:= .......... i O JH S lO O ifm l.........section data- r -okav! concretestress constraints..................h = 1 ! ................... F .c.t* =...... i .............500LffkA 51IP al
F .cc* = i ............0 .4 5 i(*fc l____tminss lokdv! oermissible strains 1 .................
eps.cnnc* = }........0.0030}loadings ? ........... i ................... itffczv/.......... eps.ri = ___ l .... 0.0020|...................w .v= 2.ft0!(tnnne/rn'> ! okav! alnha.r= . .1...... 0.60001______ ....
........ ...j............MOiCtonne).............................P..h..=...........!............MOiCtonne)........ ioJtayl..........
max. shear zone check, L.................. 1n _ . A 1?.ah= 0.50K*b) |
Figure 4.5.1 Spreadsheet User Input (page 1)
56
As seen in the spreadsheet, values are entered in SI units. When necessary, the program converts to English units to correspond to ACI code equations and reconverts final results back to SI units. For most cases, both units are shown (see Appendix A) for ease of explanation to users familiar with either convention. Figure 4.5.2, page 2 of the complete program, shows primary results from the input given in Figure 4.5.1.
Reftulfet* Itotal cost w! frp .......1..................1... concrete modulus ............ J____ ____
Rcnnc.- i 28 IflOifMPai ........total costw/p frp ...... j................. :...
f = 5 nisjfml 1........mild reinforcement costs P ...... ........[... nrestressing results •........... ..... 5... ............
........$28.71 if per mi.. P = f 3.153lfkNV.........1................
.Cu.= ......... beam dead wei eht =................ J................C.f 1 = w.rl = 2 442;ftnnne./mi ;c.j= ........ ......$lQ7-5Qi(per.m) j fundamental ffeauencvi................1........frp costsC~JLvIrp = $43.32:fper.mi...... [ deflection results | ?C.r.h.frp = ........$68-52)(per m) I kA.v = | 4141| iC.LLfiqp = $36.95jfpermi \ kA h = i 28711 .............i___ _.......C«»LLfu/.~....summary; of ....... .$22.85i(per.m)___ l..„.C.r.frp - resulting stiffness L . _ 1C.ps =...... $51.07=(per mi j F.I.v = j 1 .fi9F.+09jfkg»mA2i !...........C.c =____ F.T h = 5 8 76F.+08 !fkp»mA2i I
percentage of reinforcement (wlo frp)............%rho.r= I 2.595%._ 5: : percentage of frp cost tp total mild rein, cost%rho.fm.r £ 59.661%.... 1
%rho.fro.tot = 26.421% 5
Figure 4.5.2 Spreadsheet Results (page 2 )
Step-by-step ExampleThe complete step-by-step example is presented below using equations presented
in section 4.4. Results, equation numbers, and notation used in the example of this section correspond to both 1) the formulas presented and discussed in section 4.4, and 2) the spreadsheet output shown in Appendix A and Figures 4.5.1 and 4.5.2. Intermediate calculations are underlined in the example. The total calculated beam material cost with and without FRP reinforcement are highlighted by a surrounding border.
57
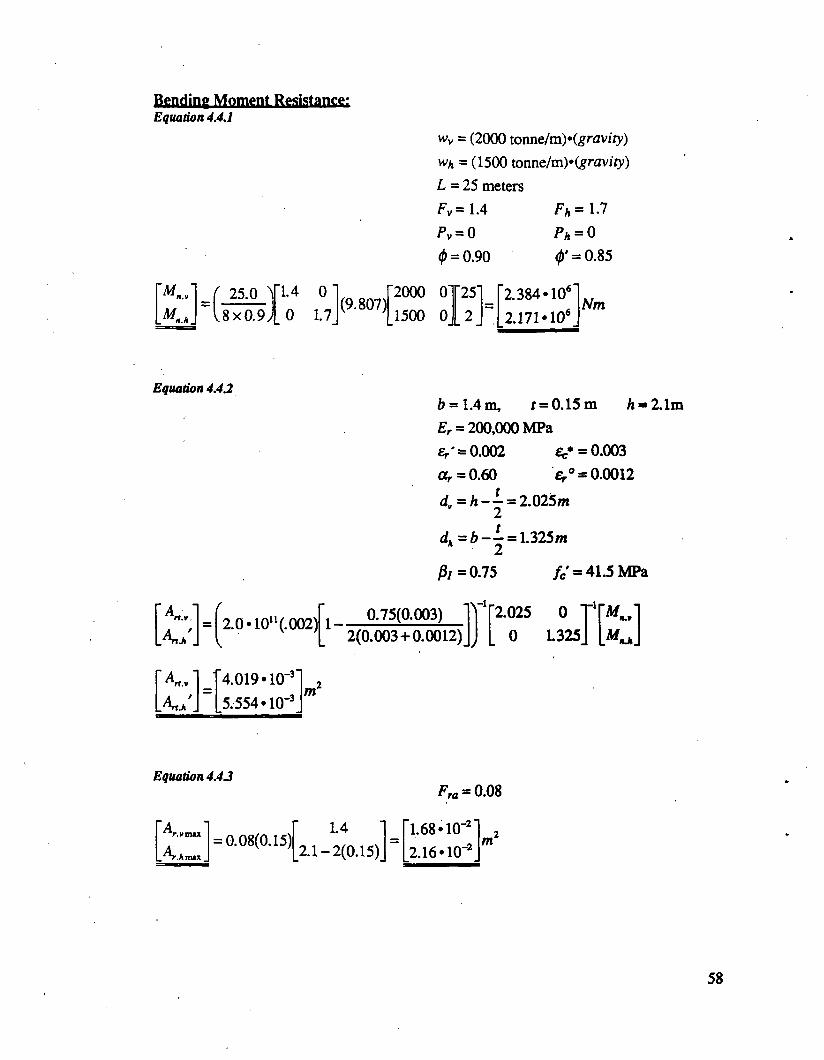
wv = (2000 tonne/mXgravi'ry) Wk = (1500 tonne/m)»(grav/oO L = 25 meters Fv= 1.4 F h = 1-7Pv = 0 Ph = 0<j) = 0.90 <f>' = 0.85
Bending Moment Resistance:Equation 4.4.1
r * „ i ( 25.0 p . 4 0 ■(9.807)
"2000°1 I"25] '2.384 *106'
U x 0 .9 j [ 0 1.7 _ 1500 ojU J 2.171 *106_
Equation 4.426 = 1.4 m, r = 0.15 m h = 2.1mEr = 200,000 MPa£r' = 0.002 fie* = 0.003a , =0.60 V = 0.0012
dv = h - - = 2.025m 2*
dh = 6 - — = 1.325m * 2
P i = 0.75 / c' = 41.5 MPa
^rt.v./
l A / J <
k / J
2 . 0 « 1 0 “ ( . 0 0 2 ) 1 - -0.75(0.003)
2(0.003 + 0.0012)J) l 0
- l r -2.025
4.019‘ 10-3 5.554 • 10-3
m
Equation 4.4 JFra = 0.08
= 0.08(0.15)1.4
2 .1-2(0 .15)1 .6 8 » 1 0 “2
2.16 *10-2m
58

Bending k’iitiiiimEquation 4.4.4
t Resistance; (conU
D b = 1.588 x 10⁻² m (5/8
A‘ r.vmin (1.588 •10"2)^(0.15)2 f 2 .0 * 10n(0 .0012)Y r i.4
r.Amin. 8 [ 2.54* 107 J 2.1-2(0.15)
^r.vmin "2.630‘ lO'3'
_^r.Amin_ 3.381-10"3
Equation 4.4.5Fnrv = 0.25
A=.v = max{0.25(4.019*10'3),2.630*10"3}
=2.630*10~%m 2
Equation 4.4.6
K m = m ax|A .Amin ,5.594 • 10'3 - (4.019 • 10'3 + 2.630 •
A,.* = 4.882 • 10~3 m2
Equation 4.4.7F „ j » = 1 . 0 0
= ( t O O ) A . . . a / L . = ‘t . 8 8 2 . 1 Q - 1 m 2

Deflection Criteria:Equation 4.4.8a
£c = 2.830xl010Pa
* = - ^ = 7.067 Ec
(.15)(2.1)(1.4-.3) + (« -1)= '
4.019* 10~3 (2.025)+ 2.63* 10-3( 4 r +-.15(2.1)2
2(.15)(1.4-.3) + { n - 1)[4.019 • 10"3 + 2.63 • 10~3]+2(.15)(2.1)
1.0591 .0 0 0
>ye.* = 1.058 m
y<.* = h - ye-v => yt_v = 1.042m
Equation 4.4.8b
(. 15)(1.4)(2.1-. 3) + (n -1)y e. * = -
(4.882 •10-3)^1.325 + +.15(1.4)2
2(.15)(2.1-.3) + (n - 1)[2(4.882 • 10_3)]+2(.15)(1.4)0.7131.019 yc.h =0-700m
y,.> = b - ye.H => y,.v= Q-700m
Equation 4.4.9a
Ig V = Ji 0583 + (2.1 - 1.058)3] + (1.4-0.3)
1.058 - j [(1.4 - 0.3)0.15 + (n -1)2.630 • 10“3]
+(2.025 - 1.058)2[(1.4- 0.3)0.15 + (n -1)4.109 • 10-3]
= 0.232 + 0.175 + 1.770
7? v= 0.584 m4
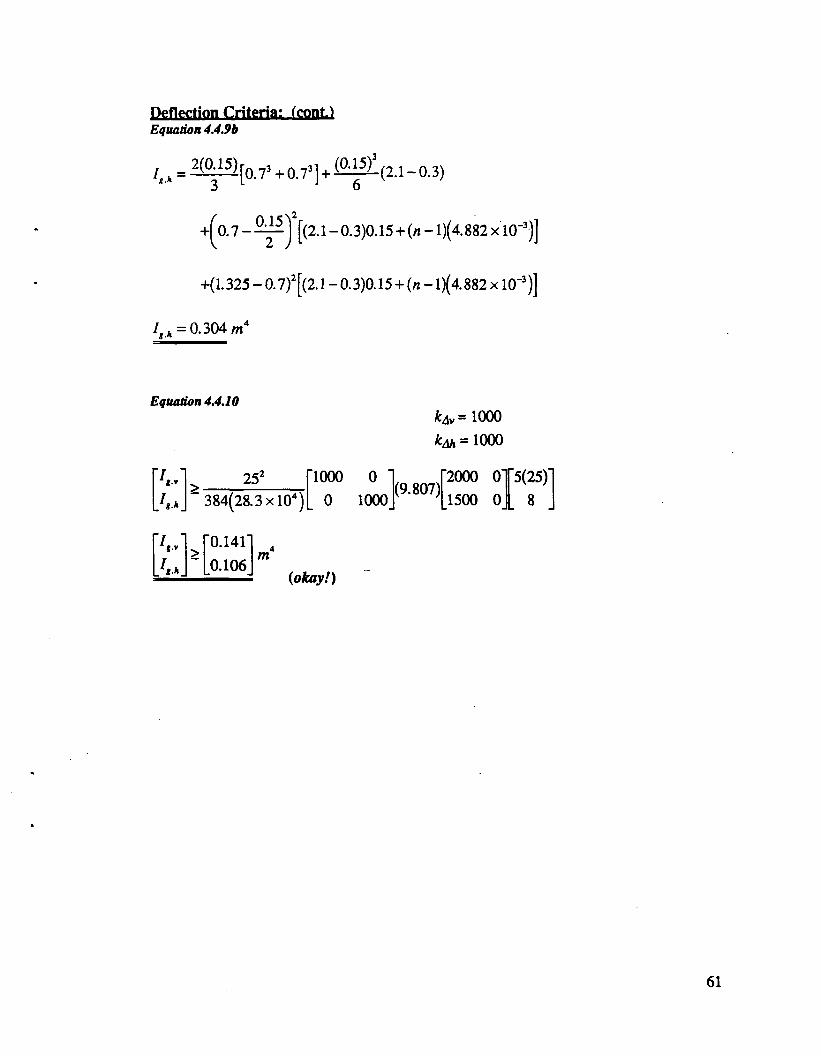
Deflection Criteria: (cont.)Equation 4 A M
l t .* = [0 .73 + 0 .73 ] + .1 - 0 .3)
+(o.7 - ^ j [(2.1 -0.3)0.15 + (n - 1)(4.882x 10"3)]
+(1.325 - 0.7)2[(2.1 - 0.3)0.15 + ( n - 1)(4.882 x 10“3)]
/ j A = 0.304 m4 * 25
Equation 4A.10kAv= 1000
^ = 1 0 0 0
*•»
*•*
252384(28.3 xlO4)
'1000 0 '(9.807)
'2000 O f0 1000. .1500 OJ.
5(25) 8
17, .1 ro.1411>k * J .0.106.
(okay!)

Prestressing CalculationsEquation 4.4.11
Flp = 0.20= sooJT;
0.96L ^ m in J ( 1 - 0 . 2 )
2.384 x l06(1.041)0.584
2.171 x 10⁶(0.7)0.304
-500V4.150xl07
'P
Amin.'1.236 xlO6
2.139 xlO6N
Equation 4.4.12pc = 23kN/m3 pr = 77 kN/m3
wm = (0.6 tonne/m)(g)
wD = (0.96)23000 + ((4.019 + 2.630 + 2(4.882)) x 10"3)(77000 - 23000) +100(9.807)
= 22080N / m + 886.28W / m + 980.67W / m
wp = 2.297 xlO4 N /m
= y , . , ~ 2 t
ema. = 1-042-0.3 => ema = 0.742 mmax max
Md = wdL2 / 8 => Mp = 1.795xlO6 iVm
Equation 4.4.13
(2.395 x 10⁴)(252) 8(0.742)(l-0.2)
= 3.153xlO6 N
62

Prestressing Calculations: IcontlEquation 4.4.14
1.236 x10s' P - max-4 2.139 x 10⁶
3.153xl06P = 3.153 x10s N
Equation 4.4.15(Check)
fc.* = 0.45
f '2.383 x10s (1.058)'pvmtxPh max
f0.96>~ l 0.8 J
(0.45)(41.5xl0s)1
- 0.5842.171 x l0 s(0.7)
L 0.304 )
~P Ivmtx '1.723 xlO7'PmA A max. 1.641 xlO7
(okay!)
Equation 4.4.16
e = m d
p( i - f¥) (for this case)
e = 0.742 m
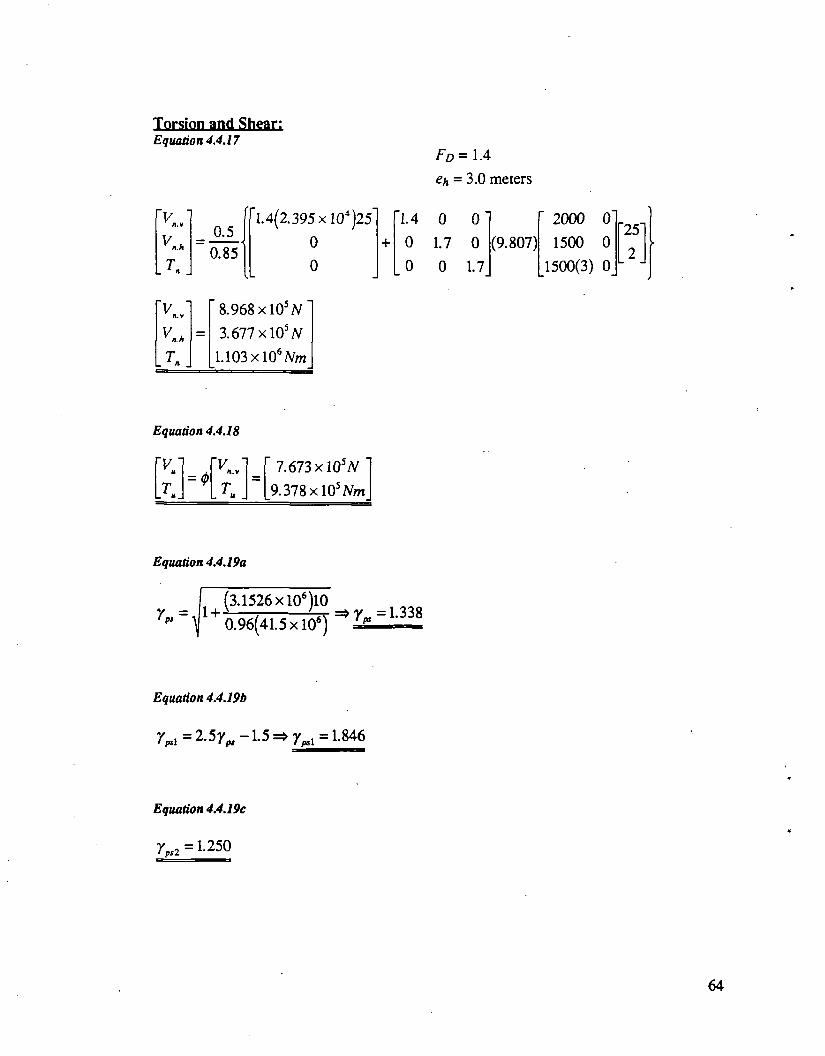
Torsion and Shear:Equation 4.4.17
Fq = 1.4 eh = 3.0 meters
r yn.v0.5
'1.4(2.395x10^)25 "1.4 0 O' ‘ 2000 Ol
“ 0.850 + 0 1.7 0 (9.807) 1500 0
[ t „ j 0 L0 0 1.7J 1500(3) 0 jL
[ X ,l ' 8.968 x 10⁵n '= 3.677xl05//
1.103 x \0 6 Nm
Equation 4.4.18
\ v ;=<p
[ X . / ’ 7.673 X 10sN 'l Tu \ 9.378 x 10s Nm
Equation 4.4.19a
V "
(3.1526 x l0 6)l0 0.96(41.5 xlO6)
y =1.338
Equation 4.4.19b
7 , t = 2 .5 y „ - 1.5 =» 1.846
Equation 4.4.19c
r pj2 = 1 .2 5 0
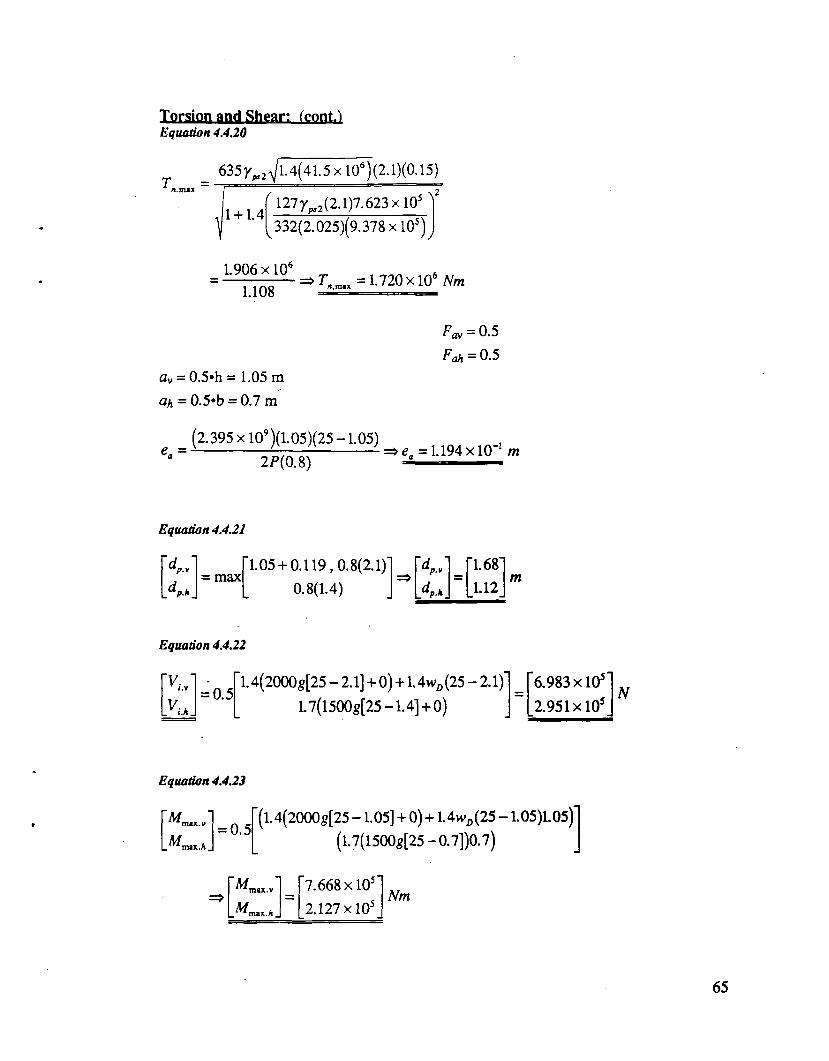
Torsion and Shear: (cont.)Equation 4.4.20
_ 635yp,2A/l.4(41.5xl06](2.1)(0.15)
1 + 1.4r I l l y ^(2.1)1.e iZ x l t f ^
332(2.025)(9.378 x 10s)
1.906 xlO6
1.108Tntm,x = l l2 0 x l0 6 Nm
Fa, = 0.5Fah = 0.5
av = 0.5»h = 1.05 m ah = 0.5*b = 0.7 m
(2.395 x l0 9)(1.05)(25-1.05)2 P ( 0 . 8 )
= > e a = 1 .1 9 4 x l O ' 1 m
Equation 4.4.21
dp.v ™ fYl Q V'1.05 + 0.119,0.8(2.1)'
_ V— IIldA
0.8(1.4)dp.v T.68"
1.12
Equation 4.4.22
r v . ' .= 0.5
1.4(2000g[25 - 2.1] + 0) +1.4 wD (25 - 2.1)‘ 1.7(l500g[25 -1.4] + 0)
’6.983 x10s'2.951 x l0 s_
Equation 4.4.23
— n ^’(l.4(2000g[25 - 1.05] + 0) + 1 .4 ^ (25 - 1.05)1.05)'U* J
(l.7(l500g[25-0.7])0.7)
^max.v '7.668xl05'2.127 x 10s _
Nm
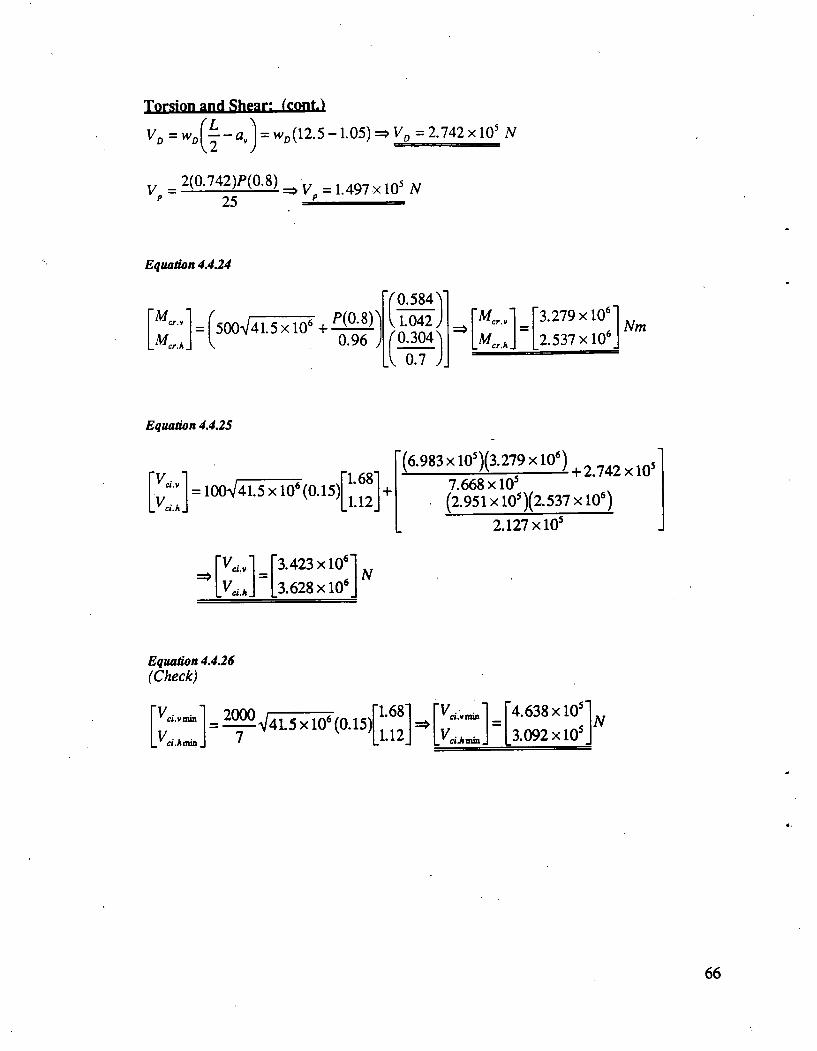
Torsion and Shear: (cont.)
V0 = wfl( j - a ,) = wd(12.5 -1.05) => V0 = 2.742 x 10s N
V = ^Q-742) ^ 0-8) _> y = i. 497 x10s N p 25 =£----------------
Equation 4.4.24
500V41.5xl06 +V
^(08)^ 0.96 J
0584v1.042, 0.304^
, 0.7 J.
i x , , i '3.279 x10s'
L ^ j 2.537xl06Nm
Equation 4.4.25
= 100V41.5 X 106 (0.15)' 1 . 6 8 '
1 .1 2
( y 8 3 * J 0 = ) ( 3 . 2 7 9 x ^ ) + 2 742xi(y 7.668 x10s(2.951 x l0 s)(2.537xl06)
2.127 x10s
|X ,v l '3.423 x10s'3.628 x10s
N
Equation 4.4.26(Check)
V .ci.vmrnv. ci. A min.
2000
7V41.5x 10s (0.15)
'1 . 6 8 '
1 .1 2
r v . . 1ci. v nun 4 .638x10s ‘v_ ci .A min . 3.092 x 10s _

Torsion and Shear: (cont.iEquation 4.4.27
'V
LK300V41.5 x 106 +V
0 .3P(0.8) 0.96
2(0.15)' 1 . 6 8 '
1 .1 2+
1.497xl05
0
r v . , i '1.521 X 10s '9.142 x 10s
(okay! )
Equation 4.4.28
K c = ™
3.423 x 10⁶
3.628xl06 1.521xl06 9.142 x10s
V =9.142 x10s iV
Equation 4.4.29
Tco = 127(y^l)>/L4(41.5 x 1()6)(2.1X0.15) => Teo =5.629 x 10s Nm
Equation 4.430
T = >T, = 5.034x10s Nm < Tm
1 +r co(7.623xl0s)^ ^ ( 9 . 377 x10s)
Equation 4.4.31
V =
1 +^ (9 .3 7 7 x 10s) r„(7.623xlOs)
V =4.092x10SN < VM
67
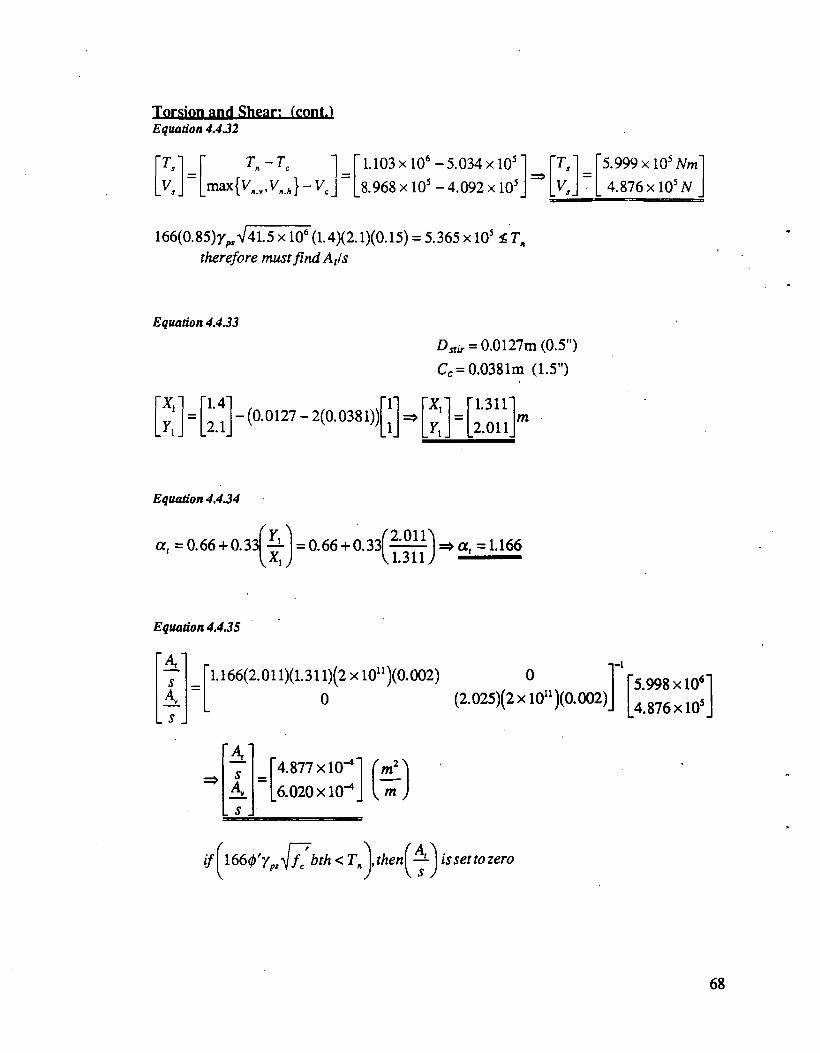
Torsion and Shear: (cont.)Equation 4.4.32
r r . l 1 r> _1 [ 1.103 x10s -5.034 x10s ] \ Ts~ 5.999 x 10s Nml_max{V..„V..*}-Ve_ 8.968 x 10s -4 .0 9 2 x 1 0 /
=>y , J _ 4.876x 10s N
166(0.85)7^41.5 x 10⁶ (1.4)(2.1)(0.15) = 5.365 x 10⁵ £ T„ therefore must find At/s
Equation 4.433Dxi, = 0.0127m (0.5") Cc = 0.0381m (1.5")
[ X '1.4'
i__
i _2 .1_-(0.0127 - 2(0.0381)) X
7 i .
1.3112 .0 1 1
m
Equation 4.434
a, =0.66 + 0.33rL .) = 0 . 6 6 +°-3< T
2 . o i n3 1 1 /
a, =1.166
Equation 4.4.35
' V (-
s
. s .
1.166(2.011)(1.311)(2 x 10" )(0 .002 ) 0
- i - l0
(2.025)(2xl0n )(0.002)5.998 x10s 4.876 x10s
s4
L s J
(? 1 V
"4.877x10“* r m2\m6 .0 2 0 x 10“* Km J
„ { f!b th < T .>,then^
V sis set to zero
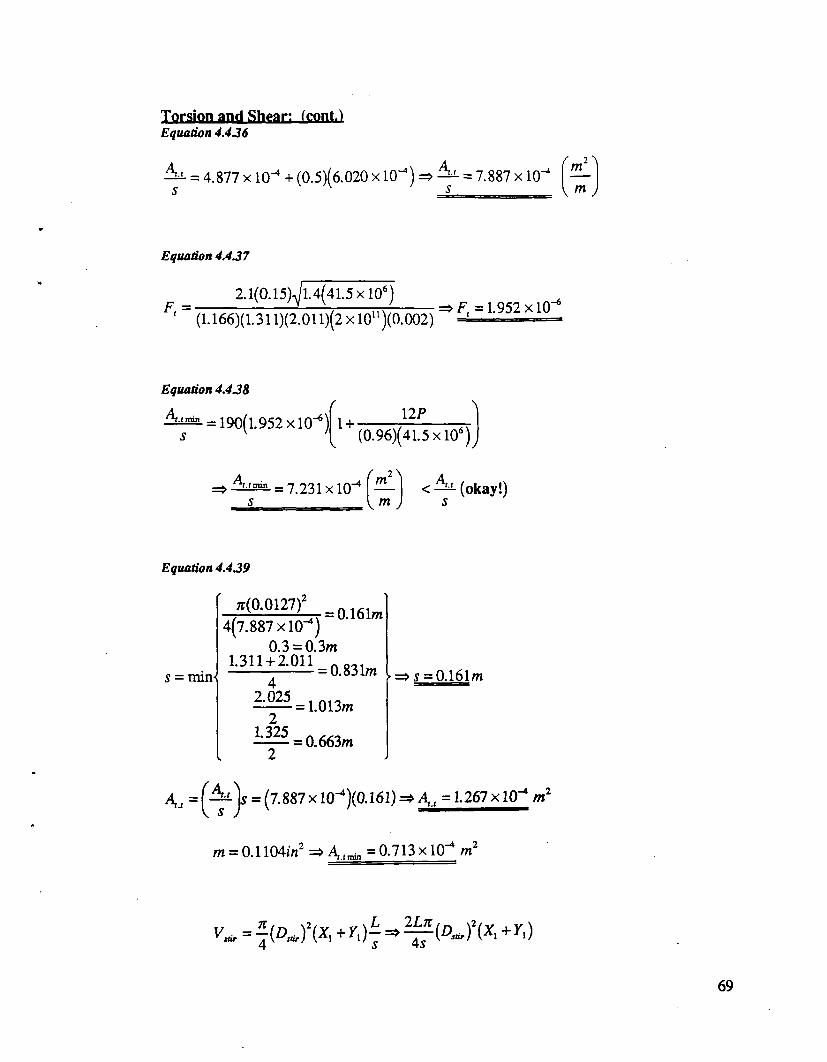
Torsion and Shear: (cont.)Equation 4.436
= 4 .8 7 7 x 1 0 “* + (0 .5 ) (6 .0 2 0 x IQ -4 )4 f m 2 \— = 7 .8 8 7 x 10“* —
s Vm
Equation 4.437
2 .1 (0 .1 5 )^ 1 .4 (4 1 .5 x l O 6)
(1 .1 6 6 ) (1 .3 1 1 ) (2 .0 1 1 ) (2 x 1 0 I1) (0 .0 0 2 )= > ? , = 1 .9 5 2 x 1 0 " *
Equation 4.438
S= 1 9 0 ( 1 .9 5 2 x 1 0 ^ ) 1 +
=> ^ = 2 - = 7.231 X i0 _
1 2 ?
( 0 . 9 6 ) ( 4 1 . 5 x l 0 6)
/ „ 2 \m
y m J< — (okay!)
Equation 4.439
s = m in -
5 aQ 127- ^ = 0 .1 6 1 m4 ( 7 . 8 8 7 x 1 0 ^ )
0 .3 = 0 .3 m1.311 + 2.01_1 _ 0_83im
42 .0 2 5
21 .3 2 5
= 1 .0 13 m
= 0 .6 6 3 m
s = 0 .1 6 1 m
= (7 .8 8 7 x 1 0 “ * )(0 .1 6 1 ) => 4 , = 1 . 2 6 7 x 1 0 “ * m 2
m = 0 . 1 1 0 4 m 2 => 4 im in = 0 - 7 1 3 x 1 0 “ * m 2
» ' - = f (o - ,)2(x .+ 1 '.)72 L tt
4 s(A.>)!(x ,+»r,)
69

Torsion and Shear: (cont.)
2 A Iv; = /i;L = ^ = ^ - ( x 1 + r I)
5
Equation 4.4.40
A , =2
4.1 = 2(4.877 x 10^)(1.311 + 2.011) =* 4 , = 3.241 x 10~3 m2
Equation 4.4.41
C \
4.,™ = 4(1-952 xl0-«)(0.161) 9.377 x10s, 2(1.4)(2.1)(7.623 x 10s)9.377 x 10s+ - A /v-- ----- }-3(2.025)
-max0.5;r(0.127)2
2(7.231 x 10“*)(0.161)1,311 + 2.011
0.161
=> 4.)min =-5.226 x!0~3 m2 < 0 < 4./ (okay!)

Hybrid FRP Reinforcement Calculations:
Equation 4.4.42aVhs.fib =0.68 Eb.fib = 7-30 x 1010 Pa Vkm.fib = 0-68 Ehm.r>b =2.30x10" PaEn = 3.45 x 10⁹ Pa
E ^ = 0.92{0.68(7.30 • 1010) + 0.32(3.45 • 109)}
0.08{0.68(2.30 • 10“ ) + 0.32(3.45 • 109)} => = 5.929 x 10¹⁰ Pa
Equation 4.4.42bf m = 8.00 x 10⁷ Pa fiu.jrp = 3.450 x 10⁹ Pa fhm.frp = 3.530 x 10⁹ Pa pm =1.800 xlO3 kg In?Phs.fib = 2.540 x 10³ kg In?Phm.jib = 1.700 xlO3 kg In?Pm =$0.65 / kg Ptu.fib = $1.50 / kg Pkm.fib = S35.0 0 /kg
p ^ = 0.92(0.68(2.54 x 10³) + 0.32(1.80 x 10³)}
+ 0.08(0.68(1.70 x 10³) + 0.32(l.80 x 103)} =>Pkfip= 2.258 x 10³ kg In?
Equation 4.4.42c=0.920
= 0.92(0.68($1.50) + 0.32($0.65)} + 0.08(0.68($35.00) + 0.32($0.65)}
Pkfrp =$3.0504 / kg
71

Hybrid FRP Reinforcement Calculations; (cont.)Equation 4.4.43
. 3.450 xlO9S l. — . « —t' •
7.300 xlO10 — . 3.530x10’
^ ” 2.300xl0u
0.047
0.015
Equation 4.4.44
£ta = 0.68(7.30 x 10u) + 0.32(3.45 x 10⁹) => £„ = 5.074 x IQ10 Pa
Equation 4.4.45
5.929a_=1.4
a =5.074(0.92)
a = 1.27 {okay! )
Equation 4.4.46
0.047r»in= 1-0
7 = 0.015(1.27)7 = 2.432 (okay!)
Equation 4.4.47
f 2 .0 x 10" 2.258xl03 f $3.05 Mg')1^5.929 x l 0 10J f 77'000) **/m ’
U 9.807 ) 6 ;[$0 .55 //# J
■ = (3.373)(jiy)(5.546) = = 5.38
For added conservatism, use

Hybrid FRP Reinforcement Calculations: (cont.)Equation 4.4.48a
* rc.v.frpfb J ^ I frp 2(0.2),
Equation 4.4.48b
mv rc.h.frp/b
©l©
r4.882xl0"3l 'vY rc.k.frp/b [1.695 xlO"2'v_ v rt.k.frplb l 2.1-0.3 J 1
7©T HX(Noo00rr___
1
(2^) => v_ r rt.k.frplb _ 1.695 xlO"2
Equation 4.4.48c
Vrt.v.frp/b = 0
Note;(Eq. 4.4.49a) not applicable for this example (Eq. 4.4.49c) not applicable for this example
Equation 4.4.49c
f 2(0.2)(0.15) + (0.4-0.15)(2)(0.15)Y 1.310 xlO"1
y ui.fr,,b\ l 0.96 J_3.241 x 10"3(25)
"VY rc.h.frpfb '1.695 xlO"2'v_ Y rt.k.frplb _ 1.695 xl0"2_
73
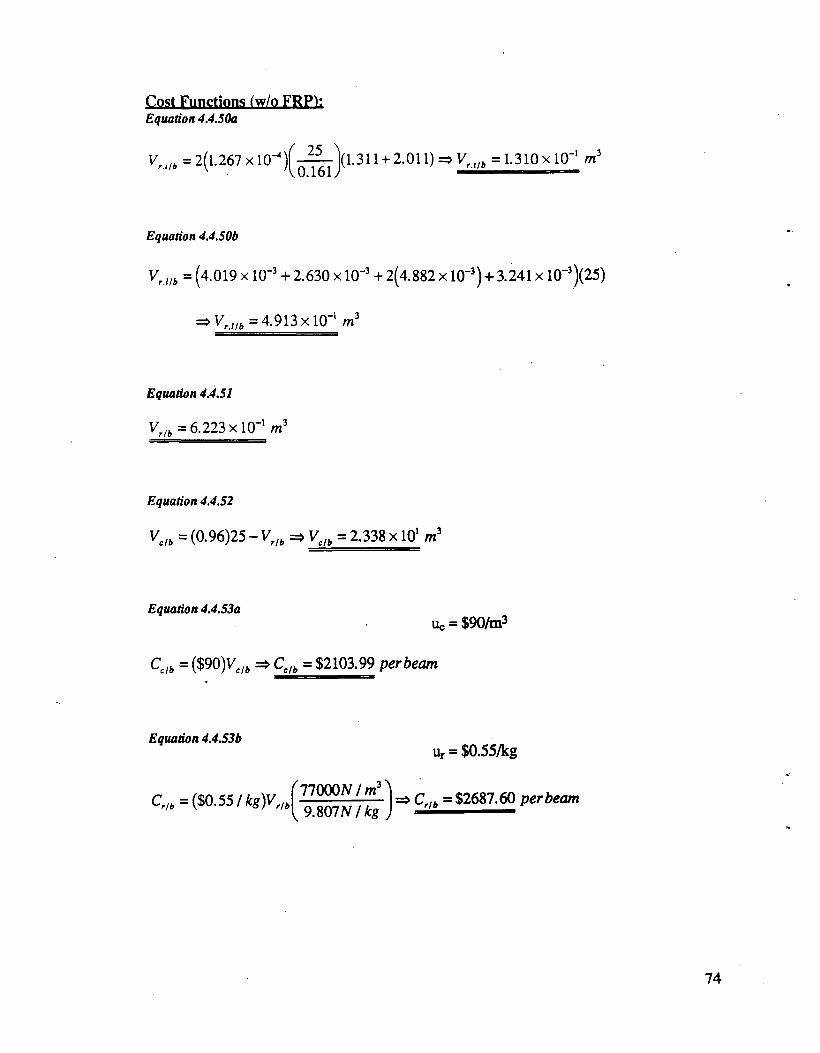
Cost Functions (w/o FRP):Equation 4.4.50a
V, M - 2(1.267 x 1 0 ' ) ( 1. 311 + 2.011) => V,M = 1.310 x IQ '1 m 1
Equation 4.4.50b
Vrllb = (4.019 X10"3 + 2.630 x 10“3 + 2(4.882 x 10"3) + 3.241 x 10"3)(25)
=>Vrl/b =4.913 xlQ"1 m3
Equation 4.4.51
Vr/b =6.223x1 O' 1 m3
Equation 4.4.52
Vclb = (0.96)25 - Vrlb =* Vc/b = 2.338 x 101 m3
Equation 4.4.53auc = $90/m3
Cclb = ($90)Vc/4 => Cclb = $2103.99 perbeam
Equation 4.4.53bur = $0.55/kg
"rib ($0.55/ kg)Vr/b 11000N !9M IN I kg ,
=> Cr/b =$2687.60 perbeam

Fps = 7.2xl0-6
Ups = $2.25/kg
J c p,ib = (7-2 xl0^)($2.25)(25)(3.153xl06) =><7^ =$1276.81 per beam
Cost Functions (w/o FRP): (conUEquation 4.4.S3c
Equation 4.4.54
‘$2103.989 ' c / ■ $84.16*= (25)-' $2687.602 => Cr = $107.50
_$1276.815_ k j _ $51.07_
Equation 4.4.55
C = C<.+Cr + Cps=>C = $242.74 m"1
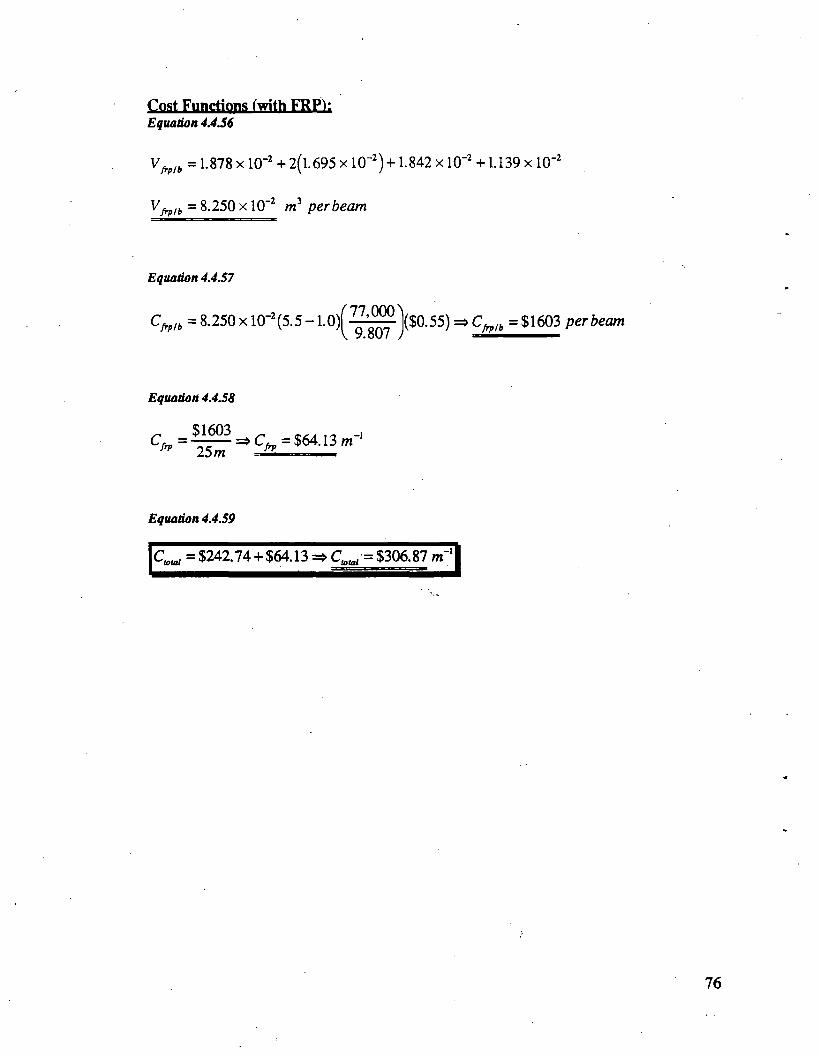
VfrP,b = 1-878 x 1(T2 + 2(1.695 x 10_2) + 1.842 x 10⁻² +1.139 x 10⁻²
Vfrp/b = 8.250 x 10⁻² m2 per beam
Cost Functions (with FRP):Equation 4.4.56
Equation 4.4.57
f l l 0 0 0 '\Cf,„ = 8.250x 10-! (5.5 -1.0)1 ^ ^ l ( $ 0 . 5 5 ) s Cw t =$1603 per beam
Equation 4.4.58
, $1603,fip 25m
=> Cfo = $64.13 m 1
Equation 4.4.59
Ctota, = $242.74 + $64.13 => Ctotei = $306.87 m 11
76
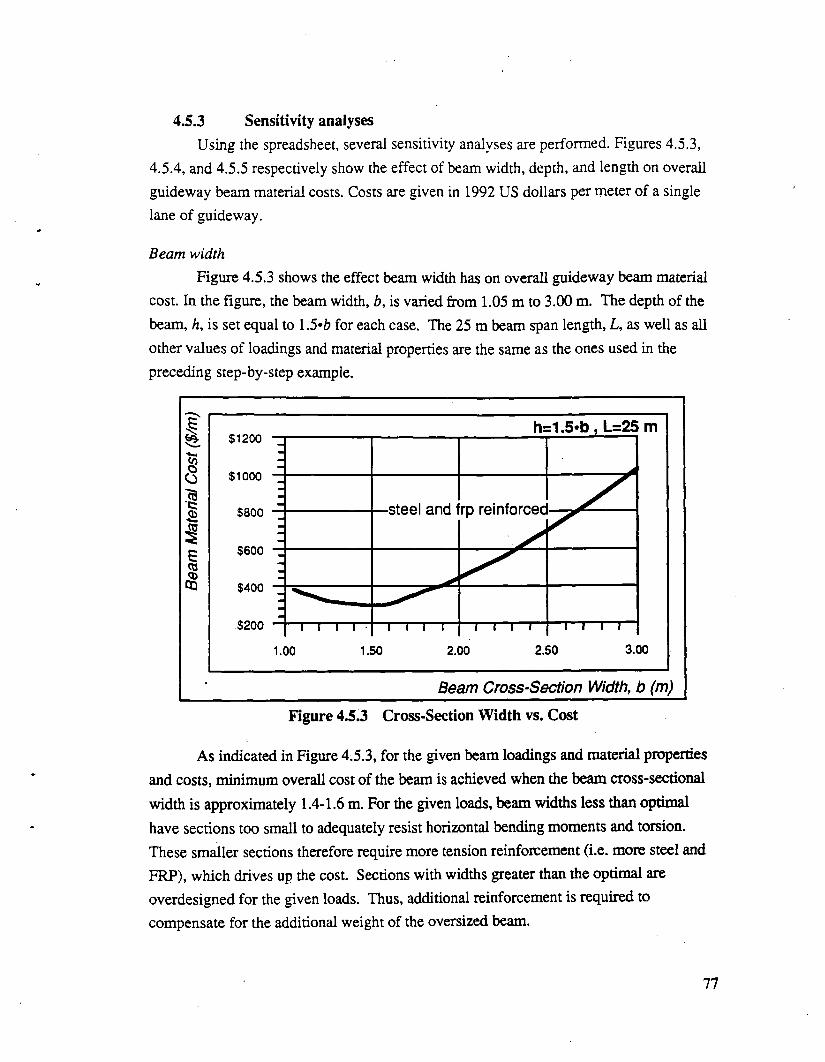
4.5.3 Sensitivity analysesUsing the spreadsheet, several sensitivity analyses are performed. Figures 4.5.3,
4.5.4, and 4.5.5 respectively show the effect of beam width, depth, and length on overall guideway beam material costs. Costs are given in 1992 US dollars per meter of a single lane of guide way.
Beam widthFigure 4.5.3 shows the effect beam width has on overall guideway beam material
cost. In the figure, the beam width, b, is varied from 1.05 m to 3.00 m. The depth of the beam, h, is set equal to 1.5*6 for each case. The 25 m beam span length, L, as well as all other values of loadings and material properties are the same as the ones used in the preceding step-by-step example.
Figure 4.5.3 Cross-Section Width vs. Cost
As indicated in Figure 4.5.3, for the given beam loadings and material properties and costs, minimum overall cost of the beam is achieved when the beam cross-sectional width is approximately 1.4-1.6 m. For the given loads, beam widths less than optimal have sections too small to adequately resist horizontal bending moments and torsion. These smaller sections therefore require more tension reinforcement (i.e. more steel and FRP), which drives up the cost. Sections with widths greater than the optimal are overdesigned for the given loads. Thus, additional reinforcement is required to compensate for the additional weight of the oversized beam.
77
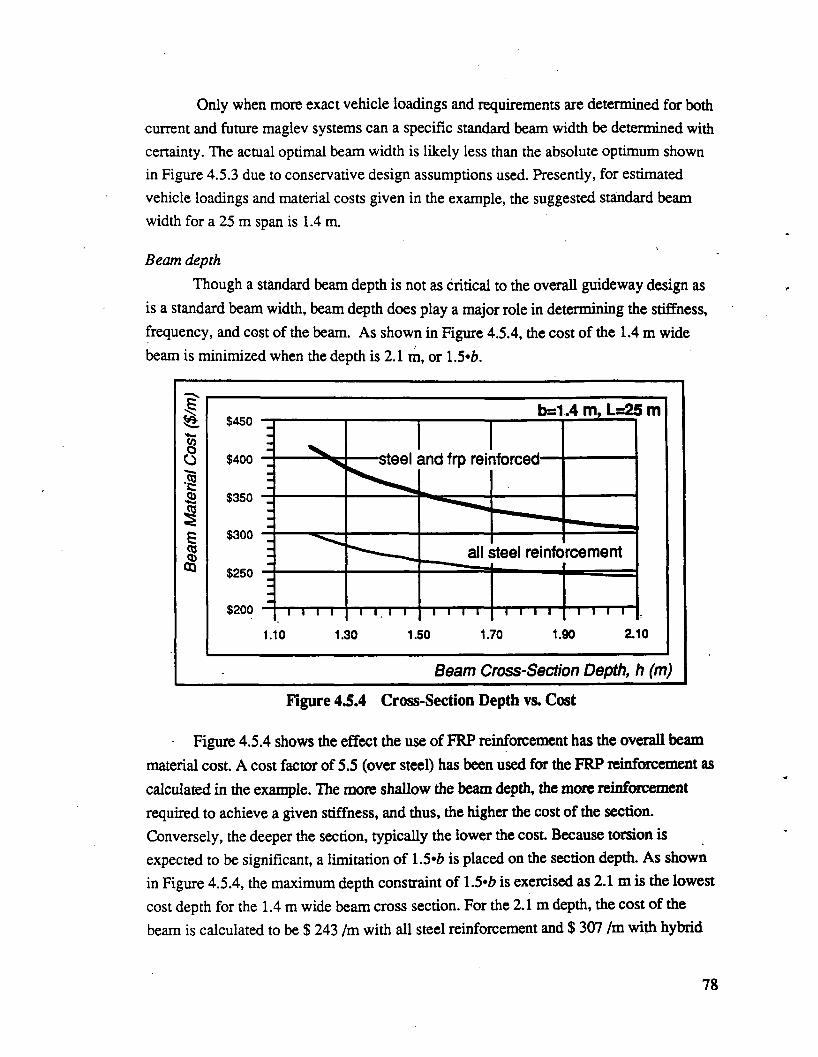
Only when more exact vehicle loadings and requirements are determined for both current and future maglev systems can a specific standard beam width be determined with certainty. The actual optimal beam width is likely less than the absolute optimum shown in Figure 4.5.3 due to conservative design assumptions used. Presently, for estimated vehicle loadings and material costs given in the example, the suggested standard beam width for a 25 m span is 1.4 m.
Beam depthThough a standard beam depth is not as critical to the overall guideway design as
is a standard beam width, beam depth does play a major role in determining the stiffness, frequency, and cost of the beam. As shown in Figure 4.5.4, the cost of the 1.4 m wide beam is minimized when the depth is 2.1 m, or 1.5«h.
F igure 4 .5 .4 C ross-Section D epth vs. C ost
Figure 4.5.4 shows the effect the use of FRP reinforcement has the overall beam material cost. A cost factor of 5.5 (over steel) has been used for the FRP reinforcement as calculated in the example. The more shallow the beam depth, the more reinforcement required to achieve a given stiffness, and thus, the higher the cost of the section. Conversely, the deeper the section, typically the lower the cost. Because torsion is expected to be significant, a limitation of 1.5»b is placed on the section depth. As shown in Figure 4.5.4, the maximum depth constraint of 1.5»h is exercised as 2.1 m is the lowest cost depth for the 1.4 m wide beam cross section. For the 2.1 m depth, the cost of the beam is calculated to be $ 243 /m with all steel reinforcement and $ 307 /m with hybrid
78
FRP reinforcement in the top comers of the cross-section (as detailed in the example). Thus, the use of FRP in this example (Case 2 shown in Figure 4.5.6) increases the total beam material cost by $ 64 /m, or 26 %.
Beam lengthFigure 4.5.5 shows the effect guideway beam span length, L, has on the overall
beam material cost. As shown in the figure, the lower the span, the lower the beam cost. However, the lower the span, the higher the overall column and foundation costs. Aesthetically, longer spans generally are more pleasing. Primarily due to aesthetics, it is common practice for a span to be chosen slightly longer than what is considered to be the most economical span.
Without additional information regarding guideway column and foundation costs, selecting an optimal beam span length is not possible. Several studies have used 25 m as a standard beam span1-2 Also, the Transrapid test track in Emsland, Germany, uses 25 m as its standard span. Though the sensitivity analysis performed does not confirm the 25 m span as optimal, it is shown in Figure 4.5.5 that a 25 m span, at approximately $ 307 /m, is not prohibitively expensive. For assumptions taken in this preliminary analysis, it
1 Harrison, J.A., et.al.,(1992) Maglev Cost Estimation: Capital Cost Elements, Parsons Brinkerhoff Quade & Douglas, Inc. for Volpe National Transportation Systems Center, 1992 Interim Report.2 CIGGT (1989). Maglev Technology Assessment, Task 92: Review, Validation and Revision of the Capital and Operating Costs for a Transrapid TR-06 Maglev System and for a TGV System in the Las Vegas-Southern California Corridor, The Canadian Institute of Guided Ground Transport, 1989.
79
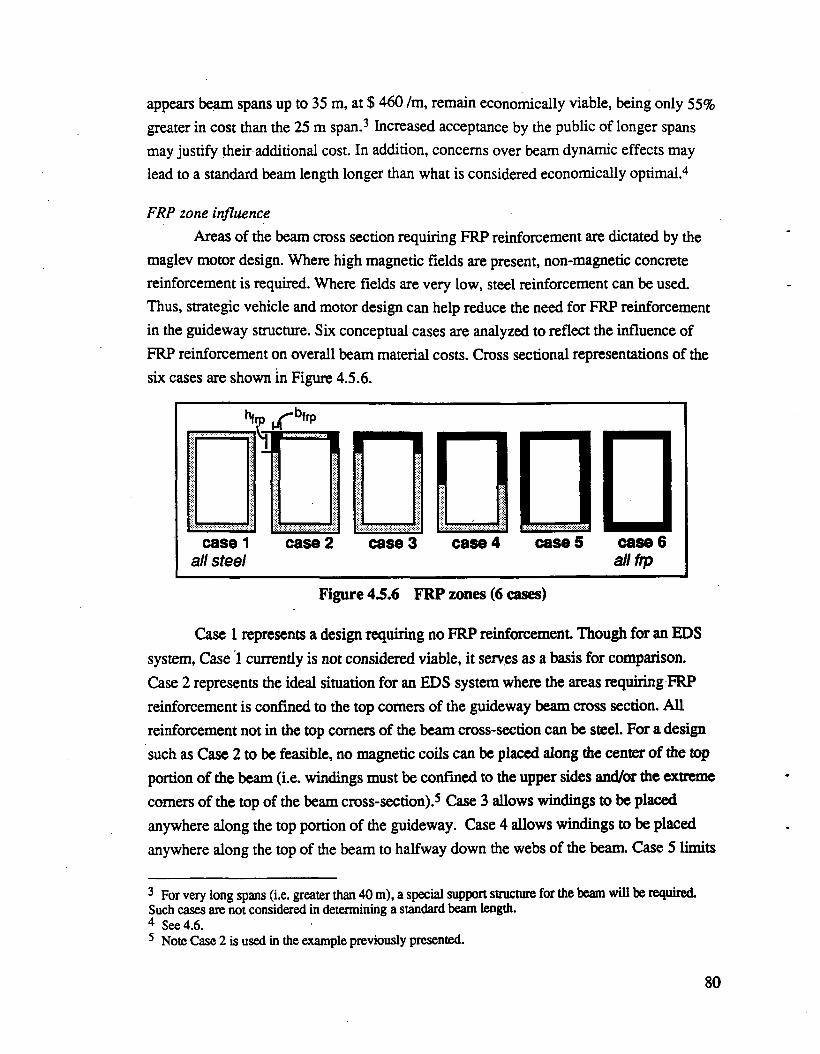
appears beam spans up to 35 m, at $ 460 /m, remain economically viable, being only 55% greater in cost than the 25 m span.3 Increased acceptance by the public of longer spans may justify their additional cost. In addition, concerns over beam dynamic effects may lead to a standard beam length longer than what is considered economically optimal.4
FRP zone influenceAreas of the beam cross section requiring FRP reinforcement are dictated by the
maglev motor design. Where high magnetic fields are present, non-magnetic concrete reinforcement is required. Where fields are very low, steel reinforcement can be used. Thus, strategic vehicle and motor design can help reduce the need for FRP reinforcement in the guideway structure. Six conceptual cases are analyzed to reflect the influence of FRP reinforcement on overall beam material costs. Cross sectional representations of the six cases are shown in Figure 4.5.6.
F igure 4 .5 .6 FR P zones (6 cases)
Case 1 represents a design requiring no FRP reinforcement Though for an EDS system, Case 1 currently is not considered viable, it serves as a basis for comparison. Case 2 represents the ideal situation for an EDS system where the areas requiring FRP reinforcement is confined to the top comers of the guideway beam cross section. All reinforcement not in the top comers of the beam cross-section can be steel. For a design such as Case 2 to be feasible, no magnetic coils can be placed along the center of the top portion of the beam (i.e. windings must be confined to the upper sides and/or the extreme comers of the top of the beam cross-section) .5 Case 3 allows windings to be placed anywhere along the top portion of the guideway. Case 4 allows windings to be placed anywhere along the top of the beam to halfway down the webs of the beam. Case 5 limits
3 For very long spans (i.e. greater than 40 m), a special support structure for the beam will be required. Such cases are not considered in determining a standard beam length.4 See 4.6.5 Note Case 2 is used in the example previously presented.
80
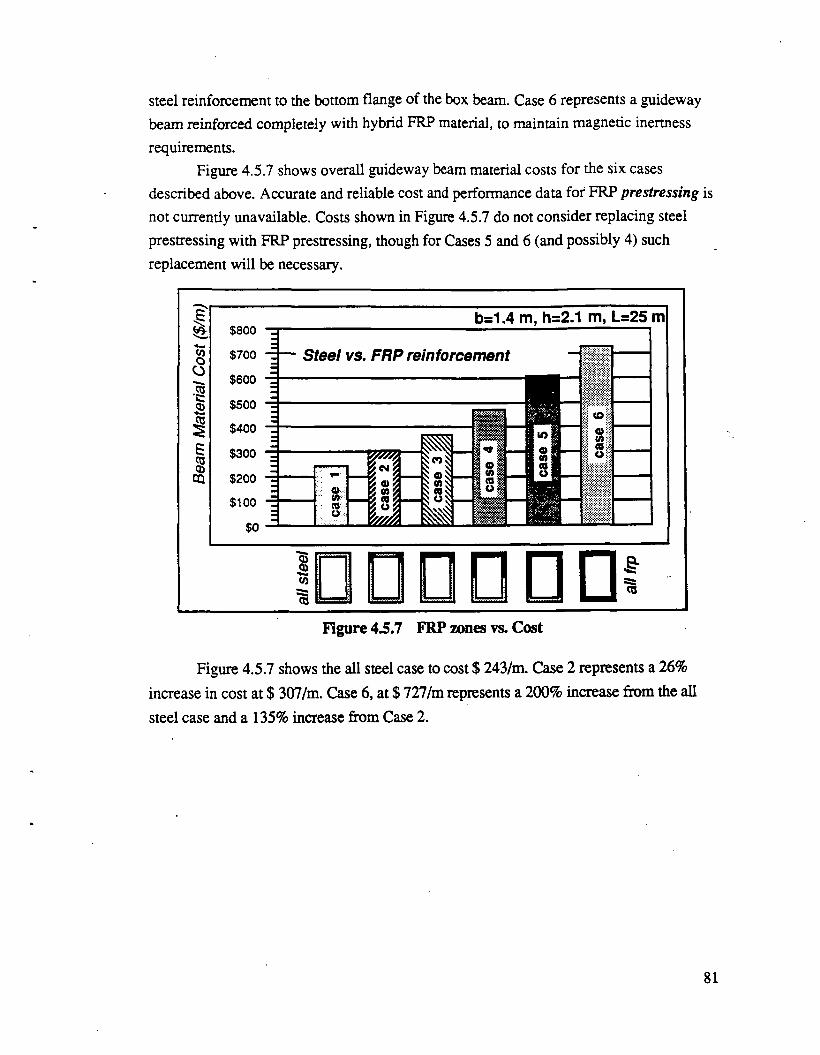
steel reinforcement to the bottom flange of the box beam. Case 6 represents a guideway beam reinforced completely with hybrid FRP material, to maintain magnetic inertness requirements.
Figure 4.5.7 shows overall guideway beam material costs for the six cases described above. Accurate and reliable cost and performance data for FRP prestressing is not currently unavailable. Costs shown in Figure 4.5.7 do not consider replacing steel prestressing with FRP prestressing, though for Cases 5 and 6 (and possibly 4) such replacement will be necessary.
F igure 4.5 .7 FRP zones vs. C ost
Figure 4.5.7 shows the all steel case to cost $ 243/m. Case 2 represents a 26% increase in cost at $ 307/m. Case 6 , at $ 727/m represents a 200% increase from the all steel case and a 135% increase from Case 2.
81

4.6 D ynam ic analysis
4.6.1 OverviewSection 4.5 outlines a method for analyzing primarily static vehicle loads, though
negative bending due to dynamic loads is considered. This section focuses on the dynamic analysis of a guideway beam both during and after a vehicle has passed. The dynamic analysis is performed using the ADINA dynamic finite element analysis program. Only the force of the traveling vehicle (i.e. not the mass) on a simply-supported span is modeled in this report.1 In addition to the ADINA program, a spreadsheet analysis program has been developed to analyze guideway beam dynamic behavior. With only small percentages of damping expected for guideway beams (e.g. less than 2%), damping effects are not significant and can be neglected in a preliminary analysis.
Governing equations for the dynamic behavior of a simply supported beam are presented. Fundamental frequencies for various span lengths and beam depths are shown respectively in Figures 4.6.1 and 4.6.2. Dynamic amplification factors for various beam geometries with respect to vehicle-beam "crossing frequencies" are shown in Figure4.6.3. A dynamic analysis of the example beam of section 4.5 is performed for both a two-point concentrated vehicle loading and a fully distributed vehicle loading in subsection 4.6.3. Subsection 4.6.4 concentrates on beam residual vibrations and includes discussions of material damping properties and the concept of motion based design. Examples are given to illustrate the close relationship between vehicle speed, vehicle pad distribution, and fundamental beam frequency on the residual vibration mode of the beam.
4.6 .2 Fundam ental guidew ay beam dynam ic behavior
governing equationsFor a simply supported beam with uniform cross section, the frequencies and
mode shapes are:2
n= 1, 2 ,3 , ... [4.6.1]
n= 1,2, 3, ... [4.6.2]
1 Future research focused on modeling the effect of vehicle mass under a variety of vehicle pad distributions and beam structural support mechanisms is recommended in section 6.0.2 Humar, J.L., Dynamics of Structures, Prentice Hall, 1990, pp. 668-671.
82
The number of theoretical modes and frequencies in the beam indicated in the above equations is infinite. Typically, however, only a few mode shapes and frequencies are required to perform an adequate guideway beam dynamic analysis.Indeed, many dynamic analysis for guideway beams consider only the fundamental mode and obtain sufficient accuracy for first order design purposes. The number of mode shapes required for an accurate analysis depends not only on the properties of the beam but also on frequencies contained in the forcing function (i.e. forces exerted on the beam as the vehicle passes) and the speed of the vehicle. When the forcing function has a uniform load distribution, the number of mode shapes is determined by the "crossing frequency" as described in the next section.3
team frequency sensitivity analysesFigure 4.6.1 is a plot of the fundamental frequency, (Ov using beam spans from
12.5 m to 40 m. Figure 4.6.2 compares change in section depth for a 25 m span with the fundamental beam frequency. The beams used to construct the plot shown in Figure 4.6.1 correspond to the same beams used to calculate the sensitivity between beam span length\ and material cost in the previous section of this report (see Figure 4.5.5). Each beam used to construct the plot in Figure 4.6.1 has cross-sectional widths and depths of 1.4 m and2.1 m, respectively. As shown in Figure 4.6.1, fundamental beam frequencies decrease approximately by the square from 26.50 Hz for a 12.5 m span to 2.42 Hz for a 40 m span. For the representative standard span of 25m, the fundamental free vibration frequency is 6.54 Hz.
3 Richardson, H.H. and D.N. Wormley, "Transportation Vehicle/Beam-Elevated Guideway Dynamic Interactions: A State-of-the-Art Review", Journal of Dynamic Systems, Measurement, and Control, 74- Aut-P, ASME, p. 1-11., 1974.
83
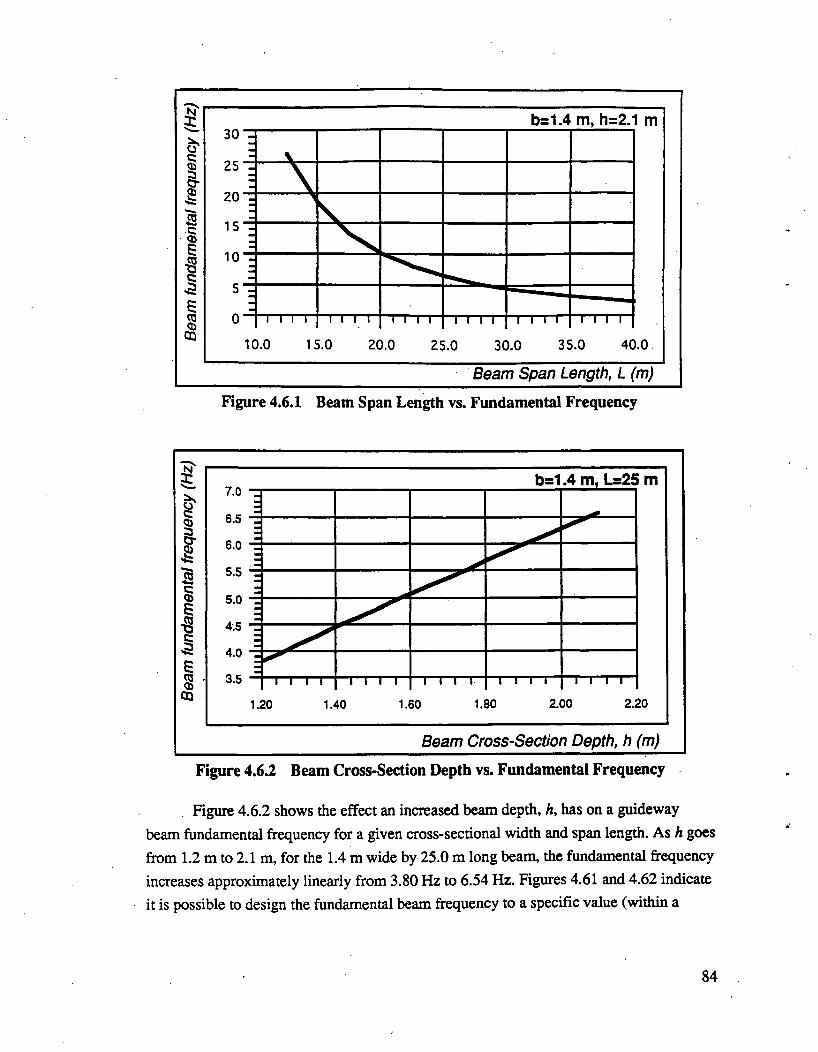
F i g u r e 4 .6 . 1 B e a m S p a n L e n g t h v s . F u n d a m e n t a l F r e q u e n c y
F i g u r e 4 . 6 . 2 B e a m C r o s s - S e c t io n D e p t h v s . F u n d a m e n t a l F r e q u e n c y
Figure 4.6.2 shows the effect an increased beam depth, h, has on a guideway beam fundamental frequency for a given cross-sectional width and span length. As h goes from 1.2 m to 2.1 m, for the 1.4 m wide by 25.0 m long beam, the fundamental frequency increases approximately linearly from 3.80 Hz to 6.54 Hz. Figures 4.61 and 4.62 indicate it is possible to design the fundamental beam frequency to a specific value (within a
84
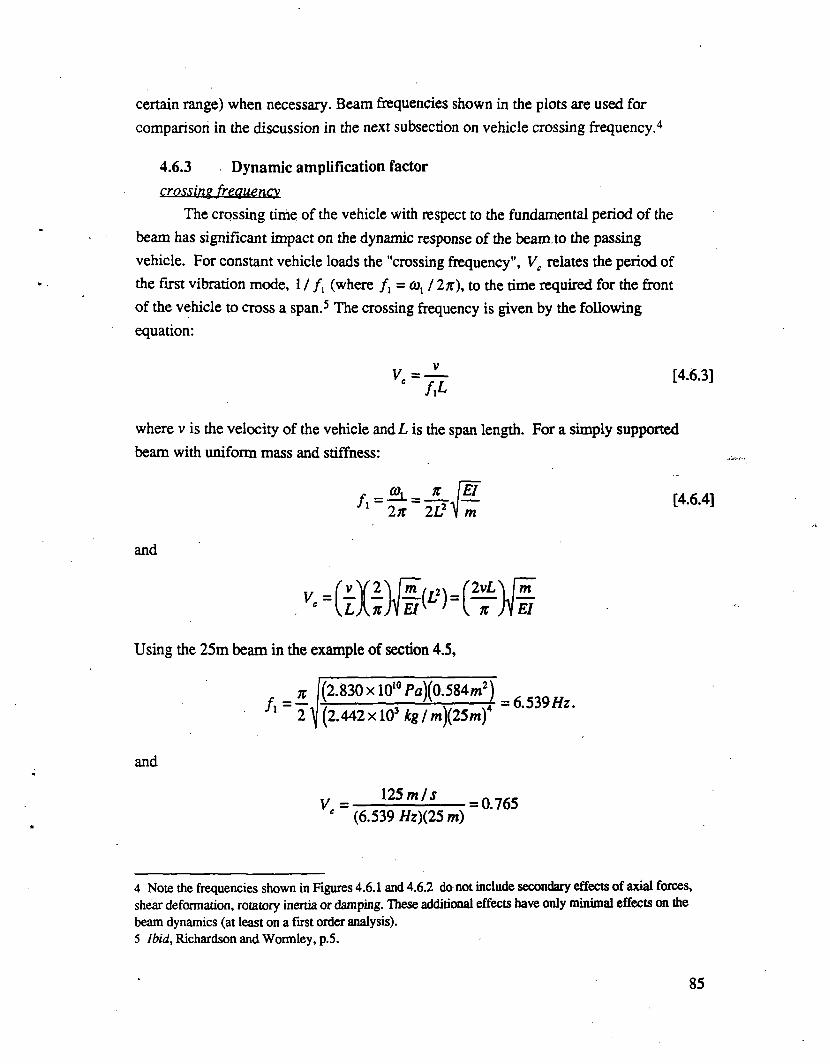
4 .6 .3 D y n a m i c a m p l i f i c a t io n f a c t o r
crossins frequencyThe crossing time of the vehicle with respect to the fundamental period of the
beam has significant impact on the dynamic response of the beam, to the passing vehicle. For constant vehicle loads the "crossing ftequency", Ve relates the period of the first vibration mode, 1 / / , (where f x=coxl 2n), to the time required for the front of the vehicle to cross a span.4 5 The crossing frequency is given by the following equation:
certain range) when necessary. Beam frequencies shown in the plots are used forcomparison in the discussion in the next subsection on vehicle crossing frequency.4
v
f t[4.6.3]
where v is the velocity of the vehicle and L is the span length. For a simply supported beam with uniform mass and stiffness:
COx __ _K_ \EI_ I n ~ 2L2 \ m
[4.6.4]
and
Using the 25m beam in the example of section 4.5,
, 1(2.830X10“ PajO.SMm*) h ” 2 ^ (2 .442x l03 k g / m p S m f
and
V = 125 m / s (6.539 Hz)(25 m)
= 0.765
4 Note the frequencies shown in Figures 4.6.1 and 4.6.2 do not include secondary effects of axial forces, shear deformation, rotatory inertia or damping. These additional effects have only minimal effects on the beam dynamics (at least on a fust order analysis).5 Ibid, Richardson and Wormley, p.5.
85
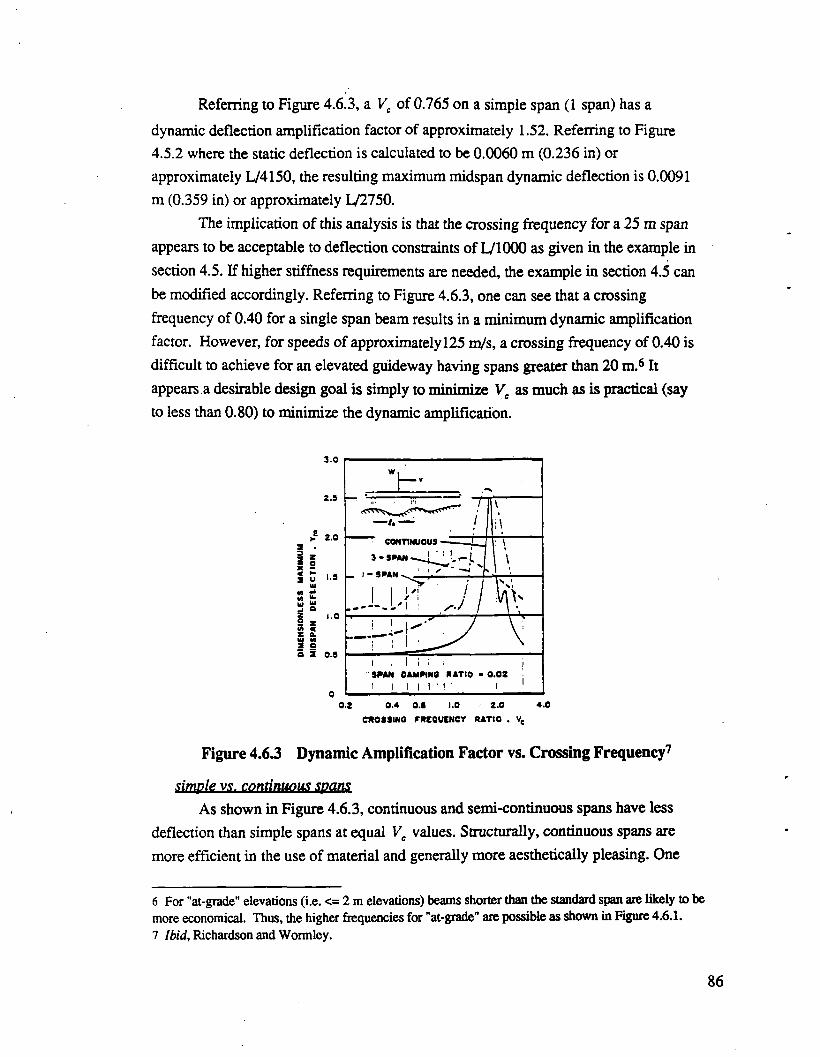
Referring to Figure 4.6.3, a Vc of 0.765 on a simple span (1 span) has a dynamic deflection amplification factor of approximately 1.52. Referring to Figure4.5.2 where the static deflection is calculated to be 0.0060 m (0.236 in) or approximately L/4150, the resulting maximum midspan dynamic deflection is 0.0091 m (0.359 in) or approximately L/2750.
The implication of this analysis is that the crossing frequency for a 25 m span appears to be acceptable to deflection constraints of L/1000 as given in the example in section 4.5. If higher stiffness requirements are needed, the example in section 4.5 can be modified accordingly. Referring to Figure 4.6.3, one can see that a crossing frequency of 0.40 for a single span beam results in a m inim um dynamic amplification factor. However, for speeds of approximately 125 m/s, a crossing frequency of 0.40 is difficult to achieve for an elevated guideway having spans greater than 20 m.6 7 It appears a desirable design goal is simply to m inim ize Vc as much as is practical (say to less than 0.80) to minimize the dynamic amplification.
0.2 0.4 0 .( 1.0 2.0 4.0CROSSING FREQUINCY RATIO . Ve
F i g u r e 4 . 6 3 D y n a m i c A m p l i f i c a t i o n F a c t o r v s . C r o s s i n g F r e q u e n c y 7
simple vs. continuous spansAs shown in Figure 4.6.3, continuous and semi-continuous spans have less
deflection than simple spans at equal Ve values. Structurally, continuous spans are more efficient in the use of material and generally more aesthetically pleasing. One
6 For "at-grade" elevations (i.e. <= 2 m elevations) beams shorter than the standard span are likely to be more economical. Thus, the higher frequencies for "at-grade" are possible as shown in Figure 4.6.1.7 Ibid, Richardson and Wormley.
86

possible drawback to continuous spans is that a traveling wave effect may be present It is possible that a continuous span may be in a vibration mode before a vehicle arrives due to the continuous nature of the structure and the deflection interaction between spans. Presumably a simple span can be assumed stationary at the time of vehicle arrival, since there is no interaction between spans.
concentrated vs. distributed loadingFigure 4.6.3 assumes a concentrated loading. The dynamic amplification
factor can be reduced considerably when a distributed loading pattern is used. Figure 4.6.4a shows a vehicle arrangement where the weight of the vehicle is transferred by two point loads. The 2 tonne/m vehicle mass is converted to two concentrated 294.2 kN traveling forces spaced 30 m apart. The beam length and fundamental frequency are 25 m and 6.54 Hz, respectively, with a resulting Ve of 0.765.
I - Lu = 30 m-------------------f 1 = 6 . 5 4 H z
F i g u r e 4 . 6 .4 a T w o P o i n t V e h i c l e L o a d i n g
Figure 4.6.4b shows the dynamic response of the midspan of the beam used in the example of section 4.5 to the two-point concentrated load vehicle traveling at 125 m/s. The maximum dynamic deflection of 9.179 x 10”3 m occurs at r = 0.110 s. The maximum static deflection on a 25 m span from a 2 tonne/m vehicle mass is 6.035 x 10~3m. Thus, the maximum dynamic amplification factor, DA ’ for the concentrated vehicle load case is:
9.179xl03m 6.035 x l0 3m
= 1.521
Note that the 1.521 FDA factor obtained from the spreadsheet analysis for the concentrated loading corresponds with results from Richardson and Wormley shown in Figure 4.6.3. For the 30 m vehicle at 125 m/s to fully pass the 25 m span requires 0.44 s. Thus, as indicated in Figure 4.6.4b, for t < 0.44s, the beam experiences forced vibration
87

response and, for t > 0.445, the beam undergoes free vibration response. When the beamis in free vibration response, after experiencing forced vibration, it is considered in aresidual vibration mode.
Figure 4.6,4b Beam Dynamic Response (Two Point Loading)
Figure 4.6.5a shows a fully distributed vehicle loading where the 2 tonne/m vehicle mass is converted to a 19,613 N/m fully distributed force traveling along the beam.8 Figure 4.6.5b shows the dynamic response of the beam to the fully distributed vehicle load. The maximum dynamic midspan deflection of 6.616 x 10⁻³ m occurs at t = 0 .175 s. Thus, the m axim um dynamic amplification factor, for the fully distributed load case is:
6.616 x l 0 3m 6.035 x l0 3m
= 1.096
Thus, by fully distributing the vehicle load, the dynamic amplification factor is reduced by 28%, to approximately 1.1 times the static deflection. Figure 4.6.6 shows the dynamic amplification factor for a 25 m simply supported span, as the load distribution of a 30 m vehicle ranges from concentrated to fully distributed.
8 Note the mass of the vehicle is not modeled in the analyses of this report. Future work will include the effect of vehicle mass.
88

v = 1 2 5 m / s
fully distributed vehicle loading
w = 1 9 , 6 1 3 N / m (m = 2 0 0 0 k g /m )
Lv = 30 mf < = 6 . 5 4 H z
F i g u r e 4 . 6 S b B e a m D y n a m i c R e s p o n s e ( F u l l y D i s t r i b u t e d L o a d i n g )
A comparison of Figures 4.6.4b and 4.6.5b shows that full distribution of the vehicle load reduces the dynamic amplification factor considerably (for this case). However, (again for this particular vehicle-beam case), the residual vibration is increased. Thus, for the particular vehicle speed, vehicle length and beam frequency used in this example, the fully distributed vehicle scenario will require more damping to limit residual vibrations. An approach to limit residual vibratioifis discussed in the next section.
89
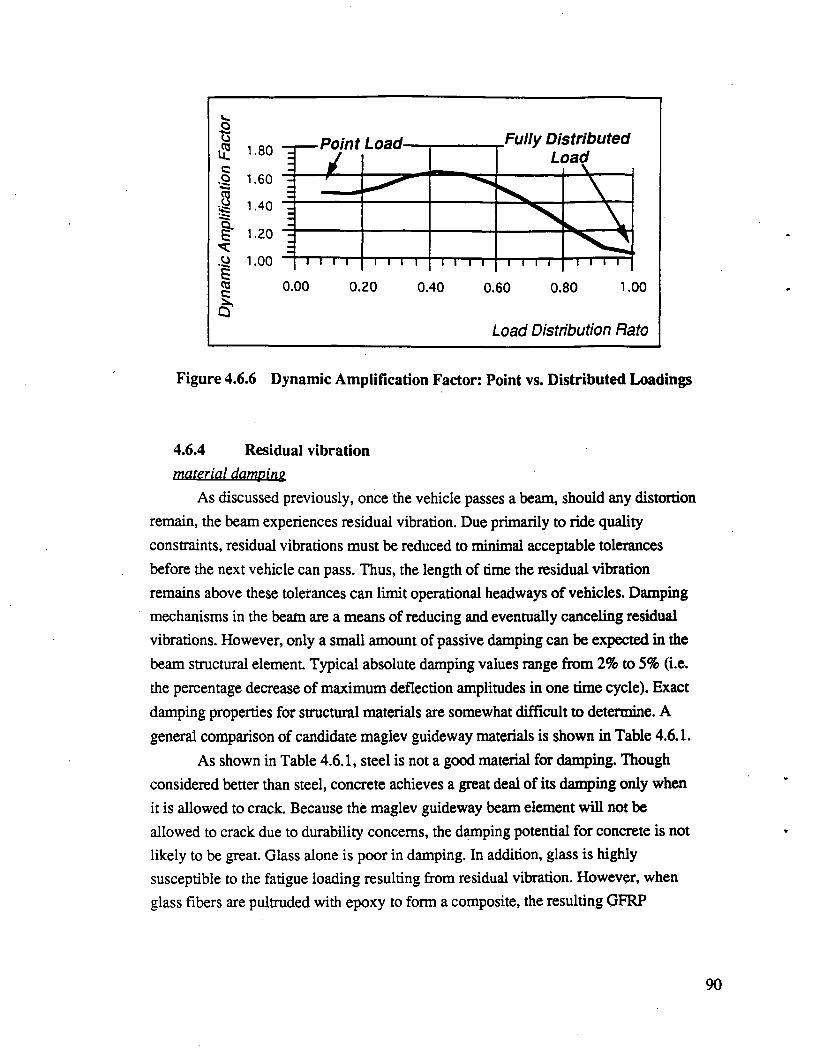
<S 0.00 0.20 0.40 0.60 0.80 1.00
O'Load Distribution Rato
F i g u r e 4 .6 .6 D y n a m i c A m p l i f i c a t i o n F a c t o r : P o i n t v s . D i s t r i b u t e d L o a d in g s
4 . 6 . 4 R e s id u a l v i b r a t i o n
material dampingAs discussed previously, once the vehicle passes a beam, should any distortion
remain, the beam experiences residual vibration. Due primarily to ride quality constraints, residual vibrations must be reduced to minimal acceptable tolerances before the next vehicle can pass. Thus, the length of time the residual vibration remains above these tolerances can limit operational headways of vehicles. Damping mechanisms in the beam are a means of reducing and eventually canceling residual vibrations. However, only a small amount of passive damping can be expected in the beam structural element Typical absolute damping values range from 2% to 5% (i.e. the percentage decrease of maximum deflection amplitudes in one time cycle). Exact damping properties for structural materials are somewhat difficult to determine. A general comparison of candidate maglev guideway materials is shown in Table 4.6.1.
As shown in Table 4.6.1, steel is not a good material for damping. Though considered better than steel, concrete achieves a great deal of its damping only when it is allowed to crack. Because the maglev guideway beam element will not be allowed to crack due to durability concerns, the damping potential for concrete is not likely to be great. Glass alone is poor in damping. In addition, glass is highly susceptible to the fatigue loading resulting from residual vibration. However, when glass fibers are pultruded with epoxy to form a composite, the resulting GFRP
90
material has fairly good Hamping properties.9 Carbon, alone as a fiber, or pultruded toform CFRP, is an excellent damping material. In addition, carbon is virtuallyinsensitive to fatigue loadings. The difficulty with using carbon is its high cost.
T a b l e 4 .6 . 1 Q u a l i t a t i v e c o m p a r is o n o f m a t e r i a l d a m p i n g p r o p e r t i e ssfpiirftiralmatwta) rKm iiBsKiiivkiriitra c tn ra i material dynamic behavior
steel Doorconcrete good
GFRP poor to goodcarbon excellent!
Should damping requirements for the guideway beam become significant, the use of additional carbon material is one way of achieving additional passive damping. Other passive and active damping approaches also can be employed, though most approaches are likely to be expensive. If possible, an appealing design approach is to attempt to design the complete maglev system, i.e. the vehicle speed, length, and pad distribution to match the dynamic response of the beam so that cancellation of the beam residual vibrations does not rely significandy on high levels of beam damping. This design approach can be classified as motion based design.
motion-based designThe following two equations which identify beam-vehicle situations where
residual vibrations are completely canceled once the vehicle has passed were derived by considering the results from a number of dynamic vehicle loadings for a variety of beam lengths, vehicle lengths, vehicle pad distributions, and vehicle velocities.
. _ Xv [4.6.5]
whereLS "convergent" vehicle length for which a fully distributed vehicle
will leave no residual vibration on the beam after passing
X : integer number of wavelengths (1, 2 , 3 ...)v vehicle velocityf x : fundamental beam frequency
and
[4.6.6]
9 However, long term properties of GFRP reinforcement in concrete under cyclic loadings presently are not well documented.
91
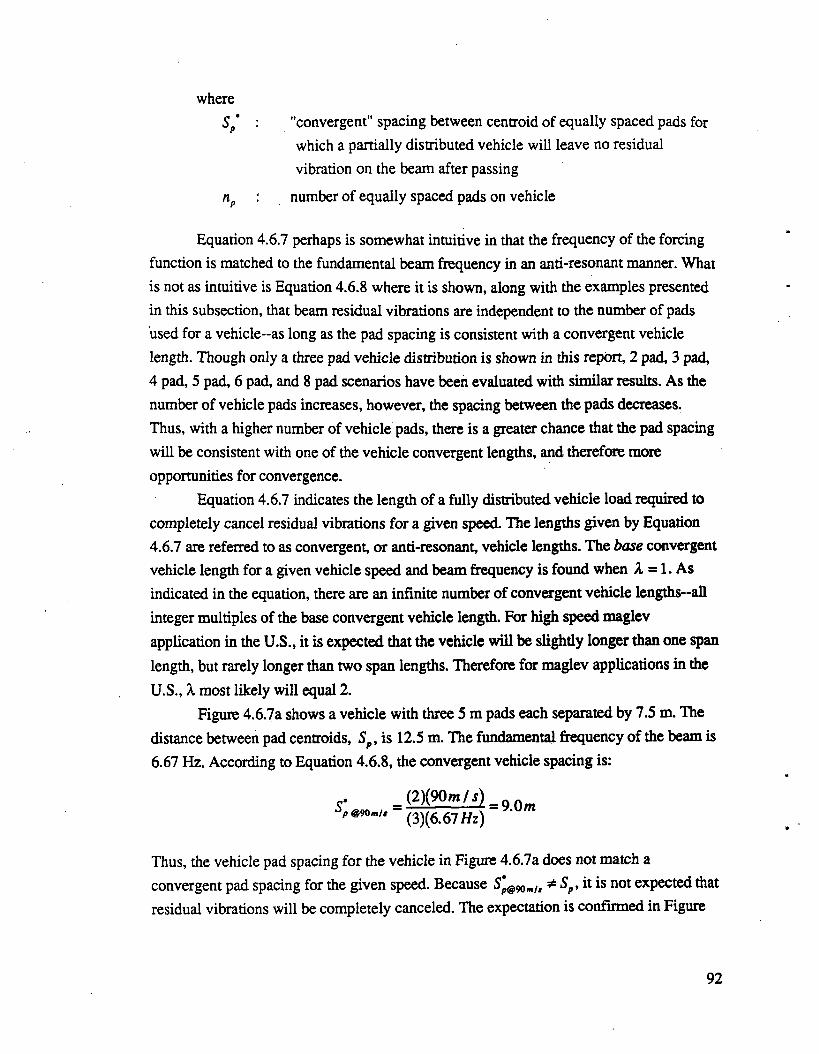
whereS ’ "convergent" spacing between centroid of equally spaced pads for
which a partially distributed vehicle will leave no residual vibration on the beam after passing
np : number of equally spaced pads on vehicle
Equation 4.6.7 perhaps is somewhat intuitive in that the frequency of the forcing function is matched to the fundamental beam frequency in an anti-resonant manner. What is not as intuitive is Equation 4.6.8 where it is shown, along with the examples presented in this subsection, that beam residual vibrations are independent to the number of pads used for a vehicle-as long as the pad spacing is consistent with a convergent vehicle length. Though only a three pad vehicle distribution is shown in this report, 2 pad, 3 pad,4 pad, 5 pad, 6 pad, and 8 pad scenarios have been evaluated with similar results. As the number of vehicle pads increases, however, the spacing between the pads decreases.Thus, with a higher number of vehicle pads, there is a greater chance that the pad spacing will be consistent with one of the vehicle convergent lengths, and therefore more opportunities for convergence.
Equation 4.6.7 indicates the length of a fully distributed vehicle load required to completely cancel residual vibrations for a given speed. The lengths given by Equation4.6.7 are referred to as convergent, or anti-resonant, vehicle lengths. The base convergent vehicle length for a given vehicle speed and beam frequency is found when X = 1. As indicated in the equation, there are an infinite number of convergent vehicle lengths—all integer multiples of the base convergent vehicle length. For high speed maglev application in the U.S., it is expected that the vehicle will be slightly longer than one span length, but rarely longer than two span lengths. Therefore for maglev applications in the U.S., X most likely will equal 2.
Figure 4.6.7a shows a vehicle with three 5 m pads each separated by 7.5 m. The distance between pad centroids, Sp, is 12.5 m. The fundamental frequency of the beam is 6.67 Hz. According to Equation 4.6.8, the convergent vehicle spacing is:
c*°p @90»i// (3)(6.67 Hz)
Thus, the vehicle pad spacing for the vehicle in Figure 4.6.7a does not match a convergent pad spacing for the given speed. Because Sp@90m/, * S p, it is not expected that residual vibrations will be completely canceled. The expectation is confirmed in Figure
92
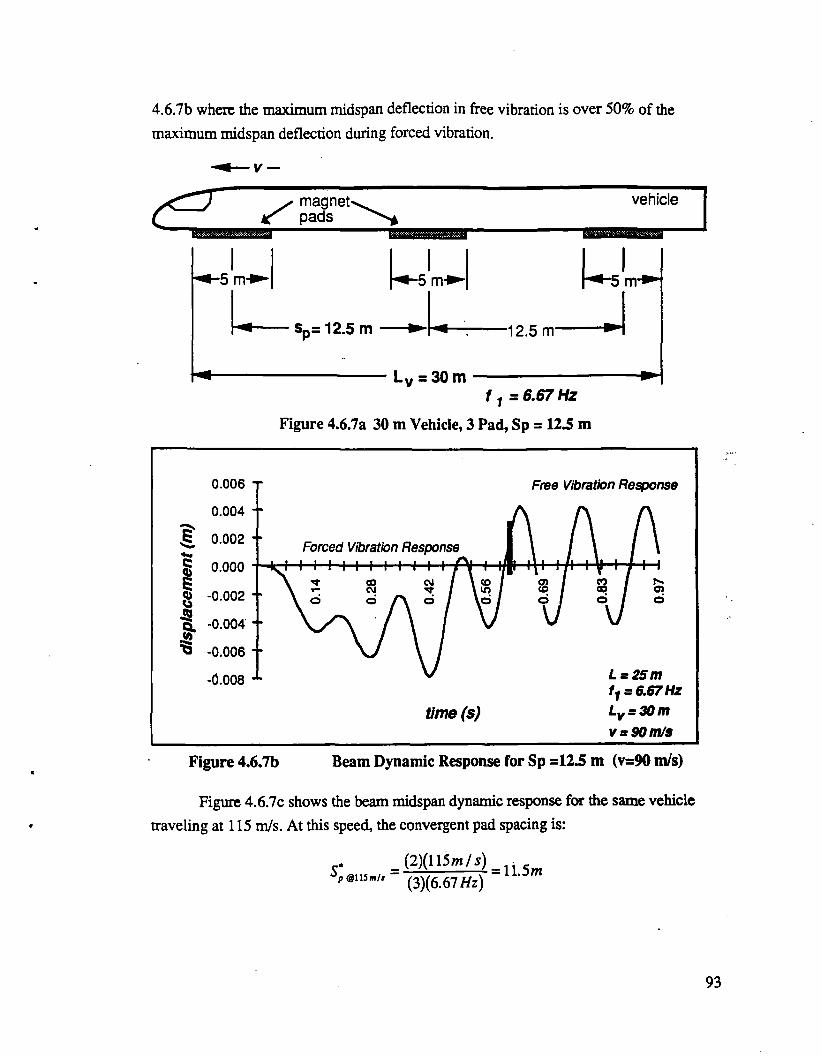
4.6.7b where the maximum midspan deflection in free vibration is over 50% of the maximum midspan deflection during forced vibration.
v —
magnetpads
vehicle
v = 9 0 m /s
F i g u r e 4 . 6 . 7 b B e a m D y n a m i c R e s p o n s e f o r S p = 1 2 . 5 m ( v = 9 0 m / s )
Figure 4.6.7c shows the beam midspan dynamic response for the same vehicle traveling at 115 m/s. At this speed, the convergent pad spacing is:
(2)(115m/s) p@nsmt, (3)(6.67 Hz) 11.5m
93
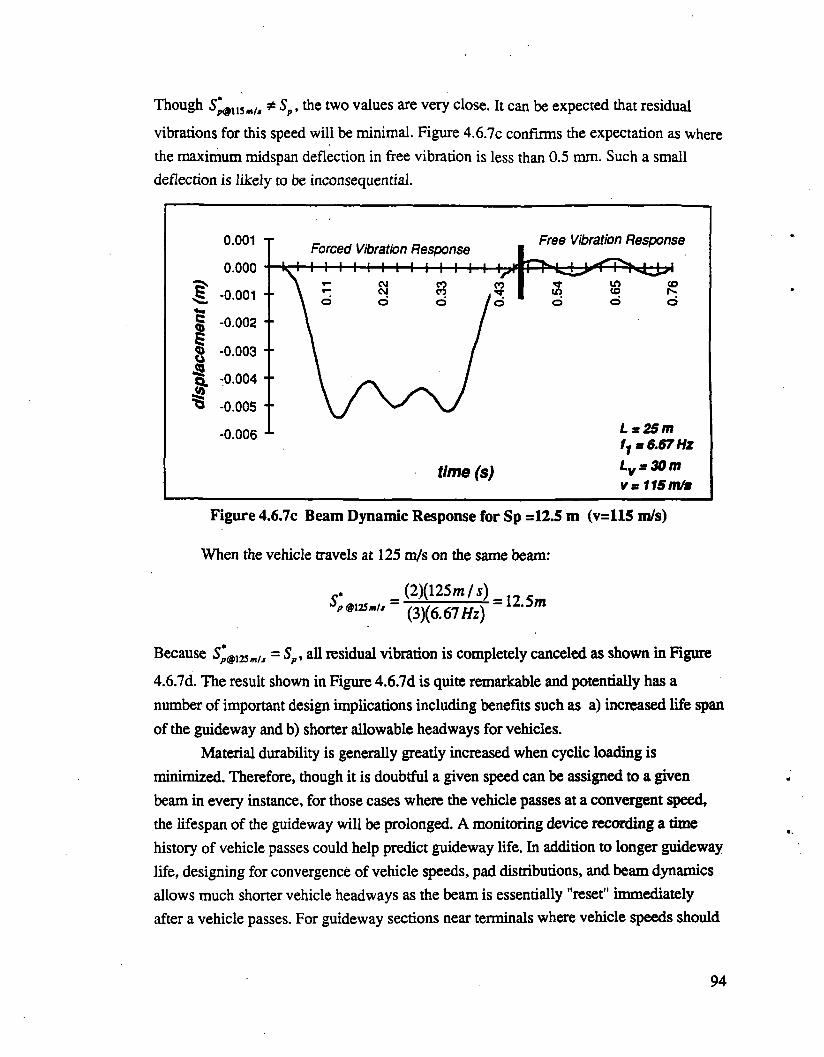
Though * Sp, the two values are very close. It can be expected that residual
vibrations for this speed will be minimal. Figure 4.6.7c confirms the expectation as where the maximum midspan deflection in free vibration is less than 0.5 mm. Such a small deflection is likely to be inconsequential.
F i g u r e 4 .6 .7 c B e a m D y n a m i c R e s p o n s e f o r S p = 1 2 . 5 m ( v = 1 1 5 m / s )
When the vehicle travels at 125 m/s on the same beam:
c *@125 mh
(2) (125 m/ s )(3) (6.67//z)
= 12.5m
Because S*@123m/J = Sp, all residual vibration is completely canceled as shown in Figure
4.6.7d. The result shown in Figure 4.6.7d is quite remarkable and potentially has a number of important design implications including benefits such as a) increased life span of the guideway and b) shorter allowable headways for vehicles.
Material durability is generally greatly increased when cyclic loading is minimized. Therefore, though it is doubtful a given speed can be assigned to a given beam in every instance, for those cases where the vehicle passes at a convergent speed, the lifespan of the guideway will be prolonged. A monitoring device recording a time history of vehicle passes could help predict guideway life. In addition to longer guideway life, designing for convergence of vehicle speeds, pad distributions, and beam dynamics allows much shorter vehicle headways as the beam is essentially "reset" immediately after a vehicle passes. For guideway sections near terminals where vehicle speeds should
94

be more consistent, it is quite conceivable that individual beam elements can be designed to exactly match an expected vehicle speed. For other guideway sections, a set of convergent velocities can be calculated which vehicles will try to match as close as possible.10
Figure 4.6.7d Beam Dynamic Response for Sp =12.5 m (v=125 m/s)
Figures 4.6.8a and 4.6.8b demonstrate that convergence criteria is indeed influenced by the vehicle pad spacing and not simply by vehicle velocity. Figure 4.6.8a shows a 35 m long vehicle with three 5 m pads separated by 10 m to give a pad spacing of 15.0 m. The vehicle is analyzed over the same beam as before at 125 m/s. As shown in Figure 4.6.8b, the same beam, with the same vehicle speed as used for Figure 4.6.7d, only with a slightly different vehicle length (and corresponding pad distribution) produces drastically different dynamic beam response.
10 Obviously, the beam will be designed for the worst case scenario, i.e. when the vehicle passes at resonance, and required damping and deflection control criteria will be met However, the vehicle velocities matching the set of convergent velocities w ill be used whenever possible to achieve longer guideway life and shorter vehicle headways.
95
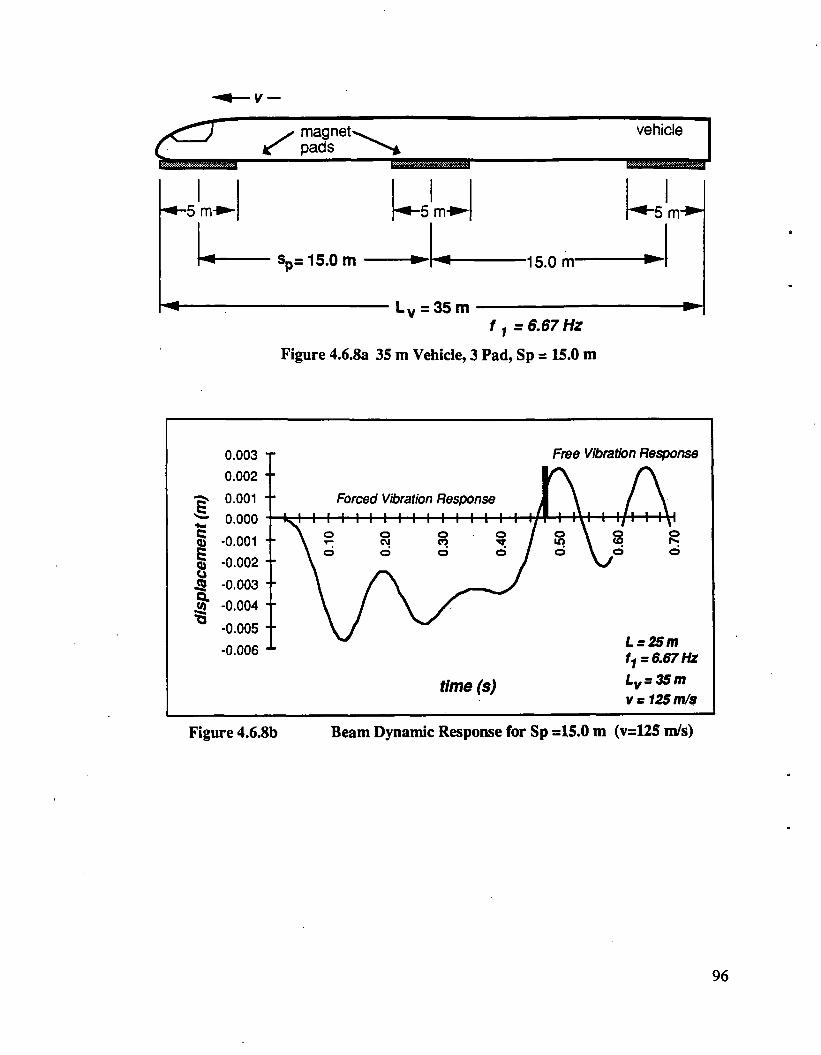
V —
7 / magnetQ- * pads■ ■ ■ -------------------------------------
vehicle
Figure 4.6.8b Beam Dynamic Response for Sp =15.0 m (v=125 m/s)
96
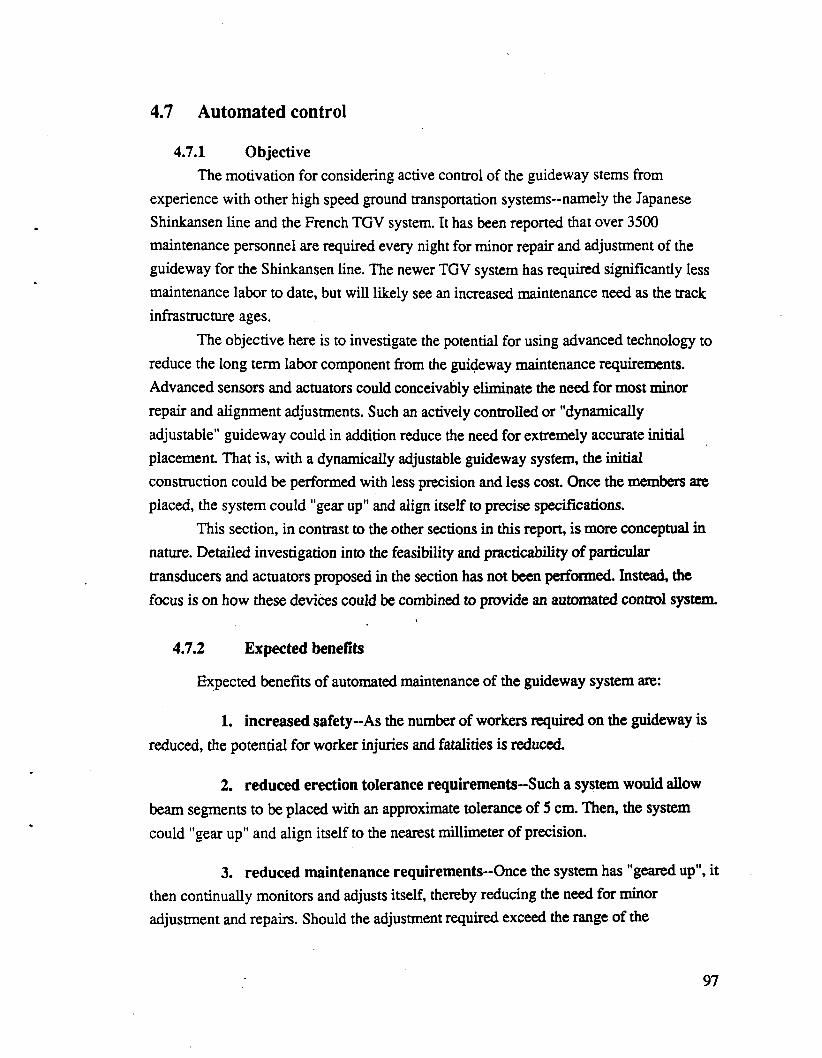
4 . 7 A u t o m a t e d c o n t r o l
4.7.1 ObjectiveThe motivation for considering active control of the guideway stems from
experience with other high speed ground transportation systems—namely the Japanese Shinkansen line and the French TGV system. It has been reported that over 3500 maintenance personnel are required every night for minor repair and adjustment of the guideway for the Shinkansen line. The newer TGV system has required significantly less maintenance labor to date, but will likely see an increased maintenance need as the track infrastructure ages.
The objective here is to investigate the potential for using advanced technology to reduce the long term labor component from the guideway maintenance requirements. Advanced sensors and actuators could conceivably eliminate the need for most minor repair and alignment adjustments. Such an actively controlled or "dynamically adjustable" guideway could in addition reduce the need for extremely accurate initial placement That is, with a dynamically adjustable guideway system, the initial construction could be performed with less precision and less cost Once the members are placed, the system could "gear up" and align itself to precise specifications.
This section, in contrast to the other sections in this report is more conceptual in nature. Detailed investigation into the feasibility and practicability of particular transducers and actuators proposed in the section has not been performed. Instead, the focus is on how these devices could be combined to provide an automated control system.
4.7.2 Expected benefits
Expected benefits of automated maintenance of the guideway system are:
1. increased safety—As the number of workers required on the guideway is reduced, the potential for worker injuries and fatalities is reduced.
2. reduced erection tolerance requirements-Such a system would allow beam segments to be placed with an approximate tolerance of 5 cm. Then, the system could "gear up" and align itself to the nearest millimeter of precision.
3. reduced maintenance requirements—Once the system has "geared up", it then continually monitors and adjusts itself, thereby reducing the need for minor adjustment and repairs. Should the adjustment required exceed the range of the
97

mechanism, the system could then be manually adjusted. With proper monitoring, such periodic adjustments could be forecast and planned for well in advance. Also, since manual repairs would be required only occasionally, the overall maintenance cost would not be severe.
4. lower construction cost-Though the addition of such automated mechanisms increases capital costs of the guideway, the reduced placement tolerances required will lower actual erection costs.
5. lower operation and repair costs-Reducing the amount of required personnel can significantly reduce the cost of operating and repairing the guideway.(Note that nightly repair workers typically only have 4 hours during which they can work. Thus, optimization of worker scheduling is difficult.)
6. increased revenue--If nightly repair requirements can be avoided and 24 hour operation is achieved, operating revenue will increase.
4.7.3 Conceptual designRide quality depends on the magnitude of "ground' roughness which is due to the
non-uniform displacement of the suspension ladder/guideway system. Simulation studies by Woimley et al.1 for a 25 m span indicate that the maximum mid-span displacement of the ladder should be less than about S mm in order to satisfy the ride quality design criteria with a realistic suspension system. The primary contributions to ladder motion are: i) the long term settlement of the piers supporting the guideway beams, ii) the misalignment due to construction tolerances, and iii) the deflection of the guideway beam due to the weight of the vehicle.
The live load deflection issue is treated by requiring a very conservative displacement design criteria. For the design presented in this study, the guideway stiffness adopted is 10 times the value normally used for conventional structures of this type. This approach was required to keep the magnitude of the live load displacement below the 5 mm level for the 25 m length. Misalignment due to construction tolerances and support settlement require some form of adjustment in the field since they increase the guideway roughness beyond the acceptable value.
Figure 4.7.1 shows the trade-off between human and automated operation as a function of required tolerance for various tasks. Precast concrete construction has high
1 National Maglev Initiative Technical Report #24.
98

quality control, and dimensional tolerances on the order of 2 mm2 are readily achievable. Field construction is much more difficult to control, since the human is more involved in the operation. Achieving a tolerance of 2 mm for foundation/pier construction requires a special effort. An additional complication is the long term deformation of the soil that supports the piers. An estimate of support movement to the accuracy of a millimeter is not feasible because of the high degree of variability of the soil and the lack of an accurate prediction model.
0 1 2 3 4 S 1 7 8 0 1O
________ tolerance required (mm)B e a m - B e a m I n te r fa c e
Figure 4.7.1 Interaction of Human and Automation Cost Curves
The conventional construction and maintenance approach is to initially fix the ladder to the guideway beam and provide for periodic adjustment at the beam-pier support The initial positioning of the ladder has to be able to compensate for construction tolerances. Adjustment at the beam-pier support is normally done manually. A more optimal strategy would be to provide a capability for adjusting the relative position of the ladder with respect to the guideway beam as it displaces over time. Figure 4.7.2 illustrates a proposed method of achieving this positioning. Actuators made from shape memory alloys and piezo-electric ceramics undergo a dimensional change when subjected to a voltage input These devices have been used as "slack" adjusters to compensate for misalignment and wear in shaft/bearing systems.3 Their role here would be as positioning elements to compensate for both the initial construction tolerance and the subsequent guideway movement due to creep and shrinkage of the guideway beam, long term foundation settlement, and other phenomena that may influence the position of the ladder. The intelligent alignm ent system would consist of sensors to detect differential motion of the ladder, a controller that decides how to respond, i.e. what actuators should be
2 Tolerance data obtained from Bechtel Corp.3 Mechanical Engineering, ASME, April 1992, p. 114.
0 1 2 3 4 5 6 7 8 9 10
________ tolerance required (mm)B e a m M a n u fa c tu r e
99
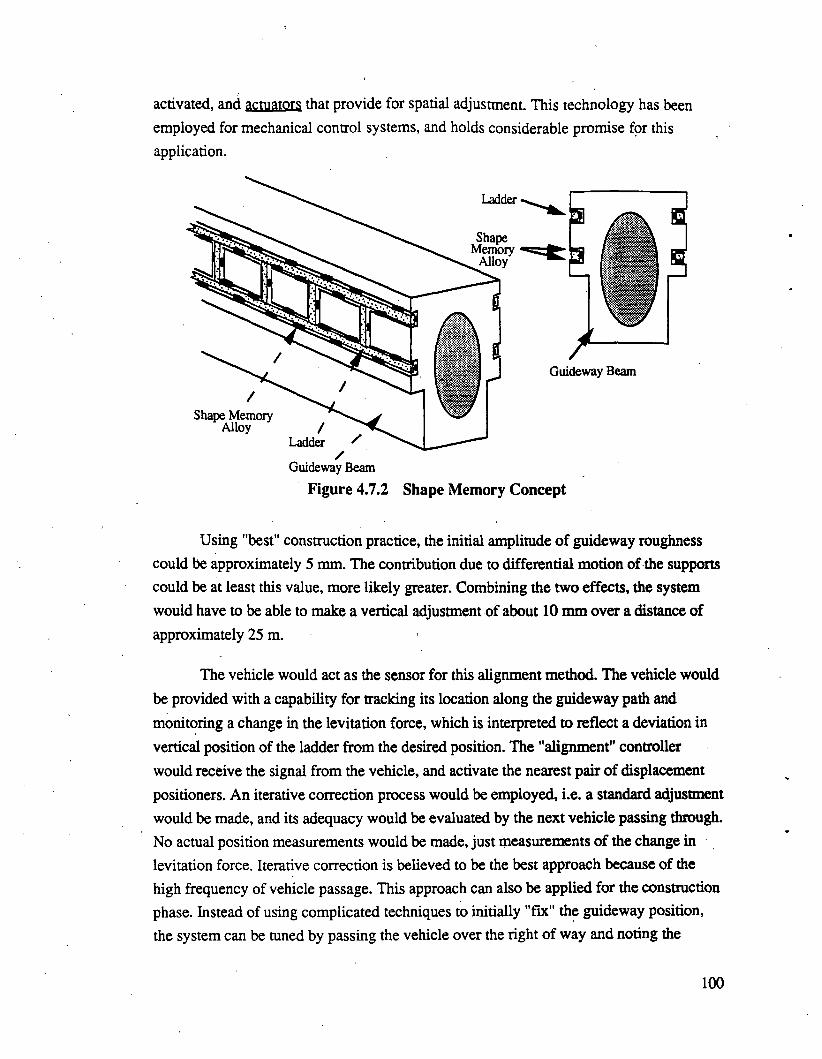
activated, and actuators that provide for spatial adjustment. This technology has been employed for mechanical control systems, and holds considerable promise for this application.
Figure 4.7.2 Shape Memory Concept
Using "best" construction practice, the initial amplitude of guideway roughness could be approximately 5 mm. The contribution due to differential motion of the supports could be at least this value, more likely greater. Combining the two effects, the system would have to be able to make a vertical adjustment of about 10 mm over a distance of approximately 25 m.
The vehicle would act as the sensor for this alignment method. The vehicle would be provided with a capability for tracking its location along the guideway path and monitoring a change in the levitation force, which is interpreted to reflect a deviation in vertical position of the ladder from the desired position. The "alignment" controller would receive the signal from the vehicle, and activate the nearest pair of displacement positioners. An iterative correction process would be employed, i.e. a standard adjustment would be made, and its adequacy would be evaluated by the next vehicle passing through. No actual position measurements would be made, just measurements of the change in levitation force. Iterative correction is believed to be the best approach because of the high frequency of vehicle passage. This approach can also be applied for the construction phase. Instead of using complicated techniques to initially "fix" the guideway position, the system can be tuned by passing the vehicle over the right of way and noting the
100

locations that need to be adjusted for excessive construction tolerance. Multiple passes would be required, but the cost should be less than doing precise field measurements.
101
4 . 8 C o s t p r o j e c t i o n a n d c o m p a r i s o n
4.8.1 OverviewThis section compares both a) narrow beam guideway cost projections with
Transrapid guideway cost estimates, and b) costs of FRP reinforcing rods made of various types and volume fractions of carbon fibers with steel reinforcing rod cost. The Transrapid guideway is chosen as a base comparison primarily because 1) it is nearing commercial implementation, and 2) perhaps more importantly, cost data for the system can be found.
4.8.2 Beam cost estimateTransrapid guideway costs
Beam material cost data calculated in Section 4.5 is translated to a projected total per meter cost for an installed dual elevated maglev guideway system. Currently, cost comparisons with other maglev guideway systems are difficult as actual cost data is not typically available. Calculated costs for the narrow beam design are compared with estimations presented in The Maglev Estimation: Capital Cost Elements Interim Report, prepared by Parsons Brinckerhoff Quade & Douglas, Inc. and the Volpe National Transportation Systems Center, henceforth referred to as the "P/B Report".1 The P/B report allows projections to be made based on material cost calculations for given beam sections. In particular, for the reinforced concrete Transrapid beam element, the P/B report considers:2
• material cost• beam casting facility cost• cost of each cast• quality control• contingencies
Though exact dimensions for the narrow beam section presented in this report, i.e. the 1.4 m width, 2.1 m depth, 25.0 m length, and 0.15 m uniform wall thickness, are subject to change given the uncertainties of actual a) vehicle loads, b) ride quality constraints, and c) column and foundation costs, they can be used for preliminary cost comparison. Calculated mass of the 25 m narrow beam is 61,050 kg. Reportedly, a 25 m
1 Harrison, J.A., etal., The Maglev Estimation: Capital Cost Elements Interim Report, Jan. 1992, Parsons Brinckerhoff Quade & Douglas, Inc., Boston, MA and the Volpe National Transportation Systems Center, Cambridge, Mass.2 Actually, the P/B report combines these cost items into a single general category of guideway beam fabrication cost. The more detailed cost breakdown shown here was obtained via telephone from the principal author of the report, John Harrison of Parsons Brinckerhoff, on 5/11/92.
102

Transrapid reinforced concrete beam has a mass of approximately 90,000 kg3, or approximately 50% greater mass than the narrow beam. Comparisons of beam masses between systems are important as greater mass typically results in higher structural costs.
The P/B report divides beam fabrication costs into the following four categories: a) $315/m for beam material costs, b) $187/m for beam casting facility cost, which considers a casting yard approximately every eight kilometers, c) $581/m cost for each cast, which includes labor and equipment costs required for each pour, and d) $49/m for quality control, which also includes costs for recesses in the concrete for motor attachments and other costs imposed due to the high precision requirements of the cast. An additional 20% of the subtotal of the four cost categories to account for contingencies gives a total beam fabrication cost of $1358/m for the Transrapid beam. These costs are converted to costs factors based on the beam material cost in Table 4.8.1 in order to compare the component costs against the cost of the beam material alone.
Table 4.8.1 Transrapid beam fabrication cost (based on P/B report)
Beam cost itemCost ($ per meter
of single guidewav)Cost Factor
(based on beam material cost)material 315 1.00casting facility 187 0.59each cast 581 1.84quality control 49 0.16
subtotal => 1132 => 3S920% contingencies 226 0.72
Total => 1358 =» 4.31
As indicated in the table, the total Transrapid guideway beam fabrication cost is 4.31 times the beam material cost The P/B Report forecasts the total installation cost for the entire elevated double track Transrapid guideway structural system—which includes the foundation, columns, power stations, in addition to guideway beam costs—to be approximately $10,500/m, of which approximately $630/m are beam material costs. Total beam fabrication cost for the dual Transrapid guideway is estimated at approximately $2700/m, or approximately 25% of the total installation cost.4 Thus, the total installation cost is 16.7 times the cost of the beam material alone.
3 Hilliges, D. and H. Schambeck, “The Concrete Guideway”, Transrapid Maglev System, edited by Heinrich, K. and R. Kretzschmar, 1989, p. 21-24.4 Actually, the cost estimate for elevated double track sections ranges from $9295/m ($14,960,000/mile) to $12,888/m ($20,741,000/mile). The $10,500/m estimate used for comparison specifically is based on “rural undulating” terrain, which is considered average terrain.
103

Transrapid costs vs. narrow beam guidewayComparisons between the Transrapid system and the narrow beam guideway
concept is restricted to beam material and fabrication costs. All other costs, specifically, column, foundation, motor, and transportation costs, are not considered. Projected narrow beam material cost for a single lane of guideway, calculated in section 4.5, is $243/m using only steel reinforcement and $307/m using both steel and FRP reinforcement. The narrow beam cost projections appear conservative against Transrapid estimates of $315/m. Normally, material cost is strictly a function of the amount of material required. Ideally, with only two-thirds the mass of the Transrapid beam, the narrow beam material cost is expected to be approximately two-thirds that of the Transrapid beam, or approximately $210/m.
The narrow beam cost estimate may be overly optimistic in that it considers 1) a fairly high vehicle to beam eccentricity and 2) a rather high projected cost for FRP reinforcement However, based on differences in beam mass between the two systems, either: a) material cost projections for the narrow beam are too high, or b) material cost projections for the Transrapid system ate too low.
In addition to less material cost possible with the narrow beam concept, manufacture, transportation, and fabrication costs should also be less. For the narrow beam design, the cost of each cast and the casting facility should be substantially less than that projected for the Transrapid design shown in Table 4.8.1, since automated manufacturing procedures are proposed to be used. A design goal is to limit total casting costs to less than the material cost of the beam. This is expected to lead to an estimated cost savings of 50% compared to the Transrapid system. Relative to the Transrapid design, the narrow beam concept offers an almost certain 25% total guideway cost reduction potential, but the design goal of 50% cost reduction remains.
The narrow beam concept has even greater cost advantages when compared to other guideway designs, especially channel guideway designs. Channel beam designs are substantially more expensive than the narrow beam concept in that 1) the amount of material required for a channel beam to surround the vehicle will be many times greater than required for the narrow beam and 2) the need for high amounts of reinforcing steel and FRP due to the low torsional resistance of the open channel sections.
104
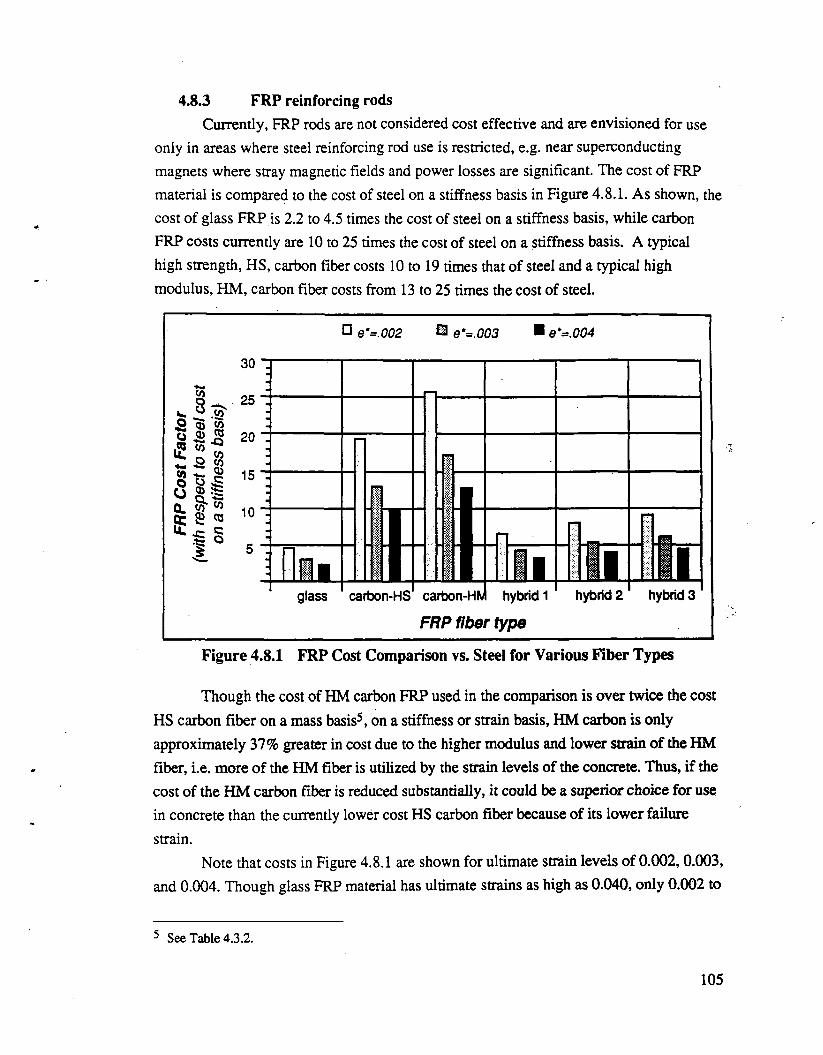
4.8.3 FRP reinforcing rodsCurrently, FRP rods are not considered cost effective and are envisioned for use
only in areas where steel reinforcing rod use is restricted, e.g. near superconducting magnets where stray magnetic fields and power losses are significant. The cost of FRP material is compared to the cost of steel on a stiffness basis in Figure 4.8.1. As shown, the cost of glass FRP is 2.2 to 4.5 times the cost of steel on a stiffness basis, while carbon FRP costs currently are 10 to 25 times the cost of steel on a stiffness basis. A typical high strength, HS, carbon fiber costs 10 to 19 times that of steel and a typical high modulus, HM, carbon Fiber costs from 13 to 25 times the cost of steel.
□ e'=.002 S eV0O3 ■ e*=.004
cn
8 3" 5 wq> to
A tqj j c Q -*5
to
V.2o
£
80 .
£§ o
30 1
2b .20 .15 .
F:: 11U - A V* ■ k5 .
H i l l l lglass carbon-HS carbon-Hto hybrid 1 hybrid 2 hybrid 3
F R P f ib e r t y p e
Figure 4.8.1 FRP Cost Comparison vs. Steel for Various Fiber Types
Though the cost of HM carbon FRP used in the comparison is over twice the cost HS carbon fiber on a mass basis5, on a stiffness or strain basis, HM carbon is only approximately 37% greater in cost due to the higher modulus and lower strain of the HM fiber, i.e. more of the HM fiber is utilized by the strain levels of the concrete. Thus, if the cost of the HM carbon fiber is reduced substantially, it could be a superior choice for use in concrete than the currently lower cost HS carbon fiber because of its lower failure strain.
Note that costs in Figure 4.8.1 are shown for ultimate strain levels of 0.002,0.003, and 0.004. Though glass FRP material has ultimate strains as high as 0.040, only 0.002 to
5 See Table 4.3.2.
105
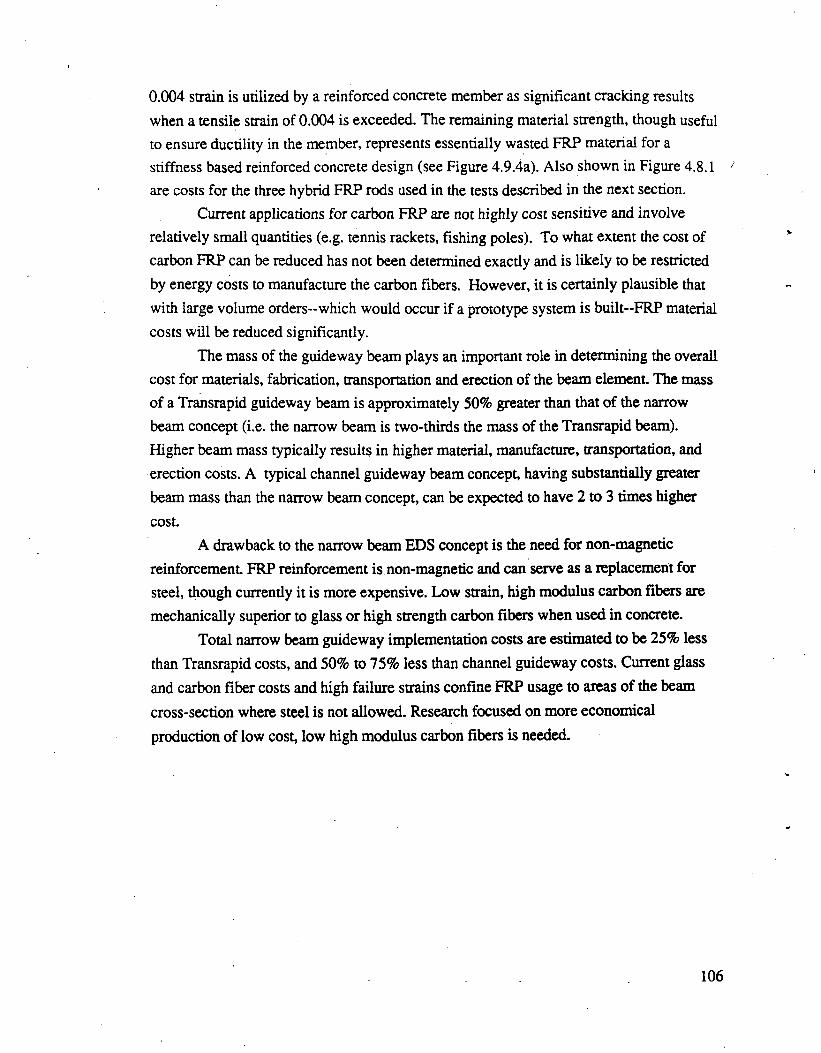
0.004 strain is utilized by a reinforced concrete member as significant cracking results when a tensile strain of 0.004 is exceeded. The remaining material strength, though useful to ensure ductility in the member, represents essentially wasted FRP material for a stiffness based reinforced concrete design (see Figure 4.9.4a). Also shown in Figure 4.8.1 7 are costs for the three hybrid FRP rods used in the tests described in the next section.
Current applications for carbon FRP are not highly cost sensitive and involve relatively small quantities (e.g. tennis rackets, fishing poles). To what extent the cost of carbon FRP can be reduced has not been determined exactly and is likely to be restricted by energy costs to manufacture the carbon fibers. However, it is certainly plausible that with large volume orders—which would occur if a prototype system is built—FRP material costs will be reduced significantly.
The mass of the guideway beam plays an important role in determining the overall cost for materials, fabrication, transportation and erection of the beam element The mass of a Transrapid guideway beam is approximately 50% greater than that of the narrow beam concept (i.e. the narrow beam is two-thirds the mass of the Transrapid beam).Higher beam mass typically results in higher material, manufacture, transportation, and erection costs. A typical channel guideway beam concept, havihg substantially greater beam mass than the narrow beam concept, can be expected to have 2 to 3 times higher cost.
A drawback to the narrow beam EDS concept is the need for non-magnetic reinforcement. FRP reinforcement is non-magnetic and can serve as a replacement for steel, though currently it is more expensive. Low strain, high modulus carbon fibers are mechanically superior to glass or high strength carbon fibers when used in concrete.
Total narrow beam guideway implementation costs are estimated to be 25% less than Transrapid costs, and 50% to 75% less than channel guideway costs. Current glass and carbon fiber costs and high failure strains confine FRP usage to areas of the beam cross-section where steel is not allowed. Research focused on more economical production of low cost, low high modulus carbon fibers is needed.
106
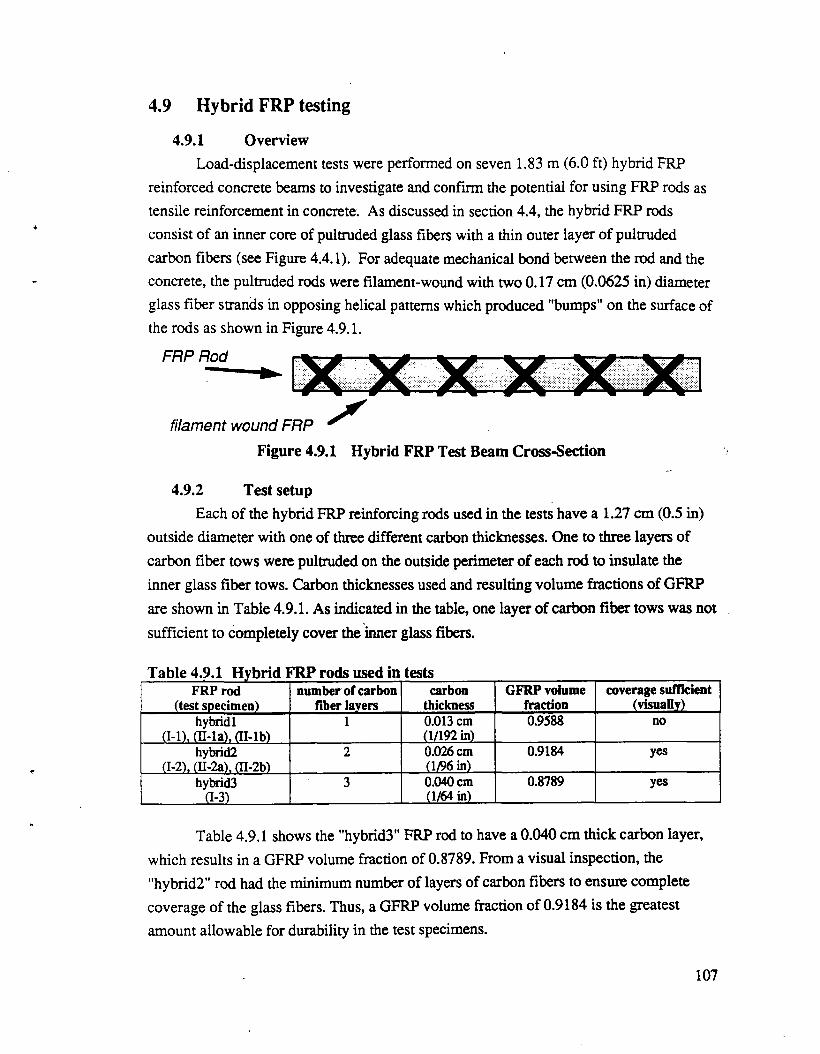
4 . 9 H y b r i d F R P t e s t i n g
4.9.1 OverviewLoad-displacement tests were performed on seven 1.83 m (6.0 ft) hybrid FRP
reinforced concrete beams to investigate and confirm the potential for using FRP rods as tensile reinforcement in concrete. As discussed in section 4.4, the hybrid FRP rods consist of an inner core of pultruded glass fibers with a thin outer layer of pultruded carbon fibers (see Figure 4.4.1). For adequate mechanical bond between the rod and the concrete, the pultruded rods were filament-wound with two 0.17 cm (0.0625 in) diameter glass fiber strands in opposing helical patterns which produced "bumps" on the surface of the rods as shown in Figure 4.9.1.
FRP Rod
filament wound FRP ^Figure 4.9.1 Hybrid FRP Test Beam Cross-Section
4.9.2 Test setupEach of the hybrid FRP reinforcing rods used in the tests have a 1.27 cm (0.5 in)
outside diameter with one of three different carbon thicknesses. One to three layers of carbon fiber tows were pultruded on the outside perimeter of each rod to insulate the inner glass fiber tows. Carbon thicknesses used and resulting volume fractions of GFRP are shown in Table 4.9.1. As indicated in the table, one layer of carbon fiber tows was not sufficient to completely cover the inner glass fibers.
Table 4.9.1 Hybrid FRP rods used in testsFRP rod
(test specimen)number of carbon
fiber layerscarbon
thicknessGFRP volume
fractioncoverage sufficient
(visually)hybridl
(1-1), 01-la). (Il-lb)1 0.013 cm
(1/192 in)0.9588 no
hybrid2(I-2),ai-2a).ai-2b)
2 0.026 cm (1/96 in)
0.9184 yes
hybrid3(1-3)
3 0.040 cm (1/64 in)
0.8789 yes
Table 4.9.1 shows the "hybrid3" FRP rod to have a 0.040 cm thick carbon layer, which results in a GFRP volume fraction of 0.8789. From a visual inspection, the "hybrid2" rod had the minimum number of layers of carbon fibers to ensure complete coverage of the glass fibers. Thus, a GFRP volume fraction of 0.9184 is the greatest amount allowable for durability in the test specimens.
107

Two phases of tests were performed. For the first phase, one test specimen was cast for each of the three carbon thicknesses, (tests I-1,1-2, and 1-3). A difficulty in the first phase tests was that the FRP reinforcing bar was placed in contact with the steel stirrups. Under considerable bending, the axial force from the stirrup caused shearing on the FRP, which led to premature failure of the FRP rod. For Phase II, (tests II-la, II-lb, II-2a, and II-2b), a separation of approximately 1.9 cm (0.75 in) between the FRP rod and the stirrups was enforced. The problem appeared to have been eliminated.
Figure 4.9.2 shows the cross-section of the Phase II test specimens. Stirrups and reinforcement in the concrete compression zone are approximately 0.476 cm (0.1875 in) diameter mild steel. One hybrid FRP rod is located in the lower web of the T-beam. Compressive strength for the concrete ranged from 55 to 75 MPa (8-11 ksi).
17.78 cm . (7.00 in)
compreslon zone reinforcement
(steel)
stirrup reinforcement
(steel)
tension zone reinforcement
(hybrid FRP rod)
v — 1( \ 14.61 cm
\ (5.75 in)17.46 cm
high strength (6.875 in) concrete
6.35 cm(2 JO in)
Figure 4.9.2 Hybrid FRP Test Beam Cross-Section
The beams were tested under 4 point bending as indicated in Figure 4.9.3. A development length of 30.5 cm (12 in) was allowed and a shear free zone (between the two loading points) of 10.2 to 20.3 cm (4-8 in) was used. A 20.3 cm shear free zone was used for the Phase I tests and a 10.2 cm zone was used for the final four beams of PhaseII. The 10.2 cm shear free zone gives a shear aspect ratio of:
86.36cm-30.48cma = ----------------------------- = 3.825
14.61cm
108
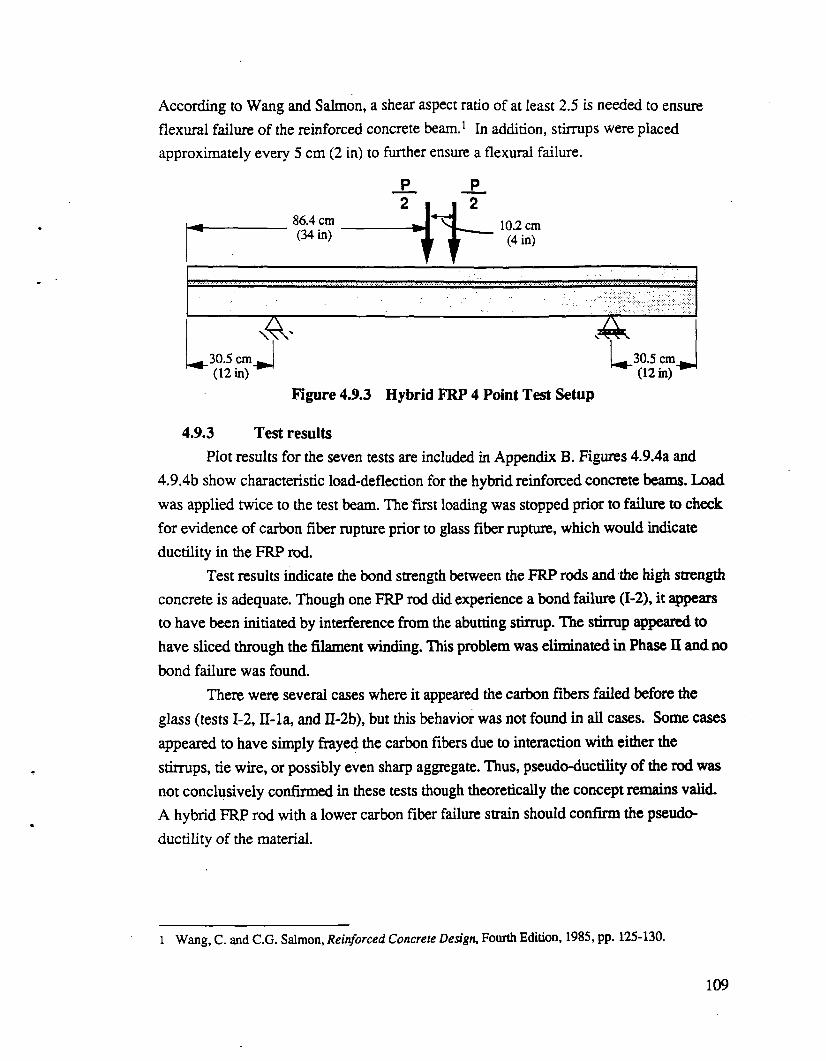
According to Wang and Salmon, a shear aspect ratio of at least 2.5 is needed to ensure flexural failure of the reinforced concrete beam.1 In addition, stirrups were placed approximately every 5 cm (2 in) to further ensure a flexural failure.
Figure 4.9.3 Hybrid FRP 4 Point Test Setup
4.9.3 Test resultsPlot results for the seven tests are included in Appendix B. Figures 4.9.4a and
4.9.4b show characteristic load-deflection for the hybrid reinforced concrete beams. Load was applied twice to the test beam. The first loading was stopped prior to failure to check for evidence of carbon fiber rupture prior to glass fiber rupture, which would indicate ductility in the FRP rod.
Test results indicate the bond strength between the FRP rods and the high strength concrete is adequate. Though one FRP rod did experience a bond failure (1-2), it appears to have been initiated by interference from the abutting stirrup. The stirrup appeared to have sliced through the filament winding. This problem was eliminated in Phase II and no bond failure was found.
There were several cases where it appeared the carbon fibers failed before the glass (tests 1-2, II-la, and II-2b), but this behavior was not found in all cases. Some cases appeared to have simply frayed the carbon fibers due to interaction with either the stirrups, tie wire, or possibly even sharp aggregate. Thus, pseudo-ductility of the rod was not conclusively confirmed in these tests though theoretically the concept remains valid. A hybrid FRP rod with a lower carbon fiber failure strain should confirm the pseudoductility of the material.
1 Wang, C. and C.G. Salmon, Reinforced Concrete Design, Fourth Edition, 1985, pp. 125-130.
109
Figure 4.9.4a FRP Reinforced Concrete Force-Displacement Plot
Figure 4.9.4b FRP Reinforced Concrete (magnified) Force-Displacement Plot
Ductility in the FRP rod could not be confirmed due to the high failure strains of the pultruded glass and high strength carbon fibers. However, ductility in the FRP reinforced beam was evident as significant and obvious cracking of the concrete occurred in each beam prior to failure. Only one beam failed in a brittle manner in the second phase. It was concluded the failure was due to improper alignment of the beam setup.The other three test beams demonstrated that FRP R/C beams indeed fail in a ductile manner.
110
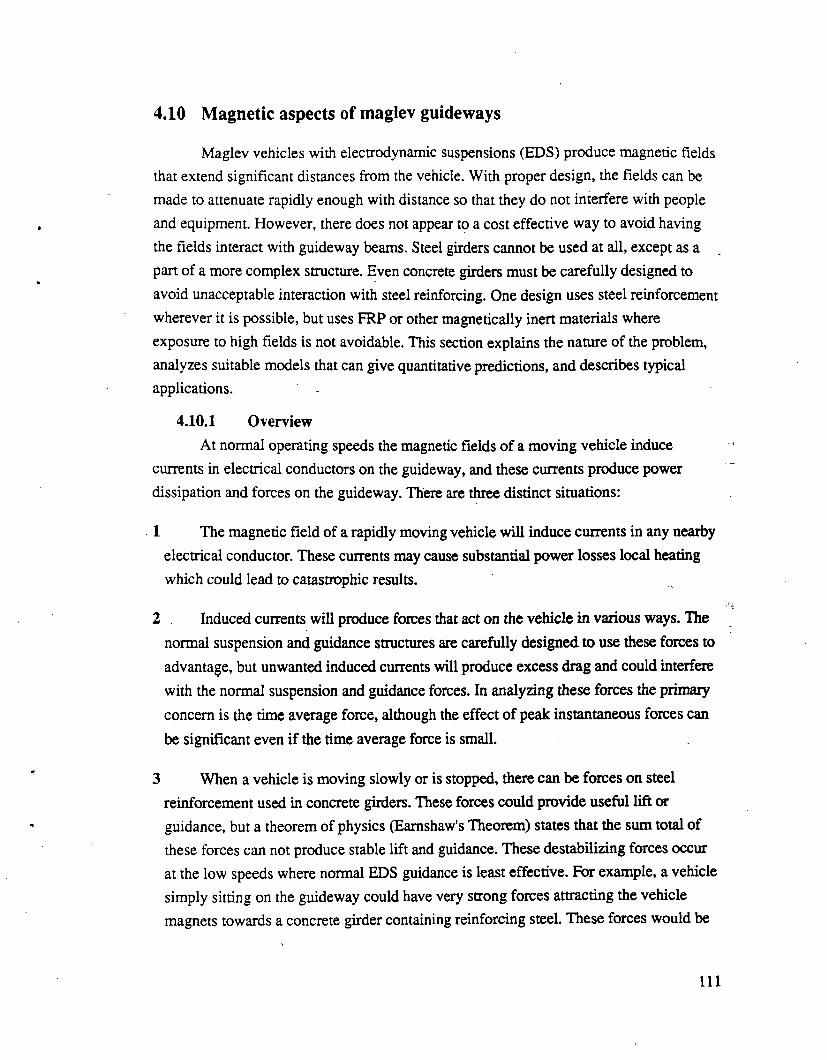
4 . 1 0 M a g n e t i c a s p e c t s o f m a g l e v g u i d e w a v s
Maglev vehicles with electrodynamic suspensions (EDS) produce magnetic fields that extend significant distances from the vehicle. With proper design, the fields can be made to attenuate rapidly enough with distance so that they do not interfere with people and equipment. However, there does not appear to a cost effective way to avoid having the fields interact with guideway beams. Steel girders cannot be used at all, except as a pan of a more complex structure. Even concrete girders must be carefully designed to avoid unacceptable interaction with steel reinforcing. One design uses steel reinforcement wherever it is possible, but uses FRP or other magnetically inert materials where exposure to high fields is not avoidable. This section explains the nature of the problem, analyzes suitable models that can give quantitative predictions, and describes typical applications.
4.10.1 OverviewAt normal operating speeds the magnetic fields of a moving vehicle induce
currents in electrical conductors on the guideway, and these currents produce power dissipation and forces on the guideway. There are three distinct situations:
1 The magnetic field of a rapidly moving vehicle will induce currents in any nearby electrical conductor. These currents may cause substantial power losses local heating which could lead to catastrophic results.
2 Induced currents will produce forces that act on the vehicle in various ways. The normal suspension and guidance structures are carefully designed to use these forces to advantage, but unwanted induced currents will produce excess drag and could interfere with the normal suspension and guidance forces. In analyzing these forces the primary concern is the time average force, although the effect of peak instantaneous forces can be significant even if the time average force is small.
3 When a vehicle is moving slowly or is stopped, there can be forces on steel reinforcement used in concrete girders. These forces could provide useful lift or guidance, but a theorem of physics (Eamshaw's Theorem) states that the sum total of these forces can not produce stable lift and guidance. These destabilizing forces occur at the low speeds where normal EDS guidance is least effective. For example, a vehicle simply sitting on the guideway could have very strong forces attracting the vehicle magnets towards a concrete girder containing reinforcing steel. These forces would be
111
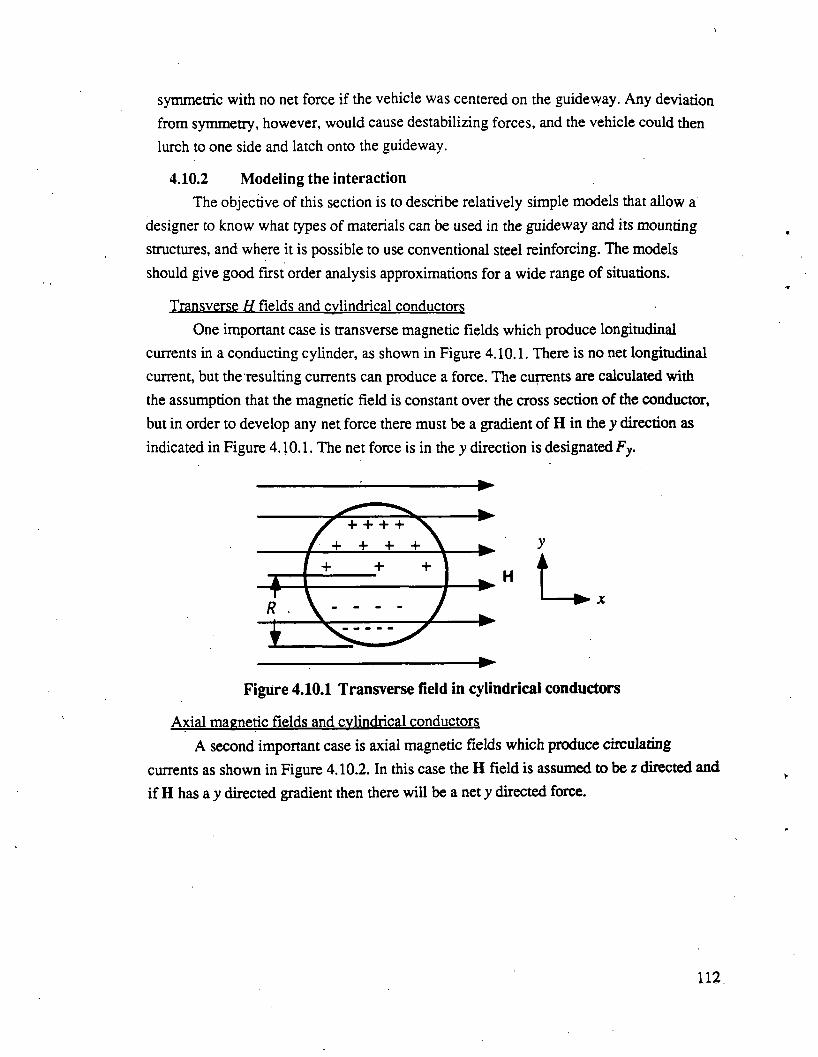
4.10.2 Modeling the interactionThe objective of this section is to describe relatively simple models that allow a
designer to know what types of materials can be used in the guideway and its mounting structures, and where it is possible to use conventional steel reinforcing. The models should give good first order analysis approximations for a wide range of situations.
Transverse H fields and cylindrical conductorsOne important case is transverse magnetic fields which produce longitudinal
currents in a conducting cylinder, as shown in Figure 4.10.1. There is no net longitudinal current, but the resulting currents can produce a force. The currents are calculated with the assumption that the magnetic field is constant over the cross section of the conductor, but in order to develop any net force there must be a gradient of H in the y direction as indicated in Figure 4.10.1. The net force is in the y direction is designated Fy.
symmetric with no net force if the vehicle was centered on the guideway. Any deviationfrom symmetry, however, would cause destabilizing forces, and the vehicle could thenlurch to one side and latch onto the guideway.
Figure 4.10.1 Transverse field in cylindrical conductors
Axial magnetic fields and cylindrical conductorsA second important case is axial magnetic fields which produce circulating
currents as shown in Figure 4.10.2. In this case the H field is assumed to be i directed and if H has a y directed gradient then there will be a net y directed force.
112

X
Figure 4.10.2 Axial field in cylindrical conductors
NotationTo simplify calculations we use complex notation with the understanding that the
quantity of interest is the real part. The radius of the conductor is assumed to be R, and force and power are assumed to be per unit volume of conductor. With reference to Figures 4.10.1 we define the following quantities:
H(r) = Re[//0e-,<“iI] is the x directed H field
(Pd) is the time average power dissipated per unit volume of conductor
(Fy} is the time average force in the y direction unit length of conductor p is the resistivity of the conductor fi is the permeability of the conductor
8 = is the skin depthV
ay' 1 dH0y
l*o <*yis a measure of the rate of field attenuation with distance
Similar notation applies to Figure 4.10.2. Following is a discussion of the parameters used in these definitions.
Skin depthFor any good conductor there is a skin effect wherein time varying magnetic
fields create induced currents which, in turn, create a reaction magnetic field that prevents currents from penetrating very far into the conductors. The skin effect causes the magnetic field density and electric current density to both attenuate exponentially with distance into the conductor. The distance required to attenuate by a factor of e — 2.718 is called the skin depth. A precise field solution that considers the skin effect often involves complex calculations, (e.g., using Bessel Functions), but there is usually a sharp dividing
113
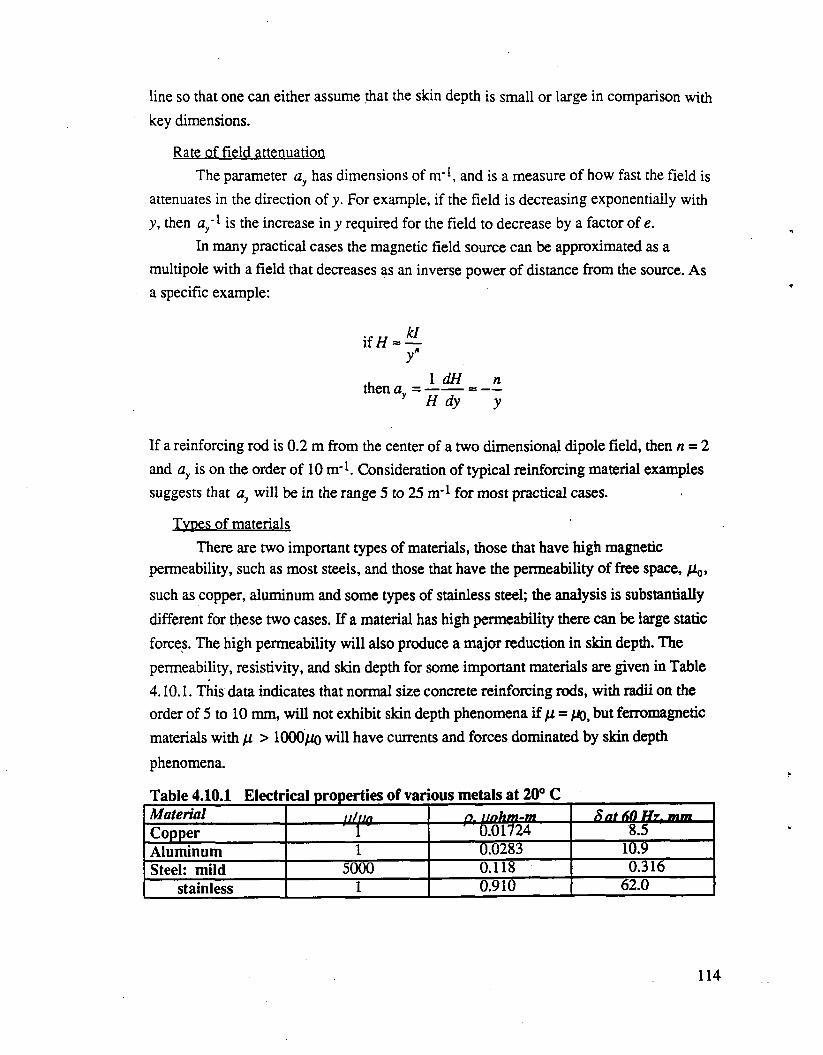
Rate of field attenuationThe parameter ay has dimensions of nr1, and is a measure of how fast the field is
attenuates in the direction of y. For example, if the field is decreasing exponentially with y, then fly'1 is the increase in y required for the field to decrease by a factor of e.
In many practical cases the magnetic field source can be approximated as a multipole with a field that decreases as an inverse power of distance from the source. As a specific example:
line so that one can either assume that the skin depth is small or large in comparison withkey dimensions.
i f *
then a. = ------y H dy
n
y
If a reinforcing rod is 0.2 m from the center of a two dimensional dipole field, then n = 2 and ay is on the order of 10 nr1. Consideration of typical reinforcing material examples suggests that ay will be in the range 5 to 25 nr1 for most practical cases.
Types of materialsThere are two important types of materials, those that have high magnetic
permeability, such as most steels, and those that have the permeability of free space, fl0,
such as copper, aluminum and some types of stainless steel; the analysis is substantially different for these two cases. If a material has high permeability there can be large static forces. The high permeability will also produce a major reduction in skin depth. The permeability, resistivity, and skin depth for some important materials are given in Table4.10.1. This data indicates that normal size concrete reinforcing rods, with radii on the order of 5 to 10 mm, will not exhibit skin depth phenomena if /i = but ferromagneticmaterials with fi > lOOO o will have currents and forces dominated by skin depth phenomena.
Table 4.10.1 Electrical properties of various metals at 20° CMaterial tj/tJn n. n nhm -m f ia t 6 0 H t, m mCopper 0.01724 8.5Aluminum 1 0.0283 10.9Steel: mild 5000 0.118 0 1 3
stainless 1 0.910 62.0
114

4.10.3 AnalysisThe following equations were derived by Prof. Mark Zahn, MIT. They were
derived from Maxwell's equations, using the approximations described above.
Transverse field1. R « S
2 / „ \ 2
\H,^ + / y
' ( p - f i o)(3/x0 + ^ K 6 /t/?4 ^
v 2 ( / * W 5<54
2. /? » < 5
ay\H0\
RS
(F, ) = -
Axial field1. R « 5
(f >>= ^ — T o F r 1"”2. R » 8
4.10.4 Application examplesSituations to be analyzed
The following three effects are analyzed for the models in Figures 4.10.1 and4.10.2:
• Time average losses and forces produced by vehicles moving at normal cruise speeds near nonmagnetic materials with skin depth greater than the key dimensions.
• Time average losses and forces produced by vehicles moving at normal cruise speeds near ferromagnetic materials with skin depth less than critical dimensions.
• Instantaneous forces on stationary or slowly moving vehicles near ferromagnetic materials with large skin depth.
115
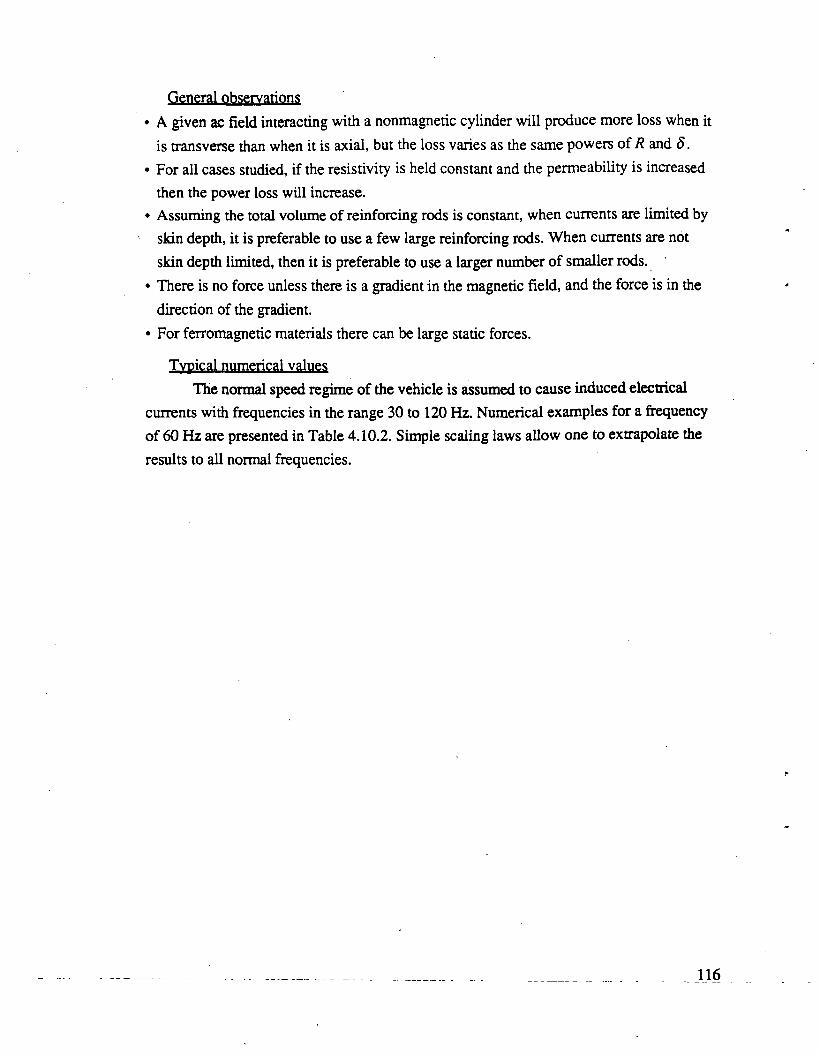
General observations• A given ac field interacting with a nonmagnetic cylinder will produce more loss when it
is transverse than when it is axial, but the loss varies as the same powers of R and 8.• For all cases studied, if the resistivity is held constant and the permeability is increased
then the power loss will increase.• Assuming the total volume of reinforcing rods is constant, when currents are limited by
skin depth, it is preferable to use a few large reinforcing rods. When currents are not skin depth limited, then it is preferable to use a larger number of smaller rods.
• There is no force unless there is a gradient in the magnetic field, and the force is in the direction of the gradient.
• For ferromagnetic materials there can be large static forces.
Typical numerical valuesThe normal speed regime of the vehicle is assumed to cause induced electrical
currents with frequencies in the range 30 to 120 Hz. Numerical examples for a frequency of 60 Hz are presented in Table 4.10.2. Simple scaling laws allow one to extrapolate the results to all normal frequencies.
116
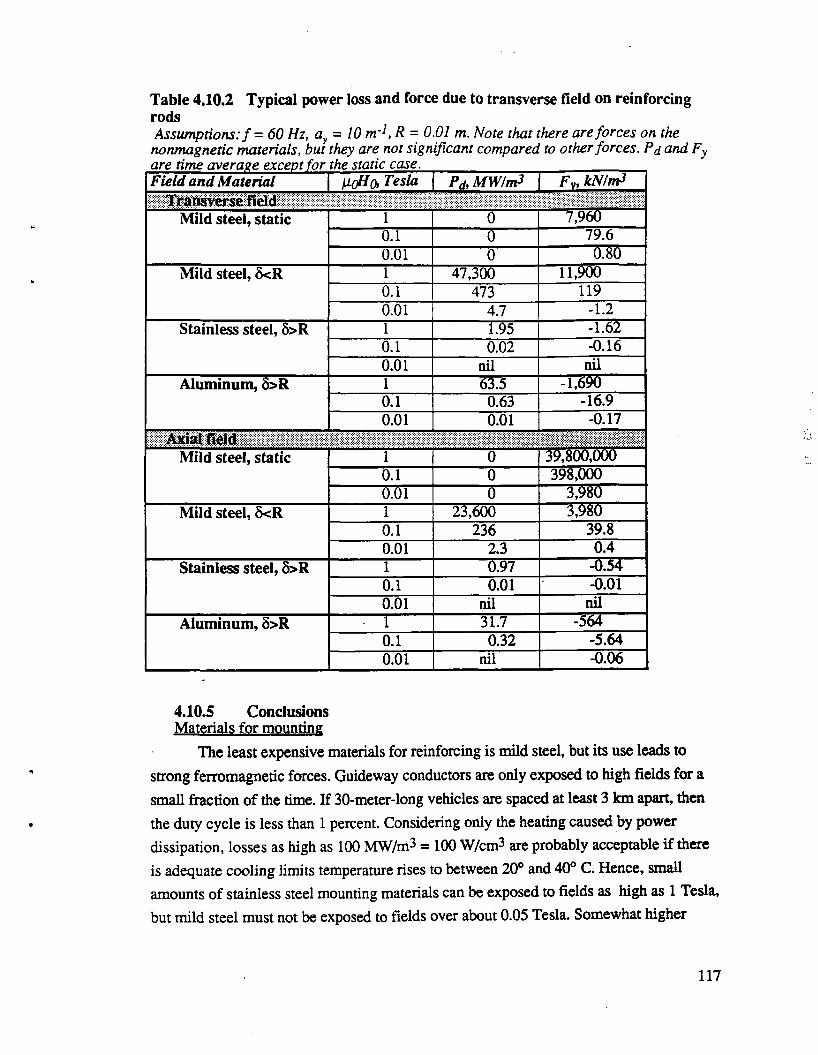
Table 4.10.2 Typical power loss and force due to transverse field on reinforcing rodsAssumptions:f = 60 Hz, ay = 10 m'1, R = 0.01 m. Note that there are forces on the nonmagnetic materials, but they are not significant compared to other forces. Pd and Fy
F ie ld a n d M ateria l P(flo> Tesla P ^ M W /m 3 F v, kN /m 3Transverse field
Mild steel, static 1 0 7,9600.1 0 7<>.60.01 0 0.80
Mild steel, 5<R 1 47,300 TT3000.1 473 1190.01 4.7 -1.2
Stainless steel, 8>R 1 1.95 -1.620.1 0.02 -0.160.01 nil nil
Aluminum, 8>R 1 63.5 =U>900.1 0.63 -16.90.01 0.01 -0.17
Axial HeldMild steel, static 1 0 39,800,000
0.1 0 398,0000.01 0
Mild steel, 8<R 1 23,600 33§o0.1 236 39.80.01 2.3 0.4
Stainless steel, 5>R 1 037 =0350.1 0.01 -0.010.01 nil nil
Aluminum, 5>R 1 31.70.1 0.32 -5.640.01 nil -0.06
4.10.5 ConclusionsMaterials for mounting
The least expensive materials for reinforcing is mild steel, but its use leads to strong ferromagnetic forces. Guideway conductors are only exposed to high fields for a small fraction of the time. If 30-meter-long vehicles are spaced at least 3 km apart, then the duty cycle is less than 1 percent. Considering only the heating caused by power dissipation, losses as high as 100 MW/m = 100 W/cm are probably acceptable if there is adequate cooling limits temperature rises to between 20° and 40° C. Hence, small amounts of stainless steel mounting materials can be exposed to fields as high as 1 Tesla, but mild steel must not be exposed to fields over about 0.05 Tesla. Somewhat higher
117
fields would be acceptable if the steel resistivity could be increased by alloying. Aluminum has a cost advantage over stainless steel and could be used at fields up to 1 Telsa, but the losses and forces will be larger than for stainless steel. A more detailed calculation is needed to ascertain the acceptability of aluminum fastening devices, and where they are used the diameter should be limited to the smallest possible value.
Materials for reinforcingIn a typical example, concrete with all metallic reinforcing rods might have 0.01
m3 of reinforcing rods exposed to the fields of a single vehicle at any time. If we limit the loss to 1 MW/m3, then the total dissipation will only be about 100 kW, and this is probably acceptable. Using this criteria, mild steel should not be used where the fields exceed 100 gauss. Stainless steel reinforcing could be exposed to axial fields of over 1 Tesla, but should not be exposed to transverse fields of more than 0.7 Tesla. However, if the radius of the reinforcing rod is decreased by a factor of 2 then stainless steel could be used at twice as high a field. Aluminum is never used for reinforcing because of problems with thermal expansion, and clearly it is not a good material to use when time varying magnetic materials are present. If it is used, it should be fabricated into insulated strands in a "Litz wire" fashion.
Magnetic forcesLoss considerations virtually preclude the use of ferromagnetic steel in regions
where these materials could create significant forces. If heating were not a criterion, then one would have to determine the impact of the very large forces. There will be forces on nonmagnetic material, but if the mounting and reinforcing materials are of relatively small size, then these forces are not significant except in so far as they create magnetic drag. Stainless steel does not appear to create significant undesirable forces.
RecommendationsThick rods of ordinary ferromagnetic steel should not be used where there are
time varying fields of more than a few hundred gauss. High resistivity, nonmagnetic steels can be used almost anywhere if care is used in matching the steel properties, rod diameter, and orientation. Aluminum is usable if fabricated into insulated strands, with the diameter of individual wires limited to 1 or 2 mm. These rough guidelines are intended only for conceptual design, and in a final design a detailed calculation should be done using the methodology described above.
118
5 . 0 S u m m a r y a n d C o n c l u s i o n s
This report focuses on five aspects of maglev guideway design and the important conclusions are summarized here.
1 Design of a minimum cost girderWe have developed a design methodology for a reinforced concrete, hollow box
beam girder. We believe that this design has the lowest possible cost consistent with required strength, stiffness, and longevity constraints. A result of the project is a spreadsheet program that allows the user to optimize beam dimensions and predict the cost for any given set of load and stiffness requirements. Comparisons with girder designs for other maglev systems shows that our proposed design has lower material usage and potentially lower cost.
We also studied possible manufacturing strategies that can contribute to lowering the cost of the installed guideway including segmental construction, near site fabrication, and assembly-line installation procedures.
2 Analysis and mitigation of magnetic interactionsWe analyzed the effect of magnetic fields on reinforcing material and showed that
typical quantities of reinforcing steel can not be used in regions where fields of more than a few hundred gauss are present. For typical EDS designs this implies that normal reinforcing should be between 0.3 and 0.5 meters from the magnets of a moving vehicle. If conventional mild steel reinforcing were used there would be strong forces that could be destabilizing at low speeds and create excessive power loss. If small amounts of ferromagnetic steel were used the force and power would be tolerable but there could be local regions with very high local power density, and this could cause excessive local temperature rise.
Strongly conducting but non magnetic materials, like aluminum and copper, also have high losses and should be avoided unless they can be used in thin strands that only have one dimension that is more than one or two millimeters.
It is possible to use reasonable amounts of higher resistivity, non magnetic metals such as stainless steel. These materials might be used for mounting hardware, even in regions of very high fields. In this case it is preferable to use rods that are not more than 10 or 20 mm in diameter.
119

3 Non-magnetic hybrid FRP concrete reinforcementWe showed that hybrid fiber reinforced plastic (FRP) rods can be used as an
alternative to steel reinforcement and determined the added cost due to this option. This option has a great potential because of the probability that adequate strength carbon fibers could be manufactured at reasonable cost.
Production of a hybrid glass/carbon FRP rod where glass fibers are insulated by carbon fibers is both possible and economical. The carbon covering 1) ensures protection of the glass fibers from the alkaline environment of the concrete, increases stiffness of the rod, and 3) allows a pseudo-ductile failure.
Adequate bond between the FRP rod and concrete is achieved through a modified filament winding process. Deformations created by the winding process can be specified for particular concrete mixes. Generally, higher strength concretes will require less rod deformations to achieve sufficient bonding.
4 Dynamics of vehicle guideway interactionWe analyzed the dynamic interaction of a vehicle moving over a guideway and
developed relatively simple means to predict the transient behavior of the girder. This analysis was done for vehicle alternatives ranging from highly concentrated loads, such as would be expected with wheeled vehicles to fully distributed vehicles such as is found in many maglev designs. In general, the more distributed the vehicle load, the less the dynamic amplification factor. Therefore, there is a definite advantage to use of multiple vehicle loading pads.
We showed that a guideway can have substantial resonant behavior and developed means to find critical speeds that should be avoided in the interest of improved ride quality and longer girder life. Residual vibration is influenced primarily by the centroid spacing of the vehicle pads and not necessarily by the extent of vehicle load distribution. Future research is planned to identify critical speeds for a variety of vehicle pad distributions and beam frequencies. Low cost pitch based carbon has potential for use as an internal damping mechanism for reducing the residual vibration.
5 Opportunities for improved guidewaysIn order to achieve good ride quality we must build a maglev guideway with very
tight tolerances, probably a factor of 2 to 5 tighter tolerance than is possible with normal construction procedures. High speed railroads have found it necessary to maintain rail alignment to a 1 or 2 millimeter tolerance and this entails relatively expensive track maintenance. The French TGV estimate maintenance cost as comparable to energy cost and the Japanese Shinkansen use several men per kilometer of guideway for continuous
120

maintenance. The Transrapid design requires precise field installation and adjustment and there is concern that the maintenance cost could be high. We explored this problem in a qualitative way and recommended some futuristic alternatives that are worthy of further study.
One promising method is to replace conventional ballasting methods, such as gravel used with rail systems, with electronically controlled means that can achieve the same objective with lower cost and higher tolerance. Another option is to use electronically controlled coils in the guideway to provide dynamic control. This might be thought of as an active primary suspension but with the active controls in the guideway instead of on the vehicle. This may be practical because the energy for the control can come from the vehicle itself as though it were a "smart" shock absorber.
In general, automated monitoring and adjustment of the guideway is desirable as it allows for 1) increased safety, 2) reduced erection tolerance requirements, 3) reduced maintenance requirements, 4) lower construction cost, 5) lower operation and repair costs, and ultimately 6) increased revenue. Achieving required ride quality tolerances for foundation and pier construction will be difficult and expensive. Actuators made from shape memory alloys and piezo-electric ceramics may allow the use of continual monitoring and adjustment of the magnetic windings. It is expected the vehicle would act as the sensor.
121
6 .0 S u g g e s te d fu tu r e r e s e a r c h
Future research is needed in a number of areas including 1) large scale manufacturing processes, 2) advanced material research, and 3) guideway beam dynamic analysis. The three specific research topics are suggested.
1 Large scale manufacturing processesConstruction of the guideway may be the single largest cost for a maglev system.
There appears to be substantial potential for developing automation methods that substantially lower the cost of a long distance guideway. This automation may entail the use of new materials that allow more flexibility in adapting to a varied terrain and will entail methods of achieving precision alignment with minimum labor.
Concrete guideways appear to be the most appropriate choice for EDS maglev, but there is very little experience in cost reduction for constructing long distance guideway segments over several years. Formwork is very expensive for highway bridge construction. Also, for the long distances involved with potential maglev corridors, multiple concrete cast sites will be necessary. Research is needed to 1) develop two or three approaches to automated manufacturing and 2) simulate the operation of each approach to see which is more effective and 3) determine how much cost reduction can be expected from automated procedures.
Because many mechanical properties of concrete structural elements are unable to
scale properly, we propose only full scale testing of guideway structural elements. In general, information sought from the testing of structural elements cannot be obtained through scale model testing. However, testing of an automation process to manufacture concrete structural elements should be possible on a scale model basis. The best known methods of constructing a guideway for high speed ground transportation should be thoroughly analyzed and a scale model of the automation system should be built and tested structurally, but should serve to help visualize the proposed automation process. Testing should be undertaken where it is feasible, where it is not, simulation of the best proposals for automation should be performed. The overall objective is to develop a recommended proposal for the construction method most appropriate for maglev
guideways.
With the possible exception of the proposed scale model testing this research should have a very high probability of success. There are no known barriers that would
122
2 Advanced material researchResearch into the applications of new materials is needed for a number of new and
existing materials. Though research into many basic materials types and derivatives such as mild steels, prestressing steels, stainless steels, polymer modified concrete, polymer impregnated concrete, fiber reinforced concrete, high strength concrete, fiber reinforced plastic material, low cost carbon fibers, high modulus aluminum, high strength aluminum, etc., will be beneficial, only a few of the most immediate material research
areas are discussed in this section. The three material types discussed below are existing materials that have not been broadly implemented to date. The suggested research focuses on steps needed to reduce uncertainty and cost
High Strength ConcretePerhaps the most important advantage of using high strength concrete over normal
strength is increased durability of the structure, j.e. longer life span. In addition, high strength concrete provides higher allowable stresses, lighter sections, lower deflections, and lower dynamic amplification rates. The objective of this research would be to identify suitable sources for light and heavy weight aggregate and to determine total cost, including transportation to typical construction sites in the U.S. Favorable results are very likely and would clarify maglev cost-effectiveness on a significant issue area.
The research would identify suitable existing aggregate sources based on crushing strength and abrasion requirements and identify types and costs for transportation to a number of production sites throughout the U.S.
FRPThough fiber reinforced plastic, FRP, is in use today, it is generally not
considered economical. Its use is primarily required when structures are exposed to corrosive or high magnetic field environments. Because of the non-magnetic property of FRP material, it can serve as a replacement for mild steel reinforcement in selected areas of EDS maglev guideway structures. Research to reduce the cost o f using FRP should be performed in the following three areas: 1) connection design, 2) lower cost, lower strain carbon fibers, and 3) long term durability tests. Connection design is important as pultruded FRP material, due to its orthotropic nature, cannot be as easily spliced or "welded" together as isotropic materials (e.g. steel) can. There is plenty of connection
prevent successful completion. Even a small reduction in cost would justify a substantialeffort.
123
design experience in the aerospace and automobile industries and this experience can be applied directly to most construction FRP applications. However, the construction industry in general, is not familiar with assembling FRP elements. Research into more cost effective and easily used connection designs for the construction industry is proposed.
Lower cost, lower strain fibers would result in better utilization of the FRP material by the concrete. It is important to note that higher strength fibers are not critical, nor is reduced weight necessarily beneficial. Rather, for use in maglev concrete beams, higher modulus and lower straining fibers are more beneficial. Though this research would run counter to current emphasis in the composite industry on higher strength to weight ratio fibers, due primarily to the aerospace and automobile industries, it should have a moderate to high chance of success. Any reduction in fiber cost will have a significant effect on making FRP a more practical alternative to steel. Finally, though much durability and fatigue testing has been performed on composites in concrete, the more durability tests that can be performed on the FRP material,, the lower the uncertainty involved, (i.e. the lower the cost), when designing with FRP.
Stainless SteelsThough stainless steel use is relatively common, due to its high cost its use in the
civil engineering industry has been restricted primarily to projects in certain corrosive environments. Research is needed to determine better and lower cost fabrication techniques for mass production.
3 Guideway beam dynamic analysisAnother very interesting research area is what direct implications concerning long
term guideway life does vehicle length, pad length and distribution, and vehicle speed have on the dynamic behavior of a guideway beam. It appears that certain speeds can be identified for particular vehicle configurations and beam stiffnesses thereby allowing
residual vibrations of the beam to be completely canceled-without any damping.Though worst case scenarios will have to be designed for and appropriate amounts of damping implemented, it is important to study the influence that the number of pads, length of pads and spacing of pads has on particular guideway beam dynamics. Results of such research will identify speeds that are both desirable and undesirable for given beam segments. Once relationships are determined, constant monitoring of vehicles passing particular beams will allow profiles to be derived for each beam segment. Such profiles will allow better prediction of long term life on a beam by beam basis. In
124-

addition, the dynamic analysis would consider vehicle mass and a variety of support
structures.
125
7.0 References
American Concrete Institute (1989), ACI Committee 318, Building Code Requirements for Reinforced Concrete.
Assessment of the Potential for Magnetic Levitation Transportation Systems in the United States-A Report to Congress, Federal Railroad Administration, June 1990.
CIGGT (1989), Maglev Technology Assessment, Task Review, Validation and Revision of the Capital and Operating Costs for a Transrapid TR-06 Maglev System and for a TGV System in the Las Vegas-Southern California Corridor, Super-Speed Ground Transportation System Las Vegas/Southem California Corridor Phase II, The Canadian Institute of Guided Ground Transport.
Charles, J.A. and F.A.A. Crane (1989), Selection and use of Engineering Materials, Second Edition.
Collins, M.P. and D. Mitchell (1991), Prestressed Concrete Structures, p. 613.
Harrison, J.A., et.al. (1992), Maglev Cost Estimation: Capital Cost Elements, Parsons Brinkerhoff Quade & Douglas, Inc. for Volpe National Transportation Systems Center, Interim Report.
Hayashi A. and A. Ohishi (1989), "HSST MAGLEV Train at Yokohama Expo '89, Magnetic Levitation Technology for Advanced Transit Systems, SAE SP-792, p. 23-32.
Hilliges, D. and H. Schambeck, “The Concrete Guideway”, Transrapid Maglev System, edited by Heinrich, K. and R. Kretzschmar, 1989, p. 21-24.
Hsu, T. (1984), Torsion of Reinforced Concrete.
Humar, J.L. (1990), Dynamics of Structures, Prentice Hall, pp. 668-671.
Kurz, D.E. (1991), “Beyond the IC-Express”, Railway Gazette International, May 1991, pp. 299-303.
Mechanical Engineering, ASME, April 1992, p. 114.
Menn, Christian (1991), Prestressed Concrete Bridges, pp. 49-64.
Phelan, R.S. and J.M. Sussman (1991) "Maglev Technology: A Look at Guideway and Maintenance Concerns", Applications of Advanced Technologies in Transportation Engineering, Proceedings of the Second International Conference, American Societyof Civil Engineers, p. 193-197.
Richardson, H.H. and D.N. Wormley (1974), "Transportation Vehicle/Beam-Elevated Guideway Dynamic Interactions: A State-of-the-Art Review", Journal of Dynamic Systems, Measurement, and Control, 74-Aut-P, ASME,p. 1-11.
126

Takeda, H. (1989), "Japanese Superconducting Maglev: Present State and Future Perspective", Magnetic Levitation Technology for Advanced Transit Systems, SAE SP-792, p. 57-62.
Thornton, R.D. (1990), "Monorail Maglev", Magnetic Levitation and Transportation Strategies, Future Transportation Technology Conference and Display, San Diego, CA, SAE Publication SP-834, Paper #90479, p. 61-67.
Wang, C. and C.G. Salmon, Reinforced Concrete Design, Fourth Edition, 1985, pp. 125- 130.
127

A p p e n d ix A
Steel and FRP Reinforced Concrete Hollow Box Beam Design
Spreadsheet Analysis Program

A B C D E F 1 GUserlnmit: okay! .... | page 1
2 material data i3 Er = 200,000i(MPa) okay!4 fconc = 4i.5d|(MPa) Qkay.1................1.........................5 fr = 414.00l(MPa) okay!6 rho.conc = 23.00i(kN/mA3) okay! j7 rho.rein = 77.0dl(kN/mA3)8 $.conc = $90.00i($/mA3) okay!9 $.rein = _______ $0.55i($/kg)............... okay!10 $.ps = $2.25j($/kg) ............... ............. ..... ..............11 F.lp = 0.20: okay!12 fro data 1.... ..............\Qkay! ............. j...... ...............13 F.frp = 5.501 okay!14 b.frp = 0.20j(m) okay!1 5 negative reinforcement fractions16 section data 1 okay! F.nr.v = .............0.25!17 b = 1,40, (m) ............ F.nr.h = 1.00!18 h = 2,10 (m) okay! kQLQWljsteQmai&.tiimms\QM\..........................19 t.min = 0.15i(m) okay! D.stir = 0.012700!(m)20 L = 25.00 (m) D.b = 0.6i5875!(mj21 loadings C.c = 0.038i00!(m)22 w.v = 2.00:(tonne/m) okay! concrete stress constraints23 P.v = O.OO(tonne) sksyl................ F.c.t* = 500j(fcA.5) [Pa]24 w.h = 1.50.(tonne/m) F.c.c* = 0.45i(*fc)25 P.h = OOOj(tonne) okavl uemimbk.Mmm262728
w.m =iileflecfion
0.10;(tonne/m) traints | alpha.r = 0.6000:
29 kA.v.min = 10001 i m m m U ed m m facM s30 kA.h.min = 10001 i... .....................!phi=................ 0.90!31 load factors32 1.40! max, shear iQM.check33 F.v = 1.401 ?.av = ................. P,50|[*h)..................34 F.h = 1.70! ?.ah = 0.50!(*b)
• IBBox Beam Spreadsheet Analysis Program (Page 1 o f 10)
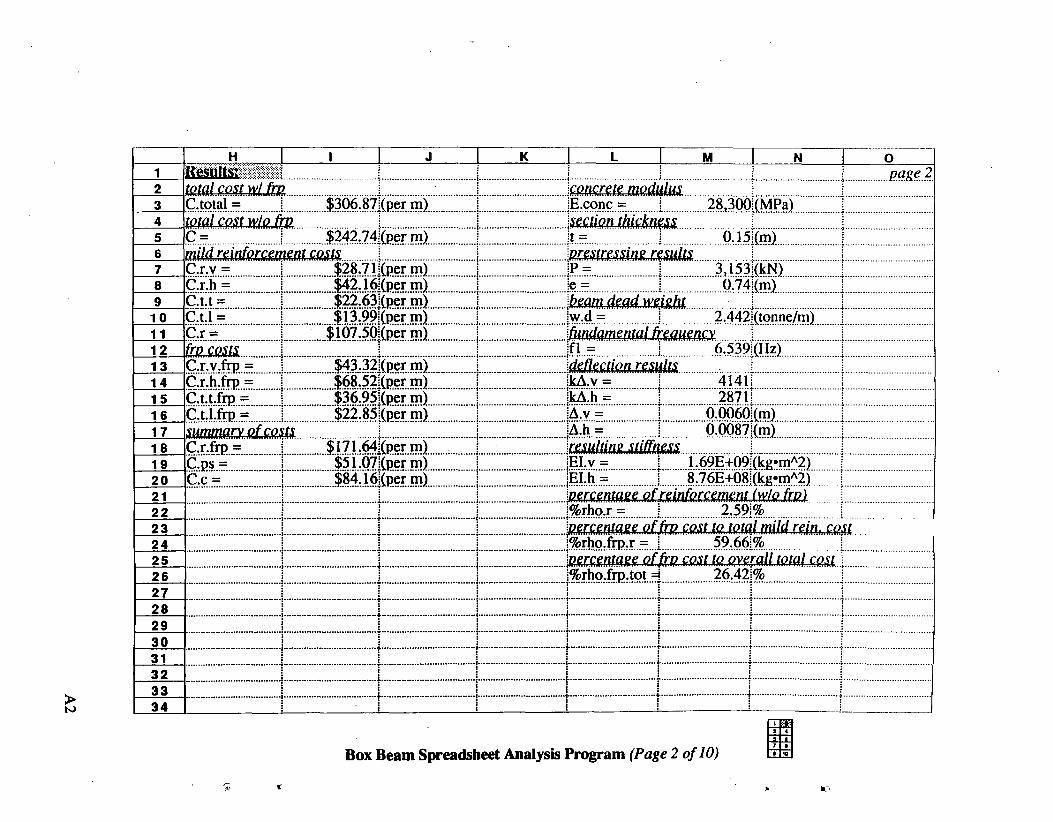
H l J K L M 1 N O1 ..................I..................... ....i..... ....!.........I I I page 22 total cost wl fro i'concrete modulus3 C.total = $306.87l(per m) iE.conc = 28,300i(MPa)4 total cost wlo fro suction thickness5 C = $242.74;(per m) it = i 0 15[(m) ...........!.......................6 mild reinforcement costs7 C r.v = $28.71i(per m)8 C.r.h = $42.16i(per m) !e = 0.74i(mj9 C.t.t =....... $22.63j(per m) \t>eam dead weight10 C.t.l = $13.99i(per m) Iw.d = 2.442i(tonne/m)11 C.r = $107.50i(per m) ifundamental frequency12 frp costs !fi = 6.539i(Hz)13 C.r.v.frp = $43.32i(per m) Reflection results14 C.r.h.frp = $68.52l(per m) ikA.v = 41411 5 !kA.h = 287116 C.t.l.frp = $22.85i(per m) iA.v = 0.6()60l(m)17 summary of costs |A.h = .... Q « 7 i(n i)...... |..18 C.r.frp = $171.64j(per m) .... ...................irm ltm jtiffiim ...... i......... 1..19 $51.07:(per m) iEI.v = 1.69E+09i(kg»mA2)20 C.c = $84.16!(per m) iEI.h =21 percentage of reinforcement (wlo fro)22 ;%rho.r = 2.591%23 Percentage of.fw cost tmotal mild rein, cost24 !%rho.frp.r = 59.66!%25 Percentage of.'Mcast to overall total cost I2627282930 j313233 ..................34 i
Box Beam Spreadsheet Analysis Program (Page 2 o f 10)
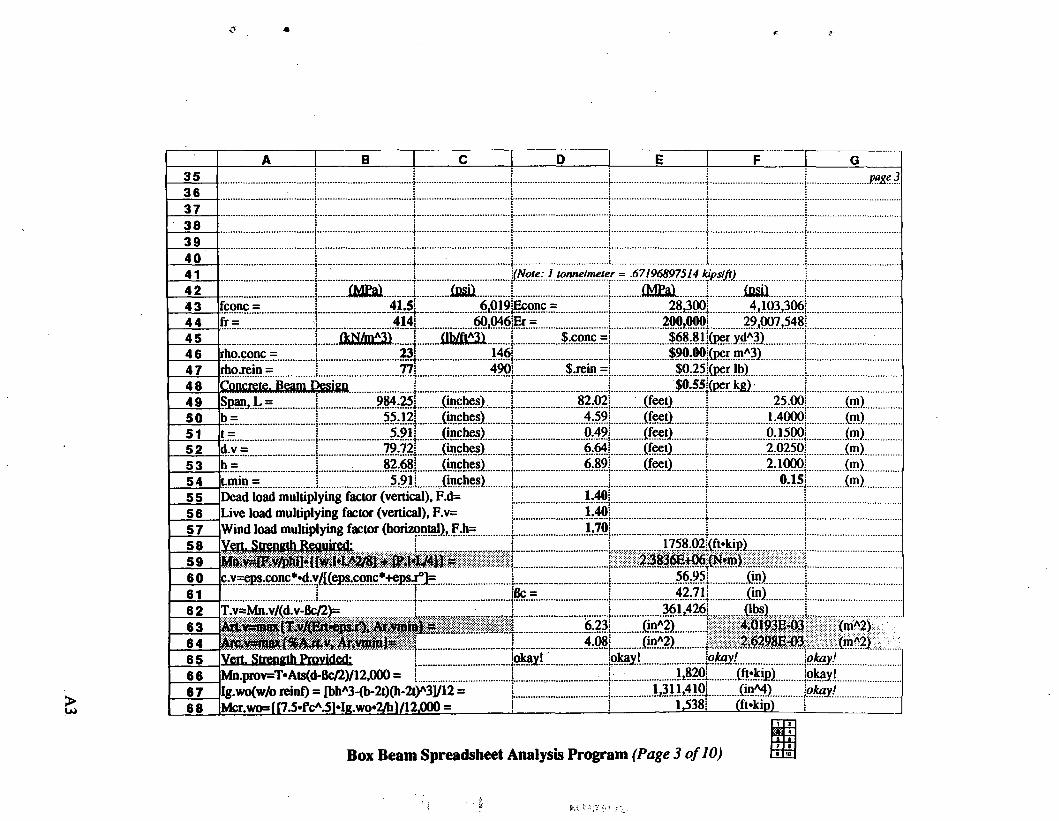
p
>OJ
A B C D E F G35 ......................... j... jpage33637 j
383940 i41 (Note: 1 t o n n e ! m e t e r = . 6 7 1 9 6 8 9 7 5 1 4 kips/ft)42 ! fMPal fosi) (MPal fpsil43 fconc = 41.5 .................6,019 Econc = 28.300 4,103,306!44 fir = 414 60,046 Er = 200,000 29,007,548!45 flcN/mA31l flb/ftA31 $.conc = $68.81 (per vdA3)46 rhoxonc = j 23 146 $90.00 (per mA3) j47 rho.rein = 77 490 $.rein = $0.25 (per lb)48 CwMirtSi Pm $0.55 (perkg);.............|................49 Span. L = 984.25 (inches) 82.02 (feet) 25.00! (m)50 b= 55.12 (inches) 4.59 ........ (fee.0......... 1.4000; (m)51 t= | 5.91 (inches) 0.49 ........ (fee.0........ 0.1500; (m)52 d.v = 79.72 (inches) 6.64 (feet) 2.0250! (m)53 h = 82.68 (inches) 6.89 (feet) 2.1000! (m)54 t.min = 5.91 (inches) 0.15! (m)55 Dead load multiplying factor (vertical), F.d= 1.4056 Live load multiplying factor (vertical), F.v= 1.4057 Wind load multiplying factor (horizi
Vert. Strength Required:58 j i758.02 (ft»kip)59 Mn.wsJF.y/phi]* + [P.l-L/4]) * 2.3836E+06 (N»m)6061 ......... (in).......... 1.............62 T.v=Mn.v/(d.v-Bc/2)=
Artvsnua (T,v/(Ert»eps.r'), Ar.vmn Arc,v»ma*{ %AjLv, Ar.vmin)- Vert. Strength Provided:
63 t) * 5 6.23! (inA2) 4.GJ93E-03 (mA2)64 ! 4.08! (inA2) 2.6298E-03 (mA2)65 okay! okay!66 Mn.prov=T»Ats(d-Bc/2)/12,000 =
Ik.woCw/o reinf) = [bhA3-(b-2t)(h-2l67 ^31/12 = .J ....... 1,311,410 (inM) okay!68 Mcr. wo= f 17.5*fca.5Mk. wo«2/h1/12.000 = 1.538__ (ft*kip)
Box Beam Spreadsheet Analysis Program (Page 3 o f 10)
13

H 1 1 J K L L M N 1 o35 ...................... 1........................ j.........................|........................| .................. | ............ [ page 43637 ' : : : i i 138394041 0.002070 0.002042 eps.conc* = 0.0030!n = Er/Ec — 7.07 jalpha.r = 0.600043 phi = 0.90IB = 0.75 ...... ]eps:r°=.......... 0.00120044 jphi' = 0.85j45 Loadings:46 Ag~bh*(b>2t)(h»2l)~ I488.00.(inA2) 9.60Q0E-01 (mA2)47 Dead Load (Beam Weight),w,d=1 f Ag*iho.conl-KA.cs+A ts+A.csb+A.tsh)(rhp.rein-rho.<x»ric)l/144,C .................... (jdM48 2.441909 (tonne/m) 1,64](kip/ft) 2.3947E+0449 Distributed (vehicle) Vertical Live Load, w.v = 2.00](tonne/m) .......... 1.9613E+0450 Concentrated (vehicle) Vertical Live Load, P.v = O.OOi(tonne) 0.00i(kip) 0.0000E+0051 Distributed (wind) Horizontal Live Load, w.h = 1.50i(tonne/m) i ;pil(kipm).......... j 1.4710E+0452 Concentrated (wind) Horizontal Live Load, P.h = O.OOi(tonne) 0.00|(kip) 0.0000E+0053 Eccentricity (vehicle to beam), e.h = 3.00i(m) 9.84!(ft)54 Distributed Torsional moment, Tn.d = w.h*e.h = 4.50l(tonne) ?:?2|(kjp).............. 4.4130E+0455 Concentrated Torsional Moment, Tn.c = P.h*e.h = 0.00i(tonne«m) 0.00i(kip*ft) 0.0000E+0056 Magnetic motor winding load, w.m = 0.10:(tonne/m) 0.07j(kip/ft) 9.8067E+0257 Md (unfactored) == l(w.d)*(LA2)/8)= 1379.87(fi.'.tip)....... 187G9E+06 (mA2)58 Horiz. Strength Required; ........................................ d.h=b-t/2 = 52.17i(in) i |59 Mn.h lRh/nhH»Hw.w*LA2/81 + lP,w«L/4tt %60 c.h=eps.con*«d.h/r(eps.conc*+eps.r°l= 37.26 .....(I.n)....61 !Bc.h = 27.95 .....(In)..62 T.h=Mnh/(d.h-8c.h/2)= J 503,049 .... (lbs)...63 Artb=max(T,WErt»eps,rHi/bKArtv+Arcy)Ar-J!t»J»b 7 V/ (inA2) 4.8818E433 (mA2)6465
...... ............. | ..........................................j ........................
Horiz. Strength Provided: lokayl okay! j66 Mnh.wov=T.h»Ats.h(d.h-Bc.h/2)/12,000 =67 Ieh.wo(w/b reinf) = rhb^-ni^tKb^ty^vu= 674,024! ...(sdM).68 Mcrh.wo=f f7.5»fcA.5WRh.wo*2/b]/12.000 = 1,186 (ft*kip) j
.L i . T 10
It i
Box Beam Spreadsheet Analysis Program (Page 4 o f 10)
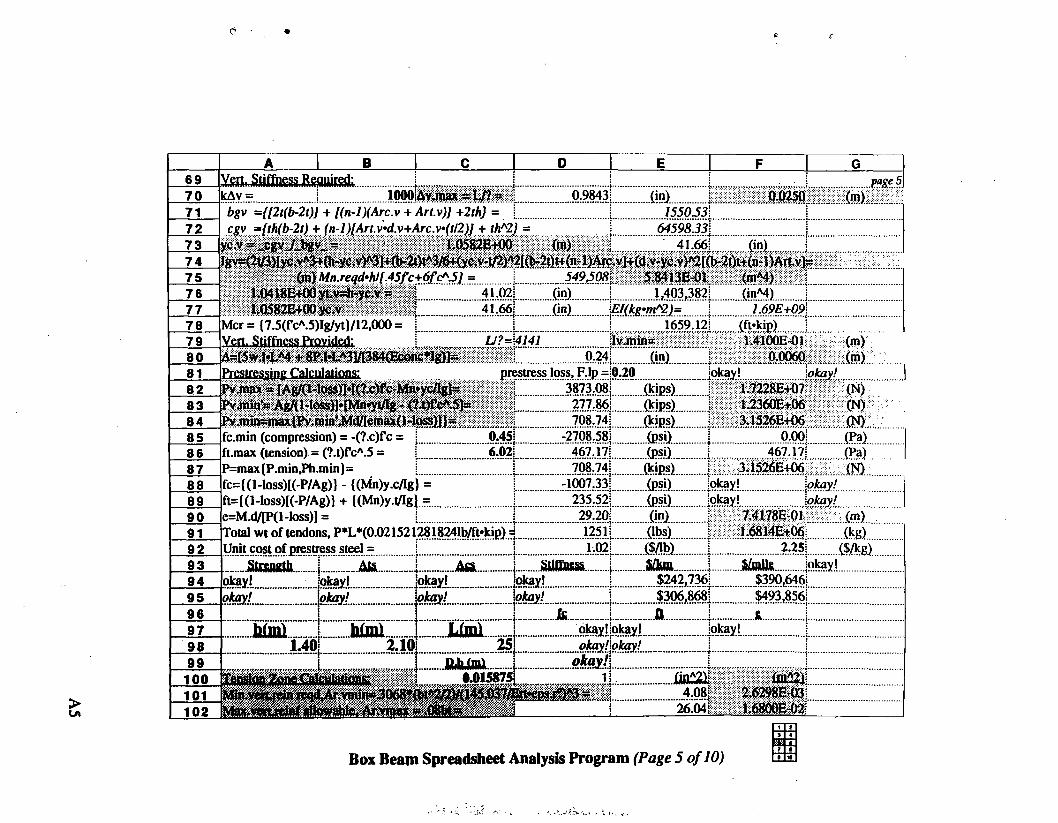
A B c D E F 1 G 169 Vert. Stiffness Required; j ...pa&jl
(m)70 kAv = 1000 A v jtm -l/? - 0.9843! (in) 0.025071 bgv ={[2t(b-2t)] + [(n-l)(Arc.v + Art.v)] +2th} = 1550.5372 cgv ={th(b-2t) + (n-l)[Art.vd.v+Arc.v(t/2)l + /AA2) = 64598.3373 yc.v = cgv J_bgv_ = 1.0582E+00 (TO) 41.66 (in) ...;" i74 ig^(^Myc^3+fli-ye,v)A3]-HV20tA3/6+(yc,y’-V3>A2[(b-2i)t+(n-l}Arc,v]+(4.v-yc,v)A2F(b*20t+(n-l)ATt.vJ75 (to\\ln.reqd»hl(.45fc+6fcA.5l = 549J08’ 5.8413E-01 (mM)76 1.0418E+0Q ytvsh-yc.v ~ 41.02! (*n)... !__ 1,403,382 (inM)77 1.Q582E+00 yc.v .................41,66]........ (in) \E/(kg»mA2)= 1.69E+09S78 Mcr = {7.5(FcA.5)Ig/yt}/12,000 = 1659.12 (ft-kip) i79 Vert. Stiffness Provided: U?=\4141 lv.min= UiboE-oi (m)80 A~t5w*LM ♦ 8P,WA3]/P84(Ec0tte*lg)]~ 0.24! ...(l.n).......... 0.0060 (n»)81 Prestressine Calculations: prestress loss. F.lp =10.20 okav! i okav! 182 Pvjnax a* [Ag/(t-lo$$M{t.c)f<j-Mii*yc/lgl^ 3873.081 (kjps) . .. . 1.7228E+07 (N)83 Pvjnin'js A&K 1 -loss)1»fMn«yt/lg * (?.t)fc\5}=» 277.86! (kips)... 1.2360E+06 (N)84 Pv.n)in=tnax (Pv.min\Md/[emax(l«lass)11= 708.74! (kips)........ 3.1526E+06 (N)„85 fc.min (compression) = -(?.c)fc = ........0-45]... -2708.58! ..(psi)......... 0.00! (Pa)86 ft.max (tension) = (?.t)fcA.5 = 6.021 467.17! ..(psi).... 467.17: (Pa)87 P=max(P.minJPh.min]= 708.74! (kips) 3.1526E+66 (N)88 fc={(l-loss)[(-P/Ag)} - {(Mn)y.c/Ig) = -1007.33! (psi) okay! iokav! 189 ft= f (1 -loss)[(-P/Ag) ] + ((Mn)y.i/Ig) = 235.52! Mi).... okay! okay! : : : :...i90 e=M.d/[P(l-Ioss)l — 29.20] ...(in).......... 7.4178E-01 (m)91 Total wt of tendons. P*L*(0.0215212818241b/ft*kio) 4 1251! (lbs)... 1.6814E+06: (kg) 192 Unit cost of prestress steel = 1.02! ($/!b)......... 2.25...($/kg)93 Strength Ats Acs Stiffness S/km $/mtle iokay!94 okay! okay! okay)...... [okay! 1 $242,736 $390,646!95 okay! okay! okay! \okay! $306,868 $493,856!96
.n . .. j ...ft....i.. ..ft.... ........&........... i................97 bfm) h(m) ... JLimi.. 1... okayljokay! okay!98 1.40 2.10 .............. 25!..... okayllokay!99 D.b tml ] okavll
100101102
1|.j
(inA2)4.08
26.04
fmA2V2.6298E-031.6800E-02
1 t3 4
s x1 •• 11Box Beam Spreadsheet Analysis Program (Page 5 o f 10)
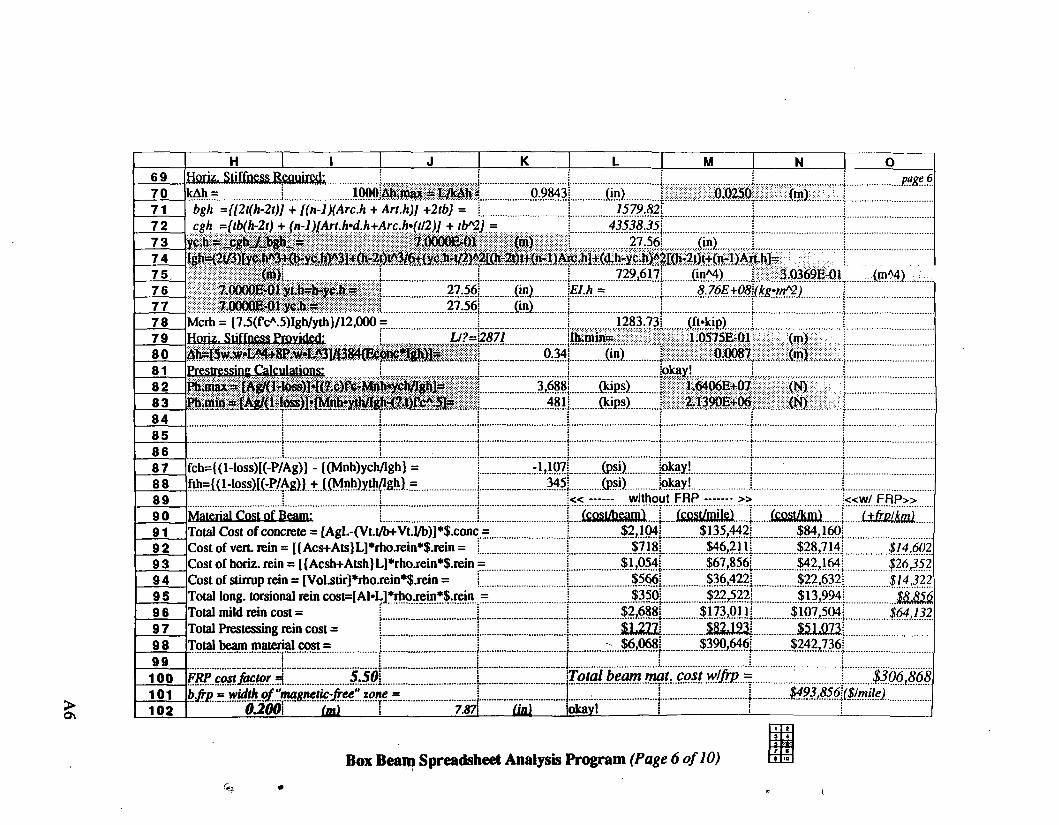
>0\
H 1 J K L M N O69 H a r k S t i f f n e s s R e q u i r e d ; p a g e 6
70 kAh = 10AA Ah.max at L/kAh 3 0.9843 ......... (|n).........!.. 0.0250 (m)71 bgh ={[2l(h-2t)J + [(n-l)(Arc.h + Art.h)] +2tb} = 1579.82172 cgh ={tb(h-2t) + (n-1 )[Art.h‘d.h+Arc.h'(t/2)] + tbA2) = 43538.35\73 yc.h = _cgh_/Jbgb_= 7.000GE-01 {m) 27.561 ...... (in)........ 1....74 Ight={20)ry<?^3^yc4iyv3l+(h-2t)tA3/6WycJi-V2)A2[Ch-2t)tt(n-l)Arc,h]+{d,h-yc.h) 2[(h-2t)t+(n-l)Ait.h]:75 (m) 729,6171 ( i n M ) 3.0369E-01 (mA4)76 7.00Q0E-01 yt.h~b*yc.h - 27.56 .........(ip)....... . EI.h = 8.76E+08:1 k g */wA2)77 7.000QE-01 yc.h =? 27.56 .........M .........78 Mcrh = {7.5(fcA.5)Igh/yih}/12,00079 H o r k S t i f f n e s s P r o v id e d ; U?= 2871 ilh.minn 1.0575E-01 (m)80 Ah=f5w.w«LM+8P.w»LA31/f384(Econc*Ich)l~ 0.34 (in) = 0.0087 (m)81 Prestressine Calculations: I lokay!82 Ph.max * [Agf( 1 -lo$s)H(?,c)fC’Mnb*ycti/Iglt]= 3,688 ....... .ftips)..... ; 1.6406E+07 (N)83 Ph.min = rAft/(l-loss)l»fMith*yth/Igh-(?i}fcA.51* 481 ....... (kips) 2.1390E+06 . (N)84 j8586 i i : i !87 f c h = { ( l - l o s s ) [ ( - P / A g ) } - { ( M n h ) y c h / I g h j = ............. - 1 , 1 0 7 ] (psi) lokay!88 f t h = f ( l - l o s s ) [ ( - P / A g ) } + f ( M n h ) y t h / I g h l = 3 4 5 1 ( p s i ) lokay!89 « --------- w i t h o u t F R P ............. » « w / F R P »
90 M a t e r i a l C o s t o f B e a m : f c o s ^ e a m ) 1 fcost/mM 1 (cost/km) (+frp/kpi)91 T o t a l C o s t o f c o n c r e t e = [ A g L - ( V t . t / b + V t . l / b ) ] " ‘$ . c o n c
C o s t o f v e r t , r e i n = [ { A c s + A t s ) L ] * r h o . r e i n * $ . r e i n =
- :
(•...|31 cs\I[
92 $ 7 1 8 1 $ 4 6 ,2 1 1 1 $ 2 8 , 7 1 4 ! $14,60293 C o s t o f h o r i z . r e i n = [ { A c s h + A t s h ) L ] * r h o . r e i n * $ . r e i n $ 1 , 0 5 4 ] $ 6 7 , 8 5 6 ] $ 4 2 , 1 6 4 ! $26,35294 C o s t o f s t i t n i p r e i n = [ V o l . s t i r ] * r h o . r e i n * $ . r e i n =
T o t a l l o n g , t o r s i o n a l r e i n c o s t = [ A l » L ] * r h o . r e i n * $ . r e i n
i
95 $ 3 5 0 1 $ 2 2 ,5 2 2 1 $ 1 3 , 9 9 4 ! $8 $5696 T o t a l m i l d r e i n c o s t = $ 2 , 6 8 8 ! $ 1 7 3 , 0 1 1 ! $ 1 0 7 , 5 0 4 ! $64,13297 T o t a l P r e s t e s s in g r e i n c o s t = $ 1 , 2 7 7 ! .........m m ..... ..... m m i98 T o t a l b e a m m a t e r i a l c o s t = - $ 6 , 0 6 8 j $ 3 9 0 , 6 4 6 ! $ 2 4 2 , 7 3 6 !
99 ........................ f I I [ ! f100101 b.frp = width of "magnetic-free" zone = : : : : : : : : : :
| $493,856\( Simile)102 0.2001 (m) 7.871 f i n ) l o k a y l !
Box Beam Spreadsheet Analysis Program (Page 6 o f 10)
1 13 4} d tr t• 10
i
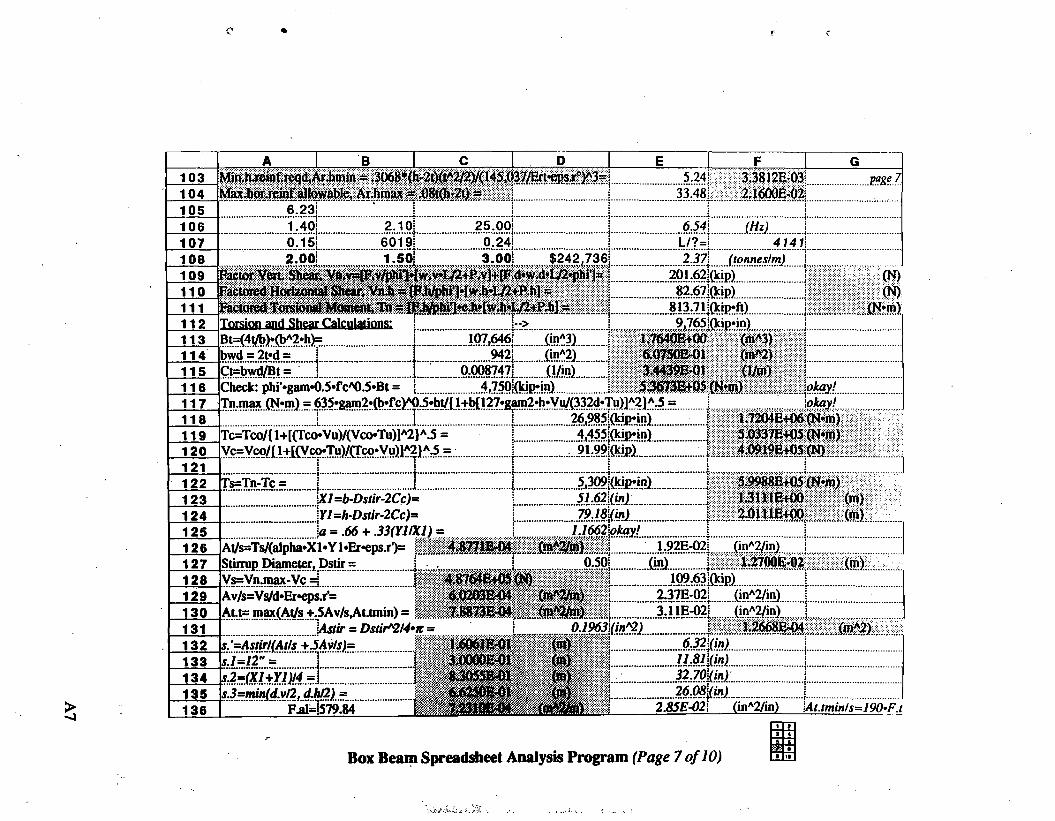
e
>-sj
103104105106
Max.hor.reinf allowable. Ar.hmax a ,0gt(h-2i) ^ 33.48! 2J6O0E-O2:6.2311.401 2.10 25.00 .......................... |.......... .......... 6S4i . .(M .... |0.151 6019 0.24 L/?=i 4 1 4 1 ]2.00! 1 .50 3 .00 $242,736! 2.37I (tonnes! m)
B
107108109110111
121
131
112 Torsion and Shear Calculations;113114
Bt=(M)^2*h)= bwd = 2t*d =
115
107,646942
116117118119120
201.62|(kip) (N)
.............. 82:6?Ift|P)....... I (N)3 JRhfrhil^.h»[w,h»L/2+P.h] - , ............. .813.7l}(kip*ft)...............j..... ...........<Nrm)
--> 9,765j(kip*in)(inA3) 1.7640E+GO <«ttA3)(inA2) 6.073QE-01 (mA2)(i/in) 3,443£E-0J (1/ro)
4,750 (tip*in)............. 5^73B+0$(N»ffi)................ \okay!...............Tn.max (N»m) = 635*gam2*(b*fc)^0.5*ht/{ l+b[127»£am2*h*Vu/(332d*Tu)]A2JA.5 = |okay!
26"98^(W ^y " ’ ’ ......I 1.7204E+06 (N*m)Tc=Tco/{ l+[(Tco»Vu)/(Vco«Tu)]A2}A.5 = .......... 4/t55jdcip«in)............ ] 5.0337E+Q5 (N*m)Vc=Vco/ {1+[(V co*Tu)/(Tco* Vu)lA2] AS = ............. [............... ......................................1......4,09*96+05 <N>...............
Ct=bwd/Bt =Check: phi'*gam»0.5*fcA0.5*Bt =
0.008747
122123124125126127
Ts=Tn-Tc = j I | 5,3(Wi(kip*in)......... j 5.9988E+Q5 (ffan)..........X l= ih D s t ir -2 C c )= [ .......... 51M ( M . ...................J 1,31*18+00 (m)
\Y l= h -D s tir-2 C c )= [ . .................... I........tO lllI+ O O .. (m)|a = .66 + 3 3 (Y 1 !X 1 ) « [........... T m 2 \o k ay ! .................|......................... j..............
At/s=Ts/(alpha*Xl»Y l* E r * e p s ____ 4,&7?*B»04 (mA2/n>V...... ..... 1.92E -62I......(inA2/jn)Stirrup Diameter, Dstir ;= 0.501 M .
128129130
Vs=Vn.max-V c =j Av/s=Vs/d*Er*eps.r'=At.t= max(At/s +.5Av/s,At.tmin) -
132 s.’=Astir /(A i/s + J A v ls )=133 s .l= 1 2 " =134135136
s 3 = (M .+ X W ..= .\...........s 3 = m in(d .vl2, d .h /2) =...... ..........Rai=im84
6.0203E-04 te A2to> 2.37E-02 ___ fin A2/in)......|....... .....7.88736*04 < ro ^ ) , 3.11E432
= j 0.1963\(inA2 )(inA2/in) j
1.2668E04 0»A2)J0 0 6 1 B # (tn) , ................. 6,32 /i» i.....................300006*01 m ! ............... U A L (in).....................
( h L .................../ /g|\ 2 6 0 8 (in )
i t X a i ’ 2.85E^02 (inA2/in) A t.tm in /s=190-F .t
,1*27O0E:02...........(m)
Box Beam Spreadsheet Analysis Program (P age 7 o f 10)a
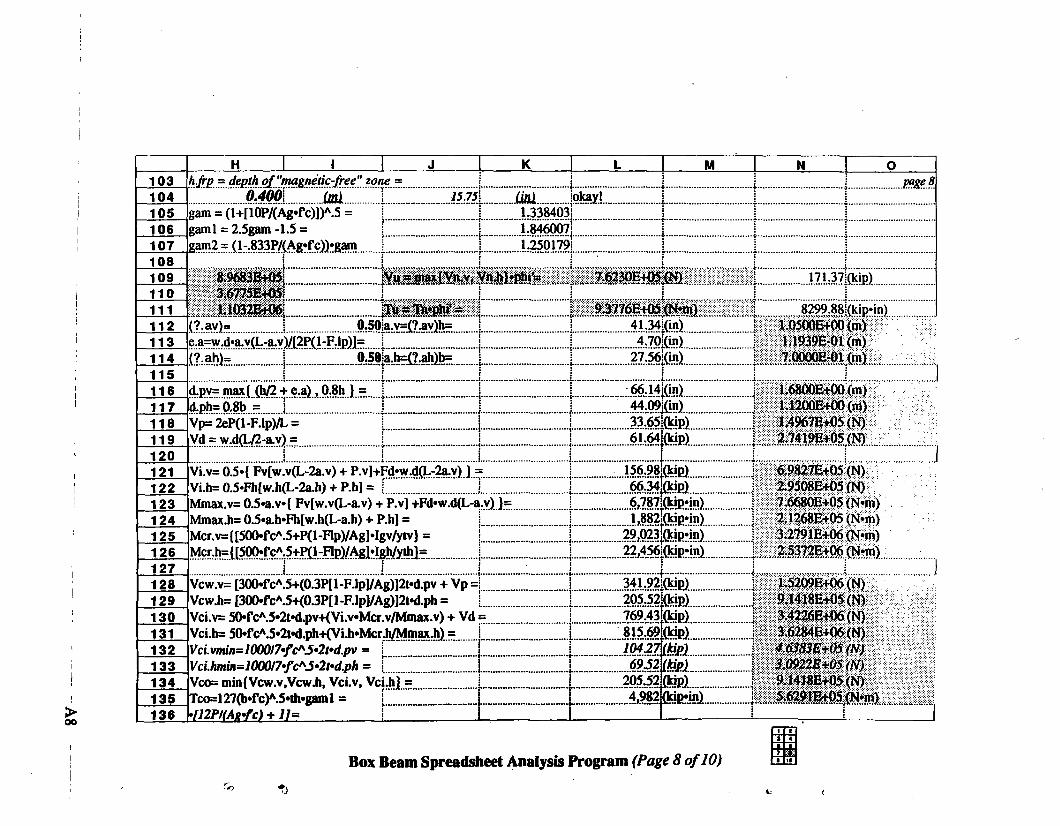
H \ 1 J K L 1 M N O103 h.frp = depth o f "magnetic-free'' zone = ........................ {...... ( page 8104 (in)105 gam = O+ri0P/(A«*fc)l)A.5 = 1.338403 ! j j
106 garni = 2.5Kam -1.5 = 1.846007 ........................1........................|........................ [ .....................107 gam2 = (l-.833P/(Ag»fc))»gam 1.250179108 ...... ; i ....................... : i
110
121
131
113114
3.6775E+05 U032B+06
(?.-.ay)=...........e.a=w.d*a.v(L-a.v
115116117118119120
122123124125126127128129130
132133134135136
Tu * .TYi'phi' - 6.s6ia.v=(?.av)h=
)/L2P(l-Rlp)J=....I............. “ I.... ...........0.s6|a.h=(?.ah)b=....
d.pv= max( (h/2 + e.a) , 0.8h ) =d.ph=0.8b = i.......................Vp=2eP(l-F.lp)/L =yd = w.d(L/2-ay)=....................
9.3776E+05 <N*n») 4i.34[(in) 4.70i(in)
.... ......27;M in)..::
8299.88IQdp*in)
1.1939E-01 (m) 7.Q00QE-01 (m)
66.14i(in)44.69j(|n)33.65i(kjp)61.64l(kjp)
1.6800E+QQ (m) 1.12G0£+00(m) 1.4967E+05 (N) 2.7419E+05(N)
Vi.v= 0.5»{ Fv[w.v(L-2a.v) + P.v]+Fd»w.d(L-2a .v )) =......Vi.h= 0.5*Fh[w.h(L-2a.h) + RhJ = f ...] ....Mmax.v= 0.5*a.v*{ Fv[w.v(L-a.v) + P.v] +Fd*w.d(L-a.v) }= Mmax.h= 0.5»a.h*Fh[w.h(L-a.h) + P.h] =Mcr.v= {[500*fcA.5+P(l-Flp)/Ag]*Igv/ytv) =Mcr.h= {[500«fcA.5+P( 1 -Flp)/Ag] «Igh/y th 1=..........
156.98j.Qdp).66.34jQdp)
Vcw.v= [300»fcA.5+(0.3P[l-F.lp]/Ag)]2t»d.pv + Vp = Vcw.h= [300»fc A.5+{0.3P[ 1 -F.lp]/Ag)]2t»d.ph =Vci.v= 50*fcA.5*2t»d.pv+(Vi.v«Mcr.v/Mmax.v) + Vd = Vci.h= 50*fcA.5*2fd.ph-KVi.h«Mcr.h/Mmax.h) -Vci.vm in=1000l7»fcAJ *2 fd .p v = i......................Vci.hm in=1000i7»fcAJ *2 p d .p h = i......................Vco= min{Vcw.v,VcwJ», Vci.v, Vci.h] =..............Tco=127(b»fc)\5«th»gainl = i f l2 P I(A g * fc ) + 1 1 = ____________ i...........
6,787j(kip»in)l,882i(kip*in)
29.(M3[(kip«inV22.456l(kip»in)
6,9827E+05(N) 2.9508E+05 (N)
] 7.6680E+05 (N*m)] 2.1268E+05 (N*m)
3.2791E+06 (N»m) I 2.5372E+06 (N*m)
4 -341,?2]Qdp)..205.52(kip)769.43|Qdp) 815.69fodp) 704.27\fjdp)
69 S 2 \Qdp)205.52jfldp>4,982|Qdp.in)..
1.52Q9E+06 (N) 9.1418Ef05(N) 3.4226E+06 (N) 3.6284E+06 (N)
4 . $ $ 8 $ E + 0 5 (N )5 . Q922B+05 (N ) 9.1418E+05 (N) 5.6291E+Q5 (N*m)
Box Beam Spreadsheet Analysis Program (P age 8 o f 10)
T)
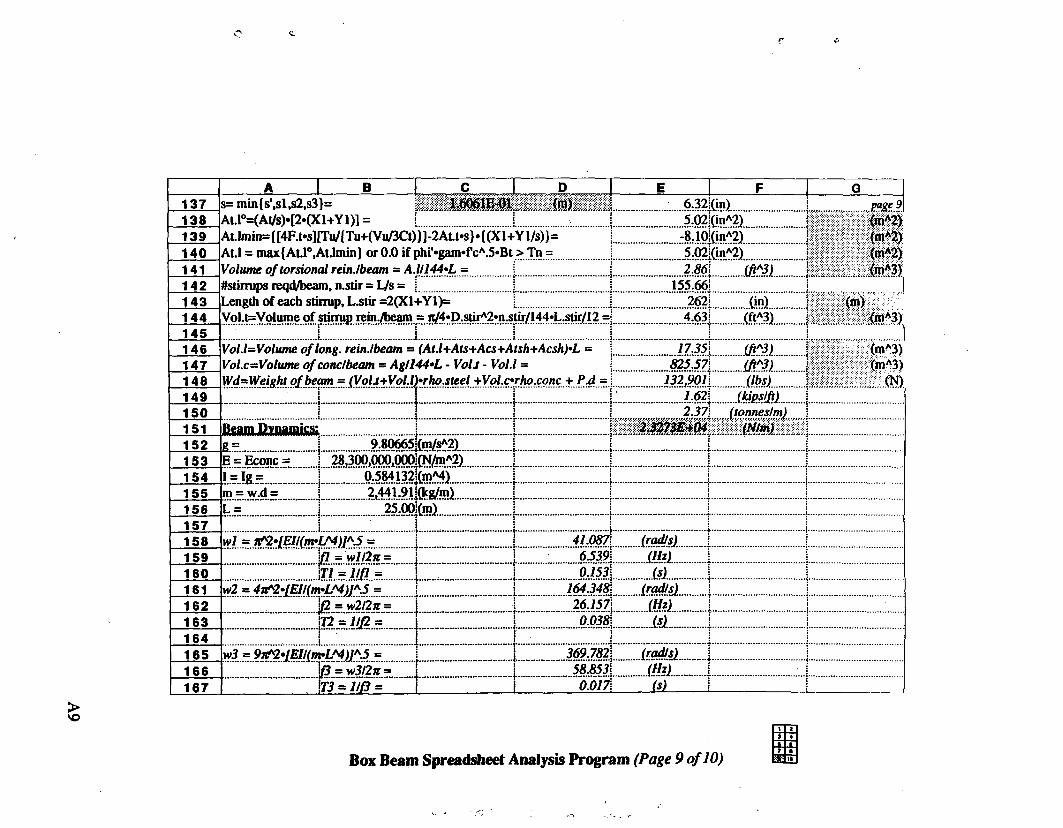
>vo
A I B c 1 D E F G137 s= min{s',sl,s2,s3}= 1.6061B4H (ro) 6.32 .(in) ............. page 9138 At.l°=(At/s)*[2*(Xl+Y 1)1 = j 5.02 (inA2) {mA2)139 At.lm in={[4F.fs][Tu/{Tu+(Vu/3Ct)}]-2Au*s}»{(Xl+Yl/s)} = -8.10X|n.A2)................. (mA2)140 A t.l = m axfAU 0,At.lm in] or 0.0 if phi'*Ram*fcA.5*Bt > Tn = 5.02 (inA2) {mA2)141 Volume o f torsional reinJbeam - A .ll l4 4 *L = 2.86 ........ , m > . ........ (roA3)142 #stimips reqd/beam, n.stir = L/s = 155.66143 Length o f each stirrup, L.stir =2(X1+Y1)= 262 (in)144 Vol.t=Volume o f stirrup rein./beam = n/4*D.stirA2*n.stir/144«L.stir/12 = 4.63 .........,(ftA3)......... (mA3)145 I_________ _ i ................ .... i........ ...... ...........! .......... ... ................ i146 V ol.l=Volum e o f long. reinJbeam = (A t.l+Ats+Acs+Atsh+Acsh)*L = 17.35 ........if ty .) .......... (mA3)147 V ol.c -V o lum e o f conc/beam = Ag/144»L - V ol.t - V o l.l = 8 2 5 3 7 .......... m > ........ (mA3)148 W d -W eig h t o f beam = (Vol.t+Vol.1 •rho.steel +Vol.c*rho.conc + P .d = 132.901 ......... Ubs)......... ................... (N)149 ! ......................... 1.......................... |:..................m . . .......(ttpsJM .......150 2 3 7 (tonnesJm)151 \ 2 3 2 7 3 E + 0 4 M m j
152 K= ! 9.80665 (m/s^) j153 E = Econc = 1 28,300,000,000 fN/mA2)154 I = Ir = 0.584132 ,(mM)................ ].......................... I..........................155 m = w.d = 2,441.91 ftg/m )............... |.......................... I...........................156 L = 25.00157 :1158 w l = i f 2 » lE l l ( m * I f 4 ) l * 5 = j 41.087 ....... irad lj).159 1/7 = w ll2 n = 6.539 ......... am ...160 177 = l l f l = i 0.153 ...........m ...161 w2 = 4rt*2 *[E I/(m -L A4 ) l * J = 1 164.348 ....... (ra4!.?l162 j/2 = w 2/2n = j 26.157 ......... ( M . . .163 1
164 ............... .. .......1........ ............. | :
165 w3 = 9 n « 2 '[E II(m -L 'V )] ''3 =ii 369.782 ....... I r s M
166 \f3 = w 3 l2 n = t 58.853 ......... c m .. .167 Uj ii $ il i_____ 0.017 Is)
3
Box Beam Spreadsheet Analysis Program (Page 9 o/iflj
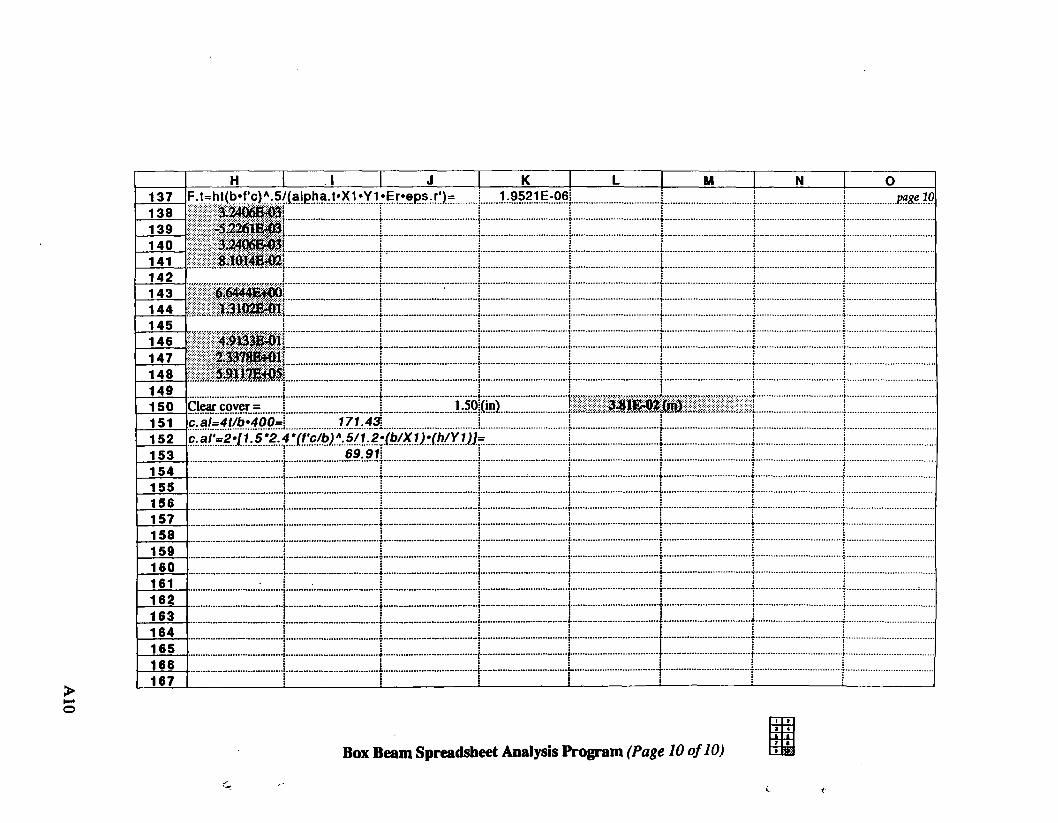
OIV
_____ H_____ 1_____J_____ J K L M N O137 F.t= ht(b*f'c)\5 j
3.2406003-5.2261E033.24060*038.1014002
^(alpha.t*X1*Y1*Er*eps.r')= 1.9521E-06 vase 10138 | i
139140141142 1 i !143 6.6444E+00
1.3102BO1I I I
144145 I !146 4.9133001
2.33780*015.91170+05
I I i
147 : I I148 ! i i149 1 i ....................... 1...................... i......................150 Clear cover = 1 1.50i(in) 1 3*8IEO2{rt0151 c .a l= 4 t /b * 4 0 0 = \ 1 7 f . 4 g ..........................j........................[........................
c. a l '= 2 • [ 1 .5 *2.4 m( f 'c /b ) A. 5 / 1 . 2 - ( b / X i ) * ( h / Y 1)1=152153 69 .9/i154 : j
155 ! j ! !
156157 I j
158j :
159 s j
160 • •
161 I !
162 j |
163 ......................... i.......................... ]........................
164165 | | .......166167 ____________ !______________ I_____________
Box Beam Spreadsheet Analysis Program (P a g e 10 o f 10)A 17 •
t
Appendix B
Hybrid FRP Reinforced Concrete Test Beam Plots
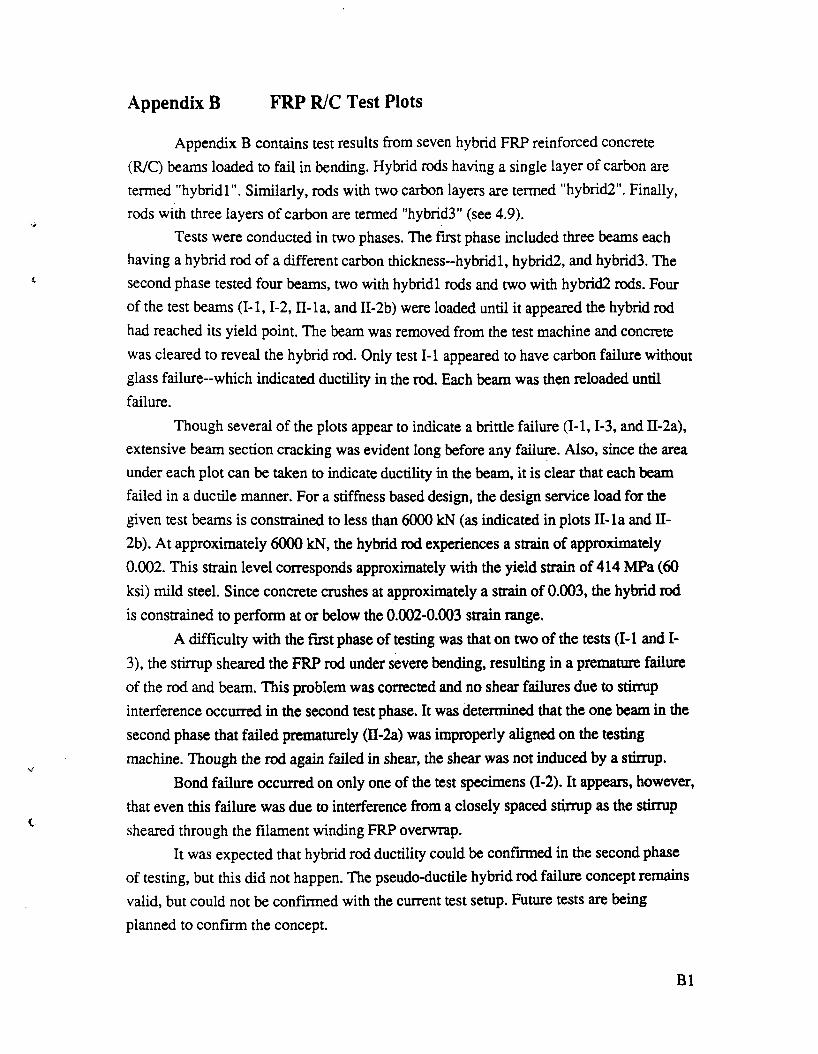
Appendix B FRP R1C Test Plots
Appendix B contains test results from seven hybrid FRP reinforced concrete (R/C) beams loaded to fail in bending. Hybrid rods having a single layer of carbon are termed "hybridl". Similarly, rods with two carbon layers are termed "hybrid2". Finally, rods with three layers of carbon are termed ”hybrid3” (see 4.9).
Tests were conducted in two phases. The Fust phase included three beams each having a hybrid rod of a different carbon thickness-hybrid 1, hybrid2, and hybrid3. The second phase tested four beams, two with hybridl rods and two with hybrid2 rods. Four of the test beams (1-1,1-2, II-la, and II-2b) were loaded until it appeared the hybrid rod had reached its yield point. The beam was removed from the test machine and concrete was cleared to reveal the hybrid rod. Only test 1-1 appeared to have carbon failure without glass failure-which indicated ductility in the rod. Each beam was then reloaded until failure.
Though several of the plots appear to indicate a brittle failure (1-1,1-3, and II-2a), extensive beam section cracking was evident long before any failure. Also, since the area under each plot can be taken to indicate ductility in the beam, it is clear that each beam failed in a ductile manner. For a stiffness based design, the design service load for the given test beams is constrained to less than 6000 kN (as indicated in plots II-la and II- 2b). At approximately 6000 kN, the hybrid rod experiences a strain of approximately 0.002. This strain level corresponds approximately with the yield strain of 414 MPa (60 ksi) mild steel. Since concrete crushes at approximately a strain of 0.003, the hybrid rod is constrained to perform at or below the 0.002-0.003 strain range.
A difficulty with the first phase of testing was that on two of the tests (1-1 and I-3), the stirrup sheared the FRP rod under severe bending, resulting in a premature failure of the rod and beam. This problem was corrected and no shear failures due to stirrup interference occurred in the second test phase. It was determined that the one beam in the second phase that failed prematurely (II-2a) was improperly aligned on the testing machine. Though the rod again failed in shear, the shear was not induced by a stirrup.
Bond failure occurred on only one of the test specimens (1-2). It appears, however, that even this failure was due to interference from a closely spaced stirrup as the stirrup
sheared through the filament winding FRP overwrap.It was expected that hybrid rod ductility could be confirmed in the second phase
of testing, but this did not happen. The pseudo-ductile hybrid rod failure concept remains valid, but could not be confirmed with the current test setup. Future tests are being
planned to confirm the concept.
B1

F R P ro d t e s t - h y b r i d l (1-1)
D is p la c e m e n t (m )
FRP RJC Beam Phase I, Test 1 (hybridl)

Lo
ad
(k
N)
or i
F R P r o d t e s t - -h y b r id 2 (1-2)
D is p la c e m e n t (m )
FRP R/C Beam Phase I, Test 2 (hybrid2)
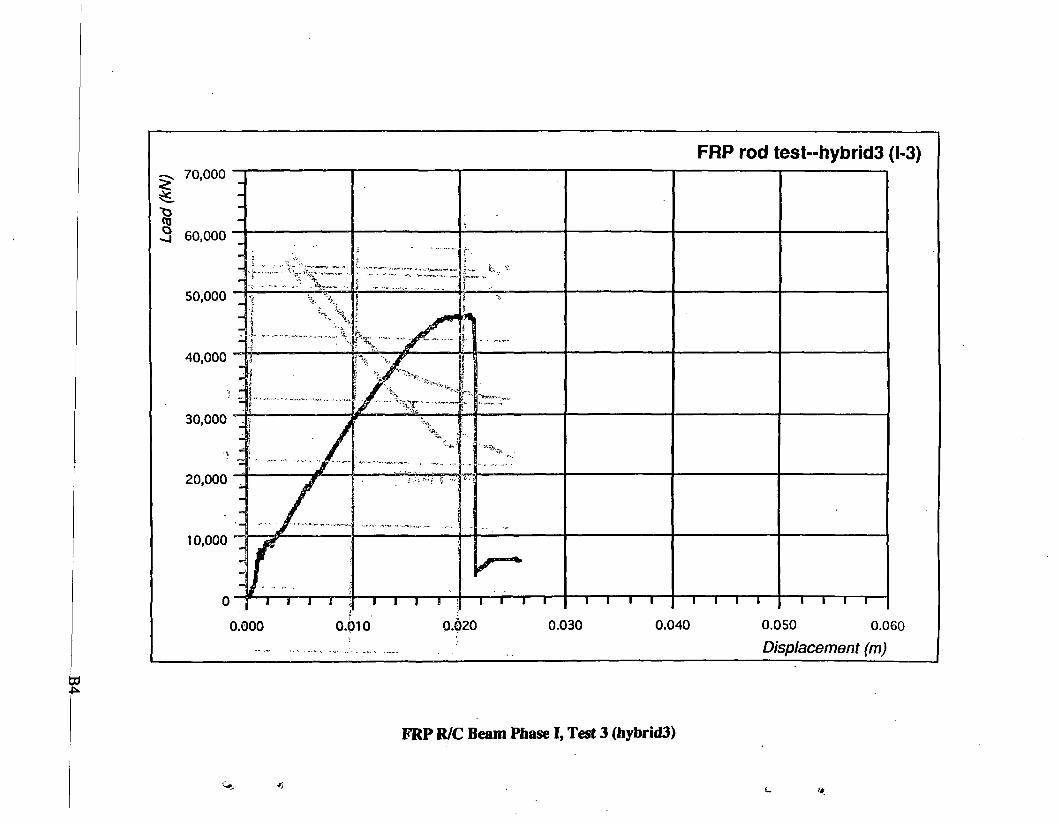
F R P r o d t e s t - -h y b r id 3 (1-3)
D is p la c e m e n t (m )
co
FRP R/C Beam Phase I, Test 3 (hybrid?)
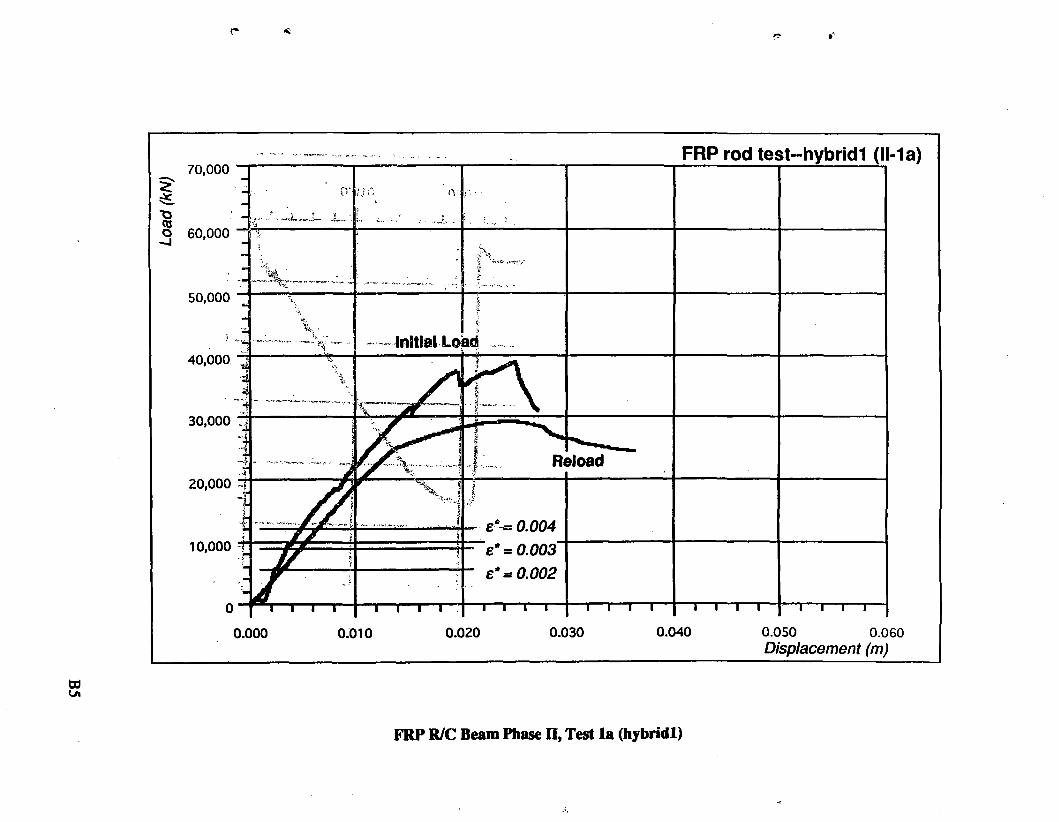
FRP R/C Beam Phase II, Test la (hybridl)
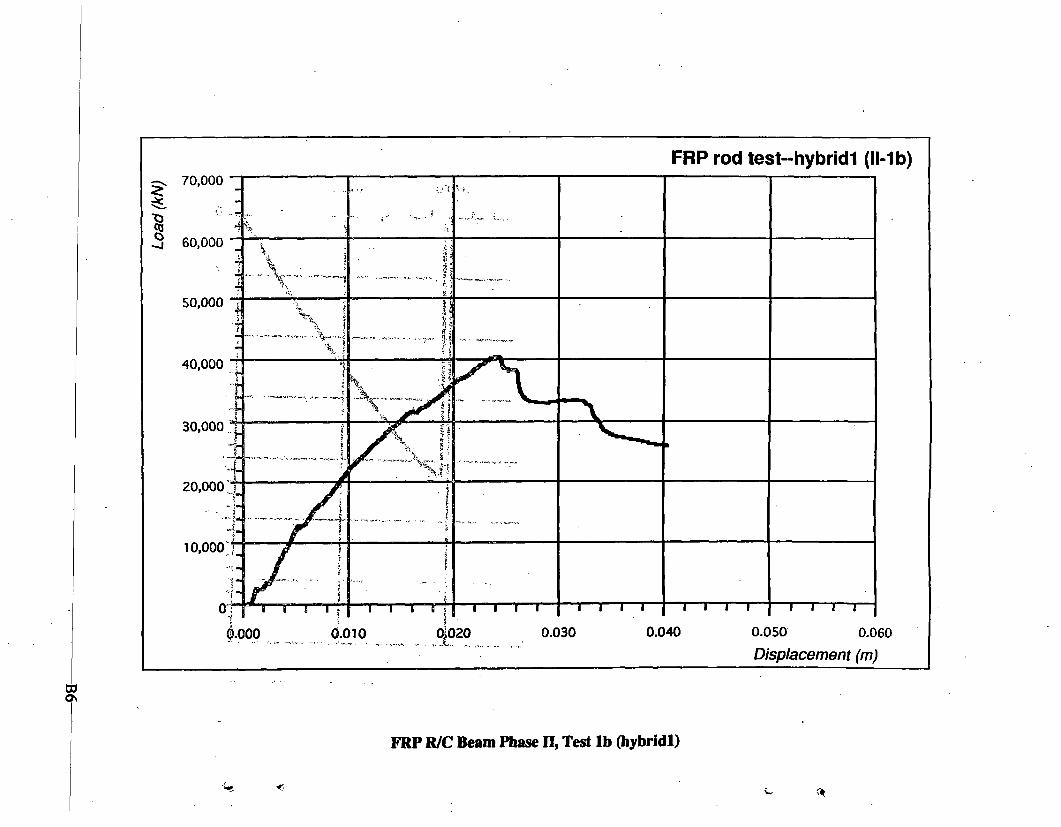
FRP R/C Beam Phase II, Test lb (hybridl)

w-J
FRP R/C Beam Phase n , Test 2a (hybrid2)

Lo
ad
(kN
)F R P ro d t e s t ~ h y b r id 2 (ll-2 b )
D isp lacem ent (m )
FRP R/C Beam Phase II, Test 2b (hybrid2)

PROPERTYitE iE A fe C M & D E V E L O P M E N T
Related Documents