BUREAU OF THE CENSUS STATISTICAL RESEARCH DIVISION REPORT SERIES SRD Research Report Number: CENSUS/SRD/RR-88104 LOW VALUE FACTORS USING AUTOMATED BROKER INTERFACE DATA bY * Elizabeth T. Huang Statistical Research Division Bureau of the Census Room 3128A, F.O.B. %4 Washington, D.C. 20233 U.S.A. This series contains research reports, written by or in cooperation with staff members of the Statistical Research Division, whose content may be of interest to the general statistical research community. The views reflected in these reports are not necessarily those of the Census Bureau nor do they necessarily represent Census Bureau statistical policy or practice. Inquiries may be addressed to the author(s) or the SRD Report Series Coordinator, Statistical Research Division, Bureau of the Census, Washington, D.C. 20233. Recommended by: Nash J. Monsour Report completed: February 1988 Report issued: February 1988

Welcome message from author
This document is posted to help you gain knowledge. Please leave a comment to let me know what you think about it! Share it to your friends and learn new things together.
Transcript
BUREAU OF THE CENSUS STATISTICAL RESEARCH DIVISION REPORT SERIES
SRD Research Report Number: CENSUS/SRD/RR-88104
LOW VALUE FACTORS USING AUTOMATED BROKER INTERFACE DATA
bY
*
Elizabeth T. Huang Statistical Research Division
Bureau of the Census Room 3128A, F.O.B. %4
Washington, D.C. 20233 U.S.A.
This series contains research reports, written by or in cooperation with staff members of the Statistical Research Division, whose content may be of interest to the general statistical research community. The views reflected in these reports are not necessarily those of the Census Bureau nor do they necessarily represent Census Bureau statistical policy or practice. Inquiries may be addressed to the author(s) or the SRD Report Series Coordinator, Statistical Research Division, Bureau of the Census, Washington, D.C. 20233.
Recommended by: Nash J. Monsour
Report completed: February 1988
Report issued: February 1988
Low Value Factors Using Automated Broker Interface Data
I. Introduction
Data for the monthly compilation of the trade statistics are received on
a flow basis from the U.S. Customs. This information is collected from
approximately 15 million documents filed annually by importers and exporters.
The data sources for U.S. import statistics are Customs import documents,
which importers or their agents are required to prepare and to file with
Customs officials at the ports at which the merchandise is entered. On
average about 550,000 of these documents are filed monthly. Customs ports
* throughout the United States transmit documents to the Bureau of the Census
(Jeffersonville, Indiana processing center) on an almost daily basis.
InfoFmal entry documents, prepared for merchandise valued not over the
exemption level of $1000 (except for certain commodities (shoe, textile, etc.)
exempted at $250), are,not transmitted to the Census Bureau. All formal
import documents containing import items valued over $1000 are fully processed
for inclusion in the monthly import statistics. Imports of items not
exceeding exemption levels ($1000 or $250 depending on commodity) in value are
included on the basis of estimates. Estimates of the value of such imports
are made at the country of origin level on the basis of historical
relationships of low-value shipments to total value established from
independent studies. Beside Customs import documents, the magnetic tapes came
from the Customs through the Automated Broker Interface system (ABI), are also
part of the input of the monthly import statistics. (The ABI system allows
automated brokers to submit data directly to Customs.) For export statistics,
the major data source is the Shipper's Export Declaration (SED). The SED is
submitted by exporters to the exporting carrier, and by the exporting carrier
in turn, to Customs offices at the U.S. ports of exportation prior to
2
departure. In the case of shipments by qualified exporters (exporters
satisfying specified census criteria), monthly reports in the form of sumnary
documents, magnetic tapes, etc., are transmitted directly to the Census
Bureau. On the average, approximately 700,000 export documents are
transmitted each month to the Census Bureau. Exports of commodities
individually valued at $1500 and less are exempt from the document filing
requirements, except when such exports are made under export licenses or to
certain countries. Data for shipments valued $1500 and less are estimated,
based on an established percentage of individual country totals.
In this report, we examine the low value shipment estimation procedures .
for imports and exports currently used by the Foreign Trade Division and
explsre other alternatives - using automated data - to estimate the low value
ratios.
activities directly to the Census
(computer tape/computer transmiss
prepare and file Shipper's Export
for submission to U.S. Customs at
In the automated data system there exist records of items valued below
the exemption levels for imports or exports. In the following, the automated
data system for imports and exports is described.
The Automated Reporting Program for Exporting Companies. (Bureau of
Census (1986)). The Census Bureau started this program in 1970. The program
allows exporters (shippers, freight forwarders and exporting carriers) with
the necessary computerized capabilities to report details on their export
Bureau each month v ia electronic means
ion). This relieved exporters of the need to
Declarations (SEDs) with exporting carriers
the time and place of filing the manifest.
The data sent through the automated reporting program have specified form, and
the participating exporter is not required to report items valued under $1001
in the automated reporting program. The percentage of the companies in the
, .'
automated reporting program voluntarily reporting the low value export data is
unknown. There are approximately 66 companies participating in this automated
reporting program.
The Automated Broker Interface (ABI). (Walter and Puzzilla (1987)). ABI
is part of the Customs Service Automated Commercial System (ACS). ACS is a
giant computer telecommunications system linking all aspects of Customs
activities at all ports throughout the United States. ABI provides electronic
processing of import entries for qualified brokers and importers, Large
volume brokers can transmit entry and entry sumnary data to ACS, receive
- priority cargo release and liquidation, and benefit' from statement accounting
on revenue collections. There are ABI brokers at all major U.S. ports and
they'currently account for about one-third of all import transactions filed
with Customs. The Census Bureau began working with Customs to develop a
program to use ABI data for statistical purposes about 4 years ago. In
addition to aiding in the development of the ABI data base, the Census Bureau
staff developed the Census Interface which extracts data from ABI, subjects it
to Census edits and validations and reformats it for processing on Census
computers. This process eliminates the need for paper documents and provides
Census with pre-processed and essentially error-free data. Statistical data
are currently being extracted from ABI via the Census Interface at 28 Customs
ports. The remaining ports are currently testing with Census, and nationwide
implementation is expected about the end of calendar year 1987. At the
present time about 20 percent of all transactions in each month's statistics
are extracted from ABI. Since ABI data contain below exemption level import
items, the ABI data are an alternative source to estimate the import low value
factors if eventually most of the import entries are processed through ABI.
4
In this study, we investigate the feasibility of using automated data as
an alternative to the present estimates of the low value factors in imports or
exports. The underlying assumption in the report is that brokers using the
ABI system report all their imports on ABI, both below and above cutoff. We
review the estimation procedure of the low value import and export factors
used by the Foreign Trade Division in Section II. We provide a description of
the ABI data used in the study and compare the low value factors estimated by
the ABI data with the 1986 import data in Section III. A sumnary of the
results appears in Section IV. Due to the small percentage (20%) of the ABI
data used in the monthly imports, the alternative estimates of the low value w
factors (by country) calculated by using a monthly ABI data are quite
diffgrent from the currently used import low value factors. We conclude that
a further study is needed when a higher percentage of the ABI data are
available in the monthly imports.
II. Low Value Estimation in Merchandise Trade Statistics
The merchandise trade statistics published monthly by the Census Bureau
include estimated data for shipments of commodities valued under a certain
cutoff. The information on U.S. export (import) shipments of commodities
valued over the cutoff is fully compiled. Shipments of commodities valued
under the cutoff will be estimated based on established ratios of such
shipments to individual country totals. The fully compiled and estimated data
will be combined to determine total exports (imports) to individual countries.
1I.A. Current Low Value Estimation Procedure
The current low value estimation procedure used by FTD for exports (or
imports) is as follows. Each individual country's previous month export
(import) total (above the cutoff) is multiplied by an established ratio (the
5
so-called low value factor) to estimate the individual country's current month
low value exports (imports). There are approximately 160 countries. The low
value export factors were historically derived by dividing each country's
total value of export items below a certain cutoff by the country's total
value of export items above the cutoff. Given the above, the current month
low value estimate is really the previous month low value estimate. The low
value export (import) estimation began in January 1978 (August 1982) for
export (import) statistics. The low value export (import) factors were
updated every other year or when the cutoff was raised.
We'll describe the formation of the initial low value factor and the
* updated low value factor for an individual country for exports (imports).
Let aTo, [O,C] be the total value of export documents with items valued less
than or equal to the cutoff C at starting time 0.
Let To , c+ be the total value of export documents with items valued above the
cutoff C at starting time 0.
Let To, (C, 2C] be the
greater than C and
The initial low va 1
defined by
Fo, L = To, I% Cl
total value of export documents with items valued
less than or equal to 2C at starting time 0.
ue factor denoted by F. , L at starting time 0 is
’ To, c+ (2.1)
The initial same increment low value factor denoted by Fo, u at time 0 is
defined by
Fo, u - To, (C, 2C] ' To, c+ (2.2)
The individual country's total value of exports with items valued below
the cutoff C for month i (i > 0) is estimated by
; j, [O, C] = Ti-l, C+ ' FO, L (2.3)
6
where Ti-1 C+ f
is the i-l month individual country total value
with items valued above the cutoff C.
of exports
In (2.3), it is assumed that F. L is constant over months with ,
and T. l-1, Ct = Ti, Ct. If the latter is not assumed, Ti, ct should
in a period
be used in
(2.3) instead of T-i-1, Ct.
The initial low value factor F. L , for exports used by the Foreign Trade
Division (FTD) was calculated using 3 months data (March, June, and September)
of 1977, when all values of export shipments were required to report on the
export document - Shipper's Export Declaration (SED) form. In January 1978,
the export exemption level was set at $500, i.e., the value of export item . under $501 was not required to be reported on the SEDs. The initial low value
factac F. L was updated every other year or when C was raised. ,
The exemption
level C was usually raised because of budget reasons or legal requirements,
II.A.l. Exemption Level Unchanged Through Years
The low value factor is updated every other year. The low value factor
Ft. L is updated at time t using the old factors Ft-l L, Ft-1 u from the 9 , ,
previous time t-l when the exemption level, C, is the same at time t-l and t,
i.e.,
Ft,L = Q-l,L x (%,U ’ Q-1,U) (2.4)
where -7-W-r
Q-l,L - b-1, [O,C] ’ Q-1, c+
Q-1 ,u = h-1, (C,2C] ’ b-1, c+
Ft,u = Tt, (C,2C] ' Tt, c+ '
Ttml, [o,cl is the individual country's total value of export (import)
documents with items valued less than or equal to the cutoff C at time t-l.
Tt, (c,2c] is the individual country's total value of export (import)
documents with items valued greater than C and less than or equal to 2C at
time t, Tt, ct is the individual country's total exports with items valued
above C at time t. It can be shown algebraically that
Ft,L = FO,L x (Ft,u ' Fo,u)*
That is, the new low value factor at time t is the initial low value factor,
F. L, multiplied by the ratio which represents the change between time t and ,
time 0 of the same increment (C,2C] "low value factors" (FL,(s). It is assumed
that the change of FL's between time t and time 0 is the same as the change of
Fu's between time t and time 0. (Recall that export (import) items valued in
. the range C to 2C are fully reported in both times 0 and t).
II.A.2. Exemption Level Raised
*When the exemption level is raised from C to C2 at time i (C2 > C), the low
value factor at time i-l, Fi-1 L, is retained as an estimate of the ratio of low ,
value with items valued under C exports (imports) to the country total exports
(imports) with items valued above C2. Estimation of the part from C to C2 was
constructed by using the ratio of the total value of exports (imports) with items
valued between C and C2, Ti-1, (C,C,], to the individual country's export
(import) total for items valued above C2, Ti-1, c2t, using data at time i-l. The
resulting low value factors for exports (imports) in value category 0 to C2 is
then
Fi,L = Fi-l,L + (Ti-l, (C,C,] / Ti-l, C2t) (2.5)
The old factor Fi-1,L is assumed to estimate the ratio (Ti-1 [O C] / , ,
Ti-1,C2+), while it actually is the estimate of the ratio (Ti-1 [O C] / , 3
Ti-l, Ct)* From the data available at time i, we can not estimate the ratios,
(Ti-1, [o,c] 1 Ti-1, c2+) or (Ti-1, [o,c] / Ti-1, c+), because no data were
8
reported below C at time i-l. Since Ti-1 c+ > Ti-1, c2+ implies (Ti-1 lo C] / s , 9
Ti-l, C+) ’ (Ti-l, [O,C] ’ Ti-l, C2+) 9 Fi-1,L most likely underestimates the
ratio (Ti-1, co,cl / Ti-1, c2+)-
An alternative method to estimate the total exports (imports) with items
valued below C2 is as follows. We first apply (T. l-l, (C,C2]‘Ti-1,C2+) to Ti, C2t
(to estimate the total exports (imports) of items valued from C to C,), add this
to T. 1,cy
and then apply the result to Fi-1 L to estimate the total exports
(imports) of items valued from 0 to C. Henc;,
. Fi
, L = Yi
, (o,C21’Ti J2 +
where
; i, (C,C,] = (Ti-l, (C, C2]'Ti-1, Cz+) ' Ti, C2+
7 L (0, C21 =; i, (C, C2] + lTi, (C, C2] + Ti, C2t1 ' Fi-l, L
By using equation (2.5), it can be shown that
‘i L = Fi , L + Fi-l,L (T , i-l , (C C J’Ti-l ’ 2 C t) ’ 2
=F i-1 , L + (l + Fi-l L , )(Ti-l, (C C ]'Ti-1,C2t) ’ 2
(2.5a)
(2.5b)
Hence F, L 2 Fi L . , *
In the alternative procedure, we assumed TiDl , (C C ]‘Ti-l ’ 2 ’ 2+ C 3 Ti, (C C 1' ’ 2
Ti , C2t' and Fi-l, L is constant over time. The alternative low value factor
in (2.5a) is calculated using data in time i-l (before the exemption level was
raised) and time i (during or after the exemption level was raised).
9
In January 1985, the exemption level for exports was raised from $500 to
$1,000, the export low value factors were updated using 3 months data (March,
June, and August) of 1984. In January 1987, the export exemption 1 eve1 was
raised from $1,000 to $1,500, the export low value factors were updated using
3 months data (March, June and August) of 1986.
1I.B. Import Low Value Estimation
Estimation of total low valued imports, those valued under $251, began in
August 1982. The low value factors were established by observation of the
percentage relationships of the under $251 import transactions to total
imports in past periods by country. Prior to August 1982, estimates were
based on a l-percent sample of documents valued under $251. In January 1985,
Customs raised the import exemption level from $250 to $1,000 for some
commodities, while specified commodities (e.g., textiles and footwear)
remained at the $250 exemption level. To accomodate this change, two low
value factors were derived using 1984 data (March, June and September). The
first low value factor Fi L was designed to estimate the total value of import ,
items valued under $250 (there was no data available for the value class under
$250 in 1984), the second low value factor Fi L was designed to estimate the ,
total value of import items valued between $251 and $1,000. The two factors
were calculated as follows:
Let Cl - $250, 2Cl = $500, C2 - $1,000
Fi,L = To, (C,, 2CI] ' (To, cl+ - T;I, (C,, C2])
Fi,L = T& (C,, C2] ' T& c2+
= Td, (Cl, C2] ' 'Td, cl+ - Ti, (Cl, C2])
(2.6)
(2.7)
where
To, (C1'2C11 is a country total value of all shipments of
commodities valued greater than Cl and less than or equal to 2CI at
time 0,
To c + is a country total value of all shipments of commodities ’ 1 valued above C1 at time 0,
TL V,,C,l is a country total value of shipments of corrrnodities
with an exemption level of C3 and valued greater than Cl and
less than or equal to C2 at time 0,
T' 0, 9
is a country total value of shipments of commodities with an
. exemption level of C3 and valued above C2 at time 0.
Note that at time 0 (1984), the import exemption level is C1 ($250). In
JanuRry 1985, some coMiiodities had import exemption level C1 and others had
C2*
Note also in FiyL, it is assumed that
To, [O, Cl] ’ (To, cl+ - Ti, (C,,C,]) = To, (Cl’ 2q1 ’
(To, cp - TL (Cl’ 2 c ]). Since no data were available below Cl, the next
comparable increment of data was used instead to estimate the low value
imports for items valued below C1.
The individual country's total imports for items valued below C1 for
month i (February 1985 and later) is estimated by
i i, [0, C1] p Fi,L ' Ti-l, Cl+ l
(2.8)
The individual country's total imports for items valued between C1 and C2
with exemption level C2 for month i (February 1985 and later) is
;I i, (C,, C2] = Fi,L ' T;-l, C2+ l
(2.9)
11
The estimate of the individual country's total imports for items valued
under Cl ($251) and items valued from Cl to C2 with exemption level C2
($1,000) is the sum of ? i, [O, Cl] and T;, (C,, C2]'
Note that in (2.8) and (2.9), it is assumed that F;) L and Fi L are ,
constant over months within a given time period, and T i-l, Cl+ =;
(-1 c + = T;
i, Cl+ and
’ 2 ,5+ ' Without the latter assumptions, Ti, c
1+ should be used
in (2.8); and Ti , c + should be used in (2.9). 2
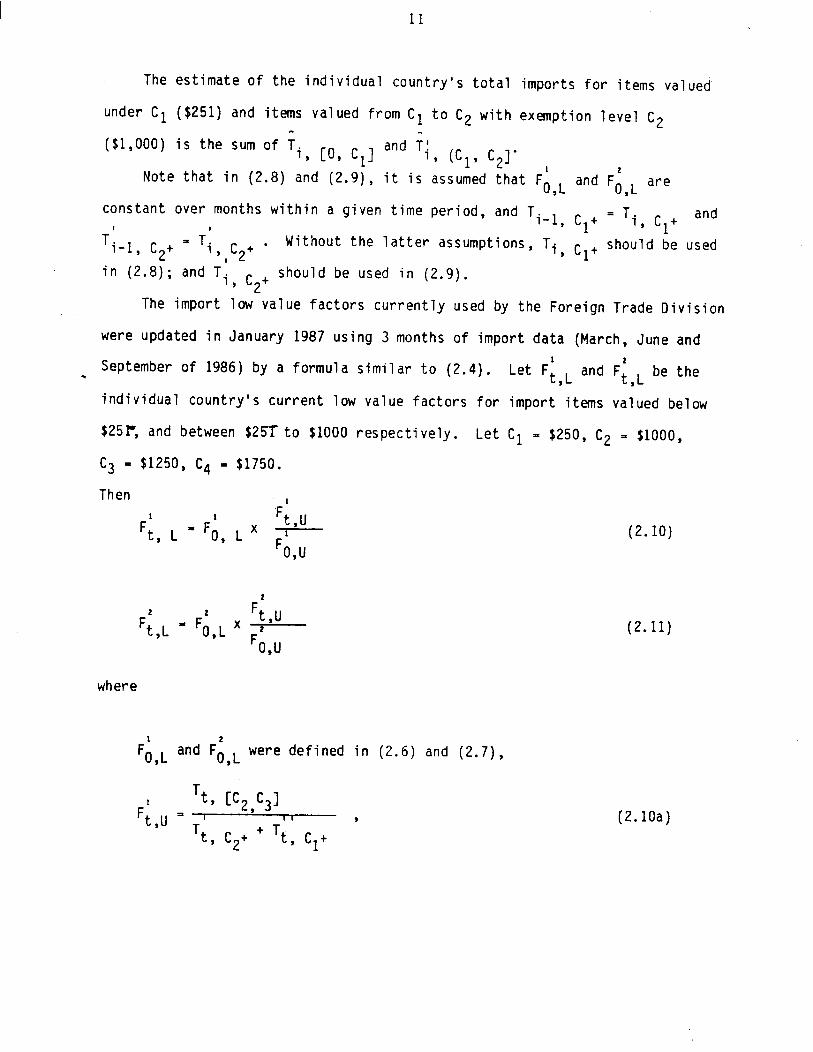
The import low value factors currently used by the Foreign Trade Division
were updated in January 1987 using 3 months of import data (March, June and
1
. September of 1986) by a formula similar to (2.4). Let Ft L and Fi L be the , ,
individual country's current low value factors for import items valued below
$25P, and between $2!Xto $1000 respectively. Let Cl - $250, C2 = $1000,
C3 - $1250, C4 = $1750.
Then I 1 I
Ft, L ‘Ft ,u
IFO,LX l Fo,u
2
2 2
Ft,L Ft,U
- Fo,L x 2 Fo,u
where
1
Fo,L and Fi L were defined in (2.6) and (2.7),
Y
1 TL cc, c31 Ft,U p ’
, I , ,
Tt, c2+ + Tt, cl+
(2.10)
(2.11)
(2.10a)
12
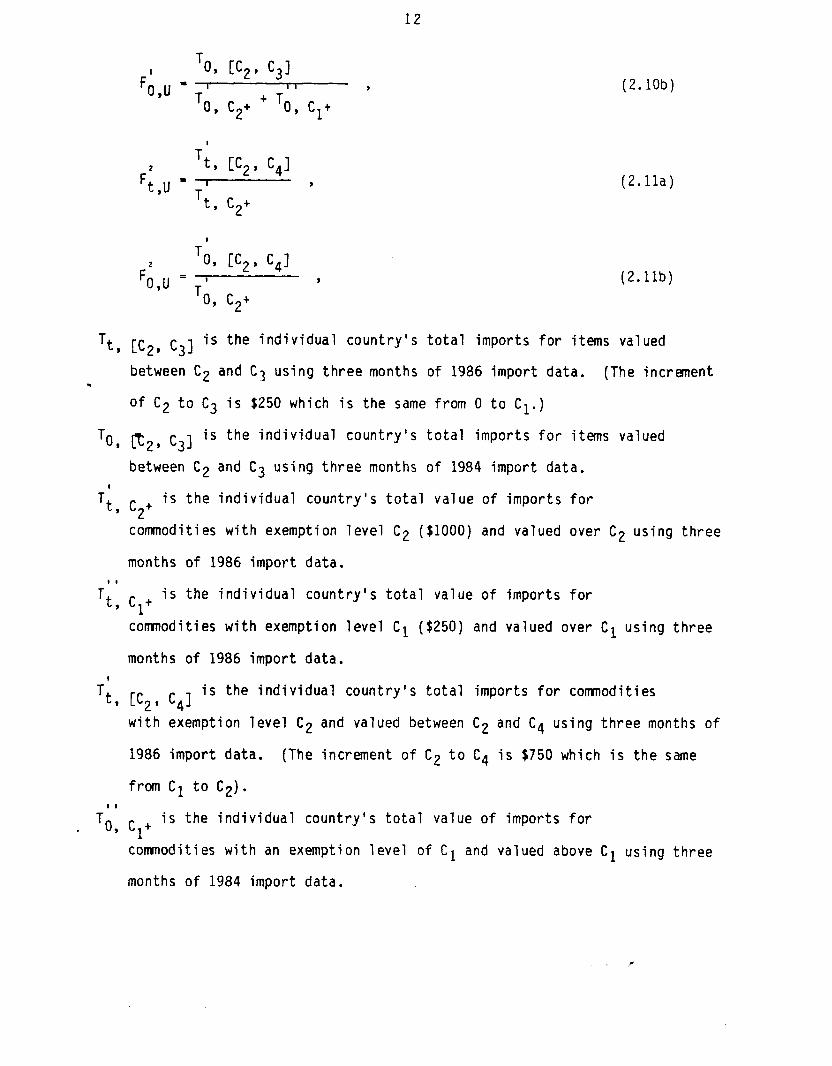
I ToY cc,, c31 Fo,u - T’ I I
’ 0, c2+ + To, cl+
2
Ft,U T;Y cc,, c41
-7, Tt, c2+
2 Tk cc,, c41 Fo,u = ’ Y
To, c2+
(2.10b)
(2. lla)
(2. llb)
TL K,’ c33 is the individual country's total imports for items valued
between C2 and C.3 using three months of 1986 import data. (The increment w
of C2 to C3 is $250 which is the same from 0 to Cl.)
ToY l5’ c31 is the individual country's total imports for items valued
between C2 and C3 using three months of 1984 import data. I
Tt, c2+ is the individual country's total value of imports for
commodities with exemption level C2 ($1000) and valued over C2 using three
months of 1986 import data.
TL' c + is the individual country's total value of imports for ’ 1 corrmodities with exemption level Cl ($250) and valued over Cl using three
months of 1986 import data.
Tk cc,, c41 is the individual country's total imports for coarnodities
with exemption level C2 and valued between C2 and C4 using three months of
1986 import data. (The increment of C2 to C4 is $750 which is the same
from Cl to C2). I I
. To, cl+ is the individual country's total value of imports for
commodities with an exemption level of Cl and valued above Cl using three
months of 1984 import data.
13
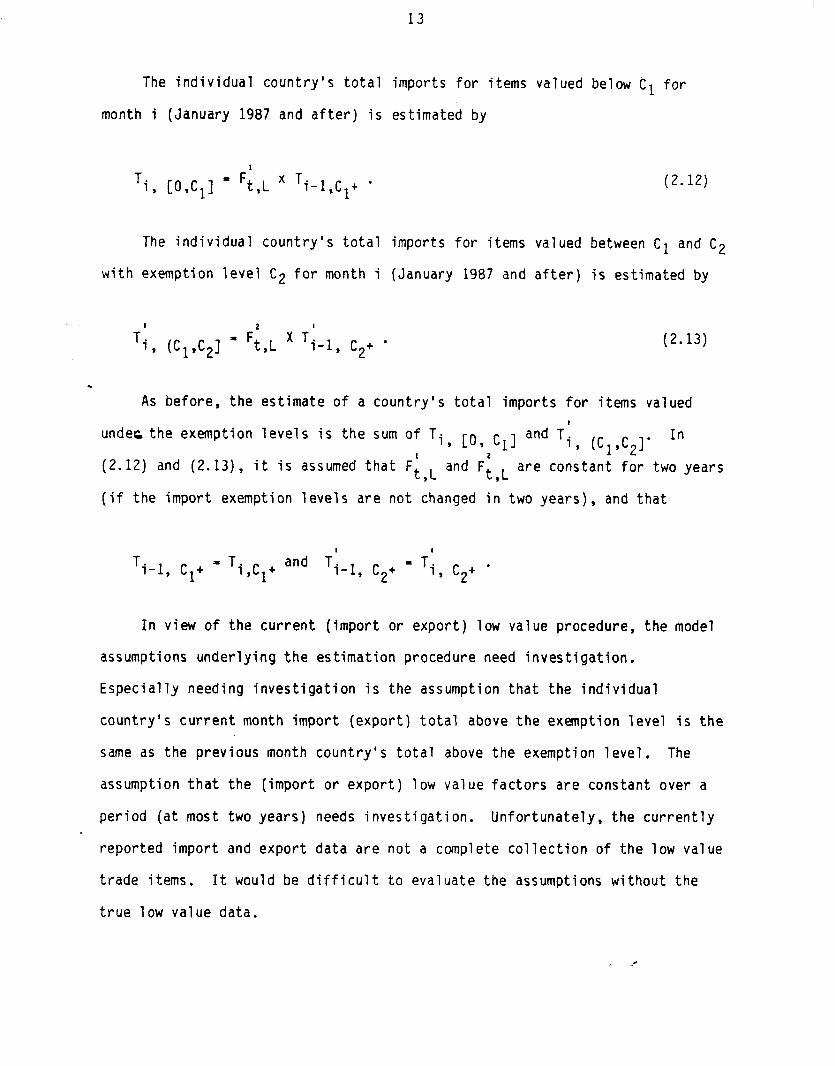
The individual country's total imports for items valued below C, for
month i (January 1987 and after) is estimated by
(2.12)
The individual country's total imports for items valued between Cl and C2
with exemption level C2 for month i (January 1987 and after) is estimated by
2
T1, (C,,C,] - Ft,L x TI-I, c2+ l
(2.13)
t
As before, the estimate of a country's total imports for items valued
under the exemption levels is the sum of Ti Y PL Cl1 and c, (C,,C,]' In (2.12) and (2.13)' it is assumed that F; L and Fi L are constant for two years
(if the import exemption levels are not ihanged il two years), and that
T i-l, Cl+ -T i c + and ’ 1 Tie1 c + = Ti
'2 Y 9 l
In view of the current (import or export) low value procedure, the model
assumptions underlying the estimation procedure need investigation.
Especially needing investigation is the assumption that the individual
country's current month import (export) total above the exemption level is the
same as the previous month country's total above the exemption level, The
assumption that the (import or export) low value factors are constant over a
period (at most two years) needs investigation. Unfortunately, the currently
reported import and export data are not a complete collection of the low value
trade items. It would be difficult to evaluate the assumptions without the
true low value data.
III. Import Low Value Factors Using ABI Data
The import data in the Automated Broker Interface (MI) System collected
by the Customs Service represent all of the import items (including items
below exemption levels) reported by the large brokers only. We are interested
in the true low value import factors by country in the ABI data which are a
subset of the monthly import data. We compare the low value factors
calculated using ABI data with the currently used import low value factors in
this report.
1II.A. Data
The data for the study were collected from June 29 to July 24, 1987 by
the U.S. Customs Service using an Automated Broker Interface (ABI) system,
therefore, it does not correspond to a given calendar month of data.
Four tapes of the statistical import data, and one tape of the "dropped
import data" were obtained from the Foreign Trade Division. The statistical
import data are the regular import data used in the monthly import tabulation
which includes items with import value over the $1000 exemption level for
general commodities and over the $250 exemption level for a special group of
commodities (e.g., textile, shoes etc.). The dropped import data are not for
regular monthly tabulation. This data set includes items with import value
below exemption levels. This is of interest to us because it allows for the
computation of low value factors for the Automated Broker Interface data. The
ABI data are a special subset of the total import universe in the given time
period.
The total records of the statistical import data files and the dropped
import data file are 321,975 and 152,878 respectively. (The monthly
statistical ABI records are approximately 18% - 20% of the total U.S.
statistical import data.) The dropped import data are edited to obtain the
The combined total records were then edited so that the country code 1000
(U.S.A.) and fiscal year '86 in the customs warehouse entry code were deleted
from the study. The resulting total number of records in the study is
464,868; of which 30.5% came in through vessal, and 69.5% came in through w
'other' transportation modes; all of the records have June as the survey
montll; while for the month of entry, 48.8% fell in June, 1987, 49.9% fell in
July, 1987 and the rest, 1.3X, fell over the previous months; 19.2% of the
records had va lue less than or equal to $250, 26.2% had value less than or
equal to $500; and 34% had value less than or equal to $1000; 40.3% had value
less than or equal to $1500; 44.5% had value less than or equal to $2000.
(The import value for those items valued less than $250 is 0.1% of total
imports; 0.7% for items valued less than $1000; 1.1% for items valued less
than $1500; 1.6% for items valued less than $2000.) On a record basis by
country, 40.8% of the records are from Canada, 4.5% from Mexico, 3.5% from the
United Kingdom, 2.1% from France, 4.7% from the Federal Republic of Germany,
1.2% from Switzerland, 5.6% from Italy, 1.3% from Singapore, 1.4% from
Mainland China, 3.5% from the Republic of Korea, 4.3% from Hong Kong,7.7% from
Taiwan, 8.6% from Japan, and less than 10.8% for the total of the rest of the
countries. There are 145 countries in all. The total import value of ABI
data set is $7,215,618,146. The total low value imports (for items valued
below $250 for special corrrnodities and below $1000 for other commodities) of
statistical low value data. In the edited stage, the nonstatistical records
with 1st digit TSUSA code of 8 or 9 (except TSUSA code 8000035 - returned
American goods) or import value over $1000 were deleted from our study. The
total records of the combined files are 465,614. The number of records in the
edited dropped import data is 143,639, about 30.8% of the total records
(465,614) in the study.
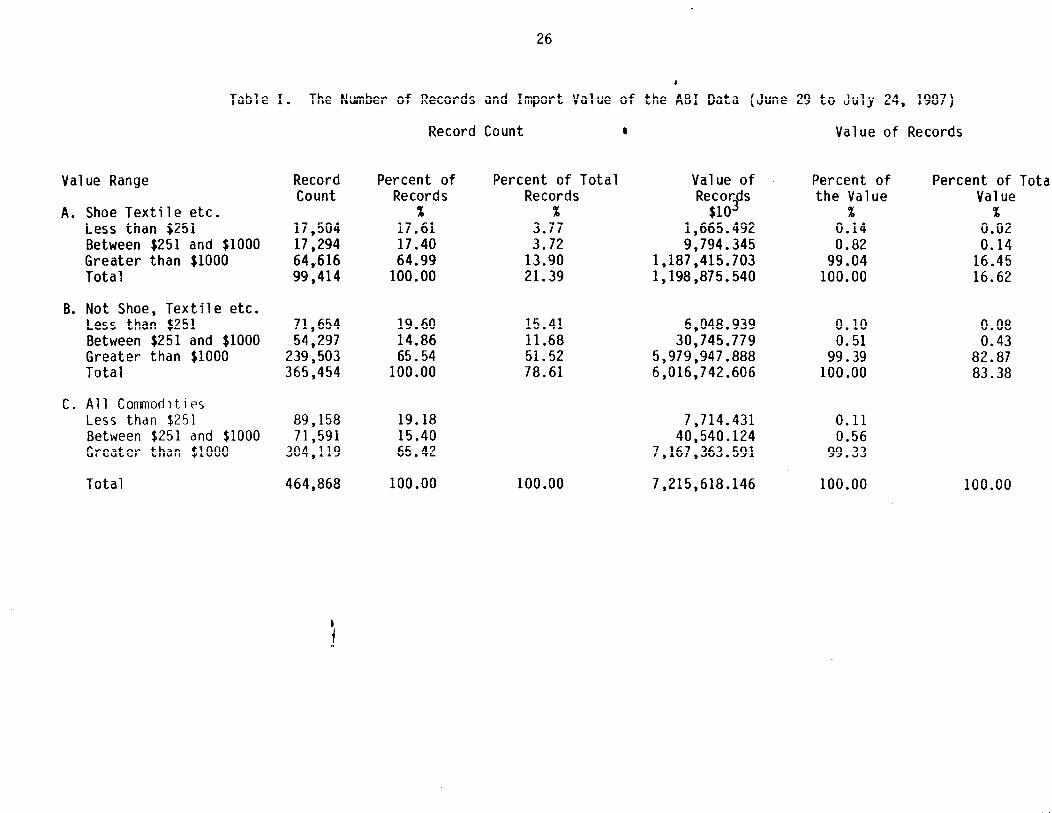
the ABI data set are $38,460,210. This is 0.53 percent of the total import
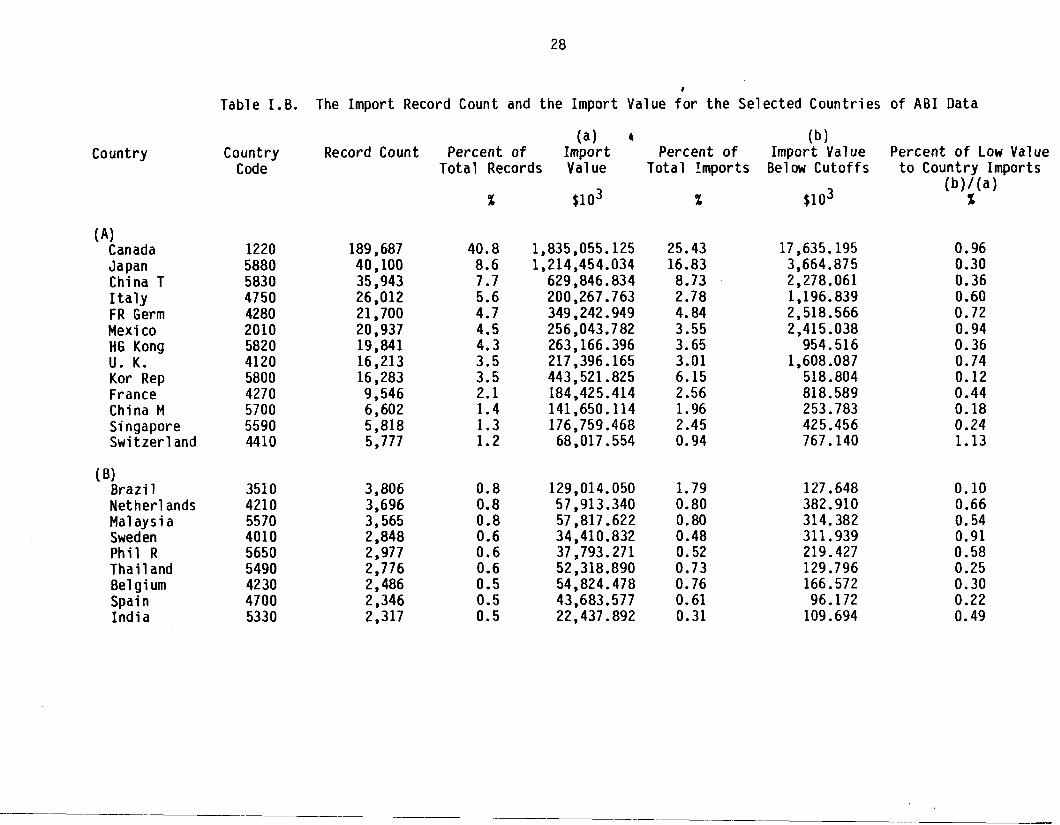
value in the ABI data set. See also Table I for other information. The
record counts and import value by import value classes and by selected
countries of the ABI data are tabulated in Tables I.A. and I.B., respectively.
1II.B. Estimation Procedure
The low value factors by country were tabulated using approximately one
month of ABI data. Note that in the ABI data, we have import items valued
under $251 and $1001 for commodities with exemption levels $250 and $1000,
The two low value factors FA L 2
respectively. , and FA,L
for under $251 and
between $251 and $1000 respectively using one month of ABI data are calculated .
for each individual country by the following formula:
1
FA,L - TA,(O,C,]'(TA,C,+ - 'A,(C,,C2])
2
FA,L = 'A,[C, ,c2]~T~,c2t
(3.1)
(3.2)
where c1 = $250 , C2 - $1000 ,
TA, W1l is the individual country's total value of imports for commodities
valued less than or equal to Cl using ABI data,
TA,C1+ is the individual country's total value of imports for commnd4ties
valued over Cl using ABI data,
T~,cc,,c21 is the individual country's total value of imports for commodities
valued between Cl and C2 with exempti on level of C2 using ABI data, I
TA,C2+ is the individual country's total value of imports for commodities
valued over C2 with exemption level of C2 using ABI data.
17
different
The
and (3.2)
exemption levels.
low value factors using ABI da.ta are calculated using formu las (3.1)
and tabulated for selected countries and compared with the currently
1II.C. Data Analysis
The data used to compute the import low value factors (FA) using ABI data
are different by size, completeness and time lag with the data used to compute
the current import low value factors (Fc). The current import low value
factors were calculated initially using March, June and September 1984 import
data (when the exemption level was $250 for all commodities), and updated by
using March, June and September 1986 import data (when the exemption level was
$250 for a special group of commodities and $1000 for the rest of the
commodities). There are no statistics available for direct comparison of
these two data sets. In Dickerson's memorandum (1984)' there is a frequency .
tabulation for import record counts and import values for different assumed
exemption levels using April 1984 import shipments. Although April 1984 was
not the month used to calculate the current import low value factors, it is
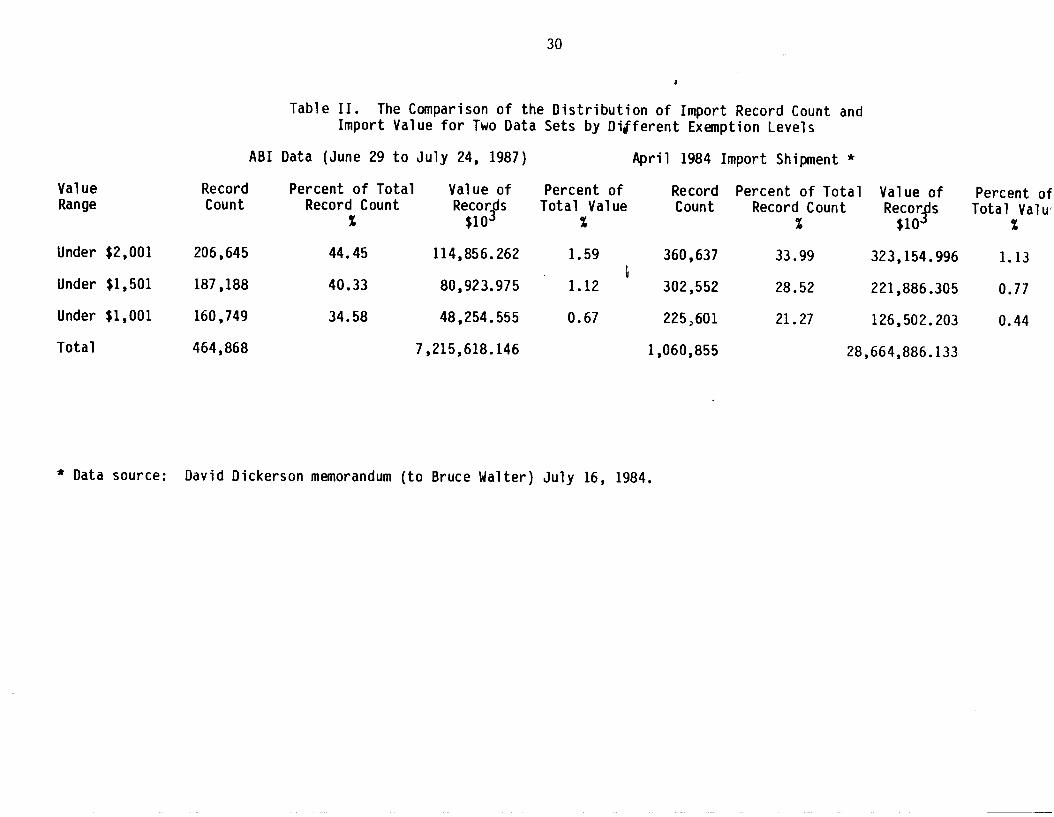
close enough in time to March 1984's data. In table II, the import record
counts and import values were tabulated for ABI data and April 1984's import
data for different exemption levels. There are 34.58% and 21.27% of records
valued under $1001 for ABI data and April 1984 import shipments respectively,
and the percentages of import items valued under $1001 are 0.67% and 0.44% of
the total import value for ABI and April 1984 data respectively. The data in
April 1984 did not have any imports with items valued below $250 because the
exemption level at the time was $250 for all commodities. The ABI,import data
is approximately 20% of the monthly imports with 49% from June and 50% from
July of 1987. In Table II, the percentages of low value import records or
values for April 1984's data are less than the percentages for ABI data for
18
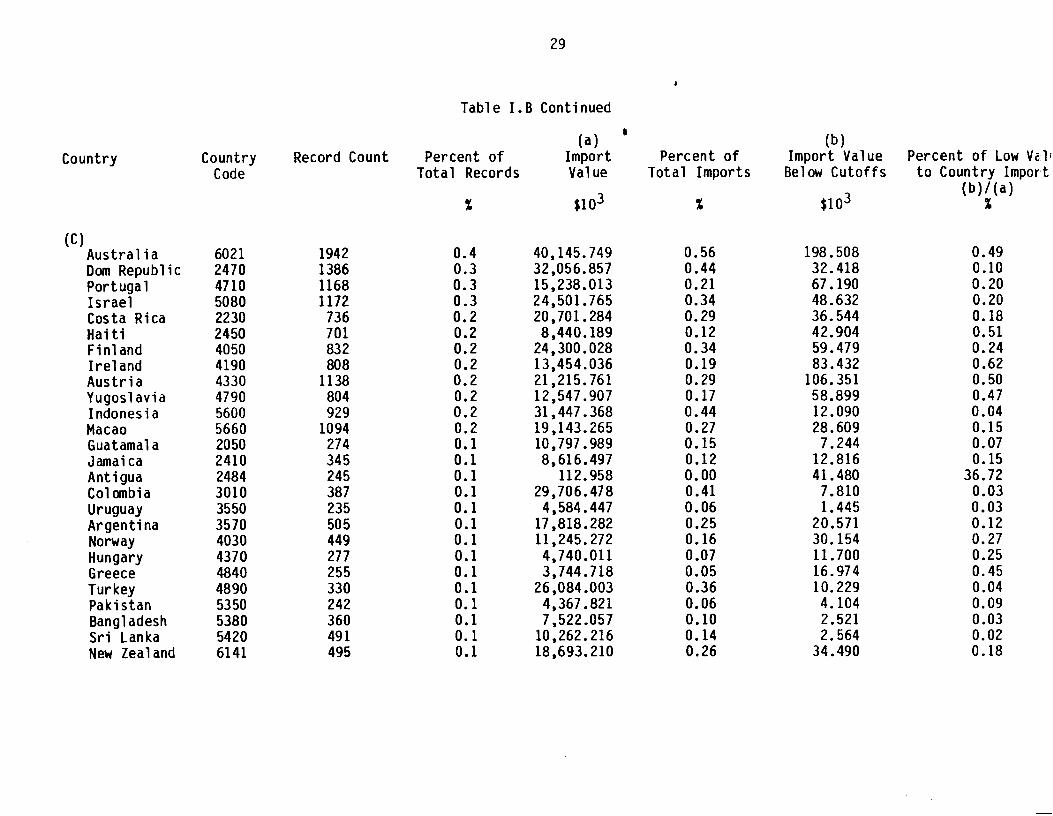
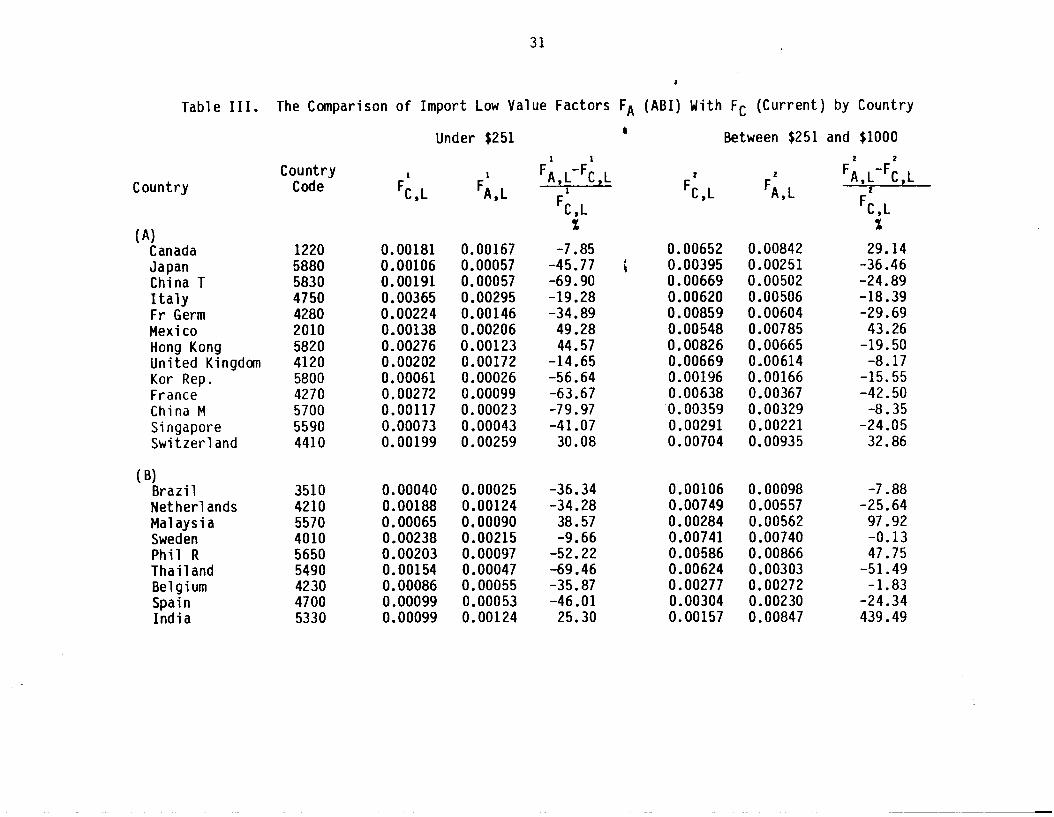
used import low value factors in Table III. The countries are grouped into
three categories according to the percentage of the total country import
record counts in the total count of the ABI records (See Table 1.B).
Categories A, B and C include countries with percent of records in the ABI
over l%, between 0.5% and l%, and between 0.1% and 0.5% respectively. For
countries with less than 0.1% of the total import records, the low value
factors were not presented in Table III because of the small amount of import
records involved. From Table III, for countries in category A, the relative
differences of low value factors using ABI data and the currently used
. factor (FA,L-Fc ,L) /Fc,L ranged from -79.97% to 49.28% for factors used to
estimate imports with items valued under $251, and from -42.50% to 43.26% for
facters used to estimate imports with items valued between $251 and $1000; for
countries in category B, the relative differences ranged from -69.46% to
38.57% for under $251, and from -51.49% to 439.49% for between $251 to $1000;
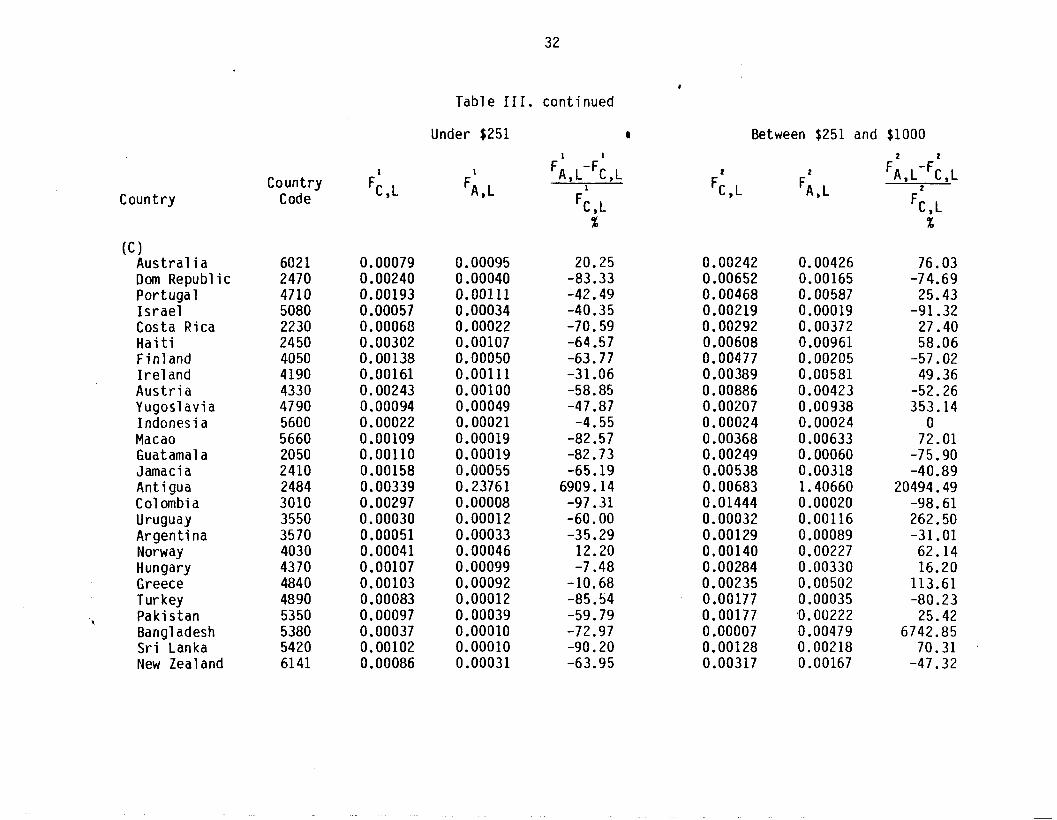
for countries in category C, the relative differences ranged from -97.31% to
6909% for under $251, and from -98.61% to 20494% for between $251 and $1000.
The relative differences of the low value factors computed using ABI data and
the currently used factor, (FA-Fc)/Fc, are not small, especially for countries
in category C. In the country C category, Antigua showed unusual import
distribution in the ABI data having 94% of its records valued below $1001
which represent 36.7% of its total import value. In the non-textile, shoe
etc. commodities, 96% of the records were valued below $1000 with 70% of the
import value, and 75% of the records were valued below $250 with 29% of the
import value. Thus the low value factor for between $250 and $1000 exceeds 1
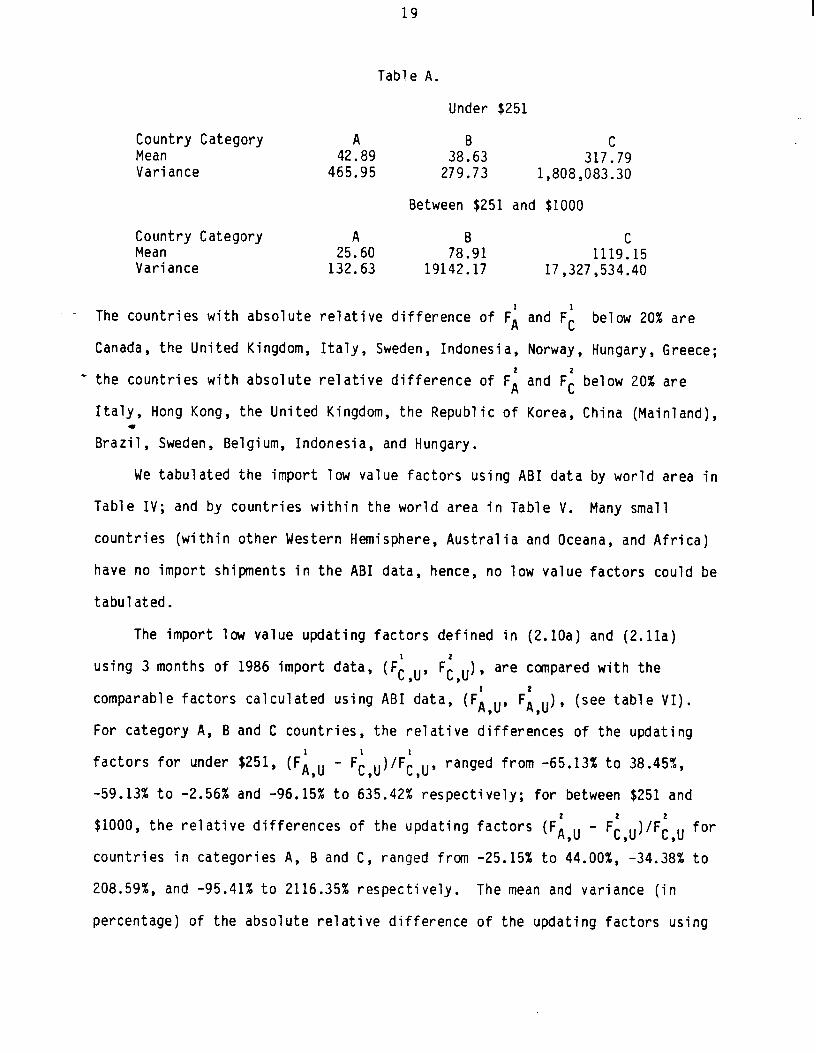
(1.4066). The mean and variance (in percentage) of the absolute relative
difference of the low value factors using two different data sets for each
country category are as follows:
19
Table A.
Under $251
Country Category Mean Variance
A 38B63
C 42.89 317.79
465.95 279:73 1,808,083.30
Between $251 and $1000
Country Category A B C Mean 25.60 78.91 1119.15 Variance 132.63 19142.17 17,327,534.40
The countries with absolute relative difference of F; and Fi below 20% are
Canada, the United Kingdom, Italy, Sweden, Indonesia, Norway, Hungary, Greece;
w the countries with absolute relative difference of Fi and Fi below 20% are
Italy, Hong Kong, the United Kingdom, the Republic of Korea, China (Mainland), I
Brazil, Sweden, Belgium, Indonesia, and Hungary.
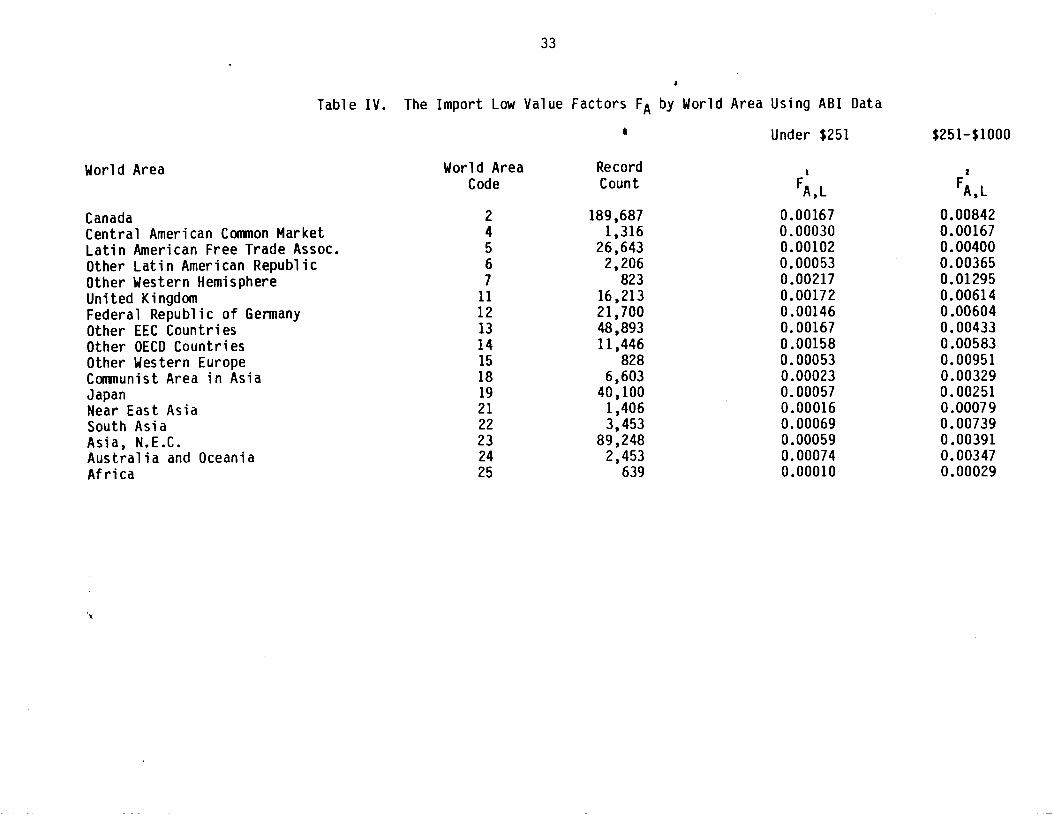
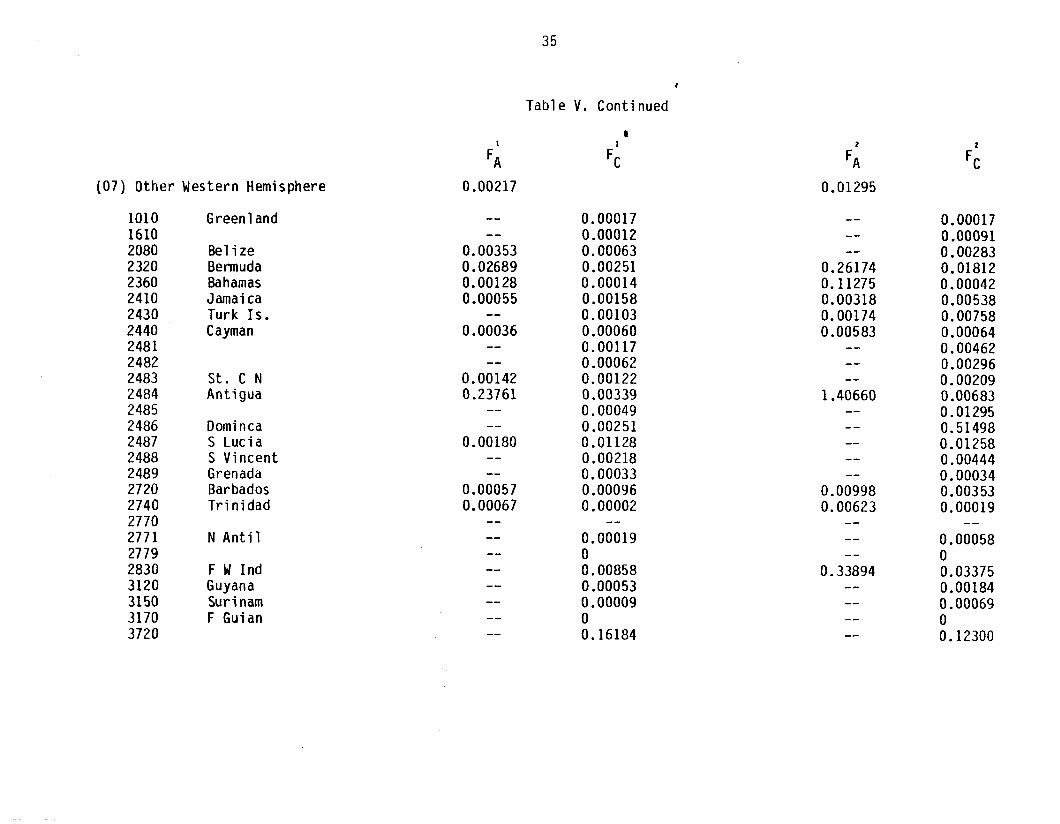
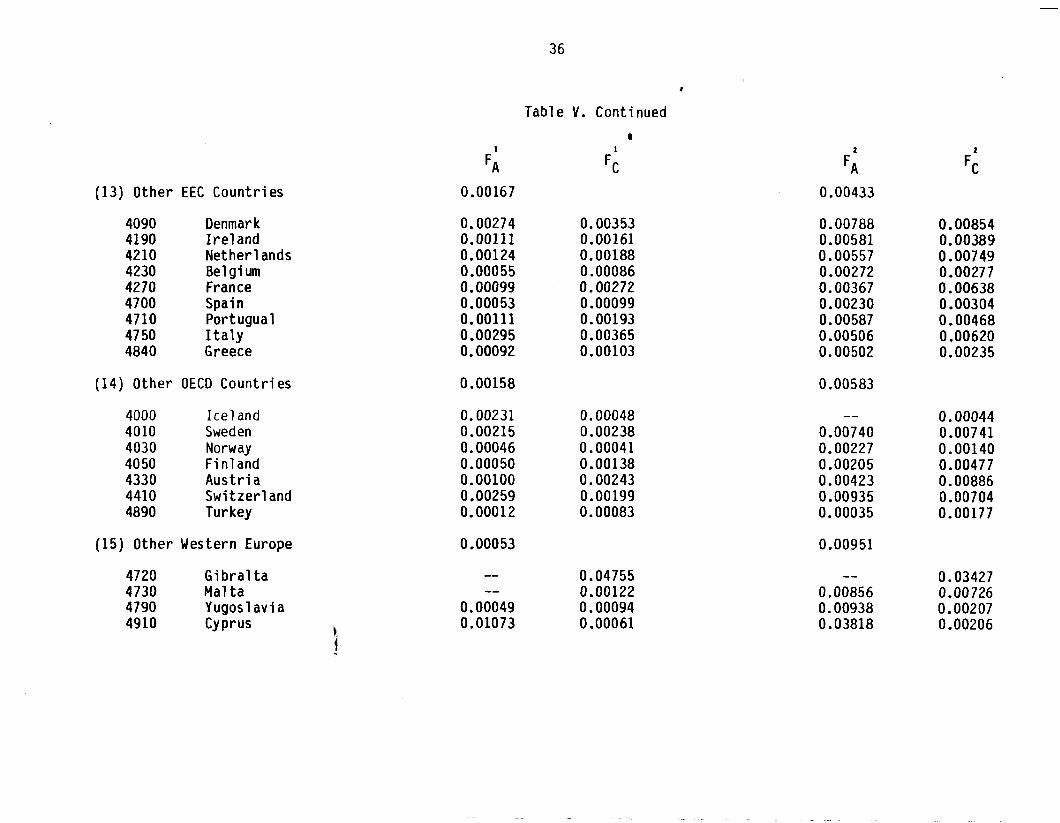
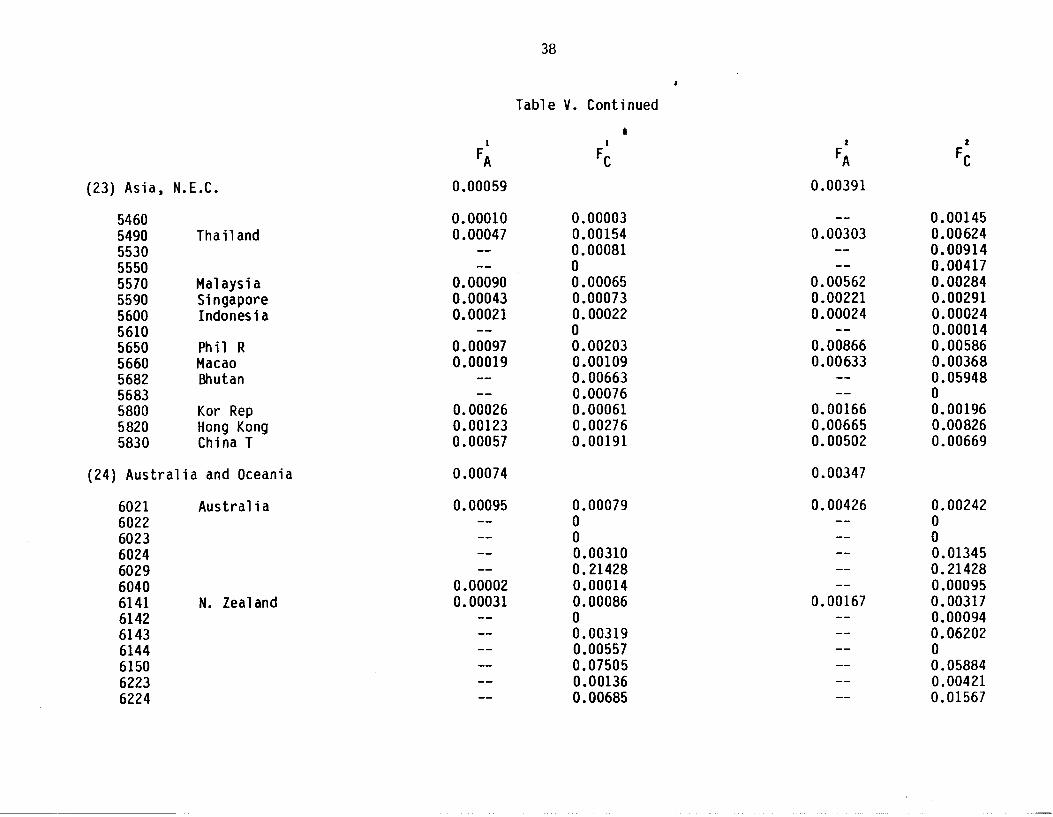
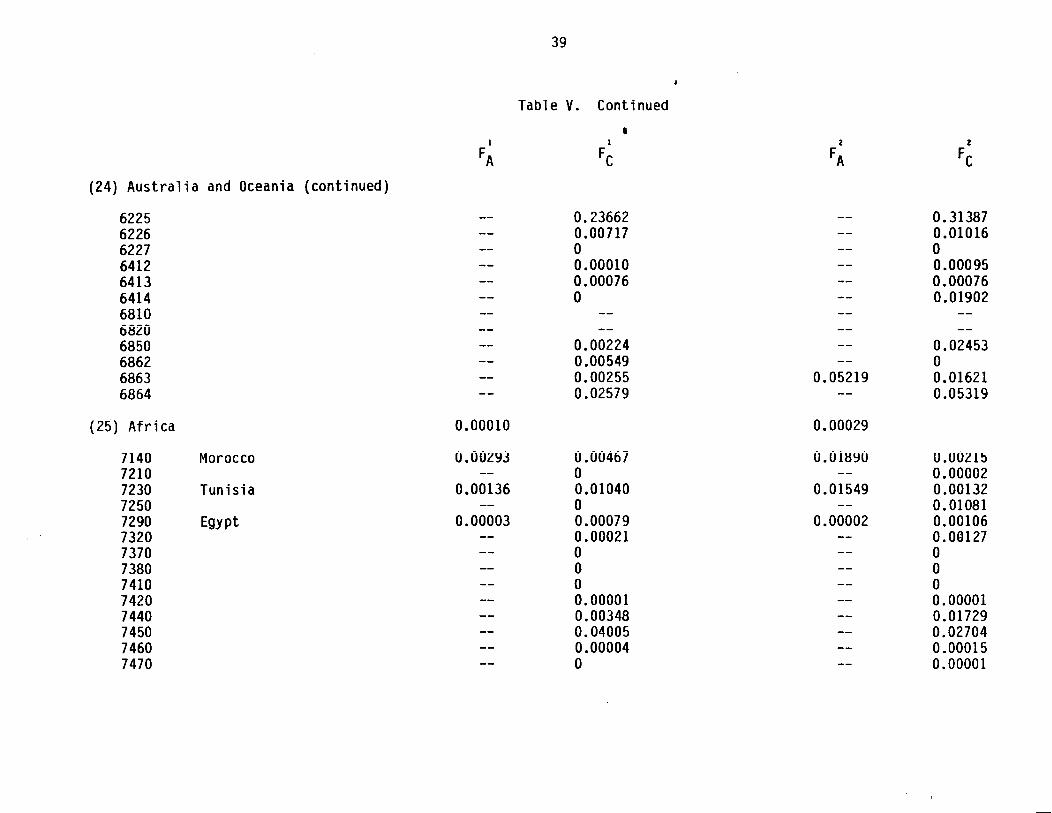
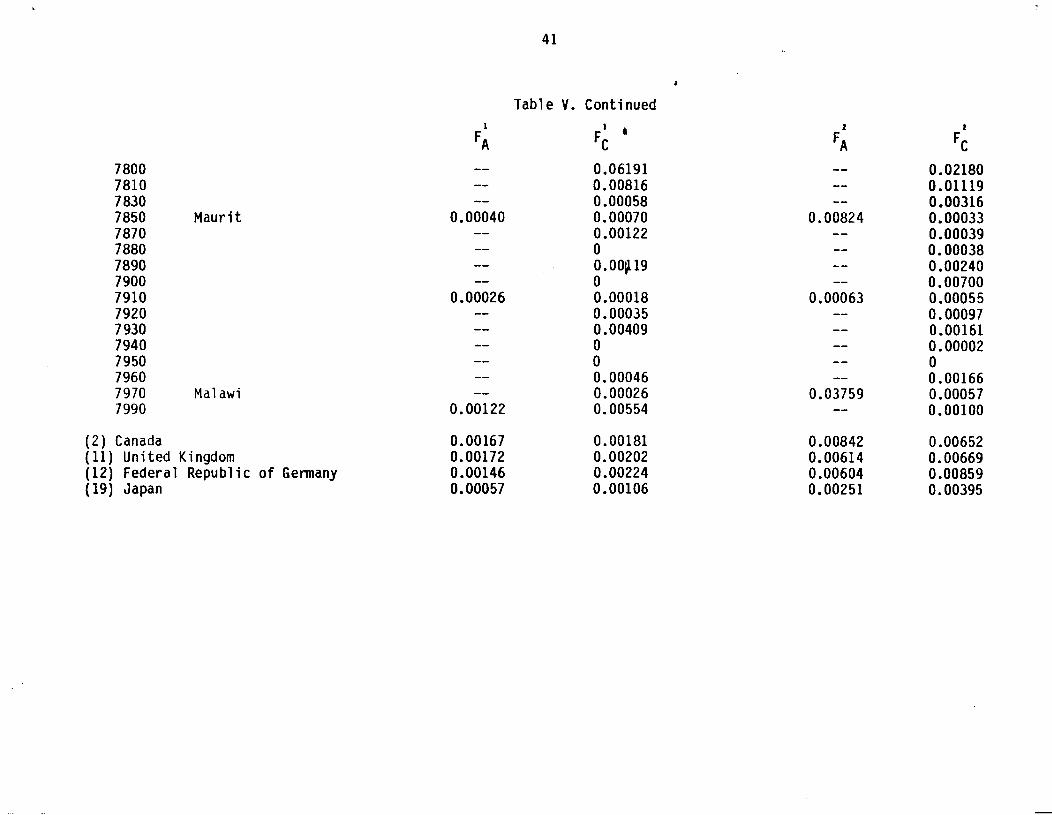
We tabulated the import low value factors using ABI data by world area in
Table IV; and by countries within the world area in Table V. Many small
countries (within other Western Hemisphere, Australia and Oceana, and Africa)
have no import shipments in the ABI data, hence, no low value factors could be
tabulated.
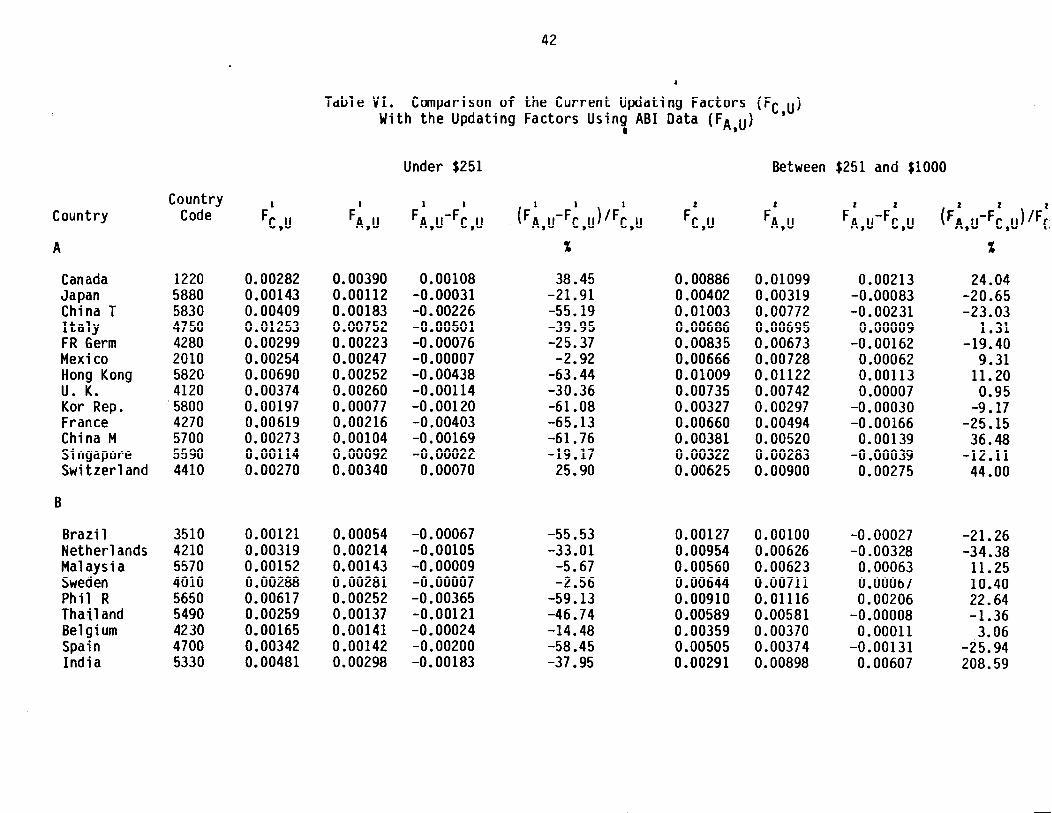
The import low value updating factors defined in (2.10a) and (2.11a)
using 3 months of 1986 import data, (Fi u, ,
Fi,u), are compared with the
comparable factors calculated using ABI data, (Fi u, Fiyu), (see table VI). ,
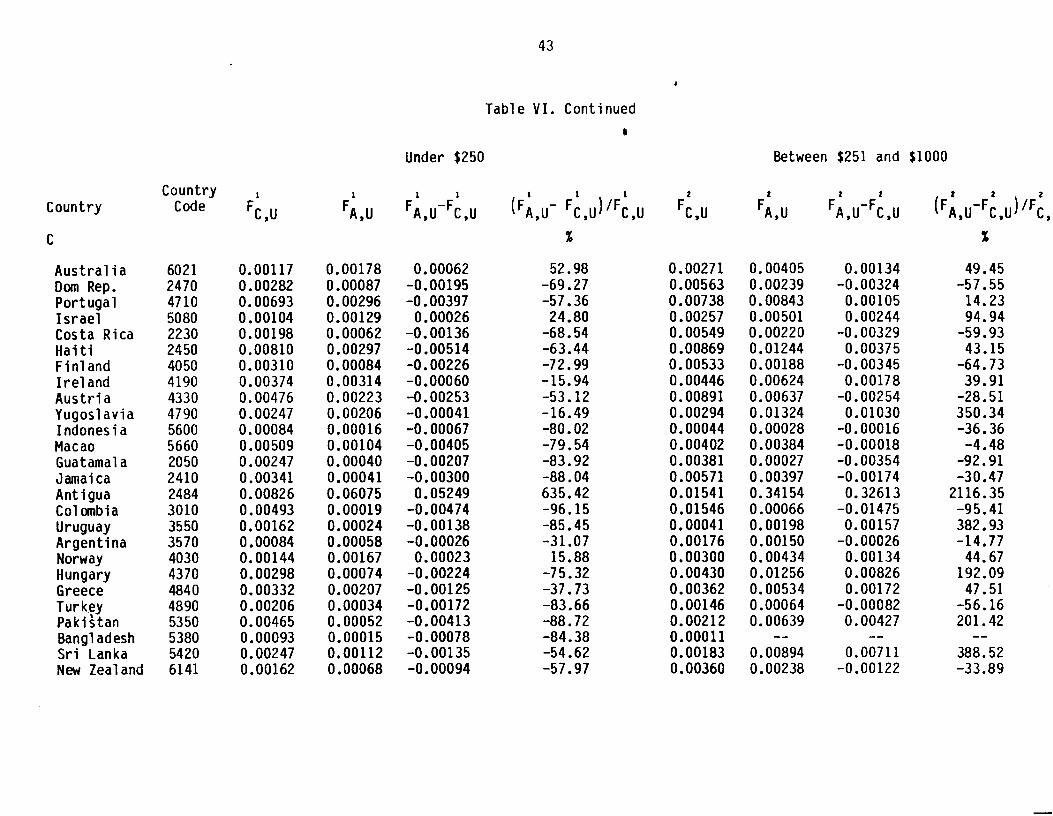
For category A, B and C countries, the relative differences of the updating
factors for under $251, (F;\ u - Fl,u)/Fl ,,, ranged from -65.13% to 38.45%' , Y
-59.13% to -2.56% and -96.15% to 635.42% respectively; for between $251 and
$1000, the relative differences of the updating factors (Fi u - Fi,u)/Fi u for Y Y
countries in categories A, B and C, ranged from -25.15% to 44.00%' -34.38% to
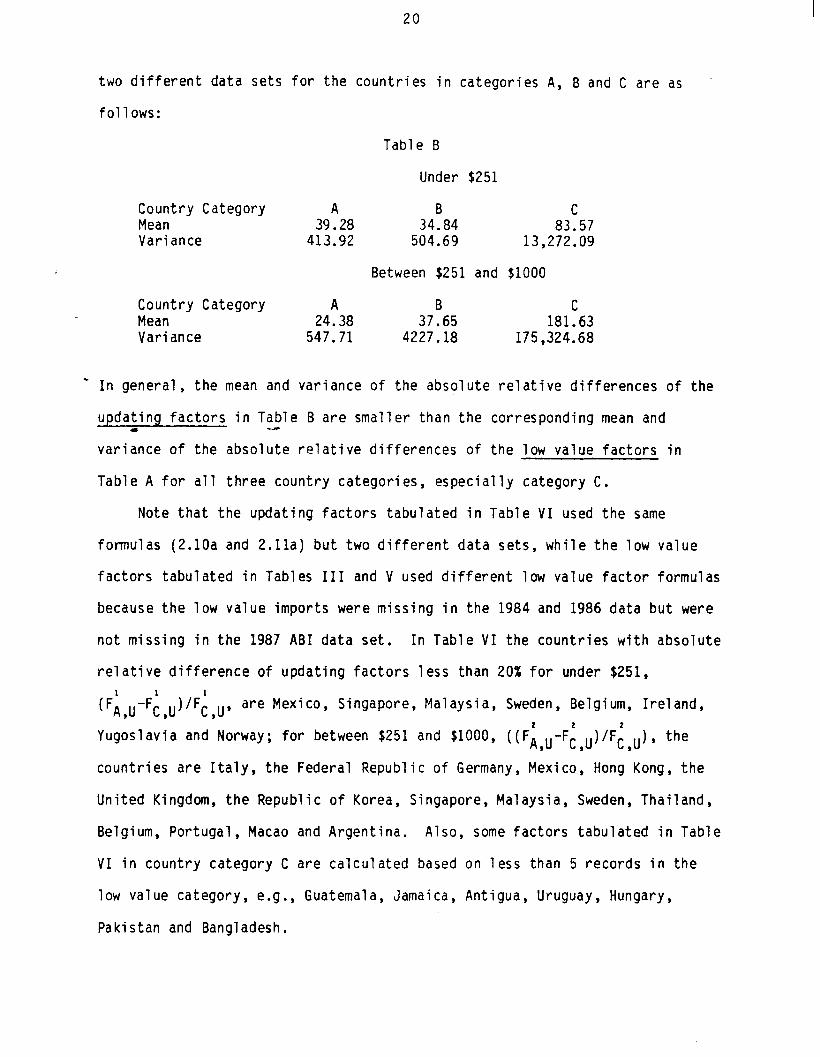
208.59%' and -95.41% to 2116.35% respectively. The mean and variance (in
percentage) of the absolute relative difference of the updating factors using
20
two different data sets for the countries in categories A, B and C are as
follows:
Table B
Under $251
Country Category A 34'84
C Mean 39.28 83.57 Variance 413.92 504:69 13,272.09
Between $251 and $1000
Country Category A B C Mean 24.38 37.65 181.63 Variance 547.71 4227.18 175,324.68
* In general, the mean and variance of the absolute relative differences of the
updating factors in Table B are smaller than the corresponding mean and I
variance of the absolute relative differences of the low value factors in
Table A for all three country categories, especially category C.
Note that the updating factors tabulated in Table VI used the same
formulas (2.10a and 2.11a) but two different data sets, while the low value
factors tabulated in Tables III and V used different low value factor formulas
because the low value imports were missing in the 1984 and 1986 data but were
not missing in the 1987 ABI data set. In Table VI the countries with absolute
relative difference of updating factors less than 20% for under $251,
(F;,u-F;,u)/F;,u. are Mexico, Singapore, Malaysia, Sweden, Belgium, Ireland,
Yugoslavia and Norway; for between $251 and $1000, ((F; u-Fi u)/F; ,), the Y Y ,
countries are Italy, the Federal Republic of Germany, Mexico, Hong Kong, the
United Kingdom, the Republic of Korea, Singapore, Malaysia, Sweden, Thailand,
Belgium, Portugal, Macao and Argentina. Also, some factors tabulated in Table
VI in country category C are calculated based on less than 5 records in the
low value category, e.g., Guatemala, Jamaica, Antigua, Uruguay, Hungary,
Pakistan and Bangladesh.
21
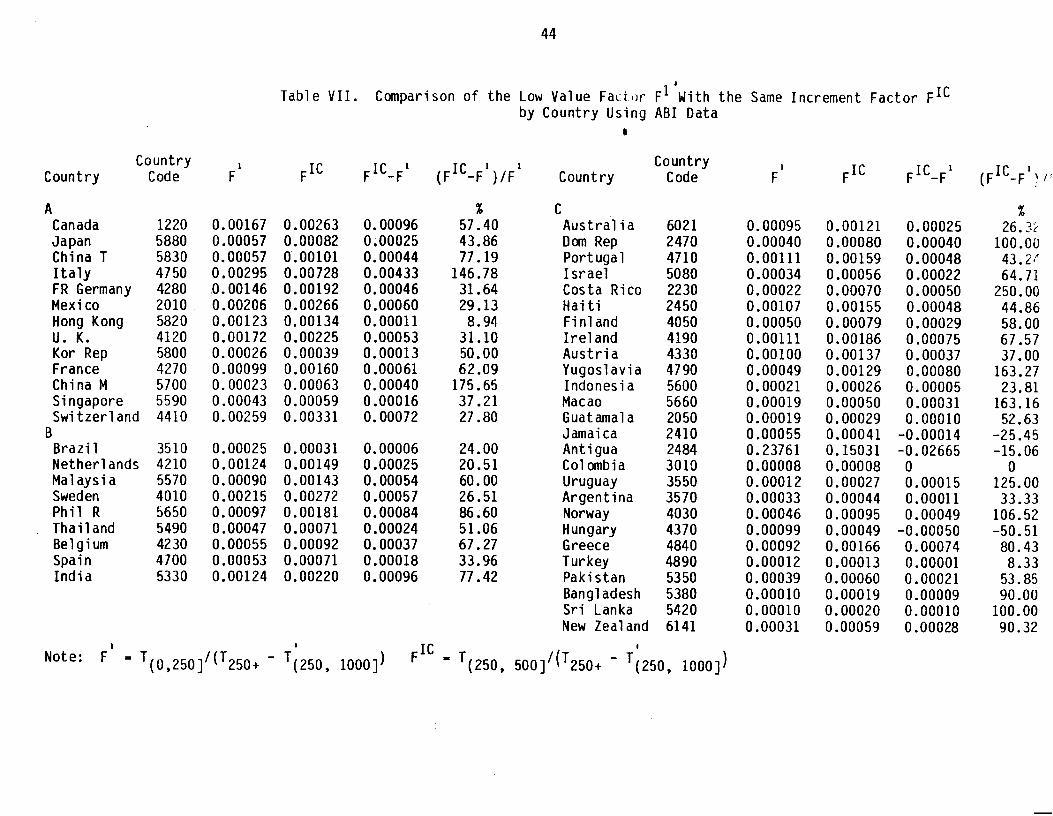
We also used ABI data to check one of the assumptions used in calculating
the initial import low value factors, i.e., that the ratio of the total
imports with items valued under $251 to the individual country's total imports
with items valued above the exemption levels (F') is approximately the same as
the ratio of the total imports with items valued between $251 to $500 to the
individual country's total imports with items valued above the exemption
levels (F"), i.e.,
TLv, ‘C,l) T(Cl ,2C,]‘(To,C,+ - To, (Cl Y 31) Y
.
where CI - $250, C2 - $1000 (See Section 1I.B).
We tabulated these two-ratios using ABI data for selected countries in table
VII. It showed, in general, F*' is bigger than F1 for most countries except
Colombia, Jamaica, Antigua and Hungary. The relative differences of these two
ratios in percent, ((F*' -F*)IF'), for countries in categories A, B and C
ranged from 8.94% to 175.65%, 20.51% to 86.60%, and -50.51% to 250.00%
respectively.
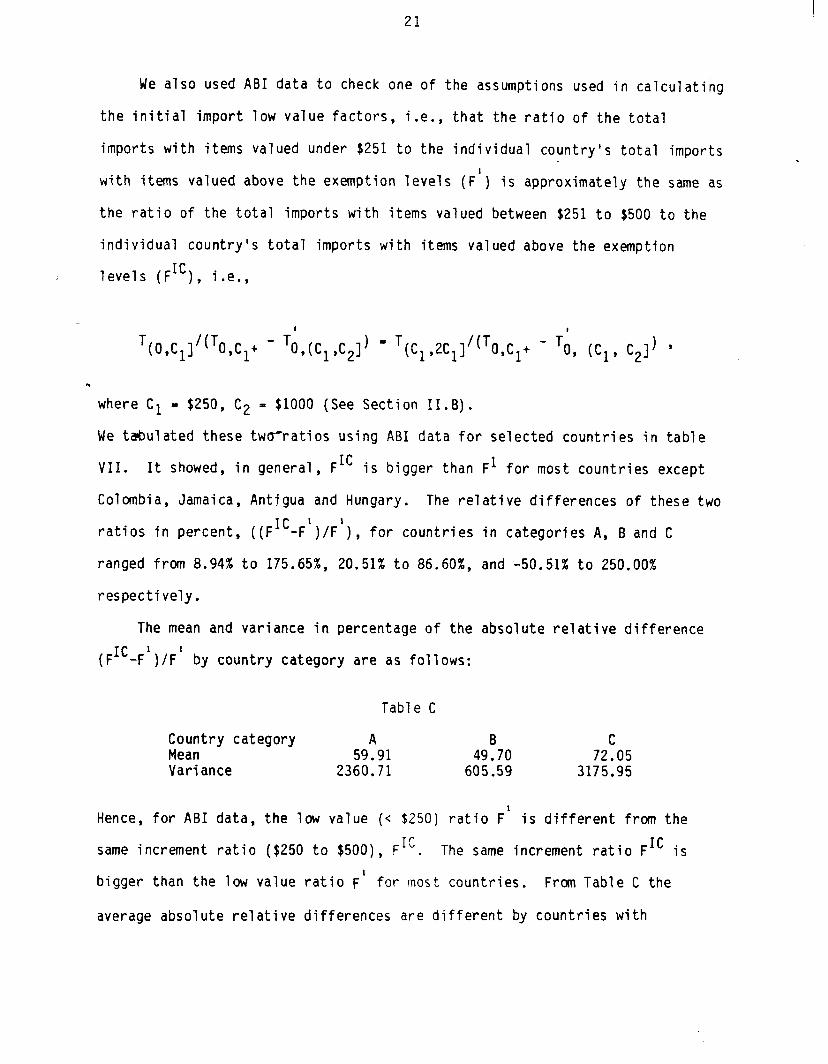
The mean and variance in percentage of the absolute relative difference
(F"-F1)/F1 by country category are as follows:
Table C
Country category A B Mean 59.91 49.70 72'05 Variance 2360.71 605.59 3175:95
Hence, for ABI data, the low value (< $250) ratio F' is different from the
same increment ratio ($250 to $500), F". The same increment ratio Frc is
bigger than the low value ratio F' for most countries. From Table C the
average absolute relative differences are different by countries with
countries in category B giving the smallest difference with an average of
49.70%.
IV. Sumnary
In this report, we reviewed the low value estimation procedures for
exports and imports used by the Foreign Trade Division. The low value
shipments are estimated by a ratio procedure. Model assumptions are used in
the low value estimation procedure. Since data are not required to be
reported to the Bureau of the Census for shipments of commodities below the
exemption level, it is very difficult to check the underlying model .
assumptions.
*The import data from the ABI system contain all import items including
the below exemption level imports. We examined the feasibility of using
Customs Service's ABI data as an alternative source for estimating low value
factors for imports. Unfortunately, this ABI data set is only about 20% of
the total monthly imports in June or July 1987. Many countries have no import
shipments in this data set. We examined 48 out of 145 countries with import
record counts over 0.1% of the total ABI records (464,868) used in the study.
In the 48 countries we compared the low value factors calculated by using ABI
data (FA) with the low value factors (Fc) currently used by Foreign Trade
Division. They are different for most of the 48 countries. Even for large
trade countries e.g., Canada, Japan, Taiwan, Italy, Germany, Hong Kong, and
the United Kingdom, the magnitude of the relative difference (FA-FC)/FC is
significantly different by country, ranging from -69.90% to 49.28% (see Table
III). The factors, FC and FA, are not really comparable. Fe's are the
estimates of the low value factors using 6 months data from 1984 and 1986;
while FA’s are the "true" low value factors using 4 weeks of ABI data
23
collected from June 29 to July 24, 1987 which are approximately 20%.of the
total monthly imports. For each country, which of these two factors Fc and FA
is closer to the true low value factor is unknown. It depends on the period
of the import data targeted. In the current low value estimation procedure,
it is assumed that for each country, the low value factor is constant over all
months within a 2 year span.
We examined the relative differences of the import updating factors using
ABI data and the currently used updating factors relative to the current
updating factors for the 48 countries. The magnitude of the relative
difference of the updating factors varies by country. However, in general, .
the differences of the two data sets for updating factors are smaller than the
low lralue factors for most countries.
We examined one of the assumptions used in the current low value import
estimation procedure using ABI data, i.e., for each country, the ratio of the
total import items valued under $251 to the individual country's total import
items above the exemption levels is the same as the ratio of the total import
items valued between $251 to $500 to the individual country's total import
items above the exemption levels. For the ABI data the latter ratios are
bigger than the former ratios, for most countries.
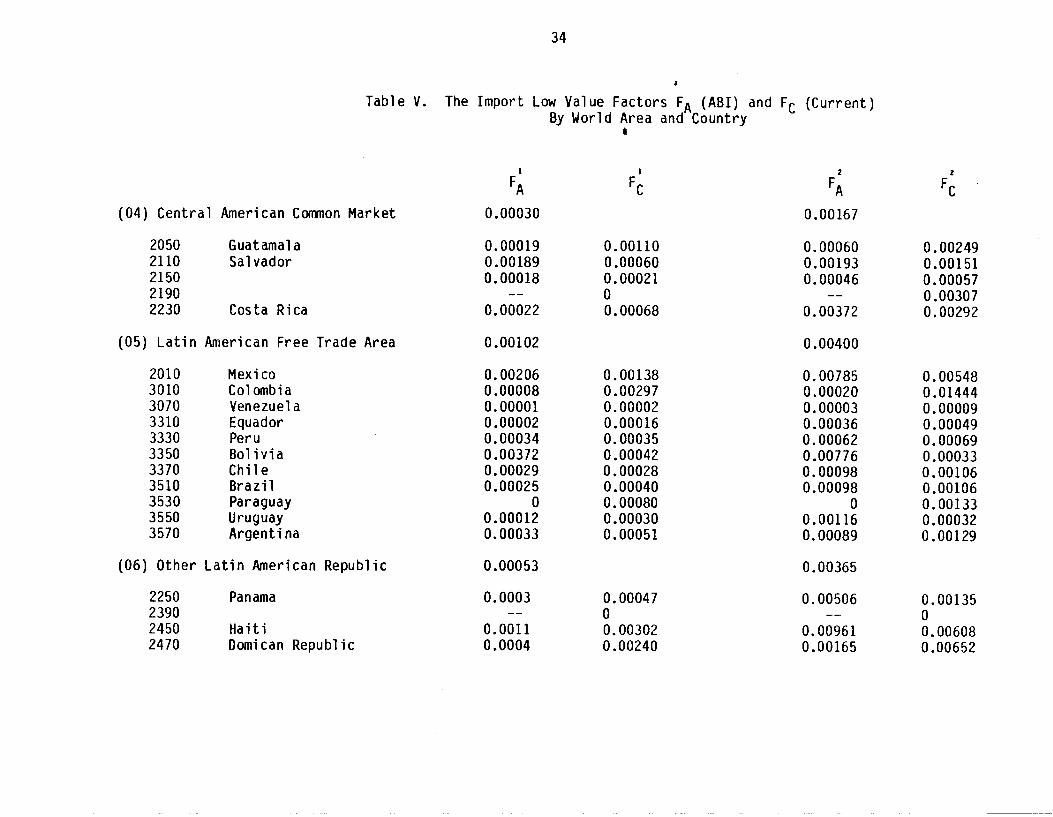
We calculated the low value factors by world area and by country within
the world area using ABI data. The low value factors vary by country within
world area.
Based on our study, we conclude that the low value factors calculated
using ABI data are different from the currently used low value import factors.
For most countries, the currently used low value factors are bigger than the
low value factors calculated using ABI data.
24
Since eventually the Customs Service anticipates that 90 percent of all
import entries will be processed through ABI, a similar study is needed at the
time when the ABI data represent a higher percentage of the monthly imports.
Also several months of ABI data need to be analyzed to check the model
assumptions underlying the low value estimation procedure. We recommend using
current month country total imports to estimate the current month country low
value imports instead of using the previous month country imports since
imports from a country are not constant over time. All the conclusions are
based on the underlying assumption that the ABI contains all import data, both
above and below cutoff, for the brokers who use this automated system. This
should be verified before extensive use is made of the ABI data to measure
below cutoff imports.
As for exports, since the proportion of the low value exports reported by
the companies participating in the Automated Reporting Program is unknown, it is
not clear whether it is worthwhile to use the data in the Automated Reporting
Program as an alternative source to estimate the export low value factors.
Acknowledgements
Thanks to many individuals providing assistance during the course of this
study. In Foreign Trade Division, Bruce Walter suggested the research idea
and provided background information. Anita Brown coordinated the provision of
the ABI data. Ken Camnie made a special effort to provide the ABI data. John
Ellman answered many questions about the current low value estimation
procedure and furnished the current import low value factors. Ruth Mangaroo
furnished the information about the Automated Reporting Program for Exporting
Companies. In Statistical Research Division, many useful discussions were
held with Nash Monsour. Comments and criticism on the draft report were given
25
by Cary Isaki and Nash Monsour. Chris Dyke and Robert Creecy assisted in data
transmission and computer programming. Alice Bell patiently typed the report.
V. References
1. Walter, Bruce C. and Puzzilla, Kathleen (1987). 'Recent Developments in Foreign Trade Statistics' paper presented to the Census Advisory Committees of the American Marketing Association and the American Economic Association at the Joint Advisory Committee Meeting, October 8-9, 1987.
2. Bureau of the Census (1986). U.S. Foreign Trade Automated Reporting Program for Exporting Companies.
3. David Dickerson (1984). April Import Shipments Valued Under $2501, $2001, $1501 and Under $1001. An internal memorandum from David Dickerson to
w Bruce Walter July 16, 1984.
4. Ellman, John II. (1985). Low-Value Estimating Factors - Exports. &published Memorandum. Foreign Trade Division, Bureau of the Census.
5. Walter, Bruce (1984). Low-Value Estimating Factors for Imports. Unpublished Memorandum. Foreign Trade Division, Bureau of the Census, Washington, D.C.
6. Bureau of the Census. Import Statistics Program. An internal document from Foreign Trade Division.
7. Bureau of the Census. Export Statistics Program. An internal document from Foreign Trade Division.
26
Table I. The Number of Records and Import Value of the 'ABI Data (June 29 to July 24, 1987)
Value Range Record Count
A. Shoe Textile etc. Less than $251 Between $251 and $1000 Greater than $1000 Total
17,504 17,294 64,616 99,414
Percent of Percent of Total Value of Percent of Percent of Tota Records Records Records
% % $103 the Value Value
% % 17.61 3.77 1’665.492 0.14 0.02 17.40 3.72 9,794.345 0.82 0.14 64.99 13.90 1,187,415.703 99.04 16.45
100.00 21.39 1,198,875.540 100.00 16.62
B. Not Shoe, Textile etc. Less than $251 Between $251 and $1000 Greater than $1000 Total
71,654 19.60 15.41 6,048.939 0.10 0.08 54,297 14.86 11.68 30,745.779 0.51 0.43
239,503 65.54 51.52 5,979,947.888 99.39 82.87 365,454 100.00 78.61 6,016,742.606 100 .oo 83.38
C. All Commodities Less thdn $251 Between $251 and $1000 Greater than $1000
89,158 19.18 7,714.431 0.11 71,591 15.40 40,540.124 0.56
304,119 65.42 7,167,363.591 99.33
Total 464,868 100.00 100.00 7,215,618.146 100.00 100.00
Record Count 4 Value of Records
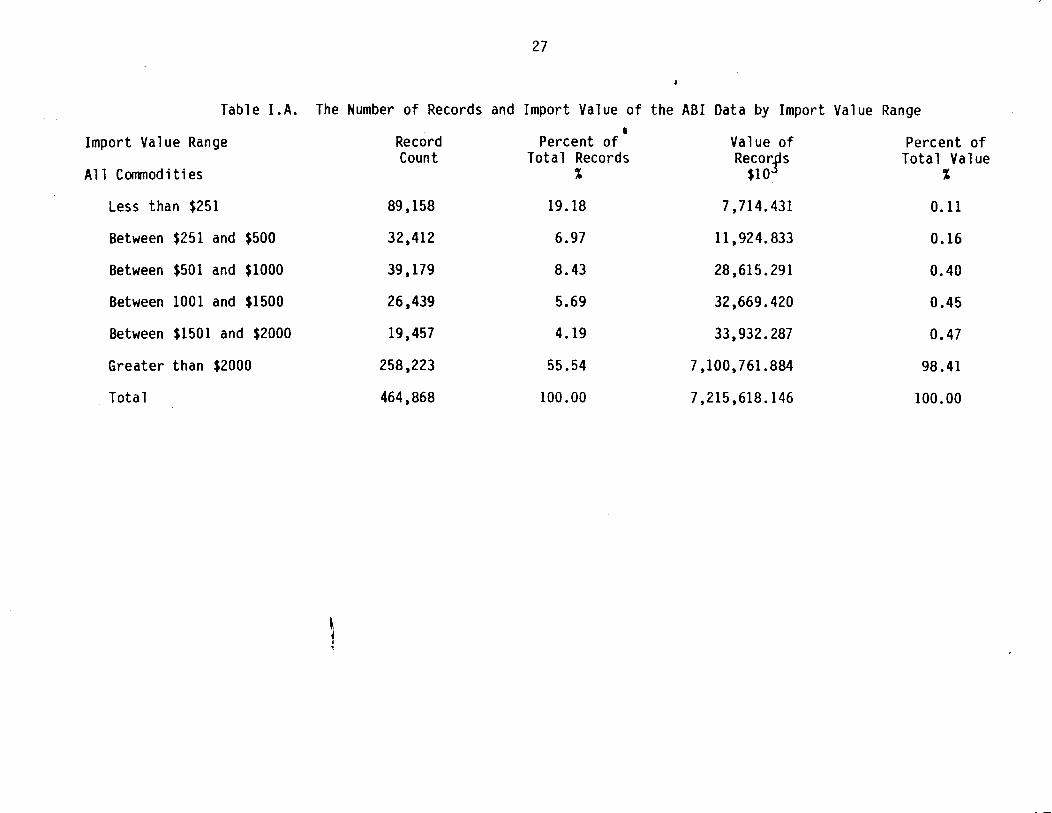
27
Table I.A. The Number of Records and Import Value of the ABI Data by Import Value Range
Import Value Range Record Percent of' Value of Percent of Count Total Records Recor s
5' Total Value
All Commodities % $10 %
Less than $251 89,158 19.18 7,714.431 0.11
Between $251 and $500 32,412 6.97 11’924.833 0.16
Between $501 and $1000 39,179 8.43 28,615.291 0.40
Between 1001 and $1500 26,439 5.69 32'669.420 0.45
Between $1501 and $2000 19,457 4.19 33’932.287 0.47
Greater than $2000 258,223 55.54 7,100,761.884 98.41
Total 464,868 100.00 7,215,618.146 100.00
28
Country
(A) Canada Japan China T Italy FR Germ Mexico HG Kong U. K. Kor Rep France China M Singapore Switzerland
(B) Brazil Netherlands Malaysia Sweden Phil R Thailand Belgium Spain India
Table I.B. The Import Record Count and the Import Value ior the Selected Countries of ABI Data
Country Code
Record Count Percent (4 4 (b)
of Import Percent of Import Value Total Records Value Total Imports Below Cutoffs
% $103
Percent of Low Value to Country Imports
W;(a)
1220 189,687 40.8 1,835,055.125 25.43 17,635.195 0.96 5880 40,100 8.6 1,214,454.034 16.83 3,664.875 0.30 5830 35,943 7.7 629'846.834 8.73 2'278.061 0.36 4750 26,012 5.6 200'267.763 2.78 1,196.839 0.60 4280 21,700 4.7 349,242.949 4.84 2,518.566 0.72 2010 20,937 4.5 256'043.782 3.55 2’415.038 0.94 5820 19,841 4.3 263,166.396 3.65 954.516 0.36 4120 16,213 3.5 217'396.165 3.01 1,608.087 0.74 5800 16,283 3.5 443'521.825 6.15 518.804 0.12 4270 9,546 2.1 184'425.414 2.56 818.589 0.44 5700 6,602 1.4 141,650.114 1.96 253.783 0.18 5590 5,818 1.3 176’759.468 2.45 425.456 0.24 4410 5,777 1.2 68,017.554 0.94 767.140 1.13
3510 3,806 4210 3,696 5570 3,565 4010 2,848 5650 2,977 5490 2,776 4230 2,486 4700 2,346 5330 2,317
0.8 0.8 0.8
X2
o"* f 0:5 0.5
129,014.050 1.79 127.648 0.10 57,913.340 0.80 382.910 0.66 57,817.622 0.80 314.382 0.54 34,410.832 0.48 311.939 0.91 37’793.271 0.52 219.427 0.58 52,318.890 0.73 129.796 0.25 54’824.478 0.76 166.572 0.30 43,683.577 0.61 96.172 0.22 22'437.892 0.31 109.694 0.49
% $103
29
Table 1.B Continued
r
Country
(Cl Australia Dom Republic Portugal Israel Costa Rica Haiti Finland Ire1 and Austria Yugoslavia Indonesia Macao Guatamala Jamaica Antigua Colombia Uruguay Argentina Norway Hungary Greece Turkey Pakistan Bangladesh Sri Lanka New Zealand
Country Code
Record Count
6021 1942 2470 1386 4710 1168 5080 1172 2230 736 2450 701 4050 832 4190 808 4330 1138 4790 804 5600 929 5660 1094 2050 274 2410 345 2484 245 3010 387 3550 235 3570 505 4030 449 4370 277 4840 255 4890 330 5350 242 5380 360 5420 491 6141 495
Percent of Total Records
%
0.4 0.3 0.3 0.3 0.2 0.2 0.2
o”*; 012 0.2
Fi: 0:1 0.1 0.1 0.1 0.1 0.1 0.1 0.1 0.1 0.1 0.1 0.1 0.1
(a) ’ Import Value
Percent of Total Imports
(b) Import Value Below Cutoffs
$103 % $103
Percent of Low Val to Country Import
(b);(a)
40,145.749 0.56 198.508 0.49 32,056.857 0.44 32.418 0.10 15,238.013 0.21 67.190 0.20 24,501.765 0.34 48.632 0.20 20,701.284 0.29 36.544 0.18 8,440.189 0.12 42.904 0.51
24’300.028 0.34 59.479 0.24 13,454.036 0.19 83.432 0.62 21,215.761 0.29 106.351 0.50 12,547.907 0.17 58.899 0.47 31’447.368 0.44 12.090 0.04 19’143.265 0.27 28.609 0.15 10,797.989 0.15 7.244 0.07 8’616.497 0.12 12.816 0.15
112.958 0.00 41.480 36.72 29,706.478 0.41 7.810 0.03
4,584.447 0.06 1.445 0.03 17’818.282 0.25 20.571 0.12 11,245.272 0.16 30.154 0.27 4,740.011 0.07 11.700 0.25 3’744.718 0.05 16.974 0.45
26’084.003 0.36 10.229 0.04 4’367.821 0.06 4.104 0.09 7 ‘522.057 0.10 2.521 0.03
10’262.216 0.14 2.564 0.02 18,693.210 0.26 34.490 0.18
30
Table II. The Comparison of the Distribution of Import Record Count and Import Value for Two Data Sets by Different Exemption Levels
ABI Data (June 29 to July 24, 1987) April 1984 Import Shipment *
Value Record Range Count
Under $2,001 206,645
Under $1,501 187,188
Under $1,001 160,749
Total 464,868
Percent of Total Value of Percent of Record Count Records Total Value
% $103 %
44.45 114’856.262 1.59 c
40.33 80’923.975 1.12
34.58 48’254.555 0.67
7 ‘215’618.146
Record Percent of Total Value of Percent 01 Count Record Count Recor s
4 Total Valu
% $10 %
360,637 33.99 323,154.996 1.13
302,552 28.52 221,886.305 0.77
225,601 21.27 126,502.203 0.44
1,060,855 28,664,886.133
* Data source: David Dickerson memorandum (to Bruce Walter) July 16, 1984.
31
Table III. The Comparison of Import Low Value Factors FA (ABI) With Fc (Current) by Country
Country
(A) Canada Japan China T Italy Fr Germ Mexico Hong Kong United Kingdom Kor Rep. France China M Singapore Switzerland
( B) Brazil Netherlands Malaysia Sweden Phil R Thailand Belgium Spain India
Country Code FL,L Fi,L
1 1
FA,L-FC,L 1
Fc,L %
2
FC,L Fi,L
2 2
FA,L-FC,L 2
Fc,L %
1220 0.00181 0.00167 -7.85 0.00652 0.00842 29.14 5880 0.00106 0.00057 .-45.77 1 0.00395 0.00251 -36.46 5830 0.00191 0.00057 -69.90 0.00669 0.00502 -24.89 4750 0.00365 0.00295 -19.28 0.00620 0.00506 -18.39 4280 0.00224 0.00146 -34.89 0.00859 0.00604 -29.69 2010 0.00138 0.00206 49.28 0.00548 0.00785 43.26 5820 0.00276 0.00123 44.57 0.00826 0.00665 -19.50 4120 0.00202 0.00172 -14.65 0.00669 0.00614 -8.17 5800 0.00061 0.00026 -56.64 0.00196 0.00166 -15.55 4270 0.00272 0.00099 -63.67 0.00638 0.00367 -42.50 5700 0.00117 0.00023 -79.97 0.00359 0.00329 -8.35 5590 0.00073 0.00043 -41.07 0.00291 0.00221 -24.05 4410 0.00199 0.00259 30.08 0.00704 0.00935 32.86
3510 0.00040 0.00025 -36.34 0.00106 0.00098 -7.88 4210 0.00188 0.00124 -34.28 0.00749 0.00557 -25.64 5570 0.00065 0.00090 38.57 0.00284 0.00562 97.92 4010 0.00238 0.00215 -9.66 0.00741 0.00740 -0.13 5650 0.00203 0.00097 -52.22 0.00586 0.00866 47.75 5490 0.00154 0.00047 -69.46 0.00624 0.00303 -51.49 4230 0.00086 0.00055 -35.87 0.00277 0.00272 -1.83 4700 0.00099 0.00053 -46.01 0.00304 0.00230 -24.34 5330 0.00099 0.00124 25.30 0.00157 0.00847 439.49
Under $251 Between $251 and $1000
32
Table III. continued
Country
(Cl Australia Dom Republic Portugal Israel Costa Rica Haiti Finland Ireland Austria Yugoslavia Indonesia Macao Guatamala Jamacia Antigua Colombia Uruguay Argentina Norway Hungary Greece Turkey
'\ Pakistan Bangladesh Sri Lanka New Zealand
Country Code
1
Fc,L
I
FA,L
1 1
FA,L-FC,L 1
Fc,L %
2
Fc,L
2
FA,L
2 2
FA,L-FC,L 2
Fc,L %
6021 0.00079 0.00095 20.25 0.00242 0.00426 76.03 2470 0.00240 0.00040 -83.33 0.00652 0.00165 -74.69 4710 0.00193 0.00111 -42.49 0.00468 0.00587 25.43 5080 0.00057 0.00034 -40.35 0.00219 0.00019 -91.32 2230 0.00068 0.00022 -70.59 0.00292 0.00372 27.40 2450 0.00302 0.00107 -64.57 0.00608 0.00961 58.06 4050 0.00138 0.00050 -63.77 0.00477 0.00205 -57.02 4190 0.00161 0.00111 -31.06 0.00389 0.00581 49.36 4330 0.00243 0.00100 -58.85 0.00886 0.00423 -52.26 4790 0.00094 0.00049 -47.87 0.00207 0.00938 353.14 5600 0.00022 0.00021 -4.55 0.00024 0.00024 0 5660 0.00109 0.00019 -82.57 0.00368 0.00633 72.01 2050 0.00110 0.00019 -82.73 0.00249 0.00060 -75.90 2410 0.00158 0.00055 -65.19 0.00538 0.00318 -40.89 2484 0.00339 0.23761 6909.14 0.00683 1.40660 20494.49 3010 0.00297 0.00008 -97.31 0.01444 0.00020 -98.61 3550 0.00030 0.00012 -60.00 0.00032 0.00116 262.50 3570 0.00051 0.00033 -35.29 0.00129 0.00089 -31.01 4030 0.00041 0.00046 12.20 0.00140 0.00227 62.14 4370 0.00107 0.00099 -7.48 0.00284 0.00330 16.20 4840 0.00103 0.00092 -10.68 0.00235 0.00502 113.61 4890 0.00083 0.00012 -85.54 0.00177 0.00035 -80.23 5350 0.00097 0.00039 -59.79 0.00177 *0.00222 25.42 5380 0.00037 0.00010 -72.97 0.00007 0.00479 6742.85 5420 0.00102 0.00010 -90.20 0.00128 0.00218 70.31 6141 0.00086 0.00031 -63.95 0.00317 0.00167 -47.32
Under $251 a Between $251 and $1000
33
World Area
Canada 2 189,687 0.00167 0.00842 Central American Cwnmon Market 4 1,316 0.00030 0.00167 Latin American Free Trade Assoc. 5 26,643 0.00102 0.00400 Other Latin American Republic 6 2,206 0.00053 0.00365 Other Western Hemisphere 7 823 0.00217 0.01295 United Kingdom 11 16,213 0.00172 0.00614 Federal Republic of Germany 12 21,700 0.00146 0.00604 Other EEC Countries 13 48,893 0.00167 0.00433 Other OECD Countries 14 11,446 0.00158 0.00583 Other Western Europe 15 828 0.00053 0.00951 Comnunist Area in Asia 18 6,603 0.00023 0.00329 Japan 19 40,100 0.00057 0.00251 Near East Asia 21 1,406 0.00016 0.00079 South Asia 22 3,453 0.00069 0.00739 Asia, N.E.C. 23 89,248 0.00059 0.00391 Australia and Oceania 24 2,453 0.00074 0.00347 Africa 25 639 0.00010 0.00029
I
Table IV. The Import Low Value Factors FA y b World Area Using ABI Data
6 Under $251
World Area Code
Record Count
1
FA,L
$251-$1000
2
FA,L
(04) Central American Cornnon Market
34
*
Table V. The Import Low Value Factors FA (ABI) and Fc (Current) By World Area and Country
a
2050 2110 2150 2190 2230
Guatamala Salvador
Costa Rica
(05) Latin American Free Trade Area 0.00102 0.00400
2010 Mexico 0.00206 0.00138 0.00785 0.00548 3010 Colombia 0.00008 0.00297 0.00020 0.01444 3070 Venezuela 0.00001 0.00002 0.00003 0.00009 3310 Equador 0.00002 0.00016 0.00036 0.00049 3330 Peru 0.00034 0.00035 0.00062 0.00069 3350 Bolivia 0.00372 0.00042 0.00776 0.00033 3370 Chile 0.00029 0.00028 0.00098 0.00106 3510 Brazil 0.00025 0.00040 0.00098 0.00106 3530 Paraguay 0 0.00080 0 0.00133 3550 Uruguay 0.00012 0.00030 0.00116 0.00032 3570 Argentina 0.00033 0.00051 0.00089 0.00129
(06) Other Latin American Republic 0.00053 0.00365
2250 2390 2450 2470
Panama
Haiti Domican Republic
1
FA
0.00030
0.00019 0.00189 0.00018
0.00022
0.0003
0.0011 0.0004
1
FC
0.00110 0.00060 0.00249 0.00060 0.00193 0.00151 0.00021 0.00046 0.00057 0 -- 0.00307 0.00068 0.00372 0.00292
0.00047 0.00506 0.00135 0 -- 0 0.00302 0.00961 0.00608 0.00240 0.00165 0.00652
2
FA
0.00167
2
Fc .
35
Table V. Continued
(07) Other Western Hemisphere
1010 1610 2080 2320 2360 2410 2430 2440 2481 2482 2483 2484 2485 2486 2487 2488 2489 2720 2740 2770 2771 2779 2830 3120 3150 3170 3720
Greenland
Belize Bermuda Bahamas Jamaica Turk Is. Cayman
St. C N Antigua
Dominca S Lucia S Vincent Grenada Barbados Trinidad
N Anti1
F W Ind Guyana Surinam F Guian
1
FA
0.00217
li I
FC
-- 0.00017 -- 0.00012
0.00353 0.00063 0.02689 0.00251 0.00128 0.00014 0.00055 0.00158
-- 0.00103 0.00036 0.00060
-- 0.00117 -- 0.00062
0.00142 0.00122 0.23761 0.00339
-- 0.00049 -- 0.00251
0.00180 0.01128 -- 0.00218 -- 0.00033
0.00057 0.00096 0.00067 0.00002
-- -- -- 0.00019 -- 0 -- 0.00858 -- 0.00053 -- 0.00009 -- 0 -- 0.16184
2
FA
0.01295
--
0.26174 0.11275 0.00318 0.00174 0.00583
--
1.40660
--
0.00998 0.00623
-- --
0.33894 Be
2
FC
0.00017 0.00091 0.00283 0.01812 0.00042 0.00538 0.00758 0.00064 0.00462 0.00296 0.00209 0.00683 0.01295 0.51498 0.01258 0.00444 0.00034 0.00353 0.00019
-- 0.00058 0 0.03375 0.00184 0.00069 0 0.12300
36
13 ) Other EEC Countries
4090 Denmark 4190 Ire1 and 4210 Netherlands 4230 Belgium 4270 France 4700 Spain 4710 Portugual 4750 Italy 4840 Greece
(14) Other OECD Countries
a 1 I
FA FC
0.00167 0.00433
0.00274 0.00353 0.00788 0.00854 0.00111 0.00161 0.00581 0.00389 0.00124 0.00188 0.00557 0.00749 0.00055 0.00086 0.00272 0.00277 0.00099 0.00272 0.00367 0.00638 0.00053 0.00099 0.00230 0.00304 0.00111 0.00193 0.00587 0.00468 0.00295 0.00365 0.00506 0.00620 0.00092 0.00103 0.00502 0.00235
0.00158 0.00583
4000 Iceland 4010 Sweden 4030 Norway 4050 Finland 4330 Austria 4410 Switzerland 4890 Turkey
(15) Other Western Europe
0.00231 0.00048 -- 0.00044 0.00215 0.00238 0.00740 0.00741 0.00046 0.00041 0.00227 0.00140 0.00050 0.00138 0.00205 0.00477 0.00100 0.00243 0.00423 0.00886 0.00259 0.00199 0.00935 0.00704 0.00012 0.00083 0.00035 0.00177
0.00053 0.00951
4720 Gibralta -- 0.04755 -- 0.03427 4730 Malta -- 0.00122 0.00856 0.00726 4790 Yugoslavia 0.00049 0.00094 0.00938 0.00207 4910 Cyprus 0.01073 0.00061 0.03818 0.00206
Table V. Continued
2
FA

37
Table V. Continued
1
FA
0.00023 (18) Comunist Area in Asia
2
FA
0.00329
5520 5700 5740 5790
China M
-- 0.00023
-- --
0 0.00117 0.00903 0.02200
-- 0.00329
-- --
0 0.00359
0"
(21) Near East Asia 0.00016 0.00079
5020 5040 5050 5070 5080 5110 5120 5130 5170 5180 5200 5210 5220 5230 5250
Lebanon
Iran Israel
S. Arab Qatar Arab EM
-- 0.00186
-- 0.00001 0.00034
-- -- --
0.00026 0.04069 0.00048
-- --
0.04657 0.01110
0.03171 0.00448 0 0.00005 0.00057 0.00566 0 0.00002 0 0.00118 0.00030
8 0.00005 0.00165
--
0.00079 -- --
0.00195 -- -- --
0.00088 0.41914 0.00510
--
Oman Bahrain
--
0.14500 0.05723
0.01484 0.01013 0.00941 0.00011 0.00219 0.00803 0.02651 0.00025 0.00002 0.02329 0.00033 0.00978 0 0.00026 0.00077
(22) South Asia 0.00069 0.00739
5310 5330 5350 5360 5380 5420
India Pakistan
Bangladesh Sri Lanka
-- 0.00071 -- 0 0.00124 0.00099 0.00847 0.00157 0.00039 0.00097 0.00222 0.00177
-- 0.00248 -- 0.01279 0.00010 0.00037 0.00479 0.00007 0.00010 0.00102 0.00218 0.00128
(23) Asia, N.E.C.
5460 5490 5530 5550 5570 5590 5600 5610 5650 5660 5682 5683 5800 5820 5830
Thailand
Malaysia Singapore Indonesia
Phil R Macao Bhutan
Kor Rep Hong Kong China T
(24) Australia and Oceania
6021 6022 6023 6024 6029 6040 6141 6142 6143 6144 6150 6223 6224
Australia
N. Zealand
I
FA
0.00059
4 1
FC
0.00010 0.00003 0.00047 0.00154
-- 0.00081 -- 0
0.00090 0.00065 0.00043 0.00073 0.00021 0.00022
-- 0 0.00097 0.00203 0.00019 0.00109
-- 0.00663 -- 0.00076
0.00026 0.00061 0.00123 0.00276 0.00057 0.00191
0.00074
0.00095 -- -- -- --
0.00002 0.00031
-- -- -- -- -- --
0.00079 0 0 0.00310 0.21428 0.00014 0.00086 0 0.00319 0.00557 0.07505 0.00136 0.00685
38
4
Table V. Continued
2
FA
0.00391
0.00303
--
0.00562 0.00221 0.00024
-- 0.00866 0.00633
--
0.00166 0.00665 0.00502
0.00347
0.00426
-- --
0.00167
2
FC
0.00145 0.00624 0.00914 0.00417 0.00284 0.00291 0.00024 0.00014 0.00586 0.00368 0.05948 0 0.00196 0.00826 0.00669
0.00242 0 0 0.01345 0.21428 0.00095 0.00317 0.00094 0.06202 0 0.05884 0.00421 0.01567
(24) Australia and Oceania (continued)
6225 --
6226 --
6227 --
6412 --
6413 --
6414 --
6810 --
6820 --
6850 --
6862 --
6863 --
6864 --
(25) Africa 0.00010 0.00029
7140 7210 7230 7250 7290 7320 7370 7380 7410 7420 7440 7450 7460 7470
Morocco
Tunisia
Ecu pt
I
FA
0.23662 0.00717 0 0.00010 0.00076 0
-- --
0.00224 0.00549 0.00255 0.02579
0.00293 0.00467 -- 0
0.00136 0.01040 -- 0
0.00003 0.00079 -- 0.00021 -- 0 -- 0 -- 0 -- 0.00001 -- 0.00348 -- 0.04005 -- 0.00004 -a 0
39
,
Table V. Continued
2
FA
-- --
--
-- --
0.05219
0.01890
0.01549 --
0.00002 -- --
-- --
2
FC
0.31387 0.01016 0 0.00095 0.00076 0.01902
--
0.02453 0 0.01621 0.05319
0.00215 0.00002 0.00132 0.01081 0.00106 0.00127 0
8 0.00001 0.01729 0.02704 0.00015 0.00001

40
(25)7tg;ica (c$i;tw;d)
7490 7500 7510 7520 7530 7540 7550 7560 7580 7600 7610 7620 7630 Co Braz 7642 7643 7644 7650 7660 7670 7690 7700 7740 Ethiopia 7770 7780 7790 Kenya
0.00012
--
-- --
-- --
-- -- -- --
-- -- --
-- -- --
-- --
0.00008
e
Table V. Continued 1
Fc a
0.00005 0.00010 0.00768 0.00926 0 0.00002 0.0017fi 0.00009 0 0.00090 0.10412 0.05631 0 0.00002 0 0 0 0.00002 0.00024 0.00047 0 0.05654 0.00012 0 0.00006 0.00102
2
FA
0.00025 -- -- --
-- --
-- --
0.00132
-- -- --
--
0.00030
0.00254
2
FC
0.00027 0.00055 0.01656 0.00656 0.00001 0.00005 0.00009 0.00009 0 0.00350 0.19092 0.05067 0 0.00003 0.06677 0.00228 0.01118 , 0.00050 0.00060 0.00117 0 0.03730 0.00063 0 0.00003 0.00406
41
Table V. Continued
7800 7810 7830 7850 7870 7880 7890 7900 7910 7920 7930 7940 7950 7960 7970 7990
Maurit
Malawi
(2) Canada (11) United Kingdom (12) Federal Republic of Germany (19) Japan
-- 0.06191 -- 0.00816 -- 0.00058
0.00040 0.00070 -- 0.00122 -- 0 -- o.oog19 -- 0
0.00026 0.00018 -- 0.00035 -- 0.00409 -- 0 -- 0 -- 0.00046 -- 0.00026
0.00122 0.00554
0.00167 0.00181 0.00842 0.00652 0.00172 0.00202 0.00614 0.00669 0.00146 0.00224 0.00604 0.00859 0.00057 0.00106 0.00251 0.00395
F;
0.00824
--
0.00063 -- --
--
0.03759
2
FC
0.02180 0.01119 0.00316 0.00033 0.00039 0.00038 0.00240 0.00700 0.00055 0.00097 0.00161 0.00002 0 0.00166 0.00057 0.00100
42
Country Country Code
I 1
FA,U FA,"-F;," FS,” 2
FA,U
2 2
FA,U-FC,U
A
(F2 *,“-F;,“)/FI x
Canada 1220 0.00282 0.00390 0.00108 38.45 0.00886 0.01099 0.00213 24.04 Japan 5880 0.00143 0.00112 -0.00031 -21.91 0.00402 0.00319 -0.00083 -20.65 China T 5830 0.00409 0.00183 -0.00226 -55.19 0.01003 0.00772 -0.00231 -23.03 Italy 4750 0.01253 0.00752 -0.00501 -39.95 0.00686 0.00695 0.00009 1.31 FR Germ 4280 0.00299 0.00223 -0.00076 -25.37 0.00835 0.00673 -0.00162 -19.40 Mexico 2010 0.00254 0.00247 -0.00007 -2.92 0.00666 0.00728 0.00062 9.31 Hong Kong 5820 0.00690 0.00252 -0.00438 -63.44 0.01009 0.01122 0.00113 11.20 U. K. 4120 0.00374 0.00260 -0.00114 -30.36 0.00735 0.00742 0.00007 0.95 Kor Rep. '5800 0.00197 0.00077 -0.00120 -61.08 0.00327 0.00297 -0.00030 -9.17 France 4270 0.00619 0.00216 -0.00403 -65.13 0.00660 0.00494 -0.00166 -25.15 China M 5700 0.00273 0.00104 -0.00169 -61.76 0.00381 0.00520 0.00139 36.48 Singapore 5590 0.00114 0.00092 -0.00022 -19.17 0.00322 0.00283 -0.00039 -12.11 Switzerland 4410 0.00270 0.00340 0.00070 25.90 0.00625 0.00900 0.00275 44.00
B
Brazil 3510 0.00121 0.00054 -0.00067 -55.53 0.00127 0.00100 -0.00027 -21.26 Netherlands 4210 0.00319 0.00214 -0.00105 -33.01 0.00954 0.00626 -0.00328 -34.38 Malaysia 5570 0.00152 0.00143 -0.00009 -5.67 0.00560 0.00623 0.00063 11.25 Sweden 4010 0.00288 0.00281 -0.00007 -2.56 0.00644 0.00711 0.00067 10.40 Phil R 5650 0.00617 0.00252 -0.00365 -59.13 0.00910 0.01116 0.00206 22.64 Thailand 5490 0.00259 0.00137 -0.00121 -46.74 0.00589 0.00581 -0.00008 -1.36 Belgium 4230 0.00165 0.00141 -0.00024 -14.48 0.00359 0.00370 0.00011 3.06 Spain 4700 0.00342 0.00142 -0.00200 -58.45 0.00505 0.00374 -0.00131 -25.94 India 5330 0.00481 0.00298 -0.00183 -37.95 0.00291 0.00898 0.00607 208.59
Table VI. With
Comparison of the Current Updating Factors (Fc,") the Updating Factors Using ABI Data (FA,")
Under $251 Between $251 and $1000
43
Country Country Code
1 Fc,u
1 1 1
FA,U FA,U-FC,U IF; u- F; "l/F; u , , , Fi,” C %
Australia 6021 0.00117 0.00178 0.00062 52.98 0.00271 Dom Rep. 2470 0.00282 0.00087 -0.00195 -69.27 0.00563 Portugal 4710 0.00693 0.00296 -0.00397 -57.36 0.00738 Israel 5080 0.00104 0.00129 0.00026 24.80 0.00257 Costa Rica 2230 0.00198 0.00062 -0.00136 -68.54 0.00549 Haiti 2450 0.00810 0.00297 -0.00514 -63.44 0.00869 Finland 4050 0.00310 0.00084 -0.00226 -72.99 0.00533 Ire1 and 4190 0.00374 0.00314 -0.00060 -15.94 0.00446 Austria 4330 0.00476 0.00223 -0.00253 -53.12 0.00891 Yugoslavia 4790 0.00247 0.00206 -0.00041 -16.49 0.00294 Indonesia 5600 0.00084 0.00016 -0.00067 -80.02 0.00044 Macao 5660 0.00509 0.00104 -0.00405 -79.54 0.00402 Guatamala 2050 0.00247 0.00040 -0.00207 -83.92 0.00381 Jamaica 2410 0.00341 0.00041 -0.00300 -88.04 0.00571 Antigua 2484 0.00826 0.06075 0.05249 635.42 0.01541 Colombia 3010 0.00493 0.00019 -0.00474 -96.15 0.01546 Uruguay 3550 0.00162 0.00024 -0.00138 -85.45 0.00041 Argentina 3570 0.00084 0.00058 -0.00026 -31.07 0.00176 Norway 4030 0.00144 0.00167 0.00023 15.88 0.00300 Hungary 4370 0.00298 0.00074 -0.00224 -75.32 0.00430 Greece 4840 0.00332 0.00207 -0.00125 -37.73 0.00362 Turkey 4890 0.00206 0.00034 -0.00172 -83.66 0.00146 Paki'itan 5350 0.00465 0.00052 -0.00413 -88.72 0.00212 Bangladesh 5380 0.00093 0.00015 -0.00078 -84.38 0.00011 Sri Lanka 5420 0.00247 0.00112 -0.00135 -54.62 0.00183 New Zealand 6141 0.00162 0.00068 -0.00094 -57.97 0.00360
Table VI. Continued
a
Under $250 Between $251 and $1000
2 2 2
FA,U FA,U-FC,U
0.00405 0.00239 0.00843 0.00501 0.00220 0.01244 0.00188 0.00624 0.00637 0.01324 0.00028 0.00384 0.00027 0.00397 0.34154 0.00066 0.00198 0.00150 0.00434 0.01256 0.00534 0.00064 0.00639
0.00894 0.00238
0.00134 49.45 -0.00324 -57.55
0.00105 14.23 0.00244 94.94
-0.00329 -59.93 0.00375 43.15
-0.00345 -64.73 0.00178 39.91
-0.00254 -28.51 0.01030 350.34
-0.00016 -36.36 -0.00018 -4.48 -0.00354 -92.91 -0.00174 -30.47
0.32613 2116.35 -0.01475 -95.41 0.00157 382.93
-0.00026 -14.77 0.00134 44.67 0.00826 192.09 0.00172 47.51
-0.00082 -56.16 0.00427 201.42
-- e- 0.00711 388.52
-0.00122 -33.89
Country Country Code
A Canada Japan China T Italy FR Germany Mexi co Hong Kong U. K. Kor Rep France China M Singapore Switzerland B Brazil Netherlands Malaysia Sweden Phil R Thailand Belgium Spain India
1220 0.00167 0.00263 0.00096 5880 0.00057 0.00082 0.00025 5830 0.00057 0.00101 0.00044 4750 0.00295 0.00728 0.00433 4280 .0.00146 0.00192 0.00046 2010 0.00206 0.00266 0.00060 5820 0.00123 0.00134 0.00011 4120 0.00172 0.00225 0.00053 5800 0.00026 0.00039 0.00013 4270 0.00099 0.00160 0.00061 5700 0.00023 0.00063 0.00040 5590 0.00043 0.00059 0.00016 4410 0.00259 0.00331 0.00072
3510 0.00025 0.00031 0.00006 24.00 4210 0.00124 0.00149 0.00025 20.51 5570 0.00090 0.00143 0.00054 60.00 4010 0.00215 0.00272 0.00057 26.51 5650 0.00097 0.00181 0.00084 86.60 5490 0.00047 0.00071 0.00024 51.06 4230 0.00055 0.00092 0.00037 67.27 4700 0.00053 0.00071 0.00018 33.96 5330 0.00124 0.00220 0.00096 77.42
F1
44
Table VII. Comparison of the Low Value Fac.ior Fl'With the Same Increment Factor Fxc by Country Using ABI Data
FIG F “-FL (F"-Fj/F1
X 57.40 43.86 77.19
146.78 31.64 29.13
8.94 31.10 50.00 62.09
175.65 37.21 27.80
Country
C Australia Dom Rep Portugal Israel Costa Rico Haiti Finland Ireland Austria Yugoslavia Indonesia Macao Guatamala Jamaica Antigua Colombia Uruguay Argentina Norway Hungary Greece Turkey Pakistan Bangladesh Sri Lanka New Zealand
Country Code F' FIG +F1 (FILF’J i
6021 0.00095 0.00121 0.00025 2470 0.00040 0.00080 0.00040 4710 0.00111 0.00159 0.00048 5080 0.00034 0.00056 0.00022 2230 0.00022 0.00070 0.00050 2450 0.00107 0.00155 0.00048 4050 0.00050 0.00079 0.00029 4190 0.00111 0.00186 0.00075 4330 0.00100 0.00137 0.00037 4790 0.00049 0.00129 0.00080 5600 0.00021 0.00026 0.00005 5660 0.00019 0.00050 0.00031 2050 0.00019 0.00029 0.00010 2410 0.00055 0.00041 -0.00014 2484 0.23761 0.15031 -0.02665 3010 0.00008 0.00008 0 3550 0.00012 0.00027 0.00015 3570 0.00033 0.00044 0.00011 4030 0.00046 0.00095 0.00049 4370 0.00099 0.00049 -0.00050 4840 0.00092 0.00166 0.00074 4890 0.00012 0.00013 0.00001 5350 0.00039 0.00060 0.00021 5380 0.00010 0.00019 0.00009 5420 0.00010 0.00020 0.00010 6141 0.00031 0.00059 0.00028
% 26.2;
lOO.Oil 43.2(' 64.71
250.00 44.86 58.00 67.57 37.00
163.27 23.81
163.16 52.63
-25.45 -15.06
0 125.00 33.33
106.52 -50.51 80.43 8.33
53.85 90.00
100.00 90.32
Note: F' = T(0,250]'(T250+ - T;250, lOOO]) F IC
= T(250, 500]'(T250+ - T;250, 1000,)
Related Documents