http://itconfidence2013.wordpress.com Analysis of ISBSG Data for Understanding Software Testing Efforts 1°International Conference on IT Data collection, Analysis and Benchmarking Rio de Janeiro (Brazil) - October 3, 2013 K R Jayakumar & Alain Abran Email: [email protected] [email protected] ANALYSIS OF ISBSG R12 DATA FOR UNDERSTADING TESTING EFFORTS Insert here a picture

Welcome message from author
This document is posted to help you gain knowledge. Please leave a comment to let me know what you think about it! Share it to your friends and learn new things together.
Transcript
http://itconfidence2013.wordpress.com
Analysis of ISBSG Data for Understanding
Software Testing Efforts
1°International Conference on IT Data collection, Analysis and Benchmarking
Rio de Janeiro (Brazil) - October 3, 2013
K R Jayakumar &
Alain Abran
Email: [email protected] [email protected]
ANALYSIS OF ISBSG R12 DATA FOR UNDERSTADING TESTING EFFORTS
Insert here a picture

2IT Confidence 2013 – October 3, 2013
http://itconfidence2013.wordpress.com© K R Jayakumar & Alain Abran
Test Effort Analysis Questions we will try to answer
Q1. How does functional size relate to software testing efforts?
Q2. What are the typical test productivity ranges?Q3. What are the influences of reviews on test efforts?Q4. What is the effect of % life cycle efforts spent on
testing?Q5. Does automated testing affect test efforts?Q6. What is the influence of application domains &
engineering approaches on testing efforts?
3IT Confidence 2013 – October 3, 2013
http://itconfidence2013.wordpress.com© K R Jayakumar & Alain Abran
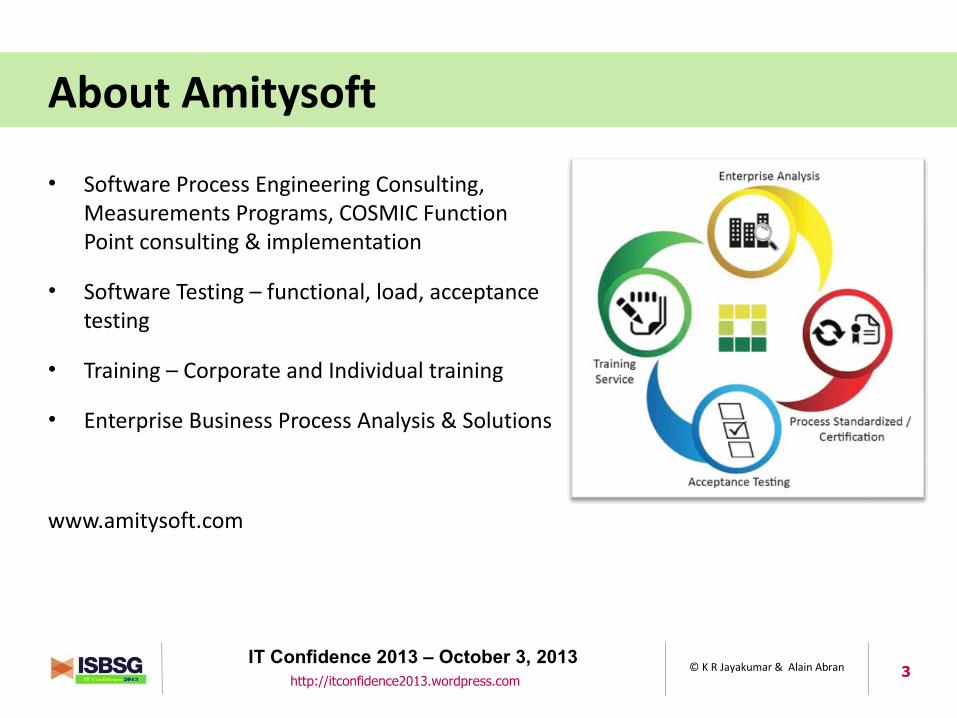
About Amitysoft
• Software Process Engineering Consulting, Measurements Programs, COSMIC Function Point consulting & implementation
• Software Testing – functional, load, acceptance testing
• Training – Corporate and Individual training
• Enterprise Business Process Analysis & Solutions
www.amitysoft.com
4IT Confidence 2013 – October 3, 2013
http://itconfidence2013.wordpress.com© K R Jayakumar & Alain Abran
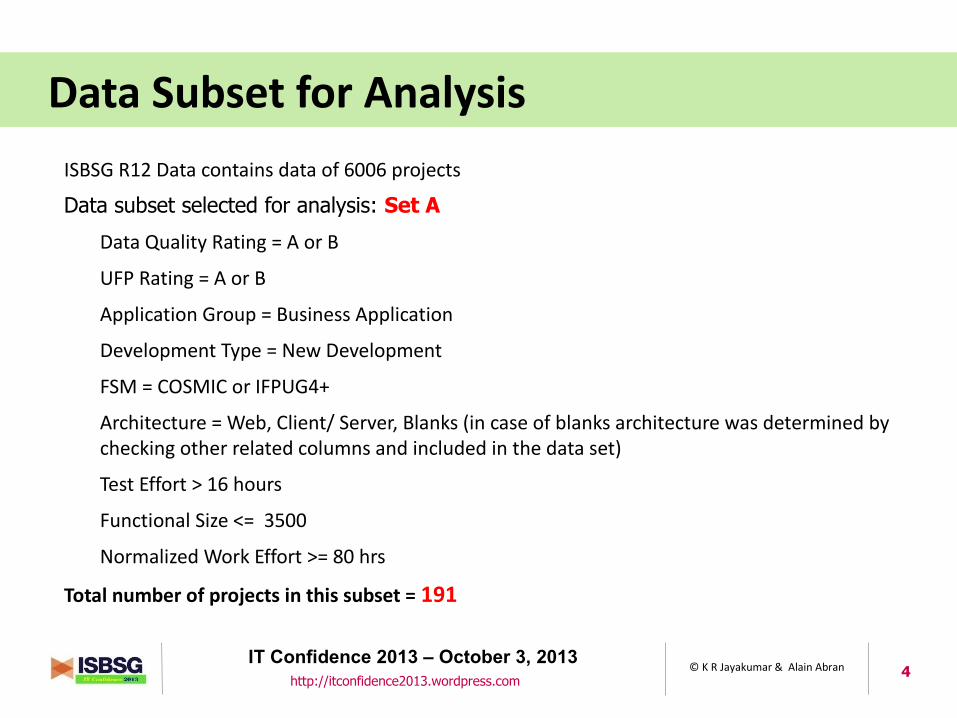
Data Subset for Analysis
ISBSG R12 Data contains data of 6006 projects
Data subset selected for analysis: Set A
Data Quality Rating = A or B
UFP Rating = A or B
Application Group = Business Application
Development Type = New Development
FSM = COSMIC or IFPUG4+
Architecture = Web, Client/ Server, Blanks (in case of blanks architecture was determined by checking other related columns and included in the data set)
Test Effort > 16 hours
Functional Size <= 3500
Normalized Work Effort >= 80 hrs
Total number of projects in this subset = 191
5IT Confidence 2013 – October 3, 2013
http://itconfidence2013.wordpress.com© K R Jayakumar & Alain Abran
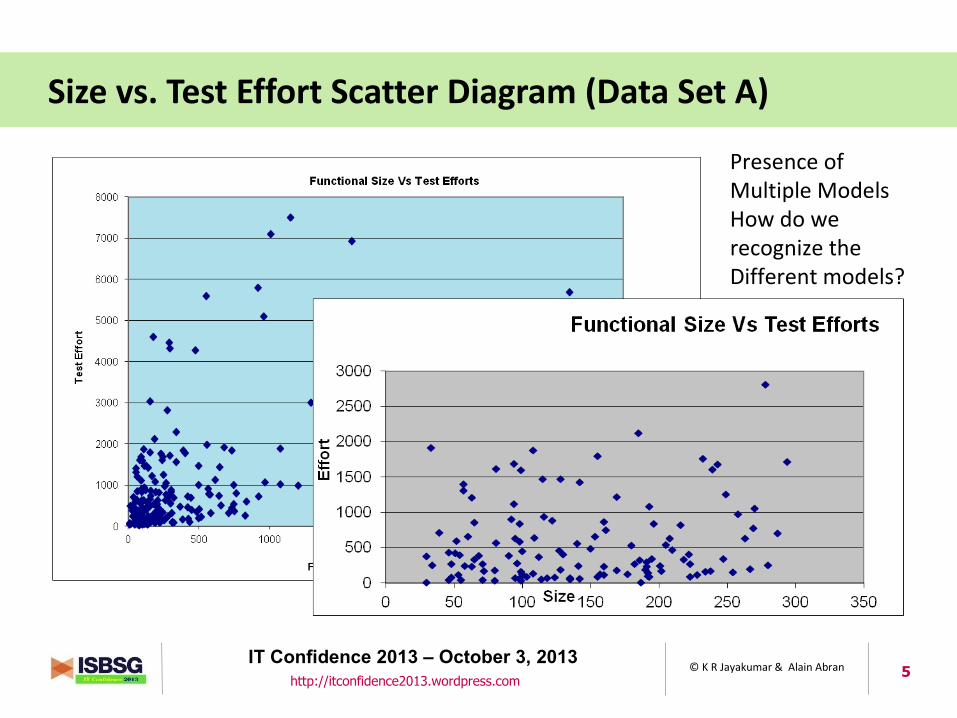
Size vs. Test Effort Scatter Diagram (Data Set A)
Presence of Multiple Models How do werecognize theDifferent models?
6IT Confidence 2013 – October 3, 2013
http://itconfidence2013.wordpress.com© K R Jayakumar & Alain Abran
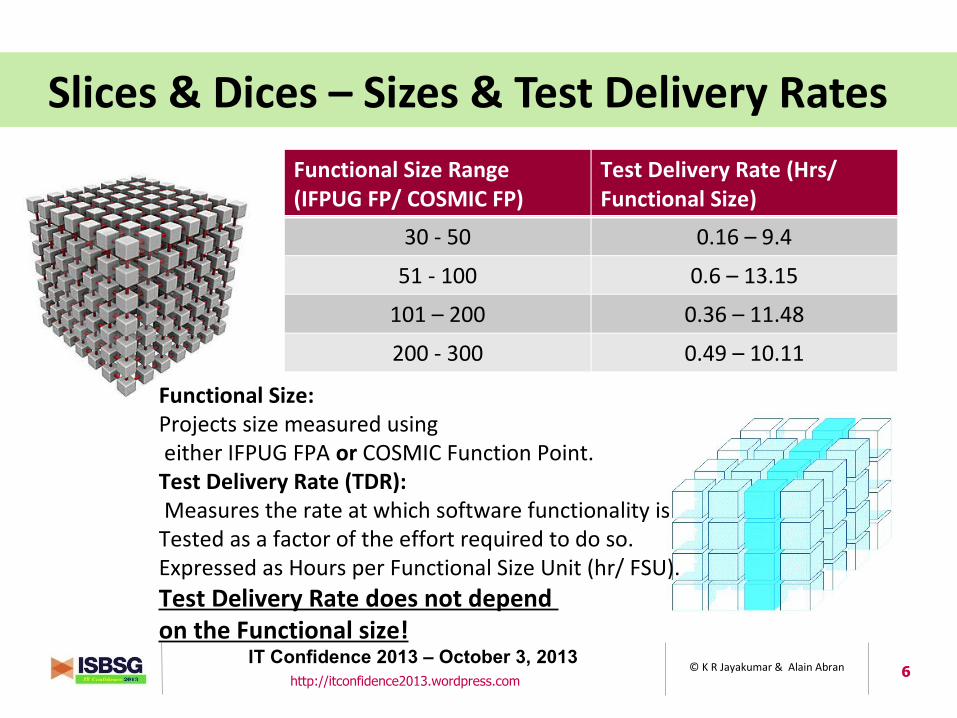
Slices & Dices – Sizes & Test Delivery Rates
Functional Size Range (IFPUG FP/ COSMIC FP)
Test Delivery Rate (Hrs/ Functional Size)
30 - 50 0.16 – 9.4
51 - 100 0.6 – 13.15
101 – 200 0.36 – 11.48
200 - 300 0.49 – 10.11
Functional Size: Projects size measured using either IFPUG FPA or COSMIC Function Point.Test Delivery Rate (TDR): Measures the rate at which software functionality is Tested as a factor of the effort required to do so. Expressed as Hours per Functional Size Unit (hr/ FSU).Test Delivery Rate does not depend on the Functional size!
7IT Confidence 2013 – October 3, 2013
http://itconfidence2013.wordpress.com© K R Jayakumar & Alain Abran
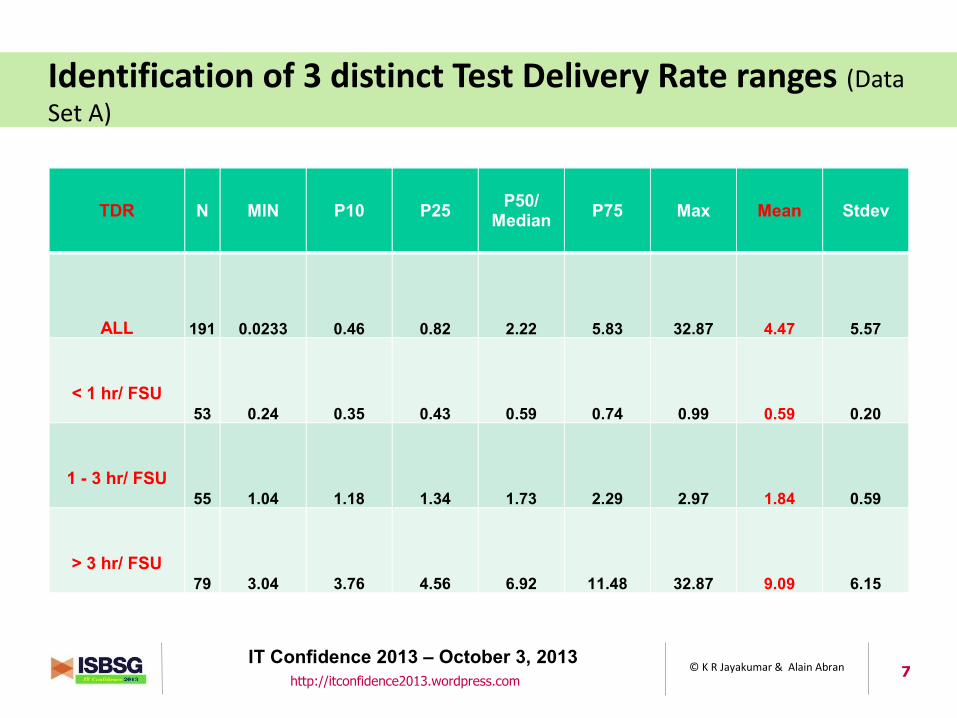
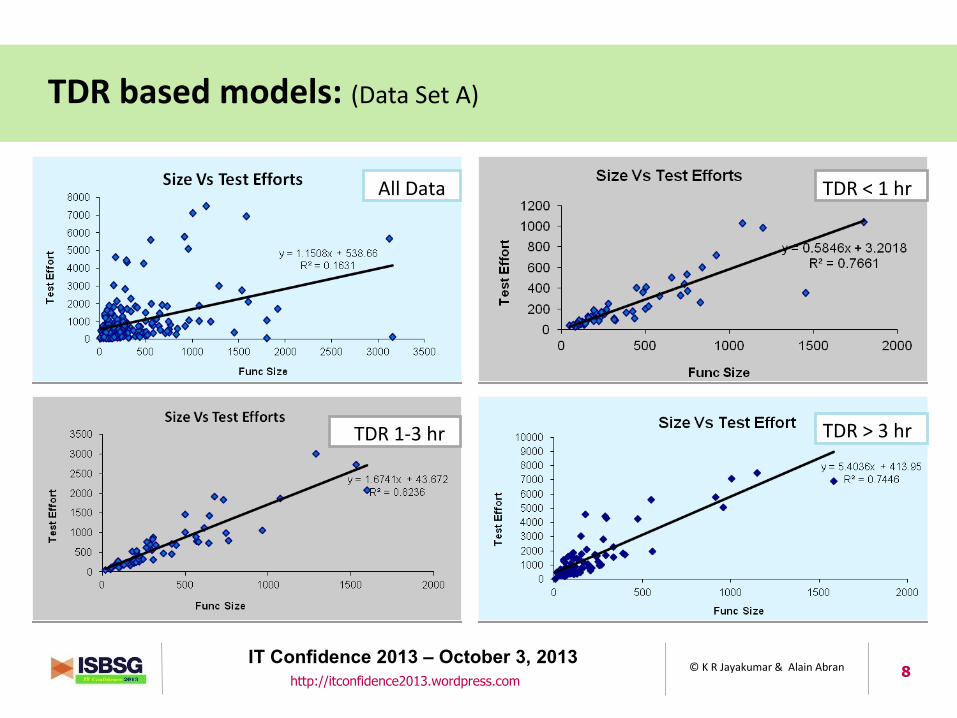
Identification of 3 distinct Test Delivery Rate ranges (Data Set A)
TDR N MIN P10 P25 P50/ Median P75 Max Mean Stdev
ALL 191 0.0233 0.46 0.82 2.22 5.83 32.87 4.47 5.57
< 1 hr/ FSU 53 0.24 0.35 0.43 0.59 0.74 0.99 0.59 0.20
1 - 3 hr/ FSU55 1.04 1.18 1.34 1.73 2.29 2.97 1.84 0.59
> 3 hr/ FSU 79 3.04 3.76 4.56 6.92 11.48 32.87 9.09 6.15
8IT Confidence 2013 – October 3, 2013
http://itconfidence2013.wordpress.com© K R Jayakumar & Alain Abran
TDR based models: (Data Set A)
All Data TDR < 1 hr
TDR 1-3 hr TDR > 3 hr
9IT Confidence 2013 – October 3, 2013
http://itconfidence2013.wordpress.com© K R Jayakumar & Alain Abran
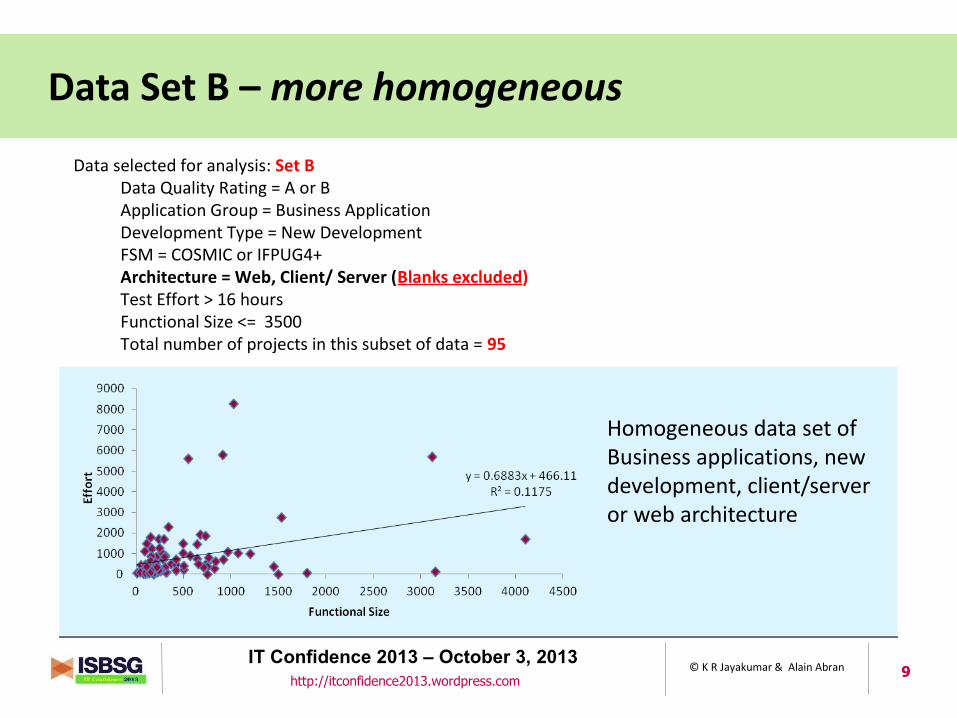
Data Set B – more homogeneous
Homogeneous data set of Business applications, new development, client/server or web architecture
Data selected for analysis: Set BData Quality Rating = A or BApplication Group = Business ApplicationDevelopment Type = New DevelopmentFSM = COSMIC or IFPUG4+Architecture = Web, Client/ Server (Blanks excluded)Test Effort > 16 hoursFunctional Size <= 3500Total number of projects in this subset of data = 95

10IT Confidence 2013 – October 3, 2013
http://itconfidence2013.wordpress.com© K R Jayakumar & Alain Abran
Identification of 3 distinct Test Delivery Rate ranges (Data Set B)
Test Delivery Rate - Key Statistics for Low Test Effort Projects (Less than 1 hr per functional size)
N P10 P25P50/
Median P75 P90 MIN MAX Mean SD
36 0.33 0.41 0.58 0.73 0.80 0.24 0.95 0.6 0.191
Test Delivery Rate - Key Statistics for Average Test Effort Projects (1 hr to less than 3 hrs per functional size)
N P10 P25P50/
Median P75 P90 MAX MIN Mean SD
23 1.07 1.28 1.59 2.12 2.58 2.89 1.04 1.72 0.566
Test Delivery Rate - Key Statistics for High Test Effort projects (Above 3 hrs per functional size)
N P10 P25P50/
Median P75 P90 MAX MIN Mean SD
11 3.29 3.69 4.30 4.95 6.90 8.3 3.08 4.7 1.611
Test Delivery Rate - Key Statistics
N P10 P25P50/
Median P75 P90 Min Max Mean SD
95 0.357 0.583 1.142 2.917 6.583 0.004 12.800 2.357 2.791

11IT Confidence 2013 – October 3, 2013
http://itconfidence2013.wordpress.com© K R Jayakumar & Alain Abran
TDR based models: (Data Set B)E
fforts
Effo
rts
12IT Confidence 2013 – October 3, 2013
http://itconfidence2013.wordpress.com© K R Jayakumar & Alain Abran
Standard Test Delivery Rate based Models
TDR based individual model can be grouped into:
• Low Test Efforts consuming Less than 1 hr/ functional size – (LTE)
• Average Test Efforts consuming between 1 hr and < 3 hrs/ functional size –(ATE)
• High Test Efforts consuming > 3 hrs per functional size – (HTE)
These models are consistent between the larger data set (Data Set A) and its sub set (Data Set B)
Can we dwell deeper into analysis of other project characteristics to understand each of these 3 models better?
13IT Confidence 2013 – October 3, 2013
http://itconfidence2013.wordpress.com© K R Jayakumar & Alain Abran
Discussions on ‘extreme values’
Base data for each data set contain data from all projects which include extreme values at low and higher end.
A few projects exist with extreme values that can affect the individual model.
Test delivery rate such as 24, 26, 34 hrs per functional size are present as a part of HTE (> 3 hrs per functional size) model.
Most of these projects are of Banking Domain.
One of the projects developed using ‘Assembler’
Two of the projects are related to ‘Security’.
There is no clear pattern emerges of such extreme behavior.
Test delivery rate such as 0.001, 0.01, 0.03 hrs per functional size are present as a part of LTE (< 1 hrs per functional size model).
Such projects have taken test hours less than 16 hrs OR
Test hrs spent per functional size does not justify considering those projects
for analysis.
14IT Confidence 2013 – October 3, 2013
http://itconfidence2013.wordpress.com© K R Jayakumar & Alain Abran
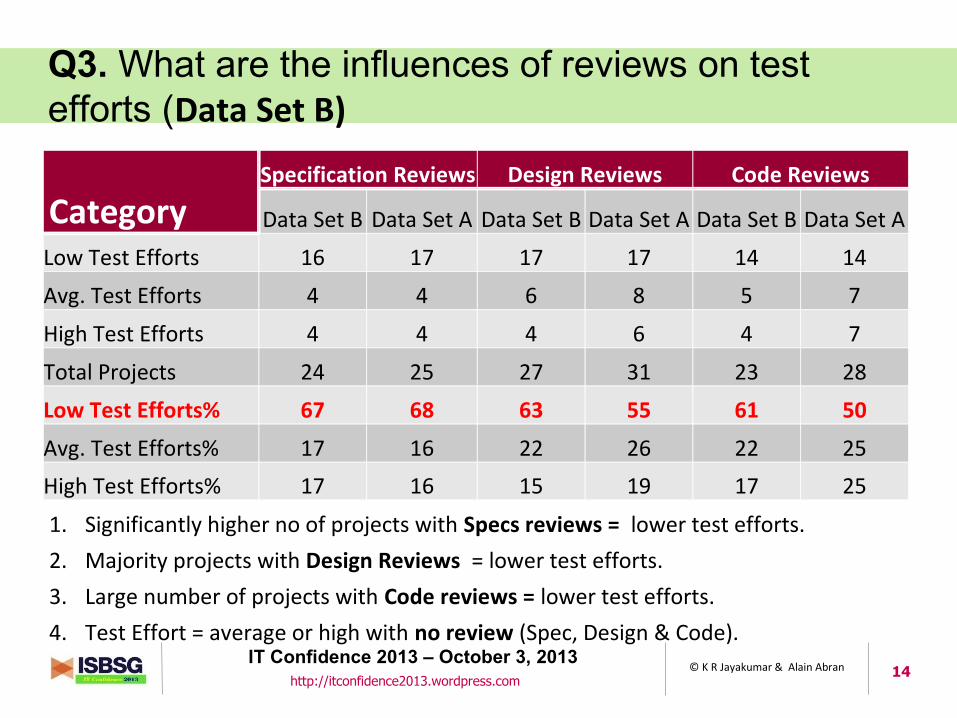
Q3. What are the influences of reviews on test efforts (Data Set B)
CategorySpecification Reviews Design Reviews Code Reviews
Data Set B Data Set A Data Set B Data Set A Data Set B Data Set A
Low Test Efforts 16 17 17 17 14 14
Avg. Test Efforts 4 4 6 8 5 7
High Test Efforts 4 4 4 6 4 7
Total Projects 24 25 27 31 23 28
Low Test Efforts% 67 68 63 55 61 50
Avg. Test Efforts% 17 16 22 26 22 25
High Test Efforts% 17 16 15 19 17 25
1. Significantly higher no of projects with Specs reviews = lower test efforts.
2. Majority projects with Design Reviews = lower test efforts.
3. Large number of projects with Code reviews = lower test efforts.
4. Test Effort = average or high with no review (Spec, Design & Code).
15IT Confidence 2013 – October 3, 2013
http://itconfidence2013.wordpress.com© K R Jayakumar & Alain Abran
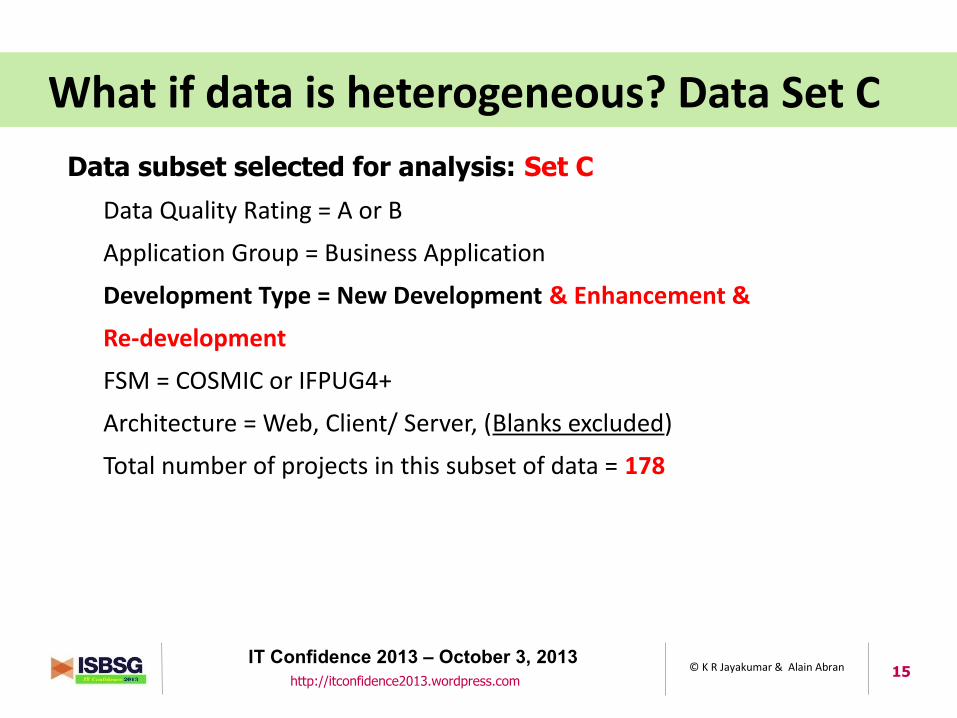
What if data is heterogeneous? Data Set C
Data subset selected for analysis: Set C
Data Quality Rating = A or B
Application Group = Business Application
Development Type = New Development & Enhancement &
Re-development
FSM = COSMIC or IFPUG4+
Architecture = Web, Client/ Server, (Blanks excluded)
Total number of projects in this subset of data = 178
16IT Confidence 2013 – October 3, 2013
http://itconfidence2013.wordpress.com© K R Jayakumar & Alain Abran
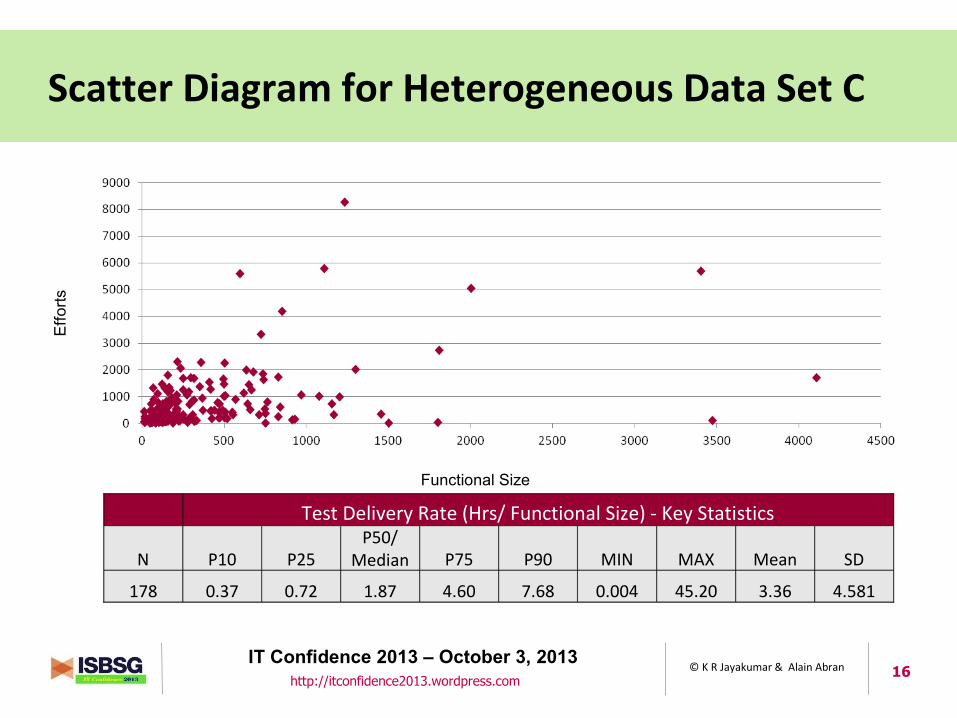
Scatter Diagram for Heterogeneous Data Set C
Test Delivery Rate (Hrs/ Functional Size) - Key Statistics
N P10 P25P50/
Median P75 P90 MIN MAX Mean SD
178 0.37 0.72 1.87 4.60 7.68 0.004 45.20 3.36 4.581
Functional Size
Effo
rts
17IT Confidence 2013 – October 3, 2013
http://itconfidence2013.wordpress.com© K R Jayakumar & Alain Abran
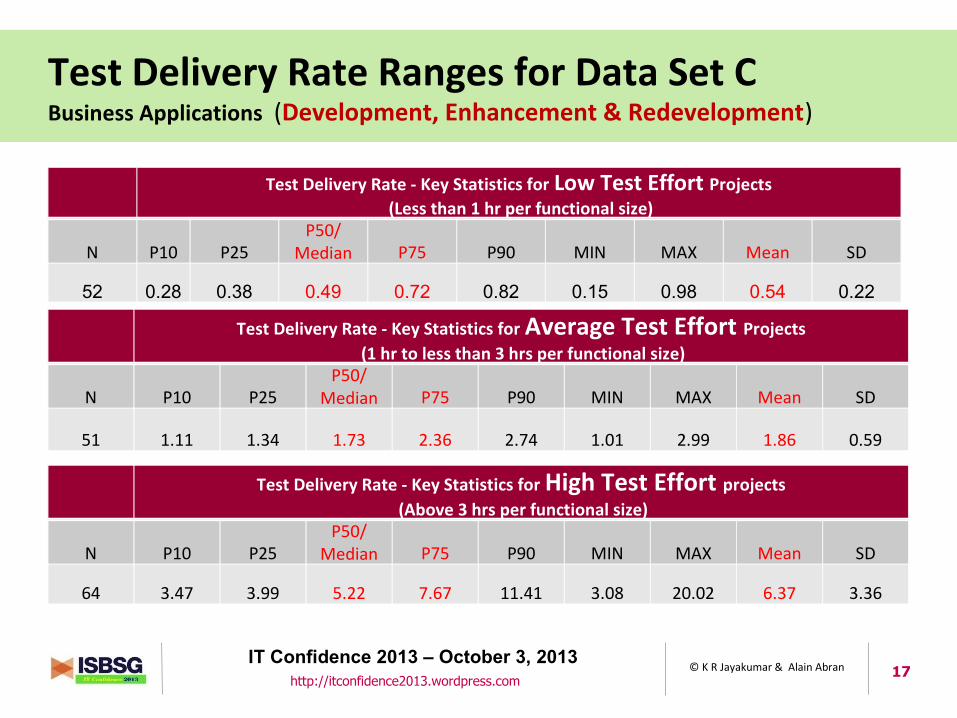
Test Delivery Rate Ranges for Data Set CBusiness Applications (Development, Enhancement & Redevelopment)
Test Delivery Rate - Key Statistics for Low Test Effort Projects (Less than 1 hr per functional size)
N P10 P25P50/
Median P75 P90 MIN MAX Mean SD
52 0.28 0.38 0.49 0.72 0.82 0.15 0.98 0.54 0.22
Test Delivery Rate - Key Statistics for Average Test Effort Projects (1 hr to less than 3 hrs per functional size)
N P10 P25P50/
Median P75 P90 MIN MAX Mean SD
51 1.11 1.34 1.73 2.36 2.74 1.01 2.99 1.86 0.59
Test Delivery Rate - Key Statistics for High Test Effort projects (Above 3 hrs per functional size)
N P10 P25P50/
Median P75 P90 MIN MAX Mean SD
64 3.47 3.99 5.22 7.67 11.41 3.08 20.02 6.37 3.36
18IT Confidence 2013 – October 3, 2013
http://itconfidence2013.wordpress.com© K R Jayakumar & Alain Abran
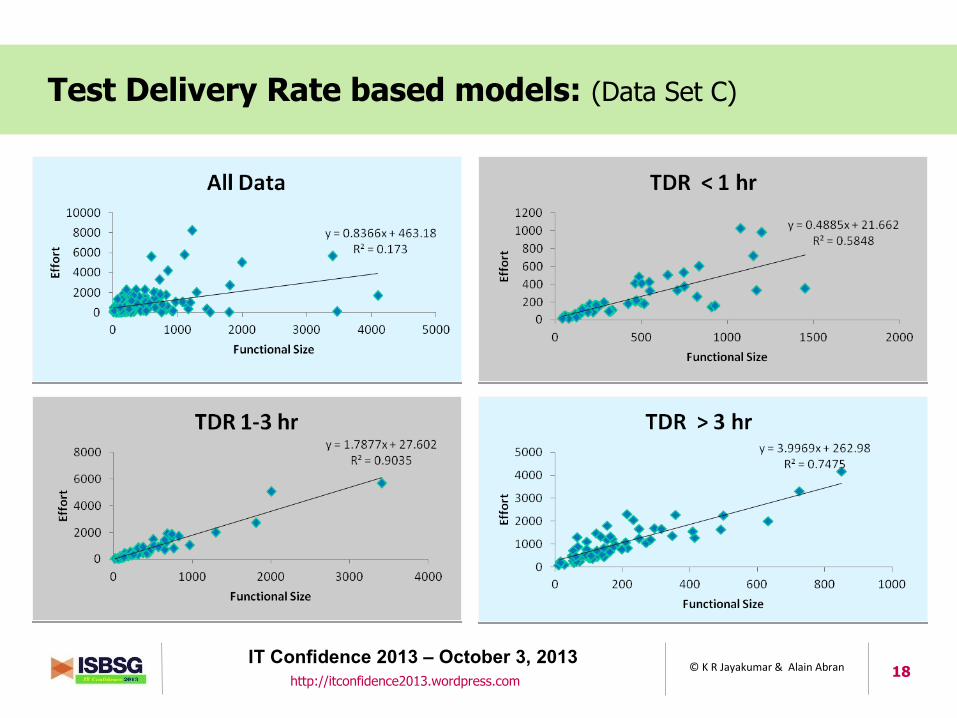
Test Delivery Rate based models: (Data Set C)E
fforts
19IT Confidence 2013 – October 3, 2013
http://itconfidence2013.wordpress.com© K R Jayakumar & Alain Abran
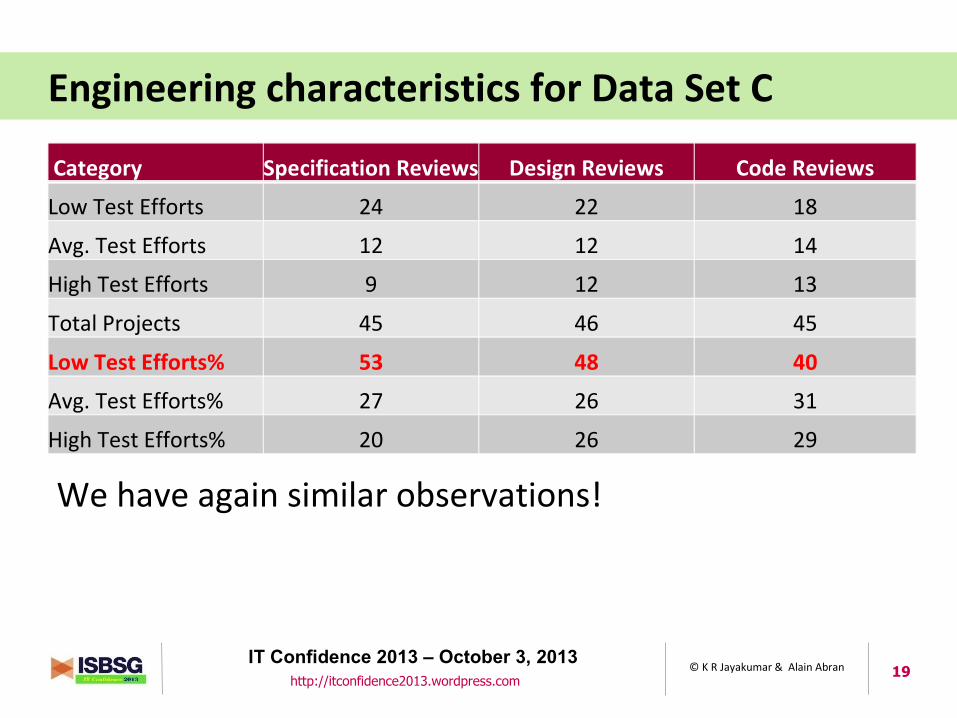
Engineering characteristics for Data Set C
Category Specification Reviews Design Reviews Code Reviews
Low Test Efforts 24 22 18
Avg. Test Efforts 12 12 14
High Test Efforts 9 12 13
Total Projects 45 46 45
Low Test Efforts% 53 48 40
Avg. Test Efforts% 27 26 31
High Test Efforts% 20 26 29
We have again similar observations!
20IT Confidence 2013 – October 3, 2013
http://itconfidence2013.wordpress.com© K R Jayakumar & Alain Abran
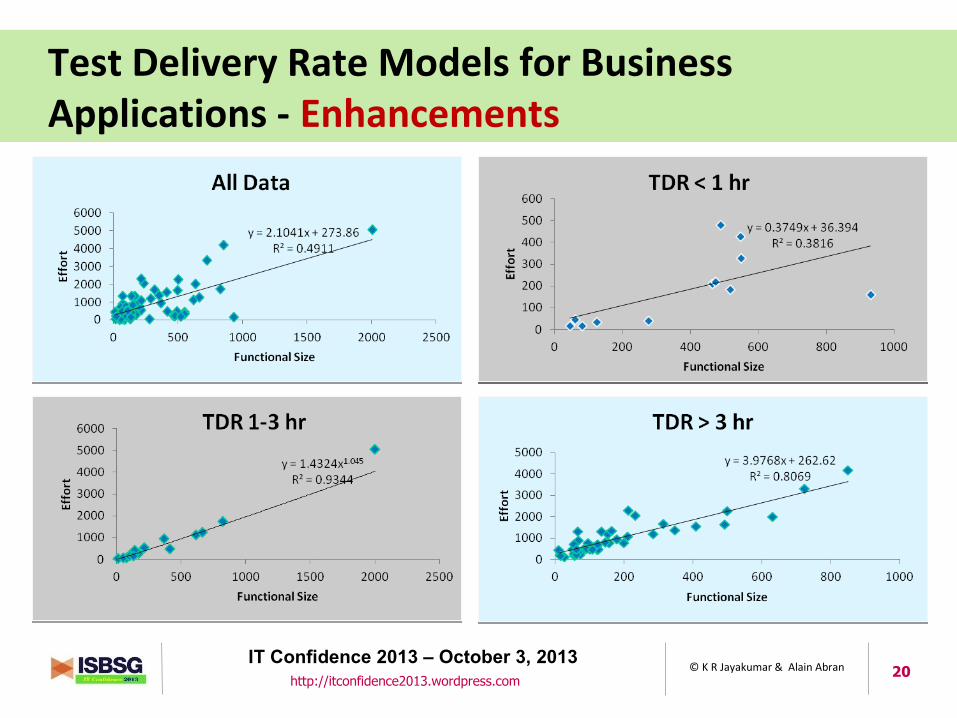
Test Delivery Rate Models for Business Applications - Enhancements
Effo
rts
21IT Confidence 2013 – October 3, 2013
http://itconfidence2013.wordpress.com© K R Jayakumar & Alain Abran
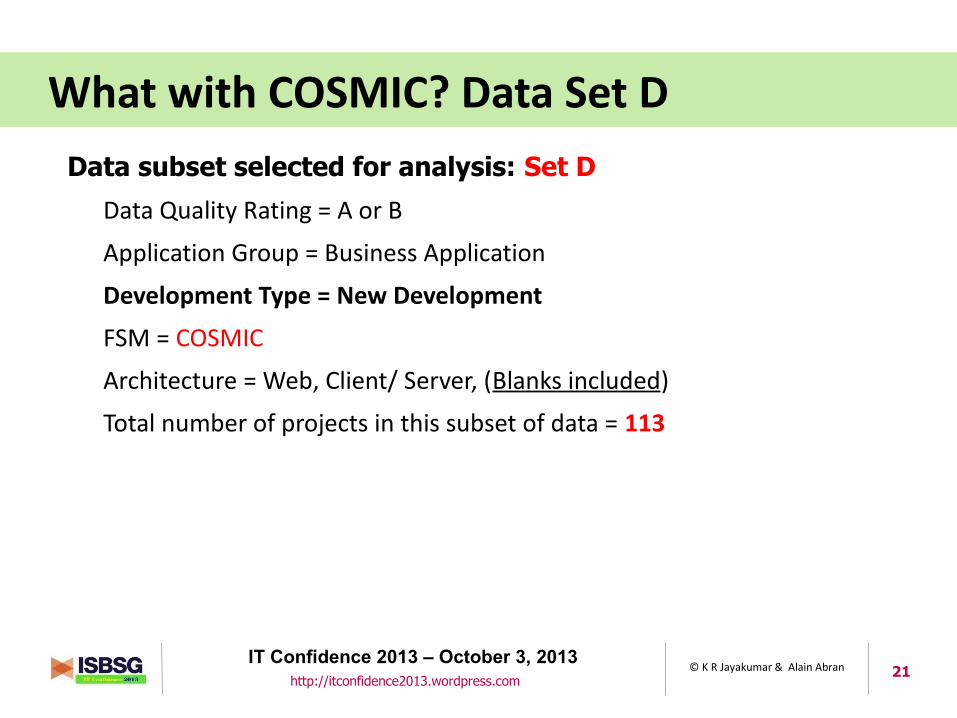
What with COSMIC? Data Set D
Data subset selected for analysis: Set D
Data Quality Rating = A or B
Application Group = Business Application
Development Type = New Development
FSM = COSMIC
Architecture = Web, Client/ Server, (Blanks included)
Total number of projects in this subset of data = 113

22IT Confidence 2013 – October 3, 2013
http://itconfidence2013.wordpress.com© K R Jayakumar & Alain Abran
Test Delivery Rate Ranges & RSQ for COSMICE
fforts
Sample Code N MIN P10 P25 P50 P75 Max Mean Stdev RSQ
Base Sample 113 0.2844 0.47 1.05 2.90 7.23 32.87 5.46 6.31 0.30< 1 hr / FSU 53.00 0.24 0.35 0.43 0.59 0.74 0.99 0.59 0.20 0.77
Bet 1 & 3 hrs / FSU 56.00 1.04 1.18 1.34 1.73 2.29 2.97 1.84 0.59 0.91> 3hrs / FSU 79 3.04 3.76 4.56 6.92 11.48 32.87 9.09 6.15 0.74
COSMIC Measured Project Data has better RSQ values for regressionBetween COSMIC Functional Size and Effort

23IT Confidence 2013 – October 3, 2013
http://itconfidence2013.wordpress.com© K R Jayakumar & Alain Abran
Q4. Effect of % life cycle efforts spent on testing
Statistic Low TE Projects Average TE Projects High TE Projects
N 53 55 74
Min 0.01 0.03 0.07
P10 0.04 0.34 0.17
P25 0.06 0.09 0.19
Median/P50 0.11 0.12 0.27
P75 0.15 0.16 0.36
Max 0.38 0.41 0.58
Mean 0.12 0.14 0.28
Std Dev 0.08 0.08 0.11
% Life cycle efforts for testing: 11% - 15% for Low Test Effort Projects, 12 % - 16% for Average Test Effort Projects and reaches 27% - 36% for High Test Effort Projects in P50 – P75.
24IT Confidence 2013 – October 3, 2013
http://itconfidence2013.wordpress.com© K R Jayakumar & Alain Abran
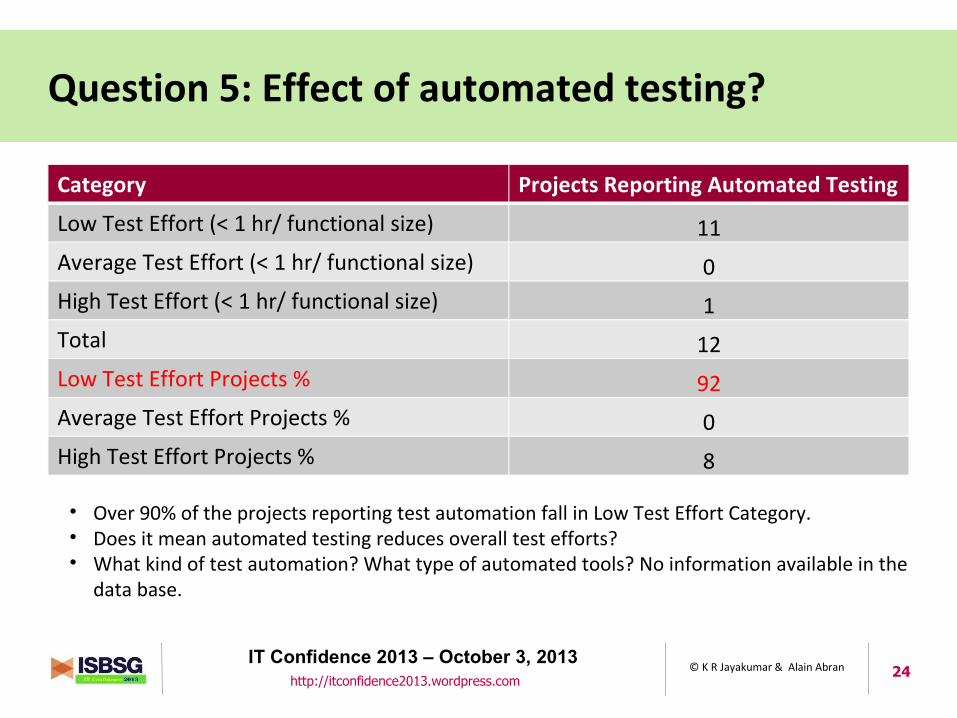
Question 5: Effect of automated testing?
• Over 90% of the projects reporting test automation fall in Low Test Effort Category.• Does it mean automated testing reduces overall test efforts?• What kind of test automation? What type of automated tools? No information available in the
data base.
Category Projects Reporting Automated Testing
Low Test Effort (< 1 hr/ functional size) 11Average Test Effort (< 1 hr/ functional size) 0High Test Effort (< 1 hr/ functional size) 1Total 12Low Test Effort Projects % 92Average Test Effort Projects % 0High Test Effort Projects % 8
25IT Confidence 2013 – October 3, 2013
http://itconfidence2013.wordpress.com© K R Jayakumar & Alain Abran
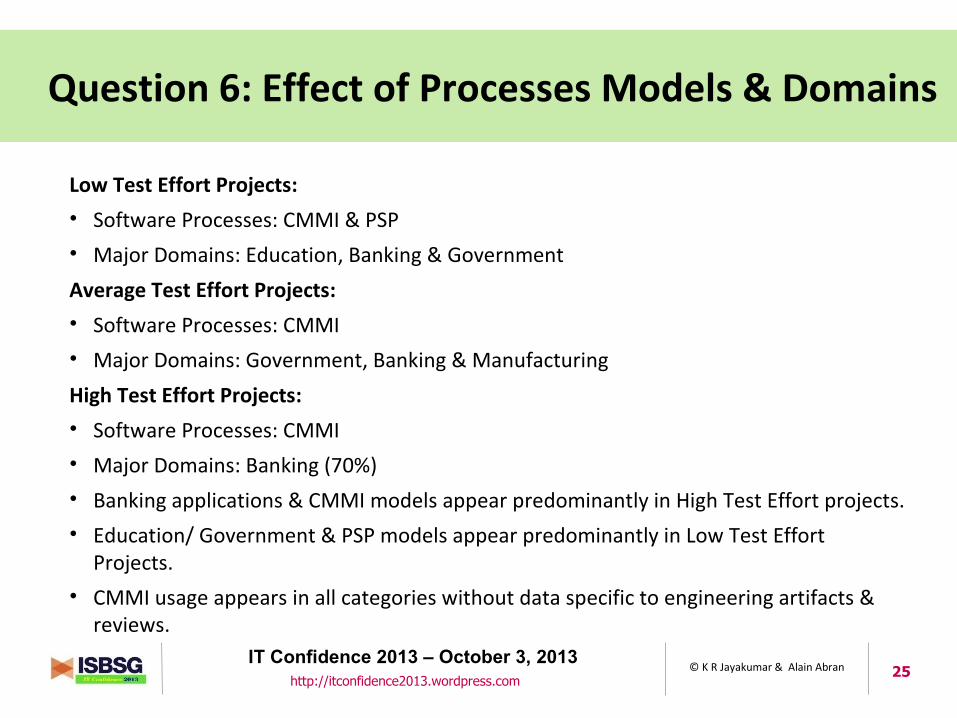
Question 6: Effect of Processes Models & Domains
Low Test Effort Projects:
• Software Processes: CMMI & PSP
• Major Domains: Education, Banking & Government
Average Test Effort Projects:
• Software Processes: CMMI
• Major Domains: Government, Banking & Manufacturing
High Test Effort Projects:
• Software Processes: CMMI
• Major Domains: Banking (70%)
• Banking applications & CMMI models appear predominantly in High Test Effort projects.
• Education/ Government & PSP models appear predominantly in Low Test Effort Projects.
• CMMI usage appears in all categories without data specific to engineering artifacts & reviews.
26IT Confidence 2013 – October 3, 2013
http://itconfidence2013.wordpress.com© K R Jayakumar & Alain Abran
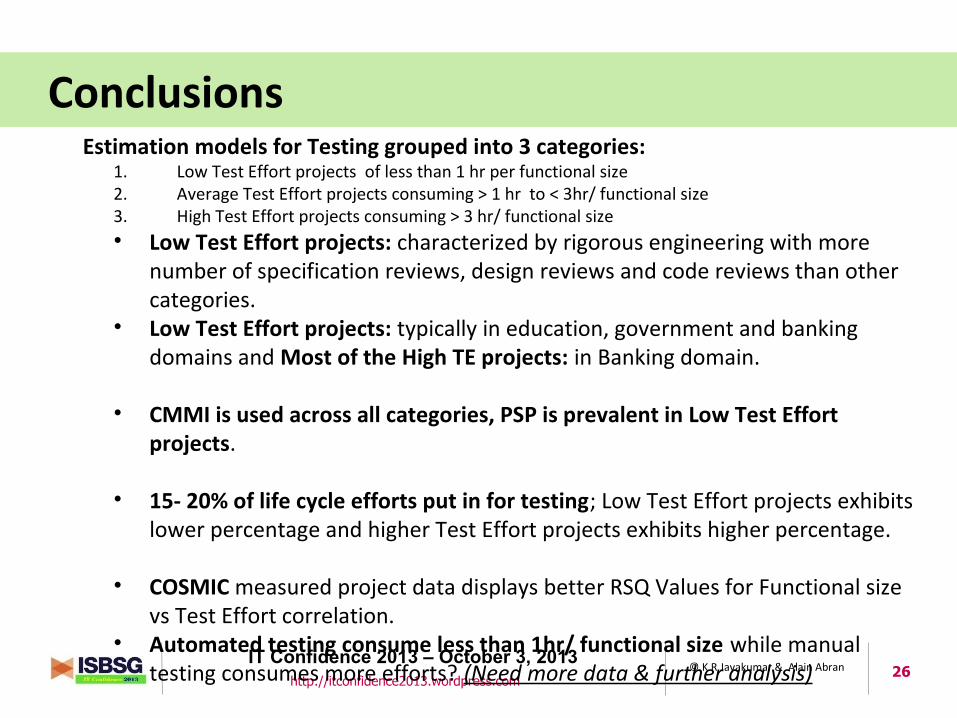
ConclusionsEstimation models for Testing grouped into 3 categories:
1. Low Test Effort projects of less than 1 hr per functional size2. Average Test Effort projects consuming > 1 hr to < 3hr/ functional size3. High Test Effort projects consuming > 3 hr/ functional size• Low Test Effort projects: characterized by rigorous engineering with more
number of specification reviews, design reviews and code reviews than other categories.
• Low Test Effort projects: typically in education, government and banking domains and Most of the High TE projects: in Banking domain.
• CMMI is used across all categories, PSP is prevalent in Low Test Effort projects.
• 15- 20% of life cycle efforts put in for testing; Low Test Effort projects exhibits lower percentage and higher Test Effort projects exhibits higher percentage.
• COSMIC measured project data displays better RSQ Values for Functional size vs Test Effort correlation.
• Automated testing consume less than 1hr/ functional size while manual testing consumes more efforts? (Need more data & further analysis)
27IT Confidence 2013 – October 3, 2013
http://itconfidence2013.wordpress.com© K R Jayakumar & Alain Abran
Feedback & AcknowledgementsImproving ISBSG Database:1) Release a report based on Testing (core presented in this presentation)2) Collect Test Effort data in detail:
Effort – Test: Data for testing efforts can be refined to capture Effort – Manual Testing, Effort – Automated Testing (Functional), Efforts – Performance Testing, Efforts – Security Testing, Efforts – Other Testing.
3) Start collecting data from testing only projects and produce benchmarks which would be useful for vendors of testing services.
Acknowledgements:Srikanth Aravamudhan, Colleague at Amitysoft participated in analysis andContributed to major observations.Lakshna, daughter of Jayakumar, 4th year University Student ofM.S. (Software Engineering), VIT University, India helped in statistical analysis.
THANK YOU FOR LISTENINGEmail: [email protected], [email protected]
Related Documents