1 Low-temperature thermal properties of an hyperaged geological glass Tomás Pérez-Castañeda 1 *, Rafael J Jiménez-Riobóo 2 and Miguel A Ramos 1 (1) Laboratorio de Bajas Temperaturas, Departamento de Física de la Materia Condensada, Condensed Matter Physics Center (IFIMAC) and Instituto Nicolás Cabrera, Universidad Autónoma de Madrid, E-28049 Madrid, SPAIN (2) Instituto de Ciencia de Materiales de Madrid, Consejo Superior de Investigaciones Científicas (ICMM-CSIC), E-28049 Madrid, Spain. *Corresponding author: [email protected] Abstract. We have measured the specific heat of amber from the Dominican Republic, an ancient geological glass about 20 million years old, in the low-temperature range 0.6 K ≤ T ≤ 26 K, in order to assess the effects of its natural stabilization (hyperageing) process on the low-temperature glassy properties, i.e. boson peak and two-level systems. We have also conducted Modulated Differential Scanning Calorimetry experiments to characterize the thermodynamic state of our samples. We found that calorimetric curves exhibit a huge ageing signal ΔH ≈ 5 J/g in the first upscan at the glass transition T g = 389 K, that completely disappears after heating up (rejuvenating) the sample to T = 395 K for three hours. To independently evaluate the phonon contribution to the specific heat, Brillouin spectroscopy was performed in the temperature range 80 K ≤ T ≤ 300 K. An expected increase in the Debye level was observed after rejuvenating the Dominican amber. However, no significant change was observed in the low-temperature specific heat of glassy amber after erasing its thermal history: both its boson peak (i.e., the maximum in the C p /T 3 representation) and the density of tunnelling two-level systems (i.e., the C p ∼ T contribution at the lowest temperatures) remained essentially the same. Also, a consistent analysis using the soft- potential model of our C p data and earlier thermal conductivity data found in the literature further supports our main conclusion, namely, that these glassy “anomalous”

Welcome message from author
This document is posted to help you gain knowledge. Please leave a comment to let me know what you think about it! Share it to your friends and learn new things together.
Transcript

1
Low-temperature thermal properties of an hyperaged geological glass
Tomás Pérez-Castañeda1*, Rafael J Jiménez-Riobóo2 and Miguel A Ramos1
(1) Laboratorio de Bajas Temperaturas, Departamento de Física de la Materia
Condensada, Condensed Matter Physics Center (IFIMAC) and Instituto Nicolás
Cabrera, Universidad Autónoma de Madrid, E-28049 Madrid, SPAIN
(2) Instituto de Ciencia de Materiales de Madrid, Consejo Superior de
Investigaciones Científicas (ICMM-CSIC), E-28049 Madrid, Spain.
*Corresponding author: [email protected]
Abstract. We have measured the specific heat of amber from the Dominican Republic,
an ancient geological glass about 20 million years old, in the low-temperature range 0.6
K ≤ T ≤ 26 K, in order to assess the effects of its natural stabilization (hyperageing)
process on the low-temperature glassy properties, i.e. boson peak and two-level
systems. We have also conducted Modulated Differential Scanning Calorimetry
experiments to characterize the thermodynamic state of our samples. We found that
calorimetric curves exhibit a huge ageing signal ΔH ≈ 5 J/g in the first upscan at the
glass transition Tg = 389 K, that completely disappears after heating up (rejuvenating)
the sample to T = 395 K for three hours. To independently evaluate the phonon
contribution to the specific heat, Brillouin spectroscopy was performed in the
temperature range 80 K ≤ T ≤ 300 K. An expected increase in the Debye level was
observed after rejuvenating the Dominican amber. However, no significant change was
observed in the low-temperature specific heat of glassy amber after erasing its thermal
history: both its boson peak (i.e., the maximum in the Cp/T
3 representation) and the
density of tunnelling two-level systems (i.e., the Cp ∼ T contribution at the lowest
temperatures) remained essentially the same. Also, a consistent analysis using the soft-
potential model of our Cp data and earlier thermal conductivity data found in the
literature further supports our main conclusion, namely, that these glassy “anomalous”

2
properties at low temperatures remain essentially invariant after strong relaxational
processes such as hyperageing.
PACS numbers: 65.60.+a, 64.70.P-, 63.50.Lm, 81.40.Cd
1. Introduction
The search of amorphous materials with exceptional properties such as remarkable kinetic or
thermodynamic stability and high density has been the focus of much interest in recent years [1–
6]. The reason is rather obvious: not only fundamental clues are hidden behind those ideal
glasses, but there is also a potential interest for their technological applications such as
development of new pharmaceuticals or new materials for the polymer industry. Among
different possible ways to obtain these higher-quality lower-enthalpy glasses, physical vapor
deposition of organic glasses at temperatures 15−20% below their glass-transition temperature
Tg has shown up as one of the most successful techniques [1,2,5] for obtaining so-called
ultrastable glasses, with extraordinary kinetic and thermodynamic stability within the
laboratory time-scale. A controlled evaporation rate in combination with an optimal substrate
temperature have proved to drastically favour two-dimensional mobility [2] and, as a
consequence, low-energy-minima states in the potential-energy landscape [7,8] for the studied
glasses. As pointed out in [6] however, an open question is whether vapour deposition provides
access to isotropic, supercooled liquid states close to the Kauzmann temperature, or whether it
unavoidable leads to the formation of new, 2D low-energy structures that should not be viewed
as representative of the isotropic bulk liquid state.
Since the glass is always in a thermodynamic state of nonequilibrium, glasses experience
continuous structural relaxational processes below Tg, slowly leading them to lower energy
states in an energy landscape plenty of local minima −the final limit being the metastable
thermodynamic state that the supercooled liquid would have at such temperature [9]. Hence a
more traditional method to obtain and study low-enthalpy glasses has been annealing

3
(intentionally controlling the glass at a fixed stabilization temperature, for a relatively long
time), or ageing (the equivalent spontaneous process, occurring when Tg is a few tens of degrees
above room temperature).
Much work has been done in the past [9–14] to study the effects of ageing/annealing on
different glassy substances. However, the structural relaxation time increases at least
exponentially with decreasing annealing temperatures below Tg , when trying to get more stable
glasses. Therefore, human time scales seem too short for producing efficient-enough
stabilization processes in bulk glasses, compared to the accelerated ageing observed [5] in those
thin or ultrathin films of organic ultrastable glasses. In fact, it has been estimated [3] that it
would require between 103 and 109 years of isothermal ageing to acquire similar kinetic and
thermodynamic properties to those exhibited by vapour-deposited ultrastable glasses.
Nevertheless, we have identified and studied a different glassy system that is indeed a
conventional 3D bulk glass, and which has naturally aged for tens of millions of years (i.e., 1015
s) at temperatures T ∼ (Tg − 90 K). We refer to amber, the well-known geological glass.
Amber is an extraordinary material: it is a sedimentary organic product with exceptional
preservation properties, both of its own nature and of materials included inside it. These reasons
have made amber of great interest for scientists in a wide range of disciplines. From the glass-
science point-of-view, amber is a chemical glass [15], obtained as a result of the polymerization
of dienic functions and evaporation of volatile components [16]. This polymerization processes
drove the initial liquid resin into the glassy state. After that, thermal annealing below the glass
transition induced relaxation processes during millions of years, depending on the provenance.
This extremely-long natural stabilization process is what we call hyperageing. In particular, we
have studied Dominican amber, which has its origin in exudants from an extinct prehistoric
leguminous leaf tree, Hymenaea protera, and whose deposits range from 15 to 45 million years
ago [16,17].
Besides the thermodynamic and kinetic aspects of the glass transition and their related open
questions briefly mentioned above, another major controversial issue is that of the low-

4
temperature universal properties of glasses [18] associated to their peculiar low-energy
dynamics. Below 1 K, the so-called Tunnelling Model (TM) [19,20] accounted in a rather
simple way (essentially using only two free parameters: the density of tunnelling states or two-
level systems (TLS) and their coupling energy to phonons) for many of those universal low-
temperature properties of glasses [18], such as the quasi-linear temperature dependence of
specific heat, Cp ∝ T, and the quadratic dependence of the thermal conductivity, κ ∝ T 2. Above
1 K, a broad maximum in the reduced specific heat Cp/T 3 is also ubiquitously found in glasses
around 3−10 K, as well as a universal plateau in the thermal conductivity κ(T) in the same
temperature range [18]. This is nowadays associated to the so-called “boson peak” in the
reduced vibrational spectra g(ω)/ω 2, a not well understood but universal broad maximum first
observed in low-frequency Raman scattering [18] typically at frequencies ω/2π ≤ 1 THz, and
later by inelastic-neutron or inelastic-X-ray scattering techniques. Indeed, the boson peak and
related features of low-energy dynamics and low-temperature properties of glasses are currently
a matter of vivid debate and considerable controversy [21].
Although there is still no consensus about the microscopic nature and the ultimate origin of the
boson peak in glasses, we will employ for practical reasons the Soft Potential Model (SPM)
[22–28], one of the phenomenological approaches more often considered to explain the
universal properties exhibited by glasses both below and above 1 K, and that can be regarded
somehow as a generalization of the TM [19,20]. Essentially, the SPM is based upon the idea
that there exist in glasses additional (non-acoustic) quasi-local vibrations that can be modelled
by asymmetric quartic potentials [22–28], which include the double-well potentials of the TM.
The SPM has been shown [27,28] to account in a consistent way for most of these glassy
properties at low temperatures and low frequencies, at least up to the boson peak energy. More
recently, the theory of vibrational instability of weakly interacting quasi-local harmonic modes
[29,30] has lent further support to the SPM picture. Based on more general grounds, this theory
explains in a unified way the observed increasing density of tunnelling and vibrational states at
low frequencies or temperatures (predicting g(ω) ∝ ω4 and hence Cp ∝ T 5, in full agreement
5
with the SPM), also accounting for the universal appearance of a maximum (the boson peak) in
g(ω)/ω2 at slightly higher frequencies.
In this work we have studied the effects on the low-temperature specific heat of the natural and
extremely long ageing process (hyperageing) of about 20 million years, experienced by samples
of Dominican amber [17], aiming to find out whether these low-temperature glassy properties
significantly depend or not on the thermal history −and therefore could be depleted by annealing
or ageing processes−, or rather are intrinsic properties of non-crystalline solids.
Characterization of the samples around the glass transition Tg = 389 K has been performed via
Modulated Differential Scanning Calorimetry (MDSC), to check and quantify the effects of this
ageing on the enthalpy reduction. In order to bring back the stabilized amber into a conventional
(rejuvenated) glassy state, the very same amber samples were heated above Tg to erase their
thermal history, and then vitrified and measured again for comparison. We have also studied the
possible changes of the Debye-like phonon contribution to the specific heat by means of
Brillouin spectroscopy. Finally, we have used the SPM to quantitatively discuss the possible
effects of hyperageing on the low-temperature behaviour of this glass (i.e. the boson peak and
the TLS), as well as to critically compare them to earlier thermal conductivity data from the
literature [31].
2. Experimental
2.1 Samples
The samples studied in this work were Dominican amber ones about 20 million years old. By
using standard chemical analysis, the composition of the samples was found to be 78.6% C,
9.9% H and 11% O in mass, in reasonable agreement with other values found in the literature
[32], and with a nitrogen content ~0.1% and sulphur impurities below 0.2%. Mass density of the
samples was measured with a Mettler Toledo AB 265-S balance by means of the Archimedes
method, using distilled water as a fluid. The density of the pristine sample (the one used in heat-
6
capacity and Brillouin experiments) was ρ = 1.058 g/cm3 at room temperature, whereas for the
rejuvenated sample we measured ρ = 1.028 g/cm3. The rejuvenated sample was obtained after
heating the pristine one to 395 K, followed by an isothermal annealing for three hours under
vacuum conditions P ≤ 10-2 mbar. Since amber samples are heterogeneous and also present
impurities, it is important always to measure the very same sample of amber before and after
rejuvenation, so that any possible spurious contribution can be cancel out, or at least minimized.
Nevertheless, similar rejuvenation processes for other amber samples from the same batch,
always indicated that the densification produced by hyperaging is within 2.5−3 %.
Sample preparation for Modulated Differential Scanning Calorimetry (MDSC) experiments was
performed by manually milling the amber pieces in an agate mortar until a homogeneous
particle size of some tens of microns was achieved. For the low-temperature specific-heat
measurements, amber was cut into flat pieces, in order to optimize the contact area to sample
volume ratio, so that a good internal equilibrium could be achieved. Typical masses of the
samples employed were m ≈ 4 mg for MDSC and m ≈ 30 mg for low-temperature specific-heat
measurements. Brillouin measurements were performed using plan-parallel polished amber
plates typically less than 500 µm thick.
2.2 Modulated Differential Scanning Calorimetry (MDSC)
Modulated Differential Scanning Calorimetry on Dominican amber samples was performed
using a commercial TA Instruments Q100 apparatus. Standard aluminium pans of empty mass
m ≈ 20 mg were employed as sample holders, and N2 gas was used for purging the chamber and
optimizing thermal equilibrium of the sample. To calibrate the equipment, both in temperature
and enthalpy, certified indium was used. Measurements on every sample were conducted at
heating/cooling rates of ±1.5 K/min, and with modulating amplitude 1 K every 60 s, in the
temperature range 273 K ≤ T ≤ 450 K. All measurements comprise three heating and three
cooling curves, where only the corresponding specific-heat curves from the heating runs are
taken for the analysis. The three heating curves were also used either to check possible
7
differences between the first heating and the two following ones, or to test the reproducibility
among them.
2.3 Low-temperature calorimetry
Low-temperature specific-heat measurements were performed by using thermal relaxation
techniques, either the standard one or an alternative faster version developed by us [33], which
allowed an accurate determination of the specific heat of our samples in the temperature range
0.6 K ≤ T ≤ 26 K. The measurements above 2 K were performed in a double-chamber insert,
with a vacuum environment of 10 -7 mbar or better. The insert is placed in a 4He cryostat from
Cryogenic Systems, where a minimum temperature of 1.8 K is easily achieved by pumping the
cryogenic bath. For the experiments below 2 K a dilution refrigerator Oxford Instruments
MX400 was employed. Specific-heat data obtained from both experimental setups in the
intermediate temperature range overlapped each other very well.
The calorimetric cells employed in the 4He cryostat consist of a sapphire disc, on which a
thermometer (CERNOX 1030) and a heater (a commercial chip of 1 kΩ resistance at room
temperature) are glued diametrically opposed using cryogenic varnish GE7301. The value of the
resistance is determined using four-terminal wiring in the case of the thermometer, and three-
terminal wiring for the heater to account for the power dissipated in the wires. The sapphire disc
is suspended by three nylon threads in the centre of a copper ring that works as a controlled
thermal sink. On this copper ring, a Germanium sensor to monitor the temperature is
mechanically attached, and a commercial chip 50 Ω-resistance heater is glued, in order to
control the temperature of the thermal sink surrounding the calorimetric cell. A 70 μm diameter
and 20 cm long copper wire was used as dominant thermal link between the cell and the copper
ring, in order to provide typical relaxation times τ ≈ 30 s at 4.2 K. A Lakeshore 336 Controller is
used both for measuring the sample temperature and for controlling the temperature of the

8
thermal sink. A home-made current source and a Keithley 2000 voltmeter supplies the current
and monitors the voltage drop in the heater, respectively.
For the measurements below 2 K in the dilution refrigerator a similar cell is employed, but with
lower mass sensors in order to reduce the addenda contribution to the total heat capacity. A
ruthenium oxide chip with mass m ≈ 1 mg and resistance R = 1.02 kΩ at room temperature is
used as thermometer. A commercial chip with mass m ≈ 8 mg and (weakly temperature-
dependent) resistance R = 147 Ω at room temperature, is employed as heater. A 100 μm
diameter and 3 cm long manganin wire was put as thermal link in this case. Typical relaxation
times of the order of τ ≈ 15 s are achieved at 1 K. The temperature of the sample is measured
with a Lakeshore 370 AC Bridge. The power to the sample heater is applied with a Keithley
224, and the voltage drop is monitored with a Keithley 2000. The temperature of the thermal
sink is controlled using a Lakeshore 336 Controller.
2.4 Brillouin spectroscopy
High Resolution Brillouin Spectroscopy (HRBS) experiments were conducted to obtain direct
information about the propagation velocity of acoustic modes at hypersonic frequencies and
refractive index of the studied samples, and hence to assess the Debye-like phonon contribution
to the specific heat.
Polished plan-parallel slabs of amber, less than 500 µm thick, with several flat surfaces, were
placed inside a cryostat (Optistat CF from Oxford Instruments). An ITC 4 temperature
controller (Oxford Instruments) was used in the experiments, obtaining a temperature stability
of ±0.05 K. Low temperatures were achieved by using liquid nitrogen. The Brillouin
spectrometer set up was as follows: The monochromatic light source was a 2060 Beamlok
Spectra Physics Ar+ ion laser (λ0 = 514.5 nm). The scattered light was analysed using a
Sandercock-type 3+3 tandem Fabry-Pérot interferometer. No polarization analysis of the
scattered light was made. Both backscattering (180º) and right-angle 90ºA geometries were

9
simultaneously used [34], the latter allowing the observation of the (weak) transverse sound
peak. The backscattering geometry (180º) implies a refractive-index dependent acoustic wave
vector and the 90ºA scattering geometry is independent of the refractive index. The
corresponding wave vectors are:
;
0
2 4=q90A
λπ
0
n4=q i180
λπ , (1)
where λ0 stands for the laser wavelength and ni for the refractive index of the sample. The sound
propagation velocity (v) results from the combination of the Brillouin frequency shift, f, and the
corresponding acoustic wave vector:
20 v
90
90AλAf
= ; in
f
20 v
180
180λ
= (2)
In the case of absence of acoustic dispersion, for elastic isotropic media as glasses, these
velocities must be identical and thus information about the refractive index of the investigated
material can be obtained.
3. Results
3.1 Ageing and glass transition
First, MDSC experiments were performed on Dominican amber samples to study the ageing
signal and the glass transition temperature of these hyperaged, stabilized glasses. Using this
technique it was possible to separately evaluate the reversible (real) part of the specific heat,
which accounts for the thermodynamically-reversible processes, and the irreversible (imaginary)
contribution, which measures the enthalpy release around Tg and hence reflects the thermal
history undergone by the sample. Three heating curves are shown for every sample, as seen in
figure 1, to check any possible differences between the first heating and the two others, as well
as the reproducibility of second and third heating runs.

10
The pristine Dominican amber sample presented a prominent peak of ΔH ≈ 5 J/g around the
glass transition at Tg = 389 K in the specific-heat curve, as can be seen in figure 1(a). This is the
fingerprint of the very long stabilization process occurred roughly at room temperature (though
not strictly isothermal), thus far below the glass transition, for a period of time around 20
million years [16]. Interestingly, comparable values of enthalpy reduction have been found in
abovementioned vapour-deposited ultrastable glasses [2–5].
0.5 J / g·K
REJU
VENA
TED
3rd heating 2nd heating 1st heating
Tota
l Spe
cific
Hea
t
(a)
(b)
PRIS
TINE∆H = 5 J/g
280 300 320 340 360 380 400 420 440
3rd heating 2nd heating 1st heating
Temperature (K)
280 300 320 340 360 380 400 420 440 d
Crev
P /
dT (
mJ
/ g ·
K2 )
Temperature (K)
∆ Tg = 10 K
280 300 320 340 360 380 400 420 440 dCre
vP
/ dT
( m
J / g
· K2 )
Temperature (K)
Figure 1. MDSC measurements on Dominican amber for pristine (a) and rejuvenated −after 3 hours at
395 K in vacuum− (b) samples. Specific heat curves for each sample comprise three consecutive heating
upscans at a rate 1.5 K/min and modulating signal 1 K every 60 s. The scale for the specific heat per gram
is shown by a vertical bar in (b). The first heating curve (blue) for the pristine sample in (a) exhibits a
huge enthalpy release ΔH ≈ 5 J/g as a result of the dramatic ageing process. Further heating runs no
longer exhibit this feature, nor do the three curves of rejuvenated amber shown in (b). Both insets show
the derivative of the reversible part of the specific heat with temperature, for the corresponding heating
curves. A decrease in the kinetic glass-transition temperature ΔTg ≈ 10 K is found from the first to the
following heating curves for the pristine sample.

11
It is to be remarked that an exothermic feature seems to be superimposed on the big
endothermic peak at 389 K, what may be indicative of some residual curing occurring at those
temperatures, in analogy to an epoxy.
After the first heating up to 450 K, the ageing signal was completely removed, as can be seen
from the overlapping second and third heating curves of the specific heat, which correspond to
the canonical behaviour of the amber substance. The kinetic glass transition temperature has
been determined by the position of the maximum in the first derivative of the reversible specific
heat with temperature, dCrev/dT, see inset of figure 1(a). The glass transition moves towards
lower temperatures, ΔTg ≈ 10 K, after the first heating, as the resulting conventional glass is far
less kinetically stable [1,2].
In order to remove the thermal history (hyperageing) of the pristine sample (corresponding to
the first heating curve of figure 1(a)), an “anti-annealing” process was done. This process
consisted of heating up the sample to 395 K, and then isothermally annealing the sample for
three hours. The whole process was conducted under vacuum conditions P ≈ 10-2 mbar. After
this rejuvenation process, no further ageing signal is observed, as the peak in specific heat has
completely disappeared around the glass transition, even at the first heating of the sample, as
can be seen in figure 1(b). In this case, no difference between the first and the second and third
heating curves is observed, confirming that the rejuvenated sample has indeed lost its dramatic
thermal history of structural relaxation with ageing time. Comparison of dCrev/dT among the
three heating upscans show a perfect agreement in the maximum position, what implies that
their kinetic glass transition temperature is the same.
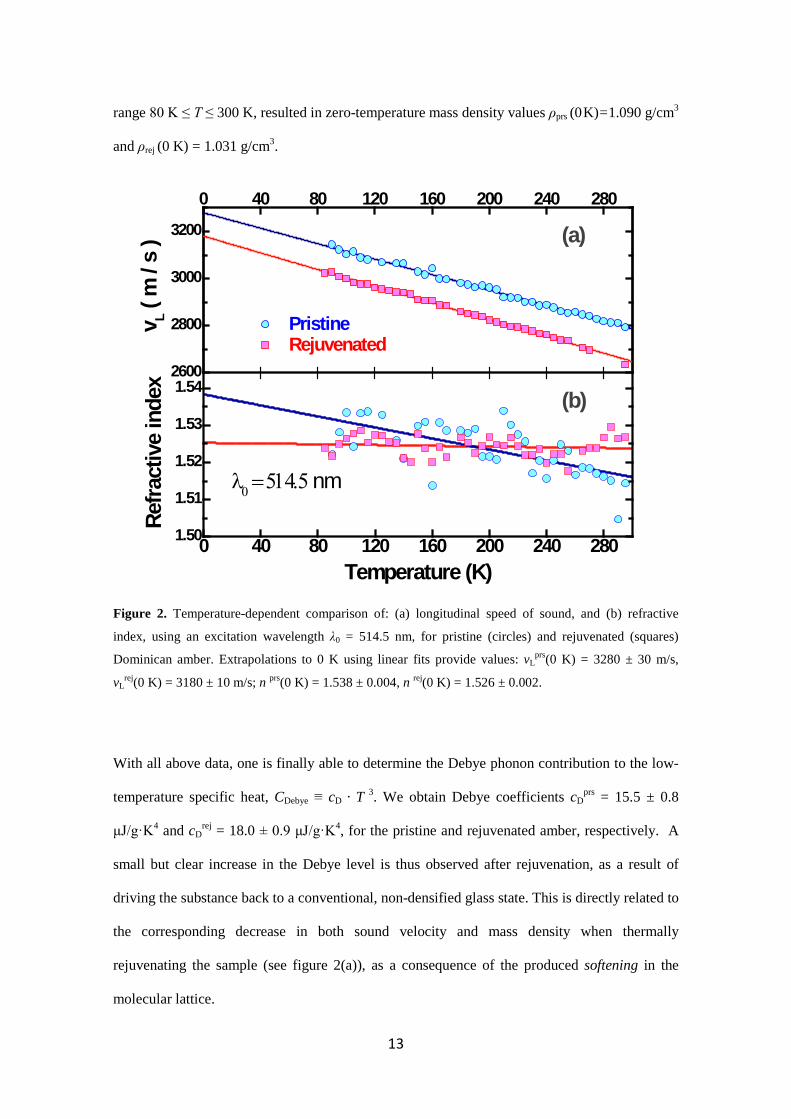
3.2 Debye level
HRBS measurements were performed to determine the phonon contribution to the low-
temperature specific heat (i.e., the Debye level) for the studied Dominican amber samples. In
figure 2(a), the longitudinal sound velocity dependence with temperature for 80 K ≤ T ≤ 300 K
is shown, where a constant shift towards lower values [vLrej
(T) − vLprs
(T)] / vLprs
(T) ≈ −3.3% is
12
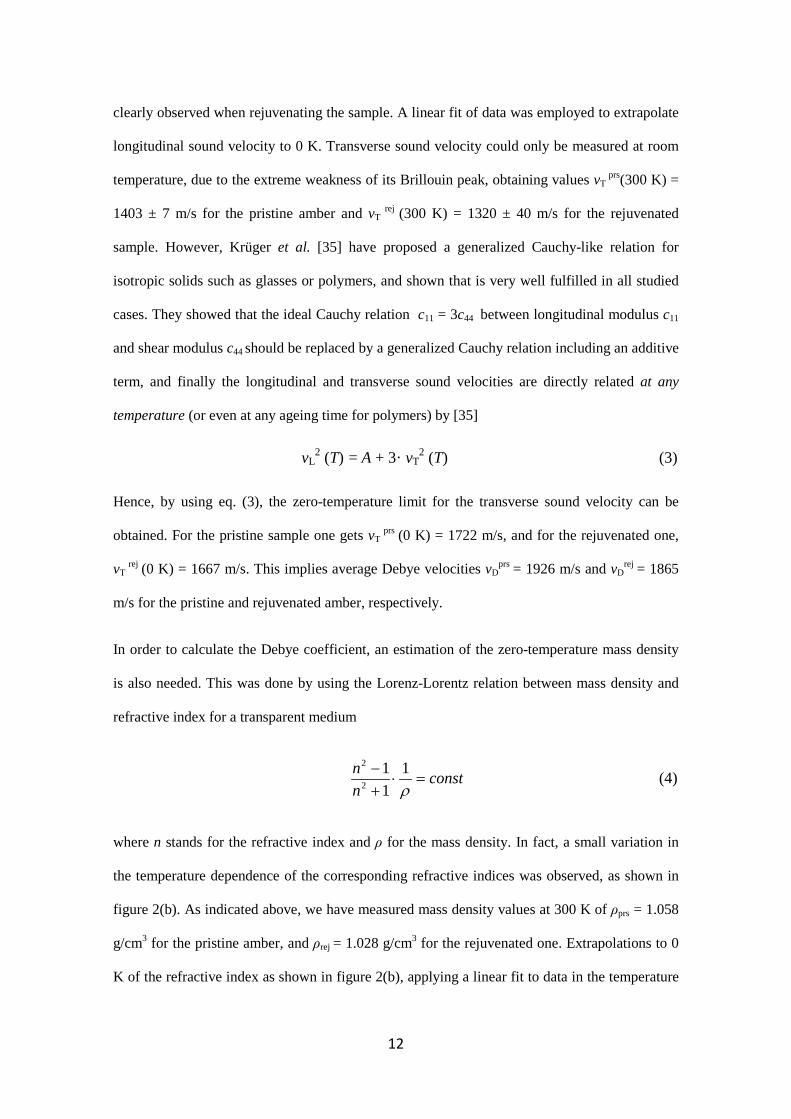
clearly observed when rejuvenating the sample. A linear fit of data was employed to extrapolate
longitudinal sound velocity to 0 K. Transverse sound velocity could only be measured at room
temperature, due to the extreme weakness of its Brillouin peak, obtaining values vT prs(300 K) =
1403 ± 7 m/s for the pristine amber and vT rej (300 K) = 1320 ± 40 m/s for the rejuvenated
sample. However, Krüger et al. [35] have proposed a generalized Cauchy-like relation for
isotropic solids such as glasses or polymers, and shown that is very well fulfilled in all studied
cases. They showed that the ideal Cauchy relation c11 = 3c44 between longitudinal modulus c11
and shear modulus c44 should be replaced by a generalized Cauchy relation including an additive
term, and finally the longitudinal and transverse sound velocities are directly related at any
temperature (or even at any ageing time for polymers) by [35]
vL2 (T) = A + 3· vT
2 (T) (3)
Hence, by using eq. (3), the zero-temperature limit for the transverse sound velocity can be
obtained. For the pristine sample one gets vT prs (0 K) = 1722 m/s, and for the rejuvenated one,
vT rej (0 K) = 1667 m/s. This implies average Debye velocities vD
prs = 1926 m/s and vDrej = 1865
m/s for the pristine and rejuvenated amber, respectively.
In order to calculate the Debye coefficient, an estimation of the zero-temperature mass density
is also needed. This was done by using the Lorenz-Lorentz relation between mass density and
refractive index for a transparent medium
const
nn
=⋅+−
ρ1
11
2
2
(4)
where n stands for the refractive index and ρ for the mass density. In fact, a small variation in
the temperature dependence of the corresponding refractive indices was observed, as shown in
figure 2(b). As indicated above, we have measured mass density values at 300 K of ρprs = 1.058
g/cm3 for the pristine amber, and ρrej = 1.028 g/cm3 for the rejuvenated one. Extrapolations to 0
K of the refractive index as shown in figure 2(b), applying a linear fit to data in the temperature
13
range 80 K ≤ T ≤ 300 K, resulted in zero-temperature mass density values ρprs (0 K) = 1.090 g/cm3
and ρrej (0 K) = 1.031 g/cm3.
2600
2800
3000
3200
0 40 80 120 160 200 240 280
Pristine Rejuvenated
v L ( m
/ s
) (a)
0 40 80 120 160 200 240 2801.50
1.51
1.52
1.53
1.54
Refra
ctiv
e in
dex
Temperature (K)
(b)
λ0 = 514.5 nm
Figure 2. Temperature-dependent comparison of: (a) longitudinal speed of sound, and (b) refractive
index, using an excitation wavelength λ0 = 514.5 nm, for pristine (circles) and rejuvenated (squares)
Dominican amber. Extrapolations to 0 K using linear fits provide values: vLprs(0 K) = 3280 ± 30 m/s,
vLrej(0 K) = 3180 ± 10 m/s; n prs(0 K) = 1.538 ± 0.004, n rej(0 K) = 1.526 ± 0.002.
With all above data, one is finally able to determine the Debye phonon contribution to the low-
temperature specific heat, CDebye ≡ cD · T 3. We obtain Debye coefficients cDprs = 15.5 ± 0.8
μJ/g·K4 and cDrej = 18.0 ± 0.9 μJ/g·K4, for the pristine and rejuvenated amber, respectively. A
small but clear increase in the Debye level is thus observed after rejuvenation, as a result of
driving the substance back to a conventional, non-densified glass state. This is directly related to
the corresponding decrease in both sound velocity and mass density when thermally
rejuvenating the sample (see figure 2(a)), as a consequence of the produced softening in the
molecular lattice.

14
3.3 Effects of hyperageing on the low-temperature specific heat
Our main goal is to study the influence of deep stabilization and densification processes, due to
extremely long ageing in Dominican amber, on the universal low-temperature glassy properties.
For this purpose, low-temperature specific heat was first measured for a pristine amber sample
in the range 0.7 K ≤ T ≤ 26 K. After this, a thermal rejuvenation process as described above was
applied to the sample, and again the specific-heat curve was obtained for comparison in the
range 0.6 K ≤ T ≤ 26 K. Data are shown in figure 3, in the usual reduced Cp(T) / T 3 vs T plot.
Corresponding Debye levels, determined from the measured sound velocities and mass densities
as detailed in the previous section, are also shown in figure 3 by thick solid lines. As expected, a
modest increase in the Debye coefficient after rejuvenation is observed. The most remarkable
result is however that both Cp(T) / T 3 curves are strikingly similar, even exhibiting the same
position for the minimum, at Tmin=1.3 K, and the maximum (boson peak), at Tmax = 3.7 K, the
only difference being a small but clear decrease in the height of the boson peak after
rejuvenation.
In order to account quantitatively for any possible differences between the two samples, the
experimental data for the low-temperature specific heat are analysed and discussed in the
framework of the SPM [22–28]. For the sake of simplicity, we will only consider the most basic
version of the SPM [24–27], which does not account for the whole of the boson peak and other
glassy properties at higher temperatures, that has been however addressed in further extensions
of this model [29,30]. In the SPM, low-frequency dynamics of glasses is assumed to be
governed by the coexistence of ordinary acoustic (phonon-like) lattice vibrations and some
additional quasilocalised vibrations (usually called ‘soft modes’). The latter contribution is
described within the SPM in terms of asymmetric quartic potentials, from which the specific
heat is found to be approximately linear in temperature, Cp ~ T, for kBT << W (in the region
dominated by double-well potentials), W being the average characteristic energy of the soft
modes, whereas Cp ~ T 5 dominates at kBT > W (single-well potentials) [24–28]. Hence in the
lowest-temperature limit T < 1 K, the TLS contribution (Cp ~ T) is dominant, and the SPM

15
essentially agrees [28] with the TM [18–20]. In the typical representation Cp /T 3, this TLS
region is thus seen as an upturn at the lowest temperatures, followed with increasing
temperature by a minimum Tmin and a rapid increase Cp ~ T 5 [28] produced by the quasi-
harmonic soft-mode vibrations responsible for the lower-energy side, T < Tmax, of the boson
peak.
1 100
10
20
30
40
50
60
70
T max
= 3.
7 K
Pristine Rejuvenated
C P / T
3 ( µJ
/ g
· K4 )
Temperature (K)
CDebye pristine
CDebye rejuvenated
SPM
T min=
1.3
K
Figure 3. Cp(T) / T 3 versus T plot for pristine (circles) and rejuvenated (squares) states of the same
Dominican amber sample. Both curves exhibit the same position for the minimum, Tmin=1.3 K, and
maximum (boson peak), Tmax = 3.7 K, of Cp(T) / T 3, the only difference being a small decrease in the
height of the boson peak after rejuvenation. The corresponding Debye levels, obtained from the measured
elastic constants, are indicated by thick solid lines. As expected, a small increase in the Debye coefficient
after rejuvenation is observed. The two (almost indistinguishable between them) dashed lines are the
corresponding total SPM specific-heat curves below the boson peak, according to equation (5), obtained
as the sum of the elastoacoustically measured Debye levels for each case (thick solid lines) and the SPM
linear fits (see text).

16
Therefore, the simplest but still reasonable fit of the low-temperature specific heat of glasses is
just a quadratic polynomial fit in a Cp / T versus T 2 representation, as suggested elsewhere
[36,37]:
Cp (T) = cTLS T + cD T 3 + csm T 5 (5)
where the coefficients in equation (5) correspond to the contribution of the TLS, Debye lattice
vibrations and quasiharmonic soft modes, respectively. In order to produce meaningful
estimations of the coefficients using this fit, the temperature range to be applied must be
approximately 0 < T < 3/2 Tmin, [36,37] where Tmin is the temperature of the minimum in the
Cp/T 3 representation.
Previously, in section 3.2, we were able to determine the elastic Debye coefficient cD, which
should coincide with the corresponding coefficient obtained from calorimetric measurements
[37] by fitting data to equation (5). Indeed, the elastic and calorimetric determinations of cD are
found to be equal in our samples within experimental error. Nonetheless, since we have a
model-independent elastic determination of the cubic Debye coefficient cD, we will better
employ the procedure followed in [38] for butanol glasses and conduct the SPM analysis with
only two fitting parameters, cTLS and csm. In brief, one fixes the elastoacoustically measured cD
coefficient for each glass, and the excess specific heat is directly manifested after subtraction of
the corresponding cubic Debye contribution CDebye = cD T 3, by plotting (Cp−CDebye)/T vs T
4 in
order to obtain the missing T and T
5 coefficients of the SPM from simple straight-linear fits, as
shown in figure 4 and Table 1. Despite the larger data scatter due to the very sensitive chosen
axes, the expected linear behaviour is observed indeed below 2 K, what supports the validity of
the made SPM assumptions and analysis. In addition, we also show in the Cp/T 3 representation
in figure 3 the total SPM specific heat (dashed lines) below the boson peak, for the amber glass
in both cases, that is the sum of the elastoacoustically measured Debye contribution for each
glass (thick solid lines) and the SPM fitted contributions from figure 4, according to equation
(5).
17
0 2 4 6 8 10 12 140
20
40
60
80
100
(CP-
C Deby
e) / T
( µJ
/ g
· K2 )
T 4 (K4)
Pristine Rejuvenated
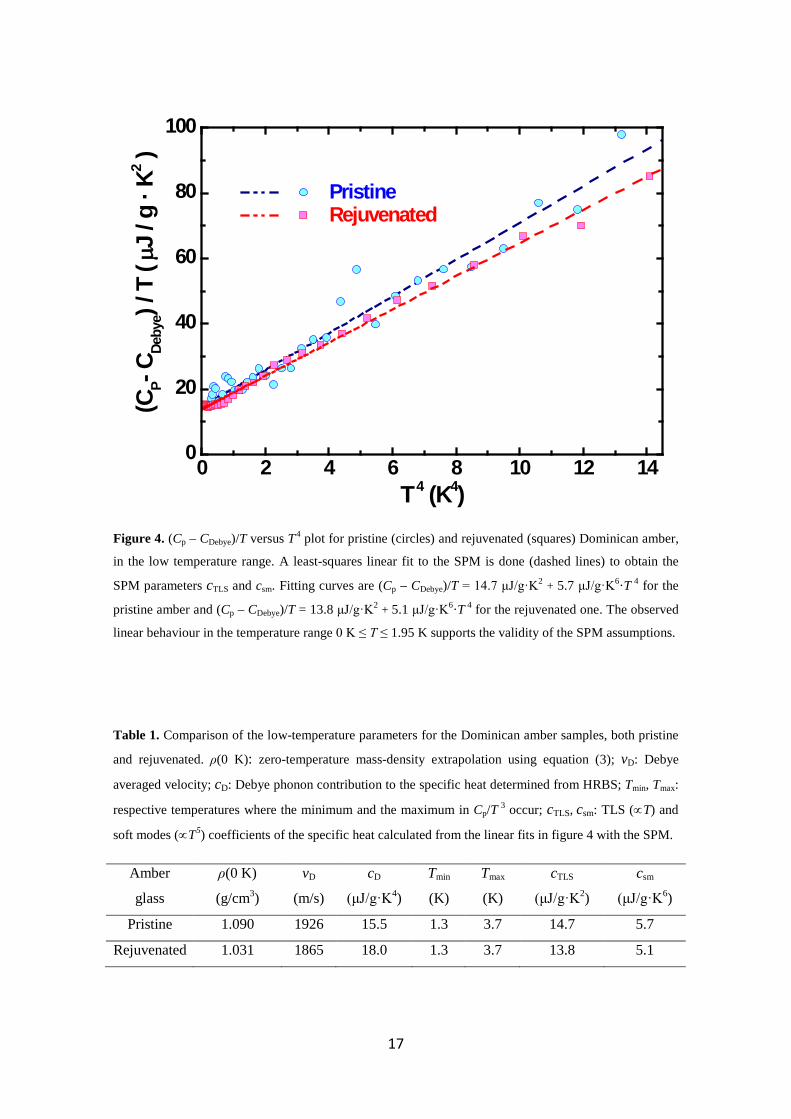
Figure 4. (Cp – CDebye)/T versus T
4 plot for pristine (circles) and rejuvenated (squares) Dominican amber,
in the low temperature range. A least-squares linear fit to the SPM is done (dashed lines) to obtain the
SPM parameters cTLS and csm. Fitting curves are (Cp – CDebye)/T = 14.7 μJ/g·K2 + 5.7 μJ/g·K6·T 4 for the
pristine amber and (Cp – CDebye)/T = 13.8 μJ/g·K2 + 5.1 μJ/g·K6·T 4 for the rejuvenated one. The observed
linear behaviour in the temperature range 0 K ≤ T ≤ 1.95 K supports the validity of the SPM assumptions.
Table 1. Comparison of the low-temperature parameters for the Dominican amber samples, both pristine
and rejuvenated. ρ(0 K): zero-temperature mass-density extrapolation using equation (3); vD: Debye
averaged velocity; cD: Debye phonon contribution to the specific heat determined from HRBS; Tmin, Tmax:
respective temperatures where the minimum and the maximum in Cp/T 3 occur; cTLS, csm: TLS (∝T) and
soft modes (∝T
5) coefficients of the specific heat calculated from the linear fits in figure 4 with the SPM.
Amber
glass
ρ(0 K)
(g/cm3)
vD
(m/s)
cD
(μJ/g·K4)
Tmin
(K)
Tmax
(K)
cTLS
(μJ/g·K2)
csm
(μJ/g·K6)
Pristine 1.090 1926 15.5 1.3 3.7 14.7 5.7
Rejuvenated 1.031 1865 18.0 1.3 3.7 13.8 5.1
18
From both figures 3 and 4, it is very clear that the highly densified, hyperaged amber retains all
glassy excitations at low temperatures (i.e. TLS and “boson-peak” soft modes), even
quantitatively. They appear in our case to be even slightly above those of the canonical,
rejuvenated amber, what is certainly striking.
Finally, we will make use of this SPM analysis of the low-temperature specific heat to
concurrently address and discuss earlier thermal-conductivity measurements at low
temperatures, also conducted in Dominican amber by Love and Anderson [31]. In figure 5, we
depict their thermal-conductivity data κ (T) [31] for pristine (as received) and rejuvenated (at
370 K) Dominican amber samples. Although their samples and ours could be somewhat
different (indeed, their reported glass-transition temperature is lower than that of our samples),
the thermal conductivity of glasses is not very much sensitive to material parameters [19,20]
and a joint analysis can be done. As it has been discussed in detail [27,28], the SPM main
parameter W/kB marks the crossover temperature below which the TLS dominate the low-energy
glassy dynamics and above which quasilocalised soft modes (eventually piling up at the boson
peak) do. To be more precise, this crossover is seen in the specific heat as the minimum Tmin in
Cp/T 3 (with W/kB ≈ 1.6 Tmin analytically [24], although also W/kB
≈ 1.8 Tmin was postulated from
some numerical calculations [28,39]), and in the thermal conductivity as a bend from the
quadratic temperature dependence at the lowest temperatures to the plateau region, hence as a
maximum Tmax,κ in κ/T (with W ≈ 1.6 Tmax,κ) [27]. Therefore, the main qualitative prediction of
the SPM is that the minimum Tmin in Cp/T 3 and the maximum Tmax,κ of κ/T should occur [27] at
(almost) the same temperature. The inset in figure 5 shows that for the pristine Dominican
amber one has Tmax,κ = 1.3 K (hence W = 2.1 K), which nicely agrees with our minimum Tmin =
1.3 K in Cp/T 3. Furthermore, it can also be seen in figure 5 that the thermal conductivity for the
rejuvenated amber (unfortunately not provided [31] in the whole temperature range) is again
very similar to that of the pristine sample. This supports our statement that the hyperaged glass
fully retains the universal glassy properties at low temperatures, which are not depleted by this
dramatic structural and thermodynamic relaxation.

19
0.01 0.1 1 10
10-4
10-3
10-2
10-1
κ (W
/m·K
)
T (K)
as receivedrejuvenated 370 K
SPM
0.01 0.1 1 100.00
0.01
0.02
κ/T
(W/m
·K2 )
T (K)
(= 1.3 K)Tmax
Figure 5. Thermal conductivity κ data versus temperature in a double logarithmic scale, measured by
Love and Anderson [31] for other pristine (as received) and rejuvenated (at 370 K) Dominican amber
samples. The inset shows the same data plotted as κ/T vs T, following the SPM method [27,28] to
determine a maximum Tmax,κ of κ/T and hence the basic SPM parameter W ≈ 1.6 Tmax,κ, which marks the
crossover from the TLS-dominated region (κ ∝ T 2) to the soft-mode one (plateau).The solid line is the
SPM [27,28] predicted curve for the fitted W.
4. Discussion
As briefly reminded in the Introduction, the two most characteristic types of “anomalous” low-
energy excitations in glasses and disordered solids, which pervade all their physical properties
at low temperatures and frequencies, are: (i) TLS (or tunnelling) states, and (ii) low-frequency
vibrations producing the “boson peak”. The former are well accepted to exist and account for
thermal, acoustic and dielectric glassy properties at temperatures below 1 K and energies below
1 meV, following the Tunnelling Model, though a full microscopic understanding is still lacking
[40]. The very nature of the latter is nowadays a vivid matter of debate and controversy, and
many theories and models [29,30,41–46] compete to explain low-frequency dynamics of glasses
featured by the boson peak. Furthermore, during the last forty years many different attempts

20
have been made (with unclear conclusions [47–52]) to know whether these low-temperature
glassy properties significantly depend or not on the impurities and the thermal history, and
therefore could be depleted by annealing or ageing processes, or rather are essential and
intrinsic properties of non-crystalline solids. Alternatively, some inelastic neutron-scattering
experiments in a mineral hyperquenched glass [53], seemed to point out that the boson peak is
greatly enhanced in the hyperquenched glass over that of the standard and the annealed glass.
The same trend was found in computer simulations of binary mixtures [6,41], where the
observed total maximum in g(ω)/ω
2 was found to decrease and shift to higher frequencies with
slower cooling rates.
Very recently, a much debated issue is whether or not the boson peak scales with the Debye
frequency and hence with the elastic medium constants, where again opposite views have been
published: in some cases, the Debye-reduced vibrational density of states plotted versus the
Debye-reduced frequency merge into a master curve, either when comparing hyperquenched to
annealed glasses [54], or measuring at different temperatures [55], or even during
polymerization of a reactive mixture [56], whereas in other cases [38,57,58] this scaling has
been found to fail. Moreover, some authors [59] have claimed that the boson peak in glasses is
the counterpart of the acoustic van Hove singularity in crystals, shifted to lower energy by
force-constants disorder. Then, similar to the transverse acoustic singularity in crystals, the
boson peak originates from the piling up of the acoustic states near the boundary of the pseudo-
Brillouin-zone.
The first key question is then: do excess glassy properties (i.e. TLS and the boson peak) strongly
depend on the thermal history of the glass, and hence on the reached excess enthalpy, and
eventually would disappear for ideal, extremely annealed or stabilized glasses, or rather are they
intrinsic properties of the glassy, non-crystalline state? Our findings in the extreme case of an
hyperaged geological glass, which retains −if not enhances− both its boson peak and its density
of TLS at low temperatures, undoubtedly state that these universal low-temperature glassy

21
excitations are robust against the thermal history, and intrinsic to the non-crystalline lattice. The
SPM analysis conducted to quantitatively assess those low-temperature glassy excitations in the
specific heat, as well as earlier thermal-conductivity data, further support our conclusion.
Such a clear statement cannot be made in relation to the Debye scaling, since both the Debye
level and the observed Cp/T3 boson peak do not vary strongly after the thermal rejuvenation.
Still, the slightly lower boson peak observed after rejuvenation, whereas the Debye level has
increased around 15%, points out that a Debye scaling of the boson peak is not fulfilled. One
may speculate that the unexpected decrease of the boson-peak height with thermal rejuvenation
could be related to some residual curing happening around 390 K, as said in section 3.1. The
fact that almost every physical property remains constant or behaves in the opposite direction,
suggests that its influence, if any, is not significant.
The remarkable enthalpy reduction observed in our MDSC characterization experiments, ΔH ≈
5 J/g, is comparable to those found in ultrastable thin film glasses [1–5] obtained by physical
vapour deposition, and provides further evidence that the expected huge structural relaxation
has indeed occurred in our pristine amber samples, and that our results are meaningful.
The modest but clear variations earlier found [47–52] in the low-temperature specific heat of
some glasses with different thermal history could be attributed, in our view, to the concurrent
variation of the elastic constants and the Debye contribution below the boson peak, which in
most cases were not measured. As a matter of fact, in the case of pure and dry B2O3 glass, very
different maxima in Cp/T3 for different thermal treatments were found to collapse in a single
curve after their corresponding Debye levels were subtracted [51].
Finally, during the writing of this paper, we became aware of a forthcoming publication by
Zhao et al. [60], who have investigated the dynamics of similar 20 million year old Dominican
amber via stress relaxation experiments above and below the glass-transition temperature.
Among other results, by fitting the relaxation time curve in the equilibrium liquid state to the
Vogel-Tamman-Fulcher function, they obtained a dynamic fragility index of m = 90. It is worth

22
emphasizing that Sokolov et al. [61,62] found, after analysing thirteen glass-forming
substances, that the relative weight of vibrational over relaxational excitations (i.e. the boson
peak) is larger for stronger than for fragile glass formers, in the well-known Angell’s
classification. One of the ways used by them to assess this relative weight was through the ratio
R of Debye-reduced specific-heat data at Tmin over that at Tmax, R = (Cp/T 3)min / (Cp/T
3)max. For
glass formers so fragile as to have m ∼ 90 (e.g. o-terphenyl or CKN), R was as large as 1, that is
a very shallow boson peak, whereas strong glass formers (low m indices) exhibited strong and
well-defined boson peaks, with R below 0.5. The boson peak of our pristine amber sample gives
R ≈ 0.52, which lies between the values of strong glass formers B2O3 and sodium-oxide silica,
with m ∼ 40. Therefore, amber does not follow the proposed correlation [61,62], its liquid being
dynamically fragile but its glass showing a strong vibrational boson peak.
5. Conclusions
We have studied the effects of the extremely long ageing process (an estimated period of time
between 15 and 45 million years) naturally occurred in Dominican amber, on the universal low-
temperature properties of this geological glass. With such an aim, we have measured the
specific heat at low temperatures of the same sample before and after a thermal rejuvenation
process to erase its dramatic thermal history. MDSC experiments confirmed the very large
enthalpy reduction geologically occurred in the pristine sample, in comparison to the
rejuvenated one. Brillouin-scattering experiments allowed us to determine both temperature-
dependent (longitudinal and transverse) sound velocities and refractive indices, and hence the
elastic Debye contributions to the specific heat needed to make a thorough analysis of the low-
temperature glassy excitations.
Somewhat strikingly, we have found that the pristine, hyperaged amber exhibits a strong boson
peak and a high density of tunnelling states, as high (if not even higher) as those of the
rejuvenated sample. Given the extreme structural and thermodynamic relaxation produced in

23
this glass prior to its rejuvenation, our observations should be robust enough as to reach a high
level of generality. The main conclusion is that the ubiquitous glassy excitations at low
frequencies or temperatures (TLS and the boson peak) are intrinsic to the non-crystalline state
and they are not depleted by long annealing or structural relaxation processes. These can
however influence the Debye-like elastic properties, and hence indirectly the total heat capacity.
Our results in this paradigmatic geological glass are also at odds with the previously proposed
Debye scaling of the boson peak and the correlation of the latter with the inverse of the fragility
index.
In order to test the reproducibility and general character of the presented results, similar
experiments on other amber glasses from different sources (i.e. with different chemical and
thermal histories) are currently underway.
Acknowledgements
The Laboratorio de Bajas Temperaturas (LBT-UAM) is an Associated Unit with the ICMM-
CSIC. This work was partially supported by the Spanish MINECO (FIS2011-23488 project, and
Consolider Ingenio Molecular Nanoscience CSD2007-00010 program) and by the Comunidad
de Madrid through program Nanobiomagnet (S2009/MAT-1726). T. P.-C. acknowledges
financial support from the Spanish Ministry of Education through FPU grant AP2008-00030 for
his PhD thesis. María José de la Mata is gratefully acknowledged for her technical support and
kind advice with MDSC measurements conducted at SIdI−UAM. M.A.R. is grateful to Greg
McKenna for sending us their article [60] prior to its publication.

24
References
[1] Swallen S F, Kearns K L, Mapes M K, Kim Y S, McMahon R J, Ediger M D, Wu T, Yu L and Satija S 2007 Science 315 353
[2] Kearns K L, Swallen S F, Ediger M D, Wu T and Yu L 2007 J. Chem. Phys. 127 154702
[3] Kearns K L, Swallen S F, Ediger M D, Wu T, Sun Y and Yu L 2008 J. Phys. Chem. B 112 4934
[4] Leon-Gutierrez E, Sepulveda A, Garcia G, Teresa Clavaguera-Mora M and Rodriguez-Viejo J 2010 Phys. Chem. Chem. Phys. 12 14693
[5] Sepúlveda A, Leon-Gutierrez E, Gonzalez-Silveira M, Rodríguez-Tinoco C, Clavaguera-Mora M and Rodríguez-Viejo J 2011 Phys. Rev. Lett. 107 025901
[6] Singh S, Ediger M D and De Pablo J J 2013 Nat. Mat. 12 1
[7] Stillinger F H 1995 Science 267 1935
[8] Debenedetti P G and Stillinger F H 2001 Nature 410 259
[9] Brawer S 1985 Relaxation in viscous liquids and glasses (Columbus, Ohio: Amer. Ceram. Soc.)
[10] Chang S S and Bestul A B 1972 J. Chem. Phys. 56 503
[11] Chang S S and Bestul A B 1974 J. Chem. Therm. 6 325
[12] Larmagnac J P, Grenet J and Michon P 1981 J. Non-Cryst. Solids 45 157
[13] Wang P, Song C and Makse H A 2006 Nat. Phys. 2 526
[14] Hay J N 1995 Pure and Appl. Chem. 67 1855
[15] Corezzi S, Fioretto D and Rolla P 2002 Nature 420 653
[16] Lambert J B and Poinar G O 2002 Accounts Chem. Research 35 628
[17] Grimaldi David A 1996 Amber, Resinite, and Fossil Resins ACS Symposium Series vol 617, Chapter 11 pp 203−217
[18] Phillips W A 1981 Amorphous solids: Low-temperature properties (Berlin: Springer)
[19] Anderson P W, Halperin B I and Varma C M 1972 Phil. Mag. 25 1
[20] Phillips W A 1972 J. Low Temp. Phys. 7 351
25
[21] See, for instance, the specific sessions devoted to this topic in the 6th International Discussion Meeting on Relaxations in Complex Systems (IDMRCS), held in Rome (Italy), and their selected papers published in: J. Non-Cryst. Solids 357 (2011) pp 501−556
[22] Karpov V, Klinger M and Ignat’ev F 1983 Zh. Eksp. Teor. Fiz 84 439
[23] Ill'in M A, Karpov V G and Parshin D A 1987 Sov. Phys. − JETP 65 165
[24] Buchenau U, Galperin Y M, Gurevich V L and Schober H R 1991 Phys. Rev. B 43 5039
[25] Buchenau U, Galperin Y M, Gurevich V L, Parshin D A, Ramos M A and Schober H R 1992 Phys. Rev. B 46 2798
[26] Parshin D A 1994 Phys. Solid State 36 991
[27] Ramos M A and Buchenau U 1997 Phys. Rev. B 55 5749
[28] Ramos M A and Buchenau U 1998 Tunnelling systems in amorphous and crystalline solids ed P Esquinazi (Berlin: Springer), Chapter 9 pp 527−569
[29] Gurevich V L, Parshin D A and Schober H R 2003 Phys. Rev. B 67 094203
[30] Parshin D A, Schober H R and Gurevich V L 2007 Phys. Rev. B 76 064206
[31] Love M S and Anderson A C 1991 J. Low Temp. Phys. 84 19
[32] Wert C A, Weller M, Schlee D and Ledbetter H 1989 J. Appl. Phys. 65 2493
[33] Pérez-Enciso E and Ramos M A 2007 Thermochim. Acta 461 50
[34] Krüger J K 1989 Optical Techniques to Characterize Polymer Systems, Studies in Polymer Science vol 5, ed K Seki & H Bässler (Amsterdam: Elsevier) pp 429–534
[35] Krüger J, Baller J, Britz T, Le Coutre A, Peter R, Bactavatchalou R and Schreiber J 2002 Phys. Rev. B 66 012206
[36] Ramos M A, Talón C, Jiménez-Rioboó R and Vieira S 2003 J. Phys.: Cond. Matt. 15 S1007
[37] Ramos M A 2004 Phil. Mag. 84 1313
[38] Hassaine M, Ramos M A, Krivchikov A I, Sharapova I V., Korolyuk O A and Jiménez-Riobóo R J 2012 Phys. Rev. B 85 104206
[39] Ramos M A, Gil L, Bringer A and Buchenau U 1993 Phys. Stat. Sol. (a) 135 477
[40] Esquinazi P 1998 Tunnelling systems in amorphous and crystalline solids (Berlin: Springer)
[41] Grigera T, Martin-Mayor V, Parisi G and Verrocchio P 2003 Nature 422 289
[42] Schirmacher W 2006 Eur. Phys. Lett. 73 892
26
[43] Ruocco G, Sette F, Di Leonardo R, Monaco G, Sampoli M, Scopigno T and Viliani G 2000 Phys. Rev. Lett. 84 5788
[44] Götze W and Mayr M 2000 Phys. Rev. E 61 587
[45] Grigera T, Martín-Mayor V, Parisi G and Verrocchio P 2001 Phys. Rev. Lett. 87 085502
[46] Taraskin S, Loh Y, Natarajan G and Elliott S 2001 Phys. Rev. Lett. 86 1255
[47] Lasjaunias J C, Penn G and Vandorpe M 1980 Phonon Scattering in Condensed Matter ed H Maris (New York: Plenum) pp 25–28
[48] Löhneysen H v, Rüsing H and Sander W 1985 Z. Phys. B - Condensed Matter 60 323
[49] Ahmad N, Hutt K and Phillips W 1986 J. Phys. C: Sol. State Phys. 19 3765
[50] Pérez-Enciso E, Ramos M A and Vieira S 1997 Phys. Rev. B 56 32
[51] Inamura Y, Arai M, Yamamuro O, Inaba A, Kitamura N, Otomo T, Matsuo T, Bennington S M and Hannon A C 1999 Phys. B 263−264 299
[52] Calemczuk R, Lagnier R and Bonjour E 1979 J. Non-Cryst. Solids 34 149
[53] Angell C, Yue Y, Wang L, Copley J R, Borick S and Mossa S 2003 J. Phys.: Cond. Matt. 15 1051
[54] Monaco A, Chumakov A, Yue Y-Z, Monaco G, Comez L, Fioretto D, Crichton W and Rüffer R 2006 Phys. Rev. Lett. 96 1051
[55] Baldi G, Fontana A, Monaco G, Orsingher L, Rols S, Rossi F and Ruta B 2009 Phys. Rev. Lett. 102 195502
[56] Caponi S, Corezzi S, Fioretto D, Fontana A, Monaco G and Rossi F 2009 Phys. Rev. Lett. 102 27402
[57] Rufflé B, Ayrinhac S, Courtens E, Vacher R, Foret M, Wischnewski A and Buchenau U 2010 Phys. Rev. Lett. 104 067402
[58] Hong L, Begen B, Kisliuk A, Alba-Simionesco C, Novikov V N and Sokolov A P 2008 Phys. Rev. B 78 134201
[59] Chumakov A I et al. 2011 Phys. Rev. Lett. 106 225501
[60] Zhao J, Simon S L and McKenna G B 2013 Nat. Comm. (accepted)
[61] Sokolov A P, Rössler E, Kisliuk A and Quitmann D 1993 Phys. Rev. Lett. 71 2062
[62] Sokolov A, Kisliuk A, Quitmann D, Kudlik A and Rössler E 1994 J. Non-Cryst. Solids 172−174 138
Related Documents