Low-temperature speciation and chemical kinetic studies of n-heptane Darshan M.A. Karwat a,⇑ , Scott W. Wagnon a , Margaret S. Wooldridge b,a , Charles K. Westbrook c a Department of Mechanical Engineering, University of Michigan, Ann Arbor, MI 48109, USA b Department of Aerospace Engineering, University of Michigan, Ann Arbor, MI 48109, USA c Lawrence Livermore National Laboratory, Livermore, CA 94550, USA article info Article history: Received 6 March 2013 Received in revised form 30 June 2013 Accepted 30 June 2013 Available online 7 August 2013 Keywords: n-Heptane Ignition delay Chemical kinetics Speciation Rapid compression facility abstract Although there have been many ignition studies of n-heptane—a primary reference fuel—few studies have provided detailed insights into the low-temperature chemistry of n-heptane through direct mea- surements of intermediate species formed during ignition. Such measurements provide understanding of reaction pathways that form toxic air pollutants and greenhouse gas emissions while also providing key metrics essential to the development of chemical kinetic mechanisms. This paper presents new igni- tion and speciation data taken at high pressure (9 atm), low temperatures (660–710 K), and a dilution of inert gases-to-molecular oxygen of 5.64 (mole basis). The detailed time-histories of 17 species, including large alkenes, aldehydes, carbon monoxide, and n-heptane were quantified using gas chromatography. A detailed chemical kinetic mechanism developed previously for oxidation of n-heptane reproduced exper- imentally observed ignition delay times reasonably well, but predicted levels of some important interme- diate chemical species that were significantly different from measured values. Results from recent theoretical studies of low temperature hydrocarbon oxidation reaction rates were used to upgrade the chemical kinetic mechanism for n-heptane, leading to much better agreement between experimental and computed intermediate species concentrations. The implications of these results to many other hydrocarbon fuel oxidation mechanisms in the literature are discussed. Ó 2013 The Combustion Institute. Published by Elsevier Inc. All rights reserved. 1. Introduction n-Heptane (n-C 7 H 16 ) is an important reference compound used to study the chemical kinetics of large n-alkanes, which are significant fractions of complex commercial fuels such as gasoline, kerosene, and diesel fuel. The size and structure of n-C 7 H 16 lead to chemical kinetic features that distinguish long-chain n-alkanes such as n-C 7 H 16 from other hydrocarbons, and in particular the strong negative-temperature coefficient (NTC) behavior of long-chain n-alkanes. As a component of primary reference fuels, n-C 7 H 16 has been studied extensively in shock tubes [1–7], jet-stir- red reactors [8,9], rapid compression machines (RCMs) [10–14], premixed laminar flames [15–19], and flow reactors [20]. There have been a smaller number of studies [8,9,13,15,17,20] in which the products of n-C 7 H 16 oxidation—intermediate and final—have been measured experimentally. The level of detail observed and measured in experimental studies of n-C 7 H 16 combustion and the kinetic complexity in the chemical kinetic reaction mechanisms used to interpret those experiments have grown steadily over the past 20 years. More detailed experiments have motivated better ki- netic models and vice versa; recent advances in theoretical chem- istry capabilities, such as the ab initio studies described later, have also been important. Nearly 20 years ago, Dagaut et al. [8] studied the oxidation of diluted stoichiometric n-C 7 H 16 mixtures in a jet-stirred reactor at residence times between 0.1 and 2 s, between pressures of 1–40 atm, temperatures of 550–1150 K, and an inert/O 2 ratio be- tween 90 and 180 (mole basis). Using gas chromatography and mass spectrometry, the authors were able to measure 44 different chemical species. They noted that increasing the pressure from 10 to 40 atm increased CO and CO 2 formation, while cyclic ethers such as cis-2-methyl-5-ethyltetrahydrofuran became more prevalent at higher temperatures as the pressure increased. The shift in cyclic ether production was attributed to QOOH formation, which in- creases with increasing pressure. Herbinet et al. [9] very recently studied n-C 7 H 16 oxidation in a jet-stirred reactor, focusing on reactions in the low-temperature regime from 500 to 1100 K and measuring concentrations of species important in that temperature range, including cyclic ethers, alkenes, species with two carbonyl groups and ketohydrop- eroxides. They used a kinetic model to interpret their measure- ments, with generally good comparisons between computed and experimental results. 0010-2180/$ - see front matter Ó 2013 The Combustion Institute. Published by Elsevier Inc. All rights reserved. http://dx.doi.org/10.1016/j.combustflame.2013.06.029 ⇑ Corresponding author. Address: Department of Mechanical Engineering, Uni- versity of Michigan, 2350 Hayward St., Ann Arbor, MI 48109-2125, USA. Fax: +1 734 647 3170. E-mail address: [email protected] (D.M.A. Karwat). Combustion and Flame 160 (2013) 2693–2706 Contents lists available at ScienceDirect Combustion and Flame journal homepage: www.elsevier.com/locate/combustflame

Welcome message from author
This document is posted to help you gain knowledge. Please leave a comment to let me know what you think about it! Share it to your friends and learn new things together.
Transcript

Combustion and Flame 160 (2013) 2693–2706
Contents lists available at ScienceDirect
Combustion and Flame
journal homepage: www.elsevier .com/locate /combustflame
Low-temperature speciation and chemical kinetic studies of n-heptane
0010-2180/$ - see front matter � 2013 The Combustion Institute. Published by Elsevier Inc. All rights reserved.http://dx.doi.org/10.1016/j.combustflame.2013.06.029
⇑ Corresponding author. Address: Department of Mechanical Engineering, Uni-versity of Michigan, 2350 Hayward St., Ann Arbor, MI 48109-2125, USA. Fax: +1 734647 3170.
E-mail address: [email protected] (D.M.A. Karwat).
Darshan M.A. Karwat a,⇑, Scott W. Wagnon a, Margaret S. Wooldridge b,a, Charles K. Westbrook c
a Department of Mechanical Engineering, University of Michigan, Ann Arbor, MI 48109, USAb Department of Aerospace Engineering, University of Michigan, Ann Arbor, MI 48109, USAc Lawrence Livermore National Laboratory, Livermore, CA 94550, USA
a r t i c l e i n f o
Article history:Received 6 March 2013Received in revised form 30 June 2013Accepted 30 June 2013Available online 7 August 2013
Keywords:n-HeptaneIgnition delayChemical kineticsSpeciationRapid compression facility
a b s t r a c t
Although there have been many ignition studies of n-heptane—a primary reference fuel—few studieshave provided detailed insights into the low-temperature chemistry of n-heptane through direct mea-surements of intermediate species formed during ignition. Such measurements provide understandingof reaction pathways that form toxic air pollutants and greenhouse gas emissions while also providingkey metrics essential to the development of chemical kinetic mechanisms. This paper presents new igni-tion and speciation data taken at high pressure (9 atm), low temperatures (660–710 K), and a dilution ofinert gases-to-molecular oxygen of 5.64 (mole basis). The detailed time-histories of 17 species, includinglarge alkenes, aldehydes, carbon monoxide, and n-heptane were quantified using gas chromatography. Adetailed chemical kinetic mechanism developed previously for oxidation of n-heptane reproduced exper-imentally observed ignition delay times reasonably well, but predicted levels of some important interme-diate chemical species that were significantly different from measured values. Results from recenttheoretical studies of low temperature hydrocarbon oxidation reaction rates were used to upgrade thechemical kinetic mechanism for n-heptane, leading to much better agreement between experimentaland computed intermediate species concentrations. The implications of these results to many otherhydrocarbon fuel oxidation mechanisms in the literature are discussed.
� 2013 The Combustion Institute. Published by Elsevier Inc. All rights reserved.
1. Introduction
n-Heptane (n-C7H16) is an important reference compound usedto study the chemical kinetics of large n-alkanes, which aresignificant fractions of complex commercial fuels such as gasoline,kerosene, and diesel fuel. The size and structure of n-C7H16 lead tochemical kinetic features that distinguish long-chain n-alkanessuch as n-C7H16 from other hydrocarbons, and in particular thestrong negative-temperature coefficient (NTC) behavior oflong-chain n-alkanes. As a component of primary reference fuels,n-C7H16 has been studied extensively in shock tubes [1–7], jet-stir-red reactors [8,9], rapid compression machines (RCMs) [10–14],premixed laminar flames [15–19], and flow reactors [20]. Therehave been a smaller number of studies [8,9,13,15,17,20] in whichthe products of n-C7H16 oxidation—intermediate and final—havebeen measured experimentally. The level of detail observed andmeasured in experimental studies of n-C7H16 combustion and thekinetic complexity in the chemical kinetic reaction mechanismsused to interpret those experiments have grown steadily over the
past 20 years. More detailed experiments have motivated better ki-netic models and vice versa; recent advances in theoretical chem-istry capabilities, such as the ab initio studies described later, havealso been important.
Nearly 20 years ago, Dagaut et al. [8] studied the oxidation ofdiluted stoichiometric n-C7H16 mixtures in a jet-stirred reactor atresidence times between 0.1 and 2 s, between pressures of1–40 atm, temperatures of 550–1150 K, and an inert/O2 ratio be-tween 90 and 180 (mole basis). Using gas chromatography andmass spectrometry, the authors were able to measure 44 differentchemical species. They noted that increasing the pressure from 10to 40 atm increased CO and CO2 formation, while cyclic ethers suchas cis-2-methyl-5-ethyltetrahydrofuran became more prevalent athigher temperatures as the pressure increased. The shift in cyclicether production was attributed to QOOH formation, which in-creases with increasing pressure.
Herbinet et al. [9] very recently studied n-C7H16 oxidation in ajet-stirred reactor, focusing on reactions in the low-temperatureregime from 500 to 1100 K and measuring concentrations ofspecies important in that temperature range, including cyclicethers, alkenes, species with two carbonyl groups and ketohydrop-eroxides. They used a kinetic model to interpret their measure-ments, with generally good comparisons between computed andexperimental results.

2694 D.M.A. Karwat et al. / Combustion and Flame 160 (2013) 2693–2706
While they did not measure product compositions, one inten-tion of the Cox et al. [14] study was to explore the extent of reac-tion of n-C7H16 during compression in an RCM. The authors usedgas chromatography to measure the amount of n-C7H16 thatreacted during the 22 ms stroke of their RCM as a function oftemperature. They supplemented these data with chemilumines-cence measurements of the first stage of ignition and foundsignificant amounts of fuel consumption during the compressionstroke when the targeted top-dead center (TDC) temperatureexceeded 800 K.
In another study carried out nearly 20 years ago, Minetti et al.[13] sampled stoichiometric n-C7H16 mixtures with a dilution ofinert gases-to-O2 of 3.76 at a temperature of 667 K and a pressureof 3.4 bar, i.e., v(n-C7H16) = 0.0187, v(O2) = 0.2061, v(N2) = 0.7, andv(CO2) = 0.0752. Using gas chromatography/mass spectrometry,they identified 36 distinct compounds formed during an ignitiondelay time of 41 ms, with the first stage of ignition occurring30 ms after top dead center in their RCM. They compared theirexperimental data with model predictions based on an earlychemical mechanism by Warnatz [21]. The model adequatelyreproduced ignition delay times, but did not perform well at pre-dicting the time-histories of many of the intermediate species.The mechanism predicted significant consumption of n-C7H16 atthe first stage of ignition (80%), while experimental measurementswere closer to 20%. Minetti et al. [13] concluded that a great dealmore mechanism development was needed before reliable speciespredictions would be possible.
Finally, Ingemarsson et al. [15], Doute et al. [17] and Held et al.[20] measured intermediate species levels in laminar flames andturbulent flow reactors, but these studies concerned high andintermediate temperature oxidation conditions where low temper-ature reaction pathways could be ignored.
There have been numerous chemical kinetic mechanismsdeveloped to describe chemical kinetics of n-C7H16 oxidation, afew of which are described below. Some early chemistry modelswere developed [22,23] to address temperatures above the NTCregime, and descriptions of low-temperature chemistry wereadded later. The mechanism developed by Curran et al. [24] in-cluded 25 reaction classes involving n-C7H16 as fuel and its imme-diate reaction products, as well as an extensive low-temperaturekinetic submechanism. Côme et al. [22] used a computer packageto generate detailed and semi-detailed high- and low-temperaturechemical kinetic mechanisms for n-C7H16. More recent kineticmechanisms, including n-C7H16 oxidation at high and low temper-atures, have been developed [25,26] with considerable attentionto alkylperoxy radical isomerization reactions that led to the re-cent study of Herbinet et al. [9]. A mechanism developed at Poli-technico di Milano [27] includes low-temperature chemistry,building on a previous mechanism [23], and contains more than13,000 reactions and 400 chemical species to describe the kineticsof alkanes with up to sixteen carbon atoms. In order to study gas-oline surrogate mixtures, Mehl et al. [28] updated the Curran et al.[24] mechanism by incorporating improved kinetic rates for linearalkenes.
Minetti et al. [13] remains the only study to date with extensivesampling of the intermediates of n-C7H16 consumption in an RCM.Given the importance of n-C7H16 as a reference compound for thecombustion chemistry of long-chain n-alkanes, the present workbuilds on these previous experimental and kinetic modeling stud-ies by presenting new measurements and analysis of intermediatespecies formed during the ignition delay of n-C7H16 at high pres-sure and low temperatures. In the present study, an upgradedchemical kinetic model based on past work but incorporating theresults of recent theoretical ab initio studies is used to simulatethe new experimental data and test the predictive capabilities ofthe model.
Given the increasing interest in utilizing low-temperature heatrelease of fuels and bio-based fuels in advanced engine strategiessuch as homogeneous charge compression ignition, this projectprovides a new set of baseline experiments and kinetic modelingresults for n-C7H16 that can be used to study combustion ofmixtures of n-C7H16 and selected alcohol fuel species. The idea isto develop some kinetic understanding of fuel behavior in internalcombustion engines when a biofuel (e.g., n-butanol) is blendedwith conventional petrochemical fuels such as gasoline, diesel fuelor jet fuel, for which n-C7H16 can be used as a surrogate component[29].
2. Experimental setup
2.1. The University of Michigan Rapid Compression Facility
As a unique and powerful apparatus for studying fuel chemistryover a broad range of thermodynamic conditions, the University ofMichigan Rapid Compression Facility (UM RCF) has been used tostudy ignition of reference hydrocarbon fuel compounds such asiso-octane [30,31], simulated syngas mixtures of hydrogen and car-bon monoxide [32], and oxygenated hydrocarbons [33], as well assoot formation and morphology [34,35]. The UM RCF has been ap-plied to obtain time-resolved measurements of hydroxyl radicalformation during iso-octane/air ignition [36], and quantitativemeasurements of the intermediate species of iso-octane [37],methyl butanoate [38], and n-butanol [39] oxidation using gaschromatography and rapid gas sampling.
The UM RCF is a chemical reactor that uses a free-piston/cylin-der compression process to create the thermodynamic conditionsnecessary for combustion chemical kinetic studies, the features ofwhich are interrogated using the optical and physical accessprovided by the test section of the facility. The five major compo-nents of the UM RCF, seen in the top panel of Fig. 1, are the driversection (with an inner diameter of 154 mm), the driven section(2.74 m long, 101.2 mm inner diameter), the test section (or testmanifold), the sabot (a free piston with a tapered nosecone) andthe fast-acting hydraulic globe valve (with a typical cycle timeof 100 ms) system. Experiments begin with delivering a pre-pre-pared fuel/oxidizer/diluent mixture into the evacuated driven sec-tion, with the sabot located at the upstream end of the drivensection. High-pressure gas in the driver section is released bythe globe valve and launches the sabot down the length of the dri-ven section, compressing the test gas mixture. At the end of com-pression (EOC), the nose cone of the sabot seals the fuel/oxidizer/diluent mixture in the test section, through an interference fit, atspecifically targeted EOC temperatures and pressures. The ther-modynamic conditions are achieved by varying the compressionratio of the test section, as well as the composition of gases inthe test mixture. The majority of the temperature rise (�50%)and pressure rise (�80%) occur during the last 10 ms of the145 ms compression stroke. After EOC, the fuel/oxidizer/diluentmixture in the test section autoignites after a period of time thatis designated the ignition delay time (sign), which is a functionprimarily of the test gas mixture composition, temperature andpressure.
The UM RCF is designed to create nominally uniform conditionsat EOC to isolate reaction chemistry during the experiments and tominimize interfering effects. Two important features of the UMRCF—the geometry of the convergent section and the sabot—arecritical to isolating reaction chemistry from the effects of fluidmechanics and heat transfer. Specifically, the unique shapes ofthe sabot and the convergent section allow the nearly isentropiccompression of the gases in the center or core region of the drivensection into the test section, while the cold boundary layer that isshed during the compression process is sealed from the core gases,

Fig. 1. Shown are a representation of the UM RCF with key dimensions (top panel),the configuration of the RCF test section for end-view imaging (middle panel), andthe configuration of the RCF test section for high-speed gas sampling (bottompanel).
D.M.A. Karwat et al. / Combustion and Flame 160 (2013) 2693–2706 2695
remaining trapped outside the test section in the space betweenthe sabot and the convergent section. Heat losses from the gasesin the core region are thus minimized, maximizing the amount oftime the test gases are at uniform state conditions. Characteriza-tion studies of the UM RCF show the difference in measured andpredicted isentropic conditions in the core region of the testsection are less than 5% and the isentropic core region extendsacross 70% of the diameter of the test section [40]. These character-istics allow long test times (on the order of 50 ms, depending ontest gas mixtures) during which pressure and temperatureconditions remain at >75% and >80% of their EOC values, respec-tively [40].
For this study, stoichiometric n-C7H16/O2 mixtures, with an in-ert/O2 diluent ratio of 5.64 (mole basis), were prepared manomet-rically in a magnetically-stirred mixing tank external to the UMRCF using a mixing manifold (n-C7H16—Sigma–Aldrich, puriss.p.a., P99.5%, GC grade; O2—Cryogenic Cryogenic Gases, Purity Plus4.3, 99.993%, <40 ppm Ar, <3 ppm moisture, <10 ppm N2, <0.5 ppmhydrocarbons; inert diluents: CO2—Cryogenic Gases, Laser Grade,99.995%, <1 ppm of O2, moisture and hydrocarbons, <0.2 ppmCO; and N2—Cryogenic Gases, Purity Plus 5.0, 99.999%, <2 ppmO2, <3 ppm moisture, <0.5 ppm hydrocarbons). Mixture composi-tions were determined using partial pressures measured with acapacitance diaphragm gauge (Varian CeramiCel VCMT12TFA, with
an accuracy of ±0.01 torr). The partial pressure of n-C7H16 wasmaintained well below its saturation vapor pressure at room tem-perature (0.059 atm or 45 torr at 25 �C) in order to avoid concernsof fuel condensation. Total mixture pressures in the mixing tankwere 0.5–0.8 atm, with initial fill pressures (P0) in the RCF ofapproximately 0.13 atm.
The pressure in the test section is monitored using a piezoelec-tric transducer (Kistler 6041AX4) and charge amplifier (Kistler5010B) with a combined accuracy of 0.01 atm and 0.015 ms. Allelectronic signals were recorded at 100 kHz (National InstrumentscDAQ 9172 chassis coupled with National Instruments 9215 cards).For ignition experiments, a transparent end wall (configurationseen in the middle panel of Fig. 1) coupled with a high-speed cam-era with a widescreen CMOS array (Vision Research Phantom v711,maximum resolution of 1280 � 800 pixels, capable of 1.4 millionframes per second at reduced resolution, 20 lm pixels with0.34 lm spacing) and a fast 50 mm lens (f/0.95, Navitar) andc-mount extension tube recorded the ignition events in the testsection by viewing along the axis of the test section. Imaging dataprovide qualitative and quantitative indications of the ignitionhomogeneity. Imaging data were acquired at 30,000 frames persecond (fps) at a spatial resolution of 256 � 256 pixels, with an im-age exposure time of 34 ls.
2.2. High-speed gas sampling and gas chromatography
For gas sampling, the transparent end wall is replaced with anendwall equipped with a high-speed gas sampling system (shownin the bottom panel of Fig. 1). The gas sampling system removes avery small portion (quantified below) of the test gas mixture at tar-geted times during the ignition delay period. The samples are thenanalyzed using gas chromatographic techniques to identify andquantify the intermediate species present in sample. A series ofsamples acquired from experiments conducted at the same tar-geted EOC conditions allows a compilation of overall speciestime-histories for the intermediates identified. Several previousstudies, including fuels such as iso-octane [37], methyl butanoate[38], and n-butanol [39] have demonstrated the validity of thisexperimental technique.
The sampling system used for these experiments consisted ofsample chambers (�4.5 ± 0.5 mL) equipped with piezoresistivepressure transducers (Kistler 4045A2), charge amplifiers (Kistler4618A0), low-bleed septa (VICI Valco), fast-acting sampling valves(modified Festo MHE3 valves with a stock response time of 3 ms,3 mm orifice), and vacuum isolation valves (Swagelok). Indepen-dent control of each sampling valve using two digital delay/pulsegenerators (Stanford Research Systems Model DG535) allows thecollection of up to four samples per experiment. The four samplesare acquired through probes located on a square spacing(26 � 26 mm) on the end wall, 19 mm (radially) from the centerof the test section. (Recall the test section inner diameter is50.8 mm.) For the sampling data presented here, one gas samplewas collected in each experiment by triggering the fast-actingvalve located at the northeast position of the sampling end wall.Significant care was taken to ensure that the samples were takenfrom the volume of the test section well beyond the cold thermalboundary layer of the test section end wall; specifically, the sam-pling tips extend 1.2 cm into the core volume of the test section,whereas the boundary layer thickness is approximately 0.3 cm(see Fig. 2 described below). During the sampling event, the react-ing gases removed from the test section gases are quenched in lessthan 0.3 ms as they expand into the vacuum of the sample cham-ber (Ptest section/Psample chamber � 11, Vtest section/Vsample chamber � 39).Once the samples are acquired, the gases are drawn into a syringe(Hamilton Gastight #1010, 10 mL) through the syringe port on thesampling chamber for delivery to the gas chromatographs. As will

Fig. 2. Results from a typical UM RCF n-C7H16 ignition experiment. The lower panel depicts the pressure time-history in the test section, along with the rate of pressure rise,which allows definition of sign and the effective pressure and temperature conditions. The upper panel shows still images taken at 30,000 fps via end-view imaging. Note thehomogeneity of the ignition event. The color of the images has been adjusted for clarity. (For interpretation of the references to color in this figure legend, the reader isreferred to the web version of this article.)
2696 D.M.A. Karwat et al. / Combustion and Flame 160 (2013) 2693–2706
be shown later, the sampling of very small volumes of test gasesleaves the reactive mixture in the test section unaffected. The sign
values determined from the gas-sampling experiments were inexcellent agreement with experiments where gas sampling wasnot used. Further details on the gas sampling system can be foundin Karwat et al. [39].
The dilution of the sample by unreacted gases trapped in the‘‘dead’’ volume of the sampling system of the sampling probe(±16%, as determined previously [39]), along with the gas chroma-tography calibration uncertainties for each species, are the chiefcontributors to the uncertainty of the gas sampling measurements.For the data presented in this paper, the temporal uncertaintiesresulting from the triggering of the fast-acting sampling valveswere the same as described previously [39]—the uncertainty inthe sampling time is ±0.75 ms centered on the falling edge of thesampling pulse sent to the fast-acting valves. The gas-sampling re-sults therefore represent the average values of the species duringthe sampling time.
Three gas chromatographs (GCs) equipped with four differentcolumns, with each connected to a separate detector (either aflame ionization detector, FID, or a thermal conductivity detector,TCD), were calibrated for quantitative measurements of species
Table 1Experimental details of the gas chromatography systems used in the current work.
GC System Column(s) Detector(s) Temperature profi
1 PerkinElmerAutosystem
Varian CP-PoraBOND Q25 m � 0.53 mm � 0.7 lm
Flameionizationdetector (FID)
30 �C (4.5 min) ?min ? 110 �C (9 mmin ? 150 �C (20
2 PerkinElmerAutosystem
Varian CP-Al2O3/Na2SO4
25 m � 0.53 mm � 0.7 lmFID 30 �C for 4 min ?
min ? 150 �C for7 min ? 45 �C/mifor 2 min
3 PerkinElmerClarus 500
Agilent DB-Wax30 m � 0.25 mm � 0.25 lm
FID 25 �C for 5 min ?min ? 200 �C for
Restek ShinCarbon STpacked 2 m � 1 mm
Thermalconductivitydetector(TCD)
25 �C for 5 min ?min ? 200 �C for
of interest. A temperature-controlled 10-port gas sampling valveinjected the samples into the columns in the GCs. Ultra high purityhelium (Cryogenic Gases, Purity Plus, 99.999%) was the carrier gasfor all of the GCs. Each of the FIDs used a hydrogen/air flame, weremaintained at 300 �C, and were set with a range and attenuation of1. The TCD was maintained at 100 �C with an attenuation of 1 andcurrent of ±160 mA. The helium, air, and hydrogen were furtherpurified before use in the GCs using adsorbents to remove water,hydrocarbons, and oxygen. High-purity reference chemicals, eithergaseous or vapors of liquid, were used to develop the GC tempera-ture programs applied in the study and to calibrate the targetedintermediate species. (Details on purity levels of referencechemicals are provided in Table S1.) Calibration mixtures weremade in the magnetically-stirred mixing tank. Upper limits tothe calibrations for all species except n-C7H16 were establishedusing the maximum concentrations predicted by the reactionmechanism discussed below during the ignition delay period of amixture with v(n-C7H16) = 0.0135, v(O2) = 0.1486, v(N2) = 0.2179,and v(CO2) = 0.62 at P = 9 atm and T = 700 K, and the maximumamount of carbon in the system. Calibration curves were linearin all cases. Voltage signals from the GC detectors were recordedusing a data acquisition system with a sampling rate of 8 Hz (NI
le Species detected
45 �C/in) ? 45 �C/
min)
n-C7H16, methanol (CH3OH), acetaldehyde (CH3CHO),propionaldehyde (C2H5CHO)
25 �C/
n ? 200 �C
Methane (CH4), ethane (C2H6), ethene (C2H4), ethyne (C2H2),propane (C3H8), propene (C3H6), 1-butene (1-C4H8), 1-pentene(1-C5H10), 1-hexene (1-C6H12), 1,3-butadiene (1,3-C4H6), 3-heptene (3-C7H14)
45 �C/5 min
2-Heptene (2-C7H14), n-butyraldehyde (n-C3H7CHO)
45 �C/5 min
Carbon monoxide (CO)

D.M.A. Karwat et al. / Combustion and Flame 160 (2013) 2693–2706 2697
PXI 4472). Table 1 provides details about the temperature profilesand columns used in the GCs and the species detected.
3. Experimental results and discussion
3.1. Ignition experiments
Experiments with end-view imaging were performed not onlyto measure the ignition delay time (sign) as a function of temper-ature, but also to identify the appropriate temperature andpressure conditions at which to conduct sampling experiments.Given that each sampling event lasts approximately 1.5 ms, wetargeted a sign of approximately 15 ms for the sampling experi-ments. This time would comfortably allow for at least 10 discretesampling events during the ignition delay period. The dilution inthese experiments (inert/O2 = 5.64 rather than the more com-monly used ratio of 3.76 in normal air) was selected to extendthe ignition delay period to 15 ms, as discussed further below.For each experiment, the effective test conditions correspondingto a sign value are determined based on the pressure time-history,an example of which is seen in Fig. 2. n-C7H16 exhibited two-stageignition for all of the experimental data presented here. Therefore,a modified method compared to previous studies [38,39] wasused to describe the experimental conditions. Eq. (1) was usedto determine the effective pressure (Peff), which is the time-inte-grated average pressure from the maximum pressure (Pmax) atthe EOC to the maximum rate of pressure rise at the 1st stage ofignition (dP/dtmax, 1st stage),
Peff ¼1
tdP=dtmax � tPmax
Z tdP=dtmax;1st stage
tPmax
P � dt ð1Þ
The effective temperature (Teff) for each experiment was deter-mined using Peff and numerical integration of the isentropic relation(Eq. (2)),
Fig. 3. Ignition characteristics of n-C7H16 over a wide range of temperatures (650–1400 Kunless otherwise noted. UM RCF data with inert/O2 �5.64, and all other data with inert/Oshock tubes, the Minetti et al. [13] RCM ignition data are represented at TEOC, and therepresenting the standard deviation of sign (0.63 ms) for the UM RCF data are not visible
Z Teff
T0
cc� 1
d ln T ¼ lnPeff
P0
� �ð2Þ
where P0 is the initial charge pressure, T0 is the initial temperature,and c is the temperature-dependent ratio of the specific heats of theunreacted test gas mixture (determined using the NASA thermody-namic data base [41]). sign for each experiment was defined as thetime between EOC (t = 0 ms, defined by the first maximum in P)and the maximum rate of pressure rise corresponding to autoigni-tion (dP/dtmax, 2nd stage). Ignition experiments were performed inthe narrow temperature range of 660–707 K at an effective pressurebetween 8.92 and 9.53 atm. The lowest EOC temperature was dic-tated by the compression ratio of the UM RCF in the configurationused, with CO2 as the sole diluent. The highest EOC temperaturewas chosen to avoid significant reaction and heat release duringcompression, thereby avoiding complications in defining the exper-imental state conditions and the interpretation of the resulting sign
and gas sampling results. All mixtures used an equivalence ratio of1 (based on the molar ratio of fuel to O2) and a dilution of inert/O2 = 5.62–5.64, with N2 and CO2 as the diluents. The n-C7H16 con-centration for the experiments was 1.34–1.35%. Table S2 of the Sup-plemental Information provides a summary of the experimentalconditions and results for sign for all of the UM RCF data presented.
Figure 2 presents typical results from a UM RCF n-C7H16 ignitionexperiment in which imaging data were acquired. The lower paneldepicts the time-histories of the pressure (P) and rate of pressurerise (dP/dt) in the test section. A fast Fourier transform has beenapplied to filter high-frequency disturbances greater than 2.5 kHzgenerated by the impact of the sabot near EOC. A smooth compres-sion process due to the motion of the sabot brings the pressure tothe first maximum, and the EOC is set as time t = 0, after which thevolume in the test section is constant. The first stage of ignition (s1)occurs at 7.13 ms, corresponding to a local maximum in dP/dt (cir-cled at the bottom in Fig. 2), and Peff and Teff are 9.32 atm and707 K, respectively. After the first stage of ignition, the pressure
) and pressures (3–42 atm), including results of the current work. All data with / = 12 �3.76. Shock tube ignition delay data are represented at T5 corresponding to P5 indata of the current work are represented at Teff corresponding to Peff. Error barsat the resolution used in the plot. Lines represent curve fits to experimental data.

Fig. 4. Typical pressure time-histories from the test section and sampling volume ofa gas-sampling experiment. The electronic signal used to trigger the gas samplingevent is included for reference. Also included in the figure is the pressure time-history of a non-igniting experiment. See text for details.
2698 D.M.A. Karwat et al. / Combustion and Flame 160 (2013) 2693–2706
rises again slowly for a while, then more abruptly, to the maximumvalue corresponding to the autoignition of the test mixture—sign = 12.73 ms.
The upper panel of Fig. 2 shows stills from the image sequenceof the chemiluminescence that occurs during ignition. Thisemission is attributed [42] to CH� (C2 + OH ? CO + CH�) andC�2 ðCþ CH! C�2 þHÞ radicals, which have strong spectroscopicfeatures in the blue part of the visible spectrum (CH�: 431.2 nm;C�2: 473.7 nm, 516.5 nm, 563.5 nm). The intense blue emission oc-curs simultaneously throughout the test section with uniformintensity, attesting to the high degree of homogeneity of the reac-tant mixture and the state conditions in the test section. Such uni-formity gives confidence in the application of localized sampling.
Figure 3 presents results of UM RCF ignition and samplingexperiments, along with n-C7H16 ignition data from other studies,including RCM studies of Minetti et al. [13] and Silke et al. [10],and shock tube studies of Shen et al. [2] and Ciezki and Adomeit[1]. Data for this plot have been selected to illustrate the influencesof pressure, equivalence ratio, and dilution on sign and to show thatthe present RCF experimental results are consistent with previousignition delay experiments using n-C7H16 as the fuel. As shown inFig. 3, n-C7H16 ignition exhibits significant NTC behavior between720 K and 950 K, and the NTC region shifts to higher temperaturesas pressure increases. Reasons for this shift are well known; NTCbehavior is governed by the ratio of RO2 to R, and since at higherpressures the concentrations of O2 are higher, the equilibrium isshifted towards RO2 formation, consequently moving the NTC re-gion to higher temperatures [43]. The magnitude of the NTC behav-ior also decreases with increasing pressure, illustrated in Fig. 3 bythe Ciezki and Adomeit results at 42 and 13.5 bar pressure [1]. Thedecrease in NTC behavior with increasing pressure, discussed byCiezki and Adomeit [1] and by Westbrook et al. [57], can be bestattributed to the quadratic increase with pressure of the bimolec-ular reaction rates, which release most of the energy in the autoig-nition. This is in contrast to the equilibrium of the R + O2 = RO2 andQOOH + O2 = O2QOOH reactions, reactions that control the NTCbehavior and are equilibrated in most of the NTC region, whichshift only linearly with increasing pressure.
Also seen in Fig. 3 are data from the ignition delay experimentsof Shen et al. [2], which show that at temperatures betweenapproximately 1050 and 1250 K, fuel–lean mixtures take longerto ignite than the stoichiometric mixtures. The authors reportedsimilar behavior for n-decane, n-dodecane and n-tetradecane inaddition to n-C7H16, with lean mixtures igniting more slowly thanstoichiometric mixtures, an effect consistent for many hydrocar-bon fuels at lower temperatures [1,30,44–46]. The results ofMinetti et al. [13] are shown as two curves, the upper one inFig. 3 showing the results of the experiments actually carried outat pressures from 3 to 4.5 bar, and the lower curve showing thesame results scaled to a pressure of 9 bar (using a scaling propor-tional to P�1 following Davidson et al. [58]) in order to comparethem with the present experiments, which were conducted at aneffective pressure close to 9 bar.
The values measured for sign in the current study are shown asthe three filled black diamonds in Fig. 3. The rather limited temper-ature range of these experiments is evident from the figure, but thetrend seen in the slope of the three experimental points clearlymatches the slope of the Minetti et al. [13] and Ciezki and Adomeit[1] results over the same temperature range. However, the presentexperimental ignition delay times, measured at an effective pres-sure of approximately 9 bar, are somewhat longer than the shocktube values of Ciezki and Adomeit [1] at the comparable pressureof 13.5 bar and similarly longer than the RCM results of Minettiet al. [13] when scaled to 9 bar. The differences are attributed tothe higher dilution used in the present work. As noted above, theUM RCF data were obtained using an inert/O2 molar dilution of
�5.64, while the other studies summarized in Fig. 3, as well asthe experiments of Griffiths et al. [12], were obtained using an in-ert/O2 molar dilution of 3.76, i.e. the N2/O2 ratio in normal air. Weused the current kinetic mechanism to compare computed ignitiondelay times for the same reactive mixtures with dilutions of 3.76and 5.64, indicating a difference of approximately a factor of 0.5,concluding that the higher diluent levels in our experimentsproduced ignition delay times twice as long as would be observedif the amount of diluent was 3.76, the value of the other experi-mental studies reported in Fig. 3. Scaling the three UM RCF exper-imental points in Fig. 3 by this ratio resulted in the open diamondsymbols shown in Fig. 3, which are in excellent agreement with theother experiments at comparable conditions.
3.2. High-speed gas sampling experiments
While ignition studies provide a good test of the global kineticsof n-C7H16 ignition, speciation measurements require a moredetailed understanding of the important chemical pathways inthe reacting test gas mixture and place stricter constraints on thechemical kinetic reaction mechanism used to simulate theexperiments. Intermediate species formed during the ignitiondelay time were measured through gas sampling experiments. Fig-ure 4 shows results from a typical sampling experiment, in whichPeff = 9.01 atm, Teff = 700 K, s1 = 8.49 ms and sign = 14.53 ms, show-ing the pressure time-history in the test section, the electronicpulse used to trigger the high-speed gas sampling system, andthe pressure in the sampling chamber. Since only a very smallamount of sample is removed from the reacting mixture in the testsection, the pressure in the test section remains unaffected by thesampling process. The pressure features seen in Fig. 4 are thus verysimilar to those seen in Fig. 2, where no sampling was employed.
Also shown as the dashed curve in Fig. 4 is the time-history of anon-igniting experiment, in which the O2 of an igniting experimentwas replaced with N2. Given the almost identical thermal charac-teristics of O2 and N2, the mixture compressed in a non-ignitingexperiment provides a baseline for comparison, including anunderstanding of the effects of heat transfer during the experi-ments. As seen in Fig. 4, the pressure time-history of the non-ignit-ing experiment is almost indistinguishable from the ignitingexperiment (Peff and Teff differ by less 0.1% and 0.3%, respectively)until the first stage of ignition, demonstrating that the heat transferphysics of the experiments remain unaffected by the samplingevents. Moreover, because the non-igniting experiment shows anearly identical compression process to the igniting experiment,

Fig. 5. The experimental pressure time-histories of the thirteen gas-samplingexperiments. Although unnormalized, note the level of repeatability of thecompression process, as well as the first and second stages of ignition and heatrelease.
D.M.A. Karwat et al. / Combustion and Flame 160 (2013) 2693–2706 2699
the data support that reaction during compression is not a concernin these experiments.
A summary of the gas-sampling experiments, including mixturecompositions, can be found in Table S2 in the Supporting Informa-tion. Figure 5 shows the pressure time-histories for the thirteenexperiments, all of which show nearly identical, smooth compres-sion processes, and very similar pressure time-histories after EOC.The average Peff, Teff, s1, and sign for all of the gas-sampling exper-iments were 9.02 atm, 701 K, 7.94 ms, and 14.09 ms, respectively,with corresponding standard deviations (representing the uncer-tainty of the data) of 0.07 atm, 1.5 K, 0.52 ms, and 0.63 ms, respec-tively, which demonstrate the excellent repeatability of theexperiments. Furthermore, since gas-sampling and end-view imag-ing cannot be conducted simultaneously, an experiment to confirmspatial homogeneity of the reacting mixture in the test section wasperformed by rotating the gas sampling system by 180� andacquiring a sample from the southwest corner of the test sectionat almost the same time during the ignition delay period as a sam-ple acquired in another experiment from the northeast corner. Thedata from the rotated gas sampling system were within measure-ment uncertainties of the baseline (i.e. unrotated) speciesconcentrations.
For comparison with kinetic mechanism predictions, the pres-sure time-histories and sampling times were converted to normal-ized times. The period of time between EOC and first stage ofignition of each experiment was normalized by s1 (resulting in anormalized time domain of 0 to 1), and the period of time between
Fig. 6. The normalized experimental pressure time-histories of the thirteen gas-sampling experiments. 0 represents EOC, 1 represents the first stage of ignition, and2 represents the second stage of ignition. Shown also are the normalized samplingtimes of each experiment.
the first stage of ignition and autoiginition (sign � s1) was normal-ized by sign � s1 and added to the first normalized time domain.The result, seen in Fig. 6, is an overall normalized time domain inwhich 0 to 1 represents the first stage of ignition, and 1 to 2 repre-sents the second stage of ignition.
Figure 7 presents typical chromatograms obtained from the GCsduring a sampling experiment, specifically, the experiment de-picted in Fig. 4. All identified species except CO are shown inFig. 7. C2H2 was not observed in any experiment, and some peaksremained unidentified. The carbon balance was 90 ± 12% for sam-pling at early times during the ignition delay period and 65 ± 9%for sampling closer to autoignition. The peaks identified in thechromatograms were converted into discrete measurements ofintermediate species for each normalized sampling time usingthe calibrations for each species.
Several peaks corresponding to large hydrocarbons and oxygen-ated compounds remained unidentified in our GC-FID analyses. Inparticular, we were unable to identify from the GC-FID analysis anylarge, C7 oxygenated species such as furans, cyclic ethers, or keto-hydroperoxides (chemical standards were difficult to find for manyof these species). The Minetti et al. study [13] detailed results ofclasses of compounds such as furans and oxirane, as well as largeketones. The kinetic model, described below, showed appreciablelevels of these species during the later stages of the ignition delayperiod. For example, just before the onset of the first stage ignition,when the computed n-C7H16 mole fraction had decreased from itsinitial value of 0.0135 to 0.0059, the model showed a sum of the C7
cyclic ether mole fractions of about 0.002 and a total of about0.0005 of C7 ketohydroperoxides, equal to about 32% of then-C7H16 consumed at this point. Based on these results, it is likelythat much of the carbon missing from the experimental carbonbalance is in the form of these large C7 oxygenated species, whoseconcentrations increase steadily during the ignition delay period.
Figure 8 presents as symbols (black circles) the UM RCFspecies measurements during the ignition delay time of n-C7H16
for the average experimental conditions of Peff = 9.02 atm,Teff = 701 K, v(n-C7H16) = 0.0134, v(O2) = 0.149, v(N2) = 0.2336,and v(CO2) = 0.6040, where the average ignition features occur ats1 = 7.94 ms and sign = 14.09 ms. The ±0.75 ms uncertainty in thesampling times, when normalized by the average sign, correspondsto approximately ±0.053. The uncertainty in the species calibra-tions (varying for each species) and the uncertainty due to pressuremeasurements in the sampling volume (±10%) were considered asindependent sources of uncertainty on the species concentrations,and were therefore combined by using the square root of the sumof the squares. The quenching and recombination of small radicalscan also be considered a source of error or uncertainty in theexperimental measurements. Small radicals such as O, H, OH,HO2, and CH3 can recombine to form water vapor and smallhydrocarbons, which may interfere with measurements of stablespecies. However, predicted small radical mole fractions, seen inFig. 9, are very low (�40–100 ppm) relative to most of themeasured intermediate species before autoignition. Radicalrecombination during the quenching process of sampling is thusnot expected to be a source of error in the species measurementspresented in this work.
Seen also in Fig. 8 (open red squares) are measurements of thespecies time-histories reported by Minetti et al. [13] in their igni-tion and speciation study. Their experiments were conducted withstoichiometric mixtures of n-C7H16 and O2 with an EOC pressureand temperature of 3.4 bar and 667 K, resulting in an average sign
of 41 ms, with s1 around 30 ms. The sampling experiments byMinetti et al. [13] were at a similar temperature to the presentUM RCF experiments, but at a lower pressure. At 3.76, the dilutionin their experiments was lower than the 5.64 dilution in the pres-ent study. Also, in contrast to the high-speed sampling used in the

Fig. 7. An example of typical gas chromatograms of a gas sample from an n-C7H16 sampling experiment. The data are from the experimental results presented in Fig. 4, inwhich sampling was performed at 12.08 ms after EOC.
2700 D.M.A. Karwat et al. / Combustion and Flame 160 (2013) 2693–2706
present study, Minetti et al. [13] quenched the entire contents ofthe combustion chamber in their experiments by bursting adiaphragm, thereby combining their measured species with thecontents of a cold boundary layer. Nevertheless, the species resultsfrom the present study are broadly consistent with those of Minettiet al. [13].
4. Kinetic modeling
Chemical kinetic modeling is frequently used to interpret RCMexperimental results, usually considering zero-dimensional con-stant volume, adiabatic model predictions using a detailed reactionmechanism for the fuel studied. For very reactive fuels, chemicalreactions and heat release during the compression stroke can beincluded in the modeling calculations, and heat losses to combus-tion chamber walls can also be included, often by making smalladiabatic expansions of the combustion volume after the end ofthe compression stroke to simulate the cooling of the reactinggases. In the present simulations, reactions during the compressionstroke and simulated heat losses were examined, and neither pro-cess was found to have significant impacts on computed results.For example, taking the experimental pressure time-history as anindicator of heat loss, the pressure decreases less than 3% betweenEOC and the first stage of ignition, corresponding to a temperaturedecrease of less than 1%. This low heat loss is primarily due to thevery high volume-to-surface area ratio of the test section. As aconsequence, all simulations used a constant volume, adiabatic ap-proach, and for comparison with the species measurements, all thesimulations used a reactant mixture of v(n-C7H16) = 0.0134,v(O2) = 0.149, v(N2) = 0.2334, and v(CO2) = 0.6042, and initial con-ditions of P0 = 9 atm and T0 = 700 K.
The kinetic modeling calculations were carried out using theCHEMKIN Release 10101 (x64) [47]. The core H2/O2/C1–C4 speciesmechanism was taken from a recently refined mechanism of Met-calfe et al. [48]. The kinetic reaction mechanism for n-C7H16 firstselected for this study was developed by Mehl et al. [28], whichwas based on an earlier mechanism of Curran et al. [24]. Bothmechanisms are constructed using 25 reaction rate rules for thedistinct classes of reactions that describe the fuel oxidation. Thisapproach, combining a core small molecule kinetic mechanism
with additional submechanisms for the larger fuels of interest ina specific study, is commonly employed by a majority of kineticmodel builders. The result in the present case was tested by simu-lations of most of the validation targets used to first develop theearlier version of the reaction mechanism [24,28], and the presentmechanism reproduced all of those tests in satisfactory fashion.Three examples of such reaction classes include the abstractionof H atoms from the fuel by small radical species such as OH or H,
n-C7H16 þ X ¼ C7H15 þ XH ðC-2Þ
where X represents the radical; the addition of molecular oxygen toan alkyl radical, a heptyl radical in the present case, to produce analkylperoxy radical RO2,
C7H15 þ O2 ¼ C7H15O2 ðC-10Þ
and isomerization reactions of RO2 to produce a hydroperoxy alkylspecies QOOH,
C7H15O2 ¼ C7H14OOH ðC-12Þ
These reactions are labeled according to the reaction classesdefined by Curran et al. [24]. The complete kinetic mechanismcontains approximately 1800 chemical species and 7250 elemen-tary chemical reactions, and is included in the supplementalinformation.
Since most of the reactions in such a large kinetic mechanismhave never been studied individually, their rates are usuallyestimated on the basis of other reactions that are somehow similarto the one being examined. For example, for reactions in class(C-10) above (there are 4 unique primary and secondary heptylradicals in the present mechanism for n-C7H16), the rates are as-sumed to be equal to the rates of addition of O2 to primary and sec-ondary sites in n-butane or propane, reactions whose rates havebeen studied. However, for some reaction classes, there were noreliable reaction rates for any similar fuels at the time the originalkinetic mechanisms were developed. One such class involves RO2
isomerization reactions of class (C-12) above. Models for this classin the n-C7H16 mechanism of Curran et al. [24] were taken fromalkyl radical isomerizations with the same size transition staterings by which the reaction proceeded and the same type of C–Hbond being broken (i.e., primary, secondary or tertiary), but didnot account for the –O–O– structure that is part of the transition

Fig. 8. (a–r) Species concentration time-histories from the UM RCF sampling experiments (solid black circles), from the Minetti et al. [13] study (open red squares), and fromthe model predictions for the UM RCF data based on the Mehl et al. [28] mechanism (dashed line), and the current, modified reaction mechanism (solid line). (Note theunique symbols for figure (d).) The model predictions are shown for constant volume, adiabatic conditions with P0 = 9 atm, T0 = 700 K, v(n-C7H16) = 0.0134, v(O2) = 0.149,v(N2) = 0.2336, and v(CO2) = 0.6040. All data are presented as normalized to the % of fuel carbon in the initial reactant mixture. (For interpretation of the references to color inthis figure legend, the reader is referred to the web version of this article.)
D.M.A. Karwat et al. / Combustion and Flame 160 (2013) 2693–2706 2701

Fig. 9. Predictions (constant volume, adiabatic simulations with P0 = 9 atm,T0 = 700 K, v(n-C7H16) = 0.0134, v(O2) = 0.149, v(N2) = 0.2336, andv(CO2) = 0.6040) using the current mechanism of radical concentrations at thefirst and second stages of ignition.
2702 D.M.A. Karwat et al. / Combustion and Flame 160 (2013) 2693–2706
state ring in reaction class (C-12), which should be expected toinfluence the amount of ring strain energy in the transition state.This logic had been proposed by Pollard [49], based in turn on anal-ysis from Fish [50] and was necessary because no rate data wereavailable for any of the RO2 isomerizations. The same type ofapproximation strategy was necessary for other reaction classesinvolving large hydrocarbon radicals that contained O atoms,including cyclic ether production from the hydroperoxy alkylradical QOOH, class (C-19); QOOH decomposition to produce an al-kene and HO2, class (C-20); QOOH b-decomposition to produce analkene and a carbonyl species as well as an OH radical, class (C-21);addition of molecular oxygen to the QOOH species, class (C-22);and isomerization of the O2QOOH radical to produce a stable keto-hydroperoxide species and OH, class (C-23). The common featureof these reaction classes is that they are all part of the RO2 isomer-ization sequence of reactions where low temperature (650–850 K)NTC behavior occurs.
Kinetic reaction mechanisms built according to past reactionrate rules, with many of their reaction rates estimated because ofthe absence of supporting experimental or theoretical values, havebeen quite successful in reproducing integrated experimentalquantities such as ignition delay times and laminar burningvelocities. However, in most such experiments, few if any interme-diate species concentrations are reported that can provide muchmore challenging tests of the predictive capabilities of reactionmechanisms, especially in the low temperature regime where somany of the reaction rates are poorly known. As noted above, the
Fig. 10. A comparison of experimental and computational pressure time-histories. The mT0 = 700 K, v(n-C7H16) = 0.0134, v(O2) = 0.149, v(N2) = 0.2336, and v(CO2) = 0.6040) base
intermediate species measurements of Dagaut et al. [8] and Minettiet al. [13] from their jet-stirred reactor and RCM experiments,respectively, were used by Curran et al. [24] to build the originaln-C7H16 kinetic mechanism, but those were the only previouslyexisting such measurements that were suitable for mechanismvalidation. The recent jet-stirred reactor experiments of Herbinetet al. [9], together with the current RCF data, provide much-neededadditional validation data for n-C7H16 chemical kinetic models, asthese experimental data focus especially on intermediate chemicalspecies concentration measurements in the low-temperatureregime.
In this study, the mechanism developed by Mehl et al. [28] wasused for initial calculations. Figure 10 presents the comparison ofthe initial model results and experimental results for pressure timehistory. The preliminary calculations produced two-stage ignitionfor the current experimental conditions, with first-stage and sec-ond-stage ignition delay times that were somewhat shorter thanbut within a factor of two of the experimental results, as shownin Fig. 10. Specifically, for the initial calculations at 700 K, the pre-dicted s1 was 5.5 ms and sign was 8.5 ms, compared with theexperimental values of about 8.5 ms and 14.5 ms, respectively.
Results for the initial model predictions for the intermediatespecies are compared with the experimental measurements inFig. 8 as the dashed lines. The initial calculations showed thatapproximately 80% of the n-C7H16 fuel was consumed in the firstignition stage, more than the approximately 40–60% consumptionobserved in the experiments, as seen in Fig. 8a. More dramatically,the computed results showed that the intermediate concentrationsof the heptene intermediates produced from n-C7H16 during thetime interval between the first and second ignition stages werehigher than the experimentally measured levels by a factor of 5to 25, as seen in Fig. 8b and c. The 3-C7H14 calibration standardwas an uncertain mixture of cis-3-C7H14 and trans-3-C7H14 andthe measured areas of these two isomers were approximatelyequal in the chromatograms. Due to the uncertainty in the calibra-tion standard, the 3-C7H14 was quantified within a factor of two. InFig. 8c and d, the solid black circles represent measurements of asingle 3-C7H14 isomer, and the open circles represent the upperbound/cumulative measurement of the 3-C7H14 isomers.
The initial mechanism predicted many species quite accurately.For example, as seen in Fig. 8, CH4 and C2H6 were well reproduced,as were CO and some small alkenes such as C3H6 and 1-C4H8. Otherkey species such 1-C5H10, 1-C6H12 and C2H4, together with smalleroxygenates such as CH3CHO and CH3OH, were captured within fac-tors of about two by the initial mechanism. However, the large errorsin the computed amounts of the heptene isomers, together with theconsiderable differences between modeled and experimental rates
odels include predictions (constant volume, adiabatic simulations with P0 = 9 atm,d on the current reaction mechanism and the Mehl et al. [28] mechanism.
D.M.A. Karwat et al. / Combustion and Flame 160 (2013) 2693–2706 2703
of n-C7H16 consumption in the first stage ignition, indicated thatimprovements in the kinetic modeling of the low temperature por-tion of the reaction mechanism were needed.
Two recent publications by Villano et al. [43,51] provided a ba-sis for making significant improvements to the n-C7H16 kineticmechanism. In the papers by Villano et al., the reaction rates forthe most important reaction classes that control ignition at lowtemperature conditions were calculated with electronic structurecalculations performed at the CBS-QB3 level of theory combinedwith canonical transition state theory calculations. The first ofthese papers [43] reported rates of addition of O2 to large alkyl rad-icals to produce RO2 (class (C-10) above); the dissociation of theRO2 back to alkyl radicals and O2 (the reverse reactions for class(C-10)); the isomerization of RO2 to produce hydroxyalkyl radicalsQOOH (class (C-12) above); and the concerted elimination reac-tions of RO2 to produce alkenes and HO2 radicals, seen below:
C7H15O2 ¼ C7H14 þHO2 ðC-12bÞ
The second paper [51] extended the same approach to includethe reverse reaction rates for hydroperoxyalkyl radicals QOOHback to RO2 (the reverse direction for class (C-12) above); the cycli-zation of the QOOH species to produce a cyclic ether and OH
C7H14OOH ¼ OHþ cyclic ether ðC-19Þ
and b-scission reactions of QOOH to produce stable species and aradical:
C7H14OOH ¼ HO2 þ alkene ðC-20ÞC7H14OOH ¼ OHþ alkeneþ carbonyl ðC-21Þ
All of these reaction rates were modified in the n-C7H16 kineticmechanism, replacing the rates that had been estimated based onthe discussions of Pollard [49].
In most kinetic reaction mechanisms and in the present work,the reaction rates in the mechanism are given in one directionand the rates of the reverse reactions are determined from the for-ward rates and detailed balance from the relevant thermochemis-try. The reverse rates for some multistep reactions that are notgenuine elementary reactions, such as Reaction (C-21) above, areusually set to zero, since the net reverse reaction cannot occur.The theory work of Villano et al. calculated the rates of elementaryreactions in the absence of their corresponding reverse reactions,and some of their theoretical computations addressed both for-ward and reverse rates of truly elementary reactions. In particular,their work provides elementary rates of both Reaction (C-12) andits reverse. We chose to specify the forward and reverse reactionrates as determined by Villano et al.; in principle, this may not sat-isfy detailed balance and may not provide the correct equilibriumconstants for these reactions. However, we felt that the precision ofthe forward and reverse reaction rate determinations was likely tobe as accurate or better than our knowledge of the thermochemis-try of the species involved. Further analysis of these theoreticallydetermined reaction rates may lead to future improvements inthe thermochemistry of the RO2 and QOOH species.
However, several important reaction pathways in the low tem-perature submechanism were not evaluated by Villano et al.,including reaction classes (C-22) and (C-23); the addition of molec-ular O2 to the hydroperoxy alkyl radicals QOOH; and the isomeri-zation reactions of the resulting O2QOOH species to produce arelatively stable ketohydroperoxide species.
QOOHþ O2 ¼ O2QOOH ðC-22ÞO2QOOH ¼ ketohydroperoxideþ OH ðC-23Þ
These last two reaction classes are especially important sincechain branching at low temperatures cannot occur without the
second addition of O2 to QOOH and the subsequent isomerizationand decomposition reactions that produce multiple small radicalspecies [24,52,53].
Fortunately, the work of Villano et al. [43,51] enables us to esti-mate the rates of reactions in classes (C-22) and (C-23) with muchgreater confidence than based on Pollard’s estimates, as follows:
1. Since Villano et al. recommended rates of O2 addition to pri-mary, secondary and tertiary sites in alkyl radicals, we assumedthat addition rates of O2 to primary, secondary and tertiary sitesin QOOH radicals would be approximately the same at eachtype of site as those for alkyl radicals.
2. Villano et al. calculated rates of RO2 isomerization reactions byspecifying the number of C, O, and H atoms in the transitionstate ring by which the isomerization took place and the typeof C–H bond being broken. We therefore assumed that the sametransition state rings would have the same energy barriers forO2QOOH species isomerization. That is, we have assumed thatthe transition state ring strain energy for each isomerizationreaction should depend only on the size of the transition statering and the atoms arranged in that transition state ring, i.e.,this energy would be the same in an RO2 reactant as in a O2-
QOOH reactant, with the only differences being the bond energyof the C–H bond that is broken.
3. Curran et al. [24] assumed that the C–H bonds for the C atomholding the OOH moiety in the initial RO2 species have a bondenergy 3 kcal/mol lower than the original value. Following this,in the revised mechanism, we assumed that the O2QOOH radi-cal isomerization reactions have the same rates as their logi-cally similar RO2 isomerizations, but with an activationenergy 3 kcal/mol lower. The Nancy kinetic modeling group[25,26] uses the same logic but reduce this activation energyby only 2 kcal/mol. As further theoretical studies of reactionclasses (C-22) and (C-23) become available, we will use themto replace the current rate expressions, but the present approx-imations are likely to be considerably better than past values,since they contain much more of the fundamental chemistryfeatures of these reactions.
Uncertainties in the rates of the RO2 isomerization reactionshave been a concern for many years, and the inadequacy of the Pol-lard/Fish approach used previously was noted by Villano et al. [43].Earlier studies by Baldwin et al. [54], Hughes et al. [55], andRobertson et al. [56] on the energy barriers for the multiple RO2
isomerization pathways led to improved rates employed by Budaet al. [25] and discussed by Battin-Leclerc [26]. However, untilexperimentally measured chemical species concentrations specificto the low temperature reaction pathways were available in addi-tion to the macroscopic data such as ignition delay times, the de-tails of the low temperature reaction pathways and rates hadlittle impact on kinetic models. The most important quantity thatis required of low temperature kinetic models has been the ratioof chain branching to chain propagation within the NTC regime,since this parameter controls the rate of heat release in the NTC re-gion and therefore the extent to which ignition advances as a resultof low temperature chemistry [26,57]. This ratio can be providedaccurately by rather crude kinetic mechanisms, explaining whyglobal, lumped, or significantly reduced kinetic mechanisms canaccurately reproduce complex ignition delay behavior for manyhydrocarbon fuels, even with substantial contributions from lowtemperature reaction pathways. The present measurement of hep-tene isomers; however, could not be accurately simulated withoutmore accurate low temperature kinetic rate parameters.
With the modified low temperature kinetic parameters, newcomputational results were generated for the pressure time histo-ries and intermediate species. Figures 8 and 10 present the results
2704 D.M.A. Karwat et al. / Combustion and Flame 160 (2013) 2693–2706
of the modified rate parameters. The computed results for n-C7H16
ignition showed significantly better results for the heptene iso-mers, as well as improved agreement for many other species withthe experimental results. The computed ignition delay times withthe improved low temperature kinetics were still faster than theexperimental values. Specifically, the first stage ignition was about4 ms and the second stage ignition was at about 10 ms, comparedwith the experimental values of 8.5 ms and 14.5 ms. The greatlyimproved predictions for 2-C7H14 and 3-C7H14 and smaller changesin other species predictions indicate that the new mechanism issignificantly improved.
Of the 17 species measured experimentally, all of the concen-trations computed from the kinetic model are in reasonable agree-ment with the measurements except the fuel and two aldehydes—propionaldehyde (C2H5CHO) and n-butyraldehyde (n-C3H7CHO).C2H5CHO and n-C3H7CHO are assumed to be produced in thenew mechanism by a number of low temperature reactions thatare quite speculative. Little attention has been given to C2H5CHOand n-C3H7CHO formation or consumption reactions and muchmore work would be needed to be more confident in their kinetics.We have therefore not included their computational predictions inthe Fig. 8. The differences between the measured and computedconsumption of n-C7H16 are more troublesome, especially sincethe amounts of n-C7H16 in both the present experiments and theexperiments of Minetti et al. [13] disagree with the high extentsof consumption predicted by the kinetic mechanism. Further anal-ysis of these results will be needed to resolve this discrepancy, butit is interesting to note that even with this difference in fuel con-sumption, the model is able to predict the concentrations of somany intermediate species as seen in the rest of these speciesprofiles.
5. Discussion
Using the present, upgraded kinetic reaction mechanism, n-C7H16 autoignition was simulated for the same constant volumecondition using the pressure and mixture composition describedearlier, but over a wider temperature range from 600 K to 800 K.The results were used to calculate the difference in values of sign
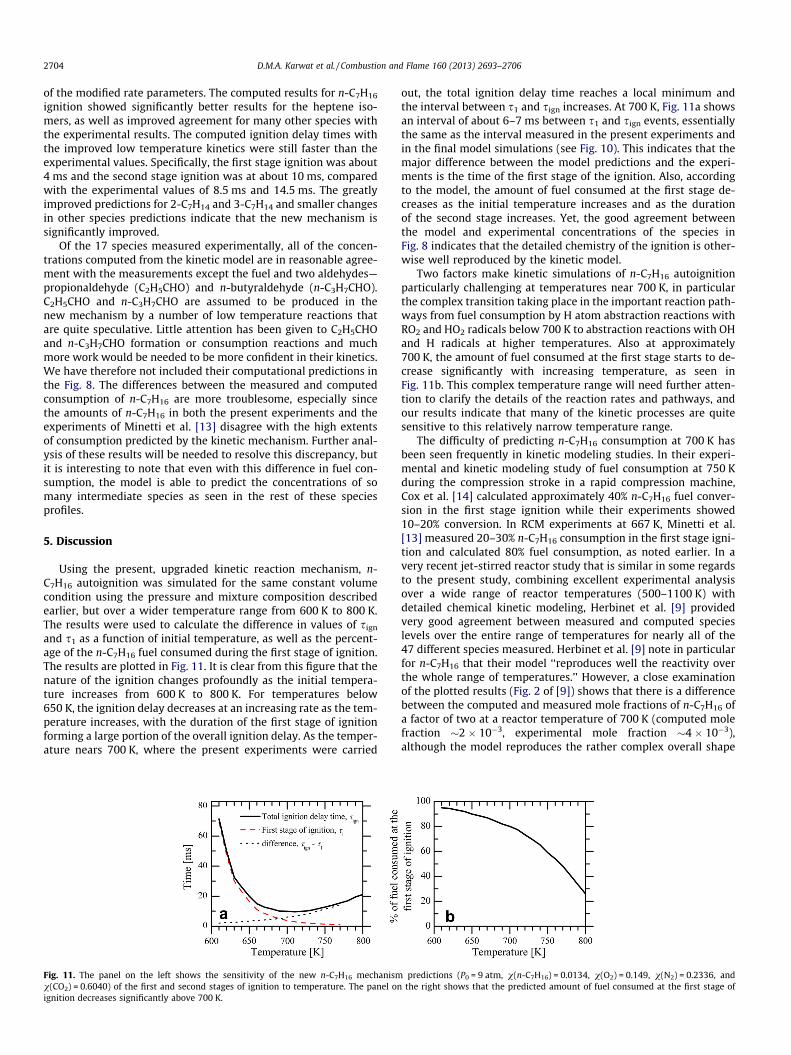
and s1 as a function of initial temperature, as well as the percent-age of the n-C7H16 fuel consumed during the first stage of ignition.The results are plotted in Fig. 11. It is clear from this figure that thenature of the ignition changes profoundly as the initial tempera-ture increases from 600 K to 800 K. For temperatures below650 K, the ignition delay decreases at an increasing rate as the tem-perature increases, with the duration of the first stage of ignitionforming a large portion of the overall ignition delay. As the temper-ature nears 700 K, where the present experiments were carried
Fig. 11. The panel on the left shows the sensitivity of the new n-C7H16 mechanismv(CO2) = 0.6040) of the first and second stages of ignition to temperature. The panel onignition decreases significantly above 700 K.
out, the total ignition delay time reaches a local minimum andthe interval between s1 and sign increases. At 700 K, Fig. 11a showsan interval of about 6–7 ms between s1 and sign events, essentiallythe same as the interval measured in the present experiments andin the final model simulations (see Fig. 10). This indicates that themajor difference between the model predictions and the experi-ments is the time of the first stage of the ignition. Also, accordingto the model, the amount of fuel consumed at the first stage de-creases as the initial temperature increases and as the durationof the second stage increases. Yet, the good agreement betweenthe model and experimental concentrations of the species inFig. 8 indicates that the detailed chemistry of the ignition is other-wise well reproduced by the kinetic model.
Two factors make kinetic simulations of n-C7H16 autoignitionparticularly challenging at temperatures near 700 K, in particularthe complex transition taking place in the important reaction path-ways from fuel consumption by H atom abstraction reactions withRO2 and HO2 radicals below 700 K to abstraction reactions with OHand H radicals at higher temperatures. Also at approximately700 K, the amount of fuel consumed at the first stage starts to de-crease significantly with increasing temperature, as seen inFig. 11b. This complex temperature range will need further atten-tion to clarify the details of the reaction rates and pathways, andour results indicate that many of the kinetic processes are quitesensitive to this relatively narrow temperature range.
The difficulty of predicting n-C7H16 consumption at 700 K hasbeen seen frequently in kinetic modeling studies. In their experi-mental and kinetic modeling study of fuel consumption at 750 Kduring the compression stroke in a rapid compression machine,Cox et al. [14] calculated approximately 40% n-C7H16 fuel conver-sion in the first stage ignition while their experiments showed10–20% conversion. In RCM experiments at 667 K, Minetti et al.[13] measured 20–30% n-C7H16 consumption in the first stage igni-tion and calculated 80% fuel consumption, as noted earlier. In avery recent jet-stirred reactor study that is similar in some regardsto the present study, combining excellent experimental analysisover a wide range of reactor temperatures (500–1100 K) withdetailed chemical kinetic modeling, Herbinet et al. [9] providedvery good agreement between measured and computed specieslevels over the entire range of temperatures for nearly all of the47 different species measured. Herbinet et al. [9] note in particularfor n-C7H16 that their model ‘‘reproduces well the reactivity overthe whole range of temperatures.’’ However, a close examinationof the plotted results (Fig. 2 of [9]) shows that there is a differencebetween the computed and measured mole fractions of n-C7H16 ofa factor of two at a reactor temperature of 700 K (computed molefraction �2 � 10�3, experimental mole fraction �4 � 10�3),although the model reproduces the rather complex overall shape
predictions (P0 = 9 atm, v(n-C7H16) = 0.0134, v(O2) = 0.149, v(N2) = 0.2336, andthe right shows that the predicted amount of fuel consumed at the first stage of

D.M.A. Karwat et al. / Combustion and Flame 160 (2013) 2693–2706 2705
of the n-C7H16 mole fraction variation over the full temperaturerange. It is interesting to note that Herbinet et al. [9] predictedan excess consumption of n-C7H16 of about the same magnitudeas the present work at about 700 K, even after including a similarfamily of low temperature RO2 isomerization and other reactionrates as those in our upgraded kinetic reaction mechanism, leavinga good explanation for the over-prediction of fuel consumptionelusive.
The changes made to produce the new n-C7H16 kinetic mecha-nism involved improved rates of reactions forming RO2 and theirsubsequent isomerization and decomposition reactions; the subse-quent addition of O2 to the RO2 isomerization products QOOH; andthe isomerization of the O2QOOH species to produce OH and keto-hydroperoxide intermediates. The opportunity to upgrade the cur-rent mechanism with these new rate values based on theory ratherthan estimations offers some new interesting insights into theoverall kinetic reaction mechanism. Villano et al. [43] conductedimportant calculations to suggest an increase in the fraction ofRO2 radicals that react via 1–5 and 1–6 isomerizations, that is,via 6-atom (�CCCOOH) and 7-atom (�CCCCOOH) transition staterings, as opposed to 1–4 or 1–7 isomerizations. They noted that re-cent electronic structure calculations by Davis and Francisco [53],not possible previously when the original kinetic mechanisms forfuels such as n-C7H16 had been developed, showed that the incor-poration of the O atoms into transition state rings has a consider-able impact on the energetics for these isomerizations not seen inalkyl radical isomerization reactions. Specifically, the 1–5 and 1–6isomerization rates are faster by factors of nearly 30 for RO2 radi-cals than the previous rates based on analogous alkyl radical iso-merizations, making RO2 isomerizations the dominant reactionpathways for the low temperature kinetics. The 1–5 reaction leadsprimarily to QOOH products that favor O2 addition and eventuallychain branching, while the 1–6 reaction leads to QOOH cyclizationand chain propagation. The dominance of these two reaction path-ways simplifies the balance between branching and propagationthat determines the amount of NTC behavior observed in boththe experiments and the kinetic model. Such information couldbe valuable in developing reduced kinetic models for ignition ofall types of hydrocarbon fuels.
The reduced fraction of RO2 reaction via 1–4 isomerization inthe revised mechanism leads to less heptene production, furtherreducing the excess heptene production observed in the simula-tions prior to the mechanism upgrade and seen as the dashed linesin Fig. 8b and c. The enhanced fraction of the 1–6 isomerizationleads to the relatively high levels of large cyclic ethers in the inter-mediate species composition. In Section 3.2 above, we attributedmost of the missing carbon in the experimental carbon balanceto large C7 cyclic ethers, and the relatively high rates of the 1–6 iso-merizations lead preferentially to large amounts of C7 cyclic etherswith 4 C atoms and one O atom. From the detailed output from theupgraded kinetic model, we find that most (i.e., about 75%) of themissing carbon is found in the form of C7H14O2–5. This is the cyclicether produced via H atom abstraction at either the 2-site or the 3-site in n-C7H16 (both of them being secondary sites with weaklybonded H atoms), followed by addition of O2 to the radical siteto produce either C7H15O2-2 or C7H15O2-3 and then the 1–6 isom-erization reaction to produce the QOOH species C7H14OOH2-5 orC7H14OOH3-6, both of which then decompose to produce the samecyclic ether, C7H14O2-5. Each step of these sequences follows anenergetically favored path, from the initial H atom abstractionfrom the fuel at secondary C–H sites to the energetically favored1–6 isomerization reaction, and then the cyclization reaction toproduce the –C–C–C–C–O– ring. We note that the cyclization reac-tion of the 1–6 isomerization product has a rate at 700 K that is 20times faster than the similar cyclization reaction of the 1–5 isom-erization reaction product at the same temperature. Under the
present conditions, the cyclization reaction rate is faster than theaddition rate of molecular oxygen to either the QOOH species C7-
H14OOH2-5 or C7H14OOH3-6, so the dominant reaction pathwayfor products of 1–6 isomerization is cyclization. Cyclization alsoyields a single OH product, so cyclization is effectively a chainpropagation reaction pathway. In contrast, the product of 1–5isomerization is much more likely to react via addition of molecu-lar oxygen and subsequent chain branching, since its rate of cycli-zation is much smaller than the cyclization reactions of the 1–6isomerization products. For these reasons, the 1–5 RO2 isomeriza-tion reaction is generally regarded as a chain branching pathwaywhile the 1–6 RO2 isomerization reaction is generally regarded asa chain propagation reaction pathway. Since the 1–4 and 1–7RO2 isomerization reaction rates are significantly smaller thanthe 1–5 and 1–6 isomerization rates, the major factor influencingthe relative amounts of chain propagation and chain branching inthe present mechanism are the relative rates of the 1–5 and 1–6isomerization rates.
A second observation provided by the new, more theory-basedlow temperature kinetic rates is that the production of heptenesis significantly reduced relative to the previous mechanism becausethe new rates of the concerted elimination reactions, reaction class(C-12b), are slower than in the previous mechanism. Reaction class(C-12b) produces a heptene species and HO2 and is thus formally achain propagation step, but it actually limits the overall rate of igni-tion more strongly than other chain propagation reactions becauseHO2 is less reactive than most other radicals. In the Mehl et al.mechanism [28], the rate of reaction class (C-12b) had to be re-duced in order to retard the time of ignition, but that led to extre-mely high computed levels of heptenes. A firm establishment ofthe rates of these reactions greatly reduced uncertainties in manyof the other low temperature reactions and reaction pathways.
6. Conclusions
Speciation data presented in this work provide important newinsights into the intermediates formed during the ignition delayof n-heptane. Computational results using an established chemicalkinetic mechanism that has been widely used for many years[24,28] for the concentrations of several important intermediatespecies such as heptenes initially showed poor agreement withthe speciation data (obtained at an effective pressure of 9 atmand an effective temperature of 700 K) from the current work. A re-fined chemical kinetic reaction mechanism that includes low tem-perature rate expressions taken from newly published theoreticalstudies by Villano et al. [43,51] predicts ignition delay times andintermediate species concentrations that are in much better agree-ment with experimental data; however, the mechanism predictshigher consumption of n-heptane at the first stage of ignitionand predicts more heat release at the first stage of ignition than ob-served experimentally.
While previous n-heptane ignition studies have providedremarkable understanding of the effects of a broad range of tem-peratures and pressures on ignition delay times, few experimentalstudies have interrogated the reaction pathways proposed andrepresented in chemical kinetic mechanisms in the form of inter-mediate chemical species concentrations. The present studyprovides new measurements of intermediate species levels duringn-heptane ignition in the low-temperature regime that could notbe reproduced using currently available kinetic mechanisms. Thediscrepancies are largely due to poorly known rates of alkylperoxyradical reactions and reactions of other species produced via alkyl-peroxy isomerization reactions. New theory results of Villano et al.[43,51] reduced these uncertainties, and improvements in themechanism made possible by these new studies were key toimproving the agreement between computed and measured

2706 D.M.A. Karwat et al. / Combustion and Flame 160 (2013) 2693–2706
intermediate species concentrations. Previous rates for alkylperoxyand alkylperoxy isomerization reactions had been based primarilyon well-intentioned estimates, so the new rate information, basedon established theoretical principles, are a significant upgrade tocurrent kinetic models. While improvements have been made inthis study for kinetics of n-heptane oxidation, considerable uncer-tainties remain. New studies of these reactions, particularly includ-ing experiments that address oxidation reactions and rates in thelow temperature range are critical to making further mechanismrefinements in this very important temperature regime.
Acknowledgments
The authors would like to thank the US Department of EnergyBasic Energy Sciences, the US Department of Energy via the Univer-sity of Michigan Consortium on Efficient and Clean High-Pressure,Lean Burn (HPLB) Engines, the Michigan Memorial Phoenix EnergyInstitute and the Graham Environmental Sustainability Institutefor their financial support. The computational portion of this workwas supported by the US Department of Energy, Office of VehicleTechnologies and the Office of Basic Energy Sciences and was per-formed under the auspices of the US Department of Energy by Law-rence Livermore National Laboratory under Contract DE-AC52-07NA27344. The authors would like to thank Dr. Stephanie Villanoand Professor Anthony Dean of the Colorado School of Mines andDr. William Pitz and Dr. Marco Mehl from LLNL for their insightsinto low-temperature chemistry. We would also like to thank Dr.Henry Curran, Dr. Darren Healy, Dr. John Griffiths, Dr. GuillaumeVanhove, and Dr. Rodolfo Minetti for sharing their experimentaldata.
Appendix A. Supplementary material
Supplementary data associated with this article can be found, inthe online version, at http://dx.doi.org/10.1016/j.combustflame.2013.06.029.
References
[1] H.K. Ciezki, G. Adomeit, Combust. Flame 93 (1993) 421–433.[2] H.-P.S. Shen, J. Steinberg, J. Vanderover, M.A. Oehlschlaeger, Energy Fuels 23
(2009) 2482–2489.[3] J. Herzler, L. Jerig, P. Roth, Proc. Combust. Inst. 30 (2005) 1147–1153.[4] J.M. Smith, J.M. Simmie, H.J. Curran, Int. J. Chem. Kinet. 37 (2005) 728–736.[5] D.F. Davidson, M.A. Oehlschlaeger, R.K. Hanson, Proc. Combust. Inst. 31 (2007)
321–328.[6] B. Akih-Kumgeh, J.M. Bergthorson, Energy Fuels 24 (2010) 2439–2448.[7] D.F. Davidson, Z. Hong, G.L. Pilla, A. Farooq, R.D. Cook, R.K. Hanson, Combust.
Flame 157 (2010) 1899–1905.[8] P. Dagaut, M. Reuillon, M. Cathonnet, Combust. Flame 101 (1995) 132–140.[9] O. Herbinet, B. Husson, Z. Serinyel, M. Cord, V. Warth, R. Fournet, P.-A. Glaude,
B. Sirjean, F. Battin-Leclerc, Z. Wang, M. Xie, Z. Cheng, F. Qi, Combust. Flame159 (2012) 3455–3472.
[10] E.J. Silke, H.J. Curran, J.M. Simmie, Proc. Combust. Inst. 30 (2005) 2639–2647.[11] S. Tanaka, F. Ayala, J.C. Keck, J.B. Heywood, Combust. Flame 132 (2003) 219–
239.[12] J.F. Griffiths, P.A. Halford-Maw, C. Mohamed, Combust. Flame 111 (1997) 327–
337.[13] R. Minetti, M. Carlier, M. Ribaucour, E. Therssen, L.R. Sochet, Combust. Flame
102 (1995) 298–309.[14] A. Cox, J.F. Griffiths, C. Mohamed, H.J. Curran, W.J. Pitz, C.K. Westbrook, Proc.
Combust. Inst. 26 (1996) 2685–2692.[15] Å. Ingemarsson, J. Pedersen, J. Olsson, J. Phys. Chem. A 103 (1999) 8222–8230.[16] A.E. Bakali, J.L. Delfau, C. Vovelle, Combust. Sci. Technol. 140 (1998) 69–91.
[17] C. Doute, J.L. Delfau, R. Akrich, C. Vovelle, Combust. Sci. Technol. 124 (1997)249–276.
[18] A. D’Anna, A. Alfe, B. Apicella, A. Tregrossi, A. Ciajolo, Energy Fuels 21 (2007)2655–2662.
[19] C. Ji, E. Dames, Y.L. Wang, H. Wang, F.N. Egolfopoulos, Combust. Flame 157(2010) 277–287.
[20] T.J. Held, A.J. Marchese, F.L. Dryer, Combust. Sci. Technol. 123 (1997) 107–146.[21] J. Warnatz, Gas/Surface Interactions and Damaging Mechanisms in Knocking
Combustion, CEC Contract: JOUE-0028D-MB, 1993.[22] G.M. Côme, V. Warth, P.-A. Glaude, R. Fournet, G. Scacchi, F. Battin-Leclerc,
Proc. Combust. Inst. 26 (1996) 755–762.[23] E. Ranzi, P. Gaffuri, T. Faravelli, P. Dagaut, Combust. Flame 103 (1995) 91–106.[24] H.J. Curran, P. Gaffuri, W.J. Pitz, C.K. Westbrook, Combust. Flame 114 (1998)
149–177.[25] F. Buda, R. Rounaceur, V. Warth, P.A. Glaude, R. Fournier, F. Battin-Leclerc,
Combust. Flame 142 (2005) 170–186.[26] F. Battin-Leclerc, Prog. Energy Combust. Sci. 34 (2008) 440–498.[27] CRECK Modeling Complete Mechanism (Low and High Temperature), Version
1201. <http://creckmodeling.chem.polimi.it/kinetic.html>.[28] M. Mehl, W.J. Pitz, C.K. Westbrook, H.J. Curran, Proc. Combust. Inst. 33 (2011)
193–200.[29] D.M.A. Karwat, S.W. Wagnon, M.S. Wooldridge, C.K. Westbrook, J. Phys. Chem.
A 116 (2012) 12406–12421.[30] X. He, M.T. Donovan, B.T. Zigler, T.R. Palmer, S.M. Walton, M.S. Wooldridge, A.
Atreya, Combust. Flame 142 (2005) 266–275.[31] S.M. Walton, X. He, B.T. Zigler, M.S. Wooldridge, A. Atreya, Combust. Flame 150
(2007) 246–262.[32] S.M. Walton, X. He, B.T. Zigler, M.S. Wooldridge, Proc. Combust. Inst. 31 (2007)
3147–3154.[33] S.M. Walton, M.S. Wooldridge, C.K. Westbrook, Proc. Combust. Inst. 32 (2009)
255–262.[34] P.D. Teini, D.M.A. Karwat, A. Atreya, Combust. Flame 158 (2011) 2045–2055.[35] P.D. Teini, D.M.A. Karwat, A. Atreya, Combust. Flame 159 (2012) 1090–1099.[36] X. He, B.T. Zigler, S.M. Walton, M.S. Wooldridge, A. Atreya, Combust. Flame 145
(2006) 552–570.[37] X. He, S.M. Walton, B.T. Zigler, M.S. Wooldridge, A. Atreya, Int. J. Chem. Kinet.
39 (2007) 498–517.[38] S.M. Walton, D.M. Karwat, P.D. Teini, A. Gorny, M.S. Wooldridge, Fuel 90 (2011)
1796–1804.[39] D.M.A. Karwat, S.W. Wagnon, P.D. Teini, M.S. Wooldridge, J. Phys. Chem. A 115
(2011) 4909–4921.[40] M.T. Donovan, X. He, B.T. Zigler, T.R. Palmer, M.S. Wooldridge, A. Atreya,
Combust. Flame 137 (2004) 351–365.[41] B.J. McBride, S. Gordon, M.A. Reno, Thermodynamic and Transport Properties
of Individual Species, vol. NASA Techn., 1993[42] A.G. Gaydon, The Spectroscopy of Flames, Wiley, New York, 1957.[43] S.M. Villano, L.K. Huynh, H.-H. Carstensen, A.M. Dean, J. Phys. Chem. A 115
(2011) 13425–13442.[44] E. Ranzi, A. Frassoldati, S. Granata, R. Faravelli, Ind. Eng. Chem. Res. 44 (2005)
5170–5183.[45] C.K. Westbrook, H.J. Curran, W.J. Pitz, J.F. Griffiths, C. Mohamed, S.K. Wo, Proc.
Combust. Inst. 27 (1998) 371–378.[46] S.M. Sarathy, C.K. Westbrook, M. Mehl, W.J. Pitz, C. Togbe, P. Dagaut, H. Wang,
M.A. Oehlschlaeger, U. Niemann, K. Seshadri, P.S. Veloo, F.N. Egolfopoulos, T.Lu, Combust. Flame 158 (2011) 2338–2357.
[47] Reaction Design CHEMKIN Release 10101 (x64), 2010.[48] W.K. Metcalfe, S.M. Burke, C.J. Aul, E.L. Petersen, H.J. Curran, Proc. Euro.
Combust. Mtg., 2011.[49] R.T. Pollard, in: C.H. Bamford, C.F.H. Tipper (Eds.), Comprehensive Chemical
Kinetics: Gas Phase Combustion, vol. 17, Elsevier, New York, 1977, pp. 249–367 (Chapter 2).
[50] A. Fish, Angew. Chem., Int. Ed. 7 (1968) 45–60.[51] S.M. Villano, L.K. Huynh, H.-H. Carstensen, A.M. Dean, J. Phys. Chem. A 116
(2012) 5068–5089.[52] J. Zador, C.A. Taatjes, R.X. Fernandes, Prog. Energy Combust. Sci. 37 (2011)
371–421.[53] A.C. Davis, J.S. Francisco, J. Phys. Chem. A 115 (2011) 2966–2977.[54] R.R. Baldwin, M.W. Hisham, R.W. Walker, J. Chem. Soc., Faraday Trans. I (78)
(1982) 1615–1627.[55] K.J. Hughes, P.A. Halford-Maw, P.D. Lightfoot, T. Turanyi, M.J. Pilling, Proc.
Combust. Inst. 24 (1992) 645–652.[56] S.H. Robertson, P.W. Seakins, M.J. Pilling, in: M.J. Pilling (Ed.), Comprehensive
Chemical Kinetics: Low-Temperature Combustion and Autoignition, vol. 35,Elsevier, Amsterdam, 1997.
[57] C.K. Westbrook, W.J. Pitz, O. Herbinet, H.J. Curran, E.J. Silke, Combust. Flame156 (2009) 181–199.
[58] D.F. Davidson, D.R. Haylett, R.K. Hanson, Combust. Flame 155 (2008) 108–117.
Related Documents


![Synthesis of new 7-azabicyclo[2.2.1]heptane derivatives](https://static.cupdf.com/doc/110x72/628d64017e1f0679361739f7/synthesis-of-new-7-azabicyclo221heptane-derivatives.jpg)