Low-Dose Aspartame Consumption Differentially Affects Gut Microbiota-Host Metabolic Interactions in the Diet- Induced Obese Rat Marie S. A. Palmna ¨s 1,2 *, Theresa E. Cowan 3 , Marc R. Bomhof 3 , Juliet Su 2 , Raylene A. Reimer 1,3 , Hans J. Vogel 1,2 , Dustin S. Hittel 1,3 , Jane Shearer 1,3 1 Department of Biochemistry and Molecular Biology, University of Calgary, Calgary, Alberta, Canada, 2 Department of Biological Sciences, University of Calgary, Calgary, Alberta, Canada, 3 Faculty of Kinesiology, University of Calgary, Calgary, Alberta, Canada Abstract Aspartame consumption is implicated in the development of obesity and metabolic disease despite the intention of limiting caloric intake. The mechanisms responsible for this association remain unclear, but may involve circulating metabolites and the gut microbiota. Aims were to examine the impact of chronic low-dose aspartame consumption on anthropometric, metabolic and microbial parameters in a diet-induced obese model. Male Sprague-Dawley rats were randomized into a standard chow diet (CH, 12% kcal fat) or high fat (HF, 60% kcal fat) and further into ad libitum water control (W) or low-dose aspartame (A, 5–7 mg/kg/d in drinking water) treatments for 8 week (n = 10–12 animals/treatment). Animals on aspartame consumed fewer calories, gained less weight and had a more favorable body composition when challenged with HF compared to animals consuming water. Despite this, aspartame elevated fasting glucose levels and an insulin tolerance test showed aspartame to impair insulin-stimulated glucose disposal in both CH and HF, independently of body composition. Fecal analysis of gut bacterial composition showed aspartame to increase total bacteria, the abundance of Enterobacteriaceae and Clostridium leptum. An interaction between HF and aspartame was also observed for Roseburia ssp wherein HF-A was higher than HF-W (P,0.05). Within HF, aspartame attenuated the typical HF-induced increase in the Firmicutes:Bacteroidetes ratio. Serum metabolomics analysis revealed aspartame to be rapidly metabolized and to be associated with elevations in the short chain fatty acid propionate, a bacterial end product and highly gluconeogenic substrate, potentially explaining its negative affects on insulin tolerance. How aspartame influences gut microbial composition and the implications of these changes on the development of metabolic disease require further investigation. Citation: Palmna ¨s MSA, Cowan TE, Bomhof MR, Su J, Reimer RA, et al. (2014) Low-Dose Aspartame Consumption Differentially Affects Gut Microbiota-Host Metabolic Interactions in the Diet-Induced Obese Rat. PLoS ONE 9(10): e109841. doi:10.1371/journal.pone.0109841 Editor: Michael Mu ¨ ller, University of East Anglia, United Kingdom Received June 25, 2014; Accepted August 28, 2014; Published October 14, 2014 Copyright: ß 2014 Palmna ¨s et al. This is an open-access article distributed under the terms of the Creative Commons Attribution License, which permits unrestricted use, distribution, and reproduction in any medium, provided the original author and source are credited. Data Availability: The authors confirm that all data underlying the findings are fully available without restriction. All relevant data are within the paper and its Supporting Information files. Funding: Research was funded by a National Science and Engineering Council of Canada Discovery Grant. H. J. V. currently holds the Lance Armstrong Chair for Molecular Cancer Research. J. S. is an Alberta Innovates Health Solutions Scholar. The funders had no role in study design, data collection and analysis, decision to publish, or preparation of the manuscript. Competing Interests: The authors have declared that no competing interests exist. * Email: [email protected] Introduction Regular consumption of artificially sweetened soft drinks is associated with disorders of the metabolic syndrome, including abdominal obesity, insulin resistance and/or impaired glucose tolerance, dyslipidemia and high blood pressure [1–3]. In particular, daily diet soda consumption (primarily sweetened with N-a-L-aspartyl-L-phenylalanine methyl ester, aspartame, APM), is reported to increase the relative risk of type 2 diabetes and the metabolic syndrome by 67% and 36% respectively [3]. Given this data, and the presence of APM in over 6000 food products, there is a need to understand the potential role of APM sweetened products in the development and maintenance of metabolic disease [4]. Emerging evidence on the gut microbiome suggests that metabolic diseases, such as type 2 diabetes, are associated with an altered gut microbiota profile [5,6]. The gut microbiome plays an important role in metabolism and caloric extraction from dietary sources. It is highly complex and one of the most diverse ecosystems, with over 50 phyla identified [7,8]. Alterations in the proportions of the two phyla that make up ,90% of the human gut microbiome, Firmicutes and Bacteroidetes, have been linked to obesity, type 2 diabetes and systemic inflammation [8–10] with the majority of studies reporting increases in the abundance of Firmicutes and reductions in Bacteroidetes compared to lean individuals [5–7,11]. Compositional and functional changes in the microbiome are also manifested as alterations of metabolite concentrations in the blood. Microbial metabolites appearing in serum consist of metabolic intermediates, organic acids and bacterial fermentation end products including the short chain fatty acids (SCFA) [12–14]. Aims of the present study were to examine the interaction of chronic low-dose APM on anthropometric, metabolic, metabo- lomic and gut microbiota profiles. As observational data in humans cannot show causality, we examined an animal model PLOS ONE | www.plosone.org 1 October 2014 | Volume 9 | Issue 10 | e109841

Welcome message from author
This document is posted to help you gain knowledge. Please leave a comment to let me know what you think about it! Share it to your friends and learn new things together.
Transcript
Low-Dose Aspartame Consumption Differentially AffectsGut Microbiota-Host Metabolic Interactions in the Diet-Induced Obese RatMarie S. A. Palmnas1,2*, Theresa E. Cowan3, Marc R. Bomhof3, Juliet Su2, Raylene A. Reimer1,3,
Hans J. Vogel1,2, Dustin S. Hittel1,3, Jane Shearer1,3
1 Department of Biochemistry and Molecular Biology, University of Calgary, Calgary, Alberta, Canada, 2 Department of Biological Sciences, University of Calgary, Calgary,
Alberta, Canada, 3 Faculty of Kinesiology, University of Calgary, Calgary, Alberta, Canada
Abstract
Aspartame consumption is implicated in the development of obesity and metabolic disease despite the intention of limitingcaloric intake. The mechanisms responsible for this association remain unclear, but may involve circulating metabolites andthe gut microbiota. Aims were to examine the impact of chronic low-dose aspartame consumption on anthropometric,metabolic and microbial parameters in a diet-induced obese model. Male Sprague-Dawley rats were randomized into astandard chow diet (CH, 12% kcal fat) or high fat (HF, 60% kcal fat) and further into ad libitum water control (W) or low-doseaspartame (A, 5–7 mg/kg/d in drinking water) treatments for 8 week (n = 10–12 animals/treatment). Animals on aspartameconsumed fewer calories, gained less weight and had a more favorable body composition when challenged with HFcompared to animals consuming water. Despite this, aspartame elevated fasting glucose levels and an insulin tolerance testshowed aspartame to impair insulin-stimulated glucose disposal in both CH and HF, independently of body composition.Fecal analysis of gut bacterial composition showed aspartame to increase total bacteria, the abundance ofEnterobacteriaceae and Clostridium leptum. An interaction between HF and aspartame was also observed for Roseburiassp wherein HF-A was higher than HF-W (P,0.05). Within HF, aspartame attenuated the typical HF-induced increase in theFirmicutes:Bacteroidetes ratio. Serum metabolomics analysis revealed aspartame to be rapidly metabolized and to beassociated with elevations in the short chain fatty acid propionate, a bacterial end product and highly gluconeogenicsubstrate, potentially explaining its negative affects on insulin tolerance. How aspartame influences gut microbialcomposition and the implications of these changes on the development of metabolic disease require further investigation.
Citation: Palmnas MSA, Cowan TE, Bomhof MR, Su J, Reimer RA, et al. (2014) Low-Dose Aspartame Consumption Differentially Affects Gut Microbiota-HostMetabolic Interactions in the Diet-Induced Obese Rat. PLoS ONE 9(10): e109841. doi:10.1371/journal.pone.0109841
Editor: Michael Muller, University of East Anglia, United Kingdom
Received June 25, 2014; Accepted August 28, 2014; Published October 14, 2014
Copyright: � 2014 Palmnas et al. This is an open-access article distributed under the terms of the Creative Commons Attribution License, which permitsunrestricted use, distribution, and reproduction in any medium, provided the original author and source are credited.
Data Availability: The authors confirm that all data underlying the findings are fully available without restriction. All relevant data are within the paper and itsSupporting Information files.
Funding: Research was funded by a National Science and Engineering Council of Canada Discovery Grant. H. J. V. currently holds the Lance Armstrong Chair forMolecular Cancer Research. J. S. is an Alberta Innovates Health Solutions Scholar. The funders had no role in study design, data collection and analysis, decision topublish, or preparation of the manuscript.
Competing Interests: The authors have declared that no competing interests exist.
* Email: [email protected]
Introduction
Regular consumption of artificially sweetened soft drinks is
associated with disorders of the metabolic syndrome, including
abdominal obesity, insulin resistance and/or impaired glucose
tolerance, dyslipidemia and high blood pressure [1–3]. In
particular, daily diet soda consumption (primarily sweetened with
N-a-L-aspartyl-L-phenylalanine methyl ester, aspartame, APM), is
reported to increase the relative risk of type 2 diabetes and the
metabolic syndrome by 67% and 36% respectively [3]. Given this
data, and the presence of APM in over 6000 food products, there
is a need to understand the potential role of APM sweetened
products in the development and maintenance of metabolic
disease [4].
Emerging evidence on the gut microbiome suggests that
metabolic diseases, such as type 2 diabetes, are associated with
an altered gut microbiota profile [5,6]. The gut microbiome plays
an important role in metabolism and caloric extraction from
dietary sources. It is highly complex and one of the most diverse
ecosystems, with over 50 phyla identified [7,8]. Alterations in the
proportions of the two phyla that make up ,90% of the human
gut microbiome, Firmicutes and Bacteroidetes, have been linked
to obesity, type 2 diabetes and systemic inflammation [8–10] with
the majority of studies reporting increases in the abundance of
Firmicutes and reductions in Bacteroidetes compared to lean
individuals [5–7,11]. Compositional and functional changes in the
microbiome are also manifested as alterations of metabolite
concentrations in the blood. Microbial metabolites appearing in
serum consist of metabolic intermediates, organic acids and
bacterial fermentation end products including the short chain fatty
acids (SCFA) [12–14].
Aims of the present study were to examine the interaction of
chronic low-dose APM on anthropometric, metabolic, metabo-
lomic and gut microbiota profiles. As observational data in
humans cannot show causality, we examined an animal model
PLOS ONE | www.plosone.org 1 October 2014 | Volume 9 | Issue 10 | e109841
where the direct effects of APM on metabolism could be
established. Specifically, we investigated the impact of low-dose
APM (5–7 mg/kg/d, equivalent to consuming 2–3 cans of diet
soda per day for the average US male and female (,89 kg and
76 kg respectively)) [14], a dose well below the upper daily-
recommended intake of 40–50 mg/kg/d [4] in the diet-induced
obese, Sprague-Dawley rat. If APM alters the gut microbiota, and
in turn the serum metabolome, such changes would likely appear
in this well-characterized model and could provide insight into the
relationship between this artificial sweetener and the development
of metabolic disease.
Methods
Animal experimentsExperimental procedures were performed under the ethical
standards approved by the University of Calgary Animal Care and
Use Committee (AC11-0016) as well as guidelines established by
the Canadian Council on Animal Care. Male Sprague-Dawley
rats (n = 44, Charles River, Wilmington, MA) were housed
individually in a 12 h light/dark cycle. Animals were randomized
into two dietary groups; chow (CH 12% kcal fat) (Lab Diet 5001,
St. Louis, MO) or high fat (HF 60% kcal fat) (Open Source Diets,
Research Diet # D12492, New Brunswick) for two weeks and
then randomly assigned fluid treatment (i.e. water or APM). APM
was directly added to drinking water (60 mg/L, Merisant
Company, Chicago, IL). All animals, had access to food and fluid
ad libitum for an additional 8 week prior to sacrifice. This resulted
in four treatment groups (n = 10–12 per treatment); chow water
(CHW), high fat water (HFW), chow aspartame (CHA) and high
fat aspartame (HFA). Data from CHW and HFW were part of a
shared control group that has been previously published [15].
Weight gain and body compositionAnimals were weighed weekly for 10 weeks. Food and fluid
intake was measured during week 7 of the diet. Dual energy x-ray
absorptiometry with small animal software (Hologic QDR 4500,
Hologic, Inc., Bedford, MA) was used to determine lean mass and
fat mass, as well as bone mineral density, during week 10, prior to
sacrifice, as previously described [16]. On the day of sacrifice,
animals were anesthetized with isoflurane (2-chloro-2-(difluoro-
methoxy)-1,1,1-trifluoro-ethane)(Sigma Aldrich, Oakville, ON,
Canada). Following anesthesia, blood samples were rapidly
collected on anesthetized animals by cardiac puncture through
the chest wall. After blood collection, the liver was rapidly excised,
rinsed in saline to remove excess blood, freeze-clamped in liquid
nitrogen, and kept frozen at 280uC until further analysis. Blood
samples were aliquoted into two tubes for serum and plasma
collection. In the first tube, blood clotted (no additives) for 20 min
(4uC) and serum was isolated via centrifugation for metabolomics
analyses. The second aliquot was placed in a chilled tube
containing ethylenediaminetetraacetic acid (EDTA), diprotinin-A
(0.034 mg/ml blood; (MP Biomedicals, Irvine, CA)), Sigma
protease inhibitor (1 mg/ml blood; Sigma Aldrich, Oakville,
ON, Canada) and Roche Pefabloc (1 mg/ml of blood; Roche,
Mississauga, ON, Canada). This sample was used for plasma
measures including insulin, gastric inhibitory polypeptide (GIP)
and free fatty acids. Both serum and plasma samples were stored at
280uC until analysis.
Biochemical analysesPlasma free fatty acids were quantified using a HR Series
NEFA-HR kit (Wako Chuo-Ku, Osaka, Japan). Plasma insulin
and GIP were measured using a Milliplex Map Kit Rat Gut
Hormone Panel 96 well plate assay for Insulin and GIP (EMD
Millipore Corporation, Billerica, MA). Liver triglycerides were
measured using Triglyceride (GPO) (Liquid) Reagent Set (Pointe
Scientific Inc., Canton MI) as per manufacturers instructions.
Oral glucose and insulin tolerance testsDuring week 8, animals were fasted for 8 h overnight prior to
an oral glucose tolerance test (OGTT). Animals were weighed and
100 mL of blood was collected via tail clip (0.5 mm tip of tail) in
conscious rats. Fasting blood glucose concentrations were mea-
sured using a standard blood glucose monitor (BD BioSciences,
Franklin Lakes, NJ). Following the initial blood glucose measure-
ment, rats received an oral glucose load (2 mg/kg body weight)
and subsequent blood samples were taken at 15, 30, 60, 90 and
120 minutes and blood glucose concentration determined
immediately. Following a one-week washout period, animals were
again fasted and an insulin tolerance test (ITT) was administered.
This was done by injecting Humulin R insulin (Eli Lilly Canada,
Toronto ON) diluted 100X with saline into the intraperitoneal
cavity (0.75 U/kg). Blood samples were obtained and glucose
measured immediately at time points identical to the OGTT.
Serum metabolomics analysisMetabolomics analysis of serum samples was performed by
proton nuclear magnetic resonance spectroscopy (1H NMR) as
previously described with minor modifications [17,18]. Samples
were coded with sample ID and prepared, analyzed and profiled
in a randomized order. Briefly, 1H NMR spectra were acquired
using the standard pulse program (prnoesy1d) on a Bruker Avance
600 spectrometer (600.22 MHz, 297K 5 mm TXI Probe). Initial
processing was performed for the first sample in each batch using
TopSpin software. Each sample was then individually processed
using Chenomx NMR Suite 7.5 software (Chenomx Inc.,
Edmonton, Canada). Targeted profiling was performed using
the NMR Suite profiling module, applying the Chenomx library.
The Human Metabolome Database, accessible at http://www.
hmdb.ca, aided metabolite identification. Two-dimensional total
correlation spectroscopy and heteronuclear single quantum
coherence spectroscopy spectra were performed on the last sample
of the batch for metabolite validation.
DNA extraction and qRT-PCR analysisFresh fecal samples were collected at 10 weeks. Samples were
stored at 280uC until further analysis. DNA was extracted from
250 mg of fecal matter using the FastDNA Spin Kit for Feces (MP
Biomedicals, LLC, Solon, OH). DNA concentrations were
quantified using the Nanodrop 2000 (Thermo Fisher Scientific
Inc., Asheville, NC), diluted to 4 ng/ml, then stored at 220uCuntil analysis. Amplification and detection were conducted in 96
well plates with SYBR Green 26 qPCR Master Mix (BioRad).
Samples were analyzed in duplicate with a final volume of 25 ml
containing 0.3 mM primer and 20 ng template gDNA. Group
specific primers have been previously published [19]. The 16S
rRNA gene copies value was calculated according the following
webpage: http://cels.uri.edu/gsc/cndna.html using average ge-
nome sizes. Standard curves were normalized to the copy number
of the 16S rRNA gene obtained from the following: http://rrndb.
mmg.msu.edu/index.php.
Statistical analysisSigmaStat version 3.5 (SYSTAT, Chicago, IL) was used for
parametric statistical analyses of the biometric and the microbiota
data. Where appropriate, microbiota data is reported on a log
Aspartame Consumption Impact on Gut Microbiota and Serum Metabolomics
PLOS ONE | www.plosone.org 2 October 2014 | Volume 9 | Issue 10 | e109841
scale and shown as mean 6 SE. Differences between the four
dietary groups were determined by a two-way ANOVA, followed
by a Student-Newman-Keuls post-hoc test (p,0.05). A two-tiered
method was employed to analyze metabolomics data as previously
described [18,20]. Initial analysis consisted of multivariate
statistical analysis. Normalized 1H NMR data was imported into
SIMCA-P+ software (version 12.01, Umetrics AB, Umea,
Sweden), performing initial mean centering and unit variance
scaling. Unsupervised principle component analysis was conducted
to identify and visualize initial grouping of the data and potential
outliers (i.e. samples outside the 95% CI). Graphical representa-
tion of these results is shown in Figures S1, S2. Individual serum
metabolites were then analyzed by a two-way ANOVA corrected
for a false discovery rate of 20% according to Benjamini and
Hochberg [21].
Results
Animal characteristicsAnthropometric, metabolic as well as food and fluid consump-
tion data are shown in Table 1. HF animals were obese with an
increase in body fat compared to their CH fed counterparts (p,
0.05). No differences in bone mineral density were found between
groups (data not shown, p.0.05). Liver triglycerides were elevated
with HF (p,0.05) but not APM treatment. CHA and HFA
consumed 17 and 25% less energy (kcal), but more fluid compared
to their respective controls (p,0.05). Fasting blood glucose levels
were elevated in both APM groups (p,0.05). Likewise, plasma
insulin levels increased with HF (CHW vs. HFW), however, within
HF, APM consumption normalized plasma insulin levels to those
observed for CH (p,0.05). The combination of HF and APM also
resulted in increases in circulating plasma free fatty acid levels (p,
0.05). Analysis of the insulin-related gut hormone GIP showed no
differences between treatments (p.0.05).
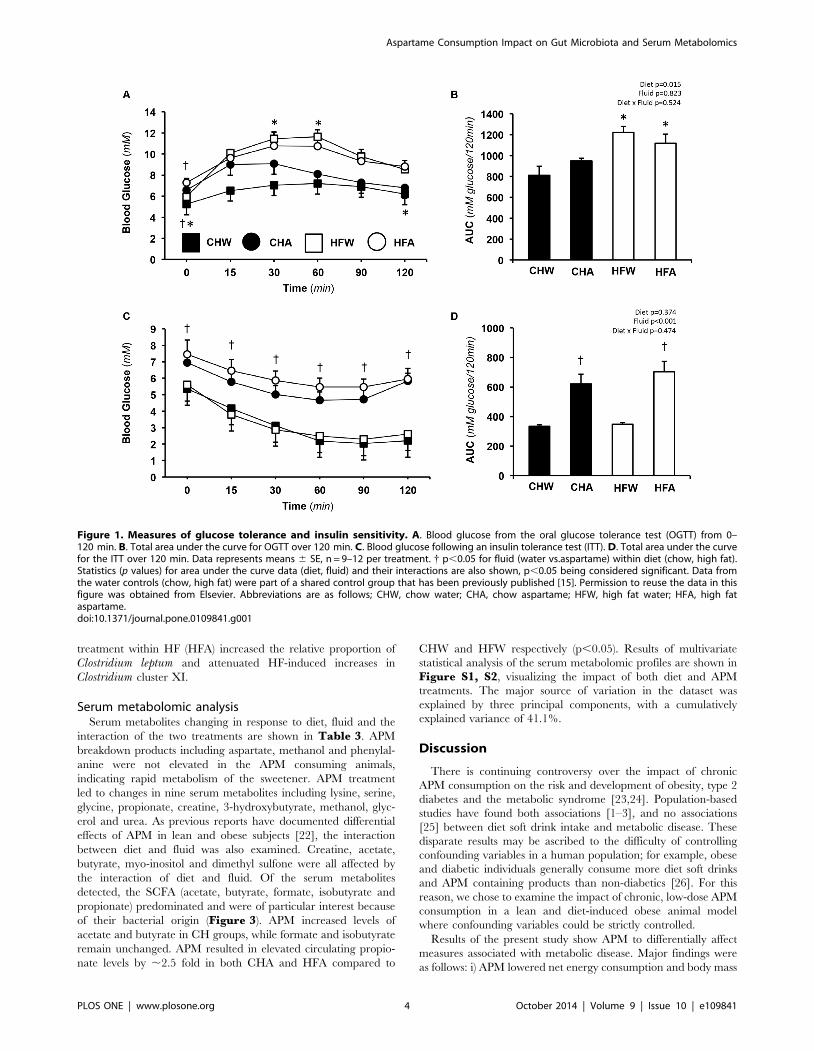
Oral glucose and insulin tolerance testsResults of the OGTT administered on week 8 of the diet are
shown in Figure 1A and 1B.
Fasting blood glucose was higher in APM versus control rats in
both CH and HF (p,0.05) (Table 1). There was a significant
main effect of diet for blood glucose AUC wherein HF was higher
than CH (p,0.05). No main effect of APM on blood glucose AUC
was observed (p.0.05).
Following a one-week wash-out period, the ITT was adminis-
tered on week 9. Results are shown in Figure 1C and 1D. For
the ITT, both APM groups started with elevated blood glucose
levels that persisted for the duration of the test (p,0.05).
Independently, fluid but not diet (p,0.05), affected glucose
disappearance during the ITT with CHA and HFA exhibiting
impaired insulin-stimulated glucose disposal compared to their
respective water controls (CHW and HFW) (p,0.05).
Gut microbiota analysisResults of gut microbiota analysis are shown in Table 2. As
expected, HF feeding alone (CHW vs. HFW) perturbed the gut
microbiota with increases in total bacteria, Firmicutes, and
Clostridium Cluster C XI (p,0.05). HF also decreased the
abundance of Bacteroides/Prevotella spp. (p,0.05). Within diets,
few differences between the CH treatment groups (CHW vs.
CHA) were observed with the exception of Clostridium leptum,
which was higher in the CHA group versus CHW (p,0.05). This
finding was consistent for HF as well where HFA had higher
Clostridium leptum compared to HFW (p,0.05). Diet affected
Bifidobacterium spp. with greater abundance in the HF versus CH
groups. Total bacteria, Enterobacteriaceae and Roseburia spp.
were all influenced by the interaction of diet and APM where the
HFA treatment resulted in the highest abundance of each bacterial
group.
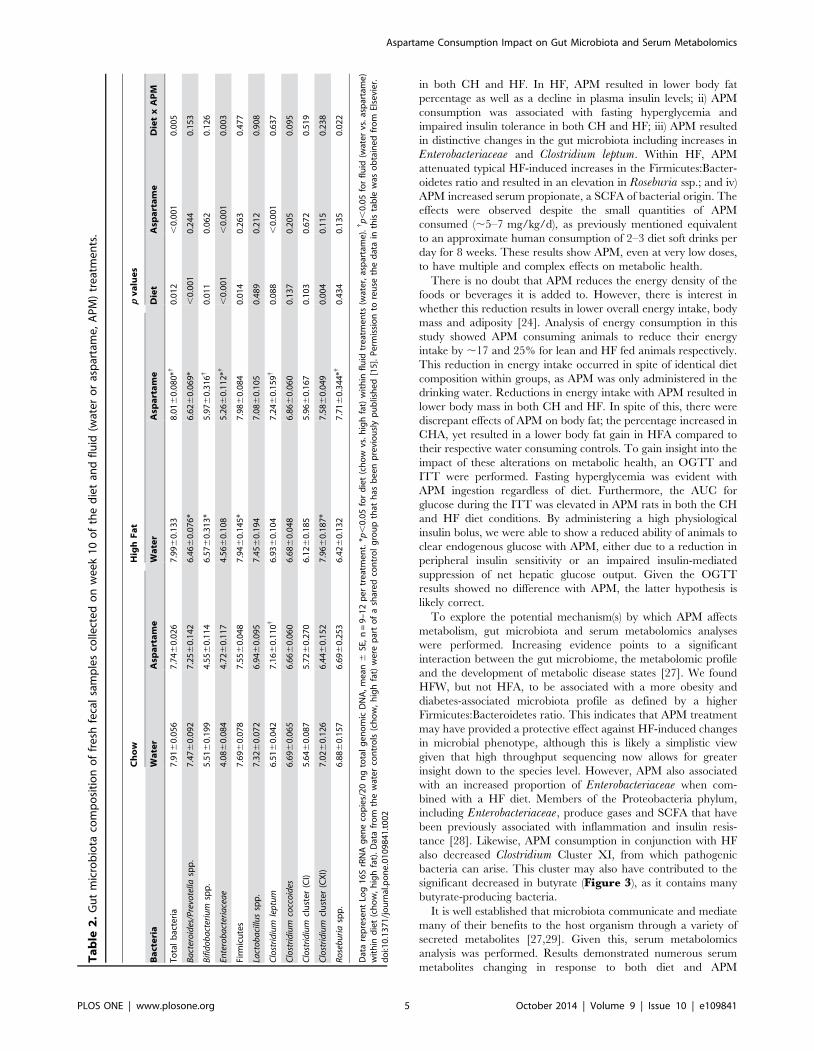
As an elevated Firmicutes to Bacteroidetes ratio has been
previously documented with obesity, this ratio was also examined.
When expressed on an absolute scale, HF resulted in a decrease in
Bacteroidetes and an increase in Firmicutes (Figure 2A). Within
HF, APM treatment (HFA) attenuated the increase in Firmicutes,
with little effect on Bacteroidetes. To further examine changes in
these phyla, the relative proportions of bacteria within the
Firmicutes phyla were plotted on a relative scale (100% total) as
shown in Figure 2B. Consistent with Table 2 results, APM
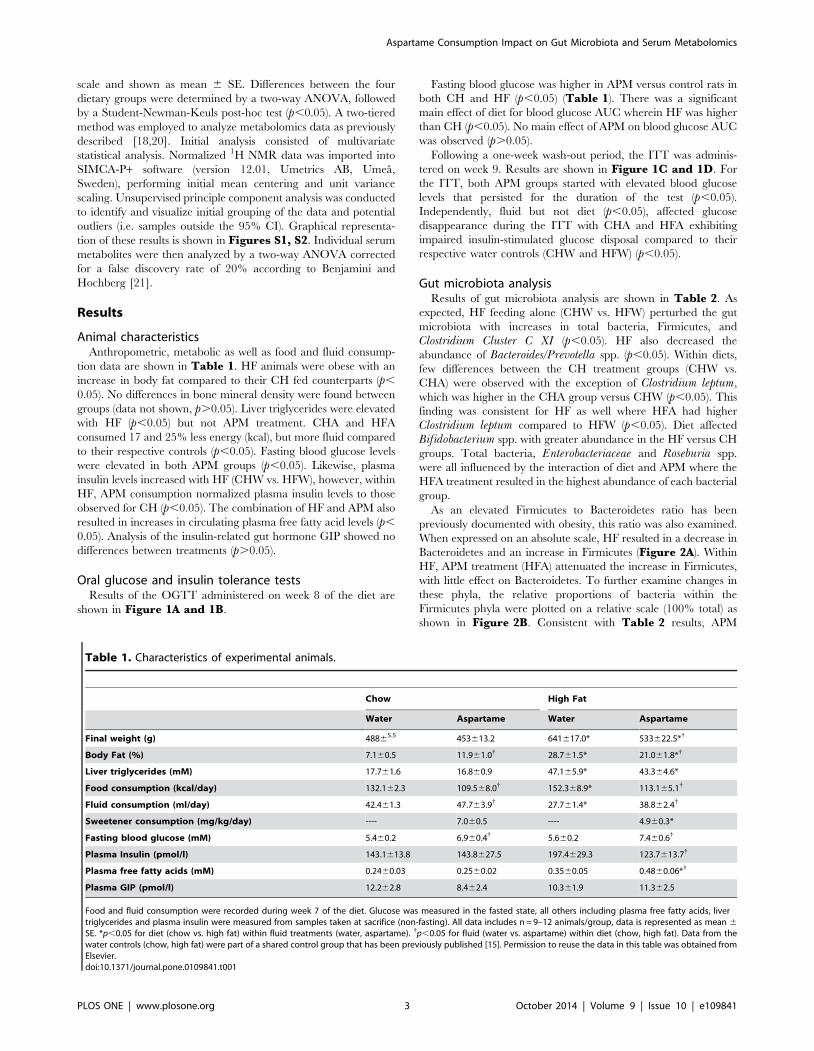
Table 1. Characteristics of experimental animals.
Chow High Fat
Water Aspartame Water Aspartame
Final weight (g) 48865.5 453613.2 641617.0* 533622.5*{
Body Fat (%) 7.160.5 11.961.0{ 28.761.5* 21.061.8*{
Liver triglycerides (mM) 17.761.6 16.860.9 47.165.9* 43.364.6*
Food consumption (kcal/day) 132.162.3 109.568.0{ 152.368.9* 113.165.1{
Fluid consumption (ml/day) 42.461.3 47.763.9{ 27.761.4* 38.862.4{
Sweetener consumption (mg/kg/day) ---- 7.060.5 ---- 4.960.3*
Fasting blood glucose (mM) 5.460.2 6.960.4{ 5.660.2 7.460.6{
Plasma Insulin (pmol/l) 143.1613.8 143.8627.5 197.4629.3 123.7613.7{
Plasma free fatty acids (mM) 0.2460.03 0.2560.02 0.3560.05 0.4860.06*{
Plasma GIP (pmol/l) 12.262.8 8.462.4 10.361.9 11.362.5
Food and fluid consumption were recorded during week 7 of the diet. Glucose was measured in the fasted state, all others including plasma free fatty acids, livertriglycerides and plasma insulin were measured from samples taken at sacrifice (non-fasting). All data includes n = 9–12 animals/group, data is represented as mean 6
SE. *p,0.05 for diet (chow vs. high fat) within fluid treatments (water, aspartame). {p,0.05 for fluid (water vs. aspartame) within diet (chow, high fat). Data from thewater controls (chow, high fat) were part of a shared control group that has been previously published [15]. Permission to reuse the data in this table was obtained fromElsevier.doi:10.1371/journal.pone.0109841.t001
Aspartame Consumption Impact on Gut Microbiota and Serum Metabolomics
PLOS ONE | www.plosone.org 3 October 2014 | Volume 9 | Issue 10 | e109841
treatment within HF (HFA) increased the relative proportion of
Clostridium leptum and attenuated HF-induced increases in
Clostridium cluster XI.
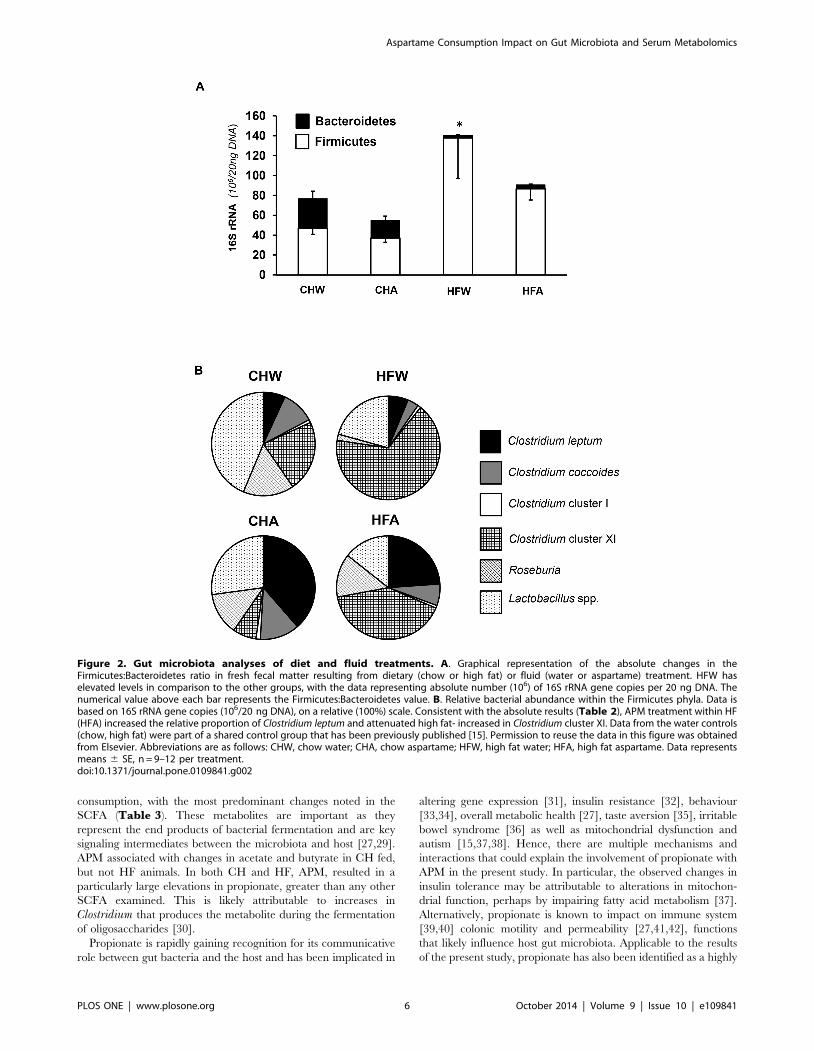
Serum metabolomic analysisSerum metabolites changing in response to diet, fluid and the
interaction of the two treatments are shown in Table 3. APM
breakdown products including aspartate, methanol and phenylal-
anine were not elevated in the APM consuming animals,
indicating rapid metabolism of the sweetener. APM treatment
led to changes in nine serum metabolites including lysine, serine,
glycine, propionate, creatine, 3-hydroxybutyrate, methanol, glyc-
erol and urea. As previous reports have documented differential
effects of APM in lean and obese subjects [22], the interaction
between diet and fluid was also examined. Creatine, acetate,
butyrate, myo-inositol and dimethyl sulfone were all affected by
the interaction of diet and fluid. Of the serum metabolites
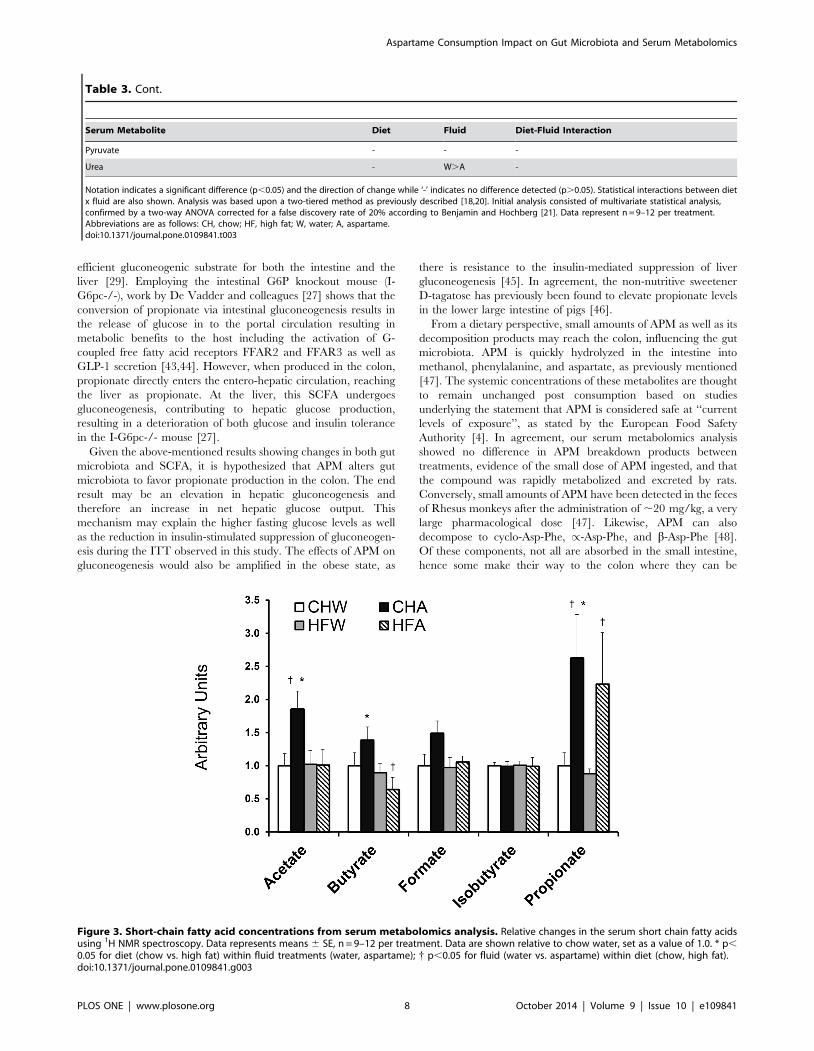
detected, the SCFA (acetate, butyrate, formate, isobutyrate and
propionate) predominated and were of particular interest because
of their bacterial origin (Figure 3). APM increased levels of
acetate and butyrate in CH groups, while formate and isobutyrate
remain unchanged. APM resulted in elevated circulating propio-
nate levels by ,2.5 fold in both CHA and HFA compared to
CHW and HFW respectively (p,0.05). Results of multivariate
statistical analysis of the serum metabolomic profiles are shown in
Figure S1, S2, visualizing the impact of both diet and APM
treatments. The major source of variation in the dataset was
explained by three principal components, with a cumulatively
explained variance of 41.1%.
Discussion
There is continuing controversy over the impact of chronic
APM consumption on the risk and development of obesity, type 2
diabetes and the metabolic syndrome [23,24]. Population-based
studies have found both associations [1–3], and no associations
[25] between diet soft drink intake and metabolic disease. These
disparate results may be ascribed to the difficulty of controlling
confounding variables in a human population; for example, obese
and diabetic individuals generally consume more diet soft drinks
and APM containing products than non-diabetics [26]. For this
reason, we chose to examine the impact of chronic, low-dose APM
consumption in a lean and diet-induced obese animal model
where confounding variables could be strictly controlled.
Results of the present study show APM to differentially affect
measures associated with metabolic disease. Major findings were
as follows: i) APM lowered net energy consumption and body mass
Figure 1. Measures of glucose tolerance and insulin sensitivity. A. Blood glucose from the oral glucose tolerance test (OGTT) from 0–120 min. B. Total area under the curve for OGTT over 120 min. C. Blood glucose following an insulin tolerance test (ITT). D. Total area under the curvefor the ITT over 120 min. Data represents means 6 SE, n = 9–12 per treatment. { p,0.05 for fluid (water vs.aspartame) within diet (chow, high fat).Statistics (p values) for area under the curve data (diet, fluid) and their interactions are also shown, p,0.05 being considered significant. Data fromthe water controls (chow, high fat) were part of a shared control group that has been previously published [15]. Permission to reuse the data in thisfigure was obtained from Elsevier. Abbreviations are as follows; CHW, chow water; CHA, chow aspartame; HFW, high fat water; HFA, high fataspartame.doi:10.1371/journal.pone.0109841.g001
Aspartame Consumption Impact on Gut Microbiota and Serum Metabolomics
PLOS ONE | www.plosone.org 4 October 2014 | Volume 9 | Issue 10 | e109841
in both CH and HF. In HF, APM resulted in lower body fat
percentage as well as a decline in plasma insulin levels; ii) APM
consumption was associated with fasting hyperglycemia and
impaired insulin tolerance in both CH and HF; iii) APM resulted
in distinctive changes in the gut microbiota including increases in
Enterobacteriaceae and Clostridium leptum. Within HF, APM
attenuated typical HF-induced increases in the Firmicutes:Bacter-
oidetes ratio and resulted in an elevation in Roseburia ssp.; and iv)
APM increased serum propionate, a SCFA of bacterial origin. The
effects were observed despite the small quantities of APM
consumed (,5–7 mg/kg/d), as previously mentioned equivalent
to an approximate human consumption of 2–3 diet soft drinks per
day for 8 weeks. These results show APM, even at very low doses,
to have multiple and complex effects on metabolic health.
There is no doubt that APM reduces the energy density of the
foods or beverages it is added to. However, there is interest in
whether this reduction results in lower overall energy intake, body
mass and adiposity [24]. Analysis of energy consumption in this
study showed APM consuming animals to reduce their energy
intake by ,17 and 25% for lean and HF fed animals respectively.
This reduction in energy intake occurred in spite of identical diet
composition within groups, as APM was only administered in the
drinking water. Reductions in energy intake with APM resulted in
lower body mass in both CH and HF. In spite of this, there were
discrepant effects of APM on body fat; the percentage increased in
CHA, yet resulted in a lower body fat gain in HFA compared to
their respective water consuming controls. To gain insight into the
impact of these alterations on metabolic health, an OGTT and
ITT were performed. Fasting hyperglycemia was evident with
APM ingestion regardless of diet. Furthermore, the AUC for
glucose during the ITT was elevated in APM rats in both the CH
and HF diet conditions. By administering a high physiological
insulin bolus, we were able to show a reduced ability of animals to
clear endogenous glucose with APM, either due to a reduction in
peripheral insulin sensitivity or an impaired insulin-mediated
suppression of net hepatic glucose output. Given the OGTT
results showed no difference with APM, the latter hypothesis is
likely correct.
To explore the potential mechanism(s) by which APM affects
metabolism, gut microbiota and serum metabolomics analyses
were performed. Increasing evidence points to a significant
interaction between the gut microbiome, the metabolomic profile
and the development of metabolic disease states [27]. We found
HFW, but not HFA, to be associated with a more obesity and
diabetes-associated microbiota profile as defined by a higher
Firmicutes:Bacteroidetes ratio. This indicates that APM treatment
may have provided a protective effect against HF-induced changes
in microbial phenotype, although this is likely a simplistic view
given that high throughput sequencing now allows for greater
insight down to the species level. However, APM also associated
with an increased proportion of Enterobacteriaceae when com-
bined with a HF diet. Members of the Proteobacteria phylum,
including Enterobacteriaceae, produce gases and SCFA that have
been previously associated with inflammation and insulin resis-
tance [28]. Likewise, APM consumption in conjunction with HF
also decreased Clostridium Cluster XI, from which pathogenic
bacteria can arise. This cluster may also have contributed to the
significant decreased in butyrate (Figure 3), as it contains many
butyrate-producing bacteria.
It is well established that microbiota communicate and mediate
many of their benefits to the host organism through a variety of
secreted metabolites [27,29]. Given this, serum metabolomics
analysis was performed. Results demonstrated numerous serum
metabolites changing in response to both diet and APM
Ta
ble
2.
Gu
tm
icro
bio
taco
mp
osi
tio
no
ffr
esh
feca
lsa
mp
les
colle
cte
do
nw
ee
k1
0o
fth
ed
iet
and
flu
id(w
ate
ro
ras
par
tam
e,
AP
M)
tre
atm
en
ts.
Ch
ow
Hig
hF
at
pv
alu
es
Ba
cte
ria
Wa
ter
Asp
art
am
eW
ate
rA
spa
rta
me
Die
tA
spa
rta
me
Die
tx
AP
M
To
tal
bac
teri
a7
.916
0.0
56
7.7
46
0.0
26
7.9
96
0.1
33
8.0
16
0.0
80
*{0
.01
2,
0.0
01
0.0
05
Ba
cter
oid
es/P
revo
tella
spp
.7
.476
0.0
92
7.2
56
0.1
42
6.4
66
0.0
76
*6
.626
0.0
69
*,
0.0
01
0.2
44
0.1
53
Bif
ido
ba
cter
ium
spp
.5
.516
0.1
99
4.5
56
0.1
14
6.5
76
0.3
13
*5
.976
0.3
16{
0.0
11
0.0
62
0.1
26
Ente
rob
act
eria
cea
e4
.086
0.0
84
4.7
26
0.1
17
4.5
66
0.1
08
5.2
66
0.1
12
*{,
0.0
01
,0
.00
10
.00
3
Firm
icu
tes
7.6
96
0.0
78
7.5
56
0.0
48
7.9
46
0.1
45
*7
.986
0.0
84
0.0
14
0.2
63
0.4
77
Lact
ob
aci
llus
spp
.7
.326
0.0
72
6.9
46
0.0
95
7.4
56
0.1
94
7.0
86
0.1
05
0.4
89
0.2
12
0.9
08
Clo
stri
diu
mle
ptu
m6
.516
0.0
42
7.1
66
0.1
10{
6.9
36
0.1
04
7.2
46
0.1
59{
0.0
88
,0
.00
10
.63
7
Clo
stri
diu
mco
cco
ides
6.6
96
0.0
65
6.6
66
0.0
60
6.6
86
0.0
48
6.8
66
0.0
60
0.1
37
0.2
05
0.0
95
Clo
stri
diu
mcl
ust
er
(CI)
5.6
46
0.0
87
5.7
26
0.2
70
6.1
26
0.1
85
5.9
66
0.1
67
0.1
03
0.6
72
0.5
19
Clo
stri
diu
mcl
ust
er
(CX
I)7
.026
0.1
26
6.4
46
0.1
52
7.9
66
0.1
87
*7
.586
0.0
49
0.0
04
0.1
15
0.2
38
Ro
seb
uri
asp
p.
6.8
86
0.1
57
6.6
96
0.2
53
6.4
26
0.1
32
7.7
16
0.3
44
*{0
.43
40
.13
50
.02
2
Dat
are
pre
sen
tLo
g1
6S
rRN
Ag
en
eco
pie
s/2
0n
gto
tal
ge
no
mic
DN
A,
me
an6
SE,
n=
9–
12
pe
rtr
eat
me
nt.
*p,
0.0
5fo
rd
iet
(ch
ow
vs.
hig
hfa
t)w
ith
infl
uid
tre
atm
en
ts(w
ate
r,as
par
tam
e).
{ p,
0.0
5fo
rfl
uid
(wat
er
vs.
asp
arta
me
)w
ith
ind
iet
(ch
ow
,h
igh
fat)
.D
ata
fro
mth
ew
ate
rco
ntr
ols
(ch
ow
,h
igh
fat)
we
rep
art
of
ash
are
dco
ntr
ol
gro
up
that
has
be
en
pre
vio
usl
yp
ub
lish
ed
[15
].P
erm
issi
on
tore
use
the
dat
ain
this
tab
lew
aso
bta
ine
dfr
om
Else
vie
r.d
oi:1
0.1
37
1/j
ou
rnal
.po
ne
.01
09
84
1.t
00
2
Aspartame Consumption Impact on Gut Microbiota and Serum Metabolomics
PLOS ONE | www.plosone.org 5 October 2014 | Volume 9 | Issue 10 | e109841
consumption, with the most predominant changes noted in the
SCFA (Table 3). These metabolites are important as they
represent the end products of bacterial fermentation and are key
signaling intermediates between the microbiota and host [27,29].
APM associated with changes in acetate and butyrate in CH fed,
but not HF animals. In both CH and HF, APM, resulted in a
particularly large elevations in propionate, greater than any other
SCFA examined. This is likely attributable to increases in
Clostridium that produces the metabolite during the fermentation
of oligosaccharides [30].
Propionate is rapidly gaining recognition for its communicative
role between gut bacteria and the host and has been implicated in
altering gene expression [31], insulin resistance [32], behaviour
[33,34], overall metabolic health [27], taste aversion [35], irritable
bowel syndrome [36] as well as mitochondrial dysfunction and
autism [15,37,38]. Hence, there are multiple mechanisms and
interactions that could explain the involvement of propionate with
APM in the present study. In particular, the observed changes in
insulin tolerance may be attributable to alterations in mitochon-
drial function, perhaps by impairing fatty acid metabolism [37].
Alternatively, propionate is known to impact on immune system
[39,40] colonic motility and permeability [27,41,42], functions
that likely influence host gut microbiota. Applicable to the results
of the present study, propionate has also been identified as a highly
Figure 2. Gut microbiota analyses of diet and fluid treatments. A. Graphical representation of the absolute changes in theFirmicutes:Bacteroidetes ratio in fresh fecal matter resulting from dietary (chow or high fat) or fluid (water or aspartame) treatment. HFW haselevated levels in comparison to the other groups, with the data representing absolute number (106) of 16S rRNA gene copies per 20 ng DNA. Thenumerical value above each bar represents the Firmicutes:Bacteroidetes value. B. Relative bacterial abundance within the Firmicutes phyla. Data isbased on 16S rRNA gene copies (106/20 ng DNA), on a relative (100%) scale. Consistent with the absolute results (Table 2), APM treatment within HF(HFA) increased the relative proportion of Clostridium leptum and attenuated high fat- increased in Clostridium cluster XI. Data from the water controls(chow, high fat) were part of a shared control group that has been previously published [15]. Permission to reuse the data in this figure was obtainedfrom Elsevier. Abbreviations are as follows: CHW, chow water; CHA, chow aspartame; HFW, high fat water; HFA, high fat aspartame. Data representsmeans 6 SE, n = 9–12 per treatment.doi:10.1371/journal.pone.0109841.g002
Aspartame Consumption Impact on Gut Microbiota and Serum Metabolomics
PLOS ONE | www.plosone.org 6 October 2014 | Volume 9 | Issue 10 | e109841
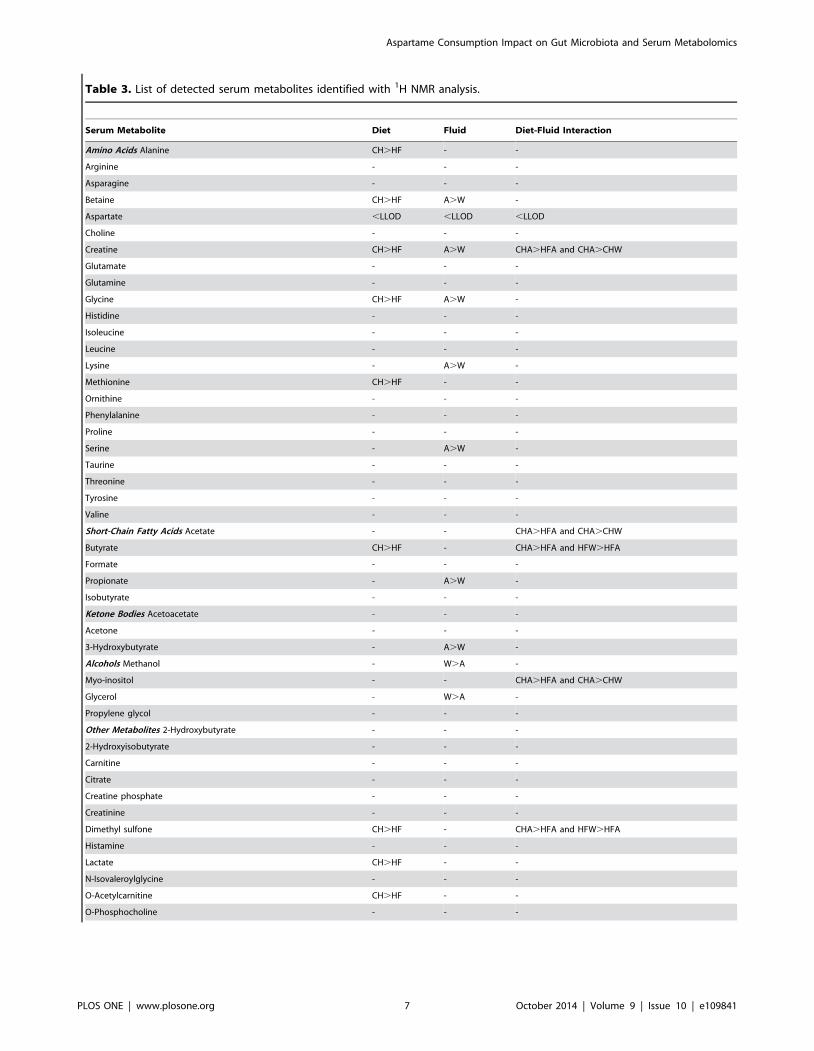
Table 3. List of detected serum metabolites identified with 1H NMR analysis.
Serum Metabolite Diet Fluid Diet-Fluid Interaction
Amino Acids Alanine CH.HF - -
Arginine - - -
Asparagine - - -
Betaine CH.HF A.W -
Aspartate ,LLOD ,LLOD ,LLOD
Choline - - -
Creatine CH.HF A.W CHA.HFA and CHA.CHW
Glutamate - - -
Glutamine - - -
Glycine CH.HF A.W -
Histidine - - -
Isoleucine - - -
Leucine - - -
Lysine - A.W -
Methionine CH.HF - -
Ornithine - - -
Phenylalanine - - -
Proline - - -
Serine - A.W -
Taurine - - -
Threonine - - -
Tyrosine - - -
Valine - - -
Short-Chain Fatty Acids Acetate - - CHA.HFA and CHA.CHW
Butyrate CH.HF - CHA.HFA and HFW.HFA
Formate - - -
Propionate - A.W -
Isobutyrate - - -
Ketone Bodies Acetoacetate - - -
Acetone - - -
3-Hydroxybutyrate - A.W -
Alcohols Methanol - W.A -
Myo-inositol - - CHA.HFA and CHA.CHW
Glycerol - W.A -
Propylene glycol - - -
Other Metabolites 2-Hydroxybutyrate - - -
2-Hydroxyisobutyrate - - -
Carnitine - - -
Citrate - - -
Creatine phosphate - - -
Creatinine - - -
Dimethyl sulfone CH.HF - CHA.HFA and HFW.HFA
Histamine - - -
Lactate CH.HF - -
N-Isovaleroylglycine - - -
O-Acetylcarnitine CH.HF - -
O-Phosphocholine - - -
Aspartame Consumption Impact on Gut Microbiota and Serum Metabolomics
PLOS ONE | www.plosone.org 7 October 2014 | Volume 9 | Issue 10 | e109841
efficient gluconeogenic substrate for both the intestine and the
liver [29]. Employing the intestinal G6P knockout mouse (I-
G6pc-/-), work by De Vadder and colleagues [27] shows that the
conversion of propionate via intestinal gluconeogenesis results in
the release of glucose in to the portal circulation resulting in
metabolic benefits to the host including the activation of G-
coupled free fatty acid receptors FFAR2 and FFAR3 as well as
GLP-1 secretion [43,44]. However, when produced in the colon,
propionate directly enters the entero-hepatic circulation, reaching
the liver as propionate. At the liver, this SCFA undergoes
gluconeogenesis, contributing to hepatic glucose production,
resulting in a deterioration of both glucose and insulin tolerance
in the I-G6pc-/- mouse [27].
Given the above-mentioned results showing changes in both gut
microbiota and SCFA, it is hypothesized that APM alters gut
microbiota to favor propionate production in the colon. The end
result may be an elevation in hepatic gluconeogenesis and
therefore an increase in net hepatic glucose output. This
mechanism may explain the higher fasting glucose levels as well
as the reduction in insulin-stimulated suppression of gluconeogen-
esis during the ITT observed in this study. The effects of APM on
gluconeogenesis would also be amplified in the obese state, as
there is resistance to the insulin-mediated suppression of liver
gluconeogenesis [45]. In agreement, the non-nutritive sweetener
D-tagatose has previously been found to elevate propionate levels
in the lower large intestine of pigs [46].
From a dietary perspective, small amounts of APM as well as its
decomposition products may reach the colon, influencing the gut
microbiota. APM is quickly hydrolyzed in the intestine into
methanol, phenylalanine, and aspartate, as previously mentioned
[47]. The systemic concentrations of these metabolites are thought
to remain unchanged post consumption based on studies
underlying the statement that APM is considered safe at ‘‘current
levels of exposure’’, as stated by the European Food Safety
Authority [4]. In agreement, our serum metabolomics analysis
showed no difference in APM breakdown products between
treatments, evidence of the small dose of APM ingested, and that
the compound was rapidly metabolized and excreted by rats.
Conversely, small amounts of APM have been detected in the feces
of Rhesus monkeys after the administration of ,20 mg/kg, a very
large pharmacological dose [47]. Likewise, APM can also
decompose to cyclo-Asp-Phe, /-Asp-Phe, and b-Asp-Phe [48].
Of these components, not all are absorbed in the small intestine,
hence some make their way to the colon where they can be
Figure 3. Short-chain fatty acid concentrations from serum metabolomics analysis. Relative changes in the serum short chain fatty acidsusing 1H NMR spectroscopy. Data represents means 6 SE, n = 9–12 per treatment. Data are shown relative to chow water, set as a value of 1.0. * p,0.05 for diet (chow vs. high fat) within fluid treatments (water, aspartame); { p,0.05 for fluid (water vs. aspartame) within diet (chow, high fat).doi:10.1371/journal.pone.0109841.g003
Table 3. Cont.
Serum Metabolite Diet Fluid Diet-Fluid Interaction
Pyruvate - - -
Urea - W.A -
Notation indicates a significant difference (p,0.05) and the direction of change while ‘-’ indicates no difference detected (p.0.05). Statistical interactions between dietx fluid are also shown. Analysis was based upon a two-tiered method as previously described [18,20]. Initial analysis consisted of multivariate statistical analysis,confirmed by a two-way ANOVA corrected for a false discovery rate of 20% according to Benjamin and Hochberg [21]. Data represent n = 9–12 per treatment.Abbreviations are as follows: CH, chow; HF, high fat; W, water; A, aspartame.doi:10.1371/journal.pone.0109841.t003
Aspartame Consumption Impact on Gut Microbiota and Serum Metabolomics
PLOS ONE | www.plosone.org 8 October 2014 | Volume 9 | Issue 10 | e109841
fermented by the gut microbiota [48]. The presence of such
compounds could potentially explain the alterations in the gut
microbiota seen in the APM animals. Of note, none of these di-
peptides were detectable by the metabolomics method (1H NMR)
employed in this study.
In summary, results of this study show APM to mitigate many of
the negative effects associated with HF feeding including lower
body mass, adiposity, caloric consumption and fasting insulin
levels. In spite of this, APM resulted in hyperglycemia and an
impaired ability to respond to insulin (ITT), which could be due to
enhanced gluconeogenesis fueled by production of the SCFA
propionate by the gut microbiota. This mechanism warrants
future investigation and may explain the increased risk of
metabolic disease states with regular APM consumption observed
in population-based studies.
Supporting Information
Figure S1 Principal component analysis score scatter-plot of the serum metabolome showing all four treat-ment groups. The unsupervised multivariate statistical model
showing how samples within each diet and fluid group cluster
together based on their respective metabolic profiles. Each dot
represents one individual rat based on serum metabolic profile.
The axis represents the principal components (PC) with the
explain variation in percentage indicated for each PC. The ellipse,
representing the 95% confidence interval, is shown to facilitate
visualization of outliers. Abbreviations are as follows: CHW, chow
water; CHA, chow aspartame; HFW, high fat water; HFA, high
fat aspartame.
(TIF)
Figure S2 Principal component analysis score scatter-plot of the serum metabolome showing individualcomparisons. The four unsupervised multivariate statistical
models based on Figure S1 showing comparisons associated with
A–B. diet (chow vs. high fat) and C–D. fluid (water vs. aspartame)
treatment. Each dot represents one individual rat based on the
serum metabolic profile. The axis represents the principal
components (PC) with the explain variation in percentage
indicated for each PC. The ellipse, representing the 95%
confidence interval, is shown to facilitate visualization of outliers.
Abbreviations are as follows: CHW, chow water; CHA, chow
aspartame; HFW, high fat water; HFA, high fat aspartame.
(TIF)
Acknowledgments
The authors gratefully acknowledge the technical assistance of Virginia L.
Johnsen, Matthias S. Klein, Jaeun Yang and Dawn Martin of the Animal
Health Unit.
Author Contributions
Conceived and designed the experiments: DH J. Su J. Shearer. Performed
the experiments: TEC J. Shearer J. Su MSAP. Analyzed the data: RAR
HJV MRB TEC MSAP. Contributed reagents/materials/analysis tools: J.
Shearer HJV. Wrote the paper: TEC MSAP J. Shearer.
References
1. Dhingra R, Sullivan L, Jacques PF, Wang TJ, Fox CS, et al. (2007) Soft drink
consumption and risk of developing cardiometabolic risk factors and the
metabolic syndrome in middle-aged adults in the community. Circulation 116:
480–488.
2. Lutsey PL, Steffen LM, Stevens J (2008) Dietary intake and the development of
the metabolic syndrome: the Atherosclerosis Risk in Communities study.
Circulation 117: 754–761.
3. Nettleton JA, Lutsey PL, Wang Y, Lima JA, Michos ED, et al. (2009) Diet soda
intake and risk of incident metabolic syndrome and type 2 diabetes in the Multi-
Ethnic Study of Atherosclerosis (MESA). Diabetes Care 32: 688–694.
4. Magnuson BA, Burdock GA, Doull J, Kroes RM, Marsh GM, et al. (2007)
Aspartame: a safety evaluation based on current use levels, regulations, and
toxicological and epidemiological studies. Crit Rev Toxicol 37: 629–727.
5. Ley RE, Backhed F, Turnbaugh P, Lozupone CA, Knight RD, et al. (2005)
Obesity alters gut microbial ecology. Proc Natl Acad Sci U S A 102: 11070–
11075.
6. Ley RE, Turnbaugh PJ, Klein S, Gordon JI (2006) Microbial ecology: human
gut microbes associated with obesity. Nature 444: 1022–1023.
7. Backhed F, Ding H, Wang T, Hooper LV, Koh GY, et al. (2004) The gut
microbiota as an environmental factor that regulates fat storage. Proc Natl Acad
Sci U S A 101: 15718–15723.
8. Lozupone CA, Stombaugh JI, Gordon JI, Jansson JK, Knight R (2012)
Diversity, stability and resilience of the human gut microbiota. Nature 489: 220–
230.
9. Remely M, Aumueller E, Jahn D, Hippe B, Brath H, et al. (2014) Microbiota
and epigenetic regulation of inflammatory mediators in type 2 diabetes and
obesity. Benef Microbes 5: 33–43.
10. Verdam FJ, Fuentes S, de Jonge C, Zoetendal EG, Erbil R, et al. (2013) Human
intestinal microbiota composition is associated with local and systemic
inflammation in obesity. Obesity (Silver Spring) 21: E607–615.
11. Semova I, Carten JD, Stombaugh J, Mackey LC, Knight R, et al. (2012)
Microbiota regulate intestinal absorption and metabolism of fatty acids in the
zebrafish. Cell Host Microbe 12: 277–288.
12. Zhao Y, Wu J, Li JV, Zhou NY, Tang H, et al. (2013) Gut microbiota
composition modifies fecal metabolic profiles in mice. J Proteome Res 12: 2987–
2999.
13. Le Chatelier E, Nielsen T, Qin J, Prifti E, Hildebrand F, et al. (2013) Richness of
human gut microbiome correlates with metabolic markers. Nature 500: 541–
546.
14. CDC National Center for Health Statistics (02 Nov 2012) Body Measurements.
Available: http://www.cdc.gov/nchs/fastats/body-measurements.htm. Ac-
cessed 2014 August 13.
15. Cowan TE, Palmnas MS, Yang J, Bomhof MR, Ardell KL, et al. (2014) Chronic
coffee consumption in the diet-induced obese rat: impact on gut microbiota and
serum metabolomics. J Nutr Biochem 25: 489–495.
16. Reimer RA, Maurer AD, Eller LK, Hallam MC, Shaykhutdinov R, et al. (2012)
Satiety hormone and metabolomic response to an intermittent high energy diet
differs in rats consuming long-term diets high in protein or prebiotic fiber.
J Proteome Res 11: 4065–4074.
17. Duggan GE, Hittel DS, Hughey CC, Weljie A, Vogel HJ, et al. (2011)
Differentiating short- and long-term effects of diet in the obese mouse using (1)
H-nuclear magnetic resonance metabolomics. Diabetes Obes Metab 13: 859–
862.
18. Duggan GE, Hittel DS, Sensen CW, Weljie AM, Vogel HJ, et al. (2011)
Metabolomic response to exercise training in lean and diet-induced obese mice.
J Appl Physiol (1985) 110: 1311–1318.
19. Bomhof MR, Saha DC, Reid DT, Paul HA, RA R (2014) Combined effects of
oligofructose and Bifidobacterium animalis on gut microbiota and glycemia in
obese rats. Obesity (Silver Spring) 22: 763–771.
20. Li Z, Li Q, Geng L, Chen X, Bi K (2013) Use of the local false discovery rate for
identification of metabolic biomarkers in rat urine following Genkwa Flos-
induced hepatotoxicity. PLoS ONE 8: e67451.
21. Hochberg Y, Benjamini Y (1990) More powerful procedures for multiple
significance testing. Stat Med 9: 811–818.
22. Bleich SN, Wolfson JA, Vine S, YC W (2014) Diet-beverage consumption and
caloric intake among US adults, overall and by body weight. Am J Public
Health 104: 72–78.
23. Johnston CA, Foreyt JP (2014) Robust scientific evidence demonstrates benefits
of artificial sweeteners. Trends Endocrinol Metab 25: 1.
24. Swithers SE (2013) Artificial sweeteners produce the counterintuitive effect of
inducing metabolic derangements. Trends Endocrinol Metab 24: 431–441.
25. de Koning L, Malik VS, Rimm EB, Willett WC, Hu FB (2011) Sugar-sweetened
and artificially sweetened beverage consumption and risk of type 2 diabetes in
men. Am J Clin Nutr 93: 1321–1327.
26. Mackenzie T, Brooks B, O’Connor G (2006) Beverage intake, diabetes, and
glucose control of adults in America. Ann Epidemiol 16: 688–691.
27. Tremaroli V, Backhed F (2012) Functional interactions between the gut
microbiota and host metabolism. Nature 489: 242–249.
28. Koren O, Goodrich JK, Cullender TC, Spor A, Laitinen K, et al. (2012) Host
remodeling of the gut microbiome and metabolic changes during pregnancy.
Cell 150: 470–480.
29. De Vadder F, Kovatcheva-Datchary P, Goncalves D, Vinera J, Zitoun C, et al.
(2014) Microbiota-Generated Metabolites Promote Metabolic Benefits via Gut-
Brain Neural Circuits. Cell 156: 84–96.
Aspartame Consumption Impact on Gut Microbiota and Serum Metabolomics
PLOS ONE | www.plosone.org 9 October 2014 | Volume 9 | Issue 10 | e109841
30. Puertollano E, Kolida S, Yaqoob P (2014) Biological significance of short-chain
fatty acid metabolism by the intestinal microbiome. Curr Opin Clin Nutr Metab
Care 17: 139–144.
31. Larsson E, Tremaroli V, Lee YS, Koren O, Nookaew I, et al. (2012) Analysis of
gut microbial regulation of host gene expression along the length of the gut and
regulation of gut microbial ecology through MyD88. Gut 61: 1124–1131.
32. Kimura I, Ozawa K, Inoue D, Imamura T, Kimura K, et al. (2013) The gut
microbiota suppresses insulin-mediated fat accumulation via the short-chain
fatty acid receptor GPR43. Nat Commun 4: 1829.
33. MacFabe DF, Cain NE, Boon F, Ossenkopp KP, Cain DP (2011) Effects of the
enteric bacterial metabolic product propionic acid on object-directed behavior,
social behavior, cognition, and neuroinflammation in adolescent rats: Relevance
to autism spectrum disorder. Behav Brain Res 217: 47–54.
34. Foley KA, Ossenkopp KP, Kavaliers M, Macfabe DF (2014) Pre- and neonatal
exposure to lipopolysaccharide or the enteric metabolite, propionic acid, alters
development and behavior in adolescent rats in a sexually dimorphic manner.
PLoS One 9: e87072.
35. Ossenkopp KP, Foley KA, Gibson J, Fudge MA, Kavaliers M, et al. (2012)
Systemic treatment with the enteric bacterial fermentation product, propionic
acid, produces both conditioned taste avoidance and conditioned place
avoidance in rats. Behav Brain Res 227: 134–141.
36. Lee KJ, Tack J (2010) Altered intestinal microbiota in irritable bowel syndrome.
Neurogastroenterol Motil 22: 493–498.
37. Frye RE, Melnyk S, Macfabe DF (2013) Unique acyl-carnitine profiles are
potential biomarkers for acquired mitochondrial disease in autism spectrum
disorder. Transl Psychiatry 3: e220.
38. Macfabe D (2013) Autism: Metabolism, Mitochondria, and the Microbiome.
Glob Adv Health Med 2: 52–66.
39. Ramsland PA, Movafagh BF, Reichlin M, Edmundson AB (1999) Interference
of rheumatoid factor activity by aspartame, a dipeptide methyl ester. J MolRecognit 12: 249–257.
40. Rahiman F, Pool EJ (2014) The in vitro effects of artificial and natural
sweeteners on the immune system using whole blood culture assays.J Immunoassay Immunochem 35: 26–36.
41. Erces D, Varga G, Fazekas B, Kovacs T, Tokes T, et al. (2012) N-methyl-D-aspartate receptor antagonist therapy suppresses colon motility and inflamma-
tory activation six days after the onset of experimental colitis in rats.
Eur J Pharmacol 691: 225–234.42. Pan-Hou H, Suda Y, Ohe Y, Sumi M, Yoshioka M (1990) Effect of aspartame
on N-methyl-D-aspartate-sensitive L-[3H]glutamate binding sites in rat brainsynaptic membranes. Brain Res 520: 351–353.
43. Tolhurst G, Heffron H, Lam YS, Parker HE, Habib AM, et al. (2012) Short-chain fatty acids stimulate glucagon-like peptide-1 secretion via the G-protein-
coupled receptor FFAR2. Diabetes 61: 364–371.
44. Samuel BS, Shaito A, Motoike T, Rey FE, Backhed F, et al. (2008) Effects of thegut microbiota on host adiposity are modulated by the short-chain fatty-acid
binding G protein-coupled receptor, Gpr41. Proc Natl Acad Sci U S A 105:16767–16772.
45. Gastaldelli A, Toschi E, Pettiti M, Frascerra S, Quinones-Galvan A, et al. (2001)
Effect of physiological hyperinsulinemia on gluconeogenesis in nondiabeticsubjects and in type 2 diabetic patients. Diabetes 50: 1807–1812.
46. Laerke HN, Jensen BB (1999) D-tagatose has low small intestinal digestibility buthigh large intestinal fermentability in pigs. J Nutr 129: 1002–1009.
47. Oppermann JA, Muldoon E, Ranney RE (1973) Metabolism of aspartame inmonkeys. J Nutr 103: 1454–1459.
48. Lipton WE, Li YN, Younoszai MK, Stegink LD (1991) Intestinal absorption of
aspartame decomposition products in adult rats. Metabolism 40: 1337–1345.
Aspartame Consumption Impact on Gut Microbiota and Serum Metabolomics
PLOS ONE | www.plosone.org 10 October 2014 | Volume 9 | Issue 10 | e109841
Related Documents