Biogeosciences, 19, 1871–1890, 2022 https://doi.org/10.5194/bg-19-1871-2022 © Author(s) 2022. This work is distributed under the Creative Commons Attribution 4.0 License. Research article Low biodegradability of particulate organic carbon mobilized from thaw slumps on the Peel Plateau, NT, and possible chemosynthesis and sorption effects Sarah Shakil 1 , Suzanne E. Tank 1 , Jorien E. Vonk 2 , and Scott Zolkos 1,a 1 Department of Biological Sciences, University of Alberta, Edmonton, Canada 2 Department of Earth Sciences, Vrije Universiteit, Amsterdam, the Netherlands a current address: John A. Paulson School of Engineering and Applied Sciences, Harvard University, Cambridge, MA 02138, USA Correspondence: Sarah Shakil ([email protected]) Received: 10 June 2021 – Discussion started: 2 July 2021 Revised: 6 January 2022 – Accepted: 28 January 2022 – Published: 4 April 2022 Abstract. Warming and wetting in the western Canadian Arctic are accelerating thaw-driven mass wasting by per- mafrost thaw slumps, increasing total organic carbon (TOC) delivery to headwater streams by orders of magnitude pri- marily due to increases in particulate organic carbon (POC). Upon thaw, permafrost carbon entering and transported within streams may be mineralized to CO 2 or re-sequestered into sediments. The balance between these processes is an important uncertainty in the permafrost–carbon–climate feedback. Using aerobic incubations of TOC from streams affected by thaw slumps we find that slump-derived organic carbon undergoes minimal (∼ 4 %) oxidation over a 1-month period, indicating that this material may be predominantly destined for sediment deposition. Simultaneous measure- ments of POC and dissolved organic carbon (DOC) suggest that mineralization of DOC accounted for most of the TOC loss. Our results indicate that mobilization of mineral-rich tills in this region may protect carbon from mineralization via adsorption to minerals and promote inorganic carbon se- questration via chemolithoautotrophic processes. With inten- sification of hillslope mass wasting across the northern per- mafrost zone, region-specific assessments of permafrost car- bon fates and inquiries beyond organic carbon decomposi- tion are needed to constrain drivers of carbon cycling and climate feedbacks within stream networks affected by per- mafrost thaw. 1 Introduction Permafrost soils comprise the single largest pool of terres- trial organic carbon (OC) (Schuur et al., 2015; Hugelius et al., 2014), half of which may be vulnerable to rapid mobi- lization into modern biogeochemical cycles via abrupt thaw processes (Turetsky et al., 2020; Olefeldt et al., 2016). Per- mafrost dissolved organic carbon (DOC), typically defined as compounds < 0.7 μm, is often highly susceptible to biotic mineralization into CO 2 within aquatic systems (Vonk et al., 2015a; Littlefair and Tank, 2018; Abbott et al., 2014; Mann et al., 2015). Abrupt thaw can mobilize orders of magnitude more particulate organic carbon (POC; typically > 0.7 μm) than DOC, yet the biodegradability of permafrost POC is not well understood (Shakil et al., 2020; Tank et al., 2020; Vonk et al., 2015b). Suspended particles can be important sites for mineraliza- tion (Attermeyer et al., 2018) or mineral protection (Heming- way et al., 2019; Opfergelt, 2020; Groeneveld et al., 2020). In addition to molecular composition and a host of environmen- tal factors that typically affect organic matter decomposition (e.g., microbial activity, nutrient availability) (Kothawala et al., 2021), mineralization of POC in stream networks de- pends on transport vs. deposition. When settled out, miner- alization of POC can be reduced by ∼ 50 % (Richardson et al., 2013) or more, particularly if contained in anoxic sedi- ments (Peter et al., 2016), though carbon release can shift to be in the form of methane (Schädel et al., 2016). Fractions of POC with different density and size therefore not only ex- Published by Copernicus Publications on behalf of the European Geosciences Union.

Welcome message from author
This document is posted to help you gain knowledge. Please leave a comment to let me know what you think about it! Share it to your friends and learn new things together.
Transcript
Biogeosciences, 19, 1871–1890, 2022https://doi.org/10.5194/bg-19-1871-2022© Author(s) 2022. This work is distributed underthe Creative Commons Attribution 4.0 License.
Research
article
Low biodegradability of particulate organic carbon mobilizedfrom thaw slumps on the Peel Plateau, NT, and possiblechemosynthesis and sorption effectsSarah Shakil1, Suzanne E. Tank1, Jorien E. Vonk2, and Scott Zolkos1,a
1Department of Biological Sciences, University of Alberta, Edmonton, Canada2Department of Earth Sciences, Vrije Universiteit, Amsterdam, the Netherlandsacurrent address: John A. Paulson School of Engineering and Applied Sciences,Harvard University, Cambridge, MA 02138, USA
Correspondence: Sarah Shakil ([email protected])
Received: 10 June 2021 – Discussion started: 2 July 2021Revised: 6 January 2022 – Accepted: 28 January 2022 – Published: 4 April 2022
Abstract. Warming and wetting in the western CanadianArctic are accelerating thaw-driven mass wasting by per-mafrost thaw slumps, increasing total organic carbon (TOC)delivery to headwater streams by orders of magnitude pri-marily due to increases in particulate organic carbon (POC).Upon thaw, permafrost carbon entering and transportedwithin streams may be mineralized to CO2 or re-sequesteredinto sediments. The balance between these processes isan important uncertainty in the permafrost–carbon–climatefeedback. Using aerobic incubations of TOC from streamsaffected by thaw slumps we find that slump-derived organiccarbon undergoes minimal (∼ 4 %) oxidation over a 1-monthperiod, indicating that this material may be predominantlydestined for sediment deposition. Simultaneous measure-ments of POC and dissolved organic carbon (DOC) suggestthat mineralization of DOC accounted for most of the TOCloss. Our results indicate that mobilization of mineral-richtills in this region may protect carbon from mineralizationvia adsorption to minerals and promote inorganic carbon se-questration via chemolithoautotrophic processes. With inten-sification of hillslope mass wasting across the northern per-mafrost zone, region-specific assessments of permafrost car-bon fates and inquiries beyond organic carbon decomposi-tion are needed to constrain drivers of carbon cycling andclimate feedbacks within stream networks affected by per-mafrost thaw.
1 Introduction
Permafrost soils comprise the single largest pool of terres-trial organic carbon (OC) (Schuur et al., 2015; Hugelius etal., 2014), half of which may be vulnerable to rapid mobi-lization into modern biogeochemical cycles via abrupt thawprocesses (Turetsky et al., 2020; Olefeldt et al., 2016). Per-mafrost dissolved organic carbon (DOC), typically definedas compounds < 0.7 µm, is often highly susceptible to bioticmineralization into CO2 within aquatic systems (Vonk et al.,2015a; Littlefair and Tank, 2018; Abbott et al., 2014; Mannet al., 2015). Abrupt thaw can mobilize orders of magnitudemore particulate organic carbon (POC; typically > 0.7 µm)than DOC, yet the biodegradability of permafrost POC is notwell understood (Shakil et al., 2020; Tank et al., 2020; Vonket al., 2015b).
Suspended particles can be important sites for mineraliza-tion (Attermeyer et al., 2018) or mineral protection (Heming-way et al., 2019; Opfergelt, 2020; Groeneveld et al., 2020). Inaddition to molecular composition and a host of environmen-tal factors that typically affect organic matter decomposition(e.g., microbial activity, nutrient availability) (Kothawala etal., 2021), mineralization of POC in stream networks de-pends on transport vs. deposition. When settled out, miner-alization of POC can be reduced by ∼ 50 % (Richardson etal., 2013) or more, particularly if contained in anoxic sedi-ments (Peter et al., 2016), though carbon release can shift tobe in the form of methane (Schädel et al., 2016). Fractionsof POC with different density and size therefore not only ex-
Published by Copernicus Publications on behalf of the European Geosciences Union.
1872 S. Shakil et al.: Low biodegradability of particulate organic carbon
perience a different settling and transport trajectory but alsomay have differing processes and rates affecting OC dynam-ics (Tesi et al., 2016). If biodegradability varies across sizeand density fractions, this could alter realized mineralizationduring transport relative to measurements on bulk OC (Tesiet al., 2016).
Warming and intensifying precipitation across the ice-richterrain of the Peel Plateau in western Canada have triggeredan acceleration of thaw-driven landscape erosion in the formof retrogressive thaw slumps (hereafter, slumps) (Kokelj etal., 2021). Thaw slumping along stream sites in this regioncan increase total organic carbon (TOC) yields by orders ofmagnitude almost entirely due to increases in POC (Shakilet al., 2020). Slump-derived DOC in the region is relativelymore labile than background DOC, as shown by chemicalcomposition and incubations (Littlefair et al., 2017; Littlefairand Tank, 2018). Slump-derived POC chemical compositionsuggests lower bioavailability as POC sources shift from theactive layer and some periphyton material to Pleistocene-aged organic carbon and petrogenic organic carbon mobi-lized from permafrost (Shakil et al., 2020; Bröder et al.,2021). However, POC bioavailability has not been experi-mentally assessed. Given that slump-derived carbon occursalmost entirely as POC in this region (Shakil et al., 2020), un-derstanding the fate of this carbon remains a critical knowl-edge gap.
Our objectives were to assess the potential for slump POCto be mineralized to CO2 during transport in streams. To dothis, we undertook experimental incubations to (a) determinewhether slump POC differs in biodegradability from POCpresent in unimpacted waters and (b) quantify and assessthe biodegradability of slump-POC fractions relative to theirtransport potential. This work provides insight into the fateof an understudied component of permafrost-mobilized OC.
2 Methods
2.1 Region and field sampling
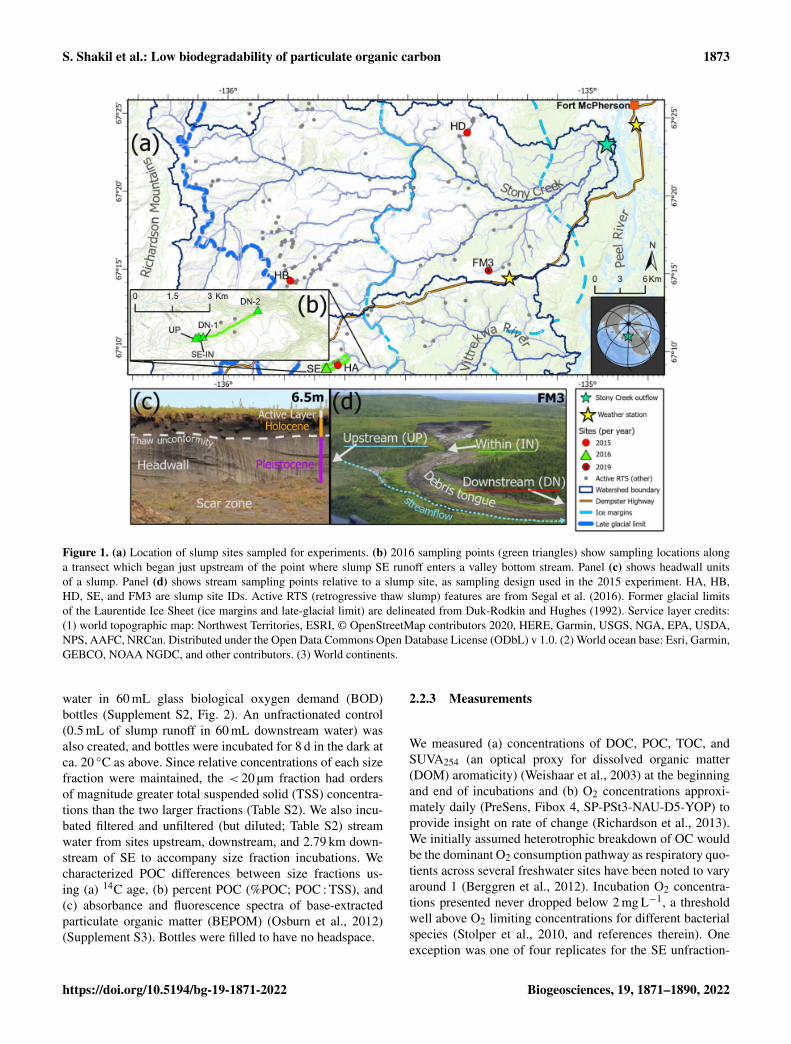
Slumping occurs across the Peel Plateau (Fig. 1) andtypically mobilizes terrestrial material from three distinctsources: (1) Pleistocene-age tills that have remained pre-served within permafrost since deposition by the Lau-rentide Ice Sheet and subsequent permafrost aggradation;(2) Holocene-age permafrost developed from tills followingactive layer deepening and/or slumping in previous warm pe-riods, followed by permafrost aggradation during a coolerclimate; and (3) a contemporary active layer. Thus, the rel-ative contribution of biogeochemical substrate from thesethree terrestrial sources to streams can depend on thaw depth(Shakil et al., 2020; Bröder et al., 2021). Source compositioncan also vary west–east as vegetation (elevation) and geologychange along this gradient (Duk-Rodkin and Hughes, 1992;Norris, 1985).
Sampling occurred during July–August, within the StonyCreek and Vittrekwa River watersheds of the Gwich’in Set-tlement Region on the Peel Plateau (Fig. 1). In 2015, sub-strate from streams near and within three slump sites (HA,HB, HD) was used to test if mobilization of slump POC andnutrients affect biodegradability of OC in streams. Streamwater samples were obtained from channelized runoff withineach thaw slump (IN), a downstream location where allrunoff entered the valley-bottom stream (DN), and an unim-pacted reference stream upstream of slump inflow (UP)(Fig. 1b). Site HD-UP experienced some encroachment ofslump runoff and thus was not a fully unimpacted site(Fig. S4). In 2016, substrate was collected upstream of,within, immediately downstream of, and 2.79 km down-stream of slump site SE to assess variations in biodegrad-ability with transport potential. In 2019, substrate was col-lected within and downstream of slump FM3 to follow upresults from 2015 and 2016 (details below). Slump sites hadvaried elevation and morphology, with maximum headwallheights (Fig. 1a) ranging from 7.1 to 23 m (see Shakil et al.,2020). All samples were processed (i.e., filtered) within 24 hof collection, apart from within-slump and downstream sam-ples used for adding particles to “unfiltered” treatments in2016 that were stored in the dark at 4 ◦C until the start of theexperiment. Experiments were initiated within 24 h (2015,2019) or 48 h (2016) after processing. The extra hold timefor the 2016 experiment was due to the extra time needed forsize fractionation of samples (see below and Supplement S2).For further sample collection details, see Supplement S1.
2.2 Biodegradation experiments
2.2.1 Effects of POC source, dissolved constituents,and settling (2015)
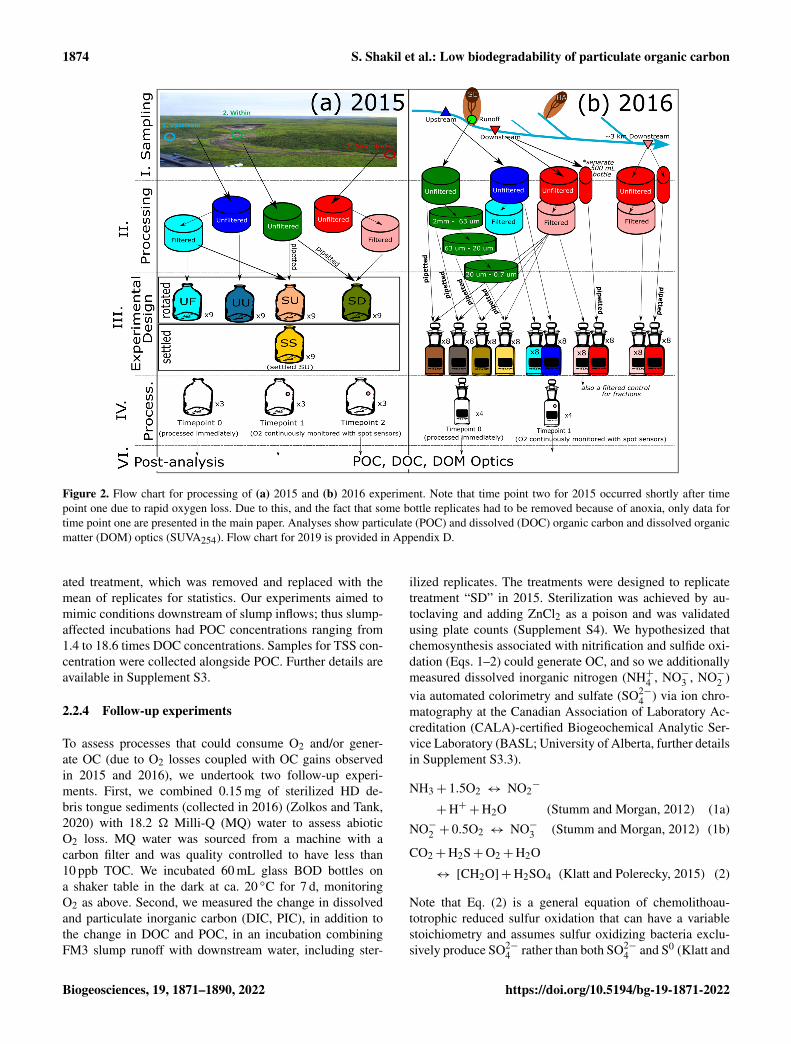
To test the effect of POC source (Table 1), we incubated un-filtered upstream water (upstream POC; treatment “UU”) andfiltered upstream water with a 2 mL addition of slump runoff(slump POC; “SU”) in 120 mL glass serum bottles for 7 dat ca. 20 ◦C in the dark, with continuous end-over-end rota-tion (4 rpm; Richardson et al., 2013) (Supplement S2, Fig. 2).Control bottles accounted for DOC contained in filtered up-stream water alone (no POC control; “UF”). Additionally,we tested for (a) the effect of particle deposition by allow-ing a replicate set of SU bottles to settle out (“SS”) and(b) the slump-derived release of additional solutes (e.g., nu-trients) by mixing slump POC with filtered downstream wa-ter (“SD”). Bottles were filled to have no headspace.
2.2.2 Variability as a function of transport potential(2016)
SE within-slump runoff was split into three sieve size frac-tions (63–2000, 20–63, < 20 µm) by sieving a 0.5 mL aliquotand adding the resultant size fractions to filtered downstream
Biogeosciences, 19, 1871–1890, 2022 https://doi.org/10.5194/bg-19-1871-2022
S. Shakil et al.: Low biodegradability of particulate organic carbon 1873
Figure 1. (a) Location of slump sites sampled for experiments. (b) 2016 sampling points (green triangles) show sampling locations alonga transect which began just upstream of the point where slump SE runoff enters a valley bottom stream. Panel (c) shows headwall unitsof a slump. Panel (d) shows stream sampling points relative to a slump site, as sampling design used in the 2015 experiment. HA, HB,HD, SE, and FM3 are slump site IDs. Active RTS (retrogressive thaw slump) features are from Segal et al. (2016). Former glacial limitsof the Laurentide Ice Sheet (ice margins and late-glacial limit) are delineated from Duk-Rodkin and Hughes (1992). Service layer credits:(1) world topographic map: Northwest Territories, ESRI, © OpenStreetMap contributors 2020, HERE, Garmin, USGS, NGA, EPA, USDA,NPS, AAFC, NRCan. Distributed under the Open Data Commons Open Database License (ODbL) v 1.0. (2) World ocean base: Esri, Garmin,GEBCO, NOAA NGDC, and other contributors. (3) World continents.
water in 60 mL glass biological oxygen demand (BOD)bottles (Supplement S2, Fig. 2). An unfractionated control(0.5 mL of slump runoff in 60 mL downstream water) wasalso created, and bottles were incubated for 8 d in the dark atca. 20 ◦C as above. Since relative concentrations of each sizefraction were maintained, the < 20 µm fraction had ordersof magnitude greater total suspended solid (TSS) concentra-tions than the two larger fractions (Table S2). We also incu-bated filtered and unfiltered (but diluted; Table S2) streamwater from sites upstream, downstream, and 2.79 km down-stream of SE to accompany size fraction incubations. Wecharacterized POC differences between size fractions us-ing (a) 14C age, (b) percent POC (%POC; POC : TSS), and(c) absorbance and fluorescence spectra of base-extractedparticulate organic matter (BEPOM) (Osburn et al., 2012)(Supplement S3). Bottles were filled to have no headspace.
2.2.3 Measurements
We measured (a) concentrations of DOC, POC, TOC, andSUVA254 (an optical proxy for dissolved organic matter(DOM) aromaticity) (Weishaar et al., 2003) at the beginningand end of incubations and (b) O2 concentrations approxi-mately daily (PreSens, Fibox 4, SP-PSt3-NAU-D5-YOP) toprovide insight on rate of change (Richardson et al., 2013).We initially assumed heterotrophic breakdown of OC wouldbe the dominant O2 consumption pathway as respiratory quo-tients across several freshwater sites have been noted to varyaround 1 (Berggren et al., 2012). Incubation O2 concentra-tions presented never dropped below 2 mg L−1, a thresholdwell above O2 limiting concentrations for different bacterialspecies (Stolper et al., 2010, and references therein). Oneexception was one of four replicates for the SE unfraction-
https://doi.org/10.5194/bg-19-1871-2022 Biogeosciences, 19, 1871–1890, 2022
1874 S. Shakil et al.: Low biodegradability of particulate organic carbon
Figure 2. Flow chart for processing of (a) 2015 and (b) 2016 experiment. Note that time point two for 2015 occurred shortly after timepoint one due to rapid oxygen loss. Due to this, and the fact that some bottle replicates had to be removed because of anoxia, only data fortime point one are presented in the main paper. Analyses show particulate (POC) and dissolved (DOC) organic carbon and dissolved organicmatter (DOM) optics (SUVA254). Flow chart for 2019 is provided in Appendix D.
ated treatment, which was removed and replaced with themean of replicates for statistics. Our experiments aimed tomimic conditions downstream of slump inflows; thus slump-affected incubations had POC concentrations ranging from1.4 to 18.6 times DOC concentrations. Samples for TSS con-centration were collected alongside POC. Further details areavailable in Supplement S3.
2.2.4 Follow-up experiments
To assess processes that could consume O2 and/or gener-ate OC (due to O2 losses coupled with OC gains observedin 2015 and 2016), we undertook two follow-up experi-ments. First, we combined 0.15 mg of sterilized HD de-bris tongue sediments (collected in 2016) (Zolkos and Tank,2020) with 18.2 � Milli-Q (MQ) water to assess abioticO2 loss. MQ water was sourced from a machine with acarbon filter and was quality controlled to have less than10 ppb TOC. We incubated 60 mL glass BOD bottles ona shaker table in the dark at ca. 20 ◦C for 7 d, monitoringO2 as above. Second, we measured the change in dissolvedand particulate inorganic carbon (DIC, PIC), in addition tothe change in DOC and POC, in an incubation combiningFM3 slump runoff with downstream water, including ster-
ilized replicates. The treatments were designed to replicatetreatment “SD” in 2015. Sterilization was achieved by au-toclaving and adding ZnCl2 as a poison and was validatedusing plate counts (Supplement S4). We hypothesized thatchemosynthesis associated with nitrification and sulfide oxi-dation (Eqs. 1–2) could generate OC, and so we additionallymeasured dissolved inorganic nitrogen (NH+4 , NO−3 , NO−2 )via automated colorimetry and sulfate (SO2−
4 ) via ion chro-matography at the Canadian Association of Laboratory Ac-creditation (CALA)-certified Biogeochemical Analytic Ser-vice Laboratory (BASL; University of Alberta, further detailsin Supplement S3.3).
NH3+ 1.5O2 ↔ NO2−
+H++H2O (Stumm and Morgan, 2012) (1a)NO−2 + 0.5O2 ↔ NO−3 (Stumm and Morgan, 2012) (1b)
CO2+H2S+O2+H2O
↔ [CH2O]+H2SO4 (Klatt and Polerecky, 2015) (2)
Note that Eq. (2) is a general equation of chemolithoau-totrophic reduced sulfur oxidation that can have a variablestoichiometry and assumes sulfur oxidizing bacteria exclu-sively produce SO2−
4 rather than both SO2−4 and S0 (Klatt and
Biogeosciences, 19, 1871–1890, 2022 https://doi.org/10.5194/bg-19-1871-2022
S. Shakil et al.: Low biodegradability of particulate organic carbon 1875
Polerecky, 2015; Nelson et al., 1986). Equation (3) shows anet reaction for a model of pyrite oxidation at circumneu-tral pH (Percak-Dennett et al., 2017). We note that pH inthe streams in this study can be quite variable but tend to becircumneutral, often varying around pH 7 and mostly rang-ing from pH 6 to 8 (see Supplement data of Shakil et al.,2020). This sulfide oxidation can generate sulfuric acid thatcan weather carbonates (e.g., Eq. 4) or silicates (Zolkos andTank, 2020; Zolkos et al., 2020).
FeS2+ 3.75O2+ 3.5H2O ↔ 2H2SO4
+Fe(OH)3 (Percak-Dennett et al., 2017) (3)
H2SO4+ 2(Ca,Mg)CO3 ↔ 2(
Ca2+,Mg2+)
+SO2−4 + 2HCO−3 (Calmels et al., 2007)
(Zolkos and Tank, 2020) (4)
Sediments in sterilized and unsterilized bottles were addi-tionally characterized using X-ray diffraction (XRD) (Sup-plement S3.4), while absorbance and fluorescence spectra ofBEPOM and DOM were assessed at the beginning and endof the experiment (see Supplement for further details).
2.3 Data analyses
Two-way ANOVAs, with site and treatment as fixed effects,were used to assess the effect of POC presence (UF vs. SU),source (UU vs. SU), dissolved matrix (SU vs. SD), and set-tling (SU vs. SS) on percent changes in OC (DOC, POC,and TOC), DOM aromaticity (SUVA254), and O2 loss rate.One-way ANOVAs were also used to assess differences inthe aforementioned changes between size fractions (2016 ex-periment). Two-way ANOVAs were used to assess the effectof distance and filtration (fixed effects) for the 2016 tran-sect experiments. Significant ANOVA tests were followedup with Tukey-adjusted pairwise t tests (Zar, 2010). We alsocalculated 95 % confidence intervals to evaluate whether OCchanges significantly differed from zero. Principal compo-nent analyses were used to visualize differences in opticalindices between size fractions (2016) and changes in DOMand BEPOM (2019), following the calculation of SUVA254(DOM only; Weishaar et al., 2003; Poulin et al., 2014) andslope ratios (Helms et al., 2008) on absorbance data, as wellas humification indices (HIX; Ohno, 2002), biological in-dices (BIX; Huguet et al., 2009), the proportion of peaksC and M (Coble, 2007), and previously identified BEPOMpeaks (Shakil et al., 2020) on fluorescence data (Supple-ment 3.6–3.9). To assess factors controlling in situ CO2 andO2 dynamics we calculated departures of O2 and CO2 fromatmospheric equilibrium (Vachon et al., 2019) using 2015in situ measurements of dissolved O2 at several slump sites(Shakil et al., 2020) and coupled CO2 departures (Zolkos etal., 2019). For further details, see Appendix A.
3 Results
3.1 Effects of POC presence and source (2015)
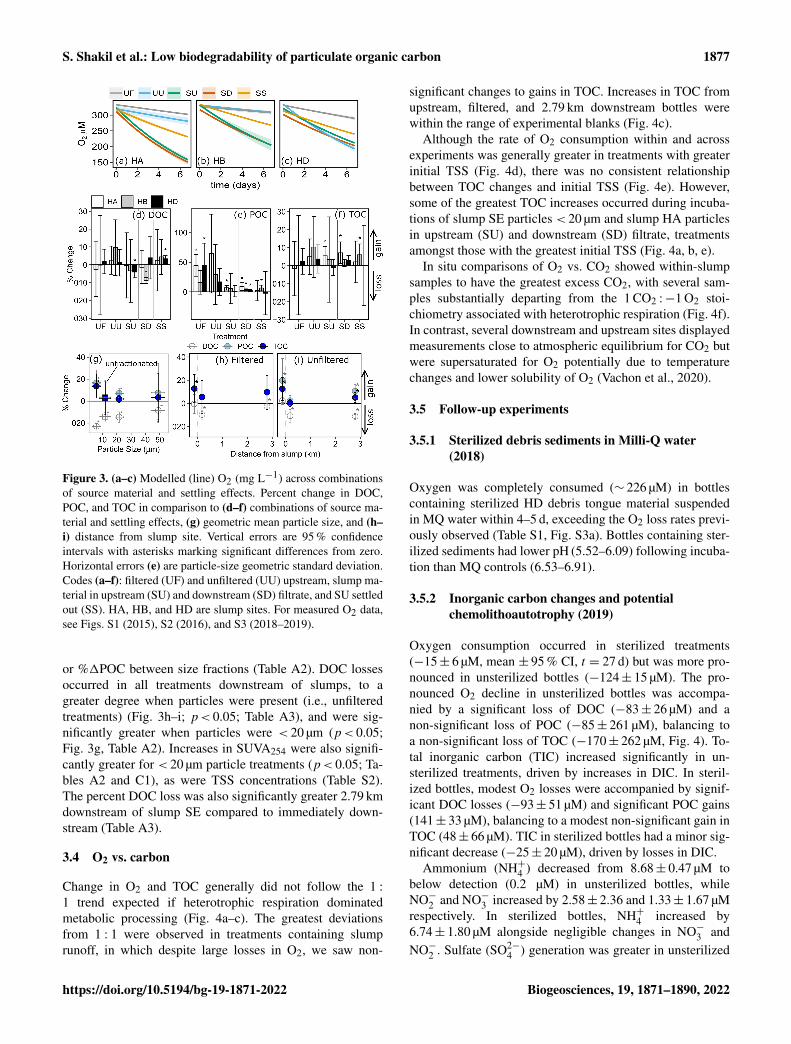
Across experiments, declines in POC were not observed, andin some cases, POC increased (Fig. 3). Slump runoff addi-tion into filtered upstream water (SU) did not significantlyalter %1DOC (the percent change in DOC from beginningto end of the experiment), 1SUVA254 (absolute change inDOM aromaticity), or %1TOC (p> 0.05; Table A1, Fig. 3)relative to the upstream filtered control (UF). Similarly, POCsource (slump, SU, vs. unfiltered upstream, UU) did notsignificantly affect %1TOC or 1SUVA254 (p> 0.05; Ta-ble A1, Fig. 3). However, %1POC was significantly lowerwhen particles were sourced from slump runoff (SU vs. UU;p< 0.001; Table A1) potentially because particle concen-trations were orders of magnitude lower in upstream bot-tles (Table S2). DOC increased in the presence of upstreamparticles (UU) but decreased in the presence of slump parti-cles (SU), though this difference was marginally insignificant(Table A1, p = 0.053). Despite no effect on %1TOC (Ta-ble A1), the addition of slump particles (SU) did significantlyincrease rates of O2 consumption compared to upstream fil-tered and unfiltered treatments (UF and UU; Fig. 3a–c),though this effect was dependent on slump site (significantinteractions; Table A1; note lack of increase for site HDwhere slump runoff encroached the upstream site).
3.2 Effects of background dissolved constituents andsettling (2015)
Changing filtrate to downstream water, which has higherion and nutrient concentrations (Shakil et al., 2020), hadno significant effect on any parameter measured in the ex-periment (SU vs. SD; Table A1). Allowing slump particlesto settle (SU vs. SS) did not affect %1TOC but did sig-nificantly reduce O2 consumption rates. Mean DOC con-centrations also switched from decreasing (SU) to increas-ing (SS) (Fig. 3d), though the difference was not significant(p = 0.10; Table A1).
3.3 Variability dependent on transport potential (2016)
Based on 14C age, %POC, and the relative contributionof fluorescent peak C (Coble, 2007), larger particle sizefractions appeared to be associated with fresher terrestrial-origin organic matter than smaller size fractions (Ap-pendix B). POC associated with particles < 20 µm dated to> 27 000 cal BP, while POC associated with particles rang-ing from 20–63 and 63–2000 µm dated to ∼ 19 600 and∼ 8000 cal BP respectively (Table B1). The majority of POC(73 %; Table B1) was associated with particles less than20 µm.
Although bottles containing particles < 20 µm displayedsignificant gains in TOC (95 % CI; Fig. 3g), ANOVA anal-yses did not uncover a significant difference in %1TOC
https://doi.org/10.5194/bg-19-1871-2022 Biogeosciences, 19, 1871–1890, 2022
1876 S. Shakil et al.: Low biodegradability of particulate organic carbon
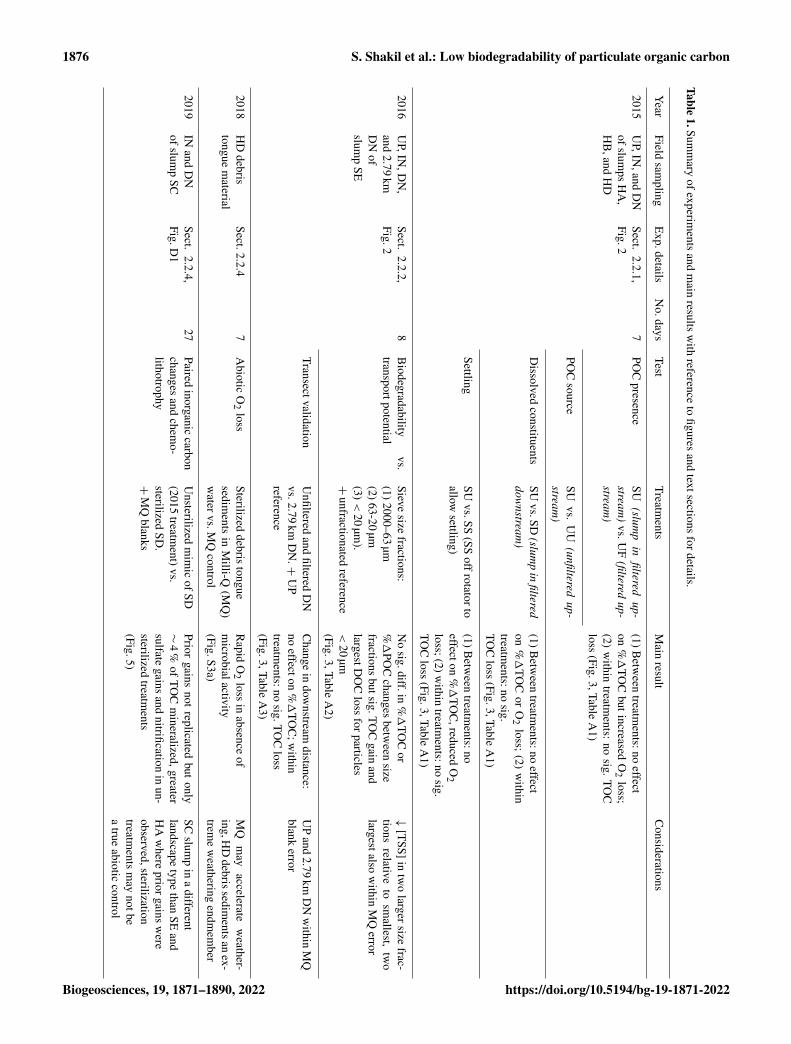
Table1.Sum
mary
ofexperiments
andm
ainresults
with
referenceto
figuresand
textsectionsfordetails.
Year
Fieldsam
plingE
xp.detailsN
o.daysTest
Treatments
Main
resultC
onsiderations
2015U
P,IN,and
DN
ofslumps
HA
,H
B,and
HD
Sect.2.2.1,
Fig.27
POC
presenceSU
(slump
infiltered
up-stream
)vs.U
F(filtered
up-stream
)
(1)Betw
eentreatm
ents:noeffect
on%
1TO
Cbutincreased
O2
loss;(2)
within
treatments:
nosig.TO
Closs
(Fig.3,TableA
1)
POC
sourceSU
vs.U
U(unfiltered
up-stream
)
Dissolved
constituentsSU
vs.SD(slum
pin
filtereddow
nstream)
(1)Betw
eentreatm
ents:noeffect
on%
1TO
Cor
O2
loss;(2)
within
treatments:no
sig.TO
Closs
(Fig.3,TableA
1)
SettlingSU
vs.SS(SS
offrotatortoallow
settling)(1)B
etween
treatments:no
effecton%
1TO
C,reduced
O2
loss;(2)within
treatments:no
sig.TO
Closs
(Fig.3,TableA
1)
2016U
P,IN,D
N,
and2.79
kmD
Nof
slump
SE
Sect.2.2.2,
Fig.28
Biodegradability
vs.transportpotential
Sievesize
fractions:(1)2000–63
µm(2)63-20
µm(3)
<20
µm).
+unfractionated
reference
No
sig.diff.in%
1TO
Cor
%1
POC
changesbetw
eensize
fractionsbutsig.TO
Cgain
andlargestD
OC
lossforparticles
<20
µm(Fig.3,Table
A2)
↓[T
SS]intw
olarger
sizefrac-
tionsrelative
tosm
allest,tw
olargestalso
within
MQ
error
TransectvalidationU
nfilteredand
filteredD
Nvs.2.79
kmD
N.+
UP
reference
Change
indow
nstreamdistance:
noeffecton
%1
TOC
;within
treatments:no
sig.TOC
loss(Fig.3,Table
A3)
UP
and2.79
kmD
Nw
ithinM
Qblank
error
2018H
Ddebris
tonguem
aterialSect.2.2.4
7A
bioticO
2loss
Sterilizeddebris
tonguesedim
entsin
Milli-Q
(MQ
)w
atervs.MQ
control
Rapid
O2
lossin
absenceof
microbialactivity
(Fig.S3a)
MQ
may
acceleratew
eather-ing,H
Ddebrissedim
entsanex-
treme
weathering
endmem
ber
2019IN
andD
Nofslum
pSC
Sect.2.2.4,
Fig.D1
27Paired
inorganiccarbon
changesand
chemo-
lithotrophy
Unsterilized
mim
icofSD
(2015treatm
ent)vs.sterilized
SD.
+M
Qblanks
Priorgains
notreplicated
butonly
∼4
%of
TOC
mineralized,greater
sulfategains
andnitrification
inun-
sterilizedtreatm
ents(Fig.5)
SCslum
pin
adifferent
landscapetype
thanSE
andH
Aw
herepriorgains
were
observed,sterilizationtreatm
entsm
aynotbe
atrue
abioticcontrol
Biogeosciences, 19, 1871–1890, 2022 https://doi.org/10.5194/bg-19-1871-2022
S. Shakil et al.: Low biodegradability of particulate organic carbon 1877
Figure 3. (a–c) Modelled (line) O2 (mg L−1) across combinationsof source material and settling effects. Percent change in DOC,POC, and TOC in comparison to (d–f) combinations of source ma-terial and settling effects, (g) geometric mean particle size, and (h–i) distance from slump site. Vertical errors are 95 % confidenceintervals with asterisks marking significant differences from zero.Horizontal errors (e) are particle-size geometric standard deviation.Codes (a–f): filtered (UF) and unfiltered (UU) upstream, slump ma-terial in upstream (SU) and downstream (SD) filtrate, and SU settledout (SS). HA, HB, and HD are slump sites. For measured O2 data,see Figs. S1 (2015), S2 (2016), and S3 (2018–2019).
or %1POC between size fractions (Table A2). DOC lossesoccurred in all treatments downstream of slumps, to agreater degree when particles were present (i.e., unfilteredtreatments) (Fig. 3h–i; p< 0.05; Table A3), and were sig-nificantly greater when particles were < 20 µm (p< 0.05;Fig. 3g, Table A2). Increases in SUVA254 were also signifi-cantly greater for < 20 µm particle treatments (p< 0.05; Ta-bles A2 and C1), as were TSS concentrations (Table S2).The percent DOC loss was also significantly greater 2.79 kmdownstream of slump SE compared to immediately down-stream (Table A3).
3.4 O2 vs. carbon
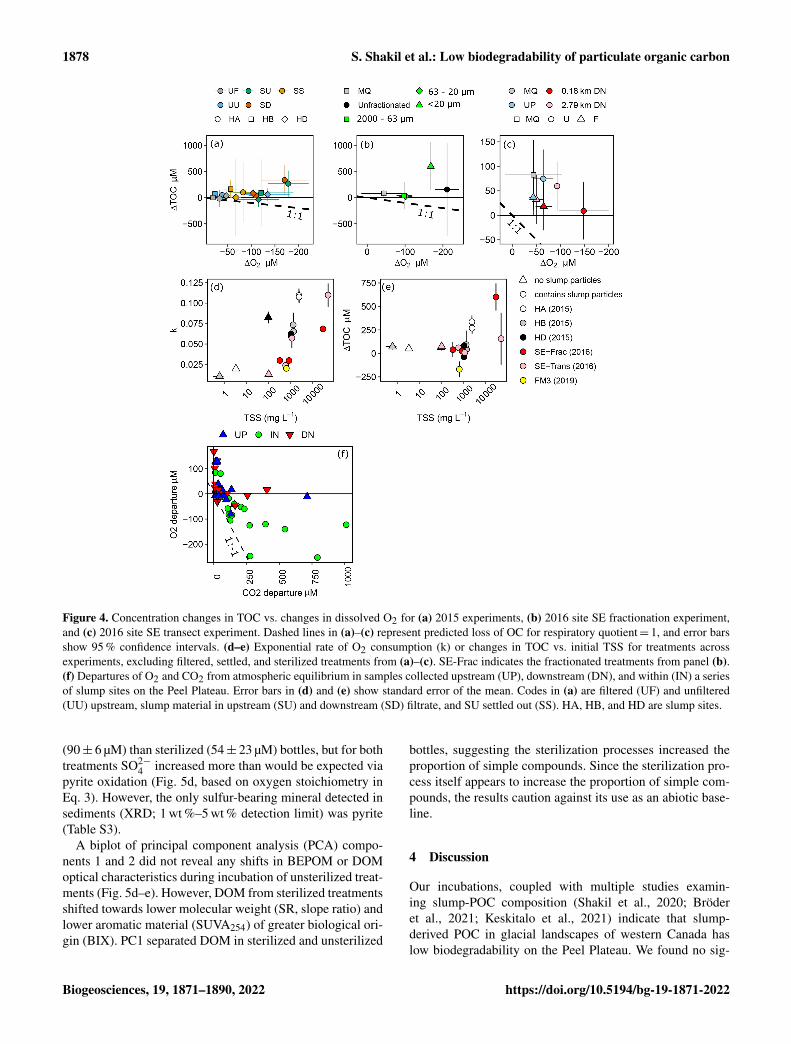
Change in O2 and TOC generally did not follow the 1 :1 trend expected if heterotrophic respiration dominatedmetabolic processing (Fig. 4a–c). The greatest deviationsfrom 1 : 1 were observed in treatments containing slumprunoff, in which despite large losses in O2, we saw non-
significant changes to gains in TOC. Increases in TOC fromupstream, filtered, and 2.79 km downstream bottles werewithin the range of experimental blanks (Fig. 4c).
Although the rate of O2 consumption within and acrossexperiments was generally greater in treatments with greaterinitial TSS (Fig. 4d), there was no consistent relationshipbetween TOC changes and initial TSS (Fig. 4e). However,some of the greatest TOC increases occurred during incuba-tions of slump SE particles < 20 µm and slump HA particlesin upstream (SU) and downstream (SD) filtrate, treatmentsamongst those with the greatest initial TSS (Fig. 4a, b, e).
In situ comparisons of O2 vs. CO2 showed within-slumpsamples to have the greatest excess CO2, with several sam-ples substantially departing from the 1 CO2 :−1 O2 stoi-chiometry associated with heterotrophic respiration (Fig. 4f).In contrast, several downstream and upstream sites displayedmeasurements close to atmospheric equilibrium for CO2 butwere supersaturated for O2 potentially due to temperaturechanges and lower solubility of O2 (Vachon et al., 2020).
3.5 Follow-up experiments
3.5.1 Sterilized debris sediments in Milli-Q water(2018)
Oxygen was completely consumed (∼ 226 µM) in bottlescontaining sterilized HD debris tongue material suspendedin MQ water within 4–5 d, exceeding the O2 loss rates previ-ously observed (Table S1, Fig. S3a). Bottles containing ster-ilized sediments had lower pH (5.52–6.09) following incuba-tion than MQ controls (6.53–6.91).
3.5.2 Inorganic carbon changes and potentialchemolithoautotrophy (2019)
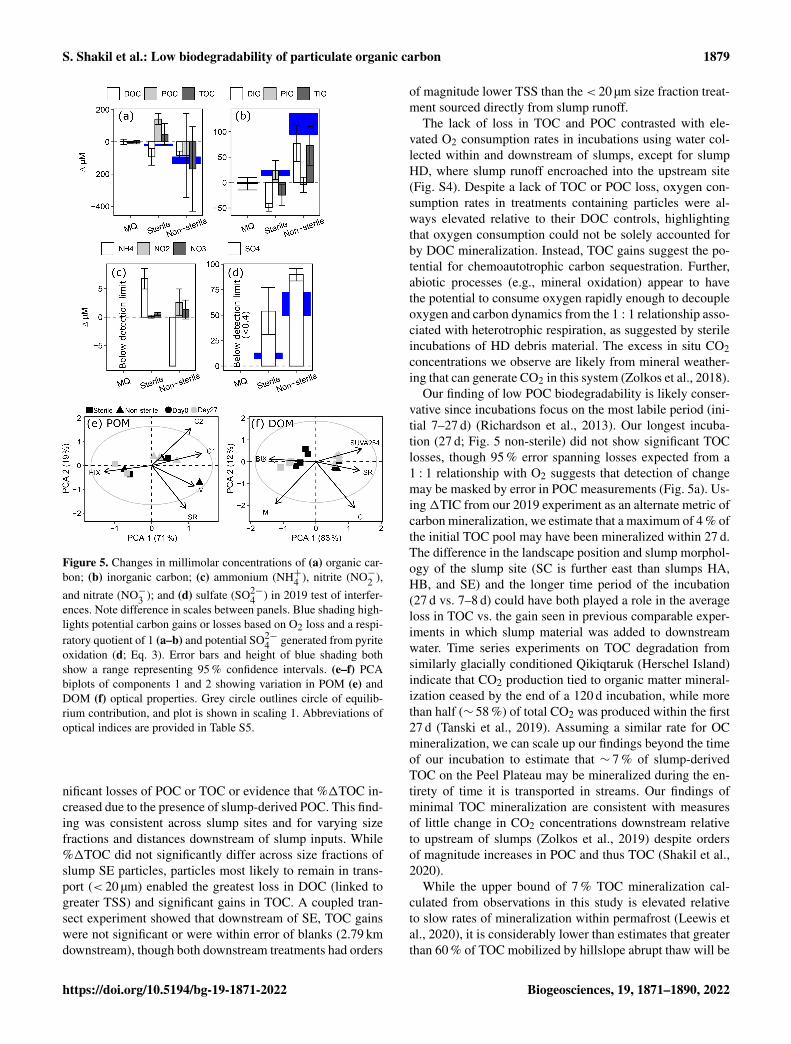
Oxygen consumption occurred in sterilized treatments(−15± 6 µM, mean ± 95 % CI, t = 27 d) but was more pro-nounced in unsterilized bottles (−124± 15 µM). The pro-nounced O2 decline in unsterilized bottles was accompa-nied by a significant loss of DOC (−83± 26 µM) and anon-significant loss of POC (−85± 261 µM), balancing toa non-significant loss of TOC (−170± 262 µM, Fig. 4). To-tal inorganic carbon (TIC) increased significantly in un-sterilized treatments, driven by increases in DIC. In steril-ized bottles, modest O2 losses were accompanied by signif-icant DOC losses (−93± 51 µM) and significant POC gains(141± 33 µM), balancing to a modest non-significant gain inTOC (48± 66 µM). TIC in sterilized bottles had a minor sig-nificant decrease (−25± 20 µM), driven by losses in DIC.
Ammonium (NH+4 ) decreased from 8.68± 0.47 µM tobelow detection (0.2 µM) in unsterilized bottles, whileNO−2 and NO−3 increased by 2.58± 2.36 and 1.33± 1.67 µMrespectively. In sterilized bottles, NH+4 increased by6.74± 1.80 µM alongside negligible changes in NO−3 andNO−2 . Sulfate (SO2−
4 ) generation was greater in unsterilized
https://doi.org/10.5194/bg-19-1871-2022 Biogeosciences, 19, 1871–1890, 2022
1878 S. Shakil et al.: Low biodegradability of particulate organic carbon
Figure 4. Concentration changes in TOC vs. changes in dissolved O2 for (a) 2015 experiments, (b) 2016 site SE fractionation experiment,and (c) 2016 site SE transect experiment. Dashed lines in (a)–(c) represent predicted loss of OC for respiratory quotient= 1, and error barsshow 95 % confidence intervals. (d–e) Exponential rate of O2 consumption (k) or changes in TOC vs. initial TSS for treatments acrossexperiments, excluding filtered, settled, and sterilized treatments from (a)–(c). SE-Frac indicates the fractionated treatments from panel (b).(f) Departures of O2 and CO2 from atmospheric equilibrium in samples collected upstream (UP), downstream (DN), and within (IN) a seriesof slump sites on the Peel Plateau. Error bars in (d) and (e) show standard error of the mean. Codes in (a) are filtered (UF) and unfiltered(UU) upstream, slump material in upstream (SU) and downstream (SD) filtrate, and SU settled out (SS). HA, HB, and HD are slump sites.
(90± 6 µM) than sterilized (54± 23 µM) bottles, but for bothtreatments SO2−
4 increased more than would be expected viapyrite oxidation (Fig. 5d, based on oxygen stoichiometry inEq. 3). However, the only sulfur-bearing mineral detected insediments (XRD; 1 wt %–5 wt % detection limit) was pyrite(Table S3).
A biplot of principal component analysis (PCA) compo-nents 1 and 2 did not reveal any shifts in BEPOM or DOMoptical characteristics during incubation of unsterilized treat-ments (Fig. 5d–e). However, DOM from sterilized treatmentsshifted towards lower molecular weight (SR, slope ratio) andlower aromatic material (SUVA254) of greater biological ori-gin (BIX). PC1 separated DOM in sterilized and unsterilized
bottles, suggesting the sterilization processes increased theproportion of simple compounds. Since the sterilization pro-cess itself appears to increase the proportion of simple com-pounds, the results caution against its use as an abiotic base-line.
4 Discussion
Our incubations, coupled with multiple studies examin-ing slump-POC composition (Shakil et al., 2020; Bröderet al., 2021; Keskitalo et al., 2021) indicate that slump-derived POC in glacial landscapes of western Canada haslow biodegradability on the Peel Plateau. We found no sig-
Biogeosciences, 19, 1871–1890, 2022 https://doi.org/10.5194/bg-19-1871-2022
S. Shakil et al.: Low biodegradability of particulate organic carbon 1879
Figure 5. Changes in millimolar concentrations of (a) organic car-bon; (b) inorganic carbon; (c) ammonium (NH+4 ), nitrite (NO−2 ),
and nitrate (NO−3 ); and (d) sulfate (SO2−4 ) in 2019 test of interfer-
ences. Note difference in scales between panels. Blue shading high-lights potential carbon gains or losses based on O2 loss and a respi-ratory quotient of 1 (a–b) and potential SO2−
4 generated from pyriteoxidation (d; Eq. 3). Error bars and height of blue shading bothshow a range representing 95 % confidence intervals. (e–f) PCAbiplots of components 1 and 2 showing variation in POM (e) andDOM (f) optical properties. Grey circle outlines circle of equilib-rium contribution, and plot is shown in scaling 1. Abbreviations ofoptical indices are provided in Table S5.
nificant losses of POC or TOC or evidence that %1TOC in-creased due to the presence of slump-derived POC. This find-ing was consistent across slump sites and for varying sizefractions and distances downstream of slump inputs. While%1TOC did not significantly differ across size fractions ofslump SE particles, particles most likely to remain in trans-port (< 20 µm) enabled the greatest loss in DOC (linked togreater TSS) and significant gains in TOC. A coupled tran-sect experiment showed that downstream of SE, TOC gainswere not significant or were within error of blanks (2.79 kmdownstream), though both downstream treatments had orders
of magnitude lower TSS than the < 20 µm size fraction treat-ment sourced directly from slump runoff.
The lack of loss in TOC and POC contrasted with ele-vated O2 consumption rates in incubations using water col-lected within and downstream of slumps, except for slumpHD, where slump runoff encroached into the upstream site(Fig. S4). Despite a lack of TOC or POC loss, oxygen con-sumption rates in treatments containing particles were al-ways elevated relative to their DOC controls, highlightingthat oxygen consumption could not be solely accounted forby DOC mineralization. Instead, TOC gains suggest the po-tential for chemoautotrophic carbon sequestration. Further,abiotic processes (e.g., mineral oxidation) appear to havethe potential to consume oxygen rapidly enough to decoupleoxygen and carbon dynamics from the 1 : 1 relationship asso-ciated with heterotrophic respiration, as suggested by sterileincubations of HD debris material. The excess in situ CO2concentrations we observe are likely from mineral weather-ing that can generate CO2 in this system (Zolkos et al., 2018).
Our finding of low POC biodegradability is likely conser-vative since incubations focus on the most labile period (ini-tial 7–27 d) (Richardson et al., 2013). Our longest incuba-tion (27 d; Fig. 5 non-sterile) did not show significant TOClosses, though 95 % error spanning losses expected from a1 : 1 relationship with O2 suggests that detection of changemay be masked by error in POC measurements (Fig. 5a). Us-ing 1TIC from our 2019 experiment as an alternate metric ofcarbon mineralization, we estimate that a maximum of 4 % ofthe initial TOC pool may have been mineralized within 27 d.The difference in the landscape position and slump morphol-ogy of the slump site (SC is further east than slumps HA,HB, and SE) and the longer time period of the incubation(27 d vs. 7–8 d) could have both played a role in the averageloss in TOC vs. the gain seen in previous comparable exper-iments in which slump material was added to downstreamwater. Time series experiments on TOC degradation fromsimilarly glacially conditioned Qikiqtaruk (Herschel Island)indicate that CO2 production tied to organic matter mineral-ization ceased by the end of a 120 d incubation, while morethan half (∼ 58 %) of total CO2 was produced within the first27 d (Tanski et al., 2019). Assuming a similar rate for OCmineralization, we can scale up our findings beyond the timeof our incubation to estimate that ∼ 7 % of slump-derivedTOC on the Peel Plateau may be mineralized during the en-tirety of time it is transported in streams. Our findings ofminimal TOC mineralization are consistent with measuresof little change in CO2 concentrations downstream relativeto upstream of slumps (Zolkos et al., 2019) despite ordersof magnitude increases in POC and thus TOC (Shakil et al.,2020).
While the upper bound of 7 % TOC mineralization cal-culated from observations in this study is elevated relativeto slow rates of mineralization within permafrost (Leewis etal., 2020), it is considerably lower than estimates that greaterthan 60 % of TOC mobilized by hillslope abrupt thaw will be
https://doi.org/10.5194/bg-19-1871-2022 Biogeosciences, 19, 1871–1890, 2022

1880 S. Shakil et al.: Low biodegradability of particulate organic carbon
mineralized on a decadal timescale (e.g., Table S1 in Turet-sky et al., 2020), which have been based on mineralizationrates observed for DOC in Pleistocene Yedoma landscapes(Vonk et al., 2013). Although similarly elevated rates of DOCmineralization have been noted in other studies (e.g., Spenceret al., 2015; Abbott et al., 2014), these DOC-specific find-ings have not been consistent in landscapes across the Arctic(e.g., Burd et al., 2020; Wickland et al., 2018) likely due todifferences in landscape factors and permafrost composition(Tank et al., 2020). Past studies have also generally not in-cluded POC within their assessments of permafrost carbonmineralization, even though POC concentrations within thawstreams can be orders of magnitude greater than for DOC(Vonk et al., 2013; Shakil et al., 2020). Notably, percent TOCloss from this study is substantially lower than percent DOCloss previously observed for this study area (Littlefair andTank, 2018) likely due to substantial differences in biogeo-chemical processes occurring in the DOC vs. POC pool uponthaw, interaction with mineral surfaces exposed (see furtherdiscussion below), and contrasting headwall sources (Shakilet al., 2020). Our loss estimate is comparable to Tanski etal. (2019), who observed 2 % to 9 % loss rates for incubationsof permafrost TOC mixed with seawater and incubated at16◦C for 120 d. Clearly, our results highlight the need to bet-ter understand the relative lability of different organic matterfractions (i.e., DOC vs. POC) and how mineralization rates ofthese fractions may vary with source (i.e., across landscapes)and receiving environments (lacustrine, fluvial, marine). Thisincreased understanding appears critical for better constrain-ing the magnitude and effective time span of permafrost car-bon degradation in Earth system models.
This study and work by Tanski et al. (2019) both sug-gest DOC contributes substantially more to heterotrophicCO2 production than POC in glacial margin landscapes evenwhere hillslope thermokarst increases fluvial POC by ordersof magnitude (Shakil et al., 2020). This seemingly contrastswith the protection of DOM by adsorption to mineral sur-faces (Littlefair et al., 2017); however adsorption onto miner-als tends to favour humic-like, oxygen-rich compounds, typ-ically considered recalcitrant, over protein-like compounds(Groeneveld et al., 2020). Thus, sorption could “sort” labilecarbon into the dissolved phase and relegate intrinsically re-calcitrant (“humic-like”, aromatic) carbon to mineral protec-tion as POC. Evidence of this effect includes elevated labil-ity of slump-derived DOM relative to upstream DOM (Lit-tlefair et al., 2017; Littlefair and Tank, 2018), low labilityof slump POM (Shakil et al., 2020; this study) and strik-ing compositional similarity of DOC from slump-impactedstreams on the Peel Plateau to that from other circumpolarregions with mineral soils (Wologo et al., 2021). However,when particles settle out, anoxia could result in release ofadsorbed DOC to the overlying water column (Peter et al.,2016), which may explain the switch from mean DOC de-creases to DOC increase in comparisons between rotated andsettled slump treatments. Since both selective sorption in the
water column and desorption in sediment deposits are likelyto happen along the aquatic continuum, it may be difficult todetect or quantify either of these processes in situ. Sorptionappeared to occur in 2019 sterilized bottles as DOC concen-trations declined but POC increased, and DOM aromaticityand molecular weight decreased. No change in DOM in un-sterilized bottles may reflect sorption (loss of aromaticity)and degradation (gain of aromaticity) acting simultaneously,which further underlines challenges in quantifying the pro-cess by measuring OC changes in bulk incubations and whyDOC declines were not consistently followed by increases ordecreases in SUVA254 across experiments, even when losseswere consistent as in 2016.
We note that rapid within-slump processing of labile TOCfractions prior to entrainment within streams may still oc-cur, as supported by high within-slump NH+4 concentra-tions (Shakil et al., 2020) indicative of decomposition (Tan-ski et al., 2017), low representation of labile compounds inthe slump scar zone and stream sediments relative to head-wall sources (active layer) (Keskitalo et al., 2021), and ex-cess CO2 in within-slump rill water resulting from both het-erotrophic respiration and geogenic production (Zolkos etal., 2019) (Fig. 3f). Past work indicates that OC rapidly lostwithin-slump may predominantly originate from the activelayer (Bröder et al., 2021) and Holocene-age permafrost inareas where organic material buried in colluvial depositsfrom past slumping has preserved organics (Lacelle et al.,2019). In addition to serving as a possible marker for decom-position, high concentrations of NH+4 may stimulate nitrifi-cation and associated chemosynthetic carbon sequestration.Though we did not see significant TOC gains in our 2019experiment, ammonia loss coupled with nitrite productionsuggests active nitrification. Nitrifying bacteria have slowgrowth rates (Sinha and Annachhatre, 2007; Bock and Wag-ner, 2013), with the molar ratio of NH+4 consumed to car-bon fixed ranging from 25–100 (Ward, 2013). Using this sto-ichiometry and initial NH+4 concentrations estimated across2015–2016 incubations (Table S4) indicates that nitrificationwould be unlikely to fix more than 1 µM of carbon, in com-parison to OC gains of 601± 459 µM (mean± 95 % CI ofSE < 20 µm incubation; Fig. 3b, Table S4). Chemolithoau-totrophy by sulfur oxidizing bacteria can also sequester car-bon (Klatt and Polerecky, 2015) with the ratio of CO2 se-questered to O2 consumed ranging from 0.09 to 0.41 for aer-obic thiosulfate oxidizers (Klatt and Polerecky, 2015). Theprocess has been noted to be an important carbon seques-tration mechanism in mine tailings (Li et al., 2019). Al-though the role of aerobic microorganisms in sulfide oxida-tion is commonly associated with acidic-pH conditions as inLi et al. (2019), this process can also occur at circumneutralpH (Percak-Dennett et al., 2015). Given the high sedimentconcentration in streams affected by slumping (can exceed800 g L−1; Shakil et al., 2020) and the prevalence of sulfideminerals and oxidation across the Peel Plateau (Zolkos etal., 2018), chemolithoautotrophy associated with sulfide ox-
Biogeosciences, 19, 1871–1890, 2022 https://doi.org/10.5194/bg-19-1871-2022
S. Shakil et al.: Low biodegradability of particulate organic carbon 1881
idation is a mechanism worth exploring as a counterbalanceto OC mineralization. Precise techniques such as isotope la-belling (Spona-Friedl et al., 2020) and the tracking of genesassociated with carbon fixation processes (Percak-Dennett etal., 2017) may circumvent challenges associated with POCmeasurement errors and tracking multiple processes actingon OC end-point measurements.
5 Conclusions
Permafrost thaw slumping is increasing TOC concentrationsin streams across the Peel Plateau (Canada) by orders ofmagnitude, almost entirely in the form of POC (Kokelj etal., 2021; Shakil et al., 2020; Keskitalo et al., 2021). Acrossincubations conducted including slump POC, we found amaximum of 4 % of the initial TOC was lost within 27 dand estimate that this would scale to approximately 7 % ofslump-derived TOC being lost during transport in streams.Changes in DOC and POC fractions suggest that this loss isprimarily driven by losses in DOC, with slump POC display-ing low biodegradability across our incubations. This find-ing, in addition to previous findings that show that the ma-jority of sediment lost from slumps is quickly deposited indebris tongues rather than immediately transported down-stream (Kokelj et al., 2021; Shakil et al., 2020), suggests thatthe majority of the TOC exiting the slump scar zone is likelyto be sequestered in sediments after mobilization to streams.While our experiments examine material exiting rather thanwithin the slump scar zone, thus missing potential within-slump degradation, our estimates highlight that POC degra-dation rates may be much lower than those for DOC – an im-portant consideration for models of permafrost organic mat-ter degradation, particularly given the dominance of organicmatter export in the particulate form from thermokarst fea-tures. Our results indicate that even when in suspension, thawslump-derived POC on the Peel Plateau may be subject to farslower rates of degradation than estimates used in models ofcarbon release from abrupt permafrost thaw (Turetsky et al.,2020), underlying the need to constrain regional variation ina component of the carbon cycle that has undergone substan-tial perturbation. Further, increased input of minerals along-side increases in organic carbon into streams creates signifi-cant potential for carbon sequestration via abiotic (sorption,mineral protection) and biotic (chemolithotrophy) processes.Targeted investigations of these multiple processes acting si-multaneously on carbon dynamics require specific quantifi-cation in landscapes experiencing rapid change.
Appendix A: Data analysis details and ANOVA results
The percent change in OC was used to measure differencesin biodegradability:
%1OC=
(OCTn −OCTOaverage
)OCTOaverage
. (A1)
In Eq. (A1) above, OCTn is the DOC, POC, or TOC mea-sured at an end time point, and OCTOaverage is the mean OCmeasured at the beginning of the experiment. Since multi-ple outcomes were tested for ANOVAs, p values of maintests were corrected for false discovery rate using p.adjustfrom R package “emmeans” (Lenth, 2021). For 2015, maintests were corrected for 19 tests since the SU treatment wastested in four comparisons, and three to four outcomes weretested per comparison. For 2016, main tests were correctedfor four to five tests since four to five outcomes were testedper ANOVA. Follow-up Tukey- or Games–Howell-adjustedpairwise t tests were conducted only when an interaction ormain test of interest was significant. Prior to PCA we (a) usedPearson correlations to remove variables such that no vari-ables within the PCA had a Pearson correlation greater than0.9, (b) log-transformed all variables to prevent skew, and(c) conducted a detrended correspondence analysis to ensurelinearity of the dataset.
https://doi.org/10.5194/bg-19-1871-2022 Biogeosciences, 19, 1871–1890, 2022
1882 S. Shakil et al.: Low biodegradability of particulate organic carbon
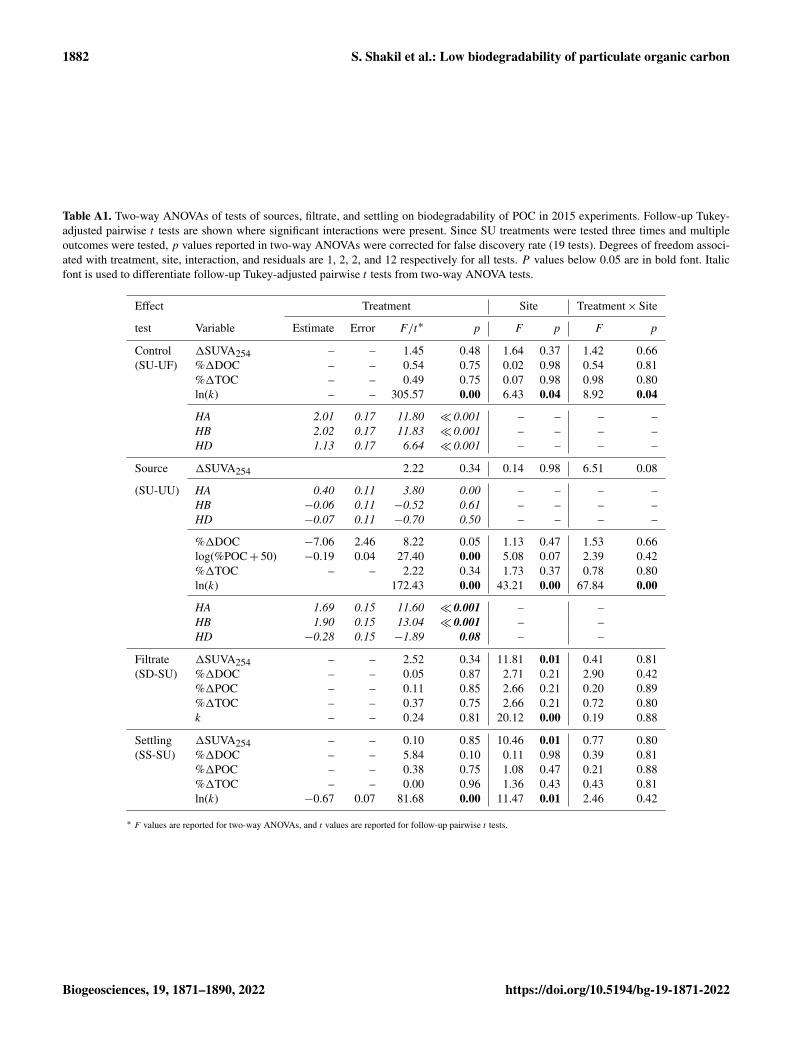
Table A1. Two-way ANOVAs of tests of sources, filtrate, and settling on biodegradability of POC in 2015 experiments. Follow-up Tukey-adjusted pairwise t tests are shown where significant interactions were present. Since SU treatments were tested three times and multipleoutcomes were tested, p values reported in two-way ANOVAs were corrected for false discovery rate (19 tests). Degrees of freedom associ-ated with treatment, site, interaction, and residuals are 1, 2, 2, and 12 respectively for all tests. P values below 0.05 are in bold font. Italicfont is used to differentiate follow-up Tukey-adjusted pairwise t tests from two-way ANOVA tests.
Effect Treatment Site Treatment×Site
test Variable Estimate Error F/t∗ p F p F p
Control 1SUVA254 – – 1.45 0.48 1.64 0.37 1.42 0.66(SU-UF) %1DOC – – 0.54 0.75 0.02 0.98 0.54 0.81
%1TOC – – 0.49 0.75 0.07 0.98 0.98 0.80ln(k) – – 305.57 0.00 6.43 0.04 8.92 0.04
HA 2.01 0.17 11.80 � 0.001 – – – –HB 2.02 0.17 11.83 � 0.001 – – – –HD 1.13 0.17 6.64 � 0.001 – – – –
Source 1SUVA254 2.22 0.34 0.14 0.98 6.51 0.08
(SU-UU) HA 0.40 0.11 3.80 0.00 – – – –HB −0.06 0.11 −0.52 0.61 – – – –HD −0.07 0.11 −0.70 0.50 – – – –
%1DOC −7.06 2.46 8.22 0.05 1.13 0.47 1.53 0.66log(%POC+ 50) −0.19 0.04 27.40 0.00 5.08 0.07 2.39 0.42%1TOC – – 2.22 0.34 1.73 0.37 0.78 0.80ln(k) 172.43 0.00 43.21 0.00 67.84 0.00
HA 1.69 0.15 11.60 � 0.001 – –HB 1.90 0.15 13.04 � 0.001 – –HD −0.28 0.15 −1.89 0.08 – –
Filtrate 1SUVA254 – – 2.52 0.34 11.81 0.01 0.41 0.81(SD-SU) %1DOC – – 0.05 0.87 2.71 0.21 2.90 0.42
%1POC – – 0.11 0.85 2.66 0.21 0.20 0.89%1TOC – – 0.37 0.75 2.66 0.21 0.72 0.80k – – 0.24 0.81 20.12 0.00 0.19 0.88
Settling 1SUVA254 – – 0.10 0.85 10.46 0.01 0.77 0.80(SS-SU) %1DOC – – 5.84 0.10 0.11 0.98 0.39 0.81
%1POC – – 0.38 0.75 1.08 0.47 0.21 0.88%1TOC – – 0.00 0.96 1.36 0.43 0.43 0.81ln(k) −0.67 0.07 81.68 0.00 11.47 0.01 2.46 0.42
∗ F values are reported for two-way ANOVAs, and t values are reported for follow-up pairwise t tests.
Biogeosciences, 19, 1871–1890, 2022 https://doi.org/10.5194/bg-19-1871-2022
S. Shakil et al.: Low biodegradability of particulate organic carbon 1883
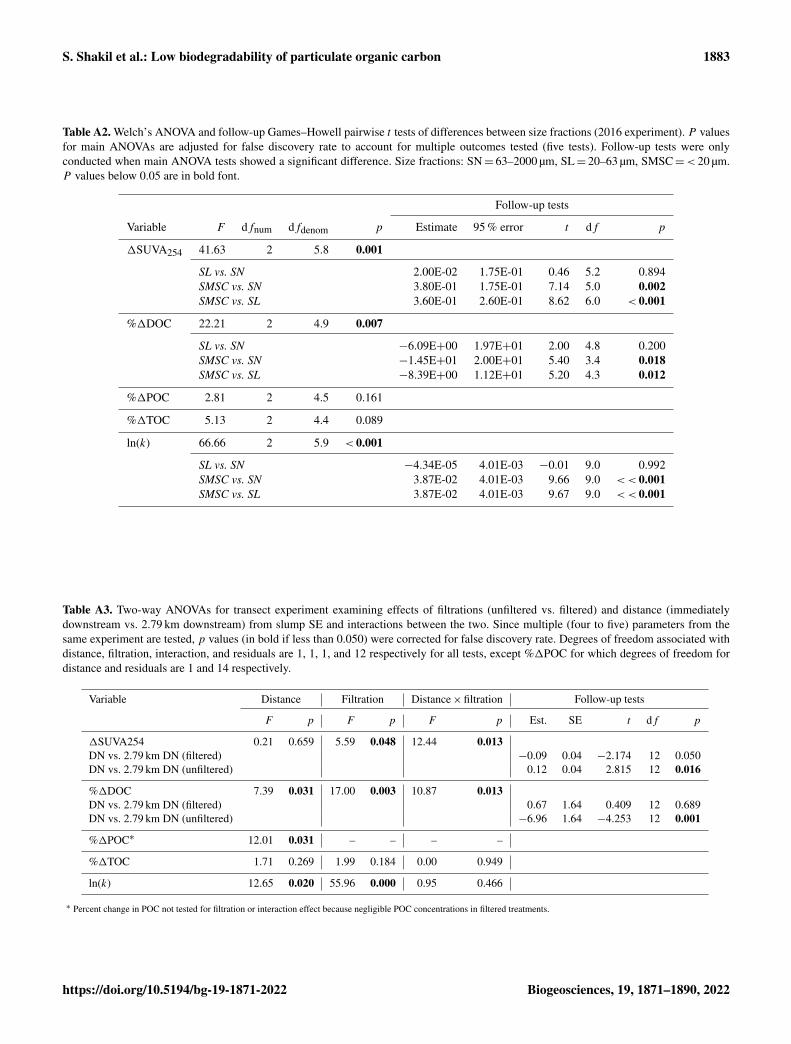
Table A2. Welch’s ANOVA and follow-up Games–Howell pairwise t tests of differences between size fractions (2016 experiment). P valuesfor main ANOVAs are adjusted for false discovery rate to account for multiple outcomes tested (five tests). Follow-up tests were onlyconducted when main ANOVA tests showed a significant difference. Size fractions: SN= 63–2000 µm, SL= 20–63 µm, SMSC=< 20 µm.P values below 0.05 are in bold font.
Follow-up tests
Variable F dfnum dfdenom p Estimate 95 % error t df p
1SUVA254 41.63 2 5.8 0.001
SL vs. SN 2.00E-02 1.75E-01 0.46 5.2 0.894SMSC vs. SN 3.80E-01 1.75E-01 7.14 5.0 0.002SMSC vs. SL 3.60E-01 2.60E-01 8.62 6.0 < 0.001
%1DOC 22.21 2 4.9 0.007
SL vs. SN −6.09E+00 1.97E+01 2.00 4.8 0.200SMSC vs. SN −1.45E+01 2.00E+01 5.40 3.4 0.018SMSC vs. SL −8.39E+00 1.12E+01 5.20 4.3 0.012
%1POC 2.81 2 4.5 0.161
%1TOC 5.13 2 4.4 0.089
ln(k) 66.66 2 5.9 < 0.001
SL vs. SN −4.34E-05 4.01E-03 −0.01 9.0 0.992SMSC vs. SN 3.87E-02 4.01E-03 9.66 9.0 < < 0.001SMSC vs. SL 3.87E-02 4.01E-03 9.67 9.0 < < 0.001
Table A3. Two-way ANOVAs for transect experiment examining effects of filtrations (unfiltered vs. filtered) and distance (immediatelydownstream vs. 2.79 km downstream) from slump SE and interactions between the two. Since multiple (four to five) parameters from thesame experiment are tested, p values (in bold if less than 0.050) were corrected for false discovery rate. Degrees of freedom associated withdistance, filtration, interaction, and residuals are 1, 1, 1, and 12 respectively for all tests, except %1POC for which degrees of freedom fordistance and residuals are 1 and 14 respectively.
Variable Distance Filtration Distance×filtration Follow-up tests
F p F p F p Est. SE t df p
1SUVA254 0.21 0.659 5.59 0.048 12.44 0.013DN vs. 2.79 km DN (filtered) −0.09 0.04 −2.174 12 0.050DN vs. 2.79 km DN (unfiltered) 0.12 0.04 2.815 12 0.016
%1DOC 7.39 0.031 17.00 0.003 10.87 0.013DN vs. 2.79 km DN (filtered) 0.67 1.64 0.409 12 0.689DN vs. 2.79 km DN (unfiltered) −6.96 1.64 −4.253 12 0.001
%1POC∗ 12.01 0.031 – – – –
%1TOC 1.71 0.269 1.99 0.184 0.00 0.949
ln(k) 12.65 0.020 55.96 0.000 0.95 0.466
∗ Percent change in POC not tested for filtration or interaction effect because negligible POC concentrations in filtered treatments.
https://doi.org/10.5194/bg-19-1871-2022 Biogeosciences, 19, 1871–1890, 2022
1884 S. Shakil et al.: Low biodegradability of particulate organic carbon
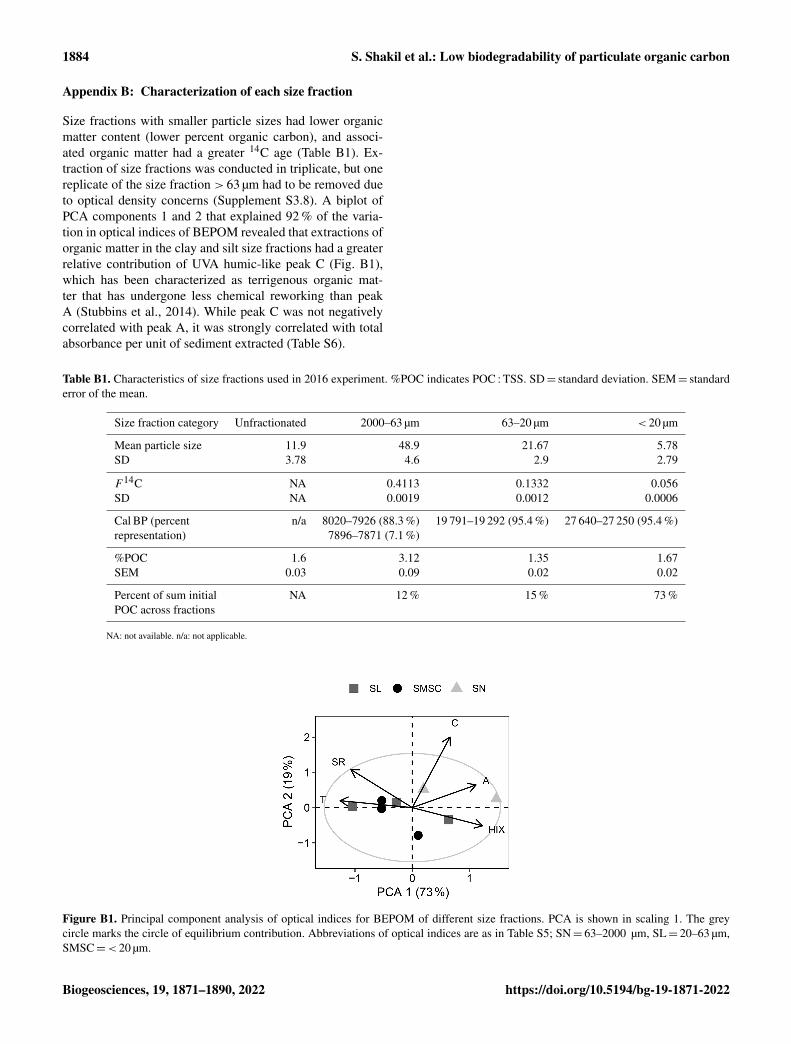
Appendix B: Characterization of each size fraction
Size fractions with smaller particle sizes had lower organicmatter content (lower percent organic carbon), and associ-ated organic matter had a greater 14C age (Table B1). Ex-traction of size fractions was conducted in triplicate, but onereplicate of the size fraction > 63 µm had to be removed dueto optical density concerns (Supplement S3.8). A biplot ofPCA components 1 and 2 that explained 92 % of the varia-tion in optical indices of BEPOM revealed that extractions oforganic matter in the clay and silt size fractions had a greaterrelative contribution of UVA humic-like peak C (Fig. B1),which has been characterized as terrigenous organic mat-ter that has undergone less chemical reworking than peakA (Stubbins et al., 2014). While peak C was not negativelycorrelated with peak A, it was strongly correlated with totalabsorbance per unit of sediment extracted (Table S6).
Table B1. Characteristics of size fractions used in 2016 experiment. %POC indicates POC : TSS. SD= standard deviation. SEM= standarderror of the mean.
Size fraction category Unfractionated 2000–63 µm 63–20 µm < 20 µm
Mean particle size 11.9 48.9 21.67 5.78SD 3.78 4.6 2.9 2.79
F 14C NA 0.4113 0.1332 0.056SD NA 0.0019 0.0012 0.0006
Cal BP (percent n/a 8020–7926 (88.3 %) 19 791–19 292 (95.4 %) 27 640–27 250 (95.4 %)representation) 7896–7871 (7.1 %)
%POC 1.6 3.12 1.35 1.67SEM 0.03 0.09 0.02 0.02
Percent of sum initial NA 12 % 15 % 73 %POC across fractions
NA: not available. n/a: not applicable.
Figure B1. Principal component analysis of optical indices for BEPOM of different size fractions. PCA is shown in scaling 1. The greycircle marks the circle of equilibrium contribution. Abbreviations of optical indices are as in Table S5; SN= 63–2000 µm, SL= 20–63 µm,SMSC=< 20 µm.
Biogeosciences, 19, 1871–1890, 2022 https://doi.org/10.5194/bg-19-1871-2022
S. Shakil et al.: Low biodegradability of particulate organic carbon 1885
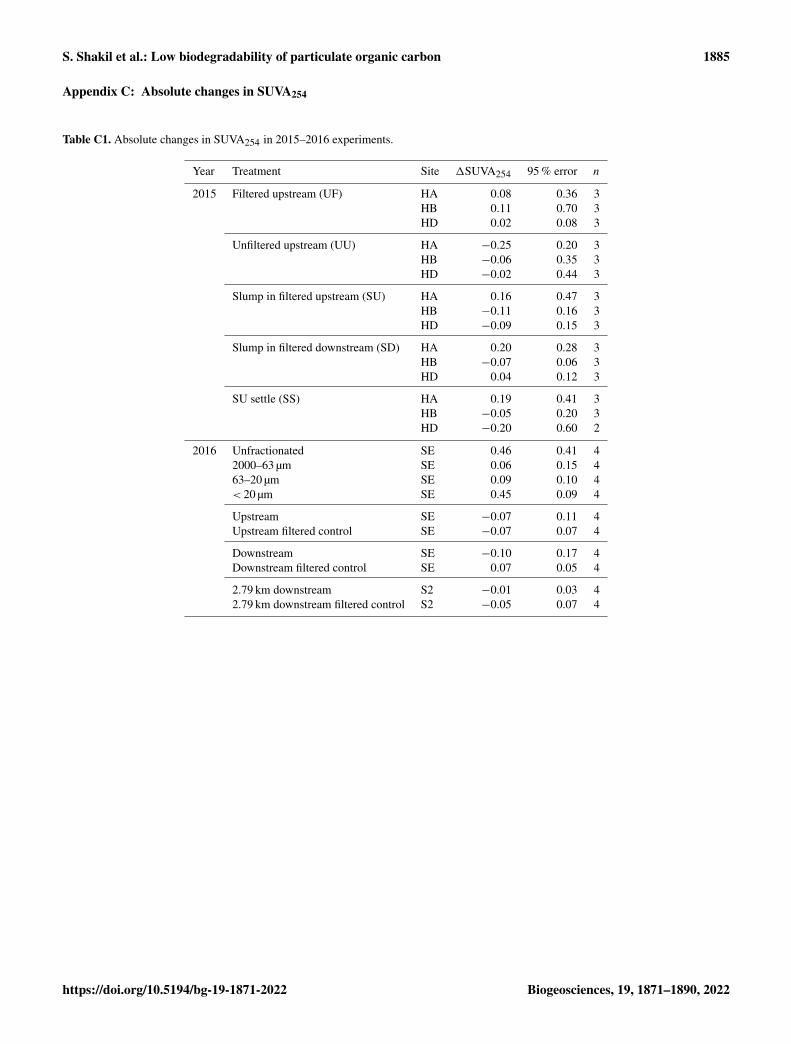
Appendix C: Absolute changes in SUVA254
Table C1. Absolute changes in SUVA254 in 2015–2016 experiments.
Year Treatment Site 1SUVA254 95 % error n
2015 Filtered upstream (UF) HA 0.08 0.36 3HB 0.11 0.70 3HD 0.02 0.08 3
Unfiltered upstream (UU) HA −0.25 0.20 3HB −0.06 0.35 3HD −0.02 0.44 3
Slump in filtered upstream (SU) HA 0.16 0.47 3HB −0.11 0.16 3HD −0.09 0.15 3
Slump in filtered downstream (SD) HA 0.20 0.28 3HB −0.07 0.06 3HD 0.04 0.12 3
SU settle (SS) HA 0.19 0.41 3HB −0.05 0.20 3HD −0.20 0.60 2
2016 Unfractionated SE 0.46 0.41 42000–63 µm SE 0.06 0.15 463–20 µm SE 0.09 0.10 4< 20 µm SE 0.45 0.09 4
Upstream SE −0.07 0.11 4Upstream filtered control SE −0.07 0.07 4
Downstream SE −0.10 0.17 4Downstream filtered control SE 0.07 0.05 4
2.79 km downstream S2 −0.01 0.03 42.79 km downstream filtered control S2 −0.05 0.07 4
https://doi.org/10.5194/bg-19-1871-2022 Biogeosciences, 19, 1871–1890, 2022
1886 S. Shakil et al.: Low biodegradability of particulate organic carbon
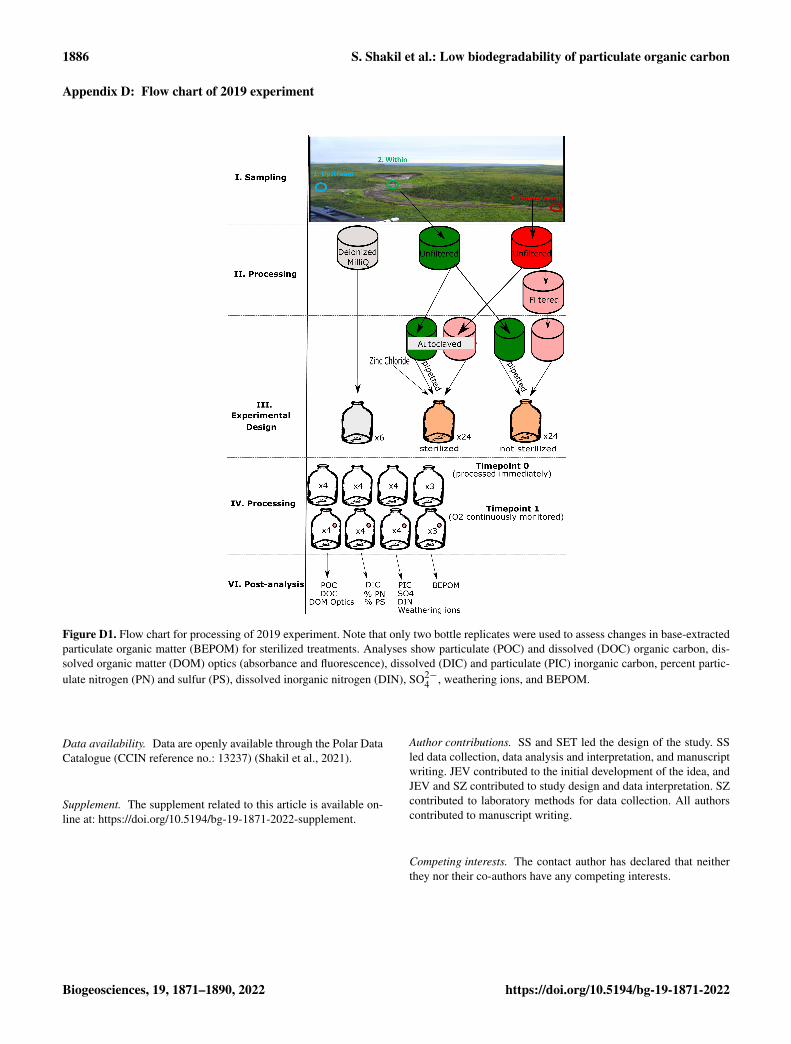
Appendix D: Flow chart of 2019 experiment
Figure D1. Flow chart for processing of 2019 experiment. Note that only two bottle replicates were used to assess changes in base-extractedparticulate organic matter (BEPOM) for sterilized treatments. Analyses show particulate (POC) and dissolved (DOC) organic carbon, dis-solved organic matter (DOM) optics (absorbance and fluorescence), dissolved (DIC) and particulate (PIC) inorganic carbon, percent partic-ulate nitrogen (PN) and sulfur (PS), dissolved inorganic nitrogen (DIN), SO2−
4 , weathering ions, and BEPOM.
Data availability. Data are openly available through the Polar DataCatalogue (CCIN reference no.: 13237) (Shakil et al., 2021).
Supplement. The supplement related to this article is available on-line at: https://doi.org/10.5194/bg-19-1871-2022-supplement.
Author contributions. SS and SET led the design of the study. SSled data collection, data analysis and interpretation, and manuscriptwriting. JEV contributed to the initial development of the idea, andJEV and SZ contributed to study design and data interpretation. SZcontributed to laboratory methods for data collection. All authorscontributed to manuscript writing.
Competing interests. The contact author has declared that neitherthey nor their co-authors have any competing interests.
Biogeosciences, 19, 1871–1890, 2022 https://doi.org/10.5194/bg-19-1871-2022
S. Shakil et al.: Low biodegradability of particulate organic carbon 1887
Disclaimer. Publisher’s note: Copernicus Publications remainsneutral with regard to jurisdictional claims in published maps andinstitutional affiliations.
Acknowledgements. This work took place within the Gwich’in Set-tlement Region, and we are thankful for support from the TetlitGwich’in Renewable Resources Council and Western Arctic Re-search Centre. We are further thankful for the field assistance ofChristine Firth, Elizabeth Jerome, Andrew Koe, Joyce Kendon,Maya Guttman, Luke Gjini, and Lindsay Stephen. Maya Guttmanand Joyce Kendon also helped experiment set-up and sample pro-cessing. Hailey Verbonac assisted with O2 measurements duringour 2015 experiments conducted in Inuvik. This paper also bene-fitted from helpful discussions with Steve Kokelj with regards tofield sampling and perspectives on landscape changes in the region,Matthias Koschorreck and Rafael Marcé with regards to chemoau-totrophic processes, and Alex Wolfe who first provided advice tobroaden consideration of what affects oxygen and carbon dynamics.The rotator used for incubations was designed and manufactured bytechnical services staff in the Department of Mechanical Engineer-ing at the University of Alberta, supervised by Roger Marchand.Funding for this study was provided by the Natural Sciences andEngineering Research Council (NSERC), Polar Continental ShelfProgram (Natural Resources Canada), Campus Alberta InnovatesProgram, ArcticNet, CICan Cleantech Internship Program, Envi-ronment Canada Science Youth Horizons Internship, Northern Sci-entific Training Program, University of Alberta and UAlberta North,and the Aurora Research Institute. Personal support to Sarah Shakilwas provided by NSERC and the Garfield Weston Foundation. Re-search for this paper was conducted under NWT research licences15685 (2015), 15685 (2016), 15887 (2017), and 16575 (2019).
Financial support. This research has been supported by the Nat-ural Sciences and Engineering Research Council of Canada (grantnos. 430696, 444873, CGS-M, CGS-D, and USRA), the Aurora Re-search Institute (Aurora Research Fellowship grant), the W. GarfieldWeston Foundation (MSc Northern Research Scholarship grant),the University of Alberta (U of A Northern Research Awardgrant), the Environment Canada (Science Youth Horizons Intern-ship GCXE16S064 and Cleantech Internship grant), the Arctic In-stitute of North America (Grant-in-Aid grant), and the ArcticNet(project #13 grant), the Polar Continental Shelf Program (Natu-ral Resources Canada) and the Campus Alberta Innovates Program(University of Alberta).
Review statement. This paper was edited by Nicolas Brüggemannand reviewed by two anonymous referees.
References
Abbott, B. W., Larouche, J. R., Jones, J. B., Bowden, W.B., and Balser, A. W.: Elevated dissolved organic car-bon biodegradability from thawing and collapsing per-mafrost, J. Geophys. Res.-Biogeo., 119, 2049–2063,https://doi.org/10.1002/2014JG002678, 2014.
Attermeyer, K., Catalán, N., Einarsdottir, K., Freixa, A.,Groeneveld, M., Hawkes, J. A., Bergquist, J., and Tran-vik, L. J.: Organic Carbon Processing During Trans-port Through Boreal Inland Waters: Particles as Impor-tant Sites, J. Geophys. Res.-Biogeo., 123, 2412–2428,https://doi.org/10.1029/2018JG004500, 2018.
Berggren, M., Lapierre, J.-F., and del Giorgio, P. A.: Magni-tude and regulation of bacterioplankton respiratory quotientacross freshwater environmental gradients, ISME J., 6, 984–993,https://doi.org/10.1038/ismej.2011.157, 2012.
Bock, E. and Wagner, M.: Oxidation of Inorganic Nitrogen Com-pounds as an Energy Source, in: The Prokaryotes, edited by:Rosenberg, E., DeLong, E. F., Lory, S., Stackebrandt, E., andThompson, F., Springer Berlin Heidelberg, Berlin, Heidelberg,83–118, https://doi.org/10.1007/978-3-642-30141-4_64, 2013.
Bröder, L., Keskitalo, K., Zolkos, S., Shakil, S., Tank, S. E.,Kokelj, S. V., Tesi, T., van Dongen, B. E., Haghipour, N., Eglin-ton, T. I., and Vonk, J. E.: Preferential export of permafrost-derived organic matter as retrogressive thaw slumping intensifies,Environ. Res. Lett., 16, 054059, https://doi.org/10.1088/1748-9326/abee4b, 2021.
Burd, K., Estop-Aragonés, C., Tank, S. E., and Olefeldt, D.: Labilityof dissolved organic carbon from boreal peatlands: interactionsbetween permafrost thaw, wildfire, and season, Can. J. Soil Sci.,100, 1–13, https://doi.org/10.1139/cjss-2019-0154, 2020.
Calmels, D., Gaillardet, J., Brenot, A., and France-Lanord, C.:Sustained sulfide oxidation by physical erosion processes inthe Mackenzie River basin: Climatic perspectives, Geology, 35,1003, https://doi.org/10.1130/G24132A.1, 2007.
Coble, P. G.: Marine Optical Biogeochemistry: The Chemistry ofOcean Color, Chem. Rev., 107, 402–418, 2007.
Duk-Rodkin, A. and Hughes, O. L.: Surficial geology, FortMcPherson-Bell River, Yukon-Northwest Territories, Geol. Surv.Can., Series Map 1745A, https://doi.org/10.4095/184002, 1992.
Groeneveld, M., Catalán, N., Attermeyer, K., Hawkes, J., Einars-dóttir, K., Kothawala, D., Bergquist, J., and Tranvik, L.:Selective Adsorption of Terrestrial Dissolved Organic Mat-ter to Inorganic Surfaces Along a Boreal Inland WaterContinuum, J. Geophys. Res.-Biogeo., 125, e2019JG005236,https://doi.org/10.1029/2019JG005236, 2020.
Helms, J. R., Stubbins, A., Ritchie, J. D., Minor, E. C., Kieber, D.J., and Mopper, K.: Absorption spectral slopes and slope ratiosas indicators of molecular weight, source, and photobleaching ofchromophoric dissolved organic matter, Limnol. Oceanogr., 53,955–969, https://doi.org/10.4319/lo.2008.53.3.0955, 2008.
Hemingway, J. D., Rothman, D. H., Grant, K. E., Rosengard, S. Z.,Eglinton, T. I., Derry, L. A., and Galy, V. V.: Mineral protectionregulates long-term global preservation of natural organic car-bon, Nature, 570, 228–231, https://doi.org/10.1038/s41586-019-1280-6, 2019.
Hugelius, G., Strauss, J., Zubrzycki, S., Harden, J. W., Schuur, E.A. G., Ping, C.-L., Schirrmeister, L., Grosse, G., Michaelson, G.J., Koven, C. D., O’Donnell, J. A., Elberling, B., Mishra, U.,Camill, P., Yu, Z., Palmtag, J., and Kuhry, P.: Estimated stocksof circumpolar permafrost carbon with quantified uncertaintyranges and identified data gaps, Biogeosciences, 11, 6573–6593,https://doi.org/10.5194/bg-11-6573-2014, 2014.
Huguet, A., Vacher, L., Relexans, S., Saubusse, S., Froidefond, J.M., and Parlanti, E.: Properties of fluorescent dissolved organic
https://doi.org/10.5194/bg-19-1871-2022 Biogeosciences, 19, 1871–1890, 2022
1888 S. Shakil et al.: Low biodegradability of particulate organic carbon
matter in the Gironde Estuary, Org. Geochem., 40, 706–719,https://doi.org/10.1016/j.orggeochem.2009.03.002, 2009.
Keskitalo, K. H., Bröder, L., Shakil, S., Zolkos, S., Tank, S. E., vanDongen, B. E., Tesi, T., Haghipour, N., Eglinton, T. I., Kokelj, S.V., and Vonk, J. E.: Downstream Evolution of Particulate OrganicMatter Composition From Permafrost Thaw Slumps, Front.Earth Sci., 9, 181, https://doi.org/10.3389/feart.2021.642675,2021.
Klatt, J. M. and Polerecky, L.: Assessment of the stoi-chiometry and efficiency of CO2 fixation coupled toreduced sulfur oxidation, Front. Microbiol., 6, 484,https://doi.org/10.3389/fmicb.2015.00484, 2015.
Kokelj, S. V., Kokoszka, J., van der Sluijs, J., Rudy, A. C. A.,Tunnicliffe, J., Shakil, S., Tank, S. E., and Zolkos, S.: Thaw-driven mass wasting couples slopes with downstream systems,and effects propagate through Arctic drainage networks, TheCryosphere, 15, 3059–3081, https://doi.org/10.5194/tc-15-3059-2021, 2021.
Kothawala, D. N., Kellerman, A. M., Catalán, N., and Tranvik, L. J.:Organic Matter Degradation across Ecosystem Boundaries: TheNeed for a Unified Conceptualization, Trends Ecol. Evol., 36,113–122, https://doi.org/10.1016/j.tree.2020.10.006, 2021.
Lacelle, D., Fontaine, M., Pellerin, A., Kokelj, S. V., and Clark,I. D.: Legacy of Holocene Landscape Changes on Soil Biogeo-chemistry: A Perspective From Paleo-Active Layers in North-western Canada, J. Geophys. Res.-Biogeo., 124, 2662–2679,https://doi.org/10.1029/2018JG004916, 2019.
Lenth, R. V.: emmeans: Estimated Marginal Means, aka Least-Squares Means. R package version 1.6.0, https://CRAN.R-project.org/package=emmeans, last access: 1 June 2021.
Leewis, M.-C., Berlemont, R., Podgorski, D. C., Srinivas, A.,Zito, P., Spencer, R. G. M., McFarland, J., Douglas, T. A.,Conaway, C. H., Waldrop, M., and Mackelprang, R.: Life at theFrozen Limit: Microbial Carbon Metabolism Across a Late Pleis-tocene Permafrost Chronosequence, Front. Microbiol., 11, 1753,https://doi.org/10.3389/fmicb.2020.01753, 2020.
Li, Y., Wu, Z., Dong, X., Xu, Z., Zhang, Q., Su, H., Jia, Z., andSun, Q.: Pyrite oxidization accelerates bacterial carbon seques-tration in copper mine tailings, Biogeosciences, 16, 573–583,https://doi.org/10.5194/bg-16-573-2019, 2019.
Littlefair, C. A. and Tank, S. E.: Biodegradability ofThermokarst Carbon in a Till-Associated, Glacial Mar-gin Landscape: The Case of the Peel Plateau, NWT,Canada, J. Geophys. Res.-Biogeo., 123, 3293–3307,https://doi.org/10.1029/2018JG004461, 2018.
Littlefair, C. A., Tank, S. E., and Kokelj, S. V.: Retrogressive thawslumps temper dissolved organic carbon delivery to streams ofthe Peel Plateau, NWT, Canada, Biogeosciences, 14, 5487–5505,https://doi.org/10.5194/bg-14-5487-2017, 2017.
Mann, P. J., Eglinton, T. I., McIntyre, C. P., Zimov, N., Davy-dova, A., Vonk, J. E., Holmes, R. M., and Spencer, R.G. M.: Utilization of ancient permafrost carbon in head-waters of Arctic fluvial networks, Nat. Commun., 6, 7856,https://doi.org/10.1038/ncomms8856, 2015.
Nelson, D. C., Jørgensen, B. B., and Revsbech, N. P.: Growth Pat-tern and Yield of a Chemoautotrophic Beggiatoa sp. in Oxygen-Sulfide Microgradients, Appl. Environ. Microbiol., 52, 225–233,1986.
Norris, D. K.: Geology of the Northern Yukon and NorthwesternDistrict of Mackenzie Ottawa, Canada, Geol. Surv. Can., SeriesMap 1581A, https://doi.org/10.4095/120537, 1985.
Ohno, T.: Fluorescence Inner-Filtering Correction for Determiningthe Humification Index of Dissolved Organic Matter, Environ.Sci. Technol., 36, 742–746, https://doi.org/10.1021/es0155276,2002.
Olefeldt, D., Goswami, S., Grosse, G., Hayes, D., Hugelius, G.,Kuhry, P., McGuire, A. D., Romanovsky, V. E., Sannel, A. B. K.,Schuur, E. A. G., and Turetsky, M. R.: Circumpolar distributionand carbon storage of thermokarst landscapes, Nat. Commun., 7,13043, https://doi.org/10.1038/ncomms13043, 2016.
Opfergelt, S.: The next generation of climate model shouldaccount for the evolution of mineral-organic interactionswith permafrost thaw, Environ. Res. Lett., 15, 091003,https://doi.org/10.1088/1748-9326/ab9a6d, 2020.
Osburn, C. L., Handsel, L. T., Mikan, M. P., Paerl, H. W.,and Montgomery, M. T.: Fluorescence Tracking of Dis-solved and Particulate Organic Matter Quality in a River-Dominated Estuary, Environ. Sci. Technol., 46, 8628–8636,https://doi.org/10.1021/es3007723, 2012.
Percak-Dennett, E., He, S., Converse, B., Konishi, H., Xu, H., Cor-coran, A., Noguera, D., Chan, C., Bhattacharyya, A., Borch, T.,Boyd, E., and Roden, E. E.: Microbial acceleration of aerobicpyrite oxidation at circumneutral pH, Geobiology, 15, 690–703,https://doi.org/10.1111/gbi.12241, 2017.
Peter, S., Isidorova, A., and Sobek, S.: Enhanced carbon lossfrom anoxic lake sediment through diffusion of dissolvedorganic carbon, J. Geophys. Res.-Biogeo., 121, 1959–1977,https://doi.org/10.1002/2016JG003425, 2016.
Poulin, B. A., Ryan, J. N., and Aiken, G. R.: Effects of Iron on Op-tical Properties of Dissolved Organic Matter, Environ. Sci. Tech-nol., 48, 10098–10106, https://doi.org/10.1021/es502670r, 2014.
Richardson, D. C., Newbold, J. D., Aufdenkampe, A. K., Taylor, P.G., and Kaplan, L. A.: Measuring heterotrophic respiration ratesof suspended particulate organic carbon from stream ecosystems:Measuring respiration rates of POC, Limnol. Oceanogr. Meth-ods, 11, 247–261, https://doi.org/10.4319/lom.2013.11.247,2013.
Schädel, C., Bader, M. K.-F., Schuur, E. A. G., Biasi, C., Bra-cho, R., Capek, P., De Baets, S., Diáková, K., Ernakovich,J., Estop-Aragones, C., Graham, D. E., Hartley, I. P., Iversen,C. M., Kane, E., Knoblauch, C., Lupascu, M., Martikainen,P. J., Natali, S. M., Norby, R. J., O’Donnell, J. A., Chowd-hury, T. R., Šantrucková, H., Shaver, G., Sloan, V. L., Treat,C. C., Turetsky, M. R., Waldrop, M. P., and Wickland, K.P.: Potential carbon emissions dominated by carbon dioxidefrom thawed permafrost soils, Nat. Clim. Change, 6, 950–953,https://doi.org/10.1038/nclimate3054, 2016.
Schuur, E. A. G., McGuire, A. D., Schädel, C., Grosse, G., Harden,J. W., Hayes, D. J., Hugelius, G., Koven, C. D., Kuhry, P.,Lawrence, D. M., Natali, S. M., Olefeldt, D., Romanovsky, V. E.,Schaefer, K., Turetsky, M. R., Treat, C. C., and Vonk, J. E.: Cli-mate change and the permafrost carbon feedback, Nature, 520,171–179, https://doi.org/10.1038/nature14338, 2015.
Segal, R. A., Lantz, T. C., and Kokelj, S. V.: Accelera-tion of thaw slump activity in glaciated landscapes of theWestern Canadian Arctic, Environ. Res. Lett., 11, 034025,https://doi.org/10.1088/1748-9326/11/3/034025, 2016.
Biogeosciences, 19, 1871–1890, 2022 https://doi.org/10.5194/bg-19-1871-2022
S. Shakil et al.: Low biodegradability of particulate organic carbon 1889
Shakil, S., Tank, S. E., Kokelj, S. V., Vonk, J. E., and Zolkos,S.: Particulate dominance of organic carbon mobilization fromthaw slumps on the Peel Plateau, NT: Quantification and im-plications for stream systems and permafrost carbon release,Environ. Res. Lett., 15, 114019, https://doi.org/10.1088/1748-9326/abac36, 2020.
Shakil, S., Tank, S., Vonk, J., and Zolkos, S.: Incubation Data As-sessing Biodegradability of Organic Carbon Mobilized from Per-mafrost Thaw Slumps (Peel Plateau, NT, Canada), Waterloo,Canada: Canadian Cryospheric Information Network (CCIN),https://doi.org/10.21963/13237, 2021.
Sinha, B. and Annachhatre, A. P.: Partial nitrification – opera-tional parameters and microorganisms involved, Rev. Environ.Sci. Biotechnol., 6, 285–313, https://doi.org/10.1007/s11157-006-9116-x, 2007.
Spencer, R. G. M., Mann, P. J., Dittmar, T., Eglinton, T. I., McIn-tyre, C., Holmes, R. M., Zimov, N., and Stubbins, A.: Detectingthe signature of permafrost thaw in Arctic rivers, Geophys. Res.Lett., 42, 2830–2835, https://doi.org/10.1002/2015GL063498,2015.
Spona-Friedl, M., Braun, A., Huber, C., Eisenreich, W., Griebler,C., Kappler, A., and Elsner, M.: Substrate-dependentCO2 fixation in heterotrophic bacteria revealed by sta-ble isotope labelling, FEMS Microbiol. Ecol., 96, fiaa080,https://doi.org/10.1093/femsec/fiaa080, 2020.
Stolper, D. A., Revsbech, N. P., and Canfield, D. E.: Aerobic growthat nanomolar oxygen concentrations, P. Natl. Acad. Sci. USA,107, 18755–18760, https://doi.org/10.1073/pnas.1013435107,2010.
Stumm, W. and Morgan, J. J.: Aquatic Chemistry: Chemical Equi-libria and Rates in Natural Waters, John Wiley & Sons, 884 pp.,ISBN 978-0-471-51185-4, 2012.
Tank, S. E., Vonk, J. E., Walvoord, M. A., McClelland, J. W., Lau-rion, I., and Abbott, B. W.: Landscape matters: Predicting thebiogeochemical effects of permafrost thaw on aquatic networkswith a state factor approach, Permafr. Periglac. Process., 31, 358–370, https://doi.org/10.1002/ppp.2057, 2020.
Tanski, G., Lantuit, H., Ruttor, S., Knoblauch, C., Radosavl-jevic, B., Strauss, J., Wolter, J., Irrgang, A. M., Ram-age, J., and Fritz, M.: Transformation of terrestrial or-ganic matter along thermokarst-affected permafrost coastsin the Arctic, Sci. Total Environ., 581/582, 434–447,https://doi.org/10.1016/j.scitotenv.2016.12.152, 2017.
Tanski, G., Wagner, D., Knoblauch, C., Fritz, M., Sachs, T.,and Lantuit, H.: Rapid CO2 Release From Eroding Per-mafrost in Seawater, Geophys. Res. Lett., 46, 11244–11252,https://doi.org/10.1029/2019GL084303, 2019.
Tesi, T., Semiletov, I., Dudarev, O., Andersson, A., and Gustafs-son, Ö.: Matrix association effects on hydrodynamic sorting anddegradation of terrestrial organic matter during cross-shelf trans-port in the Laptev and East Siberian shelf seas, J. Geophys. Res.-Biogeo., 121, 731–752, https://doi.org/10.1002/2015JG003067,2016.
Turetsky, M. R., Abbott, B. W., Jones, M. C., Anthony, K. W., Ole-feldt, D., Schuur, E. A. G., Grosse, G., Kuhry, P., Hugelius, G.,Koven, C., Lawrence, D. M., Gibson, C., Sannel, A. B. K., andMcGuire, A. D.: Carbon release through abrupt permafrost thaw,Nat. Geosci., 13, 138–143, https://doi.org/10.1038/s41561-019-0526-0, 2020.
Vachon, D., Sadro, S., Bogard, M. J., Lapierre, J.-F., Baulch,H. M., Rusak, J. A., Denfeld, B. A., Laas, A., Klaus, M.,Karlsson, J., Weyhenmeyer, G. A., and Giorgio, P. A. del:Paired O2–CO2 measurements provide emergent insights intoaquatic ecosystem function, Limnol. Oceanogr. Lett., 5, 287–294, https://doi.org/10.1002/lol2.10135, 2020.
Vonk, J. E., Mann, P. J., Davydov, S., Davydova, A., Spencer, R. G.M., Schade, J., Sobczak, W. V., Zimov, N., Zimov, S., Bulygina,E., Eglinton, T. I., and Holmes, R. M.: High biolability of ancientpermafrost carbon upon thaw, Geophys. Res. Lett., 40, 2689–2693, https://doi.org/10.1002/grl.50348, 2013.
Vonk, J. E., Tank, S. E., Mann, P. J., Spencer, R. G. M., Treat,C. C., Striegl, R. G., Abbott, B. W., and Wickland, K. P.:Biodegradability of dissolved organic carbon in permafrost soilsand aquatic systems: a meta-analysis, Biogeosciences, 12, 6915–6930, https://doi.org/10.5194/bg-12-6915-2015, 2015a.
Vonk, J. E., Tank, S. E., Bowden, W. B., Laurion, I., Vincent, W.F., Alekseychik, P., Amyot, M., Billet, M. F., Canário, J., Cory,R. M., Deshpande, B. N., Helbig, M., Jammet, M., Karlsson,J., Larouche, J., MacMillan, G., Rautio, M., Walter Anthony, K.M., and Wickland, K. P.: Reviews and syntheses: Effects of per-mafrost thaw on Arctic aquatic ecosystems, Biogeosciences, 12,7129–7167, https://doi.org/10.5194/bg-12-7129-2015, 2015b.
Ward, B. B.: Nitrification, in: Encyclopedia of Ecology, Elsevier,351–358, https://doi.org/10.1016/B978-0-12-409548-9.00697-7,2013.
Weishaar, J. L., Aiken, G. R., Bergamaschi, B. A., Fram, M. S.,Fujii, R., and Mopper, K.: Evaluation of Specific Ultraviolet Ab-sorbance as an Indicator of the Chemical Composition and Reac-tivity of Dissolved Organic Carbon, Environ. Sci. Technol., 37,4702–4708, https://doi.org/10.1021/es030360x, 2003.
Wickland, K. P., Waldrop, M. P., Aiken, G. R., Koch, J. C., Jor-genson, M. T., and Striegl, R. G.: Dissolved organic carbon andnitrogen release from boreal Holocene permafrost and season-ally frozen soils of Alaska, Environ. Res. Lett., 13, 065011,https://doi.org/10.1088/1748-9326/aac4ad, 2018.
Wologo, E., Shakil, S., Zolkos, S., Textor, S., Ewing, S., Klassen, J.,Spencer, R. G. M., Podgorski, D. C., Tank, S. E., Baker, M. A.,O’Donnell, J. A., Wickland, K. P., Foks, S. S. W., Zarnetske, J.P., Lee-Cullin, J., Liu, F., Yang, Y., Kortelainen, P., Kolehmainen,J., Dean, J. F., Vonk, J. E., Holmes, R. M., Pinay, G., Powell, M.M., Howe, J., Frei, R. J., Bratsman, S. P., and Abbott, B. W.:Stream Dissolved Organic Matter in Permafrost Regions ShowsSurprising Compositional Similarities but Negative Priming andNutrient Effects, Global Biogeochem. Cy., 35, e2020GB006719,https://doi.org/10.1029/2020GB006719, 2021.
Zar, J. H.: Biostatistical Analysis, 5th Edn., Prentice Hall, UpperSaddle River, N.J., 944 pp., ISBN 9780131008465, 2010.
Zolkos, S. and Tank, S. E.: Experimental Evidence That PermafrostThaw History and Mineral Composition Shape Abiotic CarbonCycling in Thermokarst-Affected Stream Networks, Front. EarthSci., 8, 152, https://doi.org/10.3389/feart.2020.00152, 2020.
Zolkos, S., Tank, S. E., and Kokelj, S. V.: Mineral Weathering andthe Permafrost Carbon-Climate Feedback, Geophys. Res. Lett.,45, 9623–9632, https://doi.org/10.1029/2018GL078748, 2018.
Zolkos, S., Tank, S. E., Striegl, R. G., and Kokelj,S. V.: Thermokarst Effects on Carbon Dioxide andMethane Fluxes in Streams on the Peel Plateau (NWT,
https://doi.org/10.5194/bg-19-1871-2022 Biogeosciences, 19, 1871–1890, 2022
1890 S. Shakil et al.: Low biodegradability of particulate organic carbon
Canada), J. Geophys. Res.-Biogeo., 124, 1781–1798,https://doi.org/10.1029/2019JG005038, 2019.
Zolkos, S., Tank, S. E., Striegl, R. G., Kokelj, S. V., Kokoszka, J.,Estop-Aragonés, C., and Olefeldt, D.: Thermokarst amplifies flu-vial inorganic carbon cycling and export across watershed scaleson the Peel Plateau, Canada, Biogeosciences, 17, 5163–5182,https://doi.org/10.5194/bg-17-5163-2020, 2020.
Biogeosciences, 19, 1871–1890, 2022 https://doi.org/10.5194/bg-19-1871-2022
Related Documents