Loss of NHE3 alters gut microbiota composition and influences Bacteroides thetaiotaomicron growth Melinda A. Engevik, 1,3 Eitaro Aihara, 1,3 Marshall H. Montrose, 1,3 Gary E. Shull, 2,3 Daniel J. Hassett, 2 and Roger T. Worrell 1,3 Departments of 1 Molecular and Cellular Physiology and 2 Molecular Genetics, Biochemistry and Microbiology, University of Cincinnati College of Medicine, Cincinnati; 3 Digestive Health Center of Cincinnati Children’s Hospital, Cincinnati, Ohio Submitted 14 June 2013; accepted in final form 20 September 2013 Engevik MA, Aihara E, Montrose MH, Shull GE, Hassett DJ, Worrell RT. Loss of NHE3 alters gut microbiota composition and influences Bacteroides thetaiotaomicron growth. Am J Physiol Gas- trointest Liver Physiol 305: G697–G711, 2013. First published Sep- tember 26, 2013; doi:10.1152/ajpgi.00184.2013.—Changes in the intestinal microbiota have been linked to diabetes, obesity, inflamma- tory bowel disease, and Clostridium difficile (C. difficile)-associated disease. Despite this, it remains unclear how the intestinal environ- ment, set by ion transport, affects luminal and mucosa-associated bacterial composition. Na /H -exchanger isoform 3 (NHE3), a target of C. difficile toxin B, plays an integral role in intestinal Na absorption. Thus the NHE3-deficient mouse model was chosen to examine the effect of pH and ion composition on bacterial growth. We hypothesized that ion transport-induced change in the intestinal envi- ronment would lead to alteration of the microbiota. Region-specific changes in ion composition and pH correlated with region-specific alteration of luminal and mucosal-associated bacteria with general decreases in Firmicutes and increases in Bacteroidetes members. Bacteroides thetaiotaomicron (B. thetaiotaomicron) increased in NHE3 / terminal ileum and was examined in vitro to determine whether altered Na was sufficient to affect growth. Increased in vitro growth of B. thetaiotaomicron occurred in 43 mM Na correlating with the NHE3 / mouse terminal ileum [Na ]. NHE3 / terminal ileum displayed increased fut2 mRNA and fucosylation correlating with B. thetaiotaomicron growth. Inoculation of B. thetaiotaomicron in wild-type and NHE3 / terminal ileum organoids displayed in- creased fut2 and fucosylation, indicating that B. thetaiotaomicron alone is sufficient for the increased fucosylation seen in vivo. These data demonstrate that loss of NHE3 alters the intestinal environment, leading to region-specific changes in bacteria, and shed light on the growth requirements of some gut microbiota members, which is vital for creating better treatments of complex diseases with an altered gut microbiota. Na /H -exchanger isoform 3; Clostridium difficile; Bacteroides thetaiotaomicron; fucosylation; ileum THE ALTERATION OF NORMAL GUT microbiota is known to play a role in a variety of complex diseases, such as obesity (2, 3, 51, 52, 84, 85, 86), diabetes (9, 47), inflammatory bowel disease (28, 30, 56, 68, 70), antibiotic-associated diarrhea (92), and Clostridium difficile (C. difficile)-associated disease (14). These complex diseases are increasing in frequency and are associated with significant health care costs. Although these diseases each demonstrate dramatic shifts in the gut microbiota at the phylum level, it remains mechanistically unclear how certain bacterial groups are able to proliferate and maintain an altered composition. It is well documented that changes in the gut microbiota are able to impact epithelial ion transport (8, 21, 53, 54). However, little is known about the effect of epithelial ion transport processes on the intestinal microbiota. Ion trans- porters are expressed in distinctive patterns based on their intestinal location and are required for maintaining intestinal homeostasis (80). Likewise, microbiota composition varies in total number and species representation along the intestinal length (6). An understanding of the relationship of ion trans- port status to the microbiota is important for a clear under- standing of regional microbiota changes. Transporter-null mouse models offer the unique ability to examine the microbial populations and epithelial cross-talk along the length of the intestine. We have used the Na /H - exchanger isoform 3 null (NHE3 / ) mouse model to access region-specific bacterial changes in the intestine (72). NHE3 plays a critical role in intestinal sodium, water absorption, and pH regulation (31, 72). Due to decreased sodium and water absorption and H secretion, NHE3 / mice have an enlarged cecum and colon and exhibit alkaline diarrhea (72). This particular mouse model is clinically relevant in that the patho- gen C. difficile is responsible for the majority of antibiotic- associated diarrhea (23). C. difficile interacts with the mucus layer (19, 81) and delivers two exotoxins, toxin A (TcdA) and toxin B (TcdB) (23, 44, 88). These toxins result in glucosyla- tion of Rho family GTPases, resulting in disorganization of the host cell cytoskeleton (19) and internalization of the NHE3 (36), which leads to subsequent diarrhea. C. difficile infection has also been shown to produce an altered microbiota compo- sition (14, 92). The clinical relevance of C. difficile infection highlights the importance of looking more in depth into how ion transport affects the gut microbiota. We hypothesized that the intestinal bacterial composition of NHE3 / mice is changed in response to an altered microen- vironment. Our research focused on examination of both lu- minal and mucosa-associated bacterial populations along the length of the intestine and identifies specific patterns of bacte- rial populations in each region. These populations correlated with both environmental and epithelial changes. Although these changes are likely many, herein we focus on one exam- ple, Bacteroides thetaiotaomicron (B. thetaiotaomicron). B. thetaiotaomicron proliferation in the NHE3 / terminal ileum appears to be driven by a sodium concentration optimum (43 mM) and maintained by increased host fut2 mRNA and fuco- sylation. Together, our data link changes in ion composition and pH, as a result of altered ion transport, to changes in bacterial composition. We demonstrate that NHE3 / mice exhibit an altered intestinal microbiota and with region-specific changes. Address for reprint requests and other correspondence: R. T. Worrell, Dept. of Molecular and Cellular Physiology, Univ. of Cincinnati College of Medi- cine, Cincinnati, OH 45267 (e-mail: [email protected]). Am J Physiol Gastrointest Liver Physiol 305: G697–G711, 2013. First published September 26, 2013; doi:10.1152/ajpgi.00184.2013. 0193-1857/13 Copyright © 2013 the American Physiological Society http://www.ajpgi.org G697

Welcome message from author
This document is posted to help you gain knowledge. Please leave a comment to let me know what you think about it! Share it to your friends and learn new things together.
Transcript
Loss of NHE3 alters gut microbiota composition and influences Bacteroidesthetaiotaomicron growth
Melinda A. Engevik,1,3 Eitaro Aihara,1,3 Marshall H. Montrose,1,3 Gary E. Shull,2,3 Daniel J. Hassett,2
and Roger T. Worrell1,3
Departments of 1Molecular and Cellular Physiology and 2Molecular Genetics, Biochemistry and Microbiology, University ofCincinnati College of Medicine, Cincinnati; 3Digestive Health Center of Cincinnati Children’s Hospital, Cincinnati, Ohio
Submitted 14 June 2013; accepted in final form 20 September 2013
Engevik MA, Aihara E, Montrose MH, Shull GE, Hassett DJ,Worrell RT. Loss of NHE3 alters gut microbiota composition andinfluences Bacteroides thetaiotaomicron growth. Am J Physiol Gas-trointest Liver Physiol 305: G697–G711, 2013. First published Sep-tember 26, 2013; doi:10.1152/ajpgi.00184.2013.—Changes in theintestinal microbiota have been linked to diabetes, obesity, inflamma-tory bowel disease, and Clostridium difficile (C. difficile)-associateddisease. Despite this, it remains unclear how the intestinal environ-ment, set by ion transport, affects luminal and mucosa-associatedbacterial composition. Na�/H�-exchanger isoform 3 (NHE3), a targetof C. difficile toxin B, plays an integral role in intestinal Na�
absorption. Thus the NHE3-deficient mouse model was chosen toexamine the effect of pH and ion composition on bacterial growth. Wehypothesized that ion transport-induced change in the intestinal envi-ronment would lead to alteration of the microbiota. Region-specificchanges in ion composition and pH correlated with region-specificalteration of luminal and mucosal-associated bacteria with generaldecreases in Firmicutes and increases in Bacteroidetes members.Bacteroides thetaiotaomicron (B. thetaiotaomicron) increased inNHE3�/� terminal ileum and was examined in vitro to determinewhether altered Na� was sufficient to affect growth. Increased in vitrogrowth of B. thetaiotaomicron occurred in 43 mM Na� correlatingwith the NHE3�/� mouse terminal ileum [Na�]. NHE3�/� terminalileum displayed increased fut2 mRNA and fucosylation correlatingwith B. thetaiotaomicron growth. Inoculation of B. thetaiotaomicronin wild-type and NHE3�/� terminal ileum organoids displayed in-creased fut2 and fucosylation, indicating that B. thetaiotaomicronalone is sufficient for the increased fucosylation seen in vivo. Thesedata demonstrate that loss of NHE3 alters the intestinal environment,leading to region-specific changes in bacteria, and shed light on thegrowth requirements of some gut microbiota members, which is vitalfor creating better treatments of complex diseases with an altered gutmicrobiota.
Na�/H�-exchanger isoform 3; Clostridium difficile; Bacteroidesthetaiotaomicron; fucosylation; ileum
THE ALTERATION OF NORMAL GUT microbiota is known to play arole in a variety of complex diseases, such as obesity (2, 3, 51,52, 84, 85, 86), diabetes (9, 47), inflammatory bowel disease(28, 30, 56, 68, 70), antibiotic-associated diarrhea (92), andClostridium difficile (C. difficile)-associated disease (14).These complex diseases are increasing in frequency and areassociated with significant health care costs. Although thesediseases each demonstrate dramatic shifts in the gut microbiotaat the phylum level, it remains mechanistically unclear howcertain bacterial groups are able to proliferate and maintain analtered composition. It is well documented that changes in the
gut microbiota are able to impact epithelial ion transport (8, 21,53, 54). However, little is known about the effect of epithelialion transport processes on the intestinal microbiota. Ion trans-porters are expressed in distinctive patterns based on theirintestinal location and are required for maintaining intestinalhomeostasis (80). Likewise, microbiota composition varies intotal number and species representation along the intestinallength (6). An understanding of the relationship of ion trans-port status to the microbiota is important for a clear under-standing of regional microbiota changes.
Transporter-null mouse models offer the unique ability toexamine the microbial populations and epithelial cross-talkalong the length of the intestine. We have used the Na�/H�-exchanger isoform 3 null (NHE3�/�) mouse model to accessregion-specific bacterial changes in the intestine (72). NHE3plays a critical role in intestinal sodium, water absorption, andpH regulation (31, 72). Due to decreased sodium and waterabsorption and H� secretion, NHE3�/� mice have an enlargedcecum and colon and exhibit alkaline diarrhea (72). Thisparticular mouse model is clinically relevant in that the patho-gen C. difficile is responsible for the majority of antibiotic-associated diarrhea (23). C. difficile interacts with the mucuslayer (19, 81) and delivers two exotoxins, toxin A (TcdA) andtoxin B (TcdB) (23, 44, 88). These toxins result in glucosyla-tion of Rho family GTPases, resulting in disorganization of thehost cell cytoskeleton (19) and internalization of the NHE3(36), which leads to subsequent diarrhea. C. difficile infectionhas also been shown to produce an altered microbiota compo-sition (14, 92). The clinical relevance of C. difficile infectionhighlights the importance of looking more in depth into howion transport affects the gut microbiota.
We hypothesized that the intestinal bacterial composition ofNHE3�/� mice is changed in response to an altered microen-vironment. Our research focused on examination of both lu-minal and mucosa-associated bacterial populations along thelength of the intestine and identifies specific patterns of bacte-rial populations in each region. These populations correlatedwith both environmental and epithelial changes. Althoughthese changes are likely many, herein we focus on one exam-ple, Bacteroides thetaiotaomicron (B. thetaiotaomicron). B.thetaiotaomicron proliferation in the NHE3�/� terminal ileumappears to be driven by a sodium concentration optimum (�43mM) and maintained by increased host fut2 mRNA and fuco-sylation. Together, our data link changes in ion compositionand pH, as a result of altered ion transport, to changes inbacterial composition. We demonstrate that NHE3�/� miceexhibit an altered intestinal microbiota and with region-specificchanges.
Address for reprint requests and other correspondence: R. T. Worrell, Dept.of Molecular and Cellular Physiology, Univ. of Cincinnati College of Medi-cine, Cincinnati, OH 45267 (e-mail: [email protected]).
Am J Physiol Gastrointest Liver Physiol 305: G697–G711, 2013.First published September 26, 2013; doi:10.1152/ajpgi.00184.2013.
0193-1857/13 Copyright © 2013 the American Physiological Societyhttp://www.ajpgi.org G697
MATERIALS AND METHODS
Mice. Animal protocol was approved by the University of Cincin-nati Animal Care and Use Committee and complied with NationalInstitutes of Health guidelines. FVBN NHE3�/� mice were generatedas previously described (72). Mice were maintained on a normalmouse diet (7922 NIH-07 mouse diet; Harlan Laboratories, Indianap-olis, IN). At 6–8 wk postweaning, terminal ileum (�10 cm proximalto the cecum, hereafter referred to as ileum), cecum, and colon(proximal and distal) segments were collected from wild-type (WT)and NHE3�/� littermates. Individual intestinal segments were flushedwith PBS (pH 7.4) and mucosal scrapings collected as previouslydescribed (20, 29, 42, 61). Briefly, intestinal segments were flushedwith 500 �l PBS. The segments were then opened lengthwise andwashed thoroughly with PBS, and glass slides were used to scrape theepithelia and mucus layer. Luminal flushes were processed for totalDNA, and mucosal scrapings were processed either for total DNA orfor RNA. Sample wet weight was determined and tissue homogenizedwith a Tissue Tearor homogenizer (Biospec Products, Bartlesville,OK) for 1 min. RNA was extracted and stored at �80°C untilexamined by quantitative real-time PCR (qRT-PCR). DNA was ex-tracted and stored at �20°C until examined by quantitative PCR(qPCR).
Bacterial strains and culture conditions. Staphylococcus aureus (S.aureus), Escherichia coli (E. coli), Micrococcus luteus (M. luteus),Peptostreptococcus anaerobius (P. anaerobius), and Burkoholdenacepacia (B. cepacia) were from Dr. Daniel J. Hassett. B. thetaiotao-micron ATCC 29741 and Prevotella melaninogenica (P. melanino-genica) ATCC 25845 were purchased from Fisher Scientific (ThermoFisher Scientific, Waltham, MA). Lactobacillus acidophilus (L. aci-dophilus) and Rhibozium legaminosarum (R. legaminosarum) werepurchased from Carolina Biological Supply (Carolina Biological Sup-ply, Burlington, NC). Ruminococcus productus (R. productus) ATCC27340D-5 and Faecalibacterium prausnitzii (F. prausnitzii) ATCC27766 were purchased from ATCC (American Type Culture Collec-tion, Manassas, VA). E. coli, S. aureus, M. luteus, B. cepacia, L.acidophilus, and R. legaminosarum were grown in Luria-Burtani (LB;Thermo Fisher Scientific) broth at 37°C in a shaking incubator. B.thetaiotaomicron and P. melaninogenica were grown in tryptone soybroth (TSB, Thermo Fisher Scientific), R. productus and F. prausnitziiwere grown in tryptone-yeast extract-glucose broth (Thermo FisherScientific), and P. anaerobius was grown in brain-heart-infusion(Thermo Fisher Scientific) broth at 37°C in a Coy Systems, dual-portanaerobic chamber (Coy Lab Products, Grass Lake, MI). Thesecultures were used to generate qPCR standard curves.
For characterization of the optimal [Na�] for growth of B.thetaiotaomicron and L. acidophilus, bacteria were grown in mediawhere sodium chloride (NaCl) was either removed or replaced withcesium chloride (CsCl) as previously described (12). B. thetaiotaomi-
cron was grown in TSB broth. Briefly, low-Na� media was mixedwith normal media at various dilutions to obtain the optimal concen-tration of Na� for bacterial growth. Actual Na� and K� concentra-tions were confirmed by flame photometry (Single-Channel DigitalFlame Photometer model 02655-10; Cole-Parmer Instrument, VernonHills, IL), and Cl� concentration was measured by chloridometry(Digital Chloridometer model 4425100; Labconco, Kansas City, MO).Bacteria were grown under anaerobic conditions at 37°C with gentleshaking to early stationary phase (optical density, O.D.600nm, �1) innormal media and used to inoculate media containing varying Na�
levels. Growth was measured as the O.D.600nm using an AmershamBiosciences Ultospec 3100 Spectrophotometer (GE Healthcare LifeSciences, Pittsburgh, PA) vs. uninoculated tubes of medium. Cellconcentration was determined by bacterial cell counts using a PetroffHauser chamber (Hausser Scientific, Horsham, PA) and colony-forming units (CFU) (11, 12, 40).
Histology. WT and NHE3�/� mouse terminal ileum, cecum, andproximal and distal colon segments were fixed for 4 h at 4°C inCarnoy’s fixative and embedded in paraffin. Serial 6–7-�m-thicksections were applied to glass slides and stained with hematoxylin andeosin (H&E) for intestine architecture. Goblet cells were analyzedsemiquantitatively by counting goblet cells per five regions of interest/slide, three slides, n � 4 mice. Expression of fucosyl glycoconjugateson the mucosal surface was examined using FITC-conjugated Ulexeuropaeus agglutinin-1 (UEA-1; Vector Laboratories, Burlingame,CA) as previously described (41, 55). Briefly, sections were deparaf-finized, blocked with PBS containing 10% BSA, and stained withFITC-labeled lectin (10 �g/ml) for 1 h at room temperature. Sectionswere then washed three times in PBS, mounted using Vectashieldmounting medium with DAPI (Vector Laboratories), and analyzed byconfocal laser scanning microscopy (Zeiss LSM Confocal 710; CarlZeiss, Jena, Germany). Digital images of slides were evaluated bytabulating mean pixel intensity of the respective color channel on eachimage using Image J software (NIH). Five regions of interests of fixedsize per slide, three slides per mouse, and n � 4 mice were used forsemiquantitation of stain intensity.
Quantitative real-time-PCR amplification of 16S sequences. TotalDNA was isolated with the QIAamp DNA Stool kit (Qiagen, Valen-cia, CA) according to the manufacturer’s instructions. The lysistemperature was increased to 95°C, and an incubation with lysozyme(10 mg/ml, 37°C for 30 min) was added to improve bacterial cell lysisas previously described (13, 27, 61, 67). The abundance of totalbacteria and specific intestinal bacterial phyla, class, genus, andspecies was measured by qPCR using a Step One Real Time PCRmachine (Applied Biosystems (ABI) Life Technologies, Grand Island,NY) with SYBR Green PCR Master Mix (ABI) and bacteria-specificprimers (Table 1) in a 20-�l final volume. Bacterial numbers weredetermined using standard curves from the pure bacterial cultures as
Table 1. Primer sequences for qRT-PCR of total bacteria and specific bacterial phyla and groups
Type Bacteria Forward Reverse Reference
Total Universal (Total Bacteria) ACTCCTACGGGAGGCAGCAG ATTACCGCGGCTGCTGG (4, 26, 34)Phyla Bacteroidetes GGCGACCGGCGCACGGG GRCCTTCCTCTCAGAACCC (34)Phyla Firmicutes GGAGYATGTGGTTTAATTCGAAGCA AGCTGACGACAACCATGCAC (26)Phyla Actinobacteria CGCGGCCTATCAGCTTGTTG ATTACCGCGGCTGCTGG (26)Phyla �-proteobacteria ACTCCTACGGGAGGCAGCAG TCTACGRATTTCACCYCTAC (26)Phyla �-proteobacteria CCGCACAGTTGGCGAGATGA CGACAGTTATGACGCCCTCC (26)Phyla y-Proteobacteria GAGTTTGATCATGGCTCA GTATTACCGCGGCTGCTG (50)Class Clostridium coccoides cluster XIVa group ACTCCTACGGGAGGCAGC GCTTCTTAGTCAGGTACCGTCAT (67)Class Clostridium leptum cluster IV group GTTGACAAAACGGAGGAAGG GACGGGCGGTGTGTACAA (67)Class Lactobacillus/Enterococcus group AGCAGTAGGGAATCTTCCA CACCGCTACACATGGAG (67)Genus Bacteroides GGTTCTGAGAGGAGGTCCC CTGCCTCCCGTAGGAGT (67)Genus Prevotella CCAGCCAAGTAGCGTGCA TGGACCTTCCGTATTACCGC (18)Genus Mouse Intestinal Bacteria (MIB) CCAGCAGCCGCGGTAATA CGCATTCCGCATACTTCTC (67)Species Bacteroides thetaiotaomicron GGTAGTCCACACAGTAAACGATGAA CCCGTCAATTCCTTTGAGTTTC (78)
G698 LOSS OF NHE3 ALTERS GUT MICROBIOTA COMPOSITION
AJP-Gastrointest Liver Physiol • doi:10.1152/ajpgi.00184.2013 • www.ajpgi.org

previously described (4, 62, 67), which correlated cycle of thresholdvalues (CT) to calculated bacteria number.
qRT-PCR of mRNA. Total RNA was extracted from mucosalscrapings with TRIzol Reagent (Invitrogen Life Technologies, GrandIsland, NY) according to the manufacturer’s instructions. Reversetranscription was performed using 50 �g/ml oligo(dT) 20 primer andSuperScript reverse transcriptase (Invitrogen) according to the man-ufacturer’s instructions. Amplification reactions were performed withSYBR Green PCR Master Mix (ABI), 200-ng sample cDNA in a20-�l final volume on the Step One Real Time PCR Machine (ABI).Data were reported as the CT using GAPDH as the standard.Differences in mRNA expression were determined by qRT-PCR andexpressed as the CT relative fold difference. Primers for fucosyl-transferase and GAPDH were used as previously described (57):GAPDH forward, 5=-CCTGCACCACCAACTGCTTA-3=, GAPDHreverse, 5=-ATGACCTTGCCCACAGCCT-3=; fut2 forward, 5=-AGTCTTCGTGGTTACAAGCAAC-3=, reverse, 5=-TGGCTGGT-GAGCCCTCAATA-3=; fut1 forward, 5=-CAGCTCTGCCTGA-CATTTCTG-3=, and reverse, 5=-AGCAGGTGATAGTCTGAA-CACA-3=.
Ion and pH measurements. Intestinal flushes of WT and NHE3�/�
mice were performed with 100 �l of double deionized water. Sampleswere weighed and centrifuged at 3,000 g for 10 min at 4°C to pelletintestinal solids, and the supernatant Na� and K� concentrations weredetermined using a digital Flame photometer (Single-Channel DigitalFlame Photometer Model 02655-10; Cole-Parmer Instrument, VernonHills, IL). Cl� ion concentration was determined by a digital Chlo-ridometer (Model 4425100; Labconco, Kansas City, MO) and nor-malized to intestinal volume. pH measurements were performedelectrochemically via an electronic pH meter (Orion Model 720A;Thermo Fisher Scientific).
Organoid culture. The terminal ileum (�10 cm proximal to thececum) was dissected from WT and NHE3�/� mice and washed inice-cold Ca/Mg-free DPBS. Tissue was incubated in 2 mM EDTA for30 min at 4°C. Dissociated tissues were centrifuged at 150 g for 10min and embedded in Matrigel (BD Biosciences, San Diego, CA).After the Matrigel was polymerized, Advanced DMEM/F12 mediumsupplemented with R-spondin 1 (500 ng/ml; R&D, Minneapolis,MN), penicillin/streptomycin (100/100 U/ml), HEPES (10 mM), Glu-tamax (2 mM), N2, and B27 (Drummon Scientific, Broomall, PA) was
overlaid with Noggin (100 ng/ml; PeproTech, Rocky Hill, NJ) andEGF (50 ng/ml, PeproTech) as previously described (69).
Organoid microinjection. We have previously used microinjectionto inject cRNA into Xenopus oocytes (17, 22). Given that theorganoids are of similar size to Xenopus oocytes used for expressionstudies, a similar technique to that used for oocytes (39) was used toinject the lumen of the growing organoids. Organoids derived fromterminal mouse ileum tissue ranging in size from 200 to 350 �m inapproximate diameter (�5 days after passage) were used. Injectionneedles were pulled on a horizontal bed puller (Sutter Instruments,Novato, CA) and the tip ends broken under stereoscope view to obtaina tip diameter of �10–15 �m. Microinjection was accomplishedusing a Nanoject microinjector (Drummon Scientific). Injection vol-ume was determined by the predicted organoid luminal volume.Injection volumes of �10% or less of the organoid luminal volumewere used to minimize stretch effects on epithelial cells and tightjunctions. Under these conditions, no observable leak is detected fromthe lumen of the organoid or from the injection site upon injectionneedle removal. Organoids were injected with either TBS broth aloneor with TBS broth containing B. thetaiotaomicron (106 CFU). Or-ganoids were incubated overnight, fixed with 4% paraformaldehyde,permeabilized with PBS Triton-X 100 (0.1%), stained with UEA-1FITC (Vector Laboratories) and Hoechst, and imaged by confocalmicroscopy.
Statistics. The data are presented as the means SE. Comparisonsbetween two groups were made with unpaired t-tests, and compari-sons between genotype and region were performed using two-wayANOVA and the Holme-Sidak post hoc test to determine significancebetween pairwise comparisons using SigmaPlot (Systat Software, SanJose, CA). P � 0.05 was considered significant, whereas n is numberof experiments.
RESULTS
NHE3�/� mice exhibit an altered intestinal environmentwith increased luminal Na� and alkaline pH. NHE3�/� micedisplay increased fluid retention and intestinal size (72). Todetermine whether NHE3�/� mice preserve normal intestinalarchitecture, H&E (Fig. 1A) were done for ileum, cecum,
WT
NHE3-/-
Ileum CecumProximal
ColonDistalColon
Fig. 1. Na�/H�-exchanger isoform 3 (NHE3)�/� mice have normal histology. Mucosal morphology shown in hematoxylin and eosin-stained sections from WTand NHE3�/� mouse terminal ileum, cecum, proximal colon, and distal colon, demonstrating no gross alteration of the mucosal architecture. Micrographs arerepresentative of observations from all mice n � 4. Scale bar � 50 �M.
G699LOSS OF NHE3 ALTERS GUT MICROBIOTA COMPOSITION
AJP-Gastrointest Liver Physiol • doi:10.1152/ajpgi.00184.2013 • www.ajpgi.org

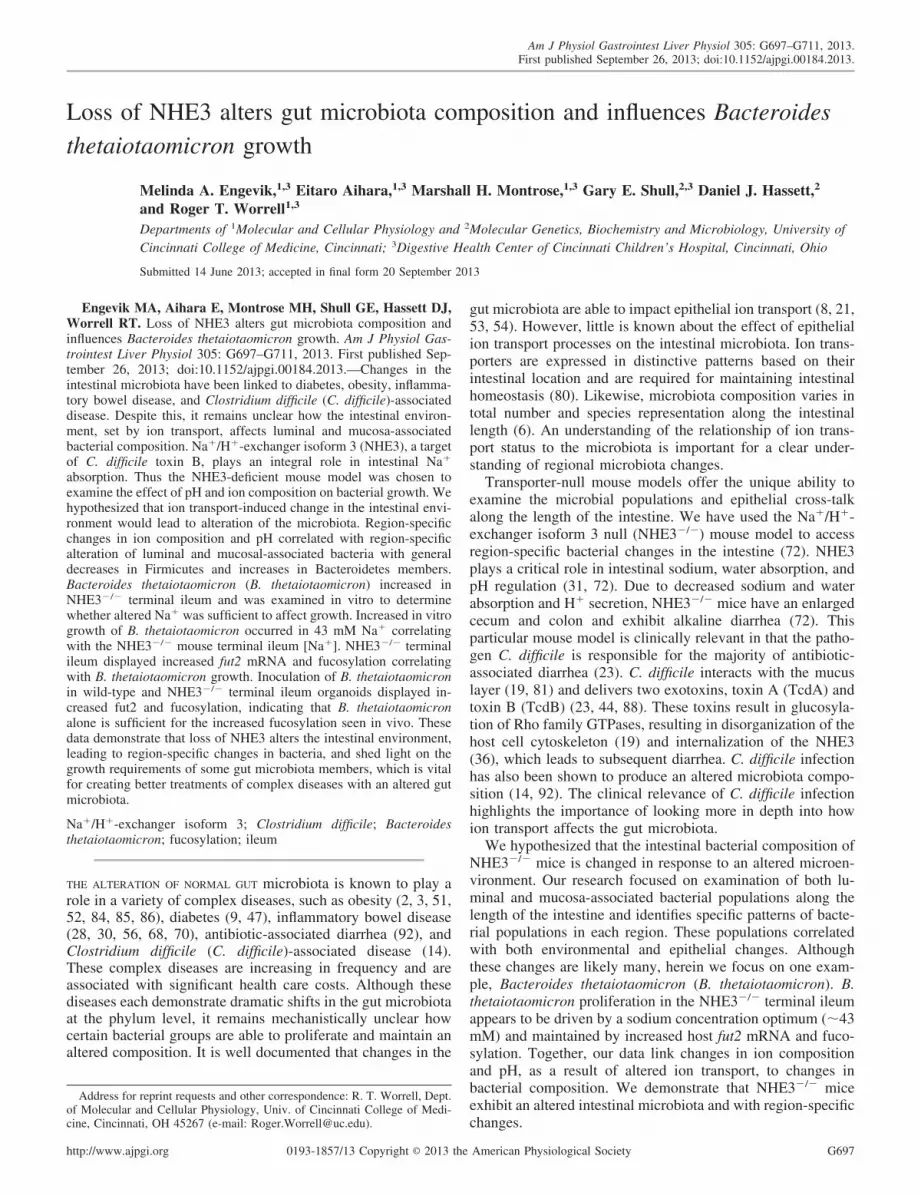
proximal, and distal colon. No gross morphological changesare observed in NHE3�/� mice compared with WT littermates.Although there appeared to be a slight decrease in goblet cellnumber in the NHE3�/� distal colon (WT: 9.3 0.7 vs.NHE3�/�: 7.7 0.4 goblet cells/crypt) significance was notreached (P � 0.097). To examine the intestinal environment,Na� and K� concentrations were determined by flame pho-tometry, and Cl� concentration was determined by chloridom-etry (Fig. 2, see also Table 2). Compared with WT mice,NHE3�/� mice had increased luminal Na� concentration interminal ileum, cecum, proximal, and distal colon (Fig. 2A). K�
concentration was increased in the cecum, proximal, and distalcolon but not in the terminal ileum (Fig. 2B). Cl� concentrationincreased only in the cecum of NHE3�/� mice (Fig. 2C). Al-though we did not directly measure bicarbonate or short-chainfatty acids (SCFA), they represent the bulk of non-Cl anions. Thenon-Cl anion gap was calculated by [Na�] � [K�] � [Cl�] andis shown in Fig. 2D. NHE3�/� mice exhibited a higher non-Clanion gap than is seen in WT mice for all intestinal segments
studied, representing increased bicarbonate and/or SCFA content.In addition, the NHE3�/� mice had increased pH in all segments(Table 2). These data indicate that NHE3�/� mice have an alteredintestinal environment.
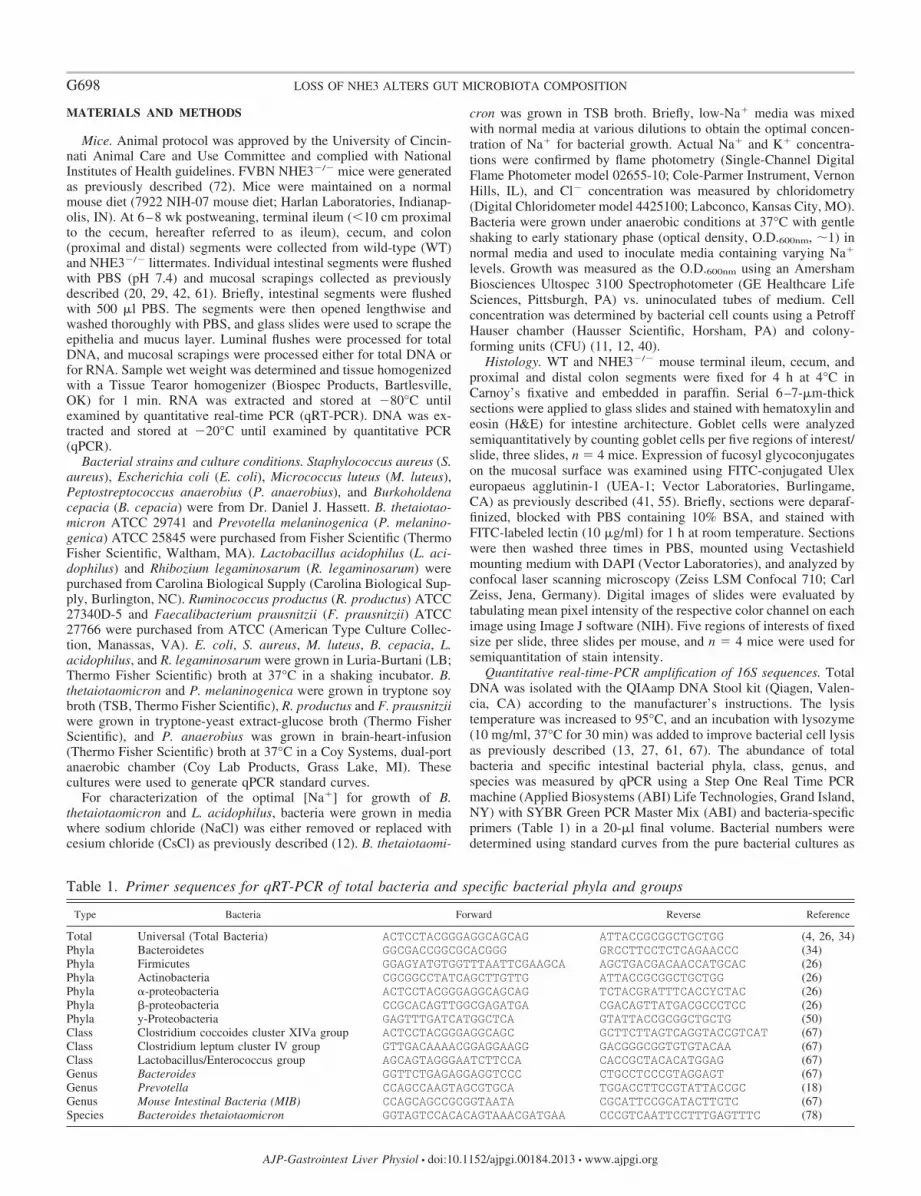
NHE3�/� mice exhibit altered microbiota composition inthe luminal and mucosa-associated bacteria at the phylumlevel. To determine whether total bacterial numbers wereincreased in correlation with increased intestinal size, totalDNA was extracted from luminal flushes and mucosal scrap-ings and analyzed by qPCR. As shown in Fig. 3A, total luminalbacteria in the NHE3�/� mouse ileum, cecum, and distal colonwas significantly increased. No significant change was ob-served in the proximal colon of the NHE3�/� mice, indicatinga regional difference for this intestinal segment. Total mucosa-associated bacteria (Fig. 3B) were significantly increased inNHE3�/� mouse ileum, cecum, proximal colon, and distalcolon. These data indicate that there is bacterial overrepresen-tation in most of the luminal and all the mucosa-associatedbacterial populations.
Ani
on G
ap (m
M)
0
20
40
60
80
100
120
140 *
Ileum Cecum ProximalColon
Distal Colon
* **C
l- (m
M)
0
20
40
60
80
100
120
140
*
Ileum Cecum ProximalColon
Distal Colon
K+ (
mM
)
0
20
40
60
80
100
120
140
*
* *
Ileum Cecum ProximalColon
Distal Colon
Na+ (
mM
)
0
20
40
60
80
100
120
140
*
**
Ileum Cecum ProximalColon
Distal Colon
*
A B
C D
Fig. 2. Ion concentrations in luminal fluidfrom wild-type (WT) (solid bar) andNHE3�/� (open bar) mouse intestinal seg-ments. A: sodium concentration as deter-mined by flame photometry was significantlyincreased in all measured segments fromNHE3�/� vs. WT littermates. B: potassiumconcentration as determined by flame pho-tometry was significantly increased in cecumand colon but not terminal ileum of NHE3�/�
vs. WT littermates. C: chloride concentrationas determined by chloridometry was signifi-cantly increased only in the cecum ofNHE3�/� vs. WT littermates. D: calculatedanion gap � bicarbonate ([Na�] � [K�] �[Cl�]) was significantly increased in all mea-sured segments from NHE3�/� vs. WT litter-mates. n � 5 for WT and n � 3 forNHE3�/�. *P � 0.05.
Table 2. Luminal ion concentration (mM) and pH in WT and NHE3�/� intestinal segments
Terminal Ileum Cecum Proximal Colon Distal Colon
Measurement WT NHE3�/� WT NHE3�/� WT NHE3�/� WT NHE3�/�
Na� 32.7 1.2 42.8 0.5* 54.0 1.8 109 1* 23.8 1.7 36.6 4.7* 16.0 1.8 24.5 2.2*K� 11.8 0.7 10.6 0.9 39.7 1.9 49.8 2.4* 10.7 0.9 19.0 0.7* 10.2 1.0 24.2 0.8*Cl� 16.0 1.1 18.6 1.0 16.1 0.7 34.4 0.7* 17.1 2.9 15.9 1.1 11.3 0.3 9.5 0.9Anion gap 19.0 2.2 36.0 3.1* 71.4 4.0 121 11* 16.0 2.5 53.0 4.8* 8.9 4.7 47.1 4.3*pH 7.2 0.1 8.0 0.0* 6.9 0.1 7.8 0.1* 7.3 0.2 8.0 0.1* 7.2 0.2 7.7 0.0*
The anion gap was calculated as (Na� � K� � Cl�) ion concentrations, and the value predominately represents (HCO3� and short-chain fatty acid� anions.
n � 8 for wild-type (WT) and n � 6 for Na�/H�-exchanger isoform 3 (NHE3)�/� groups. An interaction exists between genotype and region for Na� (P �0.007), Cl� (P � 0.001), and pH (P � 0.001) but not for K� (P � 0.382) or anion gap (P � 0.703) although the concentrations are statistically different (K�
P � 0.006; anion gap P � 0.002). 2-Way ANOVA, Holme-Sidak *P � 0.005.
G700 LOSS OF NHE3 ALTERS GUT MICROBIOTA COMPOSITION
AJP-Gastrointest Liver Physiol • doi:10.1152/ajpgi.00184.2013 • www.ajpgi.org

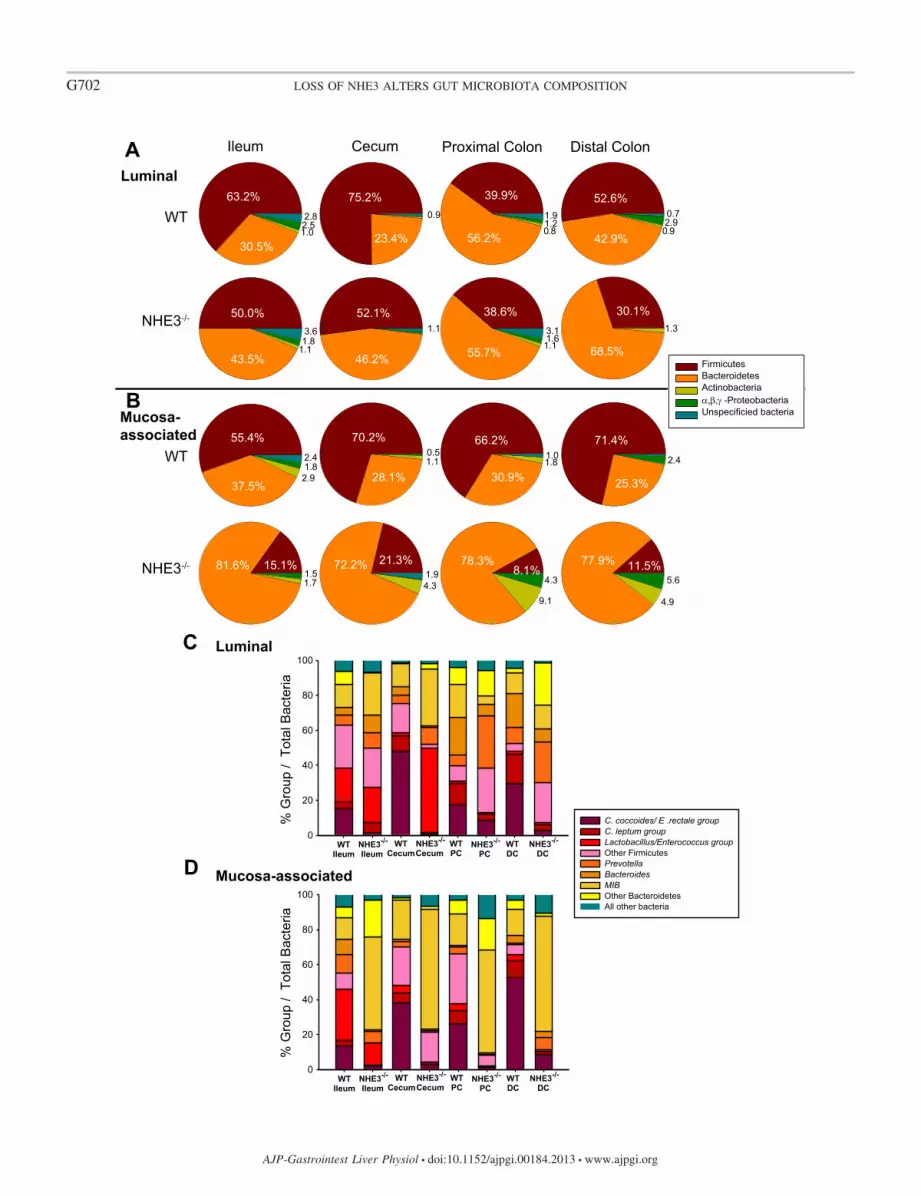
To further characterize the luminal and mucosa-associatedbacterial populations, the major intestinal bacterial phyla werecompared as a percentage of total bacteria by qPCR. As shownin the bacterial phyla representation in Fig. 4A and Table 3,there was an expansion of members of the Bacteroidetes and acontraction of those within the Firmicutes in the NHE3�/�
ileum, cecum, and distal colon luminal fluid. The major phy-lum Firmicutes decreased in the terminal ileum (13.2%), ce-cum (23.1%), and distal colon (22.5%) of NHE3�/� mice,whereas the phylum Bacteroidetes were increased (13%,22.8%, and 25.6%, respectively). Smaller changes were alsoobserved in the less dominant phyla Proteobacteria in the distalcolon (2.8% decrease) (Fig. 4A). No significant changes wereobserved in phylum from the lumen of the proximal colon.These profiles reveal that there is a region-specific microbiotachanges in the NHE3�/� luminal bacterial population. In themucosa-associated bacterial population representation (Fig. 4Band Table 3), there was a contraction of Firmicutes in allNHE3�/� intestinal segments (ileum: 40.3%, cecum: 48.9%,proximal colon: 58.1%, distal colon: 59.9%) and an expansionof Bacteroidetes, such that it became the dominant phyla(ileum: 44.1%, cecum: 44.1%, proximal colon: 47.4%, distalcolon: 52.5%). The overrepresentation of Bacteroidetes phy-lum members in the mucosa-associated population exceeds theexpansion observed in the lumen. In addition to changes inFirmicutes and Bacteroidetes, significant changes were ob-served in Proteobacteria in the colon (proximal colon: 4.2%increase, distal colon: 2.5% increase) and Actinobacteria in thececum (3.2% increase) and colon (proximal colon: 7.3% in-crease, distal colon: 5.2% increase). These data demonstratethat the NHE3�/� mouse mucosa-associated bacterial compo-sition is significantly transformed in response to altered iontransport status. These data also highlight the differencesbetween the luminal and mucosa-associated bacterial popula-tion representation. Taken together, our data indicate that theNHE3�/� mouse intestine exhibits significant region-specificchanges in the luminal and mucosa-associated bacterial popu-lation.
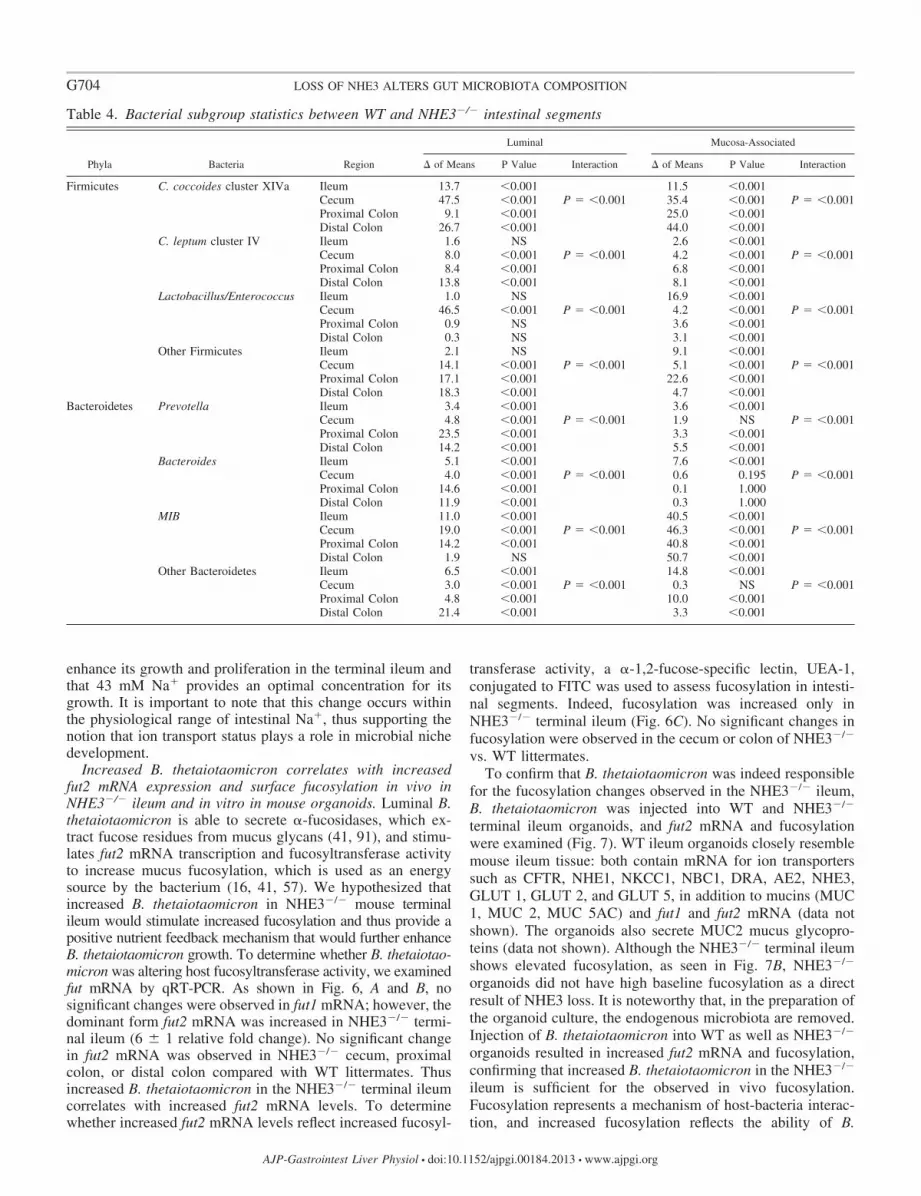
NHE3�/� mice exhibit altered microbiota composition inthe luminal and mucosa-associated bacteria at the subgrouplevel. The subgroups of Firmicutes and Bacteroidetes werefurther examined to determine the groups responsible for thesignificant changes observed in the Bacteroidetes and Firmic-utes phyla (Fig. 4, C and D). In the luminal population (Fig. 4Cand Table 4), changes were observed in all NHE3�/� intestinal
segments. From the phylum Firmicutes, C. coccoides clusterXIVa was decreased in all the NHE3�/� segments (ileum:13.7%, cecum: 47.5%, proximal colon: 9.1%, distal colon:26.7%) and C. leptum cluster IV decreased in the cecum(8.0%) and colon (proximal colon: 8.4%, distal colon: 13.8%).The Lactobacillus/Enterococcus group was increased only inthe cecum (46.5%), and another Firmicutes group was changedin the cecum (14.1% decrease) and colon (proximal colon:17.1% increase, distal colon: 18.3% increase). From the phy-lum Bacteroidetes, Prevotella was increased in all NHE3�/�
segments (ileum: 3.4%, cecum: 4.8%, proximal colon: 23.5%,distal colon: 14.2%), whereas Bacteroides was only increasedin the NHE3�/� ileum (5.1%). Interestingly, Bacteroides wasdecreased in the NHE3�/� cecum and colon (cecum: 4.0%,proximal colon: 14.6%, distal colon: 11.9%). Mouse intestinalBacteroidetes (MIB) was increased in the NHE3�/� ileum(11.0%) and cecum and decreased in the NHE3�/� proximalcolon (14.2%). Other Bacteroidetes subgroups were decreasedin the NHE3�/� ileum (7.3%) and increased in the NHE3�/�
cecum (3.0%) and colon (proximal colon: 4.8%, distal colon:21.4%). Although the overall phylum did not change in theNHE3�/� proximal colon lumen, there were changes in Fir-micutes and Bacteroidetes subgroups, indicating that the mi-crobiota composition is altered in all NHE3�/� segments.
In the mucosa-associated bacterial population (Fig. 4D andTable 4), C. coccoides cluster XIVa (ileum: 11.5%, cecum:35.4%, proximal colon: 25.0%; distal colon: 44.0%), C. leptumcluster IV (ileum: 2.6%, cecum: 4.2%, proximal colon: 6.8%,distal colon: 8.1%), and Lactobacillus/Enterococcus group (il-eum: 16.9%, cecum: 4.2%, proximal colon 3.6%, distal colon:3.1%) decreased in all NHE3�/� segments. Likewise, Bacte-roides was decreased in the NHE3�/� ileum (7.6%), andPrevotella was decreased in the NHE3�/� ileum (3.6%), ce-cum (1.9%), and proximal colon (3.3%). However, Prevotellaincreased in the NHE3�/� distal colon (5.5%), and MIB in-creased in representation in all the NHE3�/� segments (ileum:40.5%, cecum: 46.3%, proximal colon 40.8%, distal colon:50.7%). In addition, another unspecified Bacteroidetes sub-group was increased in the NHE3�/� ileum (14.8%) andproximal colon (10.0%) and decreased in the distal colon(3.3%). These data indicate that, in the mucosa-associatedbacterial population, Clostridium clusters and Lactobacillus/Enterococcus groups are responsible for the decrease in theFirmicutes phyla, whereas the MIB group is largely responsiblefor the significant increase in the Bacteroidetes phyla.
A BLuminal Mucosa-associated
Cal
cula
ted
Bac
teria
l cel
l #
Cal
cula
ted
Bac
teria
l cel
l #
2
3
4
5
6
7
8
9
10
10
10
10
10
10
10
10
1010
Ileum Cecum ProximalColon
Distal Colon
**
*
2
3
4
5
6
7
8
9
10
10
10
10
10
10
10
10
1010
Ileum Cecum ProximalColon
Distal Colon
**
*
*
Fig. 3. NHE3�/� mice exhibit region-specificincreases in total bacteria. Total bacteria werequantified by qPCR using a universal bacte-rial 16S DNA sequence. Calculated bacterialcell number was calculated using an Esche-richia coli standard curve normalized to in-testinal flush volume. A: luminal bacteriallevels in WT (solid bar) and NHE3�/� (openbar) littermates (n � 6). Significant increasesin total bacteria in NHE3�/� samples wereobserved in all but the proximal colon seg-ment. B: mucosa-associated (adherent) bacte-rial levels in WT (solid bar) and NHE3�/�
(open bar) littermates (n � 6). Significantincreases in total bacteria were observed in allNHE3�/� mucosal regions tested. *P �0.005.
G701LOSS OF NHE3 ALTERS GUT MICROBIOTA COMPOSITION
AJP-Gastrointest Liver Physiol • doi:10.1152/ajpgi.00184.2013 • www.ajpgi.org
63.2%
30.5%
75.2% 39.9%
23.4% 56.2%
52.6%
42.9%
50.0%
43.5%
52.1%
46.2%
38.6%
55.7%
30.1%
68.5%
55.4%
25.3%
70.2%
28.1%
66.2%
30.9%
71.4%
37.5%
81.6% 15.1% 72.2% 21.3% 78.3%8.1%
77.9% 11.5%
Luminal
Mucosa-associated
WT
WT
NHE3-/-
NHE3-/-
A
B
FirmicutesBacteroidetesActinobacteriaα,β,γ -ProteobacteriaUnspecificied bacteria
1.0 2.5 2.8 0.9 1.9
1.2 9.08.0
2.9
3.6
0.7
1.1 3.1
2.9 1.8
1.1 1.8
1.3 1.6 1.1
2.4 1.1 0.5
1.8 1.0 2.4
1.5 1.7 4.3
9.1
4.3 1.9 5.6
4.9
0
20
40
60
80
100
WTIleum
WTCecum
WTPC
WTDC
NHE3-/-
IleumNHE3-/-
CecumNHE3-/-
PCNHE3-/-
DC
% G
roup
/ T
otal
Bac
teria
% G
roup
/ T
otal
Bac
teria
0
20
40
60
80
100
WTIleum
WTCecum
WTPC
WTDC
NHE3-/-
IleumNHE3-/-
CecumNHE3-/-
PCNHE3-/-
DC
C
Mucosa-associated
Luminal
D
C. coccoides/ E .rectale groupC. leptum groupLactobacillus/Enterococcus groupOther FirmicutesPrevotellaBacteroidesMIBOther BacteroidetesAll other bacteria
Ileum Cecum Proximal Colon Distal Colon
G702 LOSS OF NHE3 ALTERS GUT MICROBIOTA COMPOSITION
AJP-Gastrointest Liver Physiol • doi:10.1152/ajpgi.00184.2013 • www.ajpgi.org

The genus Bacteroides makes up a substantial portion ofBacteroidetes in the gastrointestinal tract, and the species B.thetaiotaomicron is a well-characterized Bacteroides memberfound in both the human and mouse intestine (7, 10, 15, 35, 40,58, 91). Based on the increased luminal [Na�], we sought todetermine whether B. thetaiotaomicron was responsible for theincrease in luminal Bacteroides in the NHE3�/� terminalileum. Figure 5A shows that B. thetaiotaomicron is indeedincreased in NHE3�/� ileum. No increase in B. thetaiotaomi-cron was observed in the cecum, proximal, or distal colon. B.thetaiotaomicron accounted for 11.3% in WT and 31.7% inNHE3�/� of the genus Bacteroides, which represents 33% ofthe observed Bacteroides species increase. B. forsythus, B.fragilis, B. distasonis, and B. vulgaris were not increased in theNHE3�/� terminal ileum (data not shown). These data indicatethat Bacteroides, specifically B. thetaiotaomicron proliferation,is partially responsible for the Bacteroidetes overgrowth in theNHE3�/� terminal ileum lumen.
In vitro B. thetaiotaomicron growth is significantly en-hanced at [Na�] observed in NHE3�/� mouse terminal ileum.To determine whether B. thetaiotaomicron overrepresentationwas indeed due to the altered luminal ion composition causedby loss of NHE3, B. thetaiotaomicron growth was tested invitro. TSB at varying Na� concentrations, intended to mimicthe intestinal Na� concentration observed in WT and
NHE3�/� mice, was used to determine B. thetaiotaomicrongrowth. Na� and K� concentration were measured in themodified TSB by flame photometry. Na� concentrations usedwere 19, 26, 33.6, 43.5, 57.1, 65.9, and 106.5 mM, values thatclosely resembled the in vivo concentrations (Table 2). K�
concentration averaged 43.2 0.1 mM (ranging 42.8 to 43.6mM) for all solutions. After 20 h of growth, bacterial contentwas examined by O.D.600nm, cell counts, and CFU (O.D.600nm
data are shown in Fig. 5B). The data show that B. thetaiotao-micron has optimal growth at 43 mM Na� and that the greatestincrease in growth occurs over the range of [Na�] measured inthe terminal ileum of WT and NHE3�/� mice (annotated bythe bars and arrows). Slight growth rate changes were observedover the [Na�] range from other intestinal segments in WT andNHE3�/� mice. The specific effect of [Na�] on B. thetaiotao-micron growth was further confirmed by varying the Na�
concentration in TSB by cation replacement with Cs� (data notshown). The NHE3�/� mouse intestinal fluid is more alkalinethan WT littermates (Table 2). Thus we examined the effect ofvarying pH on B. thetaiotaomicron growth at WT (33 mMNa�) and NHE3�/� (43 mM Na�) concentrations. Whereasincreased B. thetaiotaomicron growth correlated well withterminal ileum [Na�], no significant correlation was seen withvarying pH (Fig. 5C). These data indicate that both in vivo andin vitro B. thetaiotaomicron are capable of using Na� to
Fig. 4. NHE3�/� mice exhibit an altered gut microbiota in luminal and mucosa-associated bacterial populations. Relative bacterial phyla abundance wascalculated as the percentage of bacterial phyla compared with total bacteria for luminal (A) and mucosa-associated bacteria (B). NHE3�/� mice showed adisproportionate amount of Bacteroidetes relative to Firmicutes phyla compared with WT littermates (n � 6). In the luminal bacterial population, significantinteraction between genotype and region was observed in Firmicutes (P � �0.001), Bacteroidetes (P � 0.001), and Proteobacteria (P � 0.001). No interactionwas observed in Actinobacteria (P � 0.641) or unspecified (P � 0.409). In the mucosa-associated bacterial population, significant interaction between genotypeand region was observed in Firmicutes (P � �0.001), Bacteroidetes (P � 0.001), Actinobacteria (P � 0.001), Proteobacteria (P � 0.001), and unspecifiedbacteria (P � 0.001). Relative abundance of luminal (C) and mucosa-associated (D) bacterial subgroups of Firmicutes and Bacteroidetes phyla was observed.Relative abundance was calculated as the percentage of bacterial subgroup compared with total bacteria. Regional changes were observed in the Firmicutessubgroup Clostridium coccoides cluster XIVa, Clostridium leptum cluster IV, and Lactobacillus/Enterococcus group. Changes were also observed in theBacteroidetes subgroup Prevotella, Bacteroides, and mouse intestinal Bacteroidetes (MIB) in the NHE3�/� mouse luminal and mucosa-associated bacterialpopulations. Significant interaction was observed between genotype and region for all groups (P � 0.001), n � 6 for WT and NHE3�/�. 2-way ANOVA,Holme-Sidak *P � 0.005. DC, distal colon; PC, proximal colon.
Table 3. Bacterial phyla statistics between WT and NHE3�/� intestinal segments
Luminal Mucosa-Associated
Bacteria Region of Means P Value Interaction of Means P Value Interaction
Firmicutes Ileum 13.2 �0.001 40.3 �0.001Cecum 23.1 �0.001 P � �0.001 48.9 �0.001 P � �0.001Proximal Colon 1.1 NS 58.1 �0.001Distal Colon 22.5 �0.001 59.9 �0.001
Bacteroidetes Ileum 13.0 �0.001 44.1 �0.001Cecum 22.8 �0.001 P � �0.001 44.1 �0.001 P � 0.001Proximal Colon 0.1 NS 47.4 �0.001Distal Colon 25.6 �0.001 52.5 �0.001
Actinobacteria Ileum 0.1 NS 1.2 NSCecum 0.1 NS NS 3.2 �0.001 P � �0.001Proximal Colon 0.3 NS 7.3 �0.001Distal Colon 0.4 NS 5.2 �0.001
Proteobacteria Ileum 0.7 NS 0.3 NSCecum 0.1 NS P � �0.001 0.1 NS P � �0.001Proximal Colon 0.5 NS 4.2 �0.001Distal Colon 2.8 �0.001 2.5 �0.001
Unspecified Ileum 0.8 NS 2.3 NSCecum 0.2 NS NS 1.8 NS NSProximal Colon 1.2 NS 0.8 NSDistal Colon 0.7 NS 0.4 NS
NS, not significant.
G703LOSS OF NHE3 ALTERS GUT MICROBIOTA COMPOSITION
AJP-Gastrointest Liver Physiol • doi:10.1152/ajpgi.00184.2013 • www.ajpgi.org
enhance its growth and proliferation in the terminal ileum andthat 43 mM Na� provides an optimal concentration for itsgrowth. It is important to note that this change occurs withinthe physiological range of intestinal Na�, thus supporting thenotion that ion transport status plays a role in microbial nichedevelopment.
Increased B. thetaiotaomicron correlates with increasedfut2 mRNA expression and surface fucosylation in vivo inNHE3�/� ileum and in vitro in mouse organoids. Luminal B.thetaiotaomicron is able to secrete �-fucosidases, which ex-tract fucose residues from mucus glycans (41, 91), and stimu-lates fut2 mRNA transcription and fucosyltransferase activityto increase mucus fucosylation, which is used as an energysource by the bacterium (16, 41, 57). We hypothesized thatincreased B. thetaiotaomicron in NHE3�/� mouse terminalileum would stimulate increased fucosylation and thus provide apositive nutrient feedback mechanism that would further enhanceB. thetaiotaomicron growth. To determine whether B. thetaiotao-micron was altering host fucosyltransferase activity, we examinedfut mRNA by qRT-PCR. As shown in Fig. 6, A and B, nosignificant changes were observed in fut1 mRNA; however, thedominant form fut2 mRNA was increased in NHE3�/� termi-nal ileum (6 1 relative fold change). No significant changein fut2 mRNA was observed in NHE3�/� cecum, proximalcolon, or distal colon compared with WT littermates. Thusincreased B. thetaiotaomicron in the NHE3�/� terminal ileumcorrelates with increased fut2 mRNA levels. To determinewhether increased fut2 mRNA levels reflect increased fucosyl-
transferase activity, a �-1,2-fucose-specific lectin, UEA-1,conjugated to FITC was used to assess fucosylation in intesti-nal segments. Indeed, fucosylation was increased only inNHE3�/� terminal ileum (Fig. 6C). No significant changes infucosylation were observed in the cecum or colon of NHE3�/�
vs. WT littermates.To confirm that B. thetaiotaomicron was indeed responsible
for the fucosylation changes observed in the NHE3�/� ileum,B. thetaiotaomicron was injected into WT and NHE3�/�
terminal ileum organoids, and fut2 mRNA and fucosylationwere examined (Fig. 7). WT ileum organoids closely resemblemouse ileum tissue: both contain mRNA for ion transporterssuch as CFTR, NHE1, NKCC1, NBC1, DRA, AE2, NHE3,GLUT 1, GLUT 2, and GLUT 5, in addition to mucins (MUC1, MUC 2, MUC 5AC) and fut1 and fut2 mRNA (data notshown). The organoids also secrete MUC2 mucus glycopro-teins (data not shown). Although the NHE3�/� terminal ileumshows elevated fucosylation, as seen in Fig. 7B, NHE3�/�
organoids did not have high baseline fucosylation as a directresult of NHE3 loss. It is noteworthy that, in the preparation ofthe organoid culture, the endogenous microbiota are removed.Injection of B. thetaiotaomicron into WT as well as NHE3�/�
organoids resulted in increased fut2 mRNA and fucosylation,confirming that increased B. thetaiotaomicron in the NHE3�/�
ileum is sufficient for the observed in vivo fucosylation.Fucosylation represents a mechanism of host-bacteria interac-tion, and increased fucosylation reflects the ability of B.
Table 4. Bacterial subgroup statistics between WT and NHE3�/� intestinal segments
Luminal Mucosa-Associated
Phyla Bacteria Region of Means P Value Interaction of Means P Value Interaction
Firmicutes C. coccoides cluster XIVa Ileum 13.7 �0.001 11.5 �0.001Cecum 47.5 �0.001 P � �0.001 35.4 �0.001 P � �0.001Proximal Colon 9.1 �0.001 25.0 �0.001Distal Colon 26.7 �0.001 44.0 �0.001
C. leptum cluster IV Ileum 1.6 NS 2.6 �0.001Cecum 8.0 �0.001 P � �0.001 4.2 �0.001 P � �0.001Proximal Colon 8.4 �0.001 6.8 �0.001Distal Colon 13.8 �0.001 8.1 �0.001
Lactobacillus/Enterococcus Ileum 1.0 NS 16.9 �0.001Cecum 46.5 �0.001 P � �0.001 4.2 �0.001 P � �0.001Proximal Colon 0.9 NS 3.6 �0.001Distal Colon 0.3 NS 3.1 �0.001
Other Firmicutes Ileum 2.1 NS 9.1 �0.001Cecum 14.1 �0.001 P � �0.001 5.1 �0.001 P � �0.001Proximal Colon 17.1 �0.001 22.6 �0.001Distal Colon 18.3 �0.001 4.7 �0.001
Bacteroidetes Prevotella Ileum 3.4 �0.001 3.6 �0.001Cecum 4.8 �0.001 P � �0.001 1.9 NS P � �0.001Proximal Colon 23.5 �0.001 3.3 �0.001Distal Colon 14.2 �0.001 5.5 �0.001
Bacteroides Ileum 5.1 �0.001 7.6 �0.001Cecum 4.0 �0.001 P � �0.001 0.6 0.195 P � �0.001Proximal Colon 14.6 �0.001 0.1 1.000Distal Colon 11.9 �0.001 0.3 1.000
MIB Ileum 11.0 �0.001 40.5 �0.001Cecum 19.0 �0.001 P � �0.001 46.3 �0.001 P � �0.001Proximal Colon 14.2 �0.001 40.8 �0.001Distal Colon 1.9 NS 50.7 �0.001
Other Bacteroidetes Ileum 6.5 �0.001 14.8 �0.001Cecum 3.0 �0.001 P � �0.001 0.3 NS P � �0.001Proximal Colon 4.8 �0.001 10.0 �0.001Distal Colon 21.4 �0.001 3.3 �0.001
G704 LOSS OF NHE3 ALTERS GUT MICROBIOTA COMPOSITION
AJP-Gastrointest Liver Physiol • doi:10.1152/ajpgi.00184.2013 • www.ajpgi.org

thetaiotaomicron to adjust to intestinal environment and otherbacterial composition changes.
These results demonstrate that changes in ion transport canalter the intestinal environment and thereby result in changes inbacteria representation. Certain bacteria are also capable ofmodifying the epithelia in a manner that allows for furtherproliferation and niche maintenance.
DISCUSSION
Recent studies have shown that the intestinal epithelium isnot simply a static barrier; the epithelium is in a constant “crosstalk” with the gut microbiota and the external environment (6).Environment and bacterial cues signal changes in ion transport,pH regulation, tight junction function, and activation of inflam-matory cascades (6). Although pathogens from a variety ofphyla have been shown to alter certain host functions, like iontransport, the overall role of an altered intestinal environmenton bacteria, pathogens, and commensal bacteria alike remainslargely undetermined. This study provides a seminal examina-tion of changes in the gut microbiota as a result of altered iontransport. Our data demonstrate that single transporter-nullmice represent a valid model to better understand mechanismsof host bacterial niche development and region-specific intes-
tinal microbiota changes. In addition, we demonstrate that B.thetaiotaomicron in vitro is Na� sensitive in the physiologicalrange, and increased B. thetaiotaomicron directly correlateswith increased fut2 mRNA and fucosylation, in vivo and invitro, revealing host-bacterial interactions that further enhanceB. thetaiotaomicron bacterial proliferation. Collectively, ourwork indicates that altered bacterial growth occurs in responseto an altered intestinal environment and that Na� and pH playa key role in shaping the gut microbiota.
Very few studies have focused on the effect of ion transporton the gut microbiota. An altered gut microbiota was demon-strated in a mouse model of cystic fibrosis (CF) (83), where thechloride transporter CFTR was knocked out. This model dis-played decreased members of Acinetobacter lwoffii and severalLactobacilliales members in addition to significant enrichmentof Mycobacteria and Bacteroides in the ileum. Additionally,increased fut2 mRNA and fucosylation were observed in thesmall intestine of the CF mice (83) and in humans with CF(82). In the CF mice, there was an increase in total bacteria inthe small intestine, and the authors hypothesized that bacteria-host interactions were responsible for the induction of in-creased fut2 and fucosylation. Data presented herein conclu-sively identify increased B. thetaiotaomicron and increased
Cal
cula
ted
Bac
teria
cel
l #
2
3
4
5
6
7
8
9
10
10
10
10
10
10
10
10
1010
Ileum Cecum ProximalColon
Distal Colon
*
A
Na+ (mM)
OD
600
nm (2
0hrs
)
B
pH
OD
600
nm (2
0hrs
)
C
15 20 25 30 35 40 45 50 55 60 65 70 6.7 6.8 6.9 7.0 7.1 7.2 7.3 7.4 7.5 7.6 7.7 7.8 7.9 8.01.00
1.02
1.04
1.06
1.08
1.10
1.12
1.14
1.16
WT NHE3-/-
terminalileum
cecumP. colon0.96
0.98
1.00
1.02
1.04
1.06
1.08
1.10
1.12
1.14
WT NHE3-/-
terminalileum
cecum
P. colonD. colon
D. colon
Fig. 5. In vivo and in vitro growth of Bacteroides thetaiotaomicron (B. thetaiotaomicron). A: calculated bacterial cell number for the Bacteroides species B.thetaiotaomicron. Bacterial cell numbers were calculated from a standard curve using a pure culture of B. thetaiotaomicron. B. thetaiotaomicron was significantlyincreased only in NHE3�/� terminal ileum vs. WT littermates. This increase accounts for 33% of the increased Bacteroidetes. n � 6 for WT (solid bar) andn � 6 for NHE3�/� (open bar) *P � 0.005. B: growth of B. thetaiotaomicron in tryptone soy broth (TSB) at varying concentrations of Na�, which mimic thoseseen in vivo for NHE3�/� and WT intestinal fluid (Table 2). The steepest change in B. thetaiotaomicron growth is observed at a [Na�] range that correlatesdirectly with that seen in the WT and NHE3�/� terminal ileum. n � 3. [Na�] ranges for each intestinal segment in WT and NHE3�/� are displayed as bars alongthe x-axis. Arrows indicate in vivo values for terminal ileum. C: growth of B. thetaiotaomicron in TSB broth at varying pH, which mimics that seen in vivo forNHE3�/� and WT intestinal fluid (Table 2). Growth was determined at 33 mM Na� (�), mimicking WT terminal ileum and 43 mM Na� (Œ), mimickingNHE3�/� ileum. No significant difference was observed in B. thetaiotaomicron growth within the pH range seen in WT and NHE3�/� terminal ileum (indicatedby the bar). n � 3. Bars and arrows indicate in vivo values.
G705LOSS OF NHE3 ALTERS GUT MICROBIOTA COMPOSITION
AJP-Gastrointest Liver Physiol • doi:10.1152/ajpgi.00184.2013 • www.ajpgi.org

A Bfut1
mR
NA
(Fol
d D
iffer
ence
)
0
2
4
6
8
10
Ileum Cecum ProximalColon
Distal Colon
fut2
mR
NA
(Fol
d D
iffer
ence
)
0
2
4
6
8
10
Ileum Cecum ProximalColon
Distal Colon
*
Ileum Cecum Proximal
Colon DistalColon
WT
NHE3-/-
50 μm
C
D
Rel
ativ
e Fl
ores
cenc
e
0
10
20
30
40
50
60
Ileum Cecum ProximalColon
DistalColon
*
G706 LOSS OF NHE3 ALTERS GUT MICROBIOTA COMPOSITION
AJP-Gastrointest Liver Physiol • doi:10.1152/ajpgi.00184.2013 • www.ajpgi.org

fut2 and fucosylation in a mouse model with a complexmicrobiota. Although CFTR is crucial for transepithelial aniontransport, loss of chloride secretion also results in mucusaccumulation and may provide a new niche for abnormalbacterial colonization.
NHE3�/� mice do experience diarrhea, and some of thechanges in the gut microbiota could be a result of diarrhea;however, based on previous literature, we believe that thedominant changes in the gut microbiota are in fact due tochanges in ion transport. In the mouse model of nontyphoidalSalmonella diarrhea, Endt et al. (23) demonstrated that Salmo-nella infection and diarrhea resulted in decreased Firmicutesmembers and decreased Bacteroidetes members, with in-creased Proteobacteria members. Barman et al. (4) also dem-onstrated decreased Eubacterium rectale/Clostridium coc-coides group (Firmicutes) and Bacteroides (Bacteroidetes) inthe cecum and colon of mice infected with Salmonella for 7days. In addition, Enterobacteriaceae (Proteobacteria) wasfound to be increased in the cecum and colon. No changes wereobserved in Lactobacillus or MIB groups. In humans, osmoticdiarrhea from oral ingestion of polyethylene glycol was foundin general to increase Firmicutes members in the stool anddecrease Bacteroidetes members in the mucosa-associated bac-terial population. Moreover, diarrhea led to a relative increasein the abundance of Proteobacteria (33). The data hereindemonstrate that NHE3�/� mice have increased Bacteroidetesand decreased Firmicutes phyla both in the luminal and mu-cosa-associated bacterial populations. Because NHE3�/� bac-terial composition differs from the bacterial composition seenin diarrhea, the data are consistent with the bacteria in theNHE3�/� being predominantly affected by changes in theintestinal environment as a result of the loss of NHE3.
The increases observed in the luminal and mucosa-associ-ated subgroups of Bacteroidetes indicate that the intestinalenvironment set by NHE3 regulates the Bacteroidetes phylumsignificantly. We show that ion transport status alters theintestinal microenvironment in ways that are advantageous forcertain bacterial groups. pH changes have been shown to affectbacterial growth. High (alkaline) pH resulting from streptomy-cin use has been shown to result in increased Gram-negativeBacteroidetes and decreased Gram-positive Firmicutes (71,73), similar to the profile observed in the NHE3�/� intestine.Gastrointestinal bacteria have been shown to rely on bacterialcation/proton antiporters when exposed to alkaline pH condi-tions. Studies of Gram-negative E. coli have demonstrated akey role in Na� extrusion and proton capture at high-pHhomeostasis (63, 64, 66). As one might expect, these Na�-coupled ATPase transporters are increased in response toelevated pH or elevated Na� (43, 45). A myriad of studies havealso demonstrated that Na� can be used by bacteria for many
aspects of their fundamental physiological processes (1, 38, 75,76, 77, 79, 89). Bacteroides spp. require Na� for growth (12),and Na� and K� ions were found to independently affect thegrowth rate and growth yield of B. amylophilus (12), B.ruminicola, B. oralis, and B. succinogenes S-85, respectively(11). Mutational studies of B. thetaiotaomicron have shownthat mutating genes involved in sensing Na� gradients resultedin a loss of bacterial fitness (32). In the terminal ileum, wherethere is low expression of oligosaccharides, an additionalproliferator factor, such as Na� may provide B. thetaiotaomi-cron a competitive edge.
Data presented herein also demonstrate that mucosa-associ-ated bacterial populations respond more dramatically tochanges in sodium and pH caused by the loss of NHE3 than theluminal bacteria. It is probable that the mucosa-associatedbacteria might be more influenced by the host genetics, as theyare in closer physical proximity to the host epithelia. However,clearly ion transport status affects both luminal and mucosa-associated representation of bacteria. Dramatic changes in themucosa-associated bacterial population are also observed inmouse models with genetic host alterations (5, 29, 67, 83, 87).We hypothesize that the luminal bacterial population may bemore affected by diet-induced changes (24, 42, 74) and luminalmicroenvironment, whereas the mucosa associated populationmay be more influenced by host changes, such as immunityand antimicrobial concentration (29, 67), mucus production (5,29, 87) or changes in ion transport (83).
It should be noted that NHE3�/� mice from our facility donot display overt intestinal inflammation, whereas NHE3�/�
mice of the same source (Gary E. Shull) housed elsewhere doshow signs of active inflammation (49). Our NHE3�/� mice doexhibit increased IFN-� and inducible nitric oxide synthase(iNOS) mRNA in the ileum and IL-1� mRNA in the distalcolon (data not shown) and have elevated blood IL-1� andIFN-� (90), but there is no increase in proinflammatory cyto-kine mRNA of IL-18, TNF-�, NOS2, and IL-10 (49) and noapparent neutrophil infiltration (data not shown) (48). Thecytokines observed in the NHE3�/� mouse may also representa subthreshold immune response due to increased Gram-neg-ative bacteria as observed in other models (5, 37, 87). Inconditions such as IBD and parasite Toxoplasma gondii infec-tion, increased Gram-negative bacteria, such as E. coli andBacteroides, signal through Toll-like receptor 4, which in-creases IFN-� and iNOS in terminal ileum (37). Studies withmonoassociated B. thetaiotaomicron have also demonstratedincreased cytokine production (48, 65). In contrast, increasedMIB has been linked with protection against inflammation withS. Typhimurium colonization (25). Increased MIB in theNHE3�/� intestine may dampen down large-scale inflamma-tory responses, contributing to the low level of inflammatory
Fig. 6. Increased fut2 and fucosylation are observed in the NHE3�/� terminal ileum. mRNA expression was determined by qRT-PCR and expressed as the CT
relative fold difference. A: no significant difference is observed in fut1 mRNA expression between NHE3�/� (open bar) and WT (solid bar) littermate mice.B: fut2 mRNA is significantly increased only in NHE3�/� (open bar) mouse terminal ileum vs. WT (solid bar) littermates. No significant difference in fut2expression is observed in mucosal segments distal to the terminal ileum. This directly correlates with B. thetaiotaomicron levels shown in Fig. 5A. n � 6. *P �0.05. C: significant increase in fucosylation was only observed in terminal ileum of NHE3�/� vs. WT mice with fucosylated residues apparent from crypt to villustip (depicted by the arrows). This increase directly correlates with increased fut2 mRNA and Bacteroides levels in the terminal ileum of the NHE3�/� mice.Fucosylation was determined by Ulex europaeus agglutinin (UEA)-1-FITC lectin binding (red). Nuclei stained with DAPI (blue). Representative micrographsof observations from n � 4 mice. Scale bar � 50 �M. D: semiquantitative analysis of fucosylation. There is a significant interaction between genotype andsegment (*P � �0.001). NHE3�/� vs. WT ileum P � 0.001. No significant differences were observed between WT and NHE3�/� cecum (P � 0.896), proximal(P � 0.511) and distal colon (P � 0.720) by 2-way ANOVA, Holme-Sidak.
G707LOSS OF NHE3 ALTERS GUT MICROBIOTA COMPOSITION
AJP-Gastrointest Liver Physiol • doi:10.1152/ajpgi.00184.2013 • www.ajpgi.org

A
0
1
2
3
4
5
fut2
mR
NA
(Fol
d D
iffer
ence
)
WT IleumOrganoid
NHE3-/- IleumOrganoid
* *
Injected Injected NHE3-/-
Control ControlB WT
Fig. 7. B. thetaiotaomicron induced host epithelial changes in mouse terminal ileal organoid. A: fut2 mRNA in WT and NHE3�/� mouse ileum organoids (solidbar � ileum organoid injected with TSB broth; open bar � ileum organoid injected with B. thetaiotaomicron culture). B: confocal images from WT and NHE3�/�
mouse ileum organoids depicting fucosylation by UEA-1-rhodamine lectin (red) binding. Nuclei stained with DAPI (blue). Shown from top to bottom areprojection images, x-y plane midsection slice, and transmitted light image. Images reveal increased fucosylation in organoids infected with B. thetaiotaomicron.These data demonstrate that B. thetaiotaomicron alone is sufficient to induce fut2, which correlates to increased fucosylation in terminal mouse ileum. n � 5*P � 0.05. Scale bar � 50 �m.
G708 LOSS OF NHE3 ALTERS GUT MICROBIOTA COMPOSITION
AJP-Gastrointest Liver Physiol • doi:10.1152/ajpgi.00184.2013 • www.ajpgi.org

response observed in our mice. The altered intestinal microbi-ota exhibited by the NHE3�/� may make these mice vulnera-ble to subsequent pathogen infection in other mouse facilities.However, for the mice housed at the animal facility at ouruniversity, the analysis of the gut microbiota are not compli-cated by an active, robust inflammatory response. Neverthe-less, careful comparative study of differences between similarmice with or without overt inflammation should prove valuablein determining the key factors (e.g., bacterial species) leadingto an inflammatory response or pathogen susceptibility.
NHE3 is also clinically relevant for analysis, as it is a targetof C. difficile toxin B (36). C. difficile is a leading cause ofnosocomial enteric infections. According to the CDC, C. dif-ficile affects over half a million people in America yearly, andthe incidence of non-hospital-acquired C. difficile infection isincreasing. Because NHE3 is involved in Na� and waterregulation, a large percentage of patients infected with C.difficile suffer from diarrhea (46, 59). In humans, increasedBacteroidetes and decreased Firmicutes have been shown to beassociated with C. difficile-associated disease (14, 92). In miceinfected with C. difficile, increased Bacteroides coordinatelyoccurred in the ileum (60). Such alterations resemble themicrobial changes observed in the NHE3�/� mouse model.Thus it is likely that C. difficile toxin B inhibition of NHE3serves to alter the intestinal microbiota and thus create a moresuitable environment for C. difficile infection. Further studiesare necessary, and underway, to determine whether the changesin the gut microbiota seen in C. difficile infection are predom-inately due to inhibition of NHE3 rather than C. difficile-bacterial interaction. Taken together, the results presentedherein propose that ion transport plays a key role, not only inregulating the intestinal environment, but also in establishingbacterial niches. This can be clinically advantageous because anumber of ion transporter drugs could be used in variousdisease states to alter the intestinal environment (regionallyspecific to transporter expression) in a manner that promotes orrepresses growth of certain bacterial groups. Such therapycould potentially be used to rebalance the intestinal microbiotaafter a shift with minimal effect on propagating antibioticresistant bacterial strains.
ACKNOWLEDGMENTS
We thank our undergraduate volunteers Khushboo Patel, Christine Ciriaco,Kristen Engevik, Robert Phan, Katie Anglin, and Fatma Rah for assistance.This work is in partial fulfillment of the Ph.D. degree for Melinda A. Engevik.
GRANTS
This work is supported in part by NIH DK079979 to R. Worrell andDK050594 to G. Shull.
DISCLOSURES
No conflicts of interest, financial or otherwise, are declared by the authors.
AUTHOR CONTRIBUTIONS
Author contributions: M.A.E. and R.T.W. conception and design of re-search; M.A.E. and E.A. performed experiments; M.A.E. analyzed data;M.A.E., M.H.M., G.E.S., D.J.H., and R.T.W. interpreted results of experi-ments; M.A.E. and E.A. prepared figures; M.A.E. drafted manuscript; M.A.E.,M.H.M., G.E.S., D.J.H., and R.T.W. edited and revised manuscript; R.T.W.approved final version of manuscript.
REFERENCES
1. Avetisyan AV, Bogachev AV, Murtasina RA, Skulachev VP. ATP-driven Na� transport and Na(�)-dependent ATP synthesis in Escherichiacoli grown at low delta mu H�. FEBS Lett 317: 267–270, 1993.
2. Backhed F, Ding H, Wang T, Hooper LV, Koh GY, Nagy A, Semen-kovich CF, Gordon JI. The gut microbiota as an environmental factorthat regulates fat storage. Proc Natl Acad Sci USA 101: 15718–15723,2004.
3. Backhed F, Manchester JK, Semenkovich CF, Gordon JI. Mechanismsunderlying the resistance to diet-induced obesity in germ-free mice. ProcNatl Acad Sci USA 104: 979–984, 2007.
4. Barman M, Unold D, Shifley K, Amir E, Hung K, Bos N, Salzman N.Enteric salmonellosis disrupts the microbial ecology of the murine gas-trointestinal tract. Infect Immun 76: 907–915, 2008.
5. Bergstrom KS, Kissoon-Singh V, Gibson DL, Ma C, Montero M,Sham HP, Ryz N, Huang T, Velcich A, Finlay BB, Chadee K, VallanceBA. Muc2 protects against lethal infectious colitis by disassociatingpathogenic and commensal bacteria from the colonic mucosa. PLoSPathog 6: e1000902, 2010.
6. Berkes J, Viswanathan VK, Savkovic SD, Hecht G. Intestinal epithelialresponses to enteric pathogens: effects on the tight junction barrier, iontransport, and inflammation. Gut 52: 439–451, 2003.
7. Bjursell MK, Martens EC, Gordon JI. Functional genomic and meta-bolic studies of the adaptations of a prominent adult human gut symbiont,Bacteroides thetaiotaomicron, to the suckling period. J Biol Chem 281:36269–36279, 2006.
8. Borenshtein D, Schlieper KA, Rickman BH, Chapman JM, Schwein-fest CW, Fox JG, Schauer DB. Decreased expression of colonic Slc26a3and carbonic anhydrase iv as a cause of fatal infectious diarrhea in mice.Infect Immun 77: 3639–3650, 2009.
9. Brugman S, Klatter FA, Visser JT, Wildeboer-Veloo AC, HarmsenHJ, Rozing J, Bos NA. Antibiotic treatment partially protects against type1 diabetes in the Bio-Breeding diabetes-prone rat. Is the gut flora involvedin the development of type 1 diabetes? Diabetologia 49: 2105–2108, 2006.
10. Bry L, Falk PG, Midtvedt T, Gordon JI. A model of host-microbialinteractions in an open mammalian ecosystem. Science 273: 1380–1383,1996.
11. Caldwell DR, Arcand C. Inorganic and metal-organic growth require-ments of the genus Bacteroides. J Bacteriol 120: 322–333, 1974.
12. Caldwell DR, Keeney M, Barton JS, Kelley JF. Sodium and otherinorganic growth requirements of bacteroides amylophilus. J Bacteriol114: 782–789, 1973.
13. Castillo M, Martin-Orue SM, Manzanilla EG, Badiola I, Martin M,Gasa J. Quantification of total bacteria, enterobacteria and lactobacillipopulations in pig digesta by real-time PCR. Vet Microbiol 114: 165–170,2006.
14. Chang JY, Antonopoulos DA, Kalra A, Tonelli A, Khalife WT,Schmidt TM, Young VB. Decreased diversity of the fecal Microbiome inrecurrent Clostridium difficile-associated diarrhea. J Infect Dis 197: 435–438, 2008.
15. Comstock LE, Coyne MJ. Bacteroides thetaiotaomicron: a dynamic,niche-adapted human symbiont. Bioessays 25: 926–929, 2003.
16. Coyne MJ, Reinap B, Lee MM, Comstock LE. Human symbionts use ahost-like pathway for surface fucosylation. Science 307: 1778–1781,2005.
17. Cunningham SA, Worrell RT, Benos DJ, Frizzell RA. cAMP-stimu-lated ion currents in Xenopus oocytes expressing CFTR cRNA. Am JPhysiol Cell Physiol 262: C783–C788, 1992.
18. Dalwai F, Spratt DA, Pratten J. Use of quantitative PCR and culturemethods to characterize ecological flux in bacterial biofilms. J ClinMicrobiol 45: 3072–3076, 2007.
19. Deneve C, Janoir C, Poilane I, Fantinato C, Collignon A. New trendsin Clostridium difficile virulence and pathogenesis. Int J AntimicrobAgents 33, Suppl 1: S24–S28, 2009.
20. Deplancke B, Vidal O, Ganessunker D, Donovan SM, Mackie RI,Gaskins HR. Selective growth of mucolytic bacteria including Clostrid-ium perfringens in a neonatal piglet model of total parenteral nutrition. AmJ Clin Nutr 76: 1117–1125, 2002.
21. Donnelly GA, Lu J, Takeda T, McKay DM. Colonic epithelial physi-ology is altered in response to the bacterial superantigen Yersinia pseu-dotuberculosis mitogen. J Infect Dis 180: 1590–1596, 1999.
22. Drumm ML, Wilkinson DJ, Smit LS, Worrell RT, Strong TV, FrizzellRA, Dawson DC, Collins FS. Chloride conductance expressed by delta
G709LOSS OF NHE3 ALTERS GUT MICROBIOTA COMPOSITION
AJP-Gastrointest Liver Physiol • doi:10.1152/ajpgi.00184.2013 • www.ajpgi.org

F508 and other mutant CFTRs in Xenopus oocytes. Science 254: 1797–1799, 1991.
23. Endt K, Stecher B, Chaffron S, Slack E, Tchitchek N, Benecke A, VanMaele L, Sirard JC, Mueller AJ, Heikenwalder M, Macpherson AJ,Strugnell R, von Mering C, Hardt WD. The microbiota mediatespathogen clearance from the gut lumen after non-typhoidal Salmonelladiarrhea. PLoS Pathog 6: e1001097, 2010.
24. Everard A, Lazarevic V, Derrien M, Girard M, Muccioli GG, Ney-rinck AM, Possemiers S, Van Holle A, Francois P, de Vos WM,Delzenne NM, Schrenzel J, Cani PD. Responses of gut microbiota andglucose and lipid metabolism to prebiotics in genetic obese and diet-induced leptin-resistant mice. Diabetes 60: 2775–2786, 2011.
25. Ferreira RB, Gill N, Willing BP, Antunes LC, Russell SL, Croxen MA,Finlay BB. The intestinal microbiota plays a role in Salmonella-inducedcolitis independent of pathogen colonization. PLoS One 6: e20338, 2011.
26. Fierer N, Jackson JA, Vilgalys R, Jackson RB. Assessment of soilmicrobial community structure by use of taxon-specific quantitative PCRassays. Appl Environ Microbiol 71: 4117–4120, 2005.
27. Fite A, Macfarlane GT, Cummings JH, Hopkins MJ, Kong SC, FurrieE, Macfarlane S. Identification and quantitation of mucosal and faecaldesulfovibrios using real time polymerase chain reaction. Gut 53: 523–529, 2004.
28. Frank DN, St Amand AL, Feldman RA, Boedeker EC, Harpaz N,Pace NR. Molecular-phylogenetic characterization of microbial commu-nity imbalances in human inflammatory bowel diseases. Proc Natl AcadSci USA 104: 13780–13785, 2007.
29. Frantz AL, Rogier EW, Weber CR, Shen L, Cohen DA, Fenton LA,Bruno ME, Kaetzel CS. Targeted deletion of MyD88 in intestinalepithelial cells results in compromised antibacterial immunity associatedwith downregulation of polymeric immunoglobulin receptor, mucin-2, andantibacterial peptides. Mucosal Immunol 5: 501–512, 2012.
30. Garrett WS, Lord GM, Punit S, Lugo-Villarino G, Mazmanian SK,Ito S, Glickman JN, Glimcher LH. Communicable ulcerative colitisinduced by T-bet deficiency in the innate immune system. Cell 131:33–45, 2007.
31. Gawenis LR, Stien X, Shull GE, Schultheis PJ, Woo AL, Walker NM,Clarke LL. Intestinal NaCl transport in NHE2 and NHE3 knockout mice.Am J Physiol Gastrointest Liver Physiol 282: G776–G784, 2002.
32. Goodman AL, McNulty NP, Zhao Y, Leip D, Mitra RD, LozuponeCA, Knight R, Gordon JI. Identifying genetic determinants needed toestablish a human gut symbiont in its habitat. Cell Host Microbe 6:279–289, 2009.
33. Gorkiewicz G, Thallinger GG, Trajanoski S, Lackner S, Stocker G,Hinterleitner T, Gully C, Hogenauer C. Alterations in the colonicmicrobiota in response to osmotic diarrhea. PLoS One 8: e55817, 2013.
34. Guo X, Xia X, Tang R, Zhou J, Zhao H, Wang K. Development of areal-time PCR method for Firmicutes and Bacteroidetes in faeces and itsapplication to quantify intestinal population of obese and lean pigs. LettAppl Microbiol 47: 367–373, 2008.
35. Hansen JJ, Huang Y, Peterson DA, Goeser L, Fan TJ, Chang EB,Sartor RB. The colitis-associated transcriptional profile of commensalBacteroides thetaiotaomicron enhances adaptive immune responses to abacterial antigen. PLoS One 7: e42645, 2012.
36. Hayashi H, Szaszi K, Coady-Osberg N, Furuya W, Bretscher AP,Orlowski J, Grinstein S. Inhibition and redistribution of NHE3, theapical Na�/H� exchanger, by Clostridium difficile toxin B. J Gen Physiol123: 491–504, 2004.
37. Heimesaat MM, Bereswill S, Fischer A, Fuchs D, Struck D, NiebergallJ, Jahn HK, Dunay IR, Moter A, Gescher DM, Schumann RR, GobelUB, Liesenfeld O. Gram-negative bacteria aggravate murine small intes-tinal Th1-type immunopathology following oral infection with Toxo-plasma gondii. J Immunol 177: 8785–8795, 2006.
38. Hilpert W, Schink B, Dimroth P. Life by a new decarboxylation-dependent energy conservation mechanism with Na as coupling ion.EMBO J 3: 1665–1670, 1984.
39. Hitchcock MJ, Ginns EI, Marcus-Sekura CJ. Microinjection into Xe-nopus oocytes: equipment. Methods Enzymol 152: 276–284, 1987.
40. Hooper LV, Falk PG, Gordon JI. Analyzing the molecular foundationsof commensalism in the mouse intestine. Curr Opin Microbiol 3: 79–85,2000.
41. Hooper LV, Xu J, Falk PG, Midtvedt T, Gordon JI. A molecular sensorthat allows a gut commensal to control its nutrient foundation in acompetitive ecosystem. Proc Natl Acad Sci USA 96: 9833–9838, 1999.
42. IJssennagger N, Derrien M, van Doorn GM, Rijnierse A, van denBogert B, Muller M, Dekker J, Kleerebezem M, van der Meer R.Dietary heme alters microbiota and mucosa of mouse colon withoutfunctional changes in host-microbe cross-talk. PLoS One 7: e49868, 2012.
43. Ikegami M, Kawano M, Takase K, Yamato I, Igarashi K, KakinumaY. Enterococcus hirae vacuolar ATPase is expressed in response to pH aswell as sodium. FEBS Lett 454: 67–70, 1999.
44. Jank T, Aktories K. Structure and mode of action of clostridial gluco-sylating toxins: the ABCD model. Trends Microbiol 16: 222–229, 2008.
45. Kakinuma Y. Inorganic cation transport and energy transduction inEnterococcus hirae and other streptococci. Microbiol Mol Biol Rev 62:1021–1045, 1998.
46. Kelly CP, LaMont JT. Clostridium difficile infection. Annu Rev Med 49:375–390, 1998.
47. Larsen N, Vogensen FK, van den Berg FW, Nielsen DS, AndreasenAS, Pedersen BK, Al-Soud WA, Sorensen SJ, Hansen LH, JakobsenM. Gut microbiota in human adults with type 2 diabetes differs fromnon-diabetic adults. PLoS One 5: e9085, 2010.
48. Larsen RD, Ernst LK, Nair RP, Lowe JB. Molecular cloning, sequence,and expression of a human GDP-L-fucose:beta-D-galactoside 2-alpha-L-fucosyltransferase cDNA that can form the H blood group antigen. ProcNatl Acad Sci USA 87: 6674–6678, 1990.
49. Laubitz D, Larmonier CB, Bai A, Midura-Kiela MT, Lipko MA,Thurston RD, Kiela PR, Ghishan FK. Colonic gene expression profile inNHE3-deficient mice: evidence for spontaneous distal colitis. Am JPhysiol Gastrointest Liver Physiol 295: G63–G77, 2008.
50. Lee J, Kim S, Jung J, Oh B, Kim I, Hong S. Analysis of total bacteria,enteric members of y-proteobacteria and microbial communities in sea-water as indirect indicators for quantifying biofouling. Environ Eng Res14: 19–25, 2009.
51. Ley RE, Backhed F, Turnbaugh P, Lozupone CA, Knight RD, GordonJI. Obesity alters gut microbial ecology. Proc Natl Acad Sci USA 102:11070–11075, 2005.
52. Ley RE, Turnbaugh PJ, Klein S, Gordon JI. Microbial ecology: humangut microbes associated with obesity. Nature 444: 1022–1023, 2006.
53. Li HS, Doyle WJ, Swarts JD, Hebda PA. Suppression of epithelial iontransport transcripts during pneumococcal acute otitis media in the rat.Acta Otolaryngol (Stockh) 122: 488–494, 2002.
54. Lu J, Wang A, Ansari S, Hershberg RM, McKay DM. Colonicbacterial superantigens evoke an inflammatory response and exaggeratedisease in mice recovering from colitis. Gastroenterology 125: 1785–1795, 2003.
55. Magalhaes A, Gomes J, Ismail MN, Haslam SM, Mendes N, Osorio H,David L, Le Pendu J, Haas R, Dell A, Boren T, Reis CA. Fut2-null micedisplay an altered glycosylation profile and impaired BabA-mediatedHelicobacter pylori adhesion to gastric mucosa. Glycobiology 19: 1525–1536, 2009.
56. Manichanh C, Rigottier-Gois L, Bonnaud E, Gloux K, Pelletier E,Frangeul L, Nalin R, Jarrin C, Chardon P, Marteau P, Roca J, DoreJ. Reduced diversity of faecal microbiota in Crohn’s disease revealed bya metagenomic approach. Gut 55: 205–211, 2006.
57. Meng D, Newburg DS, Young C, Baker A, Tonkonogy SL, Sartor RB,Walker WA, Nanthakumar NN. Bacterial symbionts induce a FUT2-dependent fucosylated niche on colonic epithelium via ERK and JNKsignaling. Am J Physiol Gastrointest Liver Physiol 293: G780–G787,2007.
58. Moore WE, Holdeman LV. Human fecal flora: the normal flora of 20Japanese-Hawaiians. Appl Microbiol 27: 961–979, 1974.
59. Mylonakis E, Ryan ET, Calderwood SB. Clostridium difficile-Associ-ated diarrhea: A review. Arch Intern Med 161: 525–533, 2001.
60. Naaber P, Mikelsaar RH, Salminen S, Mikelsaar M. Bacterial translo-cation, intestinal microflora and morphological changes of intestinal mu-cosa in experimental models of Clostridium difficile infection. J MedMicrobiol 47: 591–598, 1998.
61. Norkina O, Burnett TG, De Lisle RC. Bacterial overgrowth in the cysticfibrosis transmembrane conductance regulator null mouse small intestine.Infect Immun 72: 6040–6049, 2004.
62. Ott SJ, Musfeldt M, Ullmann U, Hampe J, Schreiber S. Quantificationof intestinal bacterial populations by real-time PCR with a universalprimer set and minor groove binder probes: a global approach to theenteric flora. J Clin Microbiol 42: 2566–2572, 2004.
63. Padan E. The enlightening encounter between structure and function inthe NhaA Na�-H� antiporter. Trends Biochem Sci 33: 435–443, 2008.
G710 LOSS OF NHE3 ALTERS GUT MICROBIOTA COMPOSITION
AJP-Gastrointest Liver Physiol • doi:10.1152/ajpgi.00184.2013 • www.ajpgi.org

64. Padan E, Tzubery T, Herz K, Kozachkov L, Rimon A, Galili L. NhaAof Escherichia coli, as a model of a pH-regulated Na�/H�antiporter.Biochim Biophys Acta 1658: 2–13, 2004.
65. Peterson DA, McNulty NP, Guruge JL, Gordon JI. IgA response tosymbiotic bacteria as a mediator of gut homeostasis. Cell Host Microbe 2:328–339, 2007.
66. Pinner E, Kotler Y, Padan E, Schuldiner S. Physiological role of nhaB,a specific Na�/H� antiporter in Escherichia coli. J Biol Chem 268:1729–1734, 1993.
67. Salzman NH, Hung K, Haribhai D, Chu H, Karlsson-Sjoberg J, AmirE, Teggatz P, Barman M, Hayward M, Eastwood D, Stoel M, Zhou Y,Sodergren E, Weinstock GM, Bevins CL, Williams CB, Bos NA.Enteric defensins are essential regulators of intestinal microbial ecology.Nat Immunol 11: 76–83, 2010.
68. Sartor RB. Microbial influences in inflammatory bowel diseases. Gastro-enterology 134: 577–594, 2008.
69. Sato T, Vries RG, Snippert HJ, van de Wetering M, Barker N, StangeDE, van Es JH, Abo A, Kujala P, Peters PJ, Clevers H. Single Lgr5stem cells build crypt-villus structures in vitro without a mesenchymalniche. Nature 459: 262–265, 2009.
70. Scanlan PD, Shanahan F, O’Mahony C, Marchesi JR. Culture-inde-pendent analyses of temporal variation of the dominant fecal microbiotaand targeted bacterial subgroups in Crohn’s disease. J Clin Microbiol 44:3980–3988, 2006.
71. Schjorring S, Krogfelt KA. Assessment of bacterial antibiotic resistancetransfer in the gut. Int J Microbiol 2011: 312956, 2011.
72. Schultheis PJCL, Meneton P, Miller ML, Soleimani M, Gawenis LR,Riddle TM, Duffy JJ, Doetschman T, Wang T, Giebisch G, AronsonPS, Lorenz JN, Shull GE. Renal and intestinal absorptive defects in micelacking the NHE3. Nat Genet 19: 282–285, 1998.
73. Sekirov I, Tam NM, Jogova M, Robertson ML, Li Y, Lupp C, FinlayBB. Antibiotic-induced perturbations of the intestinal microbiota alter hostsusceptibility to enteric infection. Infect Immun 76: 4726–4736, 2008.
74. Serino M, Luche E, Gres S, Baylac A, Berge M, Cenac C, Waget A,Klopp P, Iacovoni J, Klopp C, Mariette J, Bouchez O, Lluch J,Ouarne F, Monsan P, Valet P, Roques C, Amar J, Bouloumie A,Theodorou V, Burcelin R. Metabolic adaptation to a high-fat diet isassociated with a change in the gut microbiota. Gut 61: 543–553, 2012.
75. Skulachev VP. Chemiosmotic systems in bioenergetics: H(�)-cycles andNa(�)-cycles. Biosci Rep 11: 387–441; discussion 441–384, 1991.
76. Skulachev VP. Membrane-linked energy transductions. Bioenergeticfunctions of sodium: H� is not unique as a coupling ion. Eur J Biochem151: 199–208, 1985.
77. Skulachev VP. The sodium cycle: a novel type of bacterial energetics. JBioenerg Biomembr 21: 635–647, 1989.
78. Sonnenburg JL, Xu J, Leip DD, Chen CH, Westover BP, WeatherfordJ, Buhler JD, Gordon JI. Glycan foraging in vivo by an intestine-adaptedbacterial symbiont. Science 307: 1955–1959, 2005.
79. Speelmans G, Poolman B, Abee T, Konings WN. Energy transduction inthe thermophilic anaerobic bacterium Clostridium fervidus is exclusivelycoupled to sodium ions. Proc Natl Acad Sci USA 90: 7975–7979, 1993.
80. Talbot C, Lytle C. Segregation of Na/H exchanger-3 and Cl/HCO3exchanger SLC26A3 (DRA) in rodent cecum and colon. Am J PhysiolGastrointest Liver Physiol 299: G358–G367, 2010.
81. Tasteyre A, Barc MC, Collignon A, Boureau H, Karjalainen T. Roleof FliC and FliD flagellar proteins of Clostridium difficile in adherenceand gut colonization. Infect Immun 69: 7937–7940, 2001.
82. Thiru S, Devereux G, King A. Abnormal fucosylation of ileal mucus incystic fibrosis: I. A histochemical study using peroxidase labelled lectins.J Clin Pathol 43: 1014–1018, 1990.
83. Thomsson KA, Hinojosa-Kurtzberg M, Axelsson KA, Domino SE,Lowe JB, Gendler SJ, Hansson GC. Intestinal mucins from cysticfibrosis mice show increased fucosylation due to an induced Fucalpha1–2glycosyltransferase. Biochem J 367: 609–616, 2002.
84. Turnbaugh PJ, Backhed F, Fulton L, Gordon JI. Diet-induced obesityis linked to marked but reversible alterations in the mouse distal gutmicrobiome. Cell Host Microbe 3: 213–223, 2008.
85. Turnbaugh PJ, Hamady M, Yatsunenko T, Cantarel BL, Duncan A,Ley RE, Sogin ML, Jones WJ, Roe BA, Affourtit JP, Egholm M,Henrissat B, Heath AC, Knight R, Gordon JI. A core gut microbiomein obese and lean twins. Nature 457: 480–484, 2009.
86. Turnbaugh PJ, Ley RE, Mahowald MA, Magrini V, Mardis ER,Gordon JI. An obesity-associated gut microbiome with increased capac-ity for energy harvest. Nature 444: 1027–1031, 2006.
87. Van der Sluis M, De Koning BA, De Bruijn AC, Velcich A, MeijerinkJP, Van Goudoever JB, Buller HA, Dekker J, Van Seuningen I, RenesIB, Einerhand AW. Muc2-deficient mice spontaneously develop colitis,indicating that MUC2 is critical for colonic protection. Gastroenterology131: 117–129, 2006.
88. Voth DE, Ballard JD. Clostridium difficile toxins: mechanism of actionand role in disease. Clin Microbiol Rev 18: 247–263, 2005.
89. Wilson DM, Wilson TH. Cation specificity for sugar substrates of themelibiose carrier in Escherichia coli. Biochim Biophys Acta 904: 191–200,1987.
90. Woo AL, Gildea LA, Tack LM, Miller ML, Spicer Z, Millhorn DE,Finkelman FD, Hassett DJ, Shull GE. In vivo evidence for interferon-gamma-mediated homeostatic mechanisms in small intestine of the NHE3Na�/H� exchanger knockout model of congenital diarrhea. J Biol Chem277: 49036–49046, 2002.
91. Xu J, Bjursell MK, Himrod J, Deng S, Carmichael LK, Chiang HC,Hooper LV, Gordon JI. A genomic view of the human-Bacteroidesthetaiotaomicron symbiosis. Science 299: 2074–2076, 2003.
92. Young VB, Schmidt TM. Antibiotic-associated diarrhea accompanied bylarge-scale alterations in the composition of the fecal microbiota. J ClinMicrobiol 42: 1203–1206, 2004.
G711LOSS OF NHE3 ALTERS GUT MICROBIOTA COMPOSITION
AJP-Gastrointest Liver Physiol • doi:10.1152/ajpgi.00184.2013 • www.ajpgi.org
Related Documents