Loss of Intrinsic Organization of Cerebellar Networks in Spinocerebellar Ataxia Type 1: Correlates with Disease Severity and Duration Ana Solodkin, Department of Neurology, MC 2030, The University of Chicago Hospitals, Chicago, IL, USA Eitan Peri, School of Physics and Astronomy, Tel-Aviv University, Tel Aviv, Israel E. Elinor Chen, Department of Neurology, MC 2030, The University of Chicago Hospitals, Chicago, IL, USA Eshel Ben-Jacob, and School of Physics and Astronomy, Tel-Aviv University, Tel Aviv, Israel Christopher M. Gomez Department of Neurology, MC 2030, The University of Chicago Hospitals, Chicago, IL, USA Ana Solodkin: [email protected] Abstract The spinocerebellar ataxias (SCAs) are a genetically heterogeneous group of cerebellar degenerative disorders, characterized by progressive gait unsteadiness, hand incoordination, and dysarthria. The mutational mechanism in SCA1, a dominantly inherited form of SCA, consists of an expanded trinucleotide CAG repeat. In SCA1, there is loss of Purkinje cells, neuronal loss in dentate nucleus, olives, and pontine nuclei. In the present study, we sought to apply intrinsic functional connectivity analysis combined with diffusion tensor imaging to define the state of cerebellar connectivity in SCA1. Our results on the intrinsic functional connectivity in lateral cerebellum and thalamus showed progressive organizational changes in SCA1 noted as a progressive increase in the absolute value of the correlation coefficients. In the lateral cerebellum, the anatomical organization of functional clusters seen as parasagittal bands in controls is lost, changing to a patchy appearance in SCA1. Lastly, only fractional anisotropy in the superior peduncle and changes in functional organization in thalamus showed a linear dependence to duration and severity of disease. The present pilot work represents an initial effort describing connectivity biomarkers of disease progression in SCA1. The functional changes detected with intrinsic functional analysis and diffusion tensor imaging suggest that disease progression can be analyzed as a disconnection syndrome. Keywords Networks; MRI; Biomarkers; Ataxia © Springer Science+Business Media, LLC 2010 Correspondence to: Ana Solodkin, [email protected]. Conflict of interest The authors declare no conflict of interest. NIH Public Access Author Manuscript Cerebellum. Author manuscript; available in PMC 2012 June 1. Published in final edited form as: Cerebellum. 2011 June ; 10(2): 218–232. doi:10.1007/s12311-010-0214-5. NIH-PA Author Manuscript NIH-PA Author Manuscript NIH-PA Author Manuscript

Welcome message from author
This document is posted to help you gain knowledge. Please leave a comment to let me know what you think about it! Share it to your friends and learn new things together.
Transcript
Loss of Intrinsic Organization of Cerebellar Networks inSpinocerebellar Ataxia Type 1: Correlates with Disease Severityand Duration
Ana Solodkin,Department of Neurology, MC 2030, The University of Chicago Hospitals, Chicago, IL, USA
Eitan Peri,School of Physics and Astronomy, Tel-Aviv University, Tel Aviv, Israel
E. Elinor Chen,Department of Neurology, MC 2030, The University of Chicago Hospitals, Chicago, IL, USA
Eshel Ben-Jacob, andSchool of Physics and Astronomy, Tel-Aviv University, Tel Aviv, Israel
Christopher M. GomezDepartment of Neurology, MC 2030, The University of Chicago Hospitals, Chicago, IL, USAAna Solodkin: [email protected]
AbstractThe spinocerebellar ataxias (SCAs) are a genetically heterogeneous group of cerebellardegenerative disorders, characterized by progressive gait unsteadiness, hand incoordination, anddysarthria. The mutational mechanism in SCA1, a dominantly inherited form of SCA, consists ofan expanded trinucleotide CAG repeat. In SCA1, there is loss of Purkinje cells, neuronal loss indentate nucleus, olives, and pontine nuclei. In the present study, we sought to apply intrinsicfunctional connectivity analysis combined with diffusion tensor imaging to define the state ofcerebellar connectivity in SCA1. Our results on the intrinsic functional connectivity in lateralcerebellum and thalamus showed progressive organizational changes in SCA1 noted as aprogressive increase in the absolute value of the correlation coefficients. In the lateral cerebellum,the anatomical organization of functional clusters seen as parasagittal bands in controls is lost,changing to a patchy appearance in SCA1. Lastly, only fractional anisotropy in the superiorpeduncle and changes in functional organization in thalamus showed a linear dependence toduration and severity of disease. The present pilot work represents an initial effort describingconnectivity biomarkers of disease progression in SCA1. The functional changes detected withintrinsic functional analysis and diffusion tensor imaging suggest that disease progression can beanalyzed as a disconnection syndrome.
KeywordsNetworks; MRI; Biomarkers; Ataxia
© Springer Science+Business Media, LLC 2010Correspondence to: Ana Solodkin, [email protected] of interest The authors declare no conflict of interest.
NIH Public AccessAuthor ManuscriptCerebellum. Author manuscript; available in PMC 2012 June 1.
Published in final edited form as:Cerebellum. 2011 June ; 10(2): 218–232. doi:10.1007/s12311-010-0214-5.
NIH
-PA Author Manuscript
NIH
-PA Author Manuscript
NIH
-PA Author Manuscript
IntroductionThe spinocerebellar ataxias (SCAs) are a genetically heterogeneous group of cerebellardegenerative disorders, characterized by progressive gait unsteadiness, hand incoordination,and dysarthria due to degeneration of the cerebellum or its connections [1–4]. Thepathological changes in the SCAs consist of degeneration of cerebellar Purkinje cells and,depending on the SCA type, of several other brainstem or deep brain nuclei. In particular,SCA1 has been described as a form of olivopontocerebellar atrophy [5–7].
Since the initial discovery in 1993 of the genetic cause of SCA1 [8], there has been anexplosion of research progress elucidating the genetics and molecular basis of numerousgenetic forms of SCA. However, while genetic advances have served as the staging platformfor preclinical studies to develop therapy, they have radically outstripped our progresstoward establishment of useful outcome measures to gauge the success of experimentaltherapies. A rating scale to estimate function in ataxia has recently been validated and shownto be sensitive to change, although, due to the slow rate of disease progression and largevariance, its usefulness is limited to long studies and large sample sizes [9–11].
Comparable limitations in the study of other neurodegenerative diseases have inspiredefforts to discover and validate structural, functional, or neurochemical biomarkers that arespecific for the type or sensitive to stage of different neurodegenerative diseases [12].Therefore, the identification and validation of surrogate measures of disease severity in SCAmay enhance our ability to reproducibly gauge disease progression and facilitate the designof more efficient therapeutic trials.
In the present study, we hypothesize that graded changes in specific pathways and theirassociated brain regions may contain the key for a better characterization of the progressionof illness in SCA1 [13]. To test this, we sought to apply functional MRI and diffusion tensorimaging to define the state of cerebellar connectivity. We then sought to test whether thereare changes in connectivity in the SCA1 ataxia and whether the degree of these changescorrelates with severity of ataxia.
Because of the complexity of cerebellar connectivity, it is not known which pathologicalchanges can be used as biomarkers of disease progression and severity. With this study, weintend to provide some insight in two outstanding points: (a) Is there a specific cerebellarpathway linearly associated with disease progression in SCA1? (b) Is there a characteristicsequence and temporal progression of the pathological changes in regional involvementwithin cerebellum and elsewhere?
MethodsSix research volunteers were recruited from The University of Chicago Ataxia Center. Inaddition, eight control age-matched subjects were recruited from the local community.Individuals with preexisting severe psychiatric or other neurological illnesses wereexcluded. The diagnosis of SCA1 was established by genetic testing at a commercial genetesting laboratory according to standard methods (Athena Diagnostics, Wooster, MA, USA).The clinical disease severity was estimated by means of an internationally validated ataxiarating scale (SARAII) performed the same day of the imaging study by a single examiner(CMG) [14]. The age of onset of the five affected patients ranged from 32 to 59 years (mean= 43.2) and disease duration from 2 to 13 years (mean = 8.0). The SARA rating scale scoresranged from 7.5 to 13.0 (mean = 10.8). In addition, one subject, age 33, bore a pathologicalrepeat expansion but was presymptomatic (SARA = 0). The demographics for all SCA1subjects are listed in Table 1.
Solodkin et al. Page 2
Cerebellum. Author manuscript; available in PMC 2012 June 1.
NIH
-PA Author Manuscript
NIH
-PA Author Manuscript
NIH
-PA Author Manuscript
This study and all procedures for recruitment and consent were approved by the InstitutionalReview Board of the University of Chicago.
ImagingScanning of subjects was performed on a clinical 3-T GE Signa MRI scanner (Waukesha,WI, USA) equipped with high-speed gradients.
The following sequences were used:
a. High-resolution anatomical images were acquired with a three-dimensionalmagnetization prepared rapid gradient echo (MPRAGE) sequence that used thefollowing parameters: echo time (TE) = 3.2 ms, repetition time (TR) = 8 ms,preparation time = 725 ms, flip angle 6°, and field of view 24 cm for a resolution of0.9375 × 0.9375 × 1.5 mm.
b. Diffusion tensor imaging (Turboprop-DTI): TR = 3,500 ms, eight spin echoes perTR (ETL = 8), and 5 k-space lines per spin echo (turbo-factor = 5); thus, each bladecontained 8 × 5 = 40 lines, 16 k-space blades per image, field of view = 24 × 24cm, 25 contiguous horizontal slices, and 2 × 2 × 3 mm voxel size. All images werereconstructed to a 256 × 256 matrix. DW images with b = 900 s/mm2 wereacquired for a set of 12 diffusion directions. Two b = 0 s/mm2 images wereacquired.
c. Proton density (PD) fast spin-echo sequence with two echo times. This providedPD and T2-weighted images in the same slice locations as the Turboprop-DTI: TE1= 20 ms, TE2 = 117 ms, TR = 7,000 ms, ETL = 16, field of view = 24 cm × 24 cm,25 contiguous horizontal slices, 3 mm slice thickness, and 192 × 256 image matrixreconstructed to 256 × 256.
d. Functional imaging acquisition at rest used the spiral k-space method [15]. Thirtycontiguous 5-mm axial slices were obtained starting from the vertex through thebottom of the cerebellum. A gradient echo spiral scan pulse sequence used a singlespiral to provide 1.875 × 1.875 × 5-mm resolution over a 24-cm field of view. T2*-weighted imaging was accomplished with a gradient TE of 25 ms and a TR of2,000 ms with a flip angle of 80°.
Primary AnalysisData analysis began with three-dimensional motion correction using weighted least squaresalignment of three translational and three rotational parameters and a rigid-body three-dimensional registration of images to align the functional and anatomical datasets. Thealignment parameters were computed by an iterative weighted least squares fit to a referencevolume [16]. All images were spatially registered in three dimensions to a referenceacquisition from the first fMRI run using the AFNI function 3dvolreg.
DTI—The diffusion tensors D, eigenvalues (λ1, λ2, λ3), and eigenvectors (ε1, ε2, ε3) of thetensors were estimated for all DTI acquisitions using our own script in C and the AFNIfunction 3dDWIto DT (images to tensor). From the eigenvalues of D, we estimatedfractional anisotropy, which characterizes the anisotropy of diffusion in the tissue.
Functional ImagingPreprocessing: Time series were bandpass filtered (0.01<f<0.08 Hz) and despiked with therespective AFNI functions 3dFourier and 3dDespike. Neither spatial nor temporalsmoothing of data was performed.
Solodkin et al. Page 3
Cerebellum. Author manuscript; available in PMC 2012 June 1.
NIH
-PA Author Manuscript
NIH
-PA Author Manuscript
NIH
-PA Author Manuscript
In addition, time series were normalized (mean = 0) using the following algorithm:
(1)
where Xi,j is the jth time sample of the ith voxel.
Finally, the first three time points on the time series were discarded to avoid scannerinstability.
Secondary AnalysisMulti-subject analysis was performed using an anatomical region-of-interest (ROI)approach, based on brain regions identified a priori on the basis of known functionalanatomy of the cerebellar system (Fig. 1).
Pathways were manually outlined in the PD images and then used as masks on the DTIimages for quantification of fractional anisotropy (FA) values. Gray matter regions weredrawn in the MPRAGE images for determination of intrinsic functional connectivity in thefunctional data at rest. The white matter masks were resampled to fit the resolution of theDTI images, and the gray matter masks were resampled to the blood oxygen level-dependentresolution using the AFNI function 3dresample (using nearest neighbor interpolation). Thebrain areas included the following: white matter regions: (a) intracerebellar white matter; (b)superior, medial, and inferior cerebellar peduncles; and (c) the corticospinal pathway [17];cerebellar peduncles were traced at the level of the fourth ventricle and within cerebellum.The medial cerebellar peduncle was drawn laterally to the hemispheres of lobules VI–VIIIadjacent to the lateral border of the dentate nucleus. The inferior cerebellar peduncle wasmarked ventral to the superior cerebellar peduncle between the lateral wall of the fourthventricle and the middle cerebellar peduncle. The superior cerebellar peduncle was found inthe hilus of the dentate nucleus running in the dorsal aspect of the fourth ventricle towardthe colliculi. The corticospinal pathway was marked at the cerebral peduncles in themidbrain, limited posteriorly by the substantia nigra [18]. The gray matter regions studiedconsisted of (d) the cerebellum, (e) red nuclei, (f) ventral medulla (olivary complex), (g)thalamus, and (h) globus pallidus–putamen. For the cerebellum, the anatomical parcellationwas done based on connectivity patterns [19]: vermis (limited laterally by the paravermiansulcus [20]), paravermal region (located between the lateral paravermal fissure and a verticalimaginary line at the level of the lateral border of the intraculminate fissure [21]), lateralcerebellum1 (limited medially by the same imaginary vertical line of the intraculminatefissure), flocculus–nodulus (limited by the posterolateral fissure), and dentate nucleus(defined in the DTI images since the resolution of the structural images did not havesufficient resolution). Because pontine nuclei are small and embedded within white matterfibers, our method for tertiary analysis could not be implemented.
The generation of DTI maps and functional connectivity measures as well as the generationof ROIs were performed blind to the clinical status of the subjects when possible.
1Anatomically [21], the lateral cerebellum included the following lobules: V lat (culmen inferior), VI lat (simplex), VIIA_Crus I/1,2(superior semilunar lobule), VIIA_Crus II/1,2 (inferior semilunar lobule), VIIB lat (paramedian/gracilis), VIIIA lat (biventer, parscopularis), and VIIIB lat (biventer, pars paraflocculus dorsalis).
Solodkin et al. Page 4
Cerebellum. Author manuscript; available in PMC 2012 June 1.
NIH
-PA Author Manuscript
NIH
-PA Author Manuscript
NIH
-PA Author Manuscript
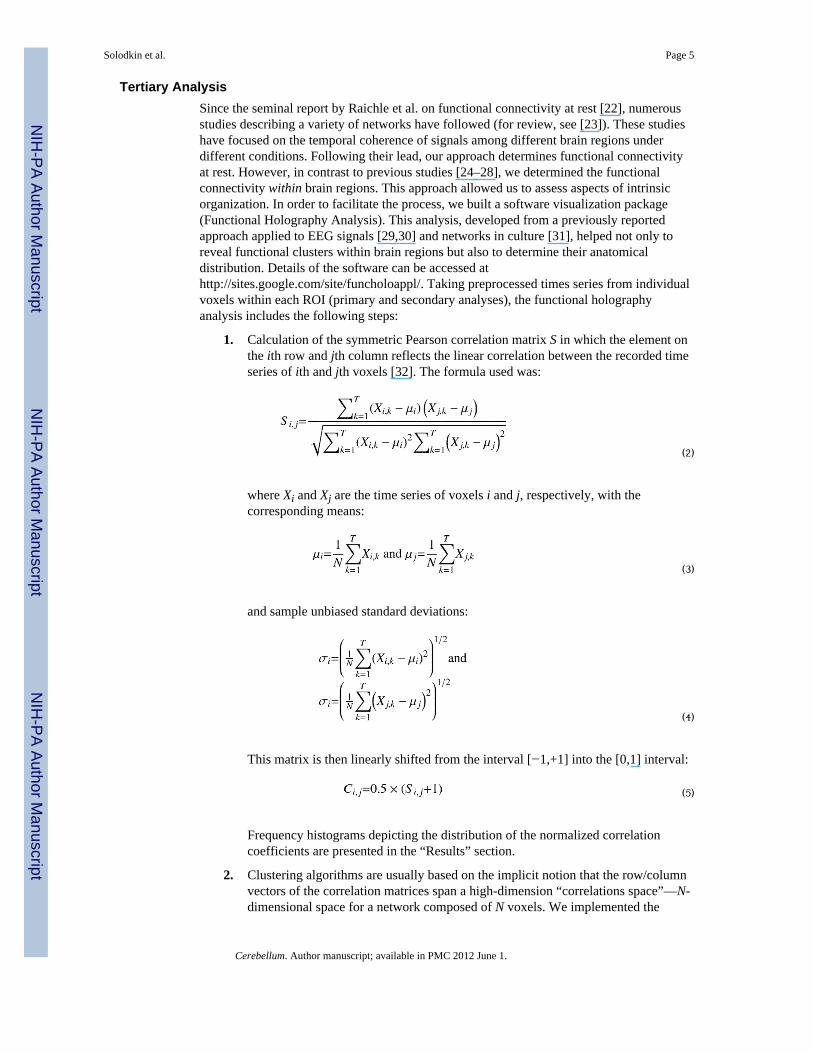
Tertiary AnalysisSince the seminal report by Raichle et al. on functional connectivity at rest [22], numerousstudies describing a variety of networks have followed (for review, see [23]). These studieshave focused on the temporal coherence of signals among different brain regions underdifferent conditions. Following their lead, our approach determines functional connectivityat rest. However, in contrast to previous studies [24–28], we determined the functionalconnectivity within brain regions. This approach allowed us to assess aspects of intrinsicorganization. In order to facilitate the process, we built a software visualization package(Functional Holography Analysis). This analysis, developed from a previously reportedapproach applied to EEG signals [29,30] and networks in culture [31], helped not only toreveal functional clusters within brain regions but also to determine their anatomicaldistribution. Details of the software can be accessed athttp://sites.google.com/site/funcholoappl/. Taking preprocessed times series from individualvoxels within each ROI (primary and secondary analyses), the functional holographyanalysis includes the following steps:
1. Calculation of the symmetric Pearson correlation matrix S in which the element onthe ith row and jth column reflects the linear correlation between the recorded timeseries of ith and jth voxels [32]. The formula used was:
(2)
where Xi and Xj are the time series of voxels i and j, respectively, with thecorresponding means:
(3)
and sample unbiased standard deviations:
(4)
This matrix is then linearly shifted from the interval [−1,+1] into the [0,1] interval:
(5)
Frequency histograms depicting the distribution of the normalized correlationcoefficients are presented in the “Results” section.
2. Clustering algorithms are usually based on the implicit notion that the row/columnvectors of the correlation matrices span a high-dimension “correlations space”—N-dimensional space for a network composed of N voxels. We implemented the
Solodkin et al. Page 5
Cerebellum. Author manuscript; available in PMC 2012 June 1.
NIH
-PA Author Manuscript
NIH
-PA Author Manuscript
NIH
-PA Author Manuscript
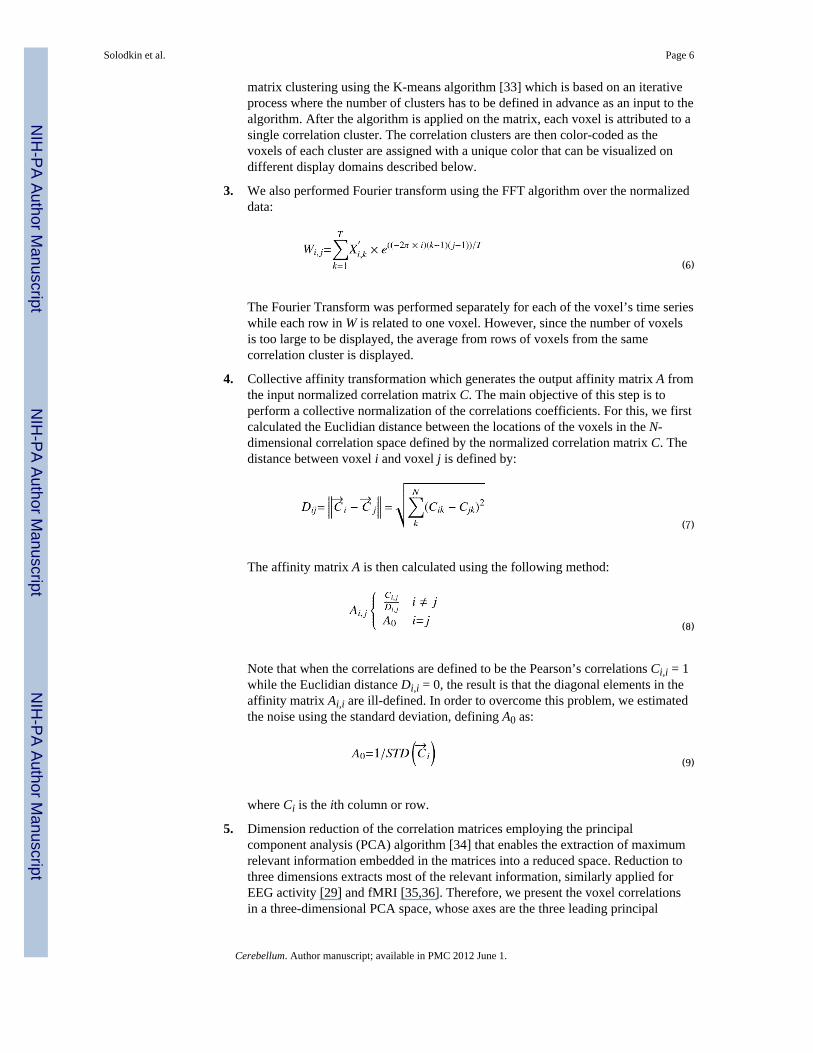
matrix clustering using the K-means algorithm [33] which is based on an iterativeprocess where the number of clusters has to be defined in advance as an input to thealgorithm. After the algorithm is applied on the matrix, each voxel is attributed to asingle correlation cluster. The correlation clusters are then color-coded as thevoxels of each cluster are assigned with a unique color that can be visualized ondifferent display domains described below.
3. We also performed Fourier transform using the FFT algorithm over the normalizeddata:
(6)
The Fourier Transform was performed separately for each of the voxel’s time serieswhile each row in W is related to one voxel. However, since the number of voxelsis too large to be displayed, the average from rows of voxels from the samecorrelation cluster is displayed.
4. Collective affinity transformation which generates the output affinity matrix A fromthe input normalized correlation matrix C. The main objective of this step is toperform a collective normalization of the correlations coefficients. For this, we firstcalculated the Euclidian distance between the locations of the voxels in the N-dimensional correlation space defined by the normalized correlation matrix C. Thedistance between voxel i and voxel j is defined by:
(7)
The affinity matrix A is then calculated using the following method:
(8)
Note that when the correlations are defined to be the Pearson’s correlations Ci,i = 1while the Euclidian distance Di,i = 0, the result is that the diagonal elements in theaffinity matrix Ai,i are ill-defined. In order to overcome this problem, we estimatedthe noise using the standard deviation, defining A0 as:
(9)
where Ci is the ith column or row.
5. Dimension reduction of the correlation matrices employing the principalcomponent analysis (PCA) algorithm [34] that enables the extraction of maximumrelevant information embedded in the matrices into a reduced space. Reduction tothree dimensions extracts most of the relevant information, similarly applied forEEG activity [29] and fMRI [35,36]. Therefore, we present the voxel correlationsin a three-dimensional PCA space, whose axes are the three leading principal
Solodkin et al. Page 6
Cerebellum. Author manuscript; available in PMC 2012 June 1.
NIH
-PA Author Manuscript
NIH
-PA Author Manuscript
NIH
-PA Author Manuscript
vectors computed by the PCA algorithm. Each voxel is placed in this PCA spaceaccording to its three eigenvalues for the three leading principal vectors. The nodesare color-coded with the same color as the original correlation cluster where thevoxel belongs. Hence, two voxels that have high normalized correlations will beplaced in close vicinity in the PCA space.
6. In order to quantify the distribution of voxels in the functional manifold (i.e., howcompact or scattered they distribute in this functional space), we performed a radiusof gyration measurement [34] for each correlation cluster. The radius of gyration iscalculated using the following algorithm:
(10)
where dist(i,j) is the Euclidean distance between nodes i and j in the functionalmanifold. These values where then normalized with the number of voxelscontained in each cluster. This provided a “density index” as described in the“Results” section.
Statistical AnalysisGroup Comparisons—To assess group differences of ROI volumes and FA, weperformed a Shapiro–Wilk test to determine multivariate normality for each measure. ABox’s M test was used to assess whether all groups had similar covariance matrices, and ifso, a parametric multivariate Hotelling T2 test was used. Otherwise, the nonparametricCramer test was applied.
Kurtosis measured the “peakedness” relative to a normal distribution of correlationcoefficients resulting from the functional connectivity analysis. It was calculated as thecentralized fourth moment divided by the squared variance minus 3.
In the case of the density index and kurtosis measures, we used the Wilcoxon rank sum testto assess weather data from the two groups had the same distribution. Finally, in order toassess possible confounds with partial tissue volumes, we calculated Pearson’s correlationwithin groups, between FA values and volumes of white matter ROIs.
Regression Analysis—In order to determine the existence of linear relationshipsbetween dependent MRI-derived variables (FA and kurtosis) and clinical independentvariables for the SCA1 individuals, a stepwise regression (forward and backward) wasconducted. The independent variables were the SARA score, duration of the disease (Ageminus age at onset), and the CAG repeat expansion size. During each step, a variable isadded (dropped) based on Akaike information criteria until the model cannot be improvedanymore. All statistical evaluations were done using SPSS 13.0 for Windows and R 2.1.1software.
ResultsThe SCA1 cohort included patients with different size CAG repeat expansions, differentseverity, and different duration of illness. The demographics for all SCA1 subjects are listedin Table 1. Likewise, the general degree of atrophy for selected SCA1 cases can beappreciated in the sagittal T1-weighted images in Fig. 2.
Solodkin et al. Page 7
Cerebellum. Author manuscript; available in PMC 2012 June 1.
NIH
-PA Author Manuscript
NIH
-PA Author Manuscript
NIH
-PA Author Manuscript
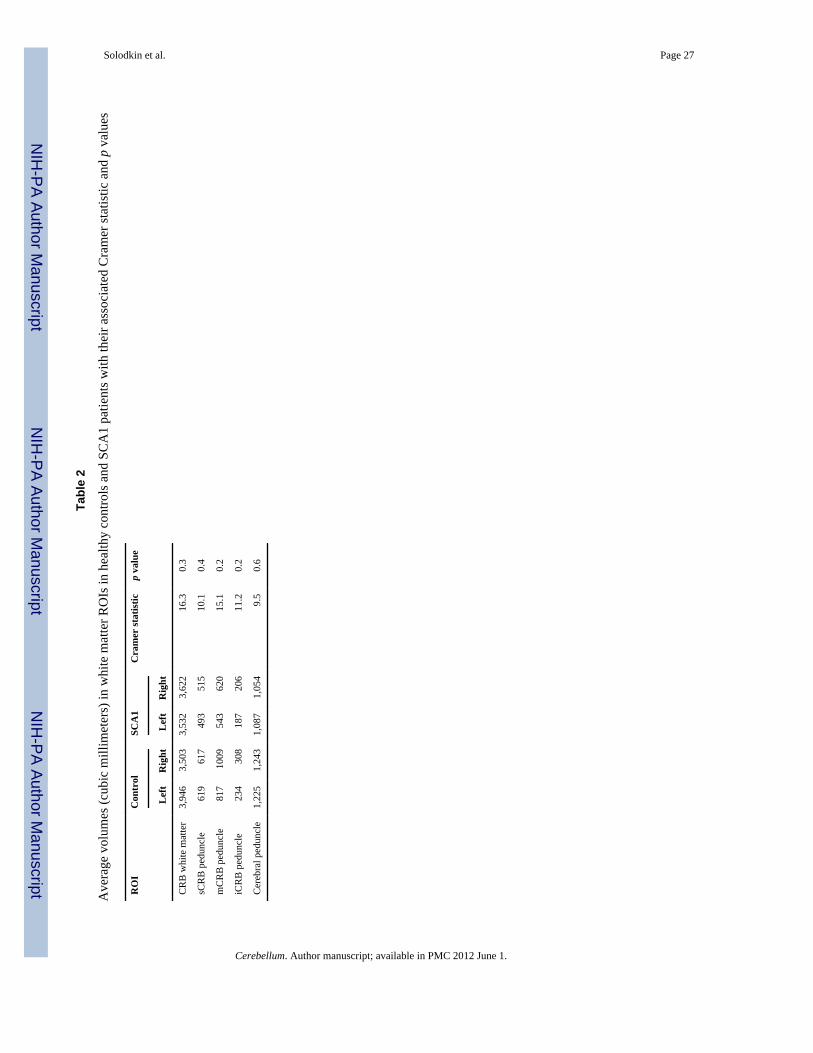
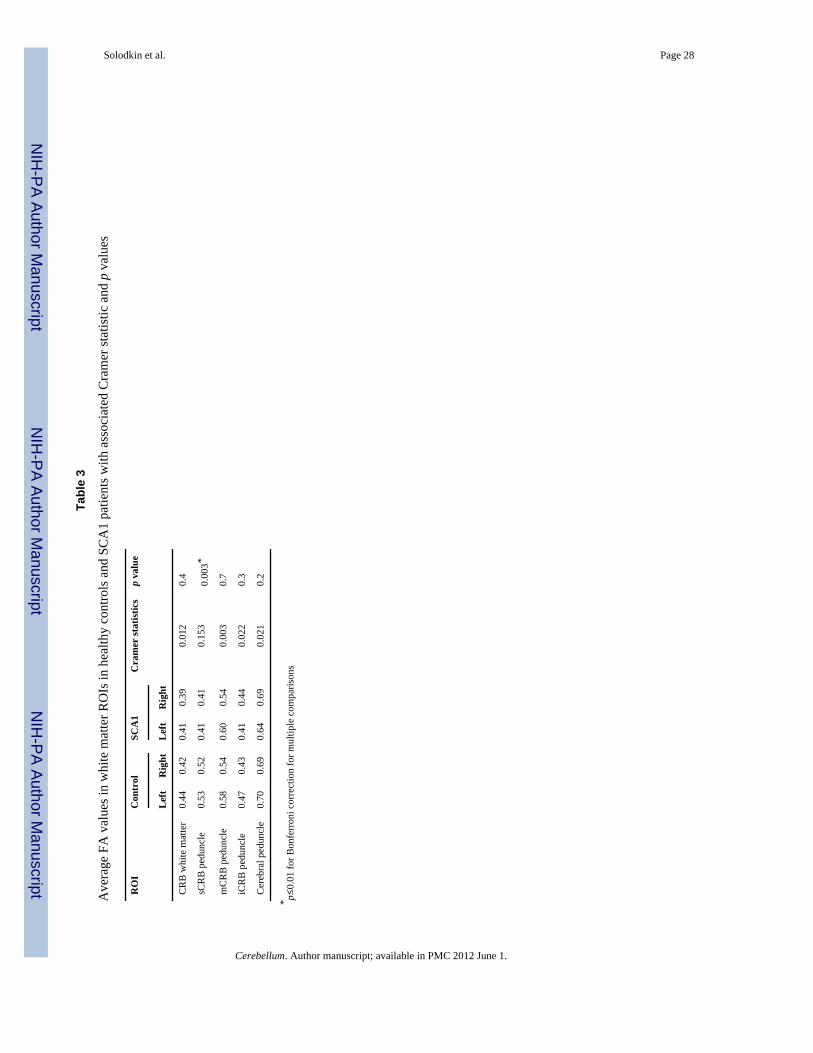
Group AnalysisThe main goal of the present work was to determine if changes in any of the main cerebellarpathways were linearly related to clinical independent variables (size of CAG repeatexpansion along severity and duration of illness). For this we first determined if there werestatistical differences in the size or FA of the cerebellar pathways in SCA1 individualscompared to healthy controls. The nonparametric multivariate Cramer test (left and rightbrain sides) showed no significant difference in volumes of white matter between SCA1 andcontrol groups even though their values in the SCA1 cases tended to be smaller (Table 2). Incontrast, the superior cerebellar peduncles of SCA1 patients had lower FA values (p =0.003) compared to controls (Fig. 3). Even when there was no difference with otherpathways (inferior and middle cerebellar peduncles, cerebral peduncle, and cerebellar whitematter), FA values in the ataxic group tended to be smaller (Table 3).
Stepwise regression (forward and backward) analysis was conducted on the averaged FAvalues in the white matter pathways using the clinical independent variables. Average FAvalues in the superior cerebellar peduncle increased linearly with duration of the illness (p =0.046) and decreased with SARA scores (p = 0.039) but not with the CAG repeat expansion.This linear relationship was not found in any other pathway. There was no significantcorrelation between age and mean FA values.
Functional ConnectivityBecause FA values in the superior cerebellar peduncles had a linear relationship with diseaseseverity and duration, next we determined if this observation was paralleled with changes inthe intrinsic organization of brain regions associated with the pathway. The majorcomponent of the pathway is the output originating in dentate nucleus that projects tothalamus [37]. Because of sizable degeneration of the dentate nucleus in some ataxic cases,we could not perform statistics. Hence, instead of targeting this nucleus, in addition tothalamus, we assessed the intrinsic functional organization of its main input from lateralcerebellum.
Lateral CerebellumIn healthy controls, functional clusters within lateral cerebellum had the following features:
The mean value of the correlation coefficient was low (mean = 0.104), while theirstatistical distribution was normal in all cases. The mean value for kurtosis was 0.07 ±0.34.
The anatomical distribution of the functional clusters was not random. Rather, thesewere arranged in stripes or bands in the mediolateral plane (Fig. 4a).
Similarly, functional clusters in the PCA space showed that their distribution wasdiscrete with absence of inter-cluster correlations. The mean density index for allclusters was 20.77 (range 0.02–58.57).
In contrast to healthy controls, functional clusters in SCA1 cases presented the followingfeatures (Fig. 4b–d):
Although the mean value of the correlation coefficients for all SCA1 subjects was low(mean = 0.071), their distribution was not normal. In most instances, distribution wasbimodal (Fig. 4c–d). Mean kurtosis value was −0.52 ± 0.42. When these values werecompared to those in controls, the Wilcoxon rank sum test showed a significantdifference (w = 32; p = 0.03). Stepwise regression analysis did not detect a lineardependence between kurtosis with illness severity and duration nor with the size of theCAG repeat expansion.
Solodkin et al. Page 8
Cerebellum. Author manuscript; available in PMC 2012 June 1.
NIH
-PA Author Manuscript
NIH
-PA Author Manuscript
NIH
-PA Author Manuscript

Remarkably, the anatomical distribution of the functional clusters was changed insymptomatic SCA1 cases. Instead of having a parasagittal distribution with segregatedstripes, they presented a patchy appearance. This tendency tended to be morepronounced in the more severe cases.
The PCA space showed two progressive changes. First, the distribution of the clustersbecame progressively denser and almost two-dimensional indicating the highercorrelation values among voxels. The mean density index for all the SCA1 cases was8.59 (range 0.02–17.63). This is an order of magnitude smaller than that of the healthycontrols (w = 0; p = 0.004). In addition, it was apparent the presence of strongcorrelation (at least −0.94) among voxels from different functional clusters in SCA1cases but not in controls.
Observations in the presymptomatic SCA1 case (SARA = 0) showed changes in thedensity index (9.33; range 8.5–12.8) and in the distribution of correlation coefficients(kurtosis = −0.334) but not in the anatomical distribution of the functional bands (Fig.6).
ThalamusThe intrinsic functional organization of the thalamus showed some parallels with those inlateral cerebellum (Fig. 5). The mean correlation coefficient was similar for the healthycontrols and the SCA1 cases (mean = 0.12 ± 0.95 for the former and mean = 0.12 ± 0.94 forthe latter). The distribution of correlation coefficients in all control cases was normal with amean kurtosis value of 0.44 ± 0.71. In the SCA1 group, the mean kurtosis value was 0.02 ±0.83. These ranged from similar values as in the controls in the less affected patients, togreatly diminished values in the more severe cases. With disease progression, the initialnormal distribution was replaced by a progressive bimodality. Stepwise regressiondemonstrated a linear increase between kurtosis and severity of illness (p = 0.0003) and alinear decrease with duration of illness (p = 0.0002), but not with the size of the CAG repeatexpansion.
With longer duration of disease, cluster distribution in the PCA space of SCA1 becamedenser and almost two-dimensional. However, as a group, there was no difference (w = 25; p= 0.3) in the density indexes between healthy controls (mean = 1.33; range 0.16–3.43) andSCA1 cases (mean = 1.82; range 0.21–7.1). In the most severe cases, strong negativecorrelation among voxels from different functional clusters started to be apparent.
Compared to controls, the presymptomatic SCA1 case did not present changes in theintrinsic organization of thalamus in terms of the statistical distribution of correlationcoefficients (kurtosis = 0.58) and the absence of strong inter-cluster correlations (Fig. 6).
Spectral analysis (Fig. 7) showed a progressive shift to smaller frequencies of signals withthe progression of disease. While in controls (and the presymptomatic SCA1), theproportion of frequencies had a more homogeneous distribution, in the symptomatic SCA1cases there was a progressive shift toward lower frequencies, albeit at a later time comparedto changes seen in lateral cerebellum.
DiscussionAnisotropy in the Superior Cerebellar Peduncles Is a Good Marker for DiseaseProgression
Even with a small cohort, our results showed that the FA associated with the superiorcerebellar peduncle differed in controls and SCA1 subjects where it varied linearly withseverity [38] and duration of disease, making it a suitable biomarker. Specifically, there was
Solodkin et al. Page 9
Cerebellum. Author manuscript; available in PMC 2012 June 1.
NIH
-PA Author Manuscript
NIH
-PA Author Manuscript
NIH
-PA Author Manuscript
an inverse relationship between severity of disease and the integrity of the pathway and adirect relationship with duration of illness. The positive correlation between FA and durationof illness is counterintuitive and may be due to the rate of progression rather than theduration of disease per se since size of the repeat expansion gives rise to an earlier age ofonset and ostensibly more severe disease [39].
The sensitivity of the superior cerebellar peduncle as biomarker for disease severity may bedue to the fact that is the only peduncle with components influencing both cerebral cortex(via thalamus) and brainstem (attesting to the distributed nature of this disease).
Of note, although the changes were not statistically significant, decreased volumes wereseen in all cerebellar peduncles and decreased FA values were seen in all but the middlecerebellar peduncle [38,40]. The lack of statistical significance can be attributed to theinclusion of the presymptomatic case in the calculations.
Qualitative Changes in the Correlation Coefficients in Lateral Cerebellum Were the EarliestChanges Seen in SCA1 Patients
Whereas in controls the correlation coefficients from functional clusters in lateralcerebellum were low, in SCA1 these were significantly larger as quantified by kurtosis anddensity index measures. These were the only changes that the SCA1 presymptomatic caseshared with the affected. Based on the spectral analysis, the immediate cause of this increasein the strength of the correlation coefficients can be attributed to a decrease in frequency inthe signals.
Neuropathological changes described in SCA1 in humans [5,6,41–44] and animal models[45–49] show that Purkinje cells are especially vulnerable to the toxic effects of mutantataxin-1. Thus, it is not surprising that early changes are seen in lateral cerebellum. Theprocess of degeneration, however, passes through progressive changes ranging from subtlephysiological alterations at the synaptic level to morphological changes in dendrites andending with neuronal death [50–52]. In SCA1 transgenic mice, one of the firstmanifestations of disease is an alteration of synaptic transmission in glutamatergic signalingin Purkinje cells [50,52]. These mild synaptic changes may lead to concomitant decrease inthe frequency and the amplitude of signals such as those seen in our presymptomatic case.With disease progression, morphological changes and cell death will occur. From animaging standpoint, these changes could be represented by further reduction in the signalsconsistent with overt ataxia.
Functional Intrinsic Organization of Lateral Cerebellum Reflects CerebellarCompartmentalization
The functional clusters in lateral cerebellum in control subjects were organized intoconcentric bands or stripes arranged parasagittally reminiscent of the stripes specific toPurkinje cells seen with zebrinI/II (aldolase C) in several species including humans [53–60].Interestingly, there is an anatomical coincidence between zebrinII stripes with the topologyof the olivocerebellar climbing fibers [61–64]. Functionally, the olivocerebellar climbingfibers synchronize complex spike activity in Purkinje cells [65–72] plausible because oftheir electrical coupling that generates synchronic oscillations [66,67,73–75]. These patternsof synchrony produced in Purkinje neurons by the inferior olivary complex are not static,changing during motor behaviors and pharmacological manipulations [70,71,76,77].
If the functional bands we detect in this study reflect this cerebellar compartmentalization[60], it is plausible that it is regulated by the climbing fiber system from the olivarycomplex. Support for this compartmentalization could potentially be based in thecomparison of sizes of our stripes with those found with immunohistochemical techniques.
Solodkin et al. Page 10
Cerebellum. Author manuscript; available in PMC 2012 June 1.
NIH
-PA Author Manuscript
NIH
-PA Author Manuscript
NIH
-PA Author Manuscript
Unfortunately, the single report on aldolase C bands in humans [60] albeit reporting theirexistence did not comment on their anatomical dimensions. Interestingly in other species,the zebrinII bands are not homogeneous, tending to be larger in lateral cerebellum [64].
Disruption of Functional Bands May Reflect Changes in the Olivocerebellar SystemDisruption of Purkinje cell synchronization follows the decoupling of olivary neurons bycarbenoxolone and in the connexin36 knockout mice [78,79]. Consequently, it is tempting tothink that disruption of functional bands in SCA1 is produced by the decoupling of inferiorolivary neurons resulting from pathological changes. Degeneration of inferior olives withneuronal death and gliosis is one of the neuropathological hallmarks in SCA1 [5–7].
To assert if possible olivary degeneration is present in our SCA1 cohort, we computed thenumber of voxels in the olivary region in all subjects. Indeed, although numbers are notnormalized by cranial volume, number of olivary voxels in SCA1 was smaller (mean = 9.5;range 7–14) than in controls (mean = 13.8; range 8–21). There are several potentialmechanisms for olivary degeneration. On the one hand, it could be a direct effect from themutated ataxin-1. Although there have been numerous studies reporting mouse geneticmodels of SCA1, there have not been opportunities to explore this issue [45–47,49,80].However, these models have reported the presence of neuronal intranuclear inclusions inolivary neurons. These inclusions that have been related to a reaction of neurons to reducethe toxic effect of mutant proteins [49] have also been used as markers for vulnerable cells[42,47,81–83]. A second alternative for olivary degeneration is through an indirect path.Retrograde degeneration could be produced by loss of synaptic targets due to Purkinje celldeath. This process, however, would require a significant amount of Purkinje cell death. Thefact that changes were seen in early SCA1 cases argues against this possibility. Conversely,anterograde degeneration could result from loss of inputs from deep cerebellar nuclei. Thisalternative is perhaps less likely because an experimental lesion of the dentate nucleus withkainic acid in rats produces an increase of synchrony in Purkinje cells [84], the oppositeeffect of what we observed in the symptomatic SCA1 patients.
In summary, if we assume that decoupling of olivocerebellar neurons is causing loss ofcerebellar compartmentalization in SCA1 cases, it becomes necessary to conclude that thisprocess should be taking place after pathological changes in Purkinje cells initialized (sincefunctional stripes were seen in the presymptomatic case) and before degeneration of thedentate nucleus occurs (since this produces an increase, not a decrease of synchrony).
The Progression of Changes in Thalamus as a Biomarker for SCA1Changes in the functional organization of thalamus in SCA1 showed two characteristics: (a)The absolute values of correlation coefficients (kurtosis) increased linearly with diseaseseverity and decreased linearly with disease duration. The functional organization in thepresymptomatic SCA1 case did not differ from healthy controls. (b) Thalamic changes weredelayed when compared to changes in the lateral cerebellum.
Although morphological changes in thalamus have not been typically associated withpathology of SCA1 [3,44,85,86], functional changes have not been tested. In our results,functional changes not only were readily apparent but they also had a linear relationshipwith severity and duration of disease. The strong linear relationship could be the result, onthe one hand, of the magnitude of the differences from the presymptomatic to the moresevere cases. On the other hand, it could be due to the fact that changes in the most severecases did not show a ceiling effect.
The linear dependence between variables in thalamus closely corresponds with a parallellinearity seen with FA values in the superior cerebellar peduncle highlighting the relevance
Solodkin et al. Page 11
Cerebellum. Author manuscript; available in PMC 2012 June 1.
NIH
-PA Author Manuscript
NIH
-PA Author Manuscript
NIH
-PA Author Manuscript
of the connectivity between cerebellum and cerebral cortex via thalamus as described inmacaques [87–92] and the possible development of cognitive changes with larger durationof disease [93,94]. Kurtosis values were the better descriptors of disease severity andduration that could be explained by loss of input. FA values of the superior cerebellarpeduncle not only are decreased [40,85] and vary according to disease severity but also theorigin of this pathway; the dentate nucleus also degenerates [43,86,95].
Hypothesis on the Progression of Disease Assessed with Connectivity AnalysisIn summary, we propose an anatomical hypothesis on the temporal course of pathologicalfunctional changes in SCA1 that suggest this disease a “disconnection syndrome” [13].Pathology initializes in Purkinje cells due to ataxin-1 toxicity reflected as functionaldownregulation of synaptic activity. Subsequently, pathological processes from ataxin-1expand to the inferior olivary nucleus, decoupling olivary cells and producing de-synchronization of Purkinje cells. This accelerates disease progression in Purkinje cellsproducing morphological changes and disrupting efferent signals to the dentate nucleus.Once this happens, thalamic functional changes follow. The eventual Purkinje neuronaldeath will produce deafferentation and degeneration of output neurons in the dentate nucleusand input signals from inferior olives. At present, a larger number of SCA1 cases must bestudied before definitive conclusions are reached. In addition, we plan to assess effectiveconnectivity among the nodes detected in this study (such as olivary complex, thalamus inaddition to red nucleus). Because this hypothesis could be tested experimentally, it can alsoassist in defining the efficacy of pharmacological agents to arrest the development of thisdevastating illness.
AcknowledgmentsWe want to thank Mr. R. Lyons for technical help in performing the scan sessions, Ms. N. Sansone for assisting inthe generation of anatomical ROIs, and Ms. N. Lobo for assisting in primary MRI analysis. Special thanks go to Dr.Christian Hansel for his valuable comments. The work was supported by grants from the Center for IntegrativeNeuroscience and Neuroengineering Research (CINNR), NIH RO1-NS-54942, and the James McDonnellFoundation (NRG group).
References1. Koeppen AH. The hereditary ataxias. J Neuropathol Exp Neurol. 1998; 57(6):531–543. [PubMed:
9630233]2. Klockgether T. Parkinsonism & related disorders. Ataxias. Parkinsonism Relat Disord. 2007; 13
Suppl 3:S391–S394.3. Manto MU. The wide spectrum of spinocerebellar ataxias (SCAs). Cerebellum. 2005; 4(1):2–6.
[PubMed: 15895552]4. Mascalchi M. Spinocerebellar ataxias. Neurol Sci. 2008; 29 Suppl 3:311–313. [PubMed: 18941720]5. Genis D, Matilla T, Volpini V, Rosell J, Davalos A, Ferrer I, et al. Clinical, neuropathologic, and
genetic studies of a large spinocerebellar ataxia type 1 (SCA1) kindred: (CAG)n expansion andearly premonitory signs and symptoms. Neurology. 1995; 45(1):24–30. [PubMed: 7824128]
6. Gilman S, Sima AA, Junck L, Kluin KJ, Koeppe RA, Lohman ME, et al. Spinocerebellar ataxia type1 with multiple system degeneration and glial cytoplasmic inclusions. Ann Neurol. 1996; 39(2):241–255. [PubMed: 8967756]
7. Matilla-Duenas A, Goold R, Giunti P. Clinical, genetic, molecular, and pathophysiological insightsinto spinocerebellar ataxia type 1. Cerebellum. 2008; 7(2):106–114. [PubMed: 18418661]
8. Orr HT, Chung MY, Banfi S, Kwiatkowski TJ Jr, Servadio A, Beaudet AL, et al. Expansion of anunstable trinucleotide CAG repeat in spinocerebellar ataxia type 1. Nat Genet. 1993; 4(3):221–226.[PubMed: 8358429]
Solodkin et al. Page 12
Cerebellum. Author manuscript; available in PMC 2012 June 1.
NIH
-PA Author Manuscript
NIH
-PA Author Manuscript
NIH
-PA Author Manuscript
9. Schmitz-Hubsch T, Giunti P, Stephenson DA, Globas C, Baliko L, Sacca F, et al. SCA functionalindex: a useful compound performance measure for spinocerebellar ataxia. Neurology. 2008; 71(7):486–492. [PubMed: 18695159]
10. Lynch DR, Farmer JM, Tsou AY, Perlman S, Subramony SH, Gomez CM, et al. MeasuringFriedreich ataxia: complementary features of examination and performance measures. Neurology.2006; 66(11):1711–1716. [PubMed: 16769945]
11. Lynch DR, Farmer JM, Wilson RL, Balcer LJ. Performance measures in Friedreich ataxia:potential utility as clinical outcome tools. Mov Disord. 2005; 20(7):777–782. [PubMed:15747359]
12. Rabinovici GD, Roberson ED. Beyond diagnosis: what biomarkers are teaching us about the“bio”logy of Alzheimer disease. Ann Neurol. 2010; 67(3):283–285. [PubMed: 20373338]
13. Schmahmann JD, Pandya DN. Disconnection syndromes of basal ganglia, thalamus, andcerebrocerebellar systems. Cortex. 2008; 44(8):1037–1066. [PubMed: 18614161]
14. Schmitz-Hubsch T, du Montcel ST, Baliko L, Berciano J, Boesch S, Depondt C, et al. Scale for theassessment and rating of ataxia: development of a new clinical scale. Neurology. 2006; 66(11):1717–1720. [PubMed: 16769946]
15. Noll DC, Cohen JD, Meyer CH, Schneider W. Spiral K-space MRI of cortical activation. J MagnReson Imaging. 1995; 5:49–56. [PubMed: 7696809]
16. Cox RW, Jesmanowicz A. Real-time 3D image registration for functional MRI. Magn Reson Med.1999; 42(6):1014–1018. [PubMed: 10571921]
17. Habas C, Cabanis EA. Anatomical parcellation of the brainstem and cerebellar white matter: apreliminary probabilistic tractography study at 3 T. Neuroradiology. 2007; 49(10):849–863.[PubMed: 17701168]
18. Walsh RR, Small SL, Chen EE, Solodkin A. Network activation during bimanual movements inhumans. Neuroimage. 2008; 43:540–553. [PubMed: 18718872]
19. Makris N, Schlerf JE, Hodge SM, Haselgrove C, Albaugh MD, Seidman LJ, et al. MRI-basedsurface-assisted parcellation of Cerebellum human cerebellar cortex: an anatomically specifiedmethod with estimate of reliability. Neuroimage. 2005; 25(4):1146–1160. [PubMed: 15850732]
20. Schmahmann, JD.; Doyon, J.; Toga, A.; Petrides, M.; Evans, A. MRI atlas of the humancerebellum. San Diego: Academic; 2000.
21. Makris N, Hodge SM, Haselgrove C, Kennedy DN, Dale A, Fischl B, et al. Human cerebellum:surface-assisted cortical parcellation and volumetry with magnetic resonance imaging. J CognNeurosci. 2003; 15(4):584–599. [PubMed: 12803969]
22. Raichle ME, MacLeod AM, Snyder AZ, Powers WJ, Gusnard DA, Shulman GL. A default modeof brain function. Proc Natl Acad Sci USA. 2001; 98(2):676–682. [PubMed: 11209064]
23. Auer DP. Spontaneous low-frequency blood oxygenation level-dependent fluctuations andfunctional connectivity analysis of the ‘resting’ brain. Magn Reson Imaging. 2008; 26(7):1055–1064. [PubMed: 18657923]
24. Diedrichsen J, Verstynen T, Schlerf J, Wiestler T. Advances in functional imaging of the humancerebellum. Curr Opin Neurol. 2010; 23(4):382–387. [PubMed: 20581682]
25. O’Reilly JX, Beckmann CF, Tomassini V, Ramnani N, Johansen-Berg H. Distinct and overlappingfunctional zones in the cerebellum defined by resting state functional connectivity. Cereb Cortex.2010; 20(4):953–965. [PubMed: 19684249]
26. Allen G, McColl R, Barnard H, Ringe WK, Fleckenstein J, Cullum CM. Magnetic resonanceimaging of cerebellar-prefrontal and cerebellar-parietal functional connectivity. Neuroimage.2005; 28(1):39–48. [PubMed: 16023375]
27. Habas C, Kamdar N, Nguyen D, Prater K, Beckmann CF, Menon V, et al. Distinct cerebellarcontributions to intrinsic connectivity networks. J Neurosci. 2009; 29(26):8586–8594. [PubMed:19571149]
28. Krienen FM, Buckner RL. Segregated fronto-cerebellar circuits revealed by intrinsic functionalconnectivity. Cereb Cortex. 2009; 19(10):2485–2497. [PubMed: 19592571]
29. Baruchi, I.; Grossman, D.; Volman, V.; Hunter, J.; Towle, VL.; Ben-Jacob, E. Functionalholography analysis: simplifying the complexity of dynamical networksStability of pattern
Solodkin et al. Page 13
Cerebellum. Author manuscript; available in PMC 2012 June 1.
NIH
-PA Author Manuscript
NIH
-PA Author Manuscript
NIH
-PA Author Manuscript
formation in networks of dynamical systems. In: Pecora, L.; Boccaletti, S., editors. Chaos. Vol. 16.2006. p. 15-112.
30. Baruchi I, Towle VL, Ben-Jacob E. Functional holography of complex networks activity—fromcultures to the human brain. Complexity. 2005; 10(3):38–51.
31. Baruchi I, Ben-Jacob E. Functional holography of recorded neuronal networks activity.Neuroinformatics. 2004; 2(3):333–352. [PubMed: 15365195]
32. Wolfram, S. The mathematica book. 4th ed.. Cambridge: Cambridge University Press; 1999.33. MacQueen, JB. Some methods for classification and analysis of multivariate observations.
Proceedings of 5-th Berkeley Symposium on Mathematical Statistics and Probability; Universityof California Press; Berkley. 1967. p. 281-297.
34. Grosberg, AU. Statistical physics of macromolecules. New York: Springer; 1994.35. Gavrilescu M, Stuart GW, Rossell S, Henshall K, McKay C, Sergejew AA, et al. Functional
connectivity estimation in fMRI data: influence of preprocessing and time course selection. HumBrain Mapp. 2008; 29(9):1040–1052. [PubMed: 17935181]
36. Damoiseaux JS, Rombouts SA, Barkhof F, Scheltens P, Stam CJ, Smith SM, et al. Consistentresting-state networks across healthy subjects. Proc Natl Acad Sci USA. 2006; 103(37):13848–13853. [PubMed: 16945915]
37. Miller RA, Strominger NL. An experimental study of the efferent connections of the superiorcerebellar peduncle in the rhesus monkey. Brain Res. 1977; 133(2):237–250. [PubMed: 409452]
38. Prakash N, Hageman N, Hua X, Toga AW, Perlman SL, Salamon N. Patterns of fractionalanisotropy changes in white matter of cerebellar peduncles distinguish spinocerebellar ataxia-1from multiple system atrophy and other ataxia syndromes. Neuroimage. 2009; 47 Suppl 2:T72–T81. [PubMed: 19446636]
39. Globas C, du Montcel ST, Baliko L, Boesch S, Depondt C, DiDonato S, et al. Early symptoms inspinocerebellar ataxia type 1, 2, 3, and 6. Mov Disord. 2008; 23(15):2232–2238. [PubMed:18759344]
40. Mandelli ML, De Simone T, Minati L, Bruzzone MG, Mariotti C, Fancellu R, et al. Diffusiontensor imaging of spinocerebellar ataxias types 1 and 2. AJNR Am J Neuroradiol. 2007; 28(10):1996–2000. [PubMed: 17998418]
41. Burk K, Abele M, Fetter M, Dichgans J, Skalej M, Laccone F, et al. Autosomal dominantcerebellar ataxia type I clinical features and MRI in families with SCA1, SCA2 and SCA3. Brain.1996; 119(Pt 5):1497–1505. [PubMed: 8931575]
42. Cummings CJ, Orr HT, Zoghbi HY. Progress in pathogenesis studies of spinocerebellar ataxia type1. Philos Trans R Soc Lond B Biol Sci. 1999; 354(1386):1079–1081. [PubMed: 10434309]
43. Ginestroni A, Dellanave R, Tessa C, Giannelli M, De Grandis D, Plasmati R, et al. Brain structuraldamage in spinocerebellar ataxia type 1: a VBM study. J Neurol. 2008; 255(8):1153–1158.[PubMed: 18438695]
44. Klockgether T, Skalej M, Wedekind D, Luft AR, Welte D, Schulz JB, et al. Autosomal dominantcerebellar ataxia type I. MRI-based volumetry of posterior fossa structures and basal ganglia inspinocerebellar ataxia types 1, 2 and 3. Brain. 1998; 121(Pt 9):1687–1693. [PubMed: 9762957]
45. Bowman AB, Lam YC, Jafar-Nejad P, Chen HK, Richman R, Samaco RC, et al. Duplication ofAtxn1l suppresses SCA1 neuropathology by decreasing incorporation of polyglutamine-expandedataxin-1 into native complexes. Nat Genet. 2007; 39(3):373–379. [PubMed: 17322884]
46. Burright EN, Clark HB, Servadio A, Matilla T, Feddersen RM, Yunis WS, et al. SCA1 transgenicmice: a model for neurodegeneration caused by an expanded CAG trinucleotide repeat. Cell. 1995;82(6):937–948. [PubMed: 7553854]
47. Clark HB, Orr HT. Spinocerebellar ataxia type 1—modeling the pathogenesis of a polyglutamineneurodegenerative disorder in transgenic mice. J Neuropathol Exp Neurol. 2000; 59(4):265–270.[PubMed: 10759181]
48. Lam YC, Bowman AB, Jafar-Nejad P, Lim J, Richman R, Fryer JD, et al. ATAXIN-1 interactswith the repressor Capicua in its native complex to cause SCA1 neuropathology. Cell. 2006;127(7):1335–1347. [PubMed: 17190598]
Solodkin et al. Page 14
Cerebellum. Author manuscript; available in PMC 2012 June 1.
NIH
-PA Author Manuscript
NIH
-PA Author Manuscript
NIH
-PA Author Manuscript
49. Yamada M, Sato T, Tsuji S, Takahashi H. CAG repeat disorder models and humanneuropathology: similarities and differences. Acta Neuropathol. 2008; 115(1):71–86. [PubMed:17786457]
50. Giovannoni R, Maggio N, Rosaria Bianco M, Cavaliere C, Cirillo G, Lavitrano M, et al. Reactiveastrocytosis and glial glutamate transporter clustering are early changes in a spinocerebellar ataxiatype 1 transgenic mouse model. Neuron Glia Biol. 2007; 3(4):335–351. [PubMed: 18634565]
51. Lin X, Antalffy B, Kang D, Orr HT, Zoghbi HY. Polyglutamine expansion down-regulates specificneuronal genes before pathologic changes in SCA1. Nat Neurosci. 2000; 3(2):157–163. [PubMed:10649571]
52. Serra HG, Byam CE, Lande JD, Tousey SK, Zoghbi HY, Orr HT. Gene profiling links SCA1pathophysiology to glutamate signaling in Purkinje cells of transgenic mice. Hum Mol Genet.2004; 13(20):2535–2543. [PubMed: 15317756]
53. Brochu G, Maler L, Hawkes R. Zebrin II: a polypeptide antigen expressed selectively by Purkinjecells reveals compartments in rat and fish cerebellum. J Comp Neurol. 1990; 291(4):538–552.[PubMed: 2329190]
54. Hawkes R, Herrup K. Aldolase C/zebrin II and the regionalization of the cerebellum. J MolNeurosci. 1995; 6(3):147–158. [PubMed: 8672398]
55. Leclerc N, Dore L, Parent A, Hawkes R. The compartmentalization of the monkey and ratcerebellar cortex: zebrin I and cytochrome oxidase. Brain Res. 1990; 506(1):70–78. [PubMed:2154279]
56. Leclerc N, Schwarting GA, Herrup K, Hawkes R, Yamamoto M. Compartmentation in mammaliancerebellum: zebrin II and P-path antibodies define three classes of sagittally organized bands ofPurkinje cells. Proc Natl Acad Sci USA. 1992; 89(11):5006–5010. [PubMed: 1594607]
57. Pakan JM, Iwaniuk AN, Wylie DR, Hawkes R, Marzban H. Purkinje cell compartmentation asrevealed by zebrin II expression in the cerebellar cortex of pigeons (Columba livia). J CompNeurol. 2007; 501(4):619–630. [PubMed: 17278140]
58. Sillitoe RV, Kunzle H, Hawkes R. Zebrin II compartmentation of the cerebellum in a basalinsectivore, the Madagascan hedgehog tenrec Echinops telfairi. J Anat. 2003; 203(3):283–296.[PubMed: 14529046]
59. Sillitoe RV, Malz CR, Rockland K, Hawkes R. Antigenic compartmentation of the primate andtree shrew cerebellum: a common topography of zebrin II in Macaca mulatta and Tupaiabelangeri. J Anat. 2004; 204(4):257–269. [PubMed: 15061752]
60. Buono P, D’Armiento FP, Terzi G, Alfieri A, Salvatore F. Differential distribution of aldolase Aand C in the human central nervous system. J Neurocytol. 2001; 30(12):957–965. [PubMed:12626877]
61. Armstrong CL, Hawkes R. Pattern formation in the cerebellar cortex. Biochem Cell Biol. 2000;78(5):551–562. [PubMed: 11103945]
62. Pijpers A, Voogd J, Ruigrok TJ. Topography of olivo-corticonuclear modules in the intermediatecerebellum of the rat. J Comp Neurol. 2005; 492(2):193–213. [PubMed: 16196034]
63. Sugihara I, Quy PN. Identification of aldolase C compartments in the mouse cerebellar cortex byolivocerebellar labeling. J Comp Neurol. 2007; 500(6):1076–1092. [PubMed: 17183552]
64. Sugihara I, Shinoda Y. Molecular, topographic, and functional organization of the cerebellarcortex: a study with combined aldolase C and olivocerebellar labeling. J Neurosci. 2004; 24(40):8771–8785. [PubMed: 15470143]
65. Eccles J, Llinas R, Sasaki K. Excitation of cerebellar Purkinje cells by the climbing fibres. Nature.1964; 203:245–246. [PubMed: 14201753]
66. Kazantsev VB, Nekorkin VI, Makarenko VI, Llinas R. Olivocerebellar cluster-based universalcontrol system. Proc Natl Acad Sci USA. 2003; 100(22):13064–13068. [PubMed: 14551321]
67. Llinas R, Leznik E, Makarenko VI. On the amazing olivocerebellar system. Ann NY Acad Sci.2002; 978:258–272. [PubMed: 12582059]
68. Llinas R, Nicholson C. Reversal properties of climbing fiber potential in cat Purkinje cells: anexample of a distributed synapse. J Neurophysiol. 1976; 39(2):311–323. [PubMed: 1255226]
69. Llinas RR. Inferior olive oscillation as the temporal basis for motricity and oscillatory reset as thebasis for motor error correction. Neuroscience. 2009; 162(3):797–804. [PubMed: 19393291]
Solodkin et al. Page 15
Cerebellum. Author manuscript; available in PMC 2012 June 1.
NIH
-PA Author Manuscript
NIH
-PA Author Manuscript
NIH
-PA Author Manuscript
70. Sugihara I, Lang EJ, Llinas R. Serotonin modulation of inferior olivary oscillations andsynchronicity: a multiple-electrode study in the rat cerebellum. Eur J Neurosci. 1995; 7(4):521–534. [PubMed: 7620604]
71. Welsh JP, Lang EJ, Suglhara I, Llinas R. Dynamic organization of motor control within theolivocerebellar system. Nature. 1995; 374(6521):453–457. [PubMed: 7700354]
72. Yamamoto T, Fukuda M, Llinas R. Bilaterally synchronous complex spike Purkinje cell activity inthe mammalian cerebellum. Eur J Neurosci. 2001; 13(2):327–339. [PubMed: 11168537]
73. Sugihara I, Lang EJ, Llinas R. Uniform olivocerebellar conduction time underlies Purkinje cellcomplex spike synchronicity in the rat cerebellum. J Physiol. 1993; 470:243–271. [PubMed:8308729]
74. Welsh JP, Llinas R. Some organizing principles for the control of movement based onolivocerebellar physiology. Prog Brain Res. 1997; 114:449–461. [PubMed: 9193160]
75. Sugihara I, Marshall SP, Lang EJ. Relationship of complex spike synchrony bands and climbingfiber projection determined by reference to aldolase C compartments in crus IIa of the ratcerebellar cortex. J Comp Neurol. 2007; 501(1):13–29. [PubMed: 17206616]
76. Lang EJ. Organization of olivocerebellar activity in the absence of excitatory glutamatergic input. JNeurosci. 2001; 21(5):1663–1675. [PubMed: 11222657]
77. Lang EJ. GABAergic and glutamatergic modulation of spontaneous and motor-cortex-evokedcomplex spike activity. J Neurophysiol. 2002; 87(4):1993–2008. [PubMed: 11929918]
78. Blenkinsop TA, Lang EJ. Block of inferior olive gap junctional coupling decreases Purkinje cellcomplex spike synchrony and rhythmicity. J Neurosci. 2006; 26(6):1739–1748. [PubMed:16467522]
79. Marshall SP, Lang EJ. Inferior olive oscillations gate transmission of motor cortical activity to thecerebellum. J Neurosci. 2004; 24(50):11356–11367. [PubMed: 15601942]
80. Serra HG, Duvick L, Zu T, Carlson K, Stevens S, Jorgensen N, et al. RORalpha-mediated Purkinjecell development determines disease severity in adult SCA1 mice. Cell. 2006; 127(4):697–708.[PubMed: 17110330]
81. Duenas AM, Goold R, Giunti P. Molecular pathogenesis of spinocerebellar ataxias. Brain. 2006;129(Pt 6):1357–1370. [PubMed: 16613893]
82. Ross CA, Poirier MA. Protein aggregation and neurodegenerative disease. Nat Med. 2004; 10Suppl:S10–S17. [PubMed: 15272267]
83. Skinner PJ, Vierra-Green CA, Clark HB, Zoghbi HY, Orr HT. Altered trafficking of membraneproteins in Purkinje cells of SCA1 transgenic mice. Am J Pathol. 2001; 159(3):905–913.[PubMed: 11549583]
84. Lang EJ, Sugihara I, Llinas R. GABAergic modulation of complex spike activity by the cerebellarnucleoolivary pathway in rat. J Neurophysiol. 1996; 76(1):255–275. [PubMed: 8836223]
85. Della Nave R, Ginestroni A, Tessa C, Salvatore E, De Grandis D, Plasmati R, et al. Brain whitematter damage in SCA1 and SCA2. An in vivo study using voxel-based morphometry, histogramanalysis of mean diffusivity and tract-based spatial statistics. Neuroimage. 2008; 43(1):10–19.[PubMed: 18672073]
86. Guerrini L, Lolli F, Ginestroni A, Belli G, Della Nave R, Tessa C, et al. Brainstemneurodegeneration correlates with clinical dysfunction in SCA1 but not in SCA2. A quantitativevolumetric, diffusion and proton spectroscopy MR study. Brain. 2004; 127(Pt 8):1785–1795.[PubMed: 15240431]
87. Akkal D, Dum RP, Strick PL. Supplementary motor area and presupplementary motor area: targetsof basal ganglia and cerebellar output. J Neurosci. 2007; 27(40):10659–10673. [PubMed:17913900]
88. Dum RP, Strick PL. An unfolded map of the cerebellar dentate nucleus and its projections to thecerebral cortex. J Neurophysiol. 2003; 89(1):634–639. [PubMed: 12522208]
89. Hoover JE, Strick PL. The organization of cerebellar and basal ganglia outputs to primary motorcortex as revealed by retrograde transneuronal transport of herpes simplex virus type 1. J Neurosci.1999; 19(4):1446–1463. [PubMed: 9952421]
90. Kelly RM, Strick PL. Cerebellar loops with motor cortex and prefrontal cortex of a nonhumanprimate. J Neurosci. 2003; 23(23):8432–8444. [PubMed: 12968006]
Solodkin et al. Page 16
Cerebellum. Author manuscript; available in PMC 2012 June 1.
NIH
-PA Author Manuscript
NIH
-PA Author Manuscript
NIH
-PA Author Manuscript
91. Middleton FA, Strick PL. Cerebellar output channels. Int Rev Neurobiol. 1997; 41:61–82.[PubMed: 9378611]
92. Middleton FA, Strick PL. Dentate output channels: motor and cognitive components. Prog BrainRes. 1997; 114:553–566. [PubMed: 9193166]
93. Schmahmann JD. Disorders of the cerebellum: ataxia, dysmetria of thought, and the cerebellarcognitive affective syndrome. J Neuropsychiatry Clin Neurosci. 2004; 16(3):367–378. [PubMed:15377747]
94. Schmahmann JD, Caplan D. Cognition, emotion and the cerebellum. Brain. 2006; 129(Pt 2):290–292. [PubMed: 16434422]
95. Della Nave R, Foresti S, Tessa C, Moretti M, Ginestroni A, Gavazzi C, et al. ADC mapping ofneurodegeneration in the brainstem and cerebellum of patients with progressive ataxias.Neuroimage. 2004; 22(2):698–705. [PubMed: 15193598]
Solodkin et al. Page 17
Cerebellum. Author manuscript; available in PMC 2012 June 1.
NIH
-PA Author Manuscript
NIH
-PA Author Manuscript
NIH
-PA Author Manuscript
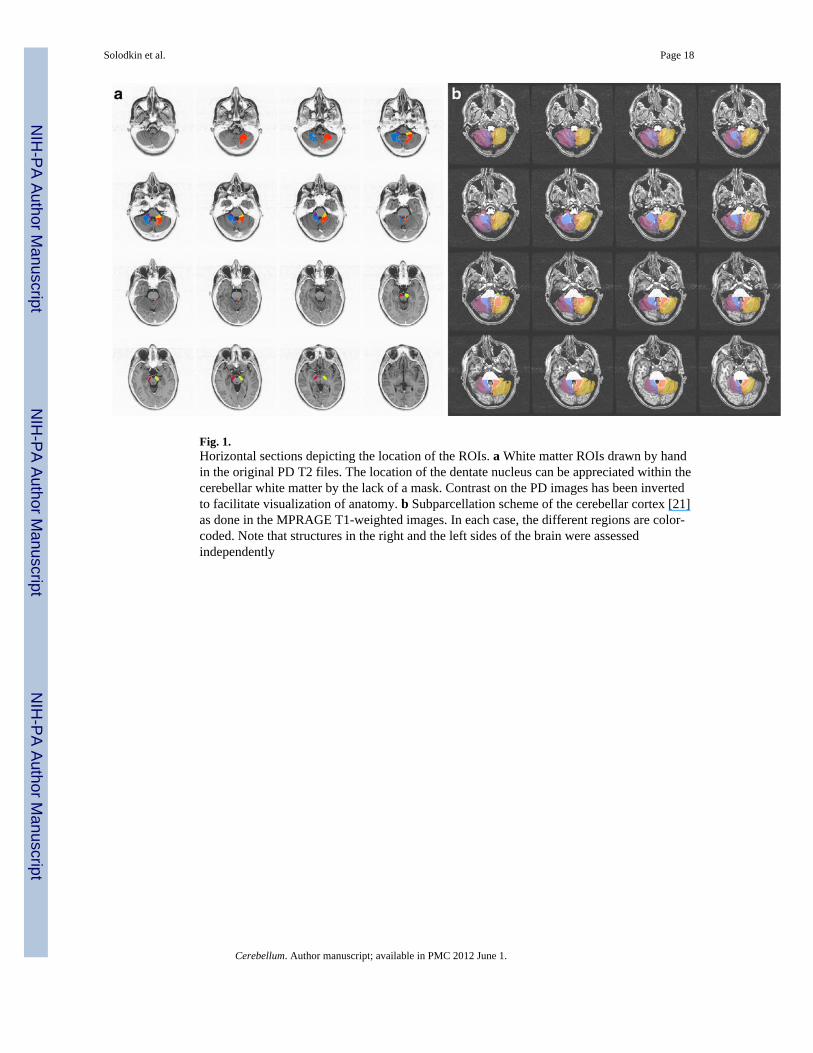
Fig. 1.Horizontal sections depicting the location of the ROIs. a White matter ROIs drawn by handin the original PD T2 files. The location of the dentate nucleus can be appreciated within thecerebellar white matter by the lack of a mask. Contrast on the PD images has been invertedto facilitate visualization of anatomy. b Subparcellation scheme of the cerebellar cortex [21]as done in the MPRAGE T1-weighted images. In each case, the different regions are color-coded. Note that structures in the right and the left sides of the brain were assessedindependently
Solodkin et al. Page 18
Cerebellum. Author manuscript; available in PMC 2012 June 1.
NIH
-PA Author Manuscript
NIH
-PA Author Manuscript
NIH
-PA Author Manuscript
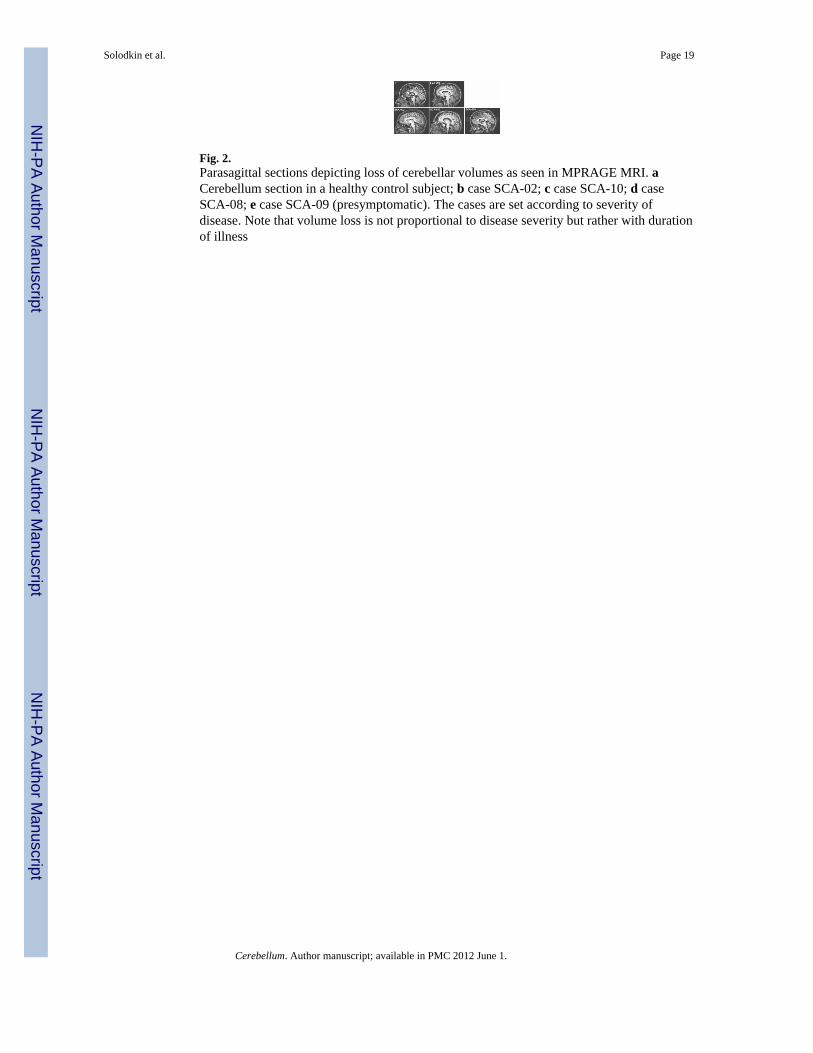
Fig. 2.Parasagittal sections depicting loss of cerebellar volumes as seen in MPRAGE MRI. aCerebellum section in a healthy control subject; b case SCA-02; c case SCA-10; d caseSCA-08; e case SCA-09 (presymptomatic). The cases are set according to severity ofdisease. Note that volume loss is not proportional to disease severity but rather with durationof illness
Solodkin et al. Page 19
Cerebellum. Author manuscript; available in PMC 2012 June 1.
NIH
-PA Author Manuscript
NIH
-PA Author Manuscript
NIH
-PA Author Manuscript
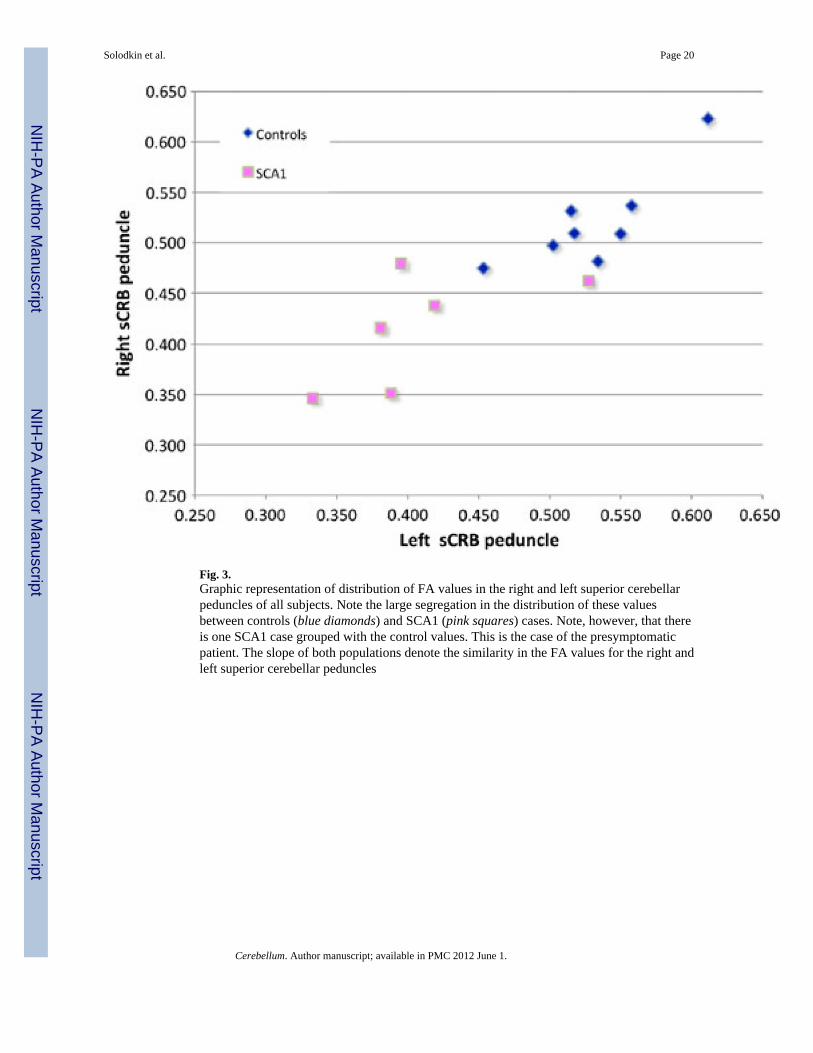
Fig. 3.Graphic representation of distribution of FA values in the right and left superior cerebellarpeduncles of all subjects. Note the large segregation in the distribution of these valuesbetween controls (blue diamonds) and SCA1 (pink squares) cases. Note, however, that thereis one SCA1 case grouped with the control values. This is the case of the presymptomaticpatient. The slope of both populations denote the similarity in the FA values for the right andleft superior cerebellar peduncles
Solodkin et al. Page 20
Cerebellum. Author manuscript; available in PMC 2012 June 1.
NIH
-PA Author Manuscript
NIH
-PA Author Manuscript
NIH
-PA Author Manuscript
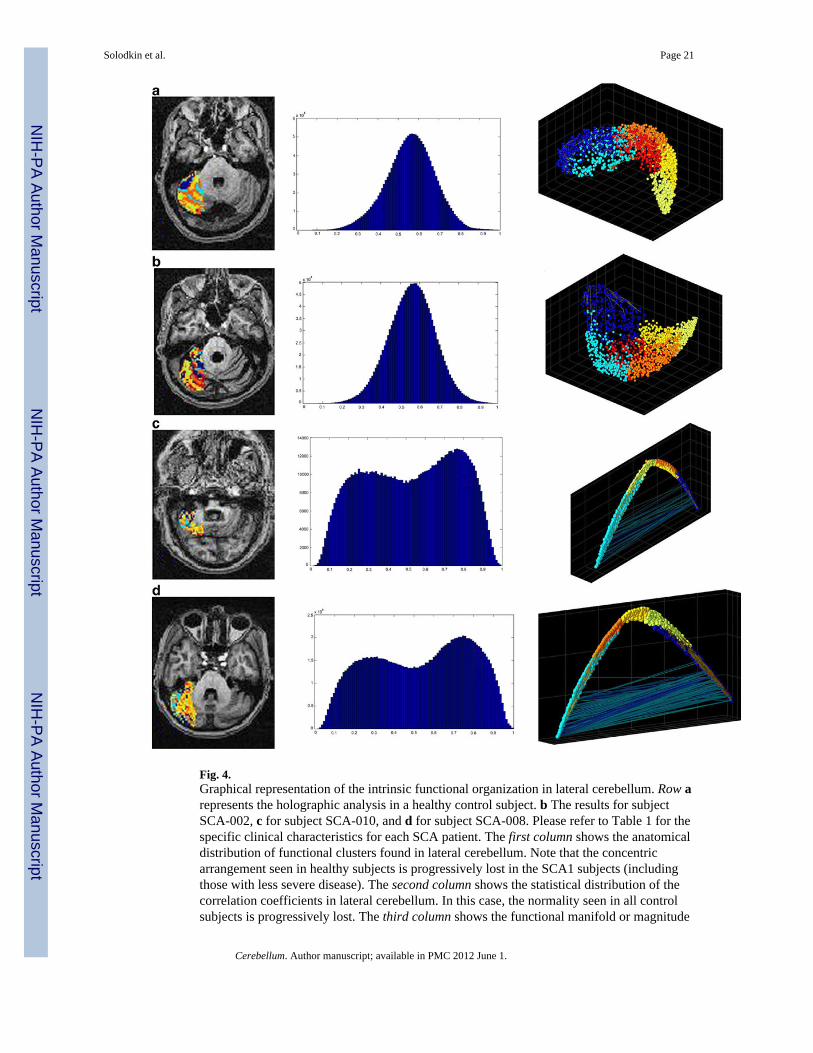
Fig. 4.Graphical representation of the intrinsic functional organization in lateral cerebellum. Row arepresents the holographic analysis in a healthy control subject. b The results for subjectSCA-002, c for subject SCA-010, and d for subject SCA-008. Please refer to Table 1 for thespecific clinical characteristics for each SCA patient. The first column shows the anatomicaldistribution of functional clusters found in lateral cerebellum. Note that the concentricarrangement seen in healthy subjects is progressively lost in the SCA1 subjects (includingthose with less severe disease). The second column shows the statistical distribution of thecorrelation coefficients in lateral cerebellum. In this case, the normality seen in all controlsubjects is progressively lost. The third column shows the functional manifold or magnitude
Solodkin et al. Page 21
Cerebellum. Author manuscript; available in PMC 2012 June 1.
NIH
-PA Author Manuscript
NIH
-PA Author Manuscript
NIH
-PA Author Manuscript

reduction as seen by the first three principal components. In this case, not only thedistribution changes, but in the most severe cases, it is apparent the presence of highnegative correlations among clusters
Solodkin et al. Page 22
Cerebellum. Author manuscript; available in PMC 2012 June 1.
NIH
-PA Author Manuscript
NIH
-PA Author Manuscript
NIH
-PA Author Manuscript
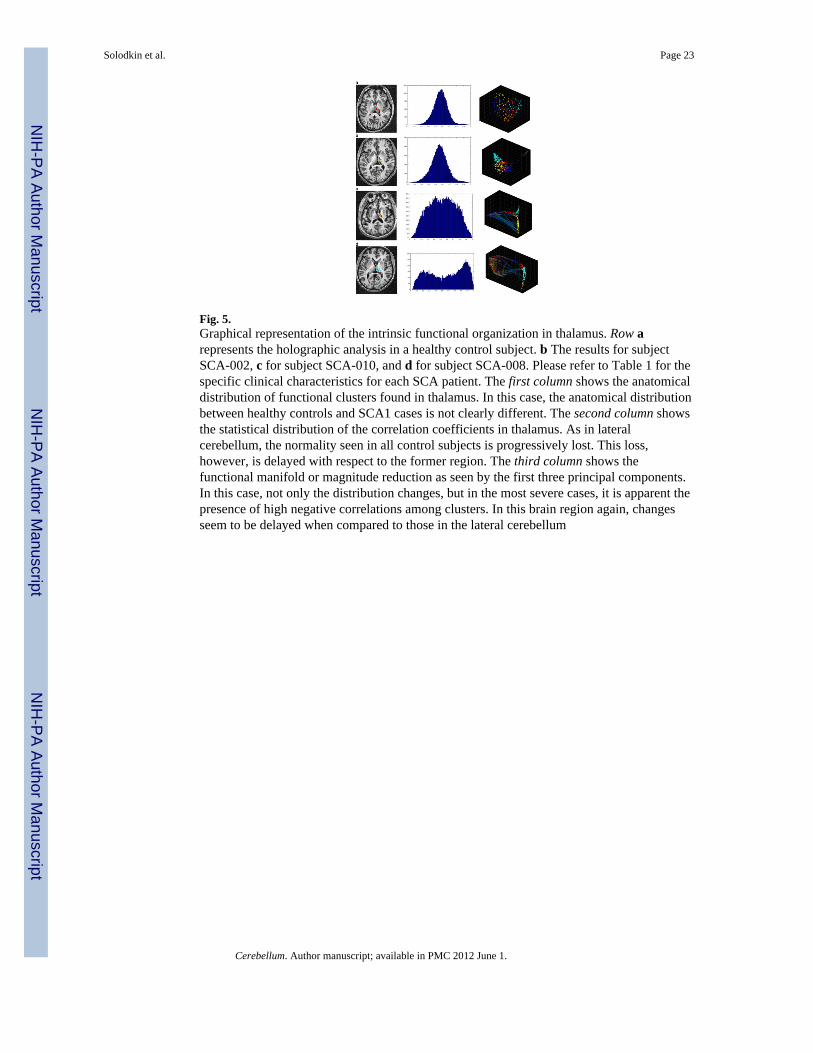
Fig. 5.Graphical representation of the intrinsic functional organization in thalamus. Row arepresents the holographic analysis in a healthy control subject. b The results for subjectSCA-002, c for subject SCA-010, and d for subject SCA-008. Please refer to Table 1 for thespecific clinical characteristics for each SCA patient. The first column shows the anatomicaldistribution of functional clusters found in thalamus. In this case, the anatomical distributionbetween healthy controls and SCA1 cases is not clearly different. The second column showsthe statistical distribution of the correlation coefficients in thalamus. As in lateralcerebellum, the normality seen in all control subjects is progressively lost. This loss,however, is delayed with respect to the former region. The third column shows thefunctional manifold or magnitude reduction as seen by the first three principal components.In this case, not only the distribution changes, but in the most severe cases, it is apparent thepresence of high negative correlations among clusters. In this brain region again, changesseem to be delayed when compared to those in the lateral cerebellum
Solodkin et al. Page 23
Cerebellum. Author manuscript; available in PMC 2012 June 1.
NIH
-PA Author Manuscript
NIH
-PA Author Manuscript
NIH
-PA Author Manuscript
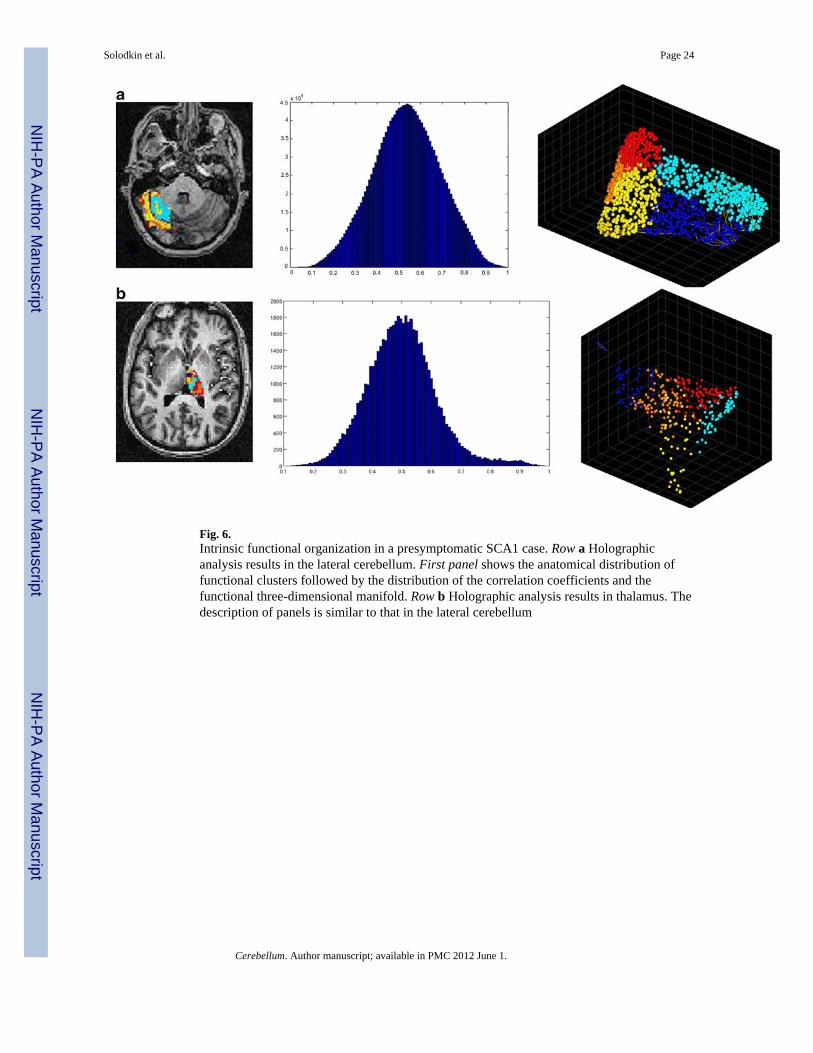
Fig. 6.Intrinsic functional organization in a presymptomatic SCA1 case. Row a Holographicanalysis results in the lateral cerebellum. First panel shows the anatomical distribution offunctional clusters followed by the distribution of the correlation coefficients and thefunctional three-dimensional manifold. Row b Holographic analysis results in thalamus. Thedescription of panels is similar to that in the lateral cerebellum
Solodkin et al. Page 24
Cerebellum. Author manuscript; available in PMC 2012 June 1.
NIH
-PA Author Manuscript
NIH
-PA Author Manuscript
NIH
-PA Author Manuscript
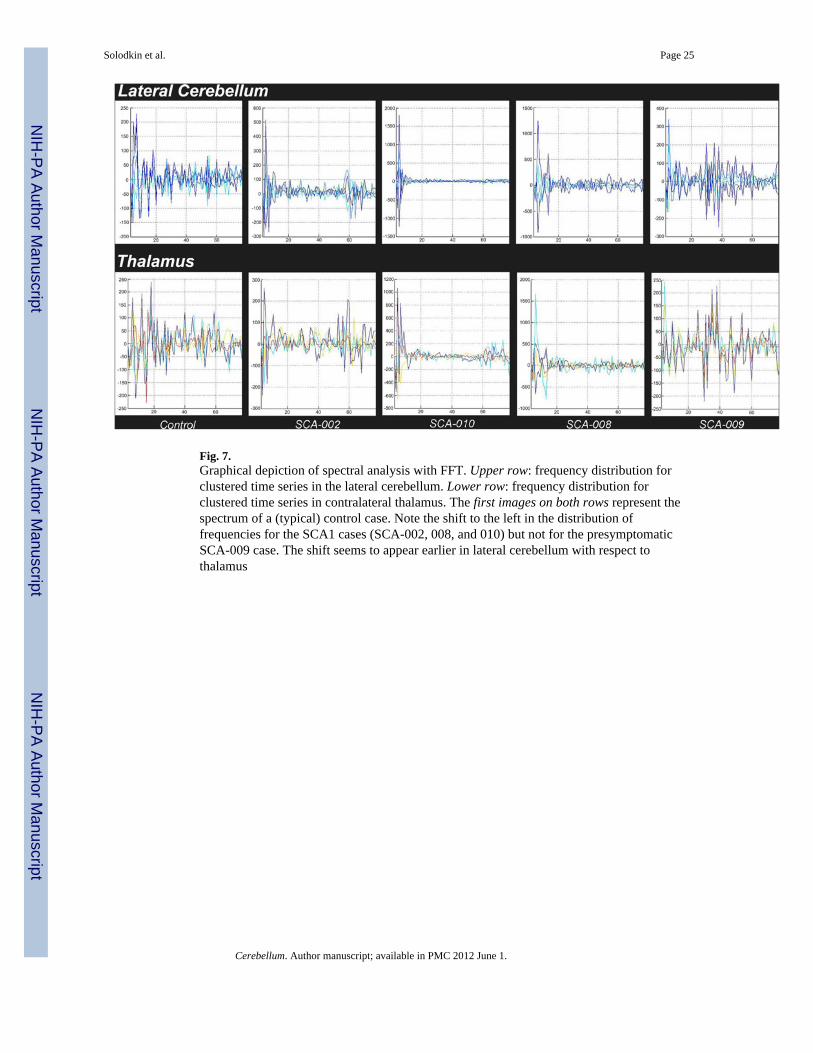
Fig. 7.Graphical depiction of spectral analysis with FFT. Upper row: frequency distribution forclustered time series in the lateral cerebellum. Lower row: frequency distribution forclustered time series in contralateral thalamus. The first images on both rows represent thespectrum of a (typical) control case. Note the shift to the left in the distribution offrequencies for the SCA1 cases (SCA-002, 008, and 010) but not for the presymptomaticSCA-009 case. The shift seems to appear earlier in lateral cerebellum with respect tothalamus
Solodkin et al. Page 25
Cerebellum. Author manuscript; available in PMC 2012 June 1.
NIH
-PA Author Manuscript
NIH
-PA Author Manuscript
NIH
-PA Author Manuscript
NIH
-PA Author Manuscript
NIH
-PA Author Manuscript
NIH
-PA Author Manuscript
Solodkin et al. Page 26
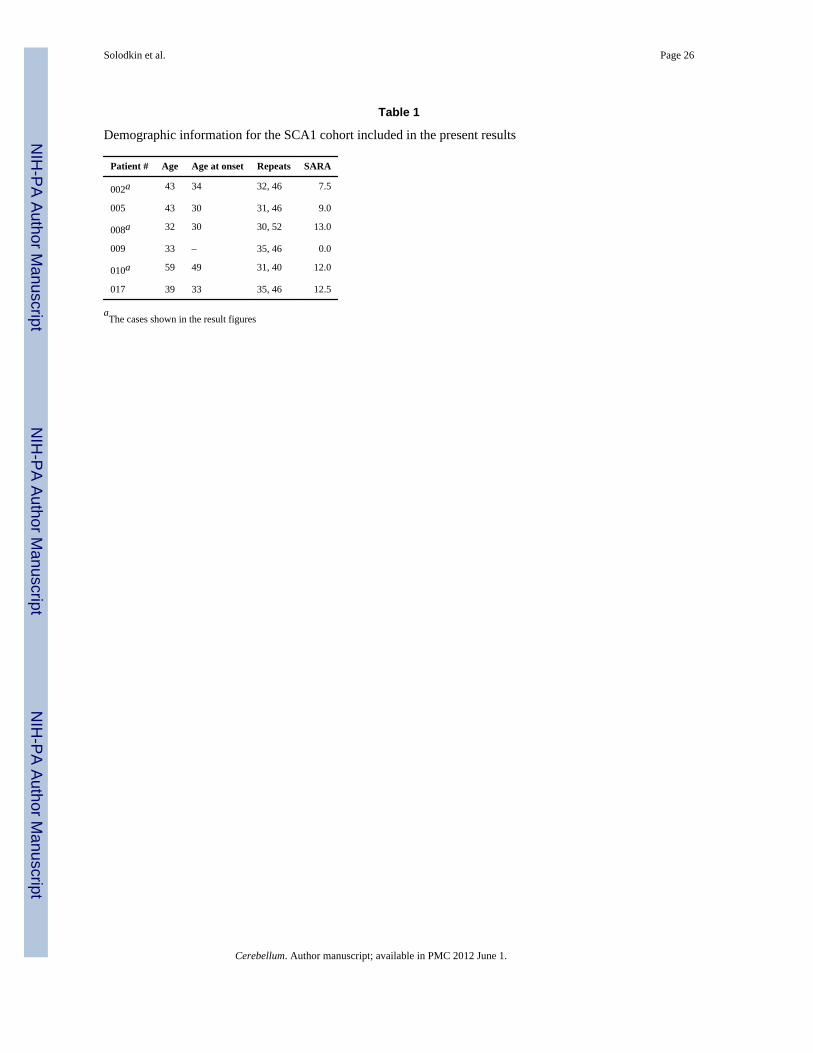
Table 1
Demographic information for the SCA1 cohort included in the present results
Patient # Age Age at onset Repeats SARA
002a 43 34 32, 46 7.5
005 43 30 31, 46 9.0
008a 32 30 30, 52 13.0
009 33 – 35, 46 0.0
010a 59 49 31, 40 12.0
017 39 33 35, 46 12.5
aThe cases shown in the result figures
Cerebellum. Author manuscript; available in PMC 2012 June 1.
NIH
-PA Author Manuscript
NIH
-PA Author Manuscript
NIH
-PA Author Manuscript
Solodkin et al. Page 27
Tabl
e 2
Ave
rage
vol
umes
(cub
ic m
illim
eter
s) in
whi
te m
atte
r RO
Is in
hea
lthy
cont
rols
and
SC
A1
patie
nts w
ith th
eir a
ssoc
iate
d C
ram
er st
atis
tic a
nd p
val
ues
RO
IC
ontr
olSC
A1
Cra
mer
stat
istic
p va
lue
Lef
tR
ight
Lef
tR
ight
CR
B w
hite
mat
ter
3,94
63,
503
3,53
23,
622
16.3
0.3
sCR
B p
edun
cle
619
617
493
515
10.1
0.4
mC
RB
ped
uncl
e81
710
0954
362
015
.10.
2
iCR
B p
edun
cle
234
308
187
206
11.2
0.2
Cer
ebra
l ped
uncl
e1,
225
1,24
31,
087
1,05
49.
50.
6
Cerebellum. Author manuscript; available in PMC 2012 June 1.
NIH
-PA Author Manuscript
NIH
-PA Author Manuscript
NIH
-PA Author Manuscript
Solodkin et al. Page 28
Tabl
e 3
Ave
rage
FA
val
ues i
n w
hite
mat
ter R
OIs
in h
ealth
y co
ntro
ls a
nd S
CA
1 pa
tient
s with
ass
ocia
ted
Cra
mer
stat
istic
and
p v
alue
s
RO
IC
ontr
olSC
A1
Cra
mer
stat
istic
sp
valu
e
Lef
tR
ight
Lef
tR
ight
CR
B w
hite
mat
ter
0.44
0.42
0.41
0.39
0.01
20.
4
sCR
B p
edun
cle
0.53
0.52
0.41
0.41
0.15
30.
003*
mC
RB
ped
uncl
e0.
580.
540.
600.
540.
003
0.7
iCR
B p
edun
cle
0.47
0.43
0.41
0.44
0.02
20.
3
Cer
ebra
l ped
uncl
e0.
700.
690.
640.
690.
021
0.2
* p≤0.
01 fo
r Bon
ferr
oni c
orre
ctio
n fo
r mul
tiple
com
paris
ons
Cerebellum. Author manuscript; available in PMC 2012 June 1.
Related Documents

![Spinocerebellar ataxia: an update · ataxia with pigmentary macular degeneration and con-sists of only SCA 7 [20]. ADCA type 3 refers to ‘pure’ cerebellar ataxia, which includes](https://static.cupdf.com/doc/110x72/5f60a23d2190f22226185a55/spinocerebellar-ataxia-an-update-ataxia-with-pigmentary-macular-degeneration-and.jpg)