DOCUSXST *:sines ED 031 867 40 EC 004 342 By- Newland. T. Ernest The Blend Learning Aptitude Test. Univ.. Urbana. Spons Agency-Office of Education OHM, BUreW Pub Date Feb 69 CranT-OEC-5-6-061;22-i agitk Note -126a ERRS Price lIE 5050 HC5640 Descriptors-Achievement Tests, Age Differences, *Aptitude Tests, *Exceptional Chad Research. Geographic Location. Individual Tests, Intelligence Tests, Racial Differences, Research Methodology, Sampfin Sex Differences, *Tactile Adaptation. Tactual Perception. Test Construction. Testing. Test Reliability, *Tests, Test validity, *Visually Handicapped Identifiers-BLAT, Blind Learning Aptitude Test A Blind Learning Aptitude Test (BLAT) was developed on The basis of sense of touch rather than on conventional experience, fine sensory discrimination, or verbal competency. From a pool of about 350 items, most of them used in testing intelligence in the sighted, a pool of 94 was selected and embossed after the manner of braille. A residual pool of 49 test and 12 training items was selected through the responses of some 500 blind children. Normative data were gathered on The responses of 961 subjects. Analyses of the data indicated the following correlations for the BLAT: internal consistency, .934; test-retest reliability over 7 months, .865; and Hayes Binet mental arses: Inte-Higence Scale for Children verbal ages, .81 for me 420 children for whom preceeding scores were available. Although the BLAT was found to lose discriminative power at or near the 12-year level, it was suggested as being more valuable than the Hayes Binet or the Wechsler for younger children since it tests process rather than product behavior. Ckt)

Welcome message from author
This document is posted to help you gain knowledge. Please leave a comment to let me know what you think about it! Share it to your friends and learn new things together.
Transcript
DOCUSXST *:sinesED 031 867 40 EC 004 342By- Newland. T. ErnestThe Blend Learning Aptitude Test.
Univ.. Urbana.Spons Agency-Office of Education OHM, BUreW
Pub Date Feb 69CranT-OEC-5-6-061;22-i agitkNote -126aERRS Price lIE 5050 HC5640Descriptors-Achievement Tests, Age Differences, *Aptitude Tests, *Exceptional Chad Research. GeographicLocation. Individual Tests, Intelligence Tests, Racial Differences, Research Methodology, Sampfin SexDifferences, *Tactile Adaptation. Tactual Perception. Test Construction. Testing. Test Reliability, *Tests,Test validity, *Visually Handicapped
Identifiers-BLAT, Blind Learning Aptitude TestA Blind Learning Aptitude Test (BLAT) was developed on The basis of sense of
touch rather than on conventional experience, fine sensory discrimination, or verbalcompetency. From a pool of about 350 items, most of them used in testing intelligencein the sighted, a pool of 94 was selected and embossed after the manner of braille.A residual pool of 49 test and 12 training items was selected through the responsesof some 500 blind children. Normative data were gathered on The responses of 961subjects. Analyses of the data indicated the following correlations for the BLAT:internal consistency, .934; test-retest reliability over 7 months, .865; and Hayes Binetmental arses: Inte-Higence Scale for Children verbal ages, .81 for me 420children for whom preceeding scores were available. Although the BLAT was found tolose discriminative power at or near the 12-year level, it was suggested as beingmore valuable than the Hayes Binet or the Wechsler for younger children since it testsprocess rather than product behavior. Ckt)
N.iqfp
CX,
r-4
PeaFINAL REPORT
Project No. 6-1928Grant No. OEG-3-6-061928-1553
Ui
THE BLIND LEARNING APTITUDE TEST
February 1969
LS. DEPARTMENT OFHEALTH, EDUCATION, AND WELFARE
Office of EducationBureau of Research

FINAL FIER 1.71T
Project 6-1928
Grant 143. 0EG-3-6-061928-1558
THE BLIND 7EAN7?Y: APTITUDE TEST
T. Ernest Newland
University of Illinois
Urbana, Illinois
February 1969
U.S. DEPARTMENT OF HEALTH, EDUCATION & WELFARE
OffiCE Of EDUCATION
THIS DOCUMENT HAS BEEN REPRODUCED EMMY AS MEP) PAM THE
PERSON OR ORGANIZATION ORIGINATING IT. POINTS OF YIEW OR OPINIONS
SIM DO NOT NECESSARILY REPRESENT OFFICIAL OFFICE OF EDUCATION
POSITION OR POLICY.
The research reported herein was performed
pursuant to a grant with the Office of Education,
U.S. Department of Health, Education, and Welfare.
Contractors undertaking such projects under
Government sponsorship are encouraged to express
freely their professional judgment in the conduct
of the project. Points of view or opinions stated
do not, therefore, necessarily represent official
Office of Education position or policy.
U.S. DEPARTMENT OFHEALTH, EDUCATION, AND WELFARE
Office of EducationBureau of Research

TABLE OF coNrENTs
Page No.1. The Standardization - Pre-Project
2
1.1 General Review of Initial Testing of Blind 2
1.2 Early Felt Need for BLAT-Like Approach 9
1-nr Research on BIAT. 12
1.4 Pre-Project Work on ft.-a.' 15
1.41 Rationale for a Test for a Specific Population 15
1.42 The Validation Problem 18
1.43 Rationale for the BLAT Items 20
1.44 Development of Test Materials 21
1.45 Development of Procedure for Administering BLAT 26
1.46 Problems of Data Collection 27
1.461 The Population Problem 27
1.462 The "Blindness" Definition Problem 28
1.463 The Age Sample Problem 29
1.464 The Background Information Problem 30
1.465 Controlled Collection of BLAT Data . . 30
2. The Project Phase 32
2.1 Collection of Data 32
2.11 Overview 32
2.12 BLAT 32
2.13 Hayes -Binet and WISC 32
2.14 Stanford Achievement Test 35
2.141 Sample Bias in Achievement Testing . 36
ii
Page No.2.15 MI Retesting 49
2.2 Characteristics of Total Standardization Fopulation . 49
2.21 The Total Standardization Population .. 49
2.22 Representativeness of Standardization Population 49
2.221 socio-Economic Status and Race . . .
2.222 Race-Sex Distribution
2.223 Geographic Distribution
2.3 Standardization Data
40
43
45
47
2.31 Learning Age and Learning Quotient Equivalents 47
2.32 Sub Analyses 53
2.321 By Sex 53
2.322 By Race 53
2.323 By Kind of School 60
2.324 By Geographic Area 60T.
2.325 By Southern School and Achievement 60
2.33 Reliability 66
2.34 Factor Analysis of BLAT 70
2.35 BLAT Correlations with Other Measures 70
2.351 With Hayes-Binet and WISC 70
2.352 With Stanford Achievement Results . . 71
3. Smmary 74
4. Further Research Possibilities 77
5. Bibliography 80
iii
6. Appendix
A. Sources of BLAT Items
B. Background Information Form
C. BLAT Factor Analysis
D. Manual
R. Test Record Sheet
Page No.
85
86
(
F. Plates 103
A .3.e of* Os oss
Table 2.13 Numbers of Pre-Project Pupils, by Age, WhoseHayes-Binet & WISC Verbal Scores Were Used 34
Table 2.14 Numbers of Children, by Schools, on WhomProject Test Scores Were Obtained 37
Table 2.141 Chronological Ave & Aptitude Test Data onChildren With and Without Achievement TestResults, by Age Groupings, by State and byTotal 39
Table 2.21A Total Functionally Blind StandardizationPopulation by Age, Type of School, Sex, andRace 41
Table 2.21B Summary Table of Functionally Blind by Age,Sex and Race 42
Table 2.222A Percentages of Blind U.S. and BLAT Popula-tions, Aged 5-19, by Sex and Race . . . . 43
Table 2.221 Occupational Levels of Subjects' MajorBreadwinners for White, Non-White, and TotalBLAT Populations 44
Table 2.222B Racial Representativeness of the Standardiza-tion Population 45
Table 2.223 Percentages in Regions, in Combined SampleArea, and in Total U.S. Blind Child PopulationRepresented in Standardization Population . 46
iv
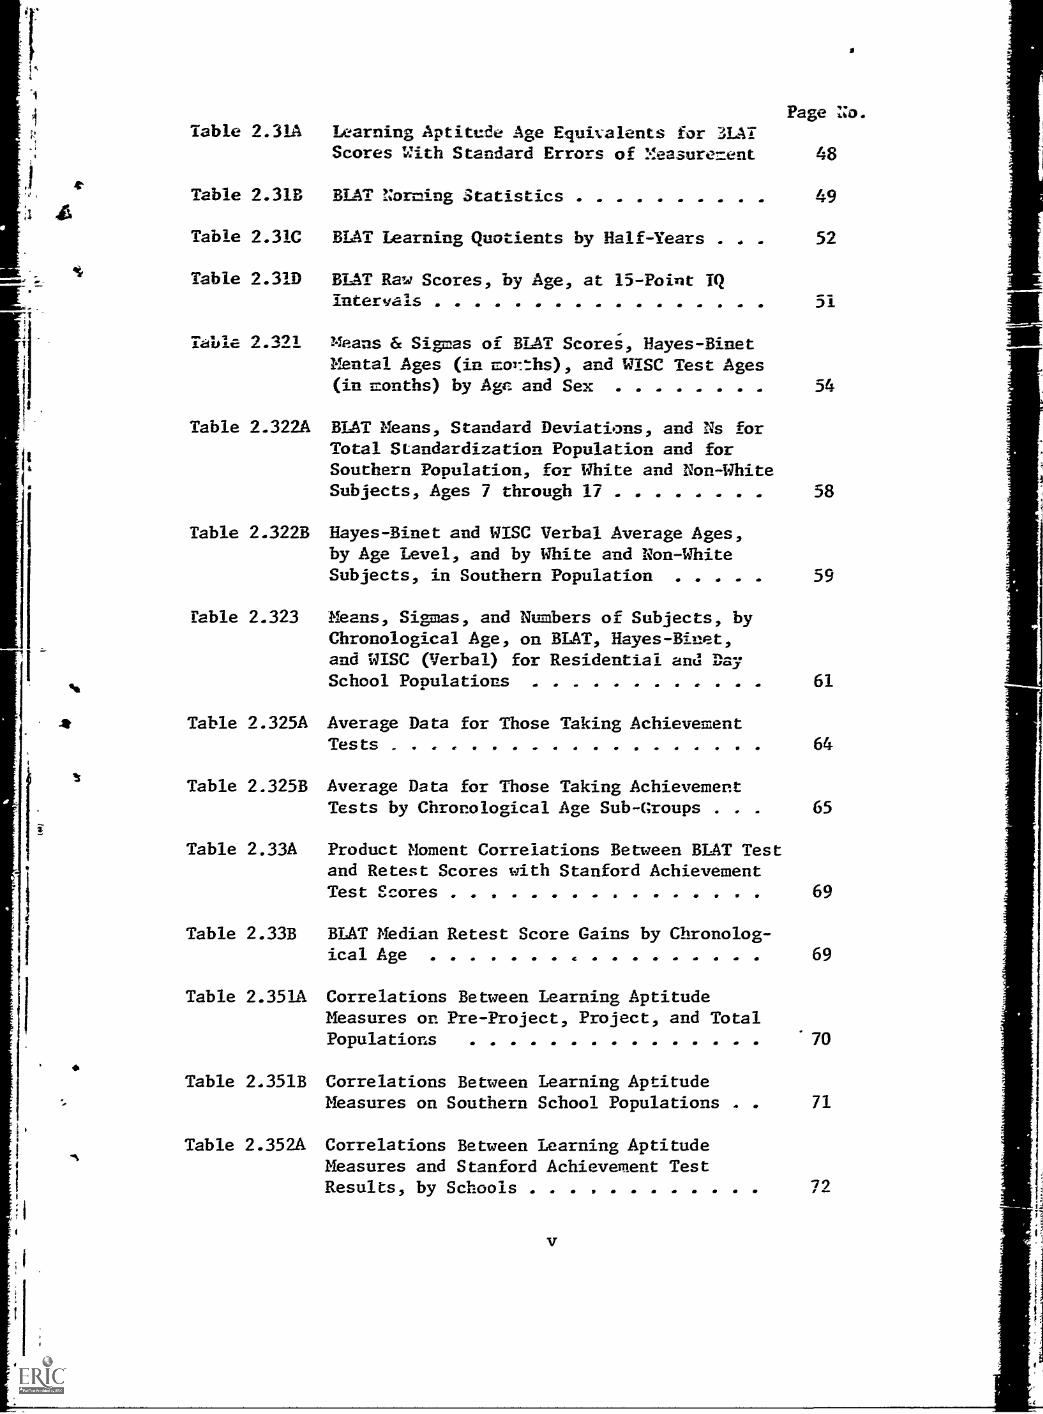
Page No.Table 2.31A Learning Aptitude Age Equivalents for 3LAT
Scores With Standard Errors of Measurerlent 48
Table 2.31B BLAT Naming Statistics 49
Table 2.31C BLAT Learning Quotients by Half-Years . . 52
Table 2.31D BLAT Raw Scores, by Age, at 15-Point IQintervals 51
Table 2.321 means & Sigmas of BLAT Scores, Bayes -BinetMental Ages (in corns), and WISC Test Ages(in months) by Age and Sex
Table 2.322A BLAT Means, Standard Deviations, and Ns forTotal Standardization Population and forSouthern Population, for White and Non-WhiteSubjects, Ages 7 through 17
Table 2.322B Hayes-Binet and WISC Verbal Average Ages,by Age Level, and by White and Non-WhiteSubjects, in Southern Population
54
58
59
Fable 2.323 Means, Sigmas, and Numbers of Subjects, byChronological Age, on BLAT, Hayes-Binet,and WISC (Verbal) for Residential and DaySchool Populations 61
Table 2.325A Average Data for Those Taking AchievementTests 64
Table 2.325B Average Data for Those Taking AchievementTests by Chronological Age Sub-Groups . . 65
Table 2.33A Product Moment Correlations Between BLAT Testand Retest Scores with Stanford AchievementTest Scores 69
Table 2.33B BLAT Median Retest Score Gains by Chronolog-ical Age 69
Table 2.351A Correlations Between Learning AptitudeMeasures on Pre-Project, Project, and TotalPopulations .70
Table 2.351B Correlations Between Learning AptitudeMeasures on Southern School Populations . 71
Table 2.352A Correlations Between Learning AptitudeMeasures and Stanford Achievement TestResults, by Schools 72
r
EL
[r
Oh
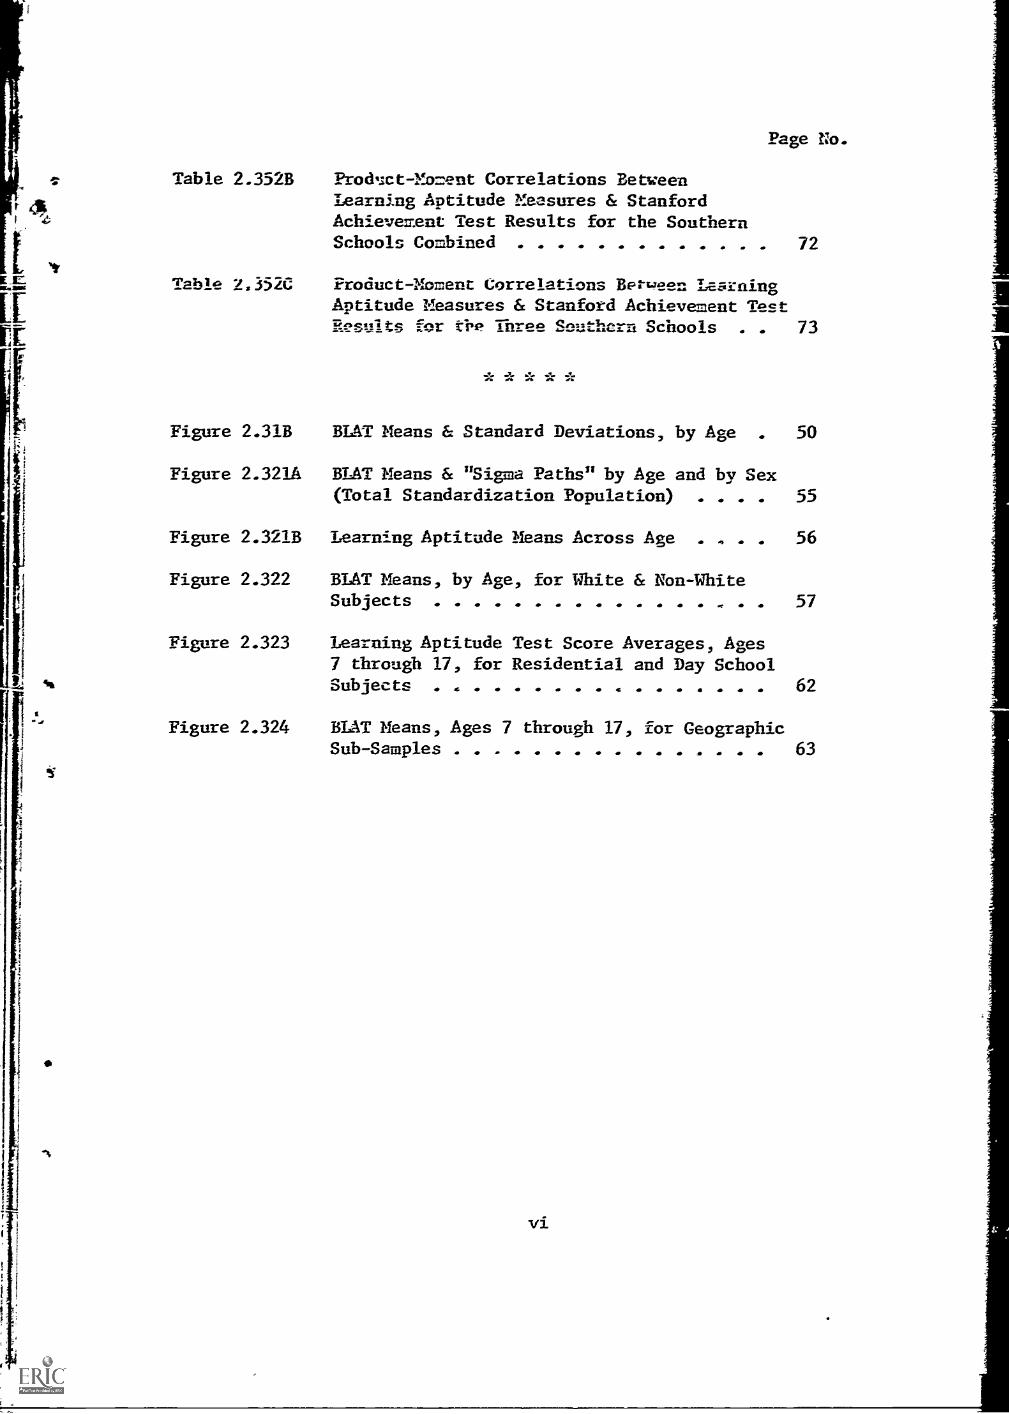
Table 2.352B
Table 1.3520
Prodnct-Moment Correlations BetweenLearning Aptitude Measures & StanfordAchievement Test Results for the SouthernSchools Combined
Page No.
72
Product-Moment Correlations Between LearningAptitude Measures & Stanford Achievement Test11Psult5 for ti,P Three Southern Schools 73
A as
Figure 2.31B BLAT Means & Standard Deviations, by Age . 50
Figure 2.321A BLAT Means & "Sigma Paths" by Age and by Sex(Total Standardization Population) . . . . 55
Figure 2.321B Learning Aptitude Means Across Age . . . 56
Figure 2.322 BLAT Means, by Age, for White & Non-WhiteSubjects 57
Figure 2.323 Learning Aptitude Test Score Averages, Ages7 through 17, for Residential and Day SchoolSubjects 62
Figure 2.324 BLAT Means, Ages 7 through 17, for GeographicSub-Samples 63
vi
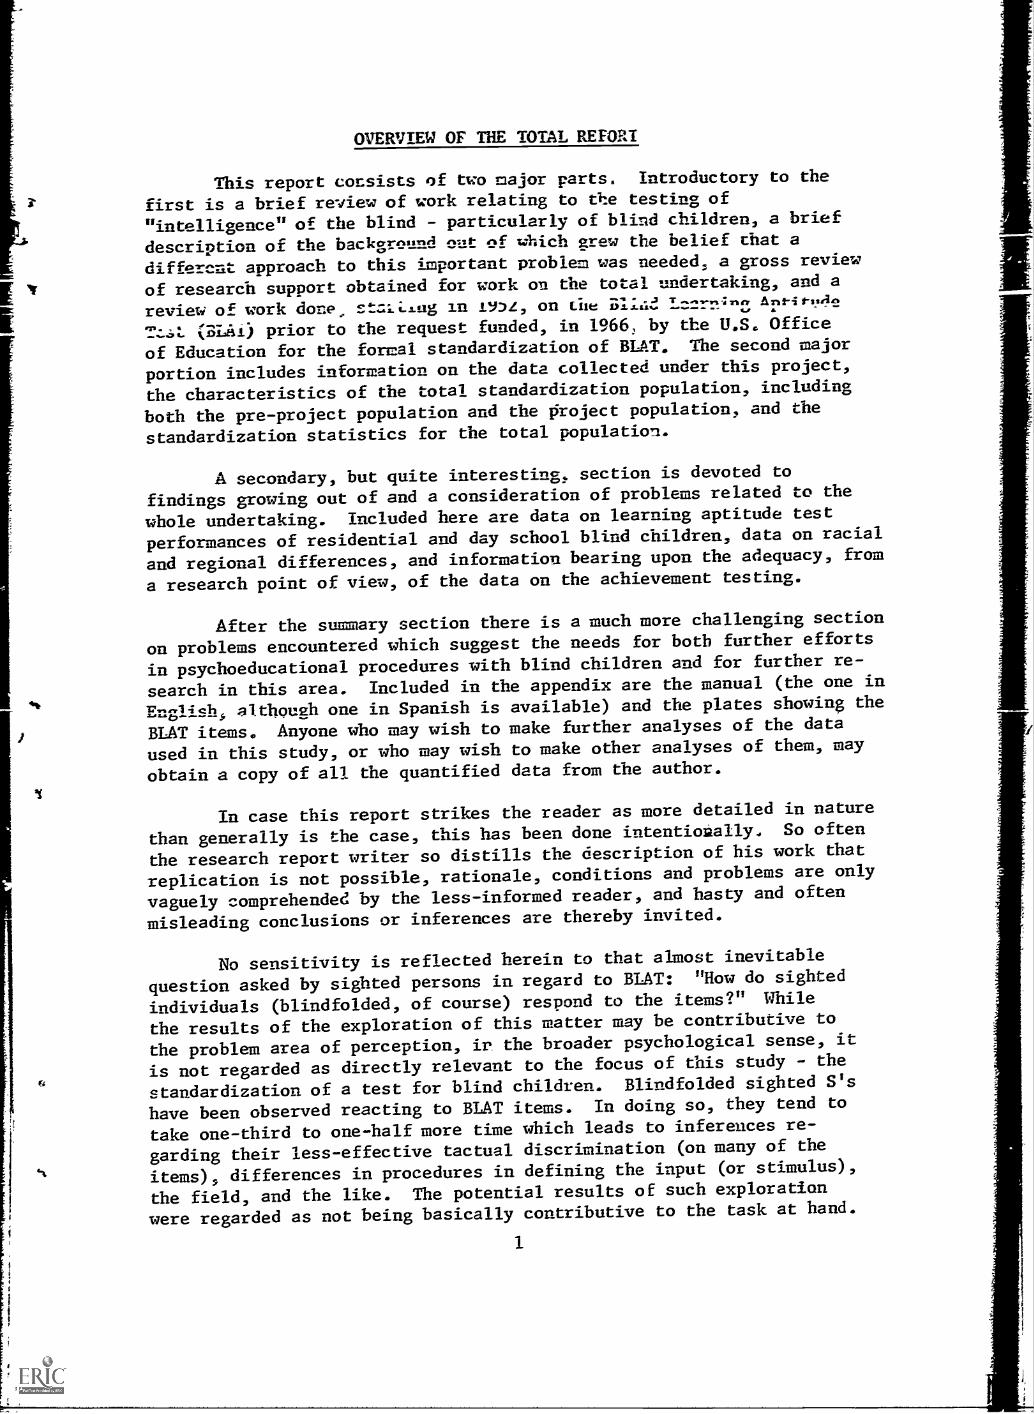
OVERVIEW OF THE TOTAL REFORI
This report consists of two major parts. Introductory to the
first is a brief review of work relating to the testing of
"intelligence" of the blind - particularly of blind children, a brief
description of the background out of which grew the belief that a
different approach to this important problem was needed, a gross review
of research support obtained for work on the total undertaking, and a
review of work done, st.7.1i.Lag in IVDL, on the Amin -I.!AC
(31.111) prior to the request funded, in 19662 by the U.S. Office
of Education for the formal standardization of BLAT. The second major
portion includes information on the data collected under this project,
the characteristics of the total standardization population, including
both the pre-project population and the project population, and the
standardization statistics for the total population.
A secondary, but quite interesting, section is devoted to
findings growing out of and a consideration of problems related to the
whole undertaking. Included here are data on learning aptitude test
performances of residential and day school blind children, data on racial
and regional differences, and information bearing upon the adequacy, from
a research point of view, of the data on the achievement testing.
After the summary section there is a much more challenging section
on problems encountered which suggest the needs for both further efforts
in psychoeducational procedures with blind children and for further re-
search in this area. Included in the appendix are the manual (the one in
English, althou2h one in Spanish is available) and the plates showing the
BLAT items. Anyone who may wish to make further analyses of the data
used in this study, or who may wish to make other analyses of them, may
obtain a copy of all the quantified data from the author.
In case this report strikes the reader as more detailed in nature
than generally is the case, this has been done intentiolaally. So often
the research report writer so distills the description of his work that
replication is not possible, rationale, conditions and problems are only
vaguely comprehended by the less-informed reader, and hasty and often
misleading conclusions or inferences are thereby invited.
No sensitivity is reflected herein to that almost inevitable
question asked by sighted persons in regard to BLAT: "How do sighted
individuals (blindfolded, of course) respond to the items?" While
the results of the exploration of this matter may be contributive to
the problem area of perception, it the broader psychological sense, it
is not regarded as directly relevant to the focus of this study - the
standardization of a test for blind children. Blindfolded sighted S's
have been observed reacting to BLAT items. In doing so, they tend to
take one-third to one-half more time which leads to inferences re-
garding their less-effective tactual discrimination (on many of the
items), differences in procedures in defining the input (or stimulus),
the field, and the like. The potential results of such exploration
were regarded as not being basically contributive to the task at hand.
1
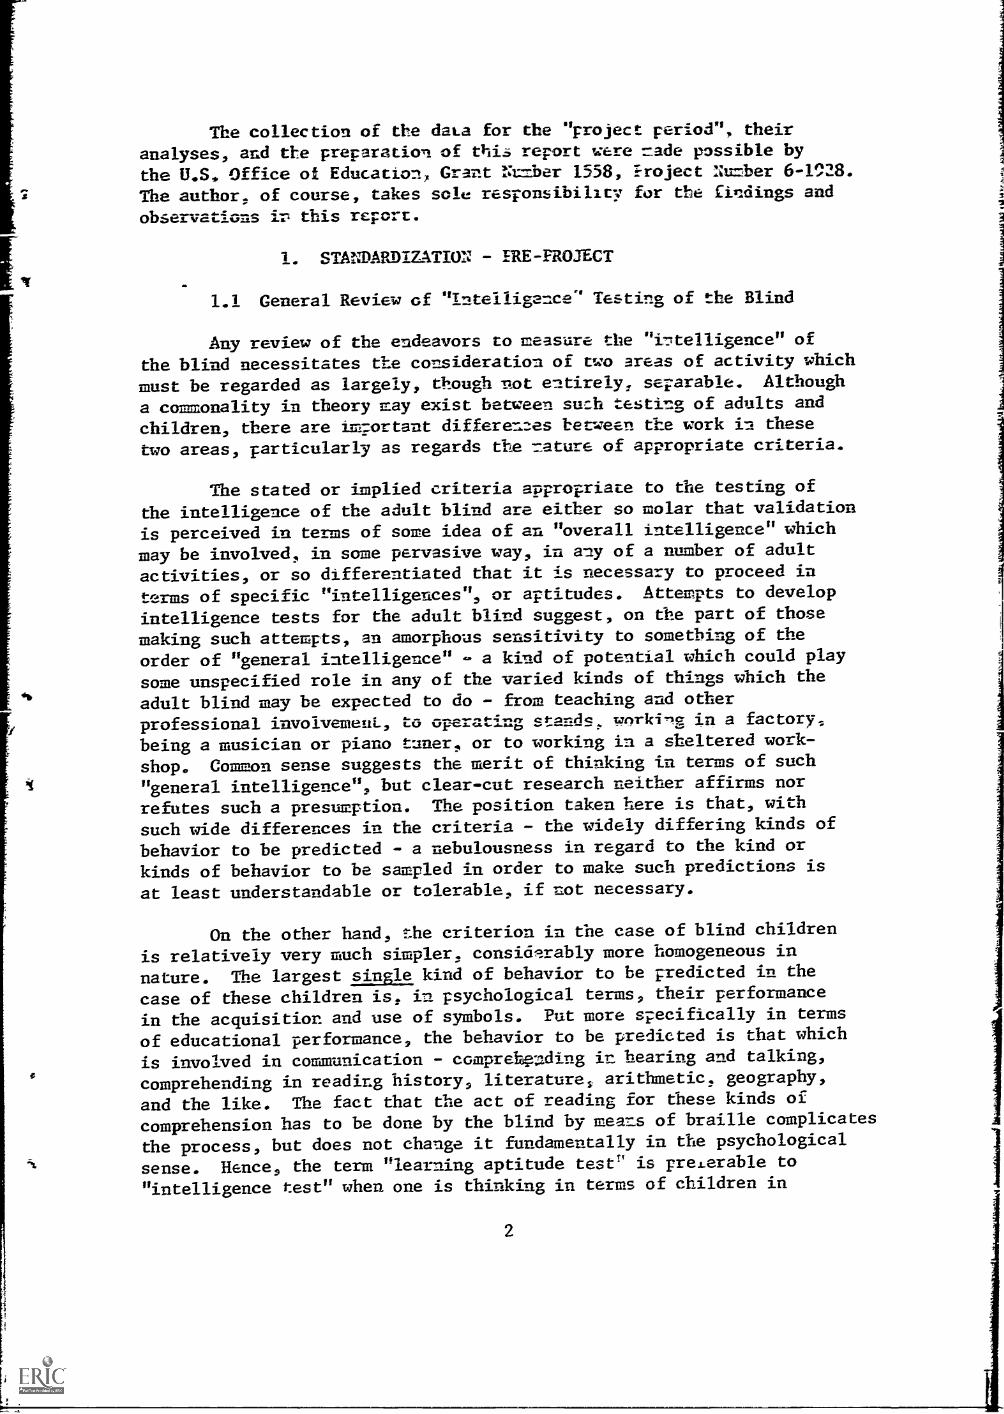
The collection of the data for the "project period", theiranalyses, and the preparation of this report were nade possible bythe U.S. Office of Education, Grant Nunber 1558, iroject Nunber 6-1^28.
The author, of course, takes sole responsibility for the findings and
observations is this report.
1. STANDARDIZATION - ERE-PROJECT
1.1 General Review of "Intelligence" Testing of the Blind
Any review of the endeavors to measure the "intelligence" of
the blind necessitates the consideration of two areas of activity which
must be regarded as largely, though not entirely, separable. Although
a commonality in theory may exist between su:11 testing of adults and
children, there are im:ortant differemzes between the work in these
two areas, particularly as regards the nature of appropriate criteria.
The stated or implied criteria appropriate to the testing of
the intelligence of the adult blind are either so molar that validation
is perceived in terms of some idea of an "overall intelligence" which
may be involved, in some pervasive way, in any of a number of adultactivities, or so differentiated that it is necessary to proceed in
terms of specific "intelligences", or aptitudes. Attempts to develop
intelligence tests for the adult blind suggest, on the part of those
making such attempts, an amorphous sensitivity to something of the
order of "general intelligence" - a kind of potential which could play
some unspecified role in any of the varied kinds of things which the
adult blind may be expected to do - from teaching and other
professional involvemeni, to operating stands, workine in a factory,
being a musician or piano tuner, or to working in a sheltered work-
shop. Common sense suggests the merit of thinking in terms of such
" general intelligence", but clear-cut research neither affirms nor
refutes such a presumption. The position taken here is that, with
such wide differences in the criteria - the widely differing kinds of
behavior to be predicted - a nebulousness in regard to the kind or
kinds of behavior to be sampled in order to make such predictions is
at least understandable or tolerable, if not necessary.
On the other hand, the criterion in the case of blind children
is relatively very much simpler, considerably more homogeneous in
nature. The largest single kind of behavior to be predicted in the
case of these children is, in psychological terms, their performance
in the acquisition and use of symbols. Put more specifically in terms
of educational performance, the behavior to be predicted is that which
is involved in communication - comprehpnding in hearing and talking,
comprehending in reading history, literature, arithmetic, geography,
and the like. The fact that the act of reading for these kinds of
comprehension has to be done by the blind by means of braille complicates
the process, but does not change it fundamentally in the psychological
sense. Hence, the term "learning aptitude test" is preLerable to
"intelligence test" when one is thinking in terms of children in
2
school situations. It is quite likely, of course:. that this conponentplays a large part in thn commonality across rather kighly variedadult occupations which makes relevant and sonewhat useful the"general intelligence" tests for adults. Bn't these two discerniblydifferent kinds of criteria cannot be regarded as -..on.stitutIng a clear
dichotomy. There is, rather, a criterion continuum, one end of whichinvolves clearly predominantly the symbol-anquisltian-and-use kind ofbehavior in the case of children;and the other eri of which involvesthe rather grossly diffuse group of behaviors in the case of adults.
The behavioral expectations for all enildren at the elementaryschool level necessitates thinking heavily in terms of academiclearning aptitude, recognizing, of course, that emotional andphysical factors also may be operating. As children progress up theeducational ladder, say to the high school level, the diversificationof learning demands increases. Not Incinding the fact that activitiessuch as physical education and vocal and instrumental music tend tobecome formally recognized as school subjects at the secondary level,the variety of other learning behaviors here has increased from therelatively few at the elementary level to include also verbal learningdemands in areas such as shop work, commercial courses, and homeeconomics. Even the verbal learning demands in quantitative areas canbe different from those in literature and social studies. Theintentionally oversimplified symbol acquisition potential which figuresso largely in predicting educational achievement at the elementarylevel continues to play an important, though decreasing, role at thesecondary level, as is shown in the decreased magnitudes of thecorrelations between measured "intelligence" and achievement in academicareas at the secondary level. As the role played by such a single typeof measure of potential decreases, special aptitude measures necessarilyhave to be utilized increasingly.
Intentionally excluded from consideration here are such positiveor (more often) negative contributing factors as the physical conditionand emotionality of the children. This ignoring of such factors hereis in no way intended to imply that they may not be significantvariables. However, they are not being measured, even though they verywell may affect both the measures of learning aptitude and the effec-tiveness with which that aptitude may operate. As in any attempt tomeasure learning aptitude, whether with blind children or others,learning aptitude is reflected through performance on the device or
devices used. The extent to which extenuating, contaminating, orfacilitative factors may have been operative is (or should be)reflected in the clinical inference(s) which the examiner draws on thebasis of his full knowledge of the child whom he is examining.
The data used in this study have been psychometrically oh fined
rather than psychologically (clinically) arrived at. The children wereadministered the learning aptitude devices by standardized proceduresby adequately trained testers and the scores which they earned under
3
such conditions were recorded. NO inferences were made on the basisof qualitative evaluations and no adjustments were made in the direc-tion of any clinically perceived "true" scores. Research based uponsuch (possibly) refined psychological data is yet to be done; suchresearch could throw valuable light upon whether the use of suchclinically refined measures is justified and upon whether moresignificant findings than by means of the more frequently encounteredpsychometric data are possible.
The BLAT, the standardization of which is described here, is,then, intended for blind children. Just where blind individuals ceasebeing reported as "children" and came to be regarded as "adults" is anelusive point or zone. Since the "learning aptitude" in BUT is pre-sumed to be related to learning in school, BLAT was regarded aspotentially valuable, particularly for blind children at the elementaryschool level and somewhat, perhaps, at the secondary school level.Therefore, a review of endeavors to develop "intelligence" tests onlyfor use with blind children is believed to be contributory to anunderstanding of the psychometric-psychological milieu out of whichBLAT has emerged.
"Early efforts to develop intelligence tests for the blindconsisted essentially of attempting to adapt, for (verbal and)tactual use with the blind, certain (verbal and) visual testswhich had been standardized on non-handicapped populations. In1914, R.B. Irwin worked with Goddard in adapting his VinelandBinet for use with the blind. W.B. Drummond, in a January, 1915,issue of the British journal, The Teacher of the Blind, suggestedadapting the Binet-Simon tests for use with the blind, althoughit was not unti11920 that he actively explored the possibilityof the use of an adaptation of the Goddard-Irwin tests whichT.H. Haines had made in Ohio. In 1916, Haines published resultson the blind which he had obtained also by means of an adaptationof the Yerkes Point Scale of the Binet. The testing done bymeans of such adaptations, largely by Samuel P. Hayes andHiss K. Roese at Perkins, Overbrook, and Batavia, provided arich background out of which subsequent testing adaptationefforts were to come.
"The stimulus of the group testing needs of World War I contri-buted to Hayes' 1919 adaptation of the Pressey Group PointScale for use with the blind. In Europe, Drummond reported in1920 on his use of the Haines adaptation, and Burkler reportedin 1918 and 1921 on his use of Bobertag's adaptation of theBinet. Hayes' 1923 'scissors and paste' adaptation of the 1917Binet was heavily contributive both statistically and experien-tially to his 1930 revision. This, in turn, was succeeded byhi. 1943 adaptation of the 1937 Revised Stanford Binet. Otheradaptations were being made: Results on the use of the OtisGroup Test of Mental Ability with a group of blind subjects
were reported by Ruth Sargent in 1931, 2r/ this may have beenthe see test by means of which B.F. Ballard obtained some ofthe data he reported in 1936. Some three years later,
Fortre- reported on results obtaimeZ by =ears of theKuhl=a=n-Anderson, and Brown a=d Davidson reported resultsobtained by means of the Institute for :uvenile Research Testfor visually handicapped children. In 1942, Haves pnblishedan adaptation of the Wechsler-Bellevee, and Pintner reportedon atte=pts to adapt the 1937 FAMEE by means of phctostaticallyenlarging the visual caterials." (el:la=d, 1961)
Any consideration of the testing of the learning aptitude("intelligence") and educational achievement of blind children wouldbe grossly inadequate if there were not reviewed, more in detail thanthe overview presented above, the early work by, and as a result ofthe influence of, Hayes. Current literature on blind chilerenreflects little concern with these areas of measurement. Either thatwhich is done is taken for granted and not regarded as having researchcommunication value or little, if any, effort is being expended in thisimportant direction. One suspects the latter to be the condition thatnaintains.
Partly because no one appears to have pulled together, in somesort of historical perspective, information on the early efforts ofHayes and his students in this area, and partly because some of theearly findings have some relevance to this undertaking, the followingsummary is included herem
As early as 1918, Hayes was urging the use of achievement andintelligence tests in schools for the blind, pointing out the feasibilityof using, for instance, the Trabue Completion Test, and supplying direc-tions for its use. In 1921, he issued, from Overbrook, a manual for theguidance of teachers under the title, "Self-Surveys in Schools fur theBlind." In this, he supplied the directions for giving, scoring, andinterpreting some 23 tests: Ten of the subtests of the Pressey GroupPoint Scale for Measuring General Intelligence; the Courtis PracticeTests in Arithmetic; the Nassau County Supplement to the Hillegas Scalefor Measuring Quality of English Composition; the Starch Test ofComprehension of Silent Reading; the Trabue Language Scale; the StarchLanguage Grammatical Usage Test; the early Texan Vocabulary Test; theHarlan Test of Information in American History; the Starch DictionarySpelling Test; the Ayers Spelling Test; the Hahn-Lackey GeographyScale; the Courtis Map Test; a rate of writing test (slate and mechanicalwriters or typewriters); and the Means Word Opposite Test. (Hayes,
1921) As director of research at Overbrook, he issued in 1927 adescriptive report entitled, "Ten Years of Psychological Research inSchools for the Blind," much of which had to do with testing. His 1929article, "The New Revision of the Binet Intelligence Tests for theBlind," not only provided descriptive information about the test, butalso alluded to the comparability of results obtained on blind andsighted children. (The blind earned IQ's 10 points below the sighted,the distribution approximately a normal curve.) (Hayes, 1929)
5
In 1931, one of his students, Sarg,-mt, rt,parted on the use ofan adaptation of the Otis Classification Test, Form:A, Part II with 210Overbraok and Perkins pupils in grades 5 through 11 (C.A. 10-4 to 36-8).She found that the IQ's in this device correlated with these en theIrwin-Hayes-Binet .586 (NA's, .55). (1931) Results obtained on 170blind pupils in grades 4, 5, and 6 by means of the Stevenson ArithmeticReading Test 1, Form 2 (7roblen Analysis) were reported by Merry in1931. Performances by the blind were fourd so be cemparable to thoseobtained by the sighted, although it was noted teat there were coreolder children in the classes for the blind. Results obtained on 500blind children in ten schools for the blind, iv 17 achievement areas,provided the basis fr,r an article, "Factors Infiz.encing the School
Success of the B1 d." (Hayes, 1934) In his 1935 article, toto
Handle Test Results - A Plea for Wider Use of Group Tests," Hayes usedresults obtained by means of the Otis Classification Test, Part II, toillustrate, among other analyses, his proposal to ascertain an"efficiency" measure by means of dividing the obtained score by the
normal score for each child. (Hayes, 1935) His analysis of perfor-mances on memory for digits provided the basis of his article, " "The
ory of Blind Children," leading to his observation of "no generalcompensatory superiority in the memory of blind children." (Hayes,
1936, page 74)
In "The Measurement of Educational Achievement in Schools for theBlind," he incorporated revised directions for administering the NewStanford Achievement Test (3rd Revision) , which had been adapted for
use with the blind. Here, again, he pressed far a greater use of
testing: "It is our hope that a considerable number of schools willbegin the use of these tests with the help of the accompanying direc-
tions." (Hayes, 1937, page 90) Under this stimulus, Abel (1938), re-ported on "The Mucational Achievement of Fifth and Sixth Grade BlindChildren" in 12 schools. The 80 fifth graders scored slightly (4months) above the sighted norms, but the 83 sixth graders averaged 1year 6 months lover than sighted sixth graders - a condition attributed,
at least in part, to the fact that there were so many older sixthgraders among the blind. Hayes' 1938 article, "What Do Blind ChildrenKnow?", evaluating the findings of two surveys, pointed out that "gradeby grade blind children are picking up about as much school informationas the seeing, although the presence of more over-age children in the
grades suggested 'retardation'. He regarded the retardation as even
greater in vocabulary. Again, he recommended a more extended use ofachievement testLng, reflecting the conviction he expressed in his 1935
article: "In any case, science advises us to face the facts," Andagain, in 1939, he tried to facilitate the use of tests in schools forthe blind in his article, "Practical Hints for Testers", giving helpfulsuggestions to teachers and listing the intelligence and achievementtests which were available in braille. This same year, his article,
"Standard Graduation Examination for Elementary Schools: Adapted for
Use in Schools for the Blind", contained directions for administering
the Otis-Orleans Graduation Examination for Elementary Schools, Form A.
In her 1939 article, "A Group Intelligence Test in Braille", Fortnerreported on the Ldaptation of the Kuhlmann-Anderson, printed in braille,by the American Printing House for the Blind. Tne results she obtainedon 102 children, in grates 5 through 12, in Oregon. Washington,, and
Iowa, correlated .567 + .068 with those obtained on the Hayes-Binet-
Haines' efforts (1916, 1919) to develop a point scale for the
blind seem to have had no major impact upon intelligence testing orresearch during this or any subsequent period. The work of Knotts and
Miles (1929), comparing maze - learning ability in the blind and sighted,led to a study by Merry and Merry (1934) of "The Finger Maze as aSupplerPntary Test of Intelligence for Blind Children", rade on 30residential school children (most of whom were blind before the age of 5;ranging in C.A. from 8 to 16; Hayes-Binet M.A. range 7-4 to 18-0, with a
median M.A. of 1S-5 and a median RI of 111), which yielded an r of.61+ .07 between average time and M.A., but this too, apparently, died
aborning.
"In 1945, I. Winifred Mangan made an English adaptation of the 1937
Binet. Mangan's 1949 doctoral dissertation reports her attemptto create a non-verbal test of intelligence for the blind.
Presuming some braille reading ability on the part of the sub-jects, the test elements reported in the dissertation involved
(1) recoggition of likenesses; (2) progression in number and/or
position of braille cells; (4) a "co=n factors" functionwhich required the identification of the braille cell common tothe first two elements of a test item followed by the additionof that common factor to the next following dement; (5) a
pattern completion activity involving the identification of a
four-cell pattern followed by the completion of a three-cellnucleus in such a way as to make a corresponding type of pattern;and (6) a nine-figure matrix test which involved the use of
geometric figures, but with the possible answers designated by
braille numbers. Little use of this test appears to have been
reported." (Newland, 1961)
The Williams Intelligence Test for Children with Defective Vision
was developed and issued by the Institute of Education of the Univer-
sity of Birmingham (England) in 1956. This individual test was in-
tended for use with blind and partially sighted children between 5 and
15 years of age. The materials for this test were taken, with noindicated awareness of the work of Hayes, from a variety of tests
already standardized on sighted children - the 1937 Terman-Merrill Binet
(largely from Form M), from the Vocabulary test of the Wechsler Intel-
ligence Scale for Children, and from two British tests - Valentine's
Intelligence Tests for Children and Burt's Reasoning Tests. Nothing
other than the standardization evidence that this test appears to
discriminate among the children in the standardization population ap-
pears to have been published regarding its validity. (Buros, 1965)
In 1956, Wattron repartee the exploratory use of the Kolas blocktest, with smooth and knurled strfaces with 10 blind boys and 10 blind
girls matched by age and sex to sighted S's. Pearson established
norms for 4th, 5th, and 6th grade blind children, on the School and
College Ability Test. Rich developed a tactual form of the 36-item
1956 Raven Program Matrices for use with blind children. Correlationsbetween results on this, for 115 children from 6 to 15 years of ageand grade point average, academic rating, and "Braille rating" rangefrom .18 to .39 in contrast to RISC "verbal scores" which correlated
.50 to .64 (1963, 1965). Davis, at Perkins, has underway the standardi-
zation of the 196t' Binet Intelligence Scale on the blind.
The early attempts to adapt tests originally developed for the
sighted for use with the blind were more of a psychometric than a
psychoeaucational nature. The adapted materials, and the scoring of
them, were modified in whatever ways seemed to be needed in order,primarily, to yield distributions of scores which would discriminate
across ages and yield distributions that would approach normality
(usually IQ's). The extent to which obtained average IQ's of the blind
approached or equalled the average for the sighted seemed to be the
focus of concern in the early literature on such work. There was
considerable additional sensitivity to the comparability of the dis-
persions of the distributions of IQ's in the blind and sighted groups.
While there were some allusions to mental ages of the blind, these
were primarily in terms of comparability with sighted M.A.'s, or, in
some instances, in terms of their use when matching blind and sighted
subjects in experimental studies. The use of LA. in terms of educa-
tional expectancy, per se, appears to have been grossly lacking - a
condition not significantly different from present practices even in
the case of sighted children. Contributing to this, of course, is the
fact that little was known, or still is known, about educational
expectancies for blind children in terms of their levels of "mental"
development. In a gross sense, however, the facts that the scores
earned by blind children on these adapted devices correlated
positively sometimes in the .50's or .60's - with measured educa-
tional performance and that the results on the different devices
intercorrelated positively encouraged the early workers in this area.
In view of the fact that a comment was made above to the effect
tat little thinking about the results of learning aptitude tests in
terms of the mental levels which they reflected and what these levels
night suggest in terms of educational expectations, an observation
seems in order regarding the kind of information communicated by the
correlation coefficients obtained (usually involving the use of IQ's).
A correlation coefficient of, say, .85 between the results on Test A
and on Test B can be interpreted in any one of three ways: While the
ordering of the S's in the two groups was roughly the same, as
reflected by that coefficient; (1) the mental levels of the scores on
the two tests-may be very much the same; (2) the mental levels of the;
scores on Test A, may-be consistently lower than those on Test B; or
8
1
(3) the mental levels of the scores on lest A may b: consistently
higher than those on Izet B. Thinking in terms of research on sighted
children, since U2 do not have such research on blind children, if
Test A yielded a mental level of, say, four and one-half years and
Test B yielded a similar result, both tests would suggest a comparable
expectancy of reasonable success in reading readiness work. If, however,
one test yielded an M.A. of four and one-half and the other one of five
and one-half, or, contrarily, of three and one-half, which of the two
tests in these two situations would suggest the more appropriate expec-
tancy? Such a correlation would have considerable statistical or
psychometric value but would be psychoeducationally ambiguous. This
concern has little relevance to the standardization problem with BLAT
at this time but very well could be important if and when test ages on
BLAT (or any other test of learning aptitude) were found to be meaning-
ful indications of educational expectancy. The need for research on
this will be pointed out at the end of the report.
It is interesting to note, particularly in regard to the contrast
in the case of BLAT, that the kinds of behavior samplings in the extant
tests were regarded implicitly as appropriate for use with the blind.
True, Hayes substituted two sticks of differing lengths for the two
printed lines in the Bizlet; Haines made larger some of the Yerkes Point
Scale materials; mazes made of staples in wood were found to be better
for the blind than slot mazes; and some vocabulary substitutions were
made. (Hayes, in discussing his early efforts with the author, told
how his basement was "full" of things he had tinkered with in his
attempts to incorporate more test materials which involqed cutaneous-
kinesthetic discriminations by the blind. The blocks of wood, various
objects, and, even, magnetized steel bars which were to be juxtaposed
on a metal sheet or plate were, he believed, too cumbersome to incor-
porate in an intelligence test for blind children.) Since the Hayes
revisions of the Binets came to be so generally used, the kinds of
behavior sampling involved therein came tacitly to be tolerated, if not
actually accepted as highly appropriate psychologically.
1.2 Early Felt Need for a BLAT-Like Approach
The bulk of the efforts which have been reported reflected
predominantly a commitment to the testing of the "intelligence" of
blind children which had underlying it, at least implicitly, the
assumption explicitly stated in the 1920's to the effect that such
tests measure achievement in order that the capacity for subsequent
achievement might be predicted on the basis of it. Implicitly under-
girding this was the further assumption that those whose achievement
had been thus measured had had reasonably comparable (rather than
identical) opportunities to learn, or achieve. As reasonably tenable,
generally, as the latter assumption may be, the blind, and certain
other deviant groups, tend not to satisfy this assumption to such an
extent that conventional 'intelligence" testing approaches would seem
of limited appropriatenessin their cases. To the extent that blind
children, either because of their sensory impairment or of the"protective" attitudes of significant others ir their environments,or both, were prevented, in whatsoever manner, from getting theopportunity to learn, regardless of their basic potential to learn ifgiven favorable opportunities, to that extent would they be adverselyaffected in performing on devices based upon such assumptions.
Here, a current befuddlement regarding the meaning and use of"intelligence" test results should not cloud the issue. On the onehand, such a test score is taken by some to identify, specify, orimply clearly the biologically determined basic learning potential ofthe child (which no reputable psychologist ever maintained) or is takento be an earned score somewhat reflective of some kind of learningpotential and also considerably reflective of the child's experientialbackground or condition. Educational action for and thinking about a
child based upon the first interpretation presumably would be dis-cernibly different than in the case of the second interpretation. In
either instance, however, the fact would be inescapable that the natureof the task of learning by the child still would be suggested by the
child's score. (Anastasi, 1967) It was due to the desire to try tocorrect, at least to some extent, for the fact that so many educatorsregard "intelligence' test results primarily as reflective of a basic,or biologically determined learning potential and due to the fact that
the acculturation of blind children tends, probably much more than inthe case of sighted children, to be markedly deviant from an assumedcommonality of exposure, or experience, that the present type ofbehavior sampling approach was adopted. The kinds of behavior sampledby BLAT are believed to be less sensitive to marked differences incultural backgrounds, but in no sense are regarded as literally"culture free". (It is hoped that the use of training items for eachseries of test items further reduces the differential impacts of prior
acculturation.)
During the years 1937-42, while the author served as Chief ofSpecial Education in the Pennsylvania State Department of PublicInstruction, the problem of a sound psychological evaluation of thelearning potential of blind and partially sighted children frequently
was encountered. Partly as a result of using the Cattell Culture-FreeTests of Intelligence and some Pintner materials in the testing of some800 acoustically impaired children in three Pennsylvania schools forthe deaf and partly as a result of meeting Penrose, who caused theauthor to obtain from England, in 1938, a set of what is now the RavenProgressive Matrices for trial use with such children, the possibilityof adapting materials of that sort for use with the blind seemed
worthy of exploration.
Contributive, too, was a rather extensive clinical experienceacquired in the psychological evaluation of children since 1925 -particularly from a time when intelligence tests often were used withthe blind confidence of the typical novitiate to the time of the
10
Pennsylvania period when their effectiveness with a number of types of
markedly deviating children increasingly seemed questionable, especially
when used in the generally prevailing over-slimplified quantitative
psychometric manner. Doll and other insightful clinical psychologists
were admonishing psychometrists regarding the psychological meaning of
test results routinely obtained. Such concern was particularly necessary
in the case of those children and adults who constitute a significant
portion of any clinic population and who have come out of experiential
backgrounds which fail, for any of a variety of reasons, to satisfy
the testing assumption of comparability of acculturation. Complicating
the psychological evaluation problem, too, was the presence of those
individuals whose communication channels - both intake and output - were
markedly inadequate. Even though the more-or-less conventional use of
existing devices with most children, and even, happily, with a portion
of those who were brought into clinics for evaluation, was recognized
as reasonably legitimate, the use of such approaches seemed open at
least to question with respect to the visually and acoustically impaired
and with the cerebral palsied. The markedly limited experiential back-
grounds and the unique difficulties inherent in communicating the test
stimuli to such children, plus the resulting nature of their responses
to such stimulation, constituted a problem of major importance in the
clinic, even though it might seem to be of minor (numerical) magnitude,
to the psychologist or to the group tester working with non-impaired
children. Some psychologically sound way, or ways, of making an
effective adjustment to such widely deviant experiential backgrounds
and of utilizing the different communication channels of such handi-
capped individuals seemed needed.
There weIlmay have been present, in the investigator's early
thinking at least, the hope that BLAT could become THE test of learning
aptitude for the blind. There seemed to be the possibility that other
devices, used to sample that area, involved to only a very limited
extent the use of touch as a means of "looking" at stimuli, and that
this demand figured heavily in the input of the blind. It is quite
probable that discussions with Dr. Samuel Hayes, the pioneer
psychometrist for the blind, played a major part in coming to see
differently the role which BLAT could play. He unhesitatingly regarded
the BLAT approach as a valuable adjunct to the more generally used
means of getting evidence on the learning potential of blind youngsters,
being enthusiastically joined in that view by another major contributor
in the field of the blind - Dr. Berthold Lowenfeld. As problems arose
and were met, as BLAT came to be perceived as much from a psychological
as from a psychometric point of view, and as differing kinds of evidence
regarding it became available, BLAT's adjunctive relationship to the
Hayes-Binet and the WISC verbal tests increasingly contributed to a
rationale wherein BLAT came to be regarded as sampling "process" - the
basic potential of the child to learn, in contrast to the Hayes-Binet
and WISC which were regarded as sampling to a much greater extent
"product" - what the child has learned from which a prediction is im-
plicitly made regarding the capacity to learn. As a result, it was
desired to try to develop a test just f,..pr blind children which wouldbe somewhat less s2.c..eptible to marked Jeviations in the acculturationto which such children had been exposed, that would involve a cutaneous-kinesthetic input channel, that would r..2cessitate little, if any, verbal
output, and that would, it was hoped, throw light more directly upon thefundamental psychological processes by which such a child would do his
learning than on what he already had learned.
1.3 Support for Research on BLAT
It was not until 1952 that active exploration of such a problem
with the blind was undertaken by the author at the University of
Illinois. The Bureau of Educational Research made available a small sum
($150.00) by means of which the first assistant, L.L. Lazowick, agraduate student in psychology, started a search for test items which
could be adapted. The University of Illinois Graduate Research Board
then supplied major support ($10,000) for help and materials. The
graduate assistants thus obtained helped mightily in the development of
test materials. Principal among them were Samuel C. Ashcroft, who
brought to the task the insight of a former principal in the Iowa
School for the Blind; Gerald Shapiro, Roger Frey, Norval Pielstick, and
Leonard Lucito. Contributing also to the second phase of the work was
the American Printing House for the Blind, where the plates for producing
the embossed items were made and the items were produced. The author,
wiLli very significant help of these assistants, administered a pool of
BLAT items to blind and partially sighted children in residential and
day schools in five midwestern states. In the second stage, made
possible by an even larger grant ($15,000) by the American Foundation
for the Blind, Joseph Twaranovica and Donald Douville went to the West
and East coasts, respectively, where each spent a semester obtaining
test responses for and data on residential and day school youngsters
in two western and two eastern states. In the final stage of data
collection, funded by a research grant ($40,000) from the U.S. Office
of Education, a group of (mostly) graduate students were trained and
taken to the state schools for the blind in Alabama, North Carolina,
and Tennessee. Hrs. Carole Fogle, Harvey Thornburg, and Thomas Anderson
carried major responsibilities in this phase of the work.
The work could not have progressed, of course, without the help
and cooperation of the administrators and teachers of the schools in
which the children were tested. To the individuals named here and to
the many others who were most helpful, heartfelt gratitude and
appreciation are expressed. The names of the state schools and the
superintendents are as of the dates when testing was done there.
12

Mid -Wes t
Illinois
Ohio
Wisconsin
Residential Schools
Illinois State Schoolfor the Blind
L.J. Flood, Supt.
State School for the BlindW.G. Scarberry, Supt.
State School for the BlindRaymond E. Long, Supt.
Pennsylvania Western Pennsylvania Schoolfof the Blind
A.G. Kloss, Supt.
Michigan
West Coast
California
Oregon
State School for the BlindW.J. Finch, Supt.
Residential Schools
State School for the BlindBerthold Lowenfeld, Supt.
Day Schools
ChampaignChicago City SchoolsOglesby
BellCorkeryLincolnMarshall HighMcPersonPerryFierce
SpauldingTalcottVan Humboldt
Cincinnati
Milwaukee
Pittsburgh
Day Schools
BerkeleyEmersonJefferson
Los AngelesFrancis BlendIrving Junior HighMarshall High School
San FranciscoLawtonSanchez
State School for the Blind Eugene
Everett Wilcox, Supt. CondonIda PattersonSanta Clara
PortlandArletaAtkinsonBeaverton High SchoolCapitol HillFowler Junior High
13

Oregon
East Coast
Massachusetts
New York
South
Alabama
State School for the BlindEverett Wilcox. Supt.
Residential Schools
Perkins School for the
BlindEdward J. Waterhouse, Dir.
Portland (Continued)Girls' Poly-TechHosfordLentLincoln High SchoolMeekMenlo ParkPortsmouthRiglerRiverdaleSacajaweaShattuckTroutdaleVostaWhitman
Day Schools
MedfordDameRoberts Junior High
QuincyCoddington
MaldenEmerson
WestonMeadowbrook
BraintreeLiberty
State School for the Blind New York City Scho:2Is
Eber L. Palmer, Supt. PS No. 167PS No. 168PS No. 175Grover Cleveland NighCharles Evans High
Schools
Residential Schools
Alabama Institute for Deaf
and BlindRichard H. Gentry, Supt.
B.Q. Scruggs, PrincipalCarl Monroe, Principal, School for Colored Blind
14
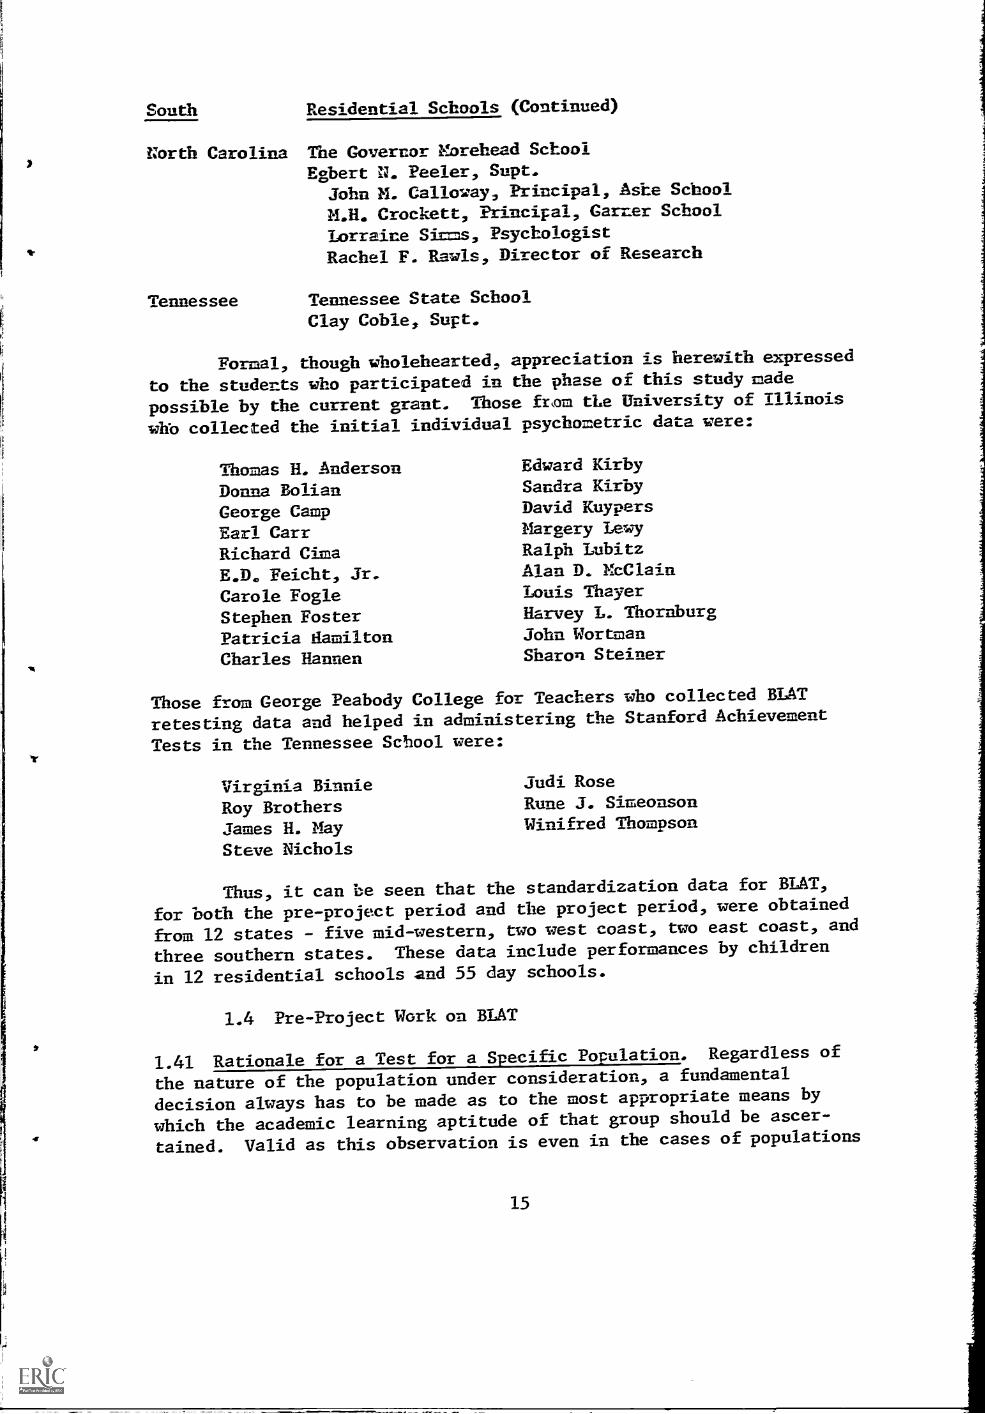
South Residential Schools (Continued)
North Carolina The Governor Morehead School
Egbert N. Peeler, Supt.John N. Calloway, Principal, Ashe School
M.B. Crockett, Principal, Gamer School
Lorraine Simms, PsychologistRachel F. Rawls, Director of Research
Tennessee Tennessee State SchoolClay Coble, Supt.
Formal, though wholehearted, appreciation is herewith expressed
to the students who participated in the phase of this study made
possible by the current grant. Those from the University of Illinois
who collected the initial individual psychometric data were:
Thomas H. AndersonDonna BolianGeorge CampEarl CarrRichard CimaE.D. Feicht, Jr.Carole FogleStephen FosterPatricia HamiltonCharles Barmen
Edward KirbySandra KirbyDavid KuypersMargery heavy
Ralph LubitzAlan D. EcClainLouis ThayerHarvey L. ThornburgJohn WortmanSharon Steiner
Those from George Peabody College for Teachers who collected BLAT
retesting data and helped in administering the Stanford Achievement
Tests in the Tennessee School were:
Virginia BinnieRoy BrothersJames H. MaySteve Nichols
Judi RoseRune J. SimeonsonWinifred Thompson
Thus, it can be seen that the standardization data for BLAT,
for both the pre-project period and the project period, were obtained
from 12 states - five mid-western, two west coast, two east coast, and
three southern states. These data include performances by children
in 12 residential schools and 55 day schools.
1.4 Pre-Project Work on BLAT
1.41 Rationale for a Test for a Specific Population. Regardless of
the nature of the population under consideration, a fundamental
decision always has to be made as to the most appropriate means by
which the academic learning aptitude of that group should be ascer-
tained. Valid as this observation is even in the cases of populations
15

that are rot markedly deviant - populations of normal" heterogeneity,
it becomes increasingly funds=ental as the popniation is known or
believed to differ from what generally may be regarded as "normal".
Even though populations may differ in known respacts - visually or
auditorially impaired or non-impaired, cerebral pLlsied or non-
cerebral palsied, disadvantaged or non-disadvantaged, white or non-white,
left-handed or non-left-handed, male or fem-alP cr.e -need is com=on to
all of then: The ascertainment of their capa:Ality to learn usually in
school, or school-type situations, whether at the pre-scr.00l,
elementary school, 3r secondary school. level.
The determination of differences among pcpnlatioms to be tested
most be made with regard to two major factors. The more important of
these is the problem of communication which may have either or both of
two important aspects - that of input, or the examiner's communicating
the test stimuli to the subjects, and that of output, or the subject's
communicating his responses to the exmirer. In the case of the deaf,
generally, input constitutes the major problem and output may or may
not be a problem, depending upon the nature of the response to be
evoked by the test stimuli. With the blind, generally, the input
problem is of considerable significance and, usnaily, the output
problem is of considerably lesser magnitude. The cerebral palsied, on
the other hand, well may involve both input and output problems to
near-equal degrees. Little seems to be gained by trying to analyze
this problem in terms of nervous system impairment or involvement
since sensory nervous system impairment presents problems of input,
motor system Impairment presents problems of output, and central
nervous system impairment affects intellective functioning which
itself is presumed to 13.t tapped by validated "intelligence" tests.
Those who have worked clinically with children markedly deviant
in sensory-motor areas iave, for a considerable time, been quite
sensitive to the fact of marked differences in the acculturation of
such children. However, social and psychoeducationai concern about
differences between the acculturation of the "disadvantaged" and that
of the larger "typical" population has resulted in a generally greater
awareness of the importance of such differences among populations whose
learning aptitudes are to be ascertained. It is difficult for the lay
or psychometrically-uninformed person to decide just to what extent it
is necessary or appropriate to differentiate among populations in terms
of their acculturation, as evidenced by overgeneralized attacks on
"intelligence testing ".
A decision thus to differentiate must be made on the basis of
the following factors, taken either singly or in combination. First,
the possibility of significant differences in acculturation must be
recognized to the extent that the children under consideration have
been physically impaired (sensory handicapped or crippled),
hospitalized, institutionalized, or "hot housed" (given some form of
relatively intensive cognitive nurturance, as in the case of being
16
supplied with extensive play or learning materials, persistent stiola-tion, planned or otherwise, by the adults 1171 their environnent).Second, the younger the children under considaration, the more thepossible importance of differences in accultur3tion anst ha recognized,due particularly to the possible effects of limiteS environzents. Thisis particularly true in the cases of physically impaired children whohave been "sheltered" and overprotected by others in their environ-ments as well as in the cases of 'culturally disadvantaee children.The older the children, the greater the chances of their being sub-jected to the nurturant stimulation of varied extra-hone environnents.In the third place, if the purpose of testing the children concernedis just to predict how easily they will learn in school, the lesscrucial becomes the need to differentiate anong them in terms ofpossible differences in acculturation. Important as these differencesmay be, the fact remains that the ease with which children will learnin school is a function of both what their basic, or inherent,learning capacities may be and what they have acquired as a result ofwhatever acculturation they may have had. A fourth consideration indeciding whether to differentiate among the children to be tested forschool learning aptitude must be based upon the extent to which thereis a commitment to get information on bow much they differ in thosepsychological processes which underlie all learning, which, inreality, make it possible for children to benefit from acculturation.From this point of view, differentiation among the children in termsof their kinds and amounts of acculturation is relatively lessimportant, but still recognizing that different kinds and amounts ofacculturation will have had differing nurturant effects upon thosepsychological processes (as contrasted with the different "things"which the children may or may not have learned). The third point,in effect, ignores the fact of differences in acculturation per sesince the purpose of the testing is to try to find out how easily thechild is likely to learn as of his present, overall condition,whereas the fourth point pertains, to the extent to which we areinterested in finding out about the child's basic learning poten-tials as independently as possible of what he has learned.
Attempts to adapt "intelligence" tests to specific populations,or to develop such tests specifically for any given population, seemnot to have been based upon an analysis of the factors involved suchas has been presented. From the time of Pintner and Paterson, whodevised their scale of performance tests "ith the deaf child inmind" (1925, p. 20), to Hayes' adaptations of the Binet for use withthe blind to Allen's (1956) suggestions for adapting the 1937 Binetfor use with the cerebral palsied, to mention only an illustrativefew, the efforts were exerted primarily in terms of the input and/oroutput problems. In none of these cases was a test developed for aspecific population. Further, these, and other, tests had beendeveloped on a psychometric basis: Results on them correlatedpositively with learning behavior, discrimination among those testedwas accomplished, and reasonably normal distributions of scores
17

resulted. At best, there was correlational evidence of concurrentand predictive validity. In these, and most other similar under-takings, there appears to have been no formal commitment to any basictheory of "intelligence' prior tc the adaptations.
One core consideration is necessary. If a test is to be
developed for a specific population, or sub - population, would therebe any conditions in that sub-population which would justify or in-validate the assumption that the " "intelligence" measured by that test
would be normally distributed? In the case of the blind, it could beargued that since their impairment essentially is in the sensory arearather than in the central nervous system, one coald expect that theaverage performance of, say, a random sample of blind ten-year-oldson a test having construct validity would be reflective of much the
same degree of measured "intelligence" as on a random sample of non-
blind ten-year-olds. This assumption is regarded as reasonablytenable with respect to BLAT. Possibly it could be somewhat attenuated
by the fact that 36.3% of those in the standardization population wereknown cases of retrolental fibroplasia.
%lie it was true that the Hayes -Binet and the MISC Verbal tests(with or without slight modifications made on some a priori basis)were used with blind children, and seemed to yield reasonably meaning-
ful results, they involved primarily auditory input and verbal output,rather than a cutaneous-kinesthetic input. Further, there existed the
not unreasonable possibility that the acculturation bias of such
devices might weaken the validity of their use with the younger and/or
newly-admitted blind children in educational programs.
On the basis of the foregoing, then, it would seem to bedefensible to claim that BLAT can be justified as a special test for
a sub-population - blind children. As will be seen, later, appropriate
input, tactual-kinesthetic, is provided for. Output relatively inde-
pendent of acculturation is provided for: The child can respond merely
by pointing; he can give an attending vocal response, but that is not
required. The perception of the test items relies to a very limited
extent upon the effects of acculturation. From a construct validity
standpoint, as will be seen later, they sample predominantly Spearman's
"g", reflecting the fundamental psychological operations by which the
child learns, rather than what or how much he has learned.
1.42 The Validation Problem. Since the "intelligence" tests usedwith blind children were regarded as having limited value in sampling
learning potential - due to the nature of behavior samplings made and
the very widely differing kinds and amounts of acculturation among
blind children, a conventional concurrent validation procedure was
believed to have markedly limited value. The position, therefore, was
taken that BLAT had to be validated primarily "from scratch".
18

The rejection of an intent to develop a test the scores onwhich would correlate in a high pzsitive =anner wit:: those on extantdevices, such as the Hayes-Binet or the WISC. was hased upon a desireto create a device that would avoid a sampling cf hehavior that was,presumably, considerably cUturally biased. Therefore, it was antici-
pated that, while scores cn BLAT wonld correlate positively with thoseon the Hayes-Binec or the WISC, this correlation wo,.ild be lower than,
say, that between scores on the Hayes-Biz.et a-7,d Or the WISC. It was
hoped that the correlations between BLAT and the Hayes-Binet, andbetween BLAT and the WISC, would be lower anong younger subjects than
in the case of older subjects. The decision was made, therefore, to
proceed on the basis of a commitment to a Spearman, or Spearman-like,
perception of intelligence.
Given a pool of items, it was desired that some constellation of
these would yield responses from children which would discriminateacross a chronological age range from six through sixteen years. In
other words, the average score of a random sample of seven-year-olds on
some yet-to-be specified pool of items would be higher than the average
score of such a sample of six-year-olds cn the same pool of items, the
average scores for eight-year-olds would be higher than the average
score for seven-year-olds. and so on. This kind of empirical informa-
tion (progressive discrimination across ages), coupled with the
posited construct, was taken as primary evidence of validity. Once
such a pool of test items satisfied these two conditions, (the
Spearman construct commitment and discrimination across ages), the
performances of children on that pool could be compared with, but not
anchored upon, the children's performances on the Hayes-Binet and/or
the WISC verbal tests.
The possibility of obtaining from the children's teachers'
judgments of the children's ability to learn was considered as another
possible means of ascertaining concurrent validity. However, the
judgments of teachers of blind children were regarded as too likely to
be contaminated by aspects of teachers' attitudes toward children's
behavior in areas other than learning to make this approach to con-
current validity sufficiently definitive to pursue. Similarly, the
possibility of using teacher judgments of the educational achievements
of their children was given only passing consideration because of the
probable presence here, too, of contaminating factors in such evalua-
tions. School marks given blind children were regarded as too con-
taminated to constitute a sound criterion. The possibility of com-
paring performances on BLAT with already-obtained scores on objective
achievement tests across the full age ranges offered little promise,
largely because of the scarcity of such information, particularly at
the age levels involved, and also because of the extrapolations from
differing testing times which would have been necessary to bring the
data into comparable frames of reference.
A pseudo-predictive validity approach, however, was possible
by means of comparing performance on BLAT with currently obtained
19
objective measures of educational azi.ieveme-t. It was possible, in
the later segment of the st=y, to adi7.ister at least significant partsof the Stanford AzI-ievement Tests to a sari to of 1-lind 0.11dren, who
also, within the same year, had earned scores o- ite BLAT i-ool of items.
Since, in the stage of ?-he study mate possible ty the USOE
grant, Hayes -Binec and WISC verbal results als w_re obtained or
available on the children who had earned scores the BLAT coal of
items and on the ediLcationai ac`-levement tests, it was therefore,
possible to ascertain the following kinds of i-lorration contributive
to this later phase of the study:
1. Relationships between BLAT performance and eat:: of the parts of
the Stanford Achievement Tests used (°'Ictal ac:-Aevement score"
was regarded as grossly less meaningful, either educationally or
psychologically, than the scores on specific parts of the test.);
2. ..elationships between Hayes -Bizet performant.e and each of the parts
of the achievement test;
3. relationships between WISC Verbal performance and each of the parts
of the achievement test; and
4. relationships between various combinations of BLAT, Hayes-Binet,
and WISC Verbal scores and the several parts of the achievement
test.
In sum, then, the evidence to he presented regarding the validity of
BLAT is of the following nature. Given the construct orientation,
1. performance on BLAT progressively improves across random samples
of increasing chronological age levels;
2. performance on BLAT correlates well enough with performances on
Hayes -Bizet and WISC Verbal to suggest that the measurements are
in a comparable domain, yet low enough to suggest differences in
the behavior samplings; and
3. performance on BLAT correlates promisingly with measured educa-
tional achievement, as compared with correlations between
performances on the Hayes-Binet and WISC Verbal and measured
educational achievement.
1.43 Rationale for the BLAT Items. In 1952, a variety of
"intelligence" tests, including the Cattail ClAture Free, the Raven
Matrices, the Kuhlmann - Anderson, the Kuhlmann-Finch, the Chicago Non-
Verbal, the Michigan Non-Language, the Amerir-an Council on Education,
and others were examined to identify possible items which might be
used as they were or which could be adapted for possible use. A file
of between 350 and 400 items was devtloped from these sources, plus
some created de nouveau. This selection and creation of possible
20
itens was carried out in terms of a Spearran type of thitking aboutthe nature of the betaviors to be sampled. This basic constructorientation was maintained, with the following restrictions beingimposed:
1. The test items were to be in bas relief form, consisting of dotsand lines.
2. The spatial discriminations to be made by the child among thesedots and lines were to be greater than those called for in thereading of braille.
3. No stimulus materials, other than the directions, were to beverbal in nature.
4. Verbalization of response was not to be required in solving theitems or in specifying the solutions to items. Pointing behaviorwas to be accepted although accompanying verbalization could beaccepted.
A variety of test-element patterns was to he developed, all ofwhich would necessitate eduction of relationships and/orcorrelates by the child.
1.44 Development of the Test Materials. A pool of 94 items originallywas identified for reproduction, embossed on regular braille paper,and administered from May 8, 1953, to May 21, 1954, to 313 children,ages 5 to 21. Due to the pressure and perspiration involved in thesubjects' exploring the items, it was early decided to cover thestimulus and response elements, and their immediate field, withshellac. This not only increased the life of the test items, but wasbelieved also to increase the cutaneous contrast effect.
By February 9, 1955, the pool of items was reduced to 84, andthese were administered, from then until March 18, 1963, to 624additional subjects over the same age range. For this period theitems had been reproduced on a plastic substance - a cellulose acetate.Even though, during this time, there had been some exploration of theuse of pressure and heat procedures which might be employed in theproducticn of brailled materials, the plastic BLAT items had beenproduced solely by printing them between the zinc sheets which hadbeen used in printing them on braille paper. While the amount oftolerance between the zinc sheets presented no problem when evenheavy braille paper was used, it was not adequate when the plasticmaterial was used, without heating. Some 4010 of the dots which madeup various item elements were damaged, mostly by virtue of the partialcutting away of the bases of the dots and, much less, by the cuttingout of the tips of the dots. Fortunately, such imperfections did notappear to render any of the item elements inadequate. (The resultsof explorations of the use of other materials and production
21
processes suggest that, when the time CO=2S for the commercialproduction of BLAT, effective production of very desirable test
materials, by means of the existing plates, is possible.)
The test items were "printed" on leafs 10" xAll dots and lines were embossed at braille height,
spaces occupied on the leafs by the test items, the
field with which the child had to work, ranged from
3-1/2" .
5-3/4" in size..015". Thetotal "visual"7" x 1" to 7" x
Early in the exploratory stage of BLAT test item development, it
Was assumed that it would be desirable to have a category of items
which involved the identification of response elements which had been
rotated through space vertical to the surface on which the stimulus
element appeared (turned over rather than rotated on the surface on
which the stimulus element appeared). This resembled the "mirror
image" type of item on some tests, allowing for the mirror to be on
either the X- or Y-axis. The assumption here was that this kind of
item would sample behavior relevant to the blind person's writing
braille by means of stylus and slate but having to turn the paper
over in order to read the impressions so made. After trying this
kind of item on some 100 blind children of varying ages, it was found
that it was extremely difficult for the children to comprehend the
nature of the test task and that discrimination across age levels was
not accomplished. This category of items was discontinued afterinquiry among teachers of the blind evoked the general opinion that
braille writing habits (with a stylus) and braille reading habits
were quite discrete learnings which involved little, if any, transfer
from the one space orientation to the other. The increasing use of
braille writers further seemed to reduce, although not eliminate, a
need for a major concern about this matter. Some definitive research
on this problem is needed, however.
In the early stage, also, some series of test items were made
out of masonite, with the major dimensions of the elements varying
from one inch to two inches. The stimulus and response elements were
glued on masonite panels 3" or 4" wide and 15" long. This kind of
lay-out of test items was found to communicate the nature of the
tests no better than, and often less well than, the embossed items.
Due to this fact and the physical clumsiness of even one series of
items so constructed, further development and use of such materials
were abandoned.
On the basis of the responses of the "original" 937 children,
aged 5 through 21, 551 of whom were in the "educationally blind"
category, the 84 items were further edited. All responses had been
made a matter of IBM record. The percentages passing at the different
age levels were ascertained and the resulting evidence of the
discriminability of each item was plotted graphically. (This was done
separately for the "born blind", the "adventitiously blind", and the
22

partially sighted. From an inspectional standpoint, no consistent
differences among the groups were apparent. However, as has been stated,
all subsequent discussion is in terms of only the educationally blind -the performance of only those children who used their fingers in
solving the problems.) Since the median number of children at theseveral age levels in this sample was, at most, 48, judgments on the
discriminability of the various its were made, instead of makingthe statistical analyses of item difficulty customary in standardiza-
tion studies involving much greater N's. items were dropped whose
curves reflected inadequate evidence of discriminability, whether
across all age levels, or over some major portion of the age range.
This resulted in a residual pool of 49 items.
The distributions of the children's uses of the different
response elements of the items were examined, resulting in the reloca-
tion of some of them in the effort to avoid position response sets,and some minor editing of specific elements was done. (One compulsive
youngster discovered one dot too many in a line in the correct
response element!)
It was this edited and selected pool of 49 items which was used
in the collection of BLAT responses over the period of September 1
through January 31, 1967, when 350 additional (educationally blind)
children were tested. Even with the total pool of all testings by
means of BLAT, the median number of educationally blind children atspecific ages over the age range of 5 years to over 18 years was 75.
The BLAT test materials on which this standardization isbased consisted, then, of the 49 test items which had been selected
out of the original, larger, pool, plus 12 training items. Two
training items precede each group of test items. The test items were
regarded, on an a priori basis, as falling into six categories. The
first category consists of items in which the child is required to
identify which of six test elements was "different", or "didn't belong
with the others", as in the illustrations below.
.. at . 0
I
.9.
.
0' 6
,IZz
**ova.
.04..
0
o'0
.04
.-.c
O.
.P.D.0.0
dr.0 ..40'
fro...
2
23
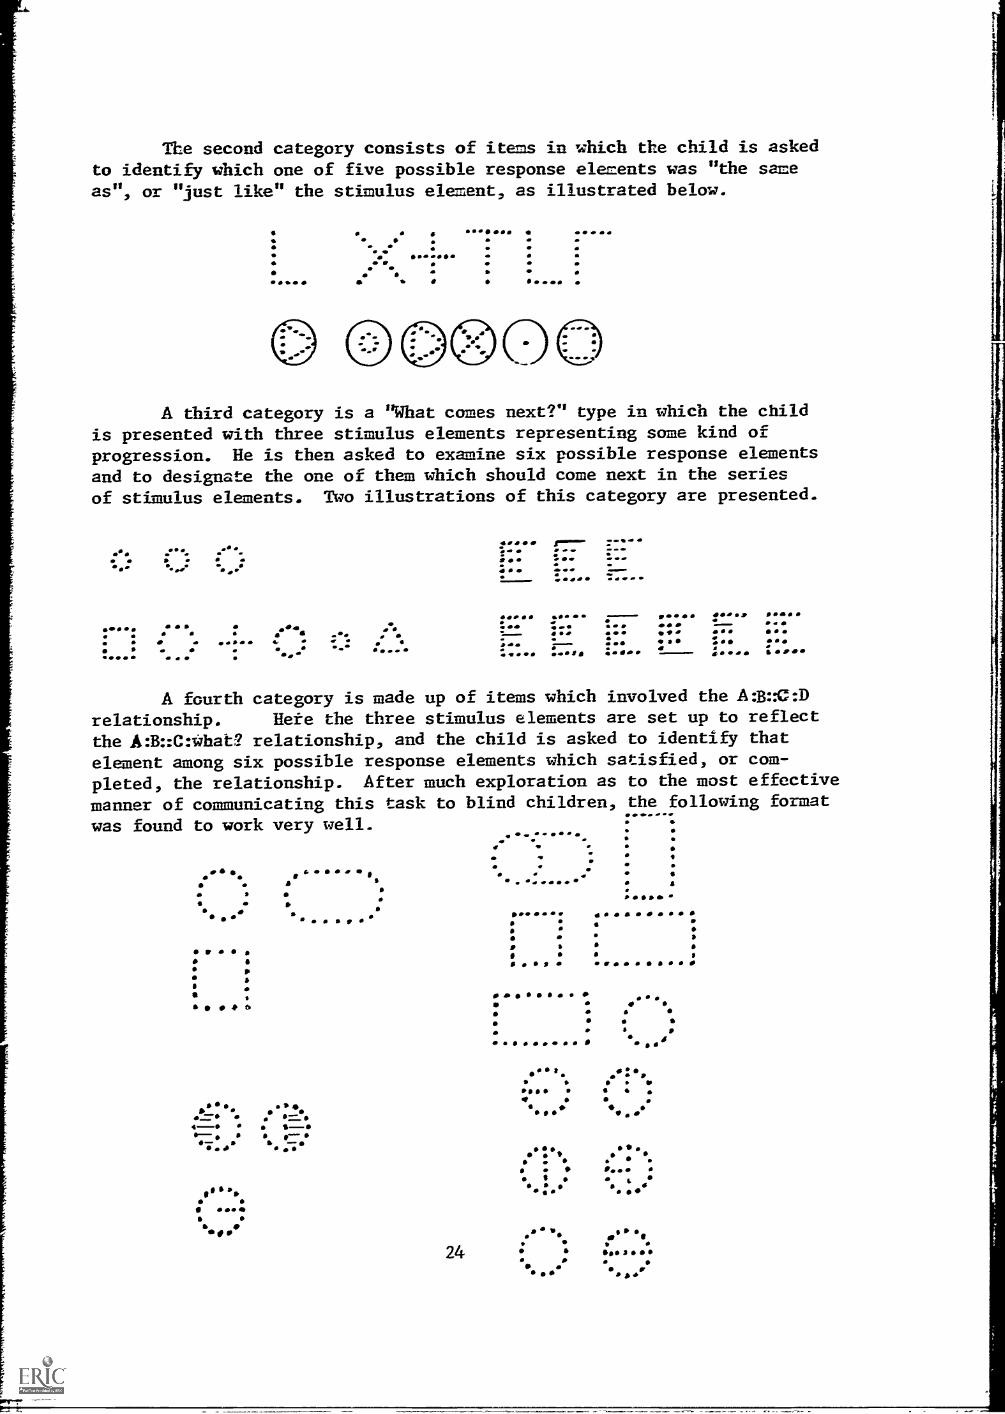
The second category consists of items in which the child is askedto identify which one of five possible response elements was "the sameas", or "just like" the stimulus element, as illustrated below.
V
adi0. .a o .a a. a
aIli
41
A third category is a "What comes next?" type in which the childis presented with three stimulus elements representing some kind ofprogression. He is then asked to examine six possible response elementsand to designate the one of them which should come next in the series
of stimulus elements. Two illustrations of this category are presented.
a a .0 1...... ..e
0.;00a a
:a...fammomm
o a..deboo
a ado Ia..." aaaaa 0 141 .1,aaa0 a 0 ...PO 4.0 Pa 0 0-a. &a a
a 7..... 11 .. a se aa 4 . 4. w . ... a & l j
II 0 .... & 4 aoo e . g. a 00 JP"
4/.4
A fourth category is made up of items which involved theA:11::inD
relationship. Hete the three stimulus elements are set up to reflecttheJM:Crwhat? relationship, and the child is asked to identify thatelement among six possible response elements which satisfied, or com-
pleted, the relationship. After much exploration as to the most effective
manner of communicating this task to blind children, the following format
was found to work very well.
sr
o
*
. a .041,-=. 6.:=,..-- loa
C....0
arpod06
4,
I
24
O..lb
w ae
w.0
.. aS. a
OOO
a
111
000000 o I oie
* s 4,0:0,
0000
0 . 4
, .0 It 6.
;oaf,,:so*,
as
is* 00000
.. 1
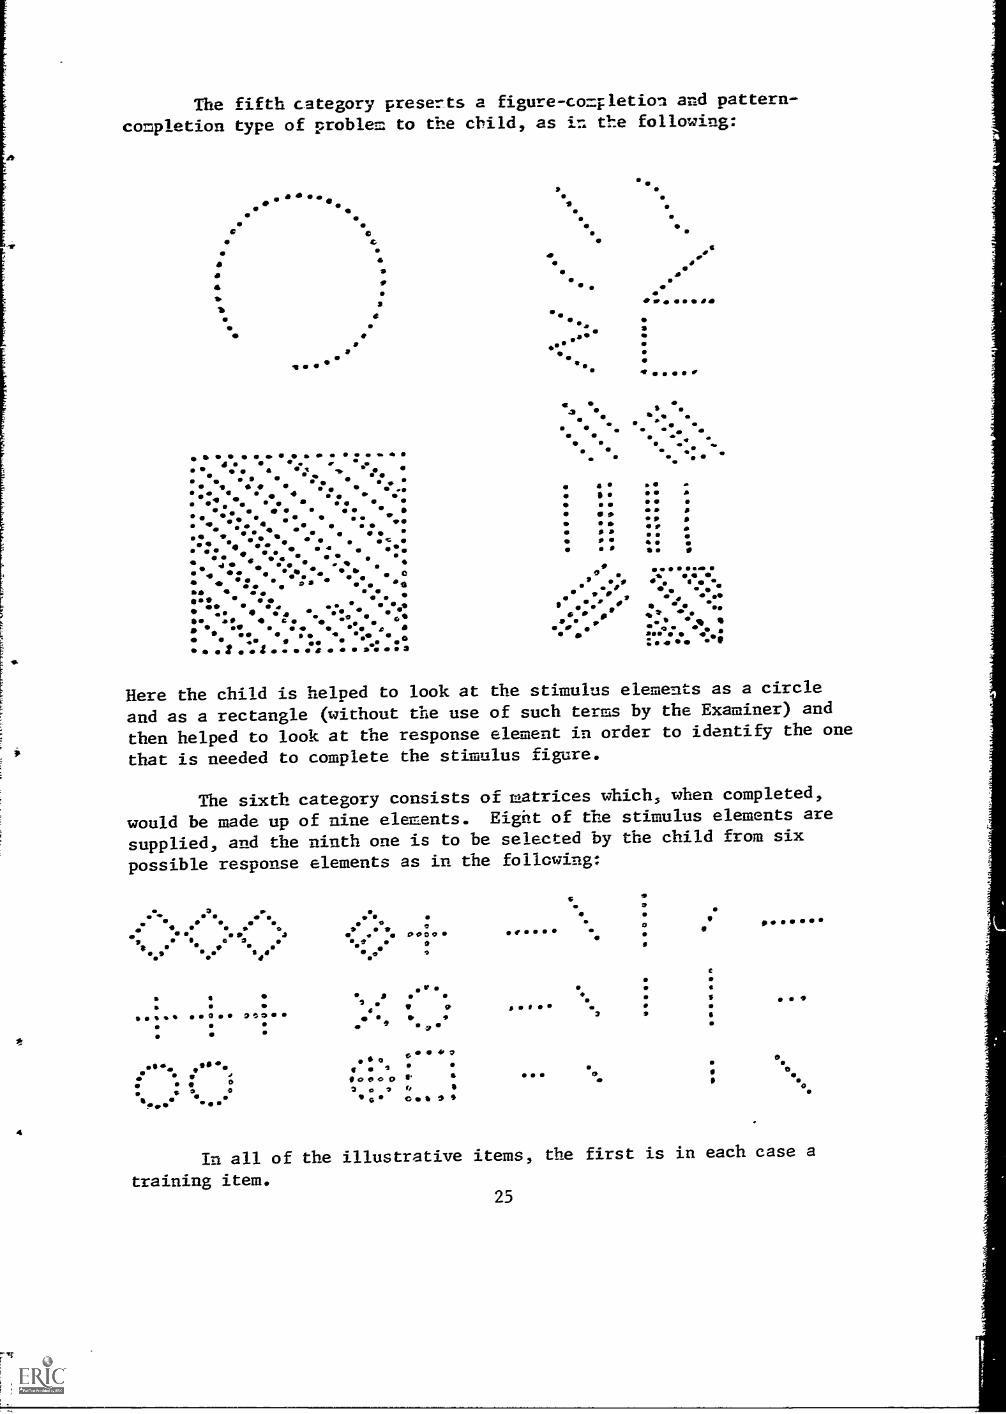
The fifth category preserts a figure-completion and pattern-
completion type of problem to the child, as in the following:
IP* 0
s SO11
C C ItC
pIP
4 /10 4411
so*so. 912 wa1.%
2
e oa
a 40..it
fell. *a oilo.
OOOOOO OOOOO4I .so I
0 . 4 q f 0 .6_ 4, a 6e....
6 s* a we 0 ope aiie 16 -is 9 a-, 4 04e '
4440 4 00,,,
Oa . 6 Co a D 4 I
lb
of 4 4s Op11 44
a* a 111 3 30. 43 ,all s 0 0
,op 0 0.41 * 00 .abi 00: 0,014... 4 2
S
0
.40 4140
0IP
99 IP IA''' a .eV*0 ,.... %00 - 4.'off 4.
. 4
IP
0
Here the child is helped to look at the stimulus elements as a circle
and as a rectangle (without the use of such terms by the Examiner) and
then helped to look at the response element in order to identify the one
that is needed to complete the stimulus figure.
The sixth category consists of uatrices which, when completed,
would be made up of nine elements. Eight of the stimulus elements are
supplied, and the ninth one is to be selected by the child from six
possible response elements as in the following:
a. *all f*.3
e Of o 0.4 0. 0 0 9 94 e SP *a .9 41*
4*iv* .39 0
O 05 0
.11S. 4 0a a a 1
0 0 0 0 00 2 o
11 ...II41.0
* *
o 2
00..09 0 aa
C
f a
issal2
0
0so0
In all of the illustrative items, the first is in each case a
training item.25
1.45 Development of F.7ocedure for Administering BLAT. From the out-set, the paramount commitment in administering BLAT was to seek tocommunicate to blind children from the age of 5 vo, the taskspresented by the several kinds of items. The moaerate experience ofthe author with the blind, informally picked up in connection bothwith a fair amount of observation of the learning procedures andproblems they manifested in classrooms and with experience acquiredin psychologically testing them, provided some initial basis in termsof which the early administration of the BLAT test items was under-taken. Initial directions were tried out by him and his two assistants.Full notes were kept on problems encountered and the directionsmodified accordingly. By the time the first 50 or so children had beenconfronted by the BIAT items, the procedure was relatively stabilizedso that only minor changes in the directions resulteJ thereafter.Particular attention was paid to the problem of obtaining psycho-logically maaningful, or plausible, respunses for younger or lesscapable children. Since no evidence was at hand at first regardingdemonstrable difficulties of items, all children were administered allof the 94 original items. After the testing of the midwesternpopulation was completed, items were identified which did not appearto discriminate across age. The training items were taken for thisgroup.
The resulting Manual of Directions is incorporated in AppendixD. (A translation of it has been made in Spanish, a result of someexploratory work with BLAT in Colombia, South America, byMrs. Donna Bolian in the summer of 1968.) Since the primary focus hasbeen to try to communicate the psychological task to the child, avariety of verbal instructions is provided, and the examiner isencouraged even to make use of idiomatic equivalents. This ispermissible so long as the examiner keeps certain points constantlyin mind: The subject (5) is to be helped as much and as often asappears necessary to "set his total visual field" - the full spaceover which the stimulus and response elements are spread. S is to
be caused to perceive each of the stimulus and response elements as
individual components. S is to be caused to see the stimulus elementsas whatever groups are necessary whenever such perception is essential
to a comprehension of the demand of the item. The examiner (E) is to
allow S to use whatever finger or fingers S uses in exploring thestimulus and response elements. E is to guide S in his explorationof the elements and/or the field only to the extent and in a mannerthat is acceptable to S. (Some Ss resent excessive guidance; others
need a great deal.) E is to keep his vocabulary as simple as in thedirections, if he does any improvising in the directions as they are
stated. E is not to make any vocabulary demands upon S, but toaccept whatever verbalization S may employ. Gross gestures, orpointings, are as acceptable as verbalizations of response. All
training items are to be mastered (with or without verbal accompani-ment, as appropriate to ), unless comprehension of the itempresented is clearly not possible.
26

That the na Yu,, is acequAz, is i.ueg-:sted correlationof the results obtained c- popkiiation of 93 z:ti...tr:T.7 wto originally
were tested on BIM L y eyia7iners trair_ed by t=e 3-.t :or and who were
retested by seven perso7s uf-o %ad only the to go by.
1.46 Problems of Zeta CoIle.:.tio7.
1.461 irol-lem. In test standardization thecustomary practice 15 to seek to obtain 3 stan,dardization populationthat closely parallels tie total general Lop-A.ation for which the testis being develorei. This Is reasonably possible scinem the proposed
test, either grocI or individual, is intended for use on anessentially "general- i:oi.ulation, say o ci-ildren in the age range of6 through 15, or 6 throue 12, nr even. 3 ti-rougt b. In tte case of
a test to be ..sed on a ge7eral poptilation 0-at is to be administeredindividually, the availanility of a potentially adequate standardiza-tion population presents no insurmountal-le probler, but theavailability of persons qualified to administer suclf a test presents
more of a problem. In the case of an individual test for the blind,both of these facets present very real problems. In the first place,
the total visually impaired population constitutes approximatelyone-fourth of ore per cent of 0-,e total populatio7, and the blindconstitute only approxilizately one -fifth of t'-is sub-group. In other
words, only one child in some 2000 is "1 and". Nor only is thenumber of this target population quite low. bcr the accessibility tothis population presents a problem since sore portion of them is not
in school. In the second place, the number of persons qualified andavailable to administer an individual test is very limited.
Therefore, the approach used in the standardization of BlATwas to obtain as large a standardization population as possible,
trying to avoid,as much as possible, grossly distorted samplings atparticular age levels. For some reason or reasons (school attendanceenforcement practices, the welfare role which schools for the blindplay, or some other condition) the pupil populations within schoolsfor the blind do not yield distributions by age levels that arecomfortably comparable to those in regular public schools. Addingthose blind children who attend public schools to those in residen-tial schools still fails, for some unidentified reason, to givecomparable distributions at different age levels. Generally, blind
children do not start their schooling as early as do sighted children.Compulsory school attendance tends not to be enforced in the case ofblind children as consistently as in the case of sighted children.(Interestingly, Even in the attempts at early standardization oftests for blind childrea, this variability in uml..-ers of children at
different chronological age levels has appeared.)
In a standardization s'ich as this, one could at best studiouslyseek geographic representation, make an essentially saturationsampling, and then examine the characteristics of the obtained
27
population, hoping that they do not depart too radically from a"representative" population. Whatever such analyses reveal, the factremains that the population on which BIAT is stand,xdized is thelargest, geographically cost dispersed group of blind children to whomany individual test has been administered by carefully controlled testadministrators.
1.462 The "Blindness" Definition Problem. Logically, and in
terms of practices in educatio7,a1 programs for them, blind childrenmay be regarded as falling into four categories:
The "blind" --Category 1: Those bli xd at birth.
Category 2: Those 1ecomi.7s blind after birth.
The partially sighted --Category 3: Those born that way.
Category 4: Those who became partially sightedafter birth.
Initially, it was anticipated that data would be collected on children
in all four categories. However, in the first 300 to 400 cases, only18 children were found whose medical records suggested that they fell
in Category 4. In the early analyses of BLAT performances, therefore,only the first three categories were employed. (Those in Category 4
were put into Category 3.)
However, logical classifications ofter are at variance with
functional classifications. Workers with the blind are distressinglyfamiliar with the elusiveness of a definitive meaning of the term
"blind". To some, it means total non- vision at birth, to others it
means a total non-vision condition that either has been present atbirth or has appeared between birth and some later specified age. To
still others, it is taken to denote a visual acuity, in Snellen terms,
of 20/200 or less, regardless of when the condition is known or
believed to have appeared. To still others, the term "blind" is
applied to any person whose visual acuity is so impaired as tonecessitate his having to do his "book learning" by reading braille.
Some characterize this latter group as "functionally blind" or
"educationally blind". (An exception in the latter case exists in
certain situations where all the children in a school for the blind,
whether "blind" or partially sighted, are required to learn to read
braille, presumably on the assumption that certain, unspecified,
children who at the moment are partially sighted may have, or later
may have, a progressively deteriorating visual acuity which may
develop into a condition necessitating the use of braille.)
The futility of operating primarily in terms of the original
logical classification scheme was recognized, and the performances
28
of only those children who responded to the BLAT items by touch wereused in this standardization. Subjects ware ide-Aified initially interms of their being "taught" by means of braille. 141-41e early datawere retained on those children who had been classified as "partiallysighted", the performance of any who were reported as using theirsight to whatever extent, in the solution of BLAT items, are excludedfrom this standardization study.
1.463 The Age Sample Problem. In the process of collectingdata in the first nine residential schools (prior to the work underthe present grant), two approaches were made to get representativechildren as subjects. The first consisted of taking all the childrenavailable within the age range of five through (or even above) six-teen years of age. Whenever any of the age populations in the schoolswere regarded as being such as would result in a numerically biasingsampling of any age group, the total specified age group in the schoolwas identified and a randomized sample (every other child, or everythird child) was taken. Volunteers were not sought; nor were teachersor administrators asked to select standardization subjects. (As anyonewho has worked in this kind of situation knows, principals andteachers, when asked to identify "typical" youngsters for inclusion insuch a study, tend more often to bring forth above-average youngstersthan they do below-average youngsters.) Thus, the residential schoolpopulation in this phase of the study constitutes either a saturationsample or a systematically randomized sample taken from a total gradepopulation. As will be seen, even this combined al-proach failed togive even reasonably equal-sized age samples. (Some curiosity shouldbe entertained regarding characteristics of the residential schoolpopulation itself which might tend to reflect the fact that, eventoday, residential school programs tend to have welfare as well aseducational functions in our society.) As for the children in theday schools, all those identified were taken. This latter practicecould contribute to a somewhat biased samples especially in thosesituations where, as some suspect. the more capable are kept in orsent to the public schools for their education. However, since theirperformances are combined with those of the residential schools, thecombined group may be regarded as, perhaps, more nearly approximatinga "normal" distribution of the blind than might either of the sub-samples.
In the project phase of the research, all the functionally(or educationally) blind residential school pupils in three southernstates between the ages of nine and sixteen years of age were tested.BLAT data only were collected, in addition, on the six-, seven-, andeight-year-olds who satisfied the braille-used criterion and wereavailable, plus only an occasional seventeen-year-old who happened tohave moved out of the sixteen-year-old category during the period ofthe study.
It must be remembered by those unfamiliar with the problem ofgetting young children into educational programs for the blind that
29

the age sample below the nine- or ten -year level is statistically lessthan ideal.
Chronological ages are used in t"..is study so as to denote mid-points of age ranges. That is to say, a was taken to be, say,ten years old as of any time between his being nine years, six monthsold, up to and in -lading his being tea years, five months old. Anychild who was sixteer days into a given moner was regarded as havingan age as of the next following month.
1.464 The Background Information Frobien. On each childtested by BLAT, an attempt was made to obtai--; rati-er extensive back-
ground information - medical, psychometric, educational (test dataand teacher evaluation) , familial, and socio-economic data. (0 copyof the form used for recording this information is incorporated asAppendix B.) This necessitated file searetes requiring from fifteenminutes to over an hour per child. All scil, information was soughtfrom school and/or clinic files. However, there are marked "individualdifferences" among the schools - both residential and day - as to theadequacy and/or accuracy of such information. Heavily contributive toa lack of fully satisfying information is a marked variability in theamount and kind of home and school background information suppliedthe schools or obtained by them. Overall, maxim: m confidence can beplaced on the birth dates (obtained from the best official sources),race, and sex of the children in this population.
1.465 Controlled Collection of BLAT Data. All the BLAT scoresused in the standardization have been obtained by the author and bystudents whom he had trained to administer BLAT. The only BLAT scoresnot obtained in such a tightly controlled manner are those which wereobtained in the retesting of 93 children in the test-retest reliabilityfacet of this study. The results of the reliability study are taken tosupport the view that such a rigid control on getting BLAT scores didnot contribute to norming data that are unrealistic or unrepresentativeof what is likely to happen in the subsequent use of BLAT.
It is appropriate to introject at this poirt a statement ofthe rationale for this controlled approach it test data collectionas contrasted with the customary practice of delegating this respon-sibility to others in the field. Particularly in connection with theearly work on BLAT, the feedback obtained from the few administratorsof the test items was of great value with respect to the developmentof both the effective administrative procedures and the nature andformat of the materials. A majority of the residertial schools eitherdid not have psychologists on their staffs or had persons serving inthat capacity whose psychometric training for work with the blindleft considerable to be desired. Further, it those instances wherethere were competent psychologists or psychometrists, the timedemands on such persons would have been so great as to mitigateagainst getting BLAT data without serious encroachment on their time,
30
delay in getting results returned, and possizIc tias i71 0-le selection
of the children to be tested. Nat inclI:dezi Ere a7ai.:ses made in
this study are t!e data ottai:_ed by ;feet.
atte=pt 7nas been rede to keep seisrate t e description ofthe earlier work done on KAT from that do-e L7der 0-_e U.S. Office ofEducation grant, iihick has rade this report possible. To tte extentthat the description concerned tte ratio-7_21e for BUT and the develop-
ment of the test materials. that objective was Loci-, logical and easy to
attain. However, the consideration of the problers i7v3ived in thedata collection and the description of the total star_dardizationpopulation necessitated e...e combining of cersai7 1-formation from
both phases of the work.
31
2. THE PROJECT FHASE
2.1 Collection of Data
2.11 Overview. All B: T, Hayes-Binet, and WISC data and the back-ground information on the children were obtained under the personaldirection of the author at the three state residential schools ofAlabama, Tennessee, and North Carolina. The individual testing andinformation collection was accomplished at the Alabama school,September 9, 1966, to September 15, 1966, inclzsive; at the Ternesseeschool, January 16, 1967, to January 21, 1967, inclusive; and at theNorth Carolina school from January 23, 1967, to Jaruary 31, 1967,inclusive. All the BLAT testing was done, as !-ad been said, by advancedundergraduates or graduate students in education and psychology, noneof whom had had formal training in individual testing but all of whomwere trained by the author in the administration of BLAT. The Hayes-Binet and WISC testing was done by graduate students in education orpsychology who had had formal training in individual intelligencetesting. The author provided them with orientation in doing suchtesting with blind children, supervised them in the testing, andchecked all computations. (The scoring of all tests later wasrechecked before the results became data for this study.) Thephysical conditions under which all the individual testing was donevaried from adequate (e.g., locations scattered through library stacks)to highly desirable testing in separate rooms.
It had been hoped that all the children aged 9 through 16 inthe three schools could be tested by means of all the "intelligence"tests and educational achievement tests. However, such complete datacollection was accomplished only in the cases of the learning aptitude
tests.
2.12 BIAT. Since standardization data were being sought, the agerange of those given BLAT was extended downward to include six-,
seven-, and eight-year-olds. Whenever time was available or adequateresults were in the schools' records, Hayes-Binet and WISC verbalresults were obtained in these younger children.
2.13 Hayes-Binet and WISC. The Hayes-Binet and WISC Verbal data were
obtained for this study in two ways. For the most part, these tests
were given to each child used in this study by the 13 graduate
students working in the project. The results of these testings were
reported to the schools.
Some ten per cent of the scores on these tests were obtained
from the school records. In all such instances, the author read overthe full psychometric or psychological report on each child anddecided whether the results appeared to be of acceptable quality. No
results more than three years old were used. All such suitable re-sults were extrapolated from the times of testing to that of this
32
study. In subsequent descriptions and analyses no distinctionwill be made between the Hayes-Hint and WISC data thus obtainedand those obtained by the testers working under this grant.
In the case of the pre-project population, also, there wereresults of testing by means of the Hayes-Hint and WISC which wereevaluated in terms of their possible use in the total standardizationstudy. Generally, those results were taken for use in this studywhenever there was evidence suggesting the competence of the examinerand when the recorded scores seemed "clinically plausible". This wasdone without any knowledge of the magnitude of the BLAT scores. (This
meant that there was still some possibility of bias in those scoreswhich were accepted since such a procedure well could have resultedin the exclusion of certain extreme scores which probably enter intomany standardization studies.) When there were two or moretestings, and later scores tended to be higher than scores earnedat entering or earlier ages, whether by the same device or bydifferent devices, the later scores were taken for use in this study.All such scores were extrapolated, where necessary, to the dates ofBLAT testing.
The Hayes-Binet results were dealt with in terms of mentalages, represented in the analyses in terms of months, instead ofyears and months. In the case of the WISC Verbal results, WISCVerbal test ages were computed by multiplying the children'schronological ages by their WISC Verbal IQ's, these results alsobeing represented in months.
Table 2.13 shows the numbers of pre-project pupils whoseHayes-Binet and WISC Verbal scores were used in the total study.It should be noted that the percentages presented under the differentcolumns reflect only the relative amounts of Hayes-Binet and WISCscores regarded as usable in this study. They do not necessarilyreflect the relative frequencies of use of the tests in the three
regions. It is interesting to note that the Hayes-Binet tended tobe used more than the WISC in the midwest and on the east coast,whereas the reverse was true on the west coast.
33
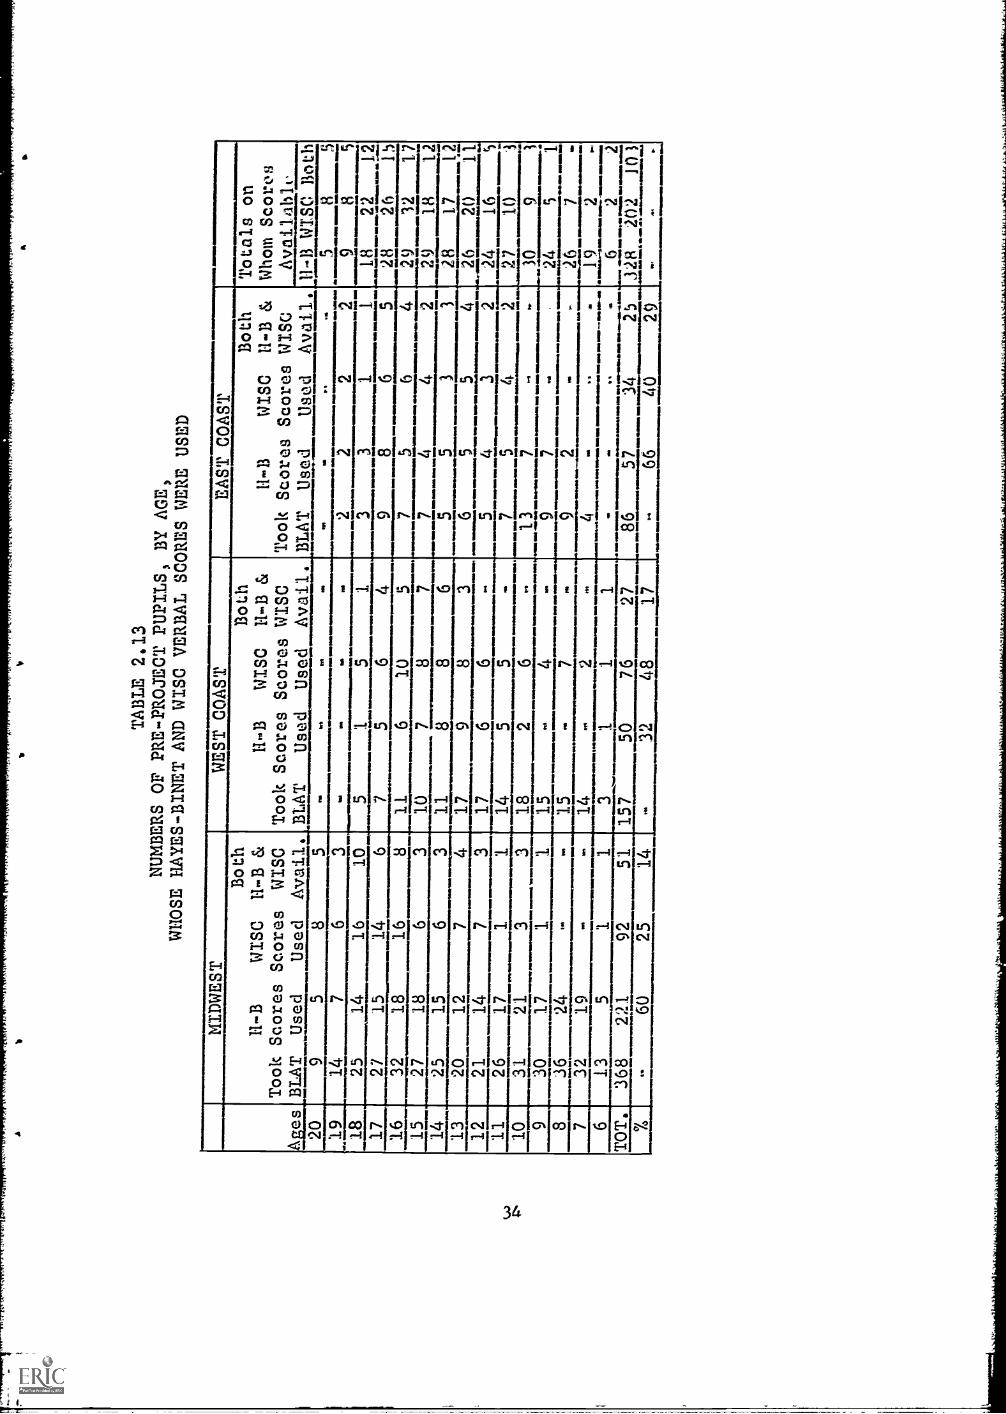
TABLE 2.13
NUMBERS OF PRE-PROJECT
PUPILS, BY AGE,
WHOSE HAYES-BINET AND WISC
VERBAL SCORES WERE USED
MIDWEST
WEST COAST
--
----
EAST COAST
----
.Ees.E.LAT.
20
Both
H-B
WISC
H-B &
Took Scores Scores
WISC
Used
Used
Avail.
Both
11-8
WISC
11-B &
Took Scores Scores WISC
BLAT
Used
Used
Avail.
Both
11-B
WISC
11-B &
Took Scores Scores WISC
Totals on
Whom Scores
Availably
BLAT
Used
Used
Avail.
U-B WISC Both
95
85
-.
..
ON
.00
4. ---.11MONOMMMOWMOMMIMIONIMIN
58
914
76
3-
--
-2
22
2---
98
5.1
918 Mowomr.&
17 16
25
14
16
10
2715
146
32
18
16
8
T3T5 .101001
1.1.
.100
0001
0.01
1001
001M
mO
OM
NO
Mu0
.0.0
11.M
10.4
0.,..
..
-26
775
.6
0.00
01y
11
610
5
98
65
40M
INO
0100
0040
MO
N00
0400
1010
1M0M
OM
MM
iNi2
8I 5
104.
0.11
1000
4M.
.7
..5
64
29
12
17
15
27
18
63
10
78
7____7_....4
42_
25'
18
1/
14.
13
25
15
63
11
88
63
3....3
T28
17
020
12
74
17
98
36
55
4.
26
20
fT *C
12
21
14
73
17
66
14
55
-
6.-----7-----T3
......7......_77,..........9........r.0000MMI000!000..a4470
157
-14
54
32
75
42
---7-----
-"
' a0.0
6..a
iNM
.0.0
.000
0100
404.
101.
mal
ba.0
.000
100
92
-
227_
16_
27
10
11
,5.-
,--5
o_o.
......
,_.i.
_.._
...._
r_i..
...5.
_._7
._.
.....r
ole.
m.*
*.re
at...
...m
okir
o...0
0.00
00.0
0..0
0.00
60.0
.0.0
00.0
..r..0
.0.1
0.10
01.1
040.
0060
.001
00.0
0100
0ww
wH
INO
8 7
26 ___17
11
ir______3______s_
36
24
.-
---.
......
..---
----
-=...
......
..77-
-32
19
-
309
3
r=a1
10.1
1011
124
)
267
-7.------7__7_---7-....__
0.00
1.0-
,0M
.110
-00
011.
0.60
.001
01N
10.w
-00
0011
06
......
0111
wel
1M00
.11.
00=
1100
1006
1411
1.10
.010
.000
4,00
0000
404.
1.10
.00,
1410
1044
=01
1....
0.0.
..011
NtI
MM
01M
OO
MM
DIN
ISIO
NI
135
11
31
11
--
--
..001
0.00
0.40
010
6.40
060.
100.
.-1.
0-01
1401
1
57.... 34
5
62
200
.000
4...1
10.0
0110
0101
0100
0.0
328.102
103
TOT.
368
221
92
51
157
'''
50
27._:--86
.60
25
14
-32
48
17
...-
66
40
29._ -
2.14 Stanford Achievement Test. It was regarded as neither feasiblenor satisfactory to give the achievement tests at the same times thelearning aptitude tests were admiristered. While the author offeredeither to bring testers to the schools to do the achievement testingor, even, to visit the schools and organize and supervise that testing,
the school personnel at Alabama and North Carolina preferred to
handle this themselves. In the hope that students at the GeorgePeabody College for Teachers who were preparing to teach the blindnight acquire helpful relevant experience in administering thesetests, the responsibility for carrying out this testing was given toDr. Mandell Harley, who was in charge of their area of professionalpreparation.
The achievement test materials, obtained by means of this grant,
were supplied to the participating schools. Generally, it was decided
that the use of answer sheets, even though they were available forcertain levels, might create adaptation problems for the pupils whichmight contaminate the scores on the tests. There were, however,
certain exceptions: (1) In the Alabama and North Carolina schools,the pupils wrote the spelling words in all instances except where theadvanced level of SAT Spelling was used. (2) In the Tennessee school,
the pupils indicated their answers by marking in the test bookletsonly where the Primary level test was used and in the Intermediate I-Alevel test in Word Meaning. Due to differences in familiarity withthe Nemeth codes employed, Form L was used in the Alabama School andForm Xmas used in the North Carolina and Tennessee schools.
All the achievement tests were scored by research assistants,and the scoring checked. Where the responses to the Spelling tests
were in braille, the assistance of a blind graduate student was ob-
tained. As soon as they were obtained, all achievement test scoreswere reported to the respective schools.
All SAT raw scores were converted to EGS scores. Three
assumptions underlie the use of the SAT results in the analyseswhich are made: (1) It is assumed that the educational gradestatus scores (EGS) of the two forms are comparable. That is to say,
an EGS in a given subject matter area of, say, 5.4 on Form L connotesan educational status comparable to an EGS of 5.4 in that area on
Form X. (2) It is assumed that any given EGS obtained on one levelof SAT (primary, intermediate, or advanced) connotes a comparableeducational status on an adjacent level. That is to say, that an
EGS of 3.5 in, say, Word Meaning obtained on a primary level testis comparable to an EGS of 3.5 in that same area on an intermediate
level. (3) In a very few instances where pupils took only one partof a two-part test, the part scores were extrapolated to representtotal scores on that content area of testing. Inspection revealed
that scores so obtained did not deviate significantly from the rangeof scores earned by those children who had taken both parts of the
test in that particular subject matter area.
35

No use was made of the designation of grade levels towhich the pupils in this study had been assigned in these schools.As in the case of sight2d school children, it was regarded as moreimportant, psychoeducationally, to consider each child's educationalachievement in terms of evidence of his own learning capability,rather than in terms of any "average" of the children with whom hehappened, for any of a number of reasons, to be sitting.
Table 2.14 (pg. 37) shows the number of n7 ildren in each ofthe three schools on whom achievement test scores were obtained. Itshould be borne in mind that especially in ele Tennessee school, thesame children did not consistently take all the parts of the teststhat were given. For that reason, in some nf the combined correlationslater to be presented, the N's will vary.
2.141 Sample Bias in Achievement Testing. As was stated, ithad been hoped to have all those children, aged 9 and over, who tookBLAT to take the different parts of the Stanford Achievement Test(Word Meaning, Paragraph Meaning, Spelling, Aritmmetic Computation,Arithmetic Concepts, Arithmetic Application, and Arithmetic Reasoning)which were appropriate to their chronological levels. The assumptionwas made that, since the age range of the sample studied was from 9through 16, a helpful number of the youngest children in the sampleshould be able to earn some kind of meaningful score on at least thelowest level of the SAT. Had this happened, there would have beensome approximation of a "normal" variability in the achievement scores.
However, since the school officials strongly preferred toadminister the achievement test, ratter than have that done under thedirect supervision of the Project Director, the pupils who took thesetests were selected by the respective school teachers and supervisors.The extent to which this selection may have affected the populationgiven achievement tests is reflected in the following.
A total of 350 children were tested by BLAT in the threesouthern schools. Their distribution by chronological ages is shown
here. As the study was planned, achievementC.A. N tests were to be given only to those children18+ 2 who were 9 years of age and older. Thus,
17 22 Presumably, 39 children would not have taken16 37 the achievement tests, leaving 311 on whom15 44 achievement test results theoretically could14 65 be expected - barring any diminution due to
13 37 transfer out of school since the BLAT testing
12 39 (those children who transferred into the
11 2U schools after the BLAT testing and who took10 29 one or more ?arts of the achievement tests9 16 were not included in this study), due to8 22 absence at the time of the achievement testing,
7 15 and, possibly due to death. However, due to
6 2 these factors plus the decisions of the school
36
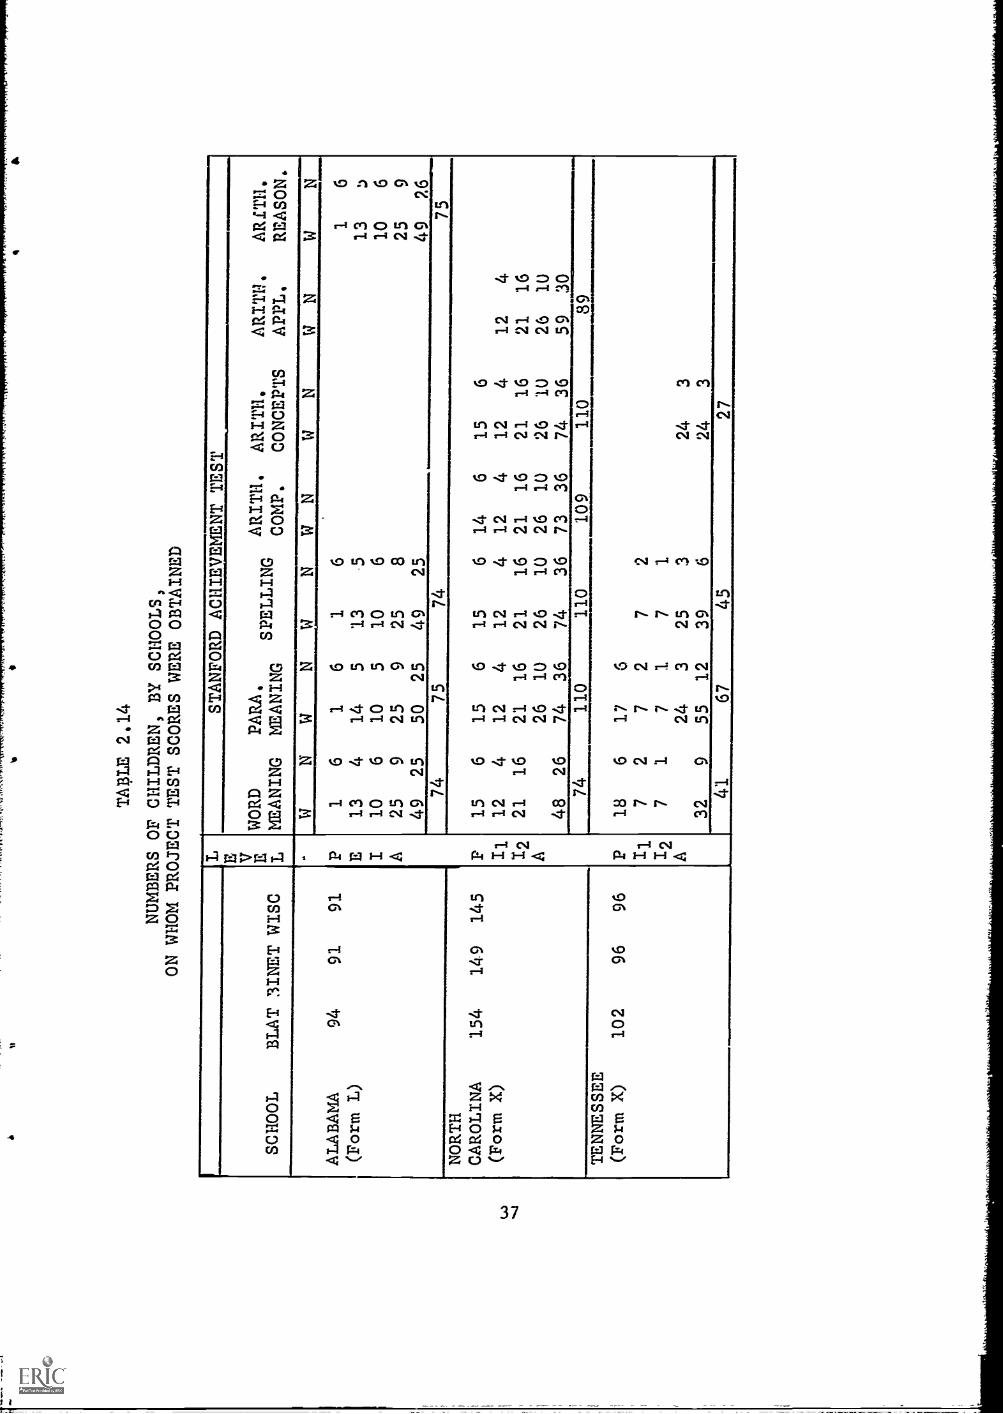
TABLE 2.14
NUMBERS OF CHILDREN, BY
SCHOOLS,
ON WHOM PROJECT TEST SCORES WERE OBTAINED
LSTANFORD ACHIEVEMENT TEST
SCHOOL
BLAT 3INET WISC
E V , LWORD
MEANING
PARA.
MEANING
SPELLING
ARITH.
COMP.
ARITH.
CONCEPTS
ARITI!.
APPL.
ARM.
REASON.
WNWNWNWN
WN
WN
WN
ALABAMA
94
91
91
P1
61
61
61
6(Form L)
E13
414
513
513
110
610
510
610
6A
25
925
925
825
949
25
50
25
49
25
49
2.6
74
75
74
75
NORTH
CAROLINA
154
149
145
P15
615
615
614
615
6(Form X)
Il
12
412
412
412
412
412
412
21
16
21
16
21
16
21
16
21
16
21
16
A26
10
26
10
26
10
26
IU
26
IU
48
26
74
36
74
36
73
36
74
36
59
30
74
110
110
109
110
89
TENNESSEE
(Form X)
102
96
96
P18
617
6
Ii7
27
27
2
127
17
17
1A
243
253
243
329
5512
39'
243
4167
45
27
officials as to which children should take achieve en.. tests, there was
a total of only 249 different pupils aged 9 and older who took one or
mora parts of the aehlevezcent tests cra whom all aptitude test results
were available, leaving a total of 53 children on wham no achievement
test scores were obtained.
In the correlational analyses between capacity (BLAB, H-B, WISC)
and achievement, the total population was broken down into three age
groupings - those aged 9 to 11 inclusive, those aged 12 and 13, and those
aged 14 and above. The 13 children under age 9 who had achievement
testing were not included in the analyses in terms of this sub-grouping
but were Included in other analyses. Presented in Table 2.141 are data
characterizing both the population on whom achievement test data were
obtained and the population for whom no achievement test data were ob-
tained.
It is apparent from a general inspection of this table, that, as
a rule, those not given achievement tests tended to be the less capable
youngsters in the different age groupings. The average Hayes-Binet mental
age of those in the 9-11 group who took no achievement tests was nearly
7 years; the average of those not so tested in the 12-13 group was about
6 years 10 months; and the average of those omitted from the 14-up group
was nearly 11 years. However, it should be noted also that, certainly
in the 12-13 and 14-up groups, some children had earned Hayes-Binet
mental ages which would lead one to expect them to have been capable
of achieving meaningfully (for them and for psychometric reasons) on
one or more parts of SAT. Note, also, that in the 14-up group for
North Carolina the average BLAT score of the 24 children not
achievement tested was somewhat higher than the average BLAT score of
those who did take achievement tests. An adaptive use of the achieve-
ment tests - giving children such tests as were appropriate to their
mental levels rather than in terms of their chronological ages or
grade placements - would have yielded additional helpful psycho-
educational information. The extent to which lack of skill in braille
reading may have been the primary basis for excluding these children
from achievement testing is not known.
The suspicion, therefore, is strongly held that "the" educational
achievement of the children in this study is not accurately represented
in the obtained data. It probably is not peculiar to sighted school
children that some of the more intellectually capable ones are perceived
by some of their teachers (or supervisors) as not capable of performing
significantly on achievement tests when, in reality, some of them perform
at average or above-average levels. The data indicate that such well
may have been true in this study population. Further, even children
who are below average in their learning aptitudes are sometimes capable
of earning scores in achievement tests that are above the chance level.
Two conclusions regarding the bias in the results obtained in
the achievement testing appear to be warranted: (1) The averages for
the different age levels throw only limited light on "the" educational
38

TABLE 2.141CHRONOLOGICAL AGE AND APTITUZE TEST DATA ON CH...I.DREN
WITH AND WITHOUT ACHIE7EMENT TEST REEULTS, BY AGE GROUPINGS,BY STATE, AND BY TOTAL
ALABAMA:M=
cr=
M=
tr=NORTHCAROLINA:
M=tr=
WI=
Yl=
Cr=
TENNESSEE:
TOTAL:
M=
ce=
14=
M=Cr"=
M=
14=
ACHIE7EXENT NON-A'-.HIE7EYXNT
C.A.
(go.)
HAYES-
BINETMA(Mo.)
WISCTA( Mo.)
BLAT L.A.
Ms.)HAYES-
BINET
MA ;Mo.)
WISC
TA(Mo.)
BLATX
AGES 9-11 N=1, _GES 9-11 N=1
124.5
7.8112.3
27.9
110.1
17.0
19.5
5.8114.0 76.0 78.0 6.0
AM.
AGES 12-13 N=2u AGES s2 -13 N=5
151.95.0
135.340.3
135.130.3
21.2
8.5
146.8
6.9
73.0
7
79.010.9
6.2
4.8
AGES 14 U AGES 14 Un N=8
178.310.4
162.947.2
174.538.1
23.99.2
178.3
12.5
130.1
47.5135.5
46.913.1
10.4
AGEE; 9-11 N =14 AGES 9-11 N=14
122.88.6
125.132.5
116.825_0
23.610.2
122.38.7
84.912.3
88.514.4
12.6
5.7
AGES 12-13 N=27 AGES 12-13 N=3
148.77.4
144.735.4
140.424.3
23.47.9
144.03.0
88.017.8
93.320.2
16.07.5
AGES 14 Ur, N=68 AGES 14 U- N=7
1 179.2
12.5
156.232.6
164.834.8
25.79.4
195.611.2
146.742.9
168.740.8
29.17.4
AGES 9--1 N=14 AGES 9-11 1: =3
118.78.5
109.7
33.4
101.421.1
18.17.0
122.35.6
76.716.2
82.020.9
13.7
11.0
AGES 12-13 N=18 AGES 12-13 N=3
150.56.9
125.131.2
129.228.6
20.19.8
146.7
6.7
88.751.4
94.741.0
7.3
11.0
AGES 14 Up N=39 AGES 14 Up N=9
180.313.0
148.5
46.3163.742.9
25.912.8
165.214.6
119.630.4
142.337.8
15.4
11.3
AGES 9-11 N=43 AGES 9-11 N=18
122.08.5
115.031.2
109.521.6
20.08.0
121.8
8.1
83.012.6
86.814.9
12.46.4
AGES' 12-13 N=65 AGES 12-13 N=Il
150.26.7
136.436.3
135.7
27.421.8
8.6
146.0
5.681.426.1
87.223.0
12.4
8.0
AGES 14 Un Nz--141 AGES 14 Un N=24
179.412.1
155.740.6
166.837.9
25.310.4
185.914.3
131.040.0
147.8
43.1
18.7
11.8
C.A. - Chronological Age in MothsHayes-Binet - Mental Age in Moz,thsWISC Test Age (Computed) it MonthsBLAT Raw Score
39
achievement of even the blind children in this study. (2) The correla-
tions between measures of learning aptitude and edncatioral achievement
probably are attenuated by this loss of achievement measures on children
with average and above-average learning aptitude who were not achievP-npnt
tested and by the loss of those of below - average capability who did not
take the achievement tests.
2.15 BLAT Retesting. To obtain evidence ar_ tie test retest reliability
of BLAT, 93 children at the Tennessee school were administered the BLAT
after a seven-month time interval. This was done by seven Peabody
graduate students, who had had no prior experier,ce or training with BLAT.
2.2 Characteristics of Total Standardizaticn Ponnlation
2.21 The Total Standardization Population. Presented in Tables 2.21A
and B are certain data on the total standardization population, pre-
project and project combined. Table 2.21A (pg. 41) shows the distribution
of the subjects by age for the residential and day school subjects, and
by sex and race. Table 2.2IB (pg. 42) shows a consolidation of those
data by age, sex, and race.
Concern often is expressed regarding the Inclusion of Negroes in
a standardization population. In this study, only five per cent of the
first 558 youngsters were non-white. The three southern schools were
included so as to provide more "representative' standardization data.
It =111 le seen in Table 2.21B, that non-white (There were three known
Indians.) youngsters constituted 14.98% of the total standardization
population. Whether their performances attenuated the "norms" can be
seen in subsequent analyses. Whether separate "norms" should have been
suggested for non-white children is at best debatable especially in
these days. However, in view of the kinds of behavior sampled by BLAT,
and the kinds of predictions to be made from such behavior sampling,
there appeared to be little, if any, merit in thinking in terms of
separate normative data.
2.22 Representativeness of Standardization Population. The extent to
which the standardization population approximates the Leality situation
in the United States will be shown in terms of a combination of socio-
economic status and race tabulations, a combination of race and sex
tabulations, and in terms of the extent to which the BLAT sampled varied
among the geographic regions involved.
2.221 Socio-economic Status and Race. Whenever the information
was available in the children's files, note was made of the occupation(s)
of the parent(s), or responsible adult(s), it the child's hove. Using
a combination of the occupational and educational characterizations of
the parents (or other responsible adult(s)), each child was character-
ized as representing an occupational level according to the occupational
level characterization in Table 328 (pp. 232-236) in the 1966 Statistical
Abstract of the United States. These characteristics of all subjects
were coded by four assistants, who worked as teams of two. The
40

TABLE 2.21A
TOTAL FUNCTIONALLY BLIND STANDARDIZATION POPULATION BY AGE,
TYPE OF SCHOOL, SEX, AND RACE
RESIDENTIAL SCHOOL
BY SEX
A.n
Age
White
MFTMF
20
64
10
53
19
10
313
10
311
18
19
12
31
18
12
30
11
17
31
22
53
27
19
46
43
7
16
38
35
73
30
29
59
86
14
15
39
36
75
28
34
62
11
213
14
48
45
93
41
35
76
710
17
13
39
33
72
33
27
60
6b
12
12
35
33
68
31
27
58
46
10
11
30
21
51
26
18
44
43
7
10
36
32
68
25
28
53
11
415
927
17
44
20
15
35
72
9
832
25
57
28
22
50
43
7
71,8
21
39
17
18
35
13
4
67
613
7613N -
Totals
415
345
760
346
296
642
I69
7;"9
1.18
.9.9
9991
ew.m
.969
999.
990.
9.9.
0999
9.99
Mfts
.949
94M
1099
9.99
994
1990
.9.9
0994
m
TOtlat Residentiql:11LILLOW61_Non-White
FT
Isl
81
12
--DAY SCHOOL
BY SEX
1OR
1 9
White
n-W111A.1.4
34
12
'
1
2
.4
312
83
11
1
11
314
92
11
2
85
13
53
83
58
1.3
57
12
35
83
47
86
14
66
12
2
97
1(
86
14
1
13
10
21
12
921
1
917
26
815
23
1
10
15
25
914
21
1
11.
1.4
25 110
14
24
1
2.4
24
1999
. row
919
949.
99
9 $
12
1
1
13
2 11
1it
12
12
23
12 1
100
lo20
..1 i8
617
..S1
2J
To 1111 11ilySehoo 1
2011_C20 . 9V2)
*Includes three Indians, on basis oft presumed similartty
of leculturaLion
information.

TAME 2.21B
SUMARY TABLE OF FUNCTIONALLY BLINDBY AGE, SEX AND RACE
AGE I 4 F I iont- I WHITE I li0N-14IIIIE1
20 6 4 10' 8 219 11 6 17 15 218 20 13 33 31 217 40 25 65 57 816 49 38 87 70. 1715 47 41 88 70 1814 53 53 106 88 1813 42 38 80 67 1312 43 39 82 70 1211 39 28 67 58 910 49 42 91 74 17
9 36 34 70 58 128 42 40 82 73 97 29 35 64 59 56 9 10 19 19 -
I TOTALS 515 446 1 961 317 144
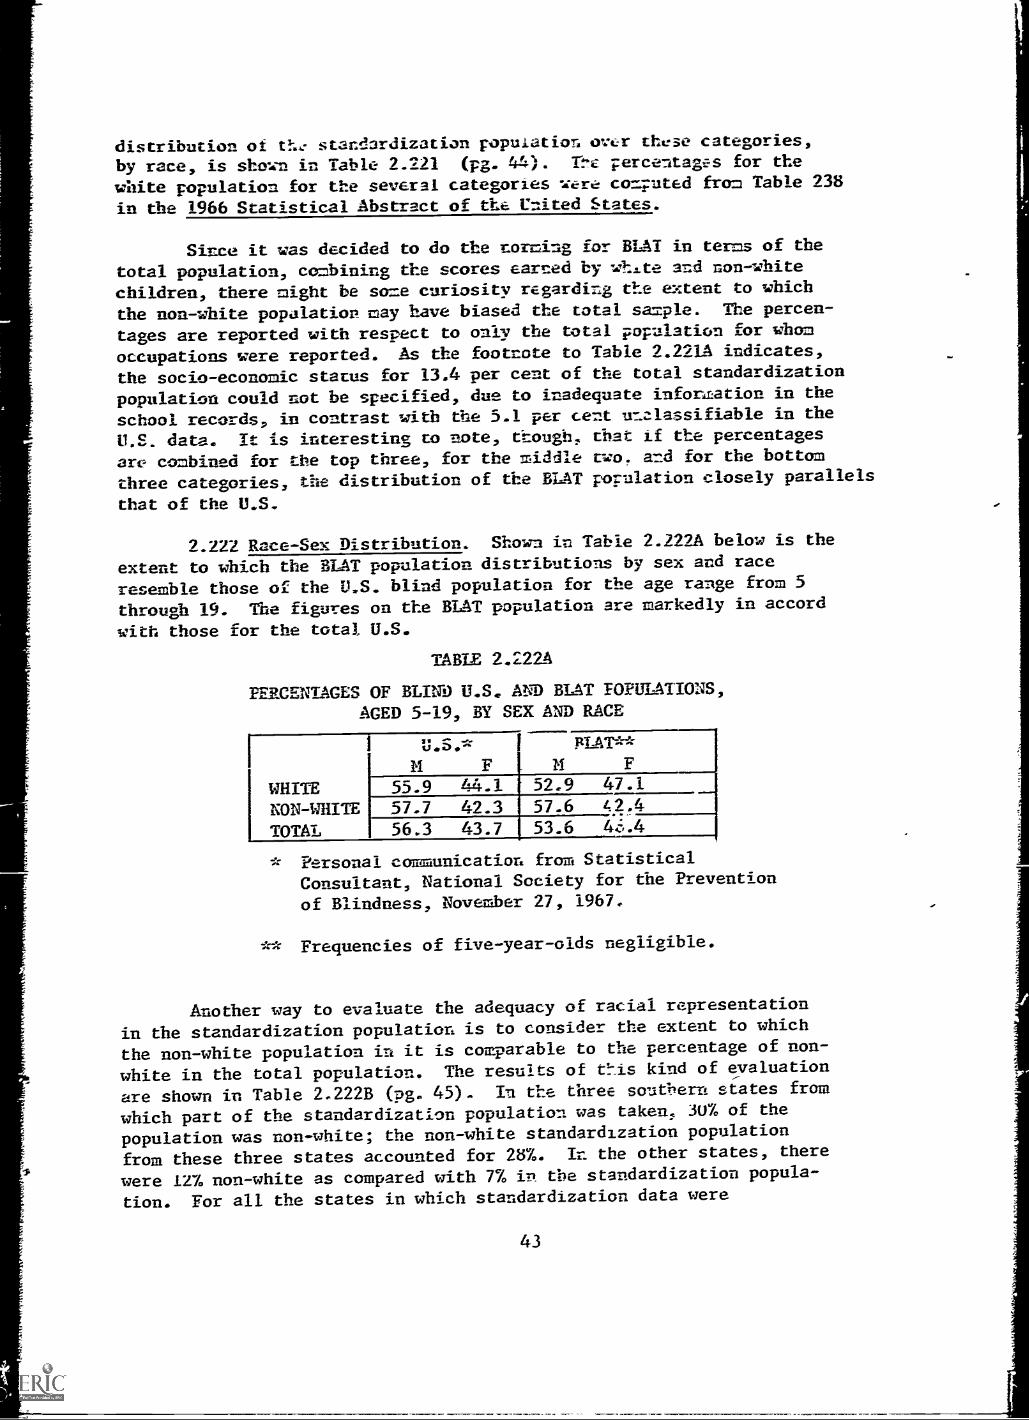
distribution of standardization population ovt,r these categories,
by race, is shown in Table 2.221 (pg. 44). The percentages for the
white population for the several categories were computed from Table 238
in the 1966 Statistical Abstract of the United States.
Since it was decided to do the norming for BLAT in terms of the
total population, combining the scores earned by white and non-white
children, there might be some curiosity regarding the extent to which
the non-white population may have biased the total sample. The percen-
tages are reported with respect to only the total population for whom
occupations were reported. As the footnote to Table 2.221A indicates,
the socio-economic status for 13.4 per cent of the total standardization
population could not be specified, due to inadequate information in the
school records, in contrast with the 5.1 per cent unclassifiable in the
U.S. data. It is interesting to note, though, that if the percentages
are combined for the top three, for the middle two. and for the bottom
three categories, the distribution of the BLAT population closely parallels
that of the U.S.
2.222 Race-Sex Distribution. Shown in Table 2.222A below is the
extent to which the BLAT population distributions by sex and race
resemble those of the U.S. blind population for the age range from 5
through 19. The figures on the BLAT population are markedly in accord
with those for the total U.S.
TABLE 2.222A
PERCENTAGES OF BLIND U.S . AND BLAT POPULATIONS,
AGED 5-19, BY SEX AND RACE
PLAT**
WHITE 55.9 44.1 52.9 47.1
NON-WHITE 57.7 42.3 57.6 42.4
TOTAL 1 56.3 43.7 53.6
* Personal communication from Statistical
Consultant, National Society for the Prevention
of Blindness, November 27, 1967.
** Frequencies of five-year-olds negligible.
Another way to evaluate the adequacy of racial representation
in the standardization population is to consider the extent to which
the non-white population in it is comparable to the percentage of non-
white in the total population. The results of t!-is kind of evaluation
are shown in Table 2.222B (pg. 45). In the three southern states from
which part of the standardization population was taken, 3U% of the
population was non-white; the non-white standardization population
from these three states accounted for 2878. It the other states, there
were 127 non-white as compared with 7% in the standardization popula-
tion. For all the states in which standardization data were
43
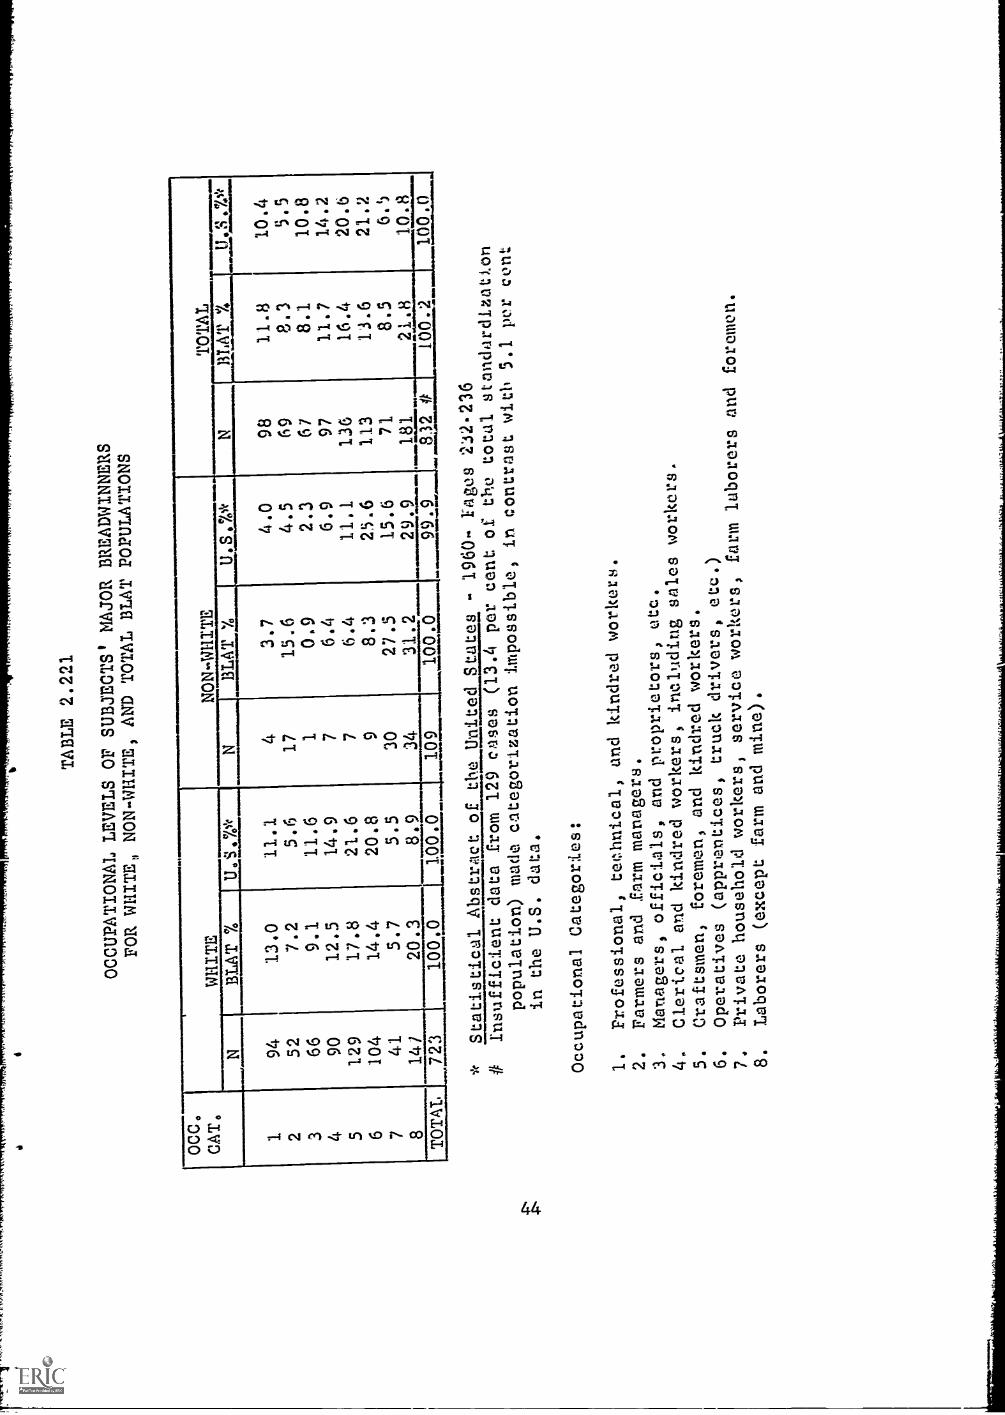
IV"P
o-.
-.7.
-..r
ylc-
m-K
rkm
-17-
rryt
rTsT
rTra
rnrn
mrt
TABLE 2.221
OCCUPATIONAL LEVELS OF SUBJECTS'
MAJOR BREADWINNERS
FOR WHITE, NON-WHITE, AND
TOTAL BLAT POPULATIONS
OCC.
CAT,
WHITE
NON-WHITE
TOTAL
NBLAT %
U.S%*
NBLAT %
U S.%*
NBLAT %
U.S.%*
194
13.0
11.1
43.7
4.0
98
11.8
10.4
252
7.2
5.6
17
15.6
4.5
69
8.3
5.5
366
9.1
11.6
10.9
2.3
67
8.1
10.8
490
12.5
14.9
76.4
6.9
97
11.7
14.2
5129
17.8
21.6
76.4
11.1
136
16.4
20.6
6104
14.4
20.8
98.3
25.6
113
13.6
21.2
741
5.7
5.5
30
27.5
15.6
71
8.5
6.5
814/
20.3
8.9
34
31.2
29.9
181
21.8
10.8
TOTAL
72:3
100.0
3p0.0_
109
100.0
-9941
832 it
100.2
100.0
Statistical Abstract of the
United States - 1960- rages
2:52.236
#Insufficient data from 129 cases
(13.4 per cent of the total
standard1zatkon
population) made categorization
impossible, in contrast with
5.1 per cent
in the U.S. data.
Occupational Categories:
1.
Professional, technical, and
kindred workers.
2.
Farmers and farm managers.
3.
Managers, officials, and
proprietors, etc.
4.
Clerical and kindred workers,
including sales workers.
5.
Craftsmen, foremen, and kindred
workers.
6.
Operatives (apprentices,
truck drivers, etc.)
7.
Private household workers,
service workers, farm
laborers and foremen.
8.
Laborers (except farm and
mine)
.
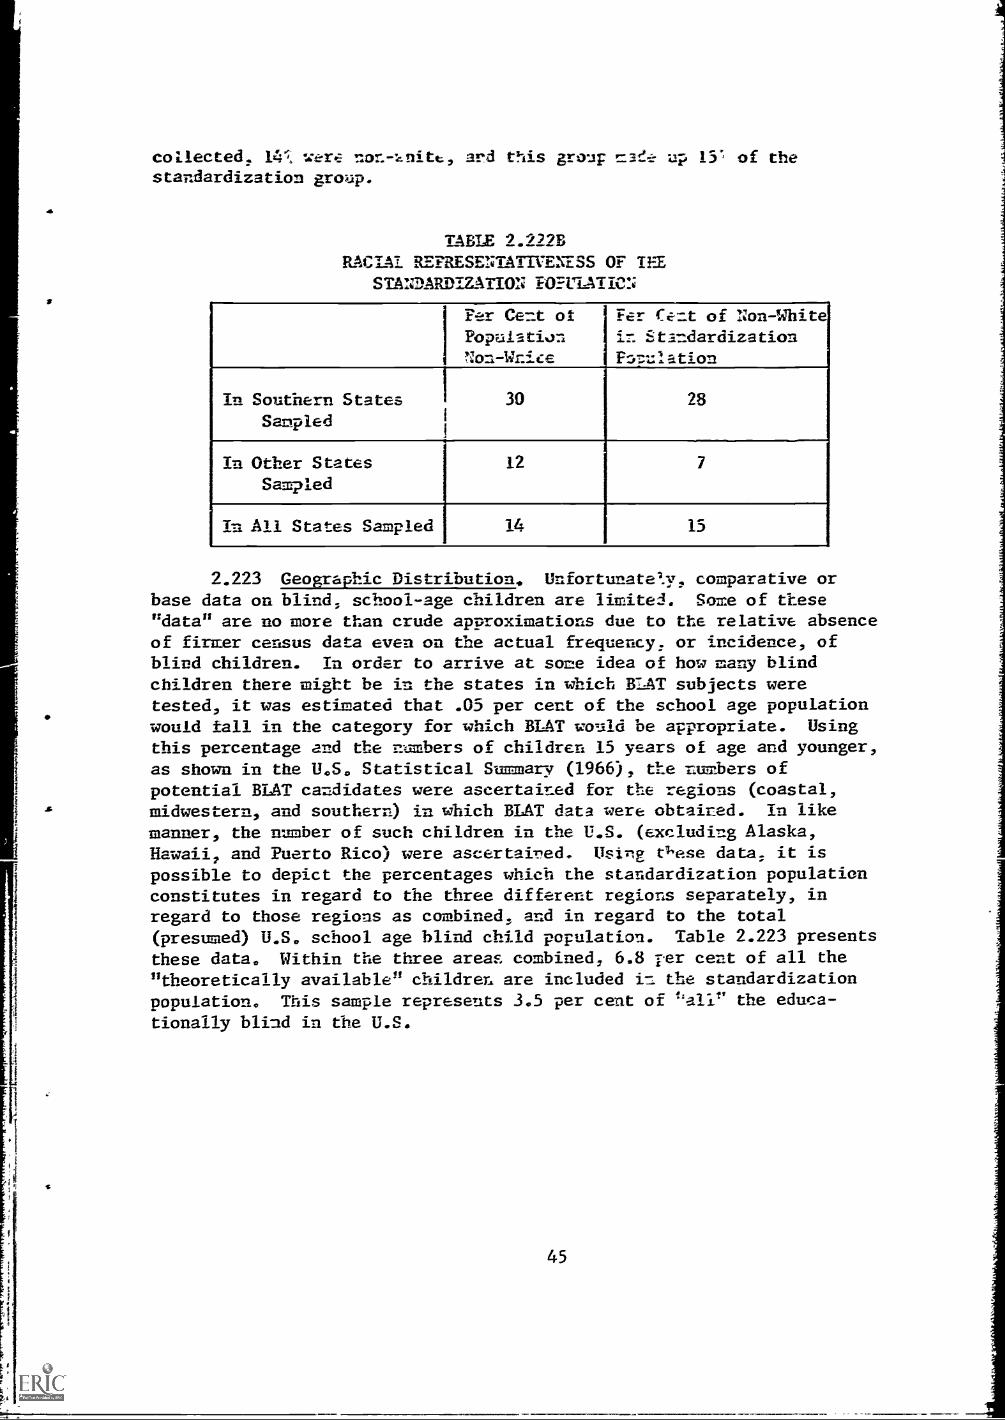
collected, 14 were non-1,nitt, and this group mae.e up 15; of thestandardization group.
TABLE 2.222B
RACIAL REPRESENTATIVENESS OF TEESTANDARDIZATION FOPUIATICN
1
Per Cent ofPopulationnon-Wzice
Fer Cent of Non=Whit-in StandardizationP:,::ulation
In Southern StatesSampled
I 30
1
28
In Other StatesSampled
12 7
In Ail States Sampled 14 15
2.223 Geographic Distribution. Unfortunatey, comparative orbase data on blind; school-age children are limited. Some of these"data" are no more than crude approximations due to the relative absenceof firmer census data even on the actual frequency, or incidence, ofblind children. In order to arrive at some idea of how many blindchildren there might be in the states in which BLAT subjects weretested, it was estimated that .05 per cent of the school age populationwould fall in the category for which BLAT would be appropriate. Usingthis percentage and the numbers of children 15 years of age and younger,as shown in the U.S. Statistical Summary (1966), the rimrbers ofpotential BLAT candidates were ascertained for the regions (coastal,midwestern, and southern) in which BLAT data were obtained. In likemanner, the number of such children in the U.S. (excluding Alaska,Hawaii, and Puerto Rico) were ascertaired. Using C'ese data, it ispossible to depict the percentages which the standardization populationconstitutes in regard to the three different regions separately, inregard to those regions as combined, and in regard to the total(presumed) U.S. school age blind child population. Table 2.223 presents
these data. Within the three areas combined, 6.8 per cent of all the"theoretically available" children are included in the standardization
population. This sample represents 3.5 per cent of "all" the educa-tionally blind in the U.S.
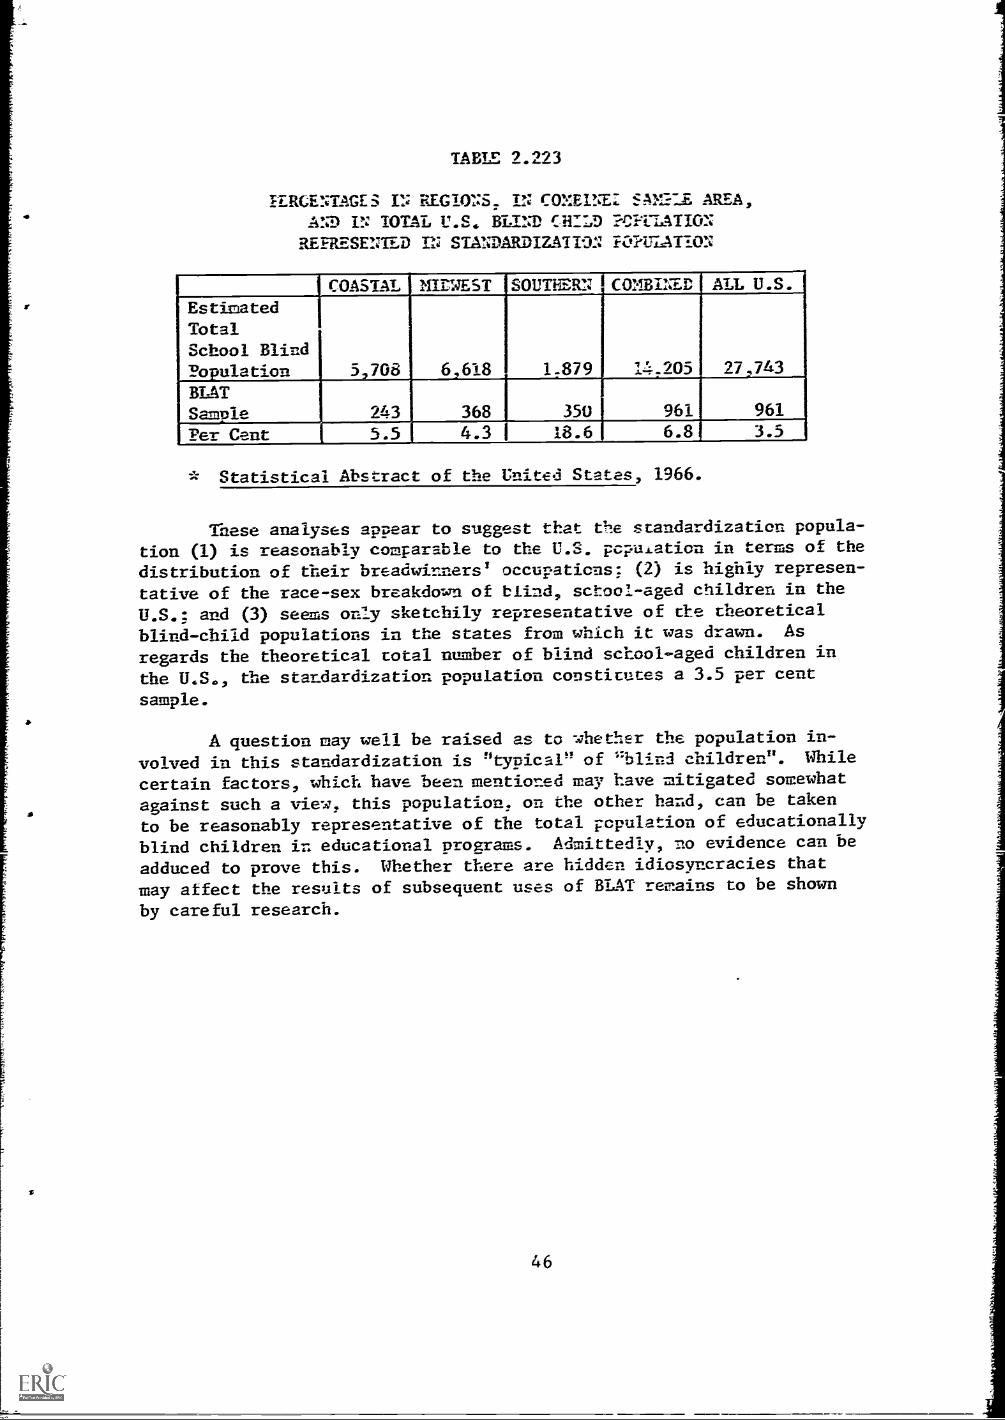
TABLE 2.223
PERCENTAGES IN REGIONS, IN COXEINE: SAMKE AREA,AND IN TOTAL U.S. BLIND CHILD PCPULATIONREPRESENTED IN STANDARDIZATIQN ICJIPUIATION
COASTAL MILWEST SOUTHERN ICOMEINED ALL U.S.
EstimatedTotalSchool BlindPopulation 5,708 6,618 1-879 14.205 27,713
BLATSample 243 368 350 961 961
Per Cent 5.5 4.3 18.6 6.8 3.5
* Statistical Abstract of the United States, 1966.
These analyses appear to suggest that the standardization popula-
tion (1) is reasonably comparable to the U.S. pcpuLation in terms of the
distribution of their breadwinners' occupations; (2) is highly represen-
tative of the race-sex breakdown of blind, sctool-aged children in the
U.S.: and (3) seems only sketchily representative of the theoretical
blind-child populations in the states from which it was drawn. As
regards the theoretical total number of blind school-aged children in
the U.S., the standardization population constitutes a 3.5 per cent
sample.
A question may well be raised as to whethsr the population in-
volved in this standardization is "typical" of 'blind children". While
certain factors, which have been mentioned may have mitigated somewhat
against such a view, this population, on the other hand, can be taken
to be reasonably representative of the total Fcpulation of educationally
blind children in educational programs. Admittedly, no evidence can be
adduced to prove this. Whether there are hidden idiosyncracies that
may affect the results of subsequent uses of BLAT remains to be shown
by careful research.
46
2.3 Ston,:nrIliz-otioa Data
The findings will be presented first in terms of Learning Age(Test Age) equivalents and in terms of Learning Quotient equivalents ofBLAT ral. scores. Sub-analyses of BLAT raw scores will be presented bysex, by race, and by kind of school (residential and day). Accompanyingthe BLAT means and standard deviations 1 i be those for the Hayes-Binetand WISC tests. While the BLAT errors of measurement will be presentedalong with the Learning Age equivalents, other reliability informationwill be presented in terms of internal consistency and test-retestfindings. The results of a factor analysis of the BLAT scores will bepresented. This section will conclude with correlational information,first in terms of the relationships between BLAT results and those onthe Hayes-Binet, on the WISC, and on the Stanford Achievement Test, andalso in terms of the relationships between the several measures oflearning aptitude and performances on the SAT when the latter are brokendown according to certain age groupings.
2.31 Learning Age and Learning Quotient Equivalents. No assumption wasmade that results on BLAT reflcet learning potential beyond that involvedin school learning. (While the suspicion is entertained that broaderinferences properly might be drawn from BLAT performances, there are nodata in this study relevant to that.) Further, in order to help reducethe possibility of contusing the characterization of performance on BLATwith the performances on other tests of learning aptitude, no use is madeof the terms "mental age", and "intelligence quotient". The terms"learning age", or even more precisely, "BLAT learning 23e", and thederived "BLAT learning quotient" are preferred.
Shown in Table 2.3 LA (pg.48) are the learning age equivalents ofBLAT raw scores, with their accompanying standard errors of measurementwhich were computed on the basis of information presented in 2.331.
only or the full yearc, since thehalf-year norms were arrived at by interpolation. As seems to be thecase with a test like BLAT, the sharpness of discrimination decreasesamong the upper age levels. It is possible that had the test beenadministered under timed conditions, sharper discrimination might havebeen attained.
Shown in Table 2.31B are the basic data from which the normspresented in Table 2.31A were obtained, with the exception of thestandard errors of measurement. Figure 2.31B shows the obtained meansand standard deviations, across age, with the best fitting curve forthe means and the smoothed curve for the sigmas drawn 1.72.
These norm data represent a composite for the sexes, for the races,and for the two different kinds of schools - residential and day - inthe 12 states.
The learning quotients were derived for each level by making a
learning quotient of 100 equal to each mean score:and a range of
47

TABLE 2.31A
Learning Aptitude Age Equivalents for BLAT Scores
With Standard Errors of Measurement
IA BLAT Suggests a learning aptitude With a standard error
score of age of an average of measurement of(KR-14)
27 152 or 16 year old 2 755
26 15 year old 2 823
25 14 or 142 year old 2 868
24 132 year old
23 13 year old 2 885
22 122 year old
21 llk or 12 year old 2 847
20 11 year old 2 888
19 102 year old
18 10 year old 2 846
17 92 year old
16 9 year old 2 741
15 . . . . 4 82 year old
sJ 8 year old 2 536
12 72 year old11 7 year old 2 462
9 62 year old
7 6 year old 1.999
48

-A2 LE 2.318
BENT Norming Statistics
Age(1) ACTUAL SMOOTBED(2)11 USED AS
NORMS
INDEXOF
SKEW-NESS
RANGEOF
SCORESEARNEDM 0---s N N ce N 6-'
19 30.88 10.48 17 -.962 5-4418 34.21 7.50 33 -.309 2-4717 27.46 9.36 65 -.182 3-4516 27.49 11.45 87 27.3 11.1 27 11 -.234 0-4915.5 26.6 10.9 27 1115 26.76 10.51 88 25.8 10.5 26 11 .147 5-4714.5 25.2 10.4 25 1014 23.80 9.20 106 24.6 10.2 25 10 -.088 0-4313.5 23.8 10.0 24 1013 23.81 9.20 80 23.0 9.6 23 10 -.174 0-4112.5 22.2 9.4 22 912 21.88 9.79 82 21.4 9.2 21 9 -.001 1-4111.5 20.6 9.0 21 9
11 20.00 7.96 67 20.0 8.6 20 9 .547 1-4210.5 19.0 8.3 19 810 19.04 8.13 91 18.2 8.1 18 8 '1..088 0-399.5 17.0 8.0 17 89 16.03 7.90 70 16.0 7.9 16 8 .603 0-428.5 14.7 7.6 15 88 12.06 7.18 82 12.7 7.2 13 7 .083 0-287.5 12.4 7.0 12 7
7 10.83 6.83 64 10.8 6.8 11 7 .233 1 0-266.5 9.0 5.2 i 9 56 5.89 4.13 19 6.8 4.131 7 4 .685 0-14
(1) Data analyzed in terms of full years (10 yrs. =9' yrs. 6'nos. through10 yrs. 5 mos.); half year data obtained by interpolation.
(2) Best fitting exponential curve used (Score = V69.556 (yr.)-370.311)
49
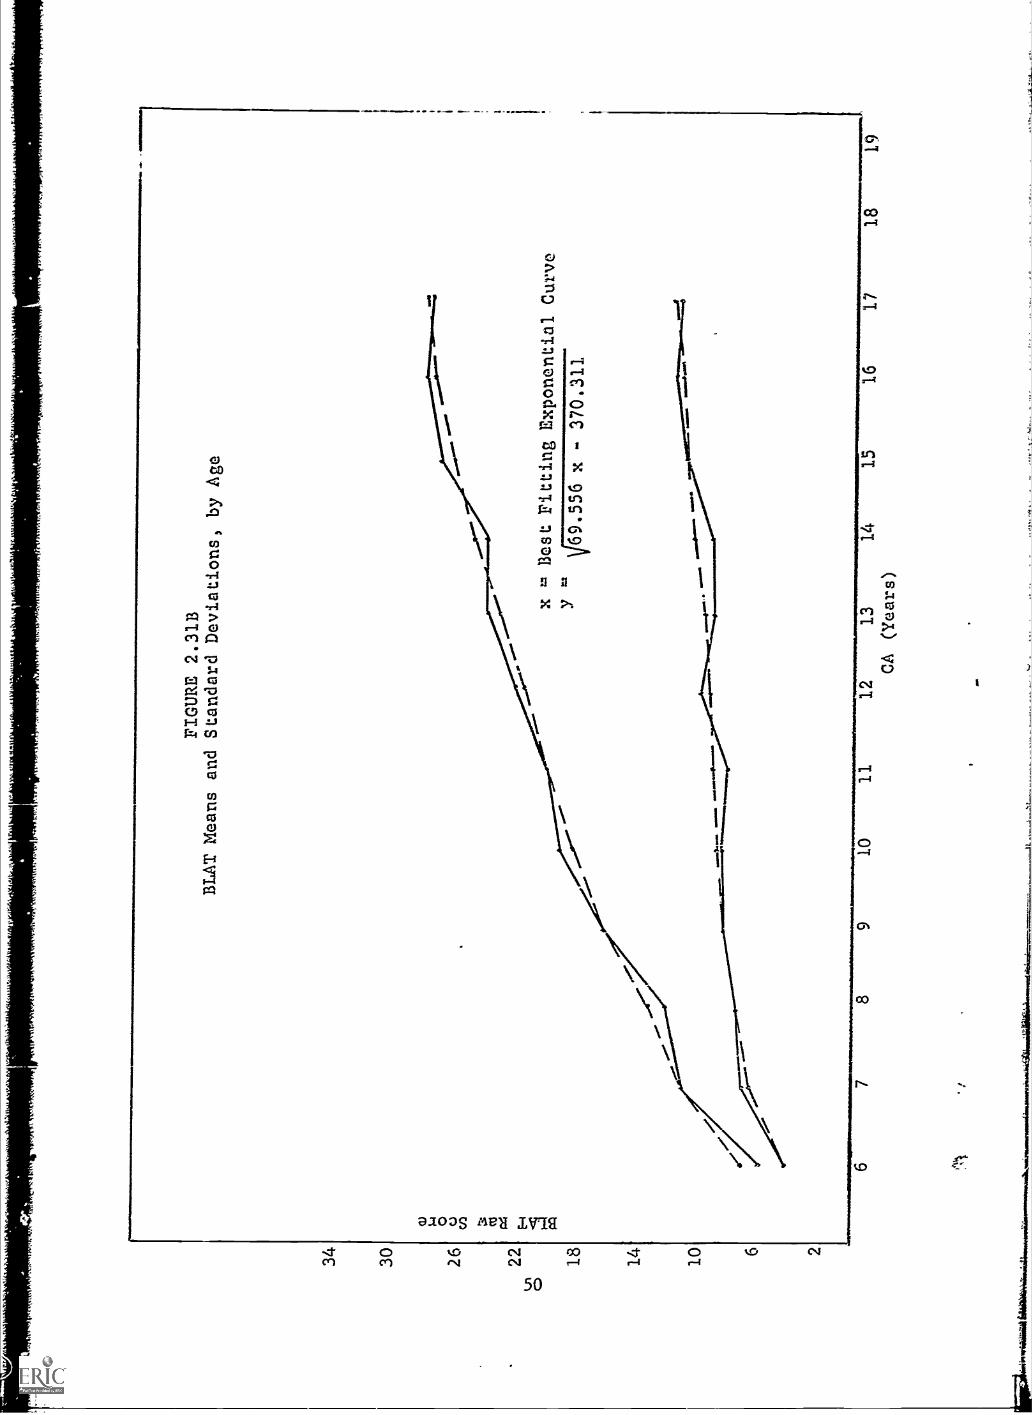
34
30
26 22
0
18 14 10
6 2
FIGURE 2.31B
BLAT Means and Standard
Deviations, by Age
,.' x = Best Fitting Exponential Curve
YV69.556 x - 370.311
.1...
... .11.
1....
......
.
67
89
10
14ill
iallg
i"...
"....
...hm
orra
irm
ara,
Ille
.le,C
.--"
...--
.....-
._...
..=...
._-_
MO
O
1112
13C
A (
Yea
rs)
1415
eam
mos
meO
wao
ssin
1617
1819

I
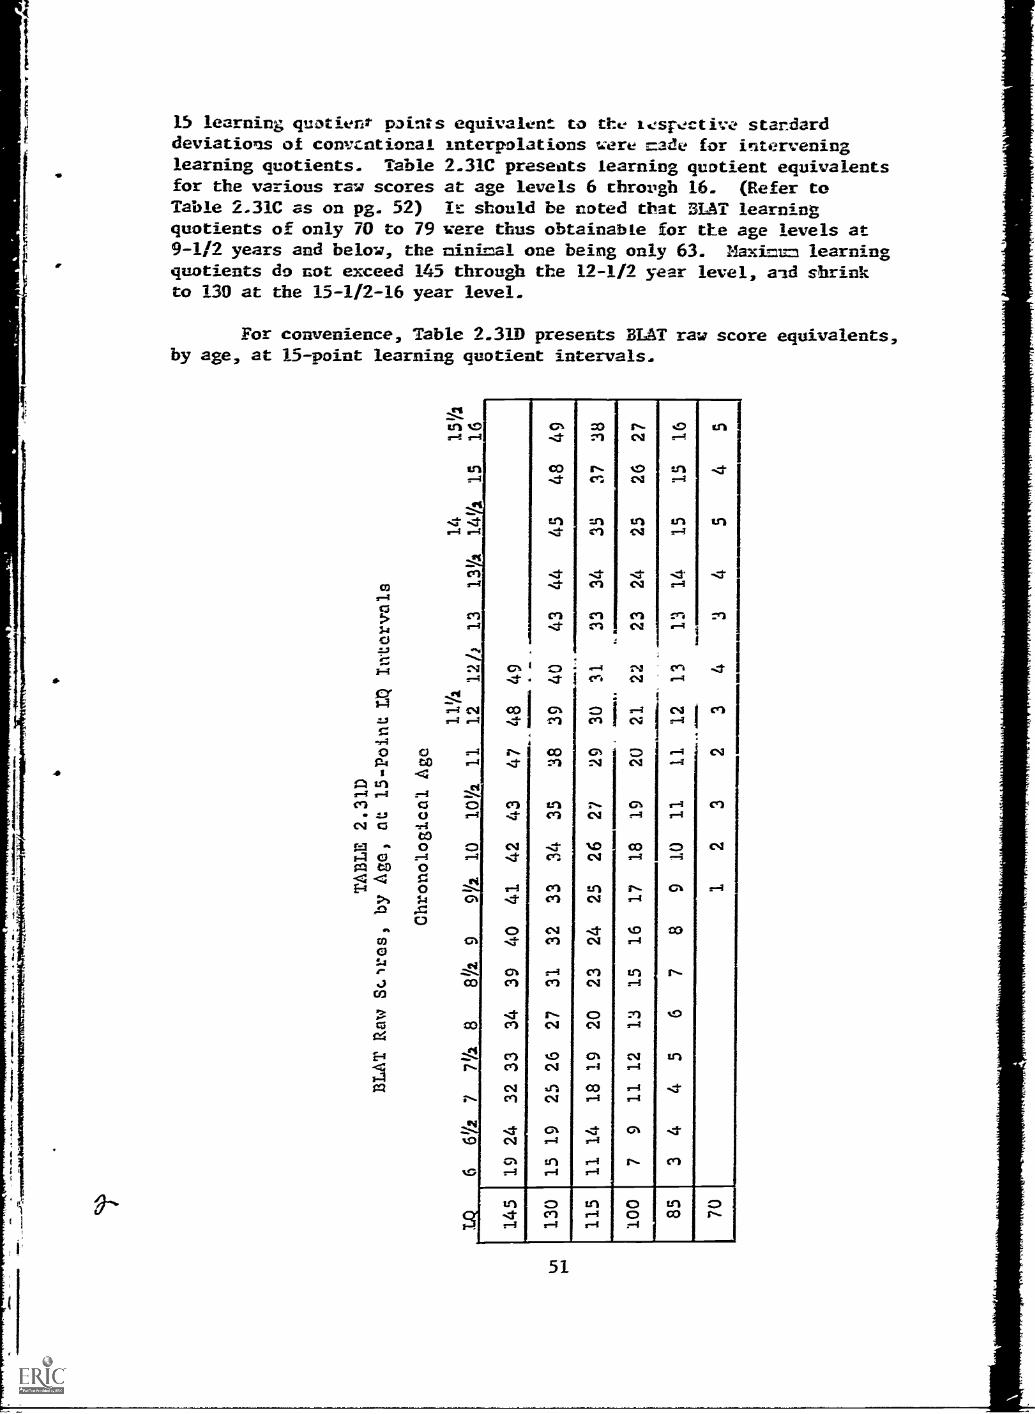
TABLE 2.310
BLAT Raw Sclres, by Age, At 15-1Point
LQ Intervals
a'19
. 10
e 60
)-4
HI
/.6C
aP"
.11/
440
gaI
0lb
0 M
CD
Liea
1-1
et11
:4 P
tiS
di11
14lw
e 1
-00
L 0
la 1
I.)1r.
CD
etri
6)C
DM
c3 M
ftV
tw e
etf.)
.40
1/44
0 N
1 m
0 lw
1)1
Pil
Pirt
Met
t00
0:3
t4 4
4 Ia
.et
IIrt
ra fa
Xi
fr)
0C
r.
I-1 m
C0,
CA
0 C
I Pi
0H
iiw
e 0
0l.1 i
ri
ri o th
lio
1
W 41-
A0
MA
WV
) fD
noO
Mkr
i et
1.-
013
0 e
teh
01
04 k
.4 0
rt
rtw
,D
Ito
01ft
rtri
Ibta
1
...I.-
A P
)11
w..)
v0
Cel
0O
I%)
n 0
C)
(V0
ati-
nt
ea C
CI
rtM
lb1,
- M
wet
CI
)-)
lw .
Po
C.)
wC
r% O
.0
VIN
HO
It134
rj0m
t.%ri
_a_6
145
61/2
771
/28
81/2
9
Chronological Age
111/
29%
x10
101/
211
1212
1313
14 141
1515
1/2
16
0).
-4ta
,ra
0013
PS
(0da (L
i1)
0 etA
--
tw i
p-i
a)0.
0 rfPi
tw i
fbti
v)rt
M(t
)C
1 G0 0.
0 03
og '-1 II ra to n 0 el
1924
3233
3439
4041
4243
4748
49
130
1519
2526
2731
3233
3435
1....
......
1MIM
IIM
IIM
Miy
ialla
25
26
27
3839
4043
4445
4849
115
11
14
18
19
20
23
24
29
30
Si
33
34
33
37
38
100
79
11
12
13
15
16
17
18
19
4...
20
21
22
23
24
25
26
27
853
44
56
78
910
1111
1213
1314
1515
16
701
23
23
43
45
45
1011
.101
1111
1111
1111
1111
1111
1111
1441
111M
6101
M11
1 et
MO
OM
INIM
MIL
IM,
1/44
1-%
-# ft
)1-
ri)
:.3ft)
4s M
'1/4
0th
IDt-
09,
'4'-'
01-
411
)IN
4 lw
rt'14
e M
f s;
rt0
Mim
lt:r
Ci
II1.
4 rt
.0M
IIe
ft)V
)6)
),-+
n 0
O P
ma
" C
I ei 1
fli0
)et
0 M
sIV
e".
1,-
0 *
)-I r
e g
P0
0 fa
Ilir
0 0
eli
(1)
nicm
a19
.ri
Ch
rt 0
121
ft)1.
1,0
met
'1.
.,ID
61)
otw
,ut
0,C
ri,w
et.
0,0
rtti
rtt
i M 4
.)It
iC
h 0
0
1.4
006)
IDfo
rft)
fro
tY\
tJa
Cid
V C
ati
ft`
Iv 0
.-.
Ps
Ps
ft0
ft)rt
0 0
tw1-
wV
t:ra
.e"
..
riti))
k4 ON
ftw 0
00. 0
9w
rlio
Pe
ON
tiM
.r.
!A)
17.4
ta45
60e
.el
ttre
VIP
10
0 H
ode:
M 1
-3rt
.01
*1 (1,
W '1
6.).
41
lb)-
w .0
-.
f b r
,w
X M
Ift)
MI
et4
(i)61
)!,t
1ft)
6)ft)
et e
trt
ran
Pirt
,ro
w(1
)03
0 k
i- 0
f D M
PI
rl11
:1C
I. ti
ft)Iw
o11
im4 tl,
We
ni<
oti
pas
ttopi
tu
4.)
Fi
DI
01"1
eta
l'ala
sPI
1"'l
04fD
0 0
6)M 0
rtet
oC
l)m
Pr
ktoi
rt

TA= 2.310
BLAT !at bit% Quouibuto by Half-Twit
06
7A
A9
1
10
10'
1' -12
12's
14 -14'
IKt10,
49
145
139
137
136
131
130
48
145
143
137
1,16
135
130
129
47
145
143
142
136
135
133
129
127
40
143
142
140
135
133
131
127
126
45
142
140
1311
133
131
130
126
125
44
140
138
137
131
130
120
125
123
43
145
138
137
135
130
128
127
123
122
42
145
143
137
135
133
128
127
126
122
120
41
145
143
141
135
133
132
127
126
124
120
119
40
145
143
141
139
133
132
130
126
124
122
119
117
39
145
143
141
139
137
132
130
120
124
122
121
117
116
38
143
141
139
137
136
130
128
t21
122
121
120
116
115
37
141
139
137
136
134
128
127
125
121
120
118
36
139
131
136
134
132
127
125
123
120
111
116
115
112
35
137
135
134
132
130
125
123
122
110
116
115
112
111
34
145
136
134
132
130
120
123
122
120
116
115
113
111
110
33
145
143
134
132
130
128
126
122
120
118
115
113
112
110
108
32
145
143
141
132
130
128
120
124
120
110
117
113
112
111
108
10/
31
143
141
139
130
128
126
124
122
118
117
115
112
111
109
107
105
30
141
139
136
128
126
124
122
121
111
115
113
111
109
107
105
104
29
139
136
134
126
124
122
121
119
115
113
112
109
107
106
104
102
28
136
134
132
124
122
121
119
117
113
112
110
107
106
105
102
101
27
134
132
130
122
121
119
111
115
112
110
108
106
105
103
101
100
26
132
130
128
121
119
117
115
113
110
108
107
105
103
101
100
99
25
130
128
126
119
117
115
113
111
108
107
105
103
181
100
99
98
%A
h324
145
128
126
12'
117
115
113
111
109
107
105
103
101
100
99
98
96
23
142
126
124
121
115
113
111
109
107
105
103
102
100
99
97
96
95
22
139
124
121
119
113
111
109
107
106
103
102
100
99
97
95
95
93
21
136
121
119
117
111
109
107
106
104
102
100
90
97
95
94
93
92
20
133
119
117
115
109
107
106
104
102
100
98
97
95
94
93
92
90
19
145
130
117
115
113
107
106
104
102
100
90
97
95
94
93
91
90
89
18
141
127
115
113
111
106
104
102
IOU
98
97
95
93
93
91
89
89
BO
17
137
124
113
111
109
104
102
100
90
96
95
93
92
91
89
08
08
80
16
133
121
111
109
106
102
100
98
96
94
93
92
90
89
88
87
86
85
15
130
118
109
106
104
100
98
96
94
93
92
90
88
08
81
85
85
84
14
126
115
106
104
102
90
96
94
93
91
90
00
07
87
85
84
84
81
13
122
112
104
102
IOU
96
94
93
91
09
00
87
85
95
04
02
81
01
12
110
109
102
100
98
94
93
91
09
87
87
85
83
04
82
BO
01
80
11
115
106
IOU
90
96
93
91
89
87
85
85
03
02
82
on
79
00
48
10
111
103
98
96
94
91
89
87
05
03
84
82
80
00
79
78
78
71
9107
100
96
94
91
09
87
85
83
81
02
80
78
79
78
76
77
75
8103
97
94
91
89
07
05
83
81
'19
80
78
77
78
76
74
76
74
7100
94
91
89
87
85
83
81
79
78
78
77
75
76
74
73
74
73
697
91
89
87
85
83
81
79
78
76
77
75
74
74
73
72
71
71
593
88
87
85
83
81
79
78
76
74
75
73
72
73
72
70
71
10
409
85
85
83
81
79
70
76
74
72
73
72
70
/2
70
09
70
69
385
82
03
81
79
78
76
74
72
70
72
70
011
70
09
67
69
AH
282
79
81
79
76
76
74
72
7U
68
70
60
67
09
07
65
68
66
I78
76
79
76
74
74
72
70
68
66
68
67
65
67
65
64
66
65
2.32 SUb-.41/..11VS1.-S
2.321 Ev Sex. fresentei TA3i, 2.3 1. ;. 54, Jrs. not only
the means and sio-as of th2 ELT scorts IC:=961). by age (up to the 19year level although BLAT Learning Age an3 1earnins Quotients are pro-vided only through age 16), but also the =cans and sigmas of the Hayes-Binet mental ages (N=663) and of the WISC verbal test ages (N=522).Inspection of the graphic depiction of t1-.e MAT data, Figure 2.321A,
p. 55, reveals no consistent difft.rcnLes between the means and
standard deviations across age. (No statistical computations were made
with respect to these differences.)
Of no particular significance here. but of possible interest in
a later discussion, is Figure 2.321B. p. 56, which shows the average
scores earned on the three measures of learning aptitude for the age
levels 6 through 16. A suspicion will be explored later that the lackof smoothness in the rise in the BLAT curve may reflect a bona fidepsychological phenomenon rather than a psychometric aberration.
2.322 By Race. As shown in the earlier information on theMAT standardization population, a dichotomy of white and non-whiteis employed, since the nop-white category includes three American
Indian children on the basis of the acculturation informatics ob:ained
on them. Since no non-white children below the age of 6 were in thestandardization population, comparative data are analyzed for the age
range 7 through 17. Shown in Figure 2.322 are line graphs depictingthe mean BLAT scores for the two categories, from age 7 through 17, for
the total standardization population and for the southern population.Generally, the average BLAT raw scores for the southern whites and non-
whites show no marked and consistent differences in favor of eithergroup, although at seven of the 11 age levels the average scores of the
whites exceed somewhat those of the non-whites. Since the numbers of
subjects at the different age levels range from 3 to only 15, conclusionsregarding differences between the groups are not warranted. Since the
southern population was entirely a residential school population, the
operation of unique selective factors must be recognized. In the ease
of the total sample, however, BLAT average scores of the white category
tended consistently to be higher than those for the non-white category.
The significance of this difference was unexplored. For the curious,
the raw data from which these line graphs were drawn are presented in
Table 2.322A,p. 58.
While not contributive to the standardization of BLAT per se,the differences between BLAT raw scores, for the two categories, can
be perceived in terms of the differences between Hayes-Binet mental
ages and WISC Verbal (computed) mental ages for the two categories may
be seen in Table 2.322B, p. 59. Inspection of these data, or a plotting
of them to reflect possible differences between the two categories, will
reveal that, generally, as both the Hayes-Binet and the WISC, the means
of the non-white tend closely to approximate minus one standard
deviations of the white and that the means of the white group tend to
53
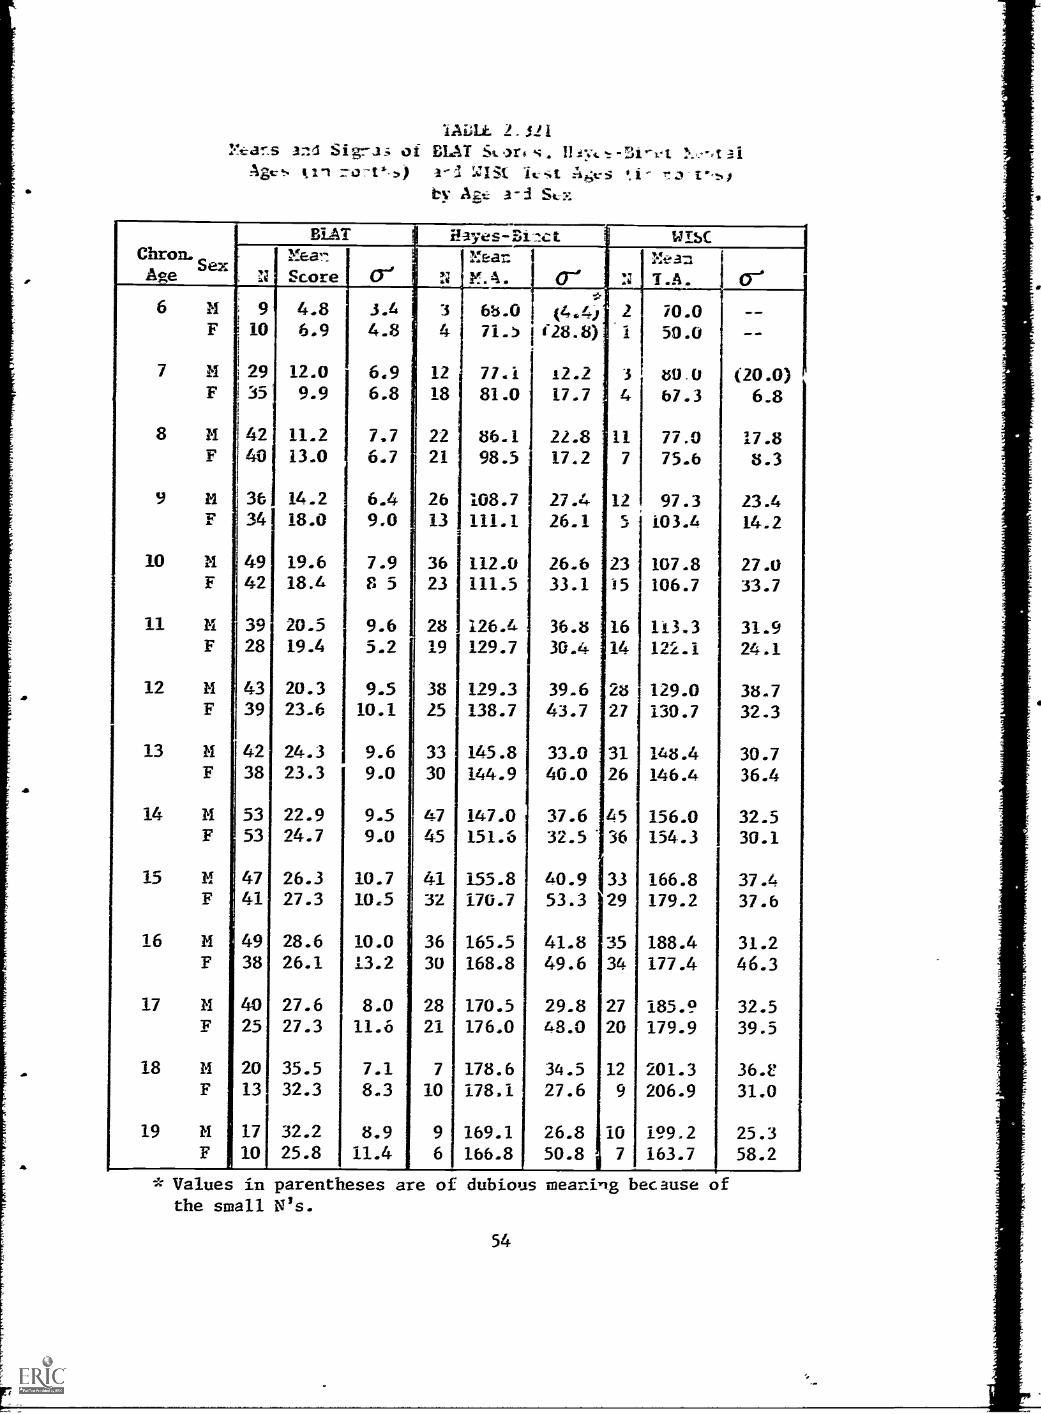
a
IADLL 2.521:.!ans 3nd Sigrli of ELT Stor.s.
Agvt ii-'t a-1 "waSt t-st ti-
by aig 3-3 St;:.:
MAT J Hayes-Bi-7 WM(Chron.
AROSex
Yd
idea"
Score 6' i 'i
MeanM.A. cr- N
MeanT.A. Cr
6 14 9 4.8 3.4 3 68.0 (4.4j 2 70.0F 10 6.9 4.8 4 71.5 (28.8) 1 50.0 --
7 N 29 12.0 6.9 12 77.1 12.2 3 t50,0 (20.0)F 35 9.9 6.8,; 18 81.0 17.7 :4 67.3 6..8
8 14 42 11.2 7.7 22 86.1 22.8 11 77.0 17.8F 40 13.0 6.7 21 98.5 17.2 7 75.6 8.3
9 14 36 14.2 6.4 26 108.7 27.4 12 97.3 23.4F '34 18.0 9.0 13 111.1 26.1 5 103.4 14.2
10 11 49 19.6 7.9 36 112.0 26.6 23 107.8 27.0F 42 18.4 8 5 23 111.5 33.1 15 106.7 33.7
11 11 39 20.5 9.6 28 126.4 36.8 16 113.3 31.9F 28 19.4 5.2 19 129.7 30.4 14 122.1 24.1
12 N 43 20.3 9.5 38 129.3 39.6 28 129.0 38.7F 39 23.6 10.1 25 138.7 43.7 27 130.7 32.3
13 11 42 24.3 9.6 33 145.8 33.0 31 148.4 30.7F 38 23.3 9.0 30 144.9 40.0 26 146.4 36.4
14 N 53 22.9 9.5 47 147.0 37.6 45 156.0 32.5F 53 24.7 9.0 45 151.6 32.5 36 154.3 30.1
15 M 47 26.3 10.7 41 155.8 40.9 33 166.8 37.4F 41 27.3 10.5 32 170.7 53.3 29 179.2 37.6
16 14 49 28.6 10.0 1 36 165.5 41.8 35 188.4 31.2F 38 26.1 13.2 3U 168.8 49.6 34 177.4 46.3
17 11 40 27.6 8.0 28 170.5 29.8 27 185.9 32.5F 25 27.3 11.6 21 176.0 48.0 20 179.9 39.5
18 14 20 35.5 7.1 7 178.6 34.5 12 201.3 36.1:'
F 13 32.3 8.3 10 178.1 27.6 S 206.9 31.0
19 11 17 32.2 8.9 9 169.1 26.8 10 199.2 25.3F 10 25.8 11.4 6 166.8 50.8 7 163.7 58.2
* Values in parentheses are of dubious meaning because ofthe small ti's.
54
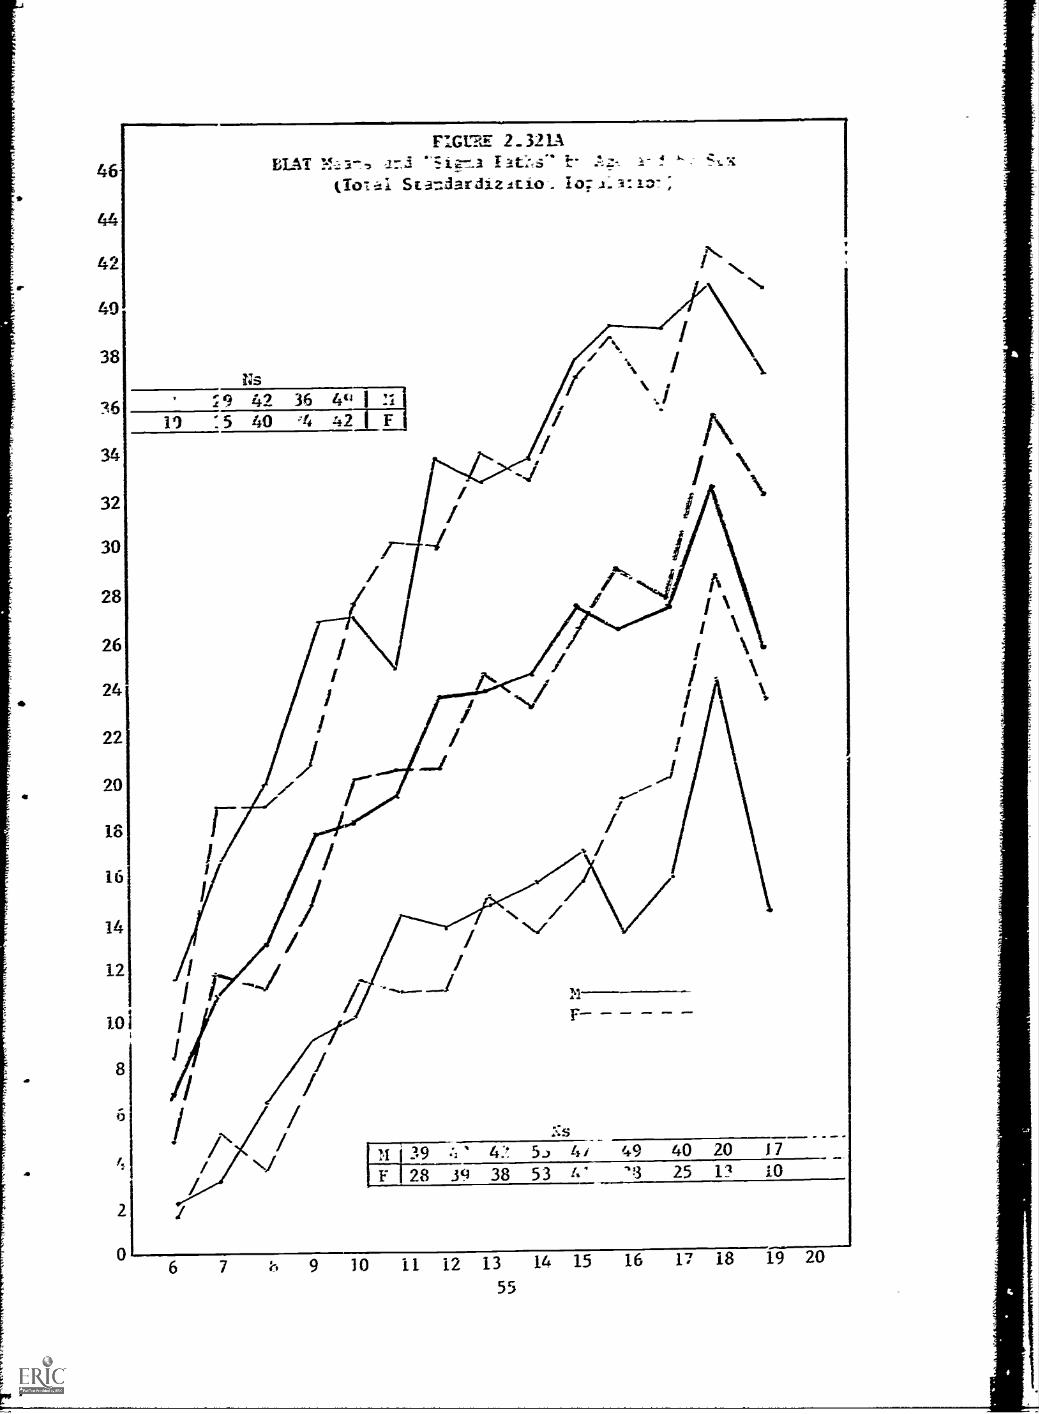
46
44
42
40
38
36
34
32
30
28
26
24
22
20
18
16
14
12
101
8
4
2
0
FIGURE 2_32LA
BUT Ma-, iri t-
(Iot ti
Ns
19 42 36 4(.1 I
11
]
:5 40 ;4 42 F
4 -
6 7
"1,2
F
ti 5.) 44 f9 40 20 17
F 28 39 38 53 4' 25 1:4 10
9 10 il 12 13 14 15 16 17 18 19
55
20
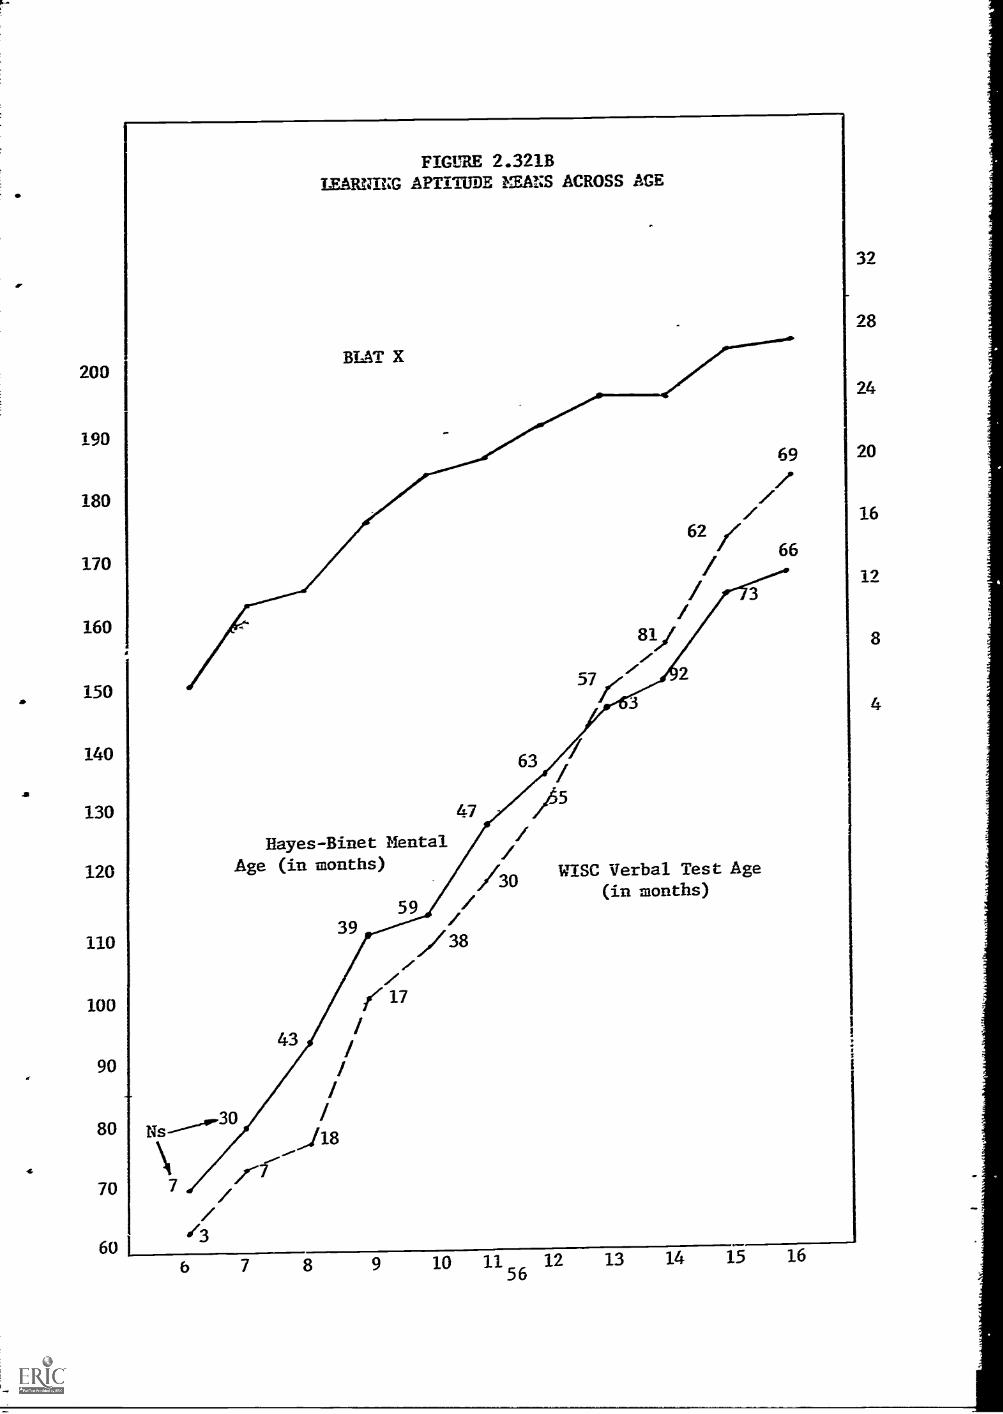
200
190
180
170
160
150.
140
130
120
110
100
90
80
70
60 I
Ns
FIGURE 2.321BLEARNING APTITUDE Zams ACROSS AGE
BLAT X
llayes-Binet MentalAge (in months)
39
47
59 ///38(17
43/
///
30 //1.8
//
57
69
/62
/ 66
/1
63 ////
/30
5
WISC Verbal Test Age(in months)
/36 7 8 9 10 11
5612 13 14 15 16
32
28
24
20
16
12
8
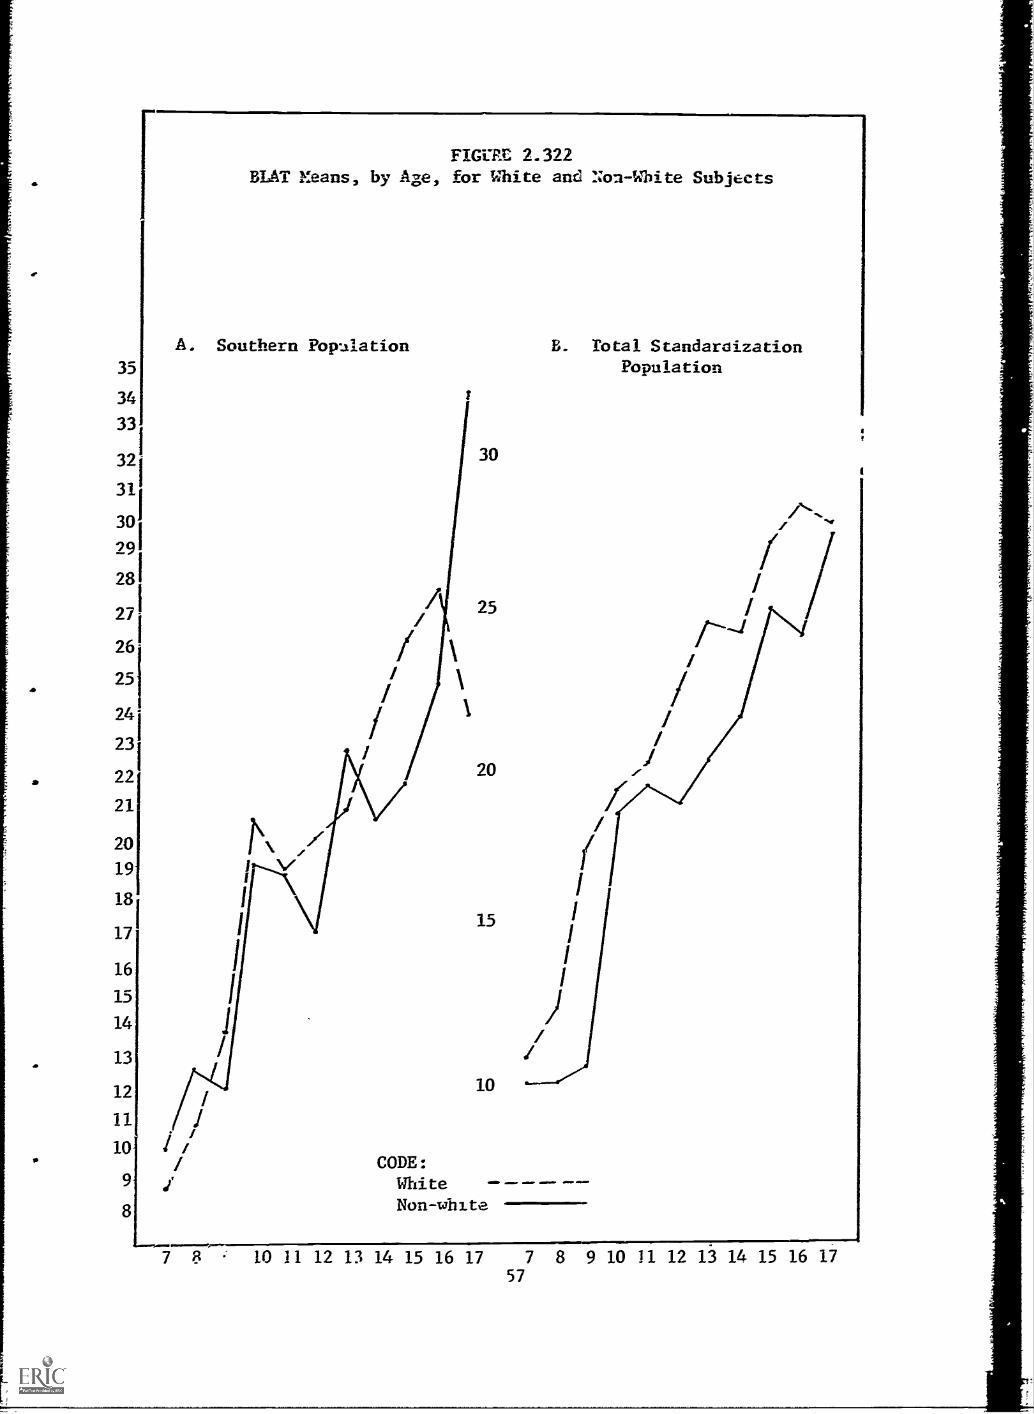
a
35
34
33
32
31
301
291
281
27
25
241
231
221
211
20
191
18!
17
16
15
14
13
12
11
10
9
8
FIGURE 2.322BLAT Means, by Age, for White and Non-White Subjects
A. Southern Pop.alation B. Total StandaroizationPopulation
30
25
20
15
10
CODE:WhiteNon-white
7 F . 10 11 12 13 14 15 16 17 7 8 9 10 11 12 13 14 15 16 1757
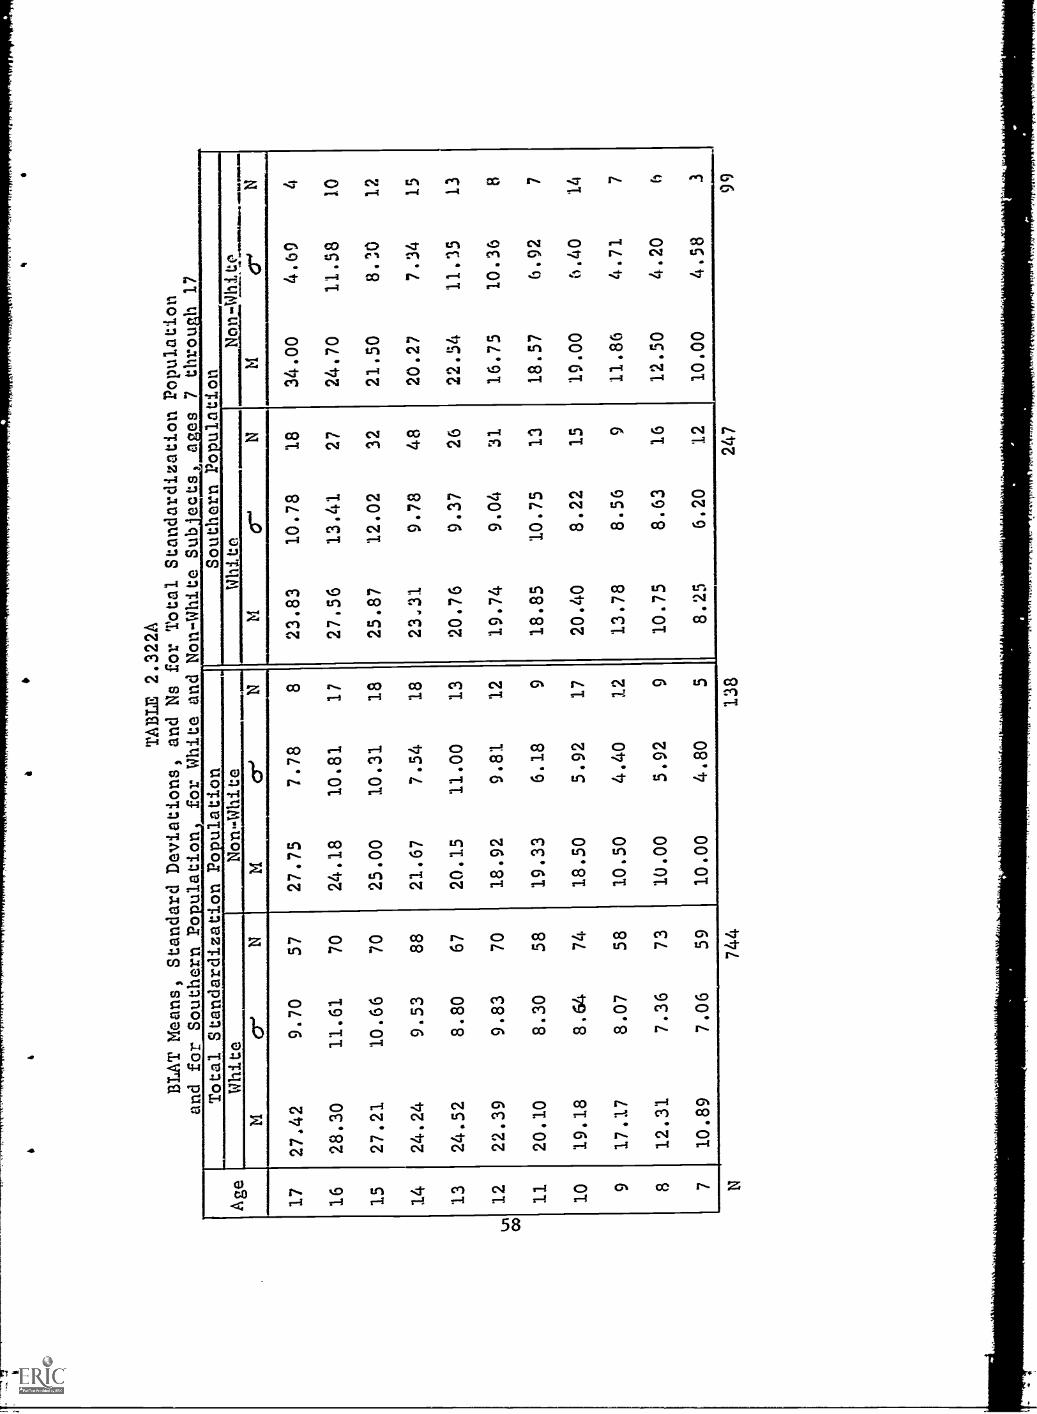
TABLE 2.322A
BLAT Means, Standard Deviations, and Ns for Total Standardization Population
and for Southern Population. for White and Non-White Sub ects, ages 7 through
17
Age
Total Standardization
Population
Non-White
Southern
White
l'opllallon
White
Non-White
Mcr-'
NM
ce
NM
0-'
NM
17
27.42
9.70
57
27.75
7.78
823.83
10.78
18
34.00
4.69
4
16
28.30
11.61
70
24.18
10.81
17
27.56
13.41
27
24.70
11.58
10
15
27.21
10.66
70
25.00
10.31
18
25.87
12.02
32
21.50
8.30
12
14
24.24
9.53
88
21.67
7.54
18
2331
9.78
48
20.27
7.34
15
13
24.52
8.80
67
20.15
11.00
13
20.76
9.37
26
22.54
11.35
13
12
22.39
9.83
70
18.92
9.81
12
19.74
9.04
31
16.75
10.36
8
11
20.10
8.30
58
19.33
6.18
918.85
10.75
13
18.57
6.92
7
10
19.18
8.64
74
18.50
5.92
17
20.40
8.22
15
19.00
6.40
14
917.17
8.07
58
10.50
4.40
12
13.78
8.56
911.86
4.71
7
812.31
7.36
73
10.00
5.92
910.75
8.63
16
12.50
4.20
6
710.89
7.06
59
10.00
4.80
58.25
6.20
12
10.00
4.58
3
744
138
247
99
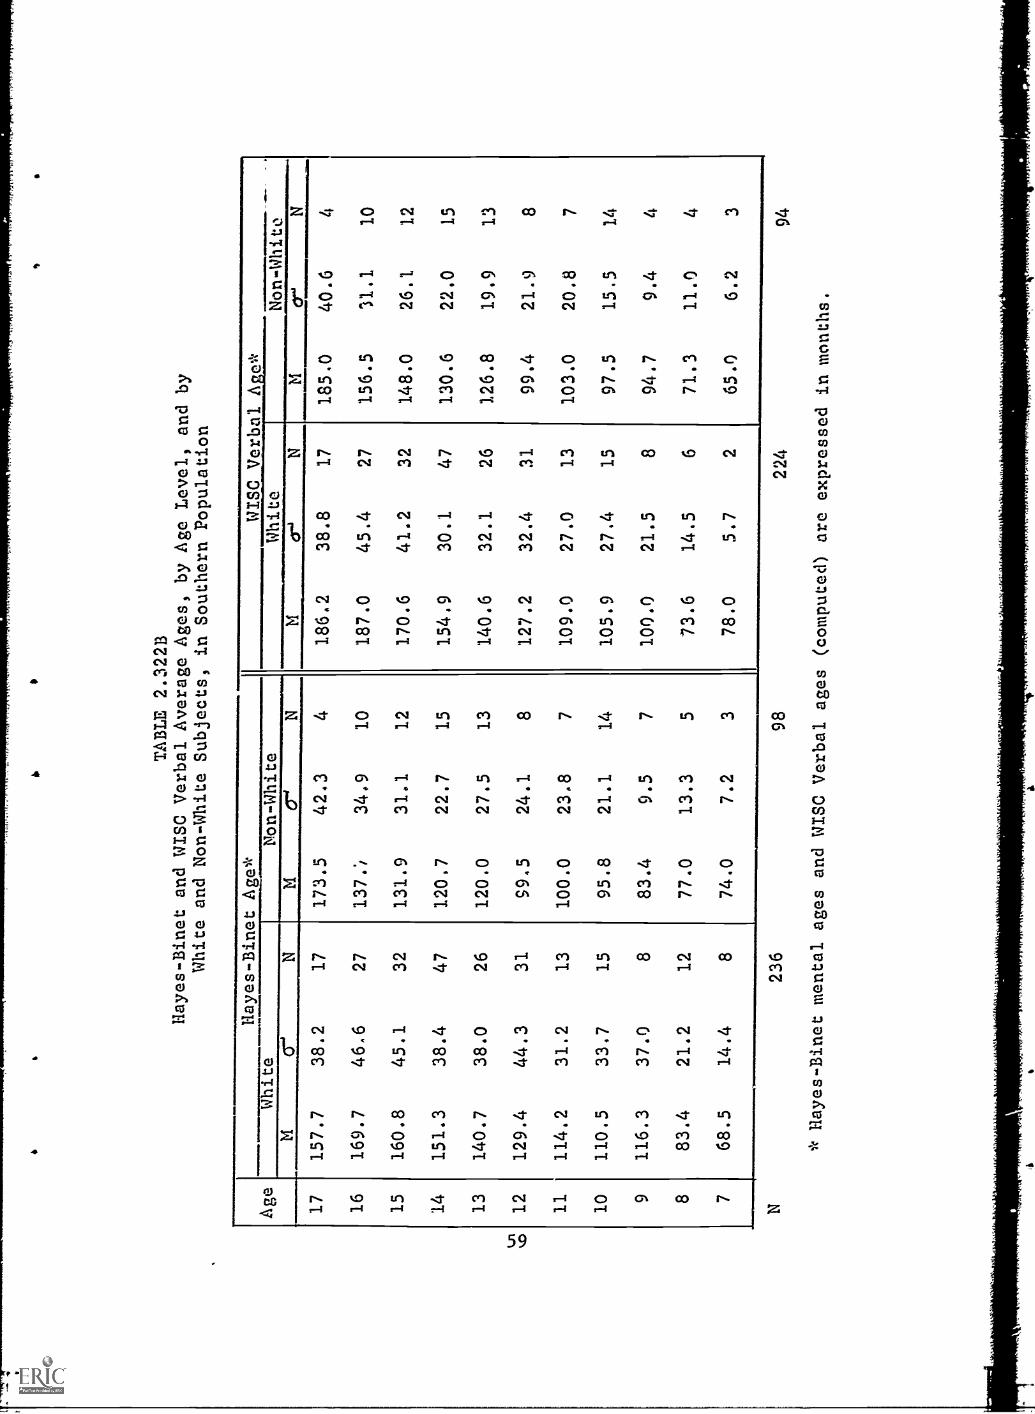
Ui 0
TABLE 2.3228
Hayes-Binet and WISC Verbal Average Ages, by Age Level, and by
White and Non-White Subjects, in Southern Population
Age
Hayes-Binet Age*
IOSL171111s16s,P*
White
Non-White
White
Non-White
Mc
NM
0'
NM
0-1
NM
cr"
N17
157.7
38.2
17
173.5
42.3
4186.2
38.8
17
185.0
40.6
4
16
169.7
46.6
27
137..,
34.9
10
187.0
45.4
27
156.5
11.1
10
15
160.8
45.1
32
131.9
31.1
12
170.6
41.2
32
148.0
26.1
12
14
151.3
38.4
47
120.7
22.7
15
154.9
30.1
47
130.6
22.0
15
13
140.7
38.0
26
120.0
27.5
13
140.6
32.1
26
126.8
19.9
13
12
129.4
44.3
31
99.5
24.1
8127.2
32.4
31
99.4
21.9
8
11
114.2
31.2
13
100.0
23.8
7109.0
27.0
13
103.0
20.8
7
10
110.5
33.7
15
95.8
21.1
14
105.9
27.4
15
97.5
15.5
14
9116.3
37.0
883.4
9.5
7100.0
21.5
894.7
9.4
4
883.4
21.2
12
77.0
13.3
573.6
14.5
671.3
11.0
4
768.5
14.4
874.0
7.2
378.0
5.7
265.0
6.2
3
N236
98
224
* Hayes-Binet mental ages and WISC Verbal
ages (computed) are expressed in months.
94
approximate plus one standard deviation of the non-white group. To be
determined later is the fact that such pronounced differences do notexist in the case of the BLAT means and standard deviations even inthe case of the rather consistent differences - across age - in thetotal standardization population.
2.323 By Kind of School. Shown in Table 2.323, p. 61, are
learning aptitudes test results for children in residential and in dayschools. On p.62 are line graphs of the means, plotted over the agerange 7 through 17. No statistically significant differences (at the.05 level) were found between the scores for the two kinds of schoolson BLAT. In the case of the Hayes -Binet results the difference wassignificant only between the .10 and .25 levels. Too few day schoolchildren had been tested by the WISC to warrant such computation oneven an exploratory basis.
2.324 By Geographic Area. Shown graphically in Figure 2.324,p. 63, are the average raw scores on BLAT, over the age range 7 through17 for the three geographic sub-samples - the midwest, the coastal, andthe southern subjects. As would be expected from data already presented,the southern sample tended to score somewhat lower than did the others.
2,325 By Southern School and Achievement. Shown in Table 2.325A
are average data on those children in the three southern schools who
took the achievement tests. while comparisons of achievement among theschools can be made on the basis of these data, they reflect, in a grossbut suggestive way, relationships among the different learning aptitudelevel indications. For Alabama, the average learning age indicatorsare in considerable agreement - all falling in the latter half of the
eleventh year. For the Tennessee school, the BLAT average learning ageappears to be about a year higher than that suggested jointly by theHayes-Binet and the WISC Verbal. In the North Carolina group, the BLATresults disagree with the Hayes -Binet and WISC Verbal by two years.The lowness of the average achievement scores in the Tennessee schoollimits any attempt at judging the predictive values of the tests of
learning aptitude.
When the average data for the different sub-groupings bychronological age (9-11, 12-13, and 14 up) are inspected in a comparablemanner, the BLAT learning age equivalents appear to increase, within each
school, as might be expected in view of the prior sectioning in terms ofC.A., but the younger group in the North Carolina school scoredrelatively higher on BLAT than they did on the Hayes-Binet or on the
WISC Verbal. Yet the achievement test performances are more what wewould expect on the basis of the Hayes-Binet and WISC tests. Again,
the achievement test data in the Tennessee school reflect no patterningas do those for both the Alabama and the North Carolina schools. (The
lack of a systematic approach to this achievement testing in theTennessee school has been noted.) (Table 2.325B, p. 65)
60
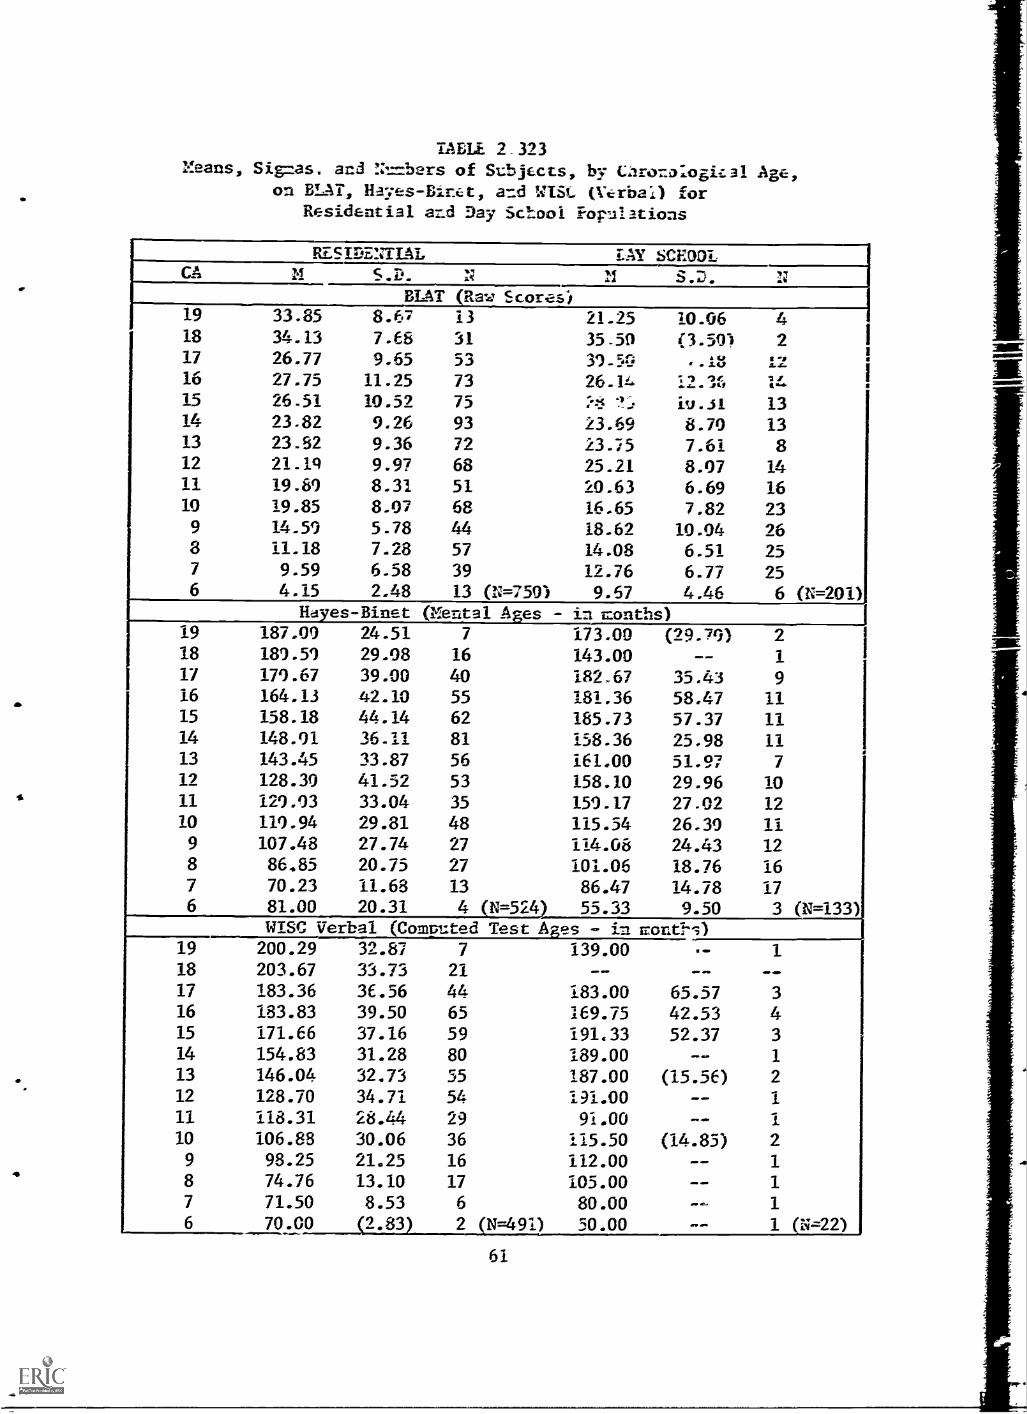
TABLE 2.323Means, Sig:as. and Nun-bers of Subjects, by Urozalogital Age,
on BLAT, Hayes-Biret, and WISC. (Verbal) forResidential and Day School Populations
RESIDENTIAL LAY SCHOOLCA m
1... S.D. N 11 S.D. NBLAT (Raw Scores)
19 33.85 8.67 13 21.25 10.06 418 34.13 7.68 31 35.50 (3.591 217 ...L.,26.77 9.65 53 31-5g '' 1"......
16 27.75 11.25 73 26.14, 12.36 1.4
15 26.51 10.52 75 :-:,5 -1.: iu.ii 1314 23.82 9.26 93 23.69 8.70 1313 23.82 9.36 72 23.:5 7.61 812 21.1q 9.97 68 25.21 8.07 1411 19.89 8.31 51 20.63 6.69 1610 19.85 8.07 68 16.65 7.82 239 14.59 5.78 44 18.62 10.04 268 11.18 7.28 57 14.08 6.51 257 9.59 6.58 39 12.76 6.77 256 4.15 2.48 13 (N=750) 9.57 4.46 6 (N=201)
Hayes-Binet (Mental Ages - in ronths)19 187.09 24.51 7 173.00 (29.79) 218 189.51 29.98 16 143.00 -- 117 179.67 39.00 40 182.67 35.43 916 164.13 42.10 55 181.36 58.47 1115 158.18 44.14 62 185.73 57.37 1114 148.01 36.11 81 158.36 25.98 1113 143.45 33.87 56 161.00 51.97 712 128.39 41.52 53 158.10 29.96 1011 129.93 33.04 35 159.17 27.02 1210 119.94 29.81 48 115.54 26.39 119 107.48 27.74 27 114.08 24.43 128 86.85 20.75 27 101.06 18.76 167 70.23 11.68 13 86.47 14.78 176 81.00 20.31 4 (N=524) 55.33 9.50 3 (N=133)
WISC Verbal (Computed Test Ages - rn mont:-.1)
19 200.29 32.87 7 139.00 .. 118 203.67 33.73 21 -- -- --17 183.36 36.56 44 183.00 65.57 316 183.83 39.50 65 169.75 42.53 415 171.66 37.16 59 191.33 52.37 314 154.83 31.28 80 189.00 __ 1
13 146.04 32.73 55 187.00 (15.56) 212 128.70 34.71 54 191..00 M M 111 118.31 28.44 29 91.00 -- 1
10 106.88 30.06 36 115.50 (14.85) 29 98.25 21.25 16 112.00 -- 1
8 74.76 13.10 17 105.00 -- 17 71.50 8.53 6 80.00 ... 1
6 70.00 (2.83) 2 (N=491) 50.00 .... 1 N=22)
61

32
30
26
24
22
20II
16;
141
12
10
180
170
160
150
140
130
120
110
100'
90
80
180
170
160
150
140
130
120
110
100
90
80
FIGURE 2.323Learning AEtitude Test Score Averages,
Ages 7 tilrolgh 17, forResidential aid
Day School Subjects
BLAT Raw Score
// 1/./f
Hayes-Hint Mental Age(in months)
f
DayResidential
/
WISC Verbal "Mental" Age j
(in months)
7 8 10 11 12 13 14 15 16 1762
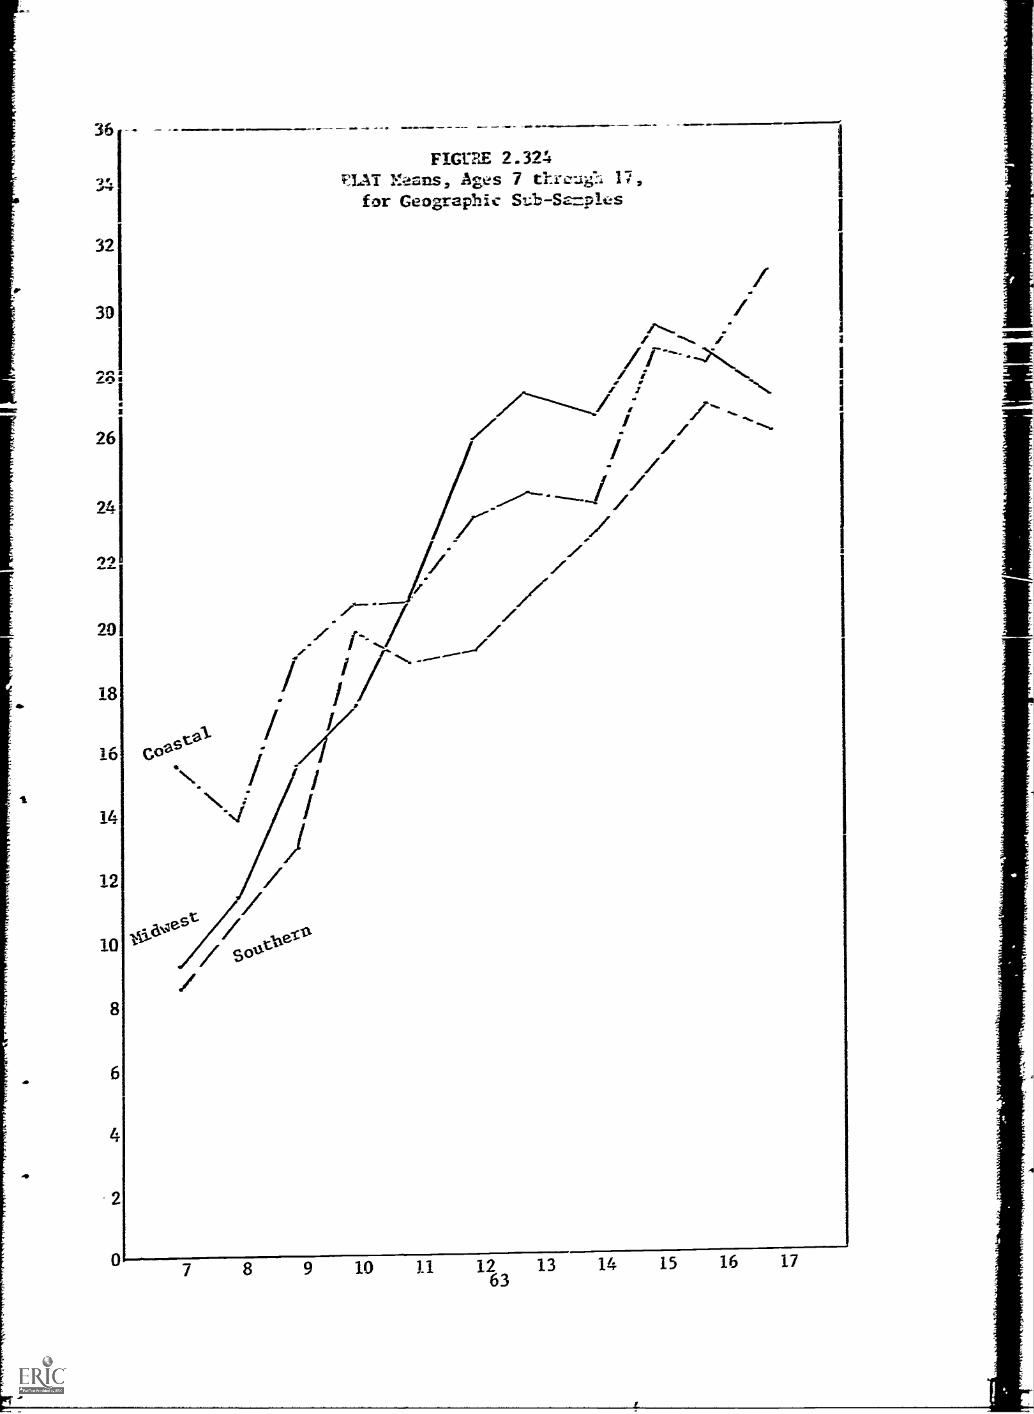
1
I
LI 91 SI 171 ET E 9
ZI II OI
IP
...., -....
...., ...../
z r /
// /- / . i Z
= / N,. 1 0 I'
I / , -,.... ,
. ".te
s;nd=zs-qns .)Itidea2cap 10J `,1 r:.Rnzi-s-43 t s'714. gstraex Tvla
facz nama
9Z
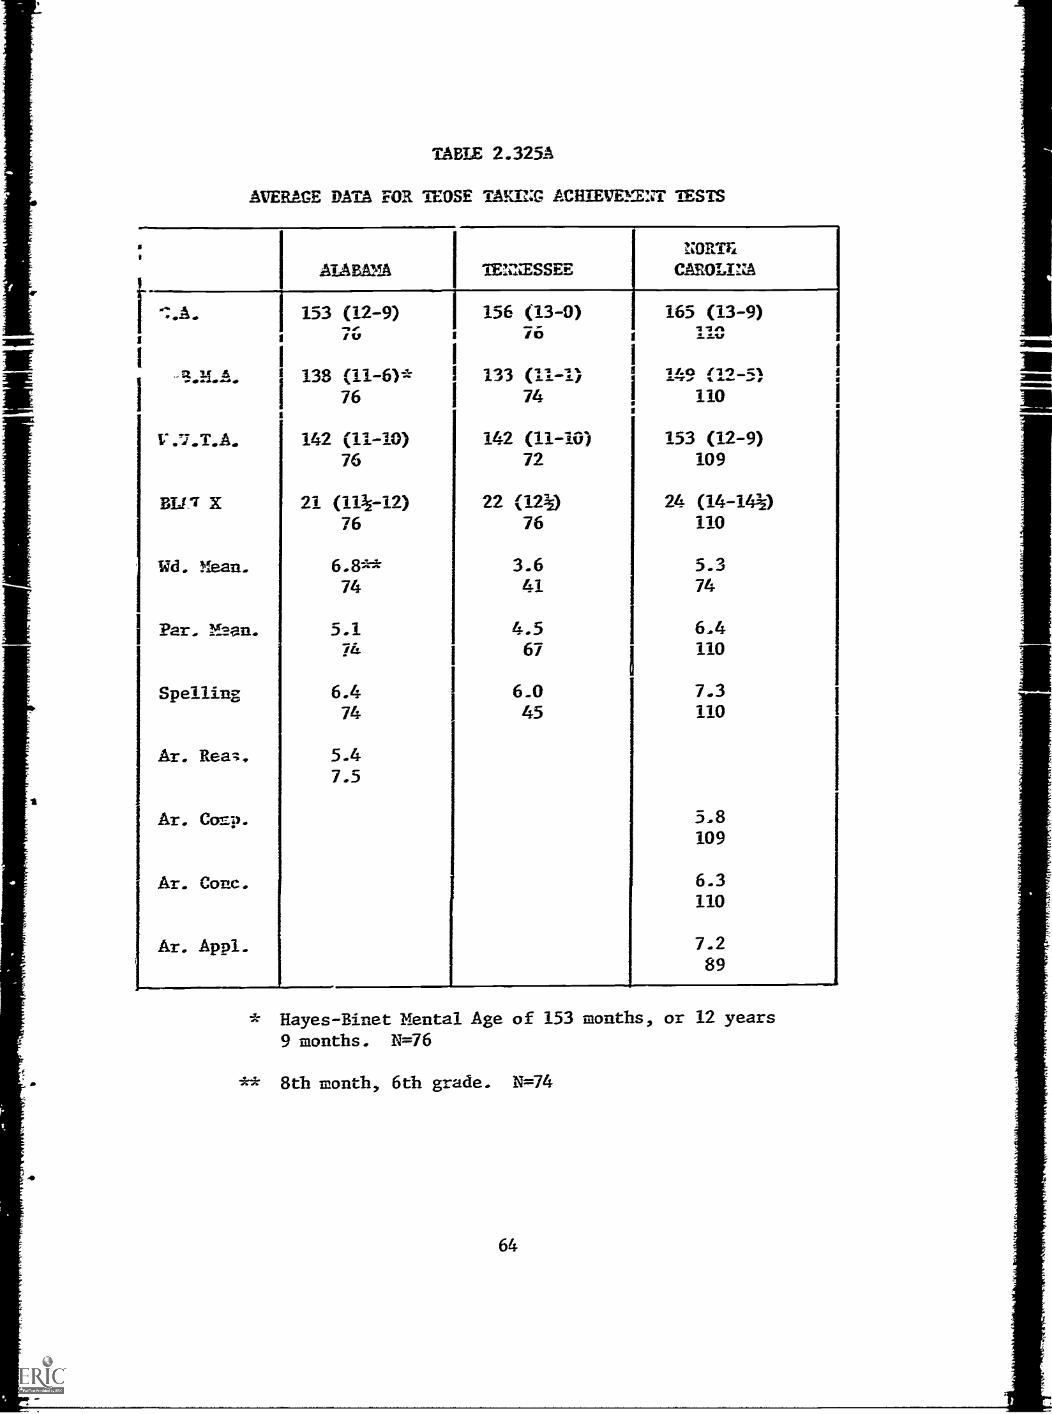
TABLE 2.325A
AVERAGE DATA FOR TEOSE TAKING ACHIEVEMENT TESTS
BLPT X
Wd.
Par. 'wen.
Spelling
Ar. tea ;.
Ar. Corp.
Ar. Conc.
Ar. Appl.
ALABAMA
153 (12-9)iv
138 (11-6)*76
142 (11-10)76
21 (113/4-12)
76
6.8**74
5.1
TENIMSSEENORTFA
CAROLINA
156 (13-0)76
133 (11-1)74
165 (13-9)11^
.S.I.V
11.0 (1)..
110
142 (11-10)72
22 (12k)
76
3.641
4.576- 67
6.4 6.0
74 45
5.47.5
153 (12-9)
109
24 (14-143/4)
110
5.374
6.4110
7.3110
5.8109
6.3110
7.2
89
* Hayes-Binet Mental Age of 153 months, or 12 years
9 months. N=76
8th month, 6th grade. N=74
64

TABLE 2.32513
AVERAGE DATA FOR THOSE TAKING ACHIEVEMENT TESTS
BY CHRONOLOGICAL AGF. SUB-GROUPS
9-11
ALABAMA
12-13
14 up
9-11
TENNESSEE
12-13
14 U3
NOM
9'41.
CAROLINA
L2-13
75(12-1) 156(13-0)
27
14
up
H.B.M.A.
112(9-4)*
15
135(11-3)
20
163(13-6)
34
110(9-2)
14
125(10-5)
18
148(12-4)
39
125(10-5)m
14
68
W.V.T.A.
110(9-2)
135(11-3)
175(14-7)
101(8-5)
129(10-9)
164(13-8)
117(9-9)
140(11-8)
165(13-9)
15
20
34
14
18
39
14
27
68
_......._
BLAT X
19(101/2)**
21(11-11k)
24(131/2)
18(10)
20(11)
26(15)
24(1:A)
:3(13)
26(15)
15
20
34
14
18
39
14
27
68
Wd.Mean.
4.8***
6.4
8.6
3.5
4.0
3.3
4.7
5.9
5.1
13
20
34
12
14
13
14
27
32
Par.Mcm.
3.6
4.8
6.2
2.5
4.0
5,8
3.9
6.1
7.0
15
19
34
13
17
33
14 ............27
68
____________
Spelling
5.1
5.8
7.9
6.8
6.2
5.8
4.9
6.4
8.2
14
20
33
212
31
14
27
68
1000
1110
Y10
IS 1
11/1
1MaM
MO
NK
IMM
Ar.Reas.
3.7
4.7
7.3
-5.5
7.2
14
20
34
423
Ar.Comp.
------......
3.2
5.1
6.6
14
27
67-...
Ar.Conc.
4.3
5.8
7.0
14
27
68
Ar.Appl.
6.7
6.7
7.4
423
61
*112 months, or 9
years 4 months.
Nm15:
***
8th month, 4th grade.
Nm13.
** 101/2 months test
age on basis o2 BUT norms;
2.33 Reliability. TIco ki---ds of evidence reflect favorably or the
reliability of mAr. Using the Kieder-Ricksrdson For-1111 7,L, the
reliability on the 951 cases o :er the total age range was found to be .934 -
suggesting a high consistency among Eh :2 49 itcns making up the (untimed)
test.
On the basis of retesting 93 children, aged 6 through 16 years,
seven months after the original testing, a test-retest reliability of
.865 was found. Seven different testers did the retesting with no
keowiecige w Lim zccsAlt: obtained by seven original testers.
None of the retestcrn !"_a4 previously administered MAT; in fact, only two
of the originate testers (ulao test.0.-t a total of 9 erildren in ttzis
=respect of the study) had he= frii-or exeeric-nce with BLAT.
From the standpoint of a maximum 'reality" situation in re-
testing for reliability information, tte conditions which maintained with
respect to the retesting of all 93 children by the seven retesters can be
regarded as quite "real". Even though the testers and the retesters had
been given orientation training in Cee administration of BLAT, there were
bound to be discernible differences among them in obtaining rapport with
the children, in involving the children in the solution of the items both
during and after the practice items in both testings, and, at times, in
pressing for responses in the hope that the most thoughtful responses could
be elicited from children who seemed to be "flighty", careless, bored, or
in some wav distracted.
Yet, a curiosity existed regarding the possibility that some testers,
by some quirk in administering or scoring BLAT, might have obtained scores
the validity of which might be questioned. The test scores on the 93
children, therefore; were examined by seeking the answers to two questions:
a) Taking the raw scores earned on the original testing of these
93 children, what were the magnitudes of change, among the
seven original testers, from the original testing to the
retesting': While differences reasonably could be expected
among the original testers, the median changes ought not
differ to any major degree.
b) Taking the raw scores earned on the retesting of those 93
children, what were the magnitudes of change, among the seven
retesters, from the original testing to the retesting?
This analysis revealed an interesting condition. The median gains
from those scores obtained by each of the original testers were 4, 5, 5,
6, 6, 6, and 7, suggesting a not unreasonable amount of variation. How-
ever, when the retest scores were analyzed in terms of the magnitudes of
the gains in the retest scores among the retesters, the median gains
were 3, 4, 5, 5, 6, 8, 5, 11, and 12. This invited curiosity, if not
concern, regarding the validity of the retesting procedures of the two
retesters whose subjects (12 all told) had median gains of 11 and 12.
No selective factors were known to have been operative in allocating
retest S's to these two retesters. , then, the test-retest
reliability were computed on only the remaining 81 children (eliminating66
the r-sulLs obcdired by L Iwo relesiers), this might givea "purer" (though perhaps sonewhat less "real-) picture of the reliabilityof BIAS. This Iearson coefficient turned out to be .888 for the a.e rangefro= 6 to 16, a negligible gain over the original .865.
In order to ascertain whether a difference existed between thetest-retest reliability of the younger children and that for olderchildren, the reliabilities were computed for those in the 6-10 yearrange and also for those in the 12-16 year range. These Pearson coeffi-cients were .871 for the 24 children in the loser age range and .895 onthe 53 subjects in the upper age rang; suggesting no major differencein terms of such agc levels.
Whether the evidence of test-retest reliability is perceived interms of the results obtained on the 93 cases (r=.865) or in terms ofwhat might be regarded as a "purer" sample N=81; r=.888) , it would appearthat BUT has reasonable test-retest reliability.
It should be borne in mind that the correlational approach in-volved here throws light primarily on the degree of agreement in theorderings of the populations under the two conditions of testing. Thepsychometric information communicated by a reliability coefficient maycreate a false sense of security with respect to the possible educationaluses of the results so correlated. a given coefficient may reflect anyone of three relationships -which might exist between the two sets of dataon the same group.
Most commonly, the magnitudes of the raw scores obtained in the twotestings are reasonably comparable, with no significant trends of increaseor decrease of the second scores in comparison with the initial scores.Barring the phenomenon of regression, this is the case with most"intelligence" and achievement tests which are readministered after ashort period of time. The use of the retest results gives pretty muchthe same predictive ("intelligence") or descriptive (achievement)characterizations of the children. (Regression should be recognized asa statistical phenomenon, at times of limited relevance psychoeducation-ally, and inmost clinical instances inapplicable.)
But two additional possibilities exist where the results of thetwo testings would correlate highly. On the one hand, the scores on thesecond testing ray be consistently lower - most children earning lowerscores in the second testing, although not necessarily by the samemagnitudes, and the ordering of the ildre on the two testingsremaining essentially similar. On the other hand, the reverse may betrue - generally higher scores being earned on the second testing,though not necessarily by the same magnitudes, and the orderings re-maining essentially similar. So long as test scores are merelyrecorded on cumulative folders and nothing is done educationally forthe children in the light of those scores, no problem becomes apparent.However, if a teacher seeks to adapt her instruction to a child interms of the results of, say, "intelligence" test results, she will be
67

at a loss to decide how to proceed. ;nder t first of the two possi-3,4.1; r-q1my find that 3 cl!ild ;-as nn firer testing
a mental age (or test age) of 9 years C ro-Iths and on the second testing
a test age of 8 years 0 months. Sho,dd she try tc work with the child as
a be fourth grader or as a beeinning thir6 grader? The reverseof this condition wolild exist in. the case of th,,! second of these two
possibilities mentioned - generally higher ,;.ores on the second testing.
This general troblem is identified lere because in the BLATretesting, with the reliability of .5265. there w.as a median gain of 5.8
points (mean =5.6) from first to second score (using the results of all
seven Letesters). __© tte exterr that Etc statistical fheno-enon ofregression would be operative, to that extent wouici one eapect the
ctcdiam diftere--ces betwee-, origiktal test 3c3rc- -^r--*
scores to approach zero. The regression phenomenon appears not to be
operating here. However, it is quite possible that the kinds ofbehavior sampled by BLAT are different from those sampled by mosttests - especially those of achievement and probably most of those of
"intelligence". The psychological ',7.rocess' or processes, sampled by
BLAT may quite properly be more susceptible to the kind of practiceprovided by the first testing.
The fact at for those 81 children presumably more carefullyretested, the median retest scores on BLAT were 4.5 higher than thescores earned in the first testing is, of itself, no unusual phenomenon.
With respect to practice effects of the Primary Abilities Tests, forinstance, the obzcrvatien has been made that "mean scores are usually
higher on the second administration.' (Technical Report, PmA, 1965,
p. 16) (It should be noted that there probably is a closer resemblancebetween the kinds of behavior being sampled by BLAT and the PNA -particularly at the lower levels than there is between BLAT and most
verbal tests of "intelligence".)
However, the question seems not generally to have been raisedas to which of the two scores, on any test of learning aptitude,better suggests the learning aptitude of the children so tested.
This matter seemed worthy of exploration in regard to BLAT, orin regard to tests involving comparable kinds of behavior sampling,
for the following reasons: (1) Blind (and other disadvantaged)children tend, more often than do any others except, probably, deaf
children, to come from environments that are clearly less nurturantto the product aspect of learning aptitude; perhaps due to decreased
visual feedback in their acts of learning, the process aspect oflearning aptitude may be similarly impaired. (2) If the act of taking
BLAT stimulates, and in fact trains in connection with the training
items for each series, and if this training has the effect of "awakening"
or causing to operate more effectively those aspects of process tapped
by BLAT, the retest, and probably higher, score may be a betterpredictor of academic achievement than the initial BLAT score. Since
68
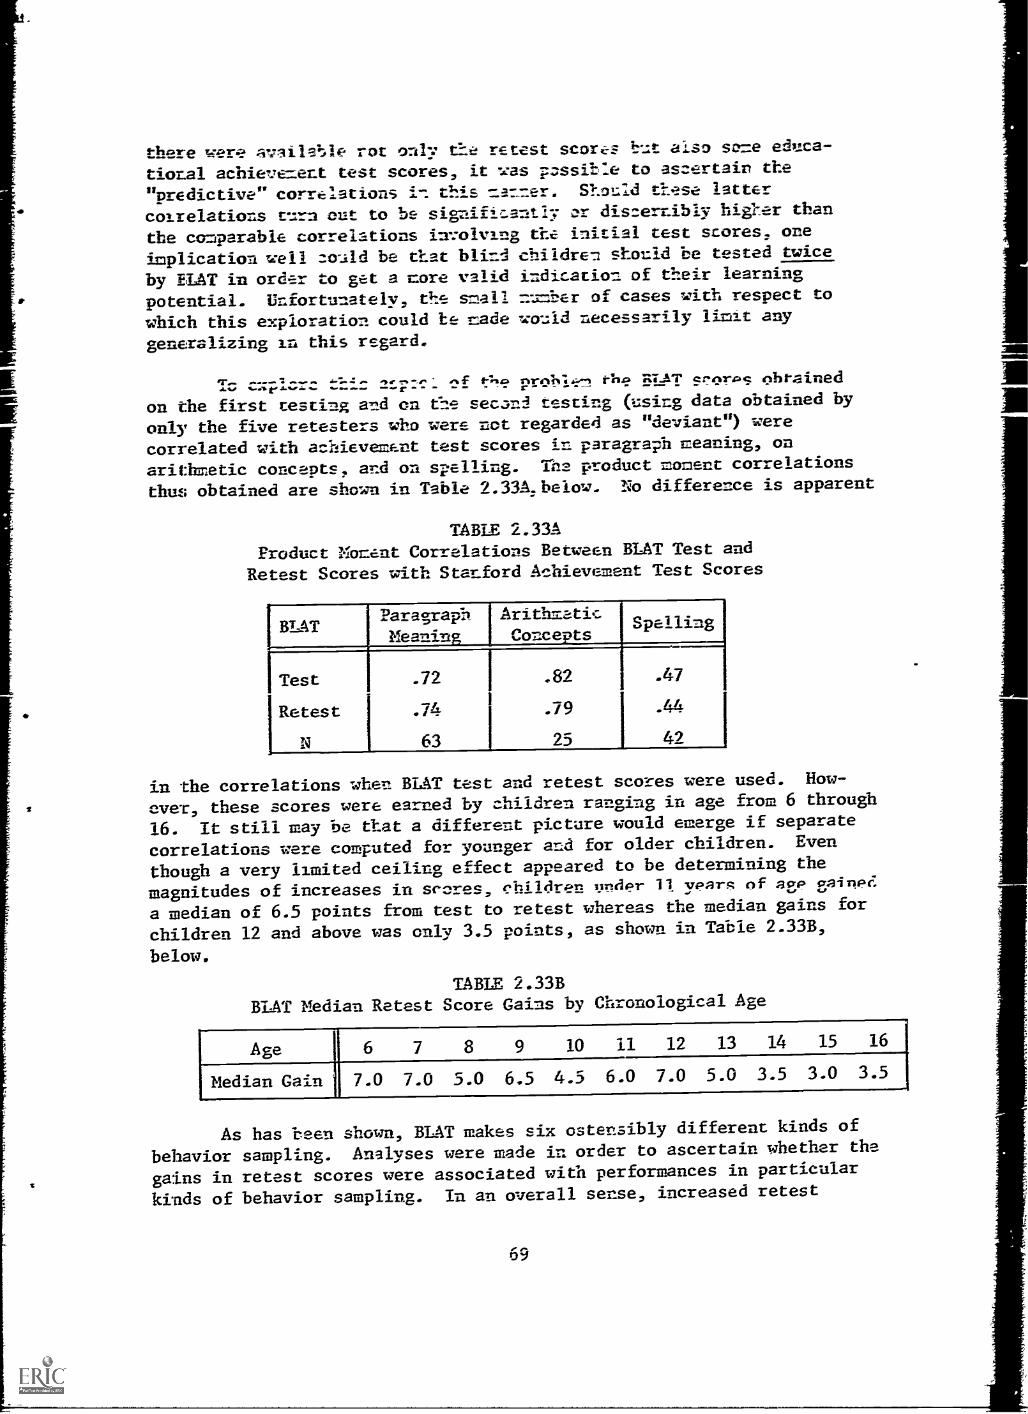
there were availa;;le rot only the retest scores but also same educa-
tional achievement test scores, it was passible to ascertain the
"predictive" correlations this ma=er. Should these latter
correlations turn out to be signifi,Lently ar discernibly higl-,er than
the comparable correlations involving the initial test scores, one
implication well aolild be that blind children should be tested twice
by BLAT in order to get a more valid indication of their learning
potential. Unfortunately, the small =umber of cases with respect to
which this exploration could he made would necessarily limit any
generalizing in this regard.
---1--- ^f f-'4c4 probi' the RtAT crnr.oc niltained
on the first testing and on the secand testing (using data obtained by
only the five retesters who were not regarded as "deviant") were
correlated with achievement test scores in paragraph meaning, on
arithmetic concepts, and on spelling. The product moment correlations
thus obtained are shown in Table 2.33A,below. No difference is apparent
TABLE 2.33A
Product Moment Correlations Between BLAT Test and
Retest Scores with Stanford Achievement Test Scores
BEAT paragraphMeaning
ArithmeticConcepts
Spelling
Test .72 .82 .47
Retest .74 .79 I .44
N 63 25 42
in 'the correlations when BLAT test and retest scores were used. How-
ever, these scores were earned by children ranging in age from 6 through
16. It still may be that a different picture would emerge if separate
correlations were computed for younger and for older children. Even
though a very limited ceiling effect appeared to be determining the
magnitudes of increases in scores, children under 11 years of age gained
a median of 6.5 points from test to retest whereas the median gains for
children 12 and above was only 3.5 points, as shown in Table 2.33B,
below.
TABLE 2.33BBLAT Median Retest Score Gains by Chronological Age
Age 6 7 8 9 10 11 12 13 14 15 16
Median Gain 7.0 7.0 5.0 6.5 4.5 6.0 7.0 5.0 3.5 3.0 3.5
As has been shown, BLAT makes six ostensibly different kinds of
behavior sampling. Analyses were made in order to ascertain whether the
gains in retest scores were associated with performances in particular
kinds of behavior sampling. In an overall sense, increased retest
69
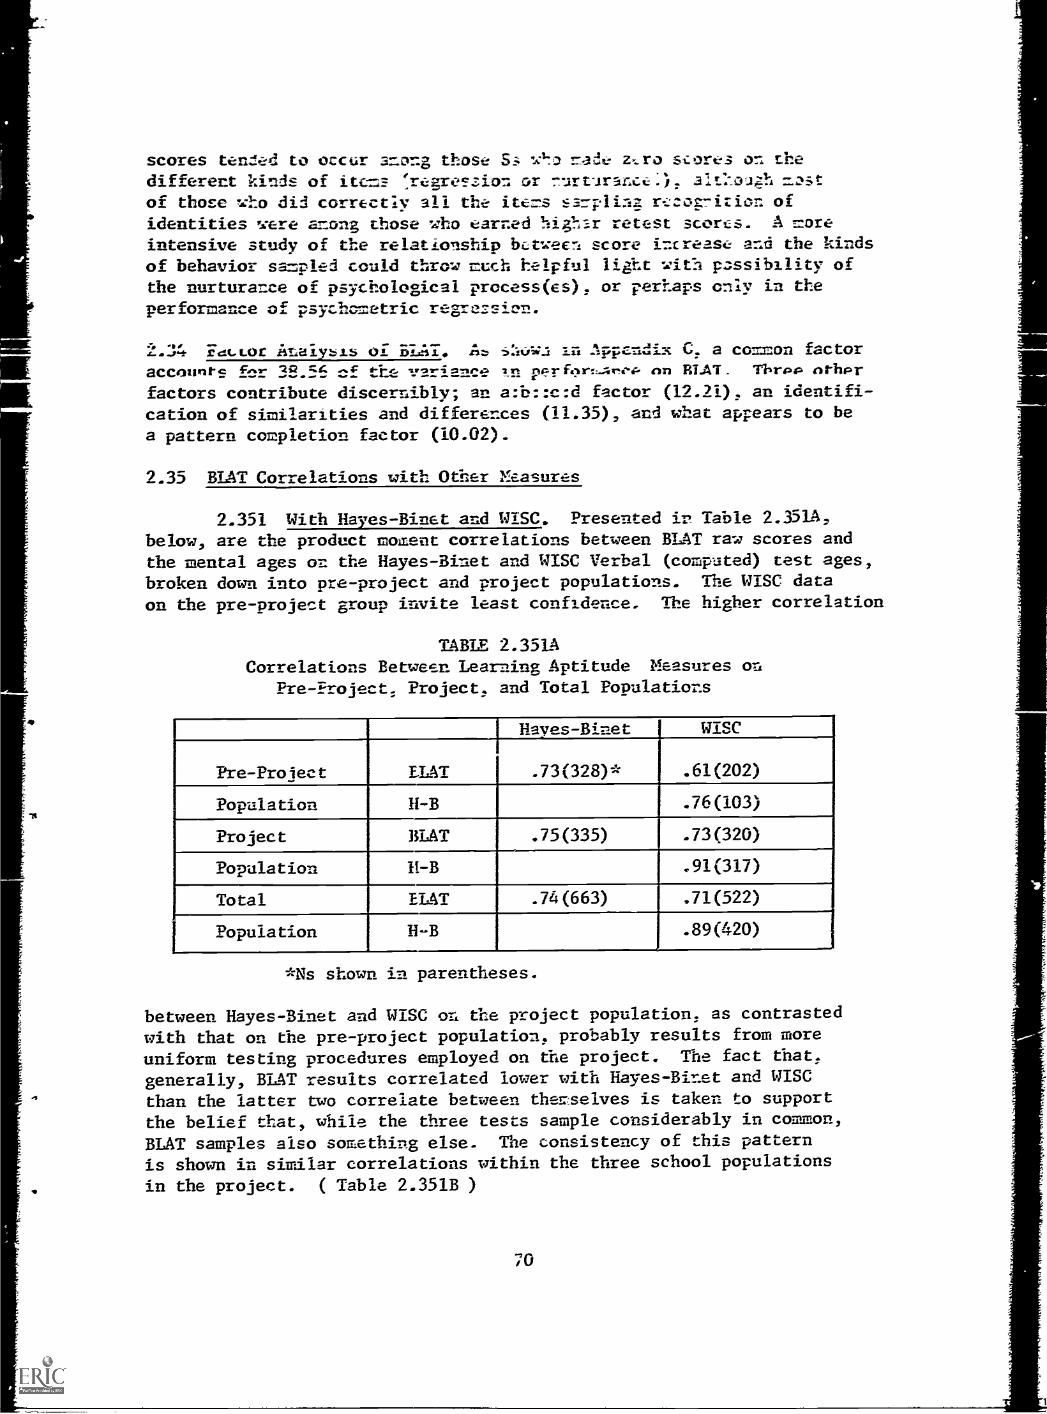
scores tensed to occur among those SA- made z,ro scores an thedifferent kinds of items 57ezreczion or nurvirance:), alt:iouzh mzstof those who did correctly all the items ssrplinz r,coz7ition ofidentities were among those who earned !:ighsr retest scorcs. A moreintensive study of the relationship bctween score increase and the kindsof behavior sampled could throw much helpful light with passibility ofthe nurturance of psychological process(es) , or perhaps only in the
performance of psychometric
2.34 Fec.Lor Ataiysis oi BIAT. in Appendix C. a co=mon factor
aCCOuntc tiara in per cm ETAT Tbrop nehpr
factors contribute discernibly; an a:b::c:d factor (12.21), an identifi-cation of similarities and differences (11.35), and what appears to be
a pattern completion factor (10.02).
2.35 BLAT Correlations with Other Measures
2.351 With Hayes-Binet and WISC. Presented it Table 2.351_A,
below, are the product moment correlations between BLAT raw scores andthe mental ages on the Hayes-Binet and WISC Verbal (computed) test ages,broken down into pre-project and project populations. The WISC data
on the pre - project group invite least confidence. The higher correlation
TABLE 2.351ACorrelations Between Learning Aptitude Measures on
Pre-Project, Project, and Total Populations
Haves- ine WISC
Pre - Project FIAT .73(328) .61(202)
Population H-B .76(103)
Project BLAT .75(335) .73(320)
Population 11-B .91(317)
Total ELAT .74(663) .71(522)
Population H-B .89(420)
*Ns shown in parentheses.
between Hayes-Binet and WISC on the project population, as contrasted
with that on the pre-project population, probably results from moreuniform testing procedures employed on the project. The fact that,
generally, BLAT results correlated lower with Hayes-Binet and WISCthan the latter two correlate between the selves is taken to supportthe belief that, while the three tests sample considerably in common,BLAT samples also something else. The consistency of this pattern
is shown in similar correlations within the three school populations
in the project. ( Table 2.351B )
70
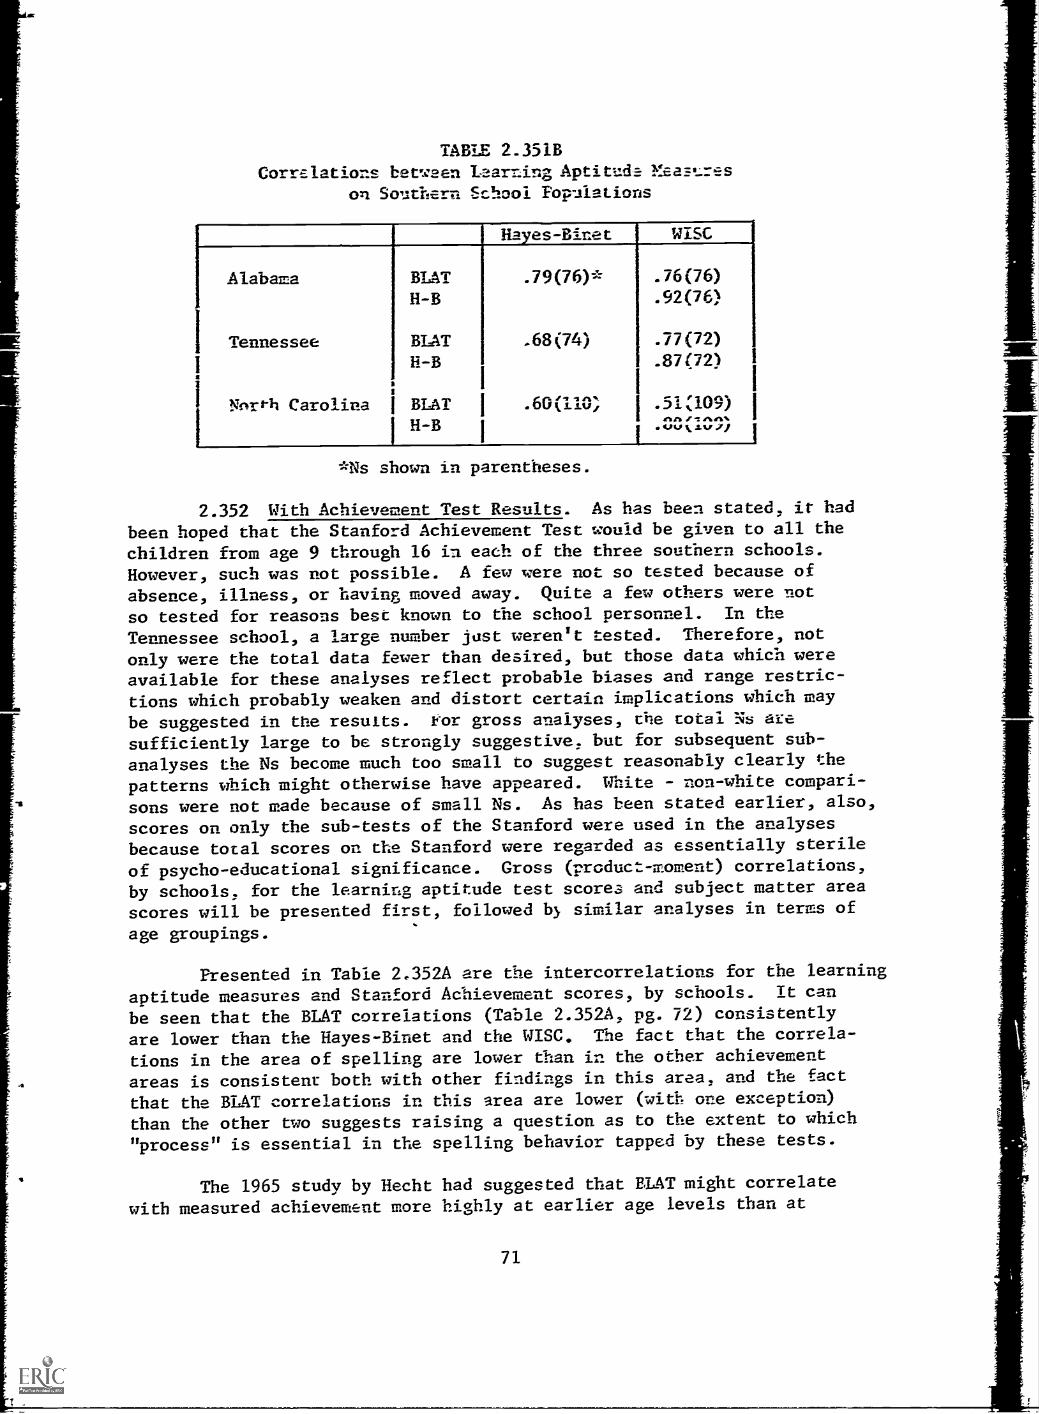
TABLE 2.351BCorrelations between le arning Aptitude Eeasres
on Southern School Populations
Hayes-Binet 1 WISC
Alabama BLAT .79(76)* .76(76)
H-B .92(76)
1Tennessee BLAT .68(74) .77(72)
I H-Bi
i .87(72)
1
North Carolina i BLAT I .60(110, .51a09)H-B
...I
I I .",,,..w.,. 1
erNs shown in parentheses.
2.352 With Achievement Test Results. As has been stated, it had
been hoped that the Stanford Achievement Test would be given to all the
children from age 9 through 16 in each of the three southern schools.
However, such was not possible. A few were not so tested because ofabsence, illness, or having moved away. Quite a few others were not
so tested for reasons best known to the school personnel. In the
Tennessee school, a large number just weren't tested. Therefore, not
only were the total data fewer than desired, but those data which were
available for these analyses reflect probable biases and range restric-
tions which probably weaken and distort certain implications which may
be suggested in the results. for gross analyses, die total Ns are
sufficiently large to be strongly suggestive, but for subsequent sub-
analyses the Ns become much too small to suggest reasonably clearly the
patterns which might otherwise have appeared. White - non-white compari-
sons were not made because of small Ns. As has been stated earlier, also,
scores on only the sub-tests of the Stanford were used in the analyses
because total scores on the Stanford were regarded as essentially sterile
of psycho-educational significance. Gross (product- moment) correlations,
by schools, for the learning aptitude test scores and subject matter area
scores will be presented first, followed b) similar analyses in terms of
age groupings.
Presented in Table 2.352A are the intercorrelations for the learning
aptitude measures and Stanford Achievement scores, by schools. It can
be seen that the BLAT correlations (Table 2.352A, pg. 72) consistently
are lower than the Hayes-Bizet and the WISC. The fact that the correla-
tions in the area of spelling are lower than in the other achievement
areas is consistent both with other findings in this area, and the fact
that the BLAT correlations in this area are lower (with one exception)
than the other two suggests raising a question as to the extent to which
" process" is essential in the spelling behavior tapped by these tests.
The 1965 study by Hecht had suggested that PLAT might correlate
with measured achievement more highly at earlier age levels than at
71
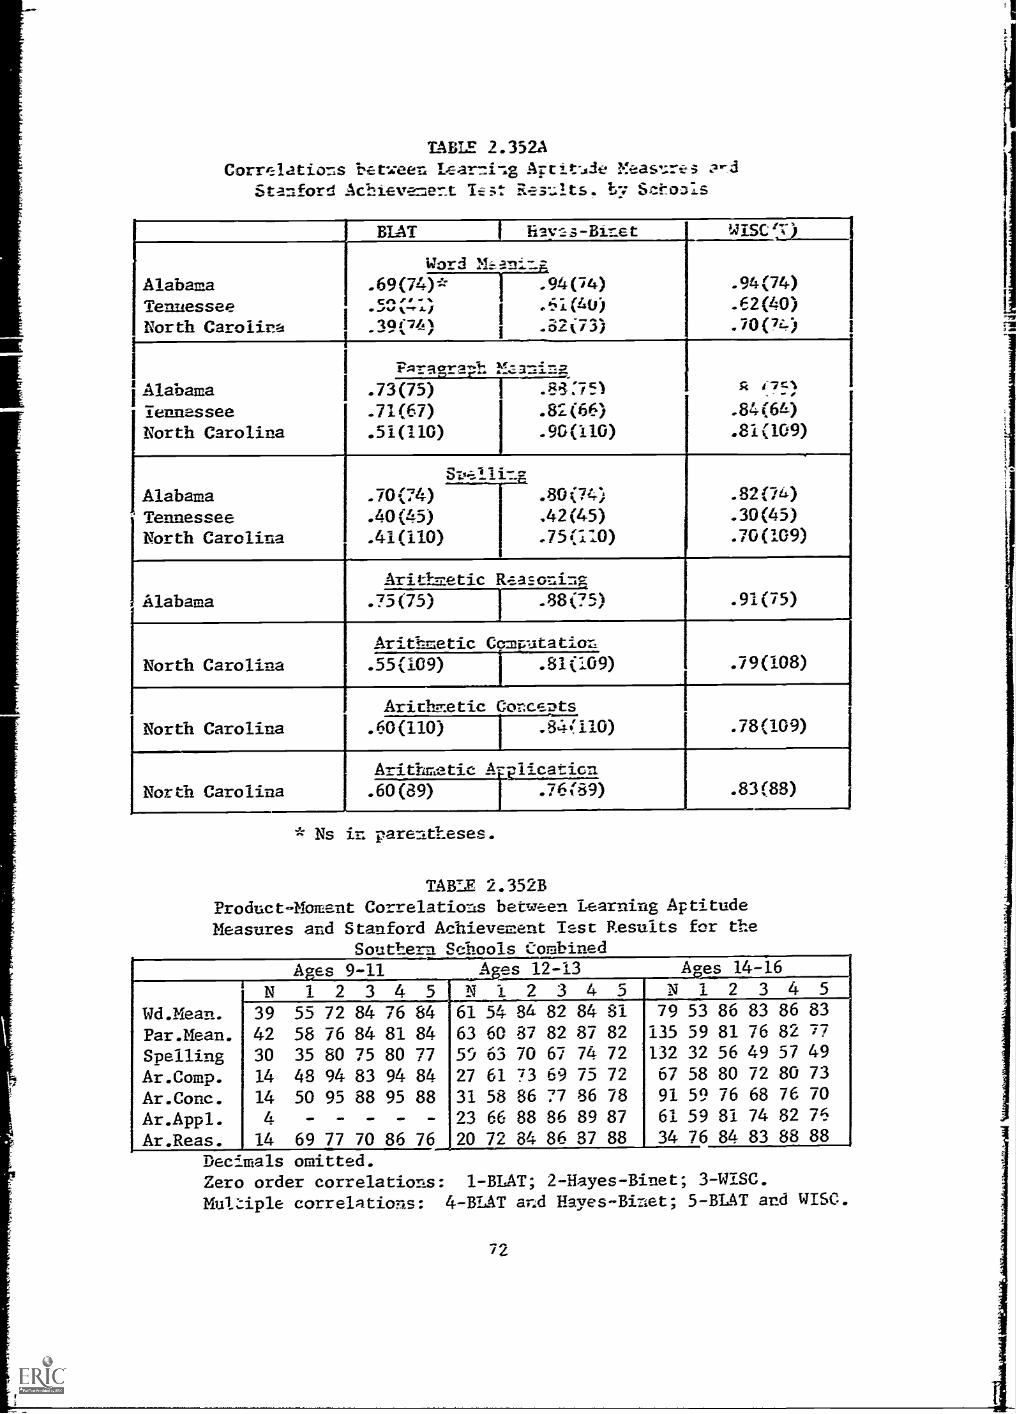
TABLE 2.352ACorrelations betIceen Lear7i-Ig Apt ride Meas1:1-E,s
Stanford Achieve=ent ReslAts. by Sctoals
BLOT 1 hayss-Binet WISC IA
Word M.E.-aniA
AlabamaTennesseeNorth Carolina
.69(74)n ,r,,,
-c"JP IL *)./_19(74)
.94(74)
I .61(40I .32(73)
.94(74)
.62(40)
.70(74)
Pn,-.agr.-ph Ysanina
Alabama .73(75) 1 .88 :75) x i7=1%,--.
Tennessee .71(67) .82(66) .84(64)
North Carolina .51(110) .90(110) .81(109)
ST...=11img
Alabama .70(74) .80(74) .82(74)
Tennessee .40(45) .42(45) .30(45)
North Carolina .41(110) .75(1:0) .70(109)
Arithmetic ReasoningAlabama .75(75) .88(75) .91(75)
Arithmetic Camr.utation
North Carolina .55(109) .81(109) . .79(108)
Arithmetic ConceDts
North Carolina .60(110) .84a10) .78(109)
Arithmetic 11,-- lication
North Carolina .60(89) r .76189) .83(88)
* Ns in parentheses.
TABLE 2.352BProduct-Moment Correlations between Learning AptitudeMeasures and Stanford Achievement Test Results for the
Southern Schools Combined
Wd.Eean.Par.Mean.SpellingAr.Comp.Ar.Conc.Ar.Appl.Ar.Reas.
ages 9-11N 1 2 3 4 5
39 55 72 84 76 8442 58 76 84 81 8430 35 80 75 80 7714 48 94 83 94 8414 50 95 88 95 88IL - - -
14 69 77 70 86 76
A es 12-13 Ages 14-16
N 1 2 3 4 5 N 1 2 3 4 5
61 54 84 82 84 81 79 53 86 83 86 83
63 60 87 82 87 82 135 59 81 76 82 77
55 63 70 67 74 72 132 32 56 49 57 49
27 61 73 69 75 72 67 58 80 72 80 73
31 58 86 77 86 78 91 59 76 68 76 70
23 66 88 86 89 87 61 59 81 74 82 76
20 72 84 86 87 88 34 76 84 83 88 88
Decimals omitted.Zero order correlations: 1-BLAT; 2-Hayes-Binet; 3-WISC.
Mul'ziple correlations: 4-BLAT and Hayes-Binet; 5-BLAT and WISC.
72
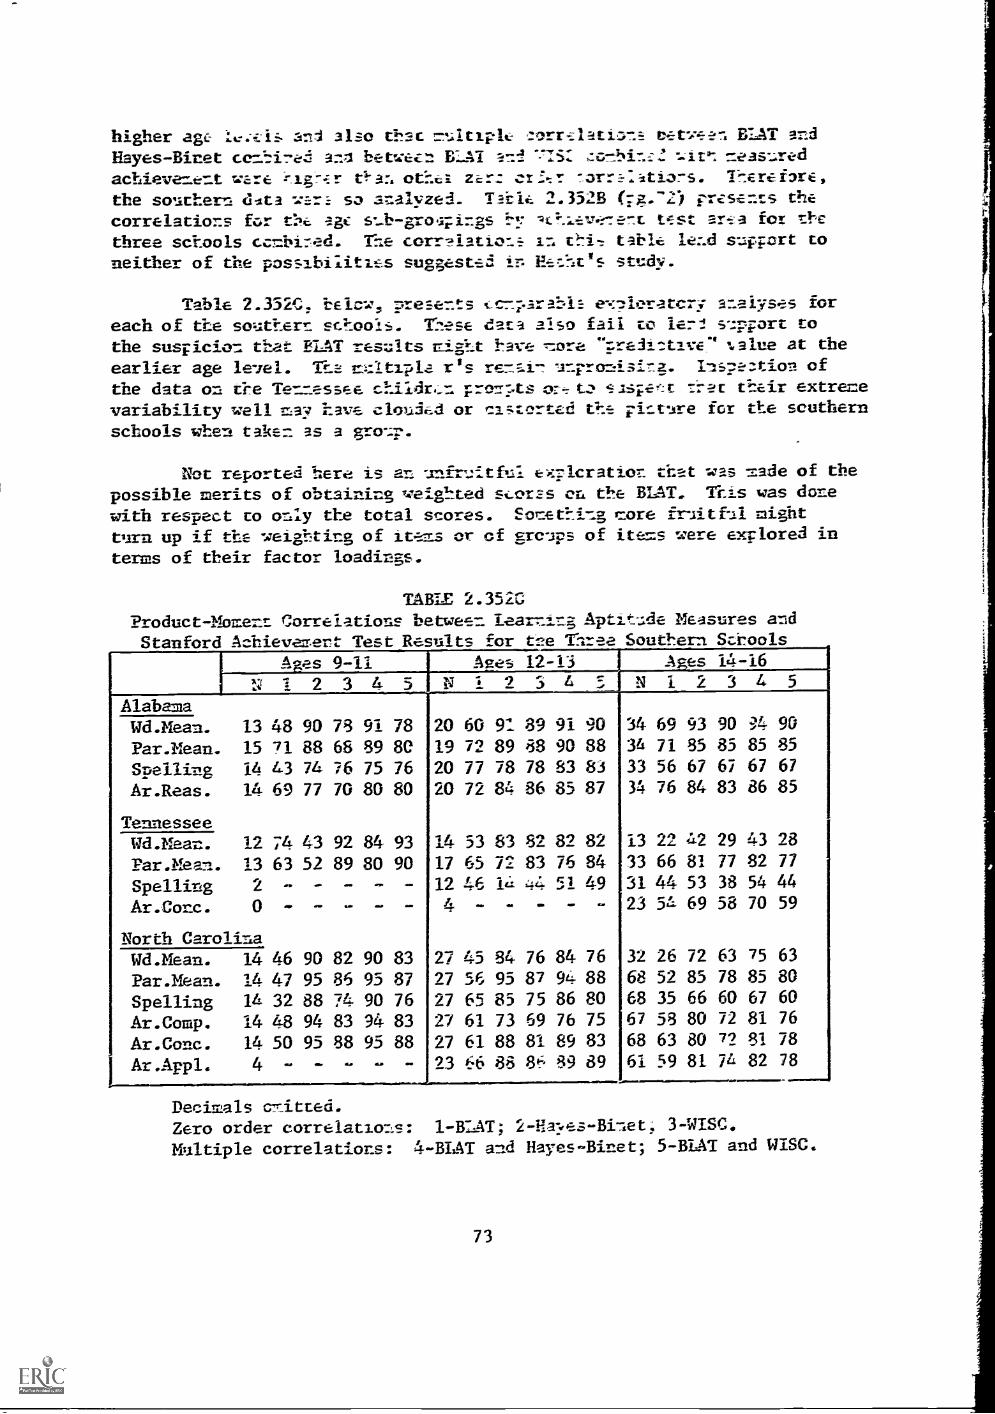
higher age anJ also that multi...plc. zorrelati,-;ns tetween BIT and
Hayes -Biret cem`1717e::: anl between EL :VI and meas-..red
achievement ware i_ig-7-.Er &an othes zer: erltr 7_3rr:,:ati3 rs. Therefore,
the so' there d.Ata wari sa analyzed. Tatle 2.352B (;g.-2) presents the
correlations fur t agc ltkleve-le7t test area for the
three schools combi:ed. The corr?iatior_s in 0.7it, table lend supFort to
neither of the possibilities suggeste3 study.
Table 2.3520. below, presents t_c-77.3rabls e-.711eratcri analyses for
each of the southern schools. These data also fail E0 le-71 s-.TFort to
the susricion that BIT reszlts right have core "-LreJi:..tive" ..alue at the
earlier age le-fel. T r's re -:i^ -Inrrorzisi7z. Laspez.tion of
the data on the Tennessee clildr,n cron-?ts =rat their extreme
variability well may have olotided or ci,;;Lorted the pit..t.ltre for the scuthern
schools when taken as a gro-.T.
Not reported here is an unfrl.:itful exl-lcratior that was made of thepossible merits of obtaining weigl-_ted si...er2s ea the BLAT. This was done
with respect to only the total scores. Eocething core fr-litful might
turn up if the weighting of its or of sre-ips of items were exTlored in
terms of their factor loadings.
TABLE 2.352CProduct-Moment Correlations between 'earning Aptitude Measures andStanford Achievezert Test Results for tee Three Southern Sci-,00ls
Ages 9-11 Ages 12-13 Ages 14-16
N 1 2 3 & 5 N 1 9 3 11 S N 1 2 3 4 5
AlabamaWd.Mean. 13 48 90 73 91 78 20 60 91 89 91 90 34 69 93 90 34 90
Par.Mean. 15 71 88 68 89 80 19 72 89 88 90 88 34 71 85 85 85 85
Spelling 14 43 74 76 75 76 20 77 78 78 83 83 33 56 67 67 67 67
Ar.Reas. 14 69 77 70 80 80 20 72 84 86 85 87 34 76 84 83 86 85
TennesseeWd.Mean. 12 74 43 92 84 93 3.4 53 83 82 82 82 13 22 412 29 43 28
Par.Mean. 13 63 52 89 80 90 17 65 72 83 76 84 33 66 81 77 82 77
Spelling 2 - - - 12 46 lil 44 51 49 31 44 53 38 54 44
Ar.Conc. 0 - - - - 4 - - - - - 23 5 69 58 70 59
North CarolinaWd.Mean. 14 46 90 82 90 83 27 45 84 76 84 76 32 26 72 63 75 63
Par.Mean. 14 47 95 86 95 87 27 56 95 87 94 88 68 52 85 78 85 80
Spelling 14 32 88 74 90 76 27 65 85 75 86 80 68 35 66 60 67 60
Ar.Comp. 14 48 94 83 94 83 27 61 73 69 76 75 67 53 80 72 81 76
Ar.Conc. 14 50 95 88 95 88 27 61 88 81 89 83 68 63 80 72 81 78
Ar.Appl. 4 -- - - - - 23 66 88 8} 89 89 61 59 81 711 82 78
Decimals clitted.Zero order correlations: 1-B1AT; 2-Hayes-Bi--Let, 3-WISC.
Multiple correlations: 4-BLAT and Hayes-Binet; 5 -SLAT and WISC.
73
3. -1=A,7"2
Starti=ng in 19.:.5 -it: a
aptitudss of blind sn:-si=r 4_7,e
that geterally in -.:se wit rssi-.;,zt to
was hegu,. 03 this idini ;_sr-:-gthis conviction was Ole :,f
should he involved. sire -- :t
But a larvar factor ina growing concerr that -ildran
had worked clinically, tendad tonot had as nurturant ar a:c;lt::ration,a result, they failed of
lying most extant proce2;r.asacculturation was s-ufficic;nt4 ,_cr;ar
the result of such measursme-A acce;-t
C.
,-.77;1
- at :cast t-ose.7:!=
as -i2 srtan to s'atisfy ar
to that of 7:
Ft:
t l:arn.
t frtn.cork
;fr
& A C7....
of :ril:reh. Asasspt:on
that t.eir:A _ i i dream t: -ake
While it :light be Tros nearly -:-.:stc!iary to ;:rafess solernly :ere
that work on BLAT was initiated an.2 Firs -.:rd tts ta.:is of a single line
of coldly reasoned al:d firmly adhered-to. fcr7ally-state3 premice=,was not the case with CIPe development of BIAT. Interestingly, factor
of the prasumed iiporta-7.:e, if Lot Oor_inace. af t%e c%ta--,eo:is-ki-eseretic
input of informatIon was verbalized strongly :21,ring tne early years and
creasingly with time, is actual r:ractice (tne things ierce.we2 as
necessary to do and tl:e steis take:. in t%e lielt of tnat
the dominance of 0-_c ides of a de..-iant a::_uitaration in so 7.7.2ary blird
children becare aloparsnt. WI-at was done fig.:red more prominently than
what was said.
Fro= the very first, it was derided that ti.as sa7i7ling of C-elearning attitude of blind chilorea; t i1 should t.lp %cn-dertional experi-ential background as little as possible, (2) s!-43L.d is Clrough the sel-se
of touch, (3) should avoid damar,ding sensory discrimi=lation as fine asthat reeled in the reading of braille, ard (4) s%aull rot evoke nispo-F.seswhich would be dependent upon verbal competency. Tehtin this str1:-;cure_
there was an a priori c.o7mit.-71s7it to a Spsarman-type cone;.-tualization of
intelligence.
Fran a pool of sone 350 items w-ich had beer -_:seth in tine tescine
of "intelligence" of the sighted. tlus a few created for this 1.-_r.1.-ose, a
pool of 94 possible test item -s as selected ard embossed, after t---e
manner in which braillai reading material 13 rrepared. 0- the basis of
the responses of some 500 edncationally blind c!-Aldrea. aged 5 to 19,to these items in residential and day schools in five midwester.-a states.a residual pool of 49 test items and 12 training items was winnowed.Further response data were obtained from blind childre,-- in two westcoast, two east coast, and three southern states. The total of the
responses of 961 fincticnally bard children in the 12 states constitutethe normative data for BLAT. All BLAT testing was done individually bypersons who had been trained for 0-at purpose ty the author.
Background inforzaticn o- -:.oliected at de tire: of
testing, indicate both that tte socio-s.:oromic distribution 'i 07:11rer
74
reasonably well appr,Amate:, that for the 1:_" ctte,=. eee white-
non-white distrin.etio_, 1:7,, in sn y.erz.11 1,ite ." *'44.1t-
for the Unite.' Stat,-s oit7eztz: y a: it
non-southern ncr.--z'nites;, end tnet tht: rkprccr;--rtz-t-T-n is -1:st
adequate.
Since t"ne Hayes-Einet and Wechsler Intelligence Stale :XISC) Vertal
tests ware implicitly challenged as adversely sensitive to the accultura-
tion of blind children, any attempt at vaiidatinz ELAT zonourrently against
either of them was avoided. Similarly avoided as criterion were teacher
judgments of learning capacity and acadenic performance, these being re-
garded as potentially contaminated. Ti-_r efere, the pres=ed construct
validity accompanied by discrimination a:ross age -.:as take, as validating
evidence. This discriminaticn is not as "sharp" between successive age
levels as might be desired, generally no greater than the standard error
of measurement, but compares favorably with that of the Raven Progressive
Matrices. (it is interesting to note that both BLAT and the Raven are un-
tied tests.) ELAT, like the Raven, tends to lose in discrininating power
above age 12.
Internal consistency is reflected by a Kuder- Ric'ardson (14) r of
.934. Test-retest reliability over a seven-month interval by seven inex-
perienced graduate student retesters yielded an r of .865.
Within ti-e total standardization population BLAT scores correlated
.74 (N-663) with the Hayes-Binet mental ages and with WISC Verbal ages
(computed by means of the Verbal. IQ) .71 (N-522). However, Hayes-Binet
results and WISC results on the 420 of these children on whom both scores
were available correlated .89 (N-420). in the group from the three
southern states, where all of the testing was done at the same times by
the same, or comparably qualified, persons, the correlationa were essen-
tially the same: .75 (. 7-335); .73 (N-320): and .91 (N-317) respectively.
Although it is believed that a bias existed in the selection of the
southern school children who were given the Stanford Achievement Test, the
fact that BLAT raw scores tended consistently to correlate somewhat lower
with the results obtained on the different parts of that test than did
either Hayes-Binet mental ages or WISC Verbal test ages is taken, along
with the pattern of correlations just reported, as suggesting that BLAT,
while measuring some facet of learning aptitude in common with the two
other tests tars something else that may be psychoeducationally valuable.
No analyses were made in terms of IQs or learning quotients, since they
are less meaningful educationally. or were analyses made in terms of
"total educational achievement" because more potentially valuable infor-
mation can be obtained in considering the differing kinds of psychological
demands made by the different subtests - for instance, spelling as con-
trasted with reading comprehension, or arithmetic reasoning vs. arithmetic
computation. The achievement test data were regarded as inadequate to
warrant the exploration of race or sex differences.
In case anyone may wish to make his own analyses of the data used
in this study, a full set of the raw data can be obtained from the author.
75
Ee renal :s, a:,1, foli
punched.
Research direct,:d to-,ard or C -ctivt: often 77.:-S yi,id is
peripheral to the original focus of tce undertaking So7etimes &let
peripheral yield has greater conceptualization value than t'.7e anticipate:,
outcone of the research undertaken. Se:eh, it is believei, was trui: in this
case. After not more than five yearc' tzark 07 BLAT, it wen discovered that
BLAT tended to lose its discriminative power at or near Cne 12-year level.
This was not the result of a "ceiling effect" resulting from a lirited
number of items. This led to a change in t1-.e way in which the results of
"intelligence" testing were perceived. In fact. this event in effect
precipitated a verbalization and structuring of what !-,ad been an intuitive
clinical practice on the part of the author as he had been assessing the
learning capability of differing kinds of cildren whose backgroun6.s had
been deviant, particularly in the cognitive area. (Mese experiences, now
seen in retrospect, had been heavily influential in prcmpting this work on
BLAT.)
Comparison of the behaviors sampled by BLAT with those sampled by
other "intelligence" tests resulted in a realization that the behavior
sampling involved in many "intelligence' tests - particularly those
early in the field, had been done in terms of the early-stated principle
that one measured achievement and inferred from that achievement an attending
capacity to achieve. This necessitated, of course, the assumption of
comparable acculturation on the parts of those so tested and evaluated. The
more this achievement played a part in such testing instruments the later
(in age) did scores on them tend to "peak". Yet there were tests, BLAT and
the Raven for instance, which peaked much earlier. These two tests
differed from most earlier ones with respect to the kinds of behavior
sampled. Achievement, in the grosser sense, played no part, or a very
small part, in the discriminative power of such tests. Rather, these
tests sampled the fundamental psychological processes which made possible
the "achievement" sampled in the majority of tests. BLAT was, then, per-
ceived as sampling at the process end of a "process-product" continuum
along which various "intelligence" tests could be placed. This is relat-
able, for instance, to Cattell's "fluid-crystallized" general abilities
continuum, or dichotomy, to Spearman's "g" (essentially 'process" in the
terminology employed here), or to the author's perception of Guilford's
"operations ".
The perception of BLAT in terms of its sampling a "process", rather
than a "product" kind of behavior, makes the results of this research more
understandable than if BLAT were regarded as just another "intelligence"
test. The correlation between BLAT results and those on the Hayes -Bidet
and WISC Verbal suggests that they have considerable in common, yet not so
much as the latter two have between them, since the Hayes-Binet and WISC
Verbal consist of a mixture of samplings of process and product. The fact
that the racial differences on BLAT are smaller than those in the cases of
the Hayes-Binet and the WISC Verbal can suggest that racial differences in
76
ecculturetio-a ar, =or
the case of FLAT
CaSt-S at thal in
While the rest:lts of this researc% threw n3 seeeific light on the
"utter, the s'.i,; ieien is strongly tl-e a-s'te't that BLAT sEn be
found by subsetient research to be 2 mar, valueolt, instrurne,.:t to -..se on
young blind children entering cducatioral programs then the Hayes-
Binet or the WISC Verbal, althoug. it may well lose its descriptive orpredictive value later for eLose sa=e children. Te.le fast that young blind
children enter education:4i programs frcr higi-Ay divergent, and often
disadvantaged, acculturanion beckgrounds wo-qd see= to nale pare=cunt thesampling of process rather than of product.
It is well, then, to regard BLAT et this energing stage as an ex-perimentel or prelininary device whose possible values and limitations
are yet to be more definitely ascertained.
4. FURTHER RESEARCH POSSIBILITIES
As is true with so much research, the work on BLAT raised .ore
questions than it provided answers. The emergence of a perception oftested "intelligence" in terms of process and product results in theraising of questions on the descriptive or predictive value of theseaspects of learning aptitude in regard to all children, not just the
blind. This is the focus of some doctoral research now under way, andwill not be dealt with here. The questions and curiosities presentedbelow for the most part pertain to BLAT and the bliad, The list is by no
means exhaustive.
4.1 School Entrance
What are the relative predictive values of BLAT and other tests oflearning aptitude when children are tested at the time of entrance intoeducational programs? As contrasted with testings at later ages? Would
combining BIAT restlts with those of Hayes-Liner or the WISC Verbal providea better predictive basis at entrance than the use of any of them singly?
The finding of no enhanced multiple correlations in these data throws noclear light on this question. What are the relative predictive values ofthe first-earned scores and the retest scores on BLAT at time of entrance?
4.2 Training
What effect, if any, on performance on BLAT would prior training intactual discrimination have when two-dimensional and three-dimensional
materials are used? To what extent is the use of the training items for
each series of items desirable? Psychologically? Statistically?
4.3 Discrimination
There would be merit in working toward a sharper discrimination in
scores between age levels. Is greater discrimination possible without
77

the rise of tht; zrkater :Istrii73ti,- be feurd inthe case of nft.;:st rcs-L:t3 es .:o.7.tra
extent, if ar.y, o.:16 3 :17A tZSt fcti-C117i:13 limitson each item) -1.cntrfk;te to stnsr7.et T3 w7aat .--xtent, ifany, would a weigl-ti7g of ef.i of :11-.7s 0- basis oftheir factor Icaii.nrs en'7a7ie
Although 0!t rotatia: of t!-.-1 eleme7ts was rejected in thedevelop :Lent of E'._ T, t-_ere 7:_sy be 7erit :1 e_ep:cring e:is facet coresystematically. Pota4.icn on bat': tkt x 3-1 f o..:11 seem to msritspecific considerazior.
4.5 Nurturanse of RCgrSSiOT.Y
The general inrease it retest scores over initial test scores onBLAT aroused curiosity as to wl_etr.'zr this tren6 was due to the psychometricphenomenon of regression or tie possible effect of the learning whichoccurred in the first testing, which wo-.ild be a plausible psychologicalphenomenon. Info-.a1 analyses of as score changes provided a basis fordoubting the adequacy of regression as an explanaticn. This should bechecked -more systanatically. Could it be that the psyc!lometric phenomenonof regrEssior -might ht more applicable 1.7, terms of product than in terms ofprocess?
4.6 Young No:441-1.ite Subjects
The deart%of --.cr-w*-__ite subjects below the chronological age of 7was noted. While this probably reflects an important social conditionwhich could have significant educational implicatiors, there is need formore information on yo:inger non-white subjects. particularly as regardsBLAT, Hayes-Biaet, a%d WI :3C Verbal results.
4.7 Saturation AalYievement Testing
The fact of a biased sampling of the children who took theStanford Achievement Test has been indicated. What is badly needed is atesting of all the children, at least from the chronological age of 9 up,using both learning apiitz:de and achievement tests.
4.8 Educational Expectancy
We just don't knew what amounts of learning aptitude in blindchildren are needed for Clem to have a reasonable chance for success atdifferent grade or age levels ir different academic subjects. To thisend the analysis of ti s results of a saturation testing, perhaps even ina given school that ilas a large enough number of children, could be veryhelpful educationally.
78
4.9 Periodicity in "Mental" Development
Inspection of the mean scores 3t successive ages for tte threeneasures of learning aptitude suggests the possibility that there is aperiodicity in 'growth' reflected by them. This in narticularly truewith respect to BI T, there being suggestions of "plateaus' at the 112-12, 14-142i, and 15-16 year levels. A parallel periodicity is suggestedin the Mayes -Binet mental age data, and sore' hat less so in regard to theWISC Verbal test ages (=erhaps due in part to the manner in which theywere obtained). Psychometrists tend to work for "straigl:t line" data.They may thus be covering up, or washing out. evidence of there bairgdiscernible stages in the growth of learning aptitude. The presence ofsuch stages, if identified, would be in harmony with a large body ofdevelopmental data that have been on the record since the work byS. A. Courtis in the 1930's.
79
5. BIBLIOGRAPifY
Abel, G. The educational achievement of 5th and 6th grade blind
children. CM thesis abstract) ThB Teachers Forum. 1938,
10 (5), 109-110.
Allen, R. M., & Katz, E. A method of selectiig Stanford-Binetintelligence scale items for evaluatltg the mental abilities
of children severely handicapped by cerebral palsy.
Cerebral Palsy Review, 1956, 1, 13-17.
Anastasi, A. Psychology, psychologists, and psychological testing.
American Psychologist, 1967, 22 (4), 297-306.
Anderson, R. P. Raven progressive matrices for presentation to the
blind. Report of Vocational Rehabilitation Administration,
RD-670, 1964.
Bond, N. J., & Dearborn, W. F. The auditory memory and tactual
sensibility of the blind. Journal of Educational Psychology.
1917, 8 (1), 21-26.
Buros, 0, K. The sixth mental measurements yearbook..
Higland Park, New Jersey: The Gryphon Press, 1965, pp. 541-2.
Cattell, R. B. Theory of fluid and crystallized intelligence.
Journal of Educational Psychology. 1965, 54 (1), 1-22.
Dauterman, W. L., Shapiro, Bernice, & Suinn, R. M. Performance tests
of intelligence for the blind reviewed. The International
Journal for the Education of the Blind. Vol. XVII, No. 1,
October, 1967, pp. 8-16.
Davis, C. J. The standardization of the Perkins-Binet tests of
intelligence. Report of Vocational Rehabilitation Adminis-
tration, RD-898, (current).
Drummond, W. B. Binet's mental tests and their application to the
blind. The Teacher of the Blind. Vol. III, #1, pp. 3-7,
January, 1915.
Drummond, W. B. A Binet scale for the blind and a provisional point
scale for the blind. Monograph from the Edinburgh Medical
Journal, Vol. 24, 1920.
Fortner, E. N. A group intelligence test from braille. The Teachers
Forum. 1939, 11 (3), 53-56.
Gilbert, J. & Rubin, E. Evaluating the intellect of blind children.
The New Outlook for the Blind. 1965, 5, 9, 7, 238-40.
80
Guilford, J. e. ,.117 Neu, Yark.
Mcr;ra-..:-Iii1:, 1967.
Haines, T. H. A point scale for tte mental measurement of the blind.
Journal of Educational fsyctology. Vol. 711, No. 3,
March, 1916.
Haines, T. H. M.ental reasIgrements of the blind. Psychological
Monograph. Vol. 21, No. 1 (Whole No. 89), April, 1916.
Haines, T. H. Report of new cases and more reliable age norms ofintelligence by the point scale for the blind. Journal of
Educational Psychology. 1919, 10 (3), 165-167.
Hayes, S. P. Standard tests in elementary subjects in schools for
the blind. Proceedings: 24th Biennial Convention,American Association of Instructors of the Blind. 1918, 42-54.
Hayes, S. P. Mental and educational survey in seven schools for the
blind. Proceedings of the American Association of Instructors
for the Blind, 1920.
Hayes, S. P. Self-scoring in schools for the blind. (A manual for
the guidance of teachers) Overbrook, Fe -ma.: Pennsylvania
Institution for the Instruction of the Blind. No. 2, 1921.
Hayes, S. P. Adaptation of the Binet tests for the blind.
Mt. Holyoke College, 1923.
Hayes, S. P. Ten years of psychological research in schools for
the blind. Overbrook, Penna.: Pennsylvania Institution
for the Instruction of the Blind, No. 4, 1927.
Hayes, S. P. The new revision of the Binet intelligence test for the
blind. The Teachers Forum, 1929, 2 (2), 2-4.
Hayes, S. F. Termans condensed guide for the Stanford revision of
the Binet-Simon tests. Adapted for use with the blind,
Perkins Publication No. 4, 193nr.
Hayes, S. P. Factors influencing the school success of the blind.
The Teachers Forum. 1934. 6 (5),91-98.
Hayes, S. P. How to handle test results - a plea for wider use of
group tests. The Teachers Forum. 1935, 7 (5), 82-85.
Hayes, S. P. The memory
Forum. 1936, 8
Hayes, S. P. The memory
Forum. 1936, 8
of blind children. (Part I) The Teachers
(3), 55-59.
of blind children. (Part II) The Teachers
(3), 71-74.
81
Hayes, S. P. The measurement of educatioral at;lievt.m..,t in schools forthe blind. ft Teachtrs Foru=.
Hayes, S. P. What do blind children know"11 (2), 22-28.
1937. 9 (5). 82-90.
Teachers Forum. 1938,
Hayes, S. P. Practice hints for testers. The Teachers Forum. 1938,11 (5), 82-93.
Hayes, S. P. Standard graduation exams for elene:Itary schools: Adaptedfor use in schools for the blind. The Teacl-ers Forum. 1939,12 (2), 22-31.
Hayes, S. P. Alternative scales for the mental measurement of thevisually handicapped. Outlook. Vol. 36, No. 4, October, 1942.
Hayes, S. P. A second test scale for the mental reasurement of thevisually handicapped. Outlook. Vol. 37, No. 2, February, 1943.
Hayes, S. P. Measuring the intelligence of the blind. In Zahl, F. A.(Ed.), Blindness. Princeton, N. J.: Princeton UniversityPress, 1950.
Hecht, P. J., & Newland, T. E. Learning potential and learningachievement of educationally blind third-eighth graders in aresidential school. The International Journal for theEducation of the Blind. December, 1965, pp. 1-6.
Hopkins, K. D., & McGuire, L. Mental measurement of the blind, thevalidity of the Wechsler intelligence scale for children.International fournal for Education of the Blind, 1966, XV,3, 65-73.
Hopkins, K. D.. & McGuire, L. I.Q. constancy and the blind child.International Journal for the Education of the Blind,Vol. XVL, No. 4, May, 1967.
Horn, J. L., & Cattell, R. B. Age differences in fluidandcrystallized intelligence. Acta Psychologica, 1967, 26,107-129.
Irwin, R. B., & Goddard, H. H. 4daptation of the Binet-Simon tests.Vineland, N. J.: 1914.
Irwin, R. B. A Binet scale for the blinzl. Outlook for the Blind,Vol. VIII, No. 3, Autumn, 1914.
Knotts, J. R., & Miles, W. R. The maze-learning ability of blind com-pared with sighted children. Journal of Genetic Psychology.1929, 36 (1), 21-50.
82
Rohs, S. C. Thd EtSt. iroceedings ofWest F to Blind
\c k: A-eric.a7
Foun3atio: re: 1963.
McNemar, Q. The rt,visio,- th . Boston:
Merry, F. A st.rve7 of r7". a;.:7111t of in sixresidential ccr,oa!,-, for th, 1111-.2. Ind Ieacerc Sc-um,1931, 3 0), 12-l!:.
Merry, R. V. To w- -=t ca-n iy.1 LiAli.Jren reL:gr_ize tactually,
simple e:11-"tossd The Tea:ners Fo.t-...s. 1930. 3 (1),
2-5.
Merry, R. V. & Merry. F. K. The finger raze as a su?plemencary testof intellignr.,.- for bli:d children. :o.:rnal of Genetic
Psychology, ..)34, 'a= . 227-230.
Newland, T. E. The learning aptit-..le test. In Re7ort ofProceedings of Research Needs in Braille. New York: AmericanFoundation/ for the Blind, Inc., 1961, 14. &C -51.
Newland, T. E. Predictions and evall.ation of academic learning byblind clildren: I - Problems and 1.rocedures in prediction.
Inter,-atior_al :curnal for the Edi:carion of the Blind, 1964;
14, 1-7.
Newland, T. E. Predizilorsami eval,;ation of acath-mic learning by blind
children: 11 - EroblerIls and T....ra:.eures in evall:ation.
International Jo-.1rnai for the EL:cation of the Blind, 1964,
14, 42-51.
Pearson, M. A. EstatitshInent of school and college ability test normsfor blind chiLire-A in grades 4, 5. and 6. CDoctoral disserta-tion, University of Oklahoma) 1962.
Pintner, Rudolph, & Paterson, D. G. A scale ofifEl2rmance tests.New York: r. Appletoz. & Co., 1925, 218 p.
Rankin, R. 3. The 077.waki-Kohs tactile blo:.k design intelligence test.
(Rev.) :Journal of Educational Measu-feirent
Vol. 4, No. 4, Winter, 1967, :57. 26i2.
Rich, C. C. The validity of am adaptation of Ra7en's progressi.!matrices test for use with blind children. (Doctoral
dissertatioz., Texas Technologi:al College), 1963.
83
Rich, C. C., Anacrscn, R. P. A tactual for of the progressives
matrices for ust with blind children. Personnel cnd Guldacct,
Journal, 1965, 43 (9), 912-919. (Reprinted in Arerican
Foundation for the Blind Research Bulletin, No. 15, January,
1968, pp. 49-60.)
Sargent, R. T. The Otis classification test, form A, part II. tAdar,ted
for use with the blind) The Teachers Forum, 1931, 4 (2),
30-33.
Tillman, EL H. The performance of blind and sighted children on the
Wechsler intelligence scale for children: Study 1. International
Journal for the Education of the Blind, Vol. X71, o. 3,
March, 1967.
Tillman, N. H. The performance of blind and sighted children on the
Wechsler intelligence scale for children: Study II.
International Journal for the Education of the Blind, Vol. XVI,
No. 4, May, 1967.
Wattron, V. B. A suggested performance test of intelligence.
New Outlook, Vol. 50, 114, April, 1956.
Wechsler, D. The measurement of intelligence. Baltimore: Williams &
Wilkins, 1939, page 138.
Williams, N. Williams intelligence test for children with defective
Vision. University of Birmingham, England, 1956.
1
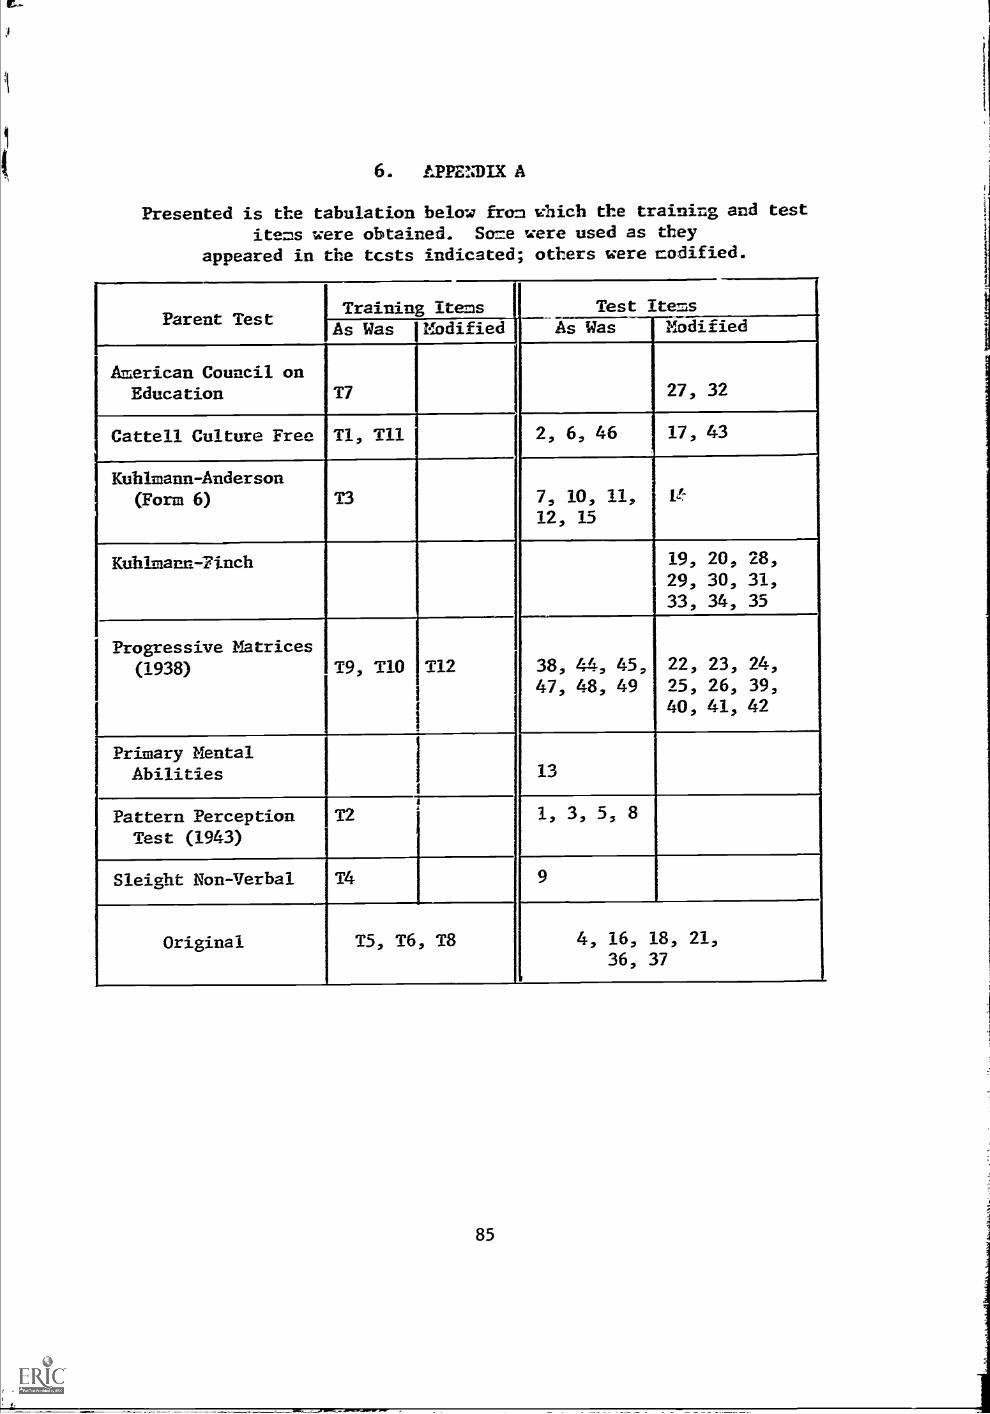
I
6. LPPENDIX A
Presented is the tabulation below from which the training and testitems were obtained. Soce were used as they
appeared in the tcsts indicated; others were codified.
Parent TestTraining Items Items
As Was Modified Was Modified
American Council onEducation T7 27, 32
Cattell Culture Free Ti, T11 2, 6, 46 17, 43
Kuhlmann-Anderson(Form 6) T3 7,
12,
10,
15
11, V.
Kuhlmann- Finch 19,
29,
33,
20,
30,
34,
28,
31,
35
Progressive Matrices(1938) T9, T10 T12 38,
47,
44, 45,48, 49
22,
25,
40,
23,
26,
41,
24,
39,
42
Primary MentalAbilities 13
Pattern PerceptionTest (1943)
T2 1, 3, 5,
Sleight Non-Verbal T4
Original T5, T6, T8 4, 16, 18, 21,36, 37

Ir
CD
. V17./ Cr H. t< H
(D 5(0(0
0 Cl) ti a Pr,rr ;X N CPT' A) *a rt et
:1,1o 11 10 H. a)0 C)) CL rr H.c") cf)A) N 1--/ *1 H.U) /I H. rt. u)H. ft) r0 ID H..
00
1J to rtW 1_1' rt Ni
)-4 ,rt fr, M1-41 (D (')
fat rt rtAr #-I
H fuu UI 1-3f
H, H. (1)Ht rt. H*
14 ' 0ft) 0
4 rt (DH. 1:14
(I)I I 0t,
trJ H.o I- to rt 1H,
A) cort () i>a r.
(0. Q i Iter ett
rrr'S' rr t-I.
'-`14 th01 (I)
rtti(1)
00v.{
Orr
hhrr(0rt
1
CL
1-1)
Cl'
ti
(.
; 10..)
11Ii
rtrirt
C)O
c Cf.)
..f/ C)O Mtr.(1 111H. 00 rt.
.e4
!.1H. airt rrO 11)
0 14N
0,z..)
1-
r 1LH CO
ri)o ..;Q'1
111
to(1)
1.1
09 rt 0H. Iv ri wrt (1) IV 0 rt
0 Hf0 (4)
. fDrt 2 H.a) 13 ,lat
LI 1.... (D 1.-1 CL9 H. 0 14. 1.1 a) '.0.1 fIl
1:1 co rt 0 :..1
Prt PC:1 r. ..... r, 0rt 0 0 13 -"< C H.
t
0 H. ert01) rt
0 I i rt ft Cu. 1/4.1
(0 ',el i-t '4'.41 (0CD H. 0 H 0 In rrCa, al p," t.i ii. C o r.i. rr0 CD m ...1 " I fD 111
rr 9 (0 to to H.0 V: rt W. re 1.11 "I
11 Cr 0 rt 0 11 I r la. VIrt rr ID tu 1.31 0 0 )1.1 M rttle ts* 4-.: (t) M Cl) 1 1--,(t) PI 0 .. ui 'C.i. CL t-I
(D et 0 at 11
../) (1) 11" : ri re t.-.. ft.
naN (rto(DI
'-'4' 1, c`i,' a) rIDI) Pct.' 1_, *I' !:I0 t-0 0 1» 11 -. rt 0 0 H,..:1 H. ti u) 1--1 U) 0 ,,.1
ca.. 0 Cl' (n pr )00 H 0 0
rt. chPi a) II
4.
hil rt at 1. t11 1',.t' rt. rr
a) 01 '41 0 rt rt. el. (0 (0H. 0 H. 11 1.10 ) 1!..1 't1 H. ti 0 (0 1';'' 1.1. 1--,1HJ,
Cl)ch rt W' uta, rt, g H
fA(A) U1 11. Ci 0
IA* rt rt Cl e--, ri. ° 0 CI5I-h 01.1 CI" M (I' 0 0) 1-4:
rt h' a, I-- 1.... rt(I) 04 H. H (V t.-' ('1`. 11' rtI-1 - 1-h 111.1 U) ri 0 ri (t) 0
HI o n) 0 m coID es a, I. ( x Li n) ic).)
I I t r4. f",' Cl 4
H) OP CI rt I (rt A) to'1 tx) Hi s..0. (-t $.;
4) ri .1 M Ix% ,-- r''4*1 11 A) re 0 '11 # '
C.' l'. n) on :X 0 1--0 o !.; a) al a) rt mri ri p-i.It M ,:, 0 0 cm kii) 09(0 M rt t..: 11 CD V;rt ft, al rt 0 1.1 T. ''rt. (t. l''''' 16:1 C: (r. 0.
ri H )-i 0. H. etz Pi H-11 t.1' HI 1:1 at 1.3
1-, o(DA) tID PD I tto /*I
1-11 n) r)
0 rt ):: H. Cl. et t't'' ri to.!:$ 0 ;7' 11 (D H, 0
'..1 CL rt It U cl,-A. K' rd. ;IA 34Cl) (0 rt C) (I) n 01 rt. ID
tia) ::):' 0) V n riA) rt 0 W.. rt Cu1-r. (1) 11, 1..1 H. ,--.
(n II) 0 (l)O
616
''I'
U)
H.in
c's
a,rt0;.1
H.1:1
H.rt(1)Elci)
(1)
(1)
'1'
rc
tL
Ct
ro
fit
I-'
to.
0t
(0
Orh
et
C)
It)
0)
ro
roI
(1,I
rt.
et.
roft,
0f
rt
to
(1')
H 4) H'0rt
H. 1:1 HCL
M ro0 II 0et fa
H.0 CD .-9 0 H.CI 0 ICACl.
V.0
H. 1'1 to0
CO
U) 1.1
I:3 A)-a
tr (1) A h.,h
11ct 09 u.i
H. l`tC1 trI ft)
fY .4 IN 1-r-
Cl0' .
tH. to
rt.t1 'rt")Ieu
(It (to to r
4) r" .' ;H'ir) ha 0c't 1
H. Ot4 et)1'1
01) .., .1'
11
1. t
ri
.
C1 w
;
11
.
00 PI 0 k;it1.
(1: (0 tilt rt(V .1 (c
rt t/1fu 0 et
A prat
14.rt rt.
(f) 0,I 1"
0 et 0,rtis
(11
O rt0 mu)
rot
Pi1-1. Pi
rt i":34 (15
MV
Cr14
tH'
CD0 C
F
H.tt
IN Li0
Cr0
to
rr
ro
0
(DrtcL
CI) 11) ra) .(:) Cr rid 11rr tr MI 0 vu
. Cl.' 0 I... en M"M 0 asC 11 rt jrt orSQ
1.-1 0(19 tort
Cr' (t1 1(ft
NCl) 0 HrtI U)rt (I)al C.
1.3 0 '41 0IN) fat ftt et1
0 Pi t'trt 01 111 (t.oftl )1.1, 0 :rti.
Pr! j .1.r e
!Cr!
ert of 01ci
rfjo
rt H. M
' LLCD (1)
(D : '91Ii 1.1
I
K'Oft% WA 01101-bCl,-'(0 0 01 it
117 W. rit0H1 ti
I.1 rt(11 rt tit.'r
(t'
,
rt rt.
0PIN
H1.1.1 It in
I'd 4;fat 11el 0Q
psi(t) rtC 0 (1rt
Ort01 10
0 (0r40
r.fn
C) , ;-kl, ft '1 0 On,0 rt 1
ft LL Itqtr. U) t.t.ii LI,:
O lit it 00 LiCl' 11 .1 etIt' rt m od (.4a) o k;
..,.41)
;S 11 ht. 1 t" P4rt a H,1 ; I' r.:
ID !r ftr, I tr1 r/irt' .. f i 1.
H' Cl' to :. ' t
A' I I .-",
1... ert),
Ptr.t.)
0t .
Inti ' "C 1 I I".(I' (sr ) LI I : '
i. Oti(II I.' %If r I
1 et P. Pt
4,)r::4: 1-4:41:1, :j9t:.t3/4')' ,°J.t :* r'il::
, I 4 i ay
4.4 4 ;I: 't
tia GC 1
I. 1 ' 't1 'V)44) 11 7 ,,t vi.itl rt. (t, C) 'It,fa, c ;.: ,,. 4,
ort v1111.4 fre, l'i re
"Cl'
fbrt elM l Ch
(C
VrW.
141.-1 ..(1) 00 (la: Ch..r)
O Pi0
103
A"(t.
n rr.(1) (1)
(11) Prifu
rt1-o P."0 ID
a, 0 rfbtLi nca.
I rri %^.
%),.!
)1
t0
"t7
C)
ri,C.61 r"
, rt,:5
(5'
to
C/ tr'1
(9
es.
; 1
C'
(1)rt tr.)ft ;34
Ira cra)
rt7' LP (0
r1))t 0wI (1;to
v.IV)
ti
Y
C.)
Cr
fo. ro...,. 0 et 5 I. 1,11, t' CD
iU J U. '1(C' #1
'. If.1 ri, : 1 ve 14. Co
'
frit: 1"11 '1Pal (Ti,: 0I'llf:1:[:,' :;:: t: it
'' km4.
).611 et r
#... Of) #° 0 t.:'11 th . f (/: 1444 el'
4, 0 11) ),', trilu1fILra 1. il ..% A13 rt tio
#11 ' , I W. 0 W. #1,
*t.till III:41 #111.!/11 .1 I r: 1111 t.171 :: I'
#: 1 ' a,, 1 rt rt; C.4 I I'
11 IIr et
0 tt, ft f k, t..,et , 5 51 .t t Ir. ret f(' II # 1
44
1l'
0ill II r,,I IIJ
, 14,
ft,th
; I' ft
O f.Ca
t't 1
(k, (I,Cl
lii ;1it n.
r11
t
L.'11 'Vfb
it
rt1"
It,
ts,
0
I 0
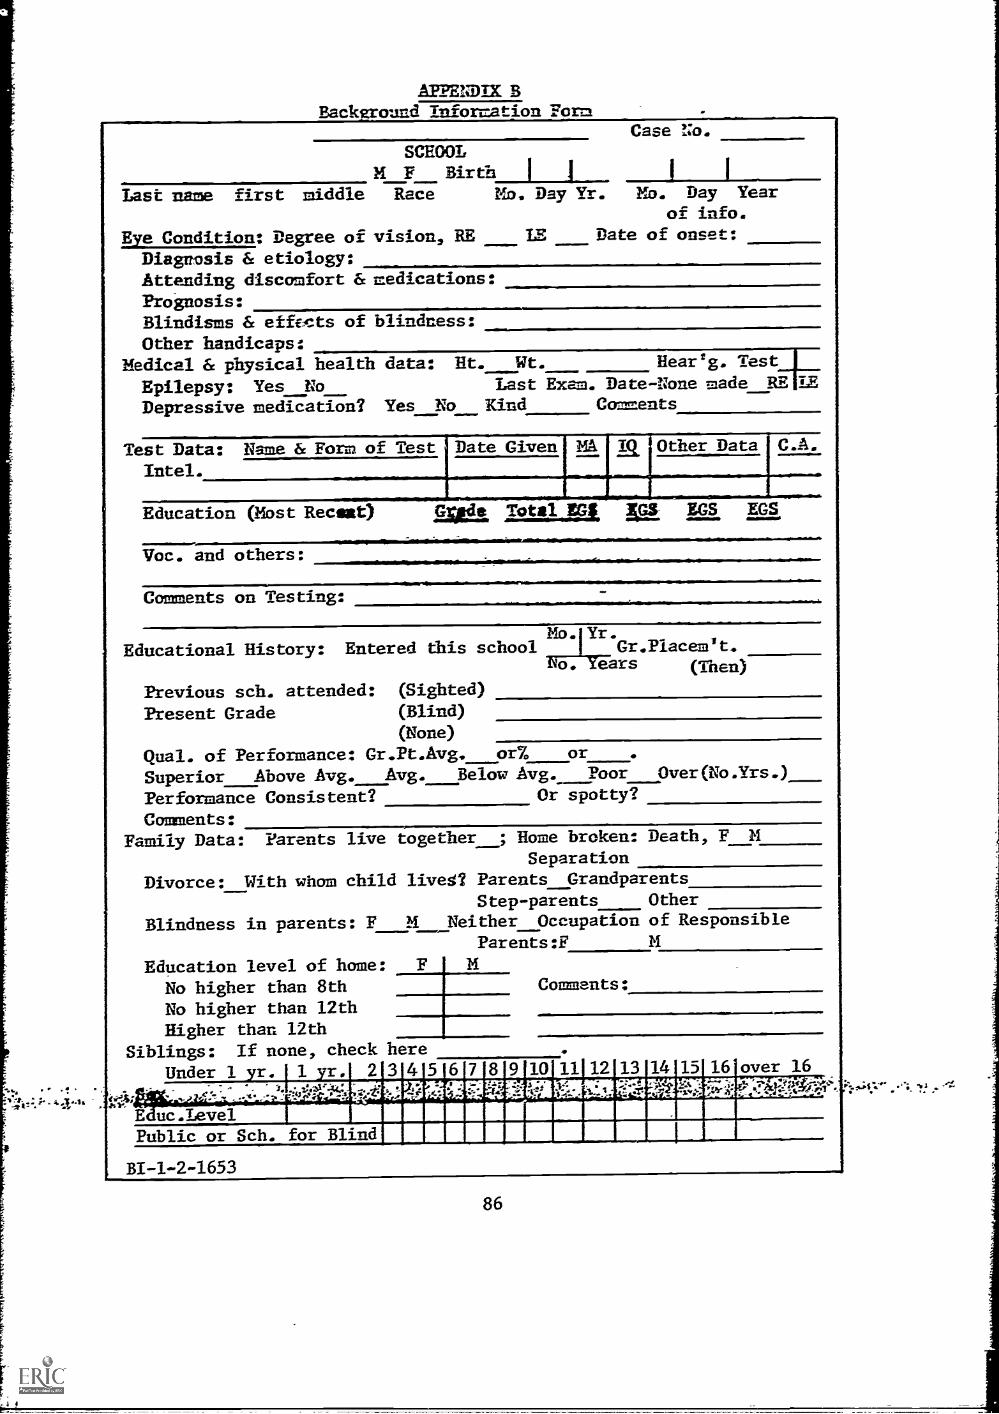
' '4.1.1.4*
APPENDIX BBackground Information Form
Case No.SCHOOLF Birth I I I I
Last name first middle Race MD, Day Yr. MD. Day Yearof info.
Eye Condition: Degree of vision, RE LE Date of onset:
Diagnosis & etiology:Attending discomfort & medications:Prognosis:Blindisms & efff-cts of blindness:
Other handicaps:Medical & physical health data: Ht. Wt. Hear'g. Test
Epilepsy: Yes No Last Exam. Date-None made RE LE
Depressive medication? Yes No Kind Comments
st Data: Name & Form of Test Date Given M 1g Other Data C.A.
Intel. .
Education (Most Recent)
Voc. and others:
limoi Total WS, Ja EGS EGS*111111mr...mrComments on Testing:
Mo.1Yr.Educational History: Entered this school 1 Gr.Placemit.
No. Years (Then)
Previous sch. attended: (Sighted)
Present Grade (Blind)
(None)
Quaff. of Performance: Gr.Pt.Avg. orb, or
Superior Above Avg. Avg. Below Avg. Poor Over(No.Yrs.)
Performance Consistent? Or spotty?
Comments:Family Data: Parents live together ; Home broken: Death, F M
Separation
Divorce: With whom child live? Parents Grandparents
Step-parents Other
Blindness in parents: F M Neither Occupation of Responsible
Education level of home:No higher than 8thNo higher than 12thHigher than 12th
Siblings: If none, check here
Parents:F
P HComments:
Under 1 yr. 1 yr. 2 3 4 5 6 7 8 9 10 11 12 13 14 15 16'over 16
'*7. itglPYlii!1... ,cam t. . . e.z3:44':9 s ,...1
-.s. ---; - 7.7: : If. ;: -.L i',1*U:t, ;7'; iN,S}
E uc.IevelPublic or Sch. for Blind 1
BI-1-2-1653
86
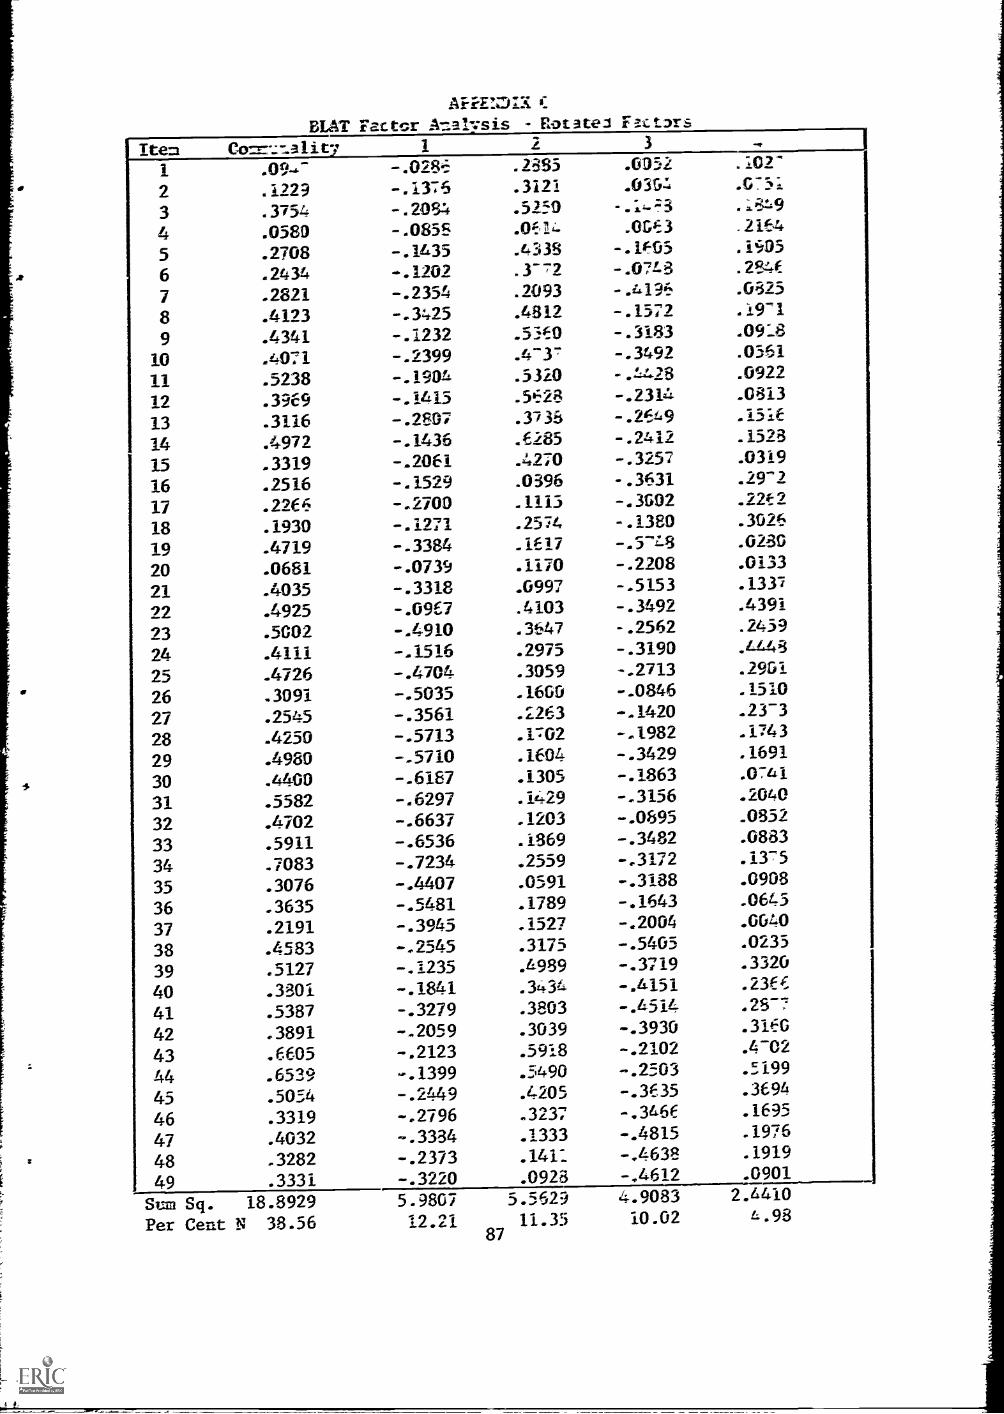
86"7 OT/7°Z 1060 6161"
9L61"
g691"
/69E" 661g"
7,0_/*
0:24E"
14EZ"
W££° MO" 0/00'
5790" 8060'
c_ET" CHO" Zc80'
010?"
Tr7i0"
1691'
OLT' E_CZ"
OIST"
Z0'01 1806"i7
ZI9/- 8E9/"- gI8/°- 39/E"-
g0E"- COgZ"- ZOIZ"- OE6E"-
IIC17.-
ISTir- 61LE"- g0/S"- /00Z"-
E99I"- 89TE"- ZLIE"- Z97E"- S680"- 9SIE"- E98I"- 6ZVE"- Z861"- OZ/I"- mo-- EILZ"-
LO
r-Z9=-"g
9Z60"
ZI/1"
CU' LEZE"
SOZ/.
0617g"
816g" 6E0E'
CORE"
686v"
gLIE"
LZSI" 68L1'
16S0'
6ccr 6981"
EOZT" 6Z+71."
SOET"
1091° ZO:A"
E9Z17,-
091' 6g0E"
TrZ1 LOWS OZZE"- ELEZ"- VEEE"- 96LZ"- 6//Z"- 66ET"- EZIZ"- 6gOZ"- 6LZE"- TV8I"- gEZT"- ci7gZ"-
gi76E"-
I8Vg"- L0/9"- VEZL"- 91g9"- LE99"- L6Z9P-
L8I9"- OIL5"- EILS"- I9SE"- gEOg"- VOL/"-
9g'8E N 6Z68"81
TnaD aaa -bs mns
IEEE"
Z8ZE"
ZEO/' 6IEE"
i7S0g°
61g9"
099" 168E"
L8Eg"
108E'
L/7ZT
161Z"
gE9E"
9LOE"
180:1"
1165'
ZOLV"
ucc- 00V47'
086r OcZ,"
ctcZ' I60£*
8'i
LV 9V
VV EV ZV IV Of7
61 81
LE
91 gE
VE EE 11 IE OE
6Z OZ £1 9Z
9ZLY SZ
EV77. 06TE"- cL6Z. 9IgT"- YEW VZ
6c47Z' Z9gZ"- L/9E" OT61"- Z005.- EZ
I6E/" Z6VE"- EOT/' L360"- SZ6r ZZ
LETT' Egig"- L660" OTEE"- c£01' TZ
EEIO" 80ZZ"- WTI" 6ELO"- 1890' OZ
ORO' 87-g-- /I'M" VOEE-- 61L9' 61
;ZOE" 08EI"- 7igZ" ILZI"- 016I" 81
Z4ZZ" ZOSE"- cIIT" OOLZ"- 99ZZ" LT
ZAZ" 1191"- 96E0' 6ZgI"- 91gr 91
6TEO" LSZE"- 0:247" I9OZ"- 6TEE" ST
EZ51= ZIZ"- SOT3' 9EIT"- ZL6I" /I
679Z"- SE'S" LOSZ"- 9/1E" £1
ET80- tflEr- ez9s- 517I"- 696E" ZI
ZZ60" Z77"- 0?fS" 706I"- SEZS" TT
T9c0' Z6/E"- 66EZ"- 01
9760" E8TE"- 03=5" ZEZI"- 1/0" 6
1_6T" ZISTe- ZISI" SZE"- EZTV" 8
SnO" ii6I,-- E6OZ' IgEr- TZ8Z" L
3478Z' 8/L0"- ZOZT"- /E/Z" 9
SOT' gO41"- SEE7" SE/1"- BOLT S
f7912' CSO' 771';0" SS80"- 0850' f-
6r*7' GgZS" t8OZ- tcAu
!SA" 7SEO" IVA" 91ET"- 6ZZI'
ZOT' ?SOO" SSEZ' i:-.8Z0"-
7 can _/C 7E r CalE STS:4E-V ICP3723
XIC:713-1%7
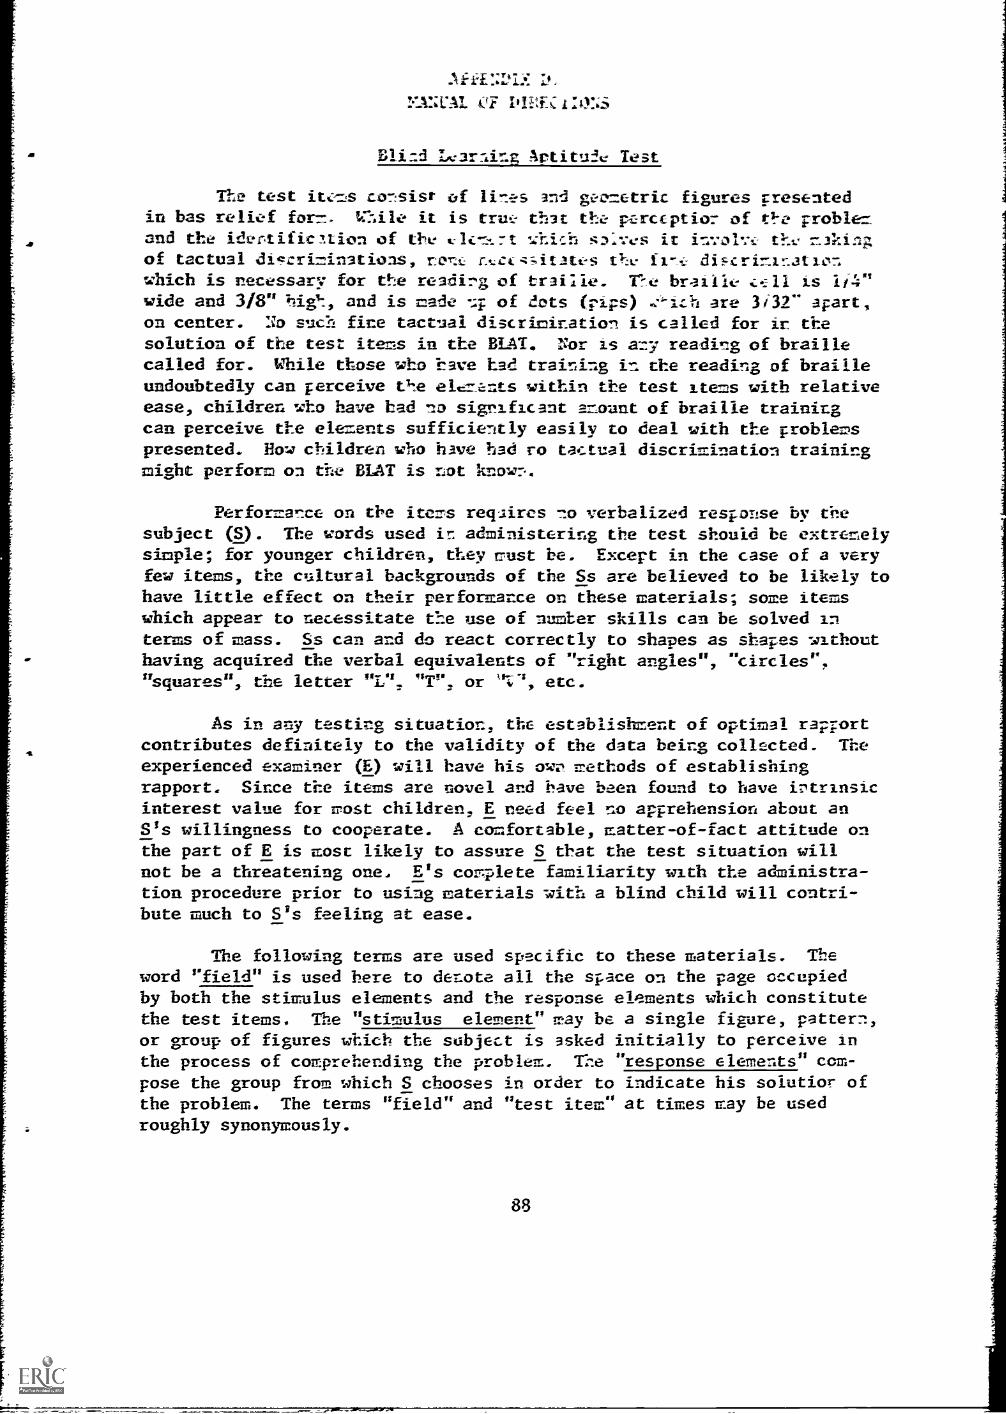
D.
YlNCAL CF
Blind Lear:-,ing Aptitude Test
The test its consist of lines and geometric figures presentedin bas relief form. W:Ale it is true. that the perception of It37e problemand the identificltion of the vlen.:!.7t snlves it involv thv makingof tactual diccrininations, none, nece-q--;itates lei fin.e diFcriminationwhich is necessary for the reading of traille. *re braille is i/4"wide and 3/8" hie., and is made -.4 of dots (pips) .,"-ich are 3i32- apart,on center. No such fine tactual discrimination is called for it thesolution of the test items in the BLAT. Nor is any reading of braillecalled for. While those who have had training in the reading of brailleundoubtedly can perceive tie elenents within the test items with relativeease, children who have had no significant _mount of braille trainingcan perceive the elements sufficiently easily to deal with the problemspresented. How children who have had to tactual discrimination trainingmight perform on the BLAT is not known.
Performance on the items regaires no verbalized response by thesubject (9. The words used in administering the test should be extremelysimple; for younger children, they oust be. Except in the case of a veryfew items, the cultural backgrounds of the Ss are believed to be likely tohave little effect on their performance on these materials; some itemswhich appear to necessitate the use of number skills can be solved interms of mass. Ss can and do react correctly to shapes as shapes withouthaving acquired the verbal equivalents of "right angles", "circles","squares ", the letter "L" "T". or etc.
As in any testing situation, the establishment of optimal rapportcontributes definitely to the validity of the data being collected. Theexperienced examiner (E) will have his own methods of establishingrapport. Since the items are novel and have been found to have intrinsicinterest value for most children, E need feel no apprehension about anS's willingness to cooperate. A comfortable, matter-of-fact attitude onthe part of E is most likely to assure S that the test situation willnot be a threatening one. E's corplete familiarity with the administra-tion procedure prior to using materials with a blind child will contri-bute much to S's feeling at ease.
The following terms are used specific to these materials. The
word "field" is used here to denote all the space on the page occupiedby both the stimulus elements and the response elements which constitutethe test items. The "stimulus element" may be a single figure, pattern,or group of figures which the subject is asked initially to perceive inthe process of comprehending the problem. The "response elements" com-pose the group from which S chooses in order to indicate his solution- ofthe problem. The terms "field" and "test item" at times may be usedroughly synonymously.
88
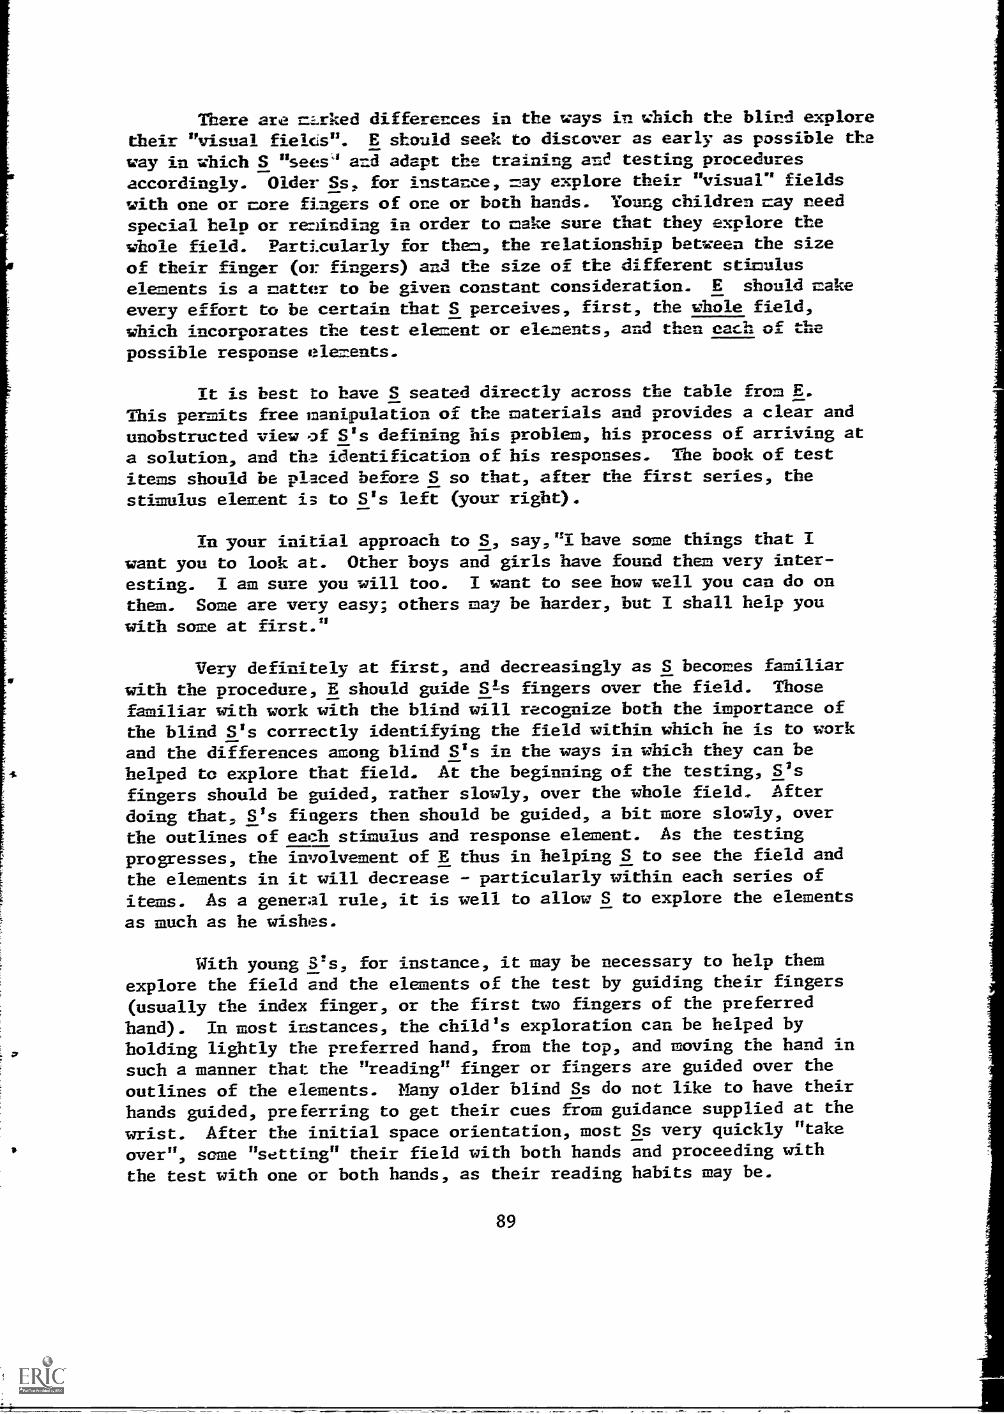
There are =.rked differences in the nays in which the blind explore
their "visual fields ". E should seek to discover as early as possible the
way in which S "sees' and adapt the training ane testing procedures
accordingly. Older Ss, for instance, =ay explore their "visual" fields
with one or core fingers of one or both hands. Young children may need
special help or riinding in order to cake sure gilt they explore the
whole field. Particularly for them, the relationship between the sizeof their finger (or fingers) and the size of the different stimuluselements is a matter to be given constant consideration. E should cake
every effort to be certain that S perceives, first, the whole field,
which incorporates the test element or elements, and than each of the
possible response elements.
It is best to have S seated directly across the table from E.This permits free manipulation of the materials and provides a clear and
unobstructed view of S's defining his problem, his process of arriving at
a solution, and tha identification of his responses. The book of test
items should be placed before S so that, after the first series, the
stimulus element is to S2s left (your right).
In your initial approach to S, say,"Ihave some things that Iwant you to look at. Other boys and girls have found them very inter-
esting. I am sure you will too. I want to see how well you can do on
them. Some are very easy; others may be harder, but I shall help you
with some at first."
Very definitely at first, and decreasingly as S becomes familiarwith the procedure, E should guide Sts fingers over the field. Those
familiar with work with the blind will recognize both the importance ofthe blind S's correctly identifying the field within which he is to workand the differences among blind S's in the ways in which they can be
helped to explore that field. At the beginning of the testing, S's
fingers should be guided, rather slowly, over the whole field. After
doing that, S's fingers then should be guided, a bit more slowly, overthe outlines of each stimulus and response element. As the testing
progresses, the involvement of E thus in helping S to see the field and
the elements in it will decrease - particularly within each series of
items. As a general rule, it is well to allow S to explore the elements
as much as he wishes.
With young S's, for instance, it may be necessary to help themexplore the field and the elements of the test by guiding their fingers
(usually the index finger, or the first two fingers of the preferred
hand). In most instances, the child's exploration can be helped by
holding lightly the preferred hand, from the top, and moving the hand in
such a manner that the "reading" finger or fingers are guided over the
outlines of the elements. Many older blind Ss do not like to have their
hands guided, preferring to get their cues from guidance supplied at the
wrist. After the initial space orientation, most Ss very quickly "take
over", some "setting" their field with both hands and proceeding with
the test with one or both hands, as their reading habits may be.
89

Care should be taken to provide only as much help in getting
oriented as S actually needs, giving him every opportunity to do his
own exploring, yet making sure, particularly in the training stages,
that S overlooks no part of the items. Obviozisly, after S has started
on the test items, such help is not justified. Once in awhile, a reminder
may be in order such as, "Be sure to look at all of them. "" In such
instances, be sure not to make such a comment only when S fails an item
due to his not having examined the whole field.
E should adapt the direction for the later parts of the test in
terms of S's demonstrated ability to "set" his field and to identify and
examine the stimulus and response elements. With more capable and
usually older Ss, orientation at the beginning of a line of elements or
over a pattern of elements may suffice.
!o time limits are specified for the items. For the most part Ss
will arrive at item solutions in less than a minute. Generally, some
solution (correct or incorrect) will be forthcoming in not more than two
minutes. E will have to use his judgment in deciding how much to allow
S on items. It is doubtful if anything will be gained by allowing more
than three minutes on even a more difficult item. Occasionally, S may
indicate rather clearly by the ways) he is looking at an item that he
has pretty well arrived at a solution. In such instances, nonthreateningly
asking him the question, "Which one is correct?" will evoke a clear
response. In a very few instances, S may seem to have departed psycho-
logically from the testing situation. Here, such a query may serve the
purpose of bringing him back 'o the task at hand.
In the cases of a very few children, the total testing time may
be such that they are likely to become tired even though their interest
may appear to be continuing satisfactorily. E will do well to watch for
the need for a break in the work and will, if he deems it necessary,
allow for a brief resE period between two series of items. Experience
suggests that this more often occurs after item 21, although, with the
majority of children no break is necessary.
In the process of administering the items, E is asked to keep a
record of three things in the spaces provided on the response sheet:
1) Observations concerning the handedness of S, the quality or
manner of his response, fatiguability, frustration, and the like, are to
be recorded under "Examination behavior" near the top of the response
sheet.
Be sure to check as well as you can to see if there is any
evidence of lowered kinesthetic sensitivity. Absence of any observa-
tions here regarding this problem will be taken to mean that E had no
reason to assume the presence of any such condition in S. Early in
the school year, some children's fingers lose some sensitivity due to
play or work activity. If a diabetic condition is known or reported to
90
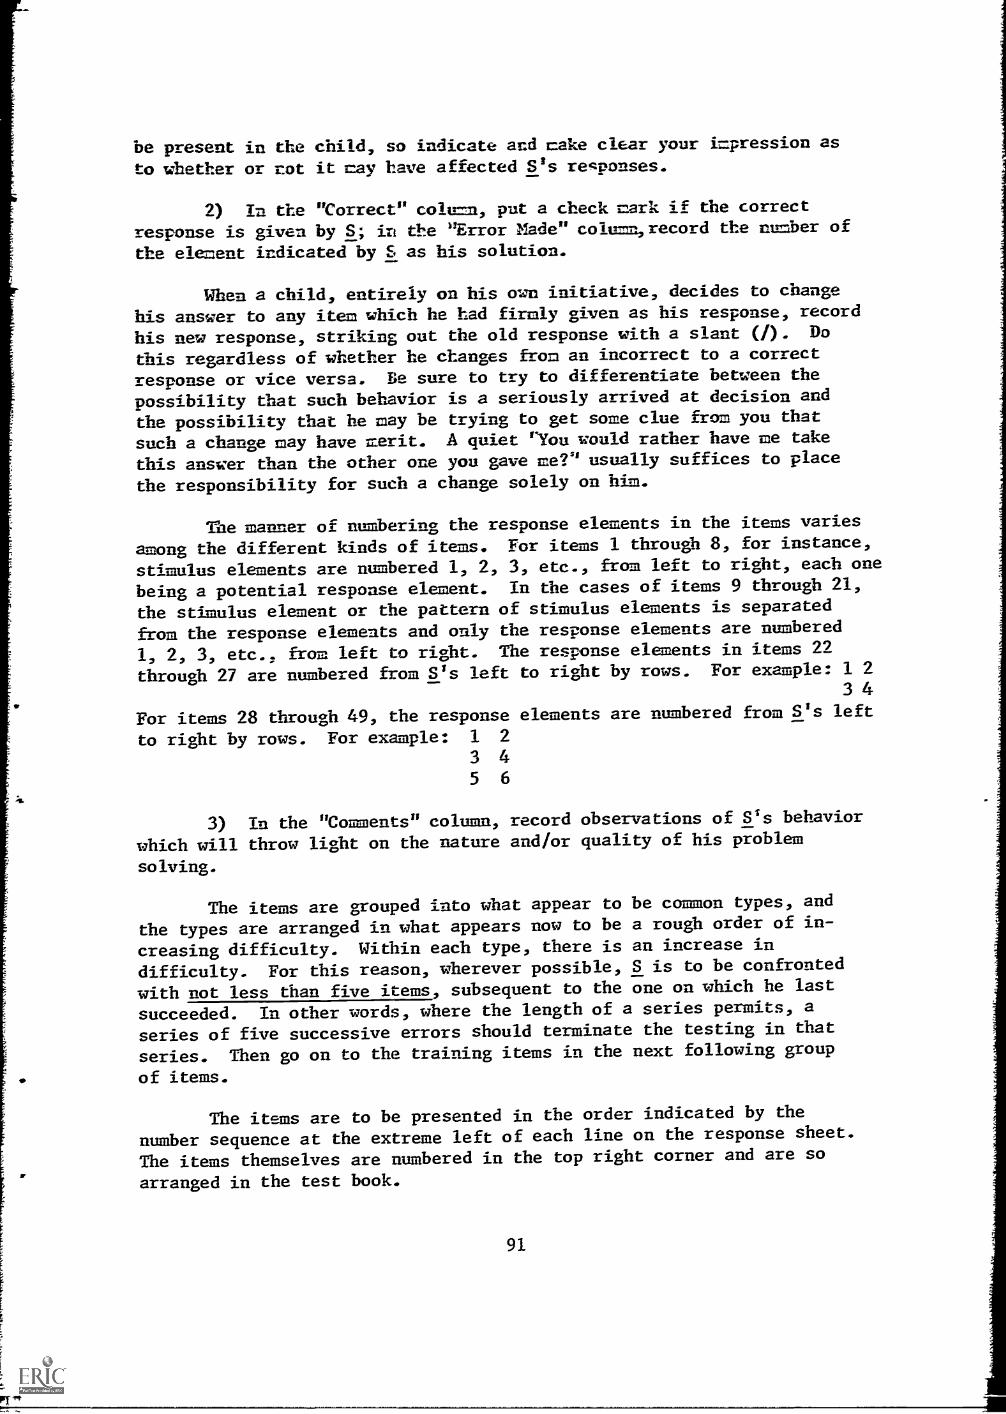
be present in the child, so indicate and make clear your impression as
to whether or not it may have affected S's responses.
2) In the "Correct" column, put a check mark if the correct
response is given by S; in the 'Error Made" columm,record the number of
the element indicated by S as his solution.
When a child, entirely on his own initiative, decides to change
his answer to any item which he had firmly given as his response, record
his new response, striking out the old response with a slant (/). Do
this regardless of whether he changes from an incorrect to a correct
response or vice versa. Be sure to try to differentiate between the
possibility that such behavior is a seriously arrived at decision and
the possibility that he may be trying to get some clue from you that
such a change may have merit. A quiet 'You would rather have me take
this answer than the other one you gave me?" usually suffices to place
the responsibility for such a change solely on him.
The manner of numbering the response elements in the items varies
among the different kinds of items. For items 1 through 8, for instance,
stimulus elements are numbered 1, 2, 3, etc., from left to right, each one
being a potential response element. In the cases of items 9 through 21,
the stimulus element or the pattern of stimulus elements is separated
from the response elements and only the response elements are numbered
1, 2, 3, etc., from left to right. The response elements in items 22
through 27 are numbered from S's left to right by rows. For example: 1 23 4
For items 28 through 49, the response elements are numbered from S's left
to right by rows. For example: 1 2
3 45 6
3) In the "Comments" column, record observations of S's behavior
which will throw light on the nature and/or quality of his problem
solving.
The items are grouped into what appear to be common types, and
the types are arranged in what appears now to be a rough order of in-
creasing difficulty. Within each type, there is an increase in
difficulty. For this reason, wherever possible, S is to be confronted
with not less than five items, subsequent to the one on which he last
succeeded. In other words, where the length of a series permits, a
series of five successive errors should terminate the testing in that
series. Then go on to the training items in the next following group
of items.
The items are to be presented in the order indicated by the
number sequence at the extreme left of each line on the response sheet.
The items themselves are numbered in the top right corner and are so
arranged in the test book.
91
I

The first V.:a items of each series are to be used as training
items. Assist S. if necessary, to find the correct response element and
to discover and state if he can, the correct reason for the choice of
the correct response element. Some cnildreo (as well as sore adults) can
"some" these witi-out being able to tell way. Such Ss are to be helped
in verbalizing their behavior. E should make every reasonable effort to
enable S to be trained to mastery on each training item. In helping Ss
to tell bow they came to rake the decision they did, watch your vocabulary.
It's better to say: Each gets bigger than the one before it," or "They
get bigger as you go across, don't they-:" than it is to say: "You mean
that the figures became proportionately larger as you progress from left
to right.' It is better to say (with a T figure), "Yes, this goes across
this way (guiding Cs finger), and this goes down." than to say: "It
looks like a T. doesn't it?" In some instances, you will need to be
satisfied with 'It's just like this one " (as S points to the correct
response element). Remember that this is not a test of verbal facility.
Take particular care, in the process of ascertaining how S solved any
training item, that your choice of words, tone of voice, or inflection
in no way threatens S.
It may be helpful, in evaluating the child's performance, if,
especially with respect to the training items in each group, you record
in the "Comments" column characterizations of his behavior. These would
be reflected in such notations as: "Trained O.K.," meaning he learned
quickly. "Trained slowly," meaning he required a bit of help to get the
correct ieea. "Trained with difficulty," meaning he needed much help
before he succeeded, even to the point of having to be told the answer
and the reason for it. "Did not comprehend," meaning that, in spite of
all help and a variety of explanations, he still failed to understand
the process involved. "Verbalized easily (clearly) or quickly" should
mean that:, on his own, S put his correct soIution(s) into understandable
statements. 'Unable to verbalize" would mean that S responded correctly
to items but couldn't tell why or how he arrived at the decision. If E
helps S to verbalize a correct solution. E should ask S to "Tell me insolution,
your own words why that is the correct answer.'
After the second training item in each series is completed,
introduce S CO the test items with the statement: "The rest in this
group are like the ones you have just finished, but you are to do them
by yourself (on your own). Do them in the same way you (we) have just
done them."
By the time S has completed the training items, the chances are
fairly high that he has learned to expect a fairly well-defined working
field to be in front of him. When he starts working on the items, be
sure to help him first to discover, especially at the beginning of a
test series, the size of the field in which the elements appear, as
well as to get some idea, for the different series, as to how the ele-
ments are placed on it.
92
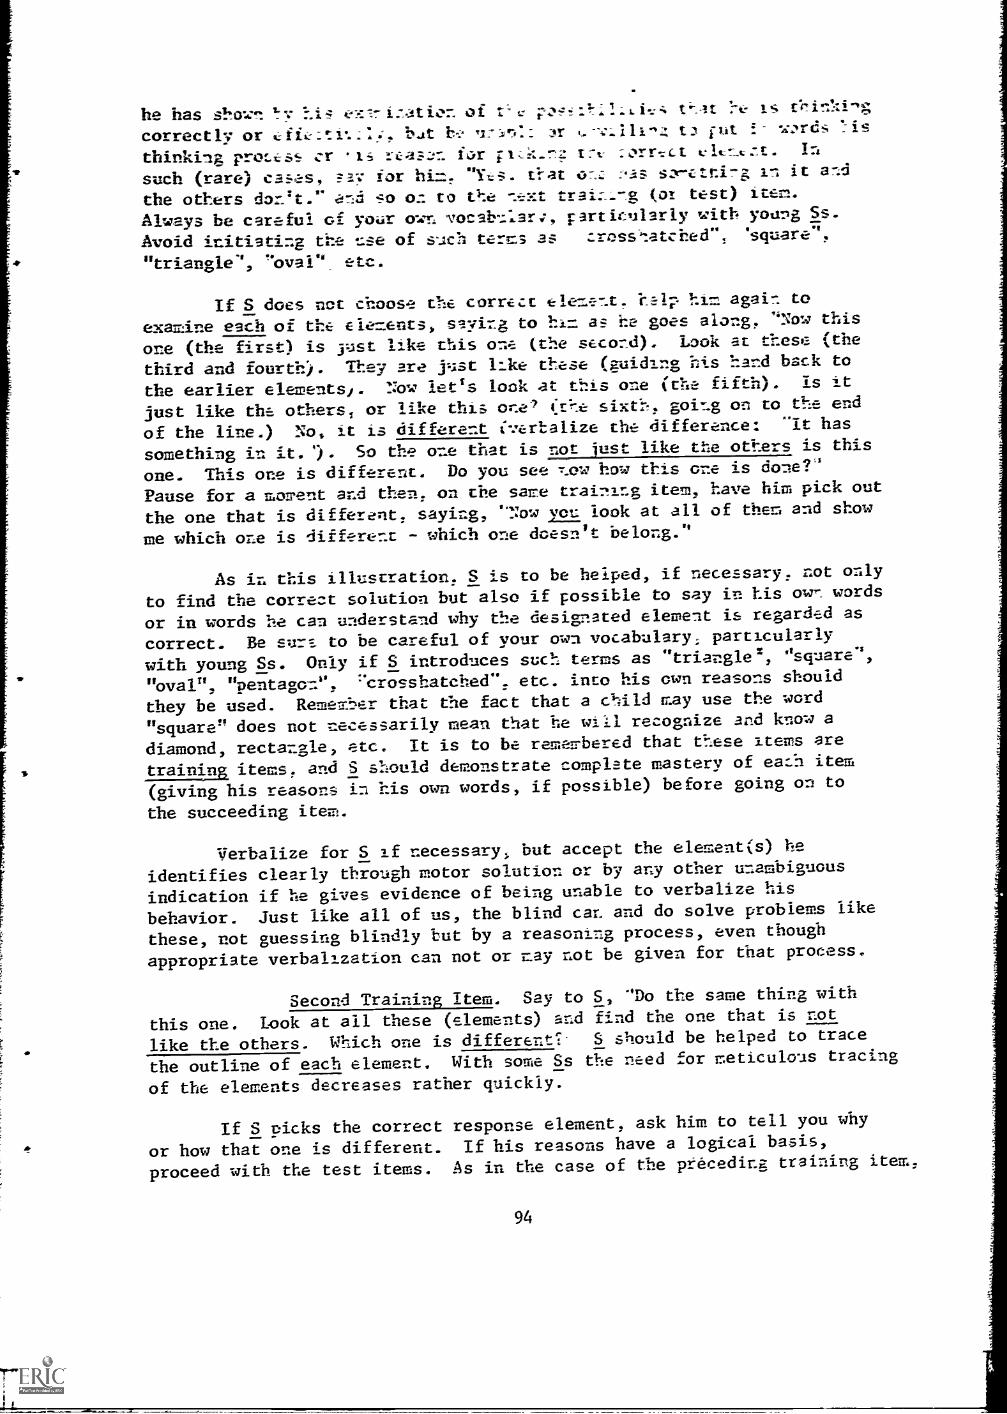
he has shown sv hi 4 s i :atio. of t- At is thinking
correctly or cut !- w,m-ds As
thinking pros 471- .is feas;;n fc,r :rrect elt:7_,:_t. In
such (rare) C3S-Z:S, FlIF =or hi=, "Yes. tat 07.,L szt-etti7g in it a:A
the others don't." and so oc to the ni,xt traig (o* test) item.
Always be careful of your on vocablar..7, particularly with young Ss.
Avoid initiating the use of such terns as crossnatched" 'square",
"triangle", "oval" etc.
If S does not choose the correct Eleme7.t, help hi= again to
examine each of the ele=ents, saying to hi= as he goes along, 'Now this
one (the first) is just like this one (the second). Look at these (the
third and fourth). They are just like these (guiding his hand beck to
the earlier elements'. Now let's look at this one (the fifth). Is it
just like the others, or like this or.e? (the sixth, gong on to the end
of the line.) No it is different (verbalize the difference: It has
something in it."). So the one that is not just like the others is this
one. This one is different. Do you see _ow how this one is done?'
Pause for a moTent and then, on the same training item, have him pick out
the one that is different, saying, 'Now you look at all of then and show
me which one is different - which one doesn't belong."
As in this illustration. S is to be helped, if necessary, not only
to find the correct solution but also if passible to say in his own words
or in words he can understand why the designated element is regarded as
correct. Be surs to be careful of your own vocabulary, particularly
with young Ss. Only if S introduces such terms as "triangle', 'square",
"oval", "pentagon", 'crosshatched", etc. into his own reasons should
they be used. Remember that the fact that a chdld may use the word
n square" does not necessarily mean that he will recognize and know a
diamond, rectangle, etc. It is to be remembered that these items are
traini items, and S should demonstrate complete mastery of each item
(giving his reasons in his own words, if possible) before going on to
the succeeding item.
Verbalize for S if necessary, but accept the element(s) he
identifies clearly through motor solution or by any other unambiguous
indication if he gives evidence of being unable to verbalize his
behavior. Just like all of us, the blind car. and do solve problems like
these, not guessing blindly but by a reasoning process, even though
appropriate verbalization can not or nay not be given for that process.
Second Training Item. Say to 5, "Do the same thing with
this one. Look at all these (elements) and find the one that is not
like the others. Which one is different' S should be helped to trace
the outline of each element. With some Ss the need for meticulous tracing
of the elements decreases rather quickly.
If S picks the correct response element, ask him to tell you why
or how that one is different. If his reasons have a logical basis,
proceed with the test items. As in the case of the preceding training item,
94

if he picks the correct response element, but does not give an adequatereason, help him verbalize his behavior as with the first training itemabove. If he does not pick the correct one, help him to locate thecorrect element and to discover the reason for its correctness. Asbefore, present him the item again I see if he has the idea.
After the training items in each series are completed, introduceS to the other items in the series with the statement: "The rest inthis group are like the ones you have just completed, Do them in thesame way you (we) have done them here." Occasionally, a youngster mayexpect help on the test items. If this occurs, tell him that he is todo "this group just the way we did the practice ones."
Test Items 9 through 15. Remember, in each training item, tocheck the reasons for S's choice of response and, if necessary, to trainfor mastery of the item.
First Training Item. Say, "The next one is a little bit
different. Let's look at it. Now, look at all of these. (Guide S's
hand to assist him in establishing his full visual field.) Now look at
this one over here. (Guide S's hand to the stimulus element - the oneat your right.) I want you to find one just like it among these overhere. (Guide S's hand carefully over each of the response elements.)Be sure to look at all of them (response elements) and find one justlike (or "exactly like") this one" (helping S look again at thestimulus element).
If S has difficulty with this training item, help him do it,saying, "Now look at this (the stimulus element). See, this goes downlike this (guiding S's finger down the vertical line). See, then it
goes across like this (guiding S's finger across on the line moving toyour left.) See it goes down and then over" (tracing the lines again).Remember that a blind child may not know what an "L" looks like. This
is especially true of young blind children, unless they have lost theirsight after knowing what printed letters look like. If an older, moresophisticated child initiates a comment to the effect that it is, orlooks like, an "L", capitalize on the observation and proceed accordingly.Proceed with the response elements essentially as follows: "Now in this
one (the first response element), it goes down like this (tracing one of
the crossing lines in the "X") and then it goes down here (tracing theother crossing line in the "X"), like this." Help S compare this responseelement with the stimulus element, directing his examination of theelements while saying, "This one (the first response element) looks likethis, but this one (the stimulus element) looks like this. But they
don't look alike. Now let's look at the next one and see if it is likethe first one we looked at. In this one (the next response element),it goes down like this and across like this." Compare this response
element with the stimulus element, helping S see that they are notalike. Proceed similarly with each of the other response elements,helping S compare each with the stimulus element. Come back to the
correct response element and help S see that (and how) they are alike.
95
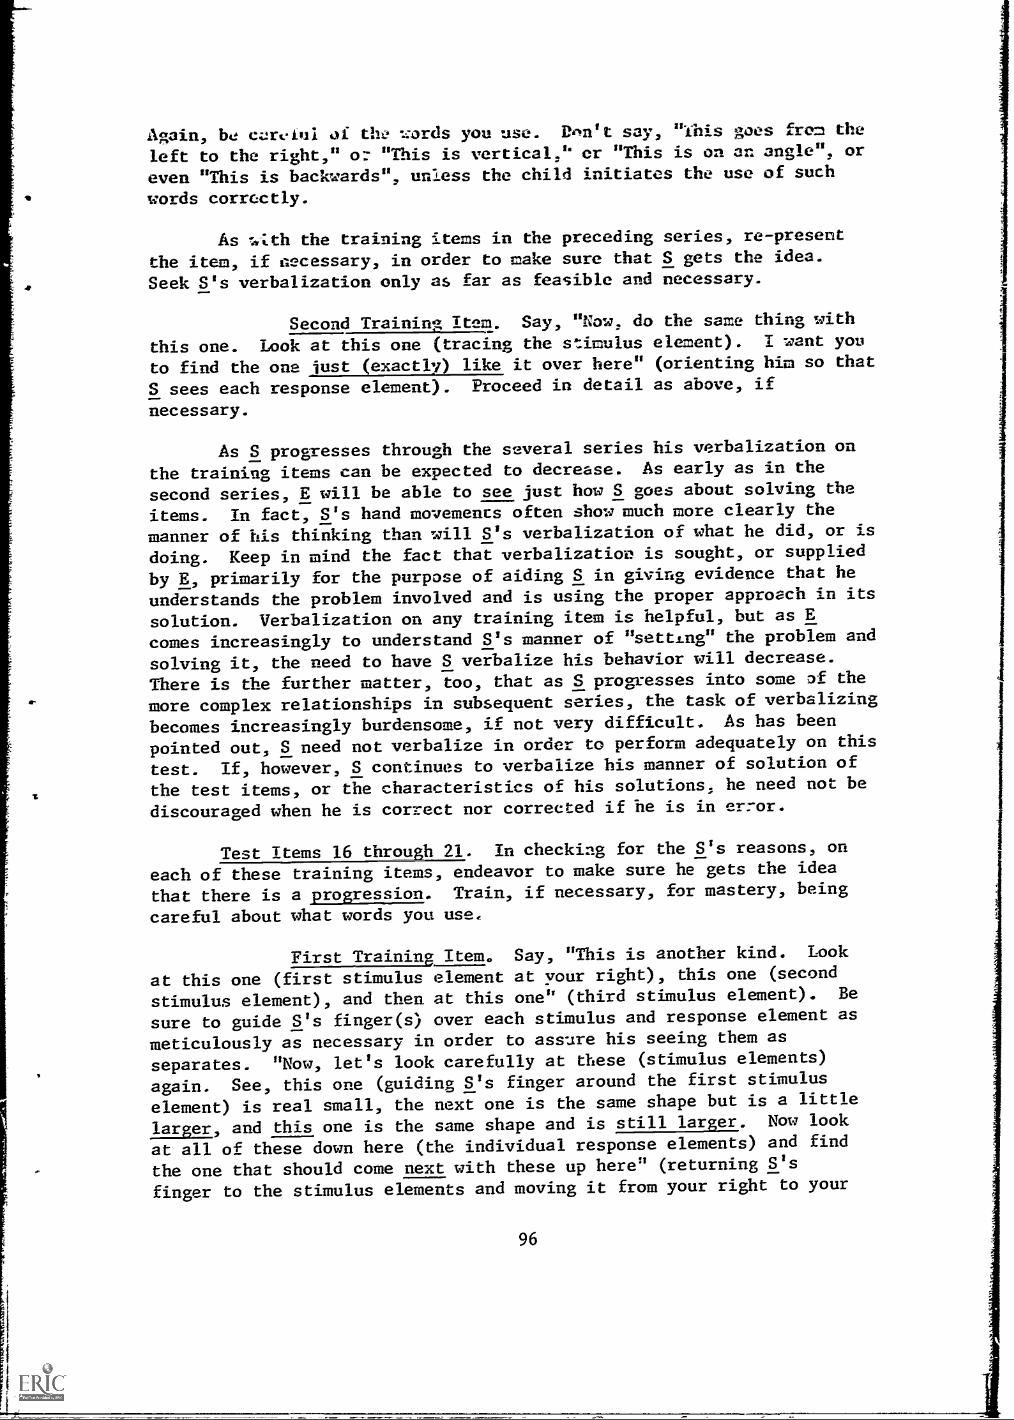
Again, be c'ereiul of the -.:ords you use. Don't say, "This goes from the
left to the right," "This is vertical," cr "This is on an angle", or
even "This is backwards", unless the child initiates the use of such
words correctly.
As the training items in the preceding series, re-presentthe item, if necessary, in order to make sure that S gets the idea.
Seek S's verbalization only as far as feasible and necessary.
Second Training Item. Say, "Now, do the same thing with
this one. Look at this one (tracing the stimulus element). I want you
to find the one just (exactly) like it over here" (orienting him so that
S sees each response element). Proceed in detail as above, if
necessary.
As S progresses through the several series his verbalization on
the training items can be expected to decrease. As early as in the
second series, E will be able to see just how S goes about solving the
items. In fact, S's hand movements often show' much more clearly the
manner of his thinking than will S's verbalization of what he did, or is
doing. Keep in mind the fact that verbalization is sought, or supplied
by E, primarily for the purpose of aiding S in giving evidence that he
understands the problem involved and is using the proper approach in its
solution. Verbalization on any training item is helpful, but as E
comes increasingly to understand S's manner of "setting" the problem and
solving it, the need to have S verbalize his behavior will decrease.
There is the further matter, too, that as S progresses into some of the
more complex relationships in subsequent series, the task of verbalizing
becomes increasingly burdensome, if not very difficult. As has been
pointed out, S need not verbalize in order to perform adequately on this
test. If, however, S continues to verbalize his manner of solution of
the test items, or the characteristics of his solutions, he need not be
discouraged when he is correct nor corrected if he is in error.
Test Items 16 through 21. In checking for the S's reasons, on
each of these training items, endeavor to make sure he gets the idea
that there is a progression. Train, if necessary, for mastery, being
careful about what words you use.
First Training Item. Say, "This is another kind. Look
at this one (first stimulus element at Your right), this one (second
stimulus element), and then at this one" (third stimulus element). Be
sure to guide S's finger(s) over each stimulus and response element as
meticulously as necessary in order to assure his seeing them as
separates. "Now, let's look carefully at these (stimulus elements)
again. See, this one (guiding S's finger around the first stimulus
element) is real small, the next one is the same shape but is a little
larger, and this one is the same shape and is still larger. Now look
at all of these down here (the individual response elements) and find
the one that should come next with these up here" (returning S's
finger to the stimulus elements and moving it from your right to your
96
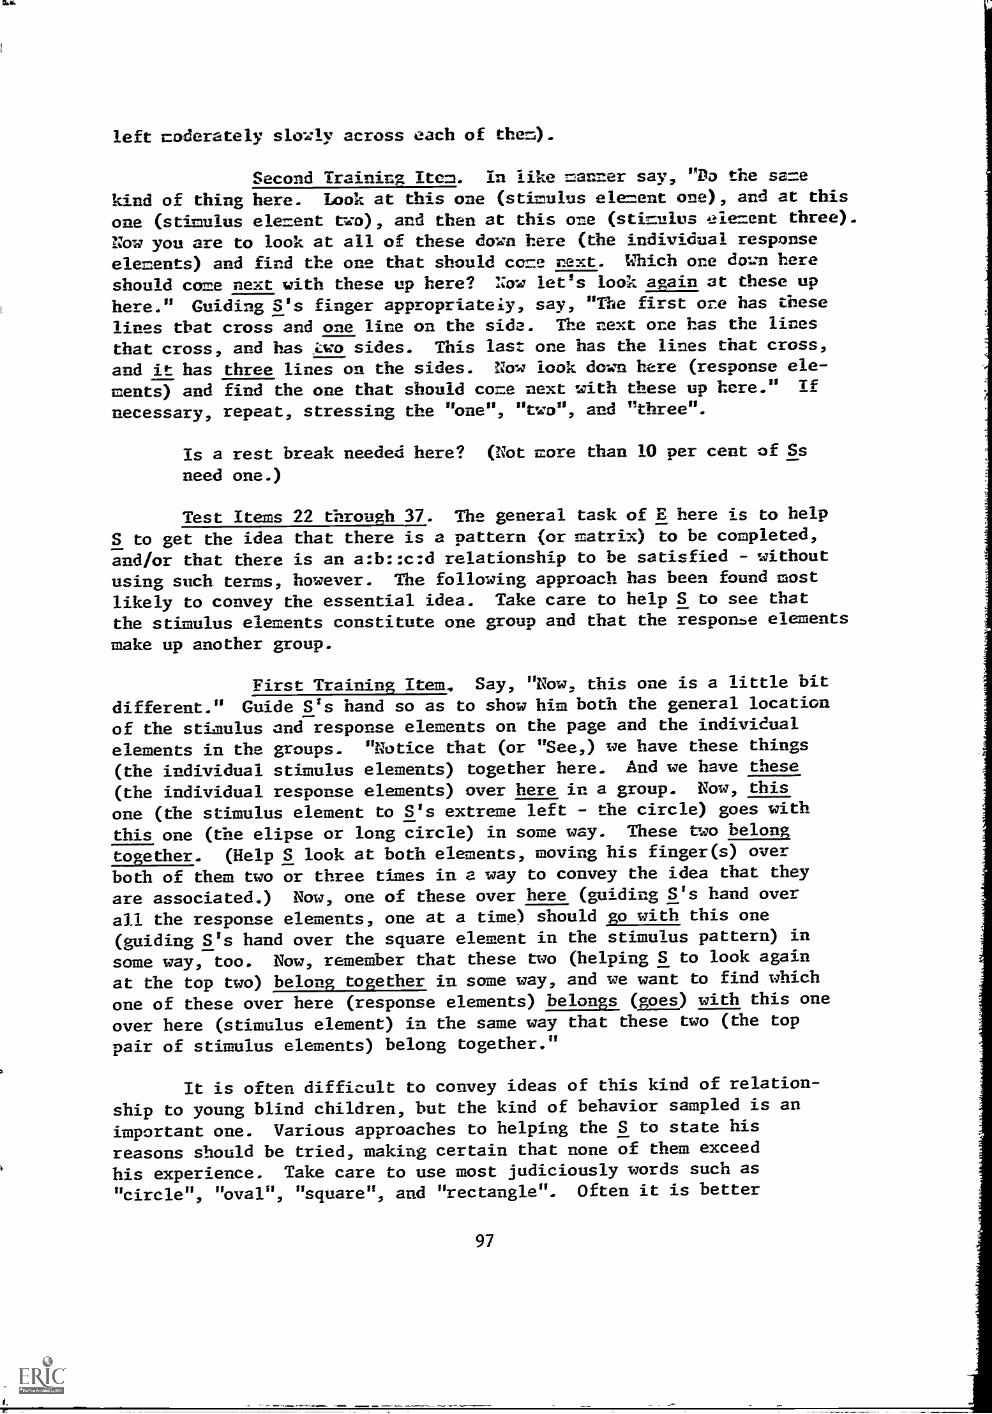
Oa.
left moderately slowly across each of them).
Second Training Item. in like manner say, "Do the same
kind of thing here. Look at this one (stimulus element one), and at this
one (stimulus element two), and then at this one (stimulus element three).
Now you are to look at all of these down here (the individual response
elements) and find the one that should core next. Which one don here
should come next with these up here? Now let's look again at these up
here." Guiding S's finger appropriateiy, say, "The first ore has these
lines that cross and one line on the side. The next one has the lines
that cross, and has ,two sides. This last one has the lines that cross,
and it has three lines on the sides. Now look down here (response ele-
ments) and find the one that should come next with these up here." If
necessary, repeat, stressing the "one", "two", and "three".
Is a rest break needed here? (Not more than 10 per cent of Ss
need one.)
Test Items 22 through 37. The general task of E here is to help
S to get the idea that there is a pattern (or matrix) to be completed,
and/or that there is an a:b::c:d relationship to be satisfied without
using such terms, however. The following approach has been found most
likely to convey the essential idea. Take care to help S to see that
the stimulus elements constitute one group and that the response elements
make up another group.
First Training Item., Say, "Now, this one is a little bit
different." Guide S's hand so as to show him both the general location
of the stimulus and response elements on the page and the individual
elements in the groups. "Notice that (or "See,) we have these things
(the individual stimulus elements) together here. And we have these
(the individual response elements) over here in a group. Now, this
one (the stimulus element to S's extreme left the circle) goes with
this one (the elipse or long circle) in some way. These two belong
together. (Help S look at both elements, moving his finger(s) over
both of them two or three times in a way to convey the idea that they
are associated.) Now, one of these over here (guiding S's hand over
all the response elements, one at a time) should go with this one
(guiding S's hand over the square element in the stimulus pattern) in
some way, too. Now, remember that these two (helping S to look again
at the top two) belong together in some way, and we want to find which
one of these over here (response elements) belongs (goes) with this one
over here (stimulus element) in the same way that these two (the top
pair of stimulus elements) belong together."
It is often difficult to convey ideas of this kind of relation-
ship to young blind children, but the kind of behavior sampled is an
important one. Various approaches to helping the S to state his
reasons should be tried, making certain that none of them exceed
his experience. Take care to use most judiciously words such as"circle", "oval", "square", and "rectangle". Often it is better
97
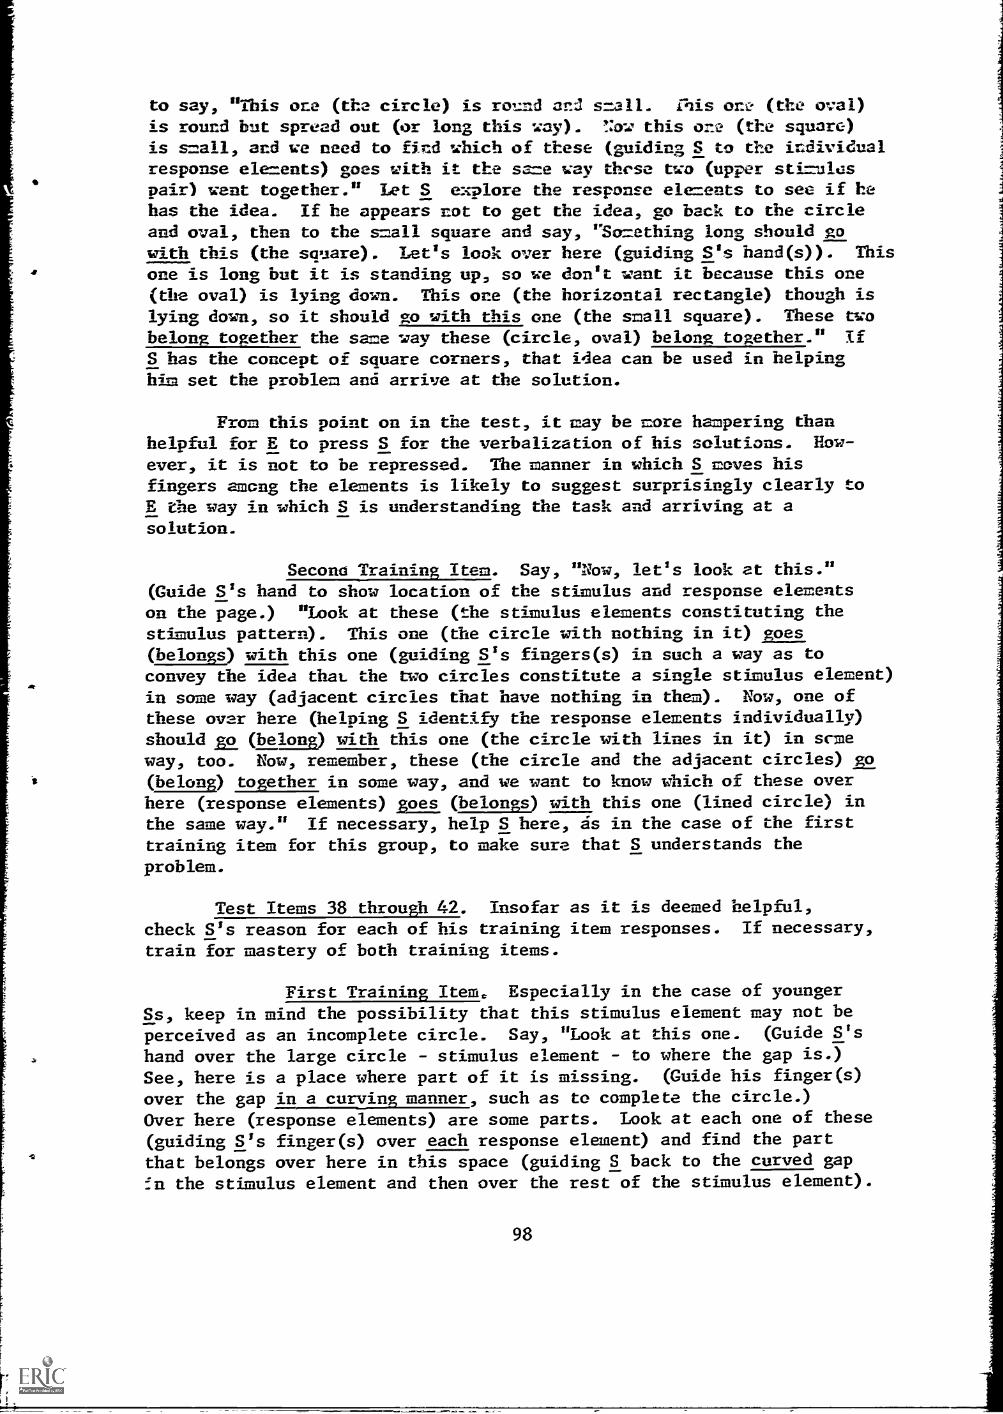
to say, "This one (the circle) is road and small. this one (the oval)is round but spread out (or long this way). Now this one (the square)is small, and we need to find which of these (guiding S to the individualresponse elements) goes with it the same way these two (upper stimulespair) went together." Let S explore the response elements to see if hehas the idea. If he appears not to get the idea, go back to the circleand oval, then to the small square and say, "Something long should gowith this (the square). Let's look over here (guiding S's hand(s)). This
one is long but it is standing up, so we don't want it because this one(the oval) is lying down. This one (the horizontal rectangle) though islying down, so it should go with this one (the small square). These twobelong together the sa=e way these (circle, oval) belong together." If
S has the concept of square corners, that idea can be used in helpinghim set the problem and arrive at the solution.
From this point on in the test, it may be more hampering thanhelpful for E to press S for the verbalization of his solutions. How-
ever, it is not to be repressed. The manner in which S moves hisfingers among the elements is likely to suggest surprisingly clearly toE the way in which S is understanding the task and arriving at asolution.
Secona Training Item. Say, "Now, let's look at this."(Guide S's hand to show location of the stimulus and response elementson the page.) "Look at these (the stimulus elements constituting thestimulus pattern). This one (the circle with nothing in it) goes(belongs) with this one (guiding S's fingers(s) in such a way as toconvey the idea that the two circles constitute a single stimulus element)
in some way (adjacent circles that have nothing in them). Now, one ofthese over here (helping S identify the response elements individually)should ao (belong) with this one (the circle with lines in it) in someway, too. Now, remember, these (the circle and the adjacent circles) go(belong) together in some way, and we want to know which of these overhere (response elements) goes (belongs) with this one (lined circle) inthe same way." If necessary, help S here, as in the case of the firsttraining item for this group, to make sure_ that S understands theproblem.
Test Items 38 through 42. Insofar as it is deemed helpful,check S's reason for each of his training item responses. If necessary,
train for mastery of both training items.
First Training Item. Especially in the case of younger
Ss, keep in mind the possibility that this stimulus element may not beperceived as an incomplete circle. Say, "Look at this one. (Guide S's
hand over the large circle - stimulus element to where the gap is.)
See, here is a place where part of it is missing. (Guide his finger(s)
over the gap in a curving manner, such as to complete the circle.)
Over here (response elements) are some parts. Look at each one of these
(guiding S's finger(s) over each response element) and find the partthat belongs over here in this space (guiding S back to the curved gapfn the stimulus element and then over the rest of the stimulus element).
98
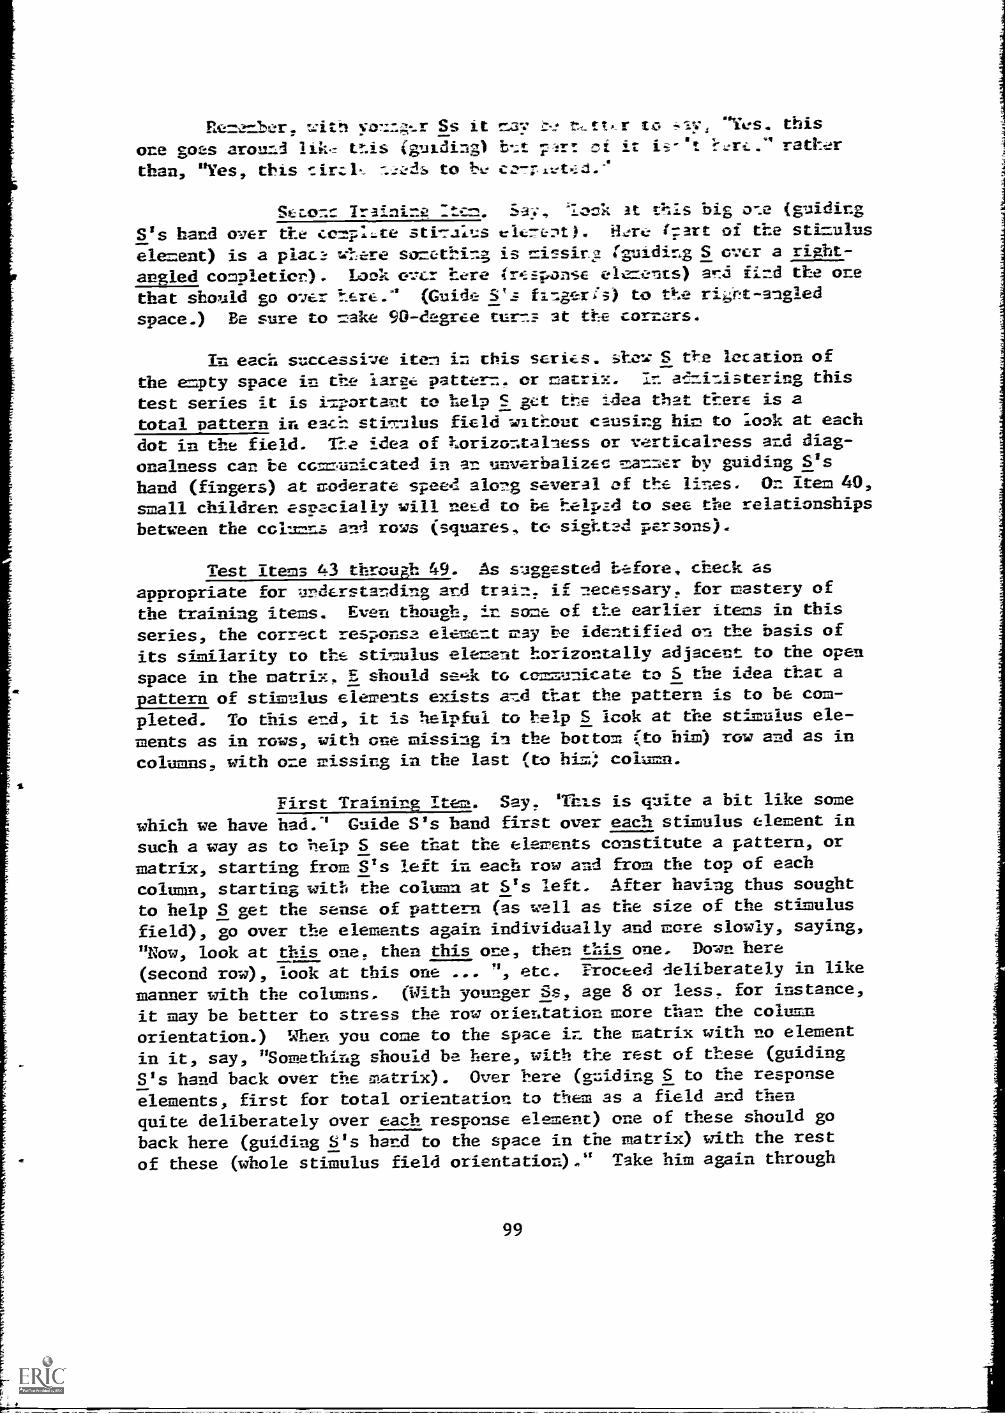
Remember, with yo-:z ger Ss it -y ,tt,r to, t-- i. "Yes. this
one goes around lik, tnis (guidingl b-:.t. 1-,3t: !., t it ii- here ." rather
than, "Yes, this eirel,_ --.eees to be co--;-leted.'
Selo n_ irainine :tem. Sai, lock at this big one (guiding
S's hand over the eempl:.te stin-ales eic7e:lt). Here (7art of the stimulus
element) is a placa, so=&thi.7.3 is r_issirg rguiding S over a right-
angled completier). Look over here trespanse elements) and find the one
that should go over here.' (Guide S's finger:5) to the riet-angled
space.) Be sure to make 90-degree turns at the corners.
In each successive iten in this series. .hew S location of
the empty space in the laree pattern. or matrix. In a.fministering this
test series it is i=eortant to help S get the idea that there is a
total pattern in eaeh stiTulus field without causing him to look at each
dot in the field. 'ae idea of %orizontalness or verticalress and diag-onalness can be communicated in an unverbalizec manner by guiding S's
hand (fingers) at noderate speed along several of the lines. On item 40,
small children especially will need to be helped to see the relationships
between the cci-r-r-i and rows (squares, to sighted persons) .
Test Items 43 through 49. As suggested before, check as
appropriate for understanding and train, if nece-ssary, for mastery of
the training items. Even though, it some of the earlier items in this
series, the correct response element may be identified on the basis of
its similarity to the stimulus element horizontally adjacent to the open
space in the matrix. E should se-A to cemmcnicate to S the idea that a
pattern of stimulus elements exists and that the pattern is to be com-
pleted. To this end, it is helpful to help S look at the stimulus ele-
ments as in rows, with one missing in the bottom (to bin) row and as in
columns, with one missing in the last (to him; coiTnn.
First Training Item. Say. 'This is quite a bit like some
which we have had.' Guide S's hand first over each stimulus element in
such a way as to lielp S see that the elements constitute a pattern, or
matrix, starting from S's left in each row and from the top of each
colvnn, starting wits the column at 5's left. After having thus sought
to help S get the sense of pattern (as well as the size of the stimulus
field), go over the elements again individually and more slowly, saying,
"Now, look at this one, then this one, then this one, Down here
(second row), look at this one ... ", etc. Proceed deliberately in like
manner with the columns. (With younger Ss, age 8 or less. for instance,
it may be better to stress the row orientation more than the colwrn
orientation.) Uhen you come to the space in the matrix with no element
in it, say, "Something should be here, with the rest of these (guiding
S's hand back over the matrix). Over here (guiding S to the response
elements, first for total orientation to them as a field and then
quite deliberately over each response element) one of these should go
back here (guiding S's hand to the space in the matrix) with the rest
of these (whole stimulus field orientation)." Take him again through
99
the matrix orientation and when he comes to the space, guide him to
the response field and say, "'you show C2 which of these should go
there" (guiding him back to the space in the matrix). Proceed in like
manner with the second training item.
The score is the total number of correct responses to the test
items (not inclut.ing the training items) .
100
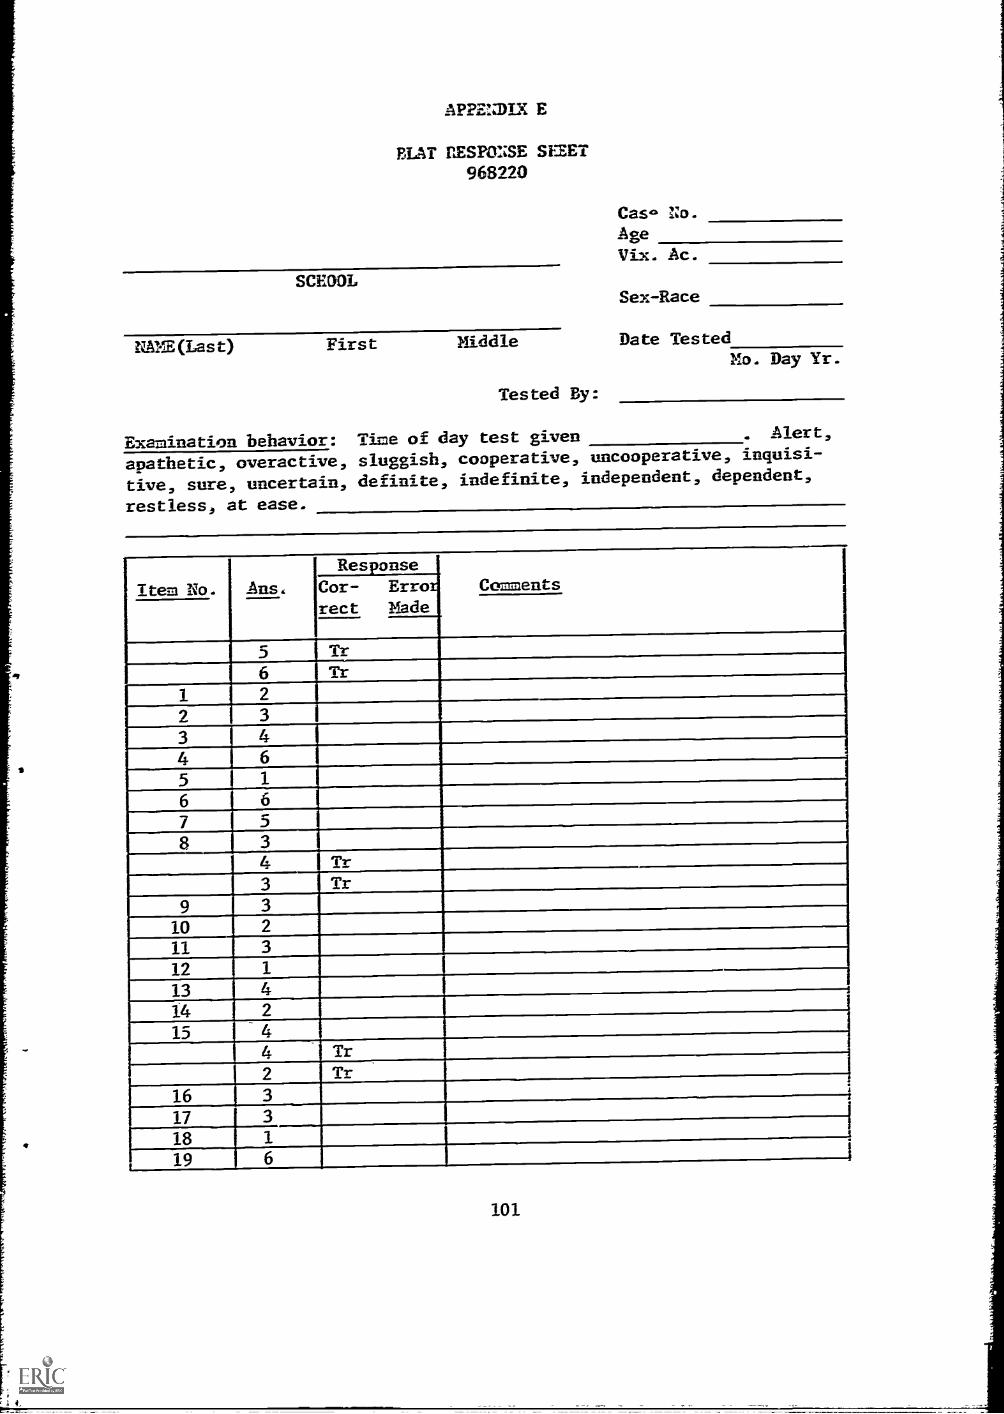
APPEZMIX E
FLAT RESPONSE SEEET968220
SCROOL
NAME(Last) First
Examination behavior:apathetic, overactive,Live, sure, uncertain,restless, at ease.
Cas,. No.
AgeVix. Ac.
Sex-Race
Middle Date Tested
Tested By:
Mo. Day Yr.
Time of day test given . Alert,
sluggish, cooperative, uncooperative, inquisi-
definite, indefinite, independent, dependent,
Item No. Ans,
ResponseCommentsCor- Erro
rect Eade
5 Tr6 Tr
1 2
2 3
3
4 6
5 1
6 6
7
8 3
4 Tr3 Tr
9
10
11 3
12
13 414
15
4 Tr
2 Tr
16 3
17 3
18 1
19
101

APPEOIX EBUT RESPONSE SHEET968220
Page 2.
Item No.I Response
Ccr=entsAns. ICor-z Errorect Made
20 521
T6
22 223 224 325 42627 128 629 230 431 532 333 634 135 136 237 4
3 Tr5 Tr
38 439 340 641 142 2
4 Tr2 Tr
43 144 445 346 447 513 549
102
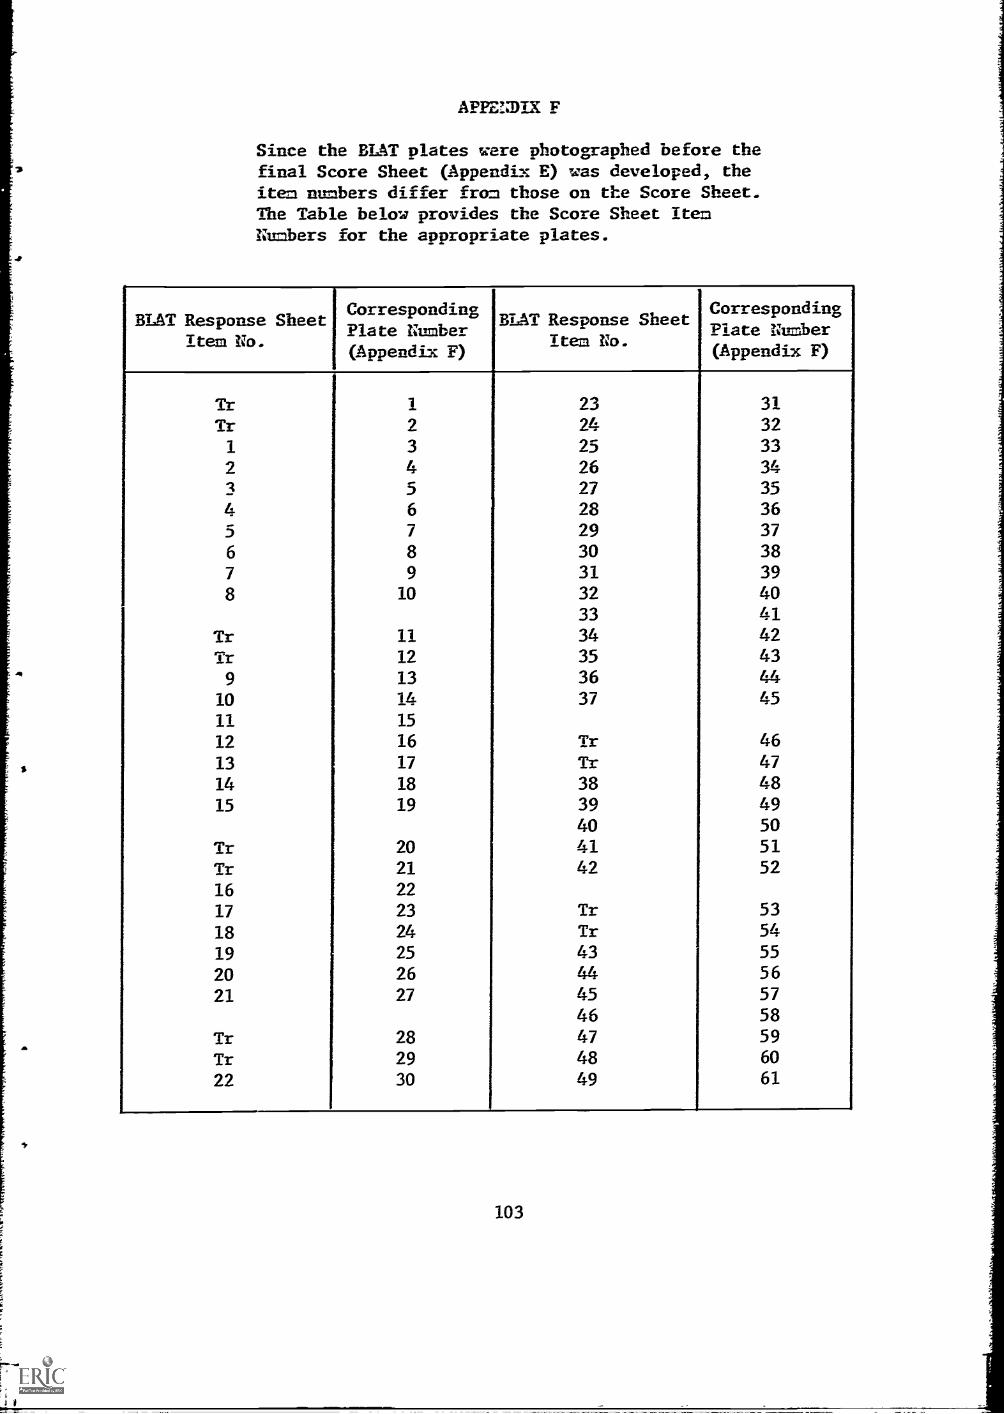
APPENDIX F
Since the BLAT plates were photographed before thefinal Score Sheet (Appendix E) was developed, theitem numbers differ from those on the Score Sheet.The Table below provides the Score Sheet ItemNumbers for the appropriate plates.
BLAT Response SheetItem No.
CorrespondingPlate Number(Appendix F)
BLAT Response SheetItem No.
CorrespondingPlate Number(Appendix F)
Tr 1 23 31
Tr 2 24 32
1 3 25 33
2 4 26 34
3 5 27 35
4 6 28 36
5 7 29 37
6 8 30 38
7 9 31 39
8 10 32 4033 41
Tr 11 34 42
Tr 12 35 43
9 13 36 44
10 14 37 45
11 15
12 16 Tr 46
13 17 Tr 47
14 18 38 4815 19 39 49
40 50
Tr 20 41 51
Tr 21 42 52
16 22
17 23 Tr 53
18 24 Tr 54
19 25 43 55
20 26 44 56
21 27 45 57
46 58
Tr 28 47 59
Tr 29 48 60
22 30 49 61
103
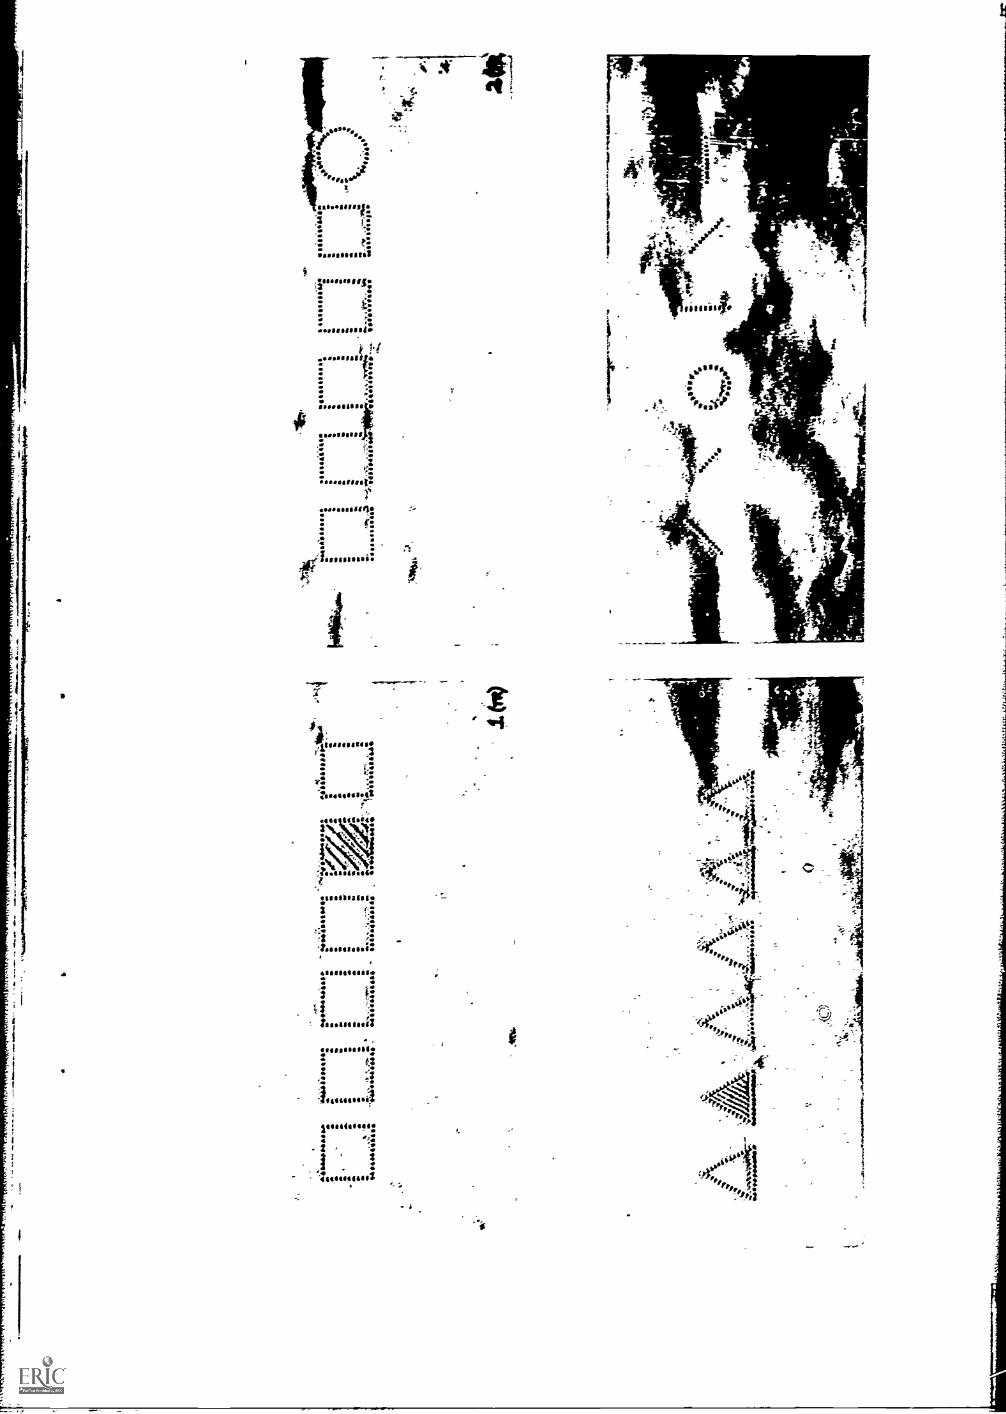

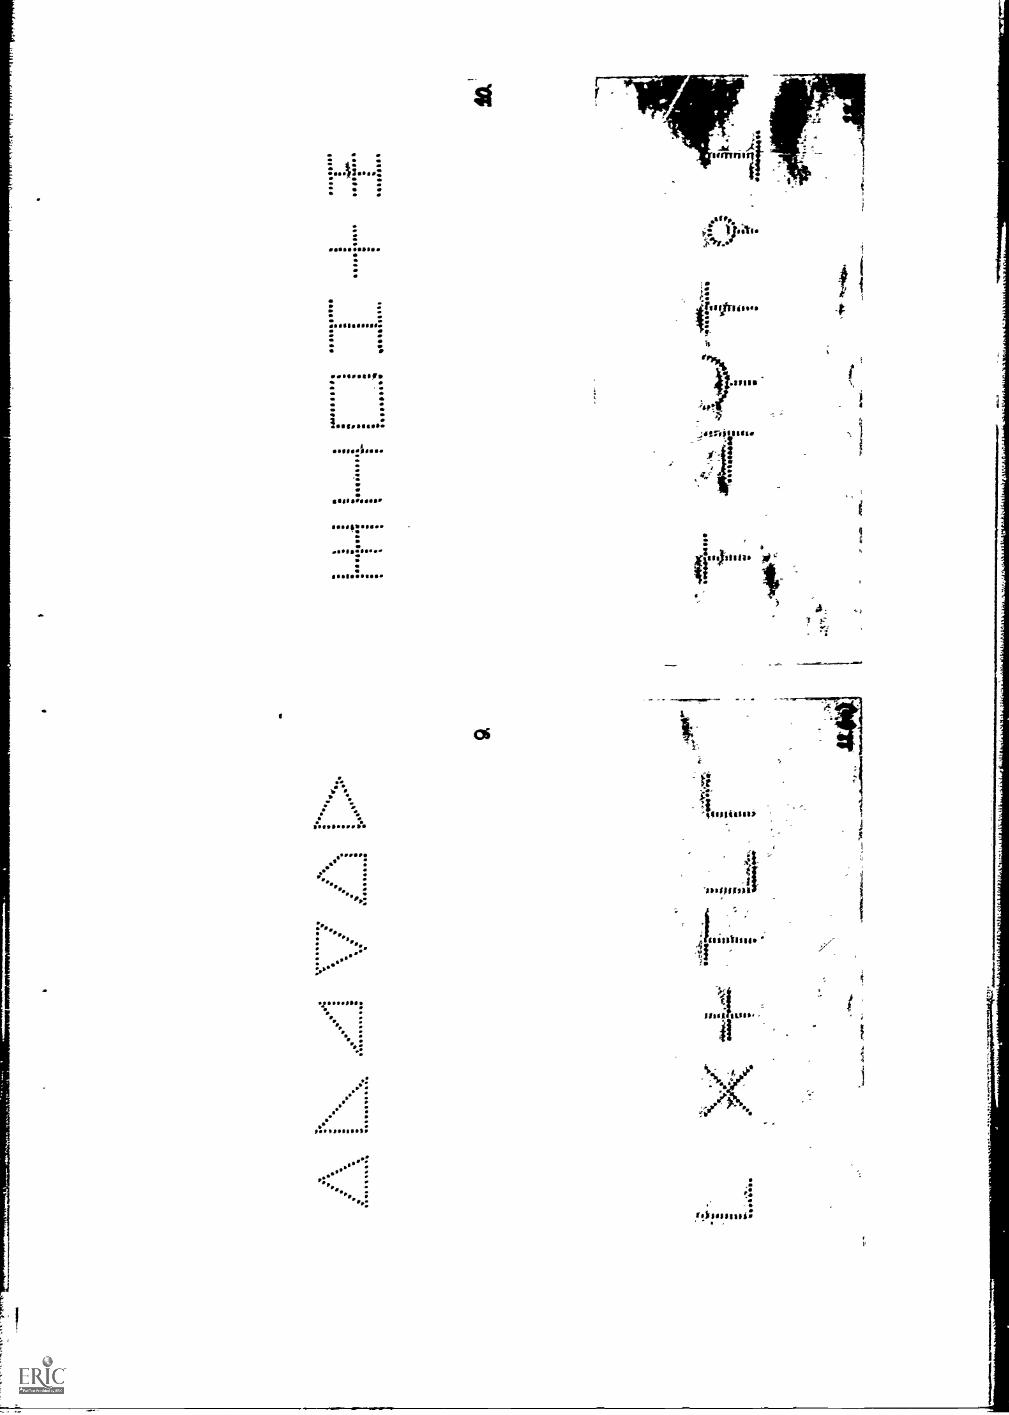
I
0O 0
AlOo :11.040 0
v....,, E
cos
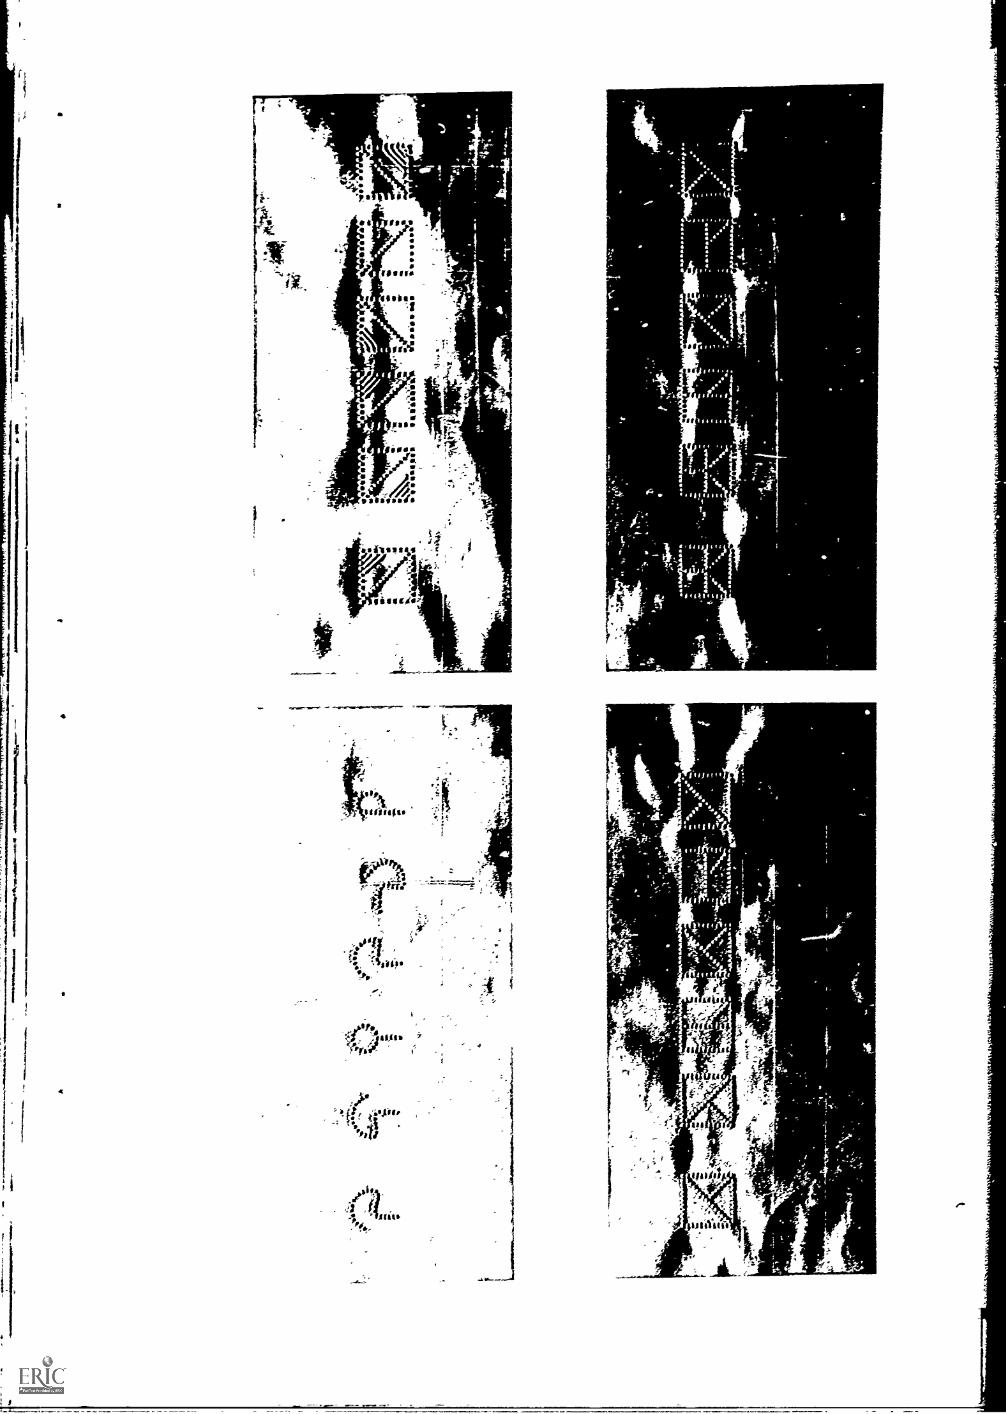
a
ref
1;1 - 1111
;Vo';ar
Li
$
t
, f
44A

A
4
wA
rry.s.
Ift'
II
II:
'''''I.:,..Ita ,,,,,
'.
47'
,A,I1
I-7i.,
'0 ',
3:$-%4
tt''
tab:7
:44'
+".
.tA
.
A.17.13. 41.14.
11111,1e,*
_0\
,
.1.I1.'0`.'
''.'
='' '
i
4..
...-',) le'''
:'...
.
4 t:
',,.
,N
a.4,..c.
to N.
c),
.1'1006Ati°'
4"."'
tz01,'"
* 404#114'I;A
..,114z,
......:-........,,,
..,...,
-I
l I7T
C n''
ie....goaV
-'t'';
--,,,r-
I.
'zpa aloe'
Cts.:

s 1,letror
jute.. ipso*1,1;"1
trt
!:2 -
-
'
..rt _ -LI
4,
1 .1 i'l lPP, k .i..:
.,,,,) 11,1
cl, k.
P
-_
44 VII,i.r45:rir*.

r
CI
: 0
2
2-;
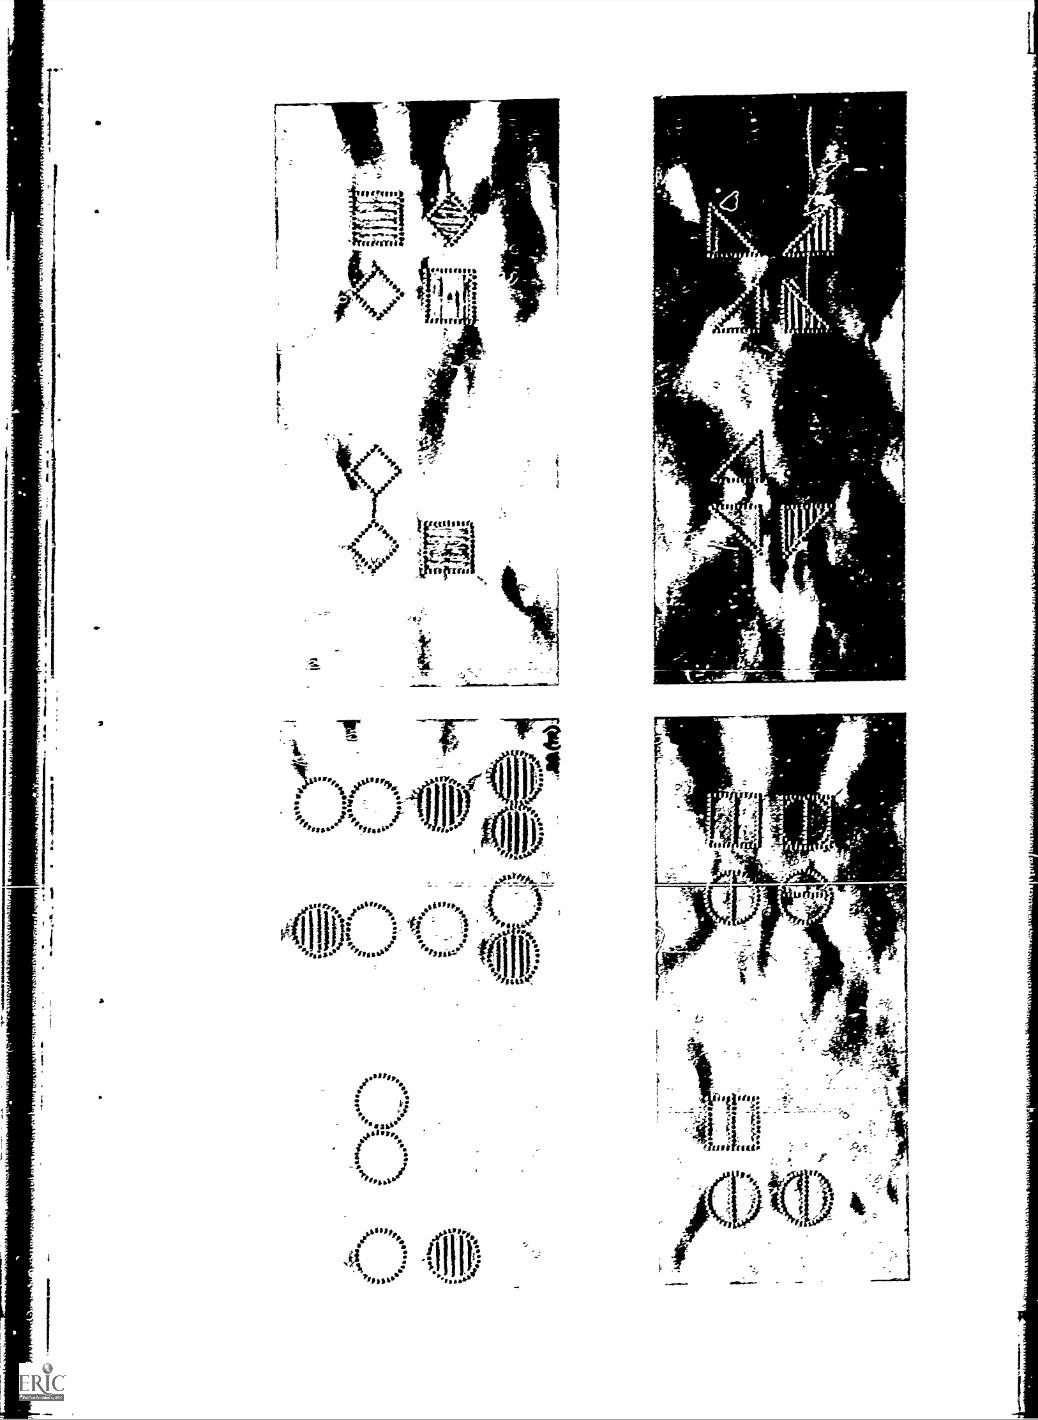
A 'S
=141111.
-
or.s, ppppp
4
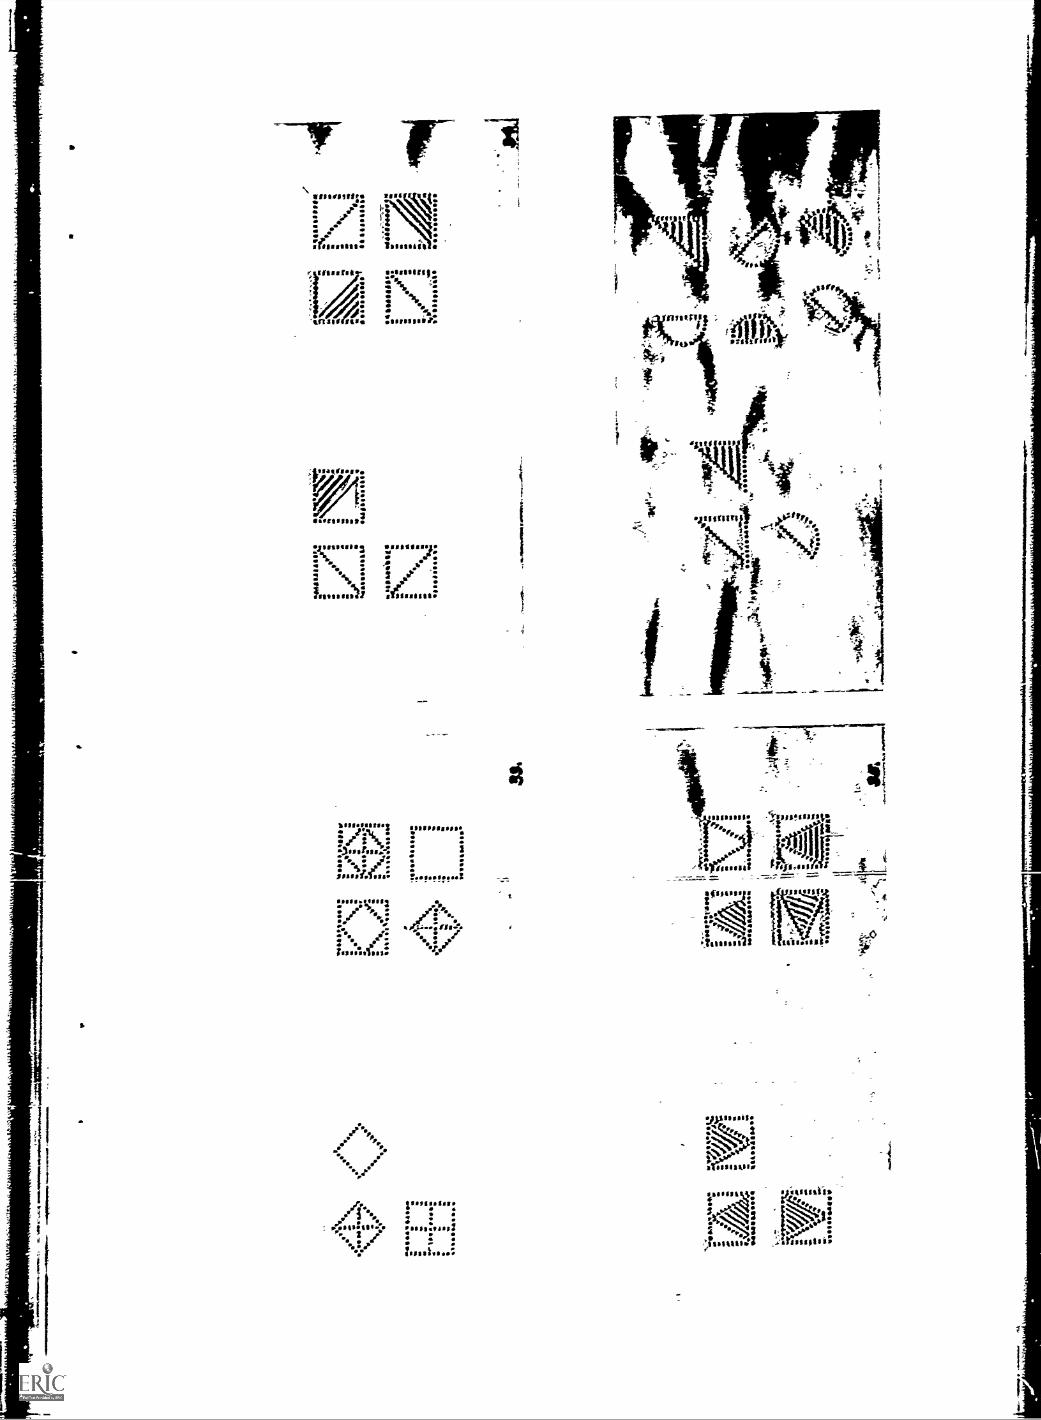
:VeSitaint.ft
4..a.0 '0
r, tritium sasserts.2
. 5,0 IN ...
. , 0r:
45111,
, -
s#:.trusir sat. 1.
3
04.
3-%""
:
:jos I fel
:usfrsnvss,:gsss:
..... ......
Disitrtofitrsio
,52
air.
22 R tassastik:
.... tug
.),,isitit,r Pr. .
:. ,01, :
to,..1

ti,:als las%
* 6'
T1 sssssss tee'
ss 0,0 met
'0EP,e
to ssssss rtillritS
1 2tally,i
2.
-1 ".2
1s r
AI%
I.SA II ..1 j l'iSib'e3SSIIIIir
1.4.^

.16
4
,,,,,at.
: 1,1".. I:
'" 1.
;1/111Pi''''
s
I bit:..: :. '1 -41.:::::1:::::2--..,... : 1,,,4
At.: : 'If ts 11.
s-,s1.68/
.111,A
S ZS , .... !SS IT 3 4:t. :
..
,714 it ...... !2
tr, 1/77:
ok ei si t
1
r-
F
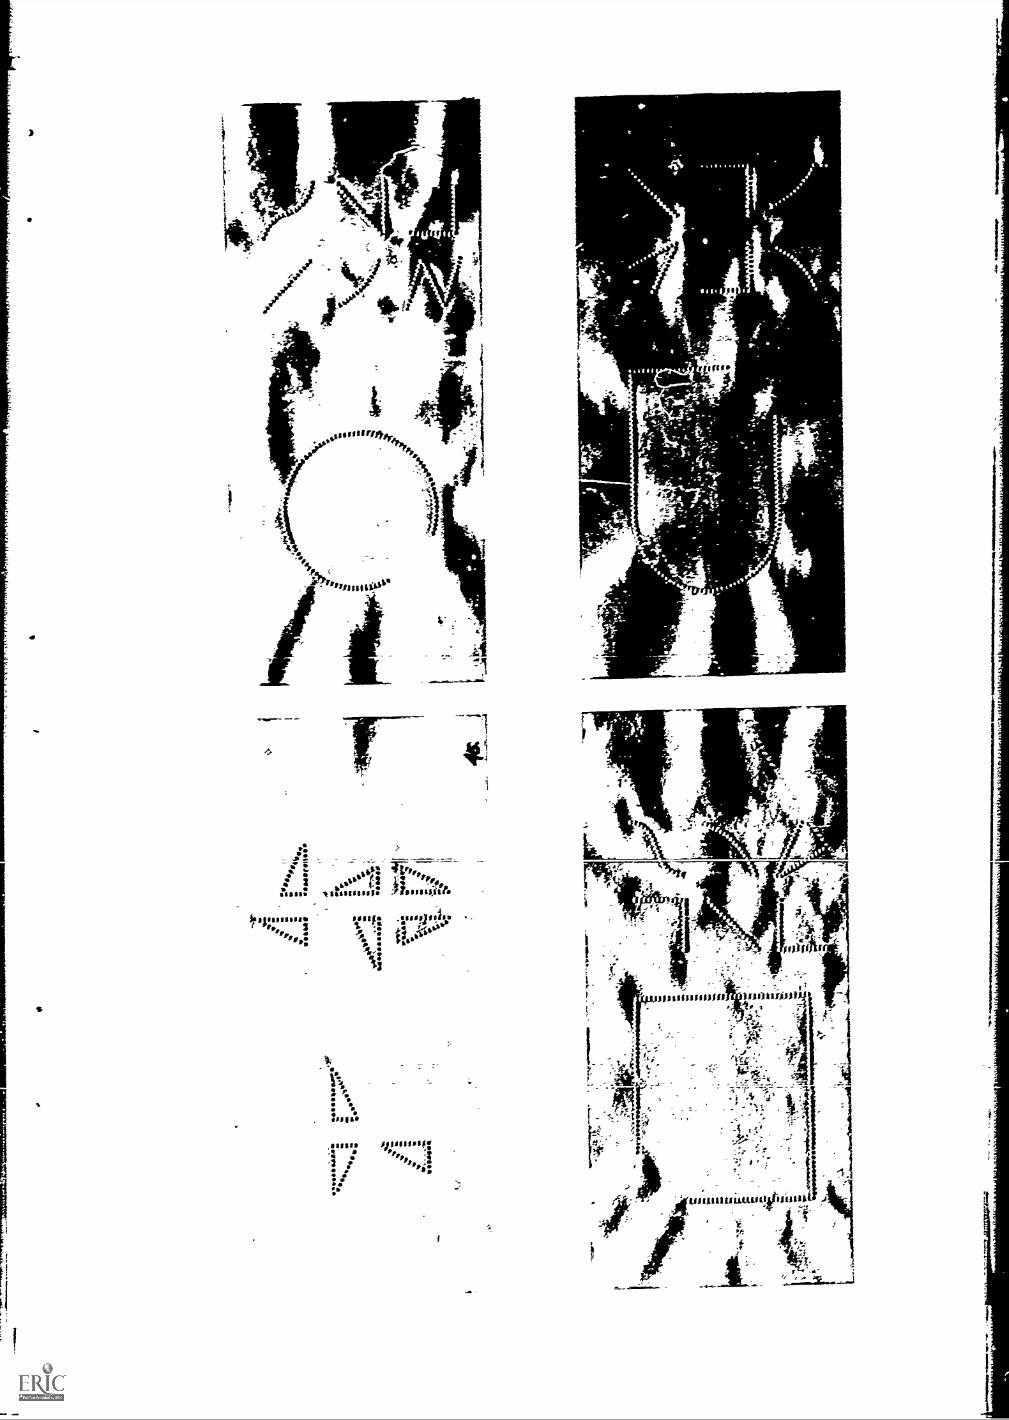
rf
4,: s --,- ----- -,==--_,-_-.
2, ol: I L'Pr2 %%% ft: 1: . 'sr,
sb % 4- 11,* ,t.A il a % Pau
J/ 1 ssq .ssofilis s;so
,. % °
211
ro
Ifte
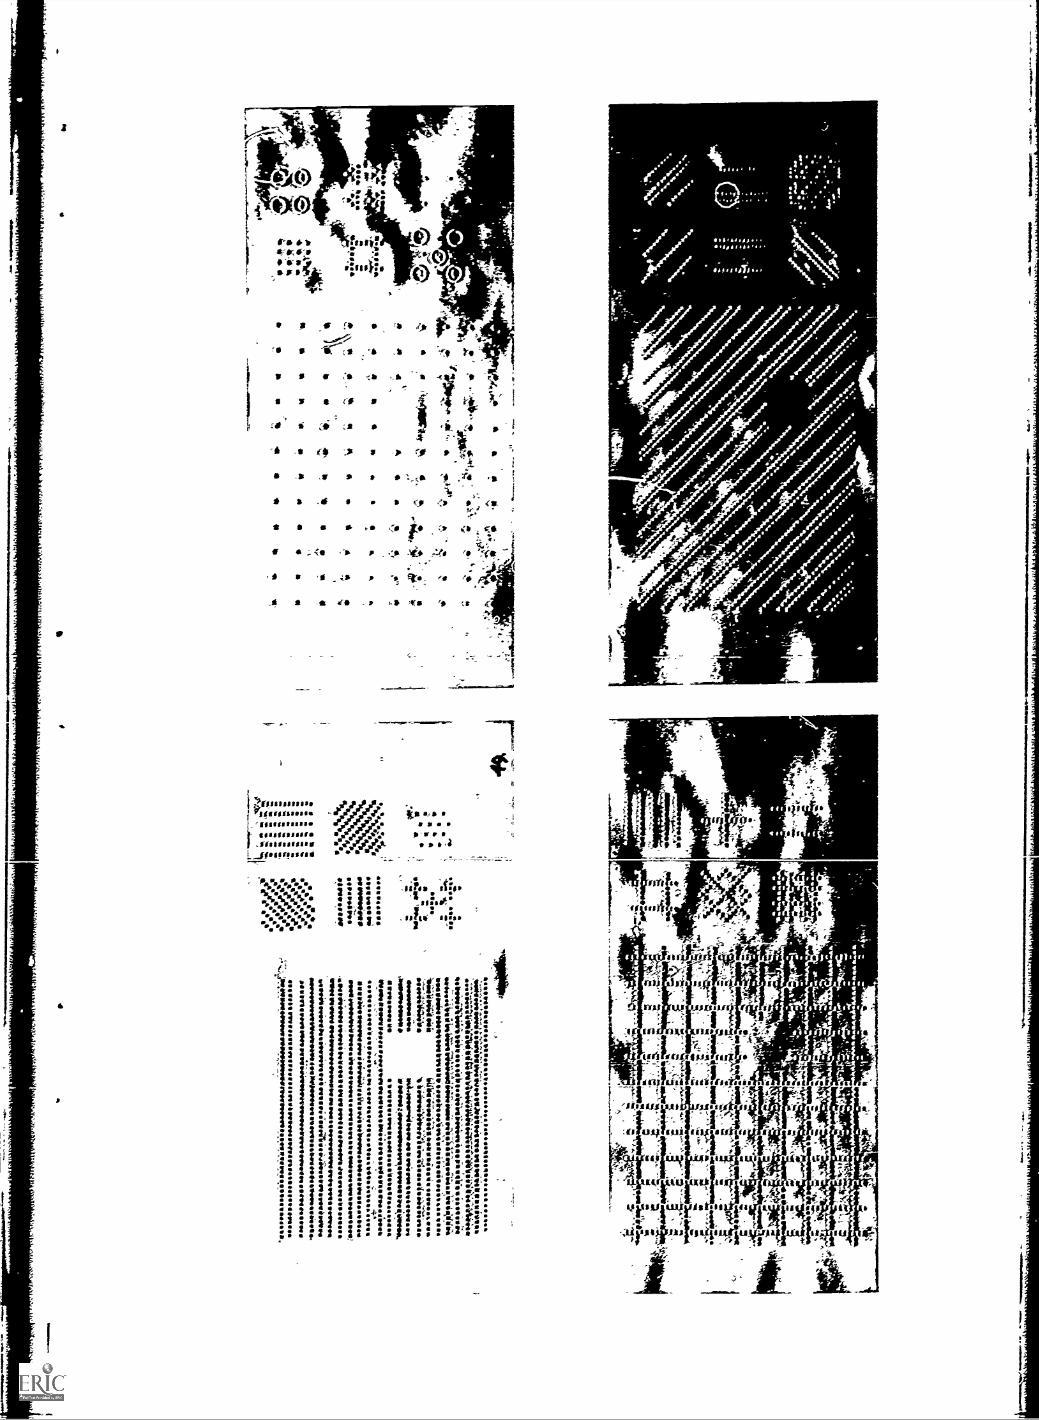
Ii
'1
-4
of V
Al 2 ;11; 2
err
t
1 `4 ,/ .1
ti ., .1_, ...
. : ei, ..I. V V
ilag!i I-..-
1
i 1111111 Ii fIlliVii:
.1 14t1F. i'..: as , gra;lifil 4 f" 00 ors?- i,: 111"1;
I 10411 , if; 1: a 4.Ettiti
2-ii fll:i 1ii f"ftq.1.11:111. Witifitat1 f : r 1 :
!Tit ..2 --..ri 4v sot-, .01
--;-., ...;7 .
1 IR .1i ',,IT, V. .4.1
ii311i! 11all1
1 r.i 2ii t rqifillii I i : I i ;lilt, 2. ... 2 : 4: :2 l'i 3 II'?2 i ! f : 2 2 li
1- r
K
;
t Istfj 0..
--4
;
ft; if
tt
4 'air
WA*. V
Ir!erpg
Ift1 111; tr i ibrils. I 0
f } -., . - .',isi.
i
.1150
j ,r .a 0
or;i
- .1111,1$113.1 10
-- : "-11...., ci 611
I- i -1-1. ._
if 111 ail II Eire 407:iit
!I 11 (s I rili
i 1"T"f V.11.1 ill,riii
,juirss Si 1,14114.1iLitAtiy.21-111...0
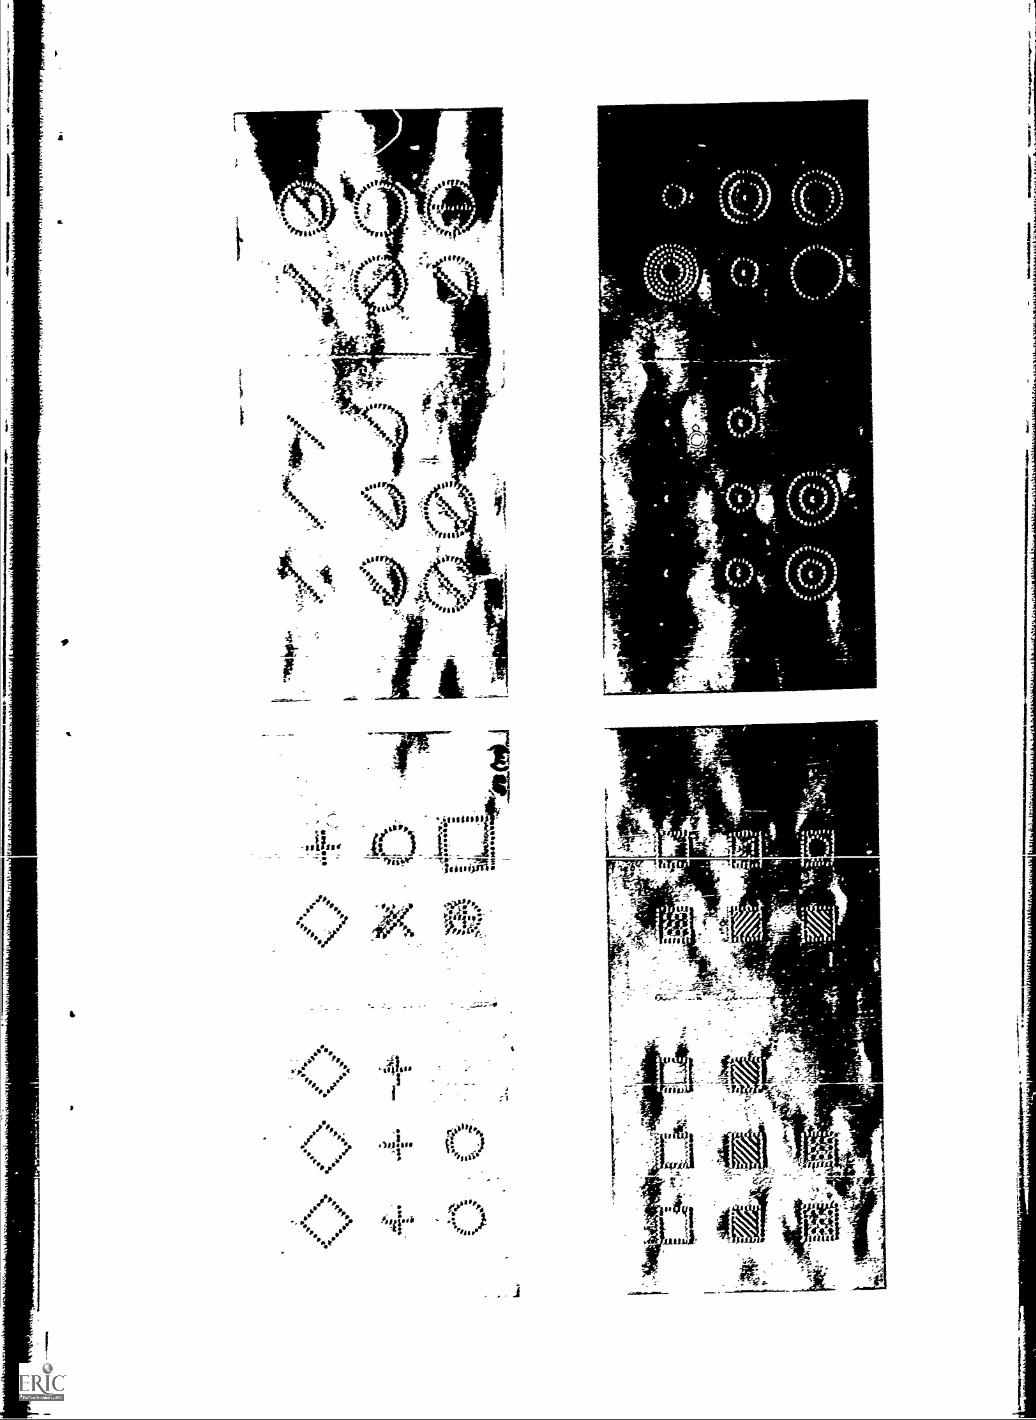
-4
Jo,
fr) It
01/0"Pa\t.
, ri.10111111
"3,.1.. r0111P
0,06 Op,
'toPC110
I
I-
1i3 . tti 1- etrsi "-
'-4"
4.. 4
4 . 06:- - 1:
74,....; .-. r.:*?. .7:41, ...-.;. r
:-:- "'A:
1

da
41191116..........
A a 0. lb 0, W
0 It 4S,
4
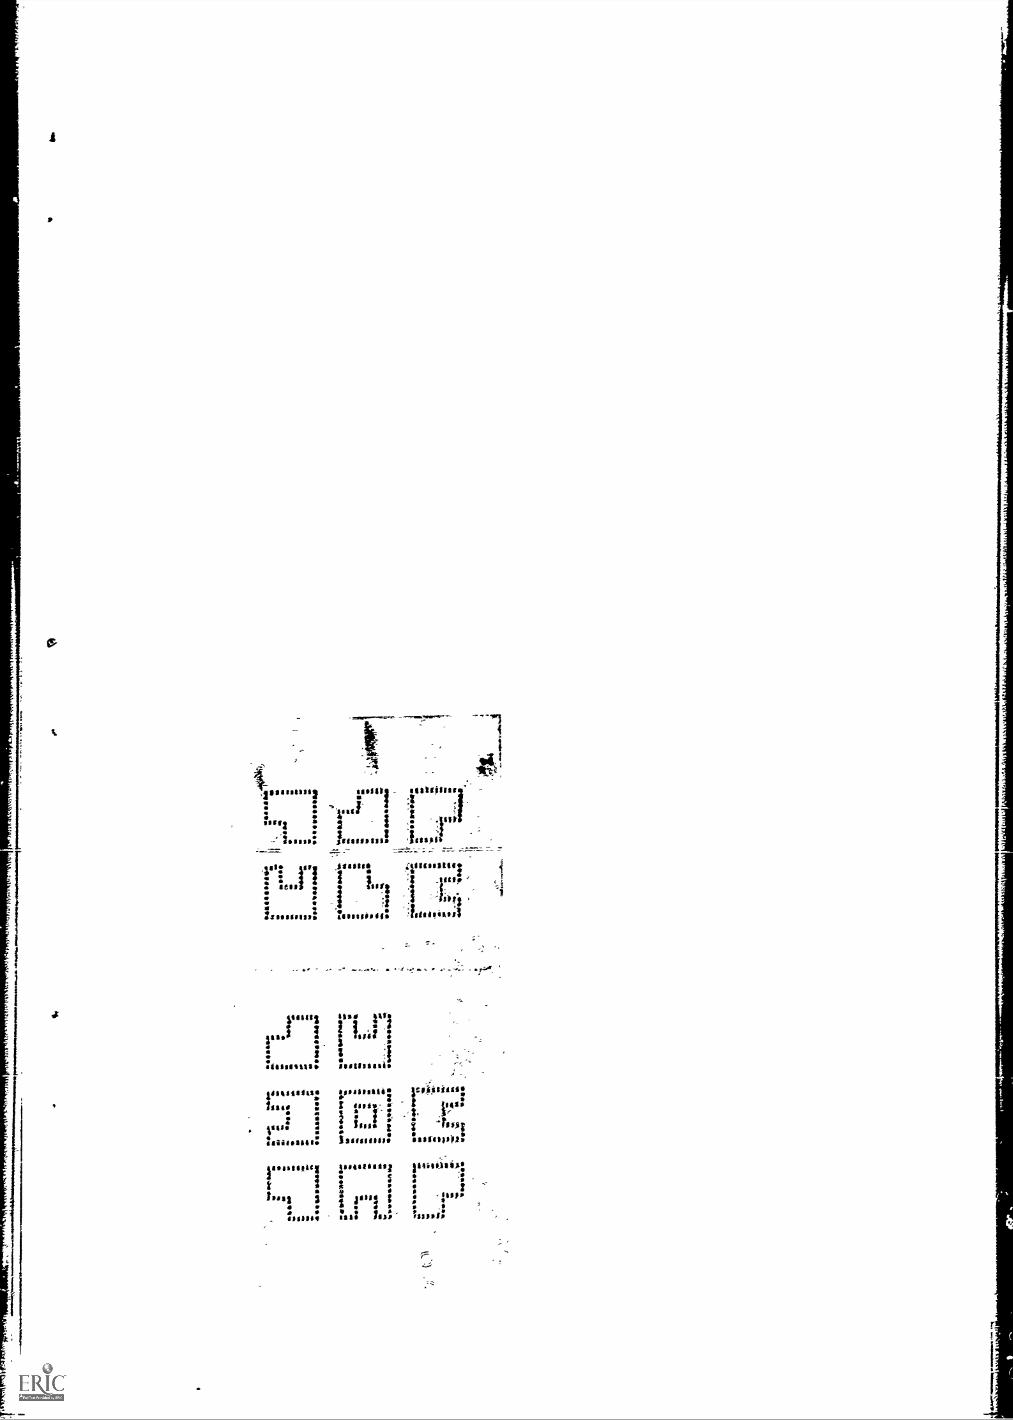
.3sati$12 _ sillaKilltr
i I' a Ii ..
I!1:
I
Isscut, fur!
-1 4ttttttt
$ s us. eli i 3 ii '
lea.i is,
t ::g i
1,4s:
.-oic3 1 tttt IOW' 114:11.111111:
: I I : :. , :
bag 3 1 psi. : Tif,: a
9 . iest. II, !SIM,
Related Documents