LOOMING WORLD OIL PROBLEMS: LOOMING WORLD OIL PROBLEMS: MYTHS AND REALITIES MYTHS AND REALITIES Keynote Address at the Smart 2007 Conference Sydney, Australia June 21, 2007 Roger H. Bezdek. Ph.D., President Management Information Services, Inc. Washington, D.C. USA [email protected]

LOOMING WORLD OIL PROBLEMS: MYTHS AND REALITIES Keynote Address at the Smart 2007 Conference Sydney, Australia June 21, 2007 Roger H. Bezdek. Ph.D., President.
Dec 23, 2015
Welcome message from author
This document is posted to help you gain knowledge. Please leave a comment to let me know what you think about it! Share it to your friends and learn new things together.
Transcript

LOOMING WORLD OIL PROBLEMS:LOOMING WORLD OIL PROBLEMS:MYTHS AND REALITIESMYTHS AND REALITIES
Keynote Address at the Smart 2007 Conference
Sydney, Australia
June 21, 2007
Roger H. Bezdek. Ph.D., President
Management Information Services, Inc.
Washington, D.C. USA

04/19/23 2
THIS PRESENTATION
• Nine myths and realities1. World is “running out of oil”2. Oil shortages wrongly predicted for 100 years – no
need to worry now3. Higher prices will create more oil4. Not to worry, world will muddle through5. Just another “energy crisis”6. Renewables will save us7. Government intervention not required8. Plenty of time to address the problem9. Oil peaking means “end of civilization as we know it”
• Implications• RecommendationsNote: Global warming is currently a major concern. However,
peak oil will likely occur suddenly and have severe consequences in the near future.
04/19/23 3
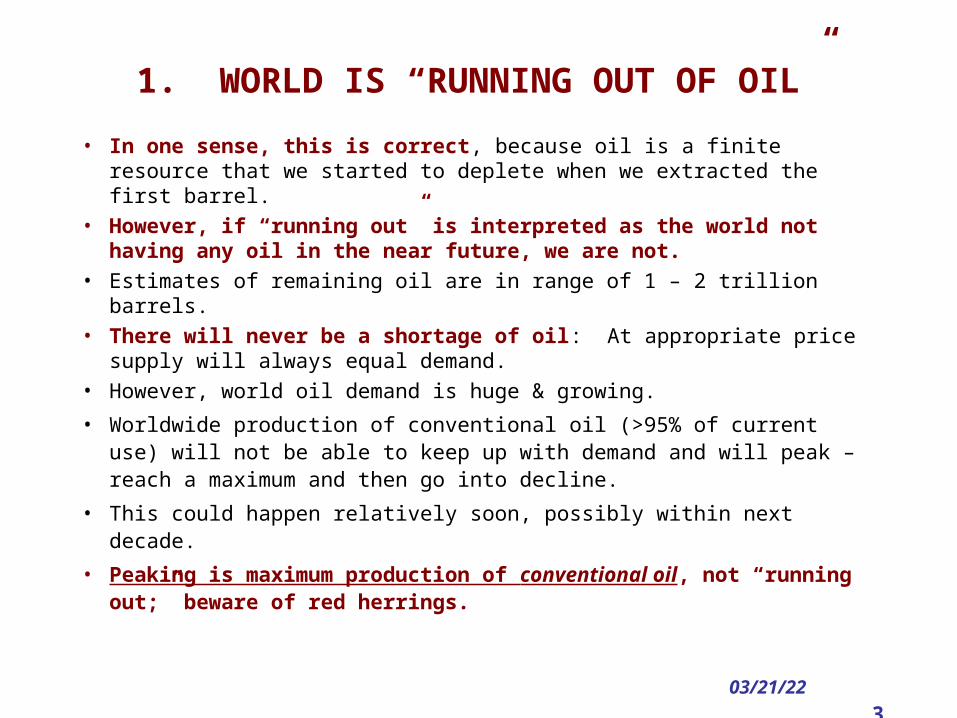
1. WORLD IS “RUNNING OUT OF OIL”
• In one sense, this is correct, because oil is a finite resource that we started to deplete when we extracted the first barrel.
• However, if “running out” is interpreted as the world not having any oil in the near future, we are not.
• Estimates of remaining oil are in range of 1 – 2 trillion barrels.• There will never be a shortage of oil: At appropriate price
supply will always equal demand.• However, world oil demand is huge & growing.
• Worldwide production of conventional oil (>95% of current use) will not be able to keep up with demand and will peak – reach a maximum and then go into decline.
• This could happen relatively soon, possibly within next decade.
• Peaking is maximum production of conventional oil, not “running out;” beware of red herrings.

04/19/23 4
WHY WILL CONVENTIONALOIL PRODUCTION PEAK?
Time - Decades
Pro
du
ctio
n
Oil Fields Peak
1945 2000Year
Pro
du
cti
on
U.S Lower 48 States
The world will peak
(All regions)
Regions Peak (Many oil fields)

04/19/23 5
WORLD IS CONSUMING MORE OILAND FINDING LESS
Past discovery by ExxonMobil
0
10
20
30
40
50
60
1930 1950 1970 1990 2010 2030 2050
Bil
lio
ns
of
Ba
rrel
s
0
10
20
30
40
50
60
Past
Future
Production
“GrowingGap”

04/19/23 6
WORLD OIL DISCOVERY HISTORY & THREE PATHS FOR USGS RESERVES ESTIMATES

04/19/23 7
WHEN DISCOVERY DECLINES, PRODUCTION ALWAYS DECLINES LATER -- NORWAY

04/19/23 8
1967 1969 1971 1973 1975 1977
2.9
3.0
3.1
3.2
3.3
3.4
3.5
Da
ily
Pro
du
cti
on
- M
M b
/d
100%
90%
85% Per
cen
t o
f M
axim
um
95%
Texas
O
Peak in
1972
1980 1982 1984 1986 1988 1990
14.4
14.6
14.8
15.0
15.2
15.4
15.6
Da
ily
Pro
du
cti
on
- M
M b
/d
100%
98%
Per
cen
t o
f M
axim
um
North America
96%
94%
Peak in
1985
1994 1996 1998 2000 2002 2004
2.4
2.5
2.6
2.7
2.8
2.9
3.0
Da
ily
Pro
du
cti
on
- M
M b
/d
100%
90%
85%
Per
cen
t o
f M
axim
um
95%
United Kingdom
Peak in
1999
1994 1996 1998 2000 2002 2004
2.9
3.0
3.1
3.2
3.3
3.4
3.5
Da
ily
Pro
du
cti
on
- M
M b
/d
100%
90%
85% Per
cen
t o
f M
axim
um
95%
Norway
Peak in
2001
PEAK PRODUCTION CAN BE SUDDEN & SHARP
Will the world behave like this?

04/19/23 9
0
10
20
30
40
50
1930 1950 1970 1990 2010 2030 20500
10
20
30
40
50
2006
WORLD OIL
Past Production
ForecastProduction
Demand Growth
Gb/year
A CHINESE VIEW OF PEAK OIL
Peak ~ 2012
China aggressively securing oil supplies worldwide
GAP

04/19/23 10
2. OIL SHORTAGES WRONGLY PREDICTED FOR 100 YEARS – NO NEED TO WORRY NOW• Wrong
• “Oil shortages” predicted for past 100 years, and repeated erroneous predictions may have given false assurance and led to discounting recent predictions
• Most past peaking predictions were wrong.- Hubbert was right on the U.S. Lower 48- Recent predictions may be right -- Wrong isn’t forever
• Many countries have past peak production & are now in decline
• Why reconsider peaking now?- World oil consumption outstripping new discoveries- CAPEX for new energy projects is large and growing- Extensive drilling worldwide - large database- Advanced technology: Modern geology, 3D seismic, etc.- Many experts are pessimistic- The economic consequences are huge

04/19/23 11
WHEN MIGHT PEAKING OCCUR? Different Approximations Lead to Different Forecasts
Forecast Source
December 2005 Deffeyes (U.S.)
2006-2007 Bakhitari (Iran)
2006-2007 Simmons (U.S.)
2010 +/- Skrebowski (U.K.)
2010 Campbell (Ireland)
Before 2010 Goodstein (U.S.)
After 2010 World Energy Council
2012 Weng (China)
2016 Doug-Westwood (U.K.)After 2020 CERA (U.S.)
2030 or later EIA (U.S) / Exxon Mobil
5 years
5-15 years
> 20 years
Already

04/19/23 12
PEAKING FORECAST RELATIVELY INSENSITIVE TO RESOURCE ESTIMATES
Already consumed worldwide: ~ One Trillion Barrels
Some estimates of remaining world reserves = One Trillion Barrels
Others estimate remaining world reserves = Two Trillion Barrels
If so, world oil peaking is
about now. [50% of total]
EIA: “(Our) results are remarkably insensitive to …
alternative resource base estimates… adding 900 Bbbl more oil …only delays the estimated production peak
by 10 years.”

04/19/23 13
Time
Production
History :
1 Trillion barrels already consumed
Some Forecasters: 1 Trillion barrels
already consumed peaking about now
EIA: Add 900 Million barrels, Gain 10 years.
ADDING ALMOST A TRILLION BARRELSGAINS ONLY 10 YEARS

04/19/23 14
3. HIGHER PRICES WILL CREATE MORE OIL?
• Not true• “Economists are better at finding oil on paper than geologists are
at finding it in the ground”• Oil is found in discrete packages (reservoirs), as opposed to
the varying concentrations characteristic of many minerals.• Thus, at some price, world reserves of recoverable conventional
oil will reach a maximum because of geological fundamentals.• Beyond that point, insufficient additional conventional oil will be
recoverable at any realistic price.• This is a geological fact often misunderstood by people
accustomed to dealing with hard minerals, whose geology is fundamentally different.
• Norway, UK, other oil producing nations have peaked within past several years with very high oil prices.
• Indonesia, a long standing OPEC member, is now a net oil importer.

04/19/23 15
TECHNOLOGY & PRICE MAY NOT SAVE USU. S. Lower 48 Oil Production
3.5
3.0
2.5
2.0
1.5
1.0
0.5
0
80
0
Production
Price
Dramatic Improvement in Oil
Field Technology
PRODUCTION(Billions of
Barrels per Year)
1950 1960 1970 1980 1990 2000
Trends were not reversed, and continued decline is forecast
PRICE(2003 $ per
barrels)

04/19/23 16
4. NOT TO WORRY, WORLD WILL MUDDLE THROUGH?
• Not true
• We should be very worried.
• The problem of the peaking of world conventional oil production is unlike any yet faced by modern industrial society.
• Previous energy transitions, from wood to coal and from coal to oil, were gradual and evolutionary.
• World may be facing an imminent energy discontinuity that will be abrupt and painful.
• World has yet to grasp this or its implications.
04/19/23 17
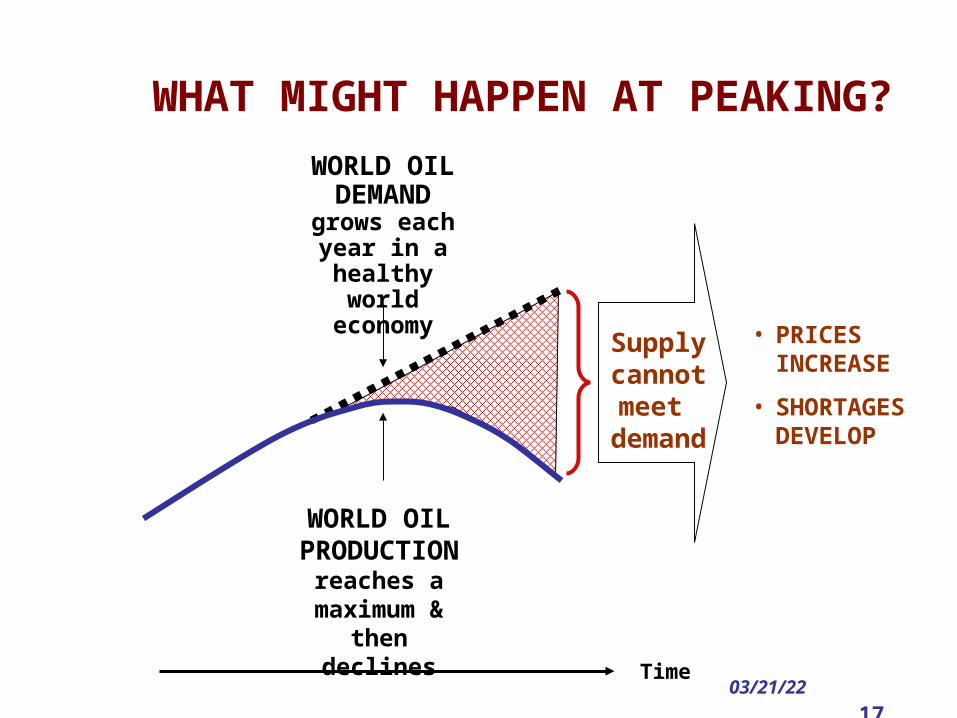
WHAT MIGHT HAPPEN AT PEAKING?
WORLD OIL DEMAND
grows each year in a
healthy world economy
WORLD OIL PRODUCTION
reaches a maximum &
then declines
Supply cannot meet
demand
• PRICES INCREASE
• SHORTAGES DEVELOP
Time

04/19/23 18
_______________________________________________________________________________________________________________
REMEMBER THE 1970S?STAGFLATION, RECESSION
-- That was only a short-term disruption

04/19/23 19
OIL PRICE INCREASES HAVECAUSED U.S. RECESSIONS
0
0.1
0.2
0.3
0.4
0.5
0.6
0.7
0.8
0.9
1
1969
1971
1973
1975
1977
1979
1981
1983
1985
1987
1989
1991
1993
1995
1997
1999
2001
2003
0
10
20
30
40
50
60
70
80
Recession
OIL PRICE
(2003 $ per
barrel)
Over 30 years, four recessions followed oil price spikes.

04/19/23 20
GROWING OIL SHORTAGES WILL INDUCE GROWING WORLD “DEMAND DESTRUCTION”
Su
pp
ly
Supply & Demand in
Balance
Minimal Disruption
Recession Depression
Demand Destruction

04/19/23 21
WHAT ABOUT “DEMAND DESTRUCTION”
• Is demand destruction the solution or the problem?
• It is always the “default solution:” Absent mitigation initiatives, it will always equate oil supply with demand
• However, demand destruction is an euphemism for recession, depression, mass unemployment, etc.
• People – & governments – will not passively accept massive demand destruction and may opt for desperate alternatives
• Therefore, objective is to use mitigation initiatives to minimize and control demand destruction
04/19/23 22
5. JUST ANOTHER “ENERGY CRISIS”?
• Not true• Not just another “energy crisis”• Oil is the lifeblood of the world.• Oil peaking will create a severe liquid fuels problem for the
transportation sector.• It is not an “energy crisis” in the usual sense that term has been
used.• For some forms of transportation (e.g., airplanes, heavy trucks)
there is no substitute for petroleum.• There will be no quick fixes for this problem, on either the
demand side or the supply side.• Many analysts and policy-makers do not comprehend this.

04/19/23 23
No, we’re facing a liquid fuels crisis

04/19/23 24
• Energy is inherently very large scale.- It’s not computers or
electronics- No magic bullets
• Long time to build capacity & savings• Long lifetimes• Inherently expensive
The only solution: Start Early!
WHY SO LONG TO MITIGATE?

04/19/23 25
Fleet Size Median Cost to Replace Lifetime Half the Fleet
(Years) (2006 $)
Automobiles 140 million 17 $1.6 trillion
Light Trucks, 90 million 16 $1.3 trillionSUVs,etc.
Heavy Trucks, 7.5 million 28 $1.7 trillionBuses, etc.
Aircraft 8,500 22 $0.3 trillion
CHARACERISTICS OF U.S.TRANSPORTATION FLEETS

04/19/23 26
TRANSPORTATION EQUIPMENT CHANGES
Efficiency improvements possible:
Large in some fleets, smaller in others,
BUT
Change is slow & expensive.
Fuel must be provided for existing fleets.

04/19/23 27
6. RENEWABLES WILL SAVE US?
• Not necessarily.
• Major renewables do not produce liquid transportation fuels
• Only major renewable options are hydro, biomass, and geothermal, and these are site and capacity limited
• Combined they provided 5.4% of U.S. energy in 2005, and EIA forecasts that they will provide 6% in 2030
• The most publicized renewable options – wind, photovoltaics, and solar thermal – remain niche applications: They provided 0.15% of U.S. energy in 2005, and EIA forecasts that they will provide 0.4% in 2030
• Only renewables capable of producing liquid fuels are biofuels

04/19/23 28
WHAT IS RENEWABLE ENERGY?
Renewable energy electricity technologies consist of:
• Hydroelectricity
• Biomass
• Geothermal
• Wind
• Photovoltaics
• Solar thermal
Except for hydro and
industry biomass,
renewables’ U.S.
energy contribution is small and is forecast to remain so
Only renewable technologies such as ethanol, bio-diesel, and biomass-to-liquids, produce liquid fuels, not electricity

04/19/23 29
CELLULOSIC ETHANOL IS REQUIRED
Potential of corn-based ethanol and biodiesel is limited, and they are not energy efficient
Cellulosic ethanol (CE) is the holy grail of biomass liquids: If it cannot be made to be commercially viable, then biomass can never play a significant role in liquid fuels
Cellulosic ethanol is an alternative fuel made from a wide variety of non-food plant materials (or feedstocks), including agricultural wastes, industrial plant waste, and energy crops (like switchgrass)
Cellulosic ethanol must work because other forms of ethanol are limitedCellulosic ethanol requires a more complex, difficult, & expensive
conversion process than traditional corn-based ethanol
04/19/23 30
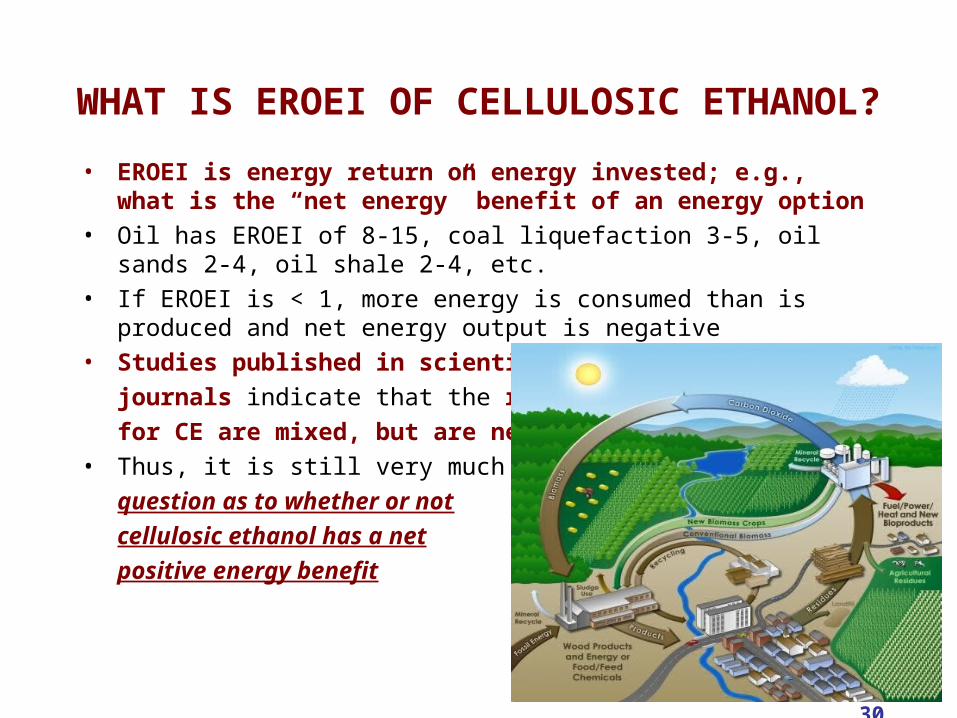
WHAT IS EROEI OF CELLULOSIC ETHANOL?
• EROEI is energy return on energy invested; e.g., what is the “net energy” benefit of an energy option
• Oil has EROEI of 8-15, coal liquefaction 3-5, oil sands 2-4, oil shale 2-4, etc.
• If EROEI is < 1, more energy is consumed than is produced and net energy output is negative
• Studies published in scientific
journals indicate that the results
for CE are mixed, but are near 1
• Thus, it is still very much an open
question as to whether or not
cellulosic ethanol has a net
positive energy benefit

04/19/23 31
BASIC FACT: IT TAKES ENERGYTO MAKE ENERGY
(All fuel conversion processes lose energy)
Process Conversion Type Efficiency
Dry Cell Battery Chemical to Electrical 85-95%Natural Gas to Compressed Chemical to Chemical 85%Crude Oil to Gasoline Chemical to Chemical 79%
Natural Gas to H2 Chemical to Chemical 60%Coal to Gasoline Chemical to Chemical 50%
Grid Electric to H2 Chemical to Chemical 22%Photovoltaic Radiative to Electrical 15-25%Soybean to Bio-Diesel Chemical to Chemical 30%Corn to Ethanol Chemical to Chemical 5-10%Plant Photosynthesis Radiative to Chemical 4-5%

04/19/23 32
BIOMASS FEEDSTOCK PRODUCTIONIS VERY FOSSIL FUEL INTENSIVE

04/19/23 33
CURRENT U.S. ENERGY CONSUMPTION IS 20% GREATER THAN ALL U.S.
BIOMASS
DOE Report

04/19/23 34
CELLULOSIC ETHANOL PLANT FACT OF LIFE
After 50 years and >$1 billion of R&D, only one pilot plant (Iogen Corp.) is operating, producing about 160,000 gal./yr. of ethanol -- 1/6 of its planned capacity, with lack of scalability
In addition to cutting most vegetation in U.S., to obtain 130 billion gal. of ethanol by 2030 Iogen plant must be scaled up 81,000 times
In human history, such scale up has never occurred within 20 years
We would need 67,000 Iogen Ottawa plants just to replace the petroleum refineries in Texas alone
Industrial cellulosic ethanol technology does not exist
Bottom line: Dangerous to assume that cellulosic ethanol will make major contribution to liquid fuels needs

04/19/23 35
7. GOVERNMENT INTERVENTION NOT REQUIRED?
• Wrong: Intervention by governments will be required• Economic and social implications of oil peaking would otherwise
be chaotic• The experiences of the 1970s and 1980s offer important
guides as to government actions that are desirable and those that are undesirable
• Process will not be easy• Burden of mitigation will fall on industry• However, due to the need for urgent action, governments will
have to provide support, incentives, and facilitation • But government intervention can have both positive and
negative effects

04/19/23 36
GOVERNMENT ACTIONS: DESIRABLEAND UNDESIRABLE
• The past can be a guide to the future• Worthwhile government initiatives
-- Mandated energy efficiency programs-- R&D-- Scientific and technical education and training programs-- Demonstration and pilot plants-- Guaranteed price floors for alternative fuels-- Provision of objective information and analyses-- International burden sharing agreements-- Development of strategic energy reserves-- Data gathering – especially reliable oil & gas reserve
data-- Rational tax policies-- Vehicle fuel efficiency standards-- Targeted, market neutral subsidies and incentives-- Public education as to the problems we face

04/19/23 37
GOVERNMENT ACTIONS: DESIRABLEAND UNDESIRABLE
• Questionable government initiatives-- Bashing the energy companies – may be popular, but national oil companies control 80 – 90% of world oil-- Gasoline rationing – nightmare no matter how implemented-- Price controls – lead to shortages and black market-- Allocation controls – impossible to enforce-- “Excess profits” taxes-- Picking “winners and losers”-- Subsidies and incentives that are not market neutral-- Spurious regulations; e.g., speed limits, odd-even fuel availability days, micro fuel restrictions, etc.
• Government intervention that is highly unpopular with public will ultimately not be effective – U.S. examples: alcohol prohibition during 1920s; energy controls during 1970s

04/19/23 38
• Skilled workers & industrial capacity worldwide are in short supply for the level of effort that is required
• Massive commercial crash programs are rare• Startup will almost certainly be much slower (and cost more)
than is generally assumed• Some countries may delay, others will proceed rapidly with
mitigation. China may have started (Canada, Venezuela)• Not clear how environmental protection will fare if there is
widespread joblessness, high inflation, & severe recession• Relationship between peak oil and climate change – two
intractable long term problems the world faces
SOME ISSUES GOVERNMENTSMUST ADDRESS

04/19/23 39
8. PLENTY OF TIME TO ADDRESS THE PROBLEM?
• Not true• Time may have already run out to avoid serious problems.• Waiting until conventional oil production peaks before initiating
crash program mitigation leaves world with a significant liquid fuel shortage for two decades or longer.
• Viable mitigation options exist.• However, they must be implemented on a crash basis at least a
decade or more in advance of oil peaking.• Thus, if oil peaking occurs within the next decade (as many
experts predict), it may already be too late to avoid severe worldwide economic and social consequences.
• Action is required immediately.

04/19/23 40
U.S. LOWER-48 OIL PRODUCTION PEAKED & DECLINED
3.5
3.0
2.5
2.0
1.5
1.0
0.5
0
Actual (EIA)
Approximation
1950 1960 1970 1980 1990 2000
Year
Production(Billions of
Barrels per Year)
A huge, complex & geologically varied oil province.
We used this pattern as a surrogate for the world.

04/19/23 41
0
20
40
60
80
100
-20 -10 0 +10 +20
YEARS BEFORE / AFTER OIL PEAK
PRODUCTION
(MM bpd)
120
Assumed:
• Demand @ 2%
• Oil Decline @ 2%
• Peak @ 100 MM bpd
(Not a prediction)
Extrapolated Demand -Growing World Economy
WORLD OIL SUPPLY & DEMANDLOWER 48 PRODUCTION PATTERN & EXTRAPOLATED DEMAND GROWTH
Shortage
L 48 production pattern

04/19/23 42
0
20
40
60
80
100
-20 -10 0 +10 +20
YEARS BEFORE / AFTER OIL PEAK
PRODUCTION(MM bpd)
120
SCENARIO I: MITIGATION @ PEAKING
Mitigation
Shortage

04/19/23 43
0
20
40
60
80
100
-20 -10 0 +10 +20
YEARS BEFORE / AFTER OIL PEAK
PRODUCTION(MM bpd)
120
SCENARIO II: MITIGATION 10 YEARS BEFORE PEAKING
Mitigation
Shortage
Oil Decline Delayed
Start

04/19/23 44
0
20
40
60
80
100
-20 -10 0 +10 +20
YEARS BEFORE / AFTER OIL PEAK
PRODUCTION(MM bpd)
120
SCENARIO III: MITIGATION 20 YEARSBEFORE PEAKING
Mitigation
Oil Peaking Further
Delayed Start

04/19/23 45
Scenario
Wait for peaking
Start 10 years early
Start 20 years early
SCENARIOS ANALYSIS CONCLUSIONSBasis: Immediate crash program implementation
Result
Oil shortages largest, longest lasting
Delays peaking; still shortages
Avoids the problem; smooth transition
No quick fix!

04/19/23 46
0 1 2 3 4 5Years After Conventional
Oil Peaking
Mill
ion
s o
f B
arre
ls p
er D
ay -
A
ssu
me
Pea
k at
100
100
9896
9492
0
6% / yr 4% / yr 2% / yr
Canadian Oil Sands
Now 2015
SOME MITIGATION EXAMPLES
50 Coal-To-Liquids Plants - When?
LDV Savings World Crash Program at
Year 20

04/19/23 47
9. OIL PEAKING MEANS “END OF CIVILIZATION AS WE KNOW IT”
• Not true• Recent spate of doomsday books and apocalyptic scenarios:
-- “Back to the earth”-- Abandon the cities-- Abandon the suburbs-- Reduce world population by 90%-- Economic and financial collapse-- War, famine, disintegration of civil order, etc. -- “Mad Max” on
steroids• However, viable risk management and mitigation options
exist on both the supply and demand sides• But to have substantial impact, they must be initiated more than
a decade in advance of peaking• To avoid adverse effects, we must start now – or yesterday

04/19/23 48
Time
Cost of Error
COST AS A FUNCTION OF START TIME (Notional)
Premature Start
Peaking Scenario I
- 10 Years Scenario II
- 20 Years Scenario III

04/19/23 49
0
20
40
60
80
100
-20 -10 0 +10 +20
YEARS BEFORE / AFTER OIL PEAK
PRODUCTION(MM bpd)
120 Supply & Demand = 2%
Oil Decline = 2%
Extrapolated Demand
Peaking Assumed at 100 MM bpd
LOOK AGAIN AT THE SHORTFALL
The “shortage”
after 20 years could be 80%
of today’s world oil
consumption65 / 82 ~ 80%

04/19/23 50
IMPLICATIONS OF FINDINGS
Controversy over interpretation; findings have various implications:
• Costs and benefits of liquid fuel requirements• What is required to maintain “current energy regime”• Implications of maintaining “current energy regime”• What is required to change “current energy regime”• What is the “new energy regime”• Time & $ required to transition to “new energy regime”
How to get from “here” to “there” – new energy regime What is “there”? When is there: 2020? 2030? 2050?
Major finding: Problem is of enormous scale, will require decades to resolve, and will require $ trillions investment. No easy, “painless” solution

04/19/23 51
IMPLICATIONS FOR SUPPLY CHAIN MANAGEMENT
• Major disruptions will impact virtually all aspects of the supply chain
• The industry can expect considerable instability in a number of areas.
• Transportation is especially vulnerable.• Planning will become much more difficult and as disruptions
occur and uncertainty increases.• Prices will become far more volatile.• Risks will also increase as managers have less control over
major portions of the supply chain.• In midst of such an unfamiliar global situation, preparation and
planning are crucial.• Major implication: Increased risk and uncertainty throughout
the supply chain

04/19/23 52
RECOMMENDATIONS FOR SUPPLYCHAIN MANAGEMENT
• Two major ways that the supply chain industry can prepare for world oil peaking.
• In micro sense, supply chain managers have to recognize what is likely to happen in the future and change their plans and methods of doing business accordingly.-- Educate themselves as to the reality and implications of
looming oil shortages-- Shifting to more efficient and secure models of transportation and inventory management
• In a macro sense, all participants in the supply chain should encourage their national and regional governments to recognize the impending liquid fuels crisis and take appropriate remedial actions.
• Burden of mitigation will fall on industry, but governments must provide support, incentives and facilitation to ensure action is taken.

04/19/23 53
THE EXAMPLE OF FED EX
• A major player in supply chain business• $32 billion in revenues, 250,000 employees, >700 aircraft,
50,000 vehicles• In 2006, spent $3.5 billion for fuel• FedEx actions, micro:
-- Abandoned fuel price hedging; utilizing fuel surcharges
-- Seeking more fuel efficient and hybrid vehicles
-- Exploring use of alternative aviation fuels• FedEx actions, macro:
-- Co chair Securing America’s Future Energy, dedicated to
reducing U.S. imports and increasing energy security
-- Encouraging Federal govt. development of alternate fuels
-- Promoting U.S vehicle fuel efficiency standards

04/19/23 54
THREE POLICY RECOMMENDATIONS
1. Federal government should increase vehicle fuel efficiency standards and initiate substitute liquid fuels mitigation options.-- On the demand side, government should stress transportation efficiency and enhanced fuel efficiency standards for all types of vehicles.-- On the supply side, government should encourage and pursue all viable options: Coal-to-liquids, oil shale, oil sands, enhanced oil recovery, heavy oil, gas-to-liquids, biomass, diesel, hybrids, and plug in electric vehicles.
2. State and local governments should encourage smart growth, telecommuting, mass transit, and other transportation fuel efficiency options and facilitate and expedite the siting of substitute liquid fuels plants.
3. All levels of government should educate the public to the fact that we face a serious liquid fuels problem that will require controversial and unpopular measures to reduce demand and increase supply.

04/19/23 55
HOWEVER, UNLESS AGGRESSIVE MITIGATION INITIATIVES ARE BEGUN SOON……..
It could happen again!
04/19/23 56
LOCAL CONTACT INFORMATION
While in Australia through July 6,
Dr. Bezdek can be contacted via ASPO Australia
Association for the Study of Peak Oil and Gas
www.ASPO-Australia.org.au
International Australia
Related Documents