Longitudinal Study of Vision and Retinal Nerve Fiber Layer Thickness in MS Lauren S. Talman, BA 1 , Esther R. Bisker, MD 1 , David J. Sackel, BS 1 , David A. Long Jr., BS 1 , Kristin M. Galetta, MS 1 , John N. Ratchford, MD 5 , Deacon J. Lile, BA 1 , Sheena K. Farrell, BS 5 , Michael J. Loguidice, BA 1 , Gina Remington, BSN, RN 6 , Amy Conger, COA 6 , Teresa C. Frohman, BS 6 , Dina A. Jacobs, MD 1 , Clyde E. Markowitz, MD 1 , Gary R. Cutter, PhD 7 , Gui-Shuang Ying, PhD 3,4 , Yang Dai, PhD 3,4 , Maureen G. Maguire, PhD 3,4 , Steven L. Galetta, MD 1,3 , Elliot M. Frohman, MD, PhD 6 , Peter A. Calabresi, MD 5 , and Laura J. Balcer, MD, MSCE 1,2,3 1 Department of Neurology, University of Pennsylvania School of Medicine, Philadelphia, PA 2 Department of Epidemiology, University of Pennsylvania School of Medicine, Philadelphia, PA 3 Department of Ophthalmology, University of Pennsylvania School of Medicine, Philadelphia, PA 4 Department of Biostatistics, University of Pennsylvania School of Medicine, Philadelphia, PA 5 Department of Neurology, The Johns Hopkins University School of Medicine, Baltimore, MD 6 Department of Neurology, University of Texas Southwestern Medical Center, Dallas, TX 7 Department of Biostatistics, University of Alabama, Birmingham, AL Abstract Objective—Cross-sectional studies of optical coherence tomography (OCT) show that retinal nerve fiber layer (RNFL) thickness is reduced in multiple sclerosis (MS) and correlates with visual function. We determined how longitudinal changes in RNFL thickness relate to visual loss. We also examined patterns of RNFL thinning over time in MS eyes with and without a prior history of acute optic neuritis (ON). Methods—Patients underwent OCT measurement of RNFL thickness at baseline and at 6-month intervals during a mean follow-up of 18 months at three centers. Low-contrast letter acuity (2.5%, 1.25% contrast) and visual acuity (VA) were assessed. Results—Among 299 patients (593 eyes) with ≥6 months follow-up, eyes with visual loss showed greater RNFL thinning compared to eyes with stable vision (low-contrast acuity, 2.5%: p<0.001; VA: p=0.005). RNFL thinning increased over time, with average losses of 2.9 μm at 2-3 years and 6.1 μm at 3-4.5 years (p<0.001 vs. 0.5-1-year follow-up interval). These patterns were observed for eyes with or without prior history of ON. Proportions of eyes with RNFL loss greater than test-retest variability (≥6.6 μm) increased from 11% at 0-1 year to 44% at 3-4.5 years (p<0.001). Interpretation—Progressive RNFL thinning occurs as a function of time in some patients with MS, even in the absence of ON, and is associated with clinically significant visual loss. These findings are consistent with sub-clinical axonal loss in the anterior visual pathway in MS and support the use of OCT and low-contrast acuity as methods to evaluate the effectiveness of putative neuroprotection protocols. Address all correspondence to: Dr. Laura J. Balcer, Department of Neurology, 3 E. Gates, 3400 Spruce Street, Philadelphia, PA 19104, 215-349-8072, Fax 215-349-5579, [email protected]. NIH Public Access Author Manuscript Ann Neurol. Author manuscript; available in PMC 2011 June 1. Published in final edited form as: Ann Neurol. 2010 June ; 67(6): 749–760. doi:10.1002/ana.22005. NIH-PA Author Manuscript NIH-PA Author Manuscript NIH-PA Author Manuscript

Welcome message from author
This document is posted to help you gain knowledge. Please leave a comment to let me know what you think about it! Share it to your friends and learn new things together.
Transcript
Longitudinal Study of Vision and Retinal Nerve Fiber LayerThickness in MS
Lauren S. Talman, BA1, Esther R. Bisker, MD1, David J. Sackel, BS1, David A. Long Jr.,BS1, Kristin M. Galetta, MS1, John N. Ratchford, MD5, Deacon J. Lile, BA1, Sheena K.Farrell, BS5, Michael J. Loguidice, BA1, Gina Remington, BSN, RN6, Amy Conger, COA6,Teresa C. Frohman, BS6, Dina A. Jacobs, MD1, Clyde E. Markowitz, MD1, Gary R. Cutter,PhD7, Gui-Shuang Ying, PhD3,4, Yang Dai, PhD3,4, Maureen G. Maguire, PhD3,4, Steven L.Galetta, MD1,3, Elliot M. Frohman, MD, PhD6, Peter A. Calabresi, MD5, and Laura J. Balcer,MD, MSCE1,2,3
1Department of Neurology, University of Pennsylvania School of Medicine, Philadelphia, PA2Department of Epidemiology, University of Pennsylvania School of Medicine, Philadelphia, PA3Department of Ophthalmology, University of Pennsylvania School of Medicine, Philadelphia, PA4Department of Biostatistics, University of Pennsylvania School of Medicine, Philadelphia, PA5Department of Neurology, The Johns Hopkins University School of Medicine, Baltimore, MD6Department of Neurology, University of Texas Southwestern Medical Center, Dallas, TX7Department of Biostatistics, University of Alabama, Birmingham, AL
AbstractObjective—Cross-sectional studies of optical coherence tomography (OCT) show that retinalnerve fiber layer (RNFL) thickness is reduced in multiple sclerosis (MS) and correlates with visualfunction. We determined how longitudinal changes in RNFL thickness relate to visual loss. Wealso examined patterns of RNFL thinning over time in MS eyes with and without a prior history ofacute optic neuritis (ON).
Methods—Patients underwent OCT measurement of RNFL thickness at baseline and at 6-monthintervals during a mean follow-up of 18 months at three centers. Low-contrast letter acuity (2.5%,1.25% contrast) and visual acuity (VA) were assessed.
Results—Among 299 patients (593 eyes) with ≥6 months follow-up, eyes with visual lossshowed greater RNFL thinning compared to eyes with stable vision (low-contrast acuity, 2.5%:p<0.001; VA: p=0.005). RNFL thinning increased over time, with average losses of 2.9 μm at 2-3years and 6.1 μm at 3-4.5 years (p<0.001 vs. 0.5-1-year follow-up interval). These patterns wereobserved for eyes with or without prior history of ON. Proportions of eyes with RNFL loss greaterthan test-retest variability (≥6.6 μm) increased from 11% at 0-1 year to 44% at 3-4.5 years(p<0.001).
Interpretation—Progressive RNFL thinning occurs as a function of time in some patients withMS, even in the absence of ON, and is associated with clinically significant visual loss. Thesefindings are consistent with sub-clinical axonal loss in the anterior visual pathway in MS andsupport the use of OCT and low-contrast acuity as methods to evaluate the effectiveness ofputative neuroprotection protocols.
Address all correspondence to: Dr. Laura J. Balcer, Department of Neurology, 3 E. Gates, 3400 Spruce Street, Philadelphia, PA19104, 215-349-8072, Fax 215-349-5579, [email protected].
NIH Public AccessAuthor ManuscriptAnn Neurol. Author manuscript; available in PMC 2011 June 1.
Published in final edited form as:Ann Neurol. 2010 June ; 67(6): 749–760. doi:10.1002/ana.22005.
NIH
-PA Author Manuscript
NIH
-PA Author Manuscript
NIH
-PA Author Manuscript
Visual dysfunction is a common cause of disability and reduced quality of life in multiplesclerosis (MS).1 The anterior visual pathway is a frequent site for inflammation anddemyelination, and axonal degeneration is likely to be a final common pathway topermanent visual loss.2-5 Recognized by MS experts as a critical dimension for outcomesassessment,6 vision has been an important area of investigation. The findings of manystudies have supported low-contrast letter acuity as a candidate clinical trial outcomemeasure. It can capture subtle visual impairment, treatment effects, MRI lesion burden,prolonged visual evoked potential latencies, and quality of life.1,7-13 Many ongoing MStrials have incorporated low-contrast acuity as a tertiary outcome.
The emergence of optical coherence tomography (OCT) in MS has brought the anteriorvisual pathway to the forefront as a model for measuring therapeutic efficacy, particularlyfor trials involving neuroprotection.14-32 A reliable marker for axonal loss in MS,24 retinalnerve fiber layer (RNFL) thickness by OCT is reduced even in the absence of past episodesof acute optic neuritis (ON).15,18-31 While cross-sectional studies have shown strongcorrelations between RNFL thickness and visual function, disease duration, MS sub-type,and MRI abnormalities, the relation of visual loss to RNFL thinning over time in MS has notbeen established.13-31
One of the most important characteristics for evaluating outcome measures is the capacity todetect change over time.6,32 In this longitudinal study, we determined how change in RNFLthickness relates to visual loss in an MS cohort. We also examined patterns of RNFLthinning that occur over time in MS eyes either with or without prior episodes of ON.
Subjects and MethodsSubjects
Participants were enrolled in an ongoing prospective study of visual outcome measures inMS at the University of Pennsylvania, University of Texas Southwestern Medical Center atDallas, and Johns Hopkins University. Subjects represented a convenience sample ofpatients willing to undergo OCT imaging and vision testing for research purposes, and werenot selected based on clinical features or extent of symptoms. Following their initial baselinevisit, patients were invited to follow-up at six to 12-month intervals. Patients with ≥6months' follow-up were included in these analyses. The present cohort includes >1,000patients with baseline visits, and therefore does not represent substantial overlap withpreviously published reports of OCT in MS.18 MS was diagnosed by standard criteria.33
Patients who had not yet followed-up at the time of these analyses were those who 1) hadnot been in the study for at least 6 months, 2) were unable to follow-up due to relocation ortransportation issues, or 3) chose not to follow-up in the study. Patients with clinically-isolated syndromes were required to fulfill MRI and clinical criteria of dissemination in timeand space for diagnosis of MS. Types of disease-modifying therapies were also recorded atstudy visits.
Patients with comorbid ocular conditions not related to MS were excluded by history, chartreview, and examination. A past history (months to years prior to enrollment) of acute opticneuritis (ON) was determined by self- and physician report and confirmed by record review.Eyes with pathologic hyperopia or myopia (spherical correction ≥ +10 diopters or ≤ -10diopters) were not included in this study. Patients with an acute attack of ON in either eyethat was ongoing or had occurred within three months prior to testing were not included inthis study in order to minimize potential optic disc swelling (and RNFL edema) associatedwith acute ON. Optic disc swelling was not noted among any participants. Eyes thatdeveloped acute ON during follow-up or within 3 months before the baseline visit (n=10
Talman et al. Page 2
Ann Neurol. Author manuscript; available in PMC 2011 June 1.
NIH
-PA Author Manuscript
NIH
-PA Author Manuscript
NIH
-PA Author Manuscript
eyes of 5 patients) were excluded since the primary aim was to examine visual loss andRNFL thinning in MS that occurs outside of the acute phase of ON.
Disease-free control participants were recruited from among staff and family of patients andhad no history of ocular or neurologic disease. Control eyes were excluded if best correctedhigh-contrast visual acuities (Snellen equivalents based on Early Treatment DiabeticRetinopathy [ETDRS] charts) were worse than 20/20 (minimum letter score 70).Institutional Review Board (IRB) approval was obtained for all study protocols, and eachsubject provided written informed consent. The study was conducted in accordance withHIPAA guidelines.
Optical Coherence TomographyOptical coherence tomography (OCT) was performed for both eyes using OCT-3, version4.0 software (Carl Zeiss Meditec, Inc., Dublin, CA). Fast retinal nerve fiber layer (RNFL)thickness protocols were used. OCT was performed by trained technicians following visualfunction testing. Scans were performed without flash photography to optimize patientcomfort. If the pupils were large enough to permit adequate imaging (≥5 mm), scanning wascompleted without the use of mydriatic drops. Dilation has little impact on OCT values andreproducibility, and previous studies of MS patients have been performed without uniformuse of mydriatics.18,25 Pupils were dilated with 1% tropicamide when necessary. Internalfixation was used, and a patch was placed over the non-tested eye. Good quality scans weredefined according to specifications in the OCT-3 User Manual; criteria included signalstrength ≥7 (maximum 10), centering of the scan, and uniform brightness. This is importantsince RNFL thickness measurements may vary by signal strength.34 Values for averageRNFL thickness (average for 360° around the optic disc) were recorded.
Visual Function TestingLow-contrast letter acuity testing was performed for each eye using retroilluminated low-contrast Sloan letter charts (2.5% and 1.25% contrast levels at 2 meters, Precision Vision,LaSalle, IL).7-11 High-contrast visual acuity was assessed using retroilluminated ETDRScharts at 3.2 meters. Low-contrast Sloan letter and ETDRS charts have a similarstandardized format with 5 letters per line. Numbers of letters identified (maximum 70/chart) were recorded for each eye. This scoring method provides continuous scale that isequivalent to logMAR (log minimal angle of resolution) yet uses units that are more familiarto neurologists and which have been used in recent MS trials.11 Testing was performed bytrained technicians experienced in research examinations. Standardized protocols, includingwritten scripts and instructions, were followed. Snellen acuity equivalents were determinedbased on scores for ETDRS charts. Participants underwent detailed refractions in order todetermine correlations with OCT that reflected best corrected vision.
Visual loss over time was summarized by determining whether changes exceeded theamount that would be expected from repeated testing when there was no real change.35 Forhigh-contrast visual acuity (VA), 2-line, or 10-letter, differences have been usedtraditionally as criteria for clinically meaningful change, based on studies of test-retestvariability.35 However, recent studies have demonstrated that, in patients with relativelygood visual acuity, 5-letter or 1-line changes in high-contrast VA are unlikely to be due totesting error.36 Examination of our inter-rater reliability study data has revealed that 5 lettersrepresents two standard deviations of inter-rater difference for VA in patients with MS.Correspondingly, two standard deviations of inter-rater difference for low-contrast acuitywere equal to 7 letters.7 These values were used as criteria for visual loss in the presentstudy. Since eyes with scores of <5 letters (for VA) or <7 letters (for low-contrast acuity) atthe baseline visit could not have visual loss during follow-up based on the above definitions,
Talman et al. Page 3
Ann Neurol. Author manuscript; available in PMC 2011 June 1.
NIH
-PA Author Manuscript
NIH
-PA Author Manuscript
NIH
-PA Author Manuscript
these eyes were not included in analyses comparing degrees of RNFL thinning orproportions of eyes with visual loss.
Statistical AnalysisStatistical analyses were performed using Stata 10.0 software. Generalized estimatingequation (GEE) models, accounting for age and adjusting for within-patient, inter-eyecorrelations, were used to determine the relation between follow-up period and change inRNFL thickness from baseline. GEE regression models account not only for the effects ofage and other covariates on the outcome, but also for within-patient, inter-eye correlation inoutcomes. This is necessary since both eyes were included in the analyses for patients in thisstudy. Age was included in the models since this variable may be associated with visualfunction and RNFL thickness; minimal RNFL thinning (0.16 μm/year) has been reportedamong normal subjects.37,38
Changes in RNFL thickness from baseline were determined for eyes of patients who hadreceived at least one follow-up visit at the time of analysis. Each one-year follow-up intervalwas plotted against change in RNFL, with each eye represented only once in the model. Forpatients with multiple follow-up visits, the change from baseline for the last follow-up visitwas used for analyses. Logistic regression models, accounting for age and adjusting forwithin-patient, inter-eye correlations, were used to assess the association of RNFL thinningwith losses of high- and low-contrast acuity (defined by criteria above). Models alsoexamined potential effects of disease duration and disease-modifying therapies on therelation of RNFL thinning to visual loss and length of follow-up. Exploratory analysesexamined the relation of treatment type and status to RNFL thinning and visual loss. Interms of univariate analyses, Pearson linear correlation coefficients were calculated. Toexamine whether eyes with longer follow-up were more likely to have visual or RNFL lossbeyond levels expected based on test-retest variability, the chi-square test for trend inbinomial proportions was used. For these analyses, eyes were categorized by 1-year follow-up intervals based on last follow-up visit. Type I error for significance was p<0.05.
ResultsCharacteristics of Baseline and Follow-Up Cohorts
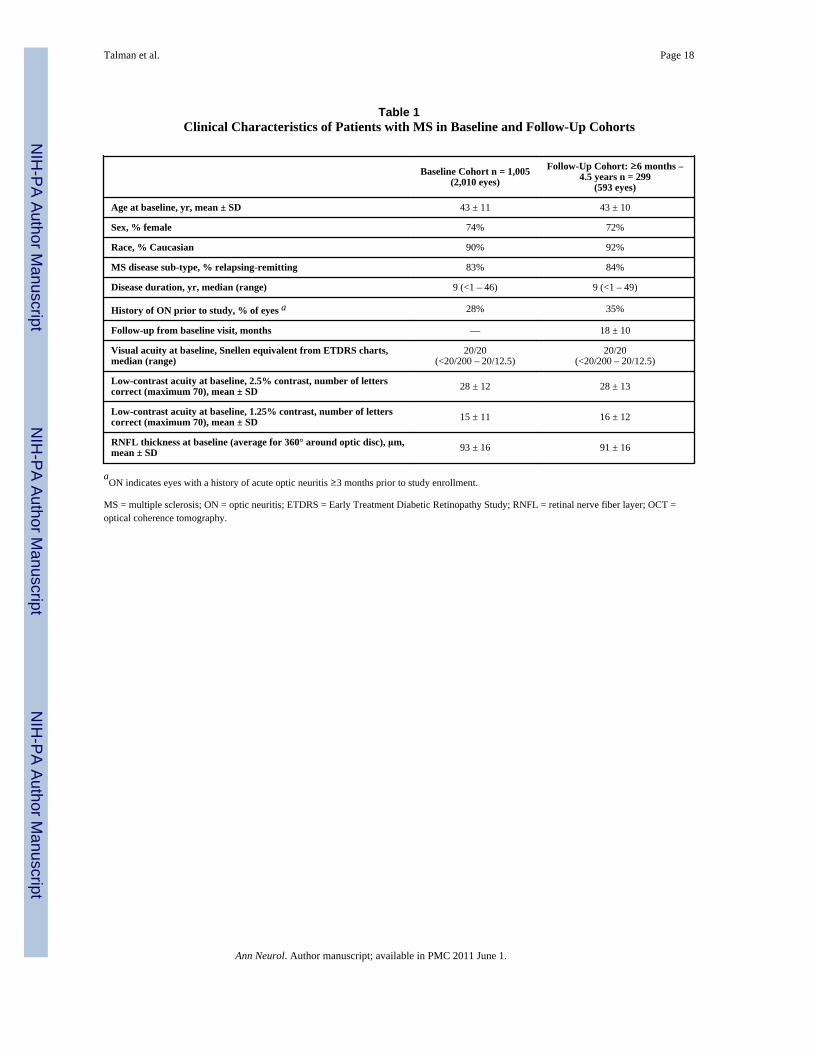
Data for the collaborative study cohort, including 1,005 patients with MS (2,010 eyes) witha baseline or first visit, are shown in Table 1. Patients with at least one follow-up visit andfollow-up time of 6 months or greater (n=593 eyes of 299 patients) did not differ from thebaseline cohort with regard to age, gender mix, or MS sub-type. The follow-up cohort had aslightly greater proportion of eyes with a history of acute optic neuritis (ON) prior to studyenrollment. Mean follow-up was 18 months, and ranged from 6 months to 4.5 years foranalyses of the follow-up cohort. Eighty-seven percent of patients (n=518 eyes) were ondisease-modifying therapy at the time of the last follow-up visit. Baseline RNFL thicknessand visual function scores were similar between the baseline and follow-up cohorts (p=0.23,t-test).
Visual Loss and RNFL ThinningBased on changes from baseline of ≥5 letters for high-contrast VA or ≥7 letters for low-contrast acuity, the following percentages of MS eyes had visual loss: high-contrast VA:12% of eyes (12% of patients); low-contrast acuity, 2.5%: 12% of eyes (13% of patients);low-contrast acuity, 1.25%: 13% of eyes (14% of patients). By our protocol, we excludedpatients who had acute ON during the observation period of the study. For eyes with ahistory of ON prior to study enrollment, percentages of eyes with visual loss were 12% forVA, 12% for low-contrast acuity at 2.5%, and 15% for low-contrast acuity at 1.25%.
Talman et al. Page 4
Ann Neurol. Author manuscript; available in PMC 2011 June 1.
NIH
-PA Author Manuscript
NIH
-PA Author Manuscript
NIH
-PA Author Manuscript
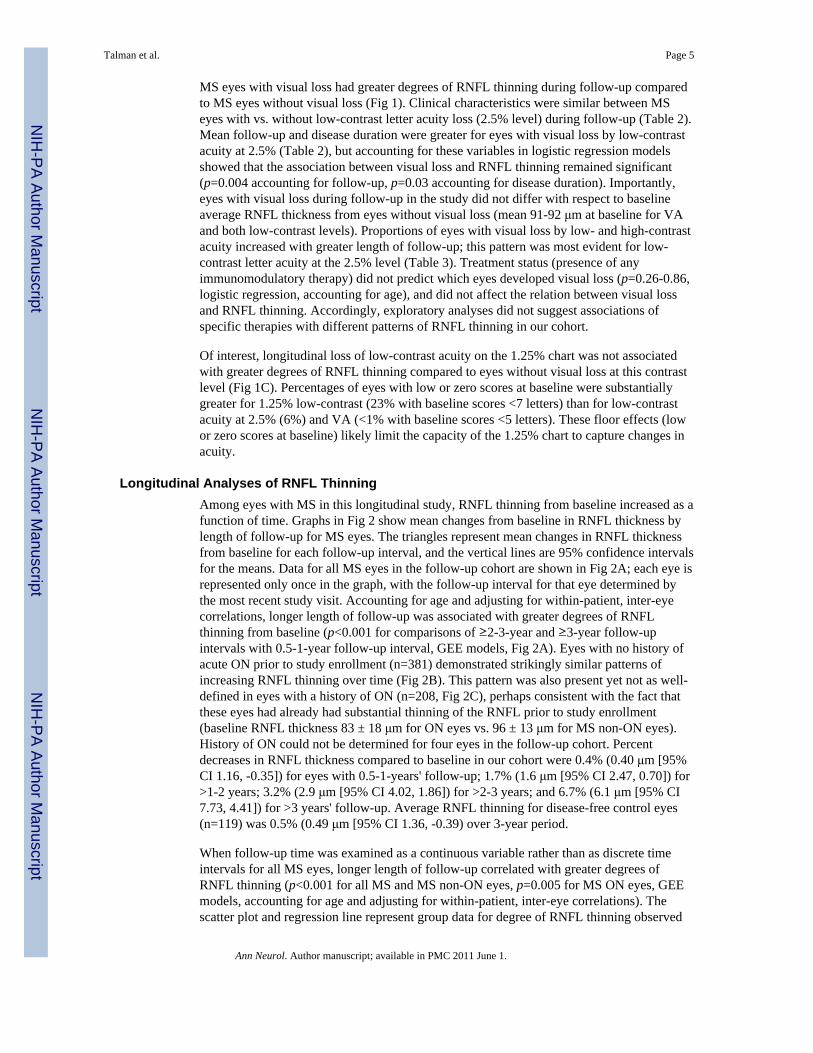
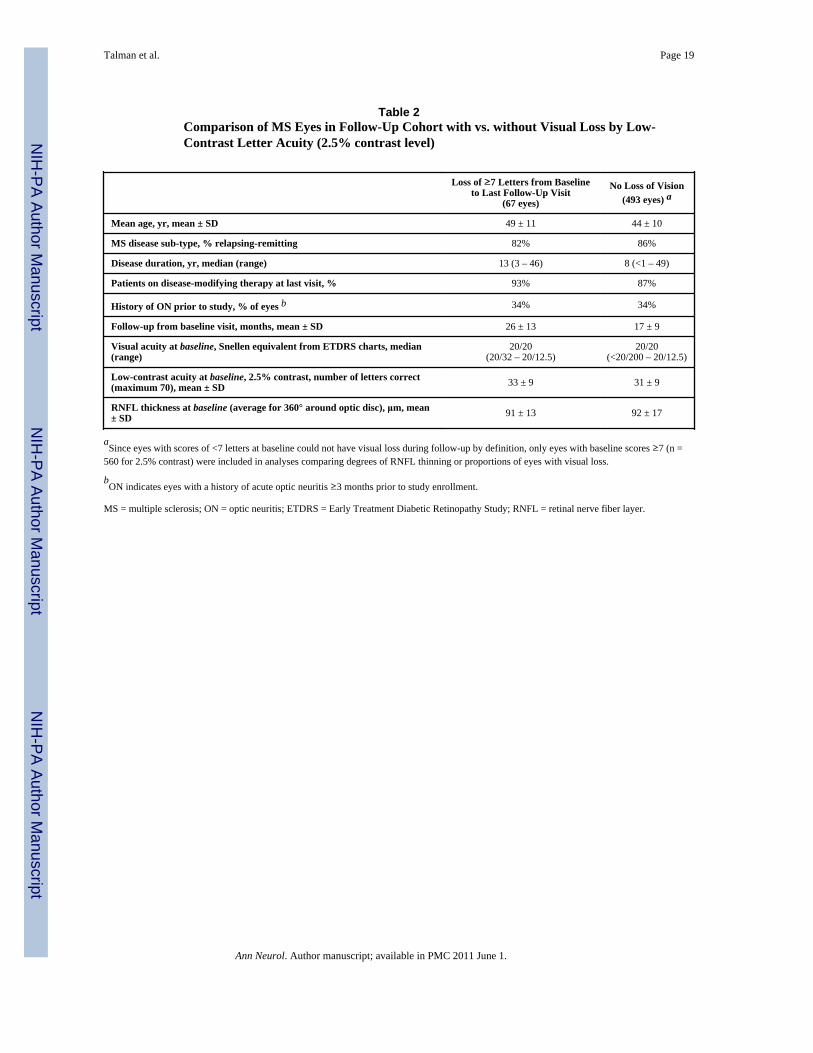
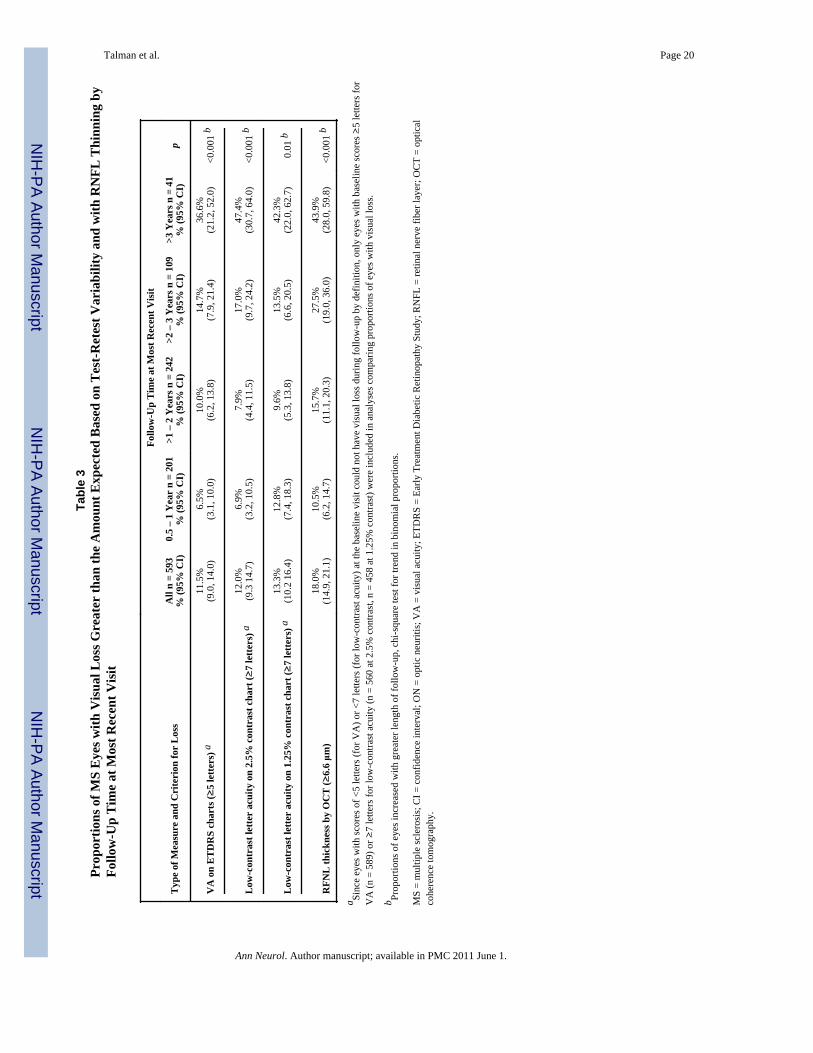
MS eyes with visual loss had greater degrees of RNFL thinning during follow-up comparedto MS eyes without visual loss (Fig 1). Clinical characteristics were similar between MSeyes with vs. without low-contrast letter acuity loss (2.5% level) during follow-up (Table 2).Mean follow-up and disease duration were greater for eyes with visual loss by low-contrastacuity at 2.5% (Table 2), but accounting for these variables in logistic regression modelsshowed that the association between visual loss and RNFL thinning remained significant(p=0.004 accounting for follow-up, p=0.03 accounting for disease duration). Importantly,eyes with visual loss during follow-up in the study did not differ with respect to baselineaverage RNFL thickness from eyes without visual loss (mean 91-92 μm at baseline for VAand both low-contrast levels). Proportions of eyes with visual loss by low- and high-contrastacuity increased with greater length of follow-up; this pattern was most evident for low-contrast letter acuity at the 2.5% level (Table 3). Treatment status (presence of anyimmunomodulatory therapy) did not predict which eyes developed visual loss (p=0.26-0.86,logistic regression, accounting for age), and did not affect the relation between visual lossand RNFL thinning. Accordingly, exploratory analyses did not suggest associations ofspecific therapies with different patterns of RNFL thinning in our cohort.
Of interest, longitudinal loss of low-contrast acuity on the 1.25% chart was not associatedwith greater degrees of RNFL thinning compared to eyes without visual loss at this contrastlevel (Fig 1C). Percentages of eyes with low or zero scores at baseline were substantiallygreater for 1.25% low-contrast (23% with baseline scores <7 letters) than for low-contrastacuity at 2.5% (6%) and VA (<1% with baseline scores <5 letters). These floor effects (lowor zero scores at baseline) likely limit the capacity of the 1.25% chart to capture changes inacuity.
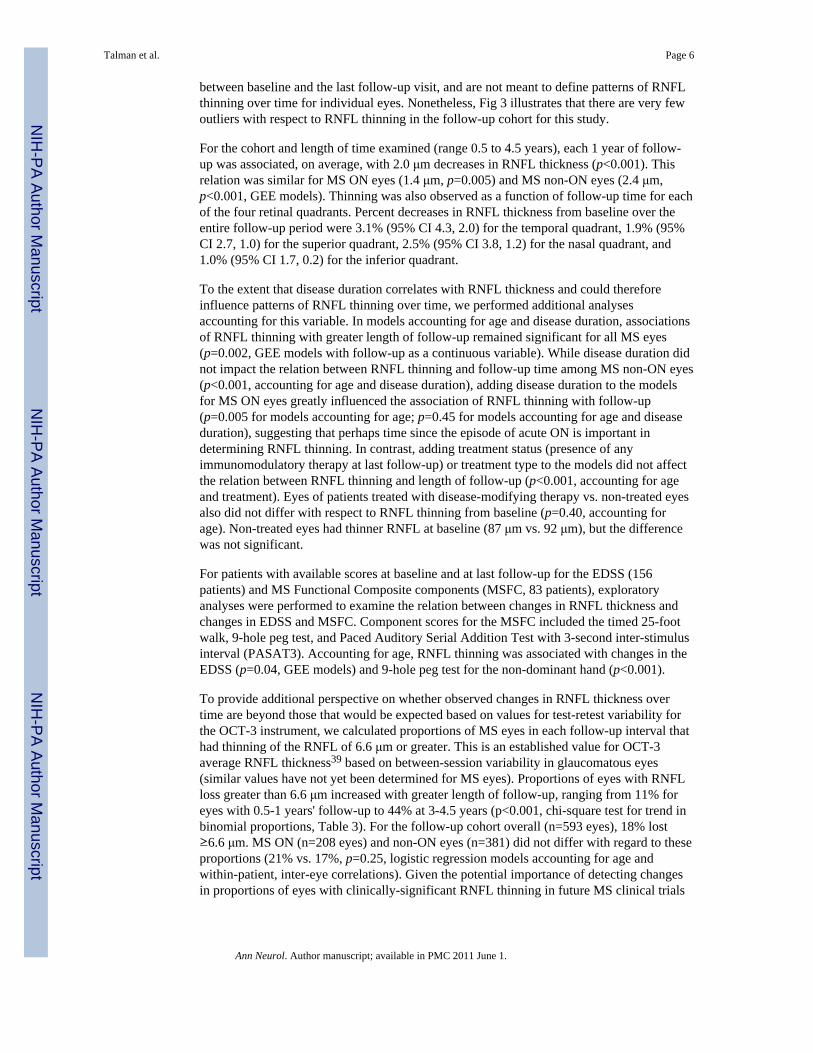
Longitudinal Analyses of RNFL ThinningAmong eyes with MS in this longitudinal study, RNFL thinning from baseline increased as afunction of time. Graphs in Fig 2 show mean changes from baseline in RNFL thickness bylength of follow-up for MS eyes. The triangles represent mean changes in RNFL thicknessfrom baseline for each follow-up interval, and the vertical lines are 95% confidence intervalsfor the means. Data for all MS eyes in the follow-up cohort are shown in Fig 2A; each eye isrepresented only once in the graph, with the follow-up interval for that eye determined bythe most recent study visit. Accounting for age and adjusting for within-patient, inter-eyecorrelations, longer length of follow-up was associated with greater degrees of RNFLthinning from baseline (p<0.001 for comparisons of ≥2-3-year and ≥3-year follow-upintervals with 0.5-1-year follow-up interval, GEE models, Fig 2A). Eyes with no history ofacute ON prior to study enrollment (n=381) demonstrated strikingly similar patterns ofincreasing RNFL thinning over time (Fig 2B). This pattern was also present yet not as well-defined in eyes with a history of ON (n=208, Fig 2C), perhaps consistent with the fact thatthese eyes had already had substantial thinning of the RNFL prior to study enrollment(baseline RNFL thickness 83 ± 18 μm for ON eyes vs. 96 ± 13 μm for MS non-ON eyes).History of ON could not be determined for four eyes in the follow-up cohort. Percentdecreases in RNFL thickness compared to baseline in our cohort were 0.4% (0.40 μm [95%CI 1.16, -0.35]) for eyes with 0.5-1-years' follow-up; 1.7% (1.6 μm [95% CI 2.47, 0.70]) for>1-2 years; 3.2% (2.9 μm [95% CI 4.02, 1.86]) for >2-3 years; and 6.7% (6.1 μm [95% CI7.73, 4.41]) for >3 years' follow-up. Average RNFL thinning for disease-free control eyes(n=119) was 0.5% (0.49 μm [95% CI 1.36, -0.39) over 3-year period.
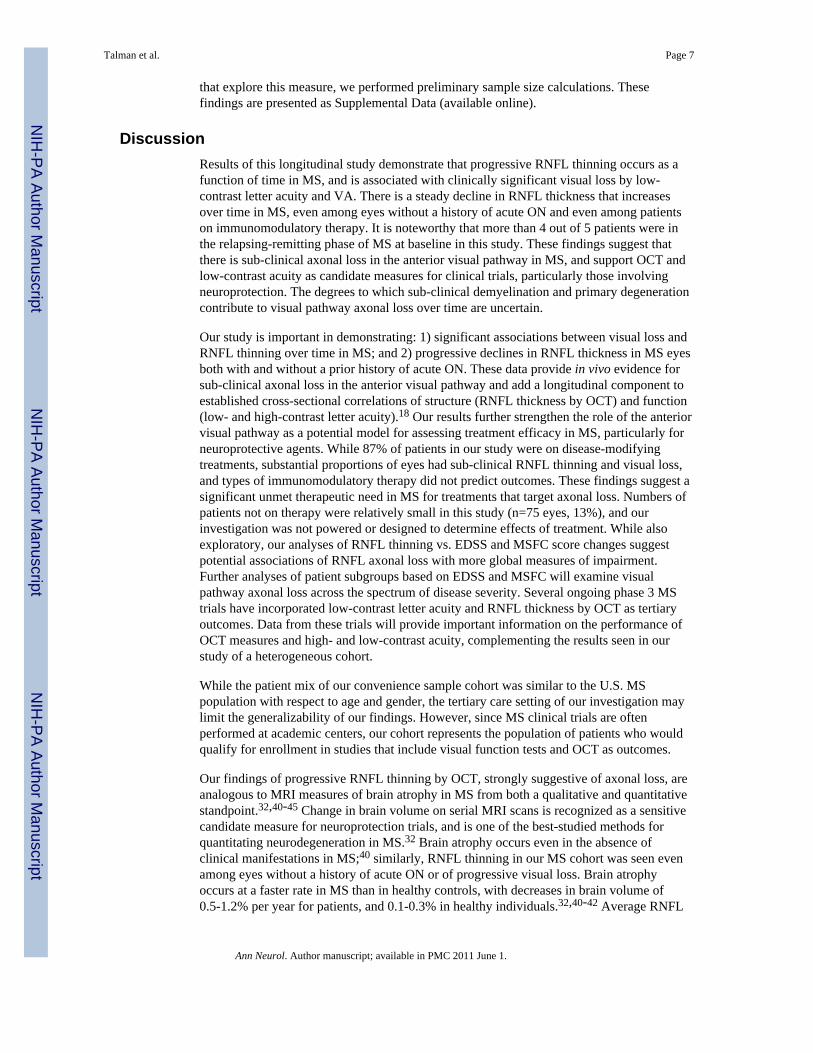
When follow-up time was examined as a continuous variable rather than as discrete timeintervals for all MS eyes, longer length of follow-up correlated with greater degrees ofRNFL thinning (p<0.001 for all MS and MS non-ON eyes, p=0.005 for MS ON eyes, GEEmodels, accounting for age and adjusting for within-patient, inter-eye correlations). Thescatter plot and regression line represent group data for degree of RNFL thinning observed
Talman et al. Page 5
Ann Neurol. Author manuscript; available in PMC 2011 June 1.
NIH
-PA Author Manuscript
NIH
-PA Author Manuscript
NIH
-PA Author Manuscript
between baseline and the last follow-up visit, and are not meant to define patterns of RNFLthinning over time for individual eyes. Nonetheless, Fig 3 illustrates that there are very fewoutliers with respect to RNFL thinning in the follow-up cohort for this study.
For the cohort and length of time examined (range 0.5 to 4.5 years), each 1 year of follow-up was associated, on average, with 2.0 μm decreases in RNFL thickness (p<0.001). Thisrelation was similar for MS ON eyes (1.4 μm, p=0.005) and MS non-ON eyes (2.4 μm,p<0.001, GEE models). Thinning was also observed as a function of follow-up time for eachof the four retinal quadrants. Percent decreases in RNFL thickness from baseline over theentire follow-up period were 3.1% (95% CI 4.3, 2.0) for the temporal quadrant, 1.9% (95%CI 2.7, 1.0) for the superior quadrant, 2.5% (95% CI 3.8, 1.2) for the nasal quadrant, and1.0% (95% CI 1.7, 0.2) for the inferior quadrant.
To the extent that disease duration correlates with RNFL thickness and could thereforeinfluence patterns of RNFL thinning over time, we performed additional analysesaccounting for this variable. In models accounting for age and disease duration, associationsof RNFL thinning with greater length of follow-up remained significant for all MS eyes(p=0.002, GEE models with follow-up as a continuous variable). While disease duration didnot impact the relation between RNFL thinning and follow-up time among MS non-ON eyes(p<0.001, accounting for age and disease duration), adding disease duration to the modelsfor MS ON eyes greatly influenced the association of RNFL thinning with follow-up(p=0.005 for models accounting for age; p=0.45 for models accounting for age and diseaseduration), suggesting that perhaps time since the episode of acute ON is important indetermining RNFL thinning. In contrast, adding treatment status (presence of anyimmunomodulatory therapy at last follow-up) or treatment type to the models did not affectthe relation between RNFL thinning and length of follow-up (p<0.001, accounting for ageand treatment). Eyes of patients treated with disease-modifying therapy vs. non-treated eyesalso did not differ with respect to RNFL thinning from baseline (p=0.40, accounting forage). Non-treated eyes had thinner RNFL at baseline (87 μm vs. 92 μm), but the differencewas not significant.
For patients with available scores at baseline and at last follow-up for the EDSS (156patients) and MS Functional Composite components (MSFC, 83 patients), exploratoryanalyses were performed to examine the relation between changes in RNFL thickness andchanges in EDSS and MSFC. Component scores for the MSFC included the timed 25-footwalk, 9-hole peg test, and Paced Auditory Serial Addition Test with 3-second inter-stimulusinterval (PASAT3). Accounting for age, RNFL thinning was associated with changes in theEDSS (p=0.04, GEE models) and 9-hole peg test for the non-dominant hand (p<0.001).
To provide additional perspective on whether observed changes in RNFL thickness overtime are beyond those that would be expected based on values for test-retest variability forthe OCT-3 instrument, we calculated proportions of MS eyes in each follow-up interval thathad thinning of the RNFL of 6.6 μm or greater. This is an established value for OCT-3average RNFL thickness39 based on between-session variability in glaucomatous eyes(similar values have not yet been determined for MS eyes). Proportions of eyes with RNFLloss greater than 6.6 μm increased with greater length of follow-up, ranging from 11% foreyes with 0.5-1 years' follow-up to 44% at 3-4.5 years (p<0.001, chi-square test for trend inbinomial proportions, Table 3). For the follow-up cohort overall (n=593 eyes), 18% lost≥6.6 μm. MS ON (n=208 eyes) and non-ON eyes (n=381) did not differ with regard to theseproportions (21% vs. 17%, p=0.25, logistic regression models accounting for age andwithin-patient, inter-eye correlations). Given the potential importance of detecting changesin proportions of eyes with clinically-significant RNFL thinning in future MS clinical trials
Talman et al. Page 6
Ann Neurol. Author manuscript; available in PMC 2011 June 1.
NIH
-PA Author Manuscript
NIH
-PA Author Manuscript
NIH
-PA Author Manuscript
that explore this measure, we performed preliminary sample size calculations. Thesefindings are presented as Supplemental Data (available online).
DiscussionResults of this longitudinal study demonstrate that progressive RNFL thinning occurs as afunction of time in MS, and is associated with clinically significant visual loss by low-contrast letter acuity and VA. There is a steady decline in RNFL thickness that increasesover time in MS, even among eyes without a history of acute ON and even among patientson immunomodulatory therapy. It is noteworthy that more than 4 out of 5 patients were inthe relapsing-remitting phase of MS at baseline in this study. These findings suggest thatthere is sub-clinical axonal loss in the anterior visual pathway in MS, and support OCT andlow-contrast acuity as candidate measures for clinical trials, particularly those involvingneuroprotection. The degrees to which sub-clinical demyelination and primary degenerationcontribute to visual pathway axonal loss over time are uncertain.
Our study is important in demonstrating: 1) significant associations between visual loss andRNFL thinning over time in MS; and 2) progressive declines in RNFL thickness in MS eyesboth with and without a prior history of acute ON. These data provide in vivo evidence forsub-clinical axonal loss in the anterior visual pathway and add a longitudinal component toestablished cross-sectional correlations of structure (RNFL thickness by OCT) and function(low- and high-contrast letter acuity).18 Our results further strengthen the role of the anteriorvisual pathway as a potential model for assessing treatment efficacy in MS, particularly forneuroprotective agents. While 87% of patients in our study were on disease-modifyingtreatments, substantial proportions of eyes had sub-clinical RNFL thinning and visual loss,and types of immunomodulatory therapy did not predict outcomes. These findings suggest asignificant unmet therapeutic need in MS for treatments that target axonal loss. Numbers ofpatients not on therapy were relatively small in this study (n=75 eyes, 13%), and ourinvestigation was not powered or designed to determine effects of treatment. While alsoexploratory, our analyses of RNFL thinning vs. EDSS and MSFC score changes suggestpotential associations of RNFL axonal loss with more global measures of impairment.Further analyses of patient subgroups based on EDSS and MSFC will examine visualpathway axonal loss across the spectrum of disease severity. Several ongoing phase 3 MStrials have incorporated low-contrast letter acuity and RNFL thickness by OCT as tertiaryoutcomes. Data from these trials will provide important information on the performance ofOCT measures and high- and low-contrast acuity, complementing the results seen in ourstudy of a heterogeneous cohort.
While the patient mix of our convenience sample cohort was similar to the U.S. MSpopulation with respect to age and gender, the tertiary care setting of our investigation maylimit the generalizability of our findings. However, since MS clinical trials are oftenperformed at academic centers, our cohort represents the population of patients who wouldqualify for enrollment in studies that include visual function tests and OCT as outcomes.
Our findings of progressive RNFL thinning by OCT, strongly suggestive of axonal loss, areanalogous to MRI measures of brain atrophy in MS from both a qualitative and quantitativestandpoint.32,40-45 Change in brain volume on serial MRI scans is recognized as a sensitivecandidate measure for neuroprotection trials, and is one of the best-studied methods forquantitating neurodegeneration in MS.32 Brain atrophy occurs even in the absence ofclinical manifestations in MS;40 similarly, RNFL thinning in our MS cohort was seen evenamong eyes without a history of acute ON or of progressive visual loss. Brain atrophyoccurs at a faster rate in MS than in healthy controls, with decreases in brain volume of0.5-1.2% per year for patients, and 0.1-0.3% in healthy individuals.32,40-42 Average RNFL
Talman et al. Page 7
Ann Neurol. Author manuscript; available in PMC 2011 June 1.
NIH
-PA Author Manuscript
NIH
-PA Author Manuscript
NIH
-PA Author Manuscript
thinning for disease-free controls in our study was 0.5% (0.49 μm) over a 3-year period.Patterns of increase in RNFL thinning noted in our investigation are similar to the yearlyworsening of whole brain atrophy that has been observed in relapsing-remitting MS.40
Average declines in brain parenchymal fraction (BPF) at 2 years in the placebo-controlledtrial of interferon beta-1a were similar to our findings for >1-2 years' follow-up (∼1-1.5%decreases in BPF). Cross-sectional studies have demonstrated varying degrees of correlationbetween brain atrophy and reductions in RNFL thickness by OCT.23,46 In one study ofpatients with relapsing-remitting MS, linear correlations between BPF and RNFL thicknesswere significant (r = 0.69, p=0.001, accounting for age).23 RNFL thickness in MS eyeswithout a history of ON had significant but modest correlations with MRI measures of BPF(r = 0.40, p=0.01) and gray matter fraction (r = 0.40, p=0.02).46 Ongoing longitudinalstudies, including clinical trials, will further examine potential parallels between brain MRIparameters and OCT measures.
While whole brain volume and BPF include both gray and white matter elements, RNFLthickness measures only unmyelinated axons. OCT measures of macular volume andthickness, however, capture neuronal elements including the ganglion cell layer.30 Asdemonstrated in a recent cross-sectional study, reduced total macular volumes (∼34%neuronal cells by average thickness) in MS are associated with peripapillary RNFL thinning,with stronger correlations noted among eyes without a history of acute ON.30 Although thepresent longitudinal analyses do not include macular volumes (data collection for thismeasure began much later than for RNFL thickness), continued follow-up of our studycohort and compilation of clinical trial data that include both OCT measures will allow us todetermine how neuronal and axonal loss are associated over time in MS.
Brain MRI measures of atrophy demonstrate changes over time that are evident within 1-2years' follow-up.32,40-45 Significant degrees of RNFL thinning were most notable in ourstudy for the >2-3-year and >3-year follow-up intervals. To the extent that our investigationinvolves a heterogeneous cohort of non-uniformly-treated patients that were not selected foractive disease (i.e., generally stable patients), it is likely that clinical trial data for RNFLthickness will demonstrate changes earlier than those observed in our cohort. Although thenumbers of eyes decreased with greater length of follow-up, the proportions of eyes withRNFL thinning greater than that expected based on test-retest variability (≥6.6 μm)increased across follow-up intervals. This finding indicates that the mean changes in RNFLthickness from baseline are not being driven by only a few eyes with extreme RNFLthinning (outliers). The relation of RNFL thinning to follow-up time, demonstrated in Fig 3,also supports these observations. It should be emphasized that the scatter plot and regressionline in Fig 3 represent group data for degree of RNFL thinning observed between baselineand the last follow-up visit, and are not meant to define patterns of RNFL thinning over timefor individual eyes. Patterns of RNFL thinning in individual eyes may not, in fact, be linearthroughout the course of follow-up.
The inter-rater and test-retest reliability of OCT for measuring RNFL thickness and otherretinal structures may be enhanced by incorporation of high-resolution spectral domainOCT.14,47,48 Recent analyses comparing Cirrus high-resolution OCT with OCT-3 (currenttechnology used in this study) found greater inter-rater reliability for Cirrus RNFL thicknessmeasurements in patients with MS and disease-free controls.47,48 While not yet widelyavailable, high-resolution OCT has the advantage of greater reproducibility due toreductions in the operator-dependency of scan placement. Resolution is also 5-7 μm,compared to 8-10 μm for OCT-3. However, unlike the current technology for which a singlebrand is available (OCT-3 by Zeiss), there are already several manufacturers of high-resolution OCT.14 Future trials will require continued expertise of established OCT reading
Talman et al. Page 8
Ann Neurol. Author manuscript; available in PMC 2011 June 1.
NIH
-PA Author Manuscript
NIH
-PA Author Manuscript
NIH
-PA Author Manuscript
centers and careful consideration of differences between high-resolution and currenttechnologies.
Patterns of RNFL thinning in our longitudinal study, which demonstrated increases indegree of thinning with greater length of follow-up, were strikingly similar between all MSeyes and MS eyes with no history of acute ON. This pattern was also present yet not as well-defined in eyes with a history of ON, perhaps consistent with the fact that these eyes hadalready had substantial thinning of the RNFL prior to study enrollment (baseline RNFLthickness 83 ± 18 μm for ON eyes vs. 96 ± 13 μm for MS non-ON eyes). The follow-upcohort in our study also had a greater proportion of eyes with a history of ON. Separateanalyses of eyes with and without an ON history were performed, however, to helpdistinguish patterns of RNFL thinning in these groups. While patients were not selected forfollow-up based on clinical features, those with visual symptoms may have had a greatertendency to volunteer for follow-up in this study (volunteer bias), potentially overestimatingthe rate of increase in RNFL thinning over time.
Collectively, these data provide evidence that sub-clinical axonal loss is occurring in theanterior visual pathways in MS even in the absence of acute ON. The relative contributionsof sub-clinical demyelination and primary axonal degeneration to this process remainuncertain. These observations are consistent with cross-sectional data that have shownaverage RNFL thickness values for MS eyes without a history of acute ON to be abnormal(lower than those for disease-free controls, yet greater than those of eyes with a history ofacute ON).14-22 In terms of longitudinal studies, our data are unique in showing thatprogressive RNFL thinning occurs over time in MS non-ON eyes, and also demonstrate thateyes with a distant history of acute ON (prior to study enrollment) have continued RNFLaxonal loss. This concept is also supported by our finding that while disease duration did notaffect the relation between RNFL thinning and length of follow-up in models examining MSnon-ON eyes, accounting for disease duration lessened the strength of association betweenRNFL thinning and follow-up in MS ON eyes. The amount of time since the episode ofacute ON is perhaps important in determining the degree of RNFL thinning observed duringany particular follow-up period. While ON remains an attractive model for studying acuteeffects of neuroprotection, our findings of sub-clinical axonal loss suggest that MS trialscould also use the anterior visual pathway as a model.
Our data are also important in demonstrating that clinically significant losses of vision bylow-contrast letter acuity and high-contrast VA are associated with RNFL thinning overtime. These findings add a longitudinal component to an already strong base of cross-sectional data showing anterior visual pathway structure-function correlations in MS, andsupport validity for low-contrast letter acuity as a candidate visual outcome measure. In thepresent study and in phase 3 trials of natalizumab,11 low-contrast letter acuity at the 2.5%level was the most sensitive measure of visual loss. Visual loss by the 2.5% contrast chart inour study was significantly associated with RNFL thinning. Scores from the 1.25% contrastchart, however, correlated less well with RNFL loss. Our results suggest that high-contrastVA, measured with ETDRS charts and using research protocols, may also have a useful rolein MS trials, particularly as a correlate of RNFL thinning and as a descriptor of visualfunction. While floor effects (low or zero scores at baseline---23% of eyes followed up inthe present study) may limit the capacity of the 1.25% chart to capture changes in acuity,RNFL thinning in our study did not distinguish eyes with visual loss on the 1.25% charteven after excluding eyes with low or zero baseline scores (<7 letters). It is also possible thatlow-contrast acuity scores at the 1.25% level reflect disease in the brain and posterior visualpathway to a greater degree than do 2.5% low-contrast acuity or VA. In an investigation ofvision and MRI lesion burden in MS, low-contrast acuity scores at 1.25% correlated betterwith T2 lesion volumes in whole brain than with lesion volumes for Area 17 white matter,
Talman et al. Page 9
Ann Neurol. Author manuscript; available in PMC 2011 June 1.
NIH
-PA Author Manuscript
NIH
-PA Author Manuscript
NIH
-PA Author Manuscript
optic radiations, or optic tracts.12 The opposite pattern was observed for low-contrast acuityat 2.5%, which showed stronger correlations with lesion burden in the visual pathwayregions of interest, indicating perhaps greater sensitivity to visual pathway disease. The2.5% chart is likely to be the most useful in future MS trials; the 1.25% contrast level willyield helpful information in patients who begin the study with non-zero scores. Consistentwith data for MS neurologic outcome measures such as the MSFC, our study also showedevidence of greater dysfunction among older patients with longer disease duration.
As a potential new imaging outcome for neuroprotection and other clinical trials in MS,RNFL thickness by OCT fulfills many important criteria, including pathological specificity(measurements are concordant with retinal histology), reproducibility, ease of patientparticipation, correlation with clinical measures, and sensitivity to changes over time.32
While the final criterion, response to treatment, is fulfilled by low-contrast letter acuity,11
this important characteristic for OCT will be addressed by forthcoming MS clinical trialdata. A crucial step forward for the anterior visual pathway as a model for assessingtherapies in MS, our longitudinal study demonstrates sensitivity to changes in RNFLthickness and low-contrast letter acuity. As such, it supports these techniques as quantitativeof both structure and function of neural tissue, in this case, the retina.
Supplementary MaterialRefer to Web version on PubMed Central for supplementary material.
AcknowledgmentsThis work was supported by National Multiple Sclerosis Society PP1115 (L.J.B.), National Multiple SclerosisSociety Tissue Repair Partnership TR 3760-A-3 (L.J.B., P.A.C.), NIH/National Eye Institute K24 EY 014136(L.J.B.), the DAD's Foundation, and the McNeill Foundation. We give special thanks to Dr. Arthur Asbury forhelpful comments regarding this manuscript.
References1. Mowry EM, Loguidice MJ, Daniels AB, et al. Vision related quality of life in multiple sclerosis:
correlation with new measures of low and high contrast letter acuity. J Neurol NeurosurgPsychiatry. 2009; 80:767–772. [PubMed: 19240050]
2. Trapp BD, Peterson J, Ransohoff RM, et al. Axonal transection in the lesions of multiple sclerosis.N Engl J Med. 1998; 338:278–285. [PubMed: 9445407]
3. Evangelou N, Konz D, Esiri MM, et al. Size-selective neuronal changes in the anterior opticpathways suggest a differential susceptibility to injury in multiple sclerosis. Brain. 2001; 124:1813–1820. [PubMed: 11522583]
4. DeLuca GC, Williams K, Evangelou N, et al. The contribution of demyelination to axonal loss inmultiple sclerosis. Brain. 2006; 129:1507–1516. [PubMed: 16597651]
5. Sepulcre J, Goñi J, Masdeu JC, et al. Contribution of white matter lesions to gray matter atrophy inmultiple sclerosis: evidence from voxel-based analysis of T1 lesions in the visual pathway. ArchNeurol. 2009; 66:173–179. [PubMed: 19204153]
6. Rudick R, Antel J, Confavreux C, et al. Recommendations from the National Multiple SclerosisSociety Clinical Outcomes Assessment Task Force. Ann Neurol. 1997; 42:379–382. [PubMed:9307263]
7. Balcer LJ, Baier ML, VS, Fox RJ, et al. New low-contrast vision charts: reliability and testcharacteristics in patients with multiple sclerosis. Mult Scler. 2000; 6:163–171. [PubMed:10871827]
8. Balcer LJ, Baier ML, Cohen JA, et al. Contrast letter acuity as a visual component for the MultipleSclerosis Functional Composite. Neurology. 2003; 61:1367–1373. [PubMed: 14638957]
Talman et al. Page 10
Ann Neurol. Author manuscript; available in PMC 2011 June 1.
NIH
-PA Author Manuscript
NIH
-PA Author Manuscript
NIH
-PA Author Manuscript
9. Weinstock-Guttman B, Baier M, Stockton R, et al. Pattern reversal visual evoked potentials as ameasure of visual pathway pathology in multiple sclerosis. Mult Scler. 2003; 9:529–534. [PubMed:14582782]
10. Baier ML, Cutter GR, Rudick RA, et al. Low-contrast letter acuity testing captures visualdysfunction in patients with multiple sclerosis. Neurology. 2005; 22:992–995. [PubMed:15781814]
11. Balcer LJ, Galetta SL, Calabresi PA, et al. Natalizumab reduces visual loss in patients withrelapsing multiple sclerosis. Neurology. 2007; 68:1299–1304. [PubMed: 17438220]
12. Wu GF, Schwartz ED, Lei T, et al. Relation of vision to global and regional brain MRI in multiplesclerosis. Neurology. 2007; 69:2128–2135. [PubMed: 17881718]
13. Reich DS, Smith SA, Gordon-Lipkin EM, et al. Damage to the optic radiation in multiple sclerosisis associated with retinal injury and visual disability. Arch Neurol. 2009; 66:998–1006. [PubMed:19667222]
14. Frohman EM, Fujimoto JG, Frohman TC, et al. Optical coherence tomography: a window into themechanisms of multiple sclerosis. Nat Clin Pract Neurol. 2008; 4:664–675. [PubMed: 19043423]
15. Parisi V, Manni G, Spadaro M, et al. Correlation between morphological and functional retinalimpairment in multiple sclerosis patients. Invest Ophthalmol Vis Sci. 1999; 40:2520–2527.[PubMed: 10509645]
16. Trip SA, Schlottmann PG, Jones SJ, et al. Retinal nerve fiber layer axonal loss and visualdysfunction in optic neuritis. Ann Neurol. 2005; 58:383–391. [PubMed: 16075460]
17. Costello F, Coupland S, Hodge W, et al. Quantifying axonal loss after optic neuritis with opticalcoherence tomography. Ann Neurol. 2006; 59:963–969. [PubMed: 16718705]
18. Fisher JB, Jacobs DA, Markowitz CE, et al. Relation of visual function to retinal nerve fiber layerthickness in multiple sclerosis. Ophthalmology. 2006; 113:324–332. [PubMed: 16406539]
19. Cheng H, Laron M, Schiffman JS, Tang RA, Frishman LJ. The relationship between visual fieldand retinal nerve fiber layer measurements in patients with multiple sclerosis. Invest OphthalmolVis Sci. 2007; 48:5798–5805. [PubMed: 18055834]
20. Pulicken M, Gordon-Lipkin E, Balcer LJ, et al. Optical coherence tomography and disease subtypein multiple sclerosis. Neurology. 2007; 69:2085–2092. [PubMed: 18040015]
21. Costello F, Hodge W, Pan YI, et al. Differences in retinal nerve fiber layer atrophy betweenmultiple sclerosis subtypes. J Neurol Sci. 2009; 281:74–79. [PubMed: 19303605]
22. Henderson AP, Trip SA, Schlottmann PG, et al. An investigation of the retinal nerve fibre layer inprogressive multiple sclerosis using optical coherence tomography. Brain. 2008; 131:277–287.[PubMed: 18056739]
23. Gordon-Lipkin E, Chodkowski B, Reich DS, et al. Retinal nerve fiber layer is associated with brainatrophy in multiple sclerosis. Neurology. 2007; 69:1603–1609. [PubMed: 17938370]
24. Sepulcre J, Murie-Fernandez M, Salinas-Alaman A, et al. Diagnostic accuracy of retinalabnormalities in predicting disease activity in MS. Neurology. 2007; 68:1488–1494. [PubMed:17470751]
25. Cettomai D, Pulicken M, Gordon-Lipkin E, et al. Reproducibility of optical coherence tomographyin multiple sclerosis. Arch Neurol. 2008; 65:1218–1222. [PubMed: 18779426]
26. Zaveri M, Conger A, Salter A, et al. Retinal imaging by laser polarimetry corroborates opticalcoherence tomography evidence of axonal degeneration in multiple sclerosis. Arch Neurol. 2008;65:924–928. [PubMed: 18625859]
27. Salter AR, Conger A, Frohman TC, et al. Retinal architecture predicts pupillary reflex metrics inMS. Mult Scler. 2008; 15:479–486. [PubMed: 19091882]
28. Pueyo V, Ara JR, Almarcegui C, et al. Sub-clinical atrophy of the retinal nerve fibre layer inmultiple sclerosis. Acta Ophthalmol. 2009 Epub ahead of print.
29. Costello F, Hodge W, Pan YI, Metz L, Kardon RH. Retinal nerve fiber layer and future risk ofmultiple sclerosis. Can J Neurol Sci. 2008; 35:482–487. [PubMed: 18973066]
30. Burkholder BM, Osborne B, Loguidice MJ, et al. Macular volume by optical coherencetomography as a measure of neuronal loss in multiple sclerosis. Arch Neurol. 2009; 66:1366–1372. [PubMed: 19901168]
Talman et al. Page 11
Ann Neurol. Author manuscript; available in PMC 2011 June 1.
NIH
-PA Author Manuscript
NIH
-PA Author Manuscript
NIH
-PA Author Manuscript
31. Kolappan M, Henderson APD, Jenkins TM, et al. Assessing structure and function of the afferentvisual pathway in multiple sclerosis and associated optic neuritis. J Neurol. 2009; 256:305–319.[PubMed: 19296047]
32. Barkhof F, Calabresi P, Miller DH, Reingold SC. Imaging outcomes for neuroprotection and repairin multiple sclerosis trials. Nat Rev Neurol. 2009; 5:256–266. [PubMed: 19488083]
33. Polman CH, Reingold SC, Edan G, et al. Diagnostic criteria for multiple sclerosis: 2005 revisionsto the “McDonald Criteria”. Ann Neurol. 2005; 58:840–846. [PubMed: 16283615]
34. Cheung CYL, Leung CK, Lin D, et al. Relationship between retinal nerve fiber layer measurementand signal strength by optical coherence tomography. Ophthalmology. 2008; 115:1347–1351.[PubMed: 18294689]
35. Rosser DA, Cousens SN, Murdoch IE, et al. How sensitive to clinical change are ETDRS andlogMAR visual acuity measurements? Invest Ophthalmol Vis Sci. 2003; 44:3278–3281. [PubMed:12882770]
36. Beck RW, Maguire MG, Bressler NM, et al. Visual acuity as an outcome measure in clinical trialsof retinal diseases. Ophthalmology. 2007; 114:1804–1809. [PubMed: 17908590]
37. Parikh RS, Parikh SR, Sekhar GC, et al. Normal age-related decay of retinal nerve fiber layerthickness. Ophthalmology. 2007; 114:921–926. [PubMed: 17467529]
38. Budenz DL, Anderson DR, Varma R. Determinants of normal retinal nerve fiber layer thickness asmeasured by Stratus OCT. Ophthalmology. 2007; 114:1046–1052. [PubMed: 17210181]
39. Budenz DL, Chang RT, Huang X, et al. Reproducibility of retinal nerve fiber layer thickness usingStratus OCT in normal and glaucomatous eyes. Invest Ophthalmol Vis Sci. 2005; 46:2440–2443.[PubMed: 15980233]
40. Rudick RA, Fisher E, Lee JC, Simon J, et al. Use of the brain parenchymal fraction to measurewhole brain atrophy in relapsing-remitting MS. Neurology. 1999; 53:1698–1704. [PubMed:10563615]
41. Simon JH. Brain atrophy in multiple sclerosis: what we know and would like to know. Mult Scler.2006; 12:679–687. [PubMed: 17262994]
42. Grassiot B, Desgranges B, Eustache F, Defer G. Quantification and clinical relevance of brainatrophy in multiple sclerosis: a review. J Neurol. 2009; 256:1397–1412. [PubMed: 19353226]
43. Fisher E, Rudick RA, Cutter G, et al. Relationship between brain atrophy and disability: an 8-yearstudy of multiple sclerosis patients. Mult Scler. 2000; 6:373–377. [PubMed: 11212131]
44. Minneboo A, Uidehaag BMJ, Jongen P, et al. Association between MRI parameters and the MSseverity scale: a 12 year follow-up study. Mult Scler. 2009; 15:632–637. [PubMed: 19389751]
45. Healy BC, Valsasina P, Filippi M, Bakshi R. Sample size requirements for treatment effects usinggray matter, white matter and whole brain volume in relapsing-remitting multiple sclerosis. JNeurol Neurosurg Psychiatry. 2009; 80:1218–1224. [PubMed: 19204021]
46. Siger M, Dzi&eogongielewski K, Jasek L, et al. Optical coherence tomography in multiplesclerosis: thickness of the retinal nerve fiber layer as a potential measure of axonal loss and brainatrophy. J Neurol. 2008; 255:1555–1560. [PubMed: 18825432]
47. Warner C, Hiremath GS, Syc SB, et al. A comparison of Cirrus vs. Stratus optical coherencetomography for measuring retinal changes. Neurology. 2009; 72(Suppl 3):A244–A245.
48. Syc SB, Warner CV, Hiremath GS, et al. Reproducibility of Cirrus optical coherence tomography(OCT) in multiple sclerosis. Neurology. 2009; 72(Suppl 3):A245.
Talman et al. Page 12
Ann Neurol. Author manuscript; available in PMC 2011 June 1.
NIH
-PA Author Manuscript
NIH
-PA Author Manuscript
NIH
-PA Author Manuscript
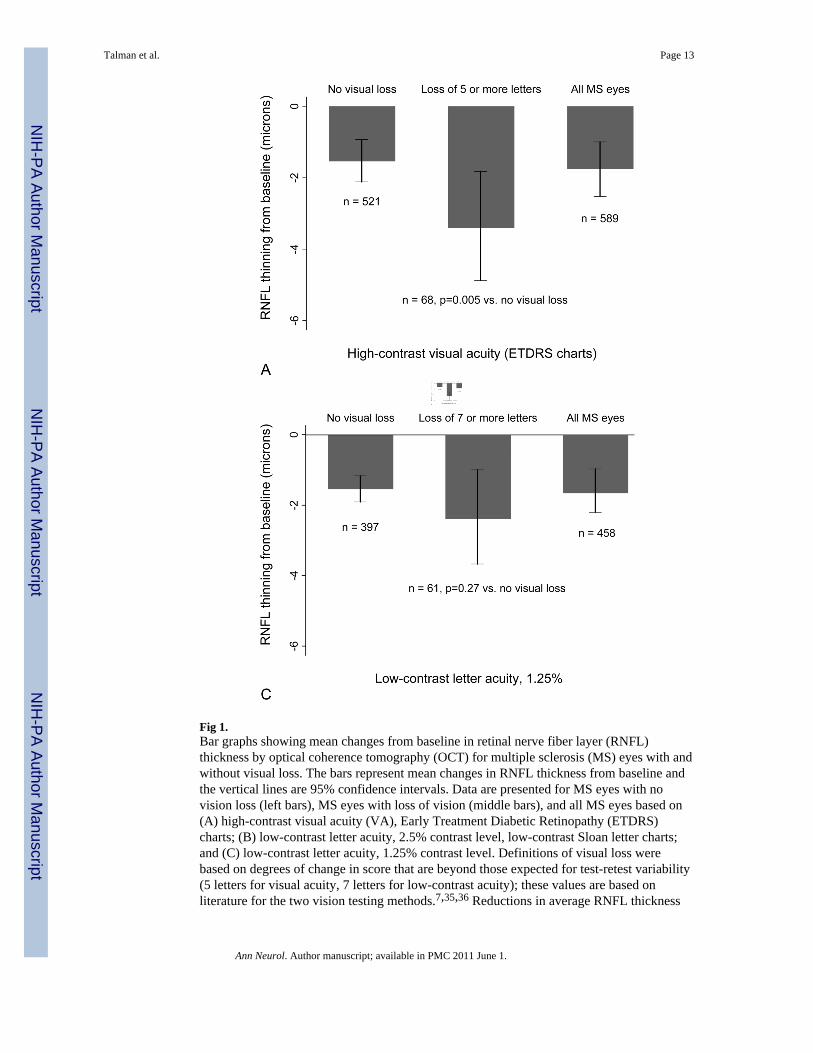
Fig 1.Bar graphs showing mean changes from baseline in retinal nerve fiber layer (RNFL)thickness by optical coherence tomography (OCT) for multiple sclerosis (MS) eyes with andwithout visual loss. The bars represent mean changes in RNFL thickness from baseline andthe vertical lines are 95% confidence intervals. Data are presented for MS eyes with novision loss (left bars), MS eyes with loss of vision (middle bars), and all MS eyes based on(A) high-contrast visual acuity (VA), Early Treatment Diabetic Retinopathy (ETDRS)charts; (B) low-contrast letter acuity, 2.5% contrast level, low-contrast Sloan letter charts;and (C) low-contrast letter acuity, 1.25% contrast level. Definitions of visual loss werebased on degrees of change in score that are beyond those expected for test-retest variability(5 letters for visual acuity, 7 letters for low-contrast acuity); these values are based onliterature for the two vision testing methods.7,35,36 Reductions in average RNFL thickness
Talman et al. Page 13
Ann Neurol. Author manuscript; available in PMC 2011 June 1.
NIH
-PA Author Manuscript
NIH
-PA Author Manuscript
NIH
-PA Author Manuscript
were greater for eyes with visual loss for VA and for low-contrast acuity at the 2.5%contrast level.* Logistic regression models, accounting for age and adjusting for within-patient, inter-eyecorrelations, were used to determine the association between visual loss and degree ofRNFL thinning from baseline.
Talman et al. Page 14
Ann Neurol. Author manuscript; available in PMC 2011 June 1.
NIH
-PA Author Manuscript
NIH
-PA Author Manuscript
NIH
-PA Author Manuscript
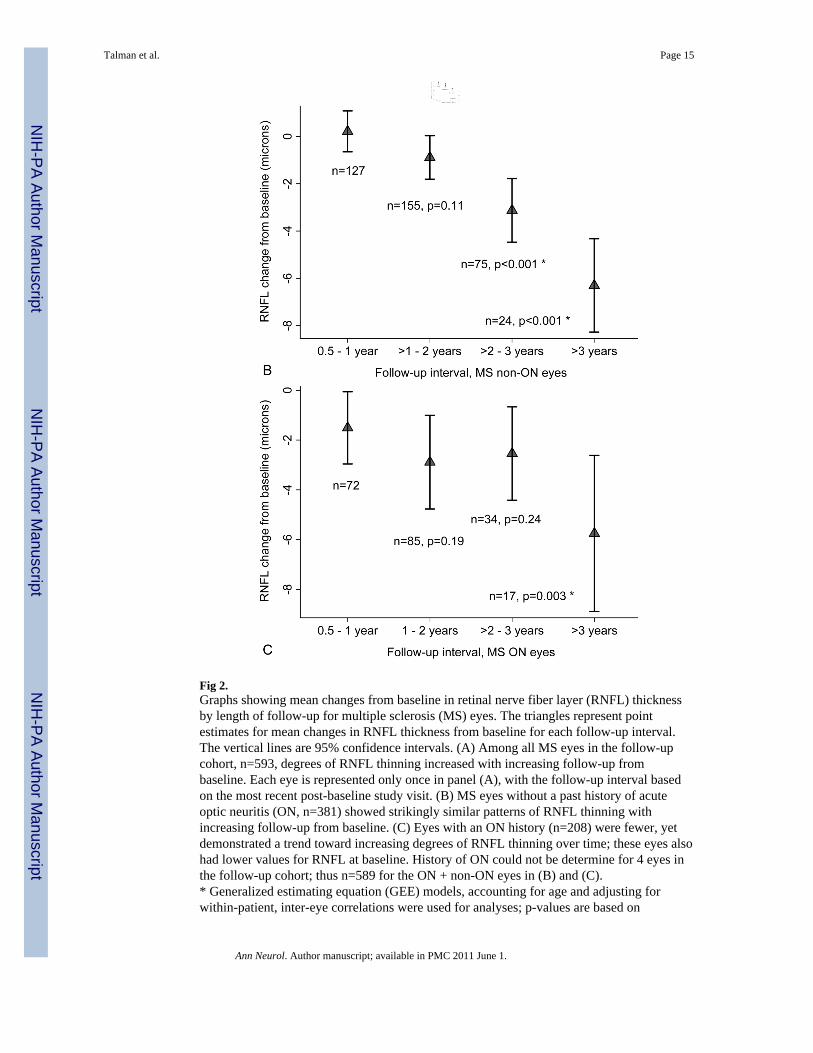
Fig 2.Graphs showing mean changes from baseline in retinal nerve fiber layer (RNFL) thicknessby length of follow-up for multiple sclerosis (MS) eyes. The triangles represent pointestimates for mean changes in RNFL thickness from baseline for each follow-up interval.The vertical lines are 95% confidence intervals. (A) Among all MS eyes in the follow-upcohort, n=593, degrees of RNFL thinning increased with increasing follow-up frombaseline. Each eye is represented only once in panel (A), with the follow-up interval basedon the most recent post-baseline study visit. (B) MS eyes without a past history of acuteoptic neuritis (ON, n=381) showed strikingly similar patterns of RNFL thinning withincreasing follow-up from baseline. (C) Eyes with an ON history (n=208) were fewer, yetdemonstrated a trend toward increasing degrees of RNFL thinning over time; these eyes alsohad lower values for RNFL at baseline. History of ON could not be determine for 4 eyes inthe follow-up cohort; thus n=589 for the ON + non-ON eyes in (B) and (C).* Generalized estimating equation (GEE) models, accounting for age and adjusting forwithin-patient, inter-eye correlations were used for analyses; p-values are based on
Talman et al. Page 15
Ann Neurol. Author manuscript; available in PMC 2011 June 1.
NIH
-PA Author Manuscript
NIH
-PA Author Manuscript
NIH
-PA Author Manuscript
comparisons of RNFL thinning at the >1-year follow-up intervals to 0.5-1-year follow-upinterval.
Talman et al. Page 16
Ann Neurol. Author manuscript; available in PMC 2011 June 1.
NIH
-PA Author Manuscript
NIH
-PA Author Manuscript
NIH
-PA Author Manuscript
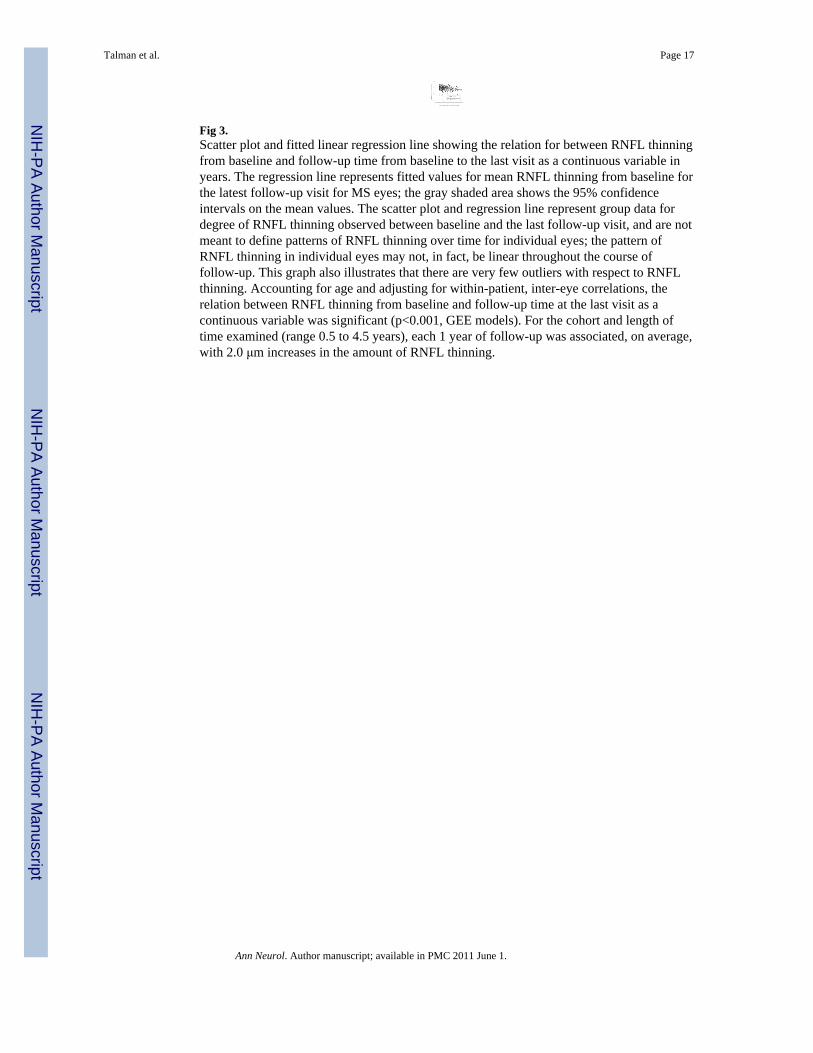
Fig 3.Scatter plot and fitted linear regression line showing the relation for between RNFL thinningfrom baseline and follow-up time from baseline to the last visit as a continuous variable inyears. The regression line represents fitted values for mean RNFL thinning from baseline forthe latest follow-up visit for MS eyes; the gray shaded area shows the 95% confidenceintervals on the mean values. The scatter plot and regression line represent group data fordegree of RNFL thinning observed between baseline and the last follow-up visit, and are notmeant to define patterns of RNFL thinning over time for individual eyes; the pattern ofRNFL thinning in individual eyes may not, in fact, be linear throughout the course offollow-up. This graph also illustrates that there are very few outliers with respect to RNFLthinning. Accounting for age and adjusting for within-patient, inter-eye correlations, therelation between RNFL thinning from baseline and follow-up time at the last visit as acontinuous variable was significant (p<0.001, GEE models). For the cohort and length oftime examined (range 0.5 to 4.5 years), each 1 year of follow-up was associated, on average,with 2.0 μm increases in the amount of RNFL thinning.
Talman et al. Page 17
Ann Neurol. Author manuscript; available in PMC 2011 June 1.
NIH
-PA Author Manuscript
NIH
-PA Author Manuscript
NIH
-PA Author Manuscript
NIH
-PA Author Manuscript
NIH
-PA Author Manuscript
NIH
-PA Author Manuscript
Talman et al. Page 18
Table 1Clinical Characteristics of Patients with MS in Baseline and Follow-Up Cohorts
Baseline Cohort n = 1,005(2,010 eyes)
Follow-Up Cohort: ≥6 months –4.5 years n = 299
(593 eyes)
Age at baseline, yr, mean ± SD 43 ± 11 43 ± 10
Sex, % female 74% 72%
Race, % Caucasian 90% 92%
MS disease sub-type, % relapsing-remitting 83% 84%
Disease duration, yr, median (range) 9 (<1 – 46) 9 (<1 – 49)
History of ON prior to study, % of eyes a 28% 35%
Follow-up from baseline visit, months — 18 ± 10
Visual acuity at baseline, Snellen equivalent from ETDRS charts,median (range)
20/20(<20/200 – 20/12.5)
20/20(<20/200 – 20/12.5)
Low-contrast acuity at baseline, 2.5% contrast, number of letterscorrect (maximum 70), mean ± SD 28 ± 12 28 ± 13
Low-contrast acuity at baseline, 1.25% contrast, number of letterscorrect (maximum 70), mean ± SD 15 ± 11 16 ± 12
RNFL thickness at baseline (average for 360° around optic disc), μm,mean ± SD 93 ± 16 91 ± 16
aON indicates eyes with a history of acute optic neuritis ≥3 months prior to study enrollment.
MS = multiple sclerosis; ON = optic neuritis; ETDRS = Early Treatment Diabetic Retinopathy Study; RNFL = retinal nerve fiber layer; OCT =optical coherence tomography.
Ann Neurol. Author manuscript; available in PMC 2011 June 1.
NIH
-PA Author Manuscript
NIH
-PA Author Manuscript
NIH
-PA Author Manuscript
Talman et al. Page 19
Table 2Comparison of MS Eyes in Follow-Up Cohort with vs. without Visual Loss by Low-Contrast Letter Acuity (2.5% contrast level)
Loss of ≥7 Letters from Baselineto Last Follow-Up Visit
(67 eyes)
No Loss of Vision(493 eyes) a
Mean age, yr, mean ± SD 49 ± 11 44 ± 10
MS disease sub-type, % relapsing-remitting 82% 86%
Disease duration, yr, median (range) 13 (3 – 46) 8 (<1 – 49)
Patients on disease-modifying therapy at last visit, % 93% 87%
History of ON prior to study, % of eyes b 34% 34%
Follow-up from baseline visit, months, mean ± SD 26 ± 13 17 ± 9
Visual acuity at baseline, Snellen equivalent from ETDRS charts, median(range)
20/20(20/32 – 20/12.5)
20/20(<20/200 – 20/12.5)
Low-contrast acuity at baseline, 2.5% contrast, number of letters correct(maximum 70), mean ± SD 33 ± 9 31 ± 9
RNFL thickness at baseline (average for 360° around optic disc), μm, mean± SD 91 ± 13 92 ± 17
aSince eyes with scores of <7 letters at baseline could not have visual loss during follow-up by definition, only eyes with baseline scores ≥7 (n =
560 for 2.5% contrast) were included in analyses comparing degrees of RNFL thinning or proportions of eyes with visual loss.
bON indicates eyes with a history of acute optic neuritis ≥3 months prior to study enrollment.
MS = multiple sclerosis; ON = optic neuritis; ETDRS = Early Treatment Diabetic Retinopathy Study; RNFL = retinal nerve fiber layer.
Ann Neurol. Author manuscript; available in PMC 2011 June 1.
NIH
-PA Author Manuscript
NIH
-PA Author Manuscript
NIH
-PA Author Manuscript
Talman et al. Page 20
Tabl
e 3
Prop
ortio
ns o
f MS
Eye
s with
Vis
ual L
oss G
reat
er th
an th
e A
mou
nt E
xpec
ted
Bas
ed o
n T
est-R
etes
t Var
iabi
lity
and
with
RN
FL T
hinn
ing
byFo
llow
-Up
Tim
e at
Mos
t Rec
ent V
isit
Follo
w-U
p T
ime
at M
ost R
ecen
t Vis
it
Typ
e of
Mea
sure
and
Cri
teri
on fo
r L
oss
All
n =
593
% (9
5% C
I)0.
5 –
1 Y
ear
n =
201
% (9
5% C
I)>1
– 2
Yea
rs n
= 2
42%
(95%
CI)
>2 –
3 Y
ears
n =
109
% (9
5% C
I)>3
Yea
rs n
= 4
1%
(95%
CI)
p
VA
on
ET
DR
S ch
arts
(≥5
lette
rs) a
11.5
%(9
.0, 1
4.0)
6.5%
(3.1
, 10.
0)10
.0%
(6.2
, 13.
8)14
.7%
(7.9
, 21.
4)36
.6%
(21.
2, 5
2.0)
<0.0
01 b
Low
-con
tras
t let
ter
acui
ty o
n 2.
5% c
ontr
ast c
hart
(≥7
lette
rs) a
12.0
%(9
.3 1
4.7)
6.9%
(3.2
, 10.
5)7.
9%(4
.4, 1
1.5)
17.0
%(9
.7, 2
4.2)
47.4
%(3
0.7,
64.
0)<0
.001
b
Low
-con
tras
t let
ter
acui
ty o
n 1.
25%
con
tras
t cha
rt (≥
7 le
tters
) a13
.3%
(10.
2 16
.4)
12.8
%(7
.4, 1
8.3)
9.6%
(5.3
, 13.
8)13
.5%
(6.6
, 20.
5)42
.3%
(22.
0, 6
2.7)
0.01
b
RFN
L th
ickn
ess b
y O
CT
(≥6.
6 μm
)18
.0%
(14.
9, 2
1.1)
10.5
%(6
.2, 1
4.7)
15.7
%(1
1.1,
20.
3)27
.5%
(19.
0, 3
6.0)
43.9
%(2
8.0,
59.
8)<0
.001
b
a Sinc
e ey
es w
ith sc
ores
of <
5 le
tters
(for
VA
) or <
7 le
tters
(for
low
-con
trast
acu
ity) a
t the
bas
elin
e vi
sit c
ould
not
hav
e vi
sual
loss
dur
ing
follo
w-u
p by
def
initi
on, o
nly
eyes
with
bas
elin
e sc
ores
≥5
lette
rs fo
rV
A (n
= 5
89) o
r ≥7
lette
rs fo
r low
-con
trast
acu
ity (n
= 5
60 a
t 2.5
% c
ontra
st, n
= 4
58 a
t 1.2
5% c
ontra
st) w
ere
incl
uded
in a
naly
ses c
ompa
ring
prop
ortio
ns o
f eye
s with
vis
ual l
oss.
b Prop
ortio
ns o
f eye
s inc
reas
ed w
ith g
reat
er le
ngth
of f
ollo
w-u
p, c
hi-s
quar
e te
st fo
r tre
nd in
bin
omia
l pro
porti
ons.
MS
= m
ultip
le sc
lero
sis;
CI =
con
fiden
ce in
terv
al; O
N =
opt
ic n
eurit
is; V
A =
vis
ual a
cuity
; ETD
RS
= Ea
rly T
reat
men
t Dia
betic
Ret
inop
athy
Stu
dy; R
NFL
= re
tinal
ner
ve fi
ber l
ayer
; OC
T =
optic
alco
here
nce
tom
ogra
phy.
Ann Neurol. Author manuscript; available in PMC 2011 June 1.
Related Documents