Longitudinal measures of perfluoroalkyl substances (PFAS) in serum of Gullah African Americans in South Carolina: 2003–2013 Matthew O. Gribble a,n , Scott M. Bartell b , Kurunthachalam Kannan c,d , Qian Wu c , Patricia A. Fair e , Diane L. Kamen f a Department of Preventive Medicine, Division of Biostatistics, University of Southern California, Los Angeles, CA, USA b Program in Public Health and Department of Statistics; University of California, Irvine, Irvine, CA, USA c Wadsworth Center, New York State Department of Health, Albany, NY, USA d Department of Environmental Health Sciences, School of Public Health, State University of New York at Albany, Albany, NY, USA e National Oceanic and Atmospheric Administration, National Ocean Service, Center for Coastal Environmental Health & Biomolecular Research, Charleston, SC, USA f Department of Medicine, Division of Rheumatology, Medical University of South Carolina; Charleston, SC, USA article info Article history: Received 22 November 2014 Received in revised form 11 March 2015 Accepted 16 March 2015 Keywords: PFAS Gullah PFOA PFOS Biomonitoring Contaminant trends abstract Background: Charleston Harbor has elevated concentrations of PFAS in dolphins, but local human ex- posure data are limited. Objectives: We sought to describe PFAS serum concentrations’ temporal trends among Gullah African American residents of coastal South Carolina. Methods: Longitudinal measures of PFAS in blood serum from a Gullah clinical sample, without lupus, were examined using spaghetti plots and visit-to-visit change scores (e.g., differences in concentrations between visits) among the 68 participants with repeated measures available. We also modeled popu- lation-level trends among the 71 participants with any data using proportionate percentile models, accounting for clustering through robust standard errors. In a post-hoc analysis we examined hetero- geneity of temporal trends by age through mixed-effects models for the log-transformed PFAS com- pounds. Results: Population concentrations of PFOS dropped approximately 9 (95% CI: 8, 10) percent each year over 2003–2013. This was concordant with individual PFOS trajectories (median PFOS change score 21.7 ng/g wet weight, interquartile range of PFOS change scores: 32.8, 14.9) and reports for other populations over this time period. Several other compounds including PFOA, PFHxS, and PFuNDA also showed a population-level decrease. However, examination of individual trajectories suggested sub- stantial heterogeneity. Post-hoc analyses indicated that PFAS trajectories were heterogeneous by age. Conclusions: Many PFAS compounds are decreasing in a sample of Gullah African Americans from coastal south Carolina. There may be age differences in the elimination kinetics of PFASs. the possible role of age as a modifier of PFAS serum trends merits further research. & 2015 Elsevier Inc. All rights reserved. 1. Introduction Perfluoroalkyl substances (PFAS) (Buck et al., 2011), although commercially useful for their surfactant properties (Lehmler, 2005), have spread around the globe and into foods and may have important consequences for the environment and human health (Armitage et al., 2009; Butt et al., 2010; Domingo, 2012; Giesy and Kannan, 2001; Ludwicki et al., 2015; Perez et al., 2014). The epidemiology and toxicology of these chemicals is still emerging, but PFAS exposures may have several health implications (Lau, 2012; Post et al., 2012; Steenland et al., 2010). Recent reviews have found that PFOA is negatively associated with fetal growth (Bach et al., 2014; Johnson et al., 2014). PFOA's associations with cancer are the focus of an IARC monograph (Benbrahim-Tallaa et al., 2014), although a recent critical review found that overall the evidence was not supportive of PFOA or PFOS as carcinogens (Chang et al., 2014). There are differences by compound in the distribution of PFAS across tissues (Pérez et al., 2013). Although the health implications are still being assessed and are generally compound-specific, as a class these chemicals may be relevant for public health. It is therefore important to understand population Contents lists available at ScienceDirect journal homepage: www.elsevier.com/locate/envres Environmental Research http://dx.doi.org/10.1016/j.envres.2015.03.012 0013-9351/& 2015 Elsevier Inc. All rights reserved. n Correspondence to: Department of Preventive Medicine, University of Southern California, 2001 N. Soto Street, Los Angeles, California 90032. E-mail address: [email protected] (M.O. Gribble). Please cite this article as: Gribble, M.O., et al., Longitudinal measures of perfluoroalkyl substances (PFAS) in serum of Gullah African Americans in South Carolina: 2003–2013. Environ. Res. (2015), http://dx.doi.org/10.1016/j.envres.2015.03.012i Environmental Research ∎ (∎∎∎∎) ∎∎∎–∎∎∎

Welcome message from author
This document is posted to help you gain knowledge. Please leave a comment to let me know what you think about it! Share it to your friends and learn new things together.
Transcript
Environmental Research ∎ (∎∎∎∎) ∎∎∎–∎∎∎
Contents lists available at ScienceDirect
Environmental Research
http://d0013-93
n CorrCaliforn
E-m
PleasAme
journal homepage: www.elsevier.com/locate/envres
Longitudinal measures of perfluoroalkyl substances (PFAS) in serum ofGullah African Americans in South Carolina: 2003–2013
Matthew O. Gribble a,n, Scott M. Bartell b, Kurunthachalam Kannan c,d, Qian Wu c,Patricia A. Fair e, Diane L. Kamen f
a Department of Preventive Medicine, Division of Biostatistics, University of Southern California, Los Angeles, CA, USAb Program in Public Health and Department of Statistics; University of California, Irvine, Irvine, CA, USAc Wadsworth Center, New York State Department of Health, Albany, NY, USAd Department of Environmental Health Sciences, School of Public Health, State University of New York at Albany, Albany, NY, USAe National Oceanic and Atmospheric Administration, National Ocean Service, Center for Coastal Environmental Health & Biomolecular Research, Charleston,SC, USAf Department of Medicine, Division of Rheumatology, Medical University of South Carolina; Charleston, SC, USA
a r t i c l e i n f o
Article history:Received 22 November 2014Received in revised form11 March 2015Accepted 16 March 2015
Keywords:PFASGullahPFOAPFOSBiomonitoringContaminant trends
x.doi.org/10.1016/j.envres.2015.03.01251/& 2015 Elsevier Inc. All rights reserved.
espondence to: Department of Preventive Media, 2001 N. Soto Street, Los Angeles, Californiaail address: [email protected] (M.O. Gribble).
e cite this article as: Gribble, M.O., ericans in South Carolina: 2003–2013
a b s t r a c t
Background: Charleston Harbor has elevated concentrations of PFAS in dolphins, but local human ex-posure data are limited.Objectives: We sought to describe PFAS serum concentrations’ temporal trends among Gullah AfricanAmerican residents of coastal South Carolina.Methods: Longitudinal measures of PFAS in blood serum from a Gullah clinical sample, without lupus,were examined using spaghetti plots and visit-to-visit change scores (e.g., differences in concentrationsbetween visits) among the 68 participants with repeated measures available. We also modeled popu-lation-level trends among the 71 participants with any data using proportionate percentile models,accounting for clustering through robust standard errors. In a post-hoc analysis we examined hetero-geneity of temporal trends by age through mixed-effects models for the log-transformed PFAS com-pounds.Results: Population concentrations of PFOS dropped approximately 9 (95% CI: 8, 10) percent each yearover 2003–2013. This was concordant with individual PFOS trajectories (median PFOS change score�21.7 ng/g wet weight, interquartile range of PFOS change scores: �32.8, �14.9) and reports for otherpopulations over this time period. Several other compounds including PFOA, PFHxS, and PFuNDA alsoshowed a population-level decrease. However, examination of individual trajectories suggested sub-stantial heterogeneity. Post-hoc analyses indicated that PFAS trajectories were heterogeneous by age.Conclusions: Many PFAS compounds are decreasing in a sample of Gullah African Americans from coastalsouth Carolina. There may be age differences in the elimination kinetics of PFASs. the possible role of ageas a modifier of PFAS serum trends merits further research.
& 2015 Elsevier Inc. All rights reserved.
1. Introduction
Perfluoroalkyl substances (PFAS) (Buck et al., 2011), althoughcommercially useful for their surfactant properties (Lehmler,2005), have spread around the globe and into foods and may haveimportant consequences for the environment and human health(Armitage et al., 2009; Butt et al., 2010; Domingo, 2012; Giesy andKannan, 2001; Ludwicki et al., 2015; Perez et al., 2014). The
icine, University of Southern90032.
t al., Longitudinal measure. Environ. Res. (2015), http:
epidemiology and toxicology of these chemicals is still emerging,but PFAS exposures may have several health implications (Lau,2012; Post et al., 2012; Steenland et al., 2010). Recent reviews havefound that PFOA is negatively associated with fetal growth (Bachet al., 2014; Johnson et al., 2014). PFOA's associations with cancerare the focus of an IARC monograph (Benbrahim-Tallaa et al.,2014), although a recent critical review found that overall theevidence was not supportive of PFOA or PFOS as carcinogens(Chang et al., 2014). There are differences by compound in thedistribution of PFAS across tissues (Pérez et al., 2013). Although thehealth implications are still being assessed and are generallycompound-specific, as a class these chemicals may be relevant forpublic health. It is therefore important to understand population
s of perfluoroalkyl substances (PFAS) in serum of Gullah African//dx.doi.org/10.1016/j.envres.2015.03.012i
M.O. Gribble et al. / Environmental Research ∎ (∎∎∎∎) ∎∎∎–∎∎∎2
exposures over time.A possible route of exposure is through consumption of con-
taminated foods including fish (Perez et al., 2014). PFASs accu-mulate in marine food webs resulting in high concentrations inhigh trophic-level marine mammals serving as sentinel species(Fair et al., 2012a; Giesy and Kannan, 2001; Houde et al., 2006a).Some of the highest PFASs found globally in marine mammals arein bottlenose dolphins in Charleston, South Carolina (Fair et al.,2012a; Houde et al., 2005). Concentrations of PFASs measured inthe Charleston dolphins are on the same order of magnitude asoccupationally exposed humans (Fair et al., 2012a; Fair et al.,2012b). The high PFAS concentrations in these dolphins alerted usto investigate the potential for environmental contaminationpossible human exposure. Further investigations have docu-mented elevated concentrations of PFASs in the dolphin food web(Houde et al., 2006b) and this current study focuses on exposuresof the Gullah African Americans in the Charleston region. Localseafood is a dietary staple in the Gullah African American popu-lation (Ellis et al., 2014).
Many biomarker studies of PFASs to date are cross-sectionalsurveys collectively offering an oblique portrait of changing con-gener profiles across time and space (Apelberg et al., 2007; Frisbeeet al., 2009; Gump et al., 2011; Guruge et al., 2005; Holzer et al.,2008; Kannan et al., 2004; Kato et al., 2014; Maisonet et al., 2012;Olsen and Zobel, 2007; Pinney et al., 2014; Schecter et al., 2012;Shaw et al., 2013; Tao et al., 2008a; Tao et al., 2008b; Tao et al.,2008c; von Ehrenstein et al., 2009; Zhang et al., 2013a; Zhanget al., 2010; Zhou et al., 2014). Several studies have examinedtrends across years in the same place, allowing more direct in-sights into temporal trends. Studies in Norway have shown de-creases in perfluorooctane sulfonate (PFOS) and perfluorononanoicacid (PFOA) since 2000 (Haug et al., 2009; Nost et al., 2014); anddecreases in women's PFOS and PFOA concentrations after phase-out in commercial products (Berg et al., 2014). In Sweden, therewere decreases over 1996–2010 in blood serum PFOA and PFOS,but increases in perfluorononanoate (PFNA), perfluorohexane-sulfonate (PFHxS), and perfluorobutanesulfonate (PFBS) (Glynnet al., 2012). There were also decreases in PFOA and PFOS inbreastmilk in Sweden 2001–2008 (Sundstrom et al., 2011). Onestudy in Germany supports a decrease in serum PFOS concentra-tions during 2001–2010, and a decrease in PFHxS concentrationsduring 2005–2010 (Schroter-Kermani et al., 2013). However, an-other German survey of samples from two cities, Halle and Mun-ster, collected over 1982–2009 did not find differences in PFHxS,but did see decreases in PFOS and PFOA, as well as increases inPFNA, PFDA and perfluoroundecanoic acid (PFuNDA) (Yeung et al.,2013a; Yeung et al., 2013b). In Japan, one study found apparentdeclines of 8.4% per year of PFOS and 3.1% per year of PFOA inumbilical cord blood samples collected over 2003–2011, but in-creases in PFNA and PFDA (Okada et al., 2013). Another study inJapan found increases in serum concentrations of perfluoroalkylacids with chains longer than 8-carbons in three cities over 2002–2009 (Harada et al., 2011). In a study in South Korea, serum con-centrations of PFNA, PFuNDA and perfluorotridecanoic acid(PFTrDA) were higher in 2007–2008 than in 1994 (Harada et al.,2011). Australian samples also showed a decrease in PFOS andPFOA during 2002–2011 (Toms et al., 2014).
Several studies have compared PFAS concentrations acrossyears within the United States. One study of umbilical cord bloodsamples collected in New York over 1997–2007 found decreases inconcentrations of PFOS, PFOA, PFHxS and perfluorooctane sulfo-namide (PFOSA) after the year 2000, coinciding with the domesticphase-out of PFOA (Spliethoff et al., 2008). In a sample of blooddonors from the American Red Cross, there was a decrease in 2010concentrations compared to 2000–2001 concentrations for PFOS,PFOA and PFHxS (Olsen et al., 2012) The National Health and
Please cite this article as: Gribble, M.O., et al., Longitudinal measureAmericans in South Carolina: 2003–2013. Environ. Res. (2015), http:
Nutrition Examination Survey also found lower concentrations ofPFOS, PFOA, and PFHxS in 2003–2004 compared to 1999–2000(Calafat et al., 2007), and over 2003–2008 while PFOS continued todecline, concentrations of PFOA remained subsequently un-changed, and the decline in PFHxS reversed in 2007–2008 (Katoet al., 2011). These apparent trends in the United States coincidewith 3M's commercial phase-out of PFOS announced in 2000 andbegun in 2002 (Paul et al., 2008). However, the United States‘temporal trend’ studies are almost all ecological comparisons ofdifferent participants recruited in different years. To our knowl-edge, the only previous longitudinal comparisons of same-subjectserum concentrations in the United States were in highly exposedpopulations such as residents of the Mid-Ohio Valley before-and-after water filtration was introduced as an exposure intervention(Bartell et al., 2010; Fitz-Simon et al., 2013). The objective of thisstudy was to summarize temporal trends of PFAS in serum col-lected from Gullah African Americans participating in a long-itudinal study from 2003–2013.
2. Methods
2.1. Study population
The African American Gullah population is estimated to bebetween 100,000 and 300,000 and largely resides in the Sea Is-lands of South Carolina and Georgia. It is a unique community fordefining environmental factors for autoimmune diseases due to itslow non-African genetic admixture, environmental-geographichomogeneity within the Sea Island region, and high prevalence ofantinuclear antibody (ANA) positivity and of autoimmune diseasessuch as systemic lupus erythematosus (SLE). The SLE in GullahHealth (SLEIGH) study is a longitudinal cohort of Gullah AfricanAmericans started in 2003 to investigate potential genetic andenvironmental factors in the development of autoimmunity (Ka-men et al., 2008). The SLEIGH study is conducted in cooperationwith and approval from the Sea Island Families Project CitizenAdvisory Committee (Spruill et al., 2013).
Gullah African Americans participating in the SLEIGH studywere invited between April 2010 and July 2013 to participate in anadditional exposure assessment visit. This study protocol was re-viewed and approved by the Medical University of South CarolinaInstitutional Review Board for Human Subjects Research and allparticipants provided informed consent. Participants came tostudy visits at the Medical University of South Carolina in Char-leston, South Carolina, where blood and urine samples were col-lected per a standardized protocol. Eighty SLEIGH study partici-pants with or without lupus completed the exposure assessmentvisit.
Serum samples from the study participants’ baseline SLEIGHvisit and subsequent exposure assessment visit were kept frozenat �80 degrees, then batch shipped on dry ice to the OrganicAnalytical Chemistry Laboratory of the Wadsworth Center of theNew York State Department of Health in Albany, NY for PFASanalysis. For this analysis, we excluded lupus patients and ex-amined biomarker temporal patterns between the first and secondvisit among 71 persons without lupus. Most (81%) participantswere female; participants ranged in age from 6.1 to 77.6 years oldat first visit.
2.2. PFAS biomarker measurements
Serum concentrations of PFASs were measured using highperformance liquid chromatography-tandem mass spectrometry(HPLC-MS/MS) as described elsewhere (Gump et al., 2011; Zhanget al., 2010). Briefly, 0.5 mL of serum sample, 5 ng of internal
s of perfluoroalkyl substances (PFAS) in serum of Gullah African//dx.doi.org/10.1016/j.envres.2015.03.012i
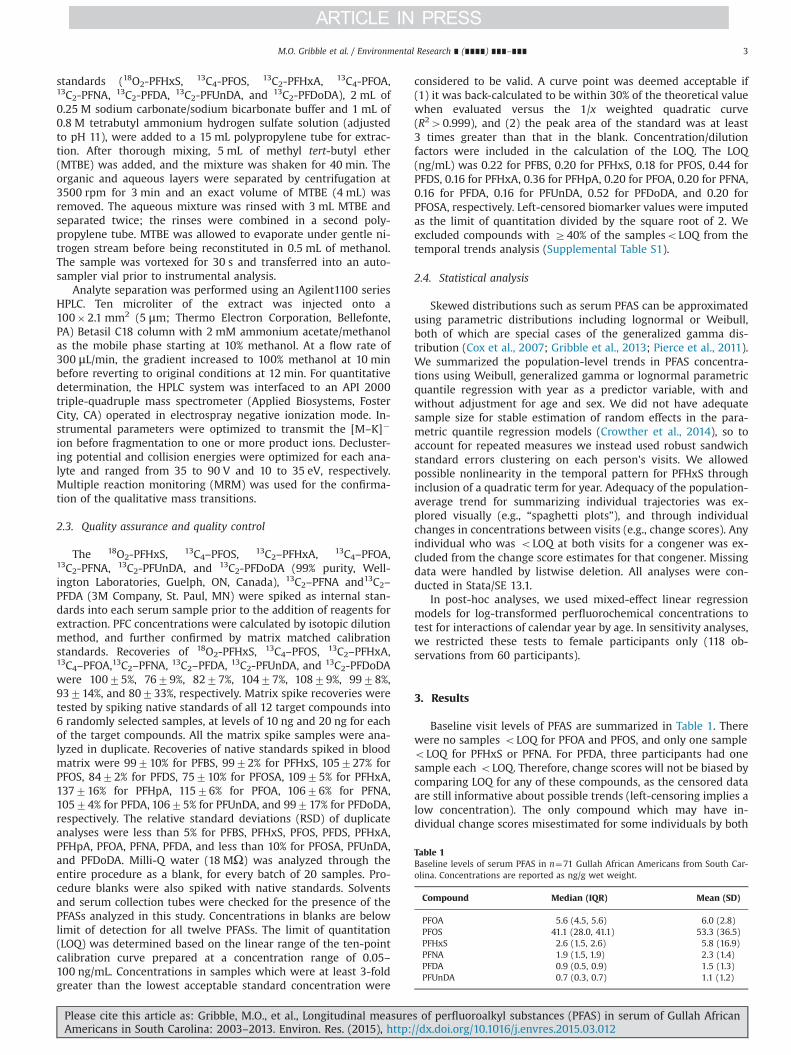
Table 1Baseline levels of serum PFAS in n¼71 Gullah African Americans from South Car-olina. Concentrations are reported as ng/g wet weight.
Compound Median (IQR) Mean (SD)
PFOA 5.6 (4.5, 5.6) 6.0 (2.8)PFOS 41.1 (28.0, 41.1) 53.3 (36.5)PFHxS 2.6 (1.5, 2.6) 5.8 (16.9)PFNA 1.9 (1.5, 1.9) 2.3 (1.4)PFDA 0.9 (0.5, 0.9) 1.5 (1.3)PFUnDA 0.7 (0.3, 0.7) 1.1 (1.2)
M.O. Gribble et al. / Environmental Research ∎ (∎∎∎∎) ∎∎∎–∎∎∎ 3
standards (18O2-PFHxS, 13C4-PFOS, 13C2-PFHxA, 13C4-PFOA,13C2-PFNA, 13C2-PFDA, 13C2-PFUnDA, and 13C2-PFDoDA), 2 mL of0.25 M sodium carbonate/sodium bicarbonate buffer and 1 mL of0.8 M tetrabutyl ammonium hydrogen sulfate solution (adjustedto pH 11), were added to a 15 mL polypropylene tube for extrac-tion. After thorough mixing, 5 mL of methyl tert-butyl ether(MTBE) was added, and the mixture was shaken for 40 min. Theorganic and aqueous layers were separated by centrifugation at3500 rpm for 3 min and an exact volume of MTBE (4 mL) wasremoved. The aqueous mixture was rinsed with 3 mL MTBE andseparated twice; the rinses were combined in a second poly-propylene tube. MTBE was allowed to evaporate under gentle ni-trogen stream before being reconstituted in 0.5 mL of methanol.The sample was vortexed for 30 s and transferred into an auto-sampler vial prior to instrumental analysis.
Analyte separation was performed using an Agilent1100 seriesHPLC. Ten microliter of the extract was injected onto a100�2.1 mm2 (5 μm; Thermo Electron Corporation, Bellefonte,PA) Betasil C18 column with 2 mM ammonium acetate/methanolas the mobile phase starting at 10% methanol. At a flow rate of300 μL/min, the gradient increased to 100% methanol at 10 minbefore reverting to original conditions at 12 min. For quantitativedetermination, the HPLC system was interfaced to an API 2000triple-quadruple mass spectrometer (Applied Biosystems, FosterCity, CA) operated in electrospray negative ionization mode. In-strumental parameters were optimized to transmit the [M–K]�
ion before fragmentation to one or more product ions. Decluster-ing potential and collision energies were optimized for each ana-lyte and ranged from 35 to 90 V and 10 to 35 eV, respectively.Multiple reaction monitoring (MRM) was used for the confirma-tion of the qualitative mass transitions.
2.3. Quality assurance and quality control
The 18O2-PFHxS, 13C4–PFOS, 13C2–PFHxA, 13C4–PFOA,13C2-PFNA, 13C2-PFUnDA, and 13C2-PFDoDA (99% purity, Well-ington Laboratories, Guelph, ON, Canada), 13C2–PFNA and13C2–
PFDA (3M Company, St. Paul, MN) were spiked as internal stan-dards into each serum sample prior to the addition of reagents forextraction. PFC concentrations were calculated by isotopic dilutionmethod, and further confirmed by matrix matched calibrationstandards. Recoveries of 18O2-PFHxS, 13C4–PFOS, 13C2–PFHxA,13C4–PFOA,13C2–PFNA, 13C2–PFDA, 13C2-PFUnDA, and 13C2-PFDoDAwere 10075%, 7679%, 8277%, 10477%, 10879%, 9978%,93714%, and 80733%, respectively. Matrix spike recoveries weretested by spiking native standards of all 12 target compounds into6 randomly selected samples, at levels of 10 ng and 20 ng for eachof the target compounds. All the matrix spike samples were ana-lyzed in duplicate. Recoveries of native standards spiked in bloodmatrix were 99710% for PFBS, 9972% for PFHxS, 105727% forPFOS, 8472% for PFDS, 75710% for PFOSA, 10975% for PFHxA,137716% for PFHpA, 11576% for PFOA, 10676% for PFNA,10574% for PFDA, 10675% for PFUnDA, and 99717% for PFDoDA,respectively. The relative standard deviations (RSD) of duplicateanalyses were less than 5% for PFBS, PFHxS, PFOS, PFDS, PFHxA,PFHpA, PFOA, PFNA, PFDA, and less than 10% for PFOSA, PFUnDA,and PFDoDA. Milli-Q water (18 MΩ) was analyzed through theentire procedure as a blank, for every batch of 20 samples. Pro-cedure blanks were also spiked with native standards. Solventsand serum collection tubes were checked for the presence of thePFASs analyzed in this study. Concentrations in blanks are belowlimit of detection for all twelve PFASs. The limit of quantitation(LOQ) was determined based on the linear range of the ten-pointcalibration curve prepared at a concentration range of 0.05–100 ng/mL. Concentrations in samples which were at least 3-foldgreater than the lowest acceptable standard concentration were
Please cite this article as: Gribble, M.O., et al., Longitudinal measureAmericans in South Carolina: 2003–2013. Environ. Res. (2015), http:
considered to be valid. A curve point was deemed acceptable if(1) it was back-calculated to be within 30% of the theoretical valuewhen evaluated versus the 1/x weighted quadratic curve(R240.999), and (2) the peak area of the standard was at least3 times greater than that in the blank. Concentration/dilutionfactors were included in the calculation of the LOQ. The LOQ(ng/mL) was 0.22 for PFBS, 0.20 for PFHxS, 0.18 for PFOS, 0.44 forPFDS, 0.16 for PFHxA, 0.36 for PFHpA, 0.20 for PFOA, 0.20 for PFNA,0.16 for PFDA, 0.16 for PFUnDA, 0.52 for PFDoDA, and 0.20 forPFOSA, respectively. Left-censored biomarker values were imputedas the limit of quantitation divided by the square root of 2. Weexcluded compounds with Z40% of the samplesoLOQ from thetemporal trends analysis (Supplemental Table S1).
2.4. Statistical analysis
Skewed distributions such as serum PFAS can be approximatedusing parametric distributions including lognormal or Weibull,both of which are special cases of the generalized gamma dis-tribution (Cox et al., 2007; Gribble et al., 2013; Pierce et al., 2011).We summarized the population-level trends in PFAS concentra-tions using Weibull, generalized gamma or lognormal parametricquantile regression with year as a predictor variable, with andwithout adjustment for age and sex. We did not have adequatesample size for stable estimation of random effects in the para-metric quantile regression models (Crowther et al., 2014), so toaccount for repeated measures we instead used robust sandwichstandard errors clustering on each person's visits. We allowedpossible nonlinearity in the temporal pattern for PFHxS throughinclusion of a quadratic term for year. Adequacy of the population-average trend for summarizing individual trajectories was ex-plored visually (e.g., “spaghetti plots”), and through individualchanges in concentrations between visits (e.g., change scores). Anyindividual who was oLOQ at both visits for a congener was ex-cluded from the change score estimates for that congener. Missingdata were handled by listwise deletion. All analyses were con-ducted in Stata/SE 13.1.
In post-hoc analyses, we used mixed-effect linear regressionmodels for log-transformed perfluorochemical concentrations totest for interactions of calendar year by age. In sensitivity analyses,we restricted these tests to female participants only (118 ob-servations from 60 participants).
3. Results
Baseline visit levels of PFAS are summarized in Table 1. Therewere no samples oLOQ for PFOA and PFOS, and only one sampleoLOQ for PFHxS or PFNA. For PFDA, three participants had onesample each oLOQ. Therefore, change scores will not be biased bycomparing LOQ for any of these compounds, as the censored dataare still informative about possible trends (left-censoring implies alow concentration). The only compound which may have in-dividual change scores misestimated for some individuals by both
s of perfluoroalkyl substances (PFAS) in serum of Gullah African//dx.doi.org/10.1016/j.envres.2015.03.012i
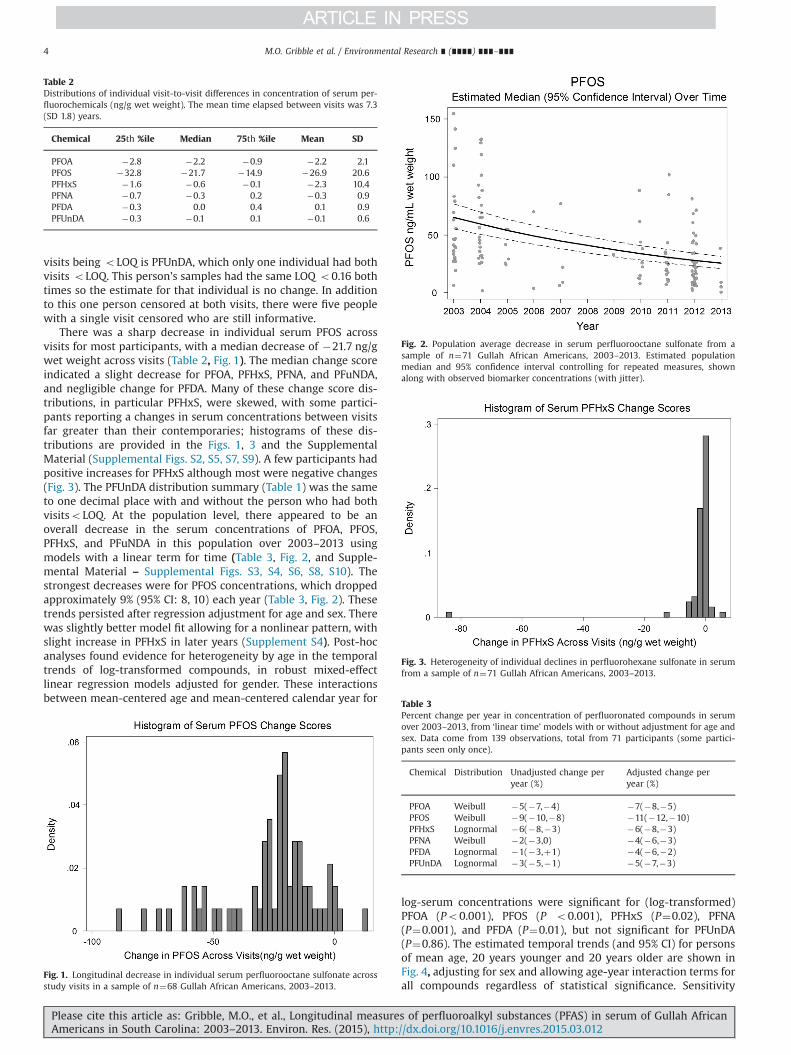
Table 2Distributions of individual visit-to-visit differences in concentration of serum per-fluorochemicals (ng/g wet weight). The mean time elapsed between visits was 7.3(SD 1.8) years.
Chemical 25th %ile Median 75th %ile Mean SD
PFOA �2.8 �2.2 �0.9 �2.2 2.1PFOS �32.8 �21.7 �14.9 �26.9 20.6PFHxS �1.6 �0.6 �0.1 �2.3 10.4PFNA �0.7 �0.3 0.2 �0.3 0.9PFDA �0.3 0.0 0.4 0.1 0.9PFUnDA �0.3 �0.1 0.1 �0.1 0.6
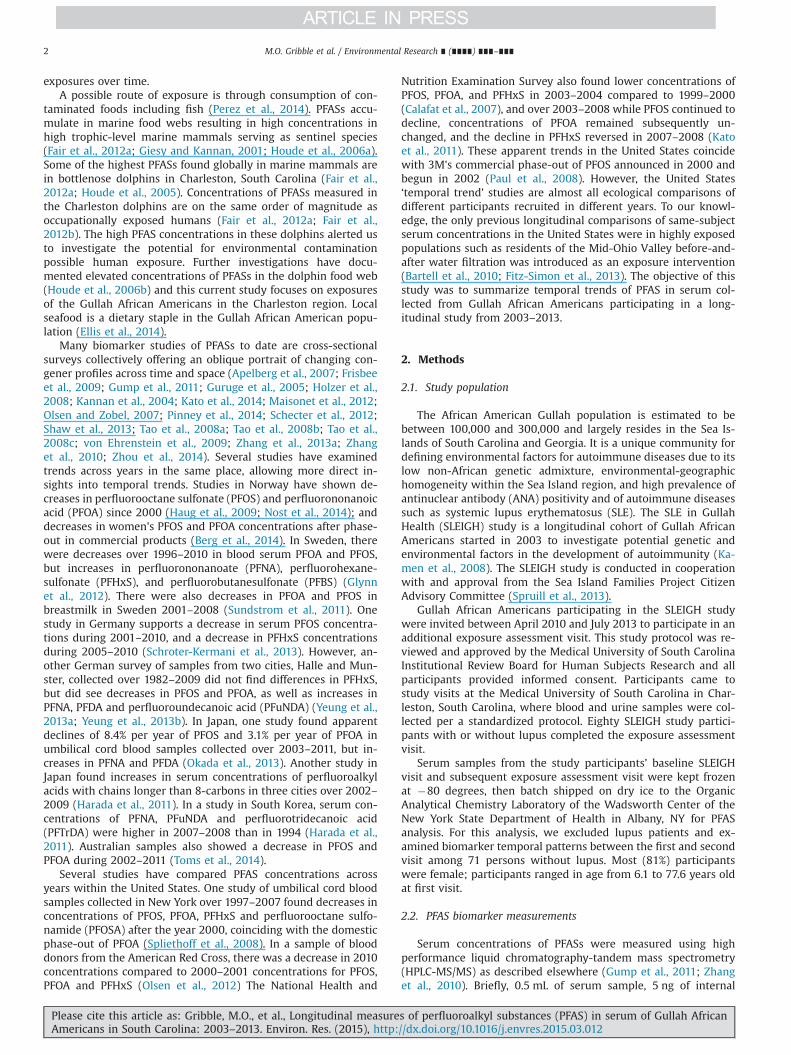
Fig. 2. Population average decrease in serum perfluorooctane sulfonate from asample of n¼71 Gullah African Americans, 2003–2013. Estimated populationmedian and 95% confidence interval controlling for repeated measures, shownalong with observed biomarker concentrations (with jitter).
Fig. 3. Heterogeneity of individual declines in perfluorohexane sulfonate in serumfrom a sample of n¼71 Gullah African Americans, 2003–2013.
Table 3
M.O. Gribble et al. / Environmental Research ∎ (∎∎∎∎) ∎∎∎–∎∎∎4
visits being oLOQ is PFUnDA, which only one individual had bothvisits oLOQ. This person’s samples had the same LOQ o0.16 bothtimes so the estimate for that individual is no change. In additionto this one person censored at both visits, there were five peoplewith a single visit censored who are still informative.
There was a sharp decrease in individual serum PFOS acrossvisits for most participants, with a median decrease of �21.7 ng/gwet weight across visits (Table 2, Fig. 1). The median change scoreindicated a slight decrease for PFOA, PFHxS, PFNA, and PFuNDA,and negligible change for PFDA. Many of these change score dis-tributions, in particular PFHxS, were skewed, with some partici-pants reporting a changes in serum concentrations between visitsfar greater than their contemporaries; histograms of these dis-tributions are provided in the Figs. 1, 3 and the SupplementalMaterial (Supplemental Figs. S2, S5, S7, S9). A few participants hadpositive increases for PFHxS although most were negative changes(Fig. 3). The PFUnDA distribution summary (Table 1) was the sameto one decimal place with and without the person who had bothvisitsoLOQ. At the population level, there appeared to be anoverall decrease in the serum concentrations of PFOA, PFOS,PFHxS, and PFuNDA in this population over 2003–2013 usingmodels with a linear term for time (Table 3, Fig. 2, and Supple-mental Material – Supplemental Figs. S3, S4, S6, S8, S10). Thestrongest decreases were for PFOS concentrations, which droppedapproximately 9% (95% CI: 8, 10) each year (Table 3, Fig. 2). Thesetrends persisted after regression adjustment for age and sex. Therewas slightly better model fit allowing for a nonlinear pattern, withslight increase in PFHxS in later years (Supplement S4). Post-hocanalyses found evidence for heterogeneity by age in the temporaltrends of log-transformed compounds, in robust mixed-effectlinear regression models adjusted for gender. These interactionsbetween mean-centered age and mean-centered calendar year for
Fig. 1. Longitudinal decrease in individual serum perfluorooctane sulfonate acrossstudy visits in a sample of n¼68 Gullah African Americans, 2003–2013.
Percent change per year in concentration of perfluoronated compounds in serumover 2003–2013, from ‘linear time’ models with or without adjustment for age andsex. Data come from 139 observations, total from 71 participants (some partici-pants seen only once).
Chemical Distribution Unadjusted change peryear (%)
Adjusted change peryear (%)
PFOA Weibull �5(�7,�4) �7(�8,�5)PFOS Weibull �9(�10,�8) �11(�12,�10)PFHxS Lognormal �6(�8,�3) �6(�8,�3)PFNA Weibull �2(�3,0) �4(�6,�3)PFDA Lognormal �1(�3,þ1) �4(�6,�2)PFUnDA Lognormal �3(�5,�1) �5(�7,�3)
Please cite this article as: Gribble, M.O., et al., Longitudinal measureAmericans in South Carolina: 2003–2013. Environ. Res. (2015), http:
log-serum concentrations were significant for (log-transformed)PFOA (Po0.001), PFOS (P o0.001), PFHxS (P¼0.02), PFNA(P¼0.001), and PFDA (P¼0.01), but not significant for PFUnDA(P¼0.86). The estimated temporal trends (and 95% CI) for personsof mean age, 20 years younger and 20 years older are shown inFig. 4, adjusting for sex and allowing age-year interaction terms forall compounds regardless of statistical significance. Sensitivity
s of perfluoroalkyl substances (PFAS) in serum of Gullah African//dx.doi.org/10.1016/j.envres.2015.03.012i
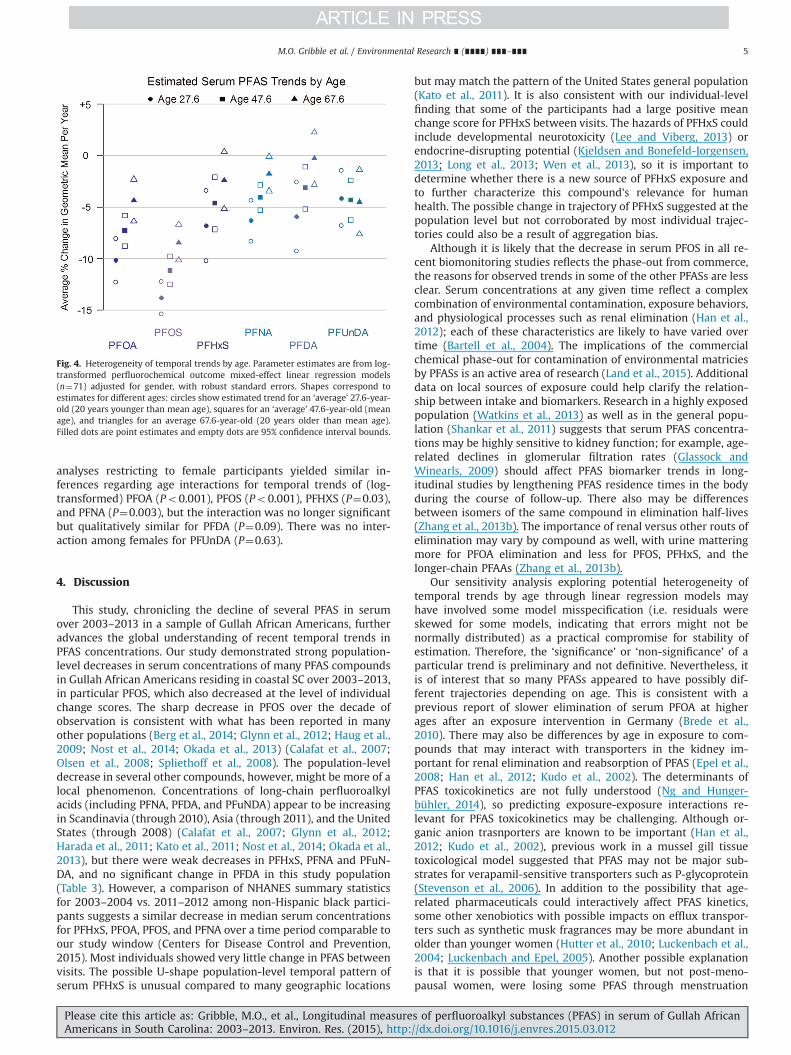
Fig. 4. Heterogeneity of temporal trends by age. Parameter estimates are from log-transformed perfluorochemical outcome mixed-effect linear regression models(n¼71) adjusted for gender, with robust standard errors. Shapes correspond toestimates for different ages: circles show estimated trend for an ‘average’ 27.6-year-old (20 years younger than mean age), squares for an ‘average’ 47.6-year-old (meanage), and triangles for an average 67.6-year-old (20 years older than mean age).Filled dots are point estimates and empty dots are 95% confidence interval bounds.
M.O. Gribble et al. / Environmental Research ∎ (∎∎∎∎) ∎∎∎–∎∎∎ 5
analyses restricting to female participants yielded similar in-ferences regarding age interactions for temporal trends of (log-transformed) PFOA (Po0.001), PFOS (Po0.001), PFHXS (P¼0.03),and PFNA (P¼0.003), but the interaction was no longer significantbut qualitatively similar for PFDA (P¼0.09). There was no inter-action among females for PFUnDA (P¼0.63).
4. Discussion
This study, chronicling the decline of several PFAS in serumover 2003–2013 in a sample of Gullah African Americans, furtheradvances the global understanding of recent temporal trends inPFAS concentrations. Our study demonstrated strong population-level decreases in serum concentrations of many PFAS compoundsin Gullah African Americans residing in coastal SC over 2003–2013,in particular PFOS, which also decreased at the level of individualchange scores. The sharp decrease in PFOS over the decade ofobservation is consistent with what has been reported in manyother populations (Berg et al., 2014; Glynn et al., 2012; Haug et al.,2009; Nost et al., 2014; Okada et al., 2013) (Calafat et al., 2007;Olsen et al., 2008; Spliethoff et al., 2008). The population-leveldecrease in several other compounds, however, might be more of alocal phenomenon. Concentrations of long-chain perfluoroalkylacids (including PFNA, PFDA, and PFuNDA) appear to be increasingin Scandinavia (through 2010), Asia (through 2011), and the UnitedStates (through 2008) (Calafat et al., 2007; Glynn et al., 2012;Harada et al., 2011; Kato et al., 2011; Nost et al., 2014; Okada et al.,2013), but there were weak decreases in PFHxS, PFNA and PFuN-DA, and no significant change in PFDA in this study population(Table 3). However, a comparison of NHANES summary statisticsfor 2003–2004 vs. 2011–2012 among non-Hispanic black partici-pants suggests a similar decrease in median serum concentrationsfor PFHxS, PFOA, PFOS, and PFNA over a time period comparable toour study window (Centers for Disease Control and Prevention,2015). Most individuals showed very little change in PFAS betweenvisits. The possible U-shape population-level temporal pattern ofserum PFHxS is unusual compared to many geographic locations
Please cite this article as: Gribble, M.O., et al., Longitudinal measureAmericans in South Carolina: 2003–2013. Environ. Res. (2015), http:
but may match the pattern of the United States general population(Kato et al., 2011). It is also consistent with our individual-levelfinding that some of the participants had a large positive meanchange score for PFHxS between visits. The hazards of PFHxS couldinclude developmental neurotoxicity (Lee and Viberg, 2013) orendocrine-disrupting potential (Kjeldsen and Bonefeld-Jorgensen,2013; Long et al., 2013; Wen et al., 2013), so it is important todetermine whether there is a new source of PFHxS exposure andto further characterize this compound's relevance for humanhealth. The possible change in trajectory of PFHxS suggested at thepopulation level but not corroborated by most individual trajec-tories could also be a result of aggregation bias.
Although it is likely that the decrease in serum PFOS in all re-cent biomonitoring studies reflects the phase-out from commerce,the reasons for observed trends in some of the other PFASs are lessclear. Serum concentrations at any given time reflect a complexcombination of environmental contamination, exposure behaviors,and physiological processes such as renal elimination (Han et al.,2012); each of these characteristics are likely to have varied overtime (Bartell et al., 2004). The implications of the commercialchemical phase-out for contamination of environmental matriciesby PFASs is an active area of research (Land et al., 2015). Additionaldata on local sources of exposure could help clarify the relation-ship between intake and biomarkers. Research in a highly exposedpopulation (Watkins et al., 2013) as well as in the general popu-lation (Shankar et al., 2011) suggests that serum PFAS concentra-tions may be highly sensitive to kidney function; for example, age-related declines in glomerular filtration rates (Glassock andWinearls, 2009) should affect PFAS biomarker trends in long-itudinal studies by lengthening PFAS residence times in the bodyduring the course of follow-up. There also may be differencesbetween isomers of the same compound in elimination half-lives(Zhang et al., 2013b). The importance of renal versus other routs ofelimination may vary by compound as well, with urine matteringmore for PFOA elimination and less for PFOS, PFHxS, and thelonger-chain PFAAs (Zhang et al., 2013b).
Our sensitivity analysis exploring potential heterogeneity oftemporal trends by age through linear regression models mayhave involved some model misspecification (i.e. residuals wereskewed for some models, indicating that errors might not benormally distributed) as a practical compromise for stability ofestimation. Therefore, the ‘significance’ or ‘non-significance’ of aparticular trend is preliminary and not definitive. Nevertheless, itis of interest that so many PFASs appeared to have possibly dif-ferent trajectories depending on age. This is consistent with aprevious report of slower elimination of serum PFOA at higherages after an exposure intervention in Germany (Brede et al.,2010). There may also be differences by age in exposure to com-pounds that may interact with transporters in the kidney im-portant for renal elimination and reabsorption of PFAS (Epel et al.,2008; Han et al., 2012; Kudo et al., 2002). The determinants ofPFAS toxicokinetics are not fully understood (Ng and Hunger-bühler, 2014), so predicting exposure-exposure interactions re-levant for PFAS toxicokinetics may be challenging. Although or-ganic anion trasnporters are known to be important (Han et al.,2012; Kudo et al., 2002), previous work in a mussel gill tissuetoxicological model suggested that PFAS may not be major sub-strates for verapamil-sensitive transporters such as P-glycoprotein(Stevenson et al., 2006). In addition to the possibility that age-related pharmaceuticals could interactively affect PFAS kinetics,some other xenobiotics with possible impacts on efflux transpor-ters such as synthetic musk fragrances may be more abundant inolder than younger women (Hutter et al., 2010; Luckenbach et al.,2004; Luckenbach and Epel, 2005). Another possible explanationis that it is possible that younger women, but not post-meno-pausal women, were losing some PFAS through menstruation
s of perfluoroalkyl substances (PFAS) in serum of Gullah African//dx.doi.org/10.1016/j.envres.2015.03.012i

M.O. Gribble et al. / Environmental Research ∎ (∎∎∎∎) ∎∎∎–∎∎∎6
(Harada et al., 2005; Lorber et al., 2015) and the majority of thisstudy sample was female. Recent work suggests that eliminationhalf-lives may be different between younger women vs. males andolder women, although all these compounds have long half-lives(Zhang et al., 2013b). Zhang et al.'s recent estimates for youngerwomen's elimination geometric mean half-lives are 7.1 years forPFHxS, 6.0 years for PFOS (sum across isomers), 1.8 for PFOA (sumacross isomers), 1.7 years for PFNA, 4.0 years for PFDA, and4.4 years for PFUnDA. Their estimates for males and older womenare 25 years for PFHxS, 18 years for PFOS (sum across isomers),1.7 years for PFOA, 3.5 years for PFNA, 9.2 years for PFDA, and7.7 years for PFUnDA. We tentatively interpret our observed in-teraction by age, and similar results in sensitivity analysis re-stricted to females, as a replication of the finding that there may beelimination differences in young women vs. older women.
Strengths of this study include the data to contrast individual-level with population-level trajectories of exposure; the flexible andinterpretable modeling approach; and the low limits of quantitationfor each PFAS. Limitations of this study include the sample size,narrow geographic scope, and potential non-representativeness of asample selected to be without lupus for the broader Gullah AfricanAmerican community in coastal South Carolina. Also, because of oursample size limitation we opted for robust standard errors ratherthan hierarchical modeling. Future research in a larger sample mightallow for more flexible modeling.
5. Conclusions
Serum concentrations decreased over 2003–2013 among Gul-lah African Americans in coastal South Carolina for PFOS andseveral other PFAS. No serum PFAS appeared to monotonicallyincrease over this decade at the population level, and the generalpattern of individual biomarker trajectories was generally con-sistent, although PFHxS might be increasing in recent years.Addi-tional data are needed on whether PFHxS exposure is increasing inrecent years in this setting. Age may be an important modifier ofPFAS exposure trajectories; future studies should investigate pos-sible mechanism by which age may modify these trajectories.
Competing interests
The authors have no competing interests to declare.
Acknowledgments
Research reported in this publication was supported by theNational Institute of Arthritis and Musculoskeletal and Skin Dis-eases and the National Institute of Environmental Health Sciencesof the National Institutes of Health under Award Numbers R21ES017934 (DLK), P60 AR062755 (DLK) and UL1 RR029882 to MUSC.MOG was supported by an “Environmental Genomics” T32 traininggrant from the National Institute for Environmental Health Sciences(T32ES013678-07). The content of this publication is solely the re-sponsibility of the authors and does not necessarily represent theofficial views of the National Institutes of Health. We thank all of thestudy participants for their time and commitment to the study.
Appendix A. Suplementary information
Supplementary data associated with this article can be found inthe online version at http://dx.doi.org/10.1016/j.envres.2015.03.012.
Please cite this article as: Gribble, M.O., et al., Longitudinal measureAmericans in South Carolina: 2003–2013. Environ. Res. (2015), http:
References
Apelberg, B.J., et al., 2007. Determinants of fetal exposure to polyfluoroalkyl com-pounds in Baltimore, Maryland. Environ. Sci. Technol. 41, 3891–3897.
Armitage, J.M., et al., 2009. Comparative assessment of the global fate and transportpathways of long-chain perfluorocarboxylic acids (PFCAs) and per-fluorocarboxylates (PFCs) emitted from direct sources. Environ. Sci. Technol. 43,5830–5836.
Bach, C.C., et al., 2014. Perfluoroalkyl and polyfluoroalkyl substances and humanfetal growth: a systematic review. Crit. Rev. Toxicol., 1–15.
Bartell, S.M., et al., 2010. Rate of decline in serum PFOA concentrations aftergranular activated carbon filtration at two public water systems in Ohio andWest Virginia. Environ. Health Perspect. 118, 222–228.
Bartell, S.M., et al., 2004. Temporal error in biomarker-based mean exposure esti-mates for individuals. J. Expo. Anal. Environ. Epidemiol. 14, 173–179.
Benbrahim-Tallaa, L., et al., 2014. Carcinogenicity of perfluorooctanoic acid, tetra-fluoroethylene, dichloromethane, 1,2-dichloropropane, and 1,3-propane sul-tone. Lancet Oncol. 15, 924–925.
Berg, V., et al., 2014. Maternal serum concentrations of per- and polyfluoroalkylsubstances and their predictors in years with reduced production and use.Environ. Int. 69, 58–66.
Brede, E., et al., 2010. Two-year follow-up biomonitoring pilot study of residents’and controls’ PFC plasma levels after PFOA reduction in public water system inArnsberg, Germany. Int. J. Hyg. Environ. Health 213, 217–223.
Buck, R., et al., 2011. Perfluoroalkyl and polyfluoroalkyl substances in the en-vironment: Terminology, classification, and origins. Integr. Environ. Assess.Manag. 7, 513–541.
Butt, C.M., et al., 2010. Levels and trends of poly- and perfluorinated compounds inthe arctic environment. Sci. Total Environ. 408, 2936–2965.
Calafat, A.M., et al., 2007. Polyfluoroalkyl chemicals in the U.S. population: datafrom the National Health and Nutrition Examination Survey (NHANES) 2003–2004 and comparisons with NHANES 1999–2000. Environ. Health Perspect.115, 1596–1602.
Chang, E.T., et al., 2014. A critical review of perfluorooctanoate and per-fluorooctanesulfonate exposure and cancer risk in humans. Crit. Rev. Toxicol. 44(Suppl 1), 1–81.
Cox, C., et al., 2007. Parametric survival analysis and taxonomy of hazard functionsfor the generalized gamma distribution. Stat. Med. 26, 4352–4374.
Crowther, M.J., et al., 2014. Multilevel mixed effects parametric survival modelsusing adaptive Gauss-Hermite quadrature with application to recurrent eventsand individual participant data meta-analysis. Stat. Med. 33, 3844–3858.
Domingo, J.L., 2012. Health risks of dietary exposure to perfluorinated compounds.Environ. Int. 40, 187–195.
Ellis, J.H., et al., 2014. A qualitative exploration of fishing and fish consumption inthe gullah/geechee culture. J. Commun. Health 39, 1161–1170.
Epel, D., et al., 2008. Efflux transporters: newly appreciated roles in protectionagainst pollutants. Environ. Sci. Technol. 42, 3914–3920.
Fair, P.A., et al., 2012a. Assessment of perfluorinated compounds (PFCs) in plasma ofbottlenose dolphins from two southeast US estuarine areas: relationship withage, sex and geographic locations. Mar. Pollut. Bull. 64, 66–74.
Fair, P.A., et al., 2012b. Association between plasma concentrations of per-fluorochemicals (PFCs) and immune and clinical chemistry parameters inbottlenose dolphins (Tursiops truncatus). Environ. Toxicol. Chem. 32, 736–746.
Fitz-Simon, N., et al., 2013. Reductions in serum lipids with a 4-year decline inserum perfluorooctanoic acid and perfluorooctanesulfonic acid. Epidemiology24, 569–576.
Frisbee, S.J., et al., 2009. The C8 health project: design, methods, and participants.Environ. Health Perspect. 117, 1873–1882.
Giesy, J.P., Kannan, K., 2001. Global distribution of perfluorooctane sulfonate inwildlife. Environ. Sci. Technol. 35, 1339–1342.
Glassock, R.J., Winearls, C., 2009. Ageing and the glomerular filtration rate: truthsand consequences. Trans. Am. Clin. Climatol. Assoc. 120, 419–428.
Glynn, A., et al., 2012. Perfluorinated alkyl acids in blood serum from primiparouswomen in Sweden: serial sampling during pregnancy and nursing, and tem-poral trends 1996–2010. Environ. Sci. Technol. 46, 9071–9079.
Gribble, M.O., et al., 2013. Body composition and arsenic metabolism: a cross-sec-tional analysis in the strong heart study. Environ. Health. 12, 107.
Gump, B.B., et al., 2011. Perfluorochemical (PFC) exposure in children: associationswith impaired response inhibition. Environ. Sci. Technol. 45, 8151–8159.
Guruge, K.S., et al., 2005. Perfluorinated organic compounds in human blood serumand seminal plasma: a study of urban and rural tea worker populations in SriLanka. J. Environ. Monit. 7, 371–377.
Han, X., et al., 2012. Renal elimination of perfluorocarboxylates (PFCAs). Chem. Res.Toxicol. 25, 35–46.
Harada, K., et al., 2005. Renal clearance of perfluorooctane sulfonate and per-fluorooctanoate in humans and their species-specific excretion. Environ. Res.99, 253–261.
Harada, K.H., et al., 2011. Odd-numbered perfluorocarboxylates predominate overperfluorooctanoic acid in serum samples from Japan, Korea and Vietnam. En-viron. Int. 37, 1183–1189.
Haug, L.S., et al., 2009. Time trends and the influence of age and gender on serumconcentrations of perfluorinated compounds in archived human samples. En-viron. Sci. Technol. 43, 2131–2136.
Holzer, J., et al., 2008. Biomonitoring of perfluorinated compounds in children andadults exposed to perfluorooctanoate-contaminated drinking water. Environ.
s of perfluoroalkyl substances (PFAS) in serum of Gullah African//dx.doi.org/10.1016/j.envres.2015.03.012i
M.O. Gribble et al. / Environmental Research ∎ (∎∎∎∎) ∎∎∎–∎∎∎ 7
Health Perspect. 116, 651–657.Houde, M., et al., 2006a. Biomagnification of perfluoroalkyl compounds in the
bottlenose dolphin (Tursiops truncatus) food web. Environ. Sci. Technol. 40,4138–4144.
Houde, M., et al., 2006b. Perfluoroalkyl compounds in relation to life-history andreproductive parameters in bottlenose dolphins (Tursiops truncatus) fromSarasota Bay, Florida, U.S.A. Environ. Toxicol. Chem. 25, 2405–2412.
Houde, M., et al., 2005. Polyfluoroalkyl compounds in free-ranging bottlenosedolphins (Tursiops truncatus) from the Gulf of Mexico and the Atlantic Ocean.Environ. Sci. Technol. 39, 6591–6598.
Hutter, H.P., et al., 2010. Higher blood concentrations of synthetic musks in womenabove fifty years than in younger women. Int. J. Hygiene Environ. Health 213,124–130.
Johnson, P.I., et al., 2014. The Navigation Guide-evidence-based medicine meetsenvironmental health: systematic review of human evidence for PFOA effectson fetal growth. Environ. Health Perspect. 122, 1028–1039.
Kamen, D.L., et al., 2008. Autoantibody prevalence and lupus characteristics in aunique African American population. Arthritis Rheum. 58, 1237–1247.
Kannan, K., et al., 2004. Perfluorooctanesulfonate and related fluorochemicals inhuman blood from several countries. Environ. Sci. Technol. 38, 4489–4495.
Kato, K., 2014. Changes in serum concentrations of maternal Poly- and Per-fluoroalkyl substances over the course of pregnancy and predictors of exposurein a multiethnic cohort of cincinnati, Ohio pregnant women during 2003–2006.Environ. Sci. Technol. 48, 9600–9608.
Kato, K., et al., 2011. Trends in exposure to polyfluoroalkyl chemicals in the U.S.Population: 1999–2008. Environ. Sci. Technol. 45, 8037–8045.
Kjeldsen, L.S., Bonefeld-Jorgensen, E.C., 2013. Perfluorinated compounds affect thefunction of sex hormone receptors. Environ. Sci. Pollut. Res. Int. 20, 8031–8044.
Kudo, N., et al., 2002. Sex hormone-regulated renal transport of perfluorooctanoicacid. Chem. Biol. Interact. 139, 301–316.
Land, M., et al., 2015. What is the effect of phasing out long-chain per- and perfluo-roalkyl substances on the concentration of perfluoroalkyl acids and their pre-cursors in the environment? A systematic review protocol. Environ. Evid. 4, 3.
Lau, C., 2012. Perfluoroalkyl acids: recent research highlights. Reprod. Toxicol. 33,405–409.
Lee, I., Viberg, H., 2013. A single neonatal exposure to perfluorohexane sulfonate(PFHxS) affects the levels of important neuroproteins in the developing mousebrain. Neurotoxicology 37, 190–196.
Lehmler, H.J., 2005. Synthesis of environmentally relevant fluorinated surfactants–areview. Chemosphere 58, 1471–1496.
Long, M., et al., 2013. Effects of perfluoroalkyl acids on the function of the thyroidhormone and the aryl hydrocarbon receptor. Environ. Sci. Pollut. Res. Int. 20,8045–8056.
Lorber, M., et al., 2015. The effect of ongoing blood loss on human serum con-centrations of perfluorinated acids. Chemosphere 118, 170–177.
Luckenbach, T., et al., 2004. Fatal attraction: synthetic musk fragrances compromisemultixenobiotic defense systems in mussels. Marine Environ. Res. 58, 215–219.
Luckenbach, T., Epel, D., 2005. Nitromusk and polycyclic musk compounds as long-term inhibitors of cellular xenobiotic defense systems mediated by multidrugtransporters. Environ. Health Perspect. 113, 17–24.
Ludwicki, J.K., et al., 2015. Hazard quotient profiles used as a risk assessment toolfor PFOS and PFOA serum levels in three distinctive European populations.Environ. Int. 74, 112–118.
Maisonet, M., et al., 2012. Maternal concentrations of polyfluoroalkyl compoundsduring pregnancy and fetal and postnatal growth in British girls. Environ.Health Perspect. 120, 1432–1437.
Ng, C.A., Hungerbühler, K., 2014. Bioaccumulation of perfluorinated alkyl acids:observations and models. Environ. Sci. Technol. 48, 4637–4648.
Nost, T.H., et al., 2014. Repeated measurements of per- and polyfluoroalkyl sub-stances (PFASs) from 1979 to 2007 in males from Northern Norway: assessingtime trends, compound correlations and relations to age/birth cohort. Environ.Int. 67, 43–53.
Okada, E., et al., 2013. Temporal trends of perfluoroalkyl acids in plasma samples ofpregnant women in Hokkaido, Japan, 2003–2011. Environ. Int. 60, 89–96.
Olsen, G.W., et al., 2012. Temporal trends of perfluoroalkyl concentrations inAmerican Red Cross adult blood donors, 2000–2010. Environ. Sci. Technol. 46,6330–6338.
Olsen, G.W., et al., 2008. Decline in perfluorooctanesulfonate and other poly-fluoroalkyl chemicals in American Red Cross adult blood donors, 2000–2006.Environ. Sci. Technol. 42, 4989–4995.
Olsen, G.W., Zobel, L.R., 2007. Assessment of lipid, hepatic, and thyroid parameterswith serum perfluorooctanoate (PFOA) concentrations in fluorochemical pro-duction workers. Int. Arch. Occup. Environ. Health 81, 231–246.
Paul, A.G., et al., 2008. A first global production, emission, and environmental in-ventory for Perfluorooctane Sulfonate. Environ. Sci. Technol. 43, 386–392.
Perez, F., et al., 2014. Assessment of perfluoroalkyl substances in food items at
Please cite this article as: Gribble, M.O., et al., Longitudinal measureAmericans in South Carolina: 2003–2013. Environ. Res. (2015), http:
global scale. Environ. Res. 135C, 181–189.Pérez, F., et al., 2013. Accumulation of perfluoroalkyl substances in human tissues.
Environ. Int. 59, 354–362.Pierce, C.B., et al., 2011. Methods for characterizing differences in longitudinal
glomerular filtration rate changes between children with glomerular chronickidney disease and those with nonglomerular chronic kidney disease. Am. J.Epidemiol. 174, 604–612.
Pinney, S.M., et al., 2014. Serum biomarkers of polyfluoroalkyl compound exposurein young girls in Greater Cincinnati and the San Francisco Bay Area, USA. En-viron. Pollut. 184, 327–334.
Post, G.B., et al., 2012. Perfluorooctanoic acid (PFOA), an emerging drinking watercontaminant: a critical review of recent literature. Environ. Res. 116, 93–117.
Schecter, A., et al., 2012. Polyfluoroalkyl compounds in Texas children from birththrough 12 years of age. Environ. Health Perspect. 120, 590–594.
Schroter-Kermani, C., et al., 2013. Retrospective monitoring of per-fluorocarboxylates and perfluorosulfonates in human plasma archived by theGerman Environmental Specimen Bank. Int. J. Hyg. Environ. Health 216,633–640.
Shankar, A., et al., 2011. Perfluoroalkyl chemicals and chronic kidney disease in USadults. Am. J. Epidemiol. 174, 893–900.
Shaw, S.D., et al., 2013. Persistent organic pollutants including polychlorinated andpolybrominated dibenzo-p-dioxins and dibenzofurans in firefighters fromNorthern California. Chemosphere 91, 1386–1394.
Spliethoff, H.M., et al., 2008. Use of newborn screening program blood spots forexposure assessment: declining levels of perluorinated compounds in NewYork State infants. Environ. Sci. Technol. 42, 5361–5367.
Spruill, I.J., et al., 2013. Successes, challenges and lessons learned: community-en-gaged research with South Carolina’s Gullah population. Gateways: Int. J.Commun. Res. Engag. 6, 150–169.
Steenland, K., et al., 2010. Epidemiologic evidence on the health effects of per-fluorooctanoic acid (PFOA). Environ. Health Perspect. 118, 1100–1108.
Stevenson, C.N., et al., 2006. New perspectives on perfluorochemical ecotoxicology:inhibition and induction of an efflux transporter in the marine mussel, Mytiluscalifornianus. Environ. Sci. Technol. 40, 5580–5585.
Sundstrom, M., et al., 2011. A temporal trend study (1972–2008) of per-fluorooctanesulfonate, perfluorohexanesulfonate, and perfluorooctanoate inpooled human milk samples from Stockholm, Sweden. Environ. Int. 37,178–183.
Tao, L., et al., 2008a. Biomonitoring of perfluorochemicals in plasma of New YorkState personnel responding to the World Trade Center disaster. Environ. Sci.Technol. 42, 3472–3478.
Tao, L., et al., 2008b. Perfluorinated compounds in human milk from Massachu-setts, U.S.A. Environ. Sci. Technol. 42, 3096–3101.
Tao, L., et al., 2008c. Perfluorinated compounds in human breast milk from severalAsian countries, and in infant formula and dairy milk from the United States.Environ. Sci. Technol. 42, 8597–8602.
Toms, L.M., et al., 2014. Decline in perfluorooctane sulfonate and per-fluorooctanoate serum concentrations in an Australian population from 2002 to2011. Environ. Int. 71, 74–80.
von Ehrenstein, O.S., et al., 2009. Polyfluoroalkyl chemicals in the serum and milk ofbreastfeeding women. Reprod. Toxicol. 27, 239–245.
Watkins, D.J., et al., 2013. Exposure to perfluoroalkyl acids and markers of kidneyfunction among children and adolescents living near a chemical plant. Environ.Health Perspect. 121, 625–630.
Wen, L.L., et al., 2013. Association between serum perfluorinated chemicals andthyroid function in U.S. adults: the National Health and Nutrition ExaminationSurvey 2007–2010. J. Clin. Endocrinol. Metab. 98, E1456–E1464.
Yeung, L.W., et al., 2013a. Part I. A temporal study of PFCAs and their precursors inhuman plasma from two German cities 1982–2009. Environ. Sci. Technol. 47,3865–3874.
Yeung, L.W., et al., 2013b. Part II. A temporal study of PFOS and its precursors inhuman plasma from two German cities in 1982–2009. Environ. Sci. Technol. 47,3875–3882.
Zhang, T., et al., 2013a. Distribution of poly- and perfluoroalkyl substances inmatched samples from pregnant women and carbon chain length relatedmaternal transfer. Environ. Sci. Technol. 47, 7974–7981.
Zhang, T., et al., 2010. Perfluorinated compounds in whole blood samples frominfants, children, and adults in China. Environ. Sci. Technol. 44, 4341–4347.
Zhang, Y., et al., 2013b. Biomonitoring of perfluoroalkyl acids in human urine andestimates of biological half-life. Environ. Sci. Technol. 47, 10619–10627.
Zhou, Z., et al., 2014. Highly elevated serum concentrations of perfluoroalkyl sub-stances in fishery employees from Tangxun lake, china. Environ. Sci. Technol.48, 3864–3874.
s of perfluoroalkyl substances (PFAS) in serum of Gullah African//dx.doi.org/10.1016/j.envres.2015.03.012i
Related Documents