Longitudinal development of number line estimation and mathematics performance in primary school children Ilona Friso-van den Bos a,⇑ , Evelyn H. Kroesbergen a , Johannes E.H. Van Luit a , Iro Xenidou-Dervou b , Lisa M. Jonkman c , Menno Van der Schoot b , Ernest C.D.M. Van Lieshout b a Department of Educational and Learning Sciences, Faculty of Social and Behavioral Sciences, Utrecht University, 3508 TC Utrecht, The Netherlands b Department of Educational Neuroscience, Faculty of Psychology and Education, VU University Amsterdam, 1081 BT Amsterdam, The Netherlands c Department of Cognitive Neuroscience, Faculty of Psychology and Neuroscience, Maastricht University, 6200 MD Maastricht, The Netherlands article info Article history: Received 30 July 2014 Revised 2 February 2015 Keywords: Numerical abilities Number line Estimation Mathematics Children Longitudinal abstract Children’s ability to relate number to a continuous quantity abstraction visualized as a number line is widely accepted to be predictive of mathematics achievement. However, a debate has emerged with respect to how children’s placements are distributed on this number line across development. In the current study, dif- ferent models were applied to children’s longitudinal number placement data to get more insight into the development of num- ber line representations in kindergarten and early primary school years. In addition, longitudinal developmental relations between number line placements and mathematical achievement, mea- sured with a national test of mathematics, were investigated using cross-lagged panel modeling. A group of 442 children participated in a 3-year longitudinal study (ages 5–8 years) in which they com- pleted a number-to-position task every 6 months. Individual number line placements were fitted to various models, of which a one-anchor power model provided the best fit for many of the placements at a younger age (5 or 6 years) and a two-anchor power model provided better fit for many of the children at an older age (7 or 8 years). The number of children who made linear placements http://dx.doi.org/10.1016/j.jecp.2015.02.002 0022-0965/Ó 2015 The Authors. Published by Elsevier Inc. This is an open access article under the CC BY-NC-ND license (http://creativecommons.org/licenses/by-nc-nd/4.0/). ⇑ Corresponding author. E-mail address: [email protected] (I. Friso-van den Bos). Journal of Experimental Child Psychology 134 (2015) 12–29 Contents lists available at ScienceDirect Journal of Experimental Child Psychology journal homepage: www.elsevier.com/locate/jecp

Welcome message from author
This document is posted to help you gain knowledge. Please leave a comment to let me know what you think about it! Share it to your friends and learn new things together.
Transcript
Longitudinal development of number lineestimation and mathematics performance in
primary school children
Ilona Friso-van den Bos a,⇑, Evelyn H. Kroesbergen a, Johannes E.H. Van Luit a,Iro Xenidou-Dervou b, Lisa M. Jonkman c, Menno Van der Schoot b,Ernest C.D.M. Van Lieshout b
aDepartment of Educational and Learning Sciences, Faculty of Social and Behavioral Sciences, Utrecht University, 3508 TC Utrecht,
The NetherlandsbDepartment of Educational Neuroscience, Faculty of Psychology and Education, VU University Amsterdam, 1081 BT Amsterdam,
The NetherlandscDepartment of Cognitive Neuroscience, Faculty of Psychology and Neuroscience, Maastricht University, 6200 MD Maastricht,
The Netherlands
a r t i c l e i n f o
Article history:
Received 30 July 2014
Revised 2 February 2015
Keywords:
Numerical abilities
Number line
Estimation
Mathematics
Children
Longitudinal
a b s t r a c t
Children’s ability to relate number to a continuous quantity
abstraction visualized as a number line is widely accepted to be
predictive of mathematics achievement. However, a debate has
emerged with respect to how children’s placements are distributed
on this number line across development. In the current study, dif-
ferent models were applied to children’s longitudinal number
placement data to get more insight into the development of num-
ber line representations in kindergarten and early primary school
years. In addition, longitudinal developmental relations between
number line placements and mathematical achievement, mea-
sured with a national test of mathematics, were investigated using
cross-lagged panel modeling. A group of 442 children participated
in a 3-year longitudinal study (ages 5–8 years) in which they com-
pleted a number-to-position task every 6 months. Individual
number line placements were fitted to various models, of which
a one-anchor power model provided the best fit for many of the
placements at a younger age (5 or 6 years) and a two-anchor power
model provided better fit for many of the children at an older age
(7 or 8 years). The number of children who made linear placements
http://dx.doi.org/10.1016/j.jecp.2015.02.002
0022-0965/� 2015 The Authors. Published by Elsevier Inc.
This is an open access article under the CC BY-NC-ND license (http://creativecommons.org/licenses/by-nc-nd/4.0/).
⇑ Corresponding author.
E-mail address: [email protected] (I. Friso-van den Bos).
Journal of Experimental Child Psychology 134 (2015) 12–29
Contents lists available at ScienceDirect
Journal of Experimental ChildPsychology
journal homepage: www.elsevier .com/locate/ jecp
also grew with age. Cross-lagged panel analyses indicated that the
best fit was provided with a model in which number line acuity
and mathematics performance were mutually predictive of each
other rather than models in which one ability predicted the other
in a non-reciprocal way. This indicates that number line acuity
should not be seen as a predictor of math but that both skills influ-
ence each other during the developmental process.
� 2015 The Authors. Published by Elsevier Inc. This is an open
access article under the CC BY-NC-ND license (http://creativecom-
mons.org/licenses/by-nc-nd/4.0/).
Introduction
Will I need to run to be in time for school? If my brother gets three pieces of candy and I get two, is
that fair? To answer these questions, one needs an understanding of number, often referred to as num-
ber sense, which is children’s ability to intuitively understand and relate numbers (Dehaene, 2001).
Number sense is considered to be a precursor to formal understanding of mathematics (De Hevia &
Spelke, 2009; Dehaene, 2001) and, therefore, of vital importance for later school success.
Recent insights into the development of number sense suggest that children develop an under-
standing of number, quantity, and relations between numbers at a young age. Although different stud-
ies may differ in their definition of number sense and involved skills or abilities, the cognitive tool
most often associated with number sense is the mental number line (Dehaene, 1992; Dehaene,
Bossini, & Giraux, 1993; Feigenson, Dehaene, & Spelke, 2004; Verguts & Fias, 2004). On this assumed
mental number line, numbers are ordered in accordance with their magnitude, and comparisons
between numbers can be made by mentally estimating the location of numbers on the number line
(Laski & Siegler, 2007). Number line representations are typically investigated using the number-to-
position task (Siegler & Opfer, 2003). In this task, children are shown a blank number line with the
beginning and end points marked with numbers (e.g., 0 and 100) and are asked to indicate the position
of a certain number on this line by drawing a hatch mark on the location or pointing to the intended
location. Number line acuity is thought to be associated with number sense at an early age (e.g.,
Dehaene, 2001), but in this study it was assumed to be more dependent on strategy use and taught
facts after the onset of formal education. In the current study, longitudinal development of number
line placements and its relation to mathematics performance was investigated.
Changes in numerical abilities across developmental time can also be indexed with the number-to-
position task. As children get older, their estimations of numbers on the number line become increas-
ingly accurate (e.g., Ebersbach, Luwel, Frick, Onghena, & Verschaffel, 2008; Friso-van den Bos,
Kolkman, Kroesbergen, & Leseman, 2014; Laski & Siegler, 2007). Accuracy of number line placements
increases because children learn to consistently place larger numbers on the right side of the number
line (Friso-van den Bos et al., 2014) and because children’s ability to determine the spatial distance
between placements improves, meaning that they learn to understand that the distance between
10 and 20 on the number line is equal to the distance between 80 and 90 (Laski & Siegler, 2007).
These two forms of improvement result in more linear associations between the placements on the
number line and the actual numerical values. Linear and accurate placements of numbers on a number
line have been shown to be associated with higher mathematics achievement (Geary, 2011; Halberda,
Mazzocco, & Feigenson, 2008; Sasanguie, De Smedt, Defever, & Reynvoet, 2012; Sasanguie, Göbel,
Moll, Smets, & Reynvoet, 2013; Siegler & Booth, 2004). Therefore, the literature highlights the impor-
tance of linear and accurate placements for the development of mathematical achievement.
Models of number line placement
Whereas it has widely been acknowledged that young children’s number line placements do not
yet follow a perfectly linear pattern (e.g., Geary, 2011; Halberda et al., 2008; Sasanguie et al., 2013;
I. Friso-van den Bos et al. / Journal of Experimental Child Psychology 134 (2015) 12–29 13

Siegler & Booth, 2004), different explanations have been given for this reduced linearity. In one of the
first accounts of number line placements, Gallistel and Gelman (1992) reported that young children’s
number line estimations did follow a linear shape, but linear fit of their placements was reduced
because of children’s difficulty with accurately placing larger numbers on the number line. More
recent accounts, however, state that prior to becoming linear, children distribute numbers logarithmi-
cally across the number line and shift toward linear distributions when they get older (Ashcraft &
Moore, 2012; Dehaene, 2003; Opfer & DeVries, 2008; Opfer, Siegler, & Young, 2011; Rips, 2013;
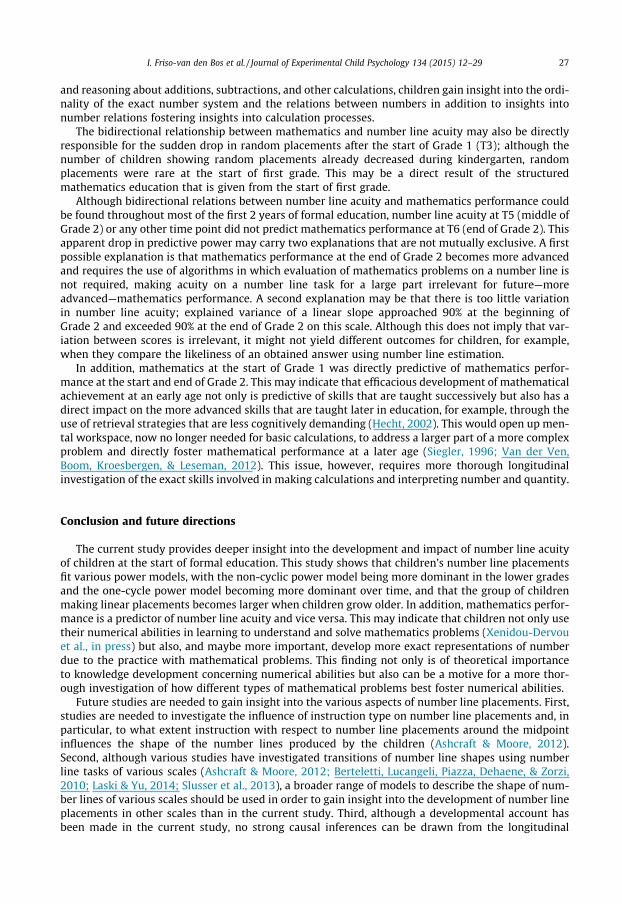
Siegler & Booth, 2004; Siegler & Opfer, 2003). Children who make logarithmic placements of numbers
on a number line intuitively place the numbers on the lower end of the line far apart and compress the
numbers at the end of the scale, as in Fig. 1.
Others have argued that the association between actual and estimated numbers on a number line
can be better explained by a cyclic model, the shape of which results from the use of proportional rea-
soning to place numbers on a number line (Barth & Paladino, 2011; Hollands & Dyre, 2000; Slusser,
Santiago, & Barth, 2013). In this cyclic model, number line placements are made based on a judgment
of the magnitude of the target number in comparison with both the minimum and maximum values
on the number line. In other words, it is suggested that children actively compare between a target
number of 90 and a maximum of 100 in a 0–100 number line, and, therefore, need to make an estimate
of the magnitude of both the whole number range and the part that needs to be inserted on that range
(Barth & Paladino, 2011; Hollands & Dyre, 2000). Biased estimates of both the whole number range
and the proportion of the estimated number result in overestimation of small numerals and underes-
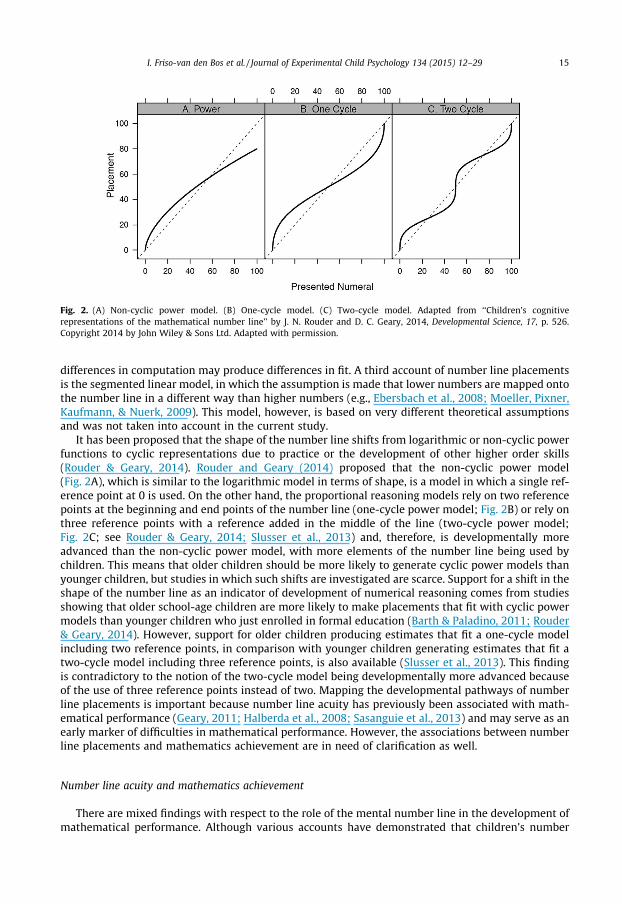
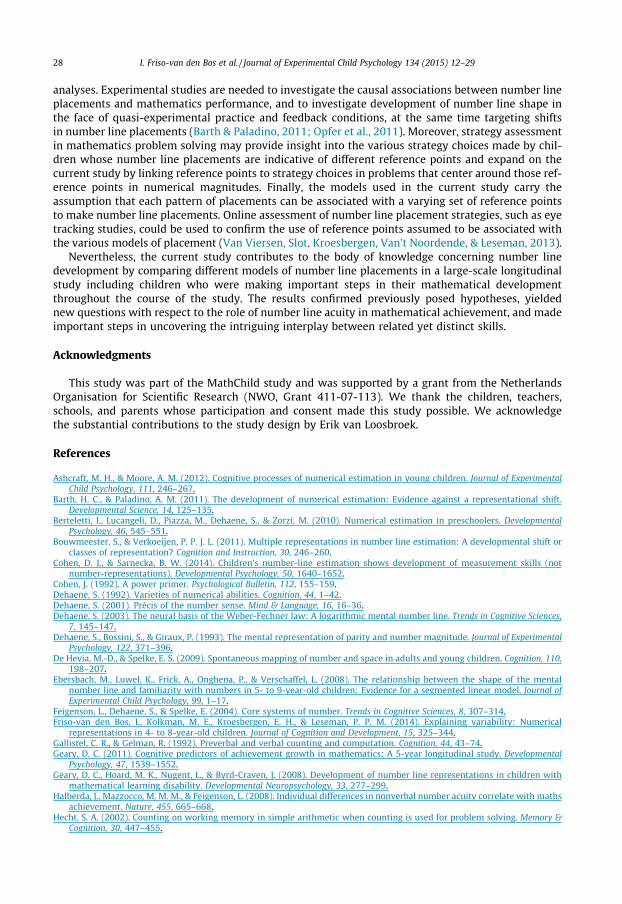
timation of large numerals (Fig. 2B). When the midpoint of a scale is added to the reference points
used to make a placement, this cycle of over- and underestimation repeats itself past the midpoint,
resulting in a two-cycle model (Fig. 2C). Whereas the extent to which children’s placements for a
logarithmic curve can be indexed by a logarithmic model, models of proportional reasoning can be
indexed by a power (exponential) function. Although the shape of these models can also be modeled
using logarithms (Rouder & Geary, 2014), as was done in the current study, they are referred to as
power models from this point onward for the sake of consistency with other studies.
There is an ongoing discussion between proponents of the logarithmic model and proponents of
the cyclic power model. Various comparisons between these models, in which children’s data have
been fitted to the models in order to compare the adequacy of each approach, have not yielded con-
sistent results in favor of either model to explain young children’s number line performance (Ashcraft
& Moore, 2012; Bouwmeester & Verkoeijen, 2011; Opfer et al., 2011; Slusser et al., 2013). Rouder and
Geary (2014) added a non-cyclic power model to the battery of cyclic power functions, which is com-
putationally comparable to the power functions as presented in other studies (e.g., Opfer et al., 2011)
but similar in shape to the logarithmic model (Fig. 2A; see Rouder & Geary, 2014; Stevens, 1957).
Importantly, in most accounts of the power model, only the cyclic model is considered and the
non-cyclic power model is not taken into account (Barth & Paladino, 2011; Opfer et al., 2011). In
the current study, this model is taken into account next to the logarithmic model because the
Fig. 1. Example of logarithmic and linear models, with numbers presented to the children on the x-axis and placements made
by the children on the y-axis.
14 I. Friso-van den Bos et al. / Journal of Experimental Child Psychology 134 (2015) 12–29
differences in computation may produce differences in fit. A third account of number line placements
is the segmented linear model, in which the assumption is made that lower numbers are mapped onto
the number line in a different way than higher numbers (e.g., Ebersbach et al., 2008; Moeller, Pixner,
Kaufmann, & Nuerk, 2009). This model, however, is based on very different theoretical assumptions
and was not taken into account in the current study.
It has been proposed that the shape of the number line shifts from logarithmic or non-cyclic power
functions to cyclic representations due to practice or the development of other higher order skills
(Rouder & Geary, 2014). Rouder and Geary (2014) proposed that the non-cyclic power model
(Fig. 2A), which is similar to the logarithmic model in terms of shape, is a model in which a single ref-
erence point at 0 is used. On the other hand, the proportional reasoning models rely on two reference
points at the beginning and end points of the number line (one-cycle power model; Fig. 2B) or rely on
three reference points with a reference added in the middle of the line (two-cycle power model;
Fig. 2C; see Rouder & Geary, 2014; Slusser et al., 2013) and, therefore, is developmentally more
advanced than the non-cyclic power model, with more elements of the number line being used by
children. This means that older children should be more likely to generate cyclic power models than
younger children, but studies in which such shifts are investigated are scarce. Support for a shift in the
shape of the number line as an indicator of development of numerical reasoning comes from studies
showing that older school-age children are more likely to make placements that fit with cyclic power
models than younger children who just enrolled in formal education (Barth & Paladino, 2011; Rouder
& Geary, 2014). However, support for older children producing estimates that fit a one-cycle model
including two reference points, in comparison with younger children generating estimates that fit a
two-cycle model including three reference points, is also available (Slusser et al., 2013). This finding
is contradictory to the notion of the two-cycle model being developmentally more advanced because
of the use of three reference points instead of two. Mapping the developmental pathways of number
line placements is important because number line acuity has previously been associated with math-
ematical performance (Geary, 2011; Halberda et al., 2008; Sasanguie et al., 2013) and may serve as an
early marker of difficulties in mathematical performance. However, the associations between number
line placements and mathematics achievement are in need of clarification as well.
Number line acuity and mathematics achievement
There are mixed findings with respect to the role of the mental number line in the development of
mathematical performance. Although various accounts have demonstrated that children’s number
Fig. 2. (A) Non-cyclic power model. (B) One-cycle model. (C) Two-cycle model. Adapted from ‘‘Children’s cognitive
representations of the mathematical number line’’ by J. N. Rouder and D. C. Geary, 2014, Developmental Science, 17, p. 526.
Copyright 2014 by John Wiley & Sons Ltd. Adapted with permission.
I. Friso-van den Bos et al. / Journal of Experimental Child Psychology 134 (2015) 12–29 15
line acuity is predictive of later mathematical achievement (Halberda et al., 2008; Sasanguie et al.,
2012, 2013; Siegler & Booth, 2004) and that children with mathematical learning disability show
delays in number line acuity (Van Viersen, Slot, Kroesbergen, Van’t Noordende, & Leseman, 2013),
others have not been able to demonstrate this relationship (Praet, Titeca, Ceulemans, & Desoete,
2013). Number line acuity may be involved in mathematics performance through calculation using
a (mental or printed) number line (e.g., Xenidou-Dervou, van der Schoot, & van Lieshout, in press)
or through the use of a mental number line in checking the likeliness of the answer to a problem
(e.g., a child may judge that the answer to 15 + 17 is unlikely to be 86 using evaluation on a number
line). Associations between number line acuity and mathematical achievement have also been found
to be bidirectional (LeFevre et al., 2013), suggesting not only that acuity on number line tasks should
perhaps be seen as a precursor to mathematics performance but also that repeated arithmetic practice
might enhance children’s insight in number relations and, hence, improve their number line acuity.
For example, when a child learns to make an analogy between 3 + 2 and 93 + 2 through repeated cal-
culation of the answer, insight into the numerical distance between 3 and 5 and that between 93 and
95 may be fostered through the analogy between the problems 3 + 2 = 5 and 93 + 2 = 95. However,
LeFevre and colleagues (2013) used a relatively small and varied sample, and there was a year interval
between measurements. Thus, their results are in need of replication using a more homogeneous and
larger sample of children with measurements in smaller time intervals. The current study aimed to
address these limitations. Moreover, although mathematical performance has been associated with
number line acuity, little is known about differences in mathematical performance between children
whose number lines adhere to different models of placement, as described above. Studies in which
comparisons are made between children falling into different categories of number line placements
often use a very limited number of models (Barth & Paladino, 2011; Opfer et al., 2011), making it dif-
ficult to observe developmental trends.
To conclude, although research concerning children’s number line estimations has expanded dur-
ing the past few years, two controversies remain. In the current study, both the debate regarding the
shape of the number line in young school-age children and the discussion regarding the role of num-
ber line acuity as a predictor of mathematical achievement were addressed.
The current study
Three research questions were addressed in this study. First, which model(s) best explains chil-
dren’s number line placements from kindergarten to Grade 2? This research question adds to relevant
previous literature (e.g., Ashcraft & Moore, 2012; Barth & Paladino, 2011; Opfer et al., 2011; Rouder &
Geary, 2014) by adopting models already used, comparing models that have not yet been directly
compared, and using a longitudinal design. More specifically, we included three of the models present-
ed by Rouder and Geary (2014): (a) a non-cyclic power model, (b) a one-cycle model in which two
anchor points are used at the beginning and end points of the number line, and (c) a two-cycle model
in which three anchor points are used at the beginning, middle, and end points (see Fig. 2).
Furthermore, we included logarithmic and linear models (e.g., Siegler & Booth, 2004; Siegler &
Opfer, 2003) and introduced a randommodel to identify children whose placements did not sufficient-
ly relate to the presented numbers to be reliably associated with one of the above models (see
Friso-van den Bos et al., 2014). Importantly, in the current study, no instruction was given to the par-
ticipants with respect to the mid-point of the number line because this may serve as a determinant of
strategy selection (Ashcraft & Moore, 2012).
These models were applied to data from a longitudinal study in which the performance of a large
sample of children was measured six times (twice a year) during the period from kindergarten to
Grade 2. At each longitudinal measurement point, children were categorized on the basis of a strategy
associated with one of the resulting six models using the fit index R2 (Opfer et al., 2011). Children were
placed into the category that produced the highest R2 fit regardless of the difference with fit of the
next best-fitting category. Although the analyses were generally exploratory, we expected to find
models indicative of one reference point to be more prevalent in younger children and models with
multiple reference points to be more prevalent in older children, similar to the findings of Rouder
and Geary (2014).
16 I. Friso-van den Bos et al. / Journal of Experimental Child Psychology 134 (2015) 12–29

Second, do placement category groups at each time point differ with respect to mathematical
achievement? This question targeted the hypothesized developmental account of number line place-
ments. If children whose placements adhere to the more advanced cyclic models indeed score higher
than children whose placements suggest a less advanced single reference point (non-cyclic power
models or logarithmic models), and if children with linear placements score higher than both former
groups on a mathematics test, this would confirm earlier suggestions that placements with more
hypothesized reference points are indicative of more advanced number processing (Rouder & Geary,
2014; Slusser et al., 2013).
Third, is number line acuity a predictor of mathematics achievement, is mathematics achievement
a predictor of number line acuity, or is the relationship bidirectional? With this question, we aimed to
address the discussion in the literature regarding the role of number line acuity as a predictor of
mathematics achievement (e.g., LeFevre et al., 2013; Praet et al., 2013; Sasanguie et al., 2013). Only
the children’s fits according to the linear model were used to address this research question because
this model is developmentally most advanced (Friso-van den Bos et al., 2014; Siegler & Booth, 2004;
Slusser et al., 2013) and provides the best view on how accurately a child can place numbers.
Method
Participants
Data were from the longitudinal MathChild study1 in which children were followed from kinder-
garten to second grade of primary school across a time span of 3 academic years. At the start of the study,
442 children were included with a mean age of 5 years 7 months (SD = 4.3 months), and 198 (44.8%)
were girls. The children were recruited from a total of 25 schools in various municipalities in The
Netherlands. Children completed a diverse battery of tasks twice per academic year, once in
November/December and once in May/June, resulting in six time points with 6-month intervals (referred
to as T1–T6 from this point onward). During the sixth and final round of data collection in Grade 2, 354
participants completed the tasks presented in the current study with a mean age of 8 years
(SD = 3.9 months). Reasons for dropout varied, but the most common reasons were repeating a grade,
which is very common in Dutch education, and moving to a different school or municipality. On average,
children who dropped out showed less linearity in their placements (R2 = .19) than children who did not
drop out (R2 = .33) during the first round of data collection, t(440) = 4.19, p < .001, and scored lower on
Raven’s Coloured Matrices (M = 17.76) than children who did not drop out (M = 21.60), t(434) = 5.47,
p < .001, which may be explained by the fact that the dropout group includes the children repeating a
grade.
Measures
Number-to-position task
The number-to position task was a computerized version of the task initially designed by Siegler
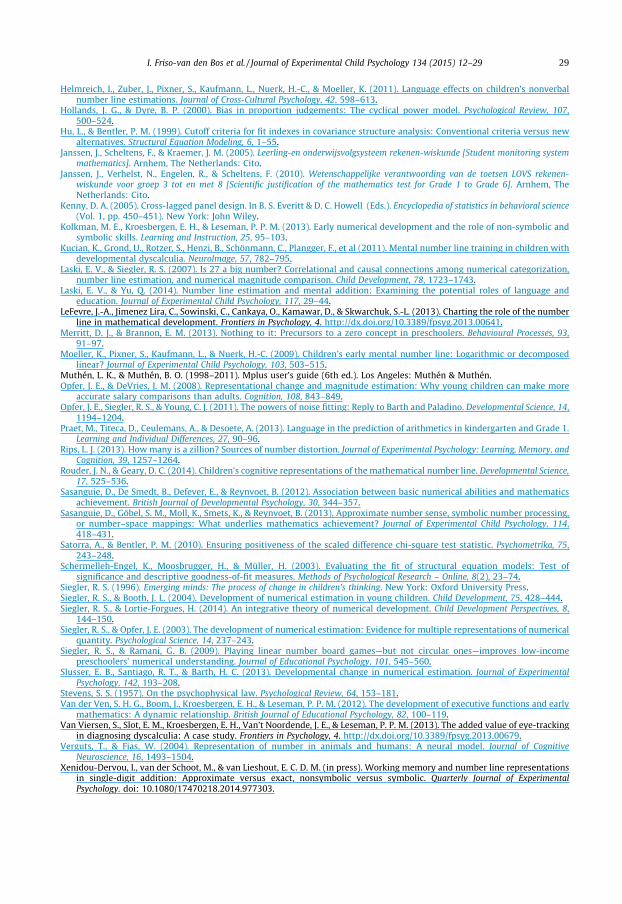
and Opfer (2003; see also Kolkman, Kroesbergen, & Leseman, 2013). In the task, children were present-
ed with a horizontal line on the computer screen and were told that they would see numbers (Arabic
numbers) that needed to be placed in a line by the children and that each number needed to get its
own spot on the line. The numbers 1 and 100 were presented below the left and right ends of the line,
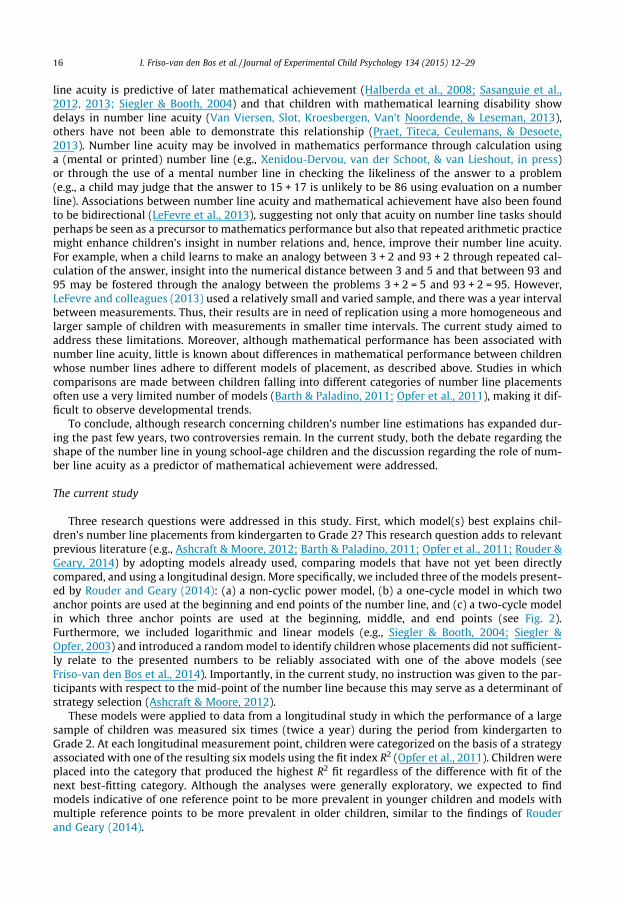
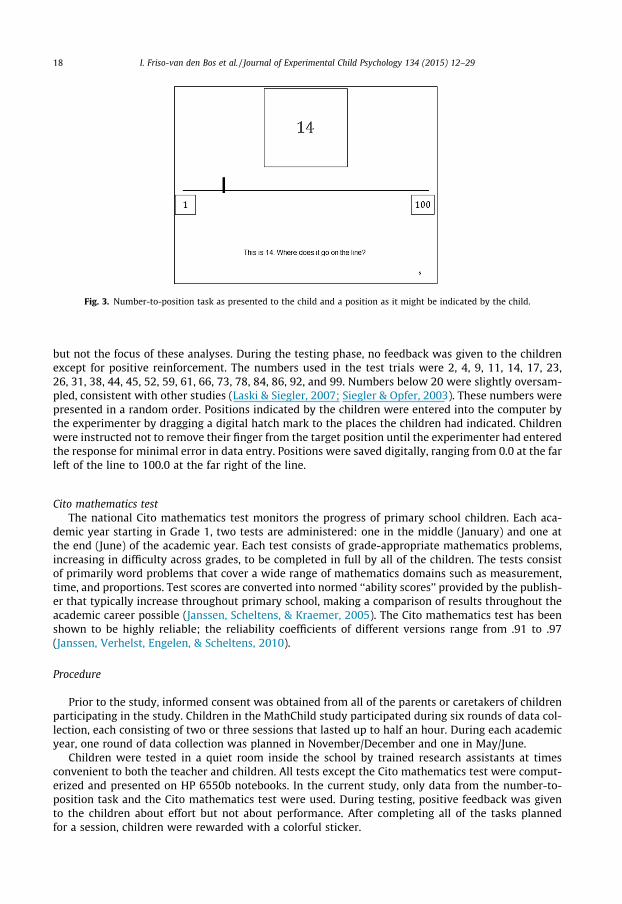
respectively, and the target number was presented above the line (see Fig. 3). In a first practice trial
the children were asked where the number 1 would go on the line, and in a second practice trial they
were asked where the number 100 would be located. Children pointed to this position with a finger on
the computer screen. The correct placements were pointed out at both practice trials, after which the
test trials started. Note that the number 0 was deliberately omitted from the number line, both to cir-
cumvent problems with the integration of 0 in a numerical continuum (e.g., Merritt & Brannon, 2013)
and to make the task analogous to a non-symbolic counterpart, which was also part of the test battery
1 Research project supported by Netherlands Organisation for Scientific Research (NWO) Grant 411-07-110.
I. Friso-van den Bos et al. / Journal of Experimental Child Psychology 134 (2015) 12–29 17
but not the focus of these analyses. During the testing phase, no feedback was given to the children
except for positive reinforcement. The numbers used in the test trials were 2, 4, 9, 11, 14, 17, 23,
26, 31, 38, 44, 45, 52, 59, 61, 66, 73, 78, 84, 86, 92, and 99. Numbers below 20 were slightly oversam-
pled, consistent with other studies (Laski & Siegler, 2007; Siegler & Opfer, 2003). These numbers were
presented in a random order. Positions indicated by the children were entered into the computer by
the experimenter by dragging a digital hatch mark to the places the children had indicated. Children
were instructed not to remove their finger from the target position until the experimenter had entered
the response for minimal error in data entry. Positions were saved digitally, ranging from 0.0 at the far
left of the line to 100.0 at the far right of the line.
Cito mathematics test
The national Cito mathematics test monitors the progress of primary school children. Each aca-
demic year starting in Grade 1, two tests are administered: one in the middle (January) and one at
the end (June) of the academic year. Each test consists of grade-appropriate mathematics problems,
increasing in difficulty across grades, to be completed in full by all of the children. The tests consist
of primarily word problems that cover a wide range of mathematics domains such as measurement,
time, and proportions. Test scores are converted into normed ‘‘ability scores’’ provided by the publish-
er that typically increase throughout primary school, making a comparison of results throughout the
academic career possible (Janssen, Scheltens, & Kraemer, 2005). The Cito mathematics test has been
shown to be highly reliable; the reliability coefficients of different versions range from .91 to .97
(Janssen, Verhelst, Engelen, & Scheltens, 2010).
Procedure
Prior to the study, informed consent was obtained from all of the parents or caretakers of children
participating in the study. Children in the MathChild study participated during six rounds of data col-
lection, each consisting of two or three sessions that lasted up to half an hour. During each academic
year, one round of data collection was planned in November/December and one in May/June.
Children were tested in a quiet room inside the school by trained research assistants at times
convenient to both the teacher and children. All tests except the Cito mathematics test were comput-
erized and presented on HP 6550b notebooks. In the current study, only data from the number-to-
position task and the Cito mathematics test were used. During testing, positive feedback was given
to the children about effort but not about performance. After completing all of the tasks planned
for a session, children were rewarded with a colorful sticker.
Fig. 3. Number-to-position task as presented to the child and a position as it might be indicated by the child.
18 I. Friso-van den Bos et al. / Journal of Experimental Child Psychology 134 (2015) 12–29
Analytical strategy
For each child at each time point, number line placements of each item were recorded. Using var-
ious formulas, for each individual child and at each longitudinal measurement point a fit of the data
with the various models of number line placements was computed using the fit index R2 (for the
logarithmic model, see Siegler & Opfer, 2003; for the non-cyclic power, one-cycle, and two-cycle mod-
els, see Rouder & Geary, 2014; linear fit was indexed by the squared correlation of untransformed val-
ues). If the correlation between presented items and placements by a child did not exceed r = .30,
placements were coded as random because effect sizes below .30 are considered to be small
(Cohen, 1992). In all other cases, the model producing the highest fit with the data was selected as
the model best fitting the child at that time point to address the first research question (which mod-
el(s) can best explain children’s number line placements from kindergarten to second grade of primary
school?). Transitions between these models were recorded for each child longitudinally.
To address the second research question (do placement category groups at each time point differ
with respect to mathematical achievement?), analyses of variance (ANOVAs) were applied to test
for potential differences in mathematical performance between children placed in different categories
of number line placement (based on their best fit scores) at different ages. In case of a significant main
group effect, Tukey’s post hoc tests were performed to test contrasts between specific groups of
children.
To address the third research question (is number line acuity a predictor of mathematics achieve-
ment, is mathematics achievement a predictor of number line acuity, or is the relationship bidirection-
al?), a series of cross-lagged panel models (Kenny, 2005) was built using Mplus software (Muthén &
Muthén, 1998–2011). Although cross-lagged panel analysis cannot prove causality between variables,
a strong claim for causal relations can be made because of the prediction of scores across time, con-
trolling for autoregressive effects, and because causality in both directions can be investigated. Only
data from first and second grades were used for this because mathematics scores were available only
from the start of first grade given that these tests cannot be completed by kindergartners. First, cor-
relations between the estimated position indicated by the child and the actual position of the number
values were computed for each child at each longitudinal time point. Correlations can be interpreted
in a similar manner as the linear model of number line placements reported in, for example, Siegler
and Opfer (2003). A starting model included these linear correlations as an indicator of number line
acuity and scores on the mathematics test at each longitudinal measurement point. To answer the
research question about mutual interdependencies between mathematical achievement and number
line acuity, five different models were tested:
A: An empty model containing only autoregressive effects and covariances between number line
acuity and mathematics achievement at the first and last time points.
B: A model in which paths from number line performance at each time point to mathematics
achievement at the next time point were added.
C: A model in which paths from mathematics achievement at each time point to number line
achievement at the next time point were added but no paths from number line to mathematics
were included.
D: A model in which both paths from number line to mathematics and from mathematics to num-
ber line performance were included.
E: A model in which the best-fitting model of the former was adjusted to achieve the best possible
fit.
Model fit for each model was evaluated using various cutoff criteria commonly accepted for statis-
tics of model fit (Hu & Bentler, 1999; Schermelleh-Engel, Moosbrugger, & Müller, 2003). Reported fit
statistics are the root mean square error of approximation (RMSEA,where smaller values are indicative
of better fit), the comparative fit index (CFI, where higher values are indicative of better fit), the
Tucker–Lewis index (TLI, where higher values are indicative of better fit), and the standardized root
mean residual (SRMR, where smaller values are indicative of better fit). Moreover, the ratio v2 to
degrees of freedom was evaluated (where smaller values are indicative of better fit) as an alternative
I. Friso-van den Bos et al. / Journal of Experimental Child Psychology 134 (2015) 12–29 19
for the v2 test, which has drawbacks when large samples are being examined (Schermelleh-Engel
et al., 2003).
Comparisons between fit indexes addressed the research question; of Models A to D, the model
with the best fit best described the relationship between number line acuity and mathematical
achievement, allowing us to conclude whether associations are unidirectional, and in which direction,
or bidirectional. Comparisons between the Satorra–Bentler scaled Dv2 test (Satorra & Bentler, 2010)
provided information about the significance of differences in fit between nested models. The final
model(s) (i.e., chosen best-fitting model) was used to explore an optimal model. In this model, added
paths were maintained only if they made a significant contribution to model fit as indexed by the
Satorra–Bentler scaled v2 (Satorra & Bentler, 2010), which is superior to v2 difference testing to com-
pare models.
Results
Number line models
First, each child was placed into a category of number line placements based on his or her best fit
across various models. The model with the highest R2 value was considered to be the best-fitting mod-
el. The number of children showing the best fit for each of the models of number line placements can
be found in Table 1. The most dominant category of number line placements was the non-cyclic power
model for kindergarten and Grade 1 (T1–T4) and the one-cycle power model for Grade 2 (T5 and T6).
Across time, an increasing number of children were placed into the category of linear placements. A
graphical representation of transitions between categories of number line placements can be found
in Fig. 4. This graph shows both stability within categories and transitions in all directions, but the
most obvious pattern was the stability in categories in which one reference point is used (logarithmic
or non-cyclic power model) in kindergarten and first grade (e.g., 232 children showed stability
between T1 and T2, fitting best into one reference point model at both time points). Other very fre-
quent patterns were transitions to a cyclic model (one- or two-cycle model) or change to a linear mod-
el in second grade (e.g., 57 children went from a two-reference-point model to a linear model from T5
to T6).
In a next step, the non-cyclic power category was removed and children fitting best into the non-
cyclic power model were placed in the next best-fitting category of number line placements (the mod-
el with the highest fit of all models but explicitly not the non-cyclic power model). This was done to
gain insight into placements into models when the non-cyclic power model, as the most prevalent
model, is disregarded, similarly to comparable studies (Barth & Paladino, 2011; Opfer et al., 2011).
The number of children placed in each category after removal of the non-cyclic power model can
be found in Table 2, and by subtracting the original number of children in each category as presented
Table 1
Numbers of children fitting into categories of number line placements for all time points.
T1 T2 T3 T4 T5 T6
n in
category
(N = 442)
R2 n in
category
(N = 430)
R2 n in
category
(N = 398)
R2 n in
category
(N = 394)
R2 n in
category
(N = 363)
R2 n in
category
(N = 354)
R2
Random 95 (21) – 58 (13) – 9 (2) – 2 (1) – 0 (0) – 0 (0) –
Logarithmic 50 (11) .44 48 (11) .53 55 (14) .64 23 (6) .73 5 (1) .75 1 (0) .77
Non-cyclic 252 (57) .53 257 (60) .62 243(61) .74 189 (48) .85 130 (36) .91 82 (23) .93
One-cycle 34 (8) .38 55 (13) .48 74 (19) .65 129 (33) .82 138 (38) .91 140 (40) .94
Two-cycle 8 (2) .18 5 (1) .22 3 (1) .33 2 (1) .52 2 (1) .70 1 (0) .78
Linear 3 (1) .31 7 (2) .42 14 (4) .57 49 (12) .77 88 (24) .87 130 (37) .93
Mean age
(years;months)
5;7 6;0 6;6 7;0 7;6 8;0
Note. Percentages are in parentheses. R2 values are the average model fits within the time points for all participants.
20 I. Friso-van den Bos et al. / Journal of Experimental Child Psychology 134 (2015) 12–29

in Table 1 from the number of children placed in the same category in Table 2, one can compute the
number of children moving to that category when the non-cyclic power model is disregarded. In
kindergarten, most children whose number line placements fit a non-cyclic power model show a
logarithmic model as next best-fitting category, whereas a one-cycle power model would fit their data
better after the start of formal education (T3 and later time points). The number of children whose
next best-fitting category was a linear model increased across time, v2(5, N = 96) = 55.00, p < .001.
Mathematical achievement differences between children in number line categories
As a next step, at each longitudinal measurement point, we tested for potential differences in
mathematics proficiency between the categories of number line placement in which children were
divided based on their best fit. This was done with a series of one-way ANOVAs with number line acu-
ity category (e.g., random, one-cycle, two-cycle) as a between-participants factor. Because scores of
mathematics proficiency were available only starting from T3 (from first grade onward), four different
analyses were performed (T3, T4, T5, and T6). Meanmathematics score per group, as well as number of
children in each category, can be found in Table 3. Analyses of homogeneity of variances, an assump-
tion of the ANOVA, yielded no problematic results. In case of significant main group effects, Tukey’s
post hoc tests were used to test for differences between the number line acuity categories.
At T3, there was a significant difference between groups of number line acuity with respect to
mathematical achievement, F(5, 364) = 6.87, p < .001. Post hoc analyses indicated that children in
Fig. 4. Transitions between models fitting each child’s data, with logarithmic and non-cyclic power models grouped under ‘‘1
reference’’ model and one-cycle and two-cycle models grouped under ‘‘2 reference’’ model. Arrow sizes represent the numbers
of children making transitions.
Table 2
Numbers of children fitting into categories of number line placements for all time points, excluding the non-cyclic power model.
T1 (N = 442) T2 (N = 430) T3 (N = 398) T4 (N = 394) T5 (N = 363) T6 (N = 354)
Random 95 (21) 58 (13) 9 (2) 2 (1) 0 (0) 0 (0)
Logarithmic 226 (51) 215 (50) 177 (44) 73 (19) 14 (4) 2 (1)
Non-cyclic power 0 (0) 0 (0) 0 (0) 0 (0) 0 (0) 0 (0)
One-cycle model 103 (23) 136 (32) 186 (47) 248 (63) 233 (64) 189 (53)
Two-cycle model 11 (2) 8 (2) 7 (2) 5 (1) 5 (1) 2 (1)
Linear 7 (2) 13 (3) 19 (5) 66 (17) 111 (31) 161 (45)
Note. Percentages are in parentheses.
I. Friso-van den Bos et al. / Journal of Experimental Child Psychology 134 (2015) 12–29 21

the linear group scored significantly higher than children in the random, logarithmic, and non-cyclic
power groups (ps < .001) and that children in the one-cycle group scored significantly higher than
children in the logarithmic and non-cyclic power groups (ps < .01). No other contrasts produced
significant differences.
At T4, there was also a significant difference between groups of number line placement with
respect to mathematical achievement, F(4, 360) = 13.59, p < .001. Post hoc analyses indicated that chil-
dren in the linear and one-cycle power groups scored higher with respect to mathematical achieve-
ment than children in the logarithmic and non-cyclic power groups (ps < .05). Contrasts with the
two-cycle power group could not be interpreted because of the low number of children in this group.
No post hoc contrasts were computed for the random group because there was only 1 child for whom
both number line and mathematics data were available.
At T5, there was also a significant difference between groups of number line placement with
respect to mathematical achievement, F(4, 347) = 7.46, p < .001. No children were placed in the ran-
dom group at this time point. Post hoc analyses indicated that both the linear and one-cycle groups
scored higher on mathematics than children in the non-cyclic power group (ps < .001). No other con-
trasts were indicative of significant differences (ps > .05).
Finally, at T6, there was a significant difference between groups of number line placement with
respect to scores of mathematics, F(2, 344) = 4.16, p = .01. Post hoc analyses indicated that children
in the linear group scored significantly higher than children in the non-cyclic power group (p = .03)
and marginally higher than children in the one-cycle power group (p = .05). The difference between
the non-cyclic power and one-cycle group was not significant (p = .86), and contrasts with the
logarithmic and two-cycle groups were not computed because only 1 child in these groups had a
mathematics score available.
Longitudinal associations between number line acuity and mathematics
To address the third research question (regarding the longitudinal associations between
mathematics achievement and number line performance), a series of path analyses was conducted.
An empty model, shown in Fig. 5A, contained no cross-lagged paths but only paths between mea-
sures at each time point and the same measure at previous time points or autoregressive asso-
ciations. Covariances between number line performance and mathematics achievement at T3 and
between number line performance and mathematics achievement at T6 were also added.
Moreover, direct paths were added between number line acuity at T3 and number line acuity at
T5 and between mathematics achievement at T3 and mathematics achievement at T5 and T6
because these paths improved the v2 fit of the models greatly without affecting the associations
between number line acuity and mathematics achievement. The latter associations were used for
hypothesis testing.
Next, three hypothesis-testing models were explored, all of which were extensions of the empty
model, meaning that all paths in the empty model were nested in all consecutive models: a model
containing only paths from number line acuity to mathematics achievement at the next time point
(Fig. 5B), a model containing only paths from mathematics achievement to number line acuity at
the next time point (Fig. 5C), and a full cross-lagged panel model with bidirectional associations
Table 3
Mean scores on mathematics and numbers of children fitting best into categories of number line acuity.
T3 T4 T5 T6
M n M n M n M n
Random 27.00 8 15.00 1 – 0 – 0
Logarithmic 30.85 53 38.95 20 50.00 5 35.00 1
Non-cyclic power 35.25 224 42.44 176 49.17 123 63.85 81
One-cycle 42.17 69 50.18 122 57.04 136 64.95 138
Two-cycle 34.00 3 80.00 2 40.50 2 67.00 1
Linear 50.23 13 57.58 45 59.58 86 69.18 128
22 I. Friso-van den Bos et al. / Journal of Experimental Child Psychology 134 (2015) 12–29

(Fig. 5D). Fit indexes of these models can be found in Table 4. Of these models, only the fit indexes of
the full cross-lagged model were acceptable.
The full cross-lagged model (Fig. 5D) demonstrated a better fit than both the number line to math
model (Fig. 5B), Dv2 = 72.45, Ddf = 3, p < .001, and the math to number line model (Fig. 5C),
Dv2 = 40.97, Ddf = 3, p < .001. This confirms that the full cross-lagged model described the data better
than the other models.
In a final step, the full cross-lagged model was adjusted to determine whether a more optimal fit
could be found. First, the non-significant path from number line performance at T5 to mathematics
achievement at T6 was removed, leading to a non-significant decrease in fit and, thus, a better and
more parsimonious model, Dv2 = 1.21, Ddf = 1, p = .21. Then, additions to the model were explored
in which mathematical achievement and number line were predicted from two time points earlier,
being the same month of the year a year earlier, and the only additional path that made a significant
contribution to the model was the path from number line acuity at T3 to mathematics achievement at
Fig. 5. (A) Empty model with no cross-lagged paths. (B) Number line to mathematics model. (C) Mathematics to number line
model. (D) Full cross-lagged model. (E) Improved cross-lagged model. Maths, mathematics. All estimates are standardized
coefficients. ⁄p < .05; ⁄⁄p < .01; ⁄⁄⁄p < .001.
Table 4
Fit indexes of path Models A to E.
Model v2 df v
2/df RMSEA CFI TLI SRMR
A: Empty model 166.38 17 9.79 .15 .86 .77 .19
B: Number line to maths model 120.88 14 8.63 .14 .90 .80 .15
C: Maths to number line model 94.35 14 6.74 .12 .92 .85 .13
D: Full cross-lagged model 48.25 11 4.39 .09 .96 .91 .08
E: Improved cross-lagged model 35.43 11 3.22 .07 .98 .94 .07
Fit criteria
Acceptable fit 65.0 <.08 P.90 P.90 6.10
Good fit 0 6 v2/df 6 2 <.05 P.95 P.95 .00 6 SRMR 6 .05
Note. v2, chi-square statistic; df, degrees of freedom; v2/df, chi-square and degrees of freedom ratio; RMSEA, root mean square
error of approximation; CFI, comparative fit index; TLI, Tucker–Lewis index; SRMR, standardized root mean square residual;
maths, mathematics.
I. Friso-van den Bos et al. / Journal of Experimental Child Psychology 134 (2015) 12–29 23
T5, Dv2 = 11.87, Ddf = 1, p < .001. The final best-fitting model is presented in Fig. 5E, and fit statistics
of this model can be found in Table 4 in the ‘‘improved cross-lagged model’’ row. In this model,
approximately 16% of variance in number lines at T6 is explained by predictor variables and 65% of
mathematics scores at T6. Note that the high explained variance in mathematics scores is mostly
based on stability within the construct, as indicated by the standardized weights reported in
Fig. 5E. All fit statistics were indicative of acceptable to good fit.
Discussion
In the current study, various models of number line placements were compared across a series of
longitudinal measurements from kindergarten to Grade 2—a period during which number line acuity
grows considerably. We found that the non-cyclic power model demonstrated the best fit for a large
number of children’s data up to Grade 1 and that the one-cycle power model did so in Grade 2. The
logarithmic model was less frequently found to be the best-fitting model. The non-cyclic power model
is similar in shape to the logarithmic model but is ignored in many studies in favor of the one- and
two-cycle models whose cyclic shape is thought to result from the use of multiple reference points
when making number line estimations (Barth & Paladino, 2011; Opfer et al., 2011). Although we
can conclude that a power model (either cyclic or non-cyclic) indeed produces a better fit for most
children’s number line placements, the interpretation of these data is closer to that of the studies in
which a logarithmic model is proposed (Ashcraft & Moore, 2012; Dehaene, 2003; Opfer & DeVries,
2008; Opfer et al., 2011; Rips, 2013; Siegler & Booth, 2004; Siegler & Opfer, 2003); one dominant ref-
erence point is used to obtain data fitting both the power model and the logarithmic model.
It should be noted that the logarithmic model and the non-cyclic power model are very similar in
shape and mathematical properties. Both models imply no difference in strategy taken by the child,
and they do not differ with respect to assumptions regarding reference points used. Their difference
is purely computational, although very relevant, as evidenced by the differences in best-fitting model
outlined in the Results section. The logarithmic model, therefore, remains suitable to compare
between logarithmic fit and linear fit, as is done in various studies (e.g., Ashcraft & Moore, 2012;
Opfer & DeVries, 2008; Siegler & Booth, 2004), and results of these studies can be interpreted in a
meaningful way despite the fact that the non-cyclic power model provided a better fit in the current
study. The power models presented in Rouder and Geary (2014) are theoretically less suitable to make
the comparison between linear and pre-linear placements; in the unlikely case of perfect placements,
this model is not statistically distinguishable from a linear model. Note, however, that any deviation
from perfect placements makes models statistically distinguishable.
When the non-cyclic power model is disregarded, children in kindergarten are more likely to make
placements best fitting the logarithmic model and there is a gradual developmental shift toward the
one-cycle power model as the statistically next best-fitting model across time points. Two inferences
can be made from these data. First, the logarithmic model, despite being inferior in fit to the non-cyclic
power model as evidenced by the smaller number of children fitting the model best, quite adequately
described number line placements of children before the start of formal education. Second, the fact
that children best fitting the non-cyclic power model did not all have the same statistically next
best-fitting model suggests that the shift from a model in which one reference point is used toward
a model in which multiple reference points are used is not sudden and paradigmatic, with children
shifting directly from one model to another across time, as suggested in previous work (Opfer et al.,
2011). More gradual shifts between models may better describe the development of number line
placements, with phases in between during which more reference points are used or even phases dur-
ing which a mixture of reference point strategies can be used; it remains possible that children use
different sets of reference points to place various numbers on a number line, making none of the mod-
els perfectly suited to their data. Previous discussions of a gradual versus abrupt shift in representa-
tion have so far been inconclusive, and microgenetic studies are needed to address this issue in more
detail (Barth & Paladino, 2011; Opfer et al., 2011). Item-based analyses could reveal item-specific
differences in strategy use within and between children that cannot be investigated using only
placements on the number line.
24 I. Friso-van den Bos et al. / Journal of Experimental Child Psychology 134 (2015) 12–29

Shifts in the use of reference points, however, were prevalent in our data, confirming the hypoth-
esis that children started using more reference points with increasing age and experience with num-
bers (Ashcraft & Moore, 2012; Rouder & Geary, 2014; Slusser et al., 2013). The frequent occurrence of
logarithmic and non-cyclic power models in kindergarten suggests that although most kindergartners
scaled their responses to fit on the line, they did not often use the end point of the number line as a
reference point. Rather, kindergartners seemed to scale their responses based on the beginning of the
number line. A shift toward increasing use of the end point as a reference point in making number line
placements is suggested by the increasing number of children who were placed in the one-cycle pow-
er model throughout the study, indicating the use of two reference points (Rouder & Geary, 2014). The
number of children whose number line placements were best fit by a linear model also grew steadily
until the end of Grade 2. By the final measurement occasion (T6), the linear model was nearly just as
prevalent as a best-fitting model as the one-cycle power model. These findings suggest that after the
second year of primary school, the number of children whose number line estimates best fit a linear
model at this scale will still increase until (nearly) all children have achieved linear estimates.
The current data do not provide information on what underlies the shift between models in which
various reference points are used. Shifts in number line placements may be the result of growing
expertise in domain-specific numerical abilities, as suggested by the longitudinal associations
between number line acuity and mathematics performance (see also Siegler & Lortie-Forgues,
2014). This implies that children who use more reference points to make number line placements
are more aware of the magnitude of numbers, the relations between numbers, and part–whole rela-
tions associated with numerical proportions displayed on a number line in comparison with their
peers who use fewer reference points. Alternatively, the use of more reference points may be the
result of an increase in measurement skills (Cohen & Sarnecka, 2014). However, it is also possible that
these shifts are the result of increasing domain-general capacities such as working memory (Friso-van
den Bos et al., 2014; Geary, Hoard, Nugent, & Byrd-Craven, 2008). Integrative longitudinal studies are
needed to compare the validity of the various predictors that have been proposed to underlie number
line placements and identify the processes through which children shift between sets of reference
points over time.
The observation that only very few children made number line placements that fit best with the
two-cycle model is striking because this model best fit the number line placements of children of a
similar age and older children in a number of previous studies (Barth & Paladino, 2011; Rouder &
Geary, 2014; Slusser et al., 2013). This difference in outcomes may be attributable to the fact that
in previous studies during the practice phase children were explicitly instructed to place 50 in the
middle of the number line and not to place any other numbers exactly on that spot (Barth &
Paladino, 2011; Rouder & Geary, 2014; Slusser et al., 2013). This may have motivated children to place
values that should be placed close to the midpoint a bit farther from the midpoint in these studies,
whereas the lack of constraints with respect to placement on the midpointmay have elicited much clo-
ser placements to this specific point on the number line. This hypothesis is supported by the fact that
in a study by Ashcraft and Moore (2012), in which the midpoint was also not stressed in the instruc-
tions, the two-cycle model was also the least representative of children’s number line placements.
Perhaps this model is not of use when no instruction is given with respect to a reference point in
the middle. This observation is consistent with the finding that number line acuity can be trained
through number line-directed practice (e.g., Kucian et al., 2011; Siegler & Ramani, 2009).
An alternative explanation for the deviation in findings with previous studies (e.g., Barth &
Paladino, 2011; Rouder & Geary, 2014; Slusser et al., 2013) and the current study is that in all previous
studies children were taught in English, in which the number system is assumed to be more transpar-
ent than the Dutch number system. Dutch number words include the ones before the tens instead of
the tens before the ones (e.g., instead of saying ‘‘thirty-five,’’ one would say ‘‘five-and-thirty’’), which is
inconsistent with the order of written numerals. This may make it more difficult for young children to
gain insight into the number system and might explain the large number of children being placed in
the random group during kindergarten, leading children to prevail in using less mature placement
strategies and skipping the strategy with three reference points to inform number line placements
in favor of the most advanced strategy, which is making linear placements. This hypothesis, however,
rests on the assumption that children make placements through interpretation of verbal number
I. Friso-van den Bos et al. / Journal of Experimental Child Psychology 134 (2015) 12–29 25

words, either by transcoding the written number or by listening closely to the experimenter reading
the numbers out loud. A study by Helmreich and colleagues (2011) indeed suggested that inversion
errors (e.g., reading ‘‘53’’ as ‘‘thirty-five’’) may be of influence on number line placements in primary
school children. More experimental studies are needed to investigate similar differences in findings
and manipulate strategy use through variations in instruction in various groups.
Across time points, children generally moved from models with fewer reference points toward
models with more reference points or linear models, as evidenced by the model transitions. This is
consistent with the notion that models with more reference points are more advanced than models
with fewer reference points (Ashcraft & Moore, 2012; Barth & Paladino, 2011; Rouder & Geary,
2014) and adds to the body of research by providing a more extensive set of models to index number
line placements (Barth & Paladino, 2011; Rouder & Geary, 2014) using a longitudinal approach
(Ashcraft & Moore, 2012). Children not only maintained the same model or moved toward more
advanced models across time points, but also small numbers of children regressed toward less
advanced models from one time point to the next. According to Siegler’s overlapping waves model,
children do not abandon a strategy entirely in favor of more advanced strategies but rather have mul-
tiple strategies available for solving any kind of problem. Gradually, more advanced approaches
become more prevalent in children’s behavior (Siegler, 1996). Regression toward less advanced mod-
els, in this framework, may be considered to be adaptive or, at the very least, can be expected. It can
also not be ruled out that children use different strategies simultaneously, specific for each item, and
that this reduced the fit of certain models to index children’s placements.
More support for the notion that models with more reference points are indicative of more
advanced development of numerical abilities comes from the contrasts in mathematics scores
between children in different groups of number line placements; although not all contrasts were sig-
nificant (some presumably due to a lack of power), a clear trend can be seen in the pattern of children
whose data fit more advanced models scoring higher on mathematical performance. Importantly, chil-
dren in the one-cycle and linear groups scored higher than children in groups that were associated
with the use of fewer reference points, confirming that children who made placements in accordance
with these models indeed were more advanced with respect to number line placements, indicative of
numerical abilities associated with mathematical achievement (De Hevia & Spelke, 2009; Dehaene,
2001). This finding replicates earlier reports that children whose placements conform to linear models
score higher on mathematical tests (Ashcraft & Moore, 2012; Geary, 2011; Halberda et al., 2008;
Sasanguie et al., 2013; Siegler & Booth, 2004) and adds to the understanding of this association by
including multiple number line models. These findings show that a more specific number of reference
points can be associated with mathematics performance and not only the contrast between linear and
pre-linear models.
The cross-lagged panel analyses addressing the interrelations between number line acuity and
mathematics performance yielded similar conclusions to those in the study by LeFevre and
colleagues (2013); the authors concluded that arithmetic performance predicted consecutive number
line performance as much as number line performance predicted arithmetic performance. The current
analyses were more extensive than the model presented by LeFevre and colleagues, comparing a num-
ber of different models with twice as many occurrences and a more adequate sample size for this type
of analysis. Word problems (as measured by the Cito mathematics test) and number line acuity
showed bidirectional relationships, and a bidirectional model showed better fit than both the model
with number lines predicting mathematics and the model with mathematics predicting number lines.
Compared with LeFevre and colleagues, the current study included a more uniform group of children
(all from the same grade), smaller intervals between time points (6 months rather than 1 year), and a
larger sample, making the data better suitable for path analysis, and included a direct comparison of
various models with different theoretical implications. Therefore, the current study made a stronger
case for the interplay between number line development and mathematical reasoning. Moreover,
the current study compared mathematics scores between children placed in various categories of
number line placement. The rationalization in the mutual interdependencies reported in the cross-
lagged model lies not only in the notion that knowledge of the number system is needed for both tasks
but also in the current model’s implication that for a large part mathematics performance enhances
young school-age children’s understanding of number. In other words, by performing calculations
26 I. Friso-van den Bos et al. / Journal of Experimental Child Psychology 134 (2015) 12–29
and reasoning about additions, subtractions, and other calculations, children gain insight into the ordi-
nality of the exact number system and the relations between numbers in addition to insights into
number relations fostering insights into calculation processes.
The bidirectional relationship between mathematics and number line acuity may also be directly
responsible for the sudden drop in random placements after the start of Grade 1 (T3); although the
number of children showing random placements already decreased during kindergarten, random
placements were rare at the start of first grade. This may be a direct result of the structured
mathematics education that is given from the start of first grade.
Although bidirectional relations between number line acuity and mathematics performance could
be found throughout most of the first 2 years of formal education, number line acuity at T5 (middle of
Grade 2) or any other time point did not predict mathematics performance at T6 (end of Grade 2). This
apparent drop in predictive power may carry two explanations that are not mutually exclusive. A first
possible explanation is that mathematics performance at the end of Grade 2 becomes more advanced
and requires the use of algorithms in which evaluation of mathematics problems on a number line is
not required, making acuity on a number line task for a large part irrelevant for future—more
advanced—mathematics performance. A second explanation may be that there is too little variation
in number line acuity; explained variance of a linear slope approached 90% at the beginning of
Grade 2 and exceeded 90% at the end of Grade 2 on this scale. Although this does not imply that var-
iation between scores is irrelevant, it might not yield different outcomes for children, for example,
when they compare the likeliness of an obtained answer using number line estimation.
In addition, mathematics at the start of Grade 1 was directly predictive of mathematics perfor-
mance at the start and end of Grade 2. This may indicate that efficacious development of mathematical
achievement at an early age not only is predictive of skills that are taught successively but also has a
direct impact on the more advanced skills that are taught later in education, for example, through the
use of retrieval strategies that are less cognitively demanding (Hecht, 2002). This would open up men-
tal workspace, now no longer needed for basic calculations, to address a larger part of a more complex
problem and directly foster mathematical performance at a later age (Siegler, 1996; Van der Ven,
Boom, Kroesbergen, & Leseman, 2012). This issue, however, requires more thorough longitudinal
investigation of the exact skills involved in making calculations and interpreting number and quantity.
Conclusion and future directions
The current study provides deeper insight into the development and impact of number line acuity
of children at the start of formal education. This study shows that children’s number line placements
fit various power models, with the non-cyclic power model being more dominant in the lower grades
and the one-cycle power model becoming more dominant over time, and that the group of children
making linear placements becomes larger when children grow older. In addition, mathematics perfor-
mance is a predictor of number line acuity and vice versa. This may indicate that children not only use
their numerical abilities in learning to understand and solve mathematics problems (Xenidou-Dervou
et al., in press) but also, and maybe more important, develop more exact representations of number
due to the practice with mathematical problems. This finding not only is of theoretical importance
to knowledge development concerning numerical abilities but also can be a motive for a more thor-
ough investigation of how different types of mathematical problems best foster numerical abilities.
Future studies are needed to gain insight into the various aspects of number line placements. First,
studies are needed to investigate the influence of instruction type on number line placements and, in
particular, to what extent instruction with respect to number line placements around the midpoint
influences the shape of the number lines produced by the children (Ashcraft & Moore, 2012).
Second, although various studies have investigated transitions of number line shapes using number
line tasks of various scales (Ashcraft & Moore, 2012; Berteletti, Lucangeli, Piazza, Dehaene, & Zorzi,
2010; Laski & Yu, 2014; Slusser et al., 2013), a broader range of models to describe the shape of num-
ber lines of various scales should be used in order to gain insight into the development of number line
placements in other scales than in the current study. Third, although a developmental account has
been made in the current study, no strong causal inferences can be drawn from the longitudinal
I. Friso-van den Bos et al. / Journal of Experimental Child Psychology 134 (2015) 12–29 27
analyses. Experimental studies are needed to investigate the causal associations between number line
placements and mathematics performance, and to investigate development of number line shape in
the face of quasi-experimental practice and feedback conditions, at the same time targeting shifts
in number line placements (Barth & Paladino, 2011; Opfer et al., 2011). Moreover, strategy assessment
in mathematics problem solving may provide insight into the various strategy choices made by chil-
dren whose number line placements are indicative of different reference points and expand on the
current study by linking reference points to strategy choices in problems that center around those ref-
erence points in numerical magnitudes. Finally, the models used in the current study carry the
assumption that each pattern of placements can be associated with a varying set of reference points
to make number line placements. Online assessment of number line placement strategies, such as eye
tracking studies, could be used to confirm the use of reference points assumed to be associated with
the various models of placement (Van Viersen, Slot, Kroesbergen, Van’t Noordende, & Leseman, 2013).
Nevertheless, the current study contributes to the body of knowledge concerning number line
development by comparing different models of number line placements in a large-scale longitudinal
study including children who were making important steps in their mathematical development
throughout the course of the study. The results confirmed previously posed hypotheses, yielded
new questions with respect to the role of number line acuity in mathematical achievement, and made
important steps in uncovering the intriguing interplay between related yet distinct skills.
Acknowledgments
This study was part of the MathChild study and was supported by a grant from the Netherlands
Organisation for Scientific Research (NWO, Grant 411-07-113). We thank the children, teachers,
schools, and parents whose participation and consent made this study possible. We acknowledge
the substantial contributions to the study design by Erik van Loosbroek.
References
Ashcraft, M. H., & Moore, A. M. (2012). Cognitive processes of numerical estimation in young children. Journal of ExperimentalChild Psychology, 111, 246–267.
Barth, H. C., & Paladino, A. M. (2011). The development of numerical estimation: Evidence against a representational shift.Developmental Science, 14, 125–135.
Berteletti, I., Lucangeli, D., Piazza, M., Dehaene, S., & Zorzi, M. (2010). Numerical estimation in preschoolers. Developmental
Psychology, 46, 545–551.Bouwmeester, S., & Verkoeijen, P. P. J. L. (2011). Multiple representations in number line estimation: A developmental shift or
classes of representation? Cognition and Instruction, 30, 246–260.Cohen, D. J., & Sarnecka, B. W. (2014). Children’s number-line estimation shows development of measurement skills (not
number-representations). Developmental Psychology, 50, 1640–1652.Cohen, J. (1992). A power primer. Psychological Bulletin, 112, 155–159.Dehaene, S. (1992). Varieties of numerical abilities. Cognition, 44, 1–42.Dehaene, S. (2001). Précis of the number sense. Mind & Language, 16, 16–36.Dehaene, S. (2003). The neural basis of the Weber-Fechner law: A logarithmic mental number line. Trends in Cognitive Sciences,
7, 145–147.Dehaene, S., Bossini, S., & Giraux, P. (1993). The mental representation of parity and number magnitude. Journal of Experimental
Psychology, 122, 371–396.De Hevia, M.-D., & Spelke, E. S. (2009). Spontaneous mapping of number and space in adults and young children. Cognition, 110,
198–207.Ebersbach, M., Luwel, K., Frick, A., Onghena, P., & Verschaffel, L. (2008). The relationship between the shape of the mental
number line and familiarity with numbers in 5- to 9-year-old children: Evidence for a segmented linear model. Journal ofExperimental Child Psychology, 99, 1–17.
Feigenson, L., Dehaene, S., & Spelke, E. (2004). Core systems of number. Trends in Cognitive Sciences, 8, 307–314.Friso-van den Bos, I., Kolkman, M. E., Kroesbergen, E. H., & Leseman, P. P. M. (2014). Explaining variability: Numerical
representations in 4- to 8-year-old children. Journal of Cognition and Development, 15, 325–344.Gallistel, C. R., & Gelman, R. (1992). Preverbal and verbal counting and computation. Cognition, 44, 43–74.Geary, D. C. (2011). Cognitive predictors of achievement growth in mathematics: A 5-year longitudinal study. Developmental
Psychology, 47, 1539–1552.Geary, D. C., Hoard, M. K., Nugent, L., & Byrd-Craven, J. (2008). Development of number line representations in children with
mathematical learning disability. Developmental Neuropsychology, 33, 277–299.Halberda, J., Mazzocco, M. M. M., & Feigenson, L. (2008). Individual differences in nonverbal number acuity correlate with maths
achievement. Nature, 455, 665–668.Hecht, S. A. (2002). Counting on working memory in simple arithmetic when counting is used for problem solving. Memory &
Cognition, 30, 447–455.
28 I. Friso-van den Bos et al. / Journal of Experimental Child Psychology 134 (2015) 12–29
Helmreich, I., Zuber, J., Pixner, S., Kaufmann, L., Nuerk, H.-C., & Moeller, K. (2011). Language effects on children’s nonverbalnumber line estimations. Journal of Cross-Cultural Psychology, 42, 598–613.
Hollands, J. G., & Dyre, B. P. (2000). Bias in proportion judgements: The cyclical power model. Psychological Review, 107,500–524.
Hu, L., & Bentler, P. M. (1999). Cutoff criteria for fit indexes in covariance structure analysis: Conventional criteria versus newalternatives. Structural Equation Modeling, 6, 1–55.
Janssen, J., Scheltens, F., & Kraemer, J. M. (2005). Leerling-en onderwijsvolgsysteem rekenen-wiskunde [Student monitoring systemmathematics]. Arnhem, The Netherlands: Cito.
Janssen, J., Verhelst, N., Engelen, R., & Scheltens, F. (2010). Wetenschappelijke verantwoording van de toetsen LOVS rekenen-wiskunde voor groep 3 tot en met 8 [Scientific justification of the mathematics test for Grade 1 to Grade 6]. Arnhem, TheNetherlands: Cito.
Kenny, D. A. (2005). Cross-lagged panel design. In B. S. Everitt & D. C. Howell (Eds.). Encyclopedia of statistics in behavioral science(Vol. 1, pp. 450–451). New York: John Wiley.
Kolkman, M. E., Kroesbergen, E. H., & Leseman, P. P. M. (2013). Early numerical development and the role of non-symbolic andsymbolic skills. Learning and Instruction, 25, 95–103.
Kucian, K., Grond, U., Rotzer, S., Henzi, B., Schönmann, C., Plangger, F., et al (2011). Mental number line training in children withdevelopmental dyscalculia. NeuroImage, 57, 782–795.
Laski, E. V., & Siegler, R. S. (2007). Is 27 a big number? Correlational and causal connections among numerical categorization,number line estimation, and numerical magnitude comparison. Child Development, 78, 1723–1743.
Laski, E. V., & Yu, Q. (2014). Number line estimation and mental addition: Examining the potential roles of language andeducation. Journal of Experimental Child Psychology, 117, 29–44.
LeFevre, J.-A., Jimenez Lira, C., Sowinski, C., Cankaya, O., Kamawar, D., & Skwarchuk, S.-L. (2013). Charting the role of the numberline in mathematical development. Frontiers in Psychology, 4. http://dx.doi.org/10.3389/fpsyg.2013.00641.
Merritt, D. J., & Brannon, E. M. (2013). Nothing to it: Precursors to a zero concept in preschoolers. Behavioural Processes, 93,91–97.
Moeller, K., Pixner, S., Kaufmann, L., & Nuerk, H.-C. (2009). Children’s early mental number line: Logarithmic or decomposedlinear? Journal of Experimental Child Psychology, 103, 503–515.
Muthén, L. K., & Muthén, B. O. (1998–2011). Mplus user’s guide (6th ed.). Los Angeles: Muthén & Muthén.Opfer, J. E., & DeVries, J. M. (2008). Representational change and magnitude estimation: Why young children can make more
accurate salary comparisons than adults. Cognition, 108, 843–849.Opfer, J. E., Siegler, R. S., & Young, C. J. (2011). The powers of noise fitting: Reply to Barth and Paladino. Developmental Science, 14,
1194–1204.Praet, M., Titeca, D., Ceulemans, A., & Desoete, A. (2013). Language in the prediction of arithmetics in kindergarten and Grade 1.
Learning and Individual Differences, 27, 90–96.Rips, L. J. (2013). How many is a zillion? Sources of number distortion. Journal of Experimental Psychology: Learning, Memory, and
Cognition, 39, 1257–1264.Rouder, J. N., & Geary, D. C. (2014). Children’s cognitive representations of the mathematical number line. Developmental Science,
17, 525–536.Sasanguie, D., De Smedt, B., Defever, E., & Reynvoet, B. (2012). Association between basic numerical abilities and mathematics
achievement. British Journal of Developmental Psychology, 30, 344–357.Sasanguie, D., Göbel, S. M., Moll, K., Smets, K., & Reynvoet, B. (2013). Approximate number sense, symbolic number processing,
or number–space mappings: What underlies mathematics achievement? Journal of Experimental Child Psychology, 114,418–431.
Satorra, A., & Bentler, P. M. (2010). Ensuring positiveness of the scaled difference chi-square test statistic. Psychometrika, 75,243–248.
Schermelleh-Engel, K., Moosbrugger, H., & Müller, H. (2003). Evaluating the fit of structural equation models: Test ofsignificance and descriptive goodness-of-fit measures. Methods of Psychological Research – Online, 8(2), 23–74.
Siegler, R. S. (1996). Emerging minds: The process of change in children’s thinking. New York: Oxford University Press.Siegler, R. S., & Booth, J. L. (2004). Development of numerical estimation in young children. Child Development, 75, 428–444.Siegler, R. S., & Lortie-Forgues, H. (2014). An integrative theory of numerical development. Child Development Perspectives, 8,
144–150.Siegler, R. S., & Opfer, J. E. (2003). The development of numerical estimation: Evidence for multiple representations of numerical
quantity. Psychological Science, 14, 237–243.Siegler, R. S., & Ramani, G. B. (2009). Playing linear number board games—but not circular ones—improves low-income
preschoolers’ numerical understanding. Journal of Educational Psychology, 101, 545–560.Slusser, E. B., Santiago, R. T., & Barth, H. C. (2013). Developmental change in numerical estimation. Journal of Experimental
Psychology, 142, 193–208.Stevens, S. S. (1957). On the psychophysical law. Psychological Review, 64, 153–181.Van der Ven, S. H. G., Boom, J., Kroesbergen, E. H., & Leseman, P. P. M. (2012). The development of executive functions and early
mathematics: A dynamic relationship. British Journal of Educational Psychology, 82, 100–119.Van Viersen, S., Slot, E. M., Kroesbergen, E. H., Van’t Noordende, J. E., & Leseman, P. P. M. (2013). The added value of eye-tracking
in diagnosing dyscalculia: A case study. Frontiers in Psychology, 4. http://dx.doi.org/10.3389/fpsyg.2013.00679.Verguts, T., & Fias, W. (2004). Representation of number in animals and humans: A neural model. Journal of Cognitive
Neuroscience, 16, 1493–1504.Xenidou-Dervou, I., van der Schoot, M., & van Lieshout, E. C. D. M. (in press). Working memory and number line representations
in single-digit addition: Approximate versus exact, nonsymbolic versus symbolic. Quarterly Journal of Experimental
Psychology. doi: 10.1080/17470218.2014.977303.
I. Friso-van den Bos et al. / Journal of Experimental Child Psychology 134 (2015) 12–29 29
Related Documents