Vol.:(0123456789) 1 3 Journal of Neurology (2018) 265:1381–1392 https://doi.org/10.1007/s00415-018-8850-7 ORIGINAL COMMUNICATION Longitudinal cognitive biomarkers predicting symptom onset in presymptomatic frontotemporal dementia Lize C. Jiskoot 1,2 · Jessica L. Panman 1,2 · Lauren van Asseldonk 1 · Sanne Franzen 1 · Lieke H. H. Meeter 1 · Laura Donker Kaat 1,3 · Emma L. van der Ende 1 · Elise G. P. Dopper 1 · Reinier Timman 4 · Rick van Minkelen 5 · John C. van Swieten 1,6 · Esther van den Berg 1 · Janne M. Papma 1 Received: 21 December 2017 / Revised: 9 March 2018 / Accepted: 26 March 2018 / Published online: 7 April 2018 © The Author(s) 2018 Abstract Introduction We performed 4-year follow-up neuropsychological assessment to investigate cognitive decline and the prog- nostic abilities from presymptomatic to symptomatic familial frontotemporal dementia (FTD). Methods Presymptomatic MAPT (n = 15) and GRN mutation carriers (n = 31), and healthy controls (n = 39) underwent neuropsychological assessment every 2 years. Eight mutation carriers (5 MAPT, 3 GRN) became symptomatic. We investi- gated cognitive decline with multilevel regression modeling; the prognostic performance was assessed with ROC analyses and stepwise logistic regression. Results MAPT converters declined on language, attention, executive function, social cognition, and memory, and GRN converters declined on attention and executive function (p < 0.05). Cognitive decline in ScreeLing phonology (p = 0.046) and letter fluency (p = 0.046) were predictive for conversion to non-fluent variant PPA, and decline on categorical fluency (p = 0.025) for an underlying MAPT mutation. Discussion Using longitudinal neuropsychological assessment, we detected a mutation-specific pattern of cognitive decline, potentially suggesting prognostic value of neuropsychological trajectories in conversion to symptomatic FTD. Keywords Presymptomatic · Frontotemporal dementia · Familial · Biomarkers · Cognition · Neuropsychological assessment · Longitudinal Introduction Frontotemporal dementia (FTD) is a presenile neurodegen- erative disorder, leading to a heterogeneous clinical pres- entation, involving behavioural (behavioural variant FTD; bvFTD) and/or language deterioration (primary progressive aphasia; PPA) [1]. FTD has an autosomal dominant pattern of inheritance in 30 percent of cases, with mutations in the progranulin (GRN) and microtubule-associated protein tau (MAPT) genes as its two main causes [2]. The cognitive profile of FTD varies depending on the clinical phenotype and the underlying genotype. Patients with bvFTD are characterized by deficits in executive function, social cog- nition and language, whereas memory and visuoconstruction are initially spared [3–5]. Non-fluent variant PPA (nfvPPA) patients show agrammatism and speech sound distortions, while semantic variant PPA (svPPA) patients experience def- icits in confrontation naming and word comprehension [6]. GRN mutations often lead to a clinical diagnosis of bvFTD, nfvPPA or parkinsonism. In MAPT mutations, bvFTD is the main phenotype, and semantic and memory impairments can be prominent neuropsychological symptoms [7]. Research in familial FTD has demonstrated the presence of a presymptomatic stage in which subtle cognitive changes have been identified [8–12]. More specifically, cognitive decline can start as early as 8 years prior to estimated symp- tom onset and shows mutation-specific patterns, with GRN mutation carriers declining in memory, and MAPT mutation carriers declining in language, social cognition and memory [8, 10]. This suggests that cognitive measures could function as disease-tracking biomarkers in the presymptomatic stage. Electronic supplementary material The online version of this article (https://doi.org/10.1007/s00415-018-8850-7) contains supplementary material, which is available to authorized users. * Janne M. Papma [email protected] Extended author information available on the last page of the article

Welcome message from author
This document is posted to help you gain knowledge. Please leave a comment to let me know what you think about it! Share it to your friends and learn new things together.
Transcript

Vol.:(0123456789)1 3
Journal of Neurology (2018) 265:1381–1392 https://doi.org/10.1007/s00415-018-8850-7
ORIGINAL COMMUNICATION
Longitudinal cognitive biomarkers predicting symptom onset in presymptomatic frontotemporal dementia
Lize C. Jiskoot1,2 · Jessica L. Panman1,2 · Lauren van Asseldonk1 · Sanne Franzen1 · Lieke H. H. Meeter1 · Laura Donker Kaat1,3 · Emma L. van der Ende1 · Elise G. P. Dopper1 · Reinier Timman4 · Rick van Minkelen5 · John C. van Swieten1,6 · Esther van den Berg1 · Janne M. Papma1
Received: 21 December 2017 / Revised: 9 March 2018 / Accepted: 26 March 2018 / Published online: 7 April 2018 © The Author(s) 2018
AbstractIntroduction We performed 4-year follow-up neuropsychological assessment to investigate cognitive decline and the prog-nostic abilities from presymptomatic to symptomatic familial frontotemporal dementia (FTD).Methods Presymptomatic MAPT (n = 15) and GRN mutation carriers (n = 31), and healthy controls (n = 39) underwent neuropsychological assessment every 2 years. Eight mutation carriers (5 MAPT, 3 GRN) became symptomatic. We investi-gated cognitive decline with multilevel regression modeling; the prognostic performance was assessed with ROC analyses and stepwise logistic regression.Results MAPT converters declined on language, attention, executive function, social cognition, and memory, and GRN converters declined on attention and executive function (p < 0.05). Cognitive decline in ScreeLing phonology (p = 0.046) and letter fluency (p = 0.046) were predictive for conversion to non-fluent variant PPA, and decline on categorical fluency (p = 0.025) for an underlying MAPT mutation.Discussion Using longitudinal neuropsychological assessment, we detected a mutation-specific pattern of cognitive decline, potentially suggesting prognostic value of neuropsychological trajectories in conversion to symptomatic FTD.
Keywords Presymptomatic · Frontotemporal dementia · Familial · Biomarkers · Cognition · Neuropsychological assessment · Longitudinal
Introduction
Frontotemporal dementia (FTD) is a presenile neurodegen-erative disorder, leading to a heterogeneous clinical pres-entation, involving behavioural (behavioural variant FTD; bvFTD) and/or language deterioration (primary progressive aphasia; PPA) [1]. FTD has an autosomal dominant pattern of inheritance in 30 percent of cases, with mutations in the progranulin (GRN) and microtubule-associated protein tau (MAPT) genes as its two main causes [2]. The cognitive profile of FTD varies depending on the clinical phenotype and the underlying genotype. Patients with bvFTD are
characterized by deficits in executive function, social cog-nition and language, whereas memory and visuoconstruction are initially spared [3–5]. Non-fluent variant PPA (nfvPPA) patients show agrammatism and speech sound distortions, while semantic variant PPA (svPPA) patients experience def-icits in confrontation naming and word comprehension [6]. GRN mutations often lead to a clinical diagnosis of bvFTD, nfvPPA or parkinsonism. In MAPT mutations, bvFTD is the main phenotype, and semantic and memory impairments can be prominent neuropsychological symptoms [7].
Research in familial FTD has demonstrated the presence of a presymptomatic stage in which subtle cognitive changes have been identified [8–12]. More specifically, cognitive decline can start as early as 8 years prior to estimated symp-tom onset and shows mutation-specific patterns, with GRN mutation carriers declining in memory, and MAPT mutation carriers declining in language, social cognition and memory [8, 10]. This suggests that cognitive measures could function as disease-tracking biomarkers in the presymptomatic stage.
Electronic supplementary material The online version of this article (https ://doi.org/10.1007/s0041 5-018-8850-7) contains supplementary material, which is available to authorized users.
* Janne M. Papma [email protected]
Extended author information available on the last page of the article
1382 Journal of Neurology (2018) 265:1381–1392
1 3
However, it is currently unknown what the long-term cogni-tive profiles of presymptomatic FTD mutations are, whether neuropsychological assessment can be used to track disease progression to the symptomatic stage, and what the prognos-tic value is of cognitive trajectories in the presymptomatic and early symptomatic stage of FTD.
In this study, we investigated longitudinal cognitive decline on neuropsychological assessment in presympto-matic mutation carriers (MAPT or GRN) and controls from the same families within our longitudinal presymptomatic Dutch familial FTD Risk Cohort (FTD-RisC). Second, we assessed the difference in cognitive course between convert-ers’ genotypes (i.e. MAPT vs. GRN) and phenotypes (i.e. bvFTD vs. nfvPPA) versus non-converters. Lastly, we inves-tigated the prognostic value of neuropsychological trajecto-ries in predicting symptom onset within 2–4 years.
Methods
Participants
In FTD-RisC, we follow healthy 50% at-risk family mem-bers from genetic FTD families on a 2-year basis. In the current study, we included 87 participants from MAPT or GRN families with study entries between December 2009 and January 2013 [8, 9, 13]. The follow-up period was 4 years, in which we acquired neuropsychological assess-ments at study entry, follow-up after 2 years and follow-up after 4 years. DNA genotyping (see “Procedure”) assigned participants either to the presymptomatic mutation carrier (n = 46; 31 GRN, 15 MAPT), or control group (n = 39; 29 GRN, 10 MAPT family members). We excluded two controls as they had cognitive disorders (≥ 2 SD below mean) on multiple domains, ultimately including 85 participants (46 mutation carriers, 37 controls; Fig. 1).
Standard protocol approvals, registrations, and patient consents
Clinical investigators were blind for participants’ genetic sta-tus if they had not undergone predictive testing. In case of conversion to clinical FTD, we offered the patient and family members genetic counselling and unblinding of genetic sta-tus, to confirm the presence of the pathogenic mutation. At study entry, all participants gave written informed consent. The study was approved by the Medical and Ethical Review Committee of the Erasmus Medical Center.
Procedure
Every 2 years, participants underwent a standardized assessment consisting of a neuropsychological test battery,
neurological examination, and MR imaging of the brain. DNA sequencing was performed at study entry. All par-ticipants were asymptomatic according to established diagnostic criteria for bvFTD [3] or PPA [6] at baseline. Knowledgeable informants were asked about cognitive and/or behavioural deterioration at each study visit by means of a structured interview and a well-validated questionnaire (Neuropsychiatric Inventory; NPI) [14].
Converters
Eight mutation carriers became symptomatic within the study time window (“converters”). Symptom onset was determined by means of the above mentioned assessment (anamnesis, MR imaging of the brain, neuropsychological assessment, heteroanamnestic information and unblinding of genetic status). Conversion was determined in a multi-disciplinary consensus meeting of the Erasmus MC FTD Expertise Centre, involving neurologists (LDK, JCvsS),
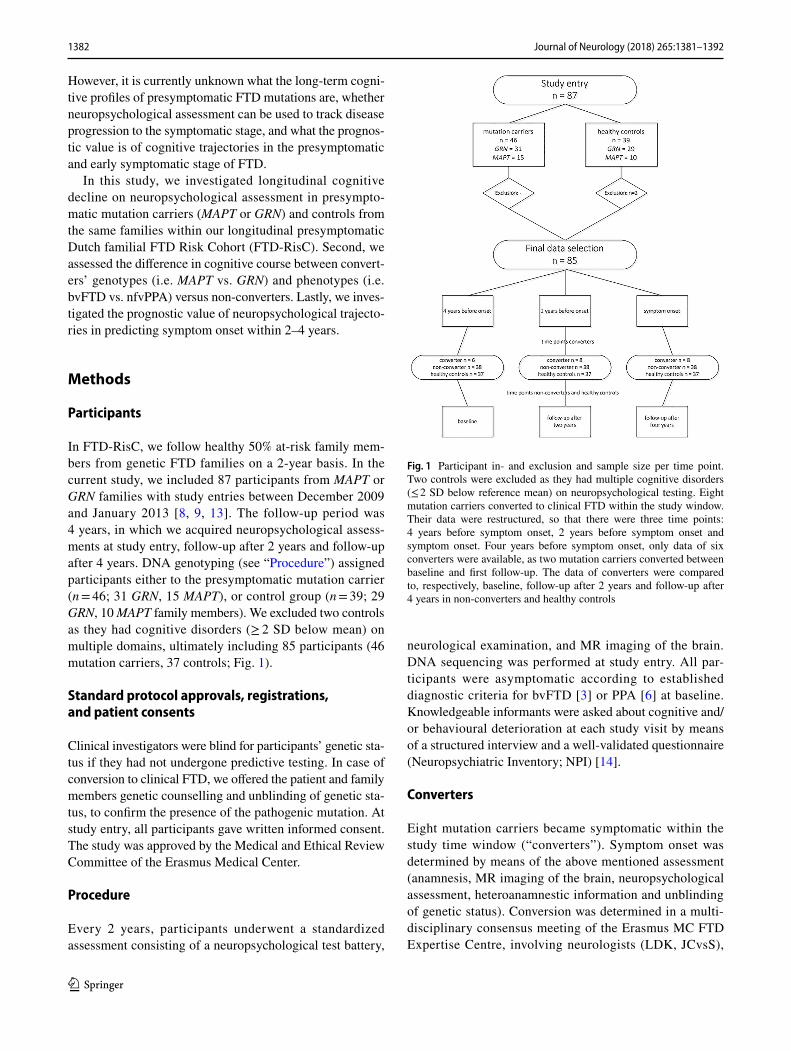
Fig. 1 Participant in- and exclusion and sample size per time point. Two controls were excluded as they had multiple cognitive disorders (≤ 2 SD below reference mean) on neuropsychological testing. Eight mutation carriers converted to clinical FTD within the study window. Their data were restructured, so that there were three time points: 4 years before symptom onset, 2 years before symptom onset and symptom onset. Four years before symptom onset, only data of six converters were available, as two mutation carriers converted between baseline and first follow-up. The data of converters were compared to, respectively, baseline, follow-up after 2 years and follow-up after 4 years in non-converters and healthy controls
1383Journal of Neurology (2018) 265:1381–1392
1 3
neuropsychologists (LCJ, JLP, SF, EvdB, JMP), medical doctors (LHM, ELvdE), as well as neuroradiologists, geri-atricians, a clinical geneticist (RvM), and a care consultant. Six converters (5 MAPT, 1 GRN) presented with progres-sive behaviour deterioration, functional decline, and frontal and/or temporal lobe atrophy on MRI, fulfilling the interna-tional diagnostic consensus criteria of Rascovsky et al. [3] for bvFTD with definite FTLD pathology. Two converters (both GRN) presented with isolated language difficulties and no impairments in daily living activities, thereby fulfill-ing the diagnostic criteria for PPA of Gorno-Tempini et al. [6]. Both developed nfvPPA, as they showed a non-fluent, halting speech, with sound errors and agrammatism. See Supplementary Table 1 for demographic, clinical and neu-ropsychological data of the converters. We defined mutation carriers remaining without FTD symptoms as non-convert-ers (n = 38; 28 GRN, 10 MAPT).
Neuropsychological assessment
We screened global cognitive functioning by means of the Mini-Mental State Examination [15] (MMSE) and frontal assessment battery [16] (FAB). Experienced neuropsycholo-gists (LCJ, JLP, SF) administered neuropsychological tests within six cognitive domains: language, attention and mental processing speed, executive functioning, social cognition, memory, and visuoconstruction. We rated language with the 60-item Boston Naming Test (BNT) [17], verbal Semantic Association Test (SAT) [18], ScreeLing phonology [19], and categorical fluency [20]. We assessed attention and mental processing speed by means of Trail making Test (TMT)-A [21], Stroop Color-Word Test I and II [22], Wechsler Adult Intelligence Scale III (WAIS-III) Digit Span forwards [23], and Letter Digit Substitution Test (LDST) [24]. Execu-tive functioning was evaluated using TMT-B [21], Stroop Color-Word Test III [22], WAIS-III Digit Span backwards [23], modified Wisconsin Card Sorting Test (WCST) con-cepts [25], letter fluency [20], and WAIS-III Similarities [23]. Happé cartoons [26] and Ekman Faces [27] measured social cognition. We assessed memory using the Dutch Rey Auditory Verbal Learning Test (RAVLT) [28] and Visual Association Test (VAT) [29]. We evaluated visuoconstruc-tion by means of clock drawing [30] and WAIS-III Block Design [23]. Alternate forms were used at follow-up visits, when applicable (letter fluency, RAVLT, VAT). Depressive symptoms were rated with the Beck’s Depression Inventory (BDI) [31].
Study design
In converters, we restructured the three original time points within our study window (i.e. baseline, follow-up after
2 years, follow-up after 4 years) into the following three new time points (Fig. 1):
• 4 years before symptom onset: we used the data of the study visit 4 years before diagnosis. Analyses could were performed in six converters, as two (1 GRN, 1 MAPT—2 bvFTD) developed symptoms between baseline and first follow-up (i.e. at 2 years follow-up), and therefore no data 4 years prior to symptom onset were available.
• 2 years before symptom onset: we used the data of the study visit 2 years before diagnosis. Analyses included all eight converters.
• After symptom onset: we used the data of the diagnosis visit. Analyses included all eight converters.
In non-converters and controls, we used the original time points: baseline (data were compared to “4 years before symptom onset” data of converters), follow-up after 2 years (data were compared to “2 years before symptom onset data of converters) and follow-up after 4 years (data were com-pared to “after symptom onset data of converters).
Statistical analysis
Statistical analyses were performed using SPSS Statistics 21.0 (IBM Corp., Armonk, NY) and GraphPad Prism 7 (La Jolla, California, USA), with the significance level at p < 0.05 (two-tailed) across all comparisons. We compared demographic data between MAPT mutation carriers, GRN mutation carriers and controls, and between converters, non-converters and controls by means of one-way ANOVAs. We performed Pearson Χ2 tests to investigate differences in sex. Longitudinal comparisons of clinical data were performed with repeated measures ANOVAs. We standardized all raw neuropsychological test scores by converting them into z-scores (i.e. individual test score minus the baseline mean of the controls, divided by the baseline SD of the controls) per time point, after which we calculated composite z-scores for the respective six cognitive domains by averaging the z-scores of the individual tests per domain. For the longi-tudinal comparisons we used multilevel linear regression modeling. This analysis corrects for bias when data absence is dependent on characteristics present in the model, and can therefore efficiently handle missing and unbalanced time points. There were two levels in the models: the partici-pants constituted the upper level; their repeated measures the lower level. We ran two analyses to assess cognitive decline per mutation (1) and clinical status (2):
1. We entered mutation status (MAPT mutation carrier, GRN mutation carrier or control), time (4 years before symptom onset, 2 years before symptom onset, and after symptom onset), and first-order interactions, with age,
1384 Journal of Neurology (2018) 265:1381–1392
1 3
gender and educational level as covariates. We reran the analyses excluding the converters to exclude convert-ers driving the cognitive decline in the mutation carrier groups;
2. We split the converter group according to genotype (MAPT or GRN) and phenotype (bvFTD or nfvPPA) to investigate specific profiles of cognitive decline over time. We then entered clinical status (converter, non-converter or control), time, and first-order interactions, with age, gender and educational level as covariates.
Third, to investigate the prognostic abilities of cognitive decline in discriminating between converters and non-con-verters, we determined the area under the curve (AUC) by receiver operating characteristic (ROC) analyses on the neu-ropsychological trajectories between visits. For this, we cal-culated deltas between test scores; one between 4 and 2 years before symptom onset and one between 2 years before symp-tom onset and symptom onset. Optimal cut-off levels were given by the highest Youden’s index [32]. Again, we split the converter group according to genotype (MAPT or GRN) and phenotype (bvFTD or nfvPPA). Next, we performed logistic regression analyses, taking group (converter vs. non-con-verter) as the dependent variable and the deltas (tests with significant diagnostic performance in abovementioned ROC analyses) as the independent variables. The models were selected with a forward stepwise method according to the likelihood ratio test and applying the standard p values for variable inclusion (0.05) and exclusion (0.10), with age, sex and education as covariates. Goodness of fit was evaluated with the HL Χ2 test. Nagelkerke R2 is reported as measure of effect size. We checked predictor variables for multicollin-earity. All models were corrected for multiple comparisons (Bonferroni).
Results
Demographics
MAPT mutation carriers were significantly younger than GRN mutation carriers (p = 0.012; Table 1). The mean familial symptom onset age was lower in MAPT than in GRN mutation carriers and controls (both p < 0.001). There were no significant differences between groups regarding estimated years to symptom onset (p > 0.05). Longitudinal analyses demonstrated that MAPT mutation carriers declined significantly more than GRN mutation carriers and controls with regards to the MMSE (p = 0.014), and also developed more depressive symptoms (p = 0.028). FAB and NPI scores did not significantly change over time (p > 0.05). Convert-ers, non-converters and controls did not differ regarding demographic variables, apart from a younger family onset
in MAPT converters than GRN converters (p = 0.043) and non-converters (p = 0.001; Table 1). Both MAPT and GRN converters declined significantly with respect to MMSE score (p < 0.001) and they developed more neuropsychi-atric symptoms in the form of higher BDI (p = 0.001) and NPI (p = 0.021) scores in comparison to non-converters and controls. FAB scores did not significantly change over time (p > 0.05).
Longitudinal cognitive decline in MAPT and GRN mutation carriers
The whole group of MAPT mutation carriers declined sig-nificantly within the domains language, social cognition and memory compared with controls (Table 2; Fig. 1). This was reflected in lower scores on the BNT and categorical fluency, Happé cartoons, VAT and RAVLT delayed recall (Table 2). In the whole group of GRN mutation carriers, no longitu-dinal decline was found in comparison to controls. In com-parison to GRN mutation carriers, MAPT mutation carriers declined significantly on the domains language (β = − 0.015, p < 0.001) and memory (β = − 0.016, p = 0.008), reflected in lower BNT (β = − 0.085, p = 0.01), SAT (β = − 0.027, p = 0.015), category fluency (β = − 0.107, p = 0.002), and RAVLT delayed recall (β = − 0.047, p = 0.001) scores. There were no cognitive domains or tests on which GRN muta-tion carriers declined more than MAPT mutation carriers (Table 2). By excluding the five MAPT converters from the analyses, none of the domain scores in MAPT mutation carriers continued to show significant decline over time in comparison to controls. Regarding individual tests, however, the decline on the RAVLT delayed recall remained signifi-cant (β = − 0.032, p = 0.023). The results did not change by excluding the three GRN converters from the analyses. In comparison to GRN, MAPT mutation carriers still declined more on language (β = − 0.010, p = 0.004), reflected in lower ScreeLing phonology (β = − 0.008, p = 0.024) and category fluency (β = − 0.007, p = 0.041). There was no cognitive decline in controls—but significant improvement was found on social cognition (Happé non-ToM and Ekman Faces) and memory (RAVLT immediate and delayed recall) (Table 2). The raw neuropsychological test scores per time point can be found in Supplementary Table 2.
Longitudinal cognitive decline in converters and non‑converters
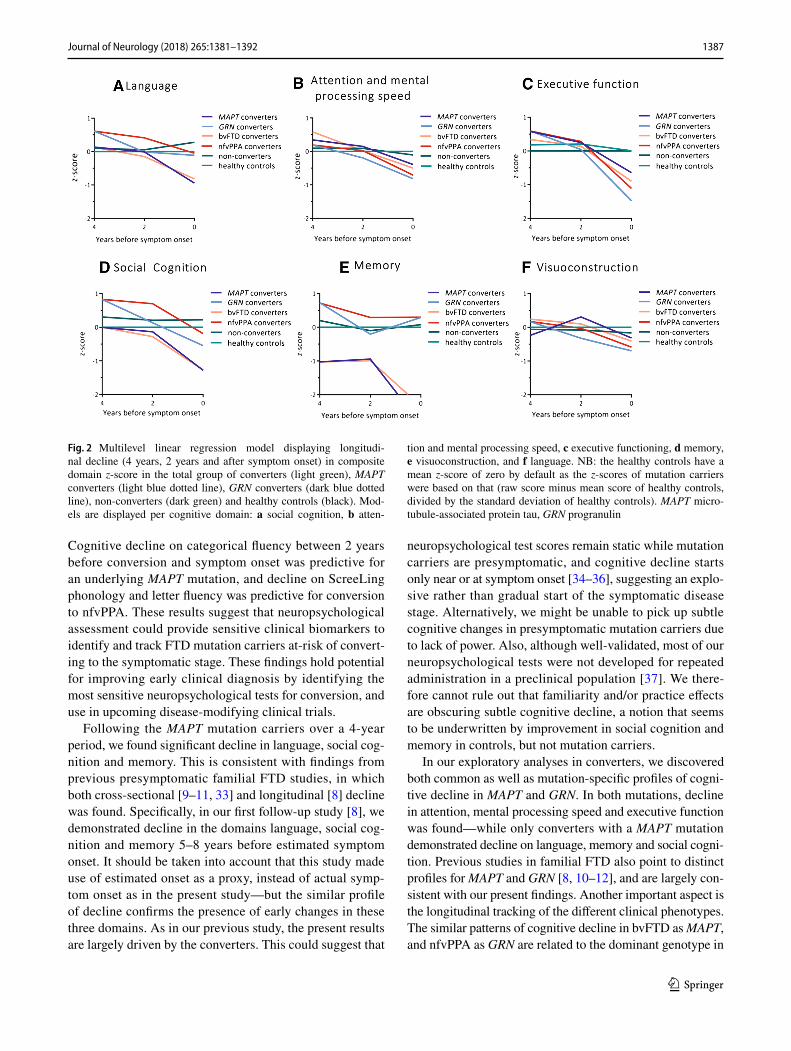
Converters with a MAPT mutation deteriorated significantly on all domains but visuoconstruction (Fig. 2a–d, f; Table 3). Within these domains, performances declined on BNT (p < 0.001), LDST (p = 0.035), Stroop I, II and III (I: p = 0.017; II: p < 0.001; III: p = 0.021), categorical fluency (p = 0.001), WAIS similarities (p < 0.001), Happé ToM (p = 0.011), and
1385Journal of Neurology (2018) 265:1381–1392
1 3
RAVLT immediate (p = 0.004) and delayed recall (p = 0.030). Converters with a GRN mutation deteriorated significantly on attention and mental processing speed, and executive function (Fig. 2b, c; Table 3). Within these domains, performances on TMT-B (p < 0.001), Stroop III (p < 0.001), WCST (p = 0.005), letter fluency (p = 0.012) and WAIS similarities (p < 0.001) deteriorated significantly over time. Converters with bvFTD had a similar pattern of cognitive decline as MAPT convert-ers, with lower scores on social cognition, memory, language, attention and executive function (Table 3). Comparably, con-verters with nfvPPA had a similar pattern of cognitive decline
as GRN converters, with lower scores on attention and execu-tive function (Table 3). There were no differences in decline between converters with bvFTD and nfvPPA (Table 3). The raw neuropsychological test scores per time point can be found in Supplementary Table 3.
Classification between converters and non‑converters
Between 4 and 2 years before symptom onset, the delta domain and individual neuropsychological test scores
Table 1 Demographics and clinical data
Values indicate: mean ± standard deviation. Significant comparisons are displayed in boldGRN progranulin, HC healthy control, MMSE Mini-Mental State Examination, FAB frontal assessment battery, BDI Beck’s depression inven-tory, NPI neuropsychiatric inventory*p value represents result of overall ANOVA between MAPT mutation carriers, GRN mutation carriers and healthy controls**p value represents result of overall ANOVA between MAPT converters, GRN converters, non-converters and HCa Significant post hoc test between MAPT and GRN mutation carriersb Significant post hoc test between MAPT mutation carriers and healthy controlsc Significant post hoc test between converters and non-convertersd Significant post hoc test between converters and healthy controlse Only data of MAPT converters available, therefore the p value represents the comparison between MAPT converters, non-converters and HCf Dutch educational system categorized into levels from 1 = less than 6 years of primary education to 7 = academic schooling (Verhage, 1964)g Data only available on follow-up visits
Demographics HC (n = 39) MAPT carriers (n = 15)
GRN carriers (n = 31)
p value* MAPT converters (n = 5)
GRN converters (n = 3)
Non-converters (n = 38)
p value**
Age at study entry, years
49.1 ± 12.2 41.9 ± 10.0 52.1 ± 8.2 0.012a 45.3 ± 8.5 54.9 ± 9.0 48.8 ± 10.3 0.704
Sex, female (%) 20 (56%) 7 (47%) 20 (65%) 0.506 1 (20%) 3 (100%) 23 (60.5%) 0.154Education
(Verhage)f5.2 ± 1.0 5.1 ± 1.6 5.7 ± 0.9 0.102 6.0 ± 0.7 5.7 ± 0.6 5.4 ± 1.3 0.409
Onset age fam-ily, years
59.0 ± 5.8 51.3 ± 6.7 61.0 ± 2.4 < 0.001a,b 48.0 ± 4.7 59.7 ± 0.0 58.8 ± 6.1 0.002c,d
Estimated years to onset, years
− 10.2 ± 11.2 − 7.7 ± 9.6 − 9.4 ± 7.9 0.690 − 2.7 ± 4.0 − 4.8 ± 9.0 − 10.0 ± 8.5 0.335
Clinical data
Years to onset
HC (n = 39) MAPT carriers (n = 15)
GRN carriers (n = 31)
p value* MAPT converters (n = 5)
GRN converters (n = 3)
Non-converters (n = 38)
p value**
MMSE 4 29.1 ± 1.3 29.6 ± 0.5 29.1 ± 1.6 0.451 29.5 ± 0.6 29.0 ± 1.4 29.2 ± 1.4 0.9242 29.2 ± 1.3 28.7 ± 2.2 28.9 ± 1.6 0.513 29.8 ± 0.4 28.0 ± 1.0 27.7 ± 1.5 0.2710 29.2 ± 1.0 28.4 ± 1.5 29.2 ± 1.4 0.099 27.2 ± 1.6 27.7 ± 1.5 29.3 ± 1.2 0.001c,d
FABg 4 – – – – – – – –2 17.4 ± 0.9 17.4 ± 0.8 17.5 ± 0.9 0.883 17.3 ± 1.0 17.5 ± 0.7 17.5 ± 0.9 0.9290 16.7 ± 1.7 16.5 ± 1.6 17.0 ± 1.1 0.639 15.4 ± 1.5 16.3 ± 1.5 17.1 ± 1.1 0.120
BDI 4 4.1 ± 4.5 4.0 ± 6.3 3.2 ± 3.9 0.693 1.3 ± 1.0 2.0 ± 2.8 3.7 ± 5.0 0.6452 3.7 ± 3.9 4.5 ± 5.0 3.2 ± 4.0 0.638 5.0 ± 4.7 2.7 ± 3.8 3.5 ± 4.4 0.8660 3.5 ± 4.3 7.6 ± 9.5 3.0 ± 6.7 0.108 11.6 ± 13.0 6.3 ± 5.1 3.1 ± 6.5 0.042c,d
NPI 4 0.1 ± 0.5 4.6 ± 11.2 1.4 ± 3.4 0.180 0.0 ± 0.0 – 3.0 ± 7.5 0.006c–e
2 0.6 ± 1.2 6.4 ± 20.7 0.3 ± 0.7 0.095 0.2 ± 0.4 0.0 ± 0.0 2.9 ± 13.3 0.7670 0.8 ± 1.5 12.3 ± 18.7 2.1 ± 6.6 0.001a,b 15.6 ± 16.3 10.7 ± 15.9 3.4 ± 11.4 0.009d

1386 Journal of Neurology (2018) 265:1381–1392
1 3
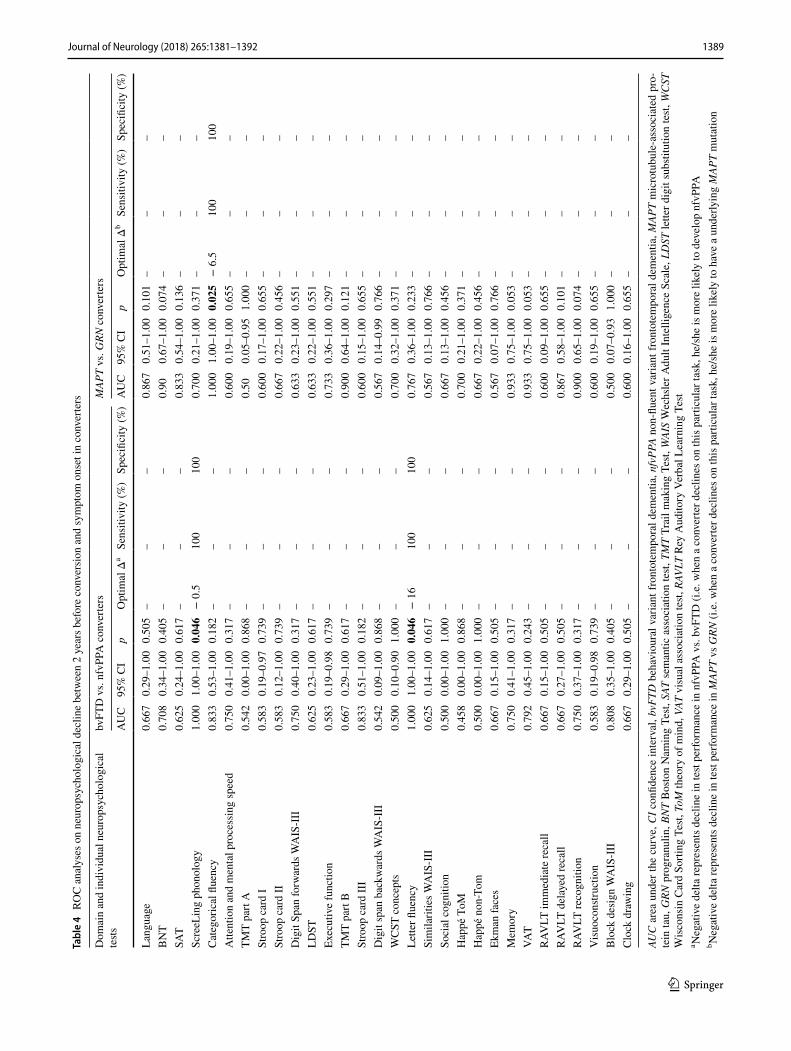
failed to distinguish significantly between converters and non-converters. Between 2 years before symptom onset and symptom onset decline on categorical fluency was predic-tive of an underlying MAPT mutation (p = 0.025; Table 4). Decline on ScreeLing phonology (p = 0.046) and letter flu-ency (p = 0.046) was predictive of conversion to nfvPPA (Table 4).
Discussion
This study examined a large cohort of at-risk participants from GRN and MAPT FTD families by means of neuropsy-chological assessment during a 4-year follow-up. Within the study time window, eight mutation carriers became symp-tomatic. Converters with a MAPT and GRN mutation had mutual as well as gene-specific profiles of cognitive decline.
Table 2 Cognitive trajectories in mutation carriers (converters, non-converters) and healthy controls
Values indicate: mean ± standard deviation; β represents estimate of change over time. Composite domain scores are z-scores, individual test scores are raw scores. Composite domain scores are expressed as z-scores, the individual test scores are raw scores. p values represent compari-sons to healthy controls. Significant comparisons are displayed in boldMAPT microtubule-associated protein tau, GRN progranulin, BNT Boston Naming Test, SAT semantic association test, TMT Trail making Test, WAIS Wechsler Adult Intelligence Scale, LDST letter digit substitution test, WCST Wisconsin card sorting test, ToM theory of mind, VAT visual association test, RAVLT Rey Auditory Verbal Learning Test, imm immediate, del delayeda Remained significant after excluding converters from the analysesb Survived Bonferroni correction for multiple comparisonsc Higher scores and β weights indicate worse performance
Domain test Healthy controls (n = 39) MAPT mutation carriers (n = 15) GRN mutation carriers (n = 31)
Baseline β p Baseline β p Baseline β p
Language 0.0 ± 0.6 0.000 0.931 0.2 ± 0.6 − 0.010 0.002 0.1 ± 0.7 0.004 0.121BNT 53.4 ± 4.5 0.026 0.105 52.6 ± 5.3 − 0.080 0.005 55.1 ± 3.7 0.006 0.786SAT 27.8 ± 1.1 − 0.003 0.604 27.9 ± 1.5 − 0.008 0.604 27.5 ± 2.0 0.019 0.033a
ScreeLing phonology 23.5 ± 0.8 0.001 0.733 23.9 ± 0.3 − 0.005 0.190 23.8 ± 0.5 − 0.001 0.863Categorical fluency 23.9 ± 4.9 0.026 0.141 26.5 ± 6.6 − 0.087 0.006 23.4 ± 5.7 0.021 0.424Attention and processing speed 0.0 ± 0.8 − 0.001 0.084 0.3 ± 0.6 − 0.003 0.096 0.1 ± 0.9 − 0.003 0.075TMT part Ac 31.8 ± 15.0 − 0.022 0.416 26.1 ± 9.7 0.065 0.192 31.4 ± 12.2 0.060 0.145Stroop card Ic 47.1 ± 8.0 0.039 0.011 43.2 ± 8.8 − 0.017 0.529 45.0 ± 8.4 − 0.001 0.951Stroop card IIc 58.5 ± 10.6 0.012 0.539 54.9 ± 8.5 0.027 0.470 60.2 ± 13.2 0.001 0.969Digit Span forwards 8.7 ± 1.9 0.001 0.871 9.0 ± 2.6 − 0.010 0.294 9.4 ± 2.4 − 0.016 0.055LDST 34.5 ± 6.8 0.001 0.894 34.2 ± 4.7 − 0.636 0.699 33.2 ± 7.4 0.005 0.798Executive function 0.0 ± 0.7 0.001 0.505 0.3 ± 0.6 − 0.005 0.065 0.2 ± 0.8 − 0.004 0.052TMT part Bc 67.8 ± 29.3 0.052 0.494 61.0 ± 28.5 0.079 0.570 72.2 ± 42.7 − 0.099 0.390Stroop card IIIc 93.7 ± 22.6 − 0.087 0.021 83.8 ± 14.7 0.141 0.042 96.6 ± 26.2 0.013 0.815Digit span backwards 6.1 ± 2.0 0.008 0.194 6.6 ± 1.8 0.002 0.877 6.6 ± 2.1 − 0.011 0.222WCST concepts 5.5 ± 0.9 0.002 0.592 5.6 ± 1.1 − 0.009 0.296 5.80 ± 0.6 − 0.010 0.144Letter fluency 32.1 ± 9.9 0.134 < 0.001b 36.1 ± 14.3 − 0.108 0.049 38.9 ± 12.0 − 0.062 0.173Similarities 24.8 ± 4.7 0.006 0.645 25.5 ± 4.7 − 0.034 0.122 26.2 ± 5.0 − 0.011 0.556Social cognition 0.0 ± 0.8 0.000 0.878 0.2 ± 0.7 − 0.009 0.007 0.3 ± 0.7 − 0.003 0.332Happé ToM 11.8 ± 3.4 0.013 0.172 12.6 ± 3.7 − 0.044 0.011 12.9 ± 2.9 − 0.005 0.707Happé non-Tom 11.7 ± 2.9 0.020 0.013 12.4 ± 2.8 − 0.036 0.017 13.0 ± 2.6 − 0.012 0.331Ekman faces 45.7 ± 6.4 0.038 0.009 47.0 ± 5.5 − 0.028 0.293 47.10 ± 5.5 − 0.013 0.548Memory 0.0 ± 0.7 0.000 0.848 0.1 ± 1.3 − 0.017 < 0.001b 0.1 ± 0.9 − 0.001 0.745VAT 11.8 ± 0.6 0.001 0.740 11.4 ± 1.6 − 0.012 0.019 11.5 ± 0.9 0.000 0.926RAVLT imm. recall 42.6 ± 9.8 0.157 < 0.001b 47.5 ± 9.7 − 0.076 0.090 46.3 ± 10.6 − 0.015 0.686RAVLT del. recall 8.4 ± 3.2 0.050 < 0.001b 9.7 ± 3.9 − 0.048 < 0.001a,b 9.4 ± 3.3 − 0.000 0.983RAVLT recognition 28.6 ± 2.1 0.014 0.127 29.0 ± 2.0 − 0.022 0.176 29.2 ± 1.2 − 0.009 0.505Visuoconstruction 0.0 ± 0.8 − 0.001 0.656 − 0.2 ± 0.7 − 0.005 0.266 0.0 ± 1.0 0.000 0.963Block design 36.5 ± 14.0 0.034 0.305 35.5 ± 20.8 − 0.006 0.917 39.3 ± 18.5 − 1.164 0.246Clock drawing 12.6 ± 1.4 0.003 0.453 12.2 ± 1.3 − 0.009 0.284 12.4 ± 1.8 0.005 0.475
1387Journal of Neurology (2018) 265:1381–1392
1 3
Cognitive decline on categorical fluency between 2 years before conversion and symptom onset was predictive for an underlying MAPT mutation, and decline on ScreeLing phonology and letter fluency was predictive for conversion to nfvPPA. These results suggest that neuropsychological assessment could provide sensitive clinical biomarkers to identify and track FTD mutation carriers at-risk of convert-ing to the symptomatic stage. These findings hold potential for improving early clinical diagnosis by identifying the most sensitive neuropsychological tests for conversion, and use in upcoming disease-modifying clinical trials.
Following the MAPT mutation carriers over a 4-year period, we found significant decline in language, social cog-nition and memory. This is consistent with findings from previous presymptomatic familial FTD studies, in which both cross-sectional [9–11, 33] and longitudinal [8] decline was found. Specifically, in our first follow-up study [8], we demonstrated decline in the domains language, social cog-nition and memory 5–8 years before estimated symptom onset. It should be taken into account that this study made use of estimated onset as a proxy, instead of actual symp-tom onset as in the present study—but the similar profile of decline confirms the presence of early changes in these three domains. As in our previous study, the present results are largely driven by the converters. This could suggest that
neuropsychological test scores remain static while mutation carriers are presymptomatic, and cognitive decline starts only near or at symptom onset [34–36], suggesting an explo-sive rather than gradual start of the symptomatic disease stage. Alternatively, we might be unable to pick up subtle cognitive changes in presymptomatic mutation carriers due to lack of power. Also, although well-validated, most of our neuropsychological tests were not developed for repeated administration in a preclinical population [37]. We there-fore cannot rule out that familiarity and/or practice effects are obscuring subtle cognitive decline, a notion that seems to be underwritten by improvement in social cognition and memory in controls, but not mutation carriers.
In our exploratory analyses in converters, we discovered both common as well as mutation-specific profiles of cogni-tive decline in MAPT and GRN. In both mutations, decline in attention, mental processing speed and executive function was found—while only converters with a MAPT mutation demonstrated decline on language, memory and social cogni-tion. Previous studies in familial FTD also point to distinct profiles for MAPT and GRN [8, 10–12], and are largely con-sistent with our present findings. Another important aspect is the longitudinal tracking of the different clinical phenotypes. The similar patterns of cognitive decline in bvFTD as MAPT, and nfvPPA as GRN are related to the dominant genotype in
Fig. 2 Multilevel linear regression model displaying longitudi-nal decline (4 years, 2 years and after symptom onset) in composite domain z-score in the total group of converters (light green), MAPT converters (light blue dotted line), GRN converters (dark blue dotted line), non-converters (dark green) and healthy controls (black). Mod-els are displayed per cognitive domain: a social cognition, b atten-
tion and mental processing speed, c executive functioning, d memory, e visuoconstruction, and f language. NB: the healthy controls have a mean z-score of zero by default as the z-scores of mutation carriers were based on that (raw score minus mean score of healthy controls, divided by the standard deviation of healthy controls). MAPT micro-tubule-associated protein tau, GRN progranulin

1388 Journal of Neurology (2018) 265:1381–1392
1 3
Tabl
e 3
Cog
nitiv
e tra
ject
orie
s in
MAP
T, G
RN, b
vFTD
and
nfv
PPA
con
verte
rs, a
nd n
on-c
onve
rters
Valu
es in
dica
te: m
ean ±
stan
dard
dev
iatio
n; β
repr
esen
ts e
stim
ate
of c
hang
e ov
er ti
me.
Com
posi
te d
omai
n sc
ores
are
z-sc
ores
, ind
ivid
ual t
est s
core
s are
raw
scor
es. C
ompo
site
dom
ain
scor
es a
re
expr
esse
d as
z-s
core
s, th
e in
divi
dual
test
scor
es a
re ra
w sc
ores
. p v
alue
s rep
rese
nt c
ompa
rison
s to
non-
conv
erte
rs. S
igni
fican
t com
paris
ons a
re d
ispl
ayed
in b
old
MAP
T m
icro
tubu
le-a
ssoc
iate
d pr
otei
n ta
u, G
RN p
rogr
anul
in, b
vFTD
beh
avio
ural
var
iant
fron
tote
mpo
ral d
emen
tia, n
fvPP
A no
n-flu
ent v
aria
nt p
rimar
y pr
ogre
ssiv
e ap
hasi
a, B
NT
Bos
ton
Nam
ing
Test,
SAT
sem
antic
ass
ocia
tion
test,
TM
T Tr
ail m
akin
g Te
st, W
AIS
Wec
hsle
r Adu
lt In
telli
genc
e Sc
ale,
LD
ST le
tter d
igit,
subs
titut
ion
test,
WC
ST W
isco
nsin
car
d so
rting
test,
ToM
theo
ry o
f min
d,
VAT
visu
al a
ssoc
iatio
n te
st, R
AVLT
Rey
Aud
itory
Ver
bal L
earn
ing
Test,
imm
imm
edia
te, d
el d
elay
eda Su
rviv
ed B
onfe
rron
i cor
rect
ion
for m
ultip
le c
ompa
rison
sb H
ighe
r sco
res a
nd β
wei
ghts
indi
cate
wor
se p
erfo
rman
ce
Dom
ain
test
MAP
T co
nver
ters
(n =
5)G
RN c
onve
rters
(n =
3)bv
FTD
con
verte
rs (n
= 6)
nfvP
PA c
onve
rters
(n =
2)N
on-c
onve
rters
(= 38
)
Bas
elin
eβ
pB
asel
ine
βp
Bas
elin
eβ
pB
asel
ine
βp
Bas
elin
eβ
p
Lang
uage
0.1 ±
0.7
− 0
.028
< 0.001
a0.
6 ± 0.
2−
0.0
070.
299
0.1 ±
0.7
− 0
.025
< 0.001
a0.
6 ± 0.
2−
0.0
140.
061
0.1 ±
0.6
0.00
20.
408
BN
T54
.3 ±
6.9
− 0
.239
< 0.001
a57
.5 ±
2.1
− 0
.019
0.60
454
.3 ±
6.9
− 0
.224
< 0.001
a57
.5 ±
2.1
− 0
.033
0.39
654
.2 ±
4.2
− 0
.001
0.96
0SA
T27
.0 ±
1.4
− 0
.040
0.034
28.0
± 1.
40.
006
0.80
527
.0 ±
1.4
− 0
.036
0.05
228
.0 ±
1.4
0.00
00.
993
27.7
± 2.
00.
013
0.12
7Sc
reeL
ing
phon
olog
y24
.0 ±
0.0
0.00
20.
617
24.0
± 0.
0−
0.0
110.
114
24.0
± 0.
00.
004
0.35
824
.0 ±
0.0
− 0
.017
0.018
23.8
± 0.
4−
0.0
020.
551
Cat
egor
ical
flue
ncy
25.8
± 4.
6−
0.2
50<
0.001
a28
.0 ±
2.8
− 0
.149
0.022
25.8
± 4.
6−
0.2
37<
0.001
a28
.0 ±
2.8
− 0
.170
0.015
24.0
± 6.
30.
014
0.54
6A
ttent
ion
and
men
tal
proc
essi
ng sp
eed
0.3 ±
0.6
− 0
.010
0.006
0.2 ±
0.3
− 0
.013
0.005
0.3 ±
0.6
− 0
.010
0.004
0.2 ±
0.3
− 0
.013
0.006
0.1 ±
0.8
− 0
.001
0.32
1
TMT
part
Ab
20.0
± 6.
30.
067
0.44
825
.0 ±
8.5
0.07
30.
539
20.0
± 6.
30.
065
0.44
925
.0 ±
8.5
0.09
00.
483
31.1
± 11
.80.
051
0.18
1St
roop
car
d Ib
44.0
± 5.
20.
101
0.030
46.5
± 6.
40.
058
0.34
944
.0 ±
5.2
0.10
60.020
46.5
± 6.
40.
044
0.50
344
.4 ±
8.9
− 0
.020
0.34
5St
roop
car
d II
b58
.5 ±
7.6
0.33
1<
0.001
a56
.5 ±
0.7
0.18
60.006
57.5
± 7.
60.
319
< 0.001
a56
.5 ±
0.7
0.19
40.008
58.8
± 12
.9−
0.0
320.
217
Dig
it Sp
an fo
rwar
ds9.
5 ± 1.
70.
010
0.60
99.
0 ± 0.
0−
0.0
380.
146
9.5 ±
1.7
0.01
00.
601
9.0 ±
0.0
− 0
.043
0.11
99.
3 ± 2.
6−
0.0
130.
088
LDST
34.8
± 6.
7−
0.1
000.012
35.0
± 0.
0−
0.0
610.
235
34.8
± 6.
7−
0.0
980.011
35.0
± 0.
0−
0.0
610.
270
33.3
± 6.
90.
004
0.80
9Ex
ecut
ive
func
tion
0.6 ±
0.4
− 0
.018
< 0.001
a0.
6 ± 0.
1−
0.0
32<
0.00
10.
6 ± 0.
4−
0.0
20<
0.001
0.6 ±
0.1
− 0
.029
< 0.001
a0.
2 ± 0.
8−
0.0
010.
515
TMT
part
Bb
57.0
± 27
.00.
472
0.038
48.0
± 32
.51.
448
<0.001a
57.0
± 27
.00.
684
0.006
48.0
± 32
.50.
921
0.010
71.2
± 40
.4−
0.1
320.
195
Stro
op c
ard
IIIb
87.5
± 23
.40.
468
< 0.001
a86
.5 ±
7.8
0.73
4<0.001a
87.5
± 23
.40.
449
< 0.001
a86
.5 ±
7.8
0.81
5<
0.001
a93
.7 ±
24.8
− 0
.026
0.57
7D
igit
span
bac
kwar
ds8.
0 ± 1.
4−
0.0
180.
284
5.5 ±
0.7
− 0
.039
0.08
28.
0 ± 1.
4−
0.0
220.
186
5.5 ±
0.7
− 0
.033
0.17
26.
5 ± 2.
0−
0.0
030.
721
WC
ST c
once
pts
6.0 ±
0.0
− 0
.015
0.19
36.
0 ± 0.
0−
0.0
400.007
6.0 ±
0.0
− 0
.021
0.07
36.
0 ± 0.
0−
0.0
320.035
5.7 ±
0.8
− 0
.006
0.32
3Le
tter fl
uenc
y35
.8 ±
7.9
− 0
.143
0.10
145
.5 ±
17.7
− 0
.328
0.010
35.8
± 7.
9−
0.1
560.
066
45.5
± 17
.7−
0.3
390.013
37.9
± 13
.0−
0.0
480.
245
Sim
ilarit
ies
29.0
± 1.
2−
0.1
51<
0.001
a29
.0 ±
1.4
− 0
.175
<0.001a
29.0
± 1.
2−
0.1
55<
0.001
a29
.0 ±
1.4
− 0
.175
< 0.001
a25
.5 ±
4.0
0.00
40.
775
Soci
al c
ogni
tion
0.0 ±
1.0
− 0
.022
< 0.001
a0.
8 ± 0.
1−
0.0
120.
127
0.0 ±
1.0
− 0
.021
< 0.001
a0.
8 ± 0.
1−
0.0
160.
071
0.3 ±
0.7
− 0
.002
0.33
6H
appé
ToM
12.3
± 5.
1−
0.0
960.002a
13.5
± 2.
10.
017
0.67
212
.3 ±
5.1
− 0
.078
0.012
13.5
± 2.
1−
0.0
190.
669
12.8
± 3.
0−
0.0
120.
380
Hap
pé n
on-T
om12
.3 ±
2.4
− 0
.067
0.010
15.5
± 0.
7−
0.0
410.
215
12.3
± 2.
4−
0.0
600.016
15.5
± 0.
7−
0.0
620.
080
12.8
± 2.
7−
0.0
120.
267
Ekm
an fa
ces
43.5
± 6.
1−
0.0
890.023
50.0
± 0.
0−
0.1
750.001a
43.5
± 6.
1−
0.1
180.003
50.0
± 0.
0−
0.1
270.024
47.3
± 5.
4−
0.0
010.
965
Mem
ory
− 1
.0 ±
2.0
− 0
.050
< 0.001
a0.
7 ± 0.
80.
002
0.75
1−
1.0
± 2.
0−
0.0
44<
0.001
a0.
7 ± 0.
8−
0.0
050.
525
0.2 ±
0.8
− 0
.002
0.47
3VA
T10
.0 ±
2.4
− 0
.030
0.005
12.0
± 0.
00.
004
0.67
510
.0 ±
2.4
− 0
.027
0.011
12.0
± 0.
00.
000
0.98
311
.6 ±
0.8
− 0
.002
0.70
5R
AVLT
imm
. rec
all
42.5
± 9.
1−
0.2
410.001a
54.5
± 19
.1−
0.1
110.
226
42.5
± 9.
1−
0.2
100.003
54.5
± 19
.1−
0.1
770.
067
46.7
± 10
.0−
0.0
090.
797
RAV
LT d
el. r
ecal
l7.
5 ± 5.
5−
0.0
85<
0.001
a10
.5 ±
5.0
0.00
20.
951
7.5 ±
5.5
− 0
.080
< 0.001
a10
.5 ±
5.0
− 0
.002
0.95
49.
7 ± 3.
2−
0.0
090.
359
RAV
LT re
cogn
ition
27.3
± 3.
1−
0.0
370.005
30.0
± 0.
0−
0.0
140.
266
27.3
± 3.
1−
0.0
360.004
30.0
± 0.
0−
0.0
140.
308
29.3
± 1.
1−
0.0
090.
461
Vis
uoco
nstru
ctio
n0.
2 ± 0.
8−
0.0
090.
217
0.2 ±
0.2
− 0
.010
0.31
20.
2 ± 0.
8−
0.0
080.
250
0.2 ±
0.2
− 0
.013
0.23
7−
0.1
± 1.
00.
000
0.89
5B
lock
des
ign
51.0
± 27
.1−
0.2
220.
064
32.0
± 1.
4−
0.1
480.
333
51.0
± 27
.1−
0.2
350.042
32.0
± 1.
4−
0.1
090.
503
37.1
± 18
.5−
0.0
060.
898
Clo
ck d
raw
ing
11.8
± 2.
1−
0.0
020.
876
13.5
± 0.
7−
0.0
140.
459
11.8
± 2.
1−
0.0
010.
966
13.5
± 0.
7−
0.0
230.
281
12.3
± 1.
60.
001
0.88
8
1389Journal of Neurology (2018) 265:1381–1392
1 3
Tabl
e 4
RO
C a
naly
ses o
n ne
urop
sych
olog
ical
dec
line
betw
een
2 ye
ars b
efor
e co
nver
sion
and
sym
ptom
ons
et in
con
verte
rs
AUC
are
a un
der t
he c
urve
, CI c
onfid
ence
inte
rval
, bvF
TD b
ehav
iour
al v
aria
nt fr
onto
tem
pora
l dem
entia
, nfv
PPA
non-
fluen
t var
iant
fron
tote
mpo
ral d
emen
tia, M
APT
mic
rotu
bule
-ass
ocia
ted
pro-
tein
tau,
GRN
pro
gran
ulin
, BN
T B
osto
n N
amin
g Te
st, S
AT s
eman
tic a
ssoc
iatio
n te
st, T
MT
Trai
l mak
ing
Test,
WAI
S W
echs
ler A
dult
Inte
llige
nce
Scal
e, L
DST
lette
r dig
it su
bstit
utio
n te
st, W
CST
W
isco
nsin
Car
d So
rting
Tes
t, To
M th
eory
of m
ind,
VAT
vis
ual a
ssoc
iatio
n te
st, R
AVLT
Rey
Aud
itory
Ver
bal L
earn
ing
Test
a Neg
ativ
e de
lta re
pres
ents
dec
line
in te
st pe
rform
ance
in n
fvPP
A v
s. bv
FTD
(i.e
. whe
n a
conv
erte
r dec
lines
on
this
par
ticul
ar ta
sk, h
e/sh
e is
mor
e lik
ely
to d
evel
op n
fvPP
Ab N
egat
ive
delta
repr
esen
ts d
eclin
e in
test
perfo
rman
ce in
MAP
T vs
GRN
(i.e
. whe
n a
conv
erte
r dec
lines
on
this
par
ticul
ar ta
sk, h
e/sh
e is
mor
e lik
ely
to h
ave
a un
derly
ing
MAP
T m
utat
ion
Dom
ain
and
indi
vidu
al n
euro
psyc
holo
gica
l te
stsbv
FTD
vs.
nfvP
PA c
onve
rters
MAP
T vs
. GRN
con
verte
rs
AU
C
95%
CI
pO
ptim
al Δ
aSe
nsiti
vity
(%)
Spec
ifici
ty (%
)A
UC
95
% C
Ip
Opt
imal
Δb
Sens
itivi
ty (%
)Sp
ecifi
city
(%)
Lang
uage
0.66
70.
29–1
.00
0.50
5–
––
0.86
70.
51–1
.00
0.10
1–
––
BN
T0.
708
0.34
–1.0
00.
405
––
–0.
900.
67–1
.00
0.07
4–
––
SAT
0.62
50.
24–1
.00
0.61
7–
––
0.83
30.
54–1
.00
0.13
6–
––
Scre
eLin
g ph
onol
ogy
1.00
01.
00–1
.00
0.046
− 0
.510
010
00.
700
0.21
–1.0
00.
371
––
–C
ateg
oric
al fl
uenc
y0.
833
0.53
–1.0
00.
182
––
–1.
000
1.00
–1.0
00.025
− 6
.510
010
0A
ttent
ion
and
men
tal p
roce
ssin
g sp
eed
0.75
00.
41–1
.00
0.31
7–
––
0.60
00.
19–1
.00
0.65
5–
––
TMT
part
A0.
542
0.00
–1.0
00.
868
––
–0.
500.
05–0
.95
1.00
0–
––
Stro
op c
ard
I0.
583
0.19
–0.9
70.
739
––
–0.
600
0.17
–1.0
00.
655
––
–St
roop
car
d II
0.58
30.
12–1
.00
0.73
9–
––
0.66
70.
22–1
.00
0.45
6–
––
Dig
it Sp
an fo
rwar
ds W
AIS
-III
0.75
00.
40–1
.00
0.31
7–
––
0.63
30.
23–1
.00
0.55
1–
––
LDST
0.62
50.
23–1
.00
0.61
7–
––
0.63
30.
22–1
.00
0.55
1–
––
Exec
utiv
e fu
nctio
n0.
583
0.19
–0.9
80.
739
––
–0.
733
0.36
–1.0
00.
297
––
–TM
T pa
rt B
0.66
70.
29–1
.00
0.61
7–
––
0.90
00.
64–1
.00
0.12
1–
––
Stro
op c
ard
III
0.83
30.
51–1
.00
0.18
2–
––
0.60
00.
15–1
.00
0.65
5–
––
Dig
it sp
an b
ackw
ards
WA
IS-I
II0.
542
0.09
–1.0
00.
868
––
–0.
567
0.14
–0.9
90.
766
––
–W
CST
con
cept
s0.
500
0.10
–0.9
01.
000
––
–0.
700
0.32
–1.0
00.
371
––
–Le
tter fl
uenc
y1.
000
1.00
–1.0
00.046
− 1
610
010
00.
767
0.36
–1.0
00.
233
––
–Si
mila
ritie
s WA
IS-I
II0.
625
0.14
–1.0
00.
617
––
–0.
567
0.13
–1.0
00.
766
––
–So
cial
cog
nitio
n0.
500
0.00
–1.0
01.
000
––
–0.
667
0.13
–1.0
00.
456
––
–H
appé
ToM
0.45
80.
00–1
.00
0.86
8–
––
0.70
00.
21–1
.00
0.37
1–
––
Hap
pé n
on-T
om0.
500
0.00
–1.0
01.
000
––
–0.
667
0.22
–1.0
00.
456
––
–Ek
man
face
s0.
667
0.15
–1.0
00.
505
––
–0.
567
0.07
–1.0
00.
766
––
–M
emor
y0.
750
0.41
–1.0
00.
317
––
–0.
933
0.75
–1.0
00.
053
––
–VA
T0.
792
0.45
–1.0
00.
243
––
–0.
933
0.75
–1.0
00.
053
––
–R
AVLT
imm
edia
te re
call
0.66
70.
15–1
.00
0.50
5–
––
0.60
00.
09–1
.00
0.65
5–
––
RAV
LT d
elay
ed re
call
0.66
70.
27–1
.00
0.50
5–
––
0.86
70.
58–1
.00
0.10
1–
––
RAV
LT re
cogn
ition
0.75
00.
37–1
.00
0.31
7–
––
0.90
00.
65–1
.00
0.07
4–
––
Vis
uoco
nstru
ctio
n0.
583
0.19
–0.9
80.
739
––
–0.
600
0.19
–1.0
00.
655
––
–B
lock
des
ign
WA
IS-I
II0.
808
0.35
–1.0
00.
405
––
–0.
500
0.07
–0.9
31.
000
––
–C
lock
dra
win
g0.
667
0.29
–1.0
00.
505
––
–0.
600
0.16
–1.0
00.
655
––
–
1390 Journal of Neurology (2018) 265:1381–1392
1 3
each group (e.g. all nfvPPA converters have a GRN muta-tion). These findings suggest that neuropsychological assess-ment can be used to track the different mutations and phe-notypes from the presymptomatic to the symptomatic stage, which is advantageous considering the need for good clinical endpoints in future disease-modifying trials.
Extending the findings from our first follow-up study [8], we demonstrated significant decline on the RAVLT recall in presymptomatic MAPT mutation carriers. The additional finding that lower memory scores over time were also found in MAPT, and not GRN converters—suggesting a mutation-specific aetiology—corroborate this. Although memory loss has been described in GRN [38, 39], this is usually a later symptom, while episodic memory impairment has been found as the presenting and most prominent symptom in MAPT [7, 40, 41]. Interest-ingly, the Genetic Frontotemporal dementia Initiative (GENFI) consortium revealed hippocampal atrophy in presymptomatic MAPT from 15 years before estimated symptom onset [10], and as this medial temporal structure is critical for episodic memory processing [42] this offers a good explanation for our findings. In line with earlier studies [42, 43], we did find deficits in verbal recall but not visual associative memory. Semantically loaded tasks such as the RAVLT can be particularly more difficult than visual memory tasks like the VAT, as a result of the prominent semantic impairments seen early in MAPT-associated FTD [44]. Our results contribute to the present thinking that memory defi-cits can be an integral part of the clinical spectrum [42], and comprehensive memory tasks should therefore be incorporated in the standard diagnostic work-up.
Knowing the cognitive profile of decline indicative for con-version is important to get more insight into the timing of clini-cal changes in the earliest disease stage. We found that conver-sion can be predicted based on cognitive decline in the 2 years prior to symptom onset, but not earlier. As the cognitive decline was part of the diagnostic process of determining conversion, this is not a surprising finding. However, it does suggest a more explosive disease development with cognitive decline acceler-ating rapidly in proximity of symptom onset, which is in line with evidence from a large familial Alzheimer’s disease cohort [45]. By selectively choosing tests within the domains that have prognostic abilities, the neuropsychological battery can be shortened, which would benefit patient burden and helps cutting healthcare expenses. Especially fluency tasks seem to be promising candidates, as they were able to distinguish accu-rately between future phenotype and underlying genotype. The latter is essential for patient stratification in future clinical trials targeting specific pathologies, and ideally these interventions should be applied in the presymptomatic stage [46]. Reliable phenotypic prediction furthermore optimizes the diagnostic process by shortening the current diagnostic delay [47], and is helpful for the patient, caregiver and clinician in knowing what disease presentation and course to expect. Verbal fluency tests are widely used in dementia diagnosis setting [48], and
are affected in both presymptomatic [8, 11] and symptomatic FTD [49, 50]. Future research could additionally investigate the use of qualitative assessment of verbal fluency (e.g. clustering, switching between clusters), as recent research [49] points to differences between FTD and PPA subtypes—making this a promising application of verbal fluency for a precise clinical differentiation in presymptomatic and early stage FTD.
Key strengths of our study constitute our longitudinal design, spanning a 4-year follow-up of at-risk participants from both MAPT and GRN families. Although our group of converters is currently small, this is the first study tracking FTD mutation carriers from the presymptomatic to symptomatic disease stage. Being aware of the caveats of small sample sizes and administering a large amount of neuropsychological tests with respect to statistical power, our results warrant replication in our cohort as well as larger interna-tional cohorts such as GENFI [10], in which with the passing of time more mutation carriers will approach symptom onset and/or convert to clinical FTD. The dropout rate is very low, creating balanced datasets across the three time points. Additionally, use of multilevel linear modeling further handles efficiently with miss-ing data. Directions for future research entail the development of neuropsychological tasks more suited to administer in the presymp-tomatic phase (robust to ceiling effects) and repeated administra-tion (robust to practice and able to measure small changes). More extensive quantification tools of behavioural functioning are also needed to capture the entire clinical spectrum of (presymptomatic) FTD, as well as assessment methods that rely less on the accuracy of informant report [37]. A disadvantage of the study is the fact that the neuropsychological assessment was part of the clinical assess-ment with which we determined conversion to the symptomatic stage. This has likely led to a circular reasoning, as we demonstrated that converters declined over time, while cognitive decline was con-sidered a prerequisite for conversion. Ideally, the tests assessed in our study should not have been used in the diagnosis of conver-sion. However, in our multidisciplinary meeting, we followed the international consensus criteria for bvFTD [3] and PPA [6], using all available clinical information—e.g. MR imaging of the brain, anamnestic and heteroanamnestic information, behavioural and neuropsychiatric questionnaires, unblinding of genetic status—so that symptom onset did not solely depend on the neuropsychologi-cal assessment. Furthermore, as the multilevel model assumes a linear relationship between genetic status and cognitive decline over time, we could have missed non-linear effects over time. Lastly, the analyses on the non-converters and controls were performed using the original baseline and follow-up visits, regardless of, e.g. age and time to estimated symptom onset. It is possible that these analyses therefore lost some sensitivity to detect cognitive decline over time. However, as between-group analyses on age and estimated years to symptom onset in converters, non-converters, and controls did not show significant differences (respectively, p = 0.99 and p = 0.19), we believe this effect is minimal.
Our study investigates longitudinal neuropsychological per-formance in a large cohort of at-risk individuals from genetic

1391Journal of Neurology (2018) 265:1381–1392
1 3
FTD families. We provide evidence of mutation-specific cog-nitive decline when moving from the presymptomatic into symptomatic stage, and of neuropsychological trajectories predicting symptom onset. These results suggest the potential biomarker value of neuropsychological assessment in both disease-monitoring and predicting conversion to clinical FTD.
Acknowledgements We would like to thank all the participants and their families for taking part in our study. This work was supported by Dioraphte Foundation Grant 09-02-03-00, the Association for Fronto-temporal Dementias Research Grant 2009, Alzheimer Nederland and Memorabel ZonMw Grant 733050102 (Deltaplan Dementie).
Author contributions LCJ contributed to the conception and design of the study, acquired and analysed data, and drafted the manuscript, figures and tables. JLP acquired data. LvA acquired and analysed data. SF acquired data. LHM acquired data and contributed to the design of the figures. LDK acquired data. ELvdE acquired data. EGPD con-tributed to the conception of the study and acquired data. RT contrib-uted to the design of the study and data analysis. RvM is the genetic guardian of the study. JvS contributed to the conception and design of the study and is PI of the project. EvdB contributed to the design and data interpretation of the study. JMP contributed to the design of the study, and drafting the manuscript, figures and tables. All authors were involved in copyediting and approval of the final draft of the manuscript.
Compliance with ethical standards
Conflicts of interest LCJ, JLP, LvA, LHM, LDK, ELvdE, EGPD, RT, RvM, JvS, EvdB, JMP report no conflicts of interest.
Ethical standard All procedures performed in studies involving human participants were in accordance with the ethical standards of the insti-tutional and national research committee, and with the 1964 Helsinki declaration and its later amendments or comparable ethical standards.
Informed consent Informed consent was obtained from all individual participants included in the study.
Open Access This article is distributed under the terms of the Crea-tive Commons Attribution 4.0 International License (http://creat iveco mmons .org/licen ses/by/4.0/), which permits unrestricted use, distribu-tion, and reproduction in any medium, provided you give appropriate credit to the original author(s) and the source, provide a link to the Creative Commons license, and indicate if changes were made.
References
1. Snowden JS, Pickering-Brown SM, Mackenzie IR et al (2006) Pro-granulin gene mutations associated with frontotemporal dementia and progressive non-fluent aphasia. Brain 129:3091–3102
2. Warren JD, Rohrer JD, Rossor MN (2013) Clinical review. Fron-totemporal dementia. BMJ 347:f4827
3. Rascovsky K, Hodges JR, Knopman D et al (2011) Sensitivity of revised diagnostic criteria for the behavioural variant of fronto-temporal dementia. Brain 134:2456–2477
4. Seelaar H, Rohrer JD, Pijnenburg Y et al (2011) Clinical, genetic and pathological heterogeneity of frontotemporal dementia: a review. J Neurol Neurosurg Psychiatry 82:476–486
5. Adenzato M, Cavallo M, Enrici I (2010) Theory of mind ability in the behavioural variant of frontotemporal dementia: an analysis of the neural, cognitive, and social levels. Neuropsychologia 48:2–12
6. Gorno-Tempini ML, Hillis AE, Weintraub S et al (2011) Classifi-cation of primary progressive aphasia and its variants. Neurology 76(11):1006–1014
7. Rohrer JD, Warren JD (2011) Phenotypic signatures of genetic frontotemporal dementia. Curr Opin Neurol 24(6):542–549
8. Jiskoot LC, Dopper EGP, den Heijer T et al (2016) Presympto-matic cognitive decline in familial frontotemporal dementia: a longitudinal study. Neurology 87:384–391
9. Dopper EG, Rombouts SA, Jiskoot LC et al (2014) Structural and functional brain connectivity in presymptomatic familial fronto-temporal dementia. Neurology 83:e19–e26
10. Rohrer JD, Nicholas JM, Cash DM et al (2015) Presymptomatic cognitive and neuroanatomical changes in genetic frontotemporal dementia in the genetic frontotemporal dementia initiative (GENFI) study: a cross-sectional analysis. Lancet Neurol 14:253–262
11. Geschwind DH, Robidoux J, Alarcón M et al (2001) Dementia and neurodevelopmental predisposition: cognitive dysfunction in presymptomatic subjects precedes dementia by decades in fron-totemporal dementia. Ann Neurol 50:741–746
12. Hallam BJ, Jacova C, Hsiung GYR et al (2014) Early neuropsy-chological characteristics of progranulin mutation carriers. J Int Neuropsychol Soc 20:694–703
13. Dopper EG, Chalos V, Ghariq E et al (2016) Cerebral blood flow in presymptomatic MAPT and GRN mutation carriers: a longitu-dinal arterial spin labeling study. Neuroimage Clin 12:460–465
14. Kaufer DI, Cummings JL, Ketchel P et al (2000) Validation of the NPI-Q, a brief clinical form of the neuropsychatric inventory. J Neuropsychiatry Clin Neurosci 12(2):233–239
15. Folstein MF, Folstein SE, McHugh PR (1975) “Mini-mental state”. A practical method for grading the cognitive state of patients for the clinician. J Psychiatr Res 12(3):189–198
16. Dubois B, Slachevsky A, Litvan I, Pillon B (2000) The FAB: a frontal assessment battery at bedside. Neurology 55(11):1621–1626
17. Kaplan E, Goodglass H, Weintraub S (1978) The Boston Naming Test. Lea & Febiger, Philadelphia
18. Visch-Brink E, Stronks D, Denes G (2005) Semantische Associa-tie test. Swets & Zeitlinger, Lisse
19. Doesborgh SJ, van de Sandt-Koenderman WM, Dippel DW et al (2003) Linguistic deficits in the acute phase of stroke. J Neurol 250(8):977–982
20. Thurstone LLT, Thurstone TG (1962) Primary mental abilities. Science Research Associates, Chicago
21. Battery Army Individual Test (1994) Manual of directions and scor-ing. War Department, Adjutant General’s office, Washington, DC
22. Stroop JR (1935) Studies of interference in serial verbal reactions. J Exp Psychol 18:643–662
23. Wechsler D (2005) WAIS-III nederlandse bewerking, technische handleiding. Harcourt Test Publishers, Lisse
24. Jolles J, Houx PJ, van Boxtel MPJ, Ponds RWHM (1995) Maas-tricht aging study: determinants of cognitive aging. Neuropsych Publishers, Maastricht
25. Nelson HE (1976) A modified card sorting test sensitive to frontal lobe defects. Cortex 12:313–324
26. Happe F, Brownell H, Winner E (1999) Acquired ‘theory of mind’ impairments following stroke. Cognition 70(3):211–240
27. Ekman P, Friesen WV (1976) Pictures of facial affect. Consulting Psychologists Press, Palo Alto
28. Rey A (1958) L’examen clinique en psychologie. Presses Univer-sitaires de France, Paris
29. Lindeboom J, Schmand B, Tulner L et al (2002) Visual associa-tion test to detect early dementia of the Alzheimer type. J Neurol Neurosurg Psychiatry 73(2):126–133

1392 Journal of Neurology (2018) 265:1381–1392
1 3
Affiliations
Lize C. Jiskoot1,2 · Jessica L. Panman1,2 · Lauren van Asseldonk1 · Sanne Franzen1 · Lieke H. H. Meeter1 · Laura Donker Kaat1,3 · Emma L. van der Ende1 · Elise G. P. Dopper1 · Reinier Timman4 · Rick van Minkelen5 · John C. van Swieten1,6 · Esther van den Berg1 · Janne M. Papma1
Lize C. Jiskoot [email protected]
Jessica L. Panman [email protected]
Lauren van Asseldonk [email protected]
Sanne Franzen [email protected]
Lieke H. H. Meeter [email protected]
Laura Donker Kaat [email protected]
Emma L. van der Ende [email protected]
Elise G. P. Dopper [email protected]
Reinier Timman [email protected]
Rick van Minkelen [email protected]
John C. van Swieten [email protected]
Esther van den Berg [email protected]
1 Department of Neurology, Erasmus Medical Center Rotterdam, Room Ee2240, ’s-Gravendijkwal 230, 3015 CE Rotterdam, The Netherlands
2 Department of Radiology, Leiden University Medical Center, Leiden, The Netherlands
3 Department of Clinical Genetics, Leiden University Medical Center, Leiden, The Netherlands
4 Department of Psychiatry, Section of Medical Psychology and Psychotherapy, Erasmus Medical Center, Rotterdam, The Netherlands
5 Department of Clinical Genetics, Erasmus Medical Center, Rotterdam, The Netherlands
6 Department of Clinical Genetics, VU Medical Center, Amsterdam, The Netherlands
30. Royall DR, Cordes JA, Polk M (1998) CLOX: an executive clock drawing task. J Neurol Neurosurg Psychiatry 64:588–594
31. Beck AT, Ward CH, Mendelson M, Mock J, Erbaugh J (1961) An inventory for measuring depression. Arch Gen Psychiatry 4:561–571
32. Youden WJ (1950) Index for rating diagnostic tests. Cancer 3:32–35 33. Barandiaran M, Estanga A, Moreno F et al (2012) Neuropsycho-
logical features of asymptomatic c.709-1G > A progranulin muta-tion carriers. JINS 18:1086–1090
34. Janssen JC, Schott JM, Cipolotti L et al (2005) Mapping the onset and progression of atrophy in familial frontotemporal lobar degen-eration. JNNP 76(2):162–168
35. Rohrer JD, Warren JD, Barnes J et al (2008) Mapping the progres-sion of progranulin-associated frontotemporal lobar degeneration. Nat Clin Pract Neurol 4(8):455–460
36. Ferman TJ, McRae CA, Arvanitakis Z et al (2003) Early and pre-symptomatic neuropsychological dysfunction in the PPND family with the N279K tau mutation. Parkinsonism Relat Disord 9(5):265–270
37. Miller JB, Banks SJ, Léger GC, Cummings JL (2014) Randomized controlled trials in frontotemporal dementia: cognitive and behav-ioral outcomes. Transl Neurodegener 3:12
38. Whitwell JL, Jack CR, Boeve BF et al (2009) Voxel-based mor-phometry patterns of atrophy in FTLD with mutations in MAPT or PGRN. Neurology 72:813–820
39. Rohrer JD, Ridgway GR, Modat M et al (2010) Distinct profiles of brain atrophy in frontotemporal lobar degeneration caused by progranulin and tau mutations. Neuroimage 53:1070–1076
40. Smith R, Puschmann A, Schöll M et al (2017) 18F-AV-1451 tau PET imaging correlates strongly with tau neuropathology in MAPT mutation carriers. Brain 139(9):2372–2379
41. Tolboom N, Koedam ELGE, Schott JM et al (2010) Dementia mimicking Alzheimer’s disease owing to a tau mutation: CSF and PET findings. Alzheimers Dis Assoc Disord 24:303–307
42. Hornberger M, Piguet O (2012) Episodic memory in frontotem-poral dementia: a critical review. Brain 135:678–692
43. Spina S, Schonhaut D, Boeve BF et al (2017) Frontotempo-ral dementia with the V337M MAPT mutation. Neurology 88(8):758–766
44. Snowden JS, Adams J, Harris J et al (2015) Distinct clinical and pathological phenotypes in frontotemporal dementia associated with MAPT, PGRN and C9orf72 mutations. Amyotroph Lateral Scler Frontotemp Degener 16:497–505
45. Hassenstab J, Aschenbrenner AJ, Balota DA et al (2016) Cog-nitive trajectories in DIAN: relationships with symptom onset, mutation types and clinical status. Alzheimers Dement 12(7):368
46. Meeter LH, Donker Kaat L, Rohrer JD, van Swieten JC (2017) Imaging and fluid biomarkers in frontotemporal dementia. Nat Rev Neurol 13(7):406–419
47. Rosness TA, Engedal K, Chemali Z (2016) Frontotemporal dementia: an updated clinician’s guide. J Geriatr Psychiatry 29(5):271–280
48. Pakhomov SVS, Hemmy LS (2014) A computational linguistic measure of clustering behavior on semantic verbal fluency task predicts risk of future dementia in the Nun study. Cortex 55:97–106
49. van den Berg E, Jiskoot LC, Grosveld MJH et al (2017) Qualita-tive assessment of verbal fluency performance in frontotemporal dementia. Dement Geriatr Cogn Disord 44:35–44
50. Laisney M, Matuszewski V, Mézenge F et al (2009) The under-lying mechanisms of verbal fluency deficit in frontotemporal dementia and semantic dementia. J Neurol 256:1083
Related Documents


![[XLS] · Web viewMice "preconditioned" with latrepirdine show a delayed symptom onset and a significant increase in life span. (1 μg/kg, intraperitoneal ).[3] Fruquintinib (HMPL-013)](https://static.cupdf.com/doc/110x72/5ac161e67f8b9a5a4e8d12a0/xls-viewmice-preconditioned-with-latrepirdine-show-a-delayed-symptom-onset-and.jpg)