HAL Id: tel-03510327 https://tel.archives-ouvertes.fr/tel-03510327v2 Submitted on 6 Jan 2022 HAL is a multi-disciplinary open access archive for the deposit and dissemination of sci- entific research documents, whether they are pub- lished or not. The documents may come from teaching and research institutions in France or abroad, or from public or private research centers. L’archive ouverte pluridisciplinaire HAL, est destinée au dépôt et à la diffusion de documents scientifiques de niveau recherche, publiés ou non, émanant des établissements d’enseignement et de recherche français ou étrangers, des laboratoires publics ou privés. Longitudinal analysis of brain networks by magnetic resonance imaging (MRI) in a murine model of neuropathic pain-induced depression Meltem Karatas To cite this version: Meltem Karatas. Longitudinal analysis of brain networks by magnetic resonance imaging (MRI) in a murine model of neuropathic pain-induced depression. Neurons and Cognition [q-bio.NC]. Université de Strasbourg; Albert-Ludwigs-Universität (Freiburg im Breisgau, Allemagne), 2019. English. NNT : 2019STRAJ045. tel-03510327v2

Welcome message from author
This document is posted to help you gain knowledge. Please leave a comment to let me know what you think about it! Share it to your friends and learn new things together.
Transcript
HAL Id: tel-03510327https://tel.archives-ouvertes.fr/tel-03510327v2
Submitted on 6 Jan 2022
HAL is a multi-disciplinary open accessarchive for the deposit and dissemination of sci-entific research documents, whether they are pub-lished or not. The documents may come fromteaching and research institutions in France orabroad, or from public or private research centers.
L’archive ouverte pluridisciplinaire HAL, estdestinée au dépôt et à la diffusion de documentsscientifiques de niveau recherche, publiés ou non,émanant des établissements d’enseignement et derecherche français ou étrangers, des laboratoirespublics ou privés.
Longitudinal analysis of brain networks by magneticresonance imaging (MRI) in a murine model of
neuropathic pain-induced depressionMeltem Karatas
To cite this version:Meltem Karatas. Longitudinal analysis of brain networks by magnetic resonance imaging (MRI) in amurine model of neuropathic pain-induced depression. Neurons and Cognition [q-bio.NC]. Universitéde Strasbourg; Albert-Ludwigs-Universität (Freiburg im Breisgau, Allemagne), 2019. English. �NNT :2019STRAJ045�. �tel-03510327v2�
UNIVERSITÉ DE STRASBOURG
ÉCOLE DOCTORALE DES SCIENCES DE LA VIE ET DE LA SANTÉ
UPR 3212
THÈSE
présentée par :
Meltem KARATAŞ Soutenue le 05 septembre 2019
pour obtenir le grade de : Docteur de l’Université de Strasbourg
Discipline/ Spécialité : Neurosciences
Analyse longitudinale des réseaux cérébraux par Imagerie de Résonance Magnétique (IRM) dans un modèle murin de
dépression induite par la douleur neuropathique
---
Longitudinal analysis of brain networks by magnetic resonance imaging (MRI) in a murine model of neuropathic pain-induced
depression
THÈSE dirigée par :
Mme I. YALCIN Chargée de Recherche, CNRS UPR 3212, Strasbourg Mme I. DIESTER Professeur, Albert Ludwig University of Freiburg
ENCADRANTE : Mme LA. HARSAN MCU-PH, ICube UMR 7357, Strasbourg
RAPPORTEURS : Mme E. TZAVARA Directeur de Recherche, INSERM UMR 8246, Paris M C. FABER Professeur, University of Münster, Münster
AUTRES MEMBRES DU JURY : M J. FOUCHER MCU-PH, ICube UMR 7357, Strasbourg M D. von ELVERFELDT PD, Albert Ludwig University of Freiburg M. W. WEBER-FAHR Directeur de Recherche, University of Heidelberg, Mannheim


Acknowledgements
First and foremost, I would like to thank my lovely supervisors İpek Yalçın and Laura Harsan. They were the nicest and kindest supervisors I could wish to have, and great academics. They supported and encouraged me, with a healthy dose of reprimanding if I was being particularly pessimistic. They always welcomed discussions and allowed me to express my opinions without fear of criticism. My PhD journey was rocky from the start, ending in unexpected hardships but they helped me every step of the way. When it came to worst, they treated me as if I were family, rather than a student. I’ll be eternally grateful to them.
I would like to thank my thesis directors Ilka Diester and Jürgen Hennig at Freiburg University for taking the trouble of accepting me as their student; I also thank my team leaders Dominik von Elverfeldt in Freiburg and Jean-Paul Armspach in Strasbourg.
My special thanks go to Laetitia, with whom I spent hours on end at the scanner (‘the batcave’), bursting into giggles at the end of the day from exhaustion, or really from too much isoflurane. We experienced the same difficulties, whether about a piece of code not working- ‘Ça marche pas!’ - or washing cages and getting wet all over. Thank you for all your help, understanding and great gossip. Thanks are in order for Eléna and Coralie, for your kindness and great friendship. I also thank Marion and Alix for welcoming the newbie to their office, helping in any way they could. Thanks to all members of our Stift club, Mary, Manon, Fabrice, Henrique and whomever I’m forgetting at the moment, it was a wonderful tradition. I thank all the people I had the privilege of collaborating- or rather pestering them for an analysis or code- Vincent Noblet, Céline Meillier, Julien Lamy, Lionel Landre, Dan Roquet and Argeesh Bhanot from ICube; Muris Humo from INCI and Taufiq Nasseef from Montreal. Thank you, Aude, Blandine and Cristina for all your help and compassion.
I would also like to thank Bahar, my free-spirited and extremely loyal friend; Han, an excellent person I met too late; Ewa, my partner in having fun complaining; Şehrazat and Müzeyyen- the Turkish team of emotional support for homesickness and Salma, the fun, warm and wise friend, all of whom made my life during the PhD much more colorful.
On Freiburg side, I would like to express my gratitude to Neele and Anna for being wonderful colleagues and friends. I wish we had more time working together but we made up for it in Hawaii. Thank you again for including me in your plans and thank you for your companionship. Thank you, Annette, it was so lovely to have those conversations every lunchtime with you and Neele, I really miss it. Thank you so much for all your help and support. Thanks to Tanzil, Thiago, Thomas, Katherina and Jochen for your assistance and friendship.
I have to extend my gratitude to my close friends Gülsüm, Duygu and Ayşegül for being always there for me to share all the joys and sorrows. Even though we had a continent between us and hardly saw each other once a year, I never felt we were in any way distant. Thank you so much for being in my life and showing unconditional love and support. I should also thank our little Defne for giving us constant amusement- however unintentionally. Ezgi, my professed ‘sister’, I thank you for the great conversations on anything and everything, and mutual commiserations on our neuroticism.

Last but not least, I would like to thank the members of my family, my parents and older brother, for all their love, care, and support. I’m incredibly lucky to have them. I should give my special thanks to my mother (I’ll have to translate for her). Until last year, I didn’t appreciate just how strong and resilient she was. In a strange place where she didn’t speak the language or had any acquaintances, she took on the burden of caring for me, forgoing her own worries to give me strength. She managed everything admirably. Thank you so much!
Publications
Published articles
1. Karatas, M., Noblet, V., Nasseef, M.T., Bienert, T., Reisert, M., Hennig, J., Yalcin, I., Kieffer, B.L., Elverfeldt, D. von, Harsan, L.-A., 2019. Mapping the living mouse brain neural architecture: strain specific patterns of brain structural and functional connectivity. bioRxiv 730366. https://doi.org/10.1101/730366 2. Grandjean, J., Canella, C., Anckaerts, C., Ayrancı, G., Bougacha, S., Bienert, T., Buehlmann, D., Coletta, L., Gallino, D., Gass, N., Garin, C.M., Nadkarni, N.A., Hübner, N., Karatas, M., Komaki, Y., Kreitz, S., Mandino, F., Mechling, A.E., Sato, C., Sauer, K., Shah, D., Strobelt, S., Takata, N., Wank, I., Wu, T., Yahata, N., Yeow, L.Y., Yee, Y., Aoki, I., Chakravarty, M.M., Chang, W.-T., Dhenain, M., Elverfeldt, D. von, Harsan, L.-A., Hess, A., Jiang, T., Keliris, G.A., Lerch, J.P., Okano, H., Rudin, M., Sartorius, A., Linden, A.V. der, Verhoye, M., Weber-Fahr, W., Wenderoth, N., Zerbi, V., Gozzi, A., 2019. Common functional networks in the mouse brain revealed by multi-centre resting-state fMRI analysis. bioRxiv 541060. https://doi.org/10.1101/541060 (In publication for NeuroImage)
3. Nguyen, T.L., Duchon, A., Manousopoulou, A., Loaëc, N., Villiers, B., Pani, G., Karatas, M., Mechling, A.E., Harsan, L.-A., Limanton, E., Bazureau, J.-P., Carreaux, F., Garbis, S.D., Meijer, L., Herault, Y., 2018. Correction of cognitive deficits in mouse models of Down syndrome by a pharmacological inhibitor of DYRK1A. Disease Models & Mechanisms dmm.035634. https://doi.org/10.1242/dmm.035634
4. Sellmeijer, J., Mathis, V., Hugel, S., Li, X.-H., Song, Q., Chen, Q.-Y., Barthas, F., Lutz, P.-E., Karatas, M., Luthi, A., Veinante, P., Aertsen, A., Barrot, M., Zhuo, M., Yalcin, I., 2018. Hyperactivity of Anterior Cingulate Cortex Areas 24a/24b Drives Chronic Pain-Induced Anxiodepressive-like Consequences. J. Neurosci. 38, 3102–3115. https://doi.org/10.1523/JNEUROSCI.3195-17.2018
5. Barthas, F., Humo, M., Gilsbach, R., Waltisperger, E., Karatas, M., Leman, S., Hein, L., Belzung, C., Boutillier, A.-L., Barrot, M., Yalcin, I., 2017. Cingulate Overexpression of Mitogen-Activated Protein Kinase Phosphatase-1 as Key Factor for Depression. Biological Psychiatry. https://doi.org/10.1016/j.biopsych.2017.01.019
In preparation
1. Time-dependent alterations in structural and functional brain networks in rodent neuropathic pain-induced depression.
2. Differential Effects of Anesthetics on Mouse Brain Connectivity and Function as Probed by Resting-State FMRI and [18] FDG-PET.
Oral Presentations
1. Brain functional connectivity signatures of neuropathic pain-induced depression in a preclinical model. Sixième Journées Scientifiques de la Fédération de Médicine Translationnelle de Strasbourg (FMTS) – 27 April 2018
2. Analysis of Brain Networks in Murine Models of Depression with Different Imaging Modalities. NeuroTime Annual Meeting, 7 April 2017, Amsterdam, Netherlands
3. Mapping with MRI the functional and structural brain networks in the mouse: strain dependent signatures. NeuroTime Annual Meeting, February 2016, Strasbourg
4. Brain networks in stress- and pain- induced depression: insight into the structural and functional mechanisms in the anterior cingulate cortex. NeuroTime Annual Meeting, January 2015, Basel, Switzerland
Poster presentations
1. Meltem Karatas, Muris Humo, Laetitia Degiorgis, Marion Sourty, Thomas Bienert, Céline Meillier, Jean-Paul Armspach, Dominik von Elverfeldt, Ipek Yalcin, and Laura-Adela Harsan. Brain functional connectivity signatures of neuropathic pain-induced depression in a preclinical model. Joint Annual Meeting ISMRM-ESMRMB, June 2018, Paris, FRANCE. Proc. Intl. Soc. Mag. Reson. Med. 26 (2018) Abstract number: 2341
2. Laetitia Degiorgis, Meltem Karatas, Marion Sourty, Thomas Bienert, Marco Reisert, Chantal Mathis, Anne-Laurence Boutillier, Frédéric Blanc, Jean-Paul Armspach, and Laura-Adela Harsan. Longitudinal alterations of resting-state functional connectivity in Alzheimer’s disease in a tauopathy mouse model. Joint Annual Meeting ISMRM-ESMRMB, June 2018, Paris, FRANCE. Proc. Intl. Soc. Mag. Reson. Med. 26 (2018) Abstract number: 1214
3. Meltem Karatas, Laetitia Degiorgis, Marion Sourty, Daniel Roquet, Lionel Thomas, Patrice Marchand, Thomas Bienert, Lee Hsu-Lei, Julien Lamy, Chrystelle Po, Frédéric Boisson, David Brasse, Dominik von Elverfeldt, Izzie Jacques Namer, Jean-Paul Armspach, Ipek Yalcin, and Laura-Adela Harsan. Differential Effects of Anesthetics on Mouse Brain Connectivity and Function as Probed by Resting-State FMRI and [18] FDG-PET. ISMRM Annual Meeting, April 2017, Honolulu, Hawai’i, USA. Proc. Intl. Soc. Mag. Reson. Med. 25 (2017) Abstract number: 1678
4. Laura-Adela Harsan, Meltem Karatas, Thu Lan NGUYEN, Anna Mechling, Tanzil Arefin, Thomas Bienert, Hsu-Lei Lee, Dominik von Elverfeldt, and Yann Herault. Mapping and modulation of Down Syndrome specific functional network in Dp(16)1yey mouse model. ISMRM Annual Meeting, April 2017, Honolulu, Hawai’i, USA. Proc. Intl. Soc. Mag. Reson. Med. 25 (2017) Abstract number: 4086
5. Laetitia Degiorgis, Meltem Karatas, Marion Sourty, Chrystelle Po, Thomas Bienert, Hsu Lei Lee, Dominik von Elverfeldt, Chantal Mathis, Anne-Laurence Boutillier, Frédéric Blanc, Jean-Paul Armspach, and Laura-Adela Harsan. Patterns of resting-state functional connectivity in the prodromal phase of Alzheimer’s disease: insights from a tauopathy mouse model (Thy-Tau22). ISMRM Annual Meeting, April 2017, Honolulu, Hawai’i, USA. Proc. Intl. Soc. Mag. Reson. Med. 25 (2017) Abstract number: 4082
Table of Contents
Acknowledgements ................................................................................................................... II
Publications .............................................................................................................................. IV
Table of Figures ........................................................................................................................ IX
Tables ........................................................................................................................................ XII
List of Abbreviations .............................................................................................................. XIII
Summary ................................................................................................................................ XVI
Résumé en français .............................................................................................................. XIX
Preface ................................................................................................................................... XXII
Avant-propos ....................................................................................................................... XXIII
1 Introduction ......................................................................................................................... 1
1.1 Functional and Structural Connectivity via Magnetic Resonance Imaging ................. 1
1.1.1 Resting-state fMRI ................................................................................................. 1
1.1.2 Diffusion MRI and fiber tracking ............................................................................ 8
1.1.3 Mouse brain connectome .................................................................................... 15
1.2 Neuropathic pain ......................................................................................................... 20
1.2.1 Definition and Pathophysiology .......................................................................... 20
1.2.2 Magnetic resonance imaging of pain and chronic pain conditions .................... 25
1.2.3 Affective consequences of chronic pain ............................................................. 32
2 Hypothesis and Objectives ............................................................................................. 46
3 Results ............................................................................................................................... 47
3.1 Mapping the living mouse brain neural architecture: strain specific patterns of brain
structural and functional connectivity. ................................................................................... 47
3.1.1 Introduction .......................................................................................................... 48
3.1.2 Materials and Methods ........................................................................................ 50
3.1.3 Results ................................................................................................................. 55
3.1.4 Discussion ........................................................................................................... 69
3.1.5 Conclusion ........................................................................................................... 73
3.2 Time-dependent alterations in structural and functional brain networks in rodent
neuropathic pain-induced depression ................................................................................... 74
3.2.1 Introduction .......................................................................................................... 74
3.2.2 Material and Methods .......................................................................................... 76
3.2.3 Results ................................................................................................................. 80
3.2.4 Discussion ........................................................................................................... 92
3.2.5 Conclusion ........................................................................................................... 97
4 General Discussion .......................................................................................................... 98
4.1 Comparison of strains C57BL/6N and BALB/cJ ........................................................ 99
4.1.1 Structural connectivity ......................................................................................... 99
4.1.2 Functional connectivity ........................................................................................ 99
4.2 Brain connectivity signatures of neuropathic pain-induced depression in mice ..... 101
4.2.1 Structural connectivity ....................................................................................... 101
4.2.2 Functional connectivity ...................................................................................... 102
4.3 Conclusion ................................................................................................................ 103
5 Perspectives .................................................................................................................... 104
6 References ....................................................................................................................... 105
7 Annex ............................................................................................................................... 124
7.1 Published Manuscripts ............................................................................................. 124
Table of Figures
Figure 1-1 Schematic drawing of the BOLD response due to variations in the timing of
responses of the physiological variables CBF, CBV, and CMRO2. ........................................... 2
Figure 1-2 Anticorrelated networks in the human brain. ............................................................ 5
Figure 1-3 Simple schema of resting-state fMRI seed analysis and resulting resting-state
functional connectivity maps. ...................................................................................................... 6
Figure 1-4 Certain metrics of network topology.......................................................................... 7
Figure 1-5 Water diffusion and tissue structure.......................................................................... 8
Figure 1-6 The relationship between the water motion and gradient applications. ................... 9
Figure 1-7 The diffusion ellipsoids and tensors for isotropic unrestricted diffusion, isotropic
restricted diffusion, and anisotropic restricted diffusion. .......................................................... 10
Figure 1-8 Parametric diffusion tensor maps of a mouse brain in coronal sections. .............. 11
Figure 1-9 High resolution global fiber tracking map from a coronal section of the mouse brain.
................................................................................................................................................... 12
Figure 1-10 Different white matter pathologies associated multiple tensor representation and
DTI simplification. ...................................................................................................................... 13
Figure 1-11 Averaging of diffusion anisotropy in a large imaging voxel in DTI. ...................... 14
Figure 1-12 Resting-state networks (RSNs) of mouse and human brain. ............................... 16
Figure 1-13 The peripheral and central changes induced by nerve injury or peripheral
neuropathy. ................................................................................................................................ 24
Figure 1-14 Graphical depiction of the ‘pain matrix’ of the human brain. ................................ 26
Figure 1-15 Simplified schema of reward-mediating and aversion-mediating pathways in
rodents. ...................................................................................................................................... 33
Figure 1-16 Schema illustrating the connections of the VS. .................................................... 34
Figure 1-17 Schematic illustration of a. the organization and b. the connections of the midbrain
dopamine cells. .......................................................................................................................... 35
Figure 1-18 Summary of the input and output circuitry of the LHb. ......................................... 37
Figure 1-19 Medial prefrontal regions in human and mouse. .................................................. 39
Figure 3-1 Living mouse brain connectional anatomy in BALB/cJ and C57BL/6N mouse brains.
................................................................................................................................................... 55
Figure 3-2 Group-specific fiber density (FD) maps reveal structural strain differences. ......... 57
Figure 3-3 Fractional anisotropy (FA) maps reveal differences between strains. ................... 58
Figure 3-4 Inter-group statistical comparison for deformation-based morphometry (DBM). .. 59
Figure 3-5 Functional connectivity matrices and related graph theoretical measures for
C57BL/6N and BALB/cJ mice. .................................................................................................. 61
Figure 3-6 Inter-group differences in somatosensory cortex functional connectivity for
C57BL/6N and BALB/cJ. ........................................................................................................... 63
Figure 3-7 Inter-group differences in motor cortex functional connectivity for C57BL/6N and
BALB/cJ. .................................................................................................................................... 64
Figure 3-8 Default mode network (DMN)-like patterns in C57BL/6N and BALB/cJ. ............... 65
Figure 3-9 Inter-group statistical comparison of seed-based connectivity maps for nucleus
accumbens and hippocampus. ................................................................................................. 67
Figure 3-10 Directional connectivity between reward/aversion centers. ................................. 68
Figure 3-11 Experimental timeline. ........................................................................................... 77
Figure 3-12 Nerve injury induces mechanical hypersensitivity and depressive-like behavior.80
Figure 3-13 Fractional anisotropy (FA) differences between groups at 2 weeks (TP1) and 8
weeks (TP2) after peripheral nerve injury. ................................................................................ 81
Figure 3-14 Graph theoretical analysis for functional connectivity matrices. .......................... 83
Figure 3-15 Inter-group differences in anterior cingulate area (ACA) functional connectivity at
TP1 and TP2.............................................................................................................................. 84
Figure 3-16 Inter-group differences in ventral tegmental area (VTA) functional connectivity at
TP1 and TP2.............................................................................................................................. 85
Figure 3-17 3D reconstruction of inter-group statistical differences in longitudinal evolution of
VTA functional connectivity from T1 to T2. ............................................................................... 85
Figure 3-18 Inter-group differences in lateral habenula (LHb) functional connectivity at TP1 and
TP2............................................................................................................................................. 86
Figure 3-19 Inter-group differences in the nucleus accumbens (ACB), dorsal hippocampus
(dHIP), agranular insula (AI), and periaqueductal gray (PAG) functional connectivity at TP1 and
TP2............................................................................................................................................. 88
Figure 3-20 Group-differences in the evolution of the FC patterns from TP1 to TP2 for anterior
cingulate (ACA), retrosplenial area (RSP), agranular insula (AI) and periaqueductal gray
(PAG). ........................................................................................................................................ 90
Figure 3-21 Group-differences in the evolution of the FC patterns for nucleus accumbens
(ACB), ventral tegmental area (VTA), lateral habenula (LHb) and two main hippocampal
divisions (dorsal and ventral hippocampus (dHIP and vHIP, respectively) from TP1 to TP2. 91

Tables
Table 1-1 Summary of anesthetics and their effects used commonly in rodent rs-fMRI studies.
................................................................................................................................................... 18
Table 1-2 Preclinical imaging studies in rodent chronic pain models. ..................................... 29
Table 1-3 Commonly used behavioral tests for anxiety and depression related phenotypes. 42
Table 1-4 Selected studies on the affective consequences of neuropathic pain. ................... 43
Table 1-5 Preclinical imaging studies in rodent depression models. ....................................... 44
List of Abbreviations
l Microliter
18F-FDG, 18FDG 18F-fluorodeoxyglucose
5-HT 5-hydroxytryptamine; serotonin
AAA-CEA-MEA Anterior/Central /Medial Amygdala
ACB, NAc Nucleus accumbens
ACC, ACA Anterior cingulate cortex/area
ACh Acetylcholine
AD Axial diffusivity
ADC Apparent diffusion coefficient
AI Agranular insula
AIC Akaike information criterion
ALFF Amplitude of low frequency fluctuations
AMBA Allen Mouse Brain Atlas
AMPA α-amino-3-hydroxy-5-methyl-4-isoxazolepropionic acid receptor
AMY Amygdala
ANTs Advanced Normalization Tools
AP Action potential
ASD Autism spectrum disorders
ATP Adenosine triphosphate
AUD Auditory area
BDNF Brain-derived neurotrophic factor
BG Basal ganglia
BNST, BST Bed nucleus of stria terminalis
BOLD Blood oxygen level-dependent signal
BST, BNST Bed Nucleus of Stria Terminalis
CA Cornu ammonis, Ammon’s horn
CBF Cerebral blood flow
CBP Chronic back pain
CBV Cerebral blood volume
CC Clustering coefficient
cc Corpus callosum
CCI Chronic constriction injury
CeA Central amygdala
ChR2 Channelrhodopsin-2
CLA Claustrum
cLH Congenital learned helplessness
CMRO2 Cerebral metabolic rate of oxygen
CNS Central nervous system
COA-PAA-TR Cortical/Piriform Amygdala- Postpiriform Transition Area
cp Cerebral peduncle
CPL Characteristic path length
CPP Conditioned place preference
CPS Chronic psychosocial stress
CPu, CP Caudate-putamen
CRPS Complex regional pain syndrome
CUMS Chronic unpredictable mild stress
D Diffusion coefficient
D1, DR1 Dopamine receptor-1
D2, DR2 Dopamine receptor-2
DA Dopamine
dACC Dorsal anterior cingulate area
DBM Deformation-based morphometry
DCA Directional connectivity analysis
DG Dentate gyrus
dHIP/dhc Dorsal hippocampus
DKI Diffusion kurtosis imaging
dlPFC Dorsolateral prefrontal cortex
DMN Default-mode network
dPFC Dorsal prefrontal cortex
DRN Dorsal raphe nucleus
DSM-V Diagnostic and statistical manual of mental disorders-5th edition
DTI Diffusion tensor imaging
ECT Ectorhinal Area
EEG Electroencephalography
EFP Electrical field potential
ENT Entorhinal area
EP Endopiriform Nucleus
EPSP Excitatory post-synaptic potential
fa Anterior forceps
FA Fractional anisotropy
FC Functional connectivity
FD Fiber density
FDR False discovery rate
FMR1 Fragile X Mental Retardation gene
FMR1-KO Fragile X Mental Retardation gene
fMRI Functional Magnetic Resonance Imaging
FOV Field of view
fr Fasciculus retroflexus
FRP Frontal Pole
FWER Family-wise error correction
FWHM Full width at half maximum

GABA Gamma-aminobutyric acid
gcc Genu of corpus callosum
GCM Group comparison matrix
GE Gradient echo
GE-EPI Gradient echo-echo planar imaging
GM Gray matter
GU Gustatory Area
Hb Habenula
HIP Hippocampus
HR-MRI High resolution MRI
hrFM High resolution fiber mapping
HY Hypothalamus
IBS Irritable bowel syndrome
ICA Independent component analysis
IL Infralimbic area
IPSP Inhibitory post-synaptic potential
LA-BLA-BMA-PA Lateral/ Basolateral/Basomedial/Posterior Amygdala
LFP Local field potential
LH Learned helplessness
LHb Lateral habenula
LSX-MSC-TRS Lateral/Medial Septal Complex- Triangular Nucleus of Septum
LTD Long-term depression
LTP Long-term potentiation
LV Lateral ventricle
MBq Megabecquerel, unit of radioactivity
Mbsat Behavioral State Related Midbrain
MCC Mid-cingulate cortex
mcc Middle corpus callosum
MD1 Medial dorsal nucleus
MD2 Mean diffusivity
MD3Medetomidine
MDD Major depressive disorder
MEG Magnetoencephalography
MEMRI Manganese-enhanced MRI
MFB, mfb Medial forebrain bundle
MH-LH Medial/Lateral Habenula
MK Mean kurtosis
MKP-1 Mitogen-activated protein kinase phosphatase-1
MnCl2 Manganese chloride
MO Motor area
MOp Primary Motor Area
MOs Secondary Motor Area
mPFC Medial prefrontal cortex
MRI Magnetic resonance imaging
MRN Midbrain reticular nuclei
mRNA Messenger ribonucleic acid
MRS Magnetic resonance spectroscopy
MSN Medium spiny neurons
MUA Multiunit spiking activity
MVGC Multivariate Granger Causality toolbox
NAc, ACB Nucleus accumbens
NC Negative cognitive state
NMDA N-methyl-D-aspartate receptor
NP Neuropathic pain
OA Osteoarthritis
OFC Orbitofrontal cortex
ORB Orbital area
PAG Periaqueductal gray
PALd Dorsal Pallidum
PALv Ventral Pallidum
PAR-POST-PRE-SUB Para/ Post/Pre-Subiculum- Subiculum
PCA Principal component analysis
PCC Posterior cingulate cortex
PE Prediction error signal
PERI Perirhinal Area
PET Positron emission tomography
PF Parafascicular nucleus
PFC Prefrontal cortex
PIR Piriform area
PL Prelimbic area
PPT Pedunculopontine nucleus
PRN Pontine reticular nuclei
PSNL Partial sciatic nerve ligation
PTLp Posterior parietal association areas
RARE Rapid acquisition with refocused echoes
rCBV Regional cerebral blood volume
RD Radial diffusivity
RMTg Rostromedial tegmental area
ROI Region of interest
rs-fMRI Resting state functional magnetic resonance imaging
RSN Resting state network
RSP Retrosplenial area
RVM Rostral ventromedial medulla
SC Superior colliculus
sc, s.c. Subcutaneous
scc Splenium of corpus callosum
SCI Spinal cord injury
SEM Standard error of the mean
sgACC Subgenual anterior cingulate area
SI Substantia innominata
SMA Supplementary motor area
SN1 Salience network
SN2 Substantia nigra
SNc Substantia nigra pars compacta
SNI Spared nerve injury
SNL Spinal nerve ligation
SNr Substantia nigra pars reticulata
SPL Shortest path length
SPM Statistical Parametric Mapping
spO2 Peripheral oxygen saturation
SS Somatosensory area
STN Subthalamic nucleus
SyN Symmetric normalization algorithm
T Tesla, unit of magnetic induction
tcp Thalamo-cortical pathways
TE Echo time
TeA Temporal association areas
TH Thalamus
TMD Temporo-mandibular disorder
TPN Task-positive network
TR Repetition time
VBM Voxel-based morphometry
VBQ Voxel-based quantification
vHIP Ventral hippocampus
VIS Visual area
VISC Visceral area
VM Ventromedial nucleus
vmPFC Ventromedial prefrontal cortex
VP Ventral pallidum
VPL Ventral posterolateral nucleus
VS Ventral striatum
VTA Ventral tegmental area
WM White matter
ZI Zona incerta

Summary
Introduction:
Neuropathic pain occurs as a result of an injury or disease affecting the somatosensory system, it is characterized by prolonged allodynia and hyperalgesia as well as spontaneous pain (Colloca et al., 2017). As of 2018, 6 to 8% of the European population suffers from neuropathic pain. Many patients with chronic pain also develop anxiety and/or depressive disorders, leading to a prevalence of around 50% for major depressive disorder (MDD) comorbidity with chronic pain conditions (Attal et al., 2011). Despite considerable clinical research, the mechanisms underlying this comorbidity remain largely unknown.
Recent studies in the field of neuroimaging have shown that neurological/ neuropsychiatric disorders influence the brain structural and functional networks, and thus, the way different brain areas communicate with each other (Fornito and Bullmore, 2010). Indeed, the study of the brain as an integrative system provides unique insights into large-scale neuronal communication. Study of brain networks and metabolism in preclinical settings is a crucial step for translational research.
In this context, we conducted a non-invasive brain imaging study to investigate changes in structural and functional connectivity in a mouse model of neuropathic pain-induced depression. We aimed to provide a fine-grained mapping of brain network architecture and the evolution of brain functional and structural connectivity in a longitudinal manner. This would allow us to understand the underlying mechanisms of pain-induced depression and develop novel diagnostic approaches and therapeutic strategies.
To achieve our goals, we used two methods of magnetic resonance imaging (MRI), currently the only non-invasive imaging technology that is capable of reconstructing the overall architecture of functional communication pathways (using resting state functional MRI- rs-fMRI) as well as their microstructural substrates (diffusion MRI).
Rs-fMRI is a method based on the analysis of spontaneous low frequency fluctuations (less than 0.1 Hz) of the BOLD (Blood Oxygen Level-Dependent) signal at rest (Biswal et al., 1995). It is now accepted that the synchronization of these fluctuations between distinct brain regions reflects a functional connectivity between them (Lee et al., 2013; Rosazza and Minati, 2011; van den Heuvel and Hulshoff Pol, 2010). On the other hand, diffusion MRI explores structures on a microscopic scale by mapping the displacements of water molecules in the context of the physical diffusion process (Le Bihan and Breton, 1985). It provides unique clues about the neural tissue microstructure and the changes associated with various physiological and pathological states. Since the diffusion directions reflect the underlying organization of white matter axons, diffusion MRI can also be used to map axonal fibers in the brain in vivo and non-invasively (Le Bihan, 2014, 2003).
Objectives:
Based on the published data and preliminary results, my thesis project serves two main objectives: 1) to compare C57BL/ 6 and BALB/c strains in order to find the most suitable strain for the study of depression; 2) to characterize brain functional and structural connectivity in chronic pain and depression comorbidity.
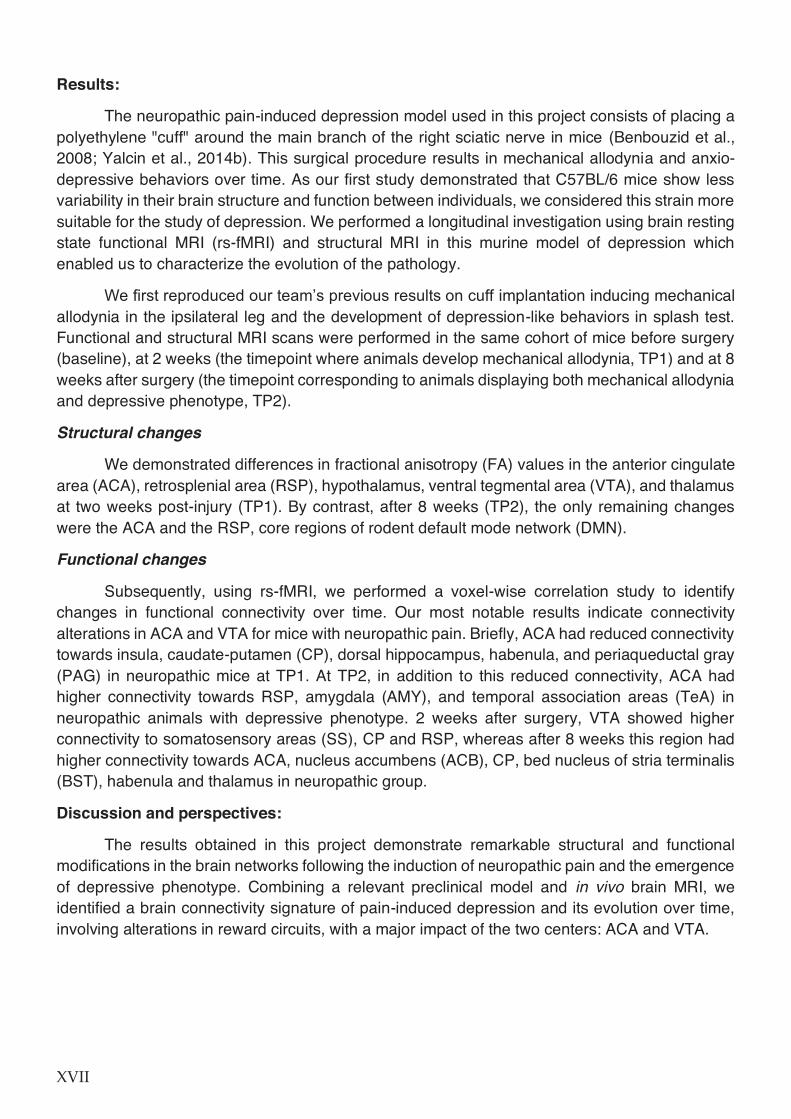
Results:
The neuropathic pain-induced depression model used in this project consists of placing a polyethylene "cuff" around the main branch of the right sciatic nerve in mice (Benbouzid et al., 2008; Yalcin et al., 2014b). This surgical procedure results in mechanical allodynia and anxio-depressive behaviors over time. As our first study demonstrated that C57BL/6 mice show less variability in their brain structure and function between individuals, we considered this strain more suitable for the study of depression. We performed a longitudinal investigation using brain resting state functional MRI (rs-fMRI) and structural MRI in this murine model of depression which enabled us to characterize the evolution of the pathology.
We first reproduced our team’s previous results on cuff implantation inducing mechanical allodynia in the ipsilateral leg and the development of depression-like behaviors in splash test. Functional and structural MRI scans were performed in the same cohort of mice before surgery (baseline), at 2 weeks (the timepoint where animals develop mechanical allodynia, TP1) and at 8 weeks after surgery (the timepoint corresponding to animals displaying both mechanical allodynia and depressive phenotype, TP2).
Structural changes
We demonstrated differences in fractional anisotropy (FA) values in the anterior cingulate area (ACA), retrosplenial area (RSP), hypothalamus, ventral tegmental area (VTA), and thalamus at two weeks post-injury (TP1). By contrast, after 8 weeks (TP2), the only remaining changes were the ACA and the RSP, core regions of rodent default mode network (DMN).
Functional changes
Subsequently, using rs-fMRI, we performed a voxel-wise correlation study to identify changes in functional connectivity over time. Our most notable results indicate connectivity alterations in ACA and VTA for mice with neuropathic pain. Briefly, ACA had reduced connectivity towards insula, caudate-putamen (CP), dorsal hippocampus, habenula, and periaqueductal gray (PAG) in neuropathic mice at TP1. At TP2, in addition to this reduced connectivity, ACA had higher connectivity towards RSP, amygdala (AMY), and temporal association areas (TeA) in neuropathic animals with depressive phenotype. 2 weeks after surgery, VTA showed higher connectivity to somatosensory areas (SS), CP and RSP, whereas after 8 weeks this region had higher connectivity towards ACA, nucleus accumbens (ACB), CP, bed nucleus of stria terminalis (BST), habenula and thalamus in neuropathic group.
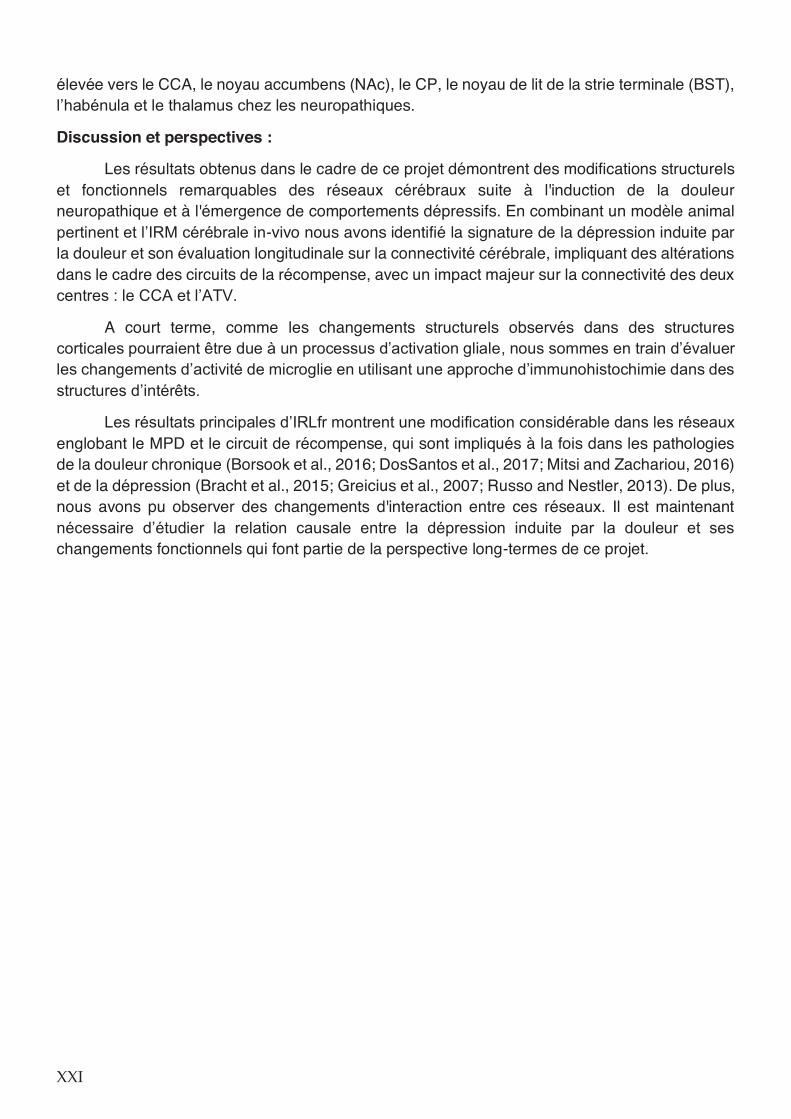
Discussion and perspectives:
The results obtained in this project demonstrate remarkable structural and functional modifications in the brain networks following the induction of neuropathic pain and the emergence of depressive phenotype. Combining a relevant preclinical model and in vivo brain MRI, we identified a brain connectivity signature of pain-induced depression and its evolution over time, involving alterations in reward circuits, with a major impact of the two centers: ACA and VTA.
The brain structural changes observed at 2 weeks post-surgery may be due to a glial activation process which subsides over time. Therefore, in the short-term, we are evaluating the changes in microglial activity using an immunohistochemistry approach, examining pertinent regions of interest.
The main results of functional imaging reveal considerable changes in the networks encompassing the reward circuit and DMN, which are known to be involved in both chronic pain pathologies (Borsook et al., 2016; DosSantos et al., 2017; Mitsi and Zachariou, 2016) and major depression (Bracht et al., 2015; Greicius et al., 2007; Russo and Nestler, 2013). Furthermore, we observed alterations in the interaction of these networks. The long-term perspective of this project is to investigate the causal relationship between pain and depression, reaching a mechanistic explanation for the comorbidity.
Résumé en français
Introduction :
Les douleurs neuropathiques, qui surviennent à la suite d’une lésion ou d’une maladie affectant le système somatosensoriel, sont caractérisées par une allodynie et une hyperalgésie prolongée ainsi que par des douleurs spontanées (Colloca et al., 2017). En 2018, 6 à 8 % de la population européenne est atteinte de douleur neuropathique. De nombreux patients douloureux chroniques développent également des troubles de l'anxiété ou/et des états dépressifs, conduisant à une prévalence d'environ 50% de trouble dépressif majeur (Attal, et al. 2011). Malgré la recherche clinique considérable, les mécanismes sous-jacents à cette comorbidité restent largement inconnus.
Les études récentes dans le domaine de la neuroimagerie ont montré que les troubles neurologiques/neuropsychiatriques influencent l'architecture structurale et fonctionnelle du réseau cérébral et, par conséquent, la façon dont différentes zones du cerveau communiquent entre elles (Fornito et Bullmore, 2010). En effet, l'étude du cerveau en tant que système intégratif fournit des informations uniques sur la communication neuronale à grande échelle. Étudier les réseaux et le métabolisme cérébral représente une étape cruciale pour la recherche translationnelle.
Dans ce contexte, nous avons mené une étude d’imagerie non-invasive - par Imagerie de Résonance Magnétique (IRM) du cerveau - pour étudier des changements dans la connectivité structurale et fonctionnelle dans un modèle murin de dépression induite par la douleur neuropathique. L'objectif principal de ce travail était de fournir une cartographie du réseau cérébral et de l'évolution de la connectivité fonctionnelle et structurelle du cerveau d'une manière longitudinale qui nous permettra d’une part de comprendre les mécanismes sous-jacents de la dépression induite par la douleur, d’autre part, de développer des nouvelles approches diagnostiques et des stratégies thérapeutiques.
Pour atteindre nos objectifs, nous avons utilisé deux méthodes d’imagerie par résonance magnétique (IRM), actuellement la seule technologie d’imagerie non invasive permettant de reconstruire l’architecture globale des voies fonctionnelles de communication (en utilisant l’imagerie fonctionnelle de repos- IRMfr) ainsi que leur substrat microstructural (imagerie du tenseur de diffusion – DTI et la tractographie des fibres).
L’IRMfr est une méthode basée sur l’analyse des fluctuations spontanées de basses fréquences (inférieures à 0,1 Hz) du signal BOLD (Blood Oxygen Level-Dependent) à l’état de repos (Biswal et al., 1995). Il est aujourd'hui admis que la synchronisation de ces fluctuations entre des régions cérébrales distinctes reflète une connexion fonctionnelle entre elles (Lee et al., 2013; Rosazza and Minati, 2011; van den Heuvel and Hulshoff Pol, 2010). D'autre part, l'IRM de diffusion permet d’étudier les structures à l'échelle microscopique en cartographiant les déplacements des molécules d'eau dans le cadre du processus de diffusion physique (Le Bihan and Breton, 1985). Il fournit des indices uniques sur l'architecture fine des tissus neuraux et sur les changements associés à divers états physiologiques et pathologiques. Comme la direction de diffusion reflète l'organisation sous-jacente des axones de la substance blanche, l'IRM de diffusion peut également être utilisée pour cartographier les fibres dans le cerveau de manière in vivo et non invasive (Le Bihan, 2014, 2003).
Objectifs :
Sur la base des données publiés et des résultats préliminaires, mon projet de thèse s’articule autour de deux objectifs principaux : 1) comparer les souches C57BL/6 et BALB/c afin de trouver la ligne plus adapter pour les études de la dépression ; 2) caractériser les changements fonctionnelles et structurelles du cerveau dans la comorbidité douleur chronique et la dépression.
Résultats :
Le modèle d’animaux que nous avons utilisé pour induire la dépression consiste en poser un manchon de polyéthylène « cuff » autour de la branche principale du nerf sciatique (Benbouzid et al., 2008 ; Yalcin et al., 2014b). Cette procédure de chirurgie entraîne une allodynie mécanique et des comportements de type dépressifs au cours du temps. Comme notre première étude a démontré que les souris C57BL/6 sont plus adaptées pour étudier la dépression, nous avons utilisé celle-ci pour le reste de l’étude. En utilisant ce modèle, nous avons réalisé un suivi longitudinal par IRM fonctionnelle de repos et IRM structurelle du cerveau qui nous a permis de caractériser l’évolution de la pathologie.
Nous avons d’abord reproduit les résultats de l’équipe en démontrant que l’implantation du cuff induit l’allodynie mécanique dans la patte ipsilateral et le comportement de type dépressive mis en évidence avec le test de toilettage provoquée (splash test). Ensuite, des IRM fonctionnelle/structurelle ont été réalisée chez les mêmes animaux avant la chirurgie, à 2 semaines (le point temporal correspondant aux animaux montrant seulement l’allodynie mécanique) et à 8 semaines après la chirurgie (le point temporal correspondant aux animaux montrant à la fois l’allodynie mécanique et le phénotype dépressif).
Changements structurels
Nous avons démontré des différences de valeurs du facteur d’anisotropie tissulaire (FA) dans le cortex cingulaire antérieurs (CCA), le cortex rétrosplénial (RSP), de l’hypothalamus, de l’aire tegmentale ventrale (ATV) et du thalamus à deux semaines post-chirurgical. Par contre, à 8 semaines, ces changements restent détectables seulement dans le CCA et le RSP, les structures qui sont fortement impliquées dans le réseau du mode par défaut (MPD) chez le rongeur.
Changements fonctionnels
Par la suite, en utilisant l’IRMfr, nous avons réalisé une étude de corrélation « voxel-wise » pour identifier les changements de connectivité au cours du temps.
Brièvement, nos résultats ont montré que le CCA a une connectivité réduite vers l’insula, le caudé-putamen (CP), l’hippocampe dorsale, l’habénula et la substance grise périaqueducale (PAG) chez les souris neuropathiques. À huit semaines, en plus de cette connectivité réduite, le CCA présentait une connectivité plus élevée vers le RSP, l’amygdale (AMY), et les aires associatives temporales (TEa) chez les animaux neuropathiques présentant le phénotype dépressif. En outre, 2 semaines après la chirurgie, l’ATV (une des régions clés du réseau de la récompense et aversion – « reward-aversion ») montrait une connectivité élevée vers les aires somatosensorielles (SS), le CP et le RSP alors qu’à 8 semaines, il avait une connectivité plus
élevée vers le CCA, le noyau accumbens (NAc), le CP, le noyau de lit de la strie terminale (BST), l’habénula et le thalamus chez les neuropathiques.
Discussion et perspectives :
Les résultats obtenus dans le cadre de ce projet démontrent des modifications structurels et fonctionnels remarquables des réseaux cérébraux suite à l'induction de la douleur neuropathique et à l'émergence de comportements dépressifs. En combinant un modèle animal pertinent et l’IRM cérébrale in-vivo nous avons identifié la signature de la dépression induite par la douleur et son évaluation longitudinale sur la connectivité cérébrale, impliquant des altérations dans le cadre des circuits de la récompense, avec un impact majeur sur la connectivité des deux centres : le CCA et l’ATV.
A court terme, comme les changements structurels observés dans des structures corticales pourraient être due à un processus d’activation gliale, nous sommes en train d’évaluer les changements d’activité de microglie en utilisant une approche d’immunohistochimie dans des structures d’intérêts.
Les résultats principales d’IRLfr montrent une modification considérable dans les réseaux englobant le MPD et le circuit de récompense, qui sont impliqués à la fois dans les pathologies de la douleur chronique (Borsook et al., 2016; DosSantos et al., 2017; Mitsi and Zachariou, 2016) et de la dépression (Bracht et al., 2015; Greicius et al., 2007; Russo and Nestler, 2013). De plus, nous avons pu observer des changements d'interaction entre ces réseaux. Il est maintenant nécessaire d’étudier la relation causale entre la dépression induite par la douleur et ses changements fonctionnels qui font partie de la perspective long-termes de ce projet.
Preface
Neuropathic pain is caused by an injury or disease of the somatosensory system including peripheral fibers and central neurons (e.g. peripheral nerve damage, diabetic neuropathy, post-stroke pain, neurodegenerative diseases) and it is among the most frequent causes of chronic pain (Colloca et al., 2017). Neuropathic pain affects around 7 -10% of the population and its incidence is likely to increase due to ageing of the population. Comorbidities such as poor sleep, anxiety and depression are frequent in neuropathic pain and they greatly impair quality of life and has a high socioeconomic impact on society (von Hehn et al., 2012). Approximately 30% of patients with neuropathic pain develop major depression. Despite concerted efforts, the mechanisms underlying this comorbidity remain elusive.
In recent years, neuroimaging emerged as a method to non-invasively assess structural and functional architecture of brain networks and their modifications in various neurological/neuropsychiatric disease states (Fornito and Bullmore, 2010). Several different magnetic resonance imaging (MRI) methodologies provide tools for the study of the brain as an integrative system. MRI gives unique insights into large-scale neuronal communication and provides a platform to study and understand how neural networks can be modified or reorganized under pathological conditions.
In this thesis, my main objective was to shed light on the mechanisms underlying neuropathic pain and depression comorbidity by exploring the functional and structural brain connectivity features in a neuropathic pain-induced depression mouse model. For this, I applied non-invasive, in vivo MRI technology in a longitudinal experimental design, aimed at following the development of the anxio-depressive phenotype and brain network remodeling over time. Probing the brain networks in a mouse model is an important step for translational research as similar MRI techniques exist for clinical investigations and thus, animal findings can be transferable to humans. In addition, this research could pave the way for innovative diagnostic protocols and the development of targeted therapeutic intervention strategies.
Three MRI methods were used in this work: resting-state fMRI (rs-fMRI) to reconstruct the overall architecture of brain functional communication pathways, diffusion tensor imaging (DTI) to examine microstructural substrates underlying this communication, and anatomical imaging to track morphological alterations using deformation-based morphometry (DBM) methods.
In the first part of the introduction chapter, I give an overview of MRI methods that I utilized in my work or used in the literature that I’m discussing. Second part of my introduction is dedicated to neuropathic pain: including a part summarizing MRI literature in chronic pain conditions and the current knowledge on anxio-depressive consequences of pain.
Avant-propos
La douleur neuropathique résulte d’une lésion ou d’une maladie du système somatosensoriel; elle est l'une des causes les plus fréquentes de la douleur chronique. (Colloca et al., 2017). La douleur neuropathique touche environ 7 à 10% de la population et son incidence est susceptible d’augmenter en raison du vieillissement de la population. Les comorbidités telles que l’insomnie, l'anxiété et la dépression sont fréquentes dans les douleurs neuropathiques et compromettent grandement la qualité de vie. Elles ont également un impact socioéconomique important (von Hehn et al., 2012). Environ 30% des patients souffrant de douleurs neuropathiques développent également une dépression. Malgré des efforts concertés, les mécanismes sous-jacents à cette comorbidité restent inconnus.
Récemment, la neuroimagerie est apparue comme une méthode d'évaluation non-invasive de l'architecture structurelle et fonctionnelle des réseaux cérébraux et de leurs modifications dans divers états neurologiques/neuropsychiatriques (Fornito and Bullmore, 2010). Plusieurs méthodes différentes d'imagerie par résonance magnétique (IRM) donnent une possibilité d’étudier le cerveau en tant que système intégratif. Les méthodes de l'IRM, comme l’IRM fonctionnelle au repos et l’imagerie du tenseur de diffusion, donnent un aperçu unique de la communication neuronale à grande échelle et permet de comprendre comment les réseaux de neurones peuvent être modifiés ou réorganisés dans des conditions pathologiques.
Dans ce travail de thèse, mon objectif général était d’améliorer nos connaissances des mécanismes sous-jacents à la comorbidité entre douleur neuropathique et dépression en étudiant les altérations fonctionnelle et structurelle des réseaux cérébraux en utilisant un modèle de dépression e induite par la douleur neuropathique chez la souris. En effet, sonder les réseaux cérébraux dans un modèle de souris représente une étape cruciale pour la recherche translationnelle car des techniques similaires d'IRM existent pour les investigations cliniques ; par conséquent, les résultats obtenus chez la souris sont facilement transférables à l'homme. De plus, cela pourrait ouvrir une voie à des protocoles de diagnostic innovants et au développement de stratégies d'intervention thérapeutique ciblées.
Dans ce travail, trois méthodes d'IRM ont été utilisées : IRMf au repos (rs-IRM) pour reconstruire l'architecture globale des voies de communication fonctionnelles du cerveau, imagerie du tenseur de diffusion (DTI) pour examiner les substrats microstructuraux sous-jacents à cette communication et imagerie anatomique pour suivre les altérations morphologiques utilisant méthode de morphométrie déformation-basée (DBM).
Dans la première partie de l’introduction, je résume des méthodes d'IRM utilisées dans mon travail et des études précédentes que j’ai citées. La deuxième partie de l'introduction est consacrée à la douleur neuropathique, elle résume la littérature sur l'IRM dans les états douloureux chroniques et les connaissances actuelles sur les conséquences anxio-dépressives de la douleur.

1 Introduction 1.1 Functional and Structural Connectivity via Magnetic Resonance Imaging
In the following sections, I will introduce resting-state functional magnetic resonance imaging (rs-fMRI), diffusion MRI and fiber tracking methodologies as well as their use in mouse brain imaging.
1.1.1 Resting-state fMRI
Paramagnetic materials form internal, induced magnetizations in the direction of the externally applied magnetic fields (i.e. increasing the field strength in the surrounding area); thus, disrupt the homogeneity of the said external magnetic fields. Deoxyhemoglobin possesses paramagnetic properties which was first demonstrated by Pauling and Coryell in 1936. Later on, Ogawa and colleagues (1990) showed that the paramagnetic deoxyhemoglobin in venous blood can be utilized as a naturally occurring contrast agent for MRI through the use of gradient echo (GE) techniques in high fields. They recognized the fact that the MRI contrast they termed ‘blood oxygen level dependent (BOLD)’ can provide real-time maps of brain oxygenation in vivo. If blood flow increases suddenly with an increase in cellular activity and this increase is not accompanied by an increase in oxygen consumption of comparable magnitude, oxygenation in capillaries and veins is increased (Fox and Raichle, 1986). BOLD functional MRI (BOLD-fMRI) technique is based on the accentuated signal due to an increase in venous oxyhemoglobin levels resulting from overcompensation by the increased blood flow in response to neural activity.
Resting-state fMRI technique, based on the use of the BOLD signal, emerged following the seminal paper by Biswal and colleagues (1995). They discovered that the spontaneous low frequency (<0.1 Hz) fluctuations of the BOLD signal are not artefactual and the regions that are activated together during a task have correlated spontaneous BOLD fluctuations during rest. They concluded that correlation of low frequency BOLD signal fluctuations is a manifestation of functional connectivity (FC) of the brain. Functional connectivity is defined as the temporal dependence of neuronal activity patterns of anatomically separated brain regions (Friston et al., 1993).
BOLD-fMRI has gained immense popularity during the last three decades in the neuroscience field as the method of choice for non-invasively studying the entirety of brain with a high spatiotemporal resolution (Logothetis, 2008). However, the BOLD signal is not a direct measure of neuronal activity (Fox and Raichle, 2007); rather it is a surrogate signal that reflects neuronal mass activity via hemodynamic responses. As such, an understanding of what BOLD signal truly represents is a prerequisite to correctly interpret fMRI findings.
1.1.1.1 Origin of the BOLD signal
The BOLD signal does not directly measure the neuronal activity itself. Instead, the BOLD effect is sensitive to the changes in cerebral blood flow (CBF), cerebral metabolic rate of oxygen (CMRO2), and cerebral blood volume (CBV): the set of physiological responses that are referred to collectively as the hemodynamic response to activation (Buxton et al., 2004). Based on numerous experimental studies of the BOLD responses to brain activation, certain characteristics of the BOLD signal were noted (Figure ):
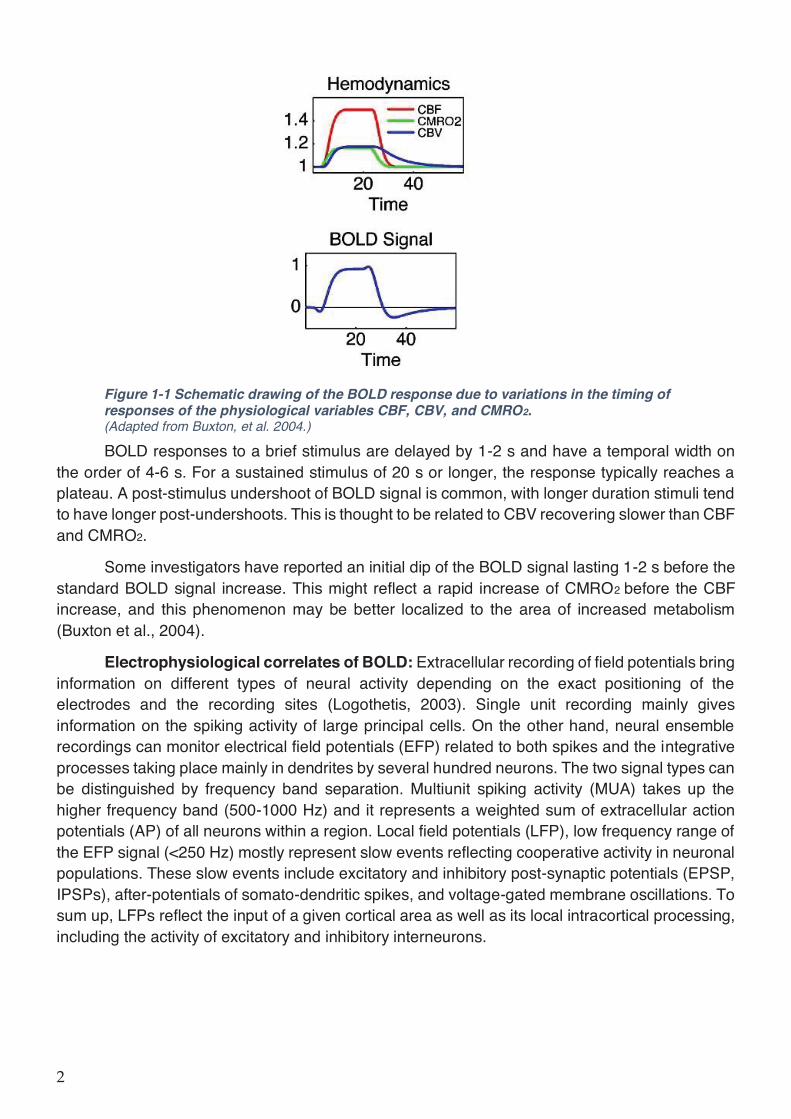
Figure 1-1 Schematic drawing of the BOLD response due to variations in the timing of responses of the physiological variables CBF, CBV, and CMRO2. (Adapted from Buxton, et al. 2004.)
BOLD responses to a brief stimulus are delayed by 1-2 s and have a temporal width on the order of 4-6 s. For a sustained stimulus of 20 s or longer, the response typically reaches a plateau. A post-stimulus undershoot of BOLD signal is common, with longer duration stimuli tend to have longer post-undershoots. This is thought to be related to CBV recovering slower than CBF and CMRO2.
Some investigators have reported an initial dip of the BOLD signal lasting 1-2 s before the standard BOLD signal increase. This might reflect a rapid increase of CMRO2 before the CBF increase, and this phenomenon may be better localized to the area of increased metabolism (Buxton et al., 2004).
Electrophysiological correlates of BOLD: Extracellular recording of field potentials bring information on different types of neural activity depending on the exact positioning of the electrodes and the recording sites (Logothetis, 2003). Single unit recording mainly gives information on the spiking activity of large principal cells. On the other hand, neural ensemble recordings can monitor electrical field potentials (EFP) related to both spikes and the integrative processes taking place mainly in dendrites by several hundred neurons. The two signal types can be distinguished by frequency band separation. Multiunit spiking activity (MUA) takes up the higher frequency band (500-1000 Hz) and it represents a weighted sum of extracellular action potentials (AP) of all neurons within a region. Local field potentials (LFP), low frequency range of the EFP signal (<250 Hz) mostly represent slow events reflecting cooperative activity in neuronal populations. These slow events include excitatory and inhibitory post-synaptic potentials (EPSP, IPSPs), after-potentials of somato-dendritic spikes, and voltage-gated membrane oscillations. To sum up, LFPs reflect the input of a given cortical area as well as its local intracortical processing, including the activity of excitatory and inhibitory interneurons.
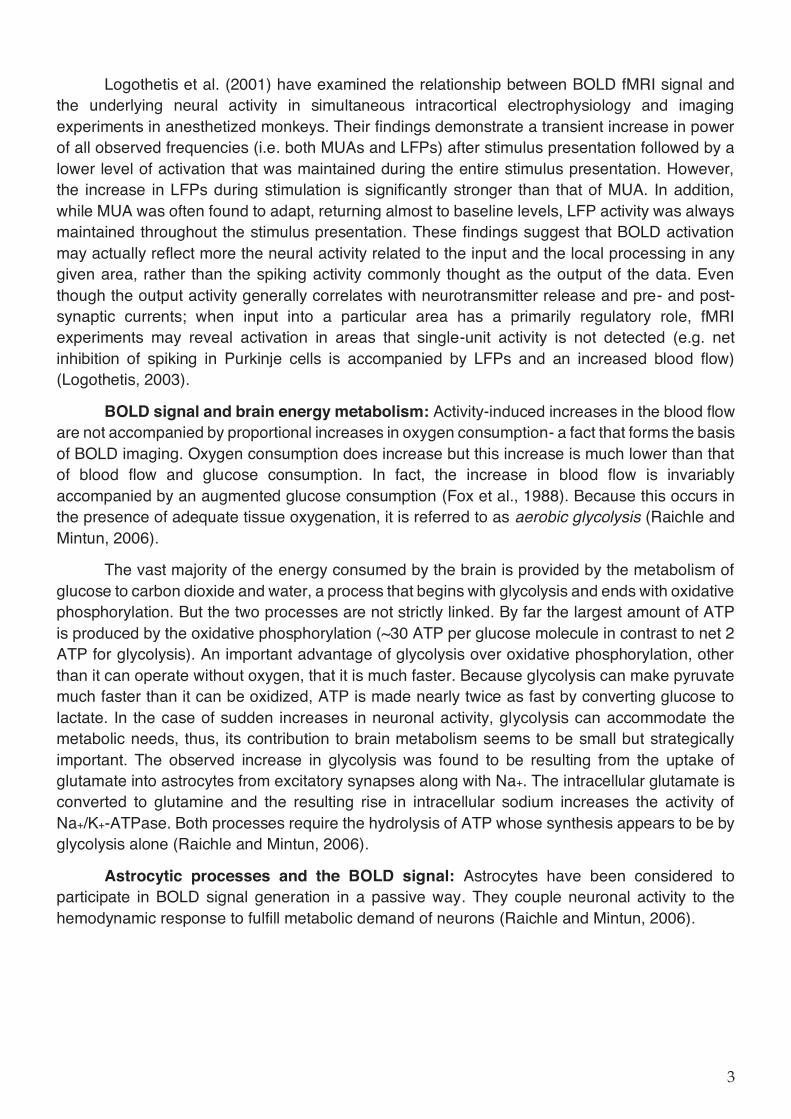
Logothetis et al. (2001) have examined the relationship between BOLD fMRI signal and the underlying neural activity in simultaneous intracortical electrophysiology and imaging experiments in anesthetized monkeys. Their findings demonstrate a transient increase in power of all observed frequencies (i.e. both MUAs and LFPs) after stimulus presentation followed by a lower level of activation that was maintained during the entire stimulus presentation. However, the increase in LFPs during stimulation is significantly stronger than that of MUA. In addition, while MUA was often found to adapt, returning almost to baseline levels, LFP activity was always maintained throughout the stimulus presentation. These findings suggest that BOLD activation may actually reflect more the neural activity related to the input and the local processing in any given area, rather than the spiking activity commonly thought as the output of the data. Even though the output activity generally correlates with neurotransmitter release and pre- and post-synaptic currents; when input into a particular area has a primarily regulatory role, fMRI experiments may reveal activation in areas that single-unit activity is not detected (e.g. net inhibition of spiking in Purkinje cells is accompanied by LFPs and an increased blood flow) (Logothetis, 2003).
BOLD signal and brain energy metabolism: Activity-induced increases in the blood flow are not accompanied by proportional increases in oxygen consumption- a fact that forms the basis of BOLD imaging. Oxygen consumption does increase but this increase is much lower than that of blood flow and glucose consumption. In fact, the increase in blood flow is invariably accompanied by an augmented glucose consumption (Fox et al., 1988). Because this occurs in the presence of adequate tissue oxygenation, it is referred to as aerobic glycolysis (Raichle and Mintun, 2006).
The vast majority of the energy consumed by the brain is provided by the metabolism of glucose to carbon dioxide and water, a process that begins with glycolysis and ends with oxidative phosphorylation. But the two processes are not strictly linked. By far the largest amount of ATP is produced by the oxidative phosphorylation (~30 ATP per glucose molecule in contrast to net 2 ATP for glycolysis). An important advantage of glycolysis over oxidative phosphorylation, other than it can operate without oxygen, that it is much faster. Because glycolysis can make pyruvate much faster than it can be oxidized, ATP is made nearly twice as fast by converting glucose to lactate. In the case of sudden increases in neuronal activity, glycolysis can accommodate the metabolic needs, thus, its contribution to brain metabolism seems to be small but strategically important. The observed increase in glycolysis was found to be resulting from the uptake of glutamate into astrocytes from excitatory synapses along with Na+. The intracellular glutamate is converted to glutamine and the resulting rise in intracellular sodium increases the activity of Na+/K+-ATPase. Both processes require the hydrolysis of ATP whose synthesis appears to be by glycolysis alone (Raichle and Mintun, 2006).
Astrocytic processes and the BOLD signal: Astrocytes have been considered to participate in BOLD signal generation in a passive way. They couple neuronal activity to the hemodynamic response to fulfill metabolic demand of neurons (Raichle and Mintun, 2006).
However, a recent study by Takata et al. (2018) demonstrated that astrocyte activation alone can evoke BOLD signal without neuronal activity. They used a transgenic mouse line carrying channelrhodopsin-2 (ChR2) in cortical astrocytes (Astrocyte-Chr2): transcranial illumination of the mouse cortex evoked BOLD response in awake fMRI. The absence of neuronal activation after astrocyte stimulation was detected using c-fos mRNA staining along with electrophysiological recordings (i.e. LFP and MUA). Optogenetic stimulation of astrocytes elicited oxygen consumption along with synthesis of acetyl-carnitine via oxidative glucose metabolism. In physiological conditions, astrocytes may be able to respond to neuromodulators released from axonal fibers of distant origin whereby activation of astrocytes is not accompanied by local neuronal activity. This study suggests BOLD signal fluctuations can reflect metabolic demands of astrocytes in addition to neurons.
1.1.1.2 Resting-state Functional Connectivity (FC)
Resting-state activity is a signature of neural oscillations synchronized across large-scale networks that occur in the absence of external inputs. The resting human brain represents only 2% of total body mass but consumes 20% of the body’s energy, most of which used to support ongoing neuronal signaling. Task related increases in neuronal metabolism are usually small (<5%) when compared with this large resting energy consumption (Fox and Raichle, 2007). Biswal and colleagues (1995) proved that the resting-state BOLD fluctuations detected with fMRI are not artefactual by showing that BOLD fluctuations of left somatomotor cortex is specifically correlated with fluctuations in the right somatomotor cortex and medial motor areas in the absence of overt motor behavior. Later on, many other neuroanatomical systems have been shown to be coherent in their spontaneous activity (Fox and Raichle, 2007).
As a rule, regions that are similarly modulated by task paradigms tend to be correlated in their spontaneous BOLD activity. In addition, regions with apparently opposing functionality have been found to be negatively correlated (i.e. anticorrelated) in their spontaneous activity. These correlations and anticorrelations between segregated brain regions as shown by rs-fMRI form the basis of resting-state functional connectivity and resting-state networks. Resting-state networks were discovered in both humans (Fox et al., 2005; Greicius et al., 2003) and other mammalian species such as non-human primates, rats and mice (Belcher et al., 2013; Grandjean et al., 2014; Jonckers et al., 2011; Mantini et al., 2011; Mechling et al., 2014; Sforazzini et al., 2014).
Several resting-state networks were defined including: default-mode network (DMN), task-positive network (TPN), salience network (SN), somatomotor, visual, auditory and cerebellar networks (Fox and Raichle, 2007; Di and Biswal, 2015). Two of the major networks, DMN and TPN are described further below:
Default mode network (DMN): Among the discovered resting-state networks, DMN is unique in showing reductions in its activity in response to cognitive tasks. A ‘default mode of brain function’ was proposed by Raichle et al. (2001) following their observation using positron emission tomography (PET) that a set of brain regions- involving, among other areas, the medial prefrontal cortex (mPFC), posterior cingulate cortex (PCC), and precuneus shows ongoing activity during rest and deactivation during externally cued tasks. Further investigations using resting-state fMRI demonstrated the temporal coherence of BOLD fluctuations between regions comprising DMN as described previously in the PET study (Greicius et al., 2003). PCC was recognized as the central region whose connectivity displayed task deactivations in PET. Changes in DMN connectivity
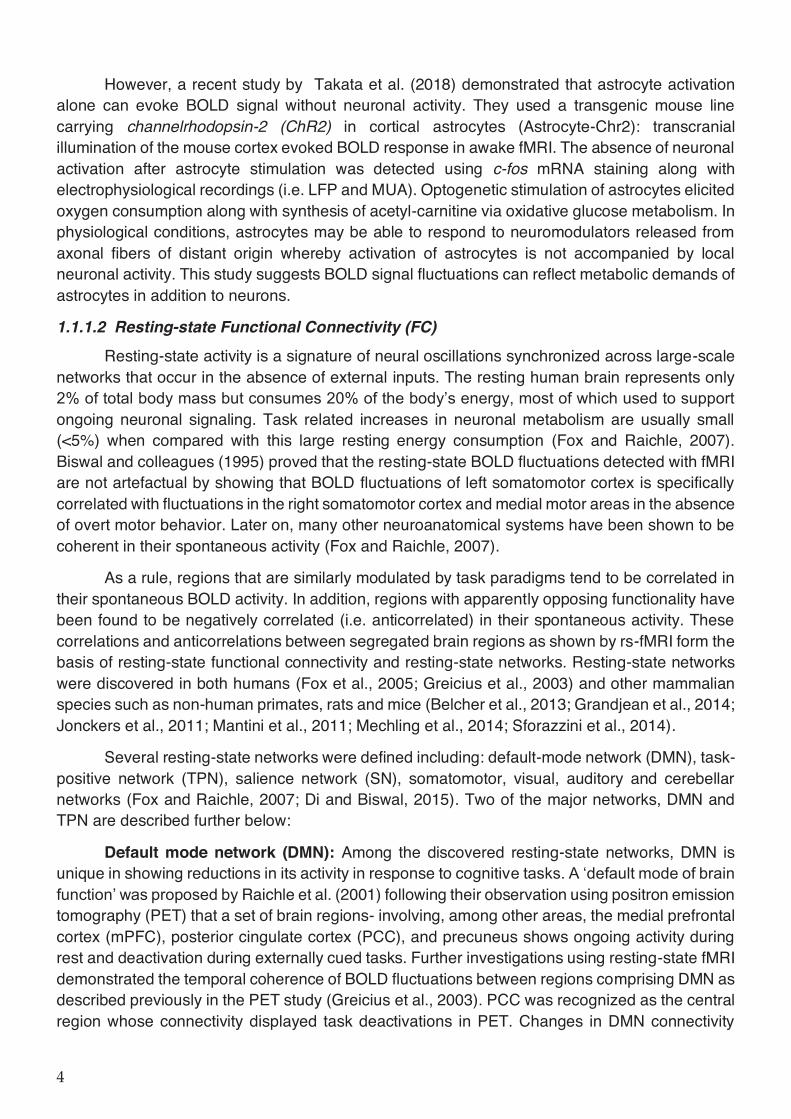
were consistently demonstrated in major depression (Greicius et al., 2007; Zhou et al., 2010) and chronic pain conditions (Marwan N. Baliki et al., 2014; Kucyi et al., 2014; Alshelh et al., 2018).
Figure 1-2 Anticorrelated networks in the human brain. Task-positive network (TPN), shown in warm colours, is significantly correlated with regions involved in focused attention and working memory (intra-parietal sulcus (IPS), frontal eye field (FEF) and middle temporal (MT) area). DMN nodes (posterior cingulate/precuneus (PCC), lateral parietal cortex (LP) and medial prefrontal cortex (MPF)), shown in cool colours, are significantly correlated with task-negative areas and significantly anticorrelated with TPN. (Taken from Fox and Raichle, 2007.)
Fox et al. (2005) described a ‘task-positive network (TPN)’ that is diametrically opposite of DMN; these areas are routinely activated during goal-directed task performance (also called dorsal attention system) and they show anticorrelations with DMN regions at rest (Figure ).
1.1.1.3 Methods for analysis of rs-fMRI data
Firstly, to separate spontaneous low frequency fluctuations from non-neuronal noise, certain steps can be followed (Fox and Raichle, 2007). A high sampling rate during data acquisition prevents aliasing by higher frequencies arising from cardiac or respiratory activity. Another method is the linear regression of physiological noise that was monitored during the experiments. Global signal regression or regression of ventricles/white matter can be included in the pre-processing pipeline of the acquired resting-state fMRI data.
Functional connectivity is defined as the temporal dependency of neuronal activation patterns of anatomically separated brain regions (Friston et al., 1993). In the context of resting-state fMRI experiments, functional connectivity is expressed as the level of correlated dynamics of fMRI time-series between brain areas (van den Heuvel and Hulshoff Pol, 2010).
Identification of spatial patterns of functional connectivity can be achieved with various analysis methods roughly classified into two: Model-dependent and model-free methods.
Model-dependent (seed) methods: The most straightforward way to examine the functional connections of a particular brain region is to correlate the resting-state time-series of the depicted brain region against the time-series of all other regions; resulting in a functional connectivity map (van den Heuvel and Hulshoff Pol, 2010). The advantage of seed analysis is the relative simplicity of the method and the ease with which to interpret the results. However, this type of analysis requires a priori assumptions on the data, necessary for the selection of the seed area (see Figure ).

Model-free methods: In contrast to seed-based methods, model-free methods are designed to look for general patterns of connectivity across brain regions without a priori selected seeds (van den Heuvel and Hulshoff Pol, 2010). Independent component analysis (ICA) is the most commonly used method, providing a high level of consistency. ICA algorithms analyze the entire BOLD dataset and decompose it into components that are maximally independent in a statistical sense; each component is associated with a spatial component map (Fox and Raichle, 2007). Advantages of this method are that it is purely data-driven, and it automatically isolates the sources of noise. However, it requires a user-selected number of components, evaluation of resulting components is done by the user (i.e. neuronal vs. noise) and their interpretation is much more complex.
Taken together, seed-based and data-driven methods all tend to show strong overlap between their results; supporting the notion of robust formation of multiple functionally linked networks in the brain during resting-state (Fox and Raichle, 2007; van den Heuvel and Hulshoff Pol, 2010).
Figure 1-3 Simple schema of resting-state fMRI seed analysis and resulting resting-state functional connectivity maps. A. High correlation between the time-series of seed voxel and the voxel j points to a functional connectivity between the two areas. (Adapted from van den Heuvel and Hulshoff Pol, 2010.) B. Warm colors represent positive correlations and cool colors represent anticorrelations with the seed area.
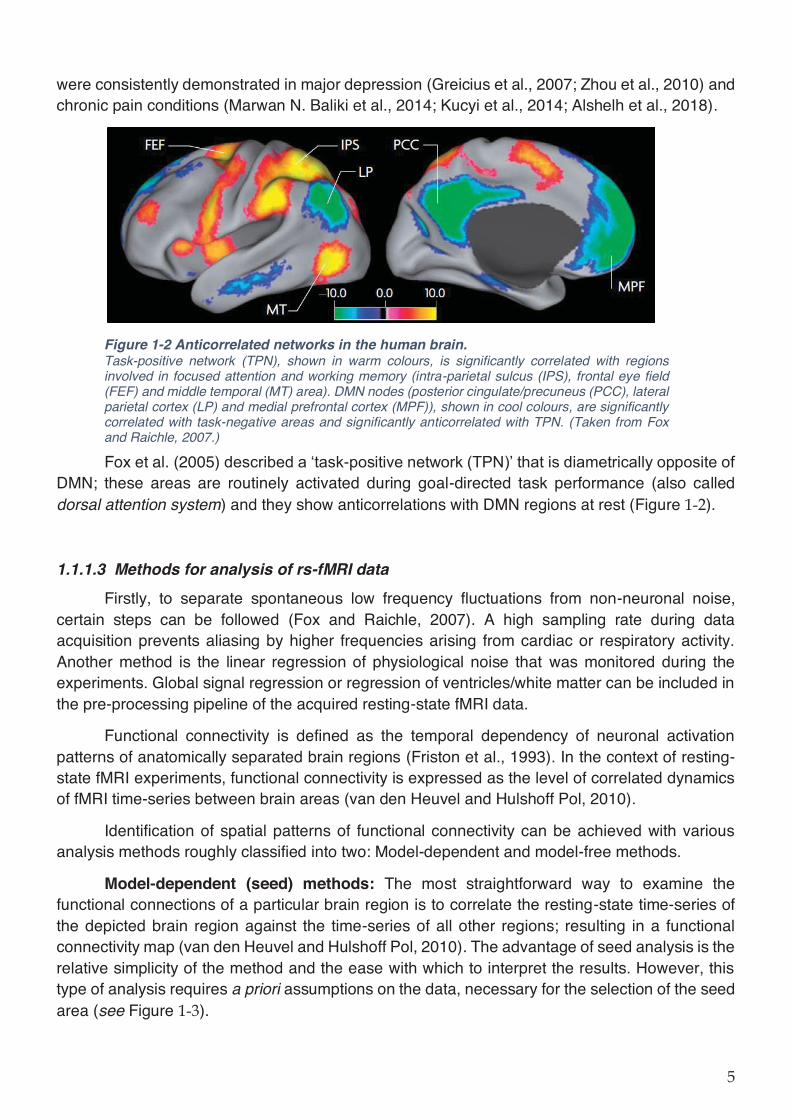
Graph analysis: Graph theory provides a theoretical framework in which the topology of complex networks is examined, revealing important information on both the local and global organization of functional brain networks. Graph analysis formulates brain networks as a collection of nodes representing brain regions and edges(also called links), the functional connections showing the correlation values between the time-series of the nodes (van den Heuvel and Hulshoff Pol, 2010). Graph analysis suggested that brain networks have an organization optimized towards a high level of local and global efficiency.
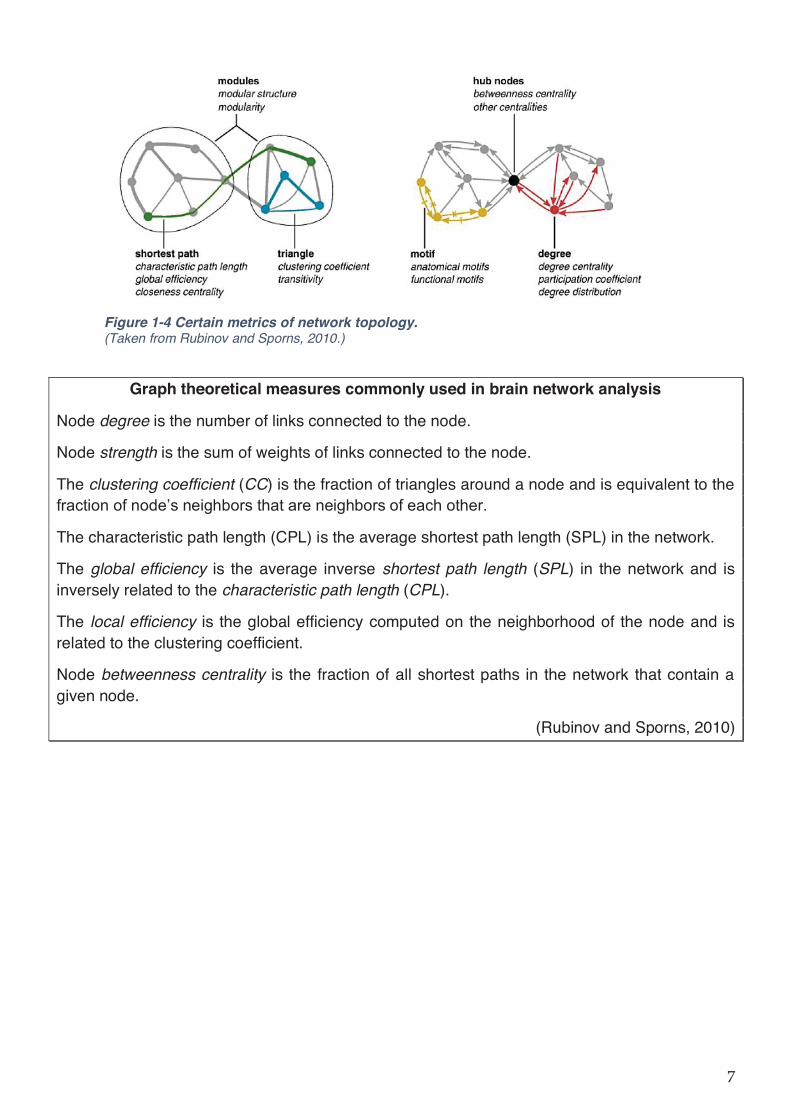
Figure 1-4 Certain metrics of network topology. (Taken from Rubinov and Sporns, 2010.)
Graph theoretical measures commonly used in brain network analysis
Node degree is the number of links connected to the node.
Node strength is the sum of weights of links connected to the node.
The clustering coefficient (CC) is the fraction of triangles around a node and is equivalent to the fraction of node’s neighbors that are neighbors of each other.
The characteristic path length (CPL) is the average shortest path length (SPL) in the network.
The global efficiency is the average inverse shortest path length (SPL) in the network and is inversely related to the characteristic path length (CPL).
The local efficiency is the global efficiency computed on the neighborhood of the node and is related to the clustering coefficient.
Node betweenness centrality is the fraction of all shortest paths in the network that contain a given node.
(Rubinov and Sporns, 2010)

1.1.2 Diffusion MRI and fiber tracking
Diffusion MRI allows probing of tissue structure on a microscopic scale by mapping displacements of water molecules as part of the physical diffusion process. It provides unique information on the fine architecture of neural tissues and to changes associated with various physiological and pathological states. Because the directedness of diffusion is associated with the underlying organization of white matter axonal bundles, diffusion MRI can also be used to map the fiber tracts in the brain in an in vivo and non-invasive manner (Le Bihan, 2003).
1.1.2.1 General information on diffusion MRI
Also known as ‘Brownian motion’, diffusion refers to the constant random microscopic molecular motion due to thermal energy. Einstein’s equation (Einstein, 1905) gives the diffusion coefficient (D)- average displacement of a molecule over an area to the observation time (mm2/s):
Figure 1-5 Water diffusion and tissue structure. a. The random displacements of molecules resulting from Brownian motion obey a statistical law formulated by Einstein (1905). b. In biological tissues, obstacles (i.e. cells, tortuous pathways, and exchange between compartments) modulate the free diffusion process. (Figure taken from Le Bihan, 2003.)
In a free medium, molecular displacements obey a three-dimensional Gaussian distribution statistically described by diffusion coefficient (D). This constant depends on the size of the molecules, the temperature and the viscosity of the medium. Free water molecules at 37°C have a diffusion coefficient of 3× 10⁻⁹ m2/s. However, in biological tissues, diffusion is no longer ‘free’; rather, molecules travel along the microscopic tissue structure. Water molecules bounce off, cross or interact with many tissue components, such as cell membranes, fibers and macromolecules. Because the movement is impeded by such obstacles, diffusion is restricted and displacement distribution is no longer Gaussian (Figure , above) (Le Bihan, 2003).

Diffusion weighted imaging: Diffusion weighted pulse sequence is constructed by the addition of a pair of diffusion sensitizing gradients (Stejskal and Tanner, 1965). Application of the first gradient pulse introduces a phase difference depending on the location of the molecules along the gradient axis. 10 to 100 ms after the first gradient pulse, another gradient along the same axis with opposite polarity is applied to refocus the phase differences. The refocusing is only perfect when the water molecules are immobile between the pulses. Because the signal at each voxel represents the sum of signals from all the water molecules in that voxel; the imperfect refocusing leads to a signal loss. Thus, MR signal is sensitized to the diffusion process; higher diffusion resulting in higher signal loss (Figure )(Le Bihan and Breton, 1985).
Figure 1-6 The relationship between the water motion and gradient applications. (Figure taken from Mori and Zhang, 2006.)
b-factor is the measure of diffusion weighting that is a function of the strength, duration, and temporal spacing of the diffusion sensitizing gradients. Its unit is s/mm2; the reciprocal to that of diffusion constant (Mukherjee et al., 2008). Apparent diffusion coefficient (ADC) is the diffusion constant measured with MRI, reflecting the fact that diffusion cannot be separated from other sources affecting water mobility. For instance, diffusion coefficient might be low due to viscosity of the environment directly related to diffusion process or due to many obstacles and barriers, diffusion might ‘appear’ slow (Mori and Zhang, 2006).
1.1.2.2 Quantifying diffusion anisotropy
Diffusion is said to be anisotropic when molecular mobility is not equal for all directions. In an ordered tissue, the measured apparent diffusion coefficient (ADC) will depend on the direction from which it is measured (Jones, 2008). White matter tracts with highly packed, coherently oriented fiber bundles hinder water displacement perpendicular to the direction of the fibers; resulting in larger ADC values parallel to the tracts rather than orthogonal to them. Hence, more than one diffusion-encoding direction is required to characterize regions of anisotropic diffusion (Moseley et al., 1990).

The model used to characterize diffusion anisotropy is the diffusion tensor which is a 3×3 symmetric matrix of numbers that characterizes three-dimensional water displacements. Diffusion tensor calculation requires at least six diffusion-encoded image sets along non-collinear directions in addition to at least one b=0 s/mm2 image (Basser, et al. 1994). The diffusion tensor is often thought of in terms of an ellipsoid: a surface representing the distance that a molecule will diffuse to with equal probability from the origin. The principal axes of the ellipsoid are given by the eigenvectors, and the lengths are given by the diffusion distance at a given time. Ellipsoids are scaled according to square roots of diffusivities in each direction (i.e. eigenvalues) (Jones, 2008).
Figure 1-7 The diffusion ellipsoids and tensors for isotropic unrestricted diffusion, isotropic restricted diffusion, and anisotropic restricted diffusion. (Figure taken from Mukherjee, et al. 2008.)
Degree of diffusion anisotropy determines the shape of the ellipsoid: in the case of isotropic diffusion where diffusion is equal in each direction, the ellipsoid would become a sphere. With a high degree of anisotropy, ellipsoid would become elongated or cigar-shaped (Mori and Zhang, 2006)(see Figure , above).
Diffusion tensor parameters: Three eigenvectors represent the three principal axes of the tensor and the three eigenvalues are the lengths of ellipsoid axes. The primary eigenvector with the largest eigenvalue gives the principal direction and magnitude of diffusion in the voxel. In white matter, this indicates the orientation of axonal fiber bundles. Parametric maps can be built from tensors to characterize the microstructure in a given voxel: Axial diffusivity (AD) maps show longitudinal diffusivity – along the main diffusion axis (λ1); radial diffusivity (RD) maps show diffusivity perpendicular to the main axis ((λ2 +λ3)/2), whereas mean diffusivity (MD) is a measure of rotationally invariant diffusion in a voxel ((λ1+λ2 +λ3)/3) (Mukherjee et al., 2008).

Figure 1-8 Parametric diffusion tensor maps of a mouse brain in coronal sections.
Fractional anisotropy (FA) is a normalized measure that expresses the directedness of diffusion in a scale ranging between 0 and 1. It takes the value 0 when diffusion is isotropic, and 1 when diffusion is constrained along one axis only (Basser and Pierpaoli, 1996).
Fiber orientation information inherent in the primary eigenvector can also be visualized on two dimensional images by assigning a color to each of three mutually orthogonal axes (Jones, 2008).
1.1.2.3 Fiber tracking
By the help of sophisticated computer algorithms, inter-voxel connectivity on the basis of anisotropic water diffusion can be calculated. In each brain voxel, the dominant direction of axonal tracts can be assumed to be parallel to the primary eigenvector of the diffusion tensor. Fiber tracking uses the diffusion tensor of each voxel to follow an axonal tract in three dimensions from voxel to voxel through the brain (Mukherjee et al., 2008).
Fiber tracking algorithms can be classified into two categories: local and global methods. Local methods construct fibers independently path-by-path. The reconstruction of long neuronal pathways is performed in small successive steps, either deterministically or probabilistically by following the local, voxel-wise defined distribution of fiber directions (Reisert et al., 2011). Deterministic fiber tracking algorithms calculate fiber trajectories by creating streamlines from the user-defined seed regions along the main diffusion directions in each voxel. Fiber construction halts when it reaches a voxel with low anisotropy value or the fiber exceeds a predefined turning angle (Mukherjee et al., 2008). Probabilistic algorithms, on the other hand, propagate a large number of pathways from each seed point rather than a single trajectory. Thus, a distribution of possible orientations is calculated. Stopping criterion for streamlines is the angular deviation between successive steps (Jones, 2008). Local methods have the advantage of being very fast; however, minor imperfections in the determination of local steps can accumulate and significantly affect the final result (Reisert et al., 2011).
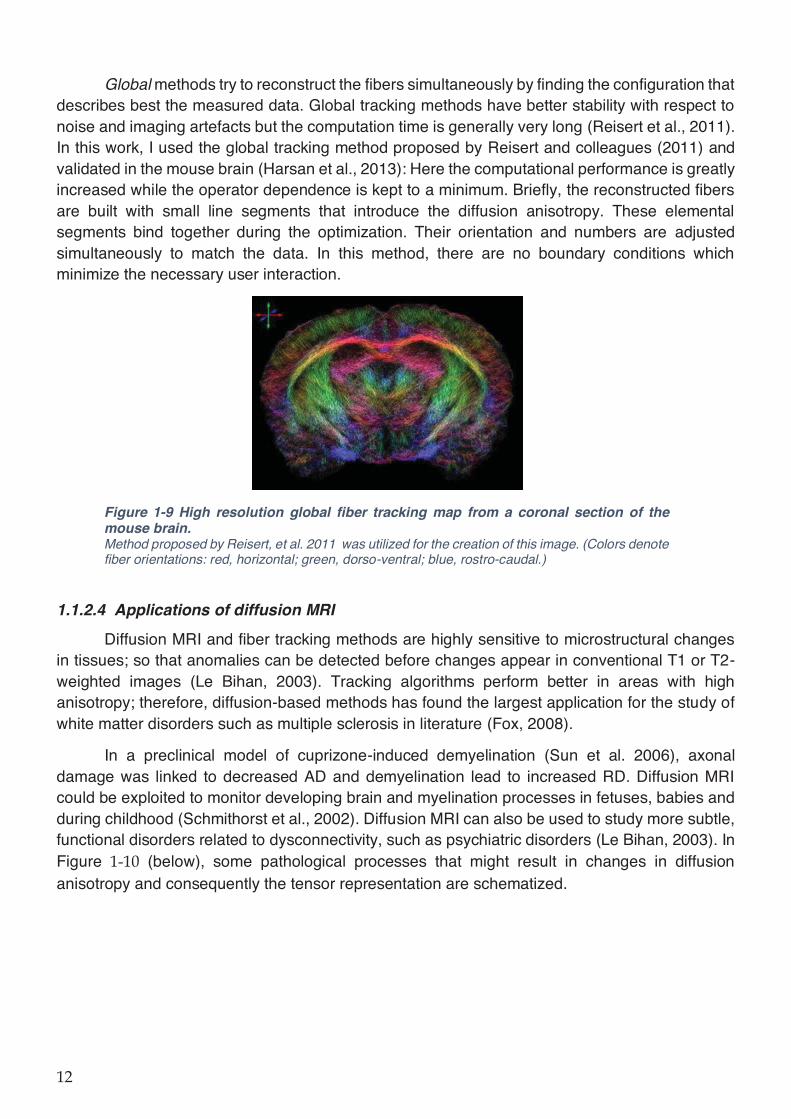
Global methods try to reconstruct the fibers simultaneously by finding the configuration that describes best the measured data. Global tracking methods have better stability with respect to noise and imaging artefacts but the computation time is generally very long (Reisert et al., 2011). In this work, I used the global tracking method proposed by Reisert and colleagues (2011) and validated in the mouse brain (Harsan et al., 2013): Here the computational performance is greatly increased while the operator dependence is kept to a minimum. Briefly, the reconstructed fibers are built with small line segments that introduce the diffusion anisotropy. These elemental segments bind together during the optimization. Their orientation and numbers are adjusted simultaneously to match the data. In this method, there are no boundary conditions which minimize the necessary user interaction.
Figure 1-9 High resolution global fiber tracking map from a coronal section of the mouse brain. Method proposed by Reisert, et al. 2011 was utilized for the creation of this image. (Colors denote fiber orientations: red, horizontal; green, dorso-ventral; blue, rostro-caudal.)
1.1.2.4 Applications of diffusion MRI
Diffusion MRI and fiber tracking methods are highly sensitive to microstructural changes in tissues; so that anomalies can be detected before changes appear in conventional T1 or T2-weighted images (Le Bihan, 2003). Tracking algorithms perform better in areas with high anisotropy; therefore, diffusion-based methods has found the largest application for the study of white matter disorders such as multiple sclerosis in literature (Fox, 2008).
In a preclinical model of cuprizone-induced demyelination (Sun et al. 2006), axonal damage was linked to decreased AD and demyelination lead to increased RD. Diffusion MRI could be exploited to monitor developing brain and myelination processes in fetuses, babies and during childhood (Schmithorst et al., 2002). Diffusion MRI can also be used to study more subtle, functional disorders related to dysconnectivity, such as psychiatric disorders (Le Bihan, 2003). In Figure (below), some pathological processes that might result in changes in diffusion anisotropy and consequently the tensor representation are schematized.
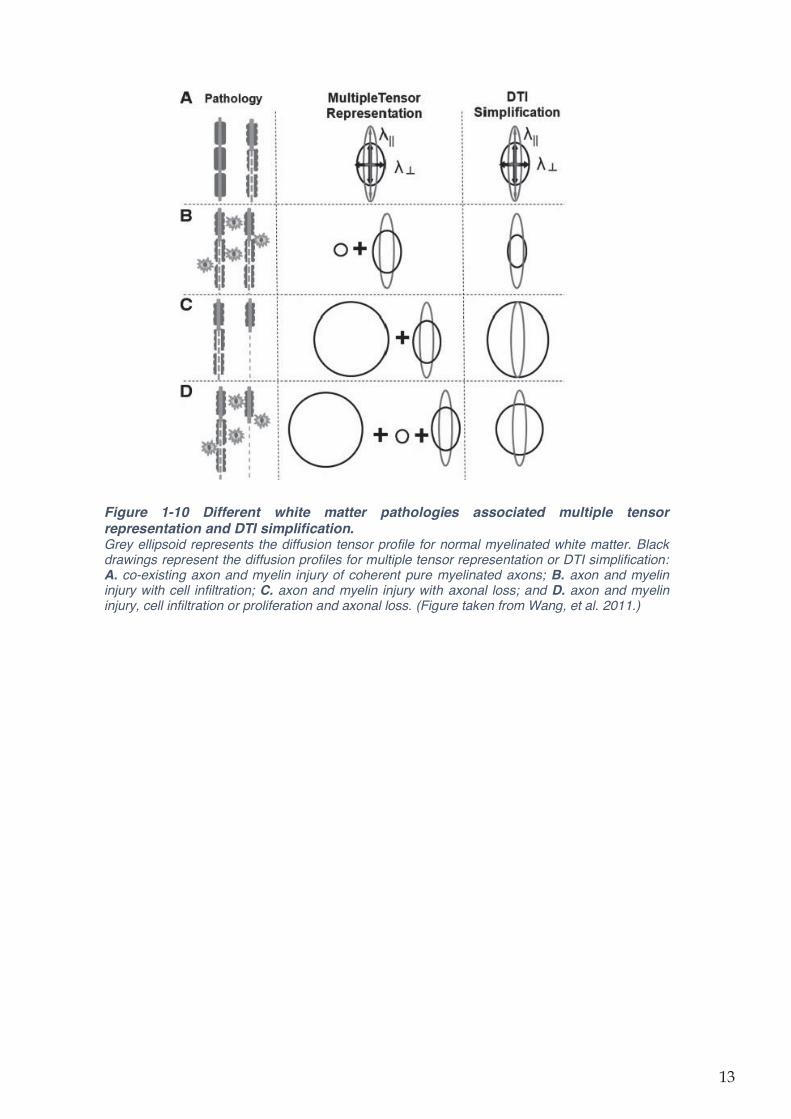
Figure 1-10 Different white matter pathologies associated multiple tensor representation and DTI simplification. Grey ellipsoid represents the diffusion tensor profile for normal myelinated white matter. Black drawings represent the diffusion profiles for multiple tensor representation or DTI simplification: A. co-existing axon and myelin injury of coherent pure myelinated axons; B. axon and myelin injury with cell infiltration; C. axon and myelin injury with axonal loss; and D. axon and myelin injury, cell infiltration or proliferation and axonal loss. (Figure taken from Wang, et al. 2011.)
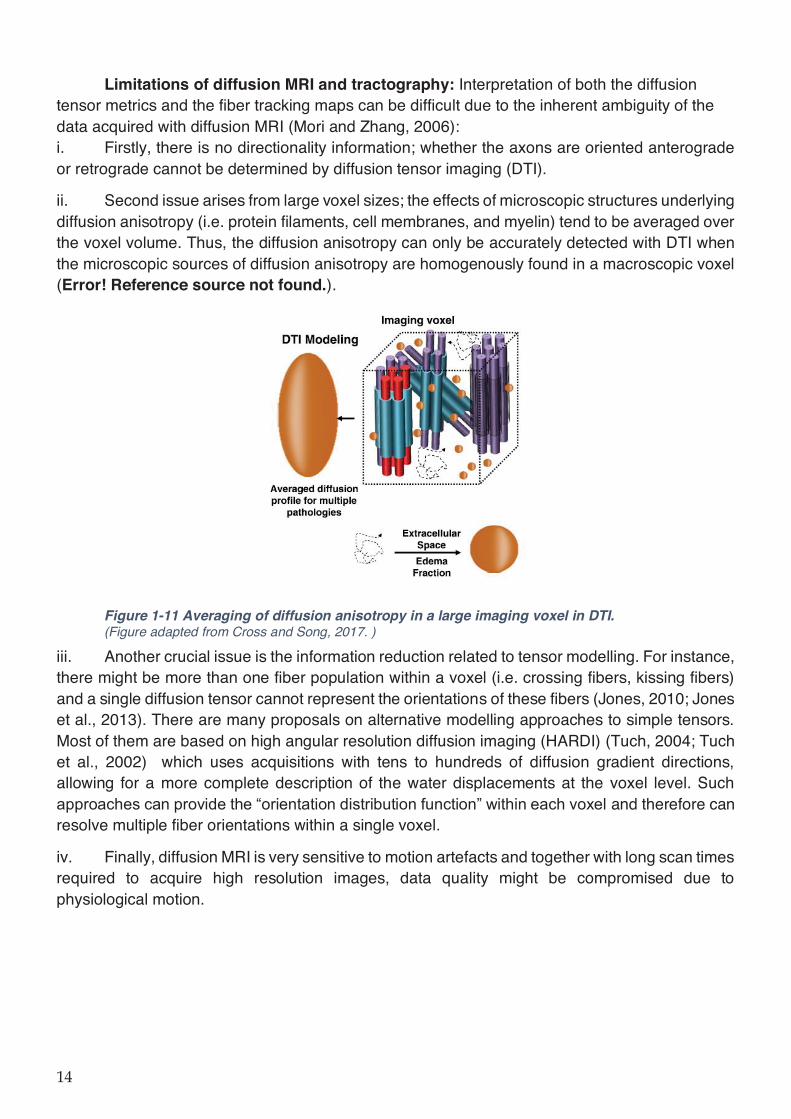
Limitations of diffusion MRI and tractography: Interpretation of both the diffusion tensor metrics and the fiber tracking maps can be difficult due to the inherent ambiguity of the data acquired with diffusion MRI (Mori and Zhang, 2006): i. Firstly, there is no directionality information; whether the axons are oriented anterograde or retrograde cannot be determined by diffusion tensor imaging (DTI).
ii. Second issue arises from large voxel sizes; the effects of microscopic structures underlying diffusion anisotropy (i.e. protein filaments, cell membranes, and myelin) tend to be averaged over the voxel volume. Thus, the diffusion anisotropy can only be accurately detected with DTI when the microscopic sources of diffusion anisotropy are homogenously found in a macroscopic voxel (Error! Reference source not found.).
Figure 1-11 Averaging of diffusion anisotropy in a large imaging voxel in DTI. (Figure adapted from Cross and Song, 2017. )
iii. Another crucial issue is the information reduction related to tensor modelling. For instance, there might be more than one fiber population within a voxel (i.e. crossing fibers, kissing fibers) and a single diffusion tensor cannot represent the orientations of these fibers (Jones, 2010; Jones et al., 2013). There are many proposals on alternative modelling approaches to simple tensors. Most of them are based on high angular resolution diffusion imaging (HARDI) (Tuch, 2004; Tuch et al., 2002) which uses acquisitions with tens to hundreds of diffusion gradient directions, allowing for a more complete description of the water displacements at the voxel level. Such approaches can provide the “orientation distribution function” within each voxel and therefore can resolve multiple fiber orientations within a single voxel.
iv. Finally, diffusion MRI is very sensitive to motion artefacts and together with long scan times required to acquire high resolution images, data quality might be compromised due to physiological motion.
1.1.3 Mouse brain connectome
Translational studies in the field of neuroscience can investigate hypotheses on the normal brain function as well as neuropsychiatric disease models in a well-controlled environment. In animal models- rodents in particular, it is possible to perform invasive recordings and stimulation along with genetic manipulations (e.g. optogenetics and chemogenetics), which are not feasible with human subjects. Rodent models can provide information on the fundamental neurophysiology and conserved biomarkers of disease which can pave the way for effective therapeutic interventions and can be translated into humans (Pan et al., 2015).
There is a considerable homology between human and rodent brains (Pan et al., 2015). Indeed, humans and rodents belong to the same subclass of placental mammals. Rostral to the brainstem and cerebellum common to all vertebrates, mammals share a common telencephalic organization consisting of basal ganglia, allocortex and neocortex. Placental mammals also have a large inter-cortical commissure; corpus callosum. All mammalian neocortices have primary and secondary representations of auditory, visual, somatosensory, multimodal association, and motor areas. Similar organization of brain structures in rodent and human is a strong rationale for translational studies focused on the rodent brain. Use of mouse as a model organism is further supported by the substantial number of genetically modified strains developed in the recent years as well as the ability to optogenetically (Boyden et al., 2005) and chemogenetically (Roth, 2016) manipulate specific neurons and circuits.
1.1.3.1 Resting-state fMRI in mice
Resting-state fMRI facilitates the study of brain function where task-based fMRI can be challenging (Pan et al., 2015). As no explicit task is needed, rs- fMRI method can be used both in rodents relatively easily. However, most rodent rs-fMRI studies require anesthesia to limit motion which might affect the results. Fortunately, resting-state networks including the default mode network (DMN) can also be detected in anesthetized rodent brain. This opens up opportunities for understanding the neurophysiological basis of the spontaneous BOLD fluctuations, the behavioral relevance of the network characteristics, connectomic deficits in diseases and treatment effects on brain connectivity in rodents (Chuang and Nasrallah, 2017).
Resting-state networks of the mouse brain: Although the very first resting-state fMRI studies in mice failed to show bilaterally symmetric connectivity between homotopic regions (Guilfoyle et al., 2013; Jonckers et al., 2011); further investigations demonstrated the existence of bilateral and distributed functional connectivity networks within the mouse brain, identifying both cortical and subcortical networks (Grandjean et al., 2014 ; Mechling et al., 2014 ; Nasrallah et al., 2014; Sforazzini et al., 2014). These findings underscore the presence of spontaneous interhemispheric homotopic fluctuations as a fundamental neuro-architectural trait of the mammalian brain (Gozzi and Schwarz, 2016).
Similarly, antero-posterior connectivity along the midline structures of the brain (i.e. prefrontal and orbitofrontal cortices, cingulate and retrosplenial areas, peri-/ventro-hippocampal areas) corresponding to an evolutionarily-conserved homologue of the DMN was detected with mouse rs-fMRI in several studies (Sforazzini et al., 2014; Shah et al., 2016b; Zerbi et al., 2015).
In addition, a network encompassing ventrolateral striatum, nucleus accumbens, anterior insula and cingulate, similar to human salience network was identified in mouse (Sforazzini et al.,
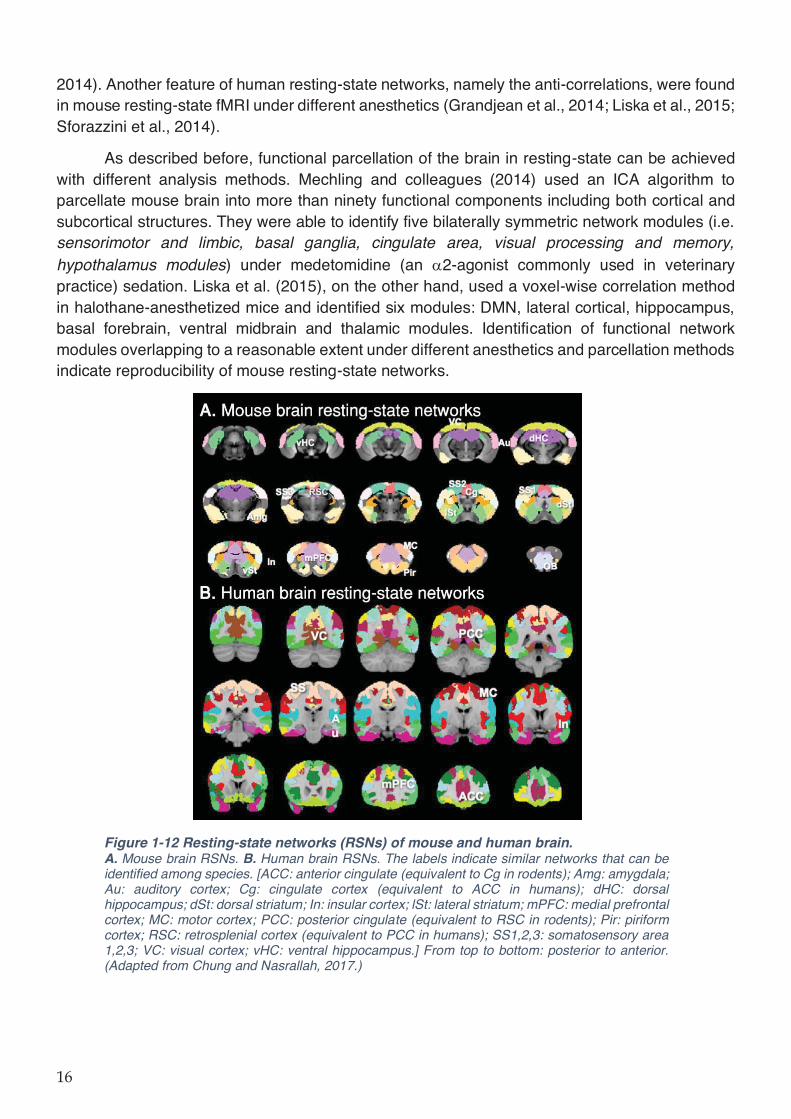
2014). Another feature of human resting-state networks, namely the anti-correlations, were found in mouse resting-state fMRI under different anesthetics (Grandjean et al., 2014; Liska et al., 2015; Sforazzini et al., 2014).
As described before, functional parcellation of the brain in resting-state can be achieved with different analysis methods. Mechling and colleagues (2014) used an ICA algorithm to parcellate mouse brain into more than ninety functional components including both cortical and subcortical structures. They were able to identify five bilaterally symmetric network modules (i.e. sensorimotor and limbic, basal ganglia, cingulate area, visual processing and memory, hypothalamus modules) under medetomidine (an 2-agonist commonly used in veterinary practice) sedation. Liska et al. (2015), on the other hand, used a voxel-wise correlation method in halothane-anesthetized mice and identified six modules: DMN, lateral cortical, hippocampus, basal forebrain, ventral midbrain and thalamic modules. Identification of functional network modules overlapping to a reasonable extent under different anesthetics and parcellation methods indicate reproducibility of mouse resting-state networks.
Figure 1-12 Resting-state networks (RSNs) of mouse and human brain. A. Mouse brain RSNs. B. Human brain RSNs. The labels indicate similar networks that can be identified among species. [ACC: anterior cingulate (equivalent to Cg in rodents); Amg: amygdala; Au: auditory cortex; Cg: cingulate cortex (equivalent to ACC in humans); dHC: dorsal hippocampus; dSt: dorsal striatum; In: insular cortex; lSt: lateral striatum; mPFC: medial prefrontal cortex; MC: motor cortex; PCC: posterior cingulate (equivalent to RSC in rodents); Pir: piriform cortex; RSC: retrosplenial cortex (equivalent to PCC in humans); SS1,2,3: somatosensory area 1,2,3; VC: visual cortex; vHC: ventral hippocampus.] From top to bottom: posterior to anterior. (Adapted from Chung and Nasrallah, 2017.)
Effects of anesthesia on functional networks: Use of anesthesia in mouse resting-state fMRI is a prerequisite for obtaining reliable and interpretable data; anesthesia alleviates stress and prevents motion (Pan et al., 2015). However, anesthesia is known to elicit complicated effects on neural, metabolic and hemodynamic responses (Chuang and Nasrallah, 2017).
Anesthetics are a potential confound for rs-fMRI studies. Fortunately the influence of anesthesia appears to only modulate neurovascular coupling rather than completely abolishing it (Pan et al., 2013). Studies have demonstrated that rodent resting-state networks are highly reproducible and consistent across different anesthesia regimens at optimal doses (Chuang and Nasrallah, 2017). Interfering effect of anesthesia appears to be dose-dependent (Gozzi and Schwarz, 2016); neural effects of anesthesia mainly arises from sites of anesthetic action, associated downstream neural activities, and the regions related to unconsciousness and arousal (Chuang and Nasrallah, 2017). Anesthetics can also affect the cardiopulmonary and vascular functions, leading to systemic changes in blood oxygenation, basal cerebral blood flow (CBF), vascular reactivity, and neurovascular coupling. Certain anesthetics possess analgesic effects which would influence pain-related networks in the brain (Chuang and Nasrallah, 2017). Additionally, not only the dosage but also the route and timing of delivery can have an influence on the resting-state networks; as a rule, continuous delivery ensures more stable anesthesia depth and physiological states in comparison to bolus administration. Anesthetic effects are also animal species, gender, age, or disease-state dependent (Chuang and Nasrallah, 2017).
Methodological considerations for mouse rs-fMRI studies: Maintaining stable physiology is paramount for resting-state fMRI; constant monitoring and control of anesthetic dose, body temperature, blood oxygenation, respiratory and cardiac rates are crucial to obtain high quality data. Physiological recordings can also be used for removing nuisance signals later in the processing of data. Consistency in the use of strains, gender, age, weight, and housing conditions of animals are necessary to ensure reproducibility (Pan et al., 2015).
Most rodent rs-fMRI studies follow similar procedures to those designed for humans. However, due to very different brain size, shape, and tissue proportions, there are several aspects related to acquisition, pre-processing and analysis that need to be considered (Chuang and Nasrallah, 2017).
For the data acquisition, specialized high field scanners are used for rodent imaging: scanners with smaller bore size (20-30 cm) with field strengths 7, 9.4 or 11.7 T are common. Higher field strengths are necessary to increase the signal to noise ratios; in addition, strong gradients for higher spatial resolution and higher order shims for minimizing distortions are needed (Pan et al., 2015). These shims are additional electrical currents which are used to render the magnetic fields more uniform. Higher order shims have more complex geometrical configurations created by the electrical currents.
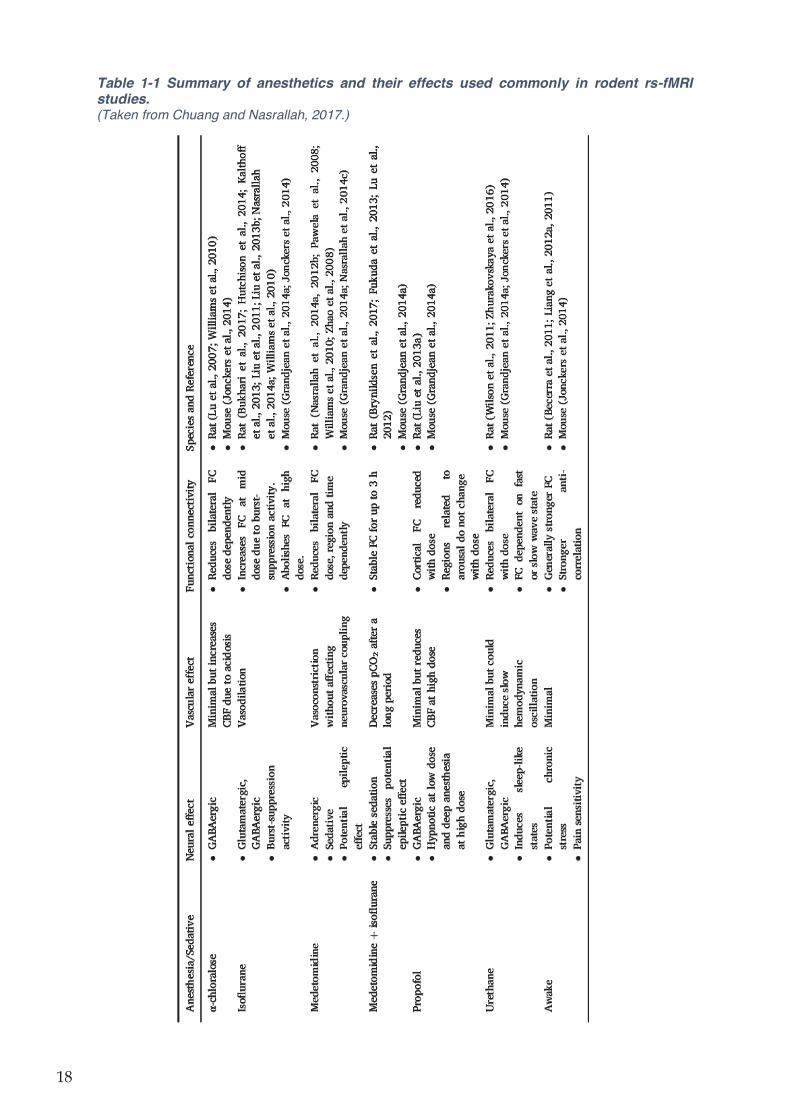
Table 1-1 Summary of anesthetics and their effects used commonly in rodent rs-fMRI studies. (Taken from Chuang and Nasrallah, 2017.)
Pre-processing pipelines of acquired data are very similar to those of human data; they generally include motion correction, band-pass filtering, de-trending, removal of nuisance covariates (i.e. global signal regression or white matter/cerebrospinal fluid regression) and smoothing. Normalization of images into a common stereotaxic space is also required for group analysis in mice data. Allen Mouse Brain Atlas (Lein et al., 2007) is a high definition reference atlas accompanied by a systematic, hierarchically organized taxonomy of brain structures. It is frequently used as a reference space in mouse rs-fMRI studies. Further data analysis can be performed with seed-based or data-driven (i.e. ICA, graph theory) methods discussed above.
1.1.3.2 Integration of functional and structural connectivity
In the animal brain, anterograde (or retrograde) and monosynaptic tract tracers can be utilized to determine the direction and density of axonal tracts between brain regions to reveal the circuitry of the brain (Oh et al., 2014; Zingg et al., 2014). Good correspondence between regions with strong direct projections and functional connectivity strength have been found for DMN (Stafford et al., 2014) and other cortical networks (Bergmann et al., 2016; Grandjean et al., 2017). Grandjean and colleagues (2017) suggested that cortical functional connectivity is mostly associated with monosynaptic projections whereas subcortical connectivity tends to depend on polysynaptic projections.
Hübner et al. (2017) studied cuprizone model of demyelinating pathology using both rs-fMRI and DTI methods. Their findings suggest that with loss of myelin, the functional connectivity decreases globally and the normal relation between white matter fractional anisotropy (FA) and functional connectivity ceases to exist. Furthermore, in mice strains characteristically lacking corpus callosum (e.g. I/LnJ; BTBR), inter-hemispherical functional connectivity was found to be decreased. Similarly, complete callosotomy resulted in fully disturbed bilateral functional connectivity (Magnuson et al., 2014) whereas partial callosotomy was observed to recover partially, possibly indicating the plasticity mediated by remaining projections (Zhou et al., 2014).
These findings highlight the importance of axonal connectivity that subserves the resting-state network topology and activity; and the potential plasticity that may occur to maintain the networks and their associated functions (Chuang and Nasrallah, 2017).
1.2 Neuropathic pain 1.2.1 Definition and Pathophysiology
Pain is an unpleasant sensory and emotional experience associated with actual or potential tissue damage, or described in terms of such damage (IASP 2011). While acute pain is a survival mechanism that serves as a warning sign and promotes self-preservation; chronic pain confers no individual or evolutionary advantage (Cohen and Mao, 2014). During my thesis, I focused my attention on one specific type of chronic pain: Namely, neuropathic pain, which is caused by a lesion or disease affecting the somatosensory system including peripheral fibers (i.e. Aβ, Aδ and C fibers) and central neurons (Colloca et al., 2017). Neuropathic pain affects 7 to 10% of the population and its incidence is likely to increase owing to ageing global population. It is more common in females and after the age of 50 years (Colloca et al., 2017). Around 15-25% of people with chronic pain are currently thought to suffer from neuropathic pain (Cohen and Mao, 2014). Comorbidities such as poor sleep, anxiety and depression are frequent in neuropathic pain and it greatly impairs quality of life and has a high socioeconomic impact on society (von Hehn et al., 2012).
Symptoms of neuropathic pain include spontaneous pain- either continuous or paroxysmal- such as burning and electrical-like sensations or evoked pain resulting from non-painful stimulation (allodynia) as well as increased responses to painful stimuli (hyperalgesia) (von Hehn et al., 2012). Neuropathic pain can be classified into two: central and peripheral neuropathic pain (Colloca et al., 2017).
i. Central neuropathic pain arises due to spinal cord and brain disorders: for example, cerebrovascular diseases affecting the central somatosensory pathways (post-stroke pain), neurodegenerative disorders (notably Parkinson’s), spinal cord injury, syringomyelia, demyelinating diseases (e.g. multiple sclerosis, transverse myelitis, neuromyelitis optica).
ii. Peripheral neuropathic pain can display generalized (usually symmetrical) or focal distribution. Causes of generalized peripheral neuropathic pain include diabetes or pre-diabetes, infections (e.g. HIV, leprosy), chemotherapy, immunological (Guillain-Barré) or inflammatory processes and inherited channelopathies. Focal neuropathic pain is caused by lesion of one or more peripheral nerves or nerve roots: for instance, post-herpetic neuralgia, post-traumatic neuropathy, trigeminal neuralgia, entrapment syndromes, HIV, leprosy, diabetes mellitus and complex regional pain syndrome (CRPS) type II.
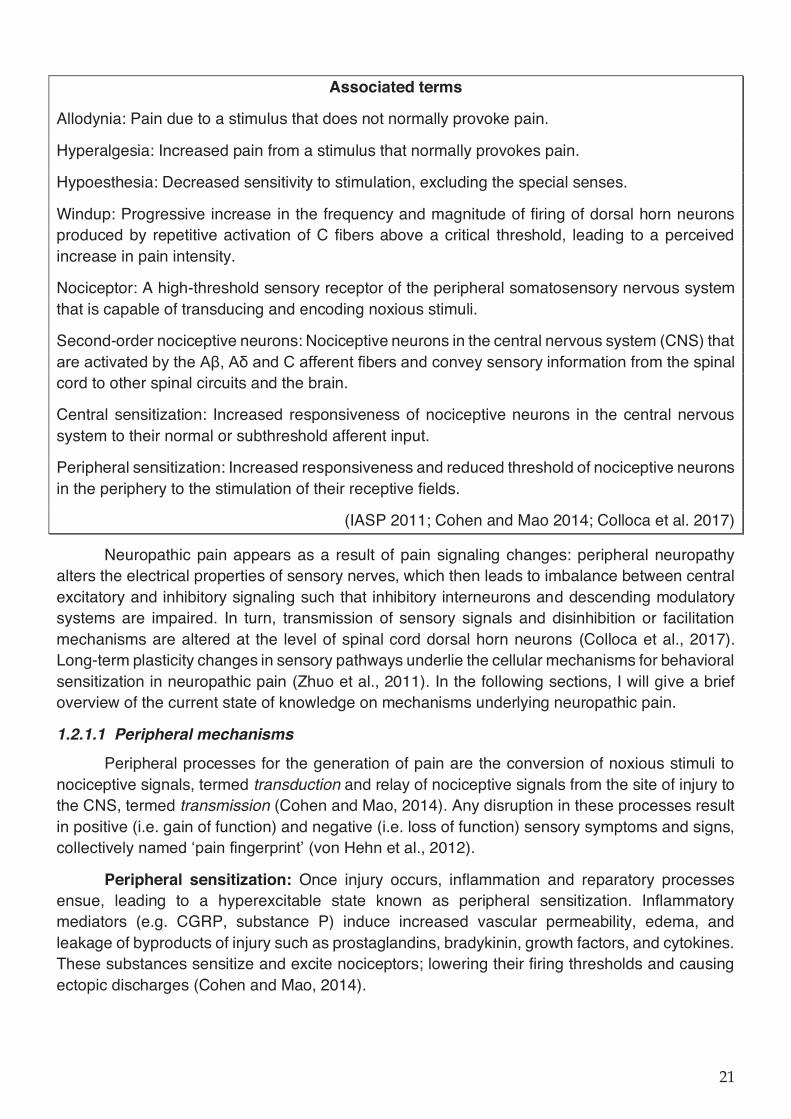
Associated terms
Allodynia: Pain due to a stimulus that does not normally provoke pain.
Hyperalgesia: Increased pain from a stimulus that normally provokes pain.
Hypoesthesia: Decreased sensitivity to stimulation, excluding the special senses.
Windup: Progressive increase in the frequency and magnitude of firing of dorsal horn neurons produced by repetitive activation of C fibers above a critical threshold, leading to a perceived increase in pain intensity.
Nociceptor: A high-threshold sensory receptor of the peripheral somatosensory nervous system that is capable of transducing and encoding noxious stimuli.
Second-order nociceptive neurons: Nociceptive neurons in the central nervous system (CNS) that are activated by the Aβ, Aδ and C afferent fibers and convey sensory information from the spinal cord to other spinal circuits and the brain.
Central sensitization: Increased responsiveness of nociceptive neurons in the central nervous system to their normal or subthreshold afferent input.
Peripheral sensitization: Increased responsiveness and reduced threshold of nociceptive neurons in the periphery to the stimulation of their receptive fields.
(IASP 2011; Cohen and Mao 2014; Colloca et al. 2017)
Neuropathic pain appears as a result of pain signaling changes: peripheral neuropathy alters the electrical properties of sensory nerves, which then leads to imbalance between central excitatory and inhibitory signaling such that inhibitory interneurons and descending modulatory systems are impaired. In turn, transmission of sensory signals and disinhibition or facilitation mechanisms are altered at the level of spinal cord dorsal horn neurons (Colloca et al., 2017). Long-term plasticity changes in sensory pathways underlie the cellular mechanisms for behavioral sensitization in neuropathic pain (Zhuo et al., 2011). In the following sections, I will give a brief overview of the current state of knowledge on mechanisms underlying neuropathic pain.
1.2.1.1 Peripheral mechanisms
Peripheral processes for the generation of pain are the conversion of noxious stimuli to nociceptive signals, termed transduction and relay of nociceptive signals from the site of injury to the CNS, termed transmission (Cohen and Mao, 2014). Any disruption in these processes result in positive (i.e. gain of function) and negative (i.e. loss of function) sensory symptoms and signs, collectively named ‘pain fingerprint’ (von Hehn et al., 2012).
Peripheral sensitization: Once injury occurs, inflammation and reparatory processes ensue, leading to a hyperexcitable state known as peripheral sensitization. Inflammatory mediators (e.g. CGRP, substance P) induce increased vascular permeability, edema, and leakage of byproducts of injury such as prostaglandins, bradykinin, growth factors, and cytokines. These substances sensitize and excite nociceptors; lowering their firing thresholds and causing ectopic discharges (Cohen and Mao, 2014).
Ectopic activity: Ectopic discharges along the nociceptive pathways after nerve injury can generate spontaneous pain in the absence of any external stimuli (von Hehn et al., 2012). Most frequently, hyperexcitability of primary sensory neurons induce ectopic action potentials leading to paresthesia, dysthesia, and spontaneous pain of differing features (e.g. continuous vs. episodic; superficial vs. deep; burning vs. shock-like) depending on the fibers affected. Even uninjured neighboring fibers can give rise to spontaneous pain via non-synaptic cross-talk, termed ephaptic transmission (Cohen and Mao, 2014).
Nerve injury drastically changes the expression, distribution, and phosphorylation of several ion channels in sensory neurons leading to changes in intrinsic membrane properties and generation of membrane potential oscillations resulting in rhythmic firing bursts in the absence of a stimulus. Downregulation of potassium channels, spontaneous sodium currents, mixed cation current through hyperpolarization-activated cyclic nucleotide-gated channels (HCN), activation of low threshold T-type calcium channels, changes in the expression profile of voltage-gated sodium channels, and downregulation of voltage-gated potassium channels contribute to hyperexcitability and generation of ectopic discharges (von Hehn et al., 2012).
1.2.1.2 Spinal mechanisms
Central sensitization: Ongoing discharge of peripheral afferent fibers with concomitant release of excitatory amino acids and neuropeptides leads to postsynaptic changes in second-order nociceptive neurons in the dorsal horn resulting in an excess of signaling (Colloca et al., 2017) and long-lasting synaptic plasticity that facilitates nociceptive processing, called central sensitization (von Hehn et al., 2012). Central sensitization provides a mechanism where nociceptive neurons have reduced thresholds, increased receptive field sizes and altered firing temporal dynamics. All these changes contribute to the generation of dynamic mechanical allodynia, hyperalgesia, and temporal summation.
Central sensitization results from homo-synaptic - similar to long term potentiation (LTP) - and hetero-synaptic (i.e. by a spread of the change in synaptic strength from activated to neighboring non-activated synapses) facilitation mechanisms. For homo-synaptic facilitation, alterations in postsynaptic calcium levels, caused by calcium influx through ionotropic receptors and voltage-gated calcium channels or by release from intracellular stores on activation of metabotropic receptors or receptor tyrosine kinases, initiate change in synaptic strength. Calcium-dependent intracellular signaling pathways produce posttranslational and transcriptional changes in various effector proteins, altering their levels, distribution, and functional activity. Some of the major players of activity-dependent central sensitization are NMDA and AMPA glutamate receptors, substance P NK1 receptor, BDNF and its TrkB receptor, CaMKII, PKA and PKC (von Hehn et al., 2012).
In hetero-synaptic facilitation, nociceptor-derived input can enable subsequent long-lasting facilitation of responses to input from low threshold Aβ and C fibers, and to afferent inputs from topographically different locations (von Hehn et al., 2012).
Glutamatergic regulation: Persistent and enhanced activation of ionotropic (NMDA, AMPA) and metabotropic glutamate receptors along with downregulation of glutamate transporters reduce the activation thresholds of glutamate receptors, increase neuronal excitability, and cause neurotoxicity. For instance, the progressive increase in the frequency and magnitude of firing of dorsal horn neurons produced by repetitive activation of C fibers, called windup, requires NMDA receptor activity (Cohen and Mao, 2014).
Loss of inhibition: After nerve injury, there is a loss of inhibitory currents at the spinal level as a result of dysfunctional GABA production and release, impaired intracellular homeostasis from reduced activity of K+Cl- cotransporter or increased activity of Na+K+-Cl- cotransporter, leading to increased Cl- levels; and apoptosis of spinal inhibitory interneurons. Loss of inhibition provokes tactile allodynia, hyperalgesia, and transmission of non-painful stimuli through Aβ fibers to nociceptive second-order neurons in the dorsal horn.
Glial mechanisms: Glial cells comprise about 70% of the CNS and play an important role in maintenance and homeostasis. Microglia are activated within 24 hours of nerve injury, and astrocytes follow shortly thereafter, with activation persisting for up to 12 weeks (Cohen and Mao, 2014). While previous experiments hypothesis that microglia might be important for initiation while astrocytes are important for maintenance of neuropathic pain (Zhuo et al., 2011), our unpublished data showed increased microglial activity even after the 8 weeks of neuropathic pain.
1.2.1.3 Supraspinal mechanisms
Standard view of central sensitization as a peripherally initiated process must be supplemented with the supraspinal mechanisms of brain reorganization, in order to account for the long-term maintenance (i.e. chronicity) of central sensitization (Farmer et al., 2012). Descending pathways that modulate the transmission of nociceptive signals originate in periaqueductal gray (PAG), locus coeruleus, anterior cingulate cortex (ACC), amygdala, and hypothalamus, and are mostly relayed through brainstem nuclei in the PAG and medulla to the spinal cord; although direct connections from cortical structures to spinal cord do exist (Chen et al., 2018). Descending modulation can be both inhibitory and faciliatory, with conflicting signals often arising from the same regions. The balance between inhibition and facilitation is dynamic and influenced by context, behavior, emotions, timing, and pathology. The neurotransmitters involved in descending modulatory pathways include noradrenaline (norepinephrine), 5-hydroxytryptamine (5-HT or serotonin), dopamine, and endogenous opioids (Cohen and Mao, 2014).
After nerve injury, several processes take place that mitigate the normal pain attenuating pathways: tonic noradrenergic inhibition decreases, and serotonergic modulation becomes predominantly facilitative. The initial spike mediated by changes in the activation and expression of glutamatergic receptors after injury is followed by a decrease in the excitability of rostral ventromedial medulla (RVM); which results in both facilitation and inhibition (Cohen and Mao, 2014). Furthermore, supraspinal centers such as ACC, prefrontal cortex (PFC), amygdala and PAG have been implicated in central sensitization, pathological plasticity and comorbidities associated with neuropathic pain (e.g. anxiety, major depression, and sleep disturbances); with detected alterations in brain structure and function in neuroimaging studies.
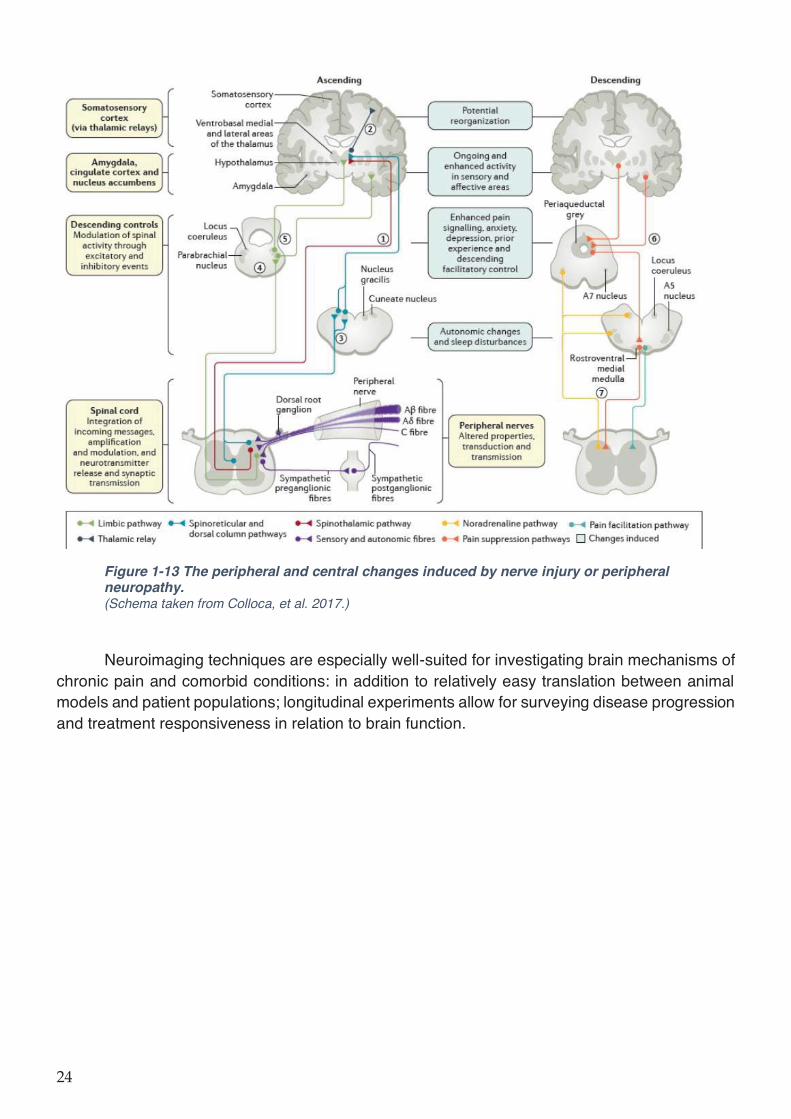
Figure 1-13 The peripheral and central changes induced by nerve injury or peripheral neuropathy. (Schema taken from Colloca, et al. 2017.)
Neuroimaging techniques are especially well-suited for investigating brain mechanisms of chronic pain and comorbid conditions: in addition to relatively easy translation between animal models and patient populations; longitudinal experiments allow for surveying disease progression and treatment responsiveness in relation to brain function.
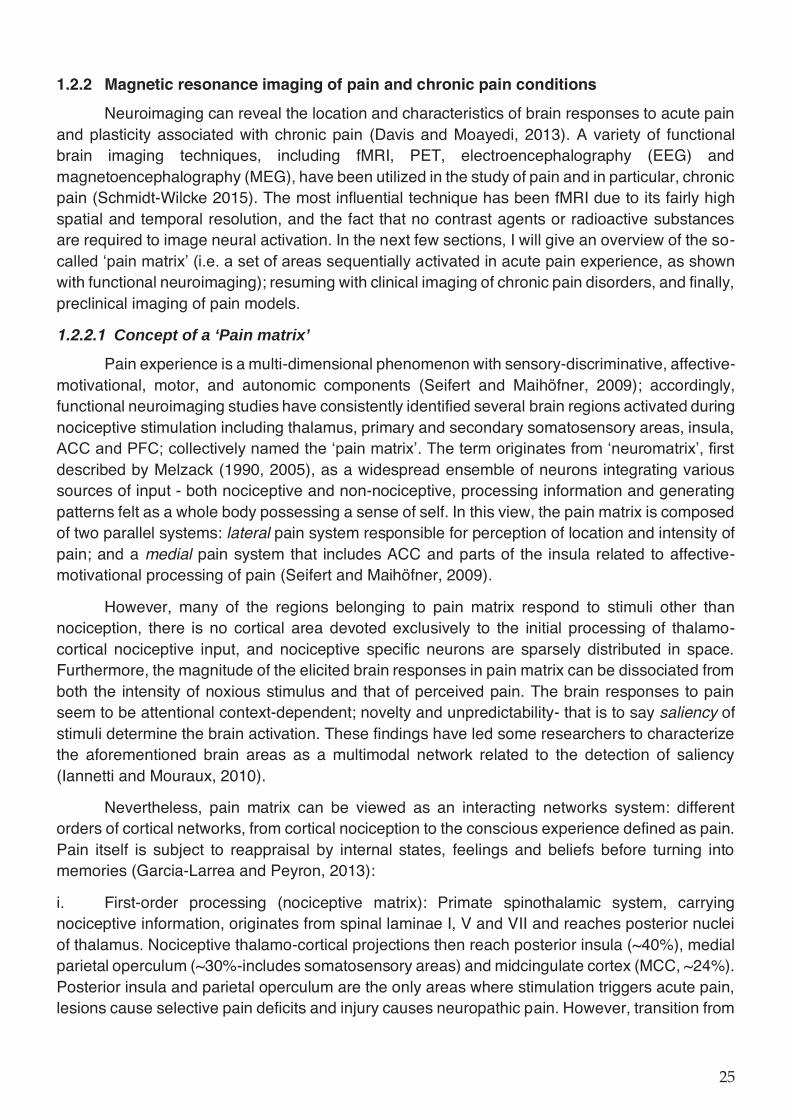
1.2.2 Magnetic resonance imaging of pain and chronic pain conditions
Neuroimaging can reveal the location and characteristics of brain responses to acute pain and plasticity associated with chronic pain (Davis and Moayedi, 2013). A variety of functional brain imaging techniques, including fMRI, PET, electroencephalography (EEG) and magnetoencephalography (MEG), have been utilized in the study of pain and in particular, chronic pain (Schmidt-Wilcke 2015). The most influential technique has been fMRI due to its fairly high spatial and temporal resolution, and the fact that no contrast agents or radioactive substances are required to image neural activation. In the next few sections, I will give an overview of the so-called ‘pain matrix’ (i.e. a set of areas sequentially activated in acute pain experience, as shown with functional neuroimaging); resuming with clinical imaging of chronic pain disorders, and finally, preclinical imaging of pain models.
1.2.2.1 Concept of a ‘Pain matrix’
Pain experience is a multi-dimensional phenomenon with sensory-discriminative, affective-motivational, motor, and autonomic components (Seifert and Maihöfner, 2009); accordingly, functional neuroimaging studies have consistently identified several brain regions activated during nociceptive stimulation including thalamus, primary and secondary somatosensory areas, insula, ACC and PFC; collectively named the ‘pain matrix’. The term originates from ‘neuromatrix’, first described by Melzack (1990, 2005), as a widespread ensemble of neurons integrating various sources of input - both nociceptive and non-nociceptive, processing information and generating patterns felt as a whole body possessing a sense of self. In this view, the pain matrix is composed of two parallel systems: lateral pain system responsible for perception of location and intensity of pain; and a medial pain system that includes ACC and parts of the insula related to affective-motivational processing of pain (Seifert and Maihöfner, 2009).
However, many of the regions belonging to pain matrix respond to stimuli other than nociception, there is no cortical area devoted exclusively to the initial processing of thalamo-cortical nociceptive input, and nociceptive specific neurons are sparsely distributed in space. Furthermore, the magnitude of the elicited brain responses in pain matrix can be dissociated from both the intensity of noxious stimulus and that of perceived pain. The brain responses to pain seem to be attentional context-dependent; novelty and unpredictability- that is to say saliency of stimuli determine the brain activation. These findings have led some researchers to characterize the aforementioned brain areas as a multimodal network related to the detection of saliency (Iannetti and Mouraux, 2010).
Nevertheless, pain matrix can be viewed as an interacting networks system: different orders of cortical networks, from cortical nociception to the conscious experience defined as pain. Pain itself is subject to reappraisal by internal states, feelings and beliefs before turning into memories (Garcia-Larrea and Peyron, 2013):
i. First-order processing (nociceptive matrix): Primate spinothalamic system, carrying nociceptive information, originates from spinal laminae I, V and VII and reaches posterior nuclei of thalamus. Nociceptive thalamo-cortical projections then reach posterior insula (~40%), medial parietal operculum (~30%-includes somatosensory areas) and midcingulate cortex (MCC, ~24%). Posterior insula and parietal operculum are the only areas where stimulation triggers acute pain, lesions cause selective pain deficits and injury causes neuropathic pain. However, transition from
nociception to conscious pain and its multiple attentional modulations requires the recruitment of a second set of areas.
ii. Second-order perceptual matrix: Other regions comprising the pain matrix, namely, mid-/anterior insula, ACC, PFC and posterior parietal areas are not direct targets of spinothalamic system, their direct stimulation does not evoke pain, or their selective destruction does not induce analgesia. These areas are also activated in contexts that are not related to pain and their contribution to pain experience depends on the context in which noxious stimuli are applied. The joint activity of the nociceptive and second order matrices is essential to ensure the modulation of vegetative reactions and internal feelings via anterior insular networks, the attentional modulation of sensory gain by top-down and bottom-up transactions and the conscious perception of pain via distributed brain activation.
iii. Third-order networks: High-level polymodal regions outside the classical pain matrix (i.e. pregenual cingulate, orbitofrontal cortex (OFC), temporal pole and anterolateral PFC) assign emotional significance, affective states and emotional responses to pain stimuli can enhance or attenuate subjective pain. Changes in the subjective pain require no adjustment of sensory gain but rather reappraisal of immediate pain perceptions. These areas have strong interconnections to subcortical descending pain control regions (e.g. PAG) and may also contribute to changes in the activity of ascending nociceptive systems (Garcia-Larrea and Peyron, 2013).
Figure 1-14 Graphical depiction of the ‘pain matrix’ of the human brain. A. sagittal; B. coronal views. (Adapted from Thompson and Bushnell, 2012.)
In contrast to acute pain, chronic pain cannot be regarded as a state of continuous nociceptive inputs to an otherwise normally functioning brain. Neuroplastic remodeling occurs on various levels of nervous system ranging from synaptic plasticity to reorganization of large scale neural networks, which can lead to the maintenance of pain even in the absence of nociceptive stimuli (Schmidt-Wilcke 2015). In a chronic pain state, there may be abnormal pain and/or salience/attention-related activity, disturbances in connectivity and/or morphology of the pain, attention and descending pain control networks (Davis and Moayedi, 2013). These abnormalities may represent pre-existing vulnerabilities or arise from disease/pain-driven plasticity.
1.2.2.2 Structural MRI in chronic pain conditions
In chronic pain, the brain regions commonly showing gray matter abnormalities are as follows: prefrontal cortex (PFC), insula, anterior cingulate cortex (ACC), mid-cingulate cortex (MCC), posterior cingulate cortex (PCC), thalamus, basal ganglia, somatosensory areas, supplementary motor area (SMA), temporal lobe, and brainstem (Davis and Moayedi, 2013). Most of the studies report a decrease in gray matter density/volume or a decrease in cortical thickness (Schmidt-Wilcke 2015) with the exceptions of basal ganglia, thalamus and brainstem. Volumetric alterations were described for neuropathic pain conditions: trigeminal neuralgia was linked with reductions in primary sensory cortex, anterior insula, putamen, NAc and thalamus volumes as well as increases in posterior insular area (Gustin et al., 2011). Yoon et al. (2013) found decreases in the gray matter volume of left dorsolateral PFC, bilateral insula, and subgenual ACC in patients with neuropathic pain following spinal cord injury.
Furthermore, voxel-based morphometry (VBM) study of a chronic back pain (CBP) population (Apkarian et al. 2004) showed decreases in the volume of dorsolateral PFC and right thalamus. In another study in this disorder (Schmidt-Wilcke et al. 2006), bilateral basal ganglia and left thalamus volumes were found to be increased. Patients with tension-type headache displayed reductions in dorsolateral prefrontal, somatosensory areas, and pons volumes (Schmidt-Wilcke et al. 2005). Kuchinad and colleagues (2007) have shown decreases in left hippocampus, bilateral MCC and PCC, left insula, and medial prefrontal cortex (mPFC) volumes in fibromyalgia; whereas Lutz et al. (2008) demonstrated volume reductions in postcentral gyrus, amygdala, superior frontal gyrus, ACC, and hippocampus in patients with the same pathology. Complex regional pain syndrome (CRPS) was found to be associated with gray matter atrophy in right insula, ventromedial PFC, nucleus accumbens (NAc) (Geha et al., 2008), and hippocampus (Mutso et al. 2013); hippocampal volume loss was also detected in chronic back pain patients.
DTI studies performed in various chronic pain conditions found white matter changes in several brain areas. DaSilva and colleagues (2007) reported for instance decreased fractional anisotropy (FA) for tracts connecting brainstem-thalamus and thalamus-primary somatosensory areas in migraine sufferers. In fibromyalgia, there were decreases in FA values in thalamus and insula; together with increases in postcentral gyrus (Lutz et al., 2008). Geha et al. (2008) showed white matter connectivity changes along ventromedial PFC, anterior insula, and NAc in CRPS patients. In temporo-mandibular disorder (TMD), decreases in FA was accompanied by increases in mean diffusivity (MD) and radial diffusivity (RD) values in corpus callosum and internal/external capsule related to sensory thalamocortical communication (Moayedi et al., 2012); tractography revealed reduced fiber density in genu of corpus callosum and dorsolateral PFC in addition to fiber increases in other parts of corpus callosum and frontal poles. There were also conflicting findings for the same pathologies in different studies. Chen et al. (2011) found increases in FA in anterior insula, thalamus (i.e. ventral posterolateral nuclei), fornix, and external capsule in irritable bowel syndrome (IBS); whereas another group reported FA decreases in thalamus, basal ganglia, sensory-motor association areas along with increased FA in frontal lobe and corpus callosum (Ellingson et al., 2013).
1.2.2.3 Functional MRI in chronic pain conditions
fMRI technique has been extensively used to study brain function and connectivity across various chronic pain conditions. In a cohort with diabetic neuropathic pain, Cauda et al. (2010)
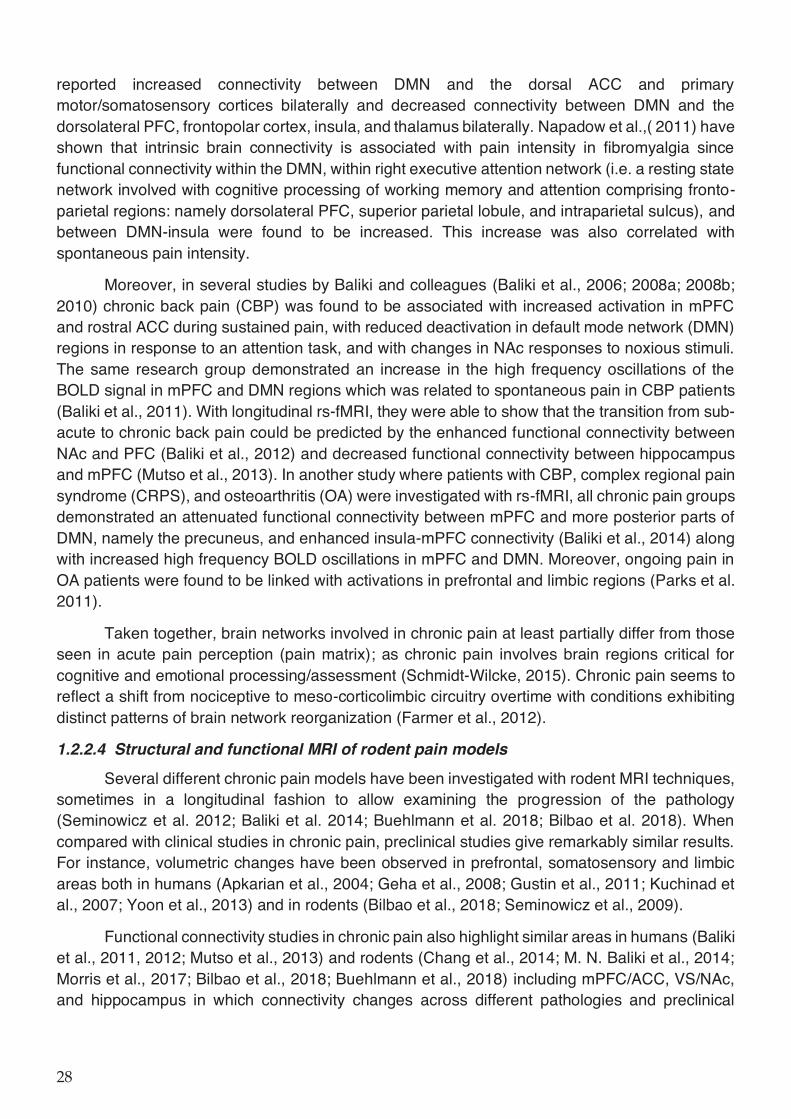
reported increased connectivity between DMN and the dorsal ACC and primary motor/somatosensory cortices bilaterally and decreased connectivity between DMN and the dorsolateral PFC, frontopolar cortex, insula, and thalamus bilaterally. Napadow et al.,( 2011) have shown that intrinsic brain connectivity is associated with pain intensity in fibromyalgia since functional connectivity within the DMN, within right executive attention network (i.e. a resting state network involved with cognitive processing of working memory and attention comprising fronto-parietal regions: namely dorsolateral PFC, superior parietal lobule, and intraparietal sulcus), and between DMN-insula were found to be increased. This increase was also correlated with spontaneous pain intensity.
Moreover, in several studies by Baliki and colleagues (Baliki et al., 2006; 2008a; 2008b; 2010) chronic back pain (CBP) was found to be associated with increased activation in mPFC and rostral ACC during sustained pain, with reduced deactivation in default mode network (DMN) regions in response to an attention task, and with changes in NAc responses to noxious stimuli. The same research group demonstrated an increase in the high frequency oscillations of the BOLD signal in mPFC and DMN regions which was related to spontaneous pain in CBP patients (Baliki et al., 2011). With longitudinal rs-fMRI, they were able to show that the transition from sub-acute to chronic back pain could be predicted by the enhanced functional connectivity between NAc and PFC (Baliki et al., 2012) and decreased functional connectivity between hippocampus and mPFC (Mutso et al., 2013). In another study where patients with CBP, complex regional pain syndrome (CRPS), and osteoarthritis (OA) were investigated with rs-fMRI, all chronic pain groups demonstrated an attenuated functional connectivity between mPFC and more posterior parts of DMN, namely the precuneus, and enhanced insula-mPFC connectivity (Baliki et al., 2014) along with increased high frequency BOLD oscillations in mPFC and DMN. Moreover, ongoing pain in OA patients were found to be linked with activations in prefrontal and limbic regions (Parks et al. 2011).
Taken together, brain networks involved in chronic pain at least partially differ from those seen in acute pain perception (pain matrix); as chronic pain involves brain regions critical for cognitive and emotional processing/assessment (Schmidt-Wilcke, 2015). Chronic pain seems to reflect a shift from nociceptive to meso-corticolimbic circuitry overtime with conditions exhibiting distinct patterns of brain network reorganization (Farmer et al., 2012).
1.2.2.4 Structural and functional MRI of rodent pain models
Several different chronic pain models have been investigated with rodent MRI techniques, sometimes in a longitudinal fashion to allow examining the progression of the pathology (Seminowicz et al. 2012; Baliki et al. 2014; Buehlmann et al. 2018; Bilbao et al. 2018). When compared with clinical studies in chronic pain, preclinical studies give remarkably similar results. For instance, volumetric changes have been observed in prefrontal, somatosensory and limbic areas both in humans (Apkarian et al., 2004; Geha et al., 2008; Gustin et al., 2011; Kuchinad et al., 2007; Yoon et al., 2013) and in rodents (Bilbao et al., 2018; Seminowicz et al., 2009).
Functional connectivity studies in chronic pain also highlight similar areas in humans (Baliki et al., 2011, 2012; Mutso et al., 2013) and rodents (Chang et al., 2014; M. N. Baliki et al., 2014; Morris et al., 2017; Bilbao et al., 2018; Buehlmann et al., 2018) including mPFC/ACC, VS/NAc, and hippocampus in which connectivity changes across different pathologies and preclinical

models were demonstrated. Following table gives a summary of brain structural and functional MRI studies in rodent chronic pain models (Table ).
Table 1-2 Preclinical imaging studies in rodent chronic pain models. Abbreviations: DBM: Deformation-based morphometry; VBM: Voxel-based morphometry; MRS: Magnetic resonance spectroscopy; MEMRI: manganese-enhanced MRI; FC: Functional connectivity; CC: Clustering coefficient; DR2: Dopamine receptor-2; PFC: Prefrontal cortex; RSP: Retrosplenial area; SS: Somatosensory area; MO: Motor area; TH: Thalamus; HY: Hypothalamus; PAG: Periaqueductal gray; HIP: Hippocampus; NAc: Nucleus accumbens; CPu: Caudate-putamen; VP: Ventral pallidum; AMY: Amygdala; CeA: Central amygdala; ACC: Anterior cingulate cortex; ORB: Orbital area; VS: Ventral striatum; VPL: Ventral posterolateral nucleus of thalamus; PL: Prelimbic area; BG: Basal ganglia; BNST: Bed nucleus of stria terminalis; ZI: Zona incerta.
Study Species Model Imaging modality Findings
Seminowicz et al.,
2009
Rat
Spared nerve injury (SNI)
T1-weighted MRI/ DBM
Age-related volume decreases in both shams and SNI animals.
Lower PFC, RSP, entorhinal cortex, SS, and insula volumes in SNI group at 4 months after injury-coincides with anxiety phenotype.
Seminowicz et al., 2012
Rat Spinal cord injury (SCI)
Rs-fMRI FC of TH contralateral to injury was increased with ipsilateral TH, PAG, and HIP; decreased with SS areas 1w after injury.
Asynchrony between thalamus and cortex was thought to be due to enhanced thalamic activity resulting in neuropathic pain.
Chang et al., 2014 Rat Spared nerve injury (SNI)
Rs-fMRI FC decreases in subregions of NAc towards CPu, insula, and SS areas at 28d after injury. Decreases correlated with mechanical allodynia and reduced DR2 expression in NAc contralateral to injury. DR2 is engaged in indirect striatopallidal pathway; whose inactivation results in aversive learning.
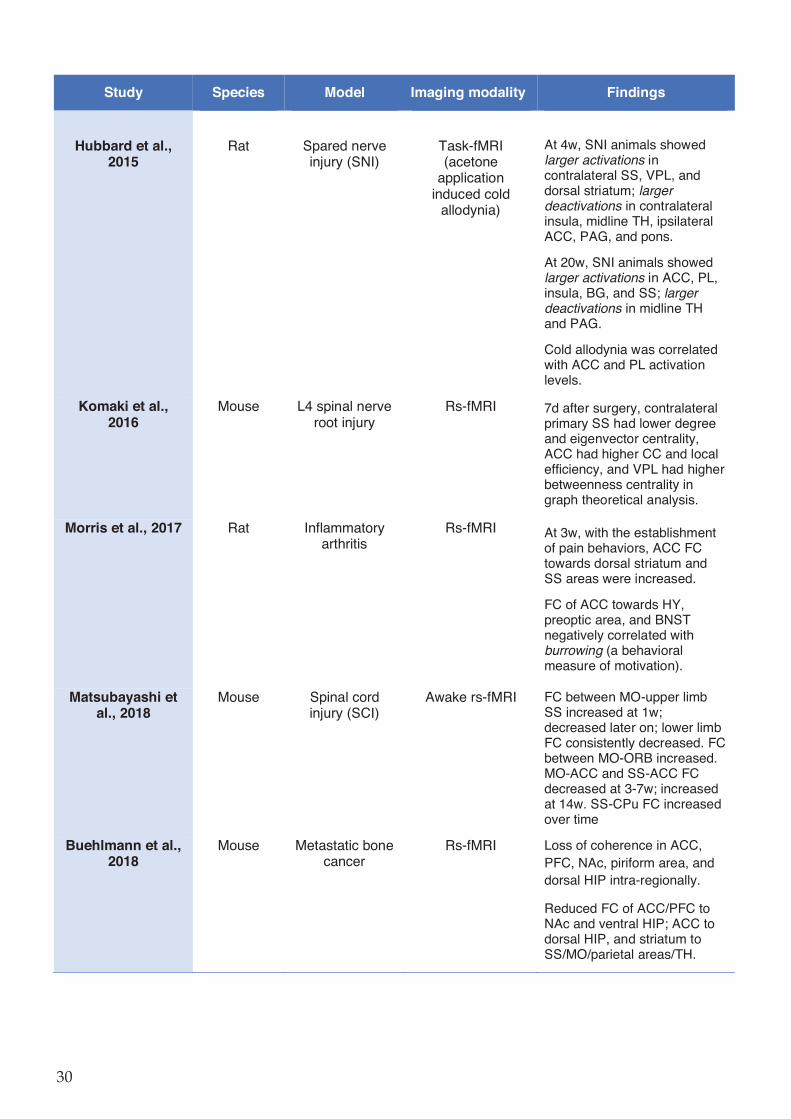
Study Species Model Imaging modality Findings
Hubbard et al., 2015
Rat
Spared nerve injury (SNI)
Task-fMRI (acetone
application induced cold
allodynia)
At 4w, SNI animals showed larger activations in contralateral SS, VPL, and dorsal striatum; larger deactivations in contralateral insula, midline TH, ipsilateral ACC, PAG, and pons.
At 20w, SNI animals showed larger activations in ACC, PL, insula, BG, and SS; larger deactivations in midline TH and PAG.
Cold allodynia was correlated with ACC and PL activation levels.
Komaki et al., 2016
Mouse L4 spinal nerve root injury
Rs-fMRI 7d after surgery, contralateral primary SS had lower degree and eigenvector centrality, ACC had higher CC and local efficiency, and VPL had higher betweenness centrality in graph theoretical analysis.
Morris et al., 2017 Rat Inflammatory arthritis
Rs-fMRI At 3w, with the establishment of pain behaviors, ACC FC towards dorsal striatum and SS areas were increased.
FC of ACC towards HY, preoptic area, and BNST negatively correlated with burrowing (a behavioral measure of motivation).
Matsubayashi et al., 2018
Mouse Spinal cord injury (SCI)
Awake rs-fMRI FC between MO-upper limb SS increased at 1w; decreased later on; lower limb FC consistently decreased. FC between MO-ORB increased. MO-ACC and SS-ACC FC decreased at 3-7w; increased at 14w. SS-CPu FC increased over time
Buehlmann et al., 2018
Mouse Metastatic bone cancer
Rs-fMRI Loss of coherence in ACC, PFC, NAc, piriform area, and dorsal HIP intra-regionally.
Reduced FC of ACC/PFC to NAc and ventral HIP; ACC to dorsal HIP, and striatum to SS/MO/parietal areas/TH.
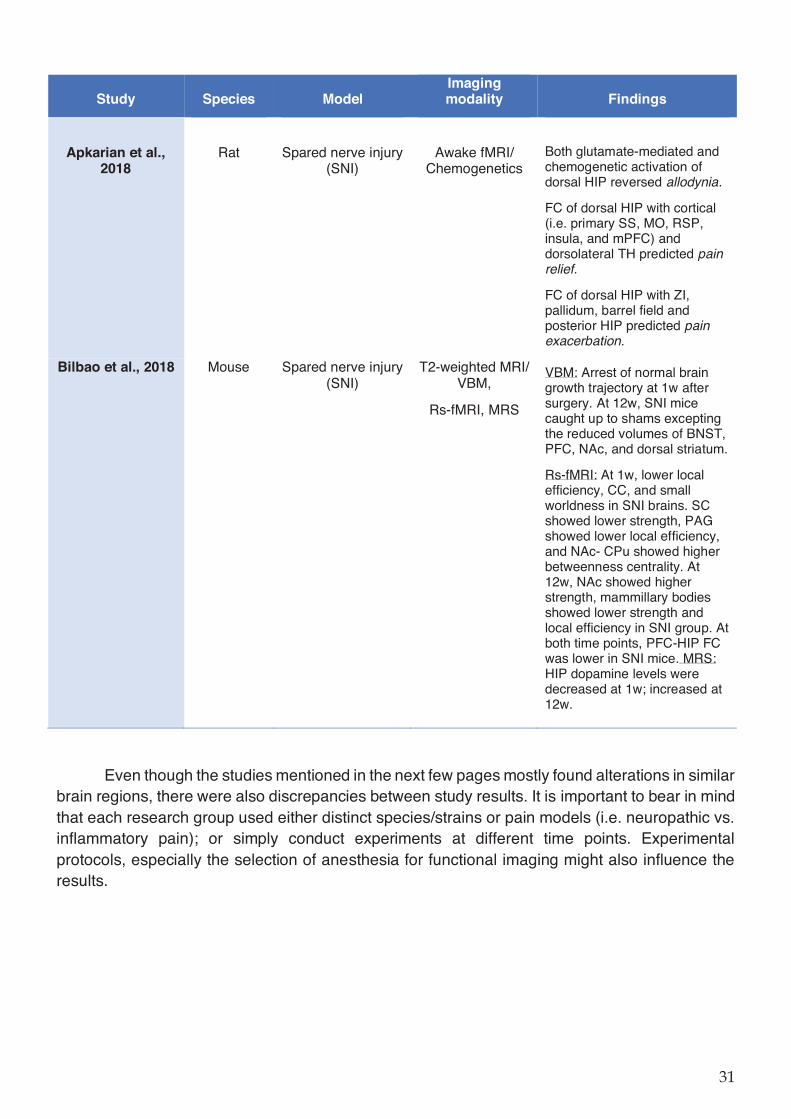
Study Species Model Imaging modality Findings
Apkarian et al., 2018
Rat
Spared nerve injury (SNI)
Awake fMRI/ Chemogenetics
Both glutamate-mediated and chemogenetic activation of dorsal HIP reversed allodynia.
FC of dorsal HIP with cortical (i.e. primary SS, MO, RSP, insula, and mPFC) and dorsolateral TH predicted pain relief.
FC of dorsal HIP with ZI, pallidum, barrel field and posterior HIP predicted pain exacerbation.
Bilbao et al., 2018 Mouse Spared nerve injury (SNI)
T2-weighted MRI/ VBM,
Rs-fMRI, MRS
VBM: Arrest of normal brain growth trajectory at 1w after surgery. At 12w, SNI mice caught up to shams excepting the reduced volumes of BNST, PFC, NAc, and dorsal striatum.
Rs-fMRI: At 1w, lower local efficiency, CC, and small worldness in SNI brains. SC showed lower strength, PAG showed lower local efficiency, and NAc- CPu showed higher betweenness centrality. At 12w, NAc showed higher strength, mammillary bodies showed lower strength and local efficiency in SNI group. At both time points, PFC-HIP FC was lower in SNI mice. MRS: HIP dopamine levels were decreased at 1w; increased at 12w.
Even though the studies mentioned in the next few pages mostly found alterations in similar brain regions, there were also discrepancies between study results. It is important to bear in mind that each research group used either distinct species/strains or pain models (i.e. neuropathic vs. inflammatory pain); or simply conduct experiments at different time points. Experimental protocols, especially the selection of anesthesia for functional imaging might also influence the results.
1.2.3 Affective consequences of chronic pain
Chronic pain and neuropsychiatric conditions such as stress, anxiety, sleep disturbances, and depression are significantly comorbid (DosSantos et al., 2017). Indeed, a wealth of clinical data suggests a high degree of comorbidity between chronic pain and depression, with an incidence of approximately 50% (Doan et al., 2015). Both animal models and human brain imaging studies show strong similarities between chronic pain and mood disorders; both conditions critically involve limbic brain circuits (Baliki and Apkarian, 2015) related to reward and motivational behaviors. Significant overlap between affected brain regions in chronic pain and mood disorders might explain their comorbidity based on ‘shared substrate hypothesis’ which defines the comorbidity of pain and depression as the plasticity of specific brain regions processing both the emotional aspect of pain and mood-related information (Yalcin et al., 2014a). Transition from acute to chronic pain has been associated with a gradual shift from sensory neural activity toward a limbic representation of spontaneous pain (Vachon-Presseau et al., 2016); possibly achieved by reorganization of cortex by corticolimbic learning mechanisms. Functional, chemical, and anatomical changes from chronic pain can, in time, alter the sensory, emotional and motivational systems and result in comorbidities such as depression (Shelton et al., 2012). Another view in the field regards nociception, pain and negative mood states a single continuum of aversion in the framework of behavioral selection (Baliki and Apkarian, 2015), which explains the overlap between structures affected by each condition.
In the following sections, I give a brief overview of brain regions implicated in both depression and chronic pain; stating their role in reward and aversive behaviors and discussing their dysfunction - with an emphasis on imaging findings. Gaining insight into each pathology might pave the way for reaching an understanding of their comorbidity.
1.2.3.1 Reward/aversion system and its dysfunction in chronic pain and depression
The reward circuit comprises several cortical and subcortical regions forming a complex network that mediates different aspects of incentive-based learning, leading to adaptive behaviors (Haber and Knutson, 2010). In mammals, encoding reward and directing motivated behaviors require the coordination of multiple brain regions including nucleus accumbens (NAc), amygdala, prefrontal cortex (PFC), substantia nigra (SN), ventral tegmental area (VTA), dorsal raphe nucleus (DRN), and lateral habenula (LHb).
The connections between these regions and others define the reward circuitry and they appear to be conserved between rodents and primates (Scaplen and Kaun, 2016). Brain reward circuitry is responsible for reinforcing behaviors that are rewarding and preventing behaviors that lead to punishment (Proulx et al., 2014) and it is involved in incentive salience, learning, and memory of rewards; ensuring survival of the organism (Arias-Carrión et al., 2010).
Dopamine (DA) is recognized as the main neurotransmitter in reward circuitry. Evidence for differential dopamine-dependent positive and negative reinforcement learning exists in both rodents and humans via different receptor subtypes (i.e. DR1/DR2). Furthermore, gamma aminobutryric acid (GABA), noradrenaline, opioid peptides, serotonin, acetylcholine (ACh), endocannabinoids, and glutamate are also implicated in acute reinforcing properties in mammals, mainly through modulatory processes (Scaplen and Kaun, 2016).
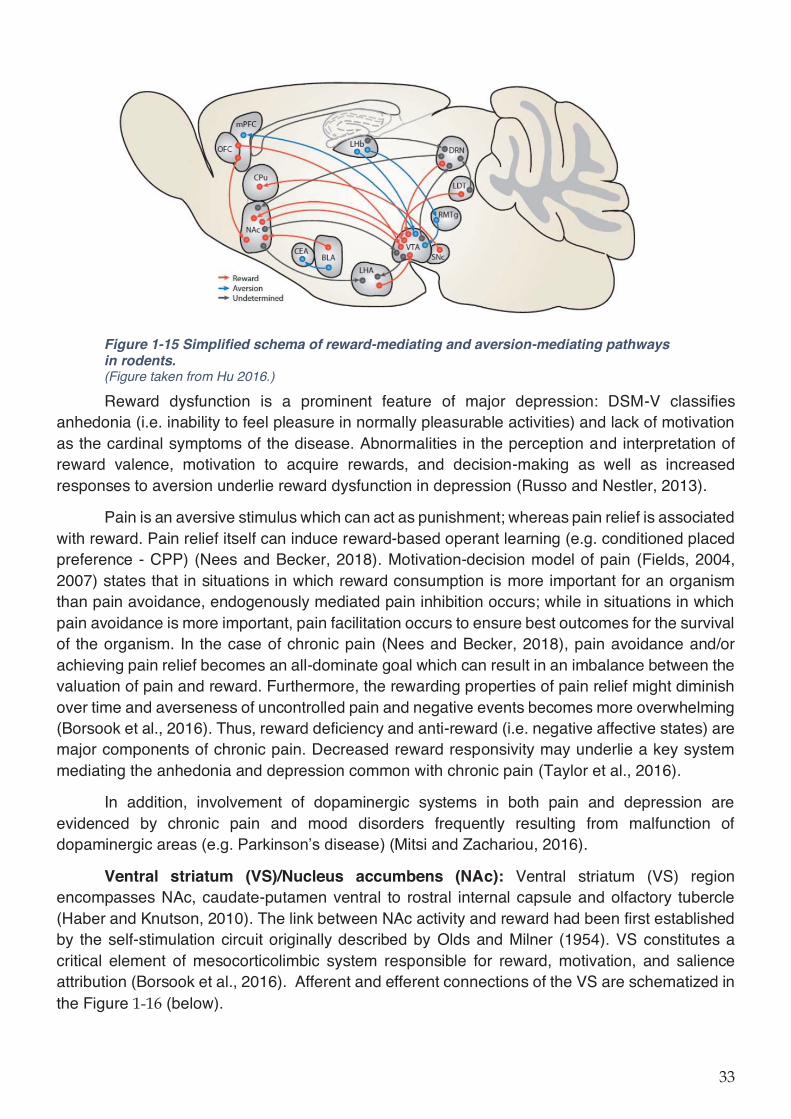
Figure 1-15 Simplified schema of reward-mediating and aversion-mediating pathways in rodents. (Figure taken from Hu 2016.)
Reward dysfunction is a prominent feature of major depression: DSM-V classifies anhedonia (i.e. inability to feel pleasure in normally pleasurable activities) and lack of motivation as the cardinal symptoms of the disease. Abnormalities in the perception and interpretation of reward valence, motivation to acquire rewards, and decision-making as well as increased responses to aversion underlie reward dysfunction in depression (Russo and Nestler, 2013).
Pain is an aversive stimulus which can act as punishment; whereas pain relief is associated with reward. Pain relief itself can induce reward-based operant learning (e.g. conditioned placed preference - CPP) (Nees and Becker, 2018). Motivation-decision model of pain (Fields, 2004, 2007) states that in situations in which reward consumption is more important for an organism than pain avoidance, endogenously mediated pain inhibition occurs; while in situations in which pain avoidance is more important, pain facilitation occurs to ensure best outcomes for the survival of the organism. In the case of chronic pain (Nees and Becker, 2018), pain avoidance and/or achieving pain relief becomes an all-dominate goal which can result in an imbalance between the valuation of pain and reward. Furthermore, the rewarding properties of pain relief might diminish over time and averseness of uncontrolled pain and negative events becomes more overwhelming (Borsook et al., 2016). Thus, reward deficiency and anti-reward (i.e. negative affective states) are major components of chronic pain. Decreased reward responsivity may underlie a key system mediating the anhedonia and depression common with chronic pain (Taylor et al., 2016).
In addition, involvement of dopaminergic systems in both pain and depression are evidenced by chronic pain and mood disorders frequently resulting from malfunction of dopaminergic areas (e.g. Parkinson’s disease) (Mitsi and Zachariou, 2016).
Ventral striatum (VS)/Nucleus accumbens (NAc): Ventral striatum (VS) region encompasses NAc, caudate-putamen ventral to rostral internal capsule and olfactory tubercle (Haber and Knutson, 2010). The link between NAc activity and reward had been first established by the self-stimulation circuit originally described by Olds and Milner (1954). VS constitutes a critical element of mesocorticolimbic system responsible for reward, motivation, and salience attribution (Borsook et al., 2016). Afferent and efferent connections of the VS are schematized in the Figure (below).
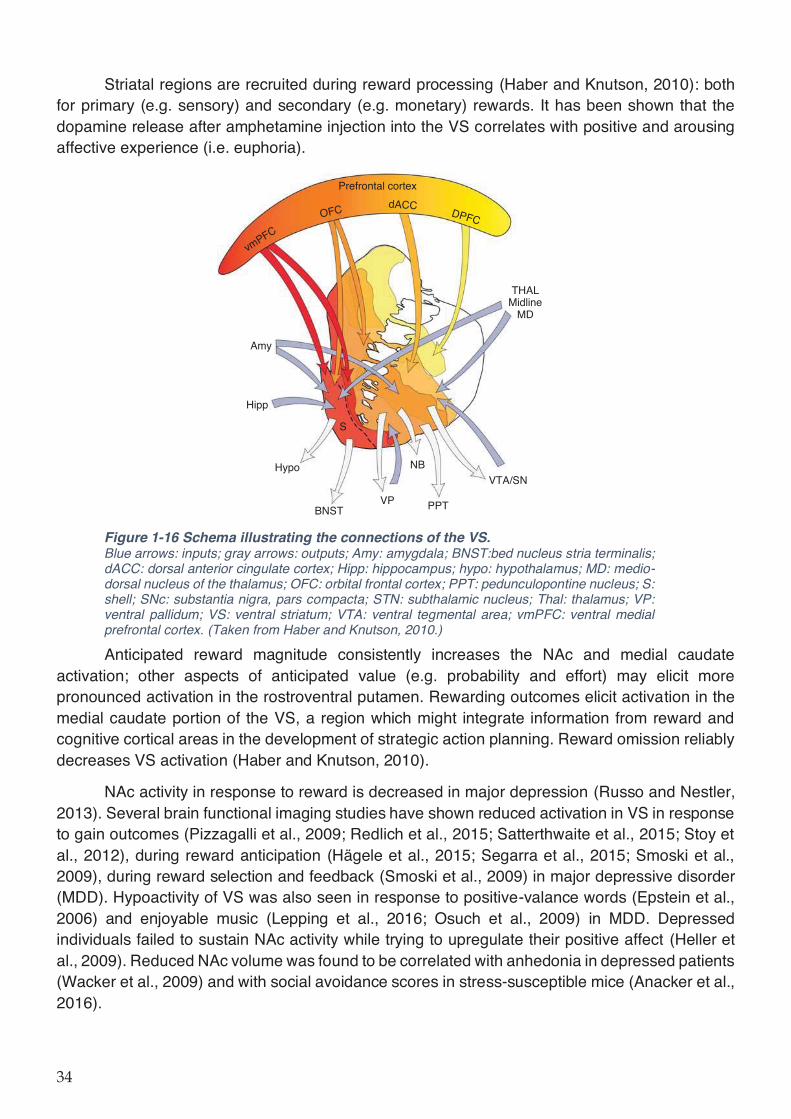
Striatal regions are recruited during reward processing (Haber and Knutson, 2010): both for primary (e.g. sensory) and secondary (e.g. monetary) rewards. It has been shown that the dopamine release after amphetamine injection into the VS correlates with positive and arousing affective experience (i.e. euphoria).
Figure 1-16 Schema illustrating the connections of the VS. Blue arrows: inputs; gray arrows: outputs; Amy: amygdala; BNST:bed nucleus stria terminalis; dACC: dorsal anterior cingulate cortex; Hipp: hippocampus; hypo: hypothalamus; MD: medio-dorsal nucleus of the thalamus; OFC: orbital frontal cortex; PPT: pedunculopontine nucleus; S: shell; SNc: substantia nigra, pars compacta; STN: subthalamic nucleus; Thal: thalamus; VP: ventral pallidum; VS: ventral striatum; VTA: ventral tegmental area; vmPFC: ventral medial prefrontal cortex. (Taken from Haber and Knutson, 2010.)
Anticipated reward magnitude consistently increases the NAc and medial caudate activation; other aspects of anticipated value (e.g. probability and effort) may elicit more pronounced activation in the rostroventral putamen. Rewarding outcomes elicit activation in the medial caudate portion of the VS, a region which might integrate information from reward and cognitive cortical areas in the development of strategic action planning. Reward omission reliably decreases VS activation (Haber and Knutson, 2010).
NAc activity in response to reward is decreased in major depression (Russo and Nestler, 2013). Several brain functional imaging studies have shown reduced activation in VS in response to gain outcomes (Pizzagalli et al., 2009; Redlich et al., 2015; Satterthwaite et al., 2015; Stoy et al., 2012), during reward anticipation (Hägele et al., 2015; Segarra et al., 2015; Smoski et al., 2009), during reward selection and feedback (Smoski et al., 2009) in major depressive disorder (MDD). Hypoactivity of VS was also seen in response to positive-valance words (Epstein et al., 2006) and enjoyable music (Lepping et al., 2016; Osuch et al., 2009) in MDD. Depressed individuals failed to sustain NAc activity while trying to upregulate their positive affect (Heller et al., 2009). Reduced NAc volume was found to be correlated with anhedonia in depressed patients (Wacker et al., 2009) and with social avoidance scores in stress-susceptible mice (Anacker et al., 2016).
S
Amy
Prefrontal cortex
vmPFC
OFCdACC
DPFC
Hipp
Hypo
BNSTVP
NB
PPT
VTA/SN
THALMidline
MD
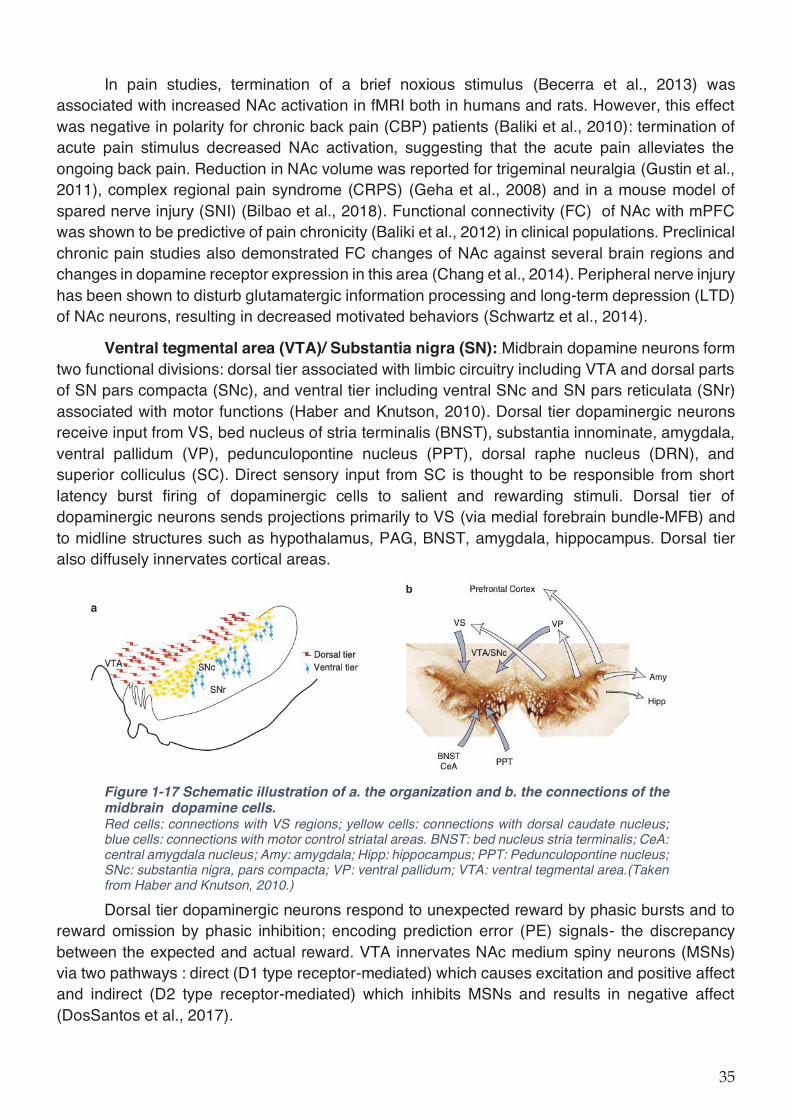
In pain studies, termination of a brief noxious stimulus (Becerra et al., 2013) was associated with increased NAc activation in fMRI both in humans and rats. However, this effect was negative in polarity for chronic back pain (CBP) patients (Baliki et al., 2010): termination of acute pain stimulus decreased NAc activation, suggesting that the acute pain alleviates the ongoing back pain. Reduction in NAc volume was reported for trigeminal neuralgia (Gustin et al., 2011), complex regional pain syndrome (CRPS) (Geha et al., 2008) and in a mouse model of spared nerve injury (SNI) (Bilbao et al., 2018). Functional connectivity (FC) of NAc with mPFC was shown to be predictive of pain chronicity (Baliki et al., 2012) in clinical populations. Preclinical chronic pain studies also demonstrated FC changes of NAc against several brain regions and changes in dopamine receptor expression in this area (Chang et al., 2014). Peripheral nerve injury has been shown to disturb glutamatergic information processing and long-term depression (LTD) of NAc neurons, resulting in decreased motivated behaviors (Schwartz et al., 2014).
Ventral tegmental area (VTA)/ Substantia nigra (SN): Midbrain dopamine neurons form two functional divisions: dorsal tier associated with limbic circuitry including VTA and dorsal parts of SN pars compacta (SNc), and ventral tier including ventral SNc and SN pars reticulata (SNr) associated with motor functions (Haber and Knutson, 2010). Dorsal tier dopaminergic neurons receive input from VS, bed nucleus of stria terminalis (BNST), substantia innominate, amygdala, ventral pallidum (VP), pedunculopontine nucleus (PPT), dorsal raphe nucleus (DRN), and superior colliculus (SC). Direct sensory input from SC is thought to be responsible from short latency burst firing of dopaminergic cells to salient and rewarding stimuli. Dorsal tier of dopaminergic neurons sends projections primarily to VS (via medial forebrain bundle-MFB) and to midline structures such as hypothalamus, PAG, BNST, amygdala, hippocampus. Dorsal tier also diffusely innervates cortical areas.
Figure 1-17 Schematic illustration of a. the organization and b. the connections of the midbrain dopamine cells. Red cells: connections with VS regions; yellow cells: connections with dorsal caudate nucleus; blue cells: connections with motor control striatal areas. BNST: bed nucleus stria terminalis; CeA: central amygdala nucleus; Amy: amygdala; Hipp: hippocampus; PPT: Pedunculopontine nucleus; SNc: substantia nigra, pars compacta; VP: ventral pallidum; VTA: ventral tegmental area.(Taken from Haber and Knutson, 2010.)
Dorsal tier dopaminergic neurons respond to unexpected reward by phasic bursts and to reward omission by phasic inhibition; encoding prediction error (PE) signals- the discrepancy between the expected and actual reward. VTA innervates NAc medium spiny neurons (MSNs) via two pathways : direct (D1 type receptor-mediated) which causes excitation and positive affect and indirect (D2 type receptor-mediated) which inhibits MSNs and results in negative affect (DosSantos et al., 2017).

Human fMRI studies has shown that dorsal tier dopaminergic neurons increase their activity in response to stimuli that predict reward (Haber and Knutson, 2010). Additionally, a small percentage of dopaminergic neurons (mostly found in dorsolateral SN with projections to NAc core) fire preferentially during aversive stimuli (e.g. noxious stimuli) or during both aversive and rewarding stimuli. Neurons activated by both rewarding and punishing stimuli are likely to code motivational salience independent of valence (Taylor et al., 2016). Dopamine modulates the salience of pain stimuli and thereby mediates the motivation to avoid or endure pain depending on the situational context explained in motivation-decision model of pain (Fields, 2007).
Different rodent models of stress-induced depression reveal differences in VTA and mesolimbic reward pathway modulation. Mouse model of social defeat stress was associated with increased activity in VTA dopaminergic neurons and higher brain-derived neurotrophic factor (BDNF) levels in NAc (Berton et al., 2006). Optogenetic activation of VTA-NAc pathway in this model resulted in even higher BDNF levels in NAc which was absent for stress-naïve mice (Walsh et al., 2014). Imaging in this model (Anacker et al., 2016) demonstrated that larger VTA volume was correlated with social avoidance scores. In addition, stress-susceptible mice tended to have larger VTA and smaller cingulate volumes.
However, chronic unpredictable mild stress (CUMS) model showed decreased activity in VTA-mPFC pathway but not in VTA-NAc pathway (Liu et al., 2018) and injection of BDNF into mPFC reversed depression-like behaviors. In clinical imaging, VS and VTA functional connectivity was higher in depression group (Redlich et al., 2015). Gradin et al. (2011) have shown lower prediction-error (PE) signals in both striatum and midbrain during reward learning and this signal reduction was correlated with anhedonia scores. Moreover, weaker memory for positive material along with lower activation in dopaminergic midbrain were found in depressed patients (Dillon et al., 2014).
Chronic pain models in rodents also show discrepancies in dopaminergic system alterations: In a rat model of peripheral nerve injury, microglial activation in VTA has been shown to result in disruption of dopaminergic signaling and reward behavior (Taylor et al., 2015); these effects were mediated by microglia-regulated activation of chloride channels in GABAergic VTA interneurons. Ko et al (2018) showed increased GABAergic and decreased dopaminergic neuronal activity in a rat model of spinal cord injury (SCI). Inflammatory pain in rats (Hipólito et al., 2015) resulted in lower levels of mu-opioid receptors in VTA along with a loss of opioid-induced dopamine release in NAc. In the spared nerve injury (SNI) model, spontaneous spiking of VTA and extracellular dopamine in NAc were reduced together with increased cell-specific excitability of NAc shell indirect pathway neurons; which was shown to be responsible from amplification of tactile allodynia (Ren et al., 2015). In a study using manganese-enhanced MRI (MEMRI) in a rat model of knee-joint pain, MnCl2 accumulation was decreased in VTA (i.e. showing lower activity) in line with hyperalgesia (Devonshire et al., 2017). Watanabe and colleagues (2018) used both nerve injury and cancer pain models in mice and replicated the findings of reduced neuronal excitability of VTA dopaminergic neurons projecting to NAc; moreover, optogenetic stimulation of VTA dopamine neurons or their terminals in NAc reversed pathological allodynia.
On the other hand, a study using SNI reported an increase in bursting activity and dopamine release in VTA along with higher serotonergic activity in dorsal raphe (Sagheddu et al., 2015); yet, another study in SNI model showed increased firing rate but not burst firing of VTA
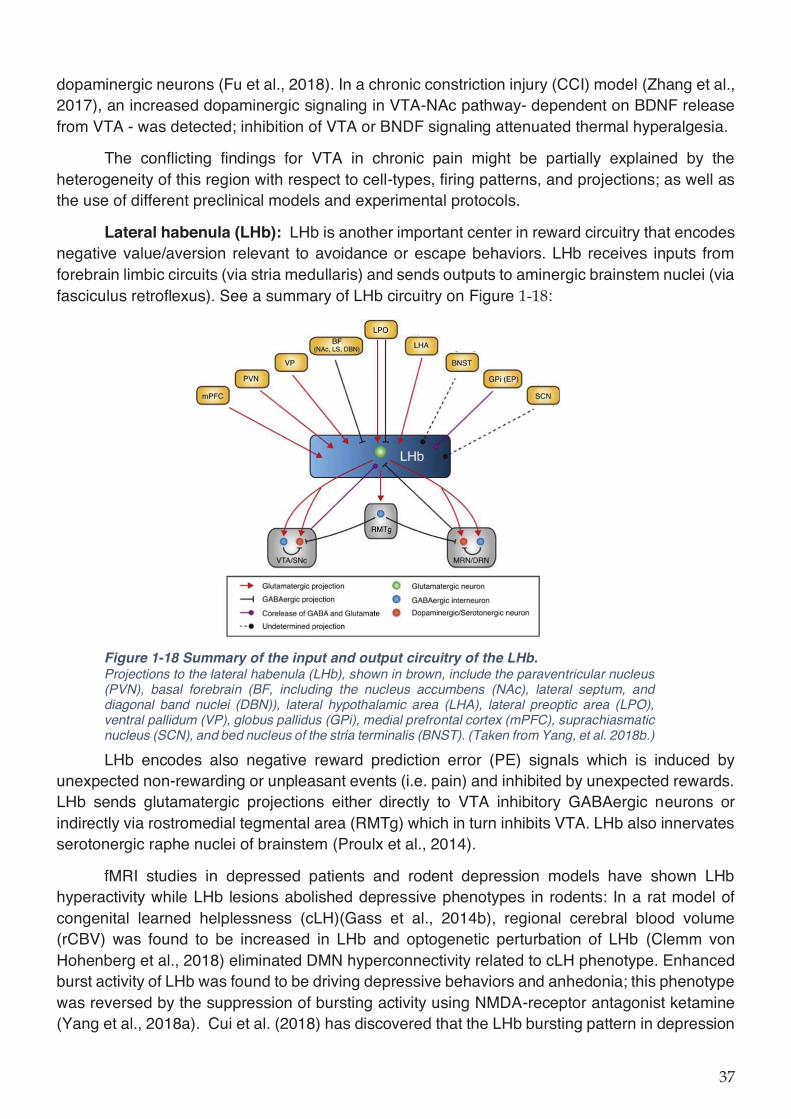
dopaminergic neurons (Fu et al., 2018). In a chronic constriction injury (CCI) model (Zhang et al., 2017), an increased dopaminergic signaling in VTA-NAc pathway- dependent on BDNF release from VTA - was detected; inhibition of VTA or BNDF signaling attenuated thermal hyperalgesia.
The conflicting findings for VTA in chronic pain might be partially explained by the heterogeneity of this region with respect to cell-types, firing patterns, and projections; as well as the use of different preclinical models and experimental protocols.
Lateral habenula (LHb): LHb is another important center in reward circuitry that encodes negative value/aversion relevant to avoidance or escape behaviors. LHb receives inputs from forebrain limbic circuits (via stria medullaris) and sends outputs to aminergic brainstem nuclei (via fasciculus retroflexus). See a summary of LHb circuitry on Figure :
Figure 1-18 Summary of the input and output circuitry of the LHb. Projections to the lateral habenula (LHb), shown in brown, include the paraventricular nucleus (PVN), basal forebrain (BF, including the nucleus accumbens (NAc), lateral septum, and diagonal band nuclei (DBN)), lateral hypothalamic area (LHA), lateral preoptic area (LPO), ventral pallidum (VP), globus pallidus (GPi), medial prefrontal cortex (mPFC), suprachiasmatic nucleus (SCN), and bed nucleus of the stria terminalis (BNST). (Taken from Yang, et al. 2018b.)
LHb encodes also negative reward prediction error (PE) signals which is induced by unexpected non-rewarding or unpleasant events (i.e. pain) and inhibited by unexpected rewards. LHb sends glutamatergic projections either directly to VTA inhibitory GABAergic neurons or indirectly via rostromedial tegmental area (RMTg) which in turn inhibits VTA. LHb also innervates serotonergic raphe nuclei of brainstem (Proulx et al., 2014).
fMRI studies in depressed patients and rodent depression models have shown LHb hyperactivity while LHb lesions abolished depressive phenotypes in rodents: In a rat model of congenital learned helplessness (cLH)(Gass et al., 2014b), regional cerebral blood volume (rCBV) was found to be increased in LHb and optogenetic perturbation of LHb (Clemm von Hohenberg et al., 2018) eliminated DMN hyperconnectivity related to cLH phenotype. Enhanced burst activity of LHb was found to be driving depressive behaviors and anhedonia; this phenotype was reversed by the suppression of bursting activity using NMDA-receptor antagonist ketamine (Yang et al., 2018a). Cui et al. (2018) has discovered that the LHb bursting pattern in depression
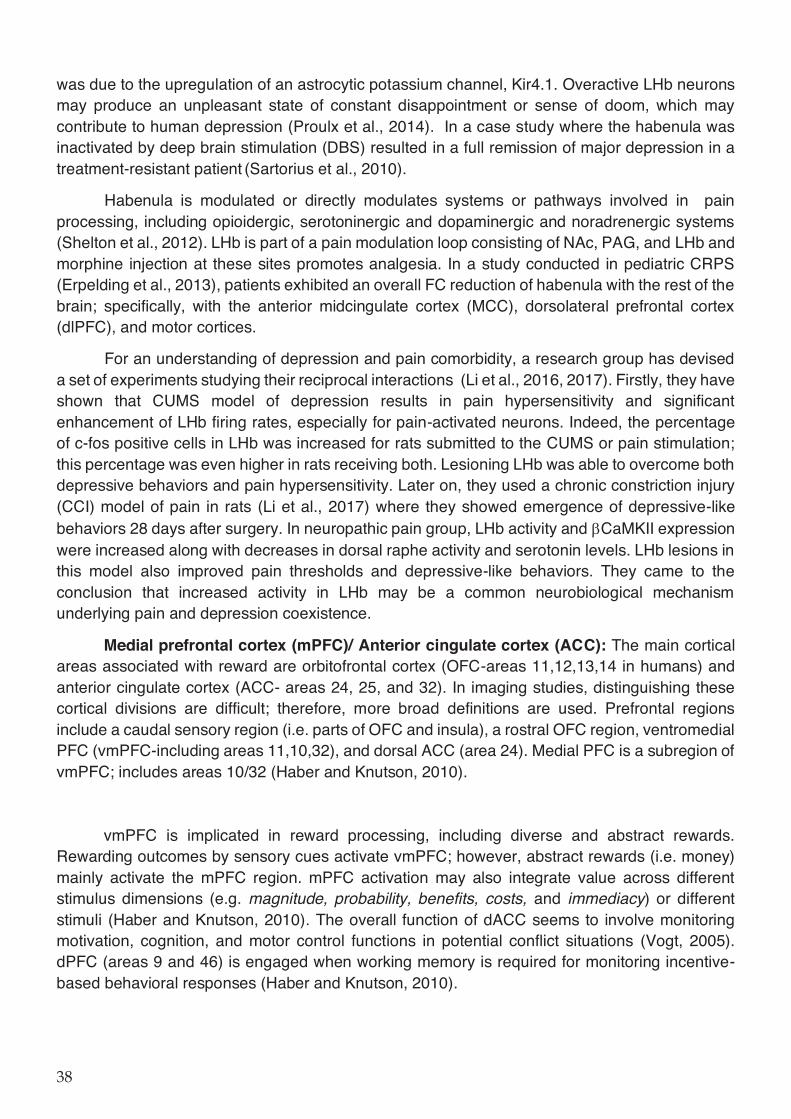
was due to the upregulation of an astrocytic potassium channel, Kir4.1. Overactive LHb neurons may produce an unpleasant state of constant disappointment or sense of doom, which may contribute to human depression (Proulx et al., 2014). In a case study where the habenula was inactivated by deep brain stimulation (DBS) resulted in a full remission of major depression in a treatment-resistant patient (Sartorius et al., 2010).
Habenula is modulated or directly modulates systems or pathways involved in pain processing, including opioidergic, serotoninergic and dopaminergic and noradrenergic systems (Shelton et al., 2012). LHb is part of a pain modulation loop consisting of NAc, PAG, and LHb and morphine injection at these sites promotes analgesia. In a study conducted in pediatric CRPS (Erpelding et al., 2013), patients exhibited an overall FC reduction of habenula with the rest of the brain; specifically, with the anterior midcingulate cortex (MCC), dorsolateral prefrontal cortex (dlPFC), and motor cortices.
For an understanding of depression and pain comorbidity, a research group has devised a set of experiments studying their reciprocal interactions (Li et al., 2016, 2017). Firstly, they have shown that CUMS model of depression results in pain hypersensitivity and significant enhancement of LHb firing rates, especially for pain-activated neurons. Indeed, the percentage of c-fos positive cells in LHb was increased for rats submitted to the CUMS or pain stimulation; this percentage was even higher in rats receiving both. Lesioning LHb was able to overcome both depressive behaviors and pain hypersensitivity. Later on, they used a chronic constriction injury (CCI) model of pain in rats (Li et al., 2017) where they showed emergence of depressive-like behaviors 28 days after surgery. In neuropathic pain group, LHb activity and CaMKII expression were increased along with decreases in dorsal raphe activity and serotonin levels. LHb lesions in this model also improved pain thresholds and depressive-like behaviors. They came to the conclusion that increased activity in LHb may be a common neurobiological mechanism underlying pain and depression coexistence.
Medial prefrontal cortex (mPFC)/ Anterior cingulate cortex (ACC): The main cortical areas associated with reward are orbitofrontal cortex (OFC-areas 11,12,13,14 in humans) and anterior cingulate cortex (ACC- areas 24, 25, and 32). In imaging studies, distinguishing these cortical divisions are difficult; therefore, more broad definitions are used. Prefrontal regions include a caudal sensory region (i.e. parts of OFC and insula), a rostral OFC region, ventromedial PFC (vmPFC-including areas 11,10,32), and dorsal ACC (area 24). Medial PFC is a subregion of vmPFC; includes areas 10/32 (Haber and Knutson, 2010).
vmPFC is implicated in reward processing, including diverse and abstract rewards. Rewarding outcomes by sensory cues activate vmPFC; however, abstract rewards (i.e. money) mainly activate the mPFC region. mPFC activation may also integrate value across different stimulus dimensions (e.g. magnitude, probability, benefits, costs, and immediacy) or different stimuli (Haber and Knutson, 2010). The overall function of dACC seems to involve monitoring motivation, cognition, and motor control functions in potential conflict situations (Vogt, 2005). dPFC (areas 9 and 46) is engaged when working memory is required for monitoring incentive-based behavioral responses (Haber and Knutson, 2010).
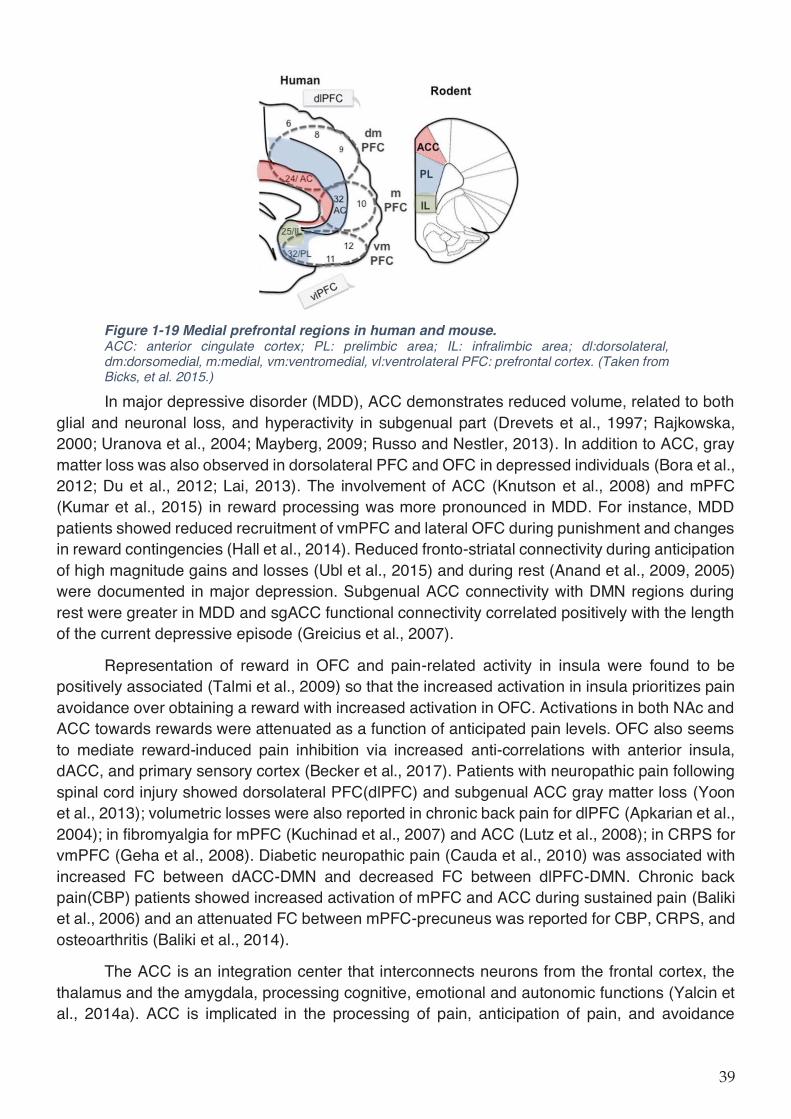
Figure 1-19 Medial prefrontal regions in human and mouse. ACC: anterior cingulate cortex; PL: prelimbic area; IL: infralimbic area; dl:dorsolateral, dm:dorsomedial, m:medial, vm:ventromedial, vl:ventrolateral PFC: prefrontal cortex. (Taken from Bicks, et al. 2015.)
In major depressive disorder (MDD), ACC demonstrates reduced volume, related to both glial and neuronal loss, and hyperactivity in subgenual part (Drevets et al., 1997; Rajkowska, 2000; Uranova et al., 2004; Mayberg, 2009; Russo and Nestler, 2013). In addition to ACC, gray matter loss was also observed in dorsolateral PFC and OFC in depressed individuals (Bora et al., 2012; Du et al., 2012; Lai, 2013). The involvement of ACC (Knutson et al., 2008) and mPFC (Kumar et al., 2015) in reward processing was more pronounced in MDD. For instance, MDD patients showed reduced recruitment of vmPFC and lateral OFC during punishment and changes in reward contingencies (Hall et al., 2014). Reduced fronto-striatal connectivity during anticipation of high magnitude gains and losses (Ubl et al., 2015) and during rest (Anand et al., 2009, 2005) were documented in major depression. Subgenual ACC connectivity with DMN regions during rest were greater in MDD and sgACC functional connectivity correlated positively with the length of the current depressive episode (Greicius et al., 2007).
Representation of reward in OFC and pain-related activity in insula were found to be positively associated (Talmi et al., 2009) so that the increased activation in insula prioritizes pain avoidance over obtaining a reward with increased activation in OFC. Activations in both NAc and ACC towards rewards were attenuated as a function of anticipated pain levels. OFC also seems to mediate reward-induced pain inhibition via increased anti-correlations with anterior insula, dACC, and primary sensory cortex (Becker et al., 2017). Patients with neuropathic pain following spinal cord injury showed dorsolateral PFC(dlPFC) and subgenual ACC gray matter loss (Yoon et al., 2013); volumetric losses were also reported in chronic back pain for dlPFC (Apkarian et al., 2004); in fibromyalgia for mPFC (Kuchinad et al., 2007) and ACC (Lutz et al., 2008); in CRPS for vmPFC (Geha et al., 2008). Diabetic neuropathic pain (Cauda et al., 2010) was associated with increased FC between dACC-DMN and decreased FC between dlPFC-DMN. Chronic back pain(CBP) patients showed increased activation of mPFC and ACC during sustained pain (Baliki et al., 2006) and an attenuated FC between mPFC-precuneus was reported for CBP, CRPS, and osteoarthritis (Baliki et al., 2014).
The ACC is an integration center that interconnects neurons from the frontal cortex, the thalamus and the amygdala, processing cognitive, emotional and autonomic functions (Yalcin et al., 2014a). ACC is implicated in the processing of pain, anticipation of pain, and avoidance
learning; this region shows synaptic changes and increased activity in various chronic pain models along with volume decrease associated with emergence of anxiety behaviors (Seminowicz et al., 2009; Yalcin et al., 2014a). ACC is thought to play an important role in pain-depression comorbidity: Hyperactivity of this region (comprising areas 24a/24b in mice) was associated with anxio-depressive consequences in a cuff model of neuropathic pain in mice (Sellmeijer et al., 2018) and optogenetic inhibition of the area provided relief from pain aversion and anxio-depressive phenotype without affecting mechanical hypersensitivity in this model. Another study (Barthas et al., 2017) showed ACC overexpression of mitogen-activated protein kinase phosphatase-1 (MKP-1) in chronic pain-induced depression, CUMS model and ACC optogenetic stimulation in mice which was reversed by antidepressant use; knockout, local silencing and pharmacological inhibition of MKP-1 alleviated depressive behaviors. In addition, lesion or optogenetic activation of prelimbic area (PL), part of rodent mPFC, induced both analgesic and anxiolytic effects; GABAergic activation in the region decreased pain responses and anxiety, and activation of PL projections to the NAc produced relief from chronic pain (Lee et al., 2015; Vachon-Presseau et al., 2016; Wang et al., 2015; Z. Zhang et al., 2015).
Amygdala: Amygdala is responsible from emotional coding of environmental stimuli and providing contextual information used for adjusting motivational level. Imaging studies show that amygdala activates both in contexts of potential reward and punishment, thus it responds more to stimulus arousal than value. Amygdala is prominently implicated in fear learning in animal studies; in addition, amygdala deactivates in response to devaluation of previously rewarding stimuli (Haber and Knutson, 2010).
Amygdala hyperactivity, especially seen in basolateral amygdala (BLA) excitatory tone, was demonstrated in MDD (Russo and Nestler, 2013). In functional neuroimaging, depressed patients showed enhanced activity in the amygdala and bilateral caudate-putamen (CPu) in response to individualized self-critical words compared to controls (Doerig et al., 2016). Moreover, amygdala was coupled positively with bilateral medial temporal, ventral occipital regions and negatively with the ACC in depressed individuals in an implicit sad affect processing task (Chen et al., 2008) and chronic antidepressant use induced higher functional coupling of amygdala with right frontal cortex, ACC, striatum, and thalamus. During viewing of negative pictures, depression severity correlated with left amygdala, bilateral OFC and left insula activity (Lee et al., 2007). In addition, bilateral amygdala volume reduction was detected in patients with depression (Hickie et al., 2007; Sheline et al., 1998).
Amygdala is also another candidate for an important player in affective consequences of pain. In addition to fear processing, amygdala (i.e. central amygdala) has connections to pain centers and contains nociceptive neurons (Yalcin et al., 2014a). Amygdala hyperactivity and volume increase (Gonçalves et al., 2008), along with signaling changes in several neurotransmitter systems have been observed in chronic pain models. Amygdala involvement in spinal cord central sensitization processes and influence on PFC (Baliki and Apkarian, 2015) further highlights the role of amygdala in chronic pain.
Hippocampus: Hippocampal regions are anatomically and functionally connected to reward circuitry (Haber and Knutson, 2010). Reward processes modulate memory formation and reward learning informs goal-directed behaviors (Adcock et al., 2006; Kahn and Shohamy, 2013; Le Merre et al., 2018).
Hippocampus dysfunction had long been observed in major depressive disorder (MDD) (Belzung et al., 2015; Wingenfeld and Wolf, 2014) including reduced hippocampal volume associated with synaptic and glial loss (Russo and Nestler, 2013). In addition, neuroimaging research featuring reward tasks in major depression discovered various hippocampal abnormalities: Reward learning signals in many regions including VS, ACC, retrosplenial cortex (RSP), midbrain, and hippocampus were reduced for depressed patients (Kumar et al., 2008). Dorsal raphe, PAG and hippocampus were hyperactive during unsuccessful loss-avoidance, whereas median raphe was hypoactive (Johnston et al., 2015); during loss events, hippocampus failed to deactivate. Healthy subjects demonstrated a stronger encoding response in the right parahippocampus and dopaminergic midbrain for reward-paired drawings versus non-rewards (Dillon et al., 2014) while depressed individuals showed the opposite pattern.
Furthermore, hippocampus likely plays a role in cognitive and affective consequences of chronic pain: deficits in working memory and short/long-term memory have been detected in chronic pain models (Yalcin et al., 2014a). Neurogenesis and synaptic plasticity were shown to be impaired in preclinical pain models (Mutso et al., 2012). In a rat spared nerve injury (SNI) model, increased HIP connectivity towards VS and sensorimotor areas inversely correlated with mechanical pain thresholds (Baliki et al., 2014) and activation of dorsal HIP reversed allodynia in the same model (Apkarian et al., 2018). Hippocampus volume was found to be reduced in chronic pain patients with fibromyalgia (Kuchinad et al., 2007; Lutz et al., 2008), CRPS, and CBP (Mutso et al., 2013). Moreover, decreased FC between hippocampus and mPFC (Mutso et al., 2013) predicted chronification of back pain.
Ventral pallidum (VP): In rats, the term VP was first used to describe the forebrain region below the anterior commissure, extending into anterior perforated space that contained pallidal-like cells. Substantia innominata (SI) is also an extension of the reward-related striato-pallidal complex. VP receives inputs from VS, subthalamic nucleus (STN), and midbrain dopaminergic neurons and projects to STN, hypothalamus, SN/VTA, PPT, MD nucleus of thalamus, striatum, and LHb (Haber and Knutson, 2010). Glutamatergic VP neurons seems to play a role in aversion processing, while canonical GABAergic VP neurons promote reinforcement and encode the hedonic value of reward (Wulff et al., 2018) via their influence on VTA and LHb.
Thalamus: Mediodorsal nucleus (MD) of thalamus projects to PFC and is the final link in the reward circuit; it completes the reward circuit back to cortex. MD receives reciprocal and non-reciprocal inputs from the cortex. Thalamic relay nuclei from the basal ganglia seem to integrate information flow from reward and higher cortical association areas of the PFC (Haber and Knutson, 2010).
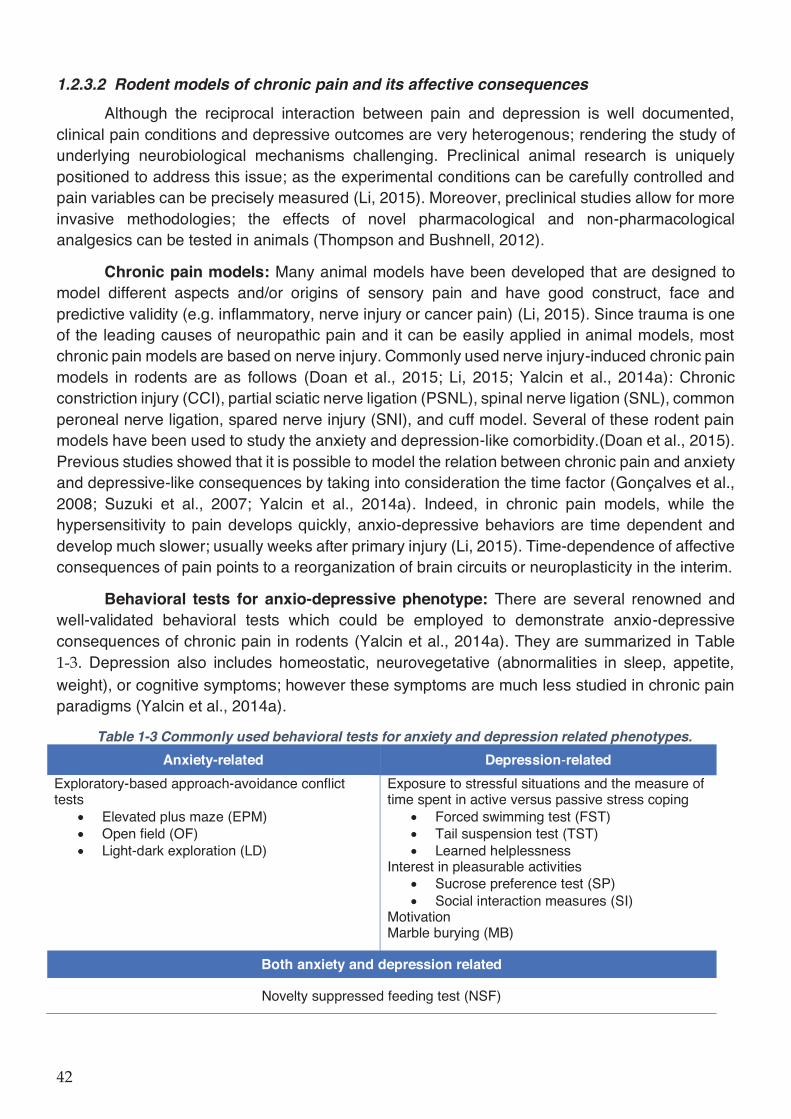
1.2.3.2 Rodent models of chronic pain and its affective consequences
Although the reciprocal interaction between pain and depression is well documented, clinical pain conditions and depressive outcomes are very heterogenous; rendering the study of underlying neurobiological mechanisms challenging. Preclinical animal research is uniquely positioned to address this issue; as the experimental conditions can be carefully controlled and pain variables can be precisely measured (Li, 2015). Moreover, preclinical studies allow for more invasive methodologies; the effects of novel pharmacological and non-pharmacological analgesics can be tested in animals (Thompson and Bushnell, 2012).
Chronic pain models: Many animal models have been developed that are designed to model different aspects and/or origins of sensory pain and have good construct, face and predictive validity (e.g. inflammatory, nerve injury or cancer pain) (Li, 2015). Since trauma is one of the leading causes of neuropathic pain and it can be easily applied in animal models, most chronic pain models are based on nerve injury. Commonly used nerve injury-induced chronic pain models in rodents are as follows (Doan et al., 2015; Li, 2015; Yalcin et al., 2014a): Chronic constriction injury (CCI), partial sciatic nerve ligation (PSNL), spinal nerve ligation (SNL), common peroneal nerve ligation, spared nerve injury (SNI), and cuff model. Several of these rodent pain models have been used to study the anxiety and depression-like comorbidity.(Doan et al., 2015). Previous studies showed that it is possible to model the relation between chronic pain and anxiety and depressive-like consequences by taking into consideration the time factor (Gonçalves et al., 2008; Suzuki et al., 2007; Yalcin et al., 2014a). Indeed, in chronic pain models, while the hypersensitivity to pain develops quickly, anxio-depressive behaviors are time dependent and develop much slower; usually weeks after primary injury (Li, 2015). Time-dependence of affective consequences of pain points to a reorganization of brain circuits or neuroplasticity in the interim.
Behavioral tests for anxio-depressive phenotype: There are several renowned and well-validated behavioral tests which could be employed to demonstrate anxio-depressive consequences of chronic pain in rodents (Yalcin et al., 2014a). They are summarized in Table
. Depression also includes homeostatic, neurovegetative (abnormalities in sleep, appetite, weight), or cognitive symptoms; however these symptoms are much less studied in chronic pain paradigms (Yalcin et al., 2014a).
Table 1-3 Commonly used behavioral tests for anxiety and depression related phenotypes.
Anxiety-related Depression-related
Exploratory-based approach-avoidance conflict tests
Elevated plus maze (EPM) Open field (OF) Light-dark exploration (LD)
Exposure to stressful situations and the measure of time spent in active versus passive stress coping
Forced swimming test (FST) Tail suspension test (TST) Learned helplessness
Interest in pleasurable activities Sucrose preference test (SP) Social interaction measures (SI)
Motivation Marble burying (MB)
Both anxiety and depression related
Novelty suppressed feeding test (NSF)
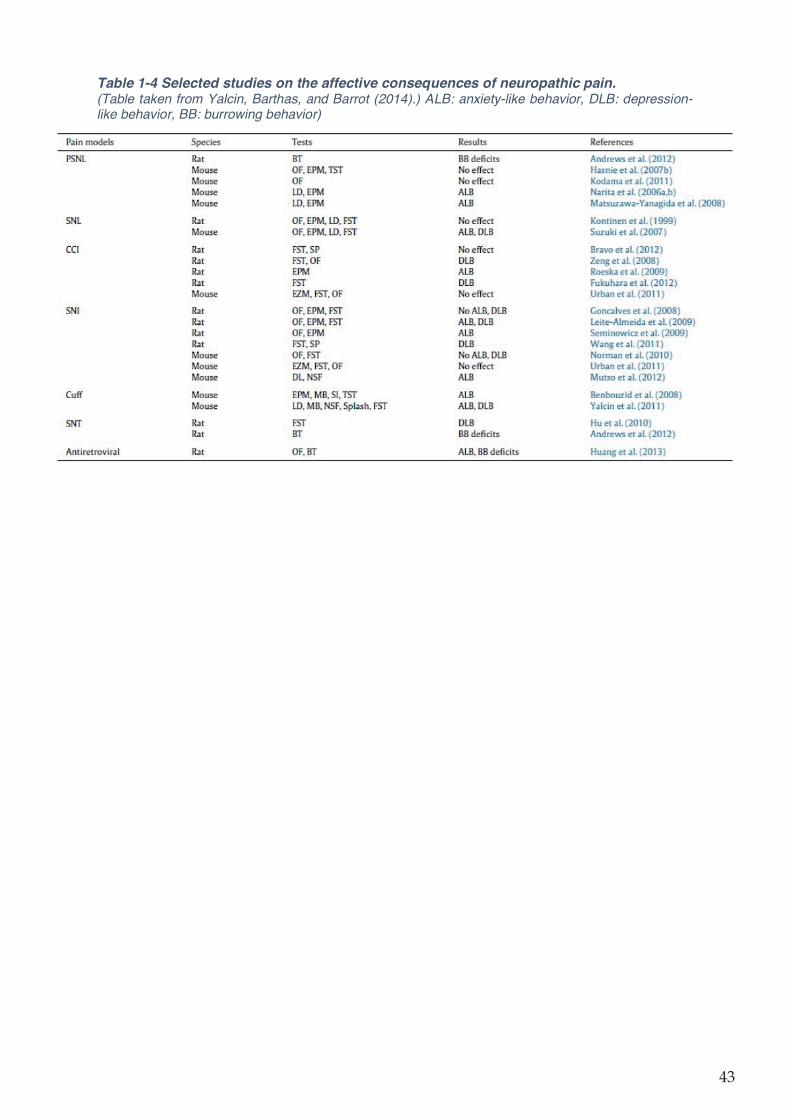
Table 1-4 Selected studies on the affective consequences of neuropathic pain. (Table taken from Yalcin, Barthas, and Barrot (2014).) ALB: anxiety-like behavior, DLB: depression-like behavior, BB: burrowing behavior)
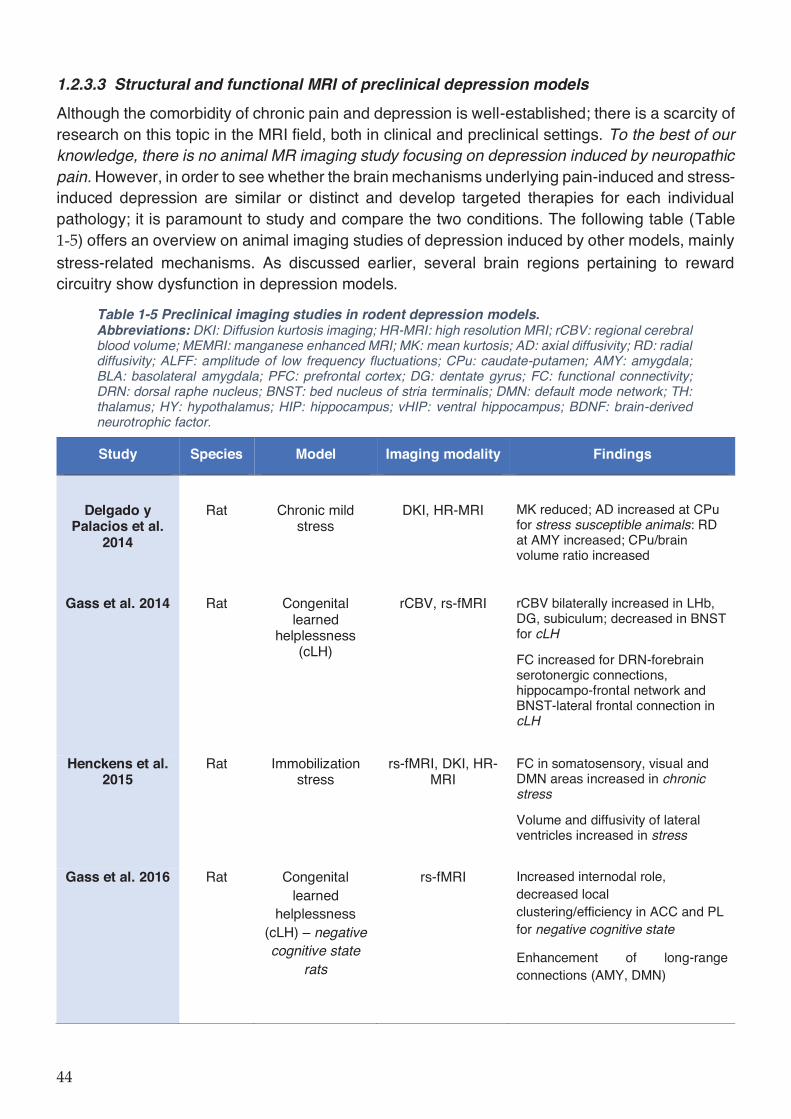
1.2.3.3 Structural and functional MRI of preclinical depression models
Although the comorbidity of chronic pain and depression is well-established; there is a scarcity of research on this topic in the MRI field, both in clinical and preclinical settings. To the best of our knowledge, there is no animal MR imaging study focusing on depression induced by neuropathic pain. However, in order to see whether the brain mechanisms underlying pain-induced and stress-induced depression are similar or distinct and develop targeted therapies for each individual pathology; it is paramount to study and compare the two conditions. The following table (Table
) offers an overview on animal imaging studies of depression induced by other models, mainly stress-related mechanisms. As discussed earlier, several brain regions pertaining to reward circuitry show dysfunction in depression models.
Table 1-5 Preclinical imaging studies in rodent depression models. Abbreviations: DKI: Diffusion kurtosis imaging; HR-MRI: high resolution MRI; rCBV: regional cerebral blood volume; MEMRI: manganese enhanced MRI; MK: mean kurtosis; AD: axial diffusivity; RD: radial diffusivity; ALFF: amplitude of low frequency fluctuations; CPu: caudate-putamen; AMY: amygdala; BLA: basolateral amygdala; PFC: prefrontal cortex; DG: dentate gyrus; FC: functional connectivity; DRN: dorsal raphe nucleus; BNST: bed nucleus of stria terminalis; DMN: default mode network; TH: thalamus; HY: hypothalamus; HIP: hippocampus; vHIP: ventral hippocampus; BDNF: brain-derived neurotrophic factor.
Study Species Model Imaging modality Findings
Delgado y Palacios et al.
2014
Rat
Chronic mild stress
DKI, HR-MRI
MK reduced; AD increased at CPu for stress susceptible animals: RD at AMY increased; CPu/brain volume ratio increased
Gass et al. 2014 Rat Congenital learned
helplessness (cLH)
rCBV, rs-fMRI rCBV bilaterally increased in LHb, DG, subiculum; decreased in BNST for cLH
FC increased for DRN-forebrain serotonergic connections, hippocampo-frontal network and BNST-lateral frontal connection in cLH
Henckens et al. 2015
Rat Immobilization stress
rs-fMRI, DKI, HR-MRI
FC in somatosensory, visual and DMN areas increased in chronic stress
Volume and diffusivity of lateral ventricles increased in stress
Gass et al. 2016 Rat Congenital learned
helplessness (cLH) – negative cognitive state
rats
rs-fMRI Increased internodal role, decreased local clustering/efficiency in ACC and PL for negative cognitive state
Enhancement of long-range connections (AMY, DMN)
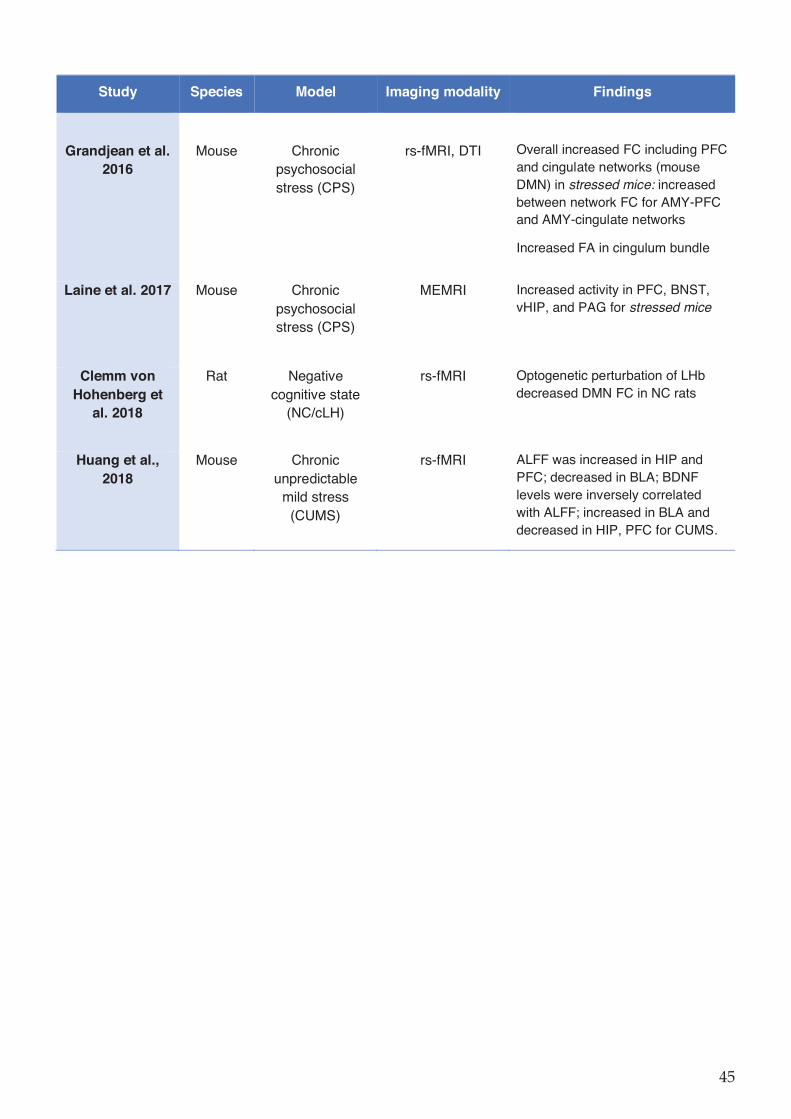
Study Species Model Imaging modality Findings
Grandjean et al. 2016
Mouse
Chronic psychosocial stress (CPS)
rs-fMRI, DTI
Overall increased FC including PFC and cingulate networks (mouse DMN) in stressed mice: increased between network FC for AMY-PFC and AMY-cingulate networks
Increased FA in cingulum bundle
Laine et al. 2017 Mouse Chronic psychosocial stress (CPS)
MEMRI Increased activity in PFC, BNST, vHIP, and PAG for stressed mice
Clemm von Hohenberg et
al. 2018
Rat Negative cognitive state
(NC/cLH)
rs-fMRI Optogenetic perturbation of LHb decreased DMN FC in NC rats
Huang et al., 2018
Mouse Chronic unpredictable
mild stress (CUMS)
rs-fMRI ALFF was increased in HIP and PFC; decreased in BLA; BDNF levels were inversely correlated with ALFF; increased in BLA and decreased in HIP, PFC for CUMS.
2 Hypothesis and Objectives My main objective in this thesis work is to map functional and structural brain connectivity
alterations in neuropathic pain and depression comorbidity using preclinical MRI in a mouse model. Probing the brain networks in a mouse model is an important step for translational research as similar MRI techniques exist for clinical investigations and therefore, animal findings can be transferable to humans. Such characterization of the network fluctuations underlying depression development would bring essential information regarding the mechanisms of the disease, paving the way towards targeted therapeutic interventions. In addition, such altered circuitry patterns might constitute specific biomarkers of the disease, relating with the causality (i.e. pain) or the severity and specificity of the mood disorder.
I conducted a preliminary study to inform the choice of mouse strain to be used in the neuropathic pain-induced depression model: Many inbred strains of mice are commercially available and C57BL/6N and BALB/cJ are the two strains most commonly used for depression studies. However, important strain differences as well as intra-strain variability were reported in the literature regarding both the behavioral outcomes and neuroanatomy (Fairless et al., 2013, 2012; Kim et al., 2012). Therefore, an important aspect in my project was to compare the brain connectivity between C57BL/6N and BALB/cJ mice using structural and functional MRI, with the aim of determining more adapted strain for modelling depression. (see section 3.1, page 47)
Subsequently, I applied non-invasive, in vivo MRI methods in a longitudinal experimental design in neuropathic pain-induced depression model, aimed at following the development of the anxio-depressive phenotype and brain network remodeling over time.
My hypothesis is that neuropathic pain and subsequent anxio-depressive phenotype are associated with time-dependent changes in brain structure and connectivity at functional and structural levels. Based on the previous literature discussed in the Introduction section; I predict alterations in brain regions linked to both pain processing and reward circuitry. The alterations likely mirror human counterparts of modifications in the brain structure and connectivity for these pathological processes and could be useful for developing novel treatments for patients. (see section 3.2, page 74).
3 Results 3.1 Mapping the living mouse brain neural architecture: strain specific
patterns of brain structural and functional connectivity. Meltem Karatasa,b,c, Vincent Nobletb,d, Taufiq Nasseefe, Thomas Bienerta, Marco Reiserta, Jürgen Henniga, Ipek Yalcinc, Brigitte Lina Kieffere, Dominik von Elverfeldta and Laura-Adela Harsana,b,f*
a Department of Radiology, Medical Physics, Medical Center – University of Freiburg, Faculty of Medicine, Breisacher Strasse 60a, 79106 Freiburg, Germany,
b Laboratory of Engineering, Informatics and Imaging (ICube), Integrative multimodal imaging in healthcare (IMIS), UMR 7357, University of Strasbourg, 4 Rue Kirschleger, 67000 Strasbourg, France
c Institut Neurosciences Cellulaires et Intégratives (INCI), CNRS UPR 3212, University of Strasbourg, 8 allée du Général Rouvillois, 67000, Strasbourg, France
d Laboratory of Engineering, Informatics and Imaging (ICube), Images-Modelling-Learning-Geometry and Statistics (IMAGeS), UMR 7357, University of Strasbourg, 300 Bd Sébastien Brant, BP 10413, 67412, Illkirch Cedex, France
e Department of Psychiatry, School of Medicine, Douglas Hospital Research Center, McGill University, Montreal, QC, Canada
f Department of Biophysics and Nuclear Medicine, Hautepierre Hospital, University Hospitals of Strasbourg, 1, Avenue Molière, 67098 Strasbourg Cedex, France
Corresponding author:
Laura-Adela Harsan
Email: [email protected]
Keywords:
mouse brain connectivity, resting state functional magnetic resonance imaging, diffusion tensor imaging, BALB/cJ, C57BL6/N, inbred strains
3.1.1 Introduction
Animal models of disease - essential for neuroscience research, are gaining huge importance in the recent years with the development of genetically modified mice and novel methods to investigate brain function. However, the diversity in the genetic background of the organisms used for modelling pathology raises questions of the impact of genetic confound on findings (Crawley et al., 1997; Keane et al., 2011). Indeed, each strain of mice display distinct sets of behavioral, neurochemical and neuroanatomical features (Grubb et al., 2004). Among these strains, C57BL/6 and BALB/cJ the commonly used inbred mouse strains, are prime examples of such divergent phenotypes (Anderzhanova et al., 2013; Belzung and Griebel, 2001; Calcagno et al., 2007).
At behavioral level, BALB/cJ strain displays neophobia (i.e. reluctance to engage with novel stimuli) and elevated anxiety (Anderzhanova et al., 2013; Ohl et al., 2001), in contrast to C57BL/6 mice. At young ages, social proximity is not rewarding for BALB/cJ mice (Panksepp and Lahvis, 2007) and they typically show reduced sociability towards conspecifics (Brodkin, 2007; Brodkin et al., 2004; Jacome et al., 2011; Moy et al., 2007; Sankoorikal et al., 2006). Such differences in social behavior are accompanied by differences in early maternal care (Lassi and Tucci, 2017) as BALB/cJ mice present a weaker maternal attachment to offspring compared to C57BL/6 mice. To divulge the underlying mechanisms of different behavioral phenotypes in C57BL/6 and BALB/cJ mice, neurochemical and neuroanatomical studies are indeed necessary (Belzung and Griebel, 2001). For instance, it has been previously demonstrated that serotonergic and dopaminergic neurotransmitter systems show strain-dependent variations in the brain (Calcagno et al., 2007; Guzzetti et al., 2008). At anatomical and microstructural level, longitudinal in-vivo diffusion tensor imaging (DTI) (Le Bihan, 2014; Le Bihan and Breton, 1985) of BALB/cJ and C57BL/6J mouse brains (Kumar et al., 2012) showed as well differences in developmental trajectories along major white matter (WM) tracts, such as the corpus callosum, as well as of gray matter (GM) regions including thalamic areas and frontal motor cortices.
Besides inter-strain differences, within strain inter-individual variations were also reported, especially concerning the BALB/cJ animals. Neuroanatomical studies using histological methods revealed variability of the size - even complete absence - of the corpus callosum (cc) in BALB/cJ mice (Wahlsten, 1974). The size of this structure (Fairless et al., 2008) and whole brain size (Fairless et al., 2012) were correlated with social measures in 30-day-old BALB/cJ mice. In addition to histology, anatomical magnetic resonance imaging (MRI) and DTI of the brain, evaluating morphology and microstructural features (Kim et al., 2012; Kumar et al., 2012), further revealed associations between sociability and DTI-derived parameters in several brain regions (Kim et al., 2012), including gray matter, of BALB/cJ male mice. For instance, positive regression between fractional anisotropy (FA) - an index of water diffusion orientation and indirectly of tissue organization – and social sniffing times was found in regions located in thalamic nuclei, zona incerta, substantia nigra, visual/orbital/ somatosensory cortices, and entorhinal cortex of BALB/cJ strain (Kumar et al., 2012).
In clinics, alterations in the corpus callosum region has also been detected in subgroups of autism spectrum disorders (ASD) patients (Alexander et al., 2007; Just et al., 2006). Indeed, behavioral phenotype of BALB/cJ mice also share similarities with certain aspects of ASD, namely the low sociability, higher anxiety and aggression (Brodkin, 2007; Liska and Gozzi, 2016). Such behavioral phenotypes might stem from the underlying architecture of neural circuitries and
established patterns of brain communication. Therefore, mapping the brain connectivity blueprints is an essential field of study in neurology and experimental neuroscience.
A detailed non-invasive insight into the whole brain axonal connectivity in vivo has become possible with the development of diffusion based tractography (Horsfield and Jones, 2002) and high-resolution fiber mapping (hrFM) (Calamante et al., 2011; Harsan et al., 2013). In mice, non-invasive DTI based fiber mapping revealed the spatial organization of axonal and dendritic networks in brain WM regions, in good agreement with the spatial projection patterns visualized using viral axonal tracer data (Wu and Zhang, 2016).
Meanwhile, the functional brain communication or connectivity (FC) can be deciphered non-invasively via resting-state functional MRI, detecting low frequency fluctuations in the blood oxygen level-dependent (BOLD) fMRI signals and their temporal correlations (Chuang and Nasrallah, 2017). Baseline BOLD signals manifest correlations between distinct brain areas that are co-activated during a task; thus, said to be functionally connected (Biswal et al., 1995).
In mouse models, deciphering strain-related patterns in the brain structural and functional connectivity or intra-strain variations of the brain wiring schemes have a tremendous importance, since these animals are used to answer questions relating to human neurological or neuropsychiatric disorders. In this context, the principal goal of our study was to bridge this gap by systematically probing the brain connectivity patterns of two mouse strains extensively used in preclinical neuroscience, including brain connectivity studies: C57BL/6N and BALB/cJ (Grandjean et al., 2017; Grubb et al., 2004; Hübner et al., 2017; Liska et al., 2015; Mechling et al., 2016; Shah et al., 2016a). We thus performed comparative MRI exploration of brain structure and function via a combination of brain deformation-based morphometry (DBM), DTI and hrFM and resting state functional MRI (rs-fMRI) in female animals.
3.1.2 Materials and Methods
3.1.2.1 Ethics statement
All procedures were conducted in compliance with the European Directive 2010/63/EU on the protection of animals used for scientific purposes, national guidelines of the German animal protective law for the use of laboratory animals and with permission of the responsible local authorities for the University Medical Center Freiburg (Regierungspräsidium Freiburg, permit numbers: G-08/15).
3.1.2.2 Animal setup
8-9 weeks old female C57BL/6N (n=11) and BALB/cJ (n=14) mice, purchased from Charles River Laboratories (Sulzfeld, Germany) were used for the MRI experiments. Animals were housed under standard animal room conditions (temperature 21°C, humidity 55-60%, food and water were given ad libitum).
For the rs-fMRI scans, the animals were initially anesthetized moderately using a subcutaneous (s.c.) medetomidine (MD, Domitor, Pfizer, Karlsruhe, Germany) bolus injection of 0.3 mg per kg body weight in 100 μl 0.9% sodium chloride solution. Preparation for the imaging session included the placement of the animal into the adapted imaging bed, stereotactic fixation of the head and attachment of physiological monitoring devices (pulse oximeter clipped to the hind paw, rectal temperature probe and pressure sensitive respiration pad placed underneath the abdomen). 15 minutes after the MD bolus injection, a continuous s.c. MD infusion of 0.6 mg per kg body weight in 200 μl per hour was applied to the animals throughout the rs-fMRI exams. Animals were monitored strictly for optimal physiological conditions (spO2: 97-99%, body temperature: 35.5±1.5°C, respiratory rates: 100-130 breaths/min). For the morphological T2-weighted and diffusion MRI acquisitions, anesthesia was switched to 1.5% isoflurane (Forene; Abbvie Deutschland GmbH & Co. KG, Wiesbaden, Germany) in 1.2 l/min oxygen and respiratory gating was performed. At the end of experiments the mice spontaneously recovered.
3.1.2.3 Data acquisition
All scans were performed using a 7T small bore animal scanner (Biospec 70/20, Bruker, Ettlingen, Germany), a cryogenically cooled quadrature mouse brain resonator (MRI CryoProbe, Bruker, Ettlingen, Germany) and the ParaVision software version 5.1 (Bruker, Ettlingen, Germany).
Resting-state fMRI data was acquired with T2*-weighted single shot Gradient Echo-echo planar imaging (GE-EPI) sequence using an echo time (TE) of 10 ms and repetition time (TR) of 1700 ms. 12 axial slices of 0.7 mm thickness were positioned on the mouse brain excluding olfactory bulb and cerebellum, field of view (FOV) and acquisition matrix were 19 × 12 mm2 and 128 × 80, respectively. A resolution of 0.15 × 0.15 × 0.7 mm3 was achieved and 200 volumes were recorded in an interlaced fashion for each run.
High resolution T2-weighted anatomical images (resolution of 0.051 × 0.051 × 0.3 mm3) were acquired with a RARE sequence using the following parameters: TE/TR = 50 ms/6514 ms; 48 slices, 0.3 mm slice thickness, interlaced sampling, RARE factor of 4, 2 averages; an acquisition matrix of 256 × 196 and FOV of 1.3×1 cm2.
Structural connectivity was investigated based on DTI data. Acquisitions were carried-out using a 4-shot DT-EPI sequence (TE/TR = 26 ms / 7750 ms; gradient duration (δ) = 4 ms and gradient separation (Δ) = 14 ms), with diffusion gradients applied along 30 nonlinear directions (Jones, 2004) and a b-factor of 1000 s/mm2. 25 axial slices with 0.5 mm thickness were acquired with a FOV of 1.5 x 1.2 cm² and an acquisition matrix of 160 x 128 resulting in an image resolution of 0.094 x 0.094 x 0.5 mm3.
3.1.2.4 Data processing
Anatomical MRI analysis
T2-weighted images were compared across groups using a DBM framework. First, each image was corrected for bias field inhomogeneity using N4ITK (Tustison et al., 2010). Then, all images were jointly registered in a deformable way using the group-wise registration procedure implemented in the ANTs registration toolbox (http://stnava.github.io/ANTs/) (Avants et al., 2011). Jacobian maps were computed for each estimated deformation field and a logarithmic transformation was applied on them so that dilation (i.e. jacobian greater than one) and contraction (i.e. jacobian between 0 and 1) are mapped on [0; +∞ [and]-∞; 0], respectively. These maps were finally smoothed using a Gaussian kernel (FWHM: 0.2 mm). Intergroup comparisons were conducted at the voxel level using the general linear model implemented in SPM12 (http://www.fil.ion.ucl.ac.uk/spm/). Statistical maps were thresholded at P< 0.05 after false discovery rate (FDR) p-value correction. Results were superimposed on the average morphological image built from the group-wise registration procedure.
Diffusion Tensor MRI data analysis and high-resolution fiber mapping (hrFM)
Post-processing of the diffusion data was performed using an in-house developed DTI and FiberTool software package for SPM (Harsan et al., 2013; Reisert et al., 2011). Diffusion based parameter maps were generated, including FA, mean diffusivity (MD), radial (RD) and axial diffusivities (AD). We further performed diffusion tractography using a global fiber tracking algorithm (Harsan et al., 2013; Reisert et al., 2011). With this family of tractography algorithms, the reconstructed fibers are built with small line segments (particle) described by a spatial position and orientation. These segments are the basic building blocks of a fiber model, bounding together to form the individual fibers. Their orientation and number are adjusted simultaneously and the connections between segments are formed based on a probabilistic procedure (Reisert et al., 2011). To generate fiber density (FD) maps, the number of tracts in each element of a grid was calculated from whole-mouse brain fibers in a manner very similar to previously published methodology (Calamante et al., 2011; Harsan et al., 2013). Further, the method used the continuity information contained in the fibers reconstructed during the global tracking procedure, to introduce sub-voxel information based on supporting information from neighboring voxels. After the generation of sufficient number of fibers passing a voxel at different spatial locations, their density was used as intravoxel information to construct highly resolved spatial histograms of diffusion orientations referred to as hrFM. The directionality of the fibers was therefore incorporated into the hrFM by assigning red/green/blue color to different spatial directions: red: mediolateral, green: dorsoventral and blue: rostro-caudal orientation.
The grid size was tailored to generate maps of 12 x 12 x 50 μm3 of resolution, 8 times the resolution of the acquired data. hrFM allowed individual assessment of the connectivity features, highlighting fine details of the structural brain scaffolding.
Diffusion MRI parametric maps were also compared across groups using a voxel-based analysis. The FA and FD maps were jointly registered using the multimodal group-wise registration procedure implemented in the ANTs registration toolbox (Avants et al., 2011). The analysis was then conducted using the voxel-based quantification (VBQ) method (Draganski et al., 2011) which implements a combined weighting/smoothing procedure, avoiding parameter value changes by Gaussian smoothing applied in standardized space. Furthermore, we conducted voxel-wise analysis on FD maps modulated by jacobian values - in a similar way to the modulated grey matter probability map used in DBM (Good et al., 2001)- in order to quantify the amount of fibers in the standardized space which accurately reflects that of the native space. A Gaussian kernel with a FWHM of 0.5 mm was applied here. Intergroup comparisons were conducted at the voxel level using the general linear model in SPM12. Statistical maps were thresholded at p< 0.05 after false discovery rate (FDR) p-value correction. Results showing higher statistical values for each group were superimposed on the average FD or FA images built from the corresponding group images.
Resting-state fMRI analysis
Each of the resting-state fMRI image volumes were first realigned on the corresponding first scan, using a least square approach and a 6-parameter rigid body transformation in space. The rs-fMRI data was next registered to a morphological template created from individual T2*-weighted scans with ANTs software using deformable SyN algorithm (Avants et al., 2011). Spatially normalized images were smoothed using a Gaussian kernel with FWHM of 0.3×0.3×0.7 mm3 on SPM8 and a zero-phase band-pass filter was applied to extract frequencies between 0.01-0.1 Hz, representatives of the low rs-fMRI Blood Oxygen Level Dependent (BOLD) signal. The signal from ventricles was regressed out using a least square approach in order to reduce non-neural correlations from the cerebrospinal fluid. Several analysis approaches were applied on this data as following:
Graph theory-based analysis of functional connectivity
To evaluate direct correlations between spatially separated regions of interest (ROIs), Partial Correlation (PC) analysis was performed (Hübner et al., 2017) between the mean time courses of the resting-state BOLD signal of included ROIs. 37 ROIs covering the major mouse brain cortical and subcortical areas were extracted from the Allen Brain Atlas (AMBA) (http://mouse.brain-map.org/static/atlas) (Lein et al., 2007) and registered on morphological template using an in-house built MATLAB tool.
The following analysis steps were carried out:
i. Groups specific average FC matrices of 37x37 ROIs (corresponding to each experimental group: C57BL/6N and BALB/cJ mice) were generated and the matrices were arranged according to the most similar pattern of connectivity across ROIs. The matrices were Fisher transformed to obtain the z scores associated to the connection strength – the edges - between pairs of ROIs. A one-sample t-test (p<0.05, FDR corrected) was applied to identify the statistically significant pairs of connections (edges). The resulting significant FC matrices were used to as inputs for graph theory measures. For each group, the most influent nodes of the network were identified using as parameters the weighted hubness (presented as the size of the node in the graph) and the Stouffer coefficients (color coded).
ii. Direct intergroup (C57BL/6N vs. BALB/cJ) statistical comparison of connectivity matrices (P<0.05, uncorrected) was performed to identify the most different “nodes” and “edges”. A group comparison matrix (GCM) was generated and graphically represented (e.g. Figure 4G) with a color-scale, displaying statistically significant inter-group differences of connectivity. A method to identify most different network nodes among the FC matrices of the two strains was implemented. The following information was taken in account for ranking the most different nodes: the number of significantly changed connections for each node, the strength of the connection difference between pair of nodes and the number of statistically different connections of the neighboring nodes. This information is graphically represented in the GCM in relationship with the node’s size and ranked in Figure 4H. Additionally, the group comparison matrix was used for calculating the Stouffer coefficients (Stouffer et al., 1949) for each node. A single p-value was computed for each region based on the combination of the p-values derived from the statistical tests made on the correlations with all other regions. The results were color-coded for most significantly different nodes (e.g. nodes color in the Figure 4B, E, G).
Seed-based functional connectivity analysis was further performed with a MATLAB tool developed in-house. Several ROIs (extracted from AMBA) were selected for this analysis based on the DTI and DBM results, as well as based on the previously published reports (Anderzhanova et al., 2013; Fairless et al., 2012; Kim et al., 2012; Kumar et al., 2012; Ohl et al., 2001, p. 6; Sankoorikal et al., 2006; Wahlsten, 1974) on the behavior of C57BL/6N and BALB/cJ mice. These ROIs were:
i. Right and left somatosensory cortex (SSr and SSl) and right and left motor cortex (MOr and MOl). These ROIs were used to check the inter-hemispherical connectivity.
ii. Anterior cingulate area (ACA) and retrosplenial cortex (RSP), to derive information about the default mode patterns in the two mouse strains. c) Key players of the known reward aversion circuitry: accumbens nuclei (ACB), hippocampus (hc).
iii. Partial correlation coefficients (Spearman correlation) were computed between the mean rs-fMRI time course of each ROI and the time courses from each voxel of the brain while excluding the effect of all the remaining voxels. Functional connectivity maps for each ROI were constructed at the individual level and also at the group level. Voxel-wise group based statistical analysis was performed using a two-sample t-test via SPM8 and the statistical results were cluster corrected at the P<0.05, FDR cluster corrected.
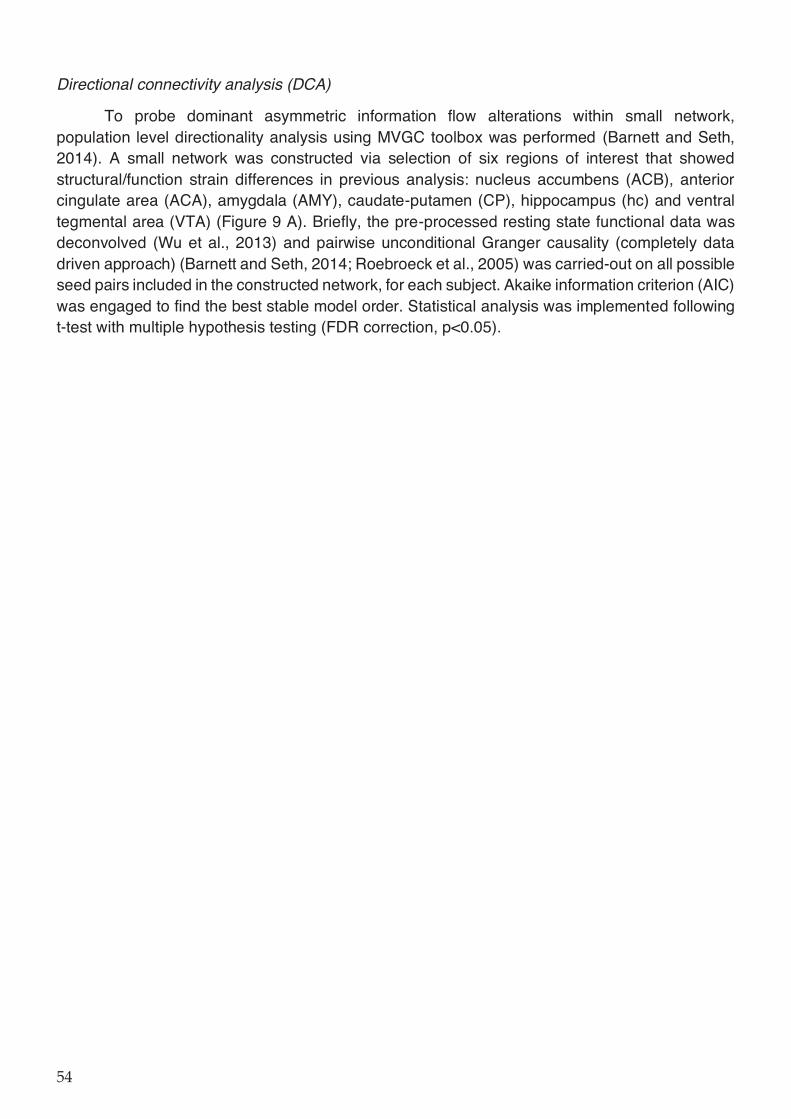
Directional connectivity analysis (DCA)
To probe dominant asymmetric information flow alterations within small network, population level directionality analysis using MVGC toolbox was performed (Barnett and Seth, 2014). A small network was constructed via selection of six regions of interest that showed structural/function strain differences in previous analysis: nucleus accumbens (ACB), anterior cingulate area (ACA), amygdala (AMY), caudate-putamen (CP), hippocampus (hc) and ventral tegmental area (VTA) (Figure 9 A). Briefly, the pre-processed resting state functional data was deconvolved (Wu et al., 2013) and pairwise unconditional Granger causality (completely data driven approach) (Barnett and Seth, 2014; Roebroeck et al., 2005) was carried-out on all possible seed pairs included in the constructed network, for each subject. Akaike information criterion (AIC) was engaged to find the best stable model order. Statistical analysis was implemented following t-test with multiple hypothesis testing (FDR correction, p<0.05).
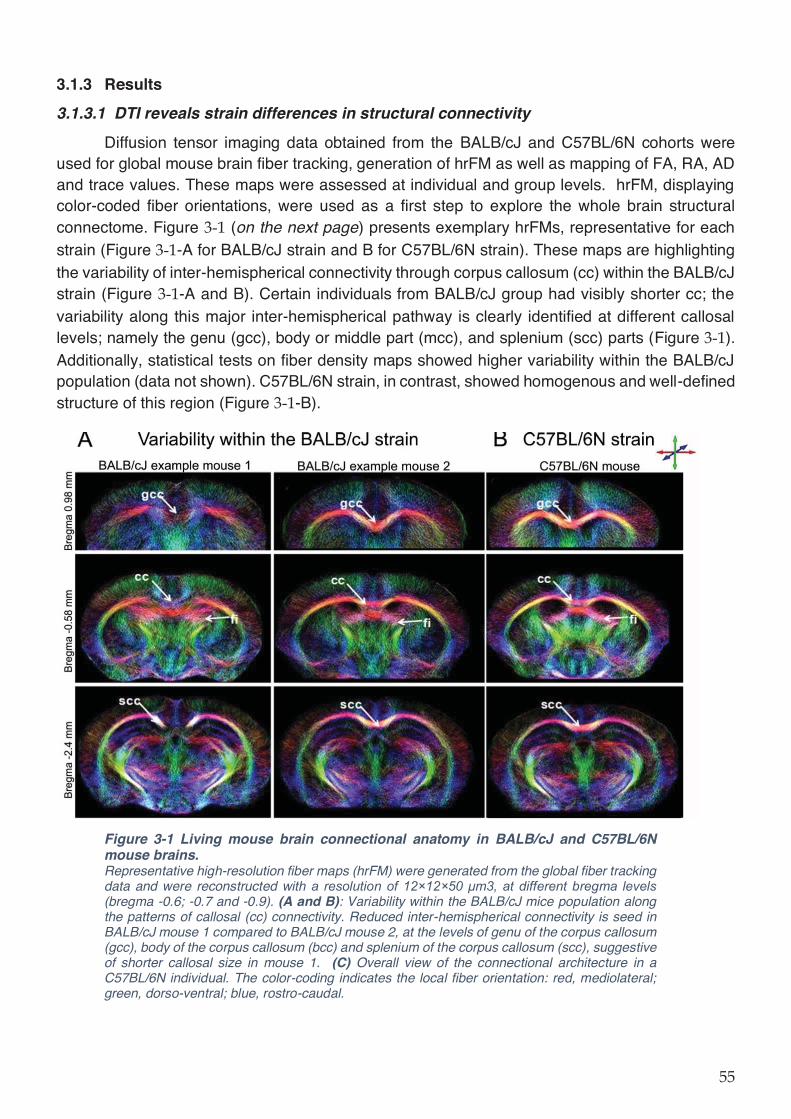
3.1.3 Results
3.1.3.1 DTI reveals strain differences in structural connectivity
Diffusion tensor imaging data obtained from the BALB/cJ and C57BL/6N cohorts were used for global mouse brain fiber tracking, generation of hrFM as well as mapping of FA, RA, AD and trace values. These maps were assessed at individual and group levels. hrFM, displaying color-coded fiber orientations, were used as a first step to explore the whole brain structural connectome. Figure (on the next page) presents exemplary hrFMs, representative for each strain (Figure -A for BALB/cJ strain and B for C57BL/6N strain). These maps are highlighting the variability of inter-hemispherical connectivity through corpus callosum (cc) within the BALB/cJ strain (Figure -A and B). Certain individuals from BALB/cJ group had visibly shorter cc; the variability along this major inter-hemispherical pathway is clearly identified at different callosal levels; namely the genu (gcc), body or middle part (mcc), and splenium (scc) parts (Figure ). Additionally, statistical tests on fiber density maps showed higher variability within the BALB/cJ population (data not shown). C57BL/6N strain, in contrast, showed homogenous and well-defined structure of this region (Figure -B).
Figure 3-1 Living mouse brain connectional anatomy in BALB/cJ and C57BL/6N mouse brains. Representative high-resolution fiber maps (hrFM) were generated from the global fiber tracking data and were reconstructed with a resolution of 12×12×50 μm3, at different bregma levels (bregma -0.6; -0.7 and -0.9). (A and B): Variability within the BALB/cJ mice population along the patterns of callosal (cc) connectivity. Reduced inter-hemispherical connectivity is seed in BALB/cJ mouse 1 compared to BALB/cJ mouse 2, at the levels of genu of the corpus callosum (gcc), body of the corpus callosum (bcc) and splenium of the corpus callosum (scc), suggestive of shorter callosal size in mouse 1. (C) Overall view of the connectional architecture in a C57BL/6N individual. The color-coding indicates the local fiber orientation: red, mediolateral; green, dorso-ventral; blue, rostro-caudal.
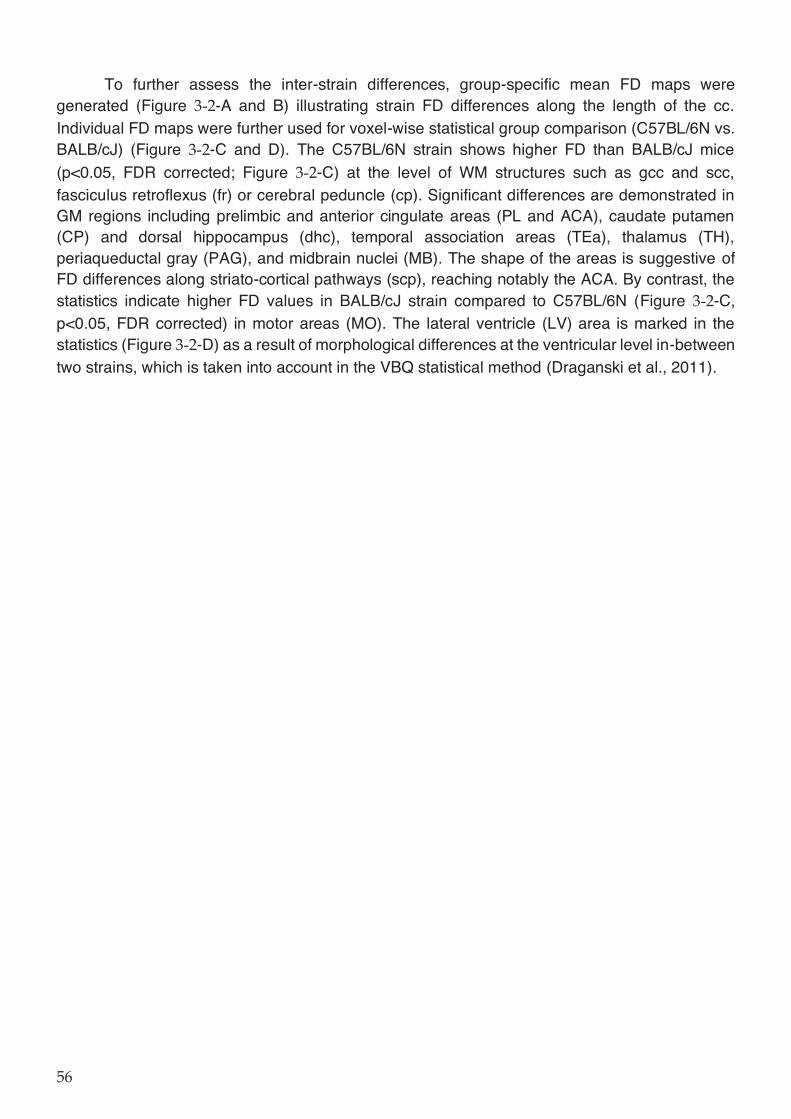
To further assess the inter-strain differences, group-specific mean FD maps were generated (Figure -A and B) illustrating strain FD differences along the length of the cc. Individual FD maps were further used for voxel-wise statistical group comparison (C57BL/6N vs. BALB/cJ) (Figure -C and D). The C57BL/6N strain shows higher FD than BALB/cJ mice (p<0.05, FDR corrected; Figure -C) at the level of WM structures such as gcc and scc, fasciculus retroflexus (fr) or cerebral peduncle (cp). Significant differences are demonstrated in GM regions including prelimbic and anterior cingulate areas (PL and ACA), caudate putamen (CP) and dorsal hippocampus (dhc), temporal association areas (TEa), thalamus (TH), periaqueductal gray (PAG), and midbrain nuclei (MB). The shape of the areas is suggestive of FD differences along striato-cortical pathways (scp), reaching notably the ACA. By contrast, the statistics indicate higher FD values in BALB/cJ strain compared to C57BL/6N (Figure -C, p<0.05, FDR corrected) in motor areas (MO). The lateral ventricle (LV) area is marked in the statistics (Figure -D) as a result of morphological differences at the ventricular level in-between two strains, which is taken into account in the VBQ statistical method (Draganski et al., 2011).
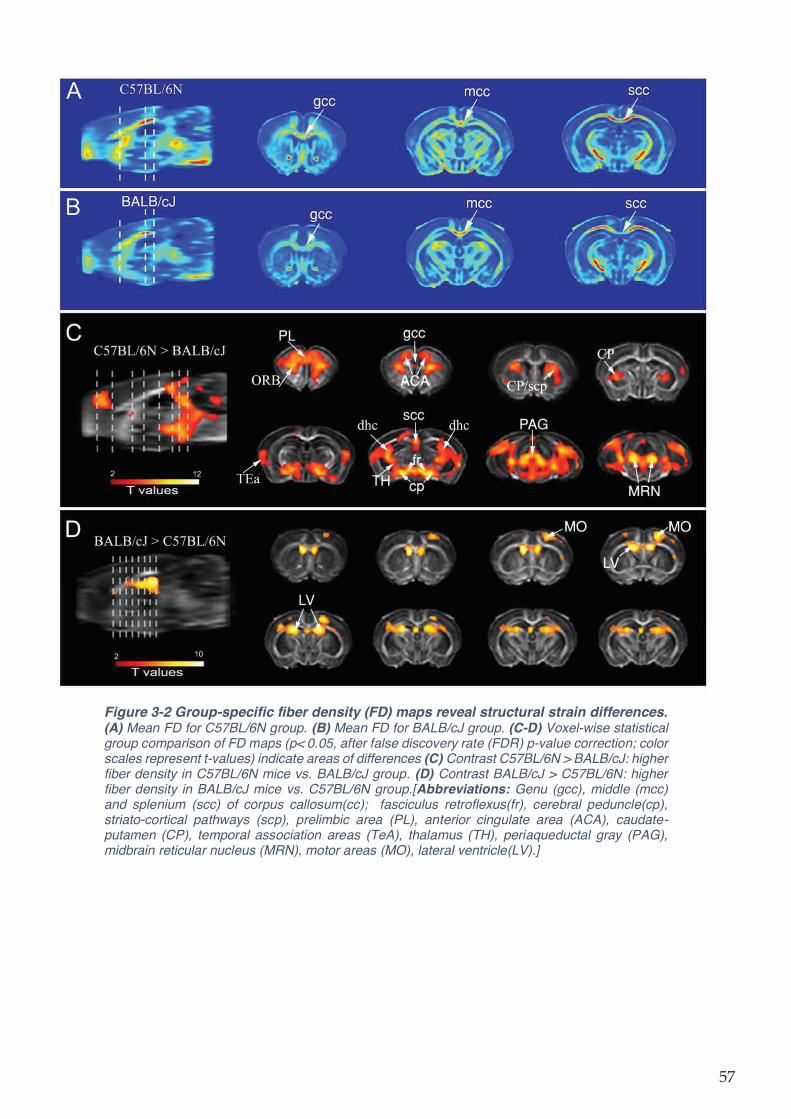
Figure 3-2 Group-specific fiber density (FD) maps reveal structural strain differences. (A) Mean FD for C57BL/6N group. (B) Mean FD for BALB/cJ group. (C-D) Voxel-wise statistical group comparison of FD maps (p< 0.05, after false discovery rate (FDR) p-value correction; color scales represent t-values) indicate areas of differences (C) Contrast C57BL/6N > BALB/cJ: higher fiber density in C57BL/6N mice vs. BALB/cJ group. (D) Contrast BALB/cJ > C57BL/6N: higher fiber density in BALB/cJ mice vs. C57BL/6N group.[Abbreviations: Genu (gcc), middle (mcc) and splenium (scc) of corpus callosum(cc); fasciculus retroflexus(fr), cerebral peduncle(cp), striato-cortical pathways (scp), prelimbic area (PL), anterior cingulate area (ACA), caudate-putamen (CP), temporal association areas (TeA), thalamus (TH), periaqueductal gray (PAG), midbrain reticular nucleus (MRN), motor areas (MO), lateral ventricle(LV).]

Statistical analysis of FA maps at the group level showed comparable differences between strains: cc, including anterior forceps (fa), cingulum (cg), gcc and scc, internal capsule (int), medial forebrain bundle (mfb) and cp as well as gray matter or mixed gray/white matter regions: PL/ACA, TEa, CP, dhc, TH, midbrain and pontine reticular nuclei (MRN; PRN, respectively) demonstrated significantly higher FA values in C57BL/6N strain (p<0.05, FDR corrected, Figure -A). The patterns are also indicative of increased FA along striato-cortical pathways. BALB/cJ mice, on the other hand, showed higher FA in ventral CP, as well as along caudal thalamo-cortical pathways (tcp), reaching somatosensory (SS) and auditory cortices (AUD) (p<0.05, FDR corrected, (Figure
-B).
Figure 3-3 Fractional anisotropy (FA) maps reveal differences between strains. (A-B) Voxel-wise statistical group comparison of FA maps (p< 0.05, after false discovery rate (FDR) p-value correction; color scales represent t-values) indicate areas of differences (C) Contrast C57BL/6N > BALB/cJ: higher FA in C57BL/6N mice vs. BALB/cJ group. (D) Contrast BALB/cJ > C57BL/6N: higher FA in BALB/cJ mice vs. C57BL/6N group. [Abbreviations: Corpus callosum (cc), anterior forceps (fa), genu and splenium of cc (gcc and scc), internal capsule (int), medial forebrain bundle (mfb), cerebral peduncle (cp), prelimbic area (PL), caudate-putamen (CP), Ammon’s horn (CA), temporal association areas (TeA), thalamus (TH), midbrain and pontine reticular nuclei (MRN; PRN, respectively) dentate gyrus (DG), thalamo-cortical pathways (tcp), somatosensory (SS) and auditory cortices (AUD).]
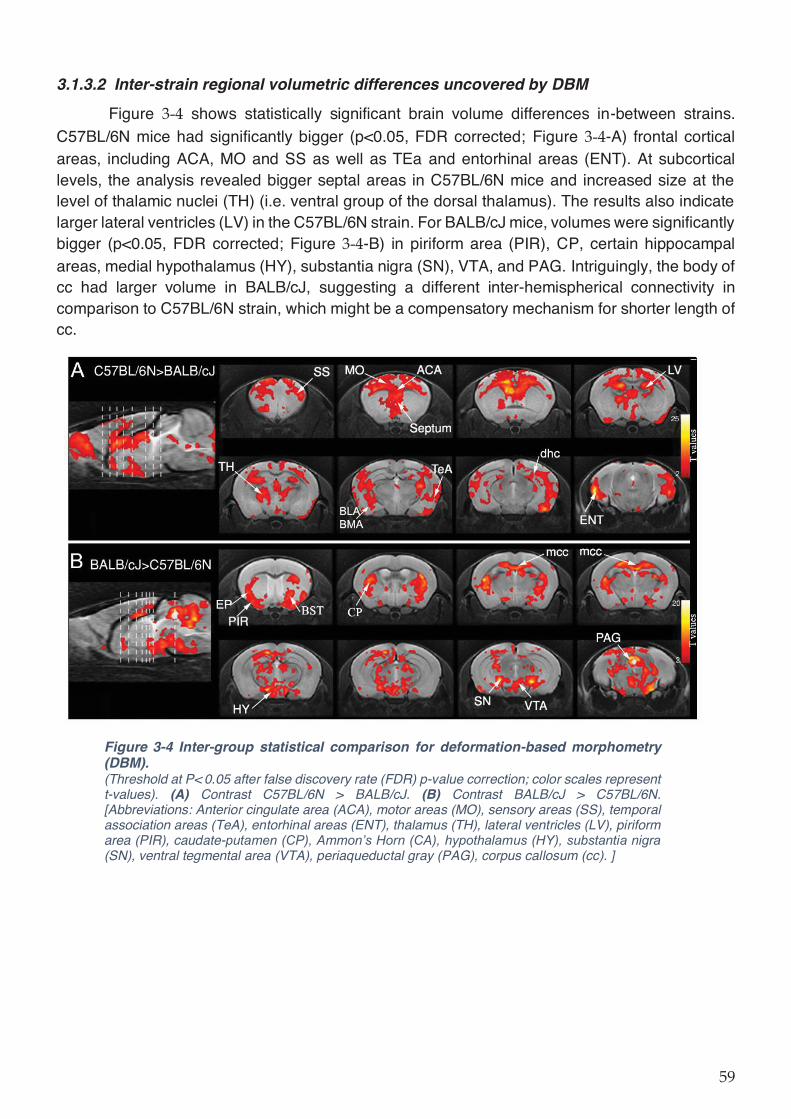
3.1.3.2 Inter-strain regional volumetric differences uncovered by DBM
Figure shows statistically significant brain volume differences in-between strains. C57BL/6N mice had significantly bigger (p<0.05, FDR corrected; Figure -A) frontal cortical areas, including ACA, MO and SS as well as TEa and entorhinal areas (ENT). At subcortical levels, the analysis revealed bigger septal areas in C57BL/6N mice and increased size at the level of thalamic nuclei (TH) (i.e. ventral group of the dorsal thalamus). The results also indicate larger lateral ventricles (LV) in the C57BL/6N strain. For BALB/cJ mice, volumes were significantly bigger (p<0.05, FDR corrected; Figure -B) in piriform area (PIR), CP, certain hippocampal areas, medial hypothalamus (HY), substantia nigra (SN), VTA, and PAG. Intriguingly, the body of cc had larger volume in BALB/cJ, suggesting a different inter-hemispherical connectivity in comparison to C57BL/6N strain, which might be a compensatory mechanism for shorter length of cc.
Figure 3-4 Inter-group statistical comparison for deformation-based morphometry (DBM). (Threshold at P< 0.05 after false discovery rate (FDR) p-value correction; color scales represent t-values). (A) Contrast C57BL/6N > BALB/cJ. (B) Contrast BALB/cJ > C57BL/6N. [Abbreviations: Anterior cingulate area (ACA), motor areas (MO), sensory areas (SS), temporal association areas (TeA), entorhinal areas (ENT), thalamus (TH), lateral ventricles (LV), piriform area (PIR), caudate-putamen (CP), Ammon’s Horn (CA), hypothalamus (HY), substantia nigra (SN), ventral tegmental area (VTA), periaqueductal gray (PAG), corpus callosum (cc). ]
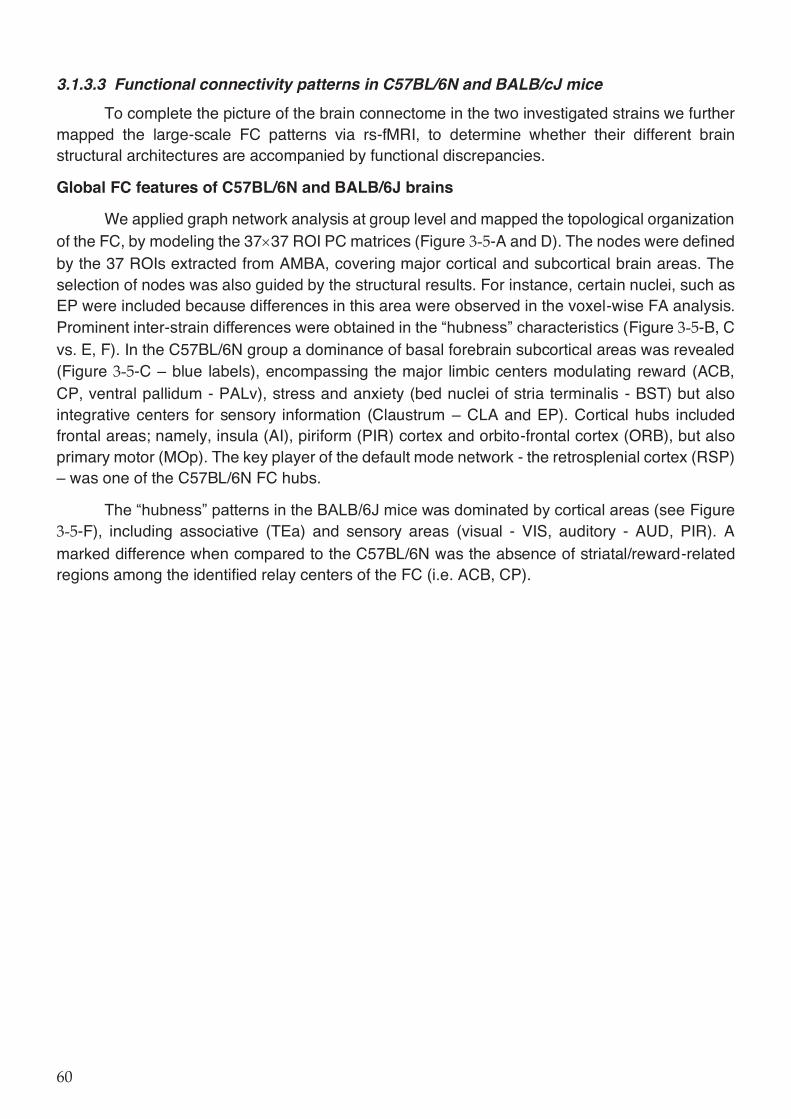
3.1.3.3 Functional connectivity patterns in C57BL/6N and BALB/cJ mice
To complete the picture of the brain connectome in the two investigated strains we further mapped the large-scale FC patterns via rs-fMRI, to determine whether their different brain structural architectures are accompanied by functional discrepancies.
Global FC features of C57BL/6N and BALB/6J brains
We applied graph network analysis at group level and mapped the topological organization of the FC, by modeling the 37 37 ROI PC matrices (Figure -A and D). The nodes were defined by the 37 ROIs extracted from AMBA, covering major cortical and subcortical brain areas. The selection of nodes was also guided by the structural results. For instance, certain nuclei, such as EP were included because differences in this area were observed in the voxel-wise FA analysis. Prominent inter-strain differences were obtained in the “hubness” characteristics (Figure -B, C vs. E, F). In the C57BL/6N group a dominance of basal forebrain subcortical areas was revealed (Figure -C – blue labels), encompassing the major limbic centers modulating reward (ACB, CP, ventral pallidum - PALv), stress and anxiety (bed nuclei of stria terminalis - BST) but also integrative centers for sensory information (Claustrum – CLA and EP). Cortical hubs included frontal areas; namely, insula (AI), piriform (PIR) cortex and orbito-frontal cortex (ORB), but also primary motor (MOp). The key player of the default mode network - the retrosplenial cortex (RSP) – was one of the C57BL/6N FC hubs.
The “hubness” patterns in the BALB/6J mice was dominated by cortical areas (see Figure -F), including associative (TEa) and sensory areas (visual - VIS, auditory - AUD, PIR). A
marked difference when compared to the C57BL/6N was the absence of striatal/reward-related regions among the identified relay centers of the FC (i.e. ACB, CP).
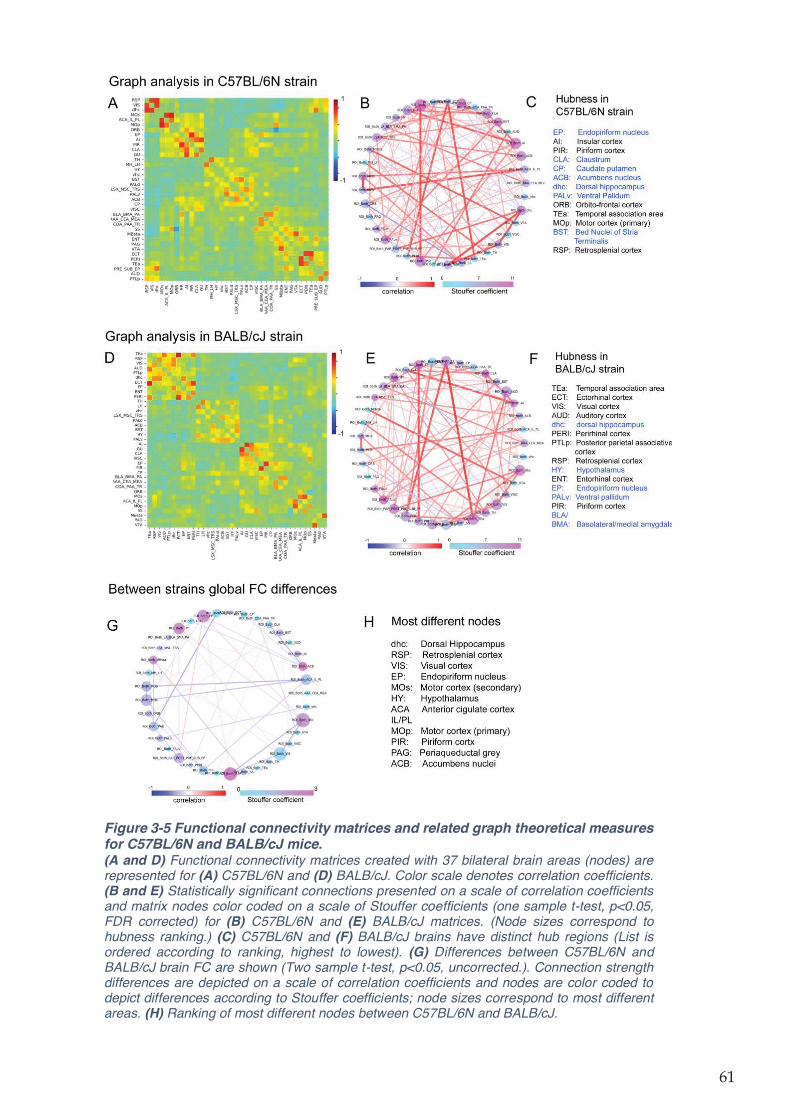
Figure 3-5 Functional connectivity matrices and related graph theoretical measures for C57BL/6N and BALB/cJ mice. (A and D) Functional connectivity matrices created with 37 bilateral brain areas (nodes) are represented for (A) C57BL/6N and (D) BALB/cJ. Color scale denotes correlation coefficients. (B and E) Statistically significant connections presented on a scale of correlation coefficients and matrix nodes color coded on a scale of Stouffer coefficients (one sample t-test, p<0.05, FDR corrected) for (B) C57BL/6N and (E) BALB/cJ matrices. (Node sizes correspond to hubness ranking.) (C) C57BL/6N and (F) BALB/cJ brains have distinct hub regions (List is ordered according to ranking, highest to lowest). (G) Differences between C57BL/6N and BALB/cJ brain FC are shown (Two sample t-test, p<0.05, uncorrected.). Connection strength differences are depicted on a scale of correlation coefficients and nodes are color coded to depict differences according to Stouffer coefficients; node sizes correspond to most different areas. (H) Ranking of most different nodes between C57BL/6N and BALB/cJ.
Direct inter-group comparison of the global FC matrices identified the brain areas with divergent patterns of connectivity (Figure -G, H). ACB showed highest number of different connections (see color coding – magenta). However, when normalized for the strength of the connectivity difference with other nodes, dorsal hippocampus emerged as the most dissimilar area in terms of FC (Figure -H and Figure -G – size of the nodes). Furthermore, our global analysis suggested strain variations in the DMN features, as two of the main DMN nodes (ACA and RSP) appeared among the nodes with variant FC (Figure -H). Several sensory processing areas (VIS, PIR, EP) as well as MO suggest also strain specific connectivity patterns.
Most of the areas indicated as divergent in the graph resting state network analysis (Figure -G and H) were also highlighted in the inter-strain comparison of the structural data (i.e FA
voxel vise analysis from Figure ). Therefore, the next group level seed analysis of FC was guided both by the structural results and the brain-wide graph theoretical resting state results.
Inter-hemispherical FC
Given the structural differences observed at callosal level in between the two strains, we first evaluated the inter-hemispherical FC, largely mediated through cc connections. The connectivity between the right and left hemispheric SS and MO cortical areas were therefore investigated. We selected successively right and left-lateral SS (SSr and SSl) as seed regions for mapping their connectivity patterns across the whole brain; subsequently, group comparisons were performed (two-sample t-tests, p<0.05, FDR cluster corrected). Despite the group differences observed at the level of gcc and scc after group comparison for structural FD and FA maps, the FC of the SS cortices with the same anatomical areas of the contralateral hemisphere (homotopic areas) does not show statistically significant inter-group differences (Figure -A and B). Interestingly, the results indicate greater synchrony of the BOLD signal ipsilaterally, within the cortical areas of the same hemisphere for the BALB/cJ mice (Fig. Figure -A and B, blue areas). The feature was reproducible for both right and left SS seeds. SS cortex also showed stronger correlation with RSP and VIS area in C57BL/6N strain (Figure -A, red areas).
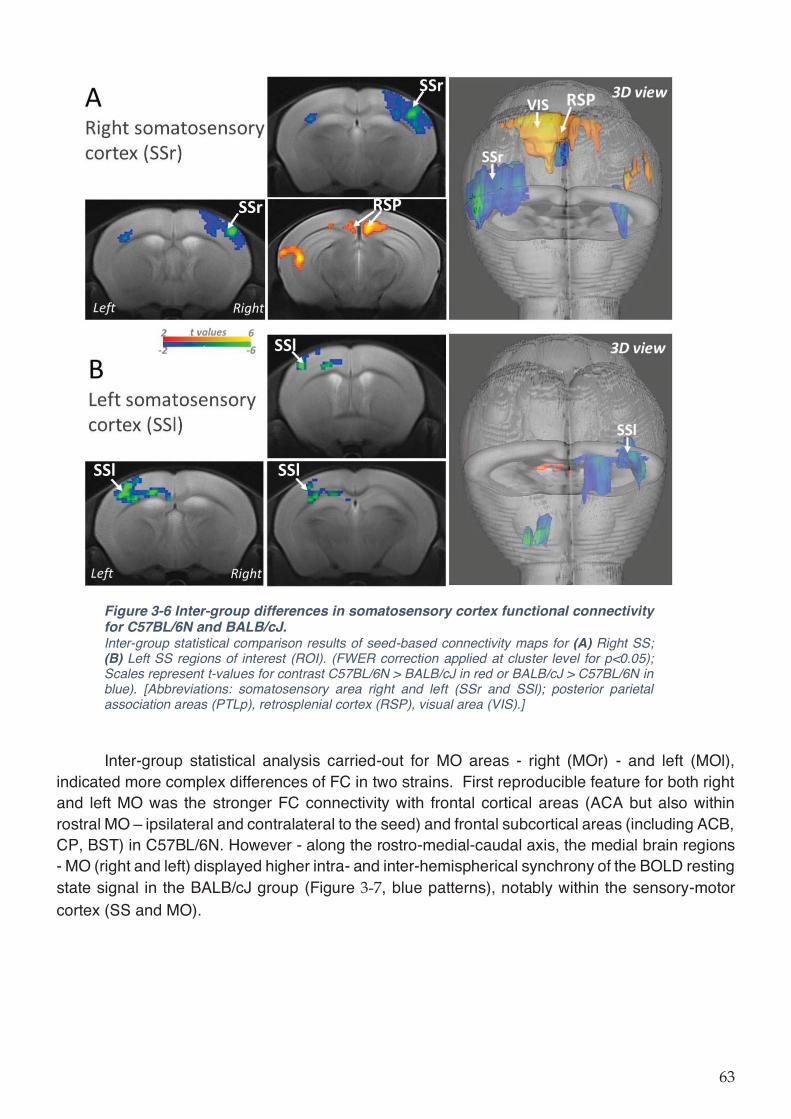
Figure 3-6 Inter-group differences in somatosensory cortex functional connectivity for C57BL/6N and BALB/cJ. Inter-group statistical comparison results of seed-based connectivity maps for (A) Right SS; (B) Left SS regions of interest (ROI). (FWER correction applied at cluster level for p<0.05); Scales represent t-values for contrast C57BL/6N > BALB/cJ in red or BALB/cJ > C57BL/6N in blue). [Abbreviations: somatosensory area right and left (SSr and SSl); posterior parietal association areas (PTLp), retrosplenial cortex (RSP), visual area (VIS).]
Inter-group statistical analysis carried-out for MO areas - right (MOr) - and left (MOl), indicated more complex differences of FC in two strains. First reproducible feature for both right and left MO was the stronger FC connectivity with frontal cortical areas (ACA but also within rostral MO – ipsilateral and contralateral to the seed) and frontal subcortical areas (including ACB, CP, BST) in C57BL/6N. However - along the rostro-medial-caudal axis, the medial brain regions - MO (right and left) displayed higher intra- and inter-hemispherical synchrony of the BOLD resting state signal in the BALB/cJ group (Figure , blue patterns), notably within the sensory-motor cortex (SS and MO).
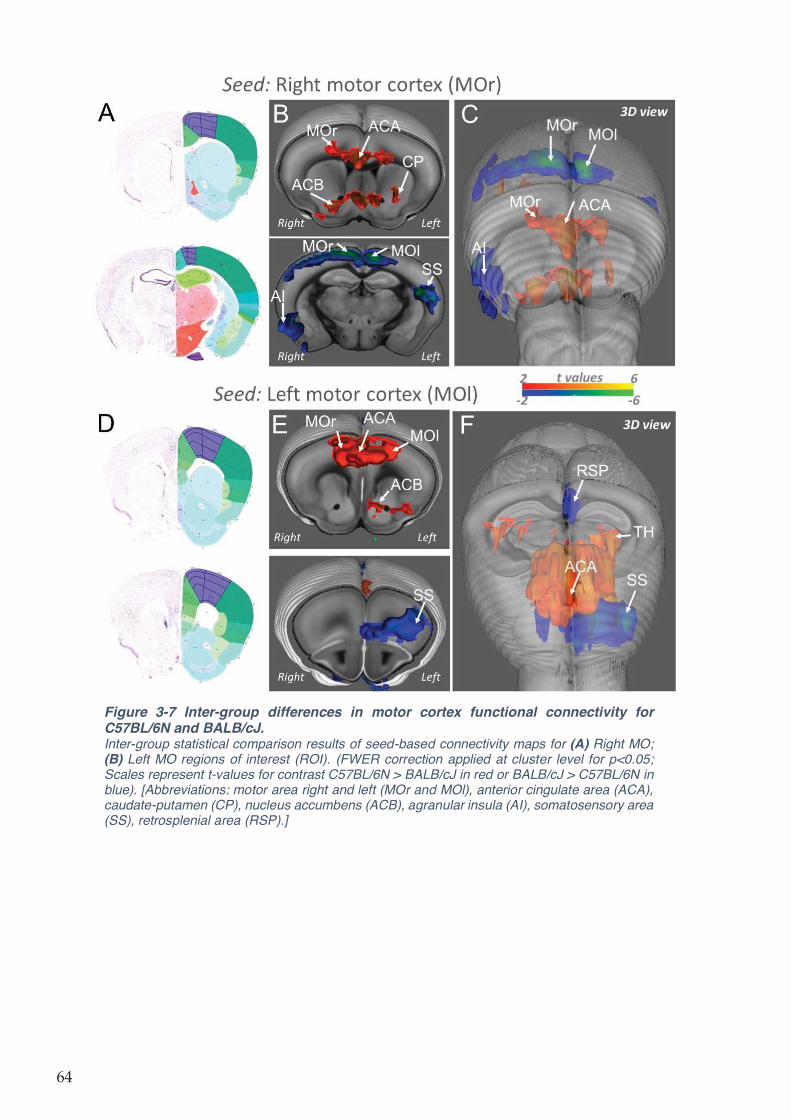
Figure 3-7 Inter-group differences in motor cortex functional connectivity for C57BL/6N and BALB/cJ. Inter-group statistical comparison results of seed-based connectivity maps for (A) Right MO; (B) Left MO regions of interest (ROI). (FWER correction applied at cluster level for p<0.05; Scales represent t-values for contrast C57BL/6N > BALB/cJ in red or BALB/cJ > C57BL/6N in blue). [Abbreviations: motor area right and left (MOr and MOl), anterior cingulate area (ACA), caudate-putamen (CP), nucleus accumbens (ACB), agranular insula (AI), somatosensory area (SS), retrosplenial area (RSP).]
DMN patterns in C57BL/6N and BALB/cJ strains
The significant strain-specific features measured with structural MRI (Figure and Figure ) in the frontal brain areas including ACA - that is part of DMN- and along frontal part of cg
bundle (Figure -A) suggested that DMN patterns might also have strain-specific characteristics. Therefore, we probed the topological patterns of DMN using seed analysis.
ACA and RSP were previously described as the key DMN nodes in rodents, showing synchronous rs-fMRI activity. We used the RSP as seed and mapped the spatial extent of DMN network, shown comparatively in Figure for the two strains. A prominent pattern of BOLD rs-fMRI signal synchrony is noted along top cortical areas in both groups, encompassing the RSP and ACA cortices. Two main features are relevant: larger cortical extent along the caudal to rostral axis of the BALB/cJ DMN and RSP-subcortical connectivity (towards CP, hc and TH) patterns in C57BL/6N mice. Inter-group comparative evaluation (Figure -B, p<0.05, FDR cluster corrected) confirmed significantly stronger connectivity of RSP towards dhc and TH areas in C57BL/6N group. Further inter-group analysis of ACA FC (Figure -C) unmasked major differences in the topology of ACA network: (i) stronger patterns of synchrony within rostral ACA and with neighboring cortical areas (MO) in C57Bl/6N mice and (ii) stronger ACA connectivity with RSP and dhc in the BALB/cJ group.
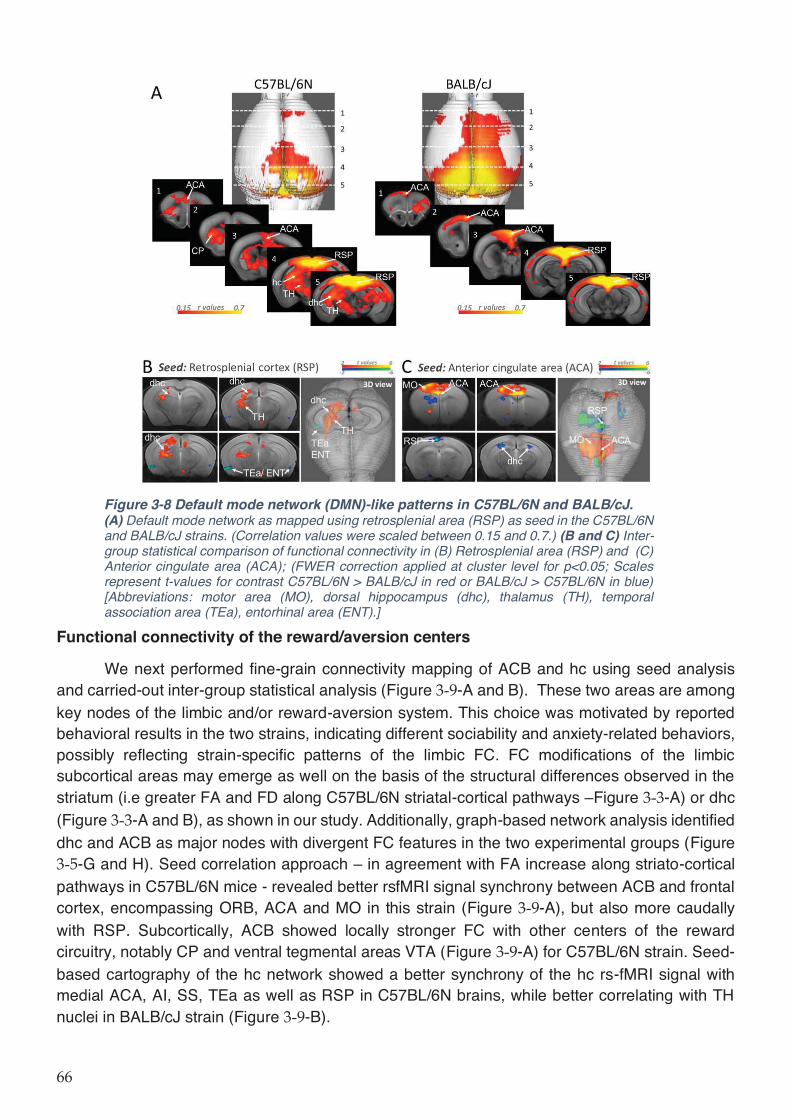
Figure 3-8 Default mode network (DMN)-like patterns in C57BL/6N and BALB/cJ. (A) Default mode network as mapped using retrosplenial area (RSP) as seed in the C57BL/6N and BALB/cJ strains. (Correlation values were scaled between 0.15 and 0.7.) (B and C) Inter-group statistical comparison of functional connectivity in (B) Retrosplenial area (RSP) and (C) Anterior cingulate area (ACA); (FWER correction applied at cluster level for p<0.05; Scales represent t-values for contrast C57BL/6N > BALB/cJ in red or BALB/cJ > C57BL/6N in blue) [Abbreviations: motor area (MO), dorsal hippocampus (dhc), thalamus (TH), temporal association area (TEa), entorhinal area (ENT).]
Functional connectivity of the reward/aversion centers
We next performed fine-grain connectivity mapping of ACB and hc using seed analysis and carried-out inter-group statistical analysis (Figure -A and B). These two areas are among key nodes of the limbic and/or reward-aversion system. This choice was motivated by reported behavioral results in the two strains, indicating different sociability and anxiety-related behaviors, possibly reflecting strain-specific patterns of the limbic FC. FC modifications of the limbic subcortical areas may emerge as well on the basis of the structural differences observed in the striatum (i.e greater FA and FD along C57BL/6N striatal-cortical pathways –Figure -A) or dhc (Figure -A and B), as shown in our study. Additionally, graph-based network analysis identified dhc and ACB as major nodes with divergent FC features in the two experimental groups (Figure
-G and H). Seed correlation approach – in agreement with FA increase along striato-cortical pathways in C57BL/6N mice - revealed better rsfMRI signal synchrony between ACB and frontal cortex, encompassing ORB, ACA and MO in this strain (Figure -A), but also more caudally with RSP. Subcortically, ACB showed locally stronger FC with other centers of the reward circuitry, notably CP and ventral tegmental areas VTA (Figure -A) for C57BL/6N strain. Seed-based cartography of the hc network showed a better synchrony of the hc rs-fMRI signal with medial ACA, AI, SS, TEa as well as RSP in C57BL/6N brains, while better correlating with TH nuclei in BALB/cJ strain (Figure -B).
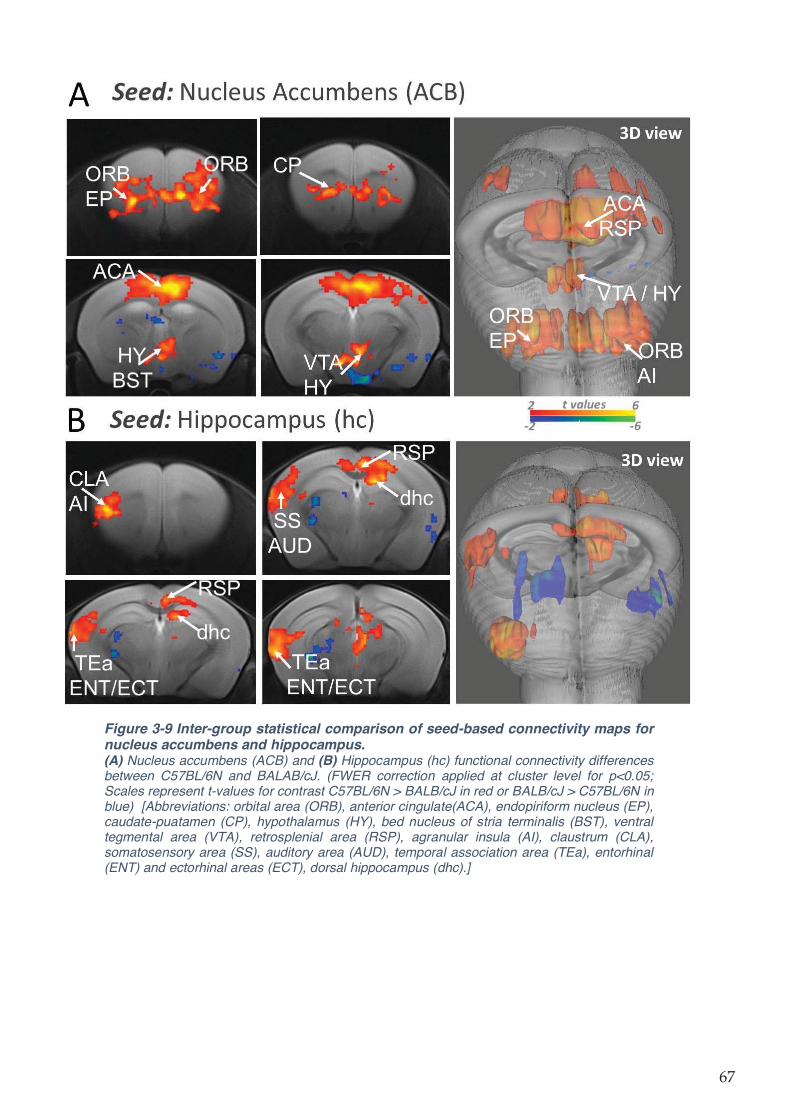
Figure 3-9 Inter-group statistical comparison of seed-based connectivity maps for nucleus accumbens and hippocampus. (A) Nucleus accumbens (ACB) and (B) Hippocampus (hc) functional connectivity differences between C57BL/6N and BALAB/cJ. (FWER correction applied at cluster level for p<0.05; Scales represent t-values for contrast C57BL/6N > BALB/cJ in red or BALB/cJ > C57BL/6N in blue) [Abbreviations: orbital area (ORB), anterior cingulate(ACA), endopiriform nucleus (EP), caudate-puatamen (CP), hypothalamus (HY), bed nucleus of stria terminalis (BST), ventral tegmental area (VTA), retrosplenial area (RSP), agranular insula (AI), claustrum (CLA), somatosensory area (SS), auditory area (AUD), temporal association area (TEa), entorhinal (ENT) and ectorhinal areas (ECT), dorsal hippocampus (dhc).]
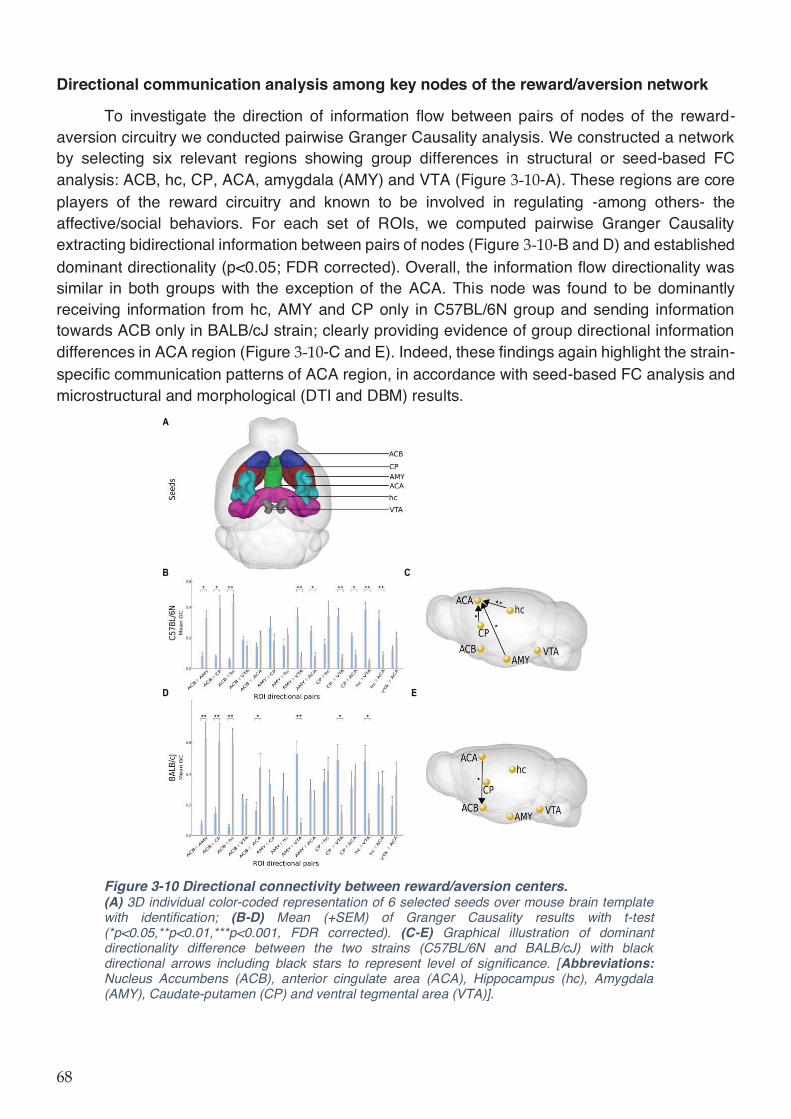
Directional communication analysis among key nodes of the reward/aversion network
To investigate the direction of information flow between pairs of nodes of the reward-aversion circuitry we conducted pairwise Granger Causality analysis. We constructed a network by selecting six relevant regions showing group differences in structural or seed-based FC analysis: ACB, hc, CP, ACA, amygdala (AMY) and VTA (Figure -A). These regions are core players of the reward circuitry and known to be involved in regulating -among others- the affective/social behaviors. For each set of ROIs, we computed pairwise Granger Causality extracting bidirectional information between pairs of nodes (Figure -B and D) and established dominant directionality (p<0.05; FDR corrected). Overall, the information flow directionality was similar in both groups with the exception of the ACA. This node was found to be dominantly receiving information from hc, AMY and CP only in C57BL/6N group and sending information towards ACB only in BALB/cJ strain; clearly providing evidence of group directional information differences in ACA region (Figure -C and E). Indeed, these findings again highlight the strain-specific communication patterns of ACA region, in accordance with seed-based FC analysis and microstructural and morphological (DTI and DBM) results.
Figure 3-10 Directional connectivity between reward/aversion centers. (A) 3D individual color-coded representation of 6 selected seeds over mouse brain template with identification; (B-D) Mean (+SEM) of Granger Causality results with t-test (*p<0.05,**p<0.01,***p<0.001, FDR corrected). (C-E) Graphical illustration of dominant directionality difference between the two strains (C57BL/6N and BALB/cJ) with black directional arrows including black stars to represent level of significance. [Abbreviations: Nucleus Accumbens (ACB), anterior cingulate area (ACA), Hippocampus (hc), Amygdala (AMY), Caudate-putamen (CP) and ventral tegmental area (VTA)].
3.1.4 Discussion
In the recent years, huge effort has been dedicated for the characterization of the mouse brain connectome - at micro and mesoscale (Bardella et al., 2016; Grandjean et al., 2017; Grange, 2018; Ingalhalikar et al., 2014; Knox et al., 2018; Oh et al., 2014; Pervolaraki et al., 2019), as this species remains the principal animal model used in neuroscience research. Most of these studies were carried-out in the C57BL/6 strain, which remains the primary "genetic background" for modelling of human disease. However, C57BL/6 has many behavioral characteristics that make it useful for some work and inappropriate for others (Clipperton-Allen et al., 2015, p. 6; Fairless et al., 2013; Fontaine and Davis, 2016; Ohl et al., 2001; Pilz et al., 2015; Sankoorikal et al., 2006; Yoshida et al., 2016). Therefore, the uncovering the large-scale brain circuitry configurations in a strain-specific manner represents a first step towards a better understanding of modifications in brain networks under the influence of various genetic factors, pharmacological interventions and pathological conditions. In this study, we systematically characterized the brain morphological patterns along with the structural and functional connectivity profiles of two commonly used mouse strains, C57BL/6N and BALB/cJ, via non-invasive in vivo MRI techniques. We show brain-wide morphological and functional differences encompassing cortical and subcortical structures as well as WM tracts. We further provide exemplary high-resolution fiber tractography maps demonstrating the inter-individual variability across inter-hemispherical callosal pathways in the BALB/cJ strain.
3.1.4.1 Strain specific morphological and structural brain connectivity patterns
Multiple previous histological and MRI studies captured the impact of genetic variability on the morphology of the brain (Fairless et al., 2012, 2008; Fontaine and Davis, 2016; Kim et al., 2012; Kumar et al., 2012; X. Zhang et al., 2015). Mice on different genetic backgrounds have stable yet distinct behavioral phenotypes that may lead to unique gene-strain interactions on brain structure. One classical example is observed with Fragile X Mental Retardation 1 knock-out (FMR1-KO) mice in which Fragile X Syndrome and related phenotypic manifestations of autism spectrum disorder (ASD) are induced. Indeed, while FMR1-KO in C57BL/6 strain show very few differences in brain morphology compared to wild-type mice (Ellegood et al., 2010) FMR1-KO mice on an FVB background displayed multiple neuroanatomical differences, including modifications of major white matter structures throughout the brain and changes in areas associated with fronto-striatal circuitry (Lai et al., 2016). White matter changes, including prominent reduction of callosal fibers are also reported with BTBR mouse, another ASD mouse model (Dodero et al., 2013; Ellegood et al., 2013; McFarlane et al., 2008; Miller et al., 2013) In our study, we produced highly resolved fiber maps that depict striking inter-individual differences along callosal commissure in the BALB/cJ female mice, with significant inter-hemispherical under-connectivity in the rostral and caudal cc in some individuals. These in vivo brain tractograms are in agreement with previous histological (Fairless et al., 2012; Moy et al., 2007; Wahlsten, 1974) and diffusion MRI findings in BALB/cJ males (Kim et al., 2012; Kumar et al., 2012) that reported variability in the size of cc, including the complete absence, in 30-40% of this strain (Wahlsten, 1974). This variability was suggested to be possibly due to a variable delay in formation of an interhemispheric bridge of tissue in the dorsal septal region during prenatal development (Wahlsten, 1974).
In some ASD-relevant rodent models, this callosal underconnectivity normalizes overtime (Frazier et al., 2012), especially in the rostral regions of the cc - suggesting developmental
trajectories that might influence behavioral outcome overtime. The BALB/cJ inbred strain was long been discussed as relevant for certain aspects of ASD (Brodkin, 2007), showing low sociability, high anxiety and aggressive behaviors. However, compared to C57BL/6J mice, only juvenile BALB/6J animals demonstrated lower sociability scores (Fairless et al., 2012) that positively correlated with mean diffusivity values along the external capsule of the WM (Kumar et al., 2012).
Although in our study, we cannot establish a direct link between behavioral features and strain-specific brain structural modifications, we provide a refined, high resolution evidence about fiber density and tissue anisotropy dissimilarities at the level of callosal structures (gcc, mcc and scc) and alongside other WM bundles (fi, fx, cg) in female C57BL/6N and BALB/cJ mice. GM regions, likewise, showed distinct microstructural patterns in the two mice populations, prominent differences appearing in frontal cortices (ORB, IL, PL, ACA); along the fronto-striatal pathways (within CP) and within thalamic and caudal midbrain nuclei, including dopaminergic VTA and substantia nigra areas. For all these areas BALB/cJ mice show lower fiber densities and FA. Changes in fronto-striatal circuitry have been often implicated in the fragile X syndrome (FXS) with autistic-like features (Dennis and Thompson, 2013a, 2013b) as well as other brain disorders (Qiu et al., 2011; Shepherd, 2013), including attention deficit disorders. In FXS patients, the lack of response inhibition and conscious regulation of anxiety are among the phenotypes that relate to the functions of these regions (Bonelli and Cummings, 2007; Eagle et al., 2008; Fox et al., 2010), so it might be relevant that fronto-striatal fiber pathways are less dense in BALB/cJ animals, that are known to show high anxiety levels.
Furthermore, we observed large volumetric variations between two strains in the prefrontal, rostral MO, SS and temporal association cortices along with septal, hc and TH areas displaying bigger volumes in C57BL/6N. Intriguingly, mcc region was found to be larger in BALB/cJ; perhaps compensating for shorter rostro-caudal cc length to ensure unperturbed inter-hemispherical information transfer. In an ex-vivo study comparing several mouse strains (Ellegood et al., 2015) for brain morphometry, BALB/cJ mice were found to have smaller frontal and parieto-temporal lobes, similar to our findings. Such regional brain volume changes were correlated with functional impairments in ASD patients. For example, changes in superior and medial prefrontal gyri volumes correlate with cognitive outcomes in spatial relations and verbal fluency scores in ASD adolescents (Bray et al., 2011). In addition, larger CP volumes– as seen in BALB/cJ mice - is a recurrent finding in ASD patients and are associated with repetitive behaviors and cognitive deficits (Peng et al., 2014).
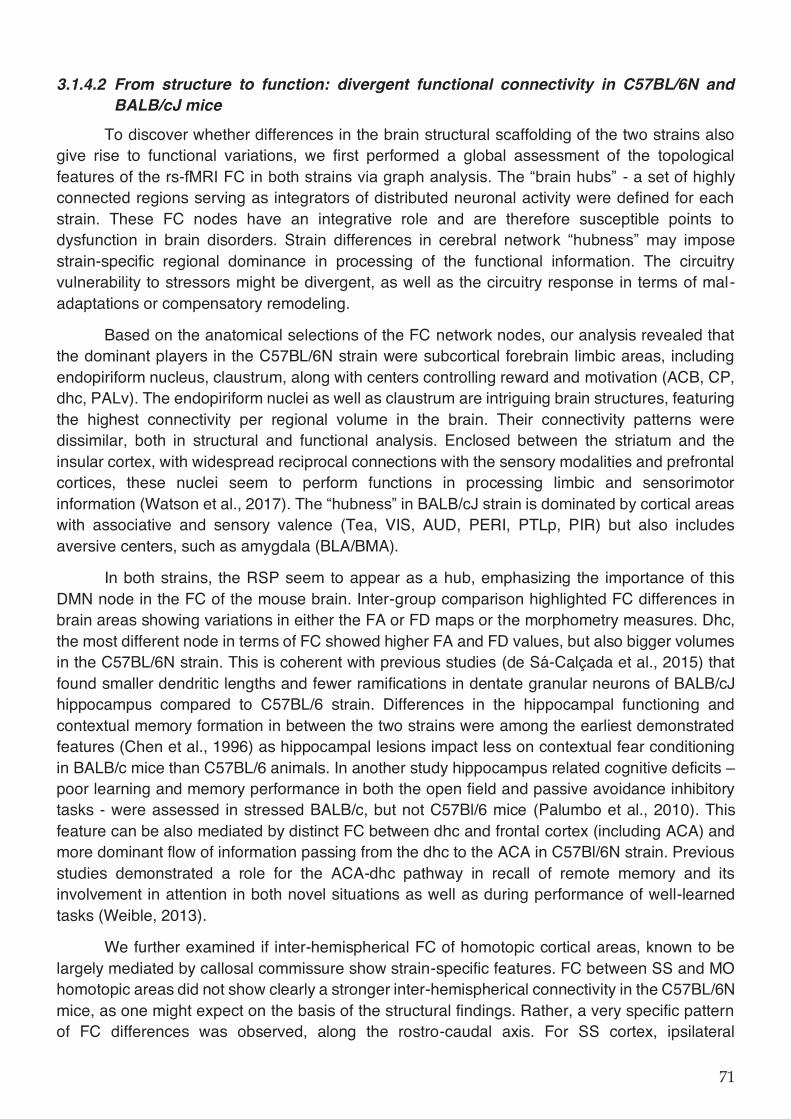
3.1.4.2 From structure to function: divergent functional connectivity in C57BL/6N and BALB/cJ mice
To discover whether differences in the brain structural scaffolding of the two strains also give rise to functional variations, we first performed a global assessment of the topological features of the rs-fMRI FC in both strains via graph analysis. The “brain hubs” - a set of highly connected regions serving as integrators of distributed neuronal activity were defined for each strain. These FC nodes have an integrative role and are therefore susceptible points to dysfunction in brain disorders. Strain differences in cerebral network “hubness” may impose strain-specific regional dominance in processing of the functional information. The circuitry vulnerability to stressors might be divergent, as well as the circuitry response in terms of mal-adaptations or compensatory remodeling.
Based on the anatomical selections of the FC network nodes, our analysis revealed that the dominant players in the C57BL/6N strain were subcortical forebrain limbic areas, including endopiriform nucleus, claustrum, along with centers controlling reward and motivation (ACB, CP, dhc, PALv). The endopiriform nuclei as well as claustrum are intriguing brain structures, featuring the highest connectivity per regional volume in the brain. Their connectivity patterns were dissimilar, both in structural and functional analysis. Enclosed between the striatum and the insular cortex, with widespread reciprocal connections with the sensory modalities and prefrontal cortices, these nuclei seem to perform functions in processing limbic and sensorimotor information (Watson et al., 2017). The “hubness” in BALB/cJ strain is dominated by cortical areas with associative and sensory valence (Tea, VIS, AUD, PERI, PTLp, PIR) but also includes aversive centers, such as amygdala (BLA/BMA).
In both strains, the RSP seem to appear as a hub, emphasizing the importance of this DMN node in the FC of the mouse brain. Inter-group comparison highlighted FC differences in brain areas showing variations in either the FA or FD maps or the morphometry measures. Dhc, the most different node in terms of FC showed higher FA and FD values, but also bigger volumes in the C57BL/6N strain. This is coherent with previous studies (de Sá-Calçada et al., 2015) that found smaller dendritic lengths and fewer ramifications in dentate granular neurons of BALB/cJ hippocampus compared to C57BL/6 strain. Differences in the hippocampal functioning and contextual memory formation in between the two strains were among the earliest demonstrated features (Chen et al., 1996) as hippocampal lesions impact less on contextual fear conditioning in BALB/c mice than C57BL/6 animals. In another study hippocampus related cognitive deficits – poor learning and memory performance in both the open field and passive avoidance inhibitory tasks - were assessed in stressed BALB/c, but not C57Bl/6 mice (Palumbo et al., 2010). This feature can be also mediated by distinct FC between dhc and frontal cortex (including ACA) and more dominant flow of information passing from the dhc to the ACA in C57Bl/6N strain. Previous studies demonstrated a role for the ACA-dhc pathway in recall of remote memory and its involvement in attention in both novel situations as well as during performance of well-learned tasks (Weible, 2013).
We further examined if inter-hemispherical FC of homotopic cortical areas, known to be largely mediated by callosal commissure show strain-specific features. FC between SS and MO homotopic areas did not show clearly a stronger inter-hemispherical connectivity in the C57BL/6N mice, as one might expect on the basis of the structural findings. Rather, a very specific pattern of FC differences was observed, along the rostro-caudal axis. For SS cortex, ipsilateral
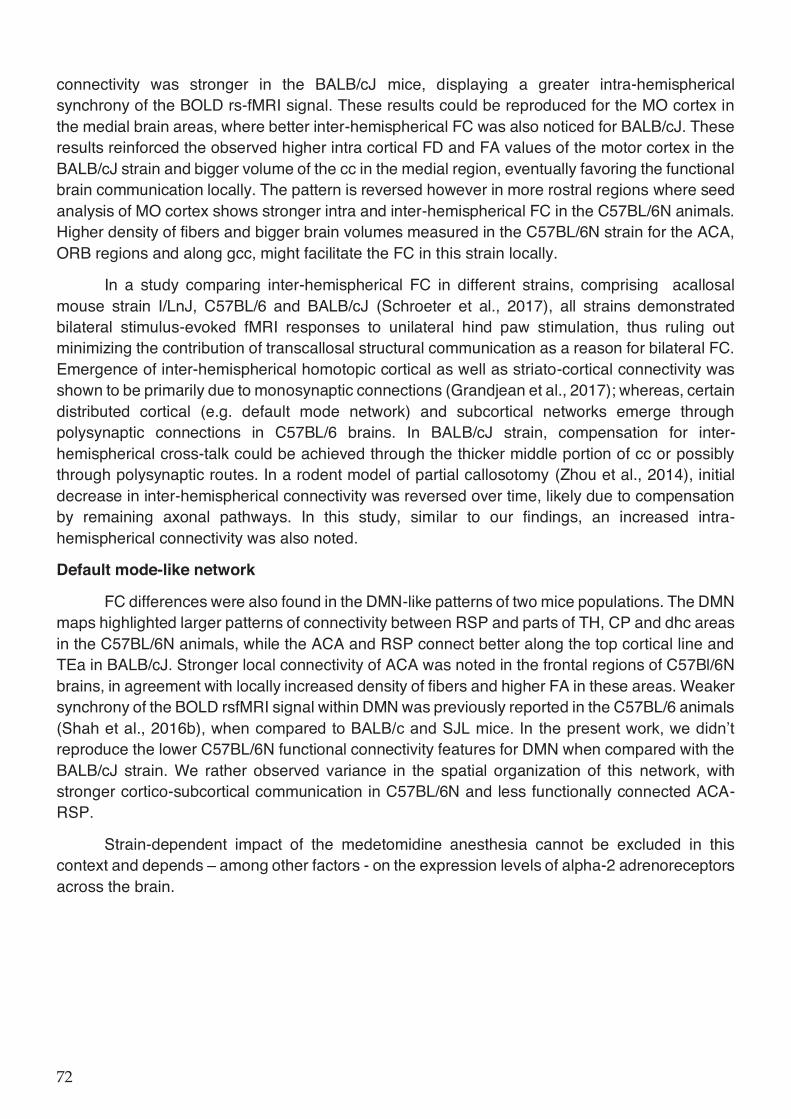
connectivity was stronger in the BALB/cJ mice, displaying a greater intra-hemispherical synchrony of the BOLD rs-fMRI signal. These results could be reproduced for the MO cortex in the medial brain areas, where better inter-hemispherical FC was also noticed for BALB/cJ. These results reinforced the observed higher intra cortical FD and FA values of the motor cortex in the BALB/cJ strain and bigger volume of the cc in the medial region, eventually favoring the functional brain communication locally. The pattern is reversed however in more rostral regions where seed analysis of MO cortex shows stronger intra and inter-hemispherical FC in the C57BL/6N animals. Higher density of fibers and bigger brain volumes measured in the C57BL/6N strain for the ACA, ORB regions and along gcc, might facilitate the FC in this strain locally.
In a study comparing inter-hemispherical FC in different strains, comprising acallosal mouse strain I/LnJ, C57BL/6 and BALB/cJ (Schroeter et al., 2017), all strains demonstrated bilateral stimulus-evoked fMRI responses to unilateral hind paw stimulation, thus ruling out minimizing the contribution of transcallosal structural communication as a reason for bilateral FC. Emergence of inter-hemispherical homotopic cortical as well as striato-cortical connectivity was shown to be primarily due to monosynaptic connections (Grandjean et al., 2017); whereas, certain distributed cortical (e.g. default mode network) and subcortical networks emerge through polysynaptic connections in C57BL/6 brains. In BALB/cJ strain, compensation for inter-hemispherical cross-talk could be achieved through the thicker middle portion of cc or possibly through polysynaptic routes. In a rodent model of partial callosotomy (Zhou et al., 2014), initial decrease in inter-hemispherical connectivity was reversed over time, likely due to compensation by remaining axonal pathways. In this study, similar to our findings, an increased intra-hemispherical connectivity was also noted.
Default mode-like network
FC differences were also found in the DMN-like patterns of two mice populations. The DMN maps highlighted larger patterns of connectivity between RSP and parts of TH, CP and dhc areas in the C57BL/6N animals, while the ACA and RSP connect better along the top cortical line and TEa in BALB/cJ. Stronger local connectivity of ACA was noted in the frontal regions of C57Bl/6N brains, in agreement with locally increased density of fibers and higher FA in these areas. Weaker synchrony of the BOLD rsfMRI signal within DMN was previously reported in the C57BL/6 animals (Shah et al., 2016b), when compared to BALB/c and SJL mice. In the present work, we didn’t reproduce the lower C57BL/6N functional connectivity features for DMN when compared with the BALB/cJ strain. We rather observed variance in the spatial organization of this network, with stronger cortico-subcortical communication in C57BL/6N and less functionally connected ACA-RSP.
Strain-dependent impact of the medetomidine anesthesia cannot be excluded in this context and depends – among other factors - on the expression levels of alpha-2 adrenoreceptors across the brain.
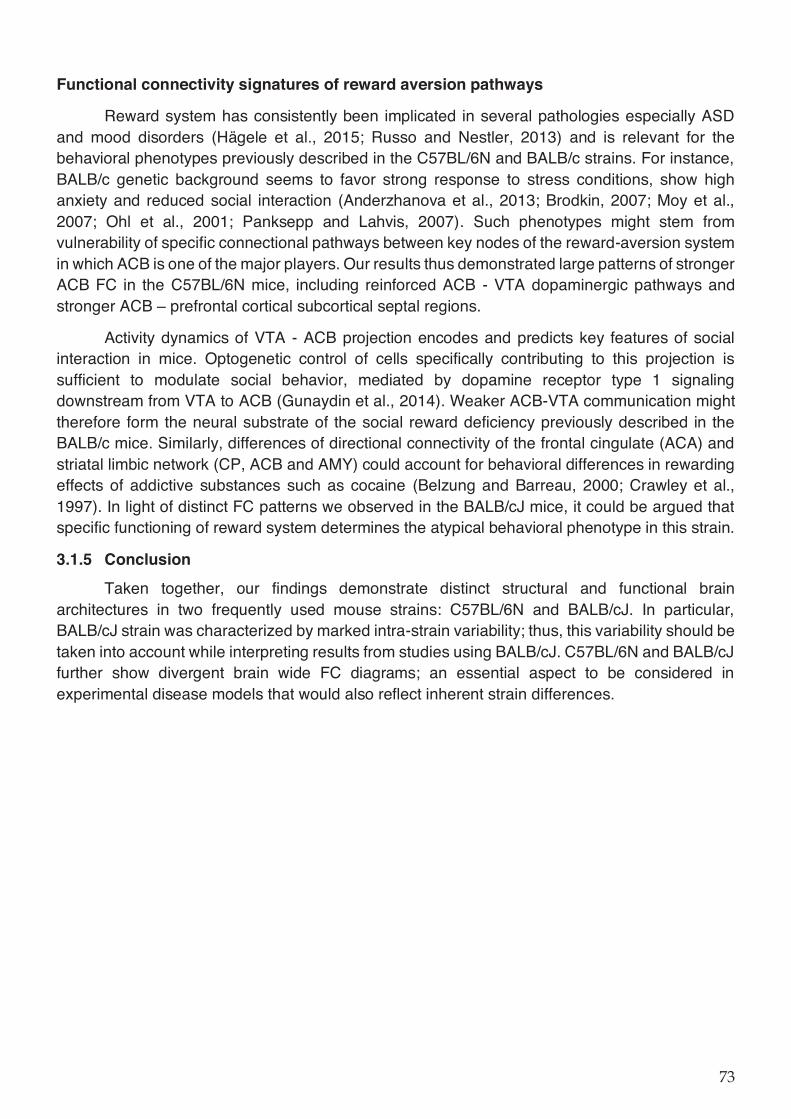
Functional connectivity signatures of reward aversion pathways
Reward system has consistently been implicated in several pathologies especially ASD and mood disorders (Hägele et al., 2015; Russo and Nestler, 2013) and is relevant for the behavioral phenotypes previously described in the C57BL/6N and BALB/c strains. For instance, BALB/c genetic background seems to favor strong response to stress conditions, show high anxiety and reduced social interaction (Anderzhanova et al., 2013; Brodkin, 2007; Moy et al., 2007; Ohl et al., 2001; Panksepp and Lahvis, 2007). Such phenotypes might stem from vulnerability of specific connectional pathways between key nodes of the reward-aversion system in which ACB is one of the major players. Our results thus demonstrated large patterns of stronger ACB FC in the C57BL/6N mice, including reinforced ACB - VTA dopaminergic pathways and stronger ACB – prefrontal cortical subcortical septal regions.
Activity dynamics of VTA - ACB projection encodes and predicts key features of social interaction in mice. Optogenetic control of cells specifically contributing to this projection is sufficient to modulate social behavior, mediated by dopamine receptor type 1 signaling downstream from VTA to ACB (Gunaydin et al., 2014). Weaker ACB-VTA communication might therefore form the neural substrate of the social reward deficiency previously described in the BALB/c mice. Similarly, differences of directional connectivity of the frontal cingulate (ACA) and striatal limbic network (CP, ACB and AMY) could account for behavioral differences in rewarding effects of addictive substances such as cocaine (Belzung and Barreau, 2000; Crawley et al., 1997). In light of distinct FC patterns we observed in the BALB/cJ mice, it could be argued that specific functioning of reward system determines the atypical behavioral phenotype in this strain.
3.1.5 Conclusion
Taken together, our findings demonstrate distinct structural and functional brain architectures in two frequently used mouse strains: C57BL/6N and BALB/cJ. In particular, BALB/cJ strain was characterized by marked intra-strain variability; thus, this variability should be taken into account while interpreting results from studies using BALB/cJ. C57BL/6N and BALB/cJ further show divergent brain wide FC diagrams; an essential aspect to be considered in experimental disease models that would also reflect inherent strain differences.

3.2 Time-dependent alterations in structural and functional brain networks in rodent neuropathic pain-induced depression
3.2.1 Introduction
Neuropathic pain is a neurological syndrome that associates both sensory nociceptive and aversive emotional components. It can also lead to anxio-depressive consequences, which increases the pain burden. The existence of neuropathic pain-induced affective disorders is further supported by preclinical studies showing that neuropathic pain models can induce anxiety- and/or depression-like behaviors in a time dependent manner (Yalcin et al., 2014a, 2011).
Previous imaging studies frequently focused on the transition from an acute to chronic pain state and demonstrated that the nucleus accumbens (ACB), hippocampus (HIP), prefrontal cortex (PFC)(M. N. Baliki et al., 2014; Bilbao et al., 2018; Chang et al., 2014), somatosensory and insular cortices (Baliki et al., 2012; Hubbard et al., 2015) are involved in the pain chronicity. However, we still do not know how the brain reorganizes functional connectivity when chronic pain comorbid with anxiety and depressive-like behaviors, which may stem from the fact that experiments in humans are generally cross-sectional in nature. Longitudinal experimental designs are thus the unique tool to study how changes occur overtime.
Longitudinal neuroimaging studies in rodent neuropathic pain models (M. N. Baliki et al., 2014; Bilbao et al., 2018; Hubbard et al., 2015; Seminowicz et al., 2009) demonstrated time-dependent changes in brain morphology, metabolism and functional connectivity. For instance, volume abnormalities in medial PFC and limbic brain regions (Bilbao et al., 2018; Seminowicz et al., 2009), altered glutamatergic transmission in the anterior cingulate area (ACA) and HIP (Bilbao et al., 2018; Hubbard et al., 2015) and an overall reorganization of corticolimbic system functional connectivity highlighting ACB, PFC and hippocampus connectivity changes (M. N. Baliki et al., 2014; Bilbao et al., 2018; Chang et al., 2014) were reported at different time points. However, the main focus of these aforementioned studies once again was nociception-related behaviors and pain chronicity.
Affective consequences of pain can be attributed to plasticity changes caused by chronic pain conditions in brain regions processing both pain and emotional/motivational information (Shelton et al., 2012; Yalcin et al., 2014a). In this framework, mesocortico-limbic circuits, encompassing reward/aversion areas such as ACB and ventral tegmental area (VTA) (Borsook et al., 2016; Mitsi and Zachariou, 2016), mPFC, ACA (Barthas et al., 2015; Wang et al., 2015; Z. Zhang et al., 2015; Zhuo, 2013) and limbic regions (e.g. amygdala, HIP) (Gonçalves et al., 2008; Mutso et al., 2013) have been shown to play important roles in negative moods associated with pain conditions. Rodent brain imaging studies using stress-based animal models of depression also highlighted the role of mesocortico-limbic areas (Anacker et al., 2016; Clemm von Hohenberg et al., 2018; Gass et al., 2014a) in particular, the major role of reward/aversion system comprising ACB, VTA, and lateral habenula (LHb). Moreover, hyperactivity of default mode network (DMN)- a large scale network of interacting brain regions that are activated during rest and deactivated during task performance- and its increased connectivity with subgenual cingulate characterizes major depressive disorder (MDD) in clinics. This hyper-connectivity is often interpreted as rumination, where depressed subjects persevere on negative, self-referential thoughts (Berman et al., 2011; Greicius et al., 2007). Similarly, these DMN alterations were also reported in rodent with stress-induced depression models (Grandjean et al., 2016; Henckens et al., 2015). Whether
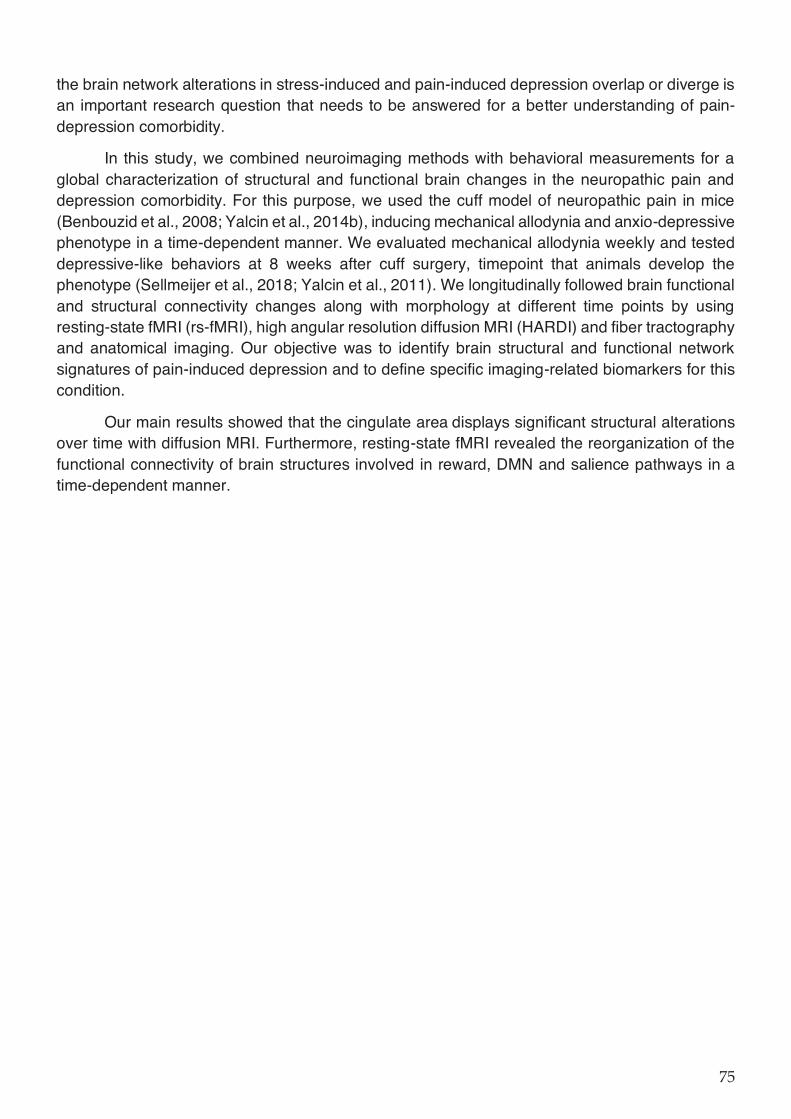
the brain network alterations in stress-induced and pain-induced depression overlap or diverge is an important research question that needs to be answered for a better understanding of pain-depression comorbidity.
In this study, we combined neuroimaging methods with behavioral measurements for a global characterization of structural and functional brain changes in the neuropathic pain and depression comorbidity. For this purpose, we used the cuff model of neuropathic pain in mice (Benbouzid et al., 2008; Yalcin et al., 2014b), inducing mechanical allodynia and anxio-depressive phenotype in a time-dependent manner. We evaluated mechanical allodynia weekly and tested depressive-like behaviors at 8 weeks after cuff surgery, timepoint that animals develop the phenotype (Sellmeijer et al., 2018; Yalcin et al., 2011). We longitudinally followed brain functional and structural connectivity changes along with morphology at different time points by using resting-state fMRI (rs-fMRI), high angular resolution diffusion MRI (HARDI) and fiber tractography and anatomical imaging. Our objective was to identify brain structural and functional network signatures of pain-induced depression and to define specific imaging-related biomarkers for this condition.
Our main results showed that the cingulate area displays significant structural alterations over time with diffusion MRI. Furthermore, resting-state fMRI revealed the reorganization of the functional connectivity of brain structures involved in reward, DMN and salience pathways in a time-dependent manner.
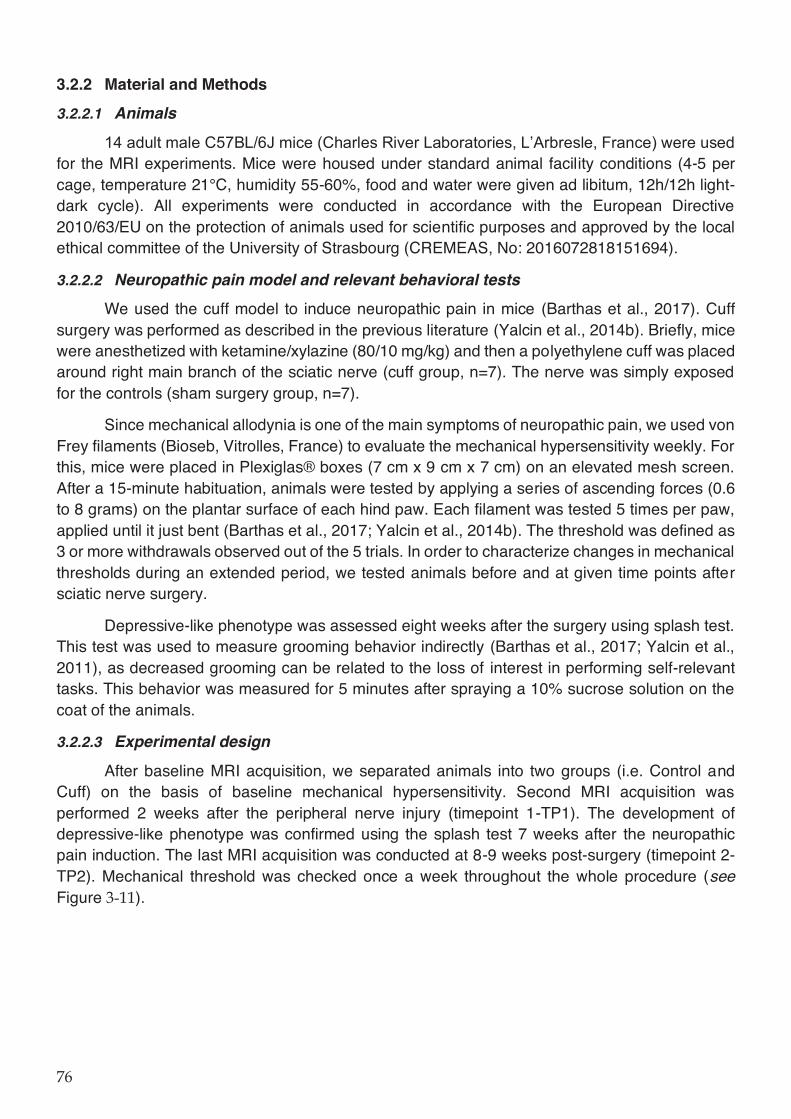
3.2.2 Material and Methods
3.2.2.1 Animals
14 adult male C57BL/6J mice (Charles River Laboratories, L’Arbresle, France) were used for the MRI experiments. Mice were housed under standard animal facility conditions (4-5 per cage, temperature 21°C, humidity 55-60%, food and water were given ad libitum, 12h/12h light-dark cycle). All experiments were conducted in accordance with the European Directive 2010/63/EU on the protection of animals used for scientific purposes and approved by the local ethical committee of the University of Strasbourg (CREMEAS, No: 2016072818151694).
3.2.2.2 Neuropathic pain model and relevant behavioral tests
We used the cuff model to induce neuropathic pain in mice (Barthas et al., 2017). Cuff surgery was performed as described in the previous literature (Yalcin et al., 2014b). Briefly, mice were anesthetized with ketamine/xylazine (80/10 mg/kg) and then a polyethylene cuff was placed around right main branch of the sciatic nerve (cuff group, n=7). The nerve was simply exposed for the controls (sham surgery group, n=7).
Since mechanical allodynia is one of the main symptoms of neuropathic pain, we used von Frey filaments (Bioseb, Vitrolles, France) to evaluate the mechanical hypersensitivity weekly. For this, mice were placed in Plexiglas® boxes (7 cm x 9 cm x 7 cm) on an elevated mesh screen. After a 15-minute habituation, animals were tested by applying a series of ascending forces (0.6 to 8 grams) on the plantar surface of each hind paw. Each filament was tested 5 times per paw, applied until it just bent (Barthas et al., 2017; Yalcin et al., 2014b). The threshold was defined as 3 or more withdrawals observed out of the 5 trials. In order to characterize changes in mechanical thresholds during an extended period, we tested animals before and at given time points after sciatic nerve surgery.
Depressive-like phenotype was assessed eight weeks after the surgery using splash test. This test was used to measure grooming behavior indirectly (Barthas et al., 2017; Yalcin et al., 2011), as decreased grooming can be related to the loss of interest in performing self-relevant tasks. This behavior was measured for 5 minutes after spraying a 10% sucrose solution on the coat of the animals.
3.2.2.3 Experimental design
After baseline MRI acquisition, we separated animals into two groups (i.e. Control and Cuff) on the basis of baseline mechanical hypersensitivity. Second MRI acquisition was performed 2 weeks after the peripheral nerve injury (timepoint 1-TP1). The development of depressive-like phenotype was confirmed using the splash test 7 weeks after the neuropathic pain induction. The last MRI acquisition was conducted at 8-9 weeks post-surgery (timepoint 2- TP2). Mechanical threshold was checked once a week throughout the whole procedure (see Figure ).
Figure 3-11 Experimental timeline. After baseline resting state functional magnetic resonance imaging (rs-fMRI) and diffusion MRI acquisition, we separated animals into two groups, cuff and sham surgery groups (neuropathic pain and control mice, respectively) based on their mechanical hypersensitivity. Second MRI acquisition was performed 2 weeks after the peripheral nerve injury (TP1). The development of depressive-like phenotype was confirmed using the splash test 7 weeks after the neuropathic pain induction. Last MRI acquisition was conducted at 8-9 weeks post-surgery (TP2). Mechanical threshold was checked once a week throughout the entire procedure.
3.2.2.4 MRI data acquisition
All scans were performed with a 7T Bruker BioSpec 70/30 USR animal scanner, room temperature surface coil for the acquisition of the MRI signal and ParaVision software version 6.1 (Bruker, Ettlingen, Germany) at baseline and at 2 (TP1) and 8 weeks (TP2) after cuff surgery.
Animal preparation and placement were done under 2% isoflurane; a bolus of medetomidine (0.15 mg/kg body weight sc) was administered during preparation. 10 minutes after the bolus injection, isoflurane was discontinued, and animal bed was placed in the scanner. Medetomidine infusion was started (0.3 mg/kg bw /h sc) right before the rs-fMRI scans, within 35 minutes of bolus injection. Respiration and body temperature were monitored throughout the imaging session. Acquisition parameters for rs-fMRI were: single shot GE-EPI sequence, 31 axial slices of 0.5 mm thickness, FOV=2.12×1.8 cm, matrix=147× 59, TE/TR= 15 ms /2000 ms, 500 image volumes, 0.14× 0.23× 0.5 mm³ resolution. Acquisition time was 16 minutes.
Morphological T2-weighted brain images (resolution of 0.08 × 0.08 × 0.4 mm3) were acquired with a RARE sequence using the following parameters: TE/TR =40 ms/4591 ms; 48 slices, 0.4 mm slice thickness, interlaced sampling, RARE factor of 8, 4 averages; an acquisition matrix of 256 × 256 and FOV of 2.12×2 cm2. For the diffusion MRI, medetomidine infusion was replaced with 1.5% isoflurane anesthesia. HARDI (High Angular Resolution Diffusion Imaging) acquisitions were carried out using a single shot DTI-EPI sequence, 27 axial slices, 0.1×0.1×0.5 mm³ resolution, TE/TR= 28.9 ms/3000 ms, 4 averages, diffusion gradients applied along 30 non-collinear directions, 2 b-values (1000/2000 s/mm2), gradient duration (δ)/separation(Δ)= 5 ms/10.6 ms for an acquisition time of 1 hour 13 minutes.
3.2.2.5 Statistical analysis of behavioral parameters
Data are presented as mean± SEM. For behavioral data, statistical analyses were performed with Statistica 7.1 software (StatSoft, Tulsa, OK) by using multifactor analysis of variance (ANOVA) with repeated measures and Duncan post hoc analyses for von Frey test and unpaired Student’s t tests for splash test. Significance level was set to p<0.05.
3.2.2.6 MRI data processing
Resting-state fMRI data
Rs-fMRI images were spatially normalized into a template using Advanced Normalization Tools (ANTs) software (Avants et al., 2011) using SyN algorithm and smoothed (FWHM=0.28×0.46×1 mm3) with SPM8.
Seed-based functional connectivity analysis was performed with a MATLAB tool developed in-house. Regions of interest (ROI) were extracted from Allen Mouse Brain Atlas (Lein et al., 2007) which were later normalized into the template space. Resting-state time series were de-trended, band-pass filtered (0.01-0.1 Hz) and regressed for cerebrospinal fluid signal from the ventricles. Principal component analysis (PCA) of the BOLD time courses across voxels within a given ROI was performed and first principal component accounting for the largest variability was selected as the representative time course for further analysis.
Partial correlation (PC) between the representative time courses of selected ROIs were computed to construct individual connectivity matrices for each mouse (76 pre-selected regions comprising limbic, cortical, reward, and nociceptive areas and covering the entire isocortex and major subcortical areas). Fisher’s r-to-z transformation was applied to individual matrices and average PC matrices were computed by pooling the two groups at baseline, and for each group at TP1 and T2. Connections surviving p<0.001 (uncorrected) threshold for one sample t-test were selected for graph theoretical analysis using NetworkX software package for Python (https://networkx.github.io). A ranking of hub regions (nodes) are reported for each timepoint. For statistical comparison between the two groups, individual baseline matrices were subtracted from those belonging to TP1 and TP2, and two sample t-test was applied for subtraction matrices at each post-injury time point. Most changed connections (edges, expressed as degrees) and most changed nodes (expressed as Stouffer coefficients) were ranked among connections surviving p<0.05 (uncorrected) threshold. Briefly, Stouffer method uses a single p-value computed for each region based on the combination of the p-values derived from the statistical tests made on the correlations with all other regions, highlighting the regions with major changes in the inter-group comparison (Stouffer et al., 1949).
Furthermore, Spearman correlations between the PCA time course of single ROIs and each voxel of the brain was computed at the group and individual levels and r values were converted to z using Fisher’s r-to-z transformation. Individual connectivity maps for baseline rs-fMRI acquisitions were subtracted from TP1 and TP2 counterparts for each subject. Baseline subtracted TP1 and TP2 connectivity maps were subsequently used for two sample t-test with SPM8 to perform group comparison at two post-injury timepoints. Family-wise error rate (FWER) correction was applied at the cluster level (p<0.05) for each statistical image. Additionally, statistical analysis of baseline-subtracted connectivity maps was performed using SPM full factorial ANOVA of the two factors group and time point, associated with two levels respectively (Neuropathic and control for the group factor; TP1 and TP2 for the time point factor) to compare longitudinal evolution of functional modifications between groups. The group effect results on the evolution functional connectivity of several ROIs from TP1 to TP2 in mice were reported (p<0.05, FWER cluster corrected).
Diffusion MRI data
Post-processing of the diffusion data was performed using an in-house developed DTI and FiberTool software package (see www.uniklinik-freiburg.de/mr-en/research-groups/diffperf/fibertools.html) for SPM on MATLAB. Diffusion-based parameter maps were generated, including fractional anisotropy (FA), mean diffusivity (MD), radial (RD) and axial diffusivities (AD). Mouse brain diffusion tractograpy using a global fiber tracking algorithm (Harsan et al., 2013) was also performed and fiber density (FD) maps were generated (Reisert et al., 2011). Diffusion MRI parametric maps were also compared across groups using a voxel-based analysis. The FA and FD maps were jointly registered using the multimodal group-wise registration procedure implemented in the ANTs; the analysis was then conducted using the voxel-based quantification (VBQ) method (Draganski et al., 2011). This method implements a combined weighting/smoothing procedure, which avoids parameter value changes by Gaussian smoothing applied in standardized space. Furthermore, we conducted voxel-wise analysis on FD maps modulated by jacobian values in order to quantify the amount of fibers in the standardized space which accurately reflects that of the native space. A Gaussian kernel with a FWHM of 0.5 mm was applied here. Baseline VBQ images were subtracted from images for later time points. Intergroup comparisons were conducted at the voxel level using the general linear model in SPM8. Statistical maps were corrected with family-wise error rate (FWER) applied at the cluster level for p<0.05.
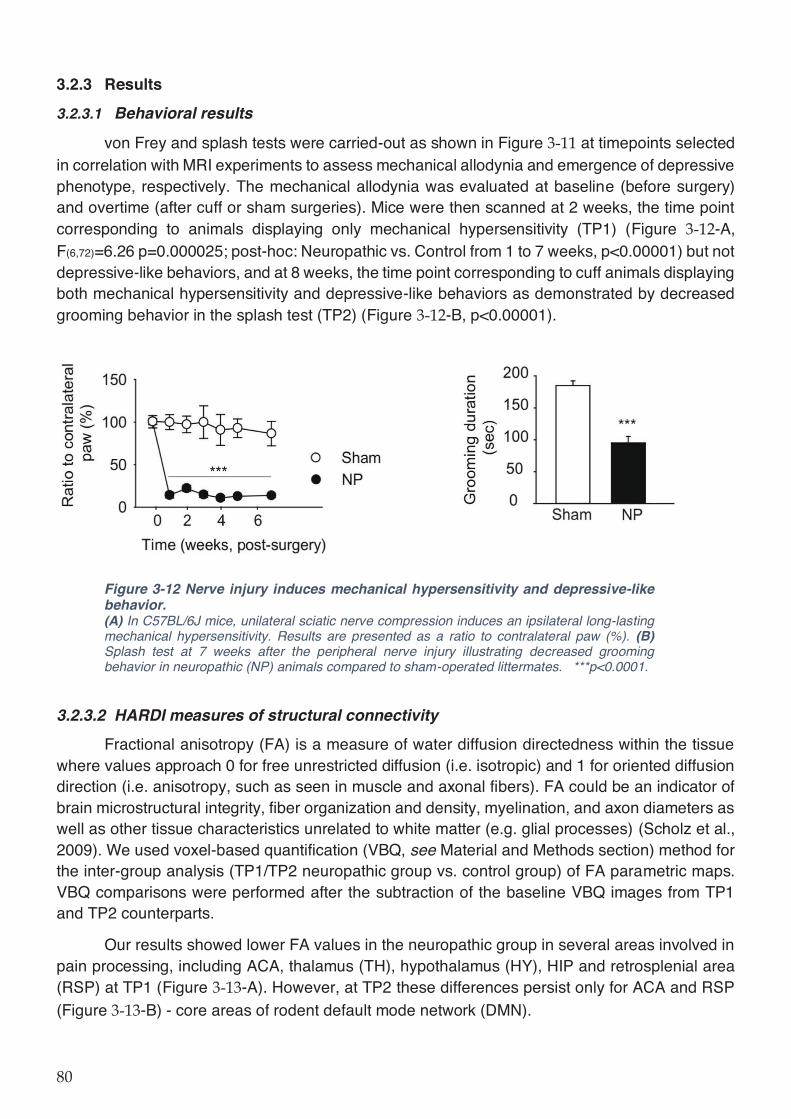
3.2.3 Results
3.2.3.1 Behavioral results
von Frey and splash tests were carried-out as shown in Figure at timepoints selected in correlation with MRI experiments to assess mechanical allodynia and emergence of depressive phenotype, respectively. The mechanical allodynia was evaluated at baseline (before surgery) and overtime (after cuff or sham surgeries). Mice were then scanned at 2 weeks, the time point corresponding to animals displaying only mechanical hypersensitivity (TP1) (Figure -A, F(6,72)=6.26 p=0.000025; post-hoc: Neuropathic vs. Control from 1 to 7 weeks, p<0.00001) but not depressive-like behaviors, and at 8 weeks, the time point corresponding to cuff animals displaying both mechanical hypersensitivity and depressive-like behaviors as demonstrated by decreased grooming behavior in the splash test (TP2) (Figure -B, p<0.00001).
Figure 3-12 Nerve injury induces mechanical hypersensitivity and depressive-like behavior. (A) In C57BL/6J mice, unilateral sciatic nerve compression induces an ipsilateral long-lasting mechanical hypersensitivity. Results are presented as a ratio to contralateral paw (%). (B) Splash test at 7 weeks after the peripheral nerve injury illustrating decreased grooming behavior in neuropathic (NP) animals compared to sham-operated littermates. ***p<0.0001.
3.2.3.2 HARDI measures of structural connectivity
Fractional anisotropy (FA) is a measure of water diffusion directedness within the tissue where values approach 0 for free unrestricted diffusion (i.e. isotropic) and 1 for oriented diffusion direction (i.e. anisotropy, such as seen in muscle and axonal fibers). FA could be an indicator of brain microstructural integrity, fiber organization and density, myelination, and axon diameters as well as other tissue characteristics unrelated to white matter (e.g. glial processes) (Scholz et al., 2009). We used voxel-based quantification (VBQ, see Material and Methods section) method for the inter-group analysis (TP1/TP2 neuropathic group vs. control group) of FA parametric maps. VBQ comparisons were performed after the subtraction of the baseline VBQ images from TP1 and TP2 counterparts.
Our results showed lower FA values in the neuropathic group in several areas involved in pain processing, including ACA, thalamus (TH), hypothalamus (HY), HIP and retrosplenial area (RSP) at TP1 (Figure -A). However, at TP2 these differences persist only for ACA and RSP (Figure -B) - core areas of rodent default mode network (DMN).
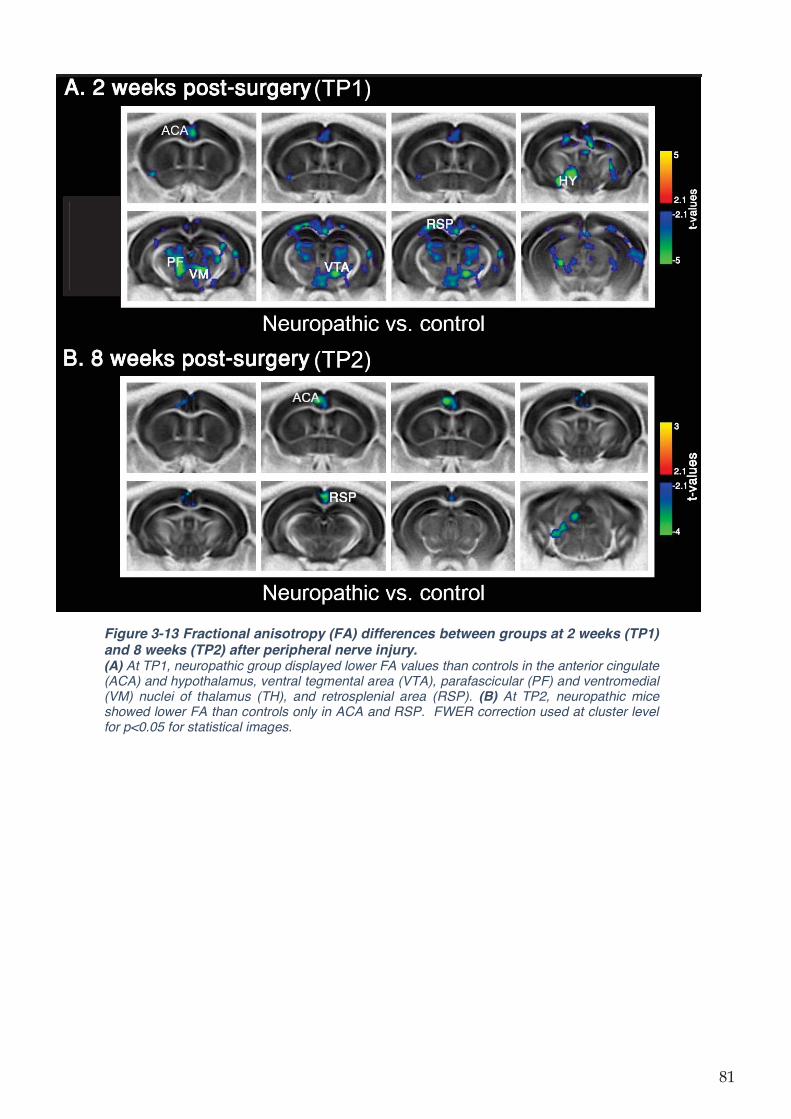
Figure 3-13 Fractional anisotropy (FA) differences between groups at 2 weeks (TP1) and 8 weeks (TP2) after peripheral nerve injury. (A) At TP1, neuropathic group displayed lower FA values than controls in the anterior cingulate (ACA) and hypothalamus, ventral tegmental area (VTA), parafascicular (PF) and ventromedial (VM) nuclei of thalamus (TH), and retrosplenial area (RSP). (B) At TP2, neuropathic mice showed lower FA than controls only in ACA and RSP. FWER correction used at cluster level for p<0.05 for statistical images.
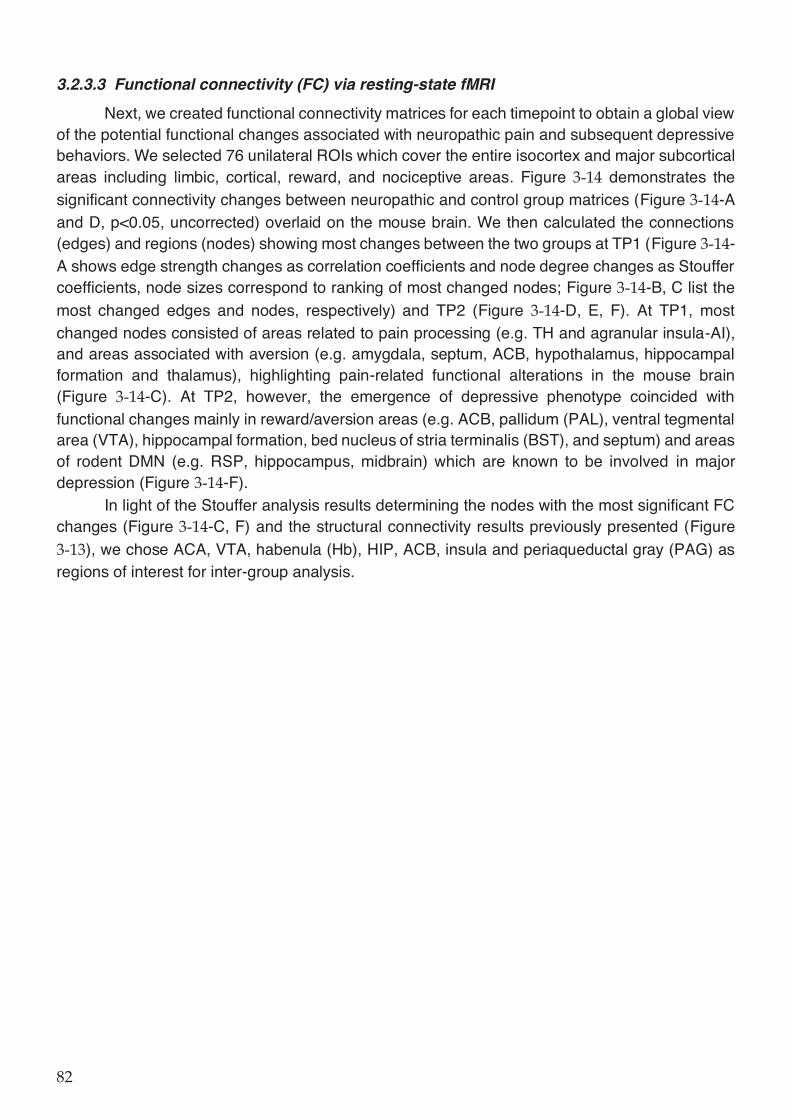
3.2.3.3 Functional connectivity (FC) via resting-state fMRI
Next, we created functional connectivity matrices for each timepoint to obtain a global view of the potential functional changes associated with neuropathic pain and subsequent depressive behaviors. We selected 76 unilateral ROIs which cover the entire isocortex and major subcortical areas including limbic, cortical, reward, and nociceptive areas. Figure demonstrates the significant connectivity changes between neuropathic and control group matrices (Figure -A and D, p<0.05, uncorrected) overlaid on the mouse brain. We then calculated the connections (edges) and regions (nodes) showing most changes between the two groups at TP1 (Figure -A shows edge strength changes as correlation coefficients and node degree changes as Stouffer coefficients, node sizes correspond to ranking of most changed nodes; Figure -B, C list the most changed edges and nodes, respectively) and TP2 (Figure -D, E, F). At TP1, most changed nodes consisted of areas related to pain processing (e.g. TH and agranular insula-AI), and areas associated with aversion (e.g. amygdala, septum, ACB, hypothalamus, hippocampal formation and thalamus), highlighting pain-related functional alterations in the mouse brain (Figure -C). At TP2, however, the emergence of depressive phenotype coincided with functional changes mainly in reward/aversion areas (e.g. ACB, pallidum (PAL), ventral tegmental area (VTA), hippocampal formation, bed nucleus of stria terminalis (BST), and septum) and areas of rodent DMN (e.g. RSP, hippocampus, midbrain) which are known to be involved in major depression (Figure -F).
In light of the Stouffer analysis results determining the nodes with the most significant FC changes (Figure -C, F) and the structural connectivity results previously presented (Figure
), we chose ACA, VTA, habenula (Hb), HIP, ACB, insula and periaqueductal gray (PAG) as regions of interest for inter-group analysis.
Figure 3-14 Graph theoretical analysis for functional connectivity matrices. (A and D) Significant changes between neuropathic and control groups for connection (edge) strengths and nodes are shown as mouse brain overlays at TP1 (A) and TP2 (D). Edge strength changes are displayed on a scale of correlation coefficients. The relevance of FC chances for each node was assessed using two measures: the degree (color coded) denoting the number of significantly changed connections / node; and the Stouffer coefficient (node size) that is also introducing the weight of the changes for each connection. Stouffer coefficients and therefore the node sizes correspond to ranking of most changed nodes. (B and E) List of most changed edges (according to the p value) are ranked for TP1 (B) and TP2 (E). (C and F) List of most changed nodes from Stouffer analysis are ranked for the two post-injury timepoints. (C) At TP1, most changed nodes are areas related to pain processing (e.g. thalamus [TH] and agranular insula [AI]) and aversion (e.g. amygdala, septum, nucleus accumbens [ACB], hypothalamus [HY], hippocampal formation and thalamus [TH]). (F) At TP2, mainly reward/aversion areas (e.g. ACB, pallidum (PAL), ventral tegmental area (VTA), hippocampal formation, bed nucleus of stria terminalis (BST), and septum) and areas of rodent default-mode network (DMN) (e.g. RSP, hippocampus, midbrain) are listed as the nodes with most changes. All results are p<0.05, uncorrected.
(Abbreviations: AAA-CEA-MEA: Anterior-central-medial amygdala; ACB: Nucleus accumbens; AI: Agranular insula; AUD: Auditory areas; BST: Bed nucleus of stria terminalis; CLA: Claustrum; COA-PAA-TR: Cortical-piriform amygdalar areas, post-piriform transition area; dhc: Dorsal hippocampus; ECT: Ectorhinal area; ENT: Entorhinal area; EP: Endopiriform nucleus; FRP: Frontal pole; GU: Gustatory area; HY: Hypothalamus; LA-BMA-BLA-PA: Lateral-basomedial-basolateral-posterior amygdala; LSX-MSC-TRS: Lateral-medial septum, triangular nucleus; MBsta: Behavioral state-related midbrain; MH-LH: Medial-lateral habenula; MOp: Primary motor area; ORB: Orbital area; PAG: Periaqueductal gray; PALd: Dorsal pallidum; PALv: Ventral pallidum; PAR-POST-PRE-SUB: Para-/post-/pre-/subiculum; PERI: Perirhinal area; PIR: Piriform area; PTLp: Posterior parietal association area; RSP: Retrosplenial area; SS: Somatosensory area; TEa: Temporal association area; TH: Thalamus; vhc: Ventral hippocampus; VISC: Visceral area; VTA: Ventral tegmental area.)
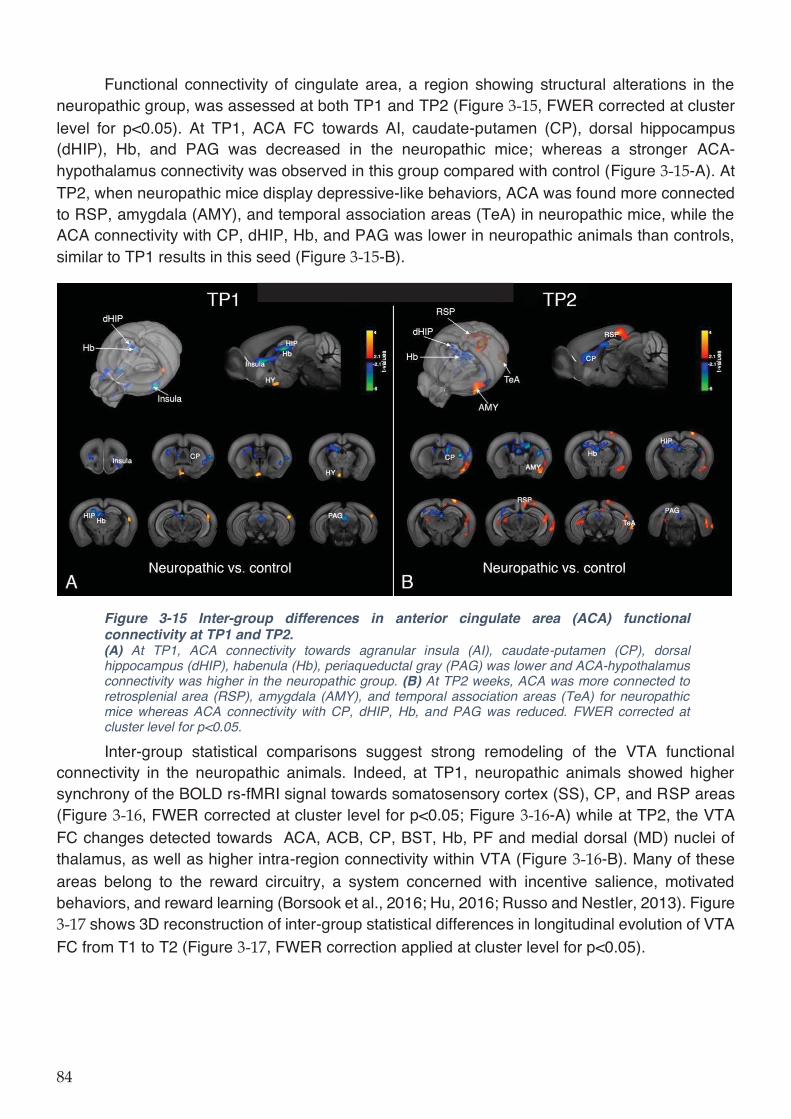
Functional connectivity of cingulate area, a region showing structural alterations in the neuropathic group, was assessed at both TP1 and TP2 (Figure , FWER corrected at cluster level for p<0.05). At TP1, ACA FC towards AI, caudate-putamen (CP), dorsal hippocampus (dHIP), Hb, and PAG was decreased in the neuropathic mice; whereas a stronger ACA-hypothalamus connectivity was observed in this group compared with control (Figure -A). At TP2, when neuropathic mice display depressive-like behaviors, ACA was found more connected to RSP, amygdala (AMY), and temporal association areas (TeA) in neuropathic mice, while the ACA connectivity with CP, dHIP, Hb, and PAG was lower in neuropathic animals than controls, similar to TP1 results in this seed (Figure -B).
Figure 3-15 Inter-group differences in anterior cingulate area (ACA) functional connectivity at TP1 and TP2. (A) At TP1, ACA connectivity towards agranular insula (AI), caudate-putamen (CP), dorsal hippocampus (dHIP), habenula (Hb), periaqueductal gray (PAG) was lower and ACA-hypothalamus connectivity was higher in the neuropathic group. (B) At TP2 weeks, ACA was more connected to retrosplenial area (RSP), amygdala (AMY), and temporal association areas (TeA) for neuropathic mice whereas ACA connectivity with CP, dHIP, Hb, and PAG was reduced. FWER corrected at cluster level for p<0.05.
Inter-group statistical comparisons suggest strong remodeling of the VTA functional connectivity in the neuropathic animals. Indeed, at TP1, neuropathic animals showed higher synchrony of the BOLD rs-fMRI signal towards somatosensory cortex (SS), CP, and RSP areas (Figure , FWER corrected at cluster level for p<0.05; Figure -A) while at TP2, the VTA FC changes detected towards ACA, ACB, CP, BST, Hb, PF and medial dorsal (MD) nuclei of thalamus, as well as higher intra-region connectivity within VTA (Figure -B). Many of these areas belong to the reward circuitry, a system concerned with incentive salience, motivated behaviors, and reward learning (Borsook et al., 2016; Hu, 2016; Russo and Nestler, 2013). Figure
shows 3D reconstruction of inter-group statistical differences in longitudinal evolution of VTA FC from T1 to T2 (Figure , FWER correction applied at cluster level for p<0.05).

Figure 3-16 Inter-group differences in ventral tegmental area (VTA) functional connectivity at TP1 and TP2. (A) At TP1, somatosensory (SS), caudate-putamen (CP) and retrosplenial area (RSP) connectivity towards VTA was higher in neuropathic mice than in controls. (B) At TP2, neuropathic group showed greater VTA synchrony towards anterior cingulate (ACA), nucleus accumbens (ACB), CP, bed nucleus of stria terminalis (BST), habenula (Hb), parafascicular (PF) and medial dorsal (MD) nuclei of thalamus and higher intra-region connectivity at VTA. FWER corrected at cluster level for p<0.05.
Figure 3-17 3D reconstruction of inter-group statistical differences in longitudinal evolution of VTA functional connectivity from T1 to T2. Full factorial ANOVA results, FWER correction applied at cluster level for p<0.05.
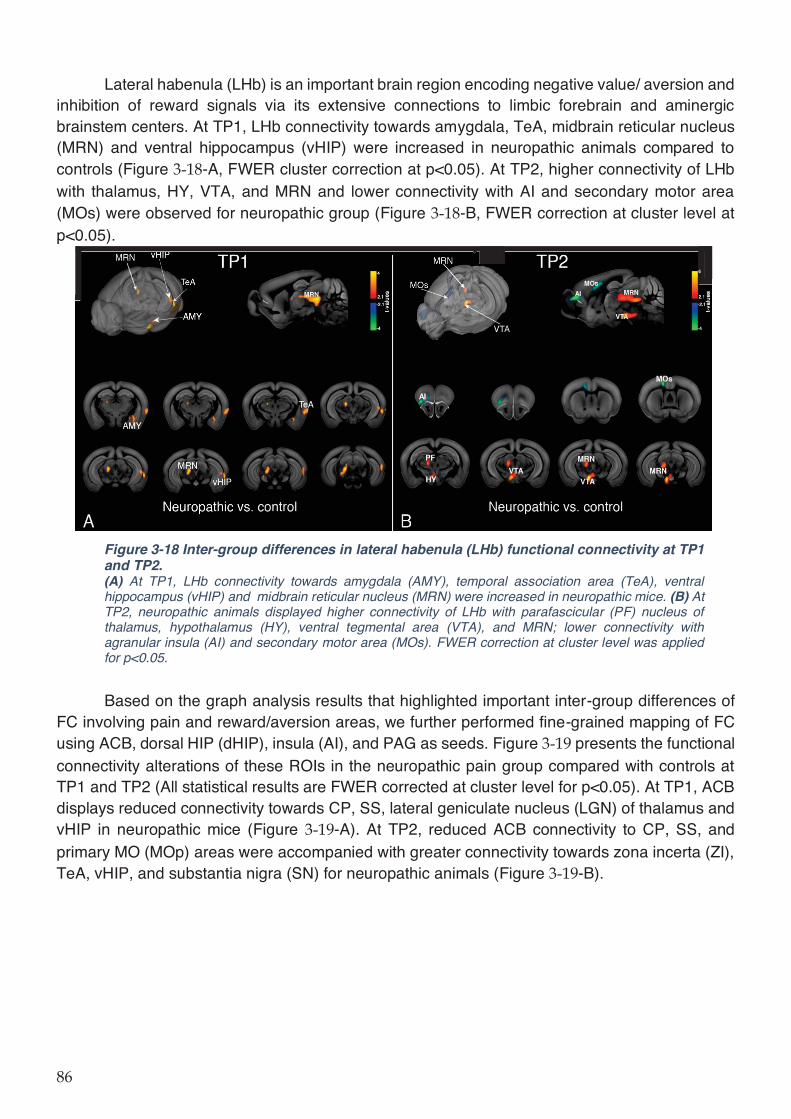
Lateral habenula (LHb) is an important brain region encoding negative value/ aversion and inhibition of reward signals via its extensive connections to limbic forebrain and aminergic brainstem centers. At TP1, LHb connectivity towards amygdala, TeA, midbrain reticular nucleus (MRN) and ventral hippocampus (vHIP) were increased in neuropathic animals compared to controls (Figure -A, FWER cluster correction at p<0.05). At TP2, higher connectivity of LHb with thalamus, HY, VTA, and MRN and lower connectivity with AI and secondary motor area (MOs) were observed for neuropathic group (Figure -B, FWER correction at cluster level at p<0.05).
Figure 3-18 Inter-group differences in lateral habenula (LHb) functional connectivity at TP1 and TP2. (A) At TP1, LHb connectivity towards amygdala (AMY), temporal association area (TeA), ventral hippocampus (vHIP) and midbrain reticular nucleus (MRN) were increased in neuropathic mice. (B) At TP2, neuropathic animals displayed higher connectivity of LHb with parafascicular (PF) nucleus of thalamus, hypothalamus (HY), ventral tegmental area (VTA), and MRN; lower connectivity with agranular insula (AI) and secondary motor area (MOs). FWER correction at cluster level was applied for p<0.05.
Based on the graph analysis results that highlighted important inter-group differences of
FC involving pain and reward/aversion areas, we further performed fine-grained mapping of FC using ACB, dorsal HIP (dHIP), insula (AI), and PAG as seeds. Figure presents the functional connectivity alterations of these ROIs in the neuropathic pain group compared with controls at TP1 and TP2 (All statistical results are FWER corrected at cluster level for p<0.05). At TP1, ACB displays reduced connectivity towards CP, SS, lateral geniculate nucleus (LGN) of thalamus and vHIP in neuropathic mice (Figure -A). At TP2, reduced ACB connectivity to CP, SS, and primary MO (MOp) areas were accompanied with greater connectivity towards zona incerta (ZI), TeA, vHIP, and substantia nigra (SN) for neuropathic animals (Figure -B).
p<0
dHIP connectivity at TP1 was higher towards AMY, RSP, superior colliculus (SC), and LGN and lower towards CP in neuropathic pain group (Figure -C). dHIP demonstrated increased connectivity with AMY and posterior parietal association areas (PTLp) and decreased connectivity with ACA and septum in neuropathic animals with depressive phenotype at TP2 (Figure -D).
Insula and PAG, areas known to be involved in pain processing, also showed connectivity alterations in the neuropathic pain group. Insular connectivity towards RSP and PAG was greater and its connectivity towards MOs, TH and vHIP was lower in neuropathic mice at TP1 (Figure
-E). At TP2, neuropathic pain group presenting depressive behaviors showed insular connectivity patterns increased towards HY, LGN, and entorhinal areas (ENT) and decreased towards CP, PF nucleus, TeA, and MRN (Figure -F). PAG connectivity at TP1 (Figure -G) was higher towards ACB, CP and HY and lower towards Hb, PTLp and SS areas in neuropathic mice compared to controls. At TP2, connectivity of PAG with ACB, piriform area (PIR), olfactory tubercle (OT), and LGN was stronger and PAG-SS connections were weaker for neuropathic pain-induced depression group (Figure -H).
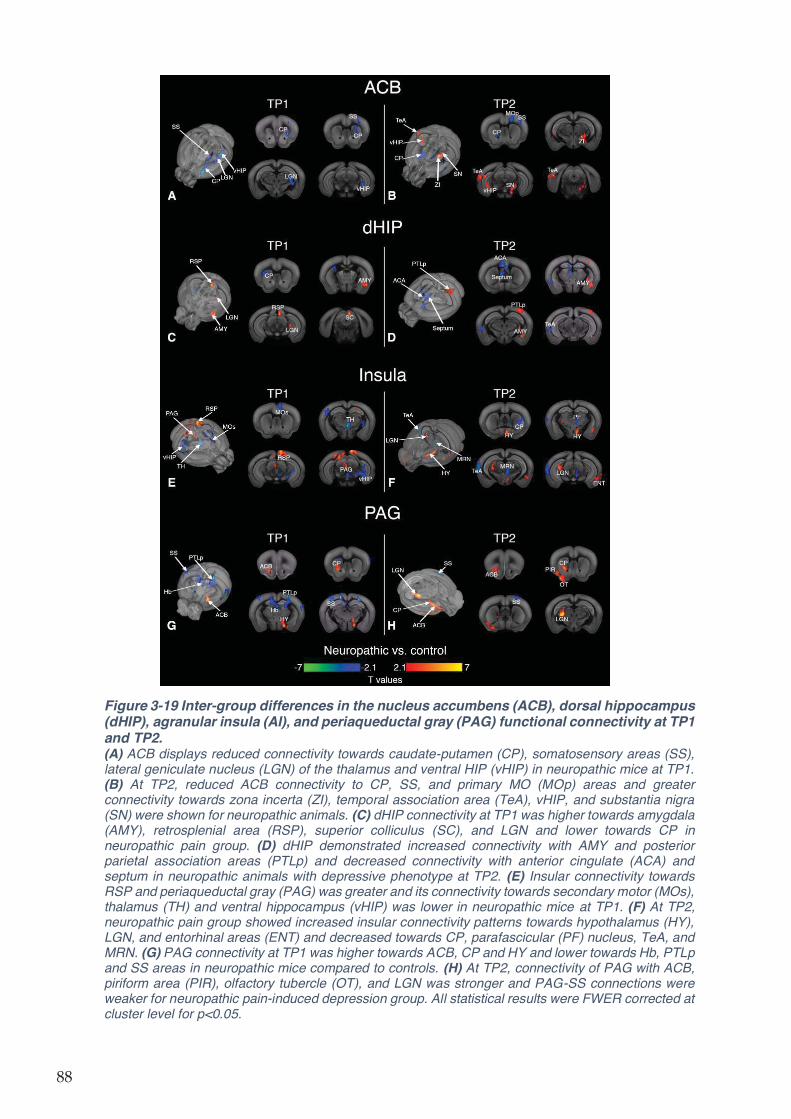
Figure 3-19 Inter-group differences in the nucleus accumbens (ACB), dorsal hippocampus (dHIP), agranular insula (AI), and periaqueductal gray (PAG) functional connectivity at TP1 and TP2. (A) ACB displays reduced connectivity towards caudate-putamen (CP), somatosensory areas (SS), lateral geniculate nucleus (LGN) of the thalamus and ventral HIP (vHIP) in neuropathic mice at TP1. (B) At TP2, reduced ACB connectivity to CP, SS, and primary MO (MOp) areas and greater connectivity towards zona incerta (ZI), temporal association area (TeA), vHIP, and substantia nigra (SN) were shown for neuropathic animals. (C) dHIP connectivity at TP1 was higher towards amygdala (AMY), retrosplenial area (RSP), superior colliculus (SC), and LGN and lower towards CP in neuropathic pain group. (D) dHIP demonstrated increased connectivity with AMY and posterior parietal association areas (PTLp) and decreased connectivity with anterior cingulate (ACA) and septum in neuropathic animals with depressive phenotype at TP2. (E) Insular connectivity towards RSP and periaqueductal gray (PAG) was greater and its connectivity towards secondary motor (MOs), thalamus (TH) and ventral hippocampus (vHIP) was lower in neuropathic mice at TP1. (F) At TP2, neuropathic pain group showed increased insular connectivity patterns towards hypothalamus (HY), LGN, and entorhinal areas (ENT) and decreased towards CP, parafascicular (PF) nucleus, TeA, and MRN. (G) PAG connectivity at TP1 was higher towards ACB, CP and HY and lower towards Hb, PTLp and SS areas in neuropathic mice compared to controls. (H) At TP2, connectivity of PAG with ACB, piriform area (PIR), olfactory tubercle (OT), and LGN was stronger and PAG-SS connections were weaker for neuropathic pain-induced depression group. All statistical results were FWER corrected at cluster level for p<0.05.
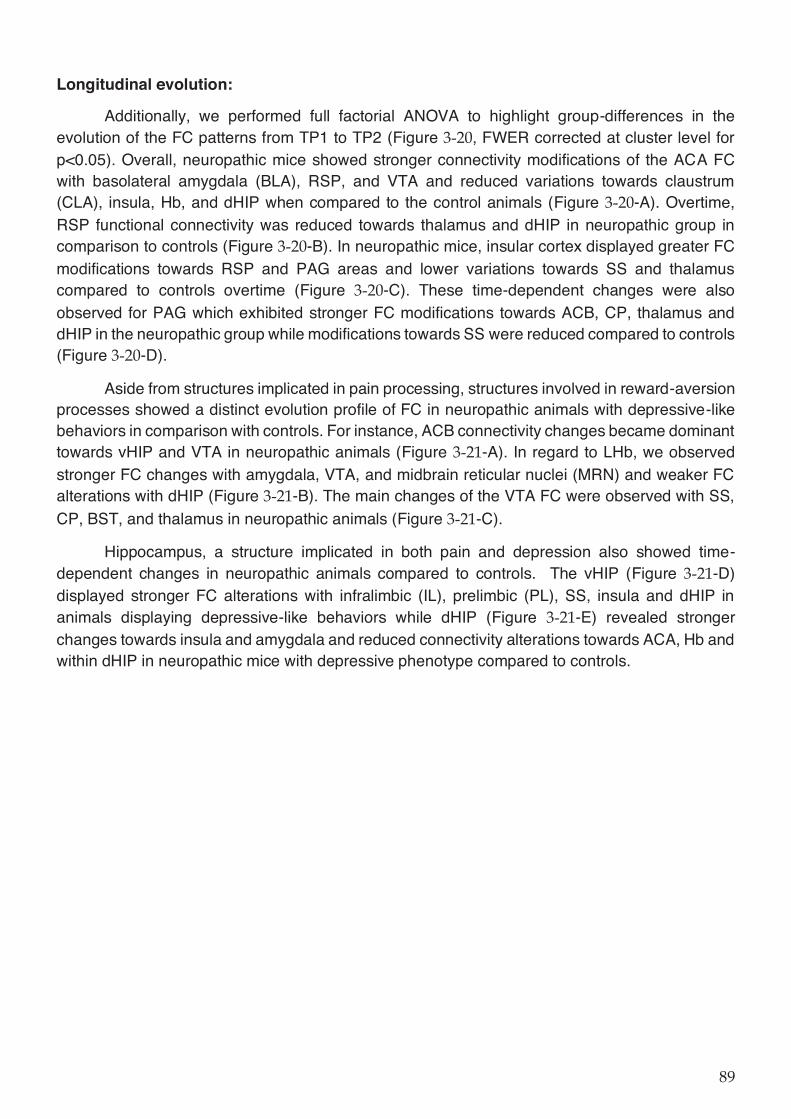
Longitudinal evolution:
Additionally, we performed full factorial ANOVA to highlight group-differences in the evolution of the FC patterns from TP1 to TP2 (Figure , FWER corrected at cluster level for p<0.05). Overall, neuropathic mice showed stronger connectivity modifications of the ACA FC with basolateral amygdala (BLA), RSP, and VTA and reduced variations towards claustrum (CLA), insula, Hb, and dHIP when compared to the control animals (Figure -A). Overtime, RSP functional connectivity was reduced towards thalamus and dHIP in neuropathic group in comparison to controls (Figure -B). In neuropathic mice, insular cortex displayed greater FC modifications towards RSP and PAG areas and lower variations towards SS and thalamus compared to controls overtime (Figure -C). These time-dependent changes were also observed for PAG which exhibited stronger FC modifications towards ACB, CP, thalamus and dHIP in the neuropathic group while modifications towards SS were reduced compared to controls (Figure -D).
Aside from structures implicated in pain processing, structures involved in reward-aversion processes showed a distinct evolution profile of FC in neuropathic animals with depressive-like behaviors in comparison with controls. For instance, ACB connectivity changes became dominant towards vHIP and VTA in neuropathic animals (Figure -A). In regard to LHb, we observed stronger FC changes with amygdala, VTA, and midbrain reticular nuclei (MRN) and weaker FC alterations with dHIP (Figure -B). The main changes of the VTA FC were observed with SS, CP, BST, and thalamus in neuropathic animals (Figure -C).
Hippocampus, a structure implicated in both pain and depression also showed time-dependent changes in neuropathic animals compared to controls. The vHIP (Figure -D) displayed stronger FC alterations with infralimbic (IL), prelimbic (PL), SS, insula and dHIP in animals displaying depressive-like behaviors while dHIP (Figure -E) revealed stronger changes towards insula and amygdala and reduced connectivity alterations towards ACA, Hb and within dHIP in neuropathic mice with depressive phenotype compared to controls.
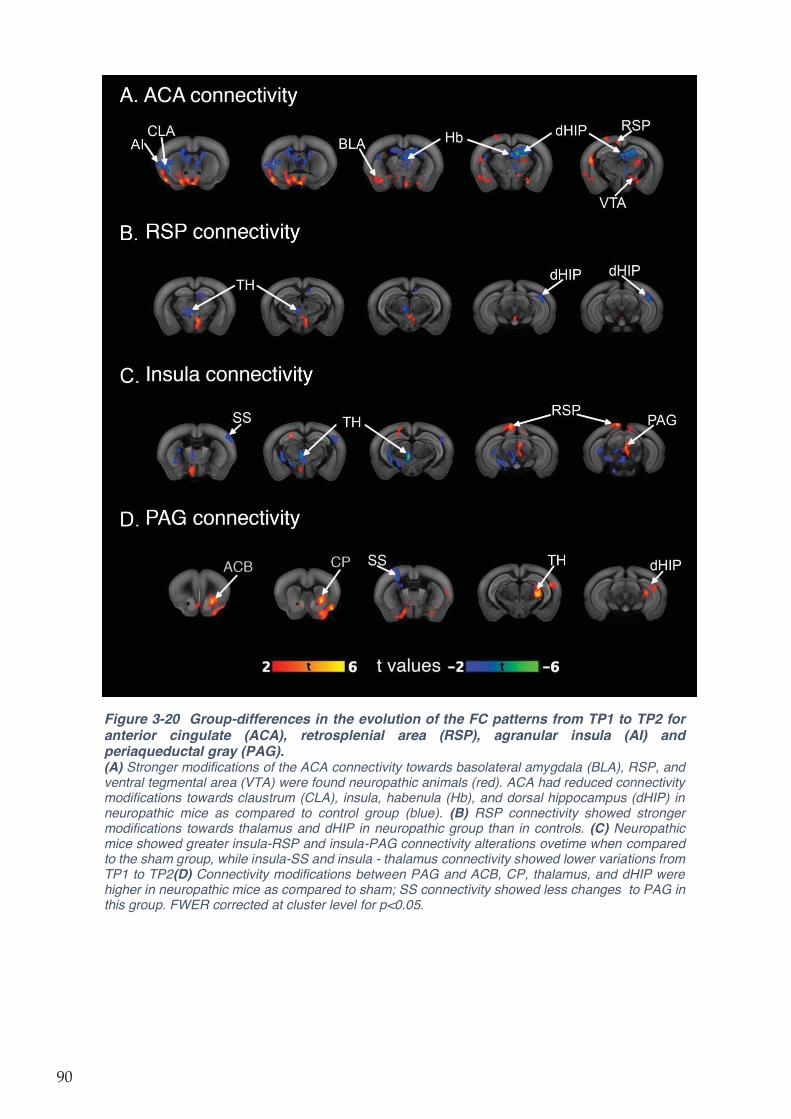
Figure 3-20 Group-differences in the evolution of the FC patterns from TP1 to TP2 for anterior cingulate (ACA), retrosplenial area (RSP), agranular insula (AI) and periaqueductal gray (PAG). (A) Stronger modifications of the ACA connectivity towards basolateral amygdala (BLA), RSP, and ventral tegmental area (VTA) were found neuropathic animals (red). ACA had reduced connectivity modifications towards claustrum (CLA), insula, habenula (Hb), and dorsal hippocampus (dHIP) in neuropathic mice as compared to control group (blue). (B) RSP connectivity showed stronger modifications towards thalamus and dHIP in neuropathic group than in controls. (C) Neuropathic mice showed greater insula-RSP and insula-PAG connectivity alterations ovetime when compared to the sham group, while insula-SS and insula - thalamus connectivity showed lower variations from TP1 to TP2(D) Connectivity modifications between PAG and ACB, CP, thalamus, and dHIP were higher in neuropathic mice as compared to sham; SS connectivity showed less changes to PAG in this group. FWER corrected at cluster level for p<0.05.
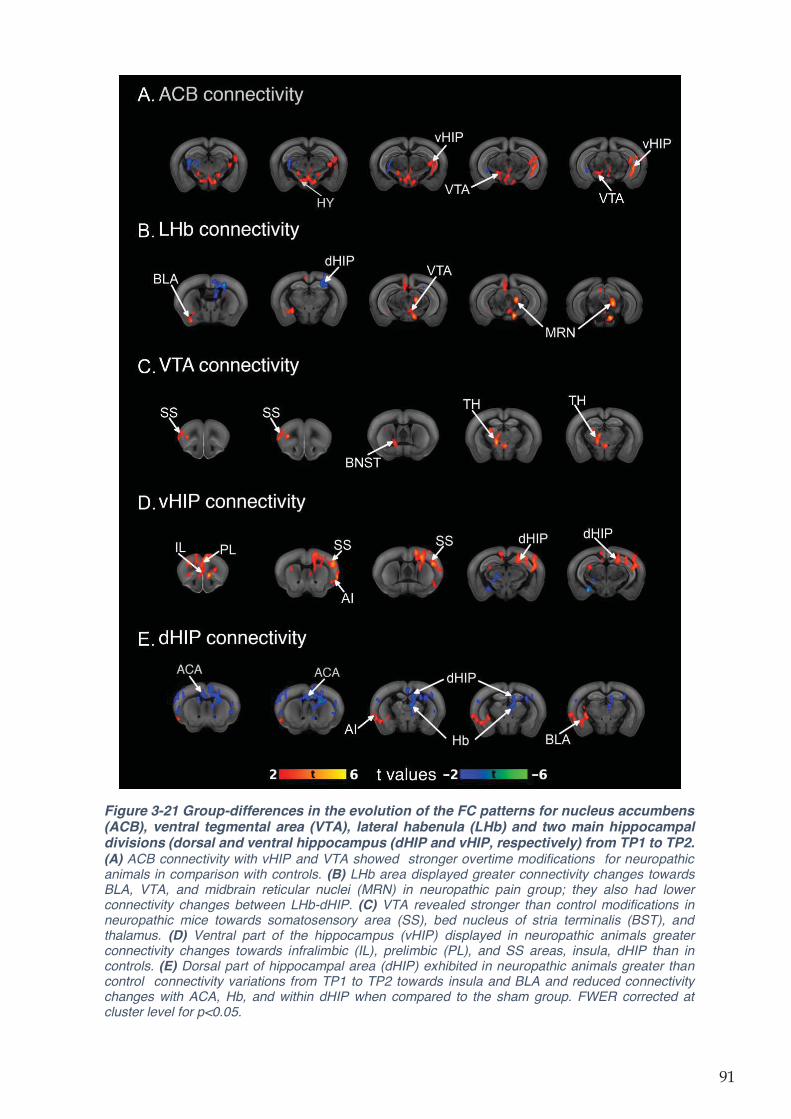
Figure 3-21 Group-differences in the evolution of the FC patterns for nucleus accumbens (ACB), ventral tegmental area (VTA), lateral habenula (LHb) and two main hippocampal divisions (dorsal and ventral hippocampus (dHIP and vHIP, respectively) from TP1 to TP2. (A) ACB connectivity with vHIP and VTA showed stronger overtime modifications for neuropathic animals in comparison with controls. (B) LHb area displayed greater connectivity changes towards BLA, VTA, and midbrain reticular nuclei (MRN) in neuropathic pain group; they also had lower connectivity changes between LHb-dHIP. (C) VTA revealed stronger than control modifications in neuropathic mice towards somatosensory area (SS), bed nucleus of stria terminalis (BST), and thalamus. (D) Ventral part of the hippocampus (vHIP) displayed in neuropathic animals greater connectivity changes towards infralimbic (IL), prelimbic (PL), and SS areas, insula, dHIP than in controls. (E) Dorsal part of hippocampal area (dHIP) exhibited in neuropathic animals greater than control connectivity variations from TP1 to TP2 towards insula and BLA and reduced connectivity changes with ACA, Hb, and within dHIP when compared to the sham group. FWER corrected at cluster level for p<0.05.
3.2.4 Discussion
In this study, we aimed to uncover the evolution of the brain structural and functional connectivity associated with the establishment of chronic pain and later, the emergence of depressive behaviors in a mouse model of neuropathic pain. For this purpose, we used diffusion MRI and resting state fMRI in parallel with behavioral measures in a longitudinal design. We were able to show structural differences at two post-injury timepoints for neuropathic mice. ACA and RSP displayed lower FA values at both 2 weeks and 8 weeks following cuff surgery while TH, HY, and hippocampus had reduced FA values only at 2 weeks post-surgery.
Brain functional connectivity networks had also undergone a substantial remodeling throughout the period of neuropathic pain. As expected, following cuff surgery, mice developed long lasting mechanical allodynia (Yalcin et al., 2011). Thus at 2 weeks, corresponding to the early stages of the neuropathy, we observed regions involved in pain processing and aversion taking predominant roles in neuropathic mouse brain networks determined from graph theoretical analysis. At 8 weeks when animals display not only mechanical allodynia but also depressive-like behavior, we demonstrated alterations in the reward circuitry and default mode network (DMN).
Further, we investigated functional connectivity profiles of brain areas showing structural changes or changes in graph measures between groups in more detail. Several regions exhibited connectivity changes for neuropathic pain group at 2-week (TP1) and 8-week (TP2) time points. Most notable results were obtained in ACA, VTA, and LHb nodes along with other reward areas and DMN components.
3.2.4.1 Neuropathic pain leads to brain structural modifications
Our results revealed that FA values are reduced at the early stages of neuropathy (2 weeks) in ACA and RSP, core regions of mouse DMN, along with TH, HY and hippocampus in neuropathic mice. Moreover, ACA and RSP changes persisted at TP2, where a depressive phenotype manifests in behavioral tests.
Preclinical and clinical studies focusing on pain research showed several structural alterations which support the results of our present study. Indeed, reduced volumes of prefrontal cortex (PFC) and RSP were reported in a rat spared nerve injury (SNI) model, coinciding with anxious behavior (Seminowicz et al., 2009). Prefrontal volume reduction was also described in the SNI model using mice (Bilbao et al., 2018). In addition, patients with neuropathic pain following spinal cord injury (Yoon et al., 2013) displayed gray matter decrease in subgenual ACC while decreased FA in thalamic areas was reported for patients with migraine (DaSilva et al., 2007), fibromyalgia(Lutz et al., 2008) and temporomandibular disorder (Moayedi et al., 2012). In addition, gray matter atrophy in ventromedial prefrontal cortex (vmPFC) along with lower FA in cingulum and decreased vmPFC-basal ganglia connectivity were found in complex regional pain syndrome (CRPS) (Geha et al., 2008)
Furthermore, studies in major depressive disorder (MDD) showed reduced volume of anterior cingulate, related to both glial and neuronal losses (Drevets et al., 1997; Mayberg, 2009; Rajkowska, 2000; Russo and Nestler, 2013; Uranova et al., 2004). Structural changes found in the same brain region for chronic pain and MDD suggest a contribution of anterior cingulate in their comorbidity. Indeed, ACA is thought to play an important role in pain-induced depression. Previous research from our group showed that the hyperactivity of this region is associated with anxio-depressive consequences of the cuff model (Sellmeijer et al., 2018) and the optogenetic inhibition of this area abolishes aversion to pain without affecting mechanical hypersensitivity.
Longitudinal nature of our experimental design enabled us to assess time-dependent evolution of brain connectivity, which is difficult to capture with cross-sectional designs often used in clinical settings. We thus could detect the disappearance of FA alterations in TH, HY, and hippocampal areas at TP2, which points to an early but short-lasting reaction to cuff surgery. TH, HY, and hippocampus were identified as parts of aversion circuitry (Hayes and Northoff, 2011) and thalamus is well-known to be involved in pain processing (Garcia-Larrea and Peyron, 2013) thus, transient structural changes in these areas might correspond to initiation of chronic pain and related aversive behaviors. Concerning the long-lasting changes that we observed in ACA and RSP might be associated with steady neuroplastic changes resulting from activity-dependent or inflammatory and glial processes, leading to depressive behavior. In line with this, ACA shows long term potentiation (LTP) of glutamatergic synapses following nerve injury in mice (Xu et al., 2008). Astrocytic processes in ACA were also shown to be involved in the establishment of LTP and pain hypersensitivity (Ikeda et al., 2013) in an inflammatory injury model. Chemotherapy-induced neuropathic pain resulted in a significant increase in ACA astrocytes in rats (Mannelli et al., 2013) and Narita Minoru et al. (2006) reported role of the cortical δ-opioid receptor dysfunction in ACA astrogliosis, potentially leading to anxiety state. Putative role of glial processes in depression were also investigated. Postmortem brains of depressed patients showed increased microglial quinolinic acid, an NMDA agonist which is considered to modulate the link between immune and neurotransmitter staple changes, in subgenual ACC and mid-cingulate areas (Steiner et al., 2011). Impairment of gap junction-mediated communication between astrocytes and oligodendrocytes in ACA was discovered in postmortem brain tissues from depressed suicides (Tanti et al., 2019), emphasizing the importance of glia in normal brain function.
RSP is a principal area of rodent DMN (Stafford et al., 2014; Upadhyay et al., 2011) together with ACA. Default mode network (DMN) is a set of regions that show synchronous activity at rest and deactivate during task performance (Greicius et al., 2003; Raichle et al., 2001). DMN alterations are found across several neurologic and psychiatric disorders (Baliki et al., 2014; Berman et al., 2011; Broyd et al., 2009; Buckner et al., 2008). Deactivation of DMN was reduced while switching from rest to attentional task in patients suffering from chronic back pain (Marwan N Baliki et al., 2008). In a diabetic neuropathy cohort, DMN connectivity was increased towards dorsal ACA and MO/SS cortices and decreased towards dlPFC, insula and TH (Cauda et al., 2010), whereas in fibromyalgia, DMN-insula connectivity and coherence within DMN were increased (Napadow et al., 2011). In three distinct pain conditions, mPFC connectivity with posterior part of DMN was found to be decreased and mPFC-insula FC was increased (Baliki et al., 2014). In short, while the DMN connectivity changes are not consistent across conditions, DMN dysfunction seems to be important maladaptation in chronic pain.
DMN modifications in major depression are also well-documented(Wang et al., 2012; Zhu et al., 2012). For instance, Greicius et al. (2007) has shown greater subgenual ACC connectivity towards DMN regions which is correlated with the length of current depressive episode in MDD. On the preclinical side, DMN connectivity was enhanced with chronic stress (Henckens et al., 2015) in a model of depression in mice (Grandjean et al., 2016) and in rats. In rats with genetic predisposition for major depression, enhancement of DMN connectivity (Gass et al., 2016) was observed while the optogenetic perturbation of LHb in this model resulted in diminished DMN connectivity and rescued the rats from depressive phenotype (Clemm von Hohenberg et al., 2018). Hence, RSP structural modifications might be giving rise to network-level functional connectivity reorganization, promoting aversive and anxio-depressive behaviors.
3.2.4.2 Functional connectivity remodeling in limbic circuitry
To obtain a global perspective on brain functional connectivity in neuropathic pain, we generated large connectivity matrices. We extracted ROIs from anatomical segmentation of Allen mouse brain atlas (Lein et al., 2007), covering isocortex and subcortical regions. The connectivity matrices were constructed with partial correlation, which computes correlation between any two nodes while excluding the influence of all others. Difference between neuropathic and control groups were analyzed for TP1 and TP2, graph theoretical parameters were assessed and most changed connections (edges) and regions (nodes) were ranked. In this manner, we were able to evaluate the longitudinal evolution of brain-wide FC.
At TP1, the point where mechanical hypersensitivity is established, the most prominent changes appeared in pain and aversion-related regions such as thalamus and insula (Iannetti and Mouraux, 2010) along with amygdala, hypothalamus, and parts of hippocampal formation. These areas were shown to be parts of aversion circuitry (Hayes and Northoff, 2011) in humans and in animals. Chronic pain is thought to reflect a shift from pain-related circuitry to meso-corticolimbic circuitry over time (Farmer et al., 2012), different pain conditions displaying divergent patterns of network reorganization. Transition from subacute to chronic back pain, as followed by rs-fMRI over time, could be predicted from initial cortico-striatal FC patterns (Baliki et al., 2012). Here, we observed limbic/reward areas and DMN components as most changed nodes at TP2 for neuropathic animals. These areas included VTA, ACB, pallidum, hippocampus, midbrain, septum, BST as well as SS, insula and RSP- implicating them in the development of anxiety and depression as a consequence of neuropathic pain.
On the basis of the nodes with most marked changes determined from graph theoretical approach and the areas showing structural alterations, we chose several ROIs to perform fine-grained seed analyses.
ACA functional connectivity presented major changes at both timepoints: At TP1, lower connectivity of ACA towards nociceptive areas (insula, PAG) might reflect the loss of descending pain modulation from this area, exacerbating pain. FC reductions towards CP, dHIP, and Hb also imply deficits in top-down control, allowing negative affect to prevail. At TP2, along with the changes observed at TP1, ACA displayed stronger connectivity towards RSP; thus, enhanced within-DMN connectivity patterns coinciding with depressive phenotype. ACA-AMY FC also showed enhancements, denoting an amplification of aversive inputs from amygdala into ACA or alterations of the negative loop between ACA and AMY. As mentioned earlier, ACA structural and functional connectivity changes are quite prevalent in depression and chronic pain conditions in
their comorbidity. Combined with our observations, ACA emerges as a crucial node taking part in brain network reconstruction prompted by nerve injury and bringing out the behavioral signatures of depressive pathology.
VTA, a dopaminergic midbrain center encoding reward and coordinating meso-corticolimbic pathway, was one of the most changed areas at TP2 in the graph analysis. At this time point, VTA demonstrated stronger connectivity towards several other limbic areas, namely, ACA, ACB, CP, BST, Hb, PF and MD nuclei of thalamus in neuropathic mice with depressive phenotype. VTA connectivity increases both within reward circuitry and towards ACA, a DMN node which position VTA and ACA at the intersection of two important networks, possibly regulating their interactions. VTA takes part in both reward and aversion (Lammel et al., 2014), pain processing (Ezzatpanah et al., 2016; Hipólito et al., 2015; Ko et al., 2018; Sotres-Bayón et al., 2001; Watanabe et al., 2018), stress- and pain-induced depressive behaviors (Fu et al., 2018; Isingrini et al., 2017; Ji et al., 2018). In rodent chronic pain models, VTA activity and reward behaviors are shown to be disrupted since rats with peripheral nerve injury had reduced dopaminergic signaling due to microglia-regulated activation of GABAergic VTA interneurons (Taylor et al., 2015) and increased GABAergic and decreased dopaminergic signaling was also reported for spinal cord injury in rats (Ko et al., 2018). In a spared nerve injury model, VTA activity and dopamine concentration in ACB were reduced (Ren et al., 2015). Both nerve injury and cancer pain models resulted in reduced neuronal excitability in VTA (Devonshire et al., 2017; Watanabe et al., 2018), while optogenetic stimulation of VTA dopaminergic neurons projecting to ACB alleviated allodynia (Watanabe et al., 2018). While preclinical studies such as chronic unpredictable mild stress (CUMS) model of depression reported lower VTA activity in VTA-mPFC pathway (Liu et al., 2018; Redlich et al., 2015) showed higher functional connectivity of ventral striatum (VS) and VTA in depressed patients. However, contradicting findings of increased VTA activity were reported in social defeat stress model (Berton et al., 2006; Walsh et al., 2014) and in chronic constriction injury (CCI) model (Liu et al., 2018). These contradictions might stem from VTA heterogeneity with respect to projections, activity patterns, and neurotransmitter types. Although we cannot determine activity levels in VTA with rs-fMRI, we might conjecture the increased connectivity towards reward/aversion areas as either compensatory mechanisms counteracting reward deficit or increased signaling for anti-reward, or a combination of both mechanisms.
LHb is another key reward/aversion structure which presents with connectivity alterations in neuropathic mice. LHb encodes aversion relevant to avoidance and escape behaviors and inhibits reward signals. At TP1, LHb connectivity towards AMY, TeA, vHIP and MRN were increased in neuropathic animals, which point to an augmented aversive signaling. The higher connectivity of LHb with PF nucleus of thalamus, HY, VTA, and MRN and lower connectivity with AI and MOs at TP2 can be interpreted as the enhancement of the inhibitory influence of LHb over reward areas. This effect can likely cause reward deficits associated with depressive phenotype. Longitudinal evolution of LHb FC in neuropathic animals identified stronger connections towards amygdala, VTA, and MRN and weaker connections to dHIP, indicating heightened LHb influence over reward areas promoting aversion and reward deficiency in a time dependent manner.
LHb is implicated in pain modulation (Shelton et al., 2012) via its connections to monoaminergic and opioidergic centers. Similar to our results, LHb connectivity towards PFC divisions and MO cortices were decreased in pediatric CRPS patients (Erpelding et al., 2013).
LHb is also involved in depressive pathologies (Proulx et al., 2014). For instance, increased blood flow to LHb (Gass et al., 2014a) and LHb hyperactivity (Gass et al., 2016) was reported in rodent models of depression model while the lesion of the LHb diminish depressive behaviors. In addition, increased LHb burst activity drives depressive phenotype and rapid antidepressant ketamine acts to suppress this hyperactivity, reversing depressive behaviors and anhedonia (Yang et al., 2018b) and inactivation of habenula with deep brain stimulation (DBS) in treatment resistant depression resulted in full remission in a patient (Sartorius et al., 2010). Even more relevant, some recent studies showed the involvement of the LHb in depression-pain comorbidity. Indeed, it has been shown that CUMS model in rats induces pain hypersensitivity and LHb hyperactivity, and its lesion relieves both the pain hypersensitivity and depressive phenotype (Li et al., 2016). Moreover, chronic constriction injury in rats also caused increased LHb activity and depressive behaviors which were eliminated by lesioning the LHb (Li et al., 2017). To conclude, increased LHb activity might be the common denominator in pain and depression comorbidity, regardless of initial pathology.
Moreover, functional connectivity of dorsal hippocampus (dHIP) showed higher connectivity towards RSP, SC, and LGN at TP1 which might be associated with amplified nociceptive inputs or compensation for lower dHIP activation in chronic pain. Indeed, impaired neurogenesis and synaptic plasticity were detected in hippocampus, which contribute to memory deficits commonly observed in chronic pain (Mutso et al., 2013). At TP2, dHIP connectivity towards ACA and septum was lower and its connectivity towards AMY and PTLp was greater in neuropathic mice. Reduced ACA-dHIP connectivity was also shown in a mouse model of metastatic bone cancer pain (Buehlmann et al., 2018). Decreased hippocampal connectivity towards mPFC was predictive of chronification of back pain in patients (Mutso et al., 2013) and may correlate with reduced reward learning signals in depressive disorder (Kumar et al., 2008). Overall, dHIP FC was higher with insula and amygdala, pain and aversion areas, and reduced towards ACA, Hb, and within itself in neuropathic pain-induced depression model.
On the other hand, ventral HIP showed stronger overall connectivity to mPFC, SS and insular area, and dHIP underlining their distinct functionalities. In fact, dorsal hippocampus engages in cognitive functions whereas vHIP is related to stress and emotional processing (Fanselow and Dong, 2010) and the two hippocampal divisions show differential gene expression patterns (Lee et al., 2017). Taken together, hippocampal FC patterns we observe might correspond to cognitive deficits and heightened emotional processing encountered in chronic pain (Simons et al., 2014) and depression.
While our study brought valuable information concerning the functional and structural reorganization of the brain in pain and depression comorbidity, it has some methodological limitations. Even though we started with the bigger animal cohort, due to a variation in the prevalence of relevant behavioral phenotype our sample size became smaller. Reproduction of our findings in a larger cohort would confirm their biological significance. Another caveat was the use of male subjects only. Recently, the stance on higher hormonal variability in female subjects was abandoned (Shansky, 2019) citing similar variability in males as well as the effects of male social hierarchy. There is a pronounced gender bias in basic research (Alderton, 2019) which might lead to false generalizations and public health problems. As depression prevalence is higher in women (Abate, 2013) and pain responses might differ between sexes (Fillingim et al., 2009), it is especially important to use female subjects in pain-induced depression results.

3.2.5 Conclusion
To recapitulate, we assessed the longitudinal evolution of the brain structural and functional connectivity coinciding with pain- and depression-related phenotypes. We observed time-dependent brain structural alterations and functional connectivity remodeling in several relevant brain areas for neuropathic mice in comparison to controls. Predominance of pain and aversion circuitries in the earlier post-injury time point accounted for the establishment of pain hypersensitivity. Development of depressive behaviors were accompanied by reorganization of reward system and DMN delineating causal relations between pain and depression. A prominent role of ACA, LHb, and VTA regions was discovered in pain-induced depression.
4 General Discussion My thesis work consisted of the investigation of brain structural and functional connectivity
signatures of neuropathic pain-induced depression in a relevant mouse model. In particular, I studied the evolution of brain networks to identify alterations occurring at different stages of the pathology in a longitudinal experimental design. Prospective studies on this subject are rather difficult to perform in clinical settings. Not only the transition periods of injury to chronic pain and then to depressive disorder are much longer in patients, but also the variability in the type of injury, genetic disposition, environmental factors, and other comorbid conditions renders the interpretation of findings complex (Burma et al., 2017). In preclinical research, we have the advantage of precisely controlling these factors: a standard injury procedure, use of inbred organisms, and a strict regulation of housing conditions and experimental variables ensure more consistent results. The ability to employ more invasive methods is another crucial advantage of animal experiments.
The inbred strains used for most rodent experiments are created for the purpose of reducing genetic variability, as mating of siblings over 20 generations are expected to produce an identical genotype for all members of an inbred strain (Padmanabhan, 2014). There are more than 400 mouse and 150 rat inbred strains commercially available. Each strain has specific phenotypic features which might be useful for addressing different research questions. In neuroscience field, inbred rodents are chosen to lower variability in nervous system structure and function, consequently the behavioral phenotype. This way, the results of an experiment can be attributed to its design and studied parameters, not the inherent variability of the test subjects.
C57BL/6N and BALB/cJ mouse strains are two most often used strains for depression research. BALB/cJ is especially preferred for its vulnerability to develop anxiety and depressive behaviors. However, there were previous reports on the intra-strain variability for BALB/cJ mice concerning their brain anatomy and behaviors (Fairless et al., 2012; Kim et al., 2012; Wahlsten, 1974). Thus, I performed a brain connectivity study in C57BL/6N and BALB/cJ to describe potential inter-strain differences and within-strain variability, utilizing MRI methods. The main aim was to determine the particular strain of mice to use for further experiments on neuropathic pain-induced depression.
4.1 Comparison of strains C57BL/6N and BALB/cJ
Investigation of brain structure and connectivity in the two strains was performed via anatomical T2 imaging, diffusion MRI and resting state-fMRI.
4.1.1 Structural connectivity
Diffusion imaging and further implementation of high-resolution fiber mapping was employed to demonstrate brain structural connectivity. C57BL/6N and BALB/cJ mice exhibited divergent white matter architectures, showing differences in corpus callosum (genu, splenium and parts) and other axonal bundles (e.g. cingulum, fimbria). Several gray matter regions also showed microstructural differences, including prefrontal areas, striatum, thalamus and midbrain. There was a general under-connectivity in BALB/cJ strain, shorter average corpus callosum and lower density of fronto-striatal communication fibers. Notably, BALB/cJ mice displayed great variation in the length and fiber density of corpus callosum within the strain. The specific patterns of under-connectivity in BALB/cJ strain might account for the specific behavioral phenotypes they exhibit, such as decreased social interaction and increased anxiety.
In addition, we performed a volumetric analysis of T2 anatomical images and found extensive volume differences in several brain regions between C57BL/6N and BALB/cJ. C57BL/6N had larger volumes for cortical (e.g. PFC, motor and somatosensory areas, association areas) and subcortical areas (e.g. septum, thalamus, and hippocampus) whereas, BALB/cJ showed a thicker corpus callosum around the middle part which can be interpreted as a compensation mechanism for its shorter length to ascertain adequate communication between hemispheres.
4.1.2 Functional connectivity
We further analyzed resting-state fMRI data to discover putative variations in functional connectivity arising from discrepancies in brain structures of the two strains. First, we investigated global functional connectivity by creating large connectivity matrices and identifying hubs, dominant regions within functional brain networks serving to establish effective information transfer. Hub regions in the C57BL/6N strain were subcortical forebrain limbic areas (e.g. endopiriform nucleus, claustrum) and parts of reward circuity (e.g. ACB, CP, dhc, PALv) along with RSP, the core region of mouse DMN. Densely connected endopiriform nucleus and claustrum have roles in the integration of limbic and somatomotor information. For BALB/cJ strains, sensory (e.g. visual and auditory) and associative (e.g. TEa, PTLp) cortices as well as regions implicated in aversion (e.g. BLA, BMA) assumed hub roles. Statistically, dorsal hippocampus was the most different area between strains, falling in line with memory impairments documented in BALB/cJ (Chen et al., 1996) associated with fear conditioning.
Next, we examined seed connectivity differences between strains using voxel-wise correlation analysis. We found that the structural under-connectivity of corpus callosum does not preclude inter-hemispherical cross-talk for the BALB/cJ strain; yet, functional connectivity of homotopic cortical areas exhibits a strain-specific configuration. Ipsilateral somatosensory areas show more coherence in BALB/cJ. For somatomotor areas, this coherence was observed only for caudal regions, connected through middle division of corpus callosum. Rostral motor areas, however, were more inter-connected in the C57BL/6N mice around the genu of corpus callosum; previously mentioned to have higher density of fibers. In short, structural connectivity of BALB/cJ
strain shapes functional connectivity; yet, inter-hemispherical connectivity is preserved, either through thicker middle part of callosal fibers or through polysynaptic routes. This shows the immense capacity of mouse brains to compensate for connectivity deficits.
Core regions of rodent default mode network are the ACA and RSP areas. Functional connectivity of these regions was also dissimilar for the two strains. BALB/cJ connectivity was higher between ACA-RSP cortical areas, while C57BL/6N showed higher RSP connectivity towards subcortical areas and higher intra-regional synchrony in ACA, where fibers are more densely packed.
Specific behavioral phenotype of BALB/cJ mice, exhibiting neophobia, anxiety, lower sociability and strong predisposition to depression (Anderzhanova et al., 2013; Brodkin, 2007; Moy et al., 2004; Ohl et al., 2001; Panksepp and Lahvis, 2007) suggest a role of reward/aversion circuitry. C57BL/6N mice displayed stronger ACB connectivity towards VTA, prefrontal, and septal regions compared to BALB/cJ. Weaker ACB-VTA connectivity, the principal reward pathway, might give rise to social reward deficits previously described in the BALB/cJ strain. Directional communication of ACA and limbic areas (i.e. ventral and dorsal striatum, amygdala) also showed differences between strains. Distinct behavioral phenotype of BALB/cJ mice might arise from the specific connectivity patterns we observed here, especially involving reward system function.
To conclude, C57BL/6N and BALB/cJ strains demonstrate intrinsic differences in brain structural connectivity with dissimilarities in white matter tracts and gray matter areas, volumetric differences in several regions, as well as divergent functional network architecture. Furthermore, the variability of white matter structures in BALB/cJ strain, seen in the dimensions of corpus callosum, is of great importance. Intra-strain variability in BALB/cJ might lead to inconsistent and contradictory results in experiments with different cohorts of animals. To prevent this, it might be possible to control corpus callosum size of BALB/cJ brains with histology or imaging for research in the neuroscience field. However, variability in smaller structures might still bias the experimental findings. Thus, for my future experiments in the neuropathic pain model, I decided to use C57BL/6 strain.
The results of this study do show some consistency with behavior results described in the literature for the BALB/cJ strain, especially the connectivity in fronto-striatal and reward pathways, proposing reward deficits as the basis of social impairments and anxio-depressive behaviors in this strain. Moreover, FC shows flexibility and exceeds the confines of anatomically defined networks, as synchronous activity between two regions might exist due to polysynaptic connections or driven by a third region (Park and Friston, 2013).
4.2 Brain connectivity signatures of neuropathic pain-induced depression in mice Chronic pain is an important public health problem, affecting a large proportion of the
population (Attal et al., 2011; Pitcher et al., 2019). Anxiety and depression frequently accompany chronic pain and worsen the disease burden (von Hehn et al., 2012). To shed light on the elusive pathophysiological mechanisms underlying depressive comorbidity in chronic pain, we investigated brain structural and functional connectivity in a mouse model of neuropathic pain, using diffusion MRI and resting state fMRI in parallel with behavioral assessments in a longitudinal manner. Neuropathic pain was induced by placing a polyethylene cuff around the right sciatic nerve; von Frey filaments were used to assess allodynia weekly and splash test- measuring grooming behaviors, was used to demonstrate depressive behaviors. Imaging sessions were scheduled at baseline, prior to cuff surgery; at 2 weeks following surgery (TP1) coinciding with mechanical hypersensitivity; and at 8 weeks after surgery where the depressive phenotype appears (TP2).
4.2.1 Structural connectivity
We detected modifications of the DTI-derived parameter maps, probably accounting for microstructural changes for neuropathic mice at post-injury time points (TP1 and TP2). TH, HY, and hippocampus had reduced FA values at TP1 while ACA and RSP, centers of rodent DMN, displayed lower FA values at both TP1 and TP2. We interpreted these findings as an initial reactive process involving pain (Garcia-Larrea and Peyron, 2013) and aversion (Hayes and Northoff, 2011) in order to respond to elevated nociceptive inputs.
ACA and RSP, on the other hand show persistent modifications over time. The principal role of ACA in pain-induced depression was reported previously by our group (Barthas et al., 2015; Sellmeijer et al., 2018). ACA hyperactivity drives anxio-depressive phenotype and inhibition of this area removes this phenotype and pain aversion without affecting pain hypersensitivity in the cuff model. Structural modifications of ACA and larger mPFC region was also reported in preclinical (Bilbao et al., 2018; Seminowicz et al., 2009) and clinical (DaSilva et al., 2007; Geha et al., 2008; Lutz et al., 2008; Moayedi et al., 2012; Yoon et al., 2013) chronic pain studies. In addition, structural alterations in this region were documented in major depressive disorder (MDD) (Drevets et al., 1997; Mayberg, 2009; Rajkowska, 2000; Russo and Nestler, 2013; Uranova et al., 2004). Seed connectivity of RSP is often used for detection of DMN in rodents. Distinct modifications in DMN connectivity was found for several chronic pain conditions (Marwan N. Baliki et al., 2014; Marwan N Baliki et al., 2008; Cauda et al., 2010; Napadow et al., 2011) as well as major depression (Greicius et al., 2007; Wang et al., 2012; Zhu et al., 2012) and preclinical stress-based depression models (Clemm von Hohenberg et al., 2018; Gass et al., 2016; Grandjean et al., 2016; Henckens et al., 2015). Long-lasting structural modifications of ACA and RSP might thus be associated with stable neuroplastic changes leading to depressive behavior. Activity-dependent (Xu et al., 2008) and glia-mediated (Ikeda et al., 2013; Mannelli et al., 2013; Narita et al., 2004) neuroplasticity occurs in ACA as a result of chronic pain. Glial abnormalities were also shown for anterior cingulate in postmortem depression studies (Steiner et al., 2011; Tanti et al., 2019) which can underlie the structural modifications observed in these structures.
In short, transient changes in TH, HY, and HIP regions are likely due to pain and aversive processes while ACA and RSP are strong candidates for mechanistic basis of pain-depression
comorbidity. Their structural alterations might give rise to extensive functional brain network reorganization, promoting aversive and depressive behaviors.
4.2.2 Functional connectivity
Neuropathic mice exhibited a substantial remodeling of brain functional networks over the experimental period. To assess brain-wide functional connectivity, we created matrices using seed areas covering the entire isocortex and subcortical areas. At TP1, major changes were discovered in pain (e.g. TH and insula) and aversion-related regions (e.g. amygdala, hypothalamus, and hippocampal formation). In line with mechanical hypersensitivity seen at this time point, nociceptive and aversive circuits displayed the most changes. At TP2 limbic/reward areas (e.g. VTA, ACB, pallidum, hippocampus, midbrain, septum, BST) and DMN (RSP) components showed the most changes in neuropathic animals along with SS and insula. Development of depressive-like behavior might stem from changes in the dominant nodes of brain networks. Initiated by neuropathic pain, alterations in reward/aversion circuitry may cause reward deficits and heightened aversive behaviors. DMN connectivity differences might also lead to depressive behaviors (Greicius et al., 2007; Wang et al., 2012; Zhu et al., 2012). Changes in SS and insular areas could be explained by continued existence of neuropathic state at TP2. Thus, the transition from chronic pain to associated depressive phenotype seems to involve a shift in predominant networks of the brain from nociceptive to affective circuitries.
The nodes with most marked changes from graph theoretical analysis and areas with structural alterations were chosen as regions of interest (ROIs) for correlation analyses. At TP1, ACA showed reduced connectivity towards nociceptive areas (e.g. insula, PAG) and limbic areas (e.g. CP, dorsal hippocampus and habenula). ACA is an important center of descending pain modulation; therefore, lower connectivity with pain areas suggests a loss of pain modulation. Decreased connectivity towards subcortical limbic regions might point to a top-down control deficit, causing negative affect. At TP2, along with the changes observed at TP1, ACA displayed larger DMN connectivity and an enhanced connectivity to AMY-a major aversive center, concurrent with the depressive phenotype. Our results further support the idea that the ACA is a critical region in the remodeling of brain networks following nerve injury at both structural and functional levels.
VTA, implicated in in reward and aversion (Lammel et al., 2014), nociceptive processes (Ezzatpanah et al., 2016; Hipólito et al., 2015; Ko et al., 2018; Sotres-Bayón et al., 2001; Watanabe et al., 2018) and depressive behaviors (Fu et al., 2018; Isingrini et al., 2017; Ji et al., 2018) was one of the most changed areas in the graph analysis at TP2. Indeed, VTA showed higher connectivity towards many limbic areas (e.g. ACA, ACB, CP, BST, Hb, PF and MD nuclei of thalamus) in neuropathic mice with depressive phenotype. VTA connectivity increased both within reward circuitry and towards ACA, a DMN node which points out to potential implication of DMN in pain-depression comorbidity. The increased connectivity towards reward/aversion areas might either be compensation for reward deficits or increased anti-reward signaling, or a combination of both mechanisms.
LHb, an important part of the reward system, encodes aversion relevant to avoidance and escape behaviors and inhibits reward signals. At TP1, LHb connectivity towards aversive areas (e.g. AMY, TeA, vHIP and MRN) was increased in neuropathic animals. At TP2, stronger connectivity of LHb with thalamus, HY, VTA, and MRN and weaker connectivity with AI and MOs

were observed. Enhanced LHb inhibition of reward areas might be the cause of reward deficits and negative affect associated with depressive phenotype. LHb is implicated in pain processing (Erpelding et al., 2013; Shelton et al., 2012; Taylor et al., 2015) and in depression (Clemm von Hohenberg et al., 2018; Cui et al., 2018; Gass et al., 2014a; Proulx et al., 2014; Sartorius et al., 2010; Yang et al., 2018a). LHb is also shown to be involved in depression-pain comorbidity as shown by Li et al., 2016. A stress-based rat depression model led to pain hypersensitivity and LHb hyperactivity (Li et al., 2016), and LHb lesion relieved both the pain hypersensitivity and depressive phenotype. In addition, chronic constriction injury in rats also caused increased LHb activity and depressive behaviors (Li et al., 2017) which were eliminated by lesioning the LHb. Increased LHb activity might be a common mechanism underlying pain-depression comorbidity.
Our study had certain caveats. Due to a variation in the prevalence of relevant behavioral phenotype in neuropathic mice, our sample size was rather small. In the future, an investigation into neuropathic mice without anxio-depressive behaviors may be warranted to find out resiliency-related factors in brain connectivity. Further reproduction of our findings in neuropathic pain-induced depression with a larger cohort would confirm their biological significance. Another caveat was the use of male subjects only. Recently, the stance on higher hormonal variability in female subjects was abandoned (Shansky, 2019) citing similar variability in males as well as the effects of male social hierarchy. There is a pronounced gender bias in basic research (Alderton, 2019) which might lead to false generalizations and public health problems. As depression prevalence is higher in women (Abate, 2013) and pain responses might differ between sexes (Fillingim et al., 2009), it is especially important to use female subjects in pain-induced depression results.
Nonetheless, we obtained important findings on the contribution of different brain areas to neuropathic pain-induced pain and their temporal evolution. Further work on underlying cellular and molecular mechanisms, and the role of specific projections in highlighted regions are needed to provide a mechanistic explanation of pain-depression comorbidity.
4.3 Conclusion My investigations into of the evolution of the brain structural and functional networks
underlying pain- and depression-related phenotypes showed a dominant role of pain/ aversion areas immediately following nerve injury. Depressive phenotype was established pursuant to reward system and DMN remodeling; highlighting a causal relationship in pain-depression comorbidity. ACA, LHb, and VTA were highlighted as strongly core brain areas implicated involved in the development of neuropathic pain-induced depression in mice.
5 Perspectives By describing pain and depression-related brain connectivity architecture in this the “cuff”
preclinical model, we were able to indicate putative brain areas and pathways responsible from for the emergence of pain-depression comorbidity. The longitudinal experimental design in the present work enabled us to explore time-dependent evolution of brain functional and structural remodeling. Detailed work into the highlighted areas, using further molecular and histological methods as well as cutting-edge technologies such as optogenetic and chemogenetic manipulations designed to alter the activity the highlighted areas, might offer mechanistic explanations into the pathophysiology of pain-induced depression. Moreover, brain MR imaging in this model might be used to monitor therapy responses to new pharmaceutical agents or alternative approaches such as repetitive transcranial magnetic stimulation (rTMS), transcranial direct current stimulation (tDCS), and deep brain stimulation (DBS). Therapeutical strategies tested in this animal model can be transferred to clinical settings, translating the treatments from bench to bedside.
6 References Abate, K.H., 2013. Gender Disparity in Prevalence of Depression Among Patient Population: A Systematic
Review. Ethiop. J. Health Sci. 23, 283–288. Adcock, R.A., Thangavel, A., Whitfield-Gabrieli, S., Knutson, B., Gabrieli, J.D.E., 2006. Reward-Motivated
Learning: Mesolimbic Activation Precedes Memory Formation. Neuron 50, 507–517. https://doi.org/10.1016/j.neuron.2006.03.036
Alderton, G., 2019. Sex bias in research animals. Science 364, 846–848. https://doi.org/10.1126/science.364.6443.846-p
Alexander, A.L., Lee, J.E., Lazar, M., Boudos, R., DuBray, M.B., Oakes, T.R., Miller, J.N., Lu, J., Jeong, E.-K., McMahon, W.M., Bigler, E.D., Lainhart, J.E., 2007. Diffusion tensor imaging of the corpus callosum in Autism. NeuroImage 34, 61–73. https://doi.org/10.1016/j.neuroimage.2006.08.032
Alshelh, Z., Marciszewski, K.K., Akhter, R., Di Pietro, F., Mills, E.P., Vickers, E.R., Peck, C.C., Murray, G.M., Henderson, L.A., 2018. Disruption of default mode network dynamics in acute and chronic pain states. NeuroImage Clin. 17, 222–231. https://doi.org/10.1016/j.nicl.2017.10.019
Anacker, C., Scholz, J., O’Donnell, K.J., Allemang-Grand, R., Diorio, J., Bagot, R.C., Nestler, E.J., Hen, R., Lerch, J.P., Meaney, M.J., 2016. Neuroanatomic Differences Associated With Stress Susceptibility and Resilience. Biol. Psychiatry, Mechanisms of Resilience to Stress Effects 79, 840–849. https://doi.org/10.1016/j.biopsych.2015.08.009
Anand, A., Li, Y., Wang, Y., Lowe, M.J., Dzemidzic, M., 2009. Resting state corticolimbic connectivity abnormalities in unmedicated bipolar disorder and unipolar depression. Psychiatry Res. Neuroimaging 171, 189–198. https://doi.org/10.1016/j.pscychresns.2008.03.012
Anand, A., Li, Y., Wang, Y., Wu, J., Gao, S., Bukhari, L., Mathews, V.P., Kalnin, A., Lowe, M.J., 2005. Antidepressant Effect on Connectivity of the Mood-Regulating Circuit: An fMRI Study. Neuropsychopharmacology. https://doi.org/10.1038/sj.npp.1300725
Anderzhanova, E.A., Bächli, H., Buneeva, O.A., Narkevich, V.B., Medvedev, A.E., Thoeringer, C.K., Wotjak, C.T., Kudrin, V.S., 2013. Strain differences in profiles of dopaminergic neurotransmission in the prefrontal cortex of the BALB/C vs. C57Bl/6 mice: Consequences of stress and afobazole. Eur. J. Pharmacol. 708, 95–104. https://doi.org/10.1016/j.ejphar.2013.03.015
Apkarian, A.V., Sosa, Y., Sonty, S., Levy, R.M., Harden, R.N., Parrish, T.B., Gitelman, D.R., 2004. Chronic Back Pain Is Associated with Decreased Prefrontal and Thalamic Gray Matter Density. J. Neurosci. 24, 10410–10415. https://doi.org/10.1523/JNEUROSCI.2541-04.2004
Apkarian, A.V., Wei, X., Ren, W., Centeno, M., Procissi, D., Xu, T., Jabakhanji, R., Martina, M., Radulovic, J., Surmeier, D., Liu, X., 2018. Dorsal Hippocampal Activation Suppresses Neuropathic Pain Behaviors: Chronic pain as extinction-resistant pain-related memory traces. bioRxiv 292094. https://doi.org/10.1101/292094
Arias-Carrión, O., Stamelou, M., Murillo-Rodríguez, E., Menéndez-González, M., Pöppel, E., 2010. Dopaminergic reward system: a short integrative review. Int. Arch. Med. 3, 24. https://doi.org/10.1186/1755-7682-3-24
Attal, N., Lanteri-Minet, M., Laurent, B., Fermanian, J., Bouhassira, D., 2011. The specific disease burden of neuropathic pain: Results of a French nationwide survey. PAIN 152, 2836. https://doi.org/10.1016/j.pain.2011.09.014
Avants, B.B., Tustison, N.J., Song, G., Cook, P.A., Klein, A., Gee, J.C., 2011. A reproducible evaluation of ANTs similarity metric performance in brain image registration. Neuroimage 54, 2033–2044. https://doi.org/10.1016/j.neuroimage.2010.09.025
Baliki, M.M., Baria, A., Apkarian, A.V., 2011. The cortical rhythms of chronic back pain. J. Neurosci. Off. J. Soc. Neurosci. 31, 13981–13990. https://doi.org/10.1523/JNEUROSCI.1984-11.2011
Baliki, M.N., Apkarian, A.V., 2015. Nociception, Pain, Negative Moods, and Behavior Selection. Neuron 87, 474–491. https://doi.org/10.1016/j.neuron.2015.06.005
Baliki, M. N., Chang, P.C., Baria, A.T., Centeno, M.V., Apkarian, A.V., 2014. Resting-sate functional reorganization of the rat limbic system following neuropathic injury. Sci. Rep. 4, 6186. https://doi.org/10.1038/srep06186
Baliki, M.N., Chialvo, D.R., Geha, P.Y., Levy, R.M., Harden, R.N., Parrish, T.B., Apkarian, A.V., 2006. Chronic Pain and the Emotional Brain: Specific Brain Activity Associated with Spontaneous Fluctuations of Intensity of Chronic Back Pain. J. Neurosci. Off. J. Soc. Neurosci. 26, 12165–12173. https://doi.org/10.1523/JNEUROSCI.3576-06.2006
Baliki, Marwan N., Geha, P.Y., Apkarian, A.V., Chialvo, D.R., 2008. Beyond Feeling: Chronic Pain Hurts the Brain, Disrupting the Default-Mode Network Dynamics. J. Neurosci. 28, 1398–1403. https://doi.org/10.1523/JNEUROSCI.4123-07.2008
Baliki, M.N., Geha, P.Y., Fields, H.L., Apkarian, A.V., 2010. Predicting Value of Pain and Analgesia: Nucleus Accumbens Response to Noxious Stimuli Changes in the Presence of Chronic Pain. Neuron 66, 149–160. https://doi.org/10.1016/j.neuron.2010.03.002
Baliki, Marwan N, Geha, P.Y., Jabakhanji, R., Harden, N., Schnitzer, T.J., Apkarian, A.V., 2008. A Preliminary fMRI Study of Analgesic Treatment in Chronic Back Pain and Knee Osteoarthritis. Mol. Pain 4, 1744-8069-4–47. https://doi.org/10.1186/1744-8069-4-47
Baliki, Marwan N., Mansour, A.R., Baria, A.T., Apkarian, A.V., 2014. Functional reorganization of the default mode network across chronic pain conditions. PloS One 9, e106133. https://doi.org/10.1371/journal.pone.0106133
Baliki, M.N., Petre, B., Torbey, S., Herrmann, K.M., Huang, L., Schnitzer, T.J., Fields, H.L., Apkarian, A.V., 2012. Corticostriatal functional connectivity predicts transition to chronic back pain. Nat. Neurosci. 15, 1117–1119. https://doi.org/10.1038/nn.3153
Bardella, G., Bifone, A., Gabrielli, A., Gozzi, A., Squartini, T., 2016. Hierarchical organization of functional connectivity in the mouse brain: a complex network approach. Sci. Rep. 6, 32060. https://doi.org/10.1038/srep32060
Barnett, L., Seth, A.K., 2014. The MVGC multivariate Granger causality toolbox: A new approach to Granger-causal inference. J. Neurosci. Methods 223, 50–68. https://doi.org/10.1016/j.jneumeth.2013.10.018
Barthas, F., Humo, M., Gilsbach, R., Waltisperger, E., Karatas, M., Leman, S., Hein, L., Belzung, C., Boutillier, A.-L., Barrot, M., Yalcin, I., 2017. Cingulate Overexpression of Mitogen-Activated Protein Kinase Phosphatase-1 as a Key Factor for Depression. Biol. Psychiatry 82, 370–379. https://doi.org/10.1016/j.biopsych.2017.01.019
Barthas, F., Sellmeijer, J., Hugel, S., Waltisperger, E., Barrot, M., Yalcin, I., 2015. The anterior cingulate cortex is a critical hub for pain-induced depression. Biol. Psychiatry 77, 236–245. https://doi.org/10.1016/j.biopsych.2014.08.004
Basser, P.J., Mattiello, J., LeBihan, D., 1994. MR diffusion tensor spectroscopy and imaging. Biophys. J. 66, 259–267. https://doi.org/10.1016/S0006-3495(94)80775-1
Basser, P.J., Pierpaoli, C., 1996. Microstructural and physiological features of tissues elucidated by quantitative-diffusion-tensor MRI. J. Magn. Reson. B 111, 209–219.
Becerra, L., Navratilova, E., Porreca, F., Borsook, D., 2013. Analogous responses in the nucleus accumbens and cingulate cortex to pain onset (aversion) and offset (relief) in rats and humans. J. Neurophysiol. 110, 1221–1226. https://doi.org/10.1152/jn.00284.2013
Becker, S., Gandhi, W., Pomares, F., Wager, T.D., Schweinhardt, P., 2017. Orbitofrontal cortex mediates pain inhibition by monetary reward. Soc. Cogn. Affect. Neurosci. 12, 651–661. https://doi.org/10.1093/scan/nsw173
Belcher, A.M., Yen, C.C., Stepp, H., Gu, H., Lu, H., Yang, Y., Silva, A.C., Stein, E.A., 2013. Large-Scale Brain Networks in the Awake, Truly Resting Marmoset Monkey. J. Neurosci. 33, 16796–16804. https://doi.org/10.1523/JNEUROSCI.3146-13.2013
Belzung, C., Barreau, S., 2000. Differences in drug-induced place conditioning between BALB/c and C57B1/6 mice. Pharmacol. Biochem. Behav. 65, 419–423. https://doi.org/10.1016/S0091-3057(99)00212-9
Belzung, C., Griebel, G., 2001. Measuring normal and pathological anxiety-like behaviour in mice: a review. Behav. Brain Res. 125, 141–149.
Belzung, C., Willner, P., Philippot, P., 2015. Depression: from psychopathology to pathophysiology. Curr. Opin. Neurobiol. 30, 24–30. https://doi.org/10.1016/j.conb.2014.08.013

Benbouzid, M., Pallage, V., Rajalu, M., Waltisperger, E., Doridot, S., Poisbeau, P., Freund-Mercier, M.J., Barrot, M., 2008. Sciatic nerve cuffing in mice: A model of sustained neuropathic pain. Eur. J. Pain 12, 591–599. https://doi.org/10.1016/j.ejpain.2007.10.002
Bergmann, E., Zur, G., Bershadsky, G., Kahn, I., 2016. The Organization of Mouse and Human Cortico-Hippocampal Networks Estimated by Intrinsic Functional Connectivity. Cereb. Cortex 26, 4497–4512. https://doi.org/10.1093/cercor/bhw327
Berman, M.G., Peltier, S., Nee, D.E., Kross, E., Deldin, P.J., Jonides, J., 2011. Depression, rumination and the default network. Soc. Cogn. Affect. Neurosci. 6, 548–555. https://doi.org/10.1093/scan/nsq080
Berton, O., McClung, C.A., DiLeone, R.J., Krishnan, V., Renthal, W., Russo, S.J., Graham, D., Tsankova, N.M., Bolanos, C.A., Rios, M., Monteggia, L.M., Self, D.W., Nestler, E.J., 2006. Essential Role of BDNF in the Mesolimbic Dopamine Pathway in Social Defeat Stress. Science 311, 864–868. https://doi.org/10.1126/science.1120972
Bilbao, A., Falfán-Melgoza, C., Leixner, S., Becker, R., Singaravelu, S.K., Sack, M., Sartorius, A., Spanagel, R., Weber-Fahr, W., 2018. Longitudinal Structural and Functional Brain Network Alterations in a Mouse Model of Neuropathic Pain. Neuroscience. https://doi.org/10.1016/j.neuroscience.2018.04.020
Biswal, B., Zerrin Yetkin, F., Haughton, V.M., Hyde, J.S., 1995. Functional connectivity in the motor cortex of resting human brain using echo-planar mri. Magn. Reson. Med. 34, 537–541.
Bonelli, R.M., Cummings, J.L., 2007. Frontal-subcortical circuitry and behavior. Dialogues Clin. Neurosci. 9, 141–151.
Bora, E., Fornito, A., Pantelis, C., Yücel, M., 2012. Gray matter abnormalities in Major Depressive Disorder: a meta-analysis of voxel based morphometry studies. J. Affect. Disord. 138, 9–18. https://doi.org/10.1016/j.jad.2011.03.049
Borsook, D., Linnman, C., Faria, V., Strassman, A.M., Becerra, L., Elman, I., 2016. Reward deficiency and anti-reward in pain chronification. Neurosci. Biobehav. Rev. 68, 282–297. https://doi.org/10.1016/j.neubiorev.2016.05.033
Boyden, E.S., Zhang, F., Bamberg, E., Nagel, G., Deisseroth, K., 2005. Millisecond-timescale, genetically targeted optical control of neural activity. Nat. Neurosci. 8, 1263–1268. https://doi.org/10.1038/nn1525
Bracht, T., Linden, D., Keedwell, P., 2015. A review of white matter microstructure alterations of pathways of the reward circuit in depression. J. Affect. Disord. 187, 45–53. https://doi.org/10.1016/j.jad.2015.06.041
Bray, S., Hirt, M., Jo, B., Hall, S.S., Lightbody, A.A., Walter, E., Chen, K., Patnaik, S., Reiss, A.L., 2011. Aberrant Frontal Lobe Maturation in Adolescents with Fragile X Syndrome is Related to Delayed Cognitive Maturation. Biol. Psychiatry, Genetic and Environmental Contributors to Disturbed Cortical Development in Developmental Disorders 70, 852–858. https://doi.org/10.1016/j.biopsych.2011.05.038
Brodkin, E.S., 2007. BALB/c mice: Low sociability and other phenotypes that may be relevant to autism. Behav. Brain Res., Animal Models for Autism 176, 53–65. https://doi.org/10.1016/j.bbr.2006.06.025
Brodkin, E.S., Hagemann, A., Nemetski, S.M., Silver, L.M., 2004. Social approach–avoidance behavior of inbred mouse strains towards DBA/2 mice. Brain Res. 1002, 151–157. https://doi.org/10.1016/j.brainres.2003.12.013
Broyd, S.J., Demanuele, C., Debener, S., Helps, S.K., James, C.J., Sonuga-Barke, E.J.S., 2009. Default-mode brain dysfunction in mental disorders: A systematic review. Neurosci. Biobehav. Rev. 33, 279–296. https://doi.org/10.1016/j.neubiorev.2008.09.002
Buckner, R.L., Andrews-Hanna, J.R., Schacter, D.L., 2008. The Brain’s Default Network: Anatomy, Function, and Relevance to Disease. Ann. N. Y. Acad. Sci. 1124, 1–38. https://doi.org/10.1196/annals.1440.011
Buehlmann, D., Grandjeanc, J., Xandryd, J., Rudin, M., 2018. Longitudinal resting-state fmri in a mouse model of metastatic bone cancer reveals distinct functional reorganizations along a developing chronic pain state. Pain Publish Ahead of Print. https://doi.org/10.1097/j.pain.0000000000001148
Burma, N.E., Leduc-Pessah, H., Fan, C.Y., Trang, T., 2017. Animal models of chronic pain: Advances and challenges for clinical translation: Animal Models of Chronic Pain. J. Neurosci. Res. 95, 1242–1256. https://doi.org/10.1002/jnr.23768
Buxton, R.B., Uludağ, K., Dubowitz, D.J., Liu, T.T., 2004. Modeling the hemodynamic response to brain activation. NeuroImage, Mathematics in Brain Imaging 23, S220–S233. https://doi.org/10.1016/j.neuroimage.2004.07.013

Calamante, F., Tournier, J.-D., Heidemann, R.M., Anwander, A., Jackson, G.D., Connelly, A., 2011. Track density imaging (TDI): Validation of super resolution property. NeuroImage 56, 1259–1266. https://doi.org/10.1016/j.neuroimage.2011.02.059
Calcagno, E., Canetta, A., Guzzetti, S., Cervo, L., Invernizzi, R.W., 2007. Strain differences in basal and post-citalopram extracellular 5-HT in the mouse medial prefrontal cortex and dorsal hippocampus: relation with tryptophan hydroxylase-2 activity. J. Neurochem. 103, 1111–1120. https://doi.org/10.1111/j.1471-4159.2007.04806.x
Cauda, F., D’Agata, F., Sacco, K., Duca, S., Cocito, D., Paolasso, I., Isoardo, G., Geminiani, G., 2010. Altered resting state attentional networks in diabetic neuropathic pain. J. Neurol. Neurosurg. Psychiatry 81, 806–811. https://doi.org/10.1136/jnnp.2009.188631
Chang, P.-C., Pollema-Mays, S.L., Centeno, M.V., Procissi, D., Contini, M., Baria, A.T., Martina, M., Apkarian, A.V., 2014. Role of nucleus accumbens in neuropathic pain: Linked multi-scale evidence in the rat transitioning to neuropathic pain: Pain 155, 1128–1139. https://doi.org/10.1016/j.pain.2014.02.019
Chen, C., Kim, J.J., Thompson, R.F., Tonegawa, S., 1996. Hippocampal lesions impair contextual fear conditioning in two strains of mice. Behav. Neurosci. 110, 1177–1180. https://doi.org/10.1037/0735-7044.110.5.1177
Chen, C.-H., Suckling, J., Ooi, C., Fu, C.H., Williams, S.C., Walsh, N.D., Mitterschiffthaler, M.T., Pich, E.M., Bullmore, E., 2008. Functional coupling of the amygdala in depressed patients treated with antidepressant medication. Neuropsychopharmacology 33, 1909–1918.
Chen, J.Y.-W., Blankstein, U., Diamant, N.E., Davis, K.D., 2011. White matter abnormalities in irritable bowel syndrome and relation to individual factors. Brain Res. 1392, 121–131. https://doi.org/10.1016/j.brainres.2011.03.069
Chen, T., Taniguchi, W., Chen, Q.-Y., Tozaki-Saitoh, H., Song, Q., Liu, R.-H., Koga, K., Matsuda, T., Kaito-Sugimura, Y., Wang, J., Li, Z.-H., Lu, Y.-C., Inoue, K., Tsuda, M., Li, Y.-Q., Nakatsuka, T., Zhuo, M., 2018. Top-down descending facilitation of spinal sensory excitatory transmission from the anterior cingulate cortex. Nat. Commun. 9. https://doi.org/10.1038/s41467-018-04309-2
Chuang, K.-H., Nasrallah, F.A., 2017. Functional networks and network perturbations in rodents. NeuroImage 163, 419–436. https://doi.org/10.1016/j.neuroimage.2017.09.038
Classification of Chronic Pain, Second Edition (Revised) - IASP [WWW Document], n.d. URL https://www.iasp-pain.org/PublicationsNews/Content.aspx?ItemNumber=1673 (accessed 5.14.18).
Clemm von Hohenberg, C., Weber-Fahr, W., Lebhardt, P., Ravi, N., Braun, U., Gass, N., Becker, R., Sack, M., Cosa Linan, A., Gerchen, M.F., Reinwald, J.R., Oettl, L.-L., Meyer-Lindenberg, A., Vollmayr, B., Kelsch, W., Sartorius, A., 2018. Lateral habenula perturbation reduces default-mode network connectivity in a rat model of depression. Transl. Psychiatry 8, 68. https://doi.org/10.1038/s41398-018-0121-y
Clipperton-Allen, A.E., Ingrao, J.C., Ruggiero, L., Batista, L., Ovari, J., Hammermueller, J., Armstrong, J.N., Bienzle, D., Choleris, E., Turner, P.V., 2015. Long-Term Provision of Environmental Resources Alters Behavior but not Physiology or Neuroanatomy of Male and Female BALB/c and C57BL/6 Mice. J. Am. Assoc. Lab. Anim. Sci. 54, 718–730.
Cohen, S.P., Mao, J., 2014. Neuropathic pain: mechanisms and their clinical implications. BMJ 348, f7656. Colloca, L., Ludman, T., Bouhassira, D., Baron, R., Dickenson, A.H., Yarnitsky, D., Freeman, R., Truini, A.,
Attal, N., Finnerup, N.B., Eccleston, C., Kalso, E., Bennett, D.L., Dworkin, R.H., Raja, S.N., 2017. Neuropathic pain. Nat. Rev. Dis. Primer 3, 17002. https://doi.org/10.1038/nrdp.2017.2
Crawley, J.N., Belknap, J.K., Collins, A., Crabbe, J.C., Frankel, W., Henderson, N., Hitzemann, R.J., Maxson, S.C., Miner, L.L., Silva, A.J., 1997. Behavioral phenotypes of inbred mouse strains: implications and recommendations for molecular studies. Psychopharmacology (Berl.) 132, 107–124.
Cui, Y., Yang, Y., Ni, Z., Dong, Y., Cai, G., Foncelle, A., Ma, S., Sang, K., Tang, S., Li, Y., Shen, Y., Berry, H., Wu, S., Hu, H., 2018. Astroglial Kir4.1 in the lateral habenula drives neuronal bursts in depression. Nature 554, 323–327. https://doi.org/10.1038/nature25752
DaSilva, A.F.M., Granziera, C., Tuch, D.S., Snyder, J., Vincent, M., Hadjikhani, N., 2007. Interictal alterations of the trigeminal somatosensory pathway and PAG in migraine. Neuroreport 18, 301–305. https://doi.org/10.1097/WNR.0b013e32801776bb
Davis, K.D., Moayedi, M., 2013. Central mechanisms of pain revealed through functional and structural MRI. J. Neuroimmune Pharmacol. Off. J. Soc. NeuroImmune Pharmacol. 8, 518–534. https://doi.org/10.1007/s11481-012-9386-8
de Sá-Calçada, D., Roque, S., Branco, C., Monteiro, S., Cerqueira-Rodrigues, B., Sousa, N., Palha, J.A., Correia-Neves, M., 2015. Exploring Female Mice Interstrain Differences Relevant for Models of Depression. Front. Behav. Neurosci. 9. https://doi.org/10.3389/fnbeh.2015.00335
Delgado y Palacios, R., Verhoye, M., Henningsen, K., Wiborg, O., Van der Linden, A., 2014. Diffusion Kurtosis Imaging and High-Resolution MRI Demonstrate Structural Aberrations of Caudate Putamen and Amygdala after Chronic Mild Stress. PLoS ONE 9, e95077. https://doi.org/10.1371/journal.pone.0095077
Dennis, E.L., Thompson, P.M., 2013a. Mapping connectivity in the developing brain. Int. J. Dev. Neurosci. 31, 525–542. https://doi.org/10.1016/j.ijdevneu.2013.05.007
Dennis, E.L., Thompson, P.M., 2013b. Typical and atypical brain development: a review of neuroimaging studies. Dialogues Clin. Neurosci. 15, 359–384.
Devonshire, I.M., Burston, J.J., Xu, L., Lillywhite, A., Prior, M.J., Watson, D.J.G., Greenspon, C.M., Iwabuchi, S.J., Auer, D.P., Chapman, V., 2017. Manganese-enhanced magnetic resonance imaging depicts brain activity in models of acute and chronic pain: A new window to study experimental spontaneous pain? NeuroImage 157, 500–510. https://doi.org/10.1016/j.neuroimage.2017.06.034
Di, X., Biswal, B.B., 2015. Dynamic Brain Functional Connectivity Modulated by Resting-State Networks. Brain Struct. Funct. 220, 37–46. https://doi.org/10.1007/s00429-013-0634-3
Dillon, D.G., Dobbins, I.G., Pizzagalli, D.A., 2014. Weak reward source memory in depression reflects blunted activation of VTA/SN and parahippocampus. Soc. Cogn. Affect. Neurosci. 9, 1576–1583. https://doi.org/10.1093/scan/nst155
Doan, L., Manders, T., Wang, J., 2015. Neuroplasticity underlying the comorbidity of pain and depression. Neural Plast. 2015, 504691. https://doi.org/10.1155/2015/504691
Dodero, L., Damiano, M., Galbusera, A., Bifone, A., Tsaftsaris, S.A., Scattoni, M.L., Gozzi, A., 2013. Neuroimaging Evidence of Major Morpho-Anatomical and Functional Abnormalities in the BTBR T+TF/J Mouse Model of Autism. PLOS ONE 8, e76655. https://doi.org/10.1371/journal.pone.0076655
Doerig, N., Krieger, T., Altenstein, D., Schlumpf, Y., Spinelli, S., Spa ti, J., Brakowski, J., Quednow, B.B., Seifritz, E., Holtforth, M. g., 2016. Amygdala response to self-critical stimuli and symptom improvement in psychotherapy for depression. Br. J. Psychiatry 208, 175–181. https://doi.org/10.1192/bjp.bp.114.149971
DosSantos, M.F., Moura, B. de S., DaSilva, A.F., 2017. Reward Circuitry Plasticity in Pain Perception and Modulation. Front. Pharmacol. 8. https://doi.org/10.3389/fphar.2017.00790
Draganski, B., Ashburner, J., Hutton, C., Kherif, F., Frackowiak, R.S.J., Helms, G., Weiskopf, N., 2011. Regional specificity of MRI contrast parameter changes in normal ageing revealed by voxel-based quantification (VBQ). NeuroImage 55, 1423–1434. https://doi.org/10.1016/j.neuroimage.2011.01.052
Drevets, W.C., Price, J.L., Jr, J.R.S., Todd, R.D., Reich, T., Vannier, M., Raichle, M.E., 1997. Subgenual prefrontal cortex abnormalities in mood disorders. Nature 386, 824–827. https://doi.org/10.1038/386824a0
Du, M.-Y., Wu, Q.-Z., Yue, Q., Li, J., Liao, Y., Kuang, W.-H., Huang, X.-Q., Chan, R.C.K., Mechelli, A., Gong, Q.-Y., 2012. Voxelwise meta-analysis of gray matter reduction in major depressive disorder. Prog. Neuropsychopharmacol. Biol. Psychiatry 36, 11–16. https://doi.org/10.1016/j.pnpbp.2011.09.014
Eagle, D.M., Baunez, C., Hutcheson, D.M., Lehmann, O., Shah, A.P., Robbins, T.W., 2008. Stop-Signal Reaction-Time Task Performance: Role of Prefrontal Cortex and Subthalamic Nucleus. Cereb. Cortex 18, 178–188. https://doi.org/10.1093/cercor/bhm044
Einstein, A., 1905. Über die von der molekularkinetischen Theorie der Wärme geforderte Bewegung von in ruhenden Flüssigkeiten suspendierten Teilchen. Ann. Phys. 322, 549–560. https://doi.org/10.1002/andp.19053220806
Ellegood, J., Anagnostou, E., Babineau, B.A., Crawley, J.N., Lin, L., Genestine, M., DiCicco-Bloom, E., Lai, J.K.Y., Foster, J.A., Peñagarikano, O., Geschwind, D.H., Pacey, L.K., Hampson, D.R., Laliberté, C.L., Mills, A.A., Tam, E., Osborne, L.R., Kouser, M., Espinosa-Becerra, F., Xuan, Z., Powell, C.M.,
Raznahan, A., Robins, D.M., Nakai, N., Nakatani, J., Takumi, T., van Eede, M.C., Kerr, T.M., Muller, C., Blakely, R.D., Veenstra-VanderWeele, J., Henkelman, R.M., Lerch, J.P., 2015. Clustering autism: using neuroanatomical differences in 26 mouse models to gain insight into the heterogeneity. Mol. Psychiatry 20, 118–125. https://doi.org/10.1038/mp.2014.98
Ellegood, J., Babineau, B.A., Henkelman, R.M., Lerch, J.P., Crawley, J.N., 2013. Neuroanatomical analysis of the BTBR mouse model of autism using magnetic resonance imaging and diffusion tensor imaging. NeuroImage 70, 288–300. https://doi.org/10.1016/j.neuroimage.2012.12.029
Ellegood, J., Pacey, L.K., Hampson, D.R., Lerch, J.P., Henkelman, R.M., 2010. Anatomical phenotyping in a mouse model of fragile X syndrome with magnetic resonance imaging. NeuroImage, Imaging Genetics 53, 1023–1029. https://doi.org/10.1016/j.neuroimage.2010.03.038
Ellingson, B.M., Mayer, E., Harris, R.J., Ashe-mcnally, C., Naliboff, B.D., Labus, J.S., Tillisch, K., 2013. Diffusion tensor imaging detects microstructural reorganization in the brain associated with chronic irritable bowel syndrome. Pain 154, 1528–1541. https://doi.org/10.1016/j.pain.2013.04.010
Epstein, J., Pan, H., Kocsis, J.H., Yang, Y., Butler, T., Chusid, J., Hochberg, H., Murrough, J., Strohmayer, E., Stern, E., others, 2006. Lack of ventral striatal response to positive stimuli in depressed versus normal subjects. Am. J. Psychiatry.
Erpelding, N., Sava, S., Simons, L.E., Lebel, A., Serrano, P., Becerra, L., Borsook, D., 2013. Habenula functional resting-state connectivity in pediatric CRPS. J. Neurophysiol. 111, 239–247. https://doi.org/10.1152/jn.00405.2013
Ezzatpanah, S., Babapour, V., Haghparast, A., 2016. Differential contribution of orexin receptors within the ventral tegmental area to modulation of persistent inflammatory pain. Eur. J. Pain 20, 1090–1101. https://doi.org/10.1002/ejp.833
Fairless, A.H., Dow, H.C., Kreibich, A.S., Torre, M., Kuruvilla, M., Gordon, E., Morton, E.A., Tan, J., Berrettini, W.H., Li, H., Abel, T., Brodkin, E.S., 2012. Sociability and brain development in BALB/cJ and C57BL/6J mice. Behav. Brain Res. 228, 299–310. https://doi.org/10.1016/j.bbr.2011.12.001
Fairless, A.H., Dow, H.C., Toledo, M.M., Malkus, K.A., Edelmann, M., Li, H., Talbot, K., Arnold, S.E., Abel, T., Brodkin, E.S., 2008. Low sociability is associated with reduced size of the corpus callosum in the BALB/cJ inbred mouse strain. Brain Res. 1230, 211–217. https://doi.org/10.1016/j.brainres.2008.07.025
Fairless, A.H., Katz, J.M., Vijayvargiya, N., Dow, H.C., Kreibich, A.S., Berrettini, W.H., Abel, T., Brodkin, E.S., 2013. Development of home cage social behaviors in BALB/cJ vs. C57BL/6J mice. Behav. Brain Res. 237, 338–347. https://doi.org/10.1016/j.bbr.2012.08.051
Fanselow, M.S., Dong, H.-W., 2010. Are the Dorsal and Ventral Hippocampus Functionally Distinct Structures? Neuron 65, 7–19. https://doi.org/10.1016/j.neuron.2009.11.031
Farmer, M.A., Baliki, M.N., Apkarian, A.V., 2012. A dynamic network perspective of chronic pain. Neurosci. Lett. 520, 197–203. https://doi.org/10.1016/j.neulet.2012.05.001
Fields, H., 2004. State-dependent opioid control of pain. Nat. Rev. Neurosci. 5, 565–575. https://doi.org/10.1038/nrn1431
Fields, H.L., 2007. Understanding How Opioids Contribute to Reward and Analgesia 32, 242–246. https://doi.org/10.1016/j.rapm.2007.01.001
Fillingim, R.B., King, C.D., Ribeiro-Dasilva, M.C., Rahim-Williams, B., Riley, J.L., 2009. Sex, Gender, and Pain: A Review of Recent Clinical and Experimental Findings. J. Pain Off. J. Am. Pain Soc. 10, 447–485. https://doi.org/10.1016/j.jpain.2008.12.001
Fontaine, D.A., Davis, D.B., 2016. Attention to Background Strain Is Essential for Metabolic Research: C57BL/6 and the International Knockout Mouse Consortium. Diabetes 65, 25–33. https://doi.org/10.2337/db15-0982
Fornito, A., Bullmore, E.T., 2010. What can spontaneous fluctuations of the blood oxygenation-level-dependent signal tell us about psychiatric disorders? Curr. Opin. Psychiatry 23, 239–249. https://doi.org/10.1097/YCO.0b013e328337d78d
Fox, A.S., Shelton, S.E., Oakes, T.R., Converse, A.K., Davidson, R.J., Kalin, N.H., 2010. Orbitofrontal Cortex Lesions Alter Anxiety-Related Activity in the Primate Bed Nucleus of Stria Terminalis. J. Neurosci. 30, 7023–7027. https://doi.org/10.1523/JNEUROSCI.5952-09.2010

Fox, M.D., Raichle, M.E., 2007. Spontaneous fluctuations in brain activity observed with functional magnetic resonance imaging. Nat. Rev. Neurosci. 8, 700–711. https://doi.org/10.1038/nrn2201
Fox, M.D., Snyder, A.Z., Vincent, J.L., Corbetta, M., Van Essen, D.C., Raichle, M.E., 2005. The human brain is intrinsically organized into dynamic, anticorrelated functional networks. Proc. Natl. Acad. Sci. U. S. A. 102, 9673–9678.
Fox, P.T., Raichle, M.E., 1986. Focal physiological uncoupling of cerebral blood flow and oxidative metabolism during somatosensory stimulation in human subjects. Proc. Natl. Acad. Sci. 83, 1140–1144. https://doi.org/10.1073/pnas.83.4.1140
Fox, P.T., Raichle, M.E., Mintun, M.A., Dence, C., 1988. Nonoxidative glucose consumption during focal physiologic neural activity. Science 241, 462–464. https://doi.org/10.1126/science.3260686
Fox, R.J., 2008. Picturing Multiple Sclerosis: Conventional and Diffusion Tensor Imaging. Semin. Neurol. 28, 453–466. https://doi.org/10.1055/s-0028-1083689
Frazier, T.W., Youngstrom, E.A., Speer, L., Embacher, R., Law, P., Constantino, J., Findling, R.L., Hardan, A.Y., Eng, C., 2012. Validation of Proposed DSM-5 Criteria for Autism Spectrum Disorder. J. Am. Acad. Child Adolesc. Psychiatry 51, 28-40.e3. https://doi.org/10.1016/j.jaac.2011.09.021
Friston, K.J., Frith, C.D., Liddle, P.F., Frackowiak, R.S.J., 1993. Functional Connectivity: The Principal-Component Analysis of Large (PET) Data Sets. J. Cereb. Blood Flow Metab. 13, 5–14. https://doi.org/10.1038/jcbfm.1993.4
Fu, B., Wen, S.-N., Wang, B., Wang, K., Zhang, J.-Y., Weng, X.-C., Liu, S.-J., 2018. Gabapentin regulates dopaminergic neuron firing and theta oscillation in the ventral tegmental area to reverse depression-like behavior in chronic neuropathic pain state [WWW Document]. J. Pain Res. https://doi.org/10.2147/JPR.S170167
Garcia-Larrea, L., Peyron, R., 2013. Pain matrices and neuropathic pain matrices: a review. Pain 154 Suppl 1, S29-43. https://doi.org/10.1016/j.pain.2013.09.001
Gass, N., Becker, R., Schwarz, A.J., Weber-Fahr, W., Clemm von Hohenberg, C., Vollmayr, B., Sartorius, A., 2016. Brain network reorganization differs in response to stress in rats genetically predisposed to depression and stress-resilient rats. Transl. Psychiatry 6, e970–e970. https://doi.org/10.1038/tp.2016.233
Gass, N., Cleppien, D., Zheng, L., Schwarz, A.J., Meyer-Lindenberg, A., Vollmayr, B., Weber-Fahr, W., Sartorius, A., 2014a. Functionally altered neurocircuits in a rat model of treatment-resistant depression show prominent role of the habenula. Eur. Neuropsychopharmacol. 24, 381–390. https://doi.org/10.1016/j.euroneuro.2013.12.004
Gass, N., Schwarz, A.J., Sartorius, A., Schenker, E., Risterucci, C., Spedding, M., Zheng, L., Meyer-Lindenberg, A., Weber-Fahr, W., 2014b. Sub-Anesthetic Ketamine Modulates Intrinsic BOLD Connectivity Within the Hippocampal-Prefrontal Circuit in the Rat. Neuropsychopharmacology 39, 895–906. https://doi.org/10.1038/npp.2013.290
Geha, P.Y., Baliki, M.N., Harden, R.N., Bauer, W.R., Parrish, T.B., Apkarian, A.V., 2008. The Brain in Chronic CRPS Pain: Abnormal Gray-White Matter Interactions in Emotional and Autonomic Regions. Neuron 60, 570–581. https://doi.org/10.1016/j.neuron.2008.08.022
Gonçalves, L., Silva, R., Pinto-Ribeiro, F., Pêgo, J.M., Bessa, J.M., Pertovaara, A., Sousa, N., Almeida, A., 2008. Neuropathic pain is associated with depressive behaviour and induces neuroplasticity in the amygdala of the rat. Exp. Neurol. 213, 48–56. https://doi.org/10.1016/j.expneurol.2008.04.043
Good, C.D., Johnsrude, I.S., Ashburner, J., Henson, R.N.A., Friston, K.J., Frackowiak, R.S.J., 2001. A Voxel-Based Morphometric Study of Ageing in 465 Normal Adult Human Brains. NeuroImage 14, 21–36. https://doi.org/10.1006/nimg.2001.0786
Gozzi, A., Schwarz, A.J., 2016. Large-scale functional connectivity networks in the rodent brain. NeuroImage 127, 496–509. https://doi.org/10.1016/j.neuroimage.2015.12.017
Gradin, V.B., Kumar, P., Waiter, G., Ahearn, T., Stickle, C., Milders, M., Reid, I., Hall, J., Steele, J.D., 2011. Expected value and prediction error abnormalities in depression and schizophrenia. Brain 134, 1751–1764. https://doi.org/10.1093/brain/awr059
Grandjean, J., Azzinnari, D., Seuwen, A., Sigrist, H., Seifritz, E., Pryce, C.R., Rudin, M., 2016. Chronic psychosocial stress in mice leads to changes in brain functional connectivity and metabolite levels
comparable to human depression. NeuroImage 142, 544–552. https://doi.org/10.1016/j.neuroimage.2016.08.013
Grandjean, J., Schroeter, A., Batata, I., Rudin, M., 2014. Optimization of anesthesia protocol for resting-state fMRI in mice based on differential effects of anesthetics on functional connectivity patterns. NeuroImage 102, 838–847. https://doi.org/10.1016/j.neuroimage.2014.08.043
Grandjean, J., Zerbi, V., Balsters, J., Wenderoth, N., Rudina, M., 2017. The structural basis of large-scale functional connectivity in the mouse. J. Neurosci. 0438–17. https://doi.org/10.1523/JNEUROSCI.0438-17.2017
Grange, P., 2018. Topology of the mesoscale connectome of the mouse brain. ArXiv181104698 Q-Bio. Greicius, M.D., Flores, B.H., Menon, V., Glover, G.H., Solvason, H.B., Kenna, H., Reiss, A.L., Schatzberg, A.F.,
2007. Resting-State Functional Connectivity in Major Depression: Abnormally Increased Contributions from Subgenual Cingulate Cortex and Thalamus. Biol. Psychiatry 62, 429–437. https://doi.org/10.1016/j.biopsych.2006.09.020
Greicius, M.D., Krasnow, B., Reiss, A.L., Menon, V., 2003. Functional connectivity in the resting brain: a network analysis of the default mode hypothesis. Proc. Natl. Acad. Sci. 100, 253–258.
Grubb, S.C., Churchill, G.A., Bogue, M.A., 2004. A collaborative database of inbred mouse strain characteristics. Bioinformatics 20, 2857–2859. https://doi.org/10.1093/bioinformatics/bth299
Guilfoyle, D.N., Gerum, S.V., Sanchez, J.L., Balla, A., Sershen, H., Javitt, D.C., Hoptman, M.J., 2013. Functional connectivity fMRI in mouse brain at 7 T using isoflurane. J. Neurosci. Methods 214, 144–148. https://doi.org/10.1016/j.jneumeth.2013.01.019
Gunaydin, L.A., Grosenick, L., Finkelstein, J.C., Kauvar, I.V., Fenno, L.E., Adhikari, A., Lammel, S., Mirzabekov, J.J., Airan, R.D., Zalocusky, K.A., Tye, K.M., Anikeeva, P., Malenka, R.C., Deisseroth, K., 2014. Natural Neural Projection Dynamics Underlying Social Behavior. Cell 157, 1535–1551. https://doi.org/10.1016/j.cell.2014.05.017
Gustin, S.M., Peck, C.C., Wilcox, S.L., Nash, P.G., Murray, G.M., Henderson, L.A., 2011. Different Pain, Different Brain: Thalamic Anatomy in Neuropathic and Non-Neuropathic Chronic Pain Syndromes. J. Neurosci. 31, 5956–5964. https://doi.org/10.1523/JNEUROSCI.5980-10.2011
Guzzetti, S., Calcagno, E., Canetta, A., Sacchetti, G., Fracasso, C., Caccia, S., Cervo, L., Invernizzi, R.W., 2008. Strain differences in paroxetine-induced reduction of immobility time in the forced swimming test in mice: role of serotonin. Eur. J. Pharmacol. 594, 117–124. https://doi.org/10.1016/j.ejphar.2008.07.031
Haber, S.N., Knutson, B., 2010. The Reward Circuit: Linking Primate Anatomy and Human Imaging. Neuropsychopharmacology 35, 4–26. https://doi.org/10.1038/npp.2009.129
Hägele, C., Schlagenhauf, F., Rapp, M., Sterzer, P., Beck, A., Bermpohl, F., Stoy, M., Ströhle, A., Wittchen, H.-U., Dolan, R.J., Heinz, A., 2015. Dimensional psychiatry: reward dysfunction and depressive mood across psychiatric disorders. Psychopharmacology (Berl.) 232, 331–341. https://doi.org/10.1007/s00213-014-3662-7
Hall, G.B.C., Milne, A.M.B., MacQueen, G.M., 2014. An fMRI study of reward circuitry in patients with minimal or extensive history of major depression. Eur. Arch. Psychiatry Clin. Neurosci. 264, 187–198. https://doi.org/10.1007/s00406-013-0437-9
Harsan, L.-A., Dávid, C., Reisert, M., Schnell, S., Hennig, J., von Elverfeldt, D., Staiger, J.F., 2013. Mapping remodeling of thalamocortical projections in the living reeler mouse brain by diffusion tractography. Proc. Natl. Acad. Sci. U. S. A. 110, E1797-1806. https://doi.org/10.1073/pnas.1218330110
Hayes, D.J., Northoff, G., 2011. Identifying a Network of Brain Regions Involved in Aversion-Related Processing: A Cross-Species Translational Investigation. Front. Integr. Neurosci. 5. https://doi.org/10.3389/fnint.2011.00049
Heller, A.S., Johnstone, T., Shackman, A.J., Light, S.N., Peterson, M.J., Kolden, G.G., Kalin, N.H., Davidson, R.J., 2009. Reduced capacity to sustain positive emotion in major depression reflects diminished maintenance of fronto-striatal brain activation. Proc. Natl. Acad. Sci. 106, 22445–22450.
Henckens, M.J.A.G., van der Marel, K., van der Toorn, A., Pillai, A.G., Fernández, G., Dijkhuizen, R.M., Joëls, M., 2015. Stress-induced alterations in large-scale functional networks of the rodent brain. NeuroImage 105, 312–322. https://doi.org/10.1016/j.neuroimage.2014.10.037
Hickie, I.B., Naismith, S.L., Ward, P.B., Scott, E.M., Mitchell, P.B., Schofield, P.R., Scimone, A., Wilhelm, K., Parker, G., 2007. Serotonin transporter gene status predicts caudate nucleus but not amygdala or hippocampal volumes in older persons with major depression. J. Affect. Disord. 98, 137–142. https://doi.org/10.1016/j.jad.2006.07.010
Hipólito, L., Wilson-Poe, A., Campos-Jurado, Y., Zhong, E., Gonzalez-Romero, J., Virag, L., Whittington, R., Comer, S.D., Carlton, S.M., Walker, B.M., Bruchas, M.R., Morón, J.A., 2015. Inflammatory Pain Promotes Increased Opioid Self-Administration: Role of Dysregulated Ventral Tegmental Area μ Opioid Receptors. J. Neurosci. 35, 12217–12231. https://doi.org/10.1523/JNEUROSCI.1053-15.2015
Horsfield, M.A., Jones, D.K., 2002. Applications of diffusion-weighted and diffusion tensor MRI to white matter diseases – a review. NMR Biomed. 15, 570–577. https://doi.org/10.1002/nbm.787
Huang, P., Gao, T., Dong, Z., Zhou, C., Lai, Y., Pan, T., Liu, Y., Zhao, X., Sun, X., Hua, H., Wen, G., Gao, L., Lv, Z., 2018. Neural circuitry among connecting the hippocampus, prefrontal cortex and basolateral amygdala in a mouse depression model: Associations correlations between BDNF levels and BOLD – fMRI signals. Brain Res. Bull. 142, 107–115. https://doi.org/10.1016/j.brainresbull.2018.06.019
Hubbard, C.S., Khan, S.A., Xu, S., Cha, M., Masri, R., Seminowicz, D.A., 2015. Behavioral, metabolic and functional brain changes in a rat model of chronic neuropathic pain: A longitudinal MRI study. NeuroImage 107, 333–344. https://doi.org/10.1016/j.neuroimage.2014.12.024
Hübner, N.S., Mechling, A.E., Lee, H.-L., Reisert, M., Bienert, T., Hennig, J., von Elverfeldt, D., Harsan, L.-A., 2017. The connectomics of brain demyelination: Functional and structural patterns in the cuprizone mouse model. NeuroImage 146, 1–18. https://doi.org/10.1016/j.neuroimage.2016.11.008
Iannetti, G.D., Mouraux, A., 2010. From the neuromatrix to the pain matrix (and back). Exp. Brain Res. 205, 1–12. https://doi.org/10.1007/s00221-010-2340-1
Ikeda, H., Mochizuki, K., Murase, K., 2013. Astrocytes are involved in long-term facilitation of neuronal excitation in the anterior cingulate cortex of mice with inflammatory pain: Pain 154, 2836–2843. https://doi.org/10.1016/j.pain.2013.08.023
Ingalhalikar, M., Smith, A., Parker, D., Satterthwaite, T.D., Elliott, M.A., Ruparel, K., Hakonarson, H., Gur, R.E., Gur, R.C., Verma, R., 2014. Sex differences in the structural connectome of the human brain. Proc. Natl. Acad. Sci. 111, 823–828. https://doi.org/10.1073/pnas.1316909110
Isingrini, E., Perret, L., Rainer, Q., Amilhon, B., Guma, E., Tanti, A., Martin, G., Robinson, J., Moquin, L., Marti, F., 2017. 695. Resilience against Chronic Stress is Mediated by Noradrenergic Regulation of the Ventral Tegmental Area. Biol. Psychiatry 81, S282.
Jacome, L.F., Burket, J.A., Herndon, A.L., Deutsch, S.I., 2011. Genetically inbred Balb/c mice differ from outbred Swiss Webster mice on discrete measures of sociability: relevance to a genetic mouse model of autism spectrum disorders. Autism Res. 4, 393–400. https://doi.org/10.1002/aur.218
Ji, N.-N., Kang, J., Hua, R., Zhang, Y.-M., 2018. Involvement of dopamine system in the regulation of the brain corticotropin-releasing hormone in paraventricular nucleus in a rat model of chronic visceral pain. Neurol. Res. 0, 1–8. https://doi.org/10.1080/01616412.2018.1460702
Johnston, B.A., Tolomeo, S., Gradin, V., Christmas, D., Matthews, K., Douglas Steele, J., 2015. Failure of hippocampal deactivation during loss events in treatment-resistant depression. Brain 138, 2766–2776. https://doi.org/10.1093/brain/awv177
Jonckers, E., Van Audekerke, J., De Visscher, G., Van der Linden, A., Verhoye, M., 2011. Functional Connectivity fMRI of the Rodent Brain: Comparison of Functional Connectivity Networks in Rat and Mouse. PLoS ONE 6, e18876. https://doi.org/10.1371/journal.pone.0018876
Jones, D., 2008. Studying connections in the living human brain with diffusion MRI. Cortex 44, 936–952. https://doi.org/10.1016/j.cortex.2008.05.002
Jones, D.K., 2004. The effect of gradient sampling schemes on measures derived from diffusion tensor MRI: A Monte Carlo study. Magn. Reson. Med. 51, 807–815. https://doi.org/10.1002/mrm.20033
Just, M.A., Cherkassky, V.L., Keller, T.A., Kana, R.K., Minshew, N.J., 2006. Functional and Anatomical Cortical Underconnectivity in Autism: Evidence from an fMRI Study of an Executive Function Task and Corpus Callosum Morphometry. Cereb. Cortex 17, 951–961. https://doi.org/10.1093/cercor/bhl006
Kahn, I., Shohamy, D., 2013. Intrinsic connectivity between the hippocampus, nucleus accumbens, and ventral tegmental area in humans. Hippocampus 23, 187–192. https://doi.org/10.1002/hipo.22077

Keane, T.M., Goodstadt, L., Danecek, P., White, M.A., Wong, K., Yalcin, B., Heger, A., Agam, A., Slater, G., Goodson, M., Furlotte, N.A., Eskin, E., Nellåker, C., Whitley, H., Cleak, J., Janowitz, D., Hernandez-Pliego, P., Edwards, A., Belgard, T.G., Oliver, P.L., McIntyre, R.E., Bhomra, A., Nicod, J., Gan, X., Yuan, W., Weyden, L. van der, Steward, C.A., Bala, S., Stalker, J., Mott, R., Durbin, R., Jackson, I.J., Czechanski, A., Guerra-Assunção, J.A., Donahue, L.R., Reinholdt, L.G., Payseur, B.A., Ponting, C.P., Birney, E., Flint, J., Adams, D.J., 2011. Mouse genomic variation and its effect on phenotypes and gene regulation. Nature 477, 289. https://doi.org/10.1038/nature10413
Kim, S., Pickup, S., Fairless, A.H., Ittyerah, R., Dow, H.C., Abel, T., Brodkin, E.S., Poptani, H., 2012. Association between sociability and diffusion tensor imaging in BALB/cJ mice: DIFFUSION TENSOR IMAGING AND SOCIABILITY. NMR Biomed. 25, 104–112. https://doi.org/10.1002/nbm.1722
Knox, J.E., Harris, K.D., Graddis, N., Whitesell, J.D., Zeng, H., Harris, J.A., Shea-Brown, E., Mihalas, S., 2018. High resolution data-driven model of the mouse connectome. bioRxiv 293019. https://doi.org/10.1101/293019
Knutson, B., Bhanji, J.P., Cooney, R.E., Atlas, L.Y., Gotlib, I.H., 2008. Neural Responses to Monetary Incentives in Major Depression. Biol. Psychiatry 63, 686–692. https://doi.org/10.1016/j.biopsych.2007.07.023
Ko, M.Y., Jang, E.Y., Lee, J.Y., Kim, S.P., Whang, S.H., Lee, B.H., Kim, H.Y., Yang, C.H., Cho, H.J., Gwak, Y.S., 2018. The Role of Ventral Tegmental Area Gamma-Aminobutyric Acid in Chronic Neuropathic Pain after Spinal Cord Injury in Rats. J. Neurotrauma 35, 1755–1764. https://doi.org/10.1089/neu.2017.5381
Komaki, Y., Hikishima, K., Shibata, S., Konomi, T., Seki, F., Yamada, M., Miyasaka, N., Fujiyoshi, K., Okano, H.J., Nakamura, M., Okano, H., 2016. Functional brain mapping using specific sensory-circuit stimulation and a theoretical graph network analysis in mice with neuropathic allodynia. Sci. Rep. 6, 37802. https://doi.org/10.1038/srep37802
Kuchinad, A., Schweinhardt, P., Seminowicz, D.A., Wood, P.B., Chizh, B.A., Bushnell, M.C., 2007. Accelerated Brain Gray Matter Loss in Fibromyalgia Patients: Premature Aging of the Brain? J. Neurosci. 27, 4004–4007. https://doi.org/10.1523/JNEUROSCI.0098-07.2007
Kucyi, A., Moayedi, M., Weissman-Fogel, I., Goldberg, M.B., Freeman, B.V., Tenenbaum, H.C., Davis, K.D., 2014. Enhanced medial prefrontal-default mode network functional connectivity in chronic pain and its association with pain rumination. J. Neurosci. Off. J. Soc. Neurosci. 34, 3969–3975. https://doi.org/10.1523/JNEUROSCI.5055-13.2014
Kumar, M., Kim, S., Pickup, S., Chen, R., Fairless, A.H., Ittyerah, R., Abel, T., Brodkin, E.S., Poptani, H., 2012. Longitudinal in-vivo diffusion tensor imaging for assessing brain developmental changes in BALB/cJ mice, a model of reduced sociability relevant to autism. Brain Res. 1455, 56–67. https://doi.org/10.1016/j.brainres.2012.03.041
Kumar, P., Slavich, G.M., Berghorst, L.H., Treadway, M.T., Brooks, N.H., Dutra, S.J., Greve, D.N., O׳Donovan, A., Bleil, M.E., Maninger, N., Pizzagalli, D.A., 2015. Perceived life stress exposure modulates reward-related medial prefrontal cortex responses to acute stress in depression. J. Affect. Disord. 180, 104–111. https://doi.org/10.1016/j.jad.2015.03.035
Kumar, P., Waiter, G., Ahearn, T., Milders, M., Reid, I., Steele, J.D., 2008. Abnormal temporal difference reward-learning signals in major depression. Brain 131, 2084–2093. https://doi.org/10.1093/brain/awn136
Lai, C.-H., 2013. Gray matter volume in major depressive disorder: a meta-analysis of voxel-based morphometry studies. Psychiatry Res. 211, 37–46. https://doi.org/10.1016/j.pscychresns.2012.06.006
Lai, J.K.Y., Lerch, J.P., Doering, L.C., Foster, J.A., Ellegood, J., 2016. Regional brain volumes changes in adult male FMR1-KO mouse on the FVB strain. Neuroscience 318, 12–21. https://doi.org/10.1016/j.neuroscience.2016.01.021
Laine, M.A., Sokolowska, E., Dudek, M., Callan, S.-A., Hyytiä, P., Hovatta, I., 2017. Brain activation induced by chronic psychosocial stress in mice. Sci. Rep. 7. https://doi.org/10.1038/s41598-017-15422-5
Lammel, S., Lim, B.K., Malenka, R.C., 2014. Reward and aversion in a heterogeneous midbrain dopamine system. Neuropharmacology 76, 351–359. https://doi.org/10.1016/j.neuropharm.2013.03.019
Lassi, G., Tucci, V., 2017. Gene-environment interaction influences attachment-like style in mice. Genes Brain Behav. 16, 612–618. https://doi.org/10.1111/gbb.12385

Le Bihan, D., 2014. Diffusion MRI: what water tells us about the brain. EMBO Mol. Med. 6, 569–573. https://doi.org/10.1002/emmm.201404055
Le Bihan, D., 2003. Looking into the functional architecture of the brain with diffusion MRI. Nat. Rev. Neurosci. 4, 469–480. https://doi.org/10.1038/nrn1119
Le Bihan, D., Breton, E., 1985. Imagerie de diffusion in-vivo par résonance magnétique nucléaire. Comptes-Rendus Académie Sci. 93, 27–34.
Le Merre, P., Esmaeili, V., Charrière, E., Galan, K., Salin, P.-A., Petersen, C.C.H., Crochet, S., 2018. Reward-Based Learning Drives Rapid Sensory Signals in Medial Prefrontal Cortex and Dorsal Hippocampus Necessary for Goal-Directed Behavior. Neuron 97, 83-91.e5. https://doi.org/10.1016/j.neuron.2017.11.031
Lee, A.-R., Kim, J.-H., Cho, E., Kim, M., Park, M., 2017. Dorsal and Ventral Hippocampus Differentiate in Functional Pathways and Differentially Associate with Neurological Disease-Related Genes during Postnatal Development. Front. Mol. Neurosci. 10. https://doi.org/10.3389/fnmol.2017.00331
Lee, B.-T., Seong Whi Cho, Hyung Soo Khang, Lee, B.-C., Choi, I.-G., In Kyoon Lyoo, Ham, B.-J., 2007. The neural substrates of affective processing toward positive and negative affective pictures in patients with major depressive disorder. Prog. Neuropsychopharmacol. Biol. Psychiatry 31, 1487–1492. https://doi.org/10.1016/j.pnpbp.2007.06.030
Lee, M., Manders, T.R., Eberle, S.E., Su, C., D’amour, J., Yang, R., Lin, H.Y., Deisseroth, K., Froemke, R.C., Wang, J., 2015. Activation of corticostriatal circuitry relieves chronic neuropathic pain. J. Neurosci. Off. J. Soc. Neurosci. 35, 5247–5259. https://doi.org/10.1523/JNEUROSCI.3494-14.2015
Lee, M.H., Smyser, C.D., Shimony, J.S., 2013. Resting-State fMRI: A Review of Methods and Clinical Applications. Am. J. Neuroradiol. 34, 1866–1872. https://doi.org/10.3174/ajnr.A3263
Lein, E.S., Hawrylycz, M.J., Ao, N., Ayres, M., Bensinger, A., Bernard, A., Boe, A.F., Boguski, M.S., Brockway, K.S., Byrnes, E.J., Chen, Lin, Chen, Li, Chen, T.-M., Chi Chin, M., Chong, J., Crook, B.E., Czaplinska, A., Dang, C.N., Datta, S., Dee, N.R., Desaki, A.L., Desta, T., Diep, E., Dolbeare, T.A., Donelan, M.J., Dong, H.-W., Dougherty, J.G., Duncan, B.J., Ebbert, A.J., Eichele, G., Estin, L.K., Faber, C., Facer, B.A., Fields, R., Fischer, S.R., Fliss, T.P., Frensley, C., Gates, S.N., Glattfelder, K.J., Halverson, K.R., Hart, M.R., Hohmann, J.G., Howell, M.P., Jeung, D.P., Johnson, R.A., Karr, P.T., Kawal, R., Kidney, J.M., Knapik, R.H., Kuan, C.L., Lake, J.H., Laramee, A.R., Larsen, K.D., Lau, C., Lemon, T.A., Liang, A.J., Liu, Y., Luong, L.T., Michaels, J., Morgan, J.J., Morgan, R.J., Mortrud, M.T., Mosqueda, N.F., Ng, L.L., Ng, R., Orta, G.J., Overly, C.C., Pak, T.H., Parry, S.E., Pathak, S.D., Pearson, O.C., Puchalski, R.B., Riley, Z.L., Rockett, H.R., Rowland, S.A., Royall, J.J., Ruiz, M.J., Sarno, N.R., Schaffnit, K., Shapovalova, N.V., Sivisay, T., Slaughterbeck, C.R., Smith, S.C., Smith, K.A., Smith, B.I., Sodt, A.J., Stewart, N.N., Stumpf, K.-R., Sunkin, S.M., Sutram, M., Tam, A., Teemer, C.D., Thaller, C., Thompson, C.L., Varnam, L.R., Visel, A., Whitlock, R.M., Wohnoutka, P.E., Wolkey, C.K., Wong, V.Y., Wood, M., Yaylaoglu, M.B., Young, R.C., Youngstrom, B.L., Feng Yuan, X., Zhang, B., Zwingman, T.A., Jones, A.R., 2007. Genome-wide atlas of gene expression in the adult mouse brain. Nature 445, 168–176. https://doi.org/10.1038/nature05453
Lepping, R.J., Atchley, R.A., Chrysikou, E., Martin, L.E., Clair, A.A., Ingram, R.E., Simmons, W.K., Savage, C.R., 2016. Neural Processing of Emotional Musical and Nonmusical Stimuli in Depression. PLOS ONE 11, e0156859. https://doi.org/10.1371/journal.pone.0156859
Li, J., Li, Y., Zhang, B., Shen, X., Zhao, H., 2016. Why depression and pain often coexist and mutually reinforce: Role of the lateral habenula. Exp. Neurol. 284, 106–113. https://doi.org/10.1016/j.expneurol.2016.08.010
Li, J.-X., 2015. Pain and depression comorbidity: a preclinical perspective. Behav. Brain Res. 276, 92–98. https://doi.org/10.1016/j.bbr.2014.04.042
Li, Yanhui, Wang, Y., Xuan, C., Li, Yang, Piao, L., Li, J., Zhao, H., 2017. Role of the Lateral Habenula in Pain-Associated Depression. Front. Behav. Neurosci. 11. https://doi.org/10.3389/fnbeh.2017.00031
Liska, A., Galbusera, A., Schwarz, A.J., Gozzi, A., 2015. Functional connectivity hubs of the mouse brain. NeuroImage 115, 281–291. https://doi.org/10.1016/j.neuroimage.2015.04.033
Liska, A., Gozzi, A., 2016. Can Mouse Imaging Studies Bring Order to Autism Connectivity Chaos? Front. Neurosci. 10. https://doi.org/10.3389/fnins.2016.00484
Liu, D., Tang, Q.-Q., Yin, C., Song, Yu, Liu, Y., Yang, J.-X., Liu, H., Zhang, Y.-M., Wu, S.-Y., Song, Ying, Juarez, B., Ding, H.-L., Han, M.-H., Zhang, H., Cao, J.-L., 2018. Brain-derived neurotrophic factor–mediated projection-specific regulation of depressive-like and nociceptive behaviors in the mesolimbic reward circuitry: PAIN 159, 175. https://doi.org/10.1097/j.pain.0000000000001083
Logothetis, N.K., 2008. What we can do and what we cannot do with fMRI. Nature 453, 869–878. https://doi.org/10.1038/nature06976
Logothetis, N.K., 2003. The underpinnings of the BOLD functional magnetic resonance imaging signal. J. Neurosci. 23, 3963–3971.
Logothetis, N.K., Pauls, J., Augath, M., Trinath, T., Oeltermann, A., 2001. Neurophysiological investigation of the basis of the fMRI signal. Nature 412, 150–157. https://doi.org/10.1038/35084005
Lutz, J., Jäger, L., Quervain, D. de, Krauseneck, T., Padberg, F., Wichnalek, M., Beyer, A., Stahl, R., Zirngibl, B., Morhard, D., Reiser, M., Schelling, G., 2008. White and gray matter abnormalities in the brain of patients with fibromyalgia: A diffusion-tensor and volumetric imaging study. Arthritis Rheum. 58, 3960–3969. https://doi.org/10.1002/art.24070
Magnuson, M.E., Thompson, G.J., Pan, W.-J., Keilholz, S.D., 2014. Effects of Severing the Corpus Callosum on Electrical and BOLD Functional Connectivity and Spontaneous Dynamic Activity in the Rat Brain. Brain Connect. 4, 15–29. https://doi.org/10.1089/brain.2013.0167
Mannelli, L.D.C., Pacini, A., Bonaccini, L., Zanardelli, M., Mello, T., Ghelardini, C., 2013. Morphologic Features and Glial Activation in Rat Oxaliplatin-Dependent Neuropathic Pain. J. Pain 14, 1585–1600. https://doi.org/10.1016/j.jpain.2013.08.002
Mantini, D., Gerits, A., Nelissen, K., Durand, J.-B., Joly, O., Simone, L., Sawamura, H., Wardak, C., Orban, G.A., Buckner, R.L., Vanduffel, W., 2011. Default Mode of Brain Function in Monkeys. J. Neurosci. Off. J. Soc. Neurosci. 31, 12954–12962. https://doi.org/10.1523/JNEUROSCI.2318-11.2011
Matsubayashi, K., Nagoshi, N., Komaki, Y., Kojima, K., Shinozaki, M., Tsuji, O., Iwanami, A., Ishihara, R., Takata, N., Matsumoto, M., Mimura, M., Okano, H., Nakamura, M., 2018. Assessing cortical plasticity after spinal cord injury by using resting-state functional magnetic resonance imaging in awake adult mice. Sci. Rep. 8, 14406. https://doi.org/10.1038/s41598-018-32766-8
Mayberg, H.S., 2009. Targeted electrode-based modulation of neural circuits for depression. J. Clin. Invest. 119, 717–725. https://doi.org/10.1172/JCI38454
McFarlane, H.G., Kusek, G.K., Yang, M., Phoenix, J.L., Bolivar, V.J., Crawley, J.N., 2008. Autism-like behavioral phenotypes in BTBR T+tf/J mice. Genes Brain Behav. 7, 152–163. https://doi.org/10.1111/j.1601-183X.2007.00330.x
Mechling, A.E., Arefin, T., Lee, H.-L., Bienert, T., Reisert, M., Ben Hamida, S., Darcq, E., Ehrlich, A., Gaveriaux-Ruff, C., Parent, M.J., Rosa-Neto, P., Hennig, J., von Elverfeldt, D., Kieffer, B.L., Harsan, L.-A., 2016. Deletion of the mu opioid receptor gene in mice reshapes the reward–aversion connectome. Proc. Natl. Acad. Sci. 201601640. https://doi.org/10.1073/pnas.1601640113
Mechling, A.E., Hübner, N.S., Lee, H.-L., Hennig, J., von Elverfeldt, D., Harsan, L.-A., 2014. Fine-grained mapping of mouse brain functional connectivity with resting-state fMRI. NeuroImage 96, 203–215. https://doi.org/10.1016/j.neuroimage.2014.03.078
Melzack, R., 2005. Evolution of the Neuromatrix Theory of Pain. The Prithvi Raj Lecture: Presented at the Third World Congress of World Institute of Pain, Barcelona 2004. Pain Pract. 5, 85–94. https://doi.org/10.1111/j.1533-2500.2005.05203.x
Melzack, R., 1990. Phantom limbs and the concept of a neuromatrix. Trends Neurosci. 13, 88–92. https://doi.org/10.1016/0166-2236(90)90179-E
Miller, V.M., Gupta, D., Neu, N., Cotroneo, A., Boulay, C.B., Seegal, R.F., 2013. Novel inter-hemispheric white matter connectivity in the BTBR mouse model of autism. Brain Res. 1513, 26–33. https://doi.org/10.1016/j.brainres.2013.04.001
Mitsi, V., Zachariou, V., 2016. Modulation of pain, nociception, and analgesia by the brain reward center. Neuroscience. https://doi.org/10.1016/j.neuroscience.2016.05.017
Moayedi, M., Weissman-Fogel, I., Salomons, T.V., Crawley, A.P., Goldberg, M.B., Freeman, B.V., Tenenbaum, H.C., Davis, K.D., 2012. White matter brain and trigeminal nerve abnormalities in temporomandibular disorder. Pain 153, 1467–1477. https://doi.org/10.1016/j.pain.2012.04.003
Mori, S., Zhang, J., 2006. Principles of Diffusion Tensor Imaging and Its Applications to Basic Neuroscience Research. Neuron 51, 527–539. https://doi.org/10.1016/j.neuron.2006.08.012
Morris, L.S., Sprenger, C., Koda, K., de la Mora, D.M., Yamada, T., Mano, H., Kashiwagi, Y., Yoshioka, Y., Morioka, Y., Seymour, B., 2017. Anterior cingulate cortex connectivity is associated with suppression of behavior in a rat model of chronic pain. https://doi.org/10.1101/225482
Moseley, M.E., Cohen, Y., Kucharczyk, J., Mintorovitch, J., Asgari, H.S., Wendland, M.F., Tsuruda, J., Norman, D., 1990. Diffusion-weighted MR imaging of anisotropic water diffusion in cat central nervous system. Radiology 176, 439–445. https://doi.org/10.1148/radiology.176.2.2367658
Moy, S.S., Nadler, J.J., Perez, A., Barbaro, R.P., Johns, J.M., Magnuson, T.R., Piven, J., Crawley, J.N., 2004. Sociability and preference for social novelty in five inbred strains: an approach to assess autistic-like behavior in mice. Genes Brain Behav. 3, 287–302.
Moy, S.S., Nadler, J.J., Young, N.B., Perez, A., Holloway, L.P., Barbaro, R.P., Barbaro, J.R., Wilson, L.M., Threadgill, D.W., Lauder, J.M., Magnuson, T.R., Crawley, J.N., 2007. Mouse behavioral tasks relevant to autism: Phenotypes of 10 inbred strains. Behav. Brain Res., Animal Models for Autism 176, 4–20. https://doi.org/10.1016/j.bbr.2006.07.030
Mukherjee, P., Berman, J.I., Chung, S.W., Hess, C.P., Henry, R.G., 2008. Diffusion Tensor MR Imaging and Fiber Tractography: Theoretic Underpinnings. Am. J. Neuroradiol. 29, 632–641. https://doi.org/10.3174/ajnr.A1051
Mutso, A.A., Petre, B., Huang, L., Baliki, M.N., Torbey, S., Herrmann, K.M., Schnitzer, T.J., Apkarian, A.V., 2013. Reorganization of hippocampal functional connectivity with transition to chronic back pain. J. Neurophysiol. 111, 1065–1076. https://doi.org/10.1152/jn.00611.2013
Mutso, A.A., Radzicki, D., Baliki, M.N., Huang, L., Banisadr, G., Centeno, M.V., Radulovic, J., Martina, M., Miller, R.J., Apkarian, A.V., 2012. Abnormalities in Hippocampal Functioning with Persistent Pain. J. Neurosci. 32, 5747–5756. https://doi.org/10.1523/JNEUROSCI.0587-12.2012
Napadow, V., LaCount, L., Park, K., As Sanie, S., Clauw, D.J., Harris, R.E., 2011. Intrinsic brain connectivity in fibromyalgia is associated with chronic pain intensity. Arthritis Rheum. 62, 2545–2555. https://doi.org/10.1002/art.27497
Narita Minoru, Kuzumaki Naoko, Narita Michiko, Kaneko Chihiro, Hareyama Nana, Miyatake Mayumi, Shindo Keiko, Miyoshi Kan, Nakajima Mayumi, Nagumo Yasuyuki, Sato Fumiaki, Wachi Hiroshi, Seyama Yoshiyuki, Suzuki Tsutomu, 2006. Chronic pain induced emotional dysfunction is associated with astrogliosis due to cortical δ opioid receptor dysfunction. J. Neurochem. 97, 1369–1378. https://doi.org/10.1111/j.1471-4159.2006.03824.x
Narita, Minoru, Suzuki, M., Imai, S., Narita, Michiko, Ozaki, S., Kishimoto, Y., Oe, K., Yajima, Y., Yamazaki, M., Suzuki, T., 2004. Molecular mechanism of changes in the morphine-induced pharmacological actions under chronic pain-like state: Suppression of dopaminergic transmission in the brain. Life Sci., The First International Pfizer Science and Research Symposium: Key Topic 2003: Central Mechanism of Neuropathic Pain 74, 2655–2673. https://doi.org/10.1016/j.lfs.2004.01.006
Nasrallah, F.A., Tay, H.-C., Chuang, K.-H., 2014. Detection of functional connectivity in the resting mouse brain. NeuroImage 86, 417–424. https://doi.org/10.1016/j.neuroimage.2013.10.025
Nees, F., Becker, S., 2018. Psychological Processes in Chronic Pain: Influences of Reward and Fear Learning as Key Mechanisms – Behavioral Evidence, Neural Circuits, and Maladaptive Changes. Neuroscience 387, 72–84. https://doi.org/10.1016/j.neuroscience.2017.08.051
Ogawa, S., Lee, T.-M., Kay, A.R., Tank, D.W., 1990. Brain magnetic resonance imaging with contrast dependent on blood oxygenation. Proc. Natl. Acad. Sci. 87, 9868–9872.
Oh, S.W., Harris, J.A., Ng, L., Winslow, B., Cain, N., Mihalas, S., Wang, Q., Lau, C., Kuan, L., Henry, A.M., Mortrud, M.T., Ouellette, B., Nguyen, T.N., Sorensen, S.A., Slaughterbeck, C.R., Wakeman, W., Li, Y., Feng, D., Ho, A., Nicholas, E., Hirokawa, K.E., Bohn, P., Joines, K.M., Peng, H., Hawrylycz, M.J., Phillips, J.W., Hohmann, J.G., Wohnoutka, P., Gerfen, C.R., Koch, C., Bernard, A., Dang, C., Jones, A.R., Zeng, H., 2014. A mesoscale connectome of the mouse brain. Nature 508, 207–214. https://doi.org/10.1038/nature13186
Ohl, F., Sillaber, I., Binder, E., Keck, M.E., Holsboer, F., 2001. Differential analysis of behavior and diazepam-induced alterations in C57BL/6N and BALB/c mice using the modified hole board test. J. Psychiatr. Res. 35, 147–154. https://doi.org/10.1016/S0022-3956(01)00017-6
Olds, J., Milner, P., 1954. Positive reinforcement produced by electrical stimulation of septal area and other regions of rat brain. J. Comp. Physiol. Psychol. 47, 419–427. https://doi.org/10.1037/h0058775
Osuch, E.A., Bluhm, R.L., Williamson, P.C., Théberge, J., Densmore, M., Neufeld, R.W.J., 2009. Brain activation to favorite music in healthy controls and depressed patients: NeuroReport 20, 1204–1208. https://doi.org/10.1097/WNR.0b013e32832f4da3
Padmanabhan, S. (Ed.), 2014. Handbook of Pharmacogenomics and Stratified Medicine, in: Handbook of Pharmacogenomics and Stratified Medicine. Academic Press, San Diego, p. i. https://doi.org/10.1016/B978-0-12-386882-4.00047-5
Palumbo, M.L., Canzobre, M.C., Pascuan, C.G., Ríos, H., Wald, M., Genaro, A.M., 2010. Stress induced cognitive deficit is differentially modulated in BALB/c and C57Bl/6 mice: Correlation with Th1/Th2 balance after stress exposure. J. Neuroimmunol. 218, 12–20. https://doi.org/10.1016/j.jneuroim.2009.11.005
Pan, W.-J., Billings, J.C.W., Grooms, J.K., Shakil, S., Keilholz, S.D., 2015. Considerations for resting state functional MRI and functional connectivity studies in rodents. Front. Neurosci. 9. https://doi.org/10.3389/fnins.2015.00269
Pan, W.-J., Thompson, G.J., Magnuson, M.E., Jaeger, D., Keilholz, S., 2013. Infraslow LFP correlates to resting-state fMRI BOLD signals. NeuroImage 74, 288–297. https://doi.org/10.1016/j.neuroimage.2013.02.035
Panksepp, J.B., Lahvis, G.P., 2007. Social reward among juvenile mice. Genes Brain Behav. 6, 661–671. Parksl, E.L., Gehal, P.Y., Balikil, M.N., Katzl, J., Schnitzerl, T.J., Apkarianl, A.V., 2011. Brain activity for chronic
knee osteoarthritis: Dissociating evoked pain from spontaneous pain. Eur. J. Pain 15, 843.e1-843.e14. https://doi.org/10.1016/j.ejpain.2010.12.007
Pauling, L., Coryell, C.D., 1936. The Magnetic Properties and Structure of Hemoglobin, Oxyhemoglobin and Carbonmonoxyhemoglobin. Proc. Natl. Acad. Sci. U. S. A. 22, 210–216.
Peng, D.X., Kelley, R.G., Quintin, E.-M., Raman, M., Thompson, P.M., Reiss, A.L., 2014. Cognitive and behavioral correlates of caudate subregion shape variation in fragile X syndrome. Hum. Brain Mapp. 35, 2861–2868. https://doi.org/10.1002/hbm.22376
Pervolaraki, E., Tyson, A.L., Pibiri, F., Poulter, S.L., Reichelt, A.C., Rodgers, R.J., Clapcote, S.J., Lever, C., Andreae, L.C., Dachtler, J., 2019. The within-subject application of diffusion tensor MRI and CLARITY reveals brain structural changes in Nrxn2 deletion mice. Mol. Autism 10, 8. https://doi.org/10.1186/s13229-019-0261-9
Pilz, L.K., Quiles, C.L., Dallegrave, E., Levandovski, R., Hidalgo, M.P.L., Elisabetsky, E., Pilz, L.K., Quiles, C.L., Dallegrave, E., Levandovski, R., Hidalgo, M.P.L., Elisabetsky, E., 2015. Differential susceptibility of BALB/c, C57BL/6N, and CF1 mice to photoperiod changes. Rev. Bras. Psiquiatr. 37, 185–190. https://doi.org/10.1590/1516-4446-2014-1454
Pitcher, M.H., Korff, M.V., Bushnell, M.C., Porter, L., 2019. Prevalence and Profile of High-Impact Chronic Pain in the United States. J. Pain 20, 146–160. https://doi.org/10.1016/j.jpain.2018.07.006
Pizzagalli, D.A., Holmes, A.J., Dillon, D.G., Goetz, E.L., Birk, J.L., Bogdan, R., Dougherty, D.D., Iosifescu, D.V., Rauch, S.L., Fava, M., 2009. Reduced caudate and nucleus accumbens response to rewards in unmedicated individuals with major depressive disorder. Am. J. Psychiatry 166, 702–710.
Proulx, C.D., Hikosaka, O., Malinow, R., 2014. Reward processing by the lateral habenula in normal and depressive behaviors. Nat. Neurosci. 17, 1146–1152. https://doi.org/10.1038/nn.3779
Qiu, M., Ye, Z., Li, Q., Liu, G., Xie, B., Wang, J., 2011. Changes of Brain Structure and Function in ADHD Children. Brain Topogr. 24, 243–252. https://doi.org/10.1007/s10548-010-0168-4
Raichle, M.E., MacLeod, A.M., Snyder, A.Z., Powers, W.J., Gusnard, D.A., Shulman, G.L., 2001. A default mode of brain function. Proc. Natl. Acad. Sci. 98, 676–682.
Raichle, M.E., Mintun, M.A., 2006. Brain work and brain imaging. Annu Rev Neurosci 29, 449–476. Rajkowska, G., 2000. Postmortem studies in mood disorders indicate altered numbers of neurons and glial
cells. Biol. Psychiatry 48, 766–777. https://doi.org/10.1016/S0006-3223(00)00950-1

Redlich, R., Dohm, K., Grotegerd, D., Opel, N., Zwitserlood, P., Heindel, W., Arolt, V., Kugel, H., Dannlowski, U., 2015. Reward Processing in Unipolar and Bipolar Depression: A Functional MRI Study. Neuropsychopharmacology 40, 2623–2631. https://doi.org/10.1038/npp.2015.110
Reisert, M., Mader, I., Anastasopoulos, C., Weigel, M., Schnell, S., Kiselev, V., 2011. Global fiber reconstruction becomes practical. NeuroImage 54, 955–962. https://doi.org/10.1016/j.neuroimage.2010.09.016
Ren, W., Centeno, M.V., Berger, S., Wu, Y., Na, X., Liu, X., Kondapalli, J., Apkarian, A.V., Martina, M., Surmeier, D.J., 2015. The indirect pathway of the nucleus accumbens shell amplifies neuropathic pain. Nat. Neurosci. 19, 220–222. https://doi.org/10.1038/nn.4199
Roebroeck, A., Formisano, E., Goebel, R., 2005. Mapping directed influence over the brain using Granger causality and fMRI. NeuroImage 25, 230–242. https://doi.org/10.1016/j.neuroimage.2004.11.017
Rosazza, C., Minati, L., 2011. Resting-state brain networks: literature review and clinical applications. Neurol. Sci. 32, 773–785. https://doi.org/10.1007/s10072-011-0636-y
Roth, B.L., 2016. DREADDs for Neuroscientists. Neuron 89, 683–694. https://doi.org/10.1016/j.neuron.2016.01.040
Rubinov, M., Sporns, O., 2010. Complex network measures of brain connectivity: uses and interpretations. Neuroimage 52, 1059–1069.
Russo, S.J., Nestler, E.J., 2013. The brain reward circuitry in mood disorders. Nat. Rev. Neurosci. 14, 609–625. https://doi.org/10.1038/nrn3381
Sagheddu, C., Aroni, S., De Felice, M., Lecca, S., Luchicchi, A., Melis, M., Muntoni, A.L., Romano, R., Palazzo, E., Guida, F., Maione, S., Pistis, M., 2015. Enhanced serotonin and mesolimbic dopamine transmissions in a rat model of neuropathic pain. Neuropharmacology 97, 383–393. https://doi.org/10.1016/j.neuropharm.2015.06.003
Sankoorikal, G.M.V., Kaercher, K.A., Boon, C.J., Lee, J.K., Brodkin, E.S., 2006. A Mouse Model System for Genetic Analysis of Sociability: C57BL/6J Versus BALB/cJ Inbred Mouse Strains. Biol. Psychiatry 59, 415–423. https://doi.org/10.1016/j.biopsych.2005.07.026
Sartorius, A., Kiening, K.L., Kirsch, P., Gall, C.C. von, Haberkorn, U., Unterberg, A.W., Henn, F.A., Meyer-Lindenberg, A., 2010. Remission of Major Depression Under Deep Brain Stimulation of the Lateral Habenula in a Therapy-Refractory Patient. Biol. Psychiatry 67, e9–e11. https://doi.org/10.1016/j.biopsych.2009.08.027
Satterthwaite, T.D., Kable, J.W., Vandekar, L., Katchmar, N., Bassett, D.S., Baldassano, C.F., Ruparel, K., Elliott, M.A., Sheline, Y.I., Gur, R.C., others, 2015. Common and dissociable dysfunction of the reward system in bipolar and unipolar depression. Neuropsychopharmacology 40, 2258–2268.
Scaplen, K.M., Kaun, K.R., 2016. Reward from bugs to bipeds: a comparative approach to understanding how reward circuits function. J. Neurogenet. 30, 133–148. https://doi.org/10.1080/01677063.2016.1180385
Schmidt-Wilcke, T., 2015. Neuroimaging of chronic pain. Best Pract. Res. Clin. Rheumatol. 29, 29–41. https://doi.org/10.1016/j.berh.2015.04.030
Schmidt-Wilcke, T., Leinisch, E., Gänbauer, S., Draganski, B., Bogdahn, U., Altmeppen, J., May, A., 2006. Affective components and intensity of pain correlate with structural differences in gray matter in chronic back pain patients: Pain 125, 89–97. https://doi.org/10.1016/j.pain.2006.05.004
Schmidt-Wilcke, T., Leinisch, E., Straube, A., Kämpfe, N., Draganski, B., Diener, H.C., Bogdahn, U., May, A., 2005. Gray matter decrease in patients with chronic tension type headache. Neurology 65, 1483–1486. https://doi.org/10.1212/01.wnl.0000183067.94400.80
Schmithorst, V.J., Wilke, M., Dardzinski, B.J., Holland, S.K., 2002. Correlation of White Matter Diffusivity and Anisotropy with Age during Childhood and Adolescence: A Cross-sectional Diffusion-Tensor MR Imaging Study. Radiology 222, 212–218. https://doi.org/10.1148/radiol.2221010626
Scholz, J., Tomassini, V., Johansen-Berg, H., 2009. Chapter 11 - Individual Differences in White Matter Microstructure in the Healthy Brain, in: Johansen-Berg, H., Behrens, T.E.J. (Eds.), Diffusion MRI. Academic Press, San Diego, pp. 237–249. https://doi.org/10.1016/B978-0-12-374709-9.00011-0
Schroeter, A., Grandjean, J., Schlegel, F., Saab, B.J., Rudin, M., 2017. Contributions of structural connectivity and cerebrovascular parameters to functional magnetic resonance imaging signals in mice at rest and during sensory paw stimulation. J. Cereb. Blood Flow Metab. 37, 2368–2382. https://doi.org/10.1177/0271678X16666292

Schwartz, N., Temkin, P., Jurado, S., Lim, B.K., Heifets, B.D., Polepalli, J.S., Malenka, R.C., 2014. Decreased motivation during chronic pain requires long-term depression in the nucleus accumbens. Science 345, 535–542. https://doi.org/10.1126/science.1253994
Segarra, N., Metastasio, A., Ziauddeen, H., Spencer, J., Reinders, N.R., Dudas, R.B., Arrondo, G., Robbins, T.W., Clark, L., Fletcher, P.C., others, 2015. Abnormal Frontostriatal Activity During Unexpected Reward Receipt in Depression and Schizophrenia: Relationship to Anhedonia. Neuropsychopharmacology.
Seifert, F., Maihöfner, C., 2009. Central mechanisms of experimental and chronic neuropathic pain: Findings from functional imaging studies. Cell. Mol. Life Sci. 66, 375. https://doi.org/10.1007/s00018-008-8428-0
Sellmeijer, J., Mathis, V., Hugel, S., Li, X.-H., Song, Q., Chen, Q.-Y., Barthas, F., Lutz, P.-E., Karatas, M., Luthi, A., Veinante, P., Aertsen, A., Barrot, M., Zhuo, M., Yalcin, I., 2018. Hyperactivity of Anterior Cingulate Cortex Areas 24a/24b Drives Chronic Pain-Induced Anxiodepressive-like Consequences. J. Neurosci. 38, 3102–3115. https://doi.org/10.1523/JNEUROSCI.3195-17.2018
Seminowicz, D.A., Jiang, L., Ji, Y., Xu, S., Gullapalli, R.P., Masri, R., 2012. Thalamocortical asynchrony in conditions of spinal cord injury pain in rats. J. Neurosci. Off. J. Soc. Neurosci. 32, 15843–15848. https://doi.org/10.1523/JNEUROSCI.2927-12.2012
Seminowicz, D.A., Laferriere, A.L., Millecamps, M., Yu, J.S.C., Coderre, T.J., Bushnell, M.C., 2009. MRI structural brain changes associated with sensory and emotional function in a rat model of long-term neuropathic pain. NeuroImage, Brain Body Medicine 47, 1007–1014. https://doi.org/10.1016/j.neuroimage.2009.05.068
Sforazzini, F., Schwarz, A.J., Galbusera, A., Bifone, A., Gozzi, A., 2014. Distributed BOLD and CBV-weighted resting-state networks in the mouse brain. NeuroImage 87, 403–415. https://doi.org/10.1016/j.neuroimage.2013.09.050
Shah, D., Blockx, I., Keliris, G.A., Kara, F., Jonckers, E., Verhoye, M., Van der Linden, A., 2016a. Cholinergic and serotonergic modulations differentially affect large-scale functional networks in the mouse brain. Brain Struct. Funct. 221, 3067–3079. https://doi.org/10.1007/s00429-015-1087-7
Shah, D., Deleye, S., Verhoye, M., Staelens, S., Van der Linden, A., 2016b. Resting-state functional MRI and [18F]-FDG PET demonstrate differences in neuronal activity between commonly used mouse strains. NeuroImage 125, 571–577. https://doi.org/10.1016/j.neuroimage.2015.10.073
Shansky, R.M., 2019. Are hormones a “female problem” for animal research? Science 364, 825–826. https://doi.org/10.1126/science.aaw7570
Sheline, Y.I., Gado, M.H., Price, J.L., 1998. Amygdala core nuclei volumes are decreased in recurrent major depression. Neuroreport Int. J. Rapid Commun. Res. Neurosci. 9, 2023–2028. https://doi.org/10.1097/00001756-199806220-00021
Shelton, L., Becerra, L., Borsook, D., 2012. Unmasking the mysteries of the habenula in pain and analgesia. Prog. Neurobiol. 96, 208–219. https://doi.org/10.1016/j.pneurobio.2012.01.004
Shepherd, G.M.G., 2013. Corticostriatal connectivity and its role in disease. Nat. Rev. Neurosci. 14, 278–291. https://doi.org/10.1038/nrn3469
Simons, L.E., Elman, I., Borsook, D., 2014. Psychological processing in chronic pain: a neural systems approach. Neurosci. Biobehav. Rev. 39, 61–78. https://doi.org/10.1016/j.neubiorev.2013.12.006
Smoski, M.J., Felder, J., Bizzell, J., Green, S.R., Ernst, M., Lynch, T.R., Dichter, G.S., 2009. fMRI of alterations in reward selection, anticipation, and feedback in major depressive disorder. J. Affect. Disord. 118, 69–78. https://doi.org/10.1016/j.jad.2009.01.034
Sotres-Bayón, F., Torres-López, E., López-Ávila, A., del Ángel, R., Pellicer, F., 2001. Lesion and electrical stimulation of the ventral tegmental area modify persistent nociceptive behavior in the rat. Brain Res. 898, 342–349. https://doi.org/10.1016/S0006-8993(01)02213-2
Stafford, J.M., Jarrett, B.R., Miranda-Dominguez, O., Mills, B.D., Cain, N., Mihalas, S., Lahvis, G.P., Lattal, K.M., Mitchell, S.H., David, S.V., Fryer, J.D., Nigg, J.T., Fair, D.A., 2014. Large-scale topology and the default mode network in the mouse connectome. Proc. Natl. Acad. Sci. 111, 18745–18750. https://doi.org/10.1073/pnas.1404346111
Steiner, J., Walter, M., Gos, T., Guillemin, G.J., Bernstein, H.-G., Sarnyai, Z., Mawrin, C., Brisch, R., Bielau, H., zu Schwabedissen, L.M., Bogerts, B., Myint, A.-M., 2011. Severe depression is associated with increased microglial quinolinic acid in subregions of the anterior cingulate gyrus: Evidence for an immune-modulated glutamatergic neurotransmission? J. Neuroinflammation 8, 94. https://doi.org/10.1186/1742-2094-8-94
Stejskal, E.O., Tanner, J.E., 1965. Spin Diffusion Measurements: Spin Echoes in the Presence of a TimeDependent Field Gradient. J. Chem. Phys. 42, 288–292. https://doi.org/10.1063/1.1695690
Stouffer, S.A., Suchman, E.A., DeVinney, L.C., Star, S.A., Williams, R.M.J., 1949. Adjustment During Army Life. Princet. NJ Princet. Univ. Press.
Stoy, M., Schlagenhauf, F., Sterzer, P., Bermpohl, F., Hagele, C., Suchotzki, K., Schmack, K., Wrase, J., Ricken, R., Knutson, B., Adli, M., Bauer, M., Heinz, A., Strohle, A., 2012. Hyporeactivity of ventral striatum towards incentive stimuli in unmedicated depressed patients normalizes after treatment with escitalopram. J. Psychopharmacol. (Oxf.) 26, 677–688. https://doi.org/10.1177/0269881111416686
Sun Shu Wei, Liang Hsiao Fang, Trinkaus Kathryn, Cross Anne H., Armstrong Regina C., Song Sheng Kwei, 2006. Noninvasive detection of cuprizone induced axonal damage and demyelination in the mouse corpus callosum. Magn. Reson. Med. 55, 302–308. https://doi.org/10.1002/mrm.20774
Suzuki, T., Amata, M., Sakaue, G., Nishimura, S., Inoue, T., Shibata, M., Mashimo, T., 2007. Experimental Neuropathy in Mice Is Associated with Delayed Behavioral Changes Related to Anxiety and Depression. Anesth. Analg. 104, 1570. https://doi.org/10.1213/01.ane.0000261514.19946.66
Takata, N., Sugiura, Y., Yoshida, K., Koizumi, M., Hiroshi, N., Honda, K., Yano, R., Komaki, Y., Matsui, K., Suematsu, M., Mimura, M., Okano, H., Tanaka, K.F., n.d. Optogenetic astrocyte activation evokes BOLD fMRI response with oxygen consumption without neuronal activity modulation. Glia 0. https://doi.org/10.1002/glia.23454
Talmi, D., Dayan, P., Kiebel, S.J., Frith, C.D., Dolan, R.J., 2009. How Humans Integrate the Prospects of Pain and Reward during Choice. J. Neurosci. 29, 14617–14626. https://doi.org/10.1523/JNEUROSCI.2026-09.2009
Tanti, A., Lutz, P.-E., Kim, J., O’Leary, L., Turecki, G., Mechawar, N., 2019. Evidence of decreased gap junction coupling between astrocytes and oligodendrocytes in the anterior cingulate cortex of depressed suicides. bioRxiv 578807. https://doi.org/10.1101/578807
Taylor, A.M.W., Becker, S., Schweinhardt, P., Cahill, C., 2016. Mesolimbic dopamine signaling in acute and chronic pain: implications for motivation, analgesia, and addiction. PAIN 157, 1194. https://doi.org/10.1097/j.pain.0000000000000494
Taylor, A.M.W., Castonguay, A., Taylor, A.J., Murphy, N.P., Ghogha, A., Cook, C., Xue, L., Olmstead, M.C., De Koninck, Y., Evans, C.J., Cahill, C.M., 2015. Microglia Disrupt Mesolimbic Reward Circuitry in Chronic Pain. J. Neurosci. 35, 8442–8450. https://doi.org/10.1523/JNEUROSCI.4036-14.2015
Thompson, S.J., Bushnell, M.C., 2012. Rodent functional and anatomical imaging of pain. Neurosci. Lett. 520, 131–139. https://doi.org/10.1016/j.neulet.2012.03.015
Tuch, D.S., 2004. Q-ball imaging. Magn. Reson. Med. 52, 1358–1372. https://doi.org/10.1002/mrm.20279 Tuch, D.S., Reese, T.G., Wiegell, M.R., Makris, N., Belliveau, J.W., Wedeen, V.J., 2002. High angular resolution
diffusion imaging reveals intravoxel white matter fiber heterogeneity. Magn. Reson. Med. 48, 577–582. https://doi.org/10.1002/mrm.10268
Tustison, N.J., Avants, B.B., Cook, P.A., Yuanjie Zheng, Egan, A., Yushkevich, P.A., Gee, J.C., 2010. N4ITK: Improved N3 Bias Correction. IEEE Trans. Med. Imaging 29, 1310–1320. https://doi.org/10.1109/TMI.2010.2046908
Ubl, B., Kuehner, C., Kirsch, P., Ruttorf, M., Flor, H., Diener, C., 2015. Neural reward processing in individuals remitted from major depression. Psychol. Med. 45, 3549–3558. https://doi.org/10.1017/S0033291715001452
Upadhyay, J., Baker, S.J., Chandran, P., Miller, L., Lee, Y., Marek, G.J., Sakoglu, U., Chin, C.-L., Luo, F., Fox, G.B., Day, M., 2011. Default-mode-like network activation in awake rodents. PloS One 6, e27839. https://doi.org/10.1371/journal.pone.0027839

Uranova, N.A., Vostrikov, V.M., Orlovskaya, D.D., Rachmanova, V.I., 2004. Oligodendroglial density in the prefrontal cortex in schizophrenia and mood disorders: a study from the Stanley Neuropathology Consortium. Schizophr. Res. 67, 269–275. https://doi.org/10.1016/S0920-9964(03)00181-6
Vachon-Presseau, E., Centeno, M.V., Ren, W., Berger, S.E., Tétreault, P., Ghantous, M., Baria, A., Farmer, M., Baliki, M.N., Schnitzer, T.J., others, 2016. The emotional brain as a predictor and amplifier of chronic pain. J. Dent. Res. 95, 605–612.
van den Heuvel, M.P., Hulshoff Pol, H.E., 2010. Exploring the brain network: A review on resting-state fMRI functional connectivity. Eur. Neuropsychopharmacol. 20, 519–534. https://doi.org/10.1016/j.euroneuro.2010.03.008
Vogt, B.A., 2005. Pain and emotion interactions in subregions of the cingulate gyrus. Nat. Rev. Neurosci. 6, 533–544. https://doi.org/10.1038/nrn1704
von Hehn, C.A., Baron, R., Woolf, C.J., 2012. Deconstructing the Neuropathic Pain Phenotype to Reveal Neural Mechanisms. Neuron 73, 638–652. https://doi.org/10.1016/j.neuron.2012.02.008
Wacker, J., Dillon, D.G., Pizzagalli, D.A., 2009. The role of the nucleus accumbens and rostral anterior cingulate cortex in anhedonia: Integration of resting EEG, fMRI, and volumetric techniques. NeuroImage 46, 327–337. https://doi.org/10.1016/j.neuroimage.2009.01.058
Wahlsten, D., 1974. Heritable aspects of anomalous myelinated fibre tracts in the forebrain of the laboratory mouse. Brain Res. 68, 1–18. https://doi.org/10.1016/0006-8993(74)90530-7
Walsh, J.J., Friedman, A.K., Sun, H., Heller, E.A., Ku, S.M., Juarez, B., Burnham, V.L., Mazei-Robison, M.S., Ferguson, D., Golden, S.A., Koo, J.W., Chaudhury, D., Christoffel, D.J., Pomeranz, L., Friedman, J.M., Russo, S.J., Nestler, E.J., Han, M.-H., 2014. Stress and CRF gate neural activation of BDNF in the mesolimbic reward pathway. Nat. Neurosci. 17, 27–29. https://doi.org/10.1038/nn.3591
Wang, G.-Q., Cen, C., Li, C., Cao, S., Wang, N., Zhou, Z., Liu, X.-M., Xu, Y., Tian, N.-X., Zhang, Y., Wang, J., Wang, L.-P., Wang, Y., 2015. Deactivation of excitatory neurons in the prelimbic cortex via Cdk5 promotes pain sensation and anxiety. Nat. Commun. 6, 7660. https://doi.org/10.1038/ncomms8660
Wang, L., Hermens, D.F., Hickie, I.B., Lagopoulos, J., 2012. A systematic review of resting-state functional-MRI studies in major depression. J. Affect. Disord. 142, 6–12. https://doi.org/10.1016/j.jad.2012.04.013
Watanabe, M., Narita, Michiko, Hamada, Y., Yamashita, A., Tamura, H., Ikegami, D., Kondo, T., Shinzato, T., Shimizu, T., Fukuchi, Y., Muto, A., Okano, H., Yamanaka, A., Tawfik, V.L., Kuzumaki, N., Navratilova, E., Porreca, F., Narita, Minoru, 2018. Activation of ventral tegmental area dopaminergic neurons reverses pathological allodynia resulting from nerve injury or bone cancer. Mol. Pain 14, 1744806918756406. https://doi.org/10.1177/1744806918756406
Watson, G.D.R., Smith, J.B., Alloway, K.D., 2017. Interhemispheric connections between the infralimbic and entorhinal cortices: The endopiriform nucleus has limbic connections that parallel the sensory and motor connections of the claustrum. J. Comp. Neurol. 525, 1363–1380. https://doi.org/10.1002/cne.23981
Weible, A.P., 2013. Remembering to attend: The anterior cingulate cortex and remote memory. Behav. Brain Res. 245, 63–75. https://doi.org/10.1016/j.bbr.2013.02.010
Wingenfeld, K., Wolf, O.T., 2014. Stress, Memory, and the Hippocampus. Hippocampus Clin. Neurosci. 34, 109–120. https://doi.org/10.1159/000356423
Wu, D., Zhang, J., 2016. In vivo mapping of macroscopic neuronal projections in the mouse hippocampus using high-resolution diffusion MRI. NeuroImage 125, 84–93. https://doi.org/10.1016/j.neuroimage.2015.10.051
Wu, G.-R., Liao, W., Stramaglia, S., Ding, J.-R., Chen, H., Marinazzo, D., 2013. A blind deconvolution approach to recover effective connectivity brain networks from resting state fMRI data. Med. Image Anal. 17, 365–374. https://doi.org/10.1016/j.media.2013.01.003
Wulff, A.B., Tooley, J., Marconi, L.J., Creed, M.C., 2018. Ventral pallidal modulation of aversion processing. Brain Res. https://doi.org/10.1016/j.brainres.2018.10.010
Xu, H., Wu, L.-J., Wang, H., Zhang, X., Vadakkan, K.I., Kim, S.S., Steenland, H.W., Zhuo, M., 2008. Presynaptic and Postsynaptic Amplifications of Neuropathic Pain in the Anterior Cingulate Cortex. J. Neurosci. 28, 7445–7453. https://doi.org/10.1523/JNEUROSCI.1812-08.2008
Yalcin, I., Barthas, F., Barrot, M., 2014a. Emotional consequences of neuropathic pain: Insight from preclinical studies. Neurosci. Biobehav. Rev. 47, 154–164. https://doi.org/10.1016/j.neubiorev.2014.08.002
Yalcin, I., Bohren, Y., Waltisperger, E., Sage-Ciocca, D., Yin, J.C., Freund-Mercier, M.-J., Barrot, M., 2011. A time-dependent history of mood disorders in a murine model of neuropathic pain. Biol. Psychiatry 70, 946–953. https://doi.org/10.1016/j.biopsych.2011.07.017
Yalcin, I., Megat, S., Barthas, F., Waltisperger, E., Kremer, M., Salvat, E., Barrot, M., 2014b. The Sciatic Nerve Cuffing Model of Neuropathic Pain in Mice. J. Vis. Exp. https://doi.org/10.3791/51608
Yang, Y., Cui, Y., Sang, K., Dong, Y., Ni, Z., Ma, S., Hu, H., 2018a. Ketamine blocks bursting in the lateral habenula to rapidly relieve depression. Nature 554, 317–322. https://doi.org/10.1038/nature25509
Yang, Y., Wang, H., Hu, J., Hu, H., 2018b. Lateral habenula in the pathophysiology of depression. Curr. Opin. Neurobiol., Neurobiology of Disease 48, 90–96. https://doi.org/10.1016/j.conb.2017.10.024
Yoon, E.J., Kim, Y.K., Shin, H.I., Lee, Y., Kim, S.E., 2013. Cortical and white matter alterations in patients with neuropathic pain after spinal cord injury. Brain Res. 1540, 64–73. https://doi.org/10.1016/j.brainres.2013.10.007
Yoshida, K., Mimura, Y., Ishihara, R., Nishida, H., Komaki, Y., Minakuchi, T., Tsurugizawa, T., Mimura, M., Okano, H., Tanaka, K.F., Takata, N., 2016. Physiological effects of a habituation procedure for functional MRI in awake mice using a cryogenic radiofrequency probe. J. Neurosci. Methods 274, 38–48. https://doi.org/10.1016/j.jneumeth.2016.09.013
Zerbi, V., Grandjean, J., Rudin, M., Wenderoth, N., 2015. Mapping the mouse brain with rs-fMRI: An optimized pipeline for functional network identification. NeuroImage 123, 11–21. https://doi.org/10.1016/j.neuroimage.2015.07.090
Zhang, H., Qian, Y.-L., Li, C., Liu, D., Wang, L., Wang, X.-Y., Liu, M.-J., Liu, H., Zhang, S., Guo, X.-Y., Yang, J.-X., Ding, H.-L., Koo, J.W., Mouzon, E., Deisseroth, K., Nestler, E.J., Zachariou, V., Han, M.-H., Cao, J.-L., 2017. Brain-Derived Neurotrophic Factor in the Mesolimbic Reward Circuitry Mediates Nociception in Chronic Neuropathic Pain. Biol. Psychiatry 82, 608–618. https://doi.org/10.1016/j.biopsych.2017.02.1180
Zhang, X., Li, Q., Wong, N., Zhang, M., Wang, W., Bu, B., McAlonan, G.M., 2015. Behaviour and prefrontal protein differences in C57BL/6N and 129 X1/SvJ mice. Brain Res. Bull. 116, 16–24. https://doi.org/10.1016/j.brainresbull.2015.05.003
Zhang, Z., Gadotti, V.M., Chen, L., Souza, I.A., Stemkowski, P.L., Zamponi, G.W., 2015. Role of Prelimbic GABAergic Circuits in Sensory and Emotional Aspects of Neuropathic Pain. Cell Rep. 12, 752–759. https://doi.org/10.1016/j.celrep.2015.07.001
Zhou, I.Y., Liang, Y.-X., Chan, R.W., Gao, P.P., Cheng, J.S., Hu, Y., So, K.-F., Wu, E.X., 2014. Brain resting-state functional MRI connectivity: Morphological foundation and plasticity. NeuroImage 84, 1–10. https://doi.org/10.1016/j.neuroimage.2013.08.037
Zhou, Y., Yu, C., Zheng, H., Liu, Y., Song, M., Qin, W., Li, K., Jiang, T., 2010. Increased neural resources recruitment in the intrinsic organization in major depression. J. Affect. Disord. 121, 220–230. https://doi.org/10.1016/j.jad.2009.05.029
Zhu, X., Wang, X., Xiao, J., Liao, J., Zhong, M., Wang, W., Yao, S., 2012. Evidence of a Dissociation Pattern in Resting-State Default Mode Network Connectivity in First-Episode, Treatment-Naive Major Depression Patients. Biol. Psychiatry 71, 611–617. https://doi.org/10.1016/j.biopsych.2011.10.035
Zhuo, M., 2013. Long-term potentiation in the anterior cingulate cortex and chronic pain. Philos. Trans. R. Soc. B Biol. Sci. 369, 20130146–20130146. https://doi.org/10.1098/rstb.2013.0146
Zhuo, M., Wu, G., Wu, L.-J., 2011. Neuronal and microglial mechanisms of neuropathic pain. Mol. Brain 4, 31. https://doi.org/10.1186/1756-6606-4-31
Zingg, B., Hintiryan, H., Gou, L., Song, M.Y., Bay, M., Bienkowski, M.S., Foster, N.N., Yamashita, S., Bowman, I., Toga, A.W., Dong, H.-W., 2014. Neural Networks of the Mouse Neocortex. Cell 156, 1096–1111. https://doi.org/10.1016/j.cell.2014.02.023

7 Annex 7.1 Published Manuscripts
1. Cingulate Overexpression of Mitogen-Activated Protein Kinase Phosphatase-1 as Key Factor for Depression.
2. Hyperactivity of Anterior Cingulate Cortex Areas 24a/24b Drives Chronic Pain-Induced Anxiodepressive-like Consequences.
3. Correction of cognitive deficits in mouse models of Down syndrome by a pharmacological inhibitor of DYRK1A.
4. Common functional networks in the mouse brain revealed by multi-centre resting-state fMRI analysis.
Archival Report
Cingulate Overexpression of Mitogen-ActivatedProtein Kinase Phosphatase-1 as a Key Factorfor DepressionFlorent Barthas, Muris Humo, Ralf Gilsbach, Elisabeth Waltisperger, Meltem Karatas,Samuel Leman, Lutz Hein, Catherine Belzung, Anne-Laurence Boutillier, Michel Barrot, andIpek Yalcin
ABSTRACTBACKGROUND: Depression is frequently associated with chronic pain or chronic stress. Among cortical areas, theanterior cingulate cortex (ACC, areas 24a and 24b) appears to be important for mood disorders and constitutes aneuroanatomical substrate for investigating the underlying molecular mechanisms. The current work aimed atidentifying ACC molecular factors subserving depression.METHODS: Anxiodepressive-like behaviors in C57BL/6J male mice were induced by neuropathic pain, unpredict-able chronic mild stress, and optogenetic ACC stimulation and were evaluated using novelty suppressed feeding,splash, and forced swim tests. ACC molecular changes in chronic pain–induced depression were uncovered throughwhole-genome expression analysis. Further mechanistic insights were provided by chromatin immunoprecipitation,Western blot, and immunostaining. The causal link between molecular changes and depression was studied usingknockout, pharmacological antagonism, and local viral-mediated gene knockdown.RESULTS: Under chronic pain–induced depression, gene expression changes in the ACC highlighted the over-expression of a regulator of the mitogen-activated protein kinase pathway, mitogen-activated protein kinasephosphatase-1 (MKP-1). This upregulation is associated with the presence of transcriptionally active chromatinmarks (acetylation) at its proximal promoter region as well as increased cyclic adenosine monophosphate responseelement–mediated transcriptional activity and phosphorylation of cyclic adenosine monophosphate responseelement binding protein and activating transcription factor. MKP-1 overexpression is also observed withunpredictable chronic mild stress and repeated ACC optogenetic stimulation and is reversed by fluoxetine. Aknockout, an antagonist, or a local silencing of MKP-1 attenuates depressive-like behaviors, pointing to an importantrole of this phosphatase in depression.CONCLUSIONS: These data point to ACC MKP-1 as a key factor in the pathophysiology of depression and apotential target for treatment development.
Keywords: Anterior cingulate cortex, Chronic pain, Chronic stress, Depression, MAPK, MKP-1
http://dx.doi.org/10.1016/j.biopsych.2017.01.019
Besides chronic stress (1), chronic pain is also clinically associatedwith the development of mood disorders (2). Epidemiologicalstudies report a mean prevalence rate of around 50% for majordepressive disorder in patients with chronic pain (3). Preclinicalresearch further revealed that the anxiodepressive consequencesof chronic pain can be studied in murine models (4,5) andhighlighted the time dependency of these affective phenotypes(6). These models now offer a reliable tool to explore originalmechanisms leading to depression.
A conceptualized view of depression relates this pathologyto specific structural and functional changes in the brainneurocircuitry. Among the candidate regions, the anteriorcingulate cortex (ACC) appears to be critical because it isknown to display functional and morphological alterations indepressed patients (7) such as decreased connectivity to the
amygdala (8), altered glucose metabolism (9), and reducedgray matter volume (10). Preclinical studies also showedfunctional and morphological alterations in the ACC followingchronic stress exposure (11,12). Recently, we reported that theoptogenetic activation of pyramidal neurons within the ACC issufficient to induce anxiety and depressive-like behaviors innaïve animals (13). Furthermore, the lesion of the ACCprevents chronic pain–induced depressive-like behaviors andthe aversiveness of spontaneous pain without affecting thesensory mechanical sensitivity (13). Thus, the ACC is a criticalhub for mood disorders, including anxiodepressive conse-quences observed in chronic pain, and for studying theirunderlying molecular aspects.
In this context, open approaches such as genome-widestudies can be powerful to identify molecular blueprints of
370 & 2017 Society of Biological Psychiatry.Biological Psychiatry September 1, 2017; 82:370–379 www.sobp.org/journal ISSN: 0006-3223
BiologicalPsychiatry
SEE COMMENTARY ON PAGE e33
depression. Here, we first performed a whole microarrayanalysis within the ACC in both sham and sciatic nerve–injuredanimals. Based on this genome expression analysis, the currentstudy then focused on one critical regulator of the mitogen-activated protein kinase (MAPK) pathway, MAPK phosphatase-1(MKP-1), in chronic pain–induced depression. Namely, our micro-array results indicate that Mkp-1 is significantly upregulated in theACC of sciatic nerve–injured animals. Reports of MKP-1 over-expression in the hippocampus of stressed animals (14,15), aswell as in patients with major depressive disorder (14), supportedour interest to further investigate MKP-1 in chronic pain and mooddisorder comorbidity.
MKP-1, also known as dual specificity phosphatase 1, isthe main negative regulator of the MAPK signaling cascade(14,16). Cell culture studies showed that the expression ofMKP-1 can be induced by a wide variety of extracellularfactors such as growth factors, lipopolysaccharides, heatshock, and hydrogen peroxide (17). Studies focusing on themechanisms of MKP-1 expression suggest that its transcrip-tion can be preceded by chromatin remodeling at the pro-moter region. External stressors (e.g., arsenite or ultraviolet C)can initiate phosphorylation and acetylation of histone H3 atthe Mkp-1 promoter region (17) and/or activate several tran-scription factors such as cyclic adenosine monophosphateresponse element binding protein (CREB), activating tran-scription factors 1 and 2 (ATF1 and -2), and activator protein1 (18,19), which leads to the induction of Mkp-1.
These data raise questions about whether ACC MKP-1 is akey factor in depression pathophysiology, particularly forchronic pain–induced depression. Thus, using animal models,we studied the link between MKP-1 and anxiodepressive-likebehaviors, identified molecular upstream mechanisms leadingto its increased expression in the ACC, and tested thetherapeutic potential of targeting this phosphatase. We showthat neuropathic pain (NP)–induced depressive-like behaviorsare associated with an increase in c-Fos expression, anincrease in phosphorylated CREB and phosphorylated ATFlevels in the ACC, and increased histone H3 lysine 9/lysine 14(H3K9/K14) acetylation at the promoter regions of C-fos andMkp-1. We further demonstrate that ACC MKP-1 overexpres-sion is present in several animal models of depression,suggesting a general link between depression and increasedlevel of ACC MKP-1. We also show that chronic treatment witha classical antidepressant drug, fluoxetine, suppresses theincrease in MKP-1 levels within the ACC. Moreover, knockingout, antagonizing, or locally silencing its presence in the ACCattenuates depressive-like behaviors induced by NP, pointingto an essential role of MKP-1.
METHODS AND MATERIALS
Animals
Approximately 350 adult male C57BL/6J mice (Charles River,L’Arbresle, France) were used in all experiments. For theoptogenetic experiments, we used Thy1-ChR2-YFP mice(13,20). The cyclic adenosine monophosphate response ele-ment (CRE)–related activity was examined by using CRE-LacZmice (21) (see Supplement). Protocols were approved bythe local ethical committee of the University of Strasbourg
(No. 2015012909428166) and Comité d’expérimentation ani-male du Val de Loire (No. 19).
Surgical Procedures
All surgical procedures were done under general anesthesia(ketamine/xylazine, 68/10 mg/kg, intraperitoneally; Centra-vet, Taden, France). Viral transfection and optogeneticprocedures used standard in vivo stereotaxic procedures,and coordinates for the ACC (areas 24a and 24b) were0.7 mm anterior and 0.3 lateral to the bregma, based on theMouse Brain Atlas (22).
NP Model and Nociceptive Testing
Chronic NP was induced by placing a polyethylene cuffaround the right common sciatic nerve of the animal (23).The control group (sham) underwent the same procedurewithout cuff implantation. The mechanical sensitivity wasscored using von Frey filaments (Bioseb, Vitrolles, France)(see Supplement).
Unpredictable Chronic Mild Stress Model
Mice were subjected to a variety of stressors several times aday/night for 8 weeks, including altered cage and bedding,altered light/dark cycle, cage tilting (451), and predator smellexposure (24,25). At the end of 8 weeks, the noveltysuppressed feeding (NSF) test was performed and the ACCwas harvested for protein analyses (see Supplement andSupplemental Table S3).
Anxiodepressive-Related Behaviors
Behavioral phenotyping was performed by using the NSF,splash, and forced swim tests (FST) (see Supplement).
Optogenetic
Independent sets of Thy1-ChR2-YFP mice implanted withoptic fibers were tested either 5 minutes and 1 day after asingle stimulation or 1 day and 2 weeks after four consecutive(30 min/day) stimulations. Animals were stimulated with a bluelight–emitting diode (peak wavelength: 460 nm; intensity: 4–6mW) (see Supplement).
Viral-Mediated Gene Knockdown
Three weeks after sciatic nerve surgery, NP- or sham-operated animals received either lentiviral vectors expressinga set of Mkp-1 small interfering RNA (siRNA)/short hairpinRNA/RNA-mediated interference and green fluorescent proteinunder the cytomegalovirus promoter (Applied Biological Mate-rials, Richmond, BC, Canada) or a scrambled version of thevirus, bilaterally (2 mL/site) into the ACC. Four weeks aftertransfection, behavioral tests were conducted on threegroups: 1) sham-operated (control for NP) mice that expresssiRNA (sham/siRNA), 2) mice displaying NP-induced anxiode-pressive-like behaviors administered with scramble virus (NP/control), and 3) mice displaying NP-induced anxiodepressive-like behaviors expressing siRNA (NP/siRNA). In a separateexperiment, the impact of local deletion of ACC MKP-1 wasassessed in naïve animals. Details are shown in the Supplement.
MAPK Phosphatase-1 in Depression
Biological Psychiatry September 1, 2017; 82:370–379 www.sobp.org/journal 371
BiologicalPsychiatry
Pharmacological Agents
The selective serotonin reuptake inhibitor fluoxetine (20 mg/kg/day) mixed with 0.2% saccharine was administered in drinkingwater for 3 weeks (starting 5 weeks after the sciatic nerve injury),while the control group drank 0.2% saccharine. The MKPantagonist dusp-(E)-2-benzylidene-3-(cyclohexylamino)-2,3-dihy-dro-1H-inden-1-one (BCI) dissolved in 2% dimethyl sulfoxidewas administered systemically (10 mg/kg, intraperitoneally, twicea day) for 4 days, followed by a behavioral test 1 hour after the lastinjection. Control animals received 2% dimethyl sulfoxide. Alldrugs were purchased from Sigma-Aldrich (Saint-Quentin-Fallav-ier, France) (see Supplement).
Tissue Harvesting and Analysis
For genomic analysis, chromatin immunoprecipitation (26),and Western blot, all animals were killed by cervical disloca-tion and the ACC, primary somatosensory cortex, and wholehippocampus were harvested and stored at 2801C. Fordetailed procedures of the microarray analysis, chromatinimmunoprecipitation, Western blot, and immunostaining, seethe Supplement.
Statistical Analysis
Results are expressed as mean 6 SEM. Statistical analyseswere performed with Statistica 7.1 (StatSoft, Tulsa, OK) byusing unpaired Student’s t tests or multifactor analysis ofvariance with independent or repeated measures and Duncanpost hoc analyses. Immunoblotting experiments wereanalyzed with the nonparametric Kruskal-Wallis test, followedby multiple comparisons with the Wilcoxon or Mann-WhitneyU test when data did not fit with the rules of parametricanalyses. The significance level was set at p # .05. Fordetailed information, see Supplemental Table S4.
RESULTS
Mkp-1 Messenger RNA and Protein Levels Increasein the ACC of NP Mice Displaying Depressive-likeBehaviors
To characterize molecular changes within the ACC, we con-ducted a whole-genome expression analysis in NP-induceddepressed-like animals. The ACC tissues were collected at 8weeks after sciatic nerve surgery, which corresponds to thepresence of both nociceptive and anxiodepressive-like phe-notypes, as illustrated by decreased mechanical thresholds inthe von Frey test (Figure 1A; F7,70 5 6.04, p # .001; post hoc:weeks 1–7, p # .001) and increased latency to feed in the NSFtest (Figure 1B; p # .01), respectively. At this time point, nochange in food intake or in spontaneous locomotor activitywas present in NP mice (Supplemental Figure S1A). Themicroarray data revealed several changes in gene expressionwithin the ACC (Figure 1C and Supplemental Table S1). AKyoto Encyclopedia of Genes and Genomes signaling path-way analysis from WebGestalt highlighted a major alteration inthe MAPK pathway (Figure 1D; p 5 1.40e-06), in particularconcerning its negative regulator Mkp-1, whose expressionwas robustly upregulated in the ACC of animals displayinganxiodepressive-like behaviors (1.7-fold) (Figure 1E; p # .01).
This finding was then confirmed by Western blot analysis,showing that the increase was also present at protein level inNP mice within the ACC (Figure 1F; p # .001; see alsoSupplemental Figure S1B) but not in the primary somatosen-sory cortex and whole hippocampus (Supplemental Figure S2).Interestingly, microarray data showed that Mkp-1 was alreadyupregulated at the messenger RNA (mRNA) level 2 weeks aftersciatic nerve surgery in animals displaying nociceptive hyper-sensitivity but not yet detectable anxiodepressive-like behav-iors (Supplemental Figure S3A; p # .001; see alsoSupplemental Table S2). However, this upregulation was notsignificant at the protein level at this 2-week early time point(Supplemental Figure S3B), but it slightly increased at 5 weekspostsurgery (Supplemental Figure S3C; p 5 .10), when animalsdisplayed anxiety-like behavior (6) in the light/dark box(Supplemental Figure S3C; p # .001).
NP-Induced Depressive-like Behaviors AreAssociated With Transcription Factors’ Recruitment
To identify potential upstream factors responsible for Mkp-1overexpression, we looked at the involvement of relevant tran-scription factors within the genomic data. Based on transcriptionfactor target analyses from WebGestalt, we focused on CREB(Figure 2A; p 5 2.55e-08) and ATF-1 (Figure 2A; p 5 4.76e-12) aswell as on Fos proteins (Figure 2A; p5 5.02e-10, serum responsefactor) that displayed significant changes in the microarray data(for C-fos and Fosb: 1.94- and 1.47-fold increases in NP animals,respectively). CREB and ATF are known to bind CREs at theMkp-1 promoter region (27), and functional activator protein1 binding sites are also present within this promoter region (18).
Western blot analyses confirmed that both phosphorylatedforms of CREB (Figure 2B; p # .05) and ATF-1 (Figure 2B;p# .01) increased in the ACC of NP animals. To have a functionalassessment of CREB/ATF activity, we used CRE-LacZ transgenicreporter mice. By using a line of CRE-LacZ mice displaying veryhigh basal reporter activity in the cortex, we previously reported noalteration in ACC CRE-mediated transcription (6). However, thiscould have been related to a ceiling effect preventing effectivedetection of increased activity in this brain region. Thus, here weused another CRE-LacZ line with lower basal reporter activity. Inthis line, β-galactosidase immunostaining showed a significantincrease in the presence of CRE-positive cells in the ACC of NPanimals (Figure 2C, D; F16,48 5 3.98, p, .001; post hoc:20.47 to11.41 from the bregma; p # .05) but not in the prelimbic (A32)and infralimbic cortices (Supplemental Figure S4). Because Fosexpression was upregulated by NP in our microarray analysis(Figure 1C and Supplemental Table S1; p , .05), we alsoconfirmed increased c-Fos protein levels in the ACC of NPanimals (Figure 2E, F; F14,48 5 5.75, p , .001; post hoc: 20.47to 11.33 from the bregma; p # .001). This alteration wasalso observed in the rostal part of the infralimbic cortex (A25)(F1,5 5 2.47, p , .05; Supplemental Figure S4) but not in theprelimbic cortex.
NP-Induced Depressive-like Behaviors AreAssociated With Epigenetic Changes at Mkp-1 andC-fos Promoters in the ACC
As immediate early genes, it is intriguing that C-fos andMkp-1 arestill present at high levels in the ACC 8 weeks after NP induction,
MAPK Phosphatase-1 in Depression
372 Biological Psychiatry September 1, 2017; 82:370–379 www.sobp.org/journal
BiologicalPsychiatry
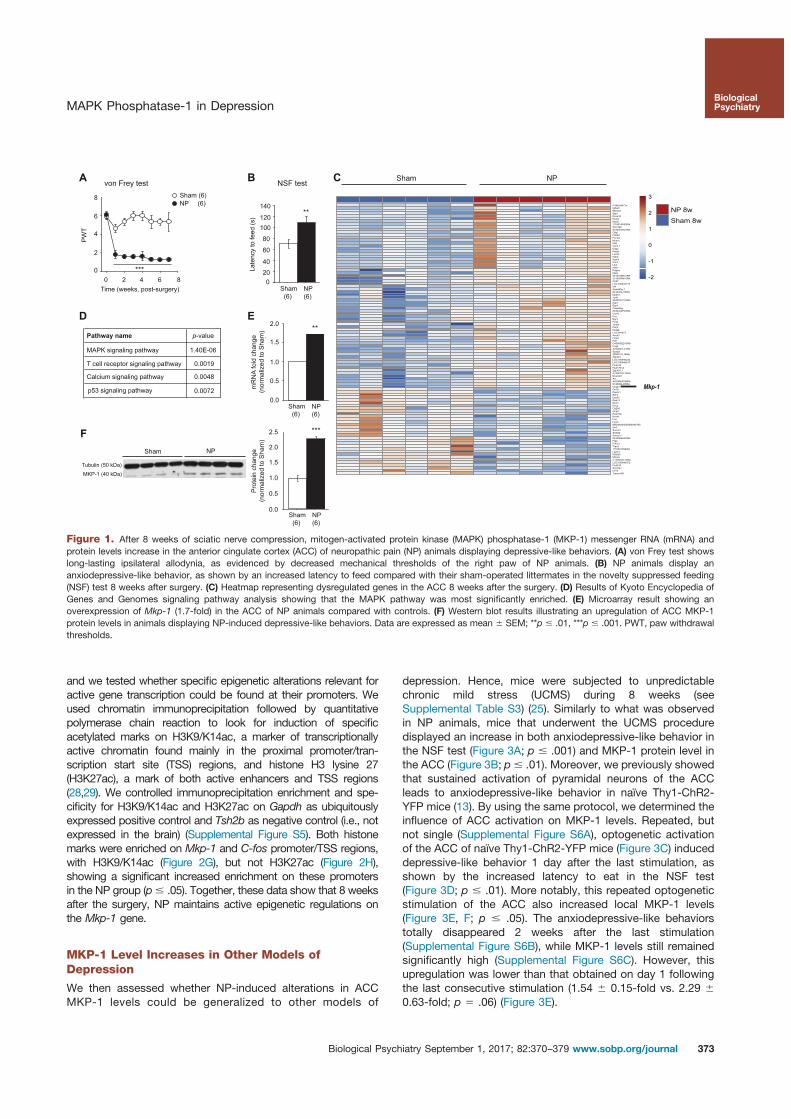
and we tested whether specific epigenetic alterations relevant foractive gene transcription could be found at their promoters. Weused chromatin immunoprecipitation followed by quantitativepolymerase chain reaction to look for induction of specificacetylated marks on H3K9/K14ac, a marker of transcriptionallyactive chromatin found mainly in the proximal promoter/tran-scription start site (TSS) regions, and histone H3 lysine 27(H3K27ac), a mark of both active enhancers and TSS regions(28,29). We controlled immunoprecipitation enrichment and spe-cificity for H3K9/K14ac and H3K27ac on Gapdh as ubiquitouslyexpressed positive control and Tsh2b as negative control (i.e., notexpressed in the brain) (Supplemental Figure S5). Both histonemarks were enriched on Mkp-1 and C-fos promoter/TSS regions,with H3K9/K14ac (Figure 2G), but not H3K27ac (Figure 2H),showing a significant increased enrichment on these promotersin the NP group (p# .05). Together, these data show that 8 weeksafter the surgery, NP maintains active epigenetic regulations onthe Mkp-1 gene.
MKP-1 Level Increases in Other Models ofDepression
We then assessed whether NP-induced alterations in ACCMKP-1 levels could be generalized to other models of
depression. Hence, mice were subjected to unpredictablechronic mild stress (UCMS) during 8 weeks (seeSupplemental Table S3) (25). Similarly to what was observedin NP animals, mice that underwent the UCMS proceduredisplayed an increase in both anxiodepressive-like behavior inthe NSF test (Figure 3A; p # .001) and MKP-1 protein level inthe ACC (Figure 3B; p # .01). Moreover, we previously showedthat sustained activation of pyramidal neurons of the ACCleads to anxiodepressive-like behavior in naïve Thy1-ChR2-YFP mice (13). By using the same protocol, we determined theinfluence of ACC activation on MKP-1 levels. Repeated, butnot single (Supplemental Figure S6A), optogenetic activationof the ACC of naïve Thy1-ChR2-YFP mice (Figure 3C) induceddepressive-like behavior 1 day after the last stimulation, asshown by the increased latency to eat in the NSF test(Figure 3D; p # .01). More notably, this repeated optogeneticstimulation of the ACC also increased local MKP-1 levels(Figure 3E, F; p # .05). The anxiodepressive-like behaviorstotally disappeared 2 weeks after the last stimulation(Supplemental Figure S6B), while MKP-1 levels still remainedsignificantly high (Supplemental Figure S6C). However, thisupregulation was lower than that obtained on day 1 followingthe last consecutive stimulation (1.54 6 0.15-fold vs. 2.29 6
0.63-fold; p 5 .06) (Figure 3E).
Figure 1. After 8 weeks of sciatic nerve compression, mitogen-activated protein kinase (MAPK) phosphatase-1 (MKP-1) messenger RNA (mRNA) andprotein levels increase in the anterior cingulate cortex (ACC) of neuropathic pain (NP) animals displaying depressive-like behaviors. (A) von Frey test showslong-lasting ipsilateral allodynia, as evidenced by decreased mechanical thresholds of the right paw of NP animals. (B) NP animals display ananxiodepressive-like behavior, as shown by an increased latency to feed compared with their sham-operated littermates in the novelty suppressed feeding(NSF) test 8 weeks after surgery. (C) Heatmap representing dysregulated genes in the ACC 8 weeks after the surgery. (D) Results of Kyoto Encyclopedia ofGenes and Genomes signaling pathway analysis showing that the MAPK pathway was most significantly enriched. (E) Microarray result showing anoverexpression of Mkp-1 (1.7-fold) in the ACC of NP animals compared with controls. (F) Western blot results illustrating an upregulation of ACC MKP-1protein levels in animals displaying NP-induced depressive-like behaviors. Data are expressed as mean 6 SEM; **p # .01, ***p # .001. PWT, paw withdrawalthresholds.
MAPK Phosphatase-1 in Depression
Biological Psychiatry September 1, 2017; 82:370–379 www.sobp.org/journal 373
BiologicalPsychiatry
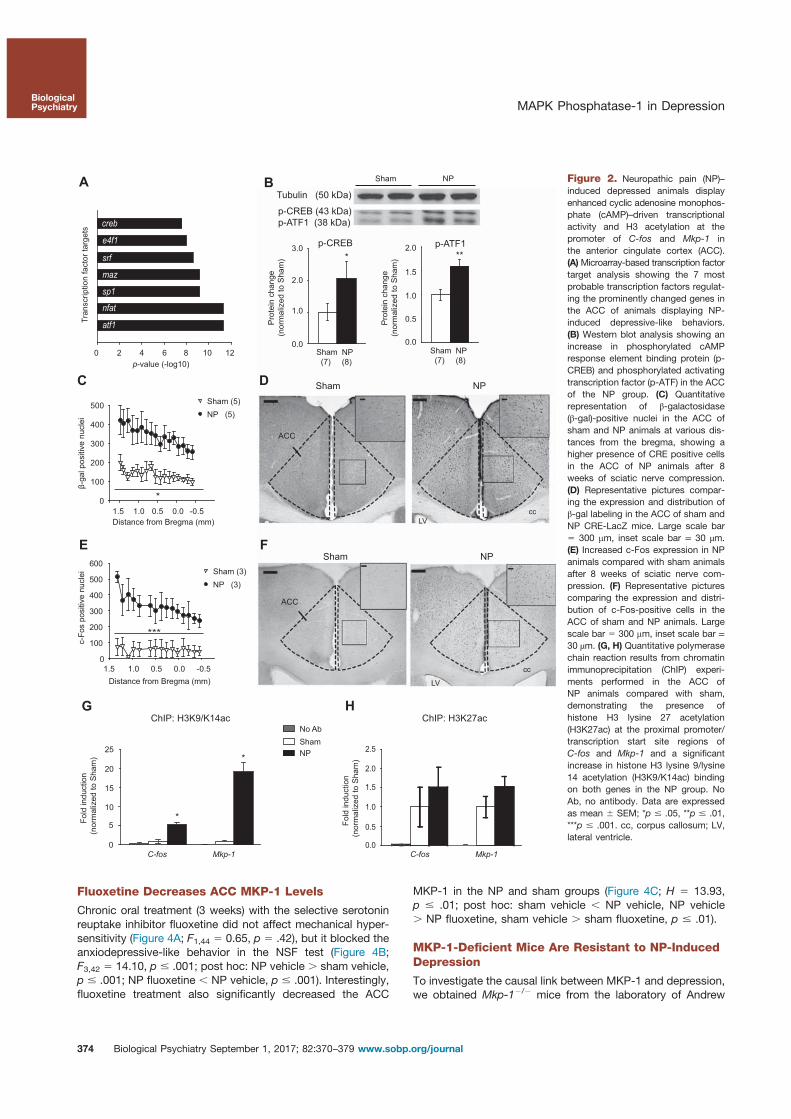
Fluoxetine Decreases ACC MKP-1 Levels
Chronic oral treatment (3 weeks) with the selective serotoninreuptake inhibitor fluoxetine did not affect mechanical hyper-sensitivity (Figure 4A; F1,44 5 0.65, p 5 .42), but it blocked theanxiodepressive-like behavior in the NSF test (Figure 4B;F3,42 5 14.10, p # .001; post hoc: NP vehicle . sham vehicle,p # .001; NP fluoxetine , NP vehicle, p # .001). Interestingly,fluoxetine treatment also significantly decreased the ACC
MKP-1 in the NP and sham groups (Figure 4C; H 5 13.93,p # .01; post hoc: sham vehicle , NP vehicle, NP vehicle. NP fluoxetine, sham vehicle . sham fluoxetine, p # .01).
MKP-1-Deficient Mice Are Resistant to NP-InducedDepression
To investigate the causal link between MKP-1 and depression,we obtained Mkp-12/2 mice from the laboratory of Andrew
Figure 2. Neuropathic pain (NP)–induced depressed animals displayenhanced cyclic adenosine monophos-phate (cAMP)–driven transcriptionalactivity and H3 acetylation at thepromoter of C-fos and Mkp-1 inthe anterior cingulate cortex (ACC).(A)Microarray-based transcription factortarget analysis showing the 7 mostprobable transcription factors regulat-ing the prominently changed genes inthe ACC of animals displaying NP-induced depressive-like behaviors.(B) Western blot analysis showing anincrease in phosphorylated cAMPresponse element binding protein (p-CREB) and phosphorylated activatingtranscription factor (p-ATF) in the ACCof the NP group. (C) Quantitativerepresentation of β-galactosidase(β-gal)-positive nuclei in the ACC ofsham and NP animals at various dis-tances from the bregma, showing ahigher presence of CRE positive cellsin the ACC of NP animals after 8weeks of sciatic nerve compression.(D) Representative pictures compar-ing the expression and distribution ofβ-gal labeling in the ACC of sham andNP CRE-LacZ mice. Large scale bar5 300 mm, inset scale bar = 30 μm.(E) Increased c-Fos expression in NPanimals compared with sham animalsafter 8 weeks of sciatic nerve com-pression. (F) Representative picturescomparing the expression and distri-bution of c-Fos-positive cells in theACC of sham and NP animals. Largescale bar 5 300 mm, inset scale bar =30 μm. (G, H) Quantitative polymerasechain reaction results from chromatinimmunoprecipitation (ChIP) experi-ments performed in the ACC ofNP animals compared with sham,demonstrating the presence ofhistone H3 lysine 27 acetylation(H3K27ac) at the proximal promoter/transcription start site regions ofC-fos and Mkp-1 and a significantincrease in histone H3 lysine 9/lysine14 acetylation (H3K9/K14ac) bindingon both genes in the NP group. NoAb, no antibody. Data are expressedas mean 6 SEM; *p # .05, **p # .01,***p # .001. cc, corpus callosum; LV,lateral ventricle.
0.0
0.5
1.0
1.5
2.0
2.5
ATF1
NFAT
SRF
SP1
MAZ
E4F1
CREBcreb
e4f1
srf
maz
sp1
nfat
atf1
A B
Tran
scrip
tion
fact
or ta
rget
s
0 2 4 6 8 10 12p-value (-log10)
β-ga
l pos
itive
nuc
lei
C D
E
G H
Distance from Bregma (mm)
Sham (5)NP (5)
3.0
2.0
1.0
0.0Sham (7)
NP (8)
P
rote
in c
hang
e(n
orm
aliz
ed to
Sha
m)
p-CREB
1.5
1.0
0.5
0.0
2.0
P
rote
in c
hang
e(n
orm
aliz
ed to
Sha
m)
Sham (7)
NP (8)
p-ATF1
25
20
15
10
5
0
F
old
indu
ctio
n(n
orm
aliz
ed to
Sha
m)
C-fos Mkp-1
ShamNP
No Ab
F
old
indu
ctio
n(n
orm
aliz
ed to
Sha
m)
***
*
*
*-0.50.00.51.01.5
0
100
200
300
400
500
0
100
200
300
400
500
600
1.5 1.0 0.5 0.0 -0.5Distance from Bregma (mm)
c-Fo
s po
sitiv
e nu
clei Sham (3)
NP (3)
Sham NP
cc
ACC
LV
***
F
Tubulin (50 kDa)
p-CREB (43 kDa)p-ATF1 (38 kDa)
Sham NP
C-fos Mkp-1
ChIP: H3K9/K14ac ChIP: H3K27ac
Sham
ccLV
NP
ACC
MAPK Phosphatase-1 in Depression
374 Biological Psychiatry September 1, 2017; 82:370–379 www.sobp.org/journal
BiologicalPsychiatry

Cato (30) and bred them in our animal facilities. We charac-terized the nociceptive sensitivity and anxiodepressive-likebehavior in Mkp-12/2 and Mkp-11/1 animals before and afterNP induction. It is important to note that we did not observeany alteration in the mechanical paw withdrawal thresholds inMkp-12/2 mice compared with Mkp-11/1 mice before surgery
(Figure 5A; F1,43 5 3.33, p . .05). After surgery, NP animalsdeveloped mechanical allodynia regardless of their geneticbackground (Figure 5B; F3,123 5 50.25, p # .001), showingthat the loss of MKP-1 expression did not modify the NPsomatosensory component. However, by using the NSF andsplash tests, we showed that Mkp-12/2 mice did not displaythe anxiodepressive-like behaviors normally induced by NP.Indeed, the loss of MKP-1 suppressed the NP-inducedincreased latency to feed in the NSF test (Figure 5C; F1,415 4.09, p # .05, sham , NP in Mkp-11/1, sham 5 NP inMkp-12/2). Similarly, Mkp-12/2 NP animals did not displaydecreased grooming behavior in the splash test (Figure 5D;F1,41 5 12.60, p # .001, sham , NP in Mkp-11/1, sham 5 NPMkp-12/2). Interestingly, Mkp-1 deficiency had no effectper se on behavioral tests in sham Mkp-12/2 mice(Figure 5C, D).
BCI, an MKP Antagonist, Reduces NP-InducedDepressive-like Behavior
Beyond constitutive depletion of MKP-1, we assessedwhether a reversible pharmacological blockade of this phos-phatase could also lead to antidepressant-like effects bytesting a systemic subchronic treatment (4 days, intraperito-neally) with MKP-1/6 antagonist BCI (31). Before treatment,NP animals showed an increased latency to feed in the NSFtest (Figure 5E; F1,20 5 10.34, p # .001; post hoc: NP . sham,p # .001), thereby confirming the presence of ananxiodepressive-like state. Subsequent BCI treatmentincreased the grooming time of NP animals in the splash test(Figure 5E; F1,19 5 3.72, p # .05; post hoc: NP saline , NPBCI, p # .01) without affecting their mechanical sensitivitythreshold (Figure 5F; F2,23 5 92.2, p # .001; post hoc: NP BCIright , sham right, p # .001; NP saline right , sham right,p # .001).
Local Suppression of MKP-1 Within the ACC BlocksNP-Induced Depression
While constitutive MKP-1 depletion and pharmacologicalantagonism brought information for evaluating the linkbetween MKP-1 and depression, they lack neuroanatomicalselectivity. Thus, we performed a local viral-mediated manip-ulation (Figure 5G) of Mkp-1 to identify its role in the ACC.
ACC
cc
180
140
100
60
20
Control (7)
UCMS (9)
Late
ncy
to fe
ed (s
)
NSF test
***
Tubulin (50 kDa)
MKP-1 (40 kDa)
A
UCMSControl
B
Control (7)
UCMS (9)
P
rote
in c
hang
e(n
orm
aliz
ed to
Con
trol)
2.0
1.5
0.5
0.0
1.0
**
Thy-1-ChR2-YFPC
NSF test
180
140
100
60
20
Late
ncy
to fe
ed (s
)
Control (7)
Stimulated (5)
D
P
rote
in c
hang
e(n
orm
aliz
ed to
Con
trol)
*
2.0
1.5
0.5
0.0
1.0
2.5
Control (7)
Stimulated (5)
E
Tubulin (50 kDa)
MKP-1 (40 kDa)
StimulatedControlF
40 ms
1 s8 s 2 s
30 min
8 s2 s
**
Figure 3. Anterior cingulate cortex (ACC) mitogen-activated proteinkinase phosphatase-1 (MKP-1) levels increase in other models of depres-sion. (A) Novelty suppressed feeding (NSF) test performed after unpredict-able chronic mild stress (UCMS) procedure illustrating an anxiodepress-ive-like behavior in stressed animals compared with nonstressed animals,as shown by an increased latency to feed. (B) Western blot analysisshowing increased levels of ACC MKP-1 in stressed animals compared withnonstressed animals. (C) Representative picture of the ACC in the Thy-1-ChR2-YFP mice (top) and a scheme of the stimulation protocol used (20 Hz;4 days; 30 min/day; 8 seconds stimulation; 40-ms pulses; 2 seconds nostimulation) (bottom). Scale bar 5 300 mm. (D) NSF test at day 5 after ACCstimulation showing that stimulated animals display an anxiodepressive-likebehavior, as shown by an increased latency to feed. (E, F) Western blotresults illustrating an upregulation of ACC MKP-1 in stimulated animalscompared with controls. Data are expressed as mean 6 SEM; *p # .05,**p # .01, ***p # .001. cc, corpus callosum.
Figure 4. Prolonged fluoxetinetreatment blocks anterior cingulatecortex (ACC) mitogen-activated pro-tein kinase phosphatase-1 (MKP-1)upregulation. (A) von Frey results forthe right hind paw showing that fluox-etine treatment (3 weeks) did notaffect the development of allodyniaafter neuropathy induction. (B)Novelty suppressed feeding (NSF)test results illustrating that fluoxetinetreatment decreases the anxiodepres-sive-like behavior in neuropathic pain(NP) animals, as shown by a loweredlatency to feed. (C) Western blotresults demonstrating a decrease in
MKP-1 in the ACC of both sham and NP animals after fluoxetine treatment. Data are expressed as mean 6 SEM; **p # .01, ***p , .001. PWT, paw withdrawalthresholds.
(10) (13) Sham
(12) (8) NP
4
3
1
0
2
5
PW
T
von Frey test NSF test
Late
ncy
to fe
ed (s
)
200
150
100
50
0
***
(10) (13) Sham
(12) (8) NP
A B C
****
P
rote
in c
hang
e(n
orm
aliz
ed to
Sha
m)
2.0
1.5
0.5
0.0
1.0
VehicleFluoxetine
(4) (4) Sham
(6) (4) NP
Tubulin (50 kDa)
MKP-1 (40 kDa)
NP vehicle NP fluox Sham vehicle
VehicleFluoxetine
Sham fluox
*** VehicleFluoxetine
**
MAPK Phosphatase-1 in Depression
Biological Psychiatry September 1, 2017; 82:370–379 www.sobp.org/journal 375
BiologicalPsychiatry
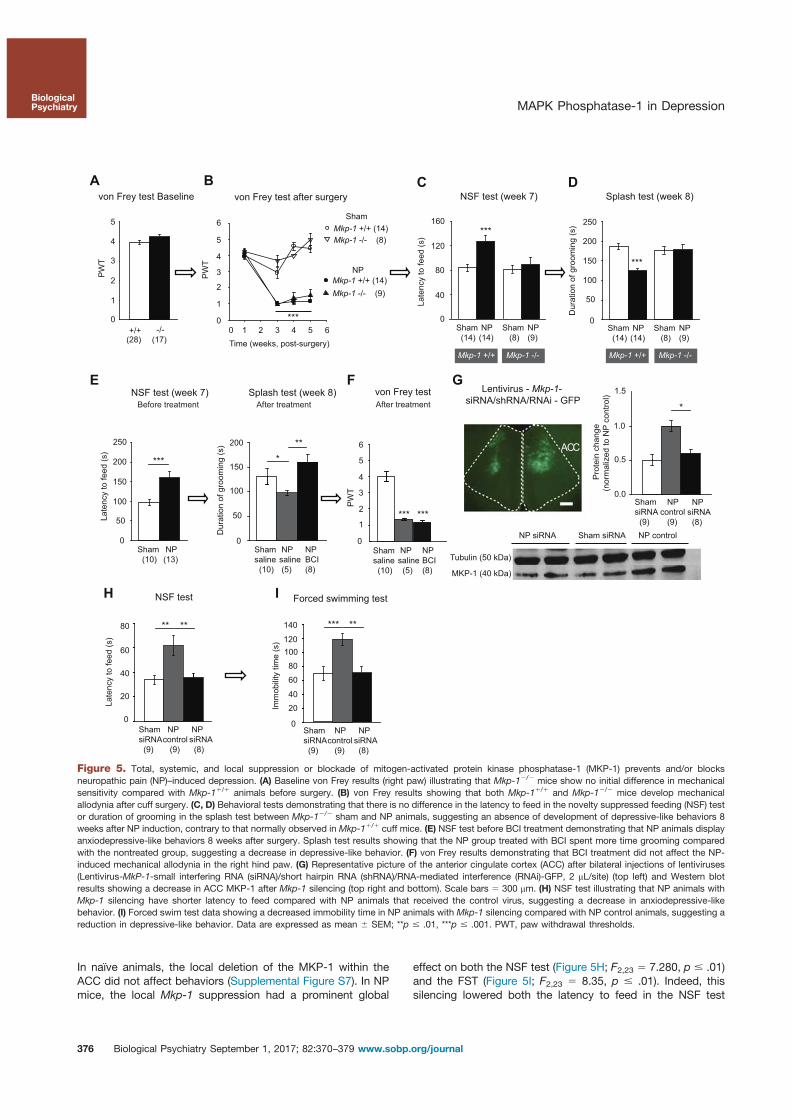
In naïve animals, the local deletion of the MKP-1 within theACC did not affect behaviors (Supplemental Figure S7). In NPmice, the local Mkp-1 suppression had a prominent global
effect on both the NSF test (Figure 5H; F2,23 5 7.280, p # .01)and the FST (Figure 5I; F2,23 5 8.35, p # .01). Indeed, thissilencing lowered both the latency to feed in the NSF test
von Frey test Baseline von Frey test after surgeryA
4
3
1
0
2
5
PW
T
(28) -/-
(17)
***
Mkp-1 +/+ (14)Mkp-1 -/- (8)
Mkp-1 +/+ (14)Mkp-1 -/- (9)
4
3
1
0
2
5
6
0 1 2 3 4 5 6
PW
T
Time (weeks, post-surgery)
B
Mkp-1 +/+ Mkp-1 -/-
Sham (14)
NP(14)
Sham (8)
NP (9)
***160
120
80
40
0
Late
ncy
to fe
ed (s
)
NSF test (week 7)C
Sham (14)
NP(14)
Sham (8)
NP (9)
Mkp-1 +/+ Mkp-1 -/-
Dur
atio
n of
gro
omin
g (s
) 250
200
150
100
50
0
***
Splash test (week 8)D
250
200
150
100
50
0
Late
ncy
to fe
ed (s
)
Sham (10)
NP (13)
ENSF test (week 7)
***
200
150
100
50
0
**
Shamsaline (10)
NP BCI (8)
NPsaline (5)
Dur
atio
n of
gro
omin
g (s
)
Splash test (week 8)F
Shamsaline (10)
NP BCI (8)
NPsaline (5)
PW
T
4
3
1
0
2
5
6
von Frey test
******
Lentivirus - Mkp-1- siRNA/shRNA/RNAi - GFP
ACC
Tubulin (50 kDa)
MKP-1 (40 kDa)
NP siRNA Sham siRNA NP control
Late
ncy
to fe
ed (s
)
ShamsiRNA (9)
NPcontrol (9)
NPsiRNA (8)
80
60
40
20
0
** **
NSF test
G
H I Forced swimming test
Imm
obili
ty ti
me
(s)
140
120100
80
0
60
4020
ShamsiRNA (9)
NPcontrol (9)
NPsiRNA (8)
Sham
NP
*** **
+/+
Before treatment After treatment After treatment1.5
0.5
0.0
1.0
ShamsiRNA (9)
NPcontrol (9)
NPsiRNA (8)
*
*
P
rote
in c
hang
e(n
orm
aliz
ed to
NP
cont
rol)
Figure 5. Total, systemic, and local suppression or blockade of mitogen-activated protein kinase phosphatase-1 (MKP-1) prevents and/or blocksneuropathic pain (NP)–induced depression. (A) Baseline von Frey results (right paw) illustrating that Mkp-12/2 mice show no initial difference in mechanicalsensitivity compared with Mkp-11/1 animals before surgery. (B) von Frey results showing that both Mkp-11/1 and Mkp-12/2 mice develop mechanicalallodynia after cuff surgery. (C, D) Behavioral tests demonstrating that there is no difference in the latency to feed in the novelty suppressed feeding (NSF) testor duration of grooming in the splash test between Mkp-12/2 sham and NP animals, suggesting an absence of development of depressive-like behaviors 8weeks after NP induction, contrary to that normally observed in Mkp-11/1 cuff mice. (E) NSF test before BCI treatment demonstrating that NP animals displayanxiodepressive-like behaviors 8 weeks after surgery. Splash test results showing that the NP group treated with BCI spent more time grooming comparedwith the nontreated group, suggesting a decrease in depressive-like behavior. (F) von Frey results demonstrating that BCI treatment did not affect the NP-induced mechanical allodynia in the right hind paw. (G) Representative picture of the anterior cingulate cortex (ACC) after bilateral injections of lentiviruses(Lentivirus-MkP-1-small interfering RNA (siRNA)/short hairpin RNA (shRNA)/RNA-mediated interference (RNAi)-GFP, 2 mL/site) (top left) and Western blotresults showing a decrease in ACC MKP-1 after Mkp-1 silencing (top right and bottom). Scale bars 5 300 mm. (H) NSF test illustrating that NP animals withMkp-1 silencing have shorter latency to feed compared with NP animals that received the control virus, suggesting a decrease in anxiodepressive-likebehavior. (I) Forced swim test data showing a decreased immobility time in NP animals with Mkp-1 silencing compared with NP control animals, suggesting areduction in depressive-like behavior. Data are expressed as mean 6 SEM; **p # .01, ***p # .001. PWT, paw withdrawal thresholds.
MAPK Phosphatase-1 in Depression
376 Biological Psychiatry September 1, 2017; 82:370–379 www.sobp.org/journal
BiologicalPsychiatry

(Figure 5H; p # .01) and the immobility time in the FST(Figure 5I; p # .01) compared with the scramble-injected NPgroup. This suggests that silencing ACC Mkp-1 leads to adecrease in anxiodepressive-like behaviors and further rein-forces the causal link between ACC MKP-1 and depression.
DISCUSSION
Here we show that anxiodepressive-like behaviors in mice areassociated with an upregulation of ACC MKP-1, which isreversed by fluoxetine. This upregulation is accompanied byincreased phosphorylated CREB/ATF-1 levels and Fosexpression as well as increased enrichment of H3K9/K14acat Mkp-1 promoter in animals displaying depressive-likebehaviors. Antidepressant-like effects produced by experi-mentally preventing, blocking, or decreasing MKP-1 activitywithin the ACC further reinforce its crucial role in depression.
While depression is the most prevalent lifetime disorder, ourlimited knowledge of its etiology, alongside the lack of efficienttreatment strategies, points to an obvious need for objectivelyquantifiable abnormalities at the molecular, cellular, or circuitlevel. Because the ACC is an integration center interconnect-ing neurons from brain regions implicated in pain andaffective-related processing, this study mainly focused onidentifying molecular alterations within this structure. Throughgenomic analyses, we identified Mkp-1 as one of the mostprominently upregulated genes in the ACC, extending pre-vious studies showing increased expression of Mkp-1 in otherbrain regions in animal models of depression and in depressedpatients (14,15).
By exploring the expression dynamics of MKP-1, weobserved that its mRNA, but not the protein, starts beingoverexpressed after 2 weeks of NP, when mice displaymechanical hypersensitivity without anxiodepressive-likebehaviors. This delay between gene expression and proteinsynthesis might involve negative feedback mechanisms con-trolling MKP-1 degradation (32,33) and/or synthesis (34,35).Furthermore, MKP-1 protein shows a tendency for overex-pression at 5 weeks of NP, when anxiety-like behaviors arepresent, and significant overexpression after 8 weeks, whenanimals fully display anxiodepressive-like behaviors. BecauseMkp-1 deletion or local downregulation suppresses thesebehaviors, MKP-1 overexpression appears to be necessaryto anxiodepressive phenotypes. However, it might not besufficient. Indeed, following optogenetic stimulation of theACC, the increase in MKP-1 levels lasted longer than theanxiodepressive phenotype. Together, these results suggestthat other molecular actors (which still remain to be identified)should also be critical and/or that the increase in MKP-1 levelsshould reach a certain threshold in order to translate into abehavioral outcome.
Various studies (16,36,37) focused on the downstreamtargets of MKP-1, showing that its main functional role is tomodulate MAPK-CREB signaling pathways by inactivatingseveral downstream targets, such as extracellular signal-regulated kinases, c-Jun N-terminal kinases, and P38(16,36), which further affects the expression of various genesimplicated in depression (14,38). However, the molecularevents triggering MKP-1 upregulation remain unknown. Pre-vious studies showed that Mkp-1 mRNA has a short half-life of
1 to 2 hours (17,39); however, our genomic analysis at 8 weeksof NP points out a sustained expression of ACC Mkp-1.Increased presence of activated transcription factors thuscould be responsible for such prolonged transcription giventhat microarray results revealed significant modificationsin several of these factors, including mRNA codingATF-1, CREB, and Fos proteins, which are known to targetMkp-1 (40).
Besides changes in transcription factors, a prolongedexpression of relatively short half-life mRNA, such as Mkp-1and C-fos mRNAs, might also require sustained changes inchromatin structure. Thus, we looked for epigenetic regulationby testing H3ac at the Mkp-1 and C-fos promoters, which hasbeen previously reported to be altered in response to variousstimuli (17,41–43). Interestingly, while both H3K9/K14ac andH3K27ac are present at the promoter/TSS region of C-fos andMkp-1, only H3K9/K14ac was increased in response to NP.H3K27ac is generally associated with active enhancers (44),whereas H3K9/K14ac, which is more particularly present atthe promoter/TSS region of highly transcribed genes (45), is ahighly inducible mark that has been shown to be modulated bybehavior at the global and locus-specific levels (46,47). Theenrichment of H3K27ac and increased NP-induced enrich-ment of H3K9/K14ac observed at both genes, demonstratinga favorable chromatin conformation for transcription that maybe relevant, possibly with other modifications, for the sus-tained upregulation of MKP-1. Such epigenetic alterations inthe ACC could contribute to the emergence of depressive-likebehaviors during NP by modulating Mkp-1 (and other genes) inthe long term.
We further demonstrate that ACC MKP-1 is overexpressednot only in NP-induced depression but also in other modelssuch as sustained optogenetic stimulation of the ACC andUCMS, one of the most valid and relevant models of depres-sion (48), suggesting that this pattern is consistent regardlessto the cause of depression and could be a common marker.Interestingly, Duric et al. (14) did not report alterations of Mkp-1in the whole cortex after chronic stress, whereas they dem-onstrated an increased level of this gene in the dentate gyrusand the cornu ammonis 1 of animals submitted to UCMS andin patients with major depressive disorder. Likewise, we didnot observe any change in the primary somatosensory cortex,suggesting that the overexpression is not a general corticaleffect but rather may be selective for the ACC. Conversely, wedid not observe alteration in MKP-1 protein level when westudied the whole hippocampus, which may reflect thatreported changes (14) affect specific subregions of thisstructure.
To leap from a correlative analysis to a causal analysis forunderstanding the link between MKP-1 and depression, wecombined several approaches. Knocking out and systemicantagonism of MKP-1 blocks the development as well as themaintenance of depressive-like behaviors without affecting thenociceptive hypersensitivity component of NP, suggesting thatthe presence of MKP-1 at the systemic level may be crucial fordepression. Interestingly, local silencing of Mkp-1 within theACC is sufficient to suppress depressive-like behaviors afterNP. Besides systemic and local suppression of MKP-1,fluoxetine also induces antidepressant-like effects in ourmodel and decreases the ACC MKP-1 levels. The latter is in
MAPK Phosphatase-1 in Depression
Biological Psychiatry September 1, 2017; 82:370–379 www.sobp.org/journal 377
BiologicalPsychiatry

line with studies showing a decrease in MKP-1 in the frontalcortex and hippocampus of rats after chronic fluoxetine treat-ment (49,50). Unlike tricyclic antidepressants that are suc-cessful in treating the nociceptive hypersensitivity component,such as mechanical allodynia, observed in NP (51), selectiveserotonin reuptake inhibitors, and particularly fluoxetine, showlimited to no analgesic efficacy in NP (52). Accordingly, theantidepressant-like effect of fluoxetine that we observedwas also independent of its impact on the mechanicalhypersensitivity.
In conclusion, our results indicate that the upregulation ofACC MKP-1 is necessary for the expression of depressivesymptoms induced by chronic pain, chronic stress, andoptogenetic activation of the ACC. From a drug discoveryperspective, dual specificity phosphatase family members arepromising drug targets given that several MAPK inhibitors arealready in different states of development for inflammatorydisease and cancer (53). Our results further provide a preclin-ical target validation for potential treatment of depressiongiven that systemic pharmacological blockade and localsuppression of the MKP-1 display antidepressant-like effects.
ACKNOWLEDGMENTS AND DISCLOSURESThis work was supported by the Centre National de la RechercheScientifique (Contract No. UPR3212) (to IY and MB), the University ofStrasbourg (to FB and MH), the Neurotime Erasmus Mundus JointDoctorate (to MK), the Institut UPSA de la Douleur (to IY and MB), and aNational Alliance for Research on Schizophrenia and Depression YoungInvestigator Grant from the Brain & Behavior Research Foundation (to IY).
We thank Stephane Doridot for assistance in breeding and genotyp-ing Mkp-12/2 mice. We are grateful to Andrew Cato and Bristol-MyersSquibb for providing Mkp-12/2 mice. We thank the Core FacilityGenomics of the Medical Faculty Münster, especially Anika Witten andMonika Stoll, for excellent gene expression analysis using Illuminamicroarrays.
The authors report no biomedical financial interests or potential conflictsof interest.
ARTICLE INFORMATIONFrom the Institute of Cellular and Integrative Neuroscience (FB, MH, EW,MK, MB, IY), Centre National de la Recherche Scientifique, Laboratory ofCognitive and Adaptive Neuroscience (A-LB), Centre National de laRecherche Scientifique, University of Strasbourg (FB, MH, MK), Strasbourg,and University François Rabelais (SL, CB), Institut National de la Santé et dela Recherche Médicale, Tours, France; and Institute of Pharmacology andToxicology (RG, LH), University of Freiburg, and BIOSS Centre for BiologicalSignalling Studies, Freiburg, Germany.
FB and MH contributed equally to this work.
Address correspondence to Ipek Yalcin, Ph.D., Pharm.D., Institut desNeurosciences Cellulaires et Intégratives, UPR 3212 CNRS, 5 rue BlaisePascal, 67084 Strasbourg cedex, France; E-mail: [email protected].
Received Jul 25, 2016; revised Jan 11, 2017; accepted Feb 2, 2017.
Supplementary material cited in this article is available online at http://dx.doi.org/10.1016/j.biopsych.2017.01.019.
REFERENCES1. Pittenger C, Duman RS (2008): Stress, depression, and neuroplastic-
ity: A convergence of mechanisms. Neuropsychopharmacology 33:88–109.
2. Attal N, Lanteri-Minet M, Laurent B, Fermanian J, Bouhassira D (2011):The specific disease burden of neuropathic pain: Results of a Frenchnationwide survey. Pain 152:2836–2843.
3. Maletic V, Raison CL (2009): Neurobiology of depression, fibro-myalgia, and neuropathic pain. Front Biosci (Landmark Ed) 14:5291–5338.
4. Suzuki T, Amata M, Sakaue G, Nishimura S, Inoue T, Shibata M, et al.(2007): Experimental neuropathy in mice is associated with delayedbehavioral changes related to anxiety and depression. Anesth Analg104:1570–1577.
5. Alba-Delgado C, Llorca-Torralba M, Horrillo I, Ortega JE, Mico JA,Sanchez-Blazquez P, et al. (2013): Chronic pain leads to concomitantnoradrenergic impairment and mood disorders. Biol Psychiatry 73:54–62.
6. Yalcin I, Bohren Y, Waltisperger E, Sage-Ciocca D, Yin JC, Freund-Mercier MJ, et al. (2011): A time-dependent history of mooddisorders in a murine model of neuropathic pain. Biol Psychiatry 70:946–953.
7. Pizzagalli DA (2011): Frontocingulate dysfunction in depression:Toward biomarkers of treatment response. Neuropsychopharmacol-ogy 36:183–206.
8. Matthews SC, Strigo IA, Simmons AN, Yang TT, Paulus MP (2008):Decreased functional coupling of the amygdala and supragenual cingulateis related to increased depression in unmedicated individuals with currentmajor depressive disorder. J Affect Disord 111:13–20.
9. Drevets WC (2001): Neuroimaging and neuropathological studies ofdepression: Implications for the cognitive-emotional features of mooddisorders. Curr Opin Neurobiol 11:240–249.
10. Drevets WC, Ongur D, Price JL (1998): Neuroimaging abnormalitiesin the subgenual prefrontal cortex: Implications for the pathophy-siology of familial mood disorders. Mol Psychiatry 3:190–191,220–226.
11. Radley JJ, Sisti HM, Hao J, Rocher AB, McCall T, Hof PR, et al. (2004):Chronic behavioral stress induces apical dendritic reorganization inpyramidal neurons of the medial prefrontal cortex. Neuroscience 125:1–6.
12. Ito H, Nagano M, Suzuki H, Murakoshi T (2010): Chronic stressenhances synaptic plasticity due to disinhibition in the anteriorcingulate cortex and induces hyper-locomotion in mice. Neurophar-macology 58:746–757.
13. Barthas F, Sellmeijer J, Hugel S, Waltisperger E, Barrot M, Yalcin I(2015): The anterior cingulate cortex is a critical hub for pain-induceddepression. Biol Psychiatry 77:236–245.
14. Duric V, Banasr M, Licznerski P, Schmidt HD, Stockmeier CA, SimenAA, et al. (2010): A negative regulator of MAP kinase causesdepressive behavior. Nat Med 16:1328–1332.
15. Iio W, Matsukawa N, Tsukahara T, Kohari D, Toyoda A (2011): Effectsof chronic social defeat stress on MAP kinase cascade. Neurosci Lett504:281–284.
16. Boutros T, Chevet E, Metrakos P (2008): Mitogen-activated protein(MAP) kinase/MAP kinase phosphatase regulation: Roles in cellgrowth, death, and cancer. Pharmacol Rev 60:261–310.
17. Li J, Gorospe M, Hutter D, Barnes J, Keyse SM, Liu Y (2001):Transcriptional induction of MKP-1 in response to stress is associatedwith histone H3 phosphorylation-acetylation. Mol Cell Biol 21:8213–8224.
18. Casals-Casas C, Alvarez E, Serra M, de la Torre C, Farrera C,Sanchez-Tillo E, et al. (2009): CREB and AP-1 activation regulatesMKP-1 induction by LPS or M-CSF and their kinetics correlate withmacrophage activation versus proliferation. Eur J Immunol 39:1902–1913.
19. Boulle F, Massart R, Stragier E, Paizanis E, Zaidan L, Marday S, et al.(2014): Hippocampal and behavioral dysfunctions in a mouse modelof environmental stress: Normalization by agomelatine. Transl Psy-chiatry 4:e485.
20. Chaumont J, Guyon N, Valera AM, Dugue GP, Popa D, Marcaggi P,et al. (2013): Clusters of cerebellar Purkinje cells control their afferentclimbing fiber discharge. Proc Natl Acad Sci U S A 110:16223–16228.
21. Impey S, Mark M, Villacres EC, Poser S, Chavkin C, Storm DR (1996):Induction of CRE-mediated gene expression by stimuli that generatelong-lasting LTP in area CA1 of the hippocampus. Neuron 16:973–982.
MAPK Phosphatase-1 in Depression
378 Biological Psychiatry September 1, 2017; 82:370–379 www.sobp.org/journal
BiologicalPsychiatry
22. Paxinos G, Franklin K (2012): Paxinos and Franklin’s the Mouse Brain inStereotaxic Coordinates, 4th ed. New York: Academic Press.
23. Yalcin I, Megat S, Barthas F, Waltisperger E, Kremer M, Salvat E,Barrot M (2014): The sciatic nerve cuffing model of neuropathic pain inmice. J Vis Exp (89). http://dx.doi.org/10.3791/51608.
24. Yalcin I, Coubard S, Bodard S, Chalon S, Belzung C (2008): Effects of5,7-dihydroxytryptamine lesion of the dorsal raphe nucleus on theantidepressant-like action of tramadol in the unpredictable chronicmild stress in mice. Psychopharmacology (Berl) 200:497–507.
25. Nollet M, Le Guisquet AM, Belzung C (2013): Models of depression:Unpredictable chronic mild stress in mice. Curr Protoc Pharmacolchapter 5:unit 5.65.
26. Neidl R, Schneider A, Bousiges O, Majchrzak M, Barbelivien A, deVasconcelos AP, et al. (2016): Late-life environmental enrichmentinduces acetylation events and nuclear factor κB-dependent regula-tions in the hippocampus of aged rats showing improved plasticityand learning. J Neurosci 36:4351–4361.
27. Rastogi R, Jiang Z, Ahmad N, Rosati R, Liu Y, Beuret L, et al. (2013):Rapamycin induces mitogen-activated protein (MAP) kinasephosphatase-1 (MKP-1) expression through activation of proteinkinase B and mitogen-activated protein kinase kinase pathways.J Biol Chem 288:33966–33977.
28. Wang Z, Zang C, Rosenfeld JA, Schones DE, Barski A, Cuddapah S,et al. (2008): Combinatorial patterns of histone acetylations andmethylations in the human genome. Nat Genet 40:897–903.
29. Karmodiya K, Krebs AR, Oulad-Abdelghani M, Kimura H, Tora L(2012): H3K9 and H3K14 acetylation co-occur at many gene regu-latory elements, while H3K14ac marks a subset of inactive induciblepromoters in mouse embryonic stem cells. BMC Genomics 13:424.
30. Maier JV, Brema S, Tuckermann J, Herzer U, Klein M, Stassen M,et al. (2007): Dual specificity phosphatase 1 knockout mice showenhanced susceptibility to anaphylaxis but are sensitive to glucocorti-coids. Mol Endocrinol 21:2663–2671.
31. Molina G, Vogt A, Bakan A, Dai W, Queiroz de Oliveira P,Znosko W, et al. (2009): Zebrafish chemical screening reveals aninhibitor of Dusp6 that expands cardiac cell lineages. Nat Chem Biol5:680–687.
32. Lin YW, Chuang SM, Yang JL (2003): ERK1/2 achieves sustainedactivation by stimulating MAPK phosphatase-1 degradation via theubiquitin-proteasome pathway. J Biol Chem 278:21534–21541.
33. Choi BH, Hur EM, Lee JH, Jun DJ, Kim KT (2006): Protein kinase Cδ-mediated proteasomal degradation of MAP kinase phosphatase-1contributes to glutamate-induced neuronal cell death. J Cell Sci 119:1329–1340.
34. Lin YW, Yang JL (2006): Cooperation of ERK and SCFSkp2 for MKP-1destruction provides a positive feedback regulation of proliferatingsignaling. J Biol Chem 281:915–926.
35. Korhonen R, Moilanen E (2014): Mitogen-activated protein kinasephosphatase 1 as an inflammatory factor and drug target. Basic ClinPharmacol Toxicol 114:24–36.
36. Sun H, Charles CH, Lau LF, Tonks NK (1993): MKP-1 (3CH134), animmediate early gene product, is a dual specificity phosphatase thatdephosphorylates MAP kinase in vivo. Cell 75:487–493.
37. Lawan A, Shi H, Gatzke F, Bennett AM (2013): Diversity and specificityof the mitogen-activated protein kinase phosphatase-1 functions. CellMol Life Sci 70:223–237.
38. Licznerski P, Duman RS (2013): Remodeling of axo-spinous synapsesin the pathophysiology and treatment of depression. Neuroscience251:33–50.
39. Kuwano Y, Kim HH, Abdelmohsen K, Pullmann R Jr, Martindale JL,Yang X, et al. (2008): MKP-1 mRNA stabilization and translationalcontrol by RNA-binding proteins HuR and NF90. Mol Cell Biol 28:4562–4575.
40. Ananieva O, Darragh J, Johansen C, Carr JM, McIlrath J, Park JM,et al. (2008): The kinases MSK1 and MSK2 act as negative regulatorsof Toll-like receptor signaling. Nat Immunol 9:1028–1036.
41. Tsankova NM, Kumar A, Nestler EJ (2004): Histone modifications atgene promoter regions in rat hippocampus after acute and chronicelectroconvulsive seizures. J Neurosci 24:5603–5610.
42. Pollack BP, Sapkota B, Boss JM (2009): Ultraviolet radiation-inducedtranscription is associated with gene-specific histone acetylation.Photochem Photobiol 85:652–662.
43. Sharma AK, Mansukh A, Varma A, Gadewal N, Gupta S (2013):Molecular modeling of differentially phosphorylated serine 10 andacetylated lysine 9/14 of histone H3 regulates their interactions with14-3-3ζ, MSK1, and MKP1. Bioinform Biol Insights 7:271–288.
44. Creyghton MP, Cheng AW, Welstead GG, Kooistra T, Carey BW,Steine EJ, et al. (2010): Histone H3K27ac separates active frompoised enhancers and predicts developmental state. Proc Natl AcadSci U S A 107:21931–21936.
45. Lopez-Atalaya JP, Ito S, Valor LM, Benito E, Barco A (2013): Genomictargets, and histone acetylation and gene expression profiling ofneural HDAC inhibition. Nucleic Acids Res 41:8072–8084.
46. Bousiges O, Vasconcelos AP, Neidl R, Cosquer B, Herbeaux K,Panteleeva I, et al. (2010): Spatial memory consolidation is associatedwith induction of several lysine-acetyltransferase (histone acetyltrans-ferase) expression levels and H2B/H4 acetylation-dependent tran-scriptional events in the rat hippocampus. Neuropsychopharmacology35:2521–2537.
47. Bousiges O, Neidl R, Majchrzak M, Muller MA, Barbelivien A,Pereira de Vasconcelos A, et al. (2013): Detection of histoneacetylation levels in the dorsal hippocampus reveals early taggingon specific residues of H2B and H4 histones in response to learning.PLoS One 8:e57816.
48. Willner P (2005): Chronic mild stress (CMS) revisited: Consistency andbehavioural-neurobiological concordance in the effects of CMS.Neuropsychobiology 52:90–110.
49. Kodama M, Russell DS, Duman RS (2005): Electroconvulsive seizuresincrease the expression of MAP kinase phosphatases in limbicregions of rat brain. Neuropsychopharmacology 30:360–371.
50. Sun YR, Wang XY, Li SS, Dong HY, Zhang XJ (2015): β-Asarone fromAcorus gramineus alleviates depression by modulating MKP-1. GenetMol Res 14:4495–4504.
51. Jackson KC 2nd, St Onge EL (2003): Antidepressant pharma-cotherapy: Considerations for the pain clinician. Pain Pract 3:135–143.
52. Max MB, Lynch SA, Muir J, Shoaf SE, Smoller B, Dubner R (1992):Effects of desipramine, amitriptyline, and fluoxetine on pain in diabeticneuropathy. N Engl J Med 326:1250–1256.
53. Jeffrey KL, Camps M, Rommel C, Mackay CR (2007): Targeting dual-specificity phosphatases: Manipulating MAP kinase signalling andimmune responses. Nat Rev Drug Discov 6:391–403.
MAPK Phosphatase-1 in Depression
Biological Psychiatry September 1, 2017; 82:370–379 www.sobp.org/journal 379
BiologicalPsychiatry

Neurobiology of Disease
Hyperactivity of Anterior Cingulate Cortex Areas 24a/24bDrives Chronic Pain-Induced Anxiodepressive-likeConsequences
Jim Sellmeijer,1,2,3 Victor Mathis,1 Sylvain Hugel,1 Xu-Hui Li,5 Qian Song,5 Qi-Yu Chen,5 Florent Barthas,1
X Pierre-Eric Lutz,1 X Meltem Karatas,1 Andreas Luthi,2 Pierre Veinante,1 X Ad Aertsen,3 Michel Barrot,1 Min Zhuo,4,5
and X Ipek Yalcin1
1Centre National de la Recherche Scientifique, Universite de Strasbourg, Institut des Neurosciences Cellulaires et Integratives, 67000 Strasbourg, France,2Friedrich Miescher Institute for Biomedical Research, 4058 Basel, Switzerland, 3Faculty of Biology and Bernstein Center Freiburg, University of Freiburg,D-79104 Freiburg, Germany, 4Department of Physiology, Faculty of Medicine, University of Toronto, Toronto, Ontario M5S 1A8, Canada, and 5Center forNeuron and Brain Disease, Frontier Institutes of Science and Technology, Xi’an Jiaotong University, Xi’an, 710049, China
Pain associates both sensory and emotional aversive components, and often leads to anxiety and depression when it becomes chronic. Here, wecharacterized, in a mouse model, the long-term development of these sensory and aversive components as well as anxiodepressive-like conse-quences of neuropathic pain and determined their electrophysiological impact on the anterior cingulate cortex (ACC, cortical areas24a/24b). We show that these symptoms of neuropathic pain evolve and recover in different time courses following nerve injury in malemice. In vivo electrophysiological recordings evidence an increased firing rate and bursting activity within the ACC whenanxiodepressive-like consequences developed, and this hyperactivity persists beyond the period of mechanical hypersensitivity. Whole-cell patch-clamp recordings also support ACC hyperactivity, as shown by increased excitatory postsynaptic transmission and contribu-tion of NMDA receptors. Optogenetic inhibition of the ACC hyperactivity was sufficient to alleviate the aversive and anxiodepressive-likeconsequences of neuropathic pain, indicating that these consequences are underpinned by ACC hyperactivity.
Key words: anterior cingulate cortex; anxiety; depression; electrophysiology; neuropathic pain; optogenetics
IntroductionMood disorders, such as anxiety and depression, are frequentlyobserved in patients suffering from chronic pain, which adds
dramatically to the patients’ pain burden (Radat et al., 2013).Preclinical studies have shown that the anxiodepressive-like con-sequences of chronic pain, as in neuropathic pain condition, canbe studied in murine models (Narita et al., 2006; Yalcin et al.,2011; Alba-Delgado et al., 2013) and further highlight the im-
Received Nov. 7, 2017; revised Jan. 10, 2018; accepted Feb. 10, 2018.
Author contributions: A.L., A.A., M.B., M.Z., and I.Y. designed research; J.S., V.M., S.H., X.-H.L., Q.S., Q.-Y.C., F.B.,
M.K., and I.Y. performed research; J.S., S.H., X.-H.L., Q.S., Q.-Y.C., F.B., P.-E.L., P.V., A.A., M.Z., and I.Y. analyzed data;
J.S. and I.Y. wrote the paper.
This work was supported by the Centre National de la Recherche Scientifique Contract UPR3212, the University of
Strasbourg, the NeuroTime Erasmus Mundus Joint doctorate, and Brain & Behavior Research Foundation National
Alliance for Research on Schizophrenia and Depression Young Investigator Grant 18893 to I.Y. P.-E.L. was supported
by Fondation pour la Recherche Medicale and Fondation Deniker fellowships. M.Z. was supported by Canada
Research Chair, Canadian Institutes of Health Research Operating Grant MOP-124807, and Azrieli Neurodevelop-
mental Research Program and Brain Canada. We thank Stephane Doridot for assistance in breeding mice and in
genotyping; Elaine Gravel for technical support; and Dr. Modesto R. Peralta for English editing.
The authors declare no competing financial interests.
Correspondence should be addressed to Dr. Ipek Yalcin, Centre National de la Recherche Scientifique, Universite de
Strasbourg, Institut des Neurosciences Cellulaires et Integratives, 67000 Strasbourg. E-mail: [email protected].
DOI:10.1523/JNEUROSCI.3195-17.2018
Copyright © 2018 the authors 0270-6474/18/383102-14$15.00/0
Significance Statement
Chronic pain is frequently comorbid with mood disorders, such as anxiety and depression. It has been shown that it is possible tomodel this comorbidity in animal models by taking into consideration the time factor. In this study, we aimed at determining thedynamic of different components and consequences of chronic pain, and correlated them with electrophysiological alterations. Bycombining electrophysiological, optogenetic, and behavioral analyses in a mouse model of neuropathic pain, we show that themechanical hypersensitivity, ongoing pain, anxiodepressive consequences, and their recoveries do not necessarily exhibit tem-poral synchrony during chronic pain processing, and that the hyperactivity of the anterior cingulate cortex is essential for drivingthe emotional impact of neuropathic pain.
3102 • The Journal of Neuroscience, March 21, 2018 • 38(12):3102–3115
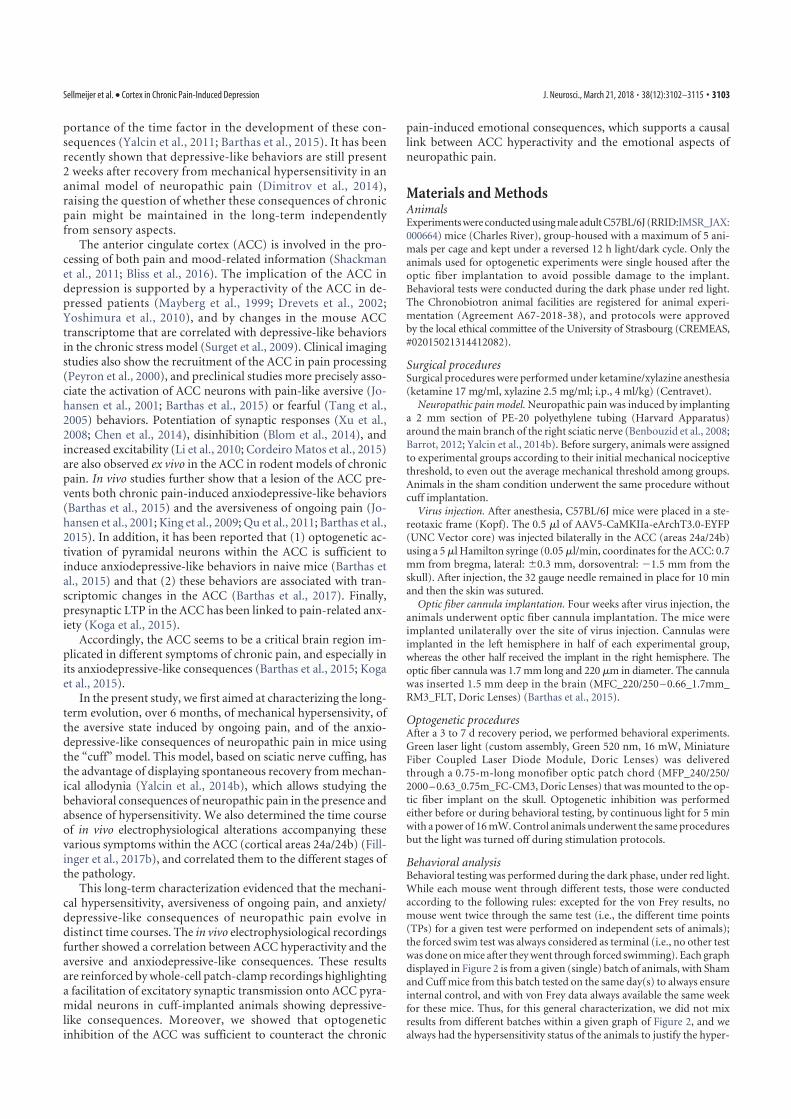
portance of the time factor in the development of these con-sequences (Yalcin et al., 2011; Barthas et al., 2015). It has beenrecently shown that depressive-like behaviors are still present2 weeks after recovery from mechanical hypersensitivity in ananimal model of neuropathic pain (Dimitrov et al., 2014),raising the question of whether these consequences of chronicpain might be maintained in the long-term independentlyfrom sensory aspects.
The anterior cingulate cortex (ACC) is involved in the pro-cessing of both pain and mood-related information (Shackmanet al., 2011; Bliss et al., 2016). The implication of the ACC indepression is supported by a hyperactivity of the ACC in de-pressed patients (Mayberg et al., 1999; Drevets et al., 2002;Yoshimura et al., 2010), and by changes in the mouse ACCtranscriptome that are correlated with depressive-like behaviorsin the chronic stress model (Surget et al., 2009). Clinical imagingstudies also show the recruitment of the ACC in pain processing(Peyron et al., 2000), and preclinical studies more precisely asso-ciate the activation of ACC neurons with pain-like aversive (Jo-hansen et al., 2001; Barthas et al., 2015) or fearful (Tang et al.,2005) behaviors. Potentiation of synaptic responses (Xu et al.,2008; Chen et al., 2014), disinhibition (Blom et al., 2014), andincreased excitability (Li et al., 2010; Cordeiro Matos et al., 2015)are also observed ex vivo in the ACC in rodent models of chronicpain. In vivo studies further show that a lesion of the ACC pre-vents both chronic pain-induced anxiodepressive-like behaviors(Barthas et al., 2015) and the aversiveness of ongoing pain (Jo-hansen et al., 2001; King et al., 2009; Qu et al., 2011; Barthas et al.,2015). In addition, it has been reported that (1) optogenetic ac-tivation of pyramidal neurons within the ACC is sufficient toinduce anxiodepressive-like behaviors in naive mice (Barthas etal., 2015) and that (2) these behaviors are associated with tran-scriptomic changes in the ACC (Barthas et al., 2017). Finally,presynaptic LTP in the ACC has been linked to pain-related anx-iety (Koga et al., 2015).
Accordingly, the ACC seems to be a critical brain region im-plicated in different symptoms of chronic pain, and especially inits anxiodepressive-like consequences (Barthas et al., 2015; Kogaet al., 2015).
In the present study, we first aimed at characterizing the long-term evolution, over 6 months, of mechanical hypersensivity, ofthe aversive state induced by ongoing pain, and of the anxio-depressive-like consequences of neuropathic pain in mice usingthe “cuff” model. This model, based on sciatic nerve cuffing, hasthe advantage of displaying spontaneous recovery from mechan-ical allodynia (Yalcin et al., 2014b), which allows studying thebehavioral consequences of neuropathic pain in the presence andabsence of hypersensitivity. We also determined the time courseof in vivo electrophysiological alterations accompanying thesevarious symptoms within the ACC (cortical areas 24a/24b) (Fill-inger et al., 2017b), and correlated them to the different stages ofthe pathology.
This long-term characterization evidenced that the mechani-cal hypersensitivity, aversiveness of ongoing pain, and anxiety/depressive-like consequences of neuropathic pain evolve indistinct time courses. The in vivo electrophysiological recordingsfurther showed a correlation between ACC hyperactivity and theaversive and anxiodepressive-like consequences. These resultsare reinforced by whole-cell patch-clamp recordings highlightinga facilitation of excitatory synaptic transmission onto ACC pyra-midal neurons in cuff-implanted animals showing depressive-like consequences. Moreover, we showed that optogeneticinhibition of the ACC was sufficient to counteract the chronic
pain-induced emotional consequences, which supports a causallink between ACC hyperactivity and the emotional aspects ofneuropathic pain.
Materials and MethodsAnimalsExperiments were conducted using male adult C57BL/6J (RRID:IMSR_JAX:000664) mice (Charles River), group-housed with a maximum of 5 ani-mals per cage and kept under a reversed 12 h light/dark cycle. Only theanimals used for optogenetic experiments were single housed after theoptic fiber implantation to avoid possible damage to the implant.Behavioral tests were conducted during the dark phase under red light.The Chronobiotron animal facilities are registered for animal experi-mentation (Agreement A67-2018-38), and protocols were approvedby the local ethical committee of the University of Strasbourg (CREMEAS,#02015021314412082).
Surgical proceduresSurgical procedures were performed under ketamine/xylazine anesthesia(ketamine 17 mg/ml, xylazine 2.5 mg/ml; i.p., 4 ml/kg) (Centravet).
Neuropathic pain model. Neuropathic pain was induced by implantinga 2 mm section of PE-20 polyethylene tubing (Harvard Apparatus)around the main branch of the right sciatic nerve (Benbouzid et al., 2008;Barrot, 2012; Yalcin et al., 2014b). Before surgery, animals were assignedto experimental groups according to their initial mechanical nociceptivethreshold, to even out the average mechanical threshold among groups.Animals in the sham condition underwent the same procedure withoutcuff implantation.
Virus injection. After anesthesia, C57BL/6J mice were placed in a ste-reotaxic frame (Kopf). The 0.5 �l of AAV5-CaMKIIa-eArchT3.0-EYFP(UNC Vector core) was injected bilaterally in the ACC (areas 24a/24b)using a 5 �l Hamilton syringe (0.05 �l/min, coordinates for the ACC: 0.7mm from bregma, lateral: �0.3 mm, dorsoventral: �1.5 mm from theskull). After injection, the 32 gauge needle remained in place for 10 minand then the skin was sutured.
Optic fiber cannula implantation. Four weeks after virus injection, theanimals underwent optic fiber cannula implantation. The mice wereimplanted unilaterally over the site of virus injection. Cannulas wereimplanted in the left hemisphere in half of each experimental group,whereas the other half received the implant in the right hemisphere. Theoptic fiber cannula was 1.7 mm long and 220 �m in diameter. The cannulawas inserted 1.5 mm deep in the brain (MFC_220/250 – 0.66_1.7mm_RM3_FLT, Doric Lenses) (Barthas et al., 2015).
Optogenetic proceduresAfter a 3 to 7 d recovery period, we performed behavioral experiments.Green laser light (custom assembly, Green 520 nm, 16 mW, MiniatureFiber Coupled Laser Diode Module, Doric Lenses) was deliveredthrough a 0.75-m-long monofiber optic patch chord (MFP_240/250/2000 – 0.63_0.75m_FC-CM3, Doric Lenses) that was mounted to the op-tic fiber implant on the skull. Optogenetic inhibition was performedeither before or during behavioral testing, by continuous light for 5 minwith a power of 16 mW. Control animals underwent the same proceduresbut the light was turned off during stimulation protocols.
Behavioral analysisBehavioral testing was performed during the dark phase, under red light.While each mouse went through different tests, those were conductedaccording to the following rules: excepted for the von Frey results, nomouse went twice through the same test (i.e., the different time points(TPs) for a given test were performed on independent sets of animals);the forced swim test was always considered as terminal (i.e., no other testwas done on mice after they went through forced swimming). Each graphdisplayed in Figure 2 is from a given (single) batch of animals, with Shamand Cuff mice from this batch tested on the same day(s) to always ensureinternal control, and with von Frey data always available the same weekfor these mice. Thus, for this general characterization, we did not mixresults from different batches within a given graph of Figure 2, and wealways had the hypersensitivity status of the animals to justify the hyper-
Sellmeijer et al. • Cortex in Chronic Pain-Induced Depression J. Neurosci., March 21, 2018 • 38(12):3102–3115 • 3103
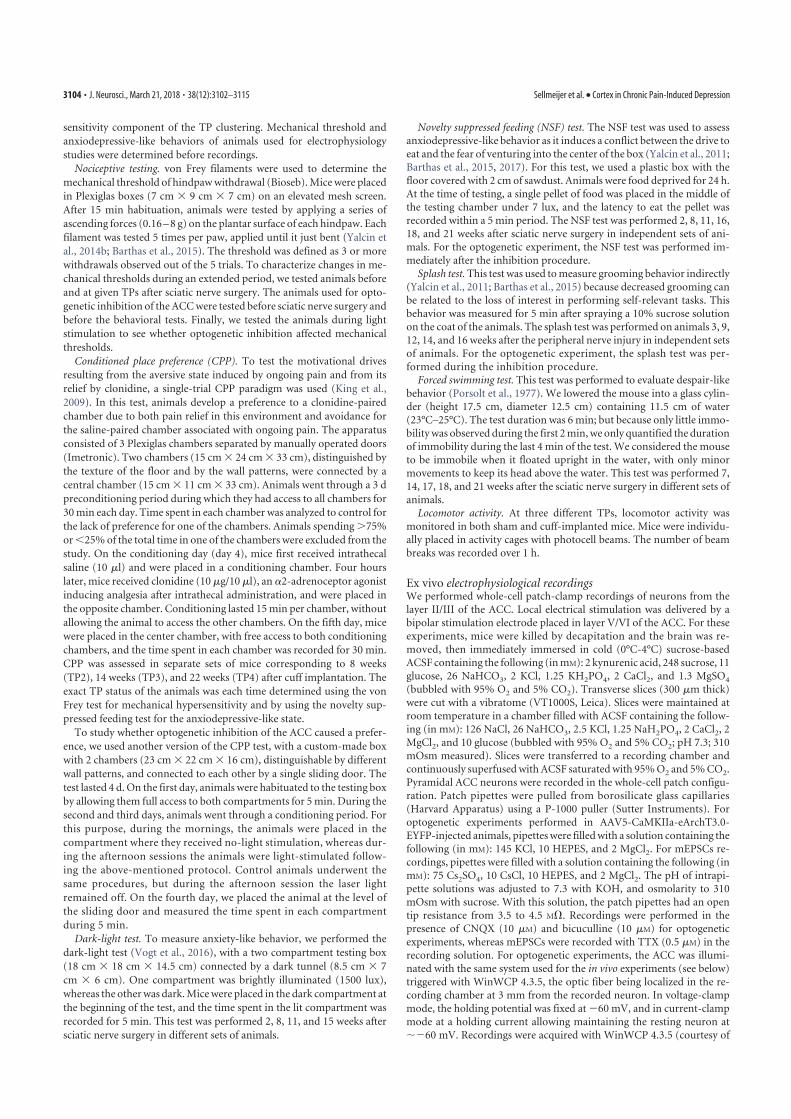
sensitivity component of the TP clustering. Mechanical threshold andanxiodepressive-like behaviors of animals used for electrophysiologystudies were determined before recordings.
Nociceptive testing. von Frey filaments were used to determine themechanical threshold of hindpaw withdrawal (Bioseb). Mice were placedin Plexiglas boxes (7 cm � 9 cm � 7 cm) on an elevated mesh screen.After 15 min habituation, animals were tested by applying a series ofascending forces (0.16 – 8 g) on the plantar surface of each hindpaw. Eachfilament was tested 5 times per paw, applied until it just bent (Yalcin etal., 2014b; Barthas et al., 2015). The threshold was defined as 3 or morewithdrawals observed out of the 5 trials. To characterize changes in me-chanical thresholds during an extended period, we tested animals beforeand at given TPs after sciatic nerve surgery. The animals used for opto-genetic inhibition of the ACC were tested before sciatic nerve surgery andbefore the behavioral tests. Finally, we tested the animals during lightstimulation to see whether optogenetic inhibition affected mechanicalthresholds.
Conditioned place preference (CPP). To test the motivational drivesresulting from the aversive state induced by ongoing pain and from itsrelief by clonidine, a single-trial CPP paradigm was used (King et al.,2009). In this test, animals develop a preference to a clonidine-pairedchamber due to both pain relief in this environment and avoidance forthe saline-paired chamber associated with ongoing pain. The apparatusconsisted of 3 Plexiglas chambers separated by manually operated doors(Imetronic). Two chambers (15 cm � 24 cm � 33 cm), distinguished bythe texture of the floor and by the wall patterns, were connected by acentral chamber (15 cm � 11 cm � 33 cm). Animals went through a 3 dpreconditioning period during which they had access to all chambers for30 min each day. Time spent in each chamber was analyzed to control forthe lack of preference for one of the chambers. Animals spending �75%or �25% of the total time in one of the chambers were excluded from thestudy. On the conditioning day (day 4), mice first received intrathecalsaline (10 �l) and were placed in a conditioning chamber. Four hourslater, mice received clonidine (10 �g/10 �l), an �2-adrenoceptor agonistinducing analgesia after intrathecal administration, and were placed inthe opposite chamber. Conditioning lasted 15 min per chamber, withoutallowing the animal to access the other chambers. On the fifth day, micewere placed in the center chamber, with free access to both conditioningchambers, and the time spent in each chamber was recorded for 30 min.CPP was assessed in separate sets of mice corresponding to 8 weeks(TP2), 14 weeks (TP3), and 22 weeks (TP4) after cuff implantation. Theexact TP status of the animals was each time determined using the vonFrey test for mechanical hypersensitivity and by using the novelty sup-pressed feeding test for the anxiodepressive-like state.
To study whether optogenetic inhibition of the ACC caused a prefer-ence, we used another version of the CPP test, with a custom-made boxwith 2 chambers (23 cm � 22 cm � 16 cm), distinguishable by differentwall patterns, and connected to each other by a single sliding door. Thetest lasted 4 d. On the first day, animals were habituated to the testing boxby allowing them full access to both compartments for 5 min. During thesecond and third days, animals went through a conditioning period. Forthis purpose, during the mornings, the animals were placed in thecompartment where they received no-light stimulation, whereas dur-ing the afternoon sessions the animals were light-stimulated follow-ing the above-mentioned protocol. Control animals underwent thesame procedures, but during the afternoon session the laser lightremained off. On the fourth day, we placed the animal at the level ofthe sliding door and measured the time spent in each compartmentduring 5 min.
Dark-light test. To measure anxiety-like behavior, we performed thedark-light test (Vogt et al., 2016), with a two compartment testing box(18 cm � 18 cm � 14.5 cm) connected by a dark tunnel (8.5 cm � 7cm � 6 cm). One compartment was brightly illuminated (1500 lux),whereas the other was dark. Mice were placed in the dark compartment atthe beginning of the test, and the time spent in the lit compartment wasrecorded for 5 min. This test was performed 2, 8, 11, and 15 weeks aftersciatic nerve surgery in different sets of animals.
Novelty suppressed feeding (NSF) test. The NSF test was used to assessanxiodepressive-like behavior as it induces a conflict between the drive toeat and the fear of venturing into the center of the box (Yalcin et al., 2011;Barthas et al., 2015, 2017). For this test, we used a plastic box with thefloor covered with 2 cm of sawdust. Animals were food deprived for 24 h.At the time of testing, a single pellet of food was placed in the middle ofthe testing chamber under 7 lux, and the latency to eat the pellet wasrecorded within a 5 min period. The NSF test was performed 2, 8, 11, 16,18, and 21 weeks after sciatic nerve surgery in independent sets of ani-mals. For the optogenetic experiment, the NSF test was performed im-mediately after the inhibition procedure.
Splash test. This test was used to measure grooming behavior indirectly(Yalcin et al., 2011; Barthas et al., 2015) because decreased grooming canbe related to the loss of interest in performing self-relevant tasks. Thisbehavior was measured for 5 min after spraying a 10% sucrose solutionon the coat of the animals. The splash test was performed on animals 3, 9,12, 14, and 16 weeks after the peripheral nerve injury in independent setsof animals. For the optogenetic experiment, the splash test was per-formed during the inhibition procedure.
Forced swimming test. This test was performed to evaluate despair-likebehavior (Porsolt et al., 1977). We lowered the mouse into a glass cylin-der (height 17.5 cm, diameter 12.5 cm) containing 11.5 cm of water(23°C–25°C). The test duration was 6 min; but because only little immo-bility was observed during the first 2 min, we only quantified the durationof immobility during the last 4 min of the test. We considered the mouseto be immobile when it floated upright in the water, with only minormovements to keep its head above the water. This test was performed 7,14, 17, 18, and 21 weeks after the sciatic nerve surgery in different sets ofanimals.
Locomotor activity. At three different TPs, locomotor activity wasmonitored in both sham and cuff-implanted mice. Mice were individu-ally placed in activity cages with photocell beams. The number of beambreaks was recorded over 1 h.
Ex vivo electrophysiological recordingsWe performed whole-cell patch-clamp recordings of neurons from thelayer II/III of the ACC. Local electrical stimulation was delivered by abipolar stimulation electrode placed in layer V/VI of the ACC. For theseexperiments, mice were killed by decapitation and the brain was re-moved, then immediately immersed in cold (0°C-4°C) sucrose-basedACSF containing the following (in mM): 2 kynurenic acid, 248 sucrose, 11glucose, 26 NaHCO3, 2 KCl, 1.25 KH2PO4, 2 CaCl2, and 1.3 MgSO4
(bubbled with 95% O2 and 5% CO2). Transverse slices (300 �m thick)were cut with a vibratome (VT1000S, Leica). Slices were maintained atroom temperature in a chamber filled with ACSF containing the follow-ing (in mM): 126 NaCl, 26 NaHCO3, 2.5 KCl, 1.25 NaH2PO4, 2 CaCl2, 2MgCl2, and 10 glucose (bubbled with 95% O2 and 5% CO2; pH 7.3; 310mOsm measured). Slices were transferred to a recording chamber andcontinuously superfused with ACSF saturated with 95% O2 and 5% CO2.Pyramidal ACC neurons were recorded in the whole-cell patch configu-ration. Patch pipettes were pulled from borosilicate glass capillaries(Harvard Apparatus) using a P-1000 puller (Sutter Instruments). Foroptogenetic experiments performed in AAV5-CaMKIIa-eArchT3.0-EYFP-injected animals, pipettes were filled with a solution containing thefollowing (in mM): 145 KCl, 10 HEPES, and 2 MgCl2. For mEPSCs re-cordings, pipettes were filled with a solution containing the following (inmM): 75 Cs2SO4, 10 CsCl, 10 HEPES, and 2 MgCl2. The pH of intrapi-pette solutions was adjusted to 7.3 with KOH, and osmolarity to 310mOsm with sucrose. With this solution, the patch pipettes had an opentip resistance from 3.5 to 4.5 M�. Recordings were performed in thepresence of CNQX (10 �M) and bicuculline (10 �M) for optogeneticexperiments, whereas mEPSCs were recorded with TTX (0.5 �M) in therecording solution. For optogenetic experiments, the ACC was illumi-nated with the same system used for the in vivo experiments (see below)triggered with WinWCP 4.3.5, the optic fiber being localized in the re-cording chamber at 3 mm from the recorded neuron. In voltage-clampmode, the holding potential was fixed at �60 mV, and in current-clampmode at a holding current allowing maintaining the resting neuron at��60 mV. Recordings were acquired with WinWCP 4.3.5 (courtesy of
3104 • J. Neurosci., March 21, 2018 • 38(12):3102–3115 Sellmeijer et al. • Cortex in Chronic Pain-Induced Depression
Dr. J. Dempster, University of Strathclyde, Glasgow, United Kingdom).All recordings were performed at 34°C.
In vivo electrophysiological recordingsAnimals were anesthetized in an induction box with a 2% isoflurane/airmixture (Vetflurane, Virbac) and then placed in a Kopf stereotaxic frame(KOPF 1730) equipped with a tight nose mask to continuously deliverthe anesthesia.
A 1 � 1.4 mm cranial window was prepared directly anterior to thebregma, ranging from �0.7 to 0.7 mm lateral from the midline. The durawas opened to lower the glass electrode into the brain. Recordings ofspontaneous activity were performed using sharp electrodes pulled fromborosilicate micropipettes (1.2 mm outer and 0.69 mm inner diameters,Harvard Apparatus, 30 – 0044), with a Narashige pipette puller (tip di-ameter � 1 �m, resistance �25 M�). The glass electrodes were filled with0.5 M potassium acetate solution. The signal from the electrode was re-corded by a silver wire, amplified using an operational amplifier (Neu-rodata IR-183A, Cygnus Technology; gain � 10), and then amplifiedfurther and filtered using a differential amplifier (Model 440, BrownleePrecision; gain � 100; bandpass filter 0.1–10 kHz). The signal was thendigitized with a CED digitizer (sampling rate: 20 kHz) and recorded withSpike2 software (version 7.12b, Cambridge Electronic Design). Raw datafiles were exported into MATLAB (The MathWorks) and analyzed withcustom-made MATLAB scripts, which are available in a bitbucket repos-itory entitled Sellmeijer, 2016.
During the recording procedure, isoflurane anesthesia was lowered to0.5%– 0.75% and was monitored by regular paw pinching. The glasspipette was slowly lowered using a Scientifica one-dimensional micro-manipulator, and recordings were made between 0.2 and 1.0 mm ante-rior to the bregma ranging from �0.5 to 0.5 mm from the midline, whichcorresponds to layers II/III of the cortex. Neurons were recorded fromthe brain surface until 1500 �m deep. Once stable cell activity was de-tected, a 5 min segment of spontaneous activity was recorded. Recordingsites were marked by iontophoretically injecting a 4% Pontamine Skyblue dye (Sigma-Aldrich) in 0.5 M sodium-acetate solution (Sigma-Aldrich). At the end of the recording, the mice were perfused, the brainwas collected, and 40 �m sections were cut on a cryostat. The position ofrecorded cells was registered using the microdrive reference point withrespect to the Pontamine Sky blue dye deposit.
Firing rate and bursting activity were calculated. Bursting activity,defined as �3 spikes within a 50 ms time window, was analyzed bycalculating the total number of bursting events within a 90 s data seg-ment. Neurons in which �20% of action potentials occurred in a burst-ing event were considered bursting neurons. The average number ofspikes within a bursting event was also calculated.
Experimental design and statistical analysisBefore starting experiments, based on our previous behavioral studies,we estimated the sample size by using power analysis. All behavioral tests,in vivo electrophysiological recordings, and experiments using optoge-netic approach were replicated several times. For each group, the me-chanical sensitivity and anxiodepressive-like behaviors were analyzed
before recordings and optogenetic manipula-tion. The number of animals per group is indi-cated in each behavioral graph; and both thenumber of recorded cells and of animals pergroup is indicated in each electrophysiologygraph. Data are mean � SEM. When data werenot normally distributed, the Kruskal–Wallistest was performed followed by Mann–Whit-ney U post hoc tests to compare the means.When data were normally distributed, groupswere compared with ANOVA multiple groupcomparisons followed by Duncan post hocanalysis, or with the Student’s t test. For thevon Frey results, we used a multifactorialANOVA, considering paws (ipsilateral vs con-tralateral) and TPs as two levels of dependentdata, and surgery (sham vs cuff) as indepen-dent groups. Significance level was set to p �
0.05. Statistical analyses were performed with MATLAB 2014a (TheMathWorks) and Statistica version 7.1 (Statsoft).
ResultsLong-term characterization of different symptoms ofneuropathic painIt has been previously shown that the anxiodepressive-like con-sequences of neuropathic pain evolve over time (Suzuki et al.,2007; Goncalves et al., 2008; Yalcin et al., 2011). Indeed, whereasmechanical hypersensitivity is immediately present followingnerve injury in the cuff model, mice develop anxiety-related be-haviors 3– 4 weeks later, while depression-related behaviors areobserved after 6 – 8 weeks (Yalcin et al., 2011). On the longerterm, cuff-implanted animals recover spontaneously from mechan-ical hypersensitivity (example from one batch of mice: F(13,260) 5.54, p 6.9 � 10�9; cuff�sham: first p 2.7 � 10�6; week 3,p 8.8 � 10�7; week 5, p 1 � 10�6; week 7, p 1.8 � 10�6;week 9, p 1.5 � 10�6; Fig. 1). Depending on the consideredbatch of animals, this recovery happened between the 11th and14th weeks after operation. However, it is to be noted that all micedisplayed mechanical hypersensitivity up to the 10th weeks afteroperation, and that no mice was hypersensitive at 15 weeks afteroperation. This recovery from mechanical hypersensitivity raisesthe question of whether the aversiveness of ongoing pain and/orthe anxiodepressive-like consequences of chronic pain also dis-appear or remain present.
As reported previously (Yalcin et al., 2011), the nerve-injuredanimals did not show anxiodepressive-like behaviors yet at 2weeks after operation (dark-light test, Fig. 2A; NSF test, Fig. 2C)or at 3 weeks after operation (splash test, Fig. 2B), even thoughmechanical hypersensitivity was already present (VF: p 0.01,Fig. 2A; p 0.0001, Fig. 2B; p 0.001, Fig. 2C). In the dark-lighttest, nerve-injured animals displayed increased anxiety-like be-havior at 8 weeks after operation, as shown by the reduced timespent in the lit compartment (p 6.17 � 10�4; Fig. 2A). Thisbehavior disappeared at 11 and 15 weeks after operation, coin-ciding with the recovery from mechanical hypersensitivity in thesame animals (Fig. 1). In contrast, in the splash test, decreasedgrooming behavior was present at 9 weeks after operation (p 0.01), but also at 12 weeks (p 0.003) and 14 weeks after oper-ation (p 0.0011) (Fig. 2B) despite that mechanical hypersensi-tivity was no longer present in these sets of animals at these last2 TPs. The deficit in grooming behavior, however, disappeared at16 weeks after operation (Fig. 2B). Recovery was even more de-layed in the NSF test, for which an increased latency to feed waspresent at 8 (p 3.3 � 10�4), 11 (p 0.0437), and 16 weeks afteroperation (p 0.0016) (with no mechanical hypersensitivity at
PW
T (g
)
Cuff, ContralateralCuff, Ipsilateral
Sham, ContralateralSham, Ipsilateral
(Weeks)
***0 2 4 6 8 10 12 14 16 18 20
0
1
2
3
4
5
6
Figure 1. Nerve injury induces mechanical hypersensitivity. In C57BL/6J mice, unilateral sciatic nerve compression induces an
ipsilateral long-lasting mechanical hypersensitivity which lasts�11 weeks. After this period, mechanical thresholds return back to
sham levels spontaneously. Sham, n 24; Cuff, n 24. Data are mean � SEM. ***p � 0.001. PWT, Paw withdrawal threshold.
Sellmeijer et al. • Cortex in Chronic Pain-Induced Depression J. Neurosci., March 21, 2018 • 38(12):3102–3115 • 3105
these last 2 TPs), with recovery at 18 and 21 weeks after operation(Fig. 2C). The presence of depressive-like behavior as assessedusing the forced swimming test was also long-lasting. Indeed,nerve-injured mice spent more time immobile at 7 (p 4.33 �10�5), 14 (p 0.0043), and 17 weeks after operation (p
0.0023) (with no mechanical hypersensitivity at these last 2 TPs)(Fig. 2D), and returned back to sham level only at 18 and 21 weeksafter operation (Fig. 2D). Each von Frey result obtained the sameweek as the anxiodepressive behavioral tests is presented near theanxiodepressive behavioral graph (Fig. 2A–D).
DL
NSF
Splash
FST
A
CuffSham
Imm
obili
ty d
urat
ion
(s)
7W
0
50
100
150 ***
200
9 10 Imm
obili
ty d
urat
ion
(s)
17W14W
0
50
100
150 ** **
200
6 6 15 14
21W
5 6Im
mob
ility
dur
atio
n (s
)
21W
5 6
Late
ncy
to fe
ed (s
)
0
50
100
150
200 16W
**
15 15
11W
Late
ncy
to fe
ed (s
)
8W
0
50
100
150
200
***
*
6 59 10
Gro
omin
g (%
of S
ham
) 14W 16W
**
6 6 15 15
8W
Tim
e in
ligh
t box
(% o
f sha
m)
0
50
100
150
***
8 10
B
C
D
0
50
100
150
200 18W
Tim
e in
ligh
t box
(% o
f sha
m)
0
50
100
150 2W 15W
15 150
50
100
150 11W
12 12 12 10
Late
ncy
to fe
ed (s
)
0
50
100
150
200 2W
Late
ncy
to fe
ed (s
)0
50
100
150
200 18W
12 10 12 10
0
50
100
150 3W
12 120
50
100
150 9W
Gro
omin
g (%
of S
ham
)
12 10
**
Gro
omin
g (%
of S
ham
)
0
50
100
150
10
12W
**
12 10
Mechanical allodynia
Anxiodepressive consequences
9 10
Tim
e in
ligh
t box
(% o
f sha
m)
TP1 TP2 TP3 TP4
Sham (10)
842.1±53.9 789.4±61.91
Cuff (10)Activity Score
E
1067.1±80 963.5±57.8
Activity Score
938.7±66.4 898.1±58.9
Activity Score
0
3
6
PW
T (g
)
ShamCuff
00
3
6
PW
T (g
)
00
3
6
PW
T (g
)
00
3
6
PW
T (g
)
0
3
6
PW
T (g
)
3
6
PW
T (g
)
0
3
6
0
3
6
PW
T (g
)
PW
T (g
)
0
3
6
PW
T (g
)
0
3
6
PW
T (g
)
0
3
6
PW
T (g
)
0
3
6
PW
T (g
)
0
3
6
PW
T (g
)
0
3
6
PW
T (g
)
0
3
6
PW
T (g
)
0
3
6
PW
T (g
)
PW
T (g
)
0
3
6
0
3
6
PW
T (g
)
0
3
6
PW
T (g
)
PW
T (g
)
0
3
6
Sham (12)Sham (12) )01( ffuC )21( ffuC
**
***
***
***
**
***
***
Figure 2. Long-term anxiodepressive-like consequences of neuropathic pain. Neuropathic pain induces anxiodepressive-like consequences, which disappear in a time-dependent manner. Sciatic
nerve injury significantly: decreases the time spent in the lit compartment of the dark-light (DL) box at 8 but not at 2, 11, and 15 weeks (W) after operation (A), decreases grooming behavior in the
splash test at 9, 12, and 14 but not at 3 and16 weeks after operation (B), increases the latency to feed in the NSF at 8, 11, 16 but not at 2, 18, 21 weeks after operation (C), increases immobility time
at 7, 14, 17 but not at 18, 21 weeks after operation in the forced swimming test (FST) (D). Cuff-implanted animals did not show any locomotor activity deficits at TP1, TP2, and TP3 (E). For a given
test, each TP was obtained in an independent set of mice and their corresponding von Frey results are presented nearby (A–D). TP1 corresponds to animals displaying mechanical hypersensitivity
but not yet anxiodepressive-like consequences, TP2 corresponds to animals displaying both mechanical hypersensitivity and anxiodepressive-like consequences, TP3 corresponds to animals that
recovered from mechanical hypersensitivity but still displayed depressive-like consequences, TP4 corresponds to animals that recovered from both mechanical hypersensitivity and anxiodepressive-
like consequences. Data are mean � SEM. Numbers in the bars or nearby activity scores indicate the number of animals. *p � 0.05, **p � 0.01, ***p � 0.001. For other TP data between 2 weeks
and 9 weeks after operation, see Yalcin et al. (2011).
3106 • J. Neurosci., March 21, 2018 • 38(12):3102–3115 Sellmeijer et al. • Cortex in Chronic Pain-Induced Depression
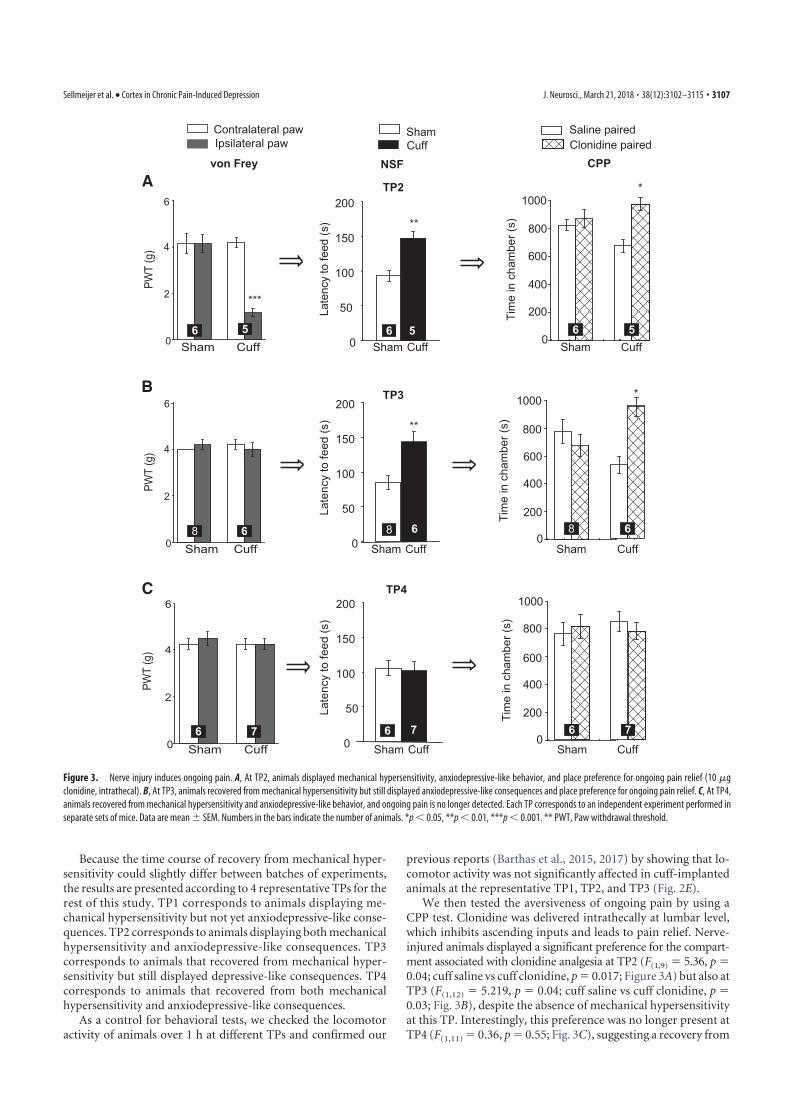
Because the time course of recovery from mechanical hyper-sensitivity could slightly differ between batches of experiments,the results are presented according to 4 representative TPs for therest of this study. TP1 corresponds to animals displaying me-chanical hypersensitivity but not yet anxiodepressive-like conse-quences. TP2 corresponds to animals displaying both mechanicalhypersensitivity and anxiodepressive-like consequences. TP3corresponds to animals that recovered from mechanical hyper-sensitivity but still displayed depressive-like consequences. TP4corresponds to animals that recovered from both mechanicalhypersensitivity and anxiodepressive-like consequences.
As a control for behavioral tests, we checked the locomotoractivity of animals over 1 h at different TPs and confirmed our
previous reports (Barthas et al., 2015, 2017) by showing that lo-comotor activity was not significantly affected in cuff-implantedanimals at the representative TP1, TP2, and TP3 (Fig. 2E).
We then tested the aversiveness of ongoing pain by using aCPP test. Clonidine was delivered intrathecally at lumbar level,which inhibits ascending inputs and leads to pain relief. Nerve-injured animals displayed a significant preference for the compart-ment associated with clonidine analgesia at TP2 (F(1,9) 5.36, p 0.04; cuff saline vs cuff clonidine, p 0.017; Figure 3A) but also atTP3 (F(1,12) 5.219, p 0.04; cuff saline vs cuff clonidine, p 0.03; Fig. 3B), despite the absence of mechanical hypersensitivityat this TP. Interestingly, this preference was no longer present atTP4 (F(1,11) 0.36, p 0.55; Fig. 3C), suggesting a recovery from
*
CPPClonidine pairedSaline paired
Tim
e in
cha
mbe
r (s)
0
200
400
600
800
1000
Sham Cuff
*
Tim
e in
cha
mbe
r (s)
0
200
400
600
800
1000
Sham Cuff
Tim
e in
cha
mbe
r (s)
0
200
400
600
800
1000
Sham Cuff6 5
8 6
6 7
0
2
4
6
Ipsilateral pawContralateral paw
0
2
4
6
0
2
4
6
PWT
(g)
PWT
(g)
PWT
(g)
von Frey
TP3
TP4
TP2
Sham Cuff
Sham Cuff
Sham Cuff
A
B
***
Late
ncy
to fe
ed (s
)
0
50
100
150
200
Sham Cuff
NSF
C
CuffSham
Late
ncy
to fe
ed (s
)
0
50
100
150
200
Sham Cuff
Late
ncy
to fe
ed (s
)
0
50
100
150
200
Sham Cuff
**
**
556 6
66 88
77 66
Figure 3. Nerve injury induces ongoing pain. A, At TP2, animals displayed mechanical hypersensitivity, anxiodepressive-like behavior, and place preference for ongoing pain relief (10 �g
clonidine, intrathecal). B, At TP3, animals recovered from mechanical hypersensitivity but still displayed anxiodepressive-like consequences and place preference for ongoing pain relief. C, At TP4,
animals recovered from mechanical hypersensitivity and anxiodepressive-like behavior, and ongoing pain is no longer detected. Each TP corresponds to an independent experiment performed in
separate sets of mice. Data are mean � SEM. Numbers in the bars indicate the number of animals. *p � 0.05, **p � 0.01, ***p � 0.001. ** PWT, Paw withdrawal threshold.
Sellmeijer et al. • Cortex in Chronic Pain-Induced Depression J. Neurosci., March 21, 2018 • 38(12):3102–3115 • 3107
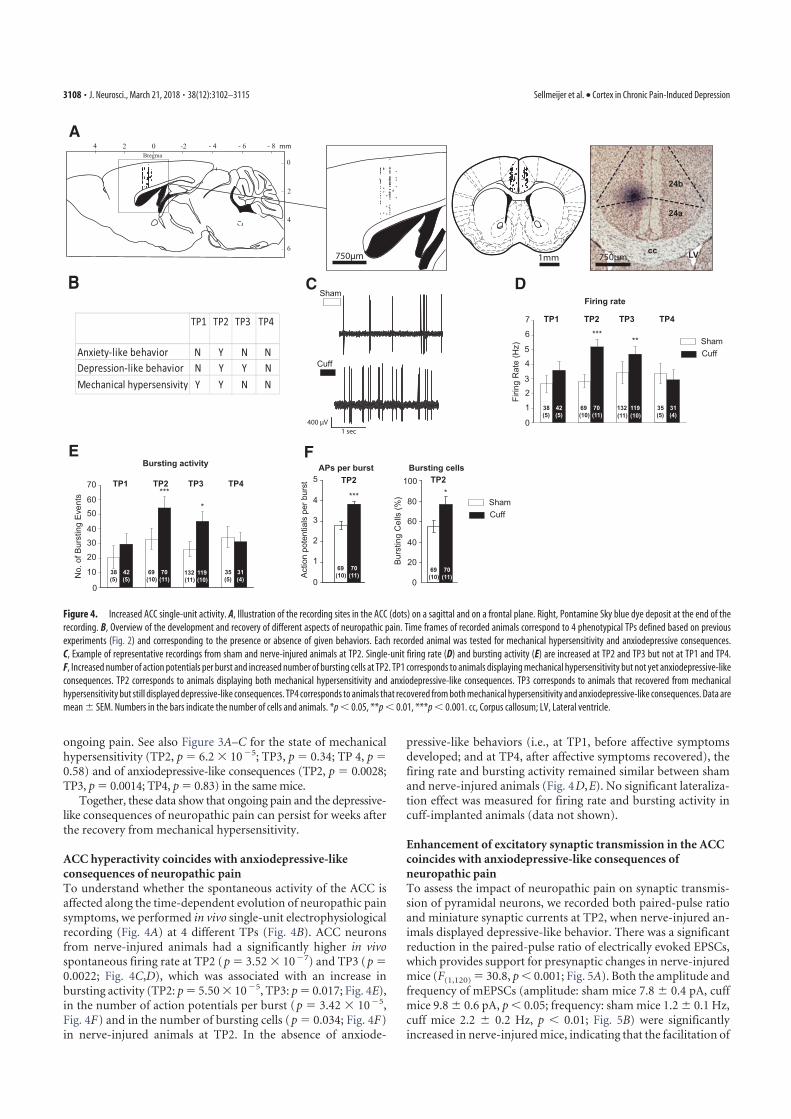
ongoing pain. See also Figure 3A–C for the state of mechanicalhypersensitivity (TP2, p 6.2 � 10�5; TP3, p 0.34; TP 4, p 0.58) and of anxiodepressive-like consequences (TP2, p 0.0028;TP3, p 0.0014; TP4, p 0.83) in the same mice.
Together, these data show that ongoing pain and the depressive-like consequences of neuropathic pain can persist for weeks afterthe recovery from mechanical hypersensitivity.
ACC hyperactivity coincides with anxiodepressive-likeconsequences of neuropathic painTo understand whether the spontaneous activity of the ACC isaffected along the time-dependent evolution of neuropathic painsymptoms, we performed in vivo single-unit electrophysiologicalrecording (Fig. 4A) at 4 different TPs (Fig. 4B). ACC neuronsfrom nerve-injured animals had a significantly higher in vivospontaneous firing rate at TP2 (p 3.52 � 10�7) and TP3 (p 0.0022; Fig. 4C,D), which was associated with an increase inbursting activity (TP2: p 5.50 � 10�5, TP3: p 0.017; Fig. 4E),in the number of action potentials per burst (p 3.42 � 10�5,Fig. 4F) and in the number of bursting cells (p 0.034; Fig. 4F)in nerve-injured animals at TP2. In the absence of anxiode-
pressive-like behaviors (i.e., at TP1, before affective symptomsdeveloped; and at TP4, after affective symptoms recovered), thefiring rate and bursting activity remained similar between shamand nerve-injured animals (Fig. 4D,E). No significant lateraliza-tion effect was measured for firing rate and bursting activity incuff-implanted animals (data not shown).
Enhancement of excitatory synaptic transmission in the ACCcoincides with anxiodepressive-like consequences ofneuropathic painTo assess the impact of neuropathic pain on synaptic transmis-sion of pyramidal neurons, we recorded both paired-pulse ratioand miniature synaptic currents at TP2, when nerve-injured an-imals displayed depressive-like behavior. There was a significantreduction in the paired-pulse ratio of electrically evoked EPSCs,which provides support for presynaptic changes in nerve-injuredmice (F(1,120) 30.8, p � 0.001; Fig. 5A). Both the amplitude andfrequency of mEPSCs (amplitude: sham mice 7.8 � 0.4 pA, cuffmice 9.8 � 0.6 pA, p � 0.05; frequency: sham mice 1.2 � 0.1 Hz,cuff mice 2.2 � 0.2 Hz, p � 0.01; Fig. 5B) were significantlyincreased in nerve-injured mice, indicating that the facilitation of
A
DC
0
2
4
6
4 2 0 -2 - 4 - 6 - 8Bregma
Cuff
Sham
Firin
g R
ate
(Hz)
0
1
2
3
4
5
6Sham Cuff
TP2TP1 TP3 TP4
Firing rate
*****
7
42(5)
38(5)
69(10)
70(11)
119(11)132
(10)31(4)
35(5)
Act
ion
pote
ntia
ls p
er b
urst
0
1
2
3
4
APs per burstTP2
***
5
69(10)
70(11)
Bursting activity
No.
of B
urst
ing
Eve
nts
0
10
20
3040
5060
***
*
42(5)
38(5)
69(10)
70(11)
119(11)132
(10)31(4)
35(5)
70
B
mm
1 sec400 μV
TP1 TP2 TP3 TP4
Anxiety-like behavior N Y N N
Mechanical hypersensivity Y Y N N
Bursting cellsTP2
Bur
stin
g C
ells
(%)
0
20
40
60
80
100*
N Y Y NDepression-like behavior
LVcc
24a
24b
750μm 750μm1mm
F
TP2TP1 TP3 TP4
Sham Cuff
69(10)
70(11)
E
Figure 4. Increased ACC single-unit activity. A, Illustration of the recording sites in the ACC (dots) on a sagittal and on a frontal plane. Right, Pontamine Sky blue dye deposit at the end of the
recording. B, Overview of the development and recovery of different aspects of neuropathic pain. Time frames of recorded animals correspond to 4 phenotypical TPs defined based on previous
experiments (Fig. 2) and corresponding to the presence or absence of given behaviors. Each recorded animal was tested for mechanical hypersensitivity and anxiodepressive consequences.
C, Example of representative recordings from sham and nerve-injured animals at TP2. Single-unit firing rate (D) and bursting activity (E) are increased at TP2 and TP3 but not at TP1 and TP4.
F, Increased number of action potentials per burst and increased number of bursting cells at TP2. TP1 corresponds to animals displaying mechanical hypersensitivity but not yet anxiodepressive-like
consequences. TP2 corresponds to animals displaying both mechanical hypersensitivity and anxiodepressive-like consequences. TP3 corresponds to animals that recovered from mechanical
hypersensitivity but still displayed depressive-like consequences. TP4 corresponds to animals that recovered from both mechanical hypersensitivity and anxiodepressive-like consequences. Data are
mean � SEM. Numbers in the bars indicate the number of cells and animals. *p � 0.05, **p � 0.01, ***p � 0.001. cc, Corpus callosum; LV, Lateral ventricle.
3108 • J. Neurosci., March 21, 2018 • 38(12):3102–3115 Sellmeijer et al. • Cortex in Chronic Pain-Induced Depression

**
BA
C
D
0
Sham CuffSham
Cuff
20 pA
5 s
Sham Cuff
Sham Cuff
NMDAR mediated EPSCs
CuffSham
Sham Cuff
*
**
*
*
*
*
** * *
*
CuffSham
2.0
1.5
1.0
0.5
0.0
Pai
red-
puls
e ra
tio
40 60 80 100 120 140 160Interval time (ms)
12
10
8
6
4
2
0
mE
PS
C A
mpl
itude
(pA
)
3
2
1
0
mE
PS
C F
requ
ency
(Hz)
AMPAR mediated EPSCs
AM
PA
rece
ptor
med
iate
dE
PS
C A
mpl
itude
(pA
)
400
300
200
100
05 6 7 8 9
Stimulation intensity (V)
100
50
0
-50
-100
-150
-80 -60 -40 -20 4020 60Vm (mV)
I (%)
NM
DA
rece
ptor
med
iate
dE
PS
C A
mpl
itude
(pA
)
250
200
150
100
50
04 6 8 10 12
Stimulation intensity (V)
100
50
0
-50
-100
-80 -60 -40 -20 4020 60Vm (mV)
I (%)
ShamCuff
ShamCuff
[11 (4)][15 (5)]
18 (3)
12 (3)
18 (3)
12 (3)
[11 (4)][11 (4)]
ShamCuff
[7 (3)][7 (3)]
ShamCuff
[6 (3)][7 (3)] Sham
Cuff[10 (4)][9 (4)]
50 pA
50 ms
100 pA
50 ms
100 pA
50 ms
50 pA
100 ms
50 pA
100 ms
** ** ******
**
Figure 5. Facilitated presynaptic and postsynaptic ACC transmission in nerve-injured animals displaying depressive-like behaviors. A, Samples (top) and summarized results (bottom) showed
that the paired-pulse ratios, with recorded intervals of 35, 50, 75, 100, and 150 ms, were decreased in the cuff group compared with the sham group. B, Samples (top) and summarized results
(bottom) of the amplitude and frequency of mEPSCs. Both amplitude and frequency were increased in the cuff group compared with the sham group. (Figure legend continues.)
Sellmeijer et al. • Cortex in Chronic Pain-Induced Depression J. Neurosci., March 21, 2018 • 38(12):3102–3115 • 3109
excitatory synaptic transmission onto pyramidal ACC neuronsinvolved presynaptic and postsynaptic changes. Interestingly,both the slopes of the AMPAR-mediated input– output curve(F(1,97) 17.1, p � 0.001; Fig. 5C, left) and NMDAR-mediatedinput– output curve (F(1,55) 7.7, p � 0.01; Fig. 5D, left) wereshifted to the left in nerve-injured mice, suggesting that an up-regulation of AMPA and NMDA receptors could contribute toexcitatory facilitation. We then tested the AMPAR and NMDAR-mediated I–V relationship and found that there was no differencein the AMPAR-mediated I–V between sham and nerve-injuredmice (F(1,108) 2.0, p 0.15; Fig. 5C, right). However, theNMDAR-mediated I–V curve differed between groups (F(1,153) 61.3, p � 0.01; Fig. 5D). When the same experiments were per-formed at TP3, which corresponds to animals still displayingdepressive-like behaviors after recovery from mechanical hyper-sensitivity, we observed that the mEPSC frequency was stillincreased (F(1,19) 8.974; p 0.008; Fig. 6), but not the paired-pulse ratio of evoked EPSCs. This finding indicates that the spon-taneous release of glutamate was still enhanced in the ACC afterthe recovery from mechanical hypersensitivity. Neither the AMPARnor the NMDAR-mediated input and output curves were altered.Interestingly, the NMDAR I–V curve remained different in thecuff group (F(1,108) 15.54; p 0.001; Fig. 6).
Inhibition of the ACC relieves the emotional consequences ofneuropathic painBased on our results demonstrating ACC hyperactivity in micedisplaying anxiodepressive-like behaviors, we studied whetheroptogenetic inhibition of the ACC may counteract these con-sequences.
The delivery of AAV5-CaMKIIa-eArchT3.0-EYFP resulted inreliable virus transfection in the ACC, which was confirmed byEYFP fluorescence (Fig. 7A). To characterize the effect of greenlaser light illumination on transfected ACC neurons, we per-formed ex vivo electrophysiological recordings. Patch-clamprecordings showed that illumination with green light reliablyinhibited spontaneous action potential firing in the current-clamp mode, and induced an outward current in the voltage-clamp mode (Fig. 7B).
In vivo, mechanical hypersensitivity was not affected by theACC inhibition at either TP2 (F(1,26) 60.29, p 0.3 � 10�8,cuff right � sham right, p 0.0001) or TP3 (F(1,20) 0.0032, p 0.95) (Fig. 7C). However, inhibition of the targeted ACC neuronsinduced a place preference in nerve-injured animals at both TPs(i.e., when mechanical hypersensitivity was still present) (TP2,F(1,18) 5.42, p 0.031, cuff stimulated [light on] vs cuff control,p 0.006) (Fig. 7D) or after it recovered (TP3, F(1,8) 8.66, p 0.018, cuff stimulated [light on] vs cuff control, p 0.039; Figure7D), without having any effect in sham animals. These findingsindicate that the inhibition of the CaMKIIa ACC neurons re-lieved the aversiveness of ongoing pain in nerve-injured mice.
Finally, we showed that optogenetic inhibition of the ACCalso suppressed the anxiodepressive-like behaviors in nerve-
injured animals, as observed by a normalization of groomingbehavior in the splash test (Fig. 7E) at both TP2 (p 0.0033, cuffno-light vs cuff light on) and TP3 (p 0.03, cuff no-light vs cufflight on), and of the feeding latency in the NSF test at TP2 (p 0.0013) (Fig. 7F). “No-light delivered” nerve-injured animals,however, still displayed characteristic chronic pain induced-behaviors (sham no-light vs cuff no-light grooming duration:p 0.03, TP2; p 0.01, TP3; Fig. 7E; sham no-light vs cuffno-light latency to feed: p 0.015, TP2; p 0.015, TP3; Fig. 7F).Together, our results show that a selective inhibition of ACCexcitatory neurons is sufficient to alleviate the long-lasting con-sequences of neuropathic pain.
DiscussionWe show here that different symptoms of neuropathic pain,including mechanical hypersensitivity, aversiveness of ongoingpain, and anxiodepressive-like consequences, display differenttime courses following nerve injury. The in vivo electrophysiolog-ical recordings showed an ACC hyperactivity coinciding with thetime window of pain aversiveness and of anxiodepressive-likebehaviors. Ex vivo patch-clamp recordings further supported ACChyperactivity, as shown by increased excitatory postsynaptictransmission and increased contribution of NMDA receptors.Finally, our results show that optogenetic inhibition of the ACCcan alleviate the aversiveness and anxiodepressive-like conse-quences of neuropathic pain.
A growing number of preclinical studies shows that the anxio-depressive-like consequences of chronic pain evolve over time(Yalcin et al., 2011; Alba-Delgado et al., 2013), raising the ques-tion of whether the various symptoms of neuropathic pain areinterdependent or whether they develop separately. With themodel and species used in this study, animals develop mechanicalhypersensitivity immediately after nerve injury and spontane-ously recover �3 months later, which allows studying the behav-ioral consequences of neuropathic pain in the presence andabsence of mechanical hypersensitivity. Patients with chronicpain also experience ongoing pain, which is rarely evaluated inpreclinical studies. In animals, this symptom can be unmasked byalleviating the pain-related tonic aversive state in a CPP proce-dure (King et al., 2009; Barthas et al., 2015). For instance, lido-caine injected into the rostral ventromedial medulla, the brainarea mediating descending modulation of pain (Wang et al.,2013), or spinal injection of clonidine (King et al., 2009; Barthaset al., 2015), induces place preference only in nerve-injured ani-mals. In the present study, we also detected the presence of on-going pain at TP3 (i.e., when mechanical hypersensitivity is nolonger present), a finding that represents, to our knowledge, thefirst evidence in an animal model for a naturally occurring tem-poral dichotomy between evoked and ongoing pain. The hyper-sensitivity and ongoing pain that follow nerve injury have beenproposed to share some mechanistic features. Indeed, both mayimply an upregulation of voltage-gated Nav1.8 channels inprimary afferent neurons (Yang et al., 2014), an alteration ofdescending pathways (Wang et al., 2013). and of spinal NK-1-positive ascending projections (King et al., 2011). Studies alsopointed out that they can be distinguished mechanistically as wellas neuroanatomically. An ACC lesion can block the aversivenessof ongoing pain in both neuropathic (Qu et al., 2011; Barthas etal., 2015) and inflammatory pain models without affecting me-chanical hypersensitivity (Johansen et al., 2001; Chen et al., 2014;Barthas et al., 2015), whereas lesioning the posterior insular cor-tex can suppress the maintenance of mechanical hypersensitivity
4
(Figure legend continued.) C, Samples (top) and summarized results (bottom) showed that the
input– output curve of AMPARs-mediated EPSCs was steeper in the cuff group. However, the
I–V curves were not changed. D, Samples (top) and summarized results (bottom) showed that
the input– output curve of NMDARs-mediated EPSCs was steeper in the cuff group. The I–Vcurve in the cuff group differed from that of the sham group. All experiments were performed at
TP2 (8 –9 weeks after surgery), which corresponds to animals displaying both mechanical
hypersensitivity and anxiodepressive-like consequences. *p � 0.05, **p � 0.01. Numbers in
bars or near group names indicate the numbers of cells and animals.
3110 • J. Neurosci., March 21, 2018 • 38(12):3102–3115 Sellmeijer et al. • Cortex in Chronic Pain-Induced Depression
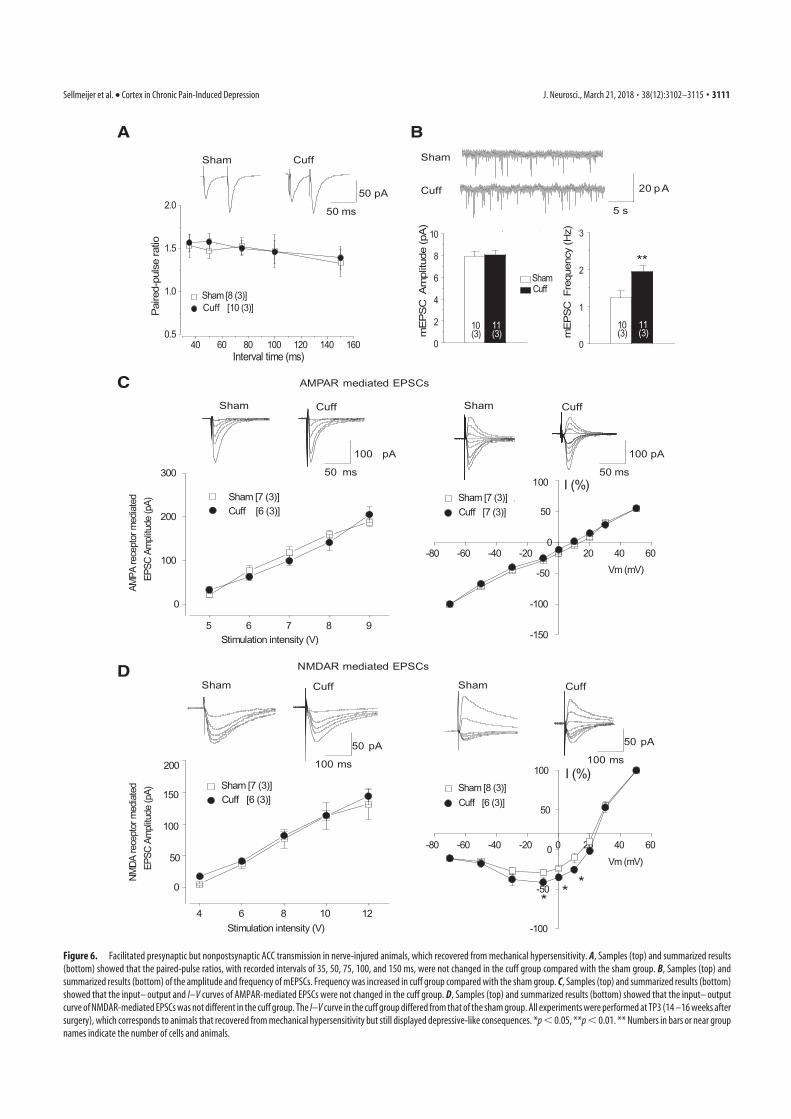
40 60 80 100 120 140 1600.5
1.0
1.5
2.0
Paire
d-pu
lse
ratio
Interval time (ms)
Sham [8 (3)] Cuff [10 (3)]
5 6 7 8 9
0
100
200
300
AMPA
rece
ptor
med
iate
d EP
SC A
mpl
itude
(pA)
Stimulation intensity (V)
Sham [7 (3)] Cuff [6 (3)]
0
2
4
6
8
10
Sham Cuff
11(3)m
EP
SC
Am
plitu
de (p
A)
10(3)
0
1
2
3
11(3)m
EP
SC
Fre
quen
cy (H
z)
10(3)
**
A B
C
D
AMPAR mediated EPSCs
Sham Cuff Sham
Cuff 20 pA
5 s
Sham Cuff Sham Cuff
Sham Cuff Sham Cuff
NMDAR mediated EPSCs
4 6 8 10 12
0
50
100
150
200
NMDA
rece
ptor
med
iate
d EP
SC A
mpl
itude
(pA)
Stimulation intensity (V)
Sham [7 (3)] Cuff [6 (3)]
-80 -60 -40 -20 0 20 40 60
-150
-100
-50
0
50
I (%)
Vm (mV)
Sham [7 (3)] Cuff [7 (3)]
-80 -60 -40 -20 0 20 40 60
-100
-50
0
50
100
I (%)
Vm (mV)
Sham [8 (3)] Cuff [6 (3)]
* * *
100
50 pA
50 ms
100 pA
50 ms
100 pA
50 ms
50 pA
100 ms
50 pA
100 ms
Figure 6. Facilitated presynaptic but nonpostsynaptic ACC transmission in nerve-injured animals, which recovered from mechanical hypersensitivity. A, Samples (top) and summarized results
(bottom) showed that the paired-pulse ratios, with recorded intervals of 35, 50, 75, 100, and 150 ms, were not changed in the cuff group compared with the sham group. B, Samples (top) and
summarized results (bottom) of the amplitude and frequency of mEPSCs. Frequency was increased in cuff group compared with the sham group. C, Samples (top) and summarized results (bottom)
showed that the input– output and I–V curves of AMPAR-mediated EPSCs were not changed in the cuff group. D, Samples (top) and summarized results (bottom) showed that the input– output
curve of NMDAR-mediated EPSCs was not different in the cuff group. The I–V curve in the cuff group differed from that of the sham group. All experiments were performed at TP3 (14 –16 weeks after
surgery), which corresponds to animals that recovered from mechanical hypersensitivity but still displayed depressive-like consequences. *p � 0.05, **p � 0.01. ** Numbers in bars or near group
names indicate the number of cells and animals.
Sellmeijer et al. • Cortex in Chronic Pain-Induced Depression J. Neurosci., March 21, 2018 • 38(12):3102–3115 • 3111
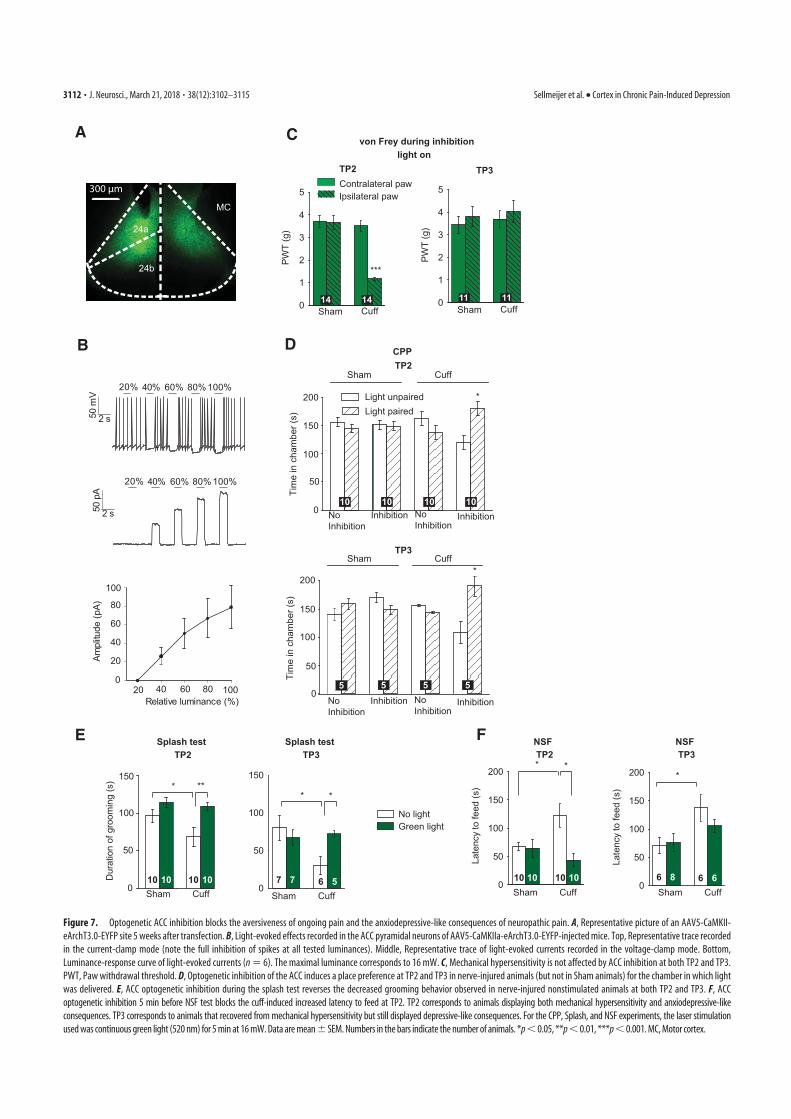
TP2
CPP
2 s50 p
A
2 s50 m
V
20% 40% 60%
0
20
40
60
80
100
Relative luminance (%)
Ampl
itude
(pA)
20 40 60 80 100
von Frey during inhibition
Sham Cuff
TP2
***
Tim
e in
cha
mbe
r (s)
0
50
100
150
200 Light unpairedLight paired
TP2
NoInhibition
Sham Cuff
*
Splash test
Green lightNo light
Dur
atio
n of
gro
omin
g (s
)
0
50
100
150
Sham Cuff
*
NSF
*
A
B
C
D
E F
TP3
Tim
e in
cha
mbe
r (s)
0
50
100
150
200
TP3Sham Cuff
*
10 10 10 10
10 10 10 10
5 5 5 5
TP2
MC
24a
24b
Inhibition
80% 100%
20% 40% 60% 80% 100%
**
*
24a
24b
MC
PW
T (g
)
0
1
2
3
4
5
14 14
light on
Ipsilateral pawContralateral paw
0
50
100
150
200
Late
ncy
to fe
ed (s
)
TP3Splash test NSF
TP3
0
50
100
150
Sham Cuff Sham Cuff
* *
*
7 7 6 5 6 8 6 6
300 μm
PW
T (g
)
NoInhibition
Inhibition
NoInhibition
Inhibition NoInhibition
Inhibition
Sham Cuff0
1
2
3
4
5
11 11
0
50
100
150
200
10 10 10 10
Late
ncy
to fe
ed (s
)
Sham Cuff
Figure 7. Optogenetic ACC inhibition blocks the aversiveness of ongoing pain and the anxiodepressive-like consequences of neuropathic pain. A, Representative picture of an AAV5-CaMKII-
eArchT3.0-EYFP site 5 weeks after transfection. B, Light-evoked effects recorded in the ACC pyramidal neurons of AAV5-CaMKIIa-eArchT3.0-EYFP-injected mice. Top, Representative trace recorded
in the current-clamp mode (note the full inhibition of spikes at all tested luminances). Middle, Representative trace of light-evoked currents recorded in the voltage-clamp mode. Bottom,
Luminance-response curve of light-evoked currents (n 6). The maximal luminance corresponds to 16 mW. C, Mechanical hypersensitivity is not affected by ACC inhibition at both TP2 and TP3.
PWT, Paw withdrawal threshold. D, Optogenetic inhibition of the ACC induces a place preference at TP2 and TP3 in nerve-injured animals (but not in Sham animals) for the chamber in which light
was delivered. E, ACC optogenetic inhibition during the splash test reverses the decreased grooming behavior observed in nerve-injured nonstimulated animals at both TP2 and TP3. F, ACC
optogenetic inhibition 5 min before NSF test blocks the cuff-induced increased latency to feed at TP2. TP2 corresponds to animals displaying both mechanical hypersensitivity and anxiodepressive-like
consequences. TP3 corresponds to animals that recovered from mechanical hypersensitivity but still displayed depressive-like consequences. For the CPP, Splash, and NSF experiments, the laser stimulation
used was continuous green light (520 nm) for 5 min at 16 mW. Data are mean � SEM. Numbers in the bars indicate the number of animals. *p � 0.05, **p � 0.01, ***p � 0.001. MC, Motor cortex.
3112 • J. Neurosci., March 21, 2018 • 38(12):3102–3115 Sellmeijer et al. • Cortex in Chronic Pain-Induced Depression
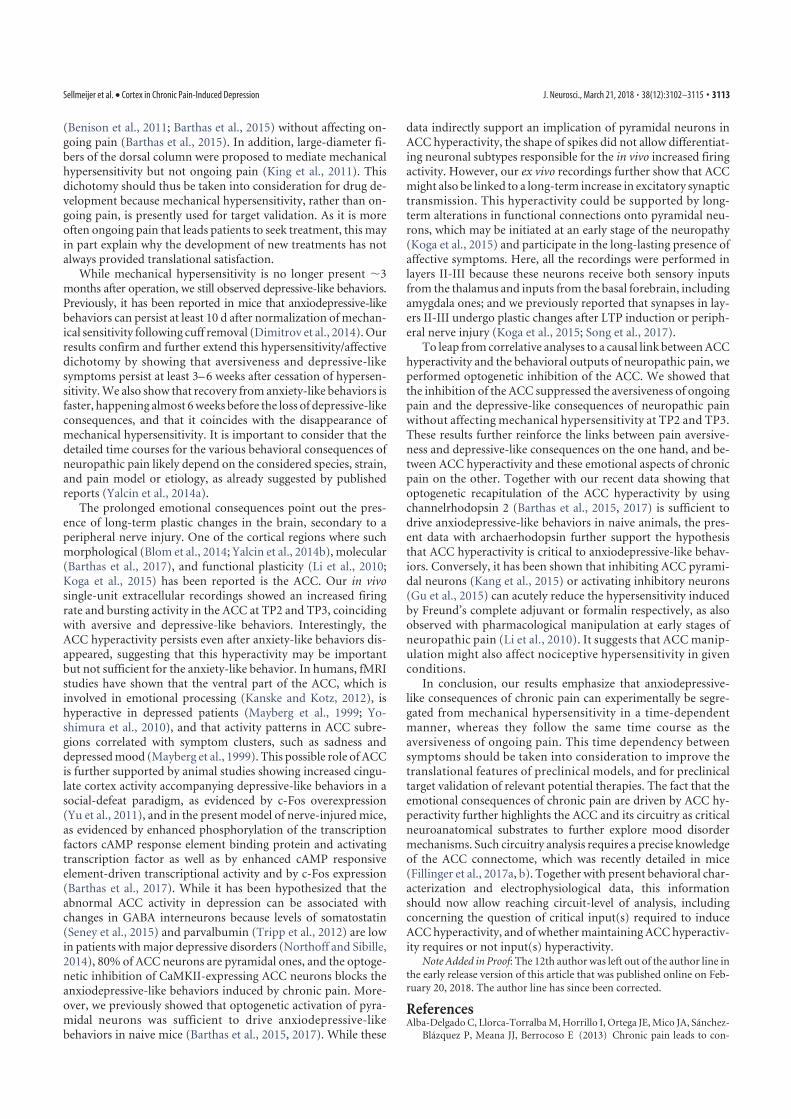
(Benison et al., 2011; Barthas et al., 2015) without affecting on-going pain (Barthas et al., 2015). In addition, large-diameter fi-bers of the dorsal column were proposed to mediate mechanicalhypersensitivity but not ongoing pain (King et al., 2011). Thisdichotomy should thus be taken into consideration for drug de-velopment because mechanical hypersensitivity, rather than on-going pain, is presently used for target validation. As it is moreoften ongoing pain that leads patients to seek treatment, this mayin part explain why the development of new treatments has notalways provided translational satisfaction.
While mechanical hypersensitivity is no longer present �3months after operation, we still observed depressive-like behaviors.Previously, it has been reported in mice that anxiodepressive-likebehaviors can persist at least 10 d after normalization of mechan-ical sensitivity following cuff removal (Dimitrov et al., 2014). Ourresults confirm and further extend this hypersensitivity/affectivedichotomy by showing that aversiveness and depressive-likesymptoms persist at least 3– 6 weeks after cessation of hypersen-sitivity. We also show that recovery from anxiety-like behaviors isfaster, happening almost 6 weeks before the loss of depressive-likeconsequences, and that it coincides with the disappearance ofmechanical hypersensitivity. It is important to consider that thedetailed time courses for the various behavioral consequences ofneuropathic pain likely depend on the considered species, strain,and pain model or etiology, as already suggested by publishedreports (Yalcin et al., 2014a).
The prolonged emotional consequences point out the pres-ence of long-term plastic changes in the brain, secondary to aperipheral nerve injury. One of the cortical regions where suchmorphological (Blom et al., 2014; Yalcin et al., 2014b), molecular(Barthas et al., 2017), and functional plasticity (Li et al., 2010;Koga et al., 2015) has been reported is the ACC. Our in vivosingle-unit extracellular recordings showed an increased firingrate and bursting activity in the ACC at TP2 and TP3, coincidingwith aversive and depressive-like behaviors. Interestingly, theACC hyperactivity persists even after anxiety-like behaviors dis-appeared, suggesting that this hyperactivity may be importantbut not sufficient for the anxiety-like behavior. In humans, fMRIstudies have shown that the ventral part of the ACC, which isinvolved in emotional processing (Kanske and Kotz, 2012), ishyperactive in depressed patients (Mayberg et al., 1999; Yo-shimura et al., 2010), and that activity patterns in ACC subre-gions correlated with symptom clusters, such as sadness anddepressed mood (Mayberg et al., 1999). This possible role of ACCis further supported by animal studies showing increased cingu-late cortex activity accompanying depressive-like behaviors in asocial-defeat paradigm, as evidenced by c-Fos overexpression(Yu et al., 2011), and in the present model of nerve-injured mice,as evidenced by enhanced phosphorylation of the transcriptionfactors cAMP response element binding protein and activatingtranscription factor as well as by enhanced cAMP responsiveelement-driven transcriptional activity and by c-Fos expression(Barthas et al., 2017). While it has been hypothesized that theabnormal ACC activity in depression can be associated withchanges in GABA interneurons because levels of somatostatin(Seney et al., 2015) and parvalbumin (Tripp et al., 2012) are lowin patients with major depressive disorders (Northoff and Sibille,2014), 80% of ACC neurons are pyramidal ones, and the optoge-netic inhibition of CaMKII-expressing ACC neurons blocks theanxiodepressive-like behaviors induced by chronic pain. More-over, we previously showed that optogenetic activation of pyra-midal neurons was sufficient to drive anxiodepressive-likebehaviors in naive mice (Barthas et al., 2015, 2017). While these
data indirectly support an implication of pyramidal neurons inACC hyperactivity, the shape of spikes did not allow differentiat-ing neuronal subtypes responsible for the in vivo increased firingactivity. However, our ex vivo recordings further show that ACCmight also be linked to a long-term increase in excitatory synaptictransmission. This hyperactivity could be supported by long-term alterations in functional connections onto pyramidal neu-rons, which may be initiated at an early stage of the neuropathy(Koga et al., 2015) and participate in the long-lasting presence ofaffective symptoms. Here, all the recordings were performed inlayers II-III because these neurons receive both sensory inputsfrom the thalamus and inputs from the basal forebrain, includingamygdala ones; and we previously reported that synapses in lay-ers II-III undergo plastic changes after LTP induction or periph-eral nerve injury (Koga et al., 2015; Song et al., 2017).
To leap from correlative analyses to a causal link between ACChyperactivity and the behavioral outputs of neuropathic pain, weperformed optogenetic inhibition of the ACC. We showed thatthe inhibition of the ACC suppressed the aversiveness of ongoingpain and the depressive-like consequences of neuropathic painwithout affecting mechanical hypersensitivity at TP2 and TP3.These results further reinforce the links between pain aversive-ness and depressive-like consequences on the one hand, and be-tween ACC hyperactivity and these emotional aspects of chronicpain on the other. Together with our recent data showing thatoptogenetic recapitulation of the ACC hyperactivity by usingchannelrhodopsin 2 (Barthas et al., 2015, 2017) is sufficient todrive anxiodepressive-like behaviors in naive animals, the pres-ent data with archaerhodopsin further support the hypothesisthat ACC hyperactivity is critical to anxiodepressive-like behav-iors. Conversely, it has been shown that inhibiting ACC pyrami-dal neurons (Kang et al., 2015) or activating inhibitory neurons(Gu et al., 2015) can acutely reduce the hypersensitivity inducedby Freund’s complete adjuvant or formalin respectively, as alsoobserved with pharmacological manipulation at early stages ofneuropathic pain (Li et al., 2010). It suggests that ACC manip-ulation might also affect nociceptive hypersensitivity in givenconditions.
In conclusion, our results emphasize that anxiodepressive-like consequences of chronic pain can experimentally be segre-gated from mechanical hypersensitivity in a time-dependentmanner, whereas they follow the same time course as theaversiveness of ongoing pain. This time dependency betweensymptoms should be taken into consideration to improve thetranslational features of preclinical models, and for preclinicaltarget validation of relevant potential therapies. The fact that theemotional consequences of chronic pain are driven by ACC hy-peractivity further highlights the ACC and its circuitry as criticalneuroanatomical substrates to further explore mood disordermechanisms. Such circuitry analysis requires a precise knowledgeof the ACC connectome, which was recently detailed in mice(Fillinger et al., 2017a, b). Together with present behavioral char-acterization and electrophysiological data, this informationshould now allow reaching circuit-level of analysis, includingconcerning the question of critical input(s) required to induceACC hyperactivity, and of whether maintaining ACC hyperactiv-ity requires or not input(s) hyperactivity.
Note Added in Proof: The 12th author was left out of the author line inthe early release version of this article that was published online on Feb-ruary 20, 2018. The author line has since been corrected.
ReferencesAlba-Delgado C, Llorca-Torralba M, Horrillo I, Ortega JE, Mico JA, Sanchez-
Blazquez P, Meana JJ, Berrocoso E (2013) Chronic pain leads to con-
Sellmeijer et al. • Cortex in Chronic Pain-Induced Depression J. Neurosci., March 21, 2018 • 38(12):3102–3115 • 3113
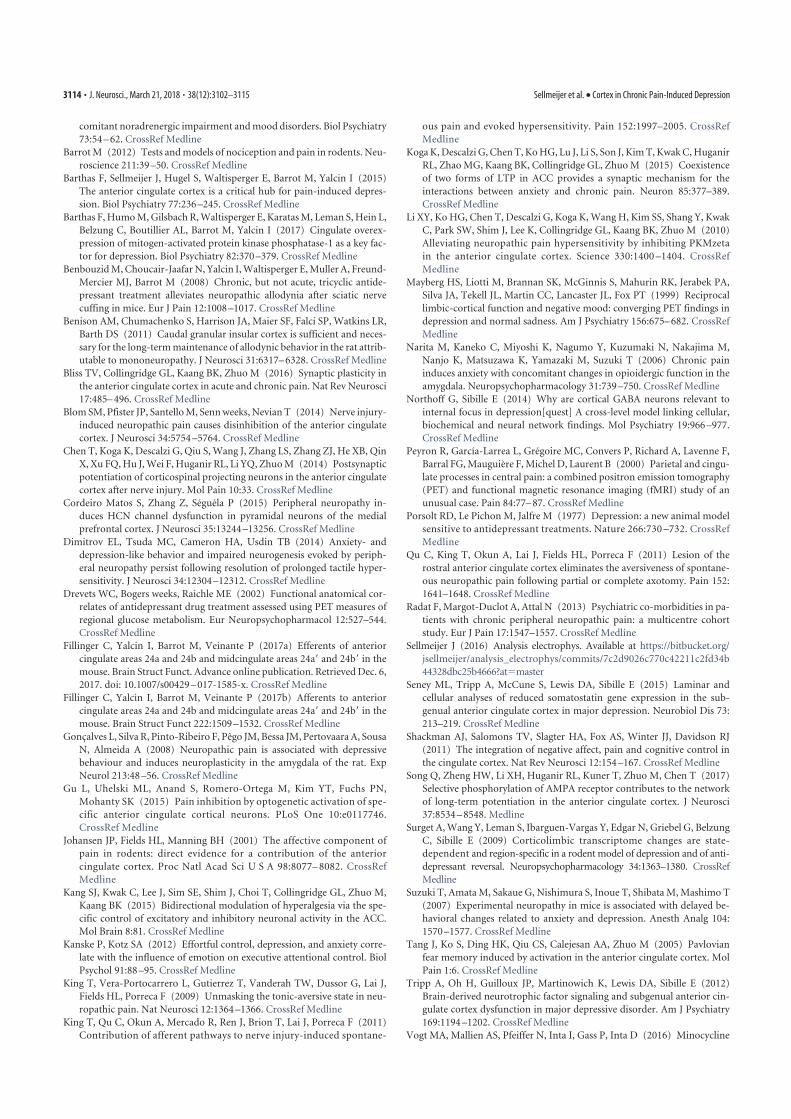
comitant noradrenergic impairment and mood disorders. Biol Psychiatry73:54 – 62. CrossRef Medline
Barrot M (2012) Tests and models of nociception and pain in rodents. Neu-roscience 211:39 –50. CrossRef Medline
Barthas F, Sellmeijer J, Hugel S, Waltisperger E, Barrot M, Yalcin I (2015)The anterior cingulate cortex is a critical hub for pain-induced depres-sion. Biol Psychiatry 77:236 –245. CrossRef Medline
Barthas F, Humo M, Gilsbach R, Waltisperger E, Karatas M, Leman S, Hein L,Belzung C, Boutillier AL, Barrot M, Yalcin I (2017) Cingulate overex-pression of mitogen-activated protein kinase phosphatase-1 as a key fac-tor for depression. Biol Psychiatry 82:370 –379. CrossRef Medline
Benbouzid M, Choucair-Jaafar N, Yalcin I, Waltisperger E, Muller A, Freund-Mercier MJ, Barrot M (2008) Chronic, but not acute, tricyclic antide-pressant treatment alleviates neuropathic allodynia after sciatic nervecuffing in mice. Eur J Pain 12:1008 –1017. CrossRef Medline
Benison AM, Chumachenko S, Harrison JA, Maier SF, Falci SP, Watkins LR,Barth DS (2011) Caudal granular insular cortex is sufficient and neces-sary for the long-term maintenance of allodynic behavior in the rat attrib-utable to mononeuropathy. J Neurosci 31:6317– 6328. CrossRef Medline
Bliss TV, Collingridge GL, Kaang BK, Zhuo M (2016) Synaptic plasticity inthe anterior cingulate cortex in acute and chronic pain. Nat Rev Neurosci17:485– 496. CrossRef Medline
Blom SM, Pfister JP, Santello M, Senn weeks, Nevian T (2014) Nerve injury-induced neuropathic pain causes disinhibition of the anterior cingulatecortex. J Neurosci 34:5754 –5764. CrossRef Medline
Chen T, Koga K, Descalzi G, Qiu S, Wang J, Zhang LS, Zhang ZJ, He XB, QinX, Xu FQ, Hu J, Wei F, Huganir RL, Li YQ, Zhuo M (2014) Postsynapticpotentiation of corticospinal projecting neurons in the anterior cingulatecortex after nerve injury. Mol Pain 10:33. CrossRef Medline
Cordeiro Matos S, Zhang Z, Seguela P (2015) Peripheral neuropathy in-duces HCN channel dysfunction in pyramidal neurons of the medialprefrontal cortex. J Neurosci 35:13244 –13256. CrossRef Medline
Dimitrov EL, Tsuda MC, Cameron HA, Usdin TB (2014) Anxiety- anddepression-like behavior and impaired neurogenesis evoked by periph-eral neuropathy persist following resolution of prolonged tactile hyper-sensitivity. J Neurosci 34:12304 –12312. CrossRef Medline
Drevets WC, Bogers weeks, Raichle ME (2002) Functional anatomical cor-relates of antidepressant drug treatment assessed using PET measures ofregional glucose metabolism. Eur Neuropsychopharmacol 12:527–544.CrossRef Medline
Fillinger C, Yalcin I, Barrot M, Veinante P (2017a) Efferents of anteriorcingulate areas 24a and 24b and midcingulate areas 24a and 24b in themouse. Brain Struct Funct. Advance online publication. Retrieved Dec. 6,2017. doi: 10.1007/s00429 – 017-1585-x. CrossRef Medline
Fillinger C, Yalcin I, Barrot M, Veinante P (2017b) Afferents to anteriorcingulate areas 24a and 24b and midcingulate areas 24a and 24b in themouse. Brain Struct Funct 222:1509 –1532. CrossRef Medline
Goncalves L, Silva R, Pinto-Ribeiro F, Pego JM, Bessa JM, Pertovaara A, SousaN, Almeida A (2008) Neuropathic pain is associated with depressivebehaviour and induces neuroplasticity in the amygdala of the rat. ExpNeurol 213:48 –56. CrossRef Medline
Gu L, Uhelski ML, Anand S, Romero-Ortega M, Kim YT, Fuchs PN,Mohanty SK (2015) Pain inhibition by optogenetic activation of spe-cific anterior cingulate cortical neurons. PLoS One 10:e0117746.CrossRef Medline
Johansen JP, Fields HL, Manning BH (2001) The affective component ofpain in rodents: direct evidence for a contribution of the anteriorcingulate cortex. Proc Natl Acad Sci U S A 98:8077– 8082. CrossRefMedline
Kang SJ, Kwak C, Lee J, Sim SE, Shim J, Choi T, Collingridge GL, Zhuo M,Kaang BK (2015) Bidirectional modulation of hyperalgesia via the spe-cific control of excitatory and inhibitory neuronal activity in the ACC.Mol Brain 8:81. CrossRef Medline
Kanske P, Kotz SA (2012) Effortful control, depression, and anxiety corre-late with the influence of emotion on executive attentional control. BiolPsychol 91:88 –95. CrossRef Medline
King T, Vera-Portocarrero L, Gutierrez T, Vanderah TW, Dussor G, Lai J,Fields HL, Porreca F (2009) Unmasking the tonic-aversive state in neu-ropathic pain. Nat Neurosci 12:1364 –1366. CrossRef Medline
King T, Qu C, Okun A, Mercado R, Ren J, Brion T, Lai J, Porreca F (2011)Contribution of afferent pathways to nerve injury-induced spontane-
ous pain and evoked hypersensitivity. Pain 152:1997–2005. CrossRefMedline
Koga K, Descalzi G, Chen T, Ko HG, Lu J, Li S, Son J, Kim T, Kwak C, HuganirRL, Zhao MG, Kaang BK, Collingridge GL, Zhuo M (2015) Coexistenceof two forms of LTP in ACC provides a synaptic mechanism for theinteractions between anxiety and chronic pain. Neuron 85:377–389.CrossRef Medline
Li XY, Ko HG, Chen T, Descalzi G, Koga K, Wang H, Kim SS, Shang Y, KwakC, Park SW, Shim J, Lee K, Collingridge GL, Kaang BK, Zhuo M (2010)Alleviating neuropathic pain hypersensitivity by inhibiting PKMzetain the anterior cingulate cortex. Science 330:1400 –1404. CrossRefMedline
Mayberg HS, Liotti M, Brannan SK, McGinnis S, Mahurin RK, Jerabek PA,Silva JA, Tekell JL, Martin CC, Lancaster JL, Fox PT (1999) Reciprocallimbic-cortical function and negative mood: converging PET findings indepression and normal sadness. Am J Psychiatry 156:675– 682. CrossRefMedline
Narita M, Kaneko C, Miyoshi K, Nagumo Y, Kuzumaki N, Nakajima M,Nanjo K, Matsuzawa K, Yamazaki M, Suzuki T (2006) Chronic paininduces anxiety with concomitant changes in opioidergic function in theamygdala. Neuropsychopharmacology 31:739 –750. CrossRef Medline
Northoff G, Sibille E (2014) Why are cortical GABA neurons relevant tointernal focus in depression[quest] A cross-level model linking cellular,biochemical and neural network findings. Mol Psychiatry 19:966 –977.CrossRef Medline
Peyron R, García-Larrea L, Gregoire MC, Convers P, Richard A, Lavenne F,Barral FG, Mauguiere F, Michel D, Laurent B (2000) Parietal and cingu-late processes in central pain: a combined positron emission tomography(PET) and functional magnetic resonance imaging (fMRI) study of anunusual case. Pain 84:77– 87. CrossRef Medline
Porsolt RD, Le Pichon M, Jalfre M (1977) Depression: a new animal modelsensitive to antidepressant treatments. Nature 266:730 –732. CrossRefMedline
Qu C, King T, Okun A, Lai J, Fields HL, Porreca F (2011) Lesion of therostral anterior cingulate cortex eliminates the aversiveness of spontane-ous neuropathic pain following partial or complete axotomy. Pain 152:1641–1648. CrossRef Medline
Radat F, Margot-Duclot A, Attal N (2013) Psychiatric co-morbidities in pa-tients with chronic peripheral neuropathic pain: a multicentre cohortstudy. Eur J Pain 17:1547–1557. CrossRef Medline
Sellmeijer J (2016) Analysis electrophys. Available at https://bitbucket.org/jsellmeijer/analysis_electrophys/commits/7c2d9026c770c42211c2fd34b44328dbc25b4666?atmaster
Seney ML, Tripp A, McCune S, Lewis DA, Sibille E (2015) Laminar andcellular analyses of reduced somatostatin gene expression in the sub-genual anterior cingulate cortex in major depression. Neurobiol Dis 73:213–219. CrossRef Medline
Shackman AJ, Salomons TV, Slagter HA, Fox AS, Winter JJ, Davidson RJ(2011) The integration of negative affect, pain and cognitive control inthe cingulate cortex. Nat Rev Neurosci 12:154 –167. CrossRef Medline
Song Q, Zheng HW, Li XH, Huganir RL, Kuner T, Zhuo M, Chen T (2017)Selective phosphorylation of AMPA receptor contributes to the networkof long-term potentiation in the anterior cingulate cortex. J Neurosci37:8534 – 8548. Medline
Surget A, Wang Y, Leman S, Ibarguen-Vargas Y, Edgar N, Griebel G, BelzungC, Sibille E (2009) Corticolimbic transcriptome changes are state-dependent and region-specific in a rodent model of depression and of anti-depressant reversal. Neuropsychopharmacology 34:1363–1380. CrossRefMedline
Suzuki T, Amata M, Sakaue G, Nishimura S, Inoue T, Shibata M, Mashimo T(2007) Experimental neuropathy in mice is associated with delayed be-havioral changes related to anxiety and depression. Anesth Analg 104:1570 –1577. CrossRef Medline
Tang J, Ko S, Ding HK, Qiu CS, Calejesan AA, Zhuo M (2005) Pavlovianfear memory induced by activation in the anterior cingulate cortex. MolPain 1:6. CrossRef Medline
Tripp A, Oh H, Guilloux JP, Martinowich K, Lewis DA, Sibille E (2012)Brain-derived neurotrophic factor signaling and subgenual anterior cin-gulate cortex dysfunction in major depressive disorder. Am J Psychiatry169:1194 –1202. CrossRef Medline
Vogt MA, Mallien AS, Pfeiffer N, Inta I, Gass P, Inta D (2016) Minocycline
3114 • J. Neurosci., March 21, 2018 • 38(12):3102–3115 Sellmeijer et al. • Cortex in Chronic Pain-Induced Depression

does not evoke anxiolytic and antidepressant-like effects in C57BL/6mice. Behav Brain Res 301:96 –101. CrossRef Medline
Wang R, King T, De Felice M, Guo weeks, Ossipov MH, Porreca F (2013)Descending facilitation maintains long-term spontaneous neuropathicpain. J Pain 14:845– 853. CrossRef Medline
Xu H, Wu LJ, Wang H, Zhang X, Vadakkan KI, Kim SS, Steenland HW, Zhuo M(2008) Presynaptic and postsynaptic amplifications of neuropathic pain inthe anterior cingulate cortex. J Neurosci 28:7445–7453. CrossRef Medline
Yalcin I, Bohren Y, Waltisperger E, Sage-Ciocca D, Yin JC, Freund-MercierMJ, Barrot M (2011) A time-dependent history of mood disorders in amurine model of neuropathic pain. Biol Psychiatry 70:946 –953. CrossRefMedline
Yalcin I, Barthas F, Barrot M (2014a) Emotional consequences of neuro-pathic pain: insight from preclinical studies. Neurosci Biobehav Rev 47:154 –164. CrossRef Medline
Yalcin I, Megat S, Barthas F, Waltisperger E, Kremer M, Salvat E, Barrot M(2014b) The sciatic nerve cuffing model of neuropathic pain in mice. JVis Exp 16:89. CrossRef Medline
Yang Q, Wu Z, Hadden JK, Odem MA, Zuo Y, Crook RJ, Frost JA, Walters ET(2014) Persistent pain after spinal cord injury is maintained by primaryafferent activity. J Neurosci 34:10765–10769. CrossRef Medline
Yoshimura S, Okamoto Y, Onoda K, Matsunaga M, Ueda K, Suzuki S,Shigetoyamawaki (2010) Rostral anterior cingulate cortex activitymediates the relationship between the depressive symptoms and themedial prefrontal cortex activity. J Affect Disord 122:76 – 85. CrossRefMedline
Yu T, Guo M, Garza J, Rendon S, Sun XL, Zhang weeks, Lu XY (2011)Cognitive and neural correlates of depression-like behaviour in sociallydefeated mice: an animal model of depression with cognitive dysfunction.Int J Neuropsychopharmacol 14:303–317. CrossRef Medline
Sellmeijer et al. • Cortex in Chronic Pain-Induced Depression J. Neurosci., March 21, 2018 • 38(12):3102–3115 • 3115
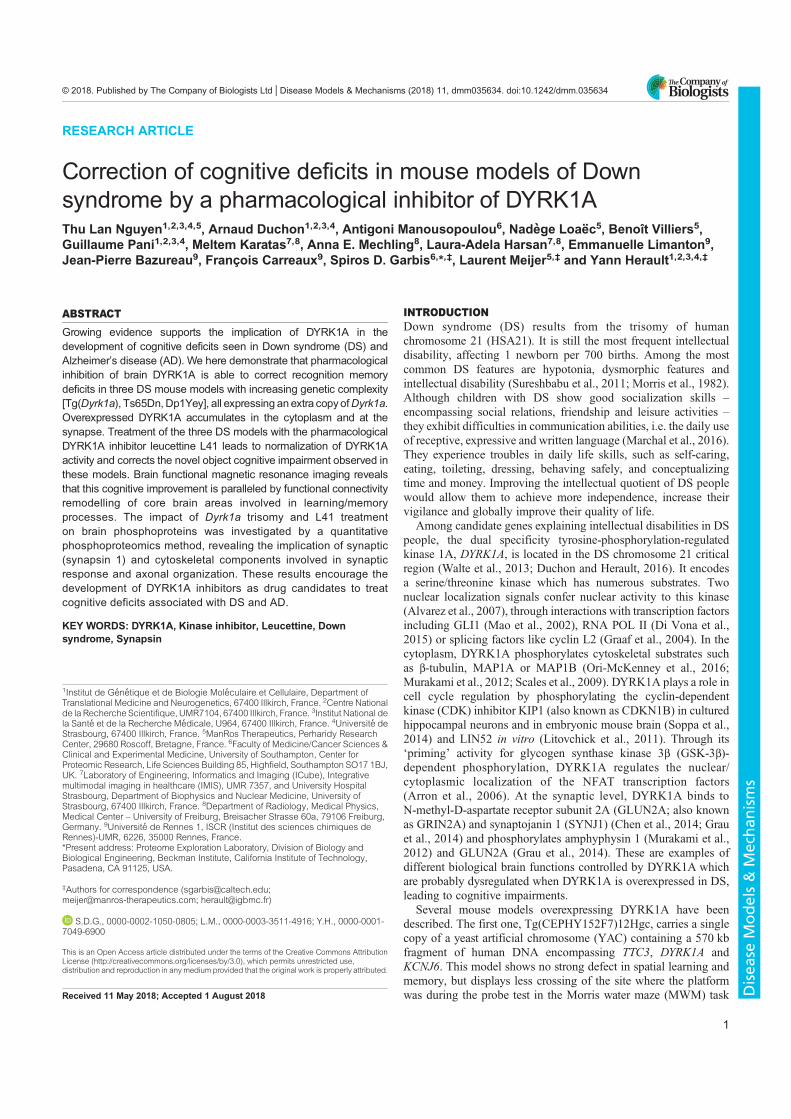
RESEARCH ARTICLE
Correction of cognitive deficits in mouse models of Downsyndrome by a pharmacological inhibitor of DYRK1AThu Lan Nguyen1,2,3,4,5, Arnaud Duchon1,2,3,4, Antigoni Manousopoulou6, Nadege Loaec5, Benoît Villiers5,Guillaume Pani1,2,3,4, Meltem Karatas7,8, Anna E. Mechling8, Laura-Adela Harsan7,8, Emmanuelle Limanton9,Jean-Pierre Bazureau9, François Carreaux9, Spiros D. Garbis6,*,‡, Laurent Meijer5,‡ and Yann Herault1,2,3,4,‡
ABSTRACTGrowing evidence supports the implication of DYRK1A in thedevelopment of cognitive deficits seen in Down syndrome (DS) andAlzheimer’s disease (AD). We here demonstrate that pharmacologicalinhibition of brain DYRK1A is able to correct recognition memorydeficits in three DS mouse models with increasing genetic complexity[Tg(Dyrk1a), Ts65Dn, Dp1Yey], all expressing anextra copyofDyrk1a.Overexpressed DYRK1A accumulates in the cytoplasm and at thesynapse. Treatment of the three DS models with the pharmacologicalDYRK1A inhibitor leucettine L41 leads to normalization of DYRK1Aactivity and corrects the novel object cognitive impairment observed inthese models. Brain functional magnetic resonance imaging revealsthat this cognitive improvement is paralleled by functional connectivityremodelling of core brain areas involved in learning/memoryprocesses. The impact of Dyrk1a trisomy and L41 treatmenton brain phosphoproteins was investigated by a quantitativephosphoproteomics method, revealing the implication of synaptic(synapsin 1) and cytoskeletal components involved in synapticresponse and axonal organization. These results encourage thedevelopment of DYRK1A inhibitors as drug candidates to treatcognitive deficits associated with DS and AD.
KEY WORDS: DYRK1A, Kinase inhibitor, Leucettine, Downsyndrome, Synapsin
INTRODUCTIONDown syndrome (DS) results from the trisomy of humanchromosome 21 (HSA21). It is still the most frequent intellectualdisability, affecting 1 newborn per 700 births. Among the mostcommon DS features are hypotonia, dysmorphic features andintellectual disability (Sureshbabu et al., 2011; Morris et al., 1982).Although children with DS show good socialization skills –encompassing social relations, friendship and leisure activities –they exhibit difficulties in communication abilities, i.e. the daily useof receptive, expressive and written language (Marchal et al., 2016).They experience troubles in daily life skills, such as self-caring,eating, toileting, dressing, behaving safely, and conceptualizingtime and money. Improving the intellectual quotient of DS peoplewould allow them to achieve more independence, increase theirvigilance and globally improve their quality of life.
Among candidate genes explaining intellectual disabilities in DSpeople, the dual specificity tyrosine-phosphorylation-regulatedkinase 1A, DYRK1A, is located in the DS chromosome 21 criticalregion (Walte et al., 2013; Duchon and Herault, 2016). It encodesa serine/threonine kinase which has numerous substrates. Twonuclear localization signals confer nuclear activity to this kinase(Alvarez et al., 2007), through interactions with transcription factorsincluding GLI1 (Mao et al., 2002), RNA POL II (Di Vona et al.,2015) or splicing factors like cyclin L2 (Graaf et al., 2004). In thecytoplasm, DYRK1A phosphorylates cytoskeletal substrates suchas β-tubulin, MAP1A or MAP1B (Ori-McKenney et al., 2016;Murakami et al., 2012; Scales et al., 2009). DYRK1A plays a role incell cycle regulation by phosphorylating the cyclin-dependentkinase (CDK) inhibitor KIP1 (also known as CDKN1B) in culturedhippocampal neurons and in embryonic mouse brain (Soppa et al.,2014) and LIN52 in vitro (Litovchick et al., 2011). Through its‘priming’ activity for glycogen synthase kinase 3β (GSK-3β)-dependent phosphorylation, DYRK1A regulates the nuclear/cytoplasmic localization of the NFAT transcription factors(Arron et al., 2006). At the synaptic level, DYRK1A binds toN-methyl-D-aspartate receptor subunit 2A (GLUN2A; also knownas GRIN2A) and synaptojanin 1 (SYNJ1) (Chen et al., 2014; Grauet al., 2014) and phosphorylates amphyphysin 1 (Murakami et al.,2012) and GLUN2A (Grau et al., 2014). These are examples ofdifferent biological brain functions controlled by DYRK1A whichare probably dysregulated when DYRK1A is overexpressed in DS,leading to cognitive impairments.
Several mouse models overexpressing DYRK1A have beendescribed. The first one, Tg(CEPHY152F7)12Hgc, carries a singlecopy of a yeast artificial chromosome (YAC) containing a 570 kbfragment of human DNA encompassing TTC3, DYRK1A andKCNJ6. This model shows no strong defect in spatial learning andmemory, but displays less crossing of the site where the platformwas during the probe test in the Morris water maze (MWM) taskReceived 11 May 2018; Accepted 1 August 2018
1Institut de Genetique et de Biologie Moleculaire et Cellulaire, Department ofTranslational Medicine and Neurogenetics, 67400 Illkirch, France. 2Centre Nationalde la Recherche Scientifique, UMR7104, 67400 Illkirch, France. 3Institut National dela Sante et de la Recherche Medicale, U964, 67400 Illkirch, France. 4Universite deStrasbourg, 67400 Illkirch, France. 5ManRos Therapeutics, Perharidy ResearchCenter, 29680 Roscoff, Bretagne, France. 6Faculty of Medicine/Cancer Sciences &Clinical and Experimental Medicine, University of Southampton, Center forProteomic Research, Life Sciences Building 85, Highfield, Southampton SO17 1BJ,UK. 7Laboratory of Engineering, Informatics and Imaging (ICube), Integrativemultimodal imaging in healthcare (IMIS), UMR 7357, and University HospitalStrasbourg, Department of Biophysics and Nuclear Medicine, University ofStrasbourg, 67400 Illkirch, France. 8Department of Radiology, Medical Physics,Medical Center – University of Freiburg, Breisacher Strasse 60a, 79106 Freiburg,Germany. 9Universite de Rennes 1, ISCR (Institut des sciences chimiques deRennes)-UMR, 6226, 35000 Rennes, France.*Present address: Proteome Exploration Laboratory, Division of Biology andBiological Engineering, Beckman Institute, California Institute of Technology,Pasadena, CA 91125, USA.
‡Authors for correspondence ([email protected];[email protected]; [email protected])
S.D.G., 0000-0002-1050-0805; L.M., 0000-0003-3511-4916; Y.H., 0000-0001-7049-6900
This is an Open Access article distributed under the terms of the Creative Commons AttributionLicense (http://creativecommons.org/licenses/by/3.0), which permits unrestricted use,distribution and reproduction in any medium provided that the original work is properly attributed.
1
© 2018. Published by The Company of Biologists Ltd | Disease Models & Mechanisms (2018) 11, dmm035634. doi:10.1242/dmm.035634
Disea
seModels&Mechan
isms
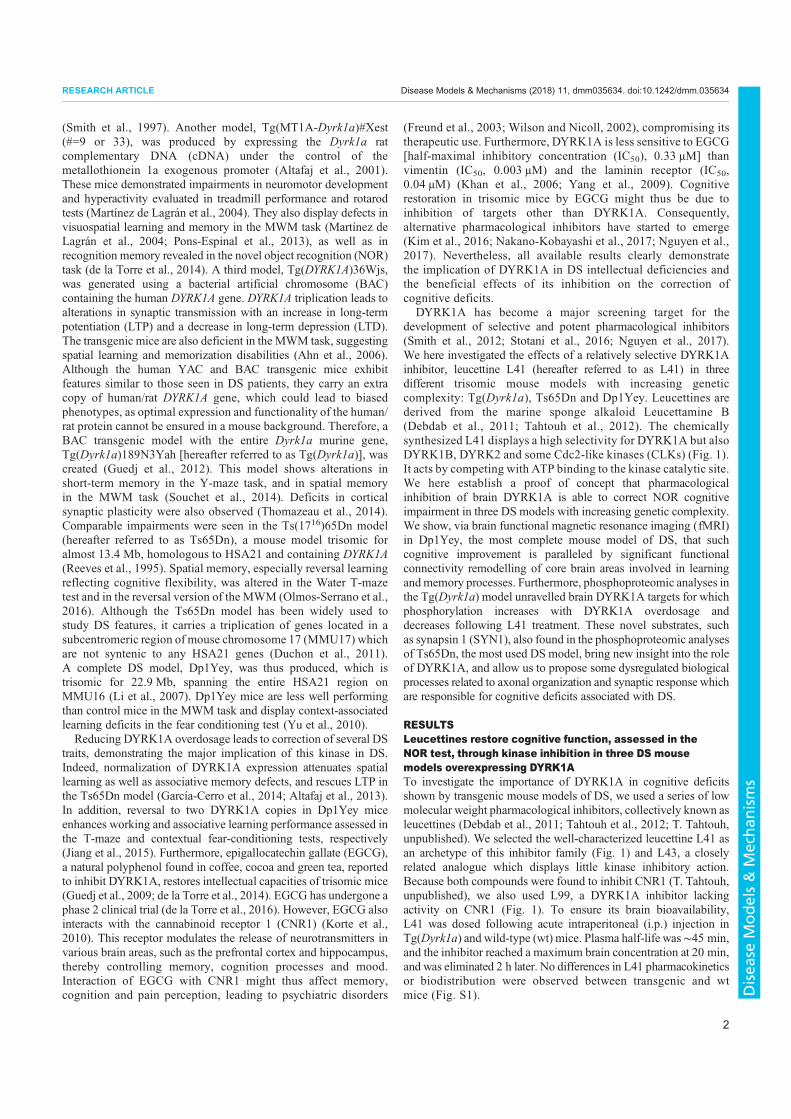
(Smith et al., 1997). Another model, Tg(MT1A-Dyrk1a)#Xest(#=9 or 33), was produced by expressing the Dyrk1a ratcomplementary DNA (cDNA) under the control of themetallothionein 1a exogenous promoter (Altafaj et al., 2001).These mice demonstrated impairments in neuromotor developmentand hyperactivity evaluated in treadmill performance and rotarodtests (Martínez de Lagrán et al., 2004). They also display defects invisuospatial learning and memory in the MWM task (Martínez deLagrán et al., 2004; Pons-Espinal et al., 2013), as well as inrecognition memory revealed in the novel object recognition (NOR)task (de la Torre et al., 2014). A third model, Tg(DYRK1A)36Wjs,was generated using a bacterial artificial chromosome (BAC)containing the human DYRK1A gene. DYRK1A triplication leads toalterations in synaptic transmission with an increase in long-termpotentiation (LTP) and a decrease in long-term depression (LTD).The transgenic mice are also deficient in the MWM task, suggestingspatial learning and memorization disabilities (Ahn et al., 2006).Although the human YAC and BAC transgenic mice exhibitfeatures similar to those seen in DS patients, they carry an extracopy of human/rat DYRK1A gene, which could lead to biasedphenotypes, as optimal expression and functionality of the human/rat protein cannot be ensured in a mouse background. Therefore, aBAC transgenic model with the entire Dyrk1a murine gene,Tg(Dyrk1a)189N3Yah [hereafter referred to as Tg(Dyrk1a)], wascreated (Guedj et al., 2012). This model shows alterations inshort-term memory in the Y-maze task, and in spatial memoryin the MWM task (Souchet et al., 2014). Deficits in corticalsynaptic plasticity were also observed (Thomazeau et al., 2014).Comparable impairments were seen in the Ts(1716)65Dn model(hereafter referred to as Ts65Dn), a mouse model trisomic foralmost 13.4 Mb, homologous to HSA21 and containing DYRK1A(Reeves et al., 1995). Spatial memory, especially reversal learningreflecting cognitive flexibility, was altered in the Water T-mazetest and in the reversal version of the MWM (Olmos-Serrano et al.,2016). Although the Ts65Dn model has been widely used tostudy DS features, it carries a triplication of genes located in asubcentromeric region of mouse chromosome 17 (MMU17) whichare not syntenic to any HSA21 genes (Duchon et al., 2011).A complete DS model, Dp1Yey, was thus produced, which istrisomic for 22.9 Mb, spanning the entire HSA21 region onMMU16 (Li et al., 2007). Dp1Yey mice are less well performingthan control mice in the MWM task and display context-associatedlearning deficits in the fear conditioning test (Yu et al., 2010).Reducing DYRK1A overdosage leads to correction of several DS
traits, demonstrating the major implication of this kinase in DS.Indeed, normalization of DYRK1A expression attenuates spatiallearning as well as associative memory defects, and rescues LTP inthe Ts65Dn model (García-Cerro et al., 2014; Altafaj et al., 2013).In addition, reversal to two DYRK1A copies in Dp1Yey miceenhances working and associative learning performance assessed inthe T-maze and contextual fear-conditioning tests, respectively(Jiang et al., 2015). Furthermore, epigallocatechin gallate (EGCG),a natural polyphenol found in coffee, cocoa and green tea, reportedto inhibit DYRK1A, restores intellectual capacities of trisomic mice(Guedj et al., 2009; de la Torre et al., 2014). EGCG has undergone aphase 2 clinical trial (de la Torre et al., 2016). However, EGCG alsointeracts with the cannabinoid receptor 1 (CNR1) (Korte et al.,2010). This receptor modulates the release of neurotransmitters invarious brain areas, such as the prefrontal cortex and hippocampus,thereby controlling memory, cognition processes and mood.Interaction of EGCG with CNR1 might thus affect memory,cognition and pain perception, leading to psychiatric disorders
(Freund et al., 2003; Wilson and Nicoll, 2002), compromising itstherapeutic use. Furthermore, DYRK1A is less sensitive to EGCG[half-maximal inhibitory concentration (IC50), 0.33 μM] thanvimentin (IC50, 0.003 μM) and the laminin receptor (IC50,0.04 μM) (Khan et al., 2006; Yang et al., 2009). Cognitiverestoration in trisomic mice by EGCG might thus be due toinhibition of targets other than DYRK1A. Consequently,alternative pharmacological inhibitors have started to emerge(Kim et al., 2016; Nakano-Kobayashi et al., 2017; Nguyen et al.,2017). Nevertheless, all available results clearly demonstratethe implication of DYRK1A in DS intellectual deficiencies andthe beneficial effects of its inhibition on the correction ofcognitive deficits.
DYRK1A has become a major screening target for thedevelopment of selective and potent pharmacological inhibitors(Smith et al., 2012; Stotani et al., 2016; Nguyen et al., 2017).We here investigated the effects of a relatively selective DYRK1Ainhibitor, leucettine L41 (hereafter referred to as L41) in threedifferent trisomic mouse models with increasing geneticcomplexity: Tg(Dyrk1a), Ts65Dn and Dp1Yey. Leucettines arederived from the marine sponge alkaloid Leucettamine B(Debdab et al., 2011; Tahtouh et al., 2012). The chemicallysynthesized L41 displays a high selectivity for DYRK1A but alsoDYRK1B, DYRK2 and some Cdc2-like kinases (CLKs) (Fig. 1).It acts by competing with ATP binding to the kinase catalytic site.We here establish a proof of concept that pharmacologicalinhibition of brain DYRK1A is able to correct NOR cognitiveimpairment in three DS models with increasing genetic complexity.We show, via brain functional magnetic resonance imaging (fMRI)in Dp1Yey, the most complete mouse model of DS, that suchcognitive improvement is paralleled by significant functionalconnectivity remodelling of core brain areas involved in learningandmemory processes. Furthermore, phosphoproteomic analyses inthe Tg(Dyrk1a) model unravelled brain DYRK1A targets for whichphosphorylation increases with DYRK1A overdosage anddecreases following L41 treatment. These novel substrates, suchas synapsin 1 (SYN1), also found in the phosphoproteomic analysesof Ts65Dn, the most used DS model, bring new insight into the roleof DYRK1A, and allow us to propose some dysregulated biologicalprocesses related to axonal organization and synaptic response whichare responsible for cognitive deficits associated with DS.
RESULTSLeucettines restore cognitive function, assessed in theNOR test, through kinase inhibition in three DS mousemodels overexpressing DYRK1ATo investigate the importance of DYRK1A in cognitive deficitsshown by transgenic mouse models of DS, we used a series of lowmolecular weight pharmacological inhibitors, collectively known asleucettines (Debdab et al., 2011; Tahtouh et al., 2012; T. Tahtouh,unpublished). We selected the well-characterized leucettine L41 asan archetype of this inhibitor family (Fig. 1) and L43, a closelyrelated analogue which displays little kinase inhibitory action.Because both compounds were found to inhibit CNR1 (T. Tahtouh,unpublished), we also used L99, a DYRK1A inhibitor lackingactivity on CNR1 (Fig. 1). To ensure its brain bioavailability,L41 was dosed following acute intraperitoneal (i.p.) injection inTg(Dyrk1a) and wild-type (wt) mice. Plasma half-life was∼45 min,and the inhibitor reached a maximum brain concentration at 20 min,and was eliminated 2 h later. No differences in L41 pharmacokineticsor biodistribution were observed between transgenic and wtmice (Fig. S1).
2
RESEARCH ARTICLE Disease Models & Mechanisms (2018) 11, dmm035634. doi:10.1242/dmm.035634
Disea
seModels&Mechan
isms
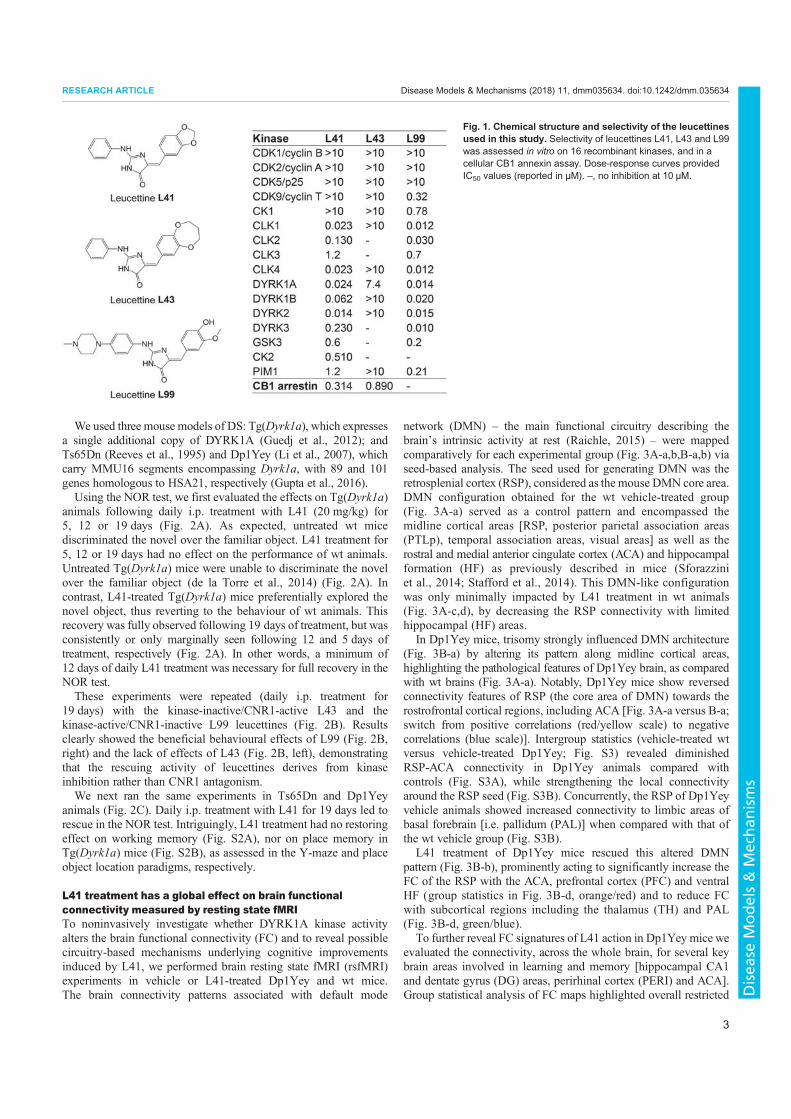
We used three mouse models of DS: Tg(Dyrk1a), which expressesa single additional copy of DYRK1A (Guedj et al., 2012); andTs65Dn (Reeves et al., 1995) and Dp1Yey (Li et al., 2007), whichcarry MMU16 segments encompassing Dyrk1a, with 89 and 101genes homologous to HSA21, respectively (Gupta et al., 2016).Using the NOR test, we first evaluated the effects on Tg(Dyrk1a)
animals following daily i.p. treatment with L41 (20 mg/kg) for5, 12 or 19 days (Fig. 2A). As expected, untreated wt micediscriminated the novel over the familiar object. L41 treatment for5, 12 or 19 days had no effect on the performance of wt animals.Untreated Tg(Dyrk1a) mice were unable to discriminate the novelover the familiar object (de la Torre et al., 2014) (Fig. 2A). Incontrast, L41-treated Tg(Dyrk1a) mice preferentially explored thenovel object, thus reverting to the behaviour of wt animals. Thisrecovery was fully observed following 19 days of treatment, but wasconsistently or only marginally seen following 12 and 5 days oftreatment, respectively (Fig. 2A). In other words, a minimum of12 days of daily L41 treatment was necessary for full recovery in theNOR test.These experiments were repeated (daily i.p. treatment for
19 days) with the kinase-inactive/CNR1-active L43 and thekinase-active/CNR1-inactive L99 leucettines (Fig. 2B). Resultsclearly showed the beneficial behavioural effects of L99 (Fig. 2B,right) and the lack of effects of L43 (Fig. 2B, left), demonstratingthat the rescuing activity of leucettines derives from kinaseinhibition rather than CNR1 antagonism.We next ran the same experiments in Ts65Dn and Dp1Yey
animals (Fig. 2C). Daily i.p. treatment with L41 for 19 days led torescue in the NOR test. Intriguingly, L41 treatment had no restoringeffect on working memory (Fig. S2A), nor on place memory inTg(Dyrk1a) mice (Fig. S2B), as assessed in the Y-maze and placeobject location paradigms, respectively.
L41 treatment has a global effect on brain functionalconnectivity measured by resting state fMRITo noninvasively investigate whether DYRK1A kinase activityalters the brain functional connectivity (FC) and to reveal possiblecircuitry-based mechanisms underlying cognitive improvementsinduced by L41, we performed brain resting state fMRI (rsfMRI)experiments in vehicle or L41-treated Dp1Yey and wt mice.The brain connectivity patterns associated with default mode
network (DMN) – the main functional circuitry describing thebrain’s intrinsic activity at rest (Raichle, 2015) – were mappedcomparatively for each experimental group (Fig. 3A-a,b,B-a,b) viaseed-based analysis. The seed used for generating DMN was theretrosplenial cortex (RSP), considered as the mouse DMN core area.DMN configuration obtained for the wt vehicle-treated group(Fig. 3A-a) served as a control pattern and encompassed themidline cortical areas [RSP, posterior parietal association areas(PTLp), temporal association areas, visual areas] as well as therostral and medial anterior cingulate cortex (ACA) and hippocampalformation (HF) as previously described in mice (Sforazziniet al., 2014; Stafford et al., 2014). This DMN-like configurationwas only minimally impacted by L41 treatment in wt animals(Fig. 3A-c,d), by decreasing the RSP connectivity with limitedhippocampal (HF) areas.
In Dp1Yey mice, trisomy strongly influenced DMN architecture(Fig. 3B-a) by altering its pattern along midline cortical areas,highlighting the pathological features of Dp1Yey brain, as comparedwith wt brains (Fig. 3A-a). Notably, Dp1Yey mice show reversedconnectivity features of RSP (the core area of DMN) towards therostrofrontal cortical regions, including ACA [Fig. 3A-a versus B-a;switch from positive correlations (red/yellow scale) to negativecorrelations (blue scale)]. Intergroup statistics (vehicle-treated wtversus vehicle-treated Dp1Yey; Fig. S3) revealed diminishedRSP-ACA connectivity in Dp1Yey animals compared withcontrols (Fig. S3A), while strengthening the local connectivityaround the RSP seed (Fig. S3B). Concurrently, the RSP of Dp1Yeyvehicle animals showed increased connectivity to limbic areas ofbasal forebrain [i.e. pallidum (PAL)] when compared with that ofthe wt vehicle group (Fig. S3B).
L41 treatment of Dp1Yey mice rescued this altered DMNpattern (Fig. 3B-b), prominently acting to significantly increase theFC of the RSP with the ACA, prefrontal cortex (PFC) and ventralHF (group statistics in Fig. 3B-d, orange/red) and to reduce FCwith subcortical regions including the thalamus (TH) and PAL(Fig. 3B-d, green/blue).
To further reveal FC signatures of L41 action in Dp1Yey mice weevaluated the connectivity, across the whole brain, for several keybrain areas involved in learning and memory [hippocampal CA1and dentate gyrus (DG) areas, perirhinal cortex (PERI) and ACA].Group statistical analysis of FC maps highlighted overall restricted
Fig. 1. Chemical structure and selectivity of the leucettinesused in this study. Selectivity of leucettines L41, L43 and L99was assessed in vitro on 16 recombinant kinases, and in acellular CB1 annexin assay. Dose-response curves providedIC50 values (reported in μM). –, no inhibition at 10 μM.
3
RESEARCH ARTICLE Disease Models & Mechanisms (2018) 11, dmm035634. doi:10.1242/dmm.035634
Disea
seModels&Mechan
isms
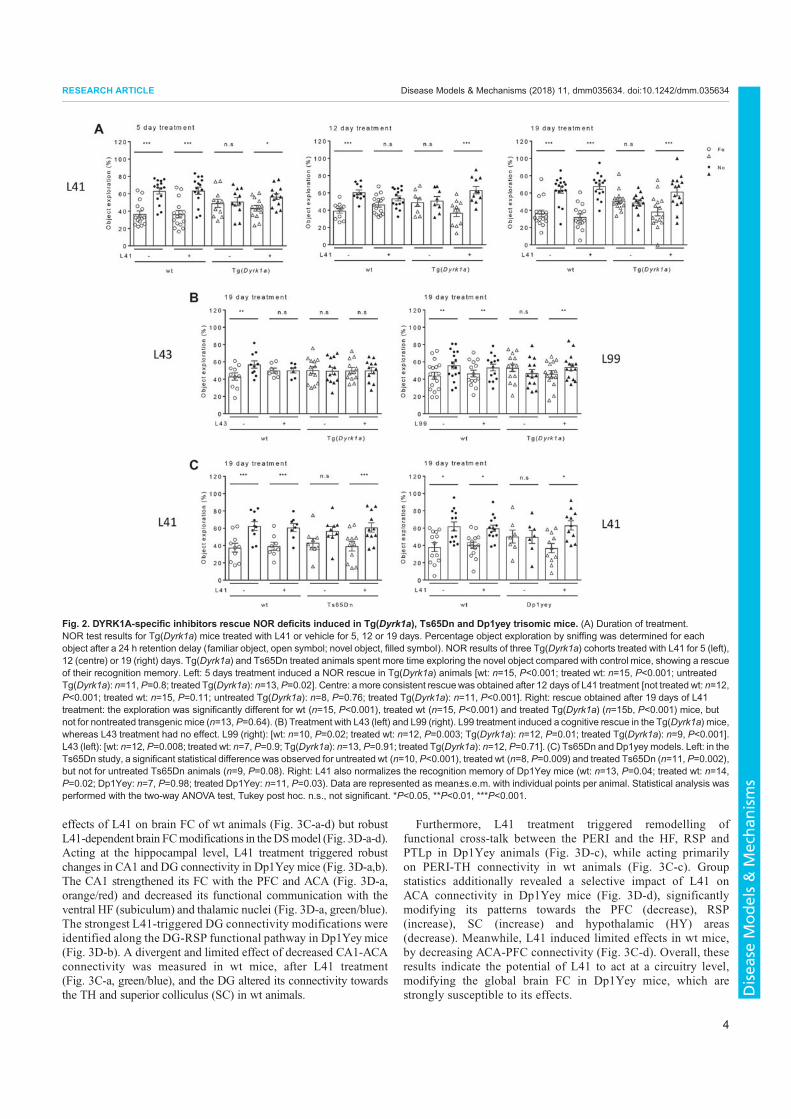
effects of L41 on brain FC of wt animals (Fig. 3C-a-d) but robustL41-dependent brain FCmodifications in theDSmodel (Fig. 3D-a-d).Acting at the hippocampal level, L41 treatment triggered robustchanges in CA1 and DG connectivity in Dp1Yey mice (Fig. 3D-a,b).The CA1 strengthened its FC with the PFC and ACA (Fig. 3D-a,orange/red) and decreased its functional communication with theventral HF (subiculum) and thalamic nuclei (Fig. 3D-a, green/blue).The strongest L41-triggered DG connectivity modifications wereidentified along the DG-RSP functional pathway in Dp1Yey mice(Fig. 3D-b). A divergent and limited effect of decreased CA1-ACAconnectivity was measured in wt mice, after L41 treatment(Fig. 3C-a, green/blue), and the DG altered its connectivity towardsthe TH and superior colliculus (SC) in wt animals.
Furthermore, L41 treatment triggered remodelling offunctional cross-talk between the PERI and the HF, RSP andPTLp in Dp1Yey animals (Fig. 3D-c), while acting primarilyon PERI-TH connectivity in wt animals (Fig. 3C-c). Groupstatistics additionally revealed a selective impact of L41 onACA connectivity in Dp1Yey mice (Fig. 3D-d), significantlymodifying its patterns towards the PFC (decrease), RSP(increase), SC (increase) and hypothalamic (HY) areas(decrease). Meanwhile, L41 induced limited effects in wt mice,by decreasing ACA-PFC connectivity (Fig. 3C-d). Overall, theseresults indicate the potential of L41 to act at a circuitry level,modifying the global brain FC in Dp1Yey mice, which arestrongly susceptible to its effects.
Fig. 2. DYRK1A-specific inhibitors rescue NOR deficits induced in Tg(Dyrk1a), Ts65Dn and Dp1yey trisomic mice. (A) Duration of treatment.NOR test results for Tg(Dyrk1a) mice treated with L41 or vehicle for 5, 12 or 19 days. Percentage object exploration by sniffing was determined for eachobject after a 24 h retention delay (familiar object, open symbol; novel object, filled symbol). NOR results of three Tg(Dyrk1a) cohorts treated with L41 for 5 (left),12 (centre) or 19 (right) days. Tg(Dyrk1a) and Ts65Dn treated animals spent more time exploring the novel object compared with control mice, showing a rescueof their recognition memory. Left: 5 days treatment induced a NOR rescue in Tg(Dyrk1a) animals [wt: n=15, P<0.001; treated wt: n=15, P<0.001; untreatedTg(Dyrk1a): n=11,P=0.8; treated Tg(Dyrk1a): n=13,P=0.02]. Centre: amore consistent rescuewas obtained after 12 days of L41 treatment [not treated wt: n=12,P<0.001; treated wt: n=15, P=0.11; untreated Tg(Dyrk1a): n=8, P=0.76; treated Tg(Dyrk1a): n=11, P<0.001]. Right: rescue obtained after 19 days of L41treatment: the exploration was significantly different for wt (n=15, P<0.001), treated wt (n=15, P<0.001) and treated Tg(Dyrk1a) (n=15b, P<0.001) mice, butnot for nontreated transgenic mice (n=13, P=0.64). (B) Treatment with L43 (left) and L99 (right). L99 treatment induced a cognitive rescue in the Tg(Dyrk1a) mice,whereas L43 treatment had no effect. L99 (right): [wt: n=10, P=0.02; treated wt: n=12, P=0.003; Tg(Dyrk1a): n=12, P=0.01; treated Tg(Dyrk1a): n=9, P<0.001].L43 (left): [wt: n=12, P=0.008; treated wt: n=7, P=0.9; Tg(Dyrk1a): n=13, P=0.91; treated Tg(Dyrk1a): n=12, P=0.71]. (C) Ts65Dn and Dp1yey models. Left: in theTs65Dn study, a significant statistical difference was observed for untreated wt (n=10, P<0.001), treated wt (n=8, P=0.009) and treated Ts65Dn (n=11, P=0.002),but not for untreated Ts65Dn animals (n=9, P=0.08). Right: L41 also normalizes the recognition memory of Dp1Yey mice (wt: n=13, P=0.04; treated wt: n=14,P=0.02; Dp1Yey: n=7, P=0.98; treated Dp1Yey: n=11, P=0.03). Data are represented as mean±s.e.m. with individual points per animal. Statistical analysis wasperformed with the two-way ANOVA test, Tukey post hoc. n.s., not significant. *P<0.05, **P<0.01, ***P<0.001.
4
RESEARCH ARTICLE Disease Models & Mechanisms (2018) 11, dmm035634. doi:10.1242/dmm.035634
Disea
seModels&Mechan
isms
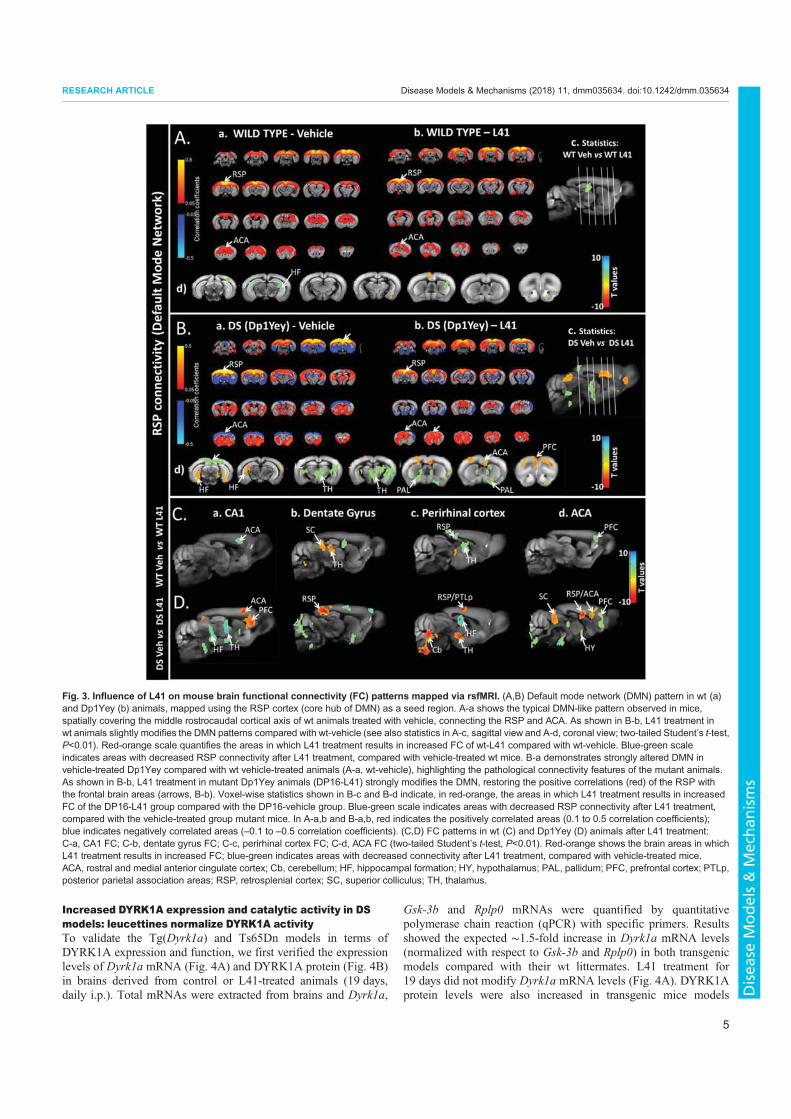
Increased DYRK1A expression and catalytic activity in DSmodels: leucettines normalize DYRK1A activityTo validate the Tg(Dyrk1a) and Ts65Dn models in terms ofDYRK1A expression and function, we first verified the expressionlevels of Dyrk1a mRNA (Fig. 4A) and DYRK1A protein (Fig. 4B)in brains derived from control or L41-treated animals (19 days,daily i.p.). Total mRNAs were extracted from brains and Dyrk1a,
Gsk-3b and Rplp0 mRNAs were quantified by quantitativepolymerase chain reaction (qPCR) with specific primers. Resultsshowed the expected ∼1.5-fold increase in Dyrk1a mRNA levels(normalized with respect to Gsk-3b and Rplp0) in both transgenicmodels compared with their wt littermates. L41 treatment for19 days did not modify Dyrk1a mRNA levels (Fig. 4A). DYRK1Aprotein levels were also increased in transgenic mice models
Fig. 3. Influence of L41 on mouse brain functional connectivity (FC) patterns mapped via rsfMRI. (A,B) Default mode network (DMN) pattern in wt (a)and Dp1Yey (b) animals, mapped using the RSP cortex (core hub of DMN) as a seed region. A-a shows the typical DMN-like pattern observed in mice,spatially covering the middle rostrocaudal cortical axis of wt animals treated with vehicle, connecting the RSP and ACA. As shown in B-b, L41 treatment inwt animals slightly modifies the DMN patterns compared with wt-vehicle (see also statistics in A-c, sagittal view and A-d, coronal view; two-tailed Student’s t-test,P<0.01). Red-orange scale quantifies the areas in which L41 treatment results in increased FC of wt-L41 compared with wt-vehicle. Blue-green scaleindicates areas with decreased RSP connectivity after L41 treatment, compared with vehicle-treated wt mice. B-a demonstrates strongly altered DMN invehicle-treated Dp1Yey compared with wt vehicle-treated animals (A-a, wt-vehicle), highlighting the pathological connectivity features of the mutant animals.As shown in B-b, L41 treatment in mutant Dp1Yey animals (DP16-L41) strongly modifies the DMN, restoring the positive correlations (red) of the RSP withthe frontal brain areas (arrows, B-b). Voxel-wise statistics shown in B-c and B-d indicate, in red-orange, the areas in which L41 treatment results in increasedFC of the DP16-L41 group compared with the DP16-vehicle group. Blue-green scale indicates areas with decreased RSP connectivity after L41 treatment,compared with the vehicle-treated group mutant mice. In A-a,b and B-a,b, red indicates the positively correlated areas (0.1 to 0.5 correlation coefficients);blue indicates negatively correlated areas (–0.1 to –0.5 correlation coefficients). (C,D) FC patterns in wt (C) and Dp1Yey (D) animals after L41 treatment:C-a, CA1 FC; C-b, dentate gyrus FC; C-c, perirhinal cortex FC; C-d, ACA FC (two-tailed Student’s t-test, P<0.01). Red-orange shows the brain areas in whichL41 treatment results in increased FC; blue-green indicates areas with decreased connectivity after L41 treatment, compared with vehicle-treated mice.ACA, rostral and medial anterior cingulate cortex; Cb, cerebellum; HF, hippocampal formation; HY, hypothalamus; PAL, pallidum; PFC, prefrontal cortex; PTLp,posterior parietal association areas; RSP, retrosplenial cortex; SC, superior colliculus; TH, thalamus.
5
RESEARCH ARTICLE Disease Models & Mechanisms (2018) 11, dmm035634. doi:10.1242/dmm.035634
Disea
seModels&Mechan
isms
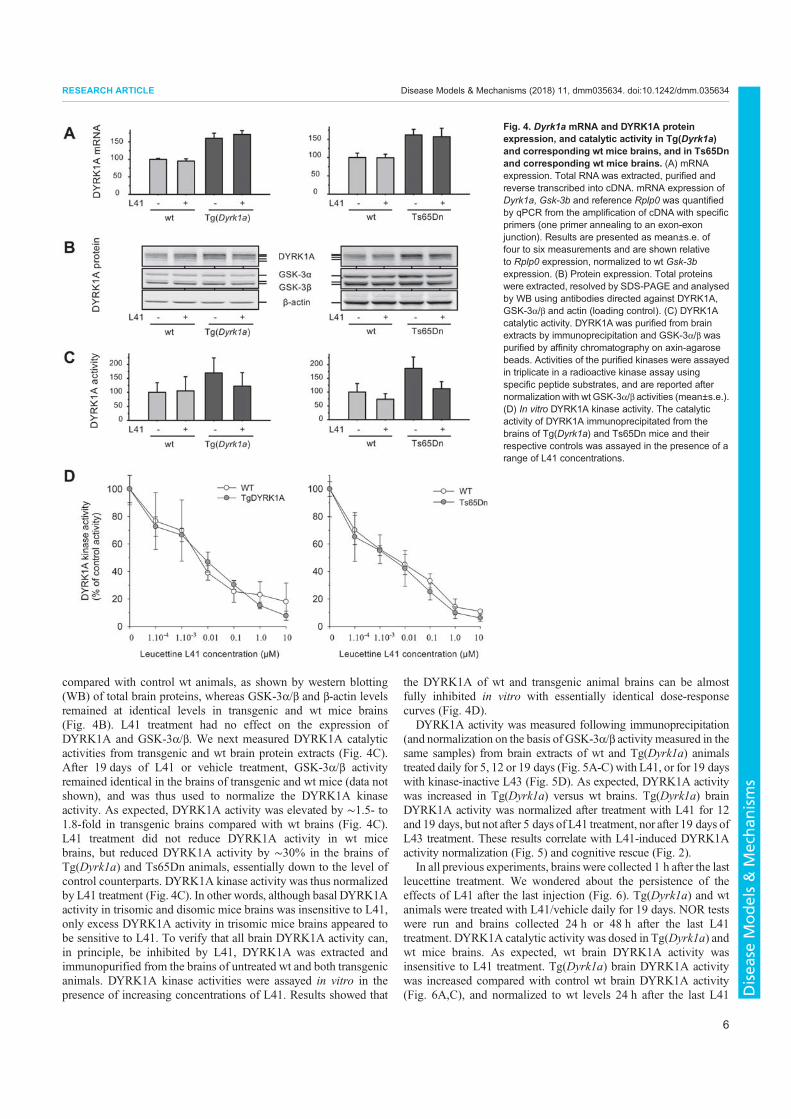
compared with control wt animals, as shown by western blotting(WB) of total brain proteins, whereas GSK-3α/β and β-actin levelsremained at identical levels in transgenic and wt mice brains(Fig. 4B). L41 treatment had no effect on the expression ofDYRK1A and GSK-3α/β. We next measured DYRK1A catalyticactivities from transgenic and wt brain protein extracts (Fig. 4C).After 19 days of L41 or vehicle treatment, GSK-3α/β activityremained identical in the brains of transgenic and wt mice (data notshown), and was thus used to normalize the DYRK1A kinaseactivity. As expected, DYRK1A activity was elevated by ∼1.5- to1.8-fold in transgenic brains compared with wt brains (Fig. 4C).L41 treatment did not reduce DYRK1A activity in wt micebrains, but reduced DYRK1A activity by ∼30% in the brains ofTg(Dyrk1a) and Ts65Dn animals, essentially down to the level ofcontrol counterparts. DYRK1A kinase activity was thus normalizedby L41 treatment (Fig. 4C). In other words, although basal DYRK1Aactivity in trisomic and disomic mice brains was insensitive to L41,only excess DYRK1A activity in trisomic mice brains appeared tobe sensitive to L41. To verify that all brain DYRK1A activity can,in principle, be inhibited by L41, DYRK1A was extracted andimmunopurified from the brains of untreated wt and both transgenicanimals. DYRK1A kinase activities were assayed in vitro in thepresence of increasing concentrations of L41. Results showed that
the DYRK1A of wt and transgenic animal brains can be almostfully inhibited in vitro with essentially identical dose-responsecurves (Fig. 4D).
DYRK1A activity was measured following immunoprecipitation(and normalization on the basis of GSK-3α/β activity measured in thesame samples) from brain extracts of wt and Tg(Dyrk1a) animalstreated daily for 5, 12 or 19 days (Fig. 5A-C) with L41, or for 19 dayswith kinase-inactive L43 (Fig. 5D). As expected, DYRK1A activitywas increased in Tg(Dyrk1a) versus wt brains. Tg(Dyrk1a) brainDYRK1A activity was normalized after treatment with L41 for 12and 19 days, but not after 5 days of L41 treatment, nor after 19 days ofL43 treatment. These results correlate with L41-induced DYRK1Aactivity normalization (Fig. 5) and cognitive rescue (Fig. 2).
In all previous experiments, brains were collected 1 h after the lastleucettine treatment. We wondered about the persistence of theeffects of L41 after the last injection (Fig. 6). Tg(Dyrk1a) and wtanimals were treated with L41/vehicle daily for 19 days. NOR testswere run and brains collected 24 h or 48 h after the last L41treatment. DYRK1A catalytic activity was dosed in Tg(Dyrk1a) andwt mice brains. As expected, wt brain DYRK1A activity wasinsensitive to L41 treatment. Tg(Dyrk1a) brain DYRK1A activitywas increased compared with control wt brain DYRK1A activity(Fig. 6A,C), and normalized to wt levels 24 h after the last L41
Fig. 4. Dyrk1a mRNA and DYRK1A proteinexpression, and catalytic activity in Tg(Dyrk1a)and corresponding wt mice brains, and in Ts65Dnand corresponding wt mice brains. (A) mRNAexpression. Total RNA was extracted, purified andreverse transcribed into cDNA. mRNA expression ofDyrk1a, Gsk-3b and reference Rplp0 was quantifiedby qPCR from the amplification of cDNA with specificprimers (one primer annealing to an exon-exonjunction). Results are presented as mean±s.e. offour to six measurements and are shown relativeto Rplp0 expression, normalized to wt Gsk-3bexpression. (B) Protein expression. Total proteinswere extracted, resolved by SDS-PAGE and analysedby WB using antibodies directed against DYRK1A,GSK-3α/β and actin (loading control). (C) DYRK1Acatalytic activity. DYRK1A was purified from brainextracts by immunoprecipitation and GSK-3α/β waspurified by affinity chromatography on axin-agarosebeads. Activities of the purified kinases were assayedin triplicate in a radioactive kinase assay usingspecific peptide substrates, and are reported afternormalization with wt GSK-3α/β activities (mean±s.e.).(D) In vitro DYRK1A kinase activity. The catalyticactivity of DYRK1A immunoprecipitated from thebrains of Tg(Dyrk1a) and Ts65Dn mice and theirrespective controls was assayed in the presence of arange of L41 concentrations.
6
RESEARCH ARTICLE Disease Models & Mechanisms (2018) 11, dmm035634. doi:10.1242/dmm.035634
Disea
seModels&Mechan
isms
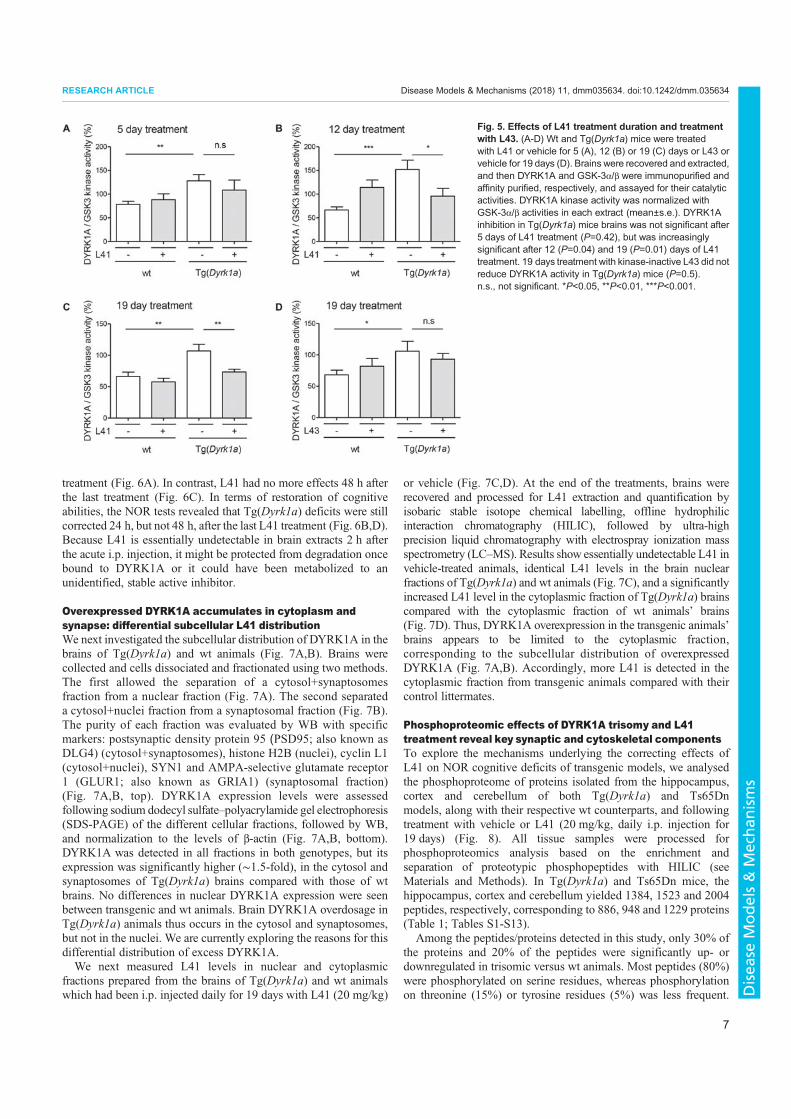
treatment (Fig. 6A). In contrast, L41 had no more effects 48 h afterthe last treatment (Fig. 6C). In terms of restoration of cognitiveabilities, the NOR tests revealed that Tg(Dyrk1a) deficits were stillcorrected 24 h, but not 48 h, after the last L41 treatment (Fig. 6B,D).Because L41 is essentially undetectable in brain extracts 2 h afterthe acute i.p. injection, it might be protected from degradation oncebound to DYRK1A or it could have been metabolized to anunidentified, stable active inhibitor.
Overexpressed DYRK1A accumulates in cytoplasm andsynapse: differential subcellular L41 distributionWe next investigated the subcellular distribution of DYRK1A in thebrains of Tg(Dyrk1a) and wt animals (Fig. 7A,B). Brains werecollected and cells dissociated and fractionated using two methods.The first allowed the separation of a cytosol+synaptosomesfraction from a nuclear fraction (Fig. 7A). The second separateda cytosol+nuclei fraction from a synaptosomal fraction (Fig. 7B).The purity of each fraction was evaluated by WB with specificmarkers: postsynaptic density protein 95 (PSD95; also known asDLG4) (cytosol+synaptosomes), histone H2B (nuclei), cyclin L1(cytosol+nuclei), SYN1 and AMPA-selective glutamate receptor1 (GLUR1; also known as GRIA1) (synaptosomal fraction)(Fig. 7A,B, top). DYRK1A expression levels were assessedfollowing sodium dodecyl sulfate–polyacrylamide gel electrophoresis(SDS-PAGE) of the different cellular fractions, followed by WB,and normalization to the levels of β-actin (Fig. 7A,B, bottom).DYRK1A was detected in all fractions in both genotypes, but itsexpression was significantly higher (∼1.5-fold), in the cytosol andsynaptosomes of Tg(Dyrk1a) brains compared with those of wtbrains. No differences in nuclear DYRK1A expression were seenbetween transgenic and wt animals. Brain DYRK1A overdosage inTg(Dyrk1a) animals thus occurs in the cytosol and synaptosomes,but not in the nuclei. We are currently exploring the reasons for thisdifferential distribution of excess DYRK1A.We next measured L41 levels in nuclear and cytoplasmic
fractions prepared from the brains of Tg(Dyrk1a) and wt animalswhich had been i.p. injected daily for 19 days with L41 (20 mg/kg)
or vehicle (Fig. 7C,D). At the end of the treatments, brains wererecovered and processed for L41 extraction and quantification byisobaric stable isotope chemical labelling, offline hydrophilicinteraction chromatography (HILIC), followed by ultra-highprecision liquid chromatography with electrospray ionization massspectrometry (LC–MS). Results show essentially undetectable L41 invehicle-treated animals, identical L41 levels in the brain nuclearfractions of Tg(Dyrk1a) and wt animals (Fig. 7C), and a significantlyincreased L41 level in the cytoplasmic fraction of Tg(Dyrk1a) brainscompared with the cytoplasmic fraction of wt animals’ brains(Fig. 7D). Thus, DYRK1A overexpression in the transgenic animals’brains appears to be limited to the cytoplasmic fraction,corresponding to the subcellular distribution of overexpressedDYRK1A (Fig. 7A,B). Accordingly, more L41 is detected in thecytoplasmic fraction from transgenic animals compared with theircontrol littermates.
Phosphoproteomic effects of DYRK1A trisomy and L41treatment reveal key synaptic and cytoskeletal componentsTo explore the mechanisms underlying the correcting effects ofL41 on NOR cognitive deficits of transgenic models, we analysedthe phosphoproteome of proteins isolated from the hippocampus,cortex and cerebellum of both Tg(Dyrk1a) and Ts65Dnmodels, along with their respective wt counterparts, and followingtreatment with vehicle or L41 (20 mg/kg, daily i.p. injection for19 days) (Fig. 8). All tissue samples were processed forphosphoproteomics analysis based on the enrichment andseparation of proteotypic phosphopeptides with HILIC (seeMaterials and Methods). In Tg(Dyrk1a) and Ts65Dn mice, thehippocampus, cortex and cerebellum yielded 1384, 1523 and 2004peptides, respectively, corresponding to 886, 948 and 1229 proteins(Table 1; Tables S1-S13).
Among the peptides/proteins detected in this study, only 30% ofthe proteins and 20% of the peptides were significantly up- ordownregulated in trisomic versus wt animals. Most peptides (80%)were phosphorylated on serine residues, whereas phosphorylationon threonine (15%) or tyrosine residues (5%) was less frequent.
Fig. 5. Effects of L41 treatment duration and treatmentwith L43. (A-D) Wt and Tg(Dyrk1a) mice were treatedwith L41 or vehicle for 5 (A), 12 (B) or 19 (C) days or L43 orvehicle for 19 days (D). Brains were recovered and extracted,and then DYRK1A and GSK-3α/β were immunopurified andaffinity purified, respectively, and assayed for their catalyticactivities. DYRK1A kinase activity was normalized withGSK-3α/β activities in each extract (mean±s.e.). DYRK1Ainhibition in Tg(Dyrk1a) mice brains was not significant after5 days of L41 treatment (P=0.42), but was increasinglysignificant after 12 (P=0.04) and 19 (P=0.01) days of L41treatment. 19 days treatment with kinase-inactive L43 did notreduce DYRK1A activity in Tg(Dyrk1a) mice (P=0.5).n.s., not significant. *P<0.05, **P<0.01, ***P<0.001.
7
RESEARCH ARTICLE Disease Models & Mechanisms (2018) 11, dmm035634. doi:10.1242/dmm.035634
Disea
seModels&Mechan
isms
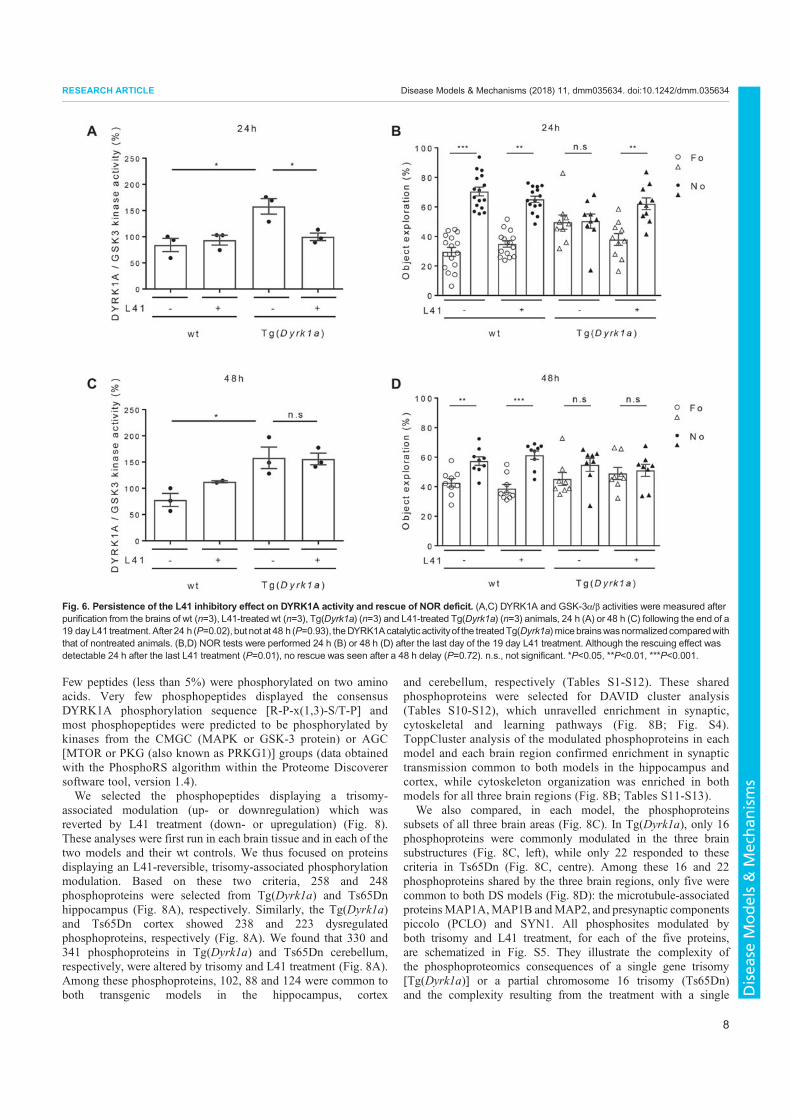
Few peptides (less than 5%) were phosphorylated on two aminoacids. Very few phosphopeptides displayed the consensusDYRK1A phosphorylation sequence [R-P-x(1,3)-S/T-P] andmost phosphopeptides were predicted to be phosphorylated bykinases from the CMGC (MAPK or GSK-3 protein) or AGC[MTOR or PKG (also known as PRKG1)] groups (data obtainedwith the PhosphoRS algorithm within the Proteome Discoverersoftware tool, version 1.4).We selected the phosphopeptides displaying a trisomy-
associated modulation (up- or downregulation) which wasreverted by L41 treatment (down- or upregulation) (Fig. 8).These analyses were first run in each brain tissue and in each of thetwo models and their wt controls. We thus focused on proteinsdisplaying an L41-reversible, trisomy-associated phosphorylationmodulation. Based on these two criteria, 258 and 248phosphoproteins were selected from Tg(Dyrk1a) and Ts65Dnhippocampus (Fig. 8A), respectively. Similarly, the Tg(Dyrk1a)and Ts65Dn cortex showed 238 and 223 dysregulatedphosphoproteins, respectively (Fig. 8A). We found that 330 and341 phosphoproteins in Tg(Dyrk1a) and Ts65Dn cerebellum,respectively, were altered by trisomy and L41 treatment (Fig. 8A).Among these phosphoproteins, 102, 88 and 124 were common toboth transgenic models in the hippocampus, cortex
and cerebellum, respectively (Tables S1-S12). These sharedphosphoproteins were selected for DAVID cluster analysis(Tables S10-S12), which unravelled enrichment in synaptic,cytoskeletal and learning pathways (Fig. 8B; Fig. S4).ToppCluster analysis of the modulated phosphoproteins in eachmodel and each brain region confirmed enrichment in synaptictransmission common to both models in the hippocampus andcortex, while cytoskeleton organization was enriched in bothmodels for all three brain regions (Fig. 8B; Tables S11-S13).
We also compared, in each model, the phosphoproteinssubsets of all three brain areas (Fig. 8C). In Tg(Dyrk1a), only 16phosphoproteins were commonly modulated in the three brainsubstructures (Fig. 8C, left), while only 22 responded to thesecriteria in Ts65Dn (Fig. 8C, centre). Among these 16 and 22phosphoproteins shared by the three brain regions, only five werecommon to both DS models (Fig. 8D): the microtubule-associatedproteinsMAP1A,MAP1B andMAP2, and presynaptic componentspiccolo (PCLO) and SYN1. All phosphosites modulated byboth trisomy and L41 treatment, for each of the five proteins,are schematized in Fig. S5. They illustrate the complexity ofthe phosphoproteomics consequences of a single gene trisomy[Tg(Dyrk1a)] or a partial chromosome 16 trisomy (Ts65Dn)and the complexity resulting from the treatment with a single
Fig. 6. Persistence of the L41 inhibitory effect on DYRK1A activity and rescue of NOR deficit. (A,C) DYRK1A and GSK-3α/β activities were measured afterpurification from the brains of wt (n=3), L41-treated wt (n=3), Tg(Dyrk1a) (n=3) and L41-treated Tg(Dyrk1a) (n=3) animals, 24 h (A) or 48 h (C) following the end of a19 dayL41 treatment.After 24 h (P=0.02), but not at 48 h (P=0.93), theDYRK1Acatalyticactivityof the treatedTg(Dyrk1a)micebrainswasnormalizedcomparedwiththat of nontreated animals. (B,D) NOR tests were performed 24 h (B) or 48 h (D) after the last day of the 19 day L41 treatment. Although the rescuing effect wasdetectable 24 h after the last L41 treatment (P=0.01), no rescue was seen after a 48 h delay (P=0.72). n.s., not significant. *P<0.05, **P<0.01, ***P<0.001.
8
RESEARCH ARTICLE Disease Models & Mechanisms (2018) 11, dmm035634. doi:10.1242/dmm.035634
Disea
seModels&Mechan
isms
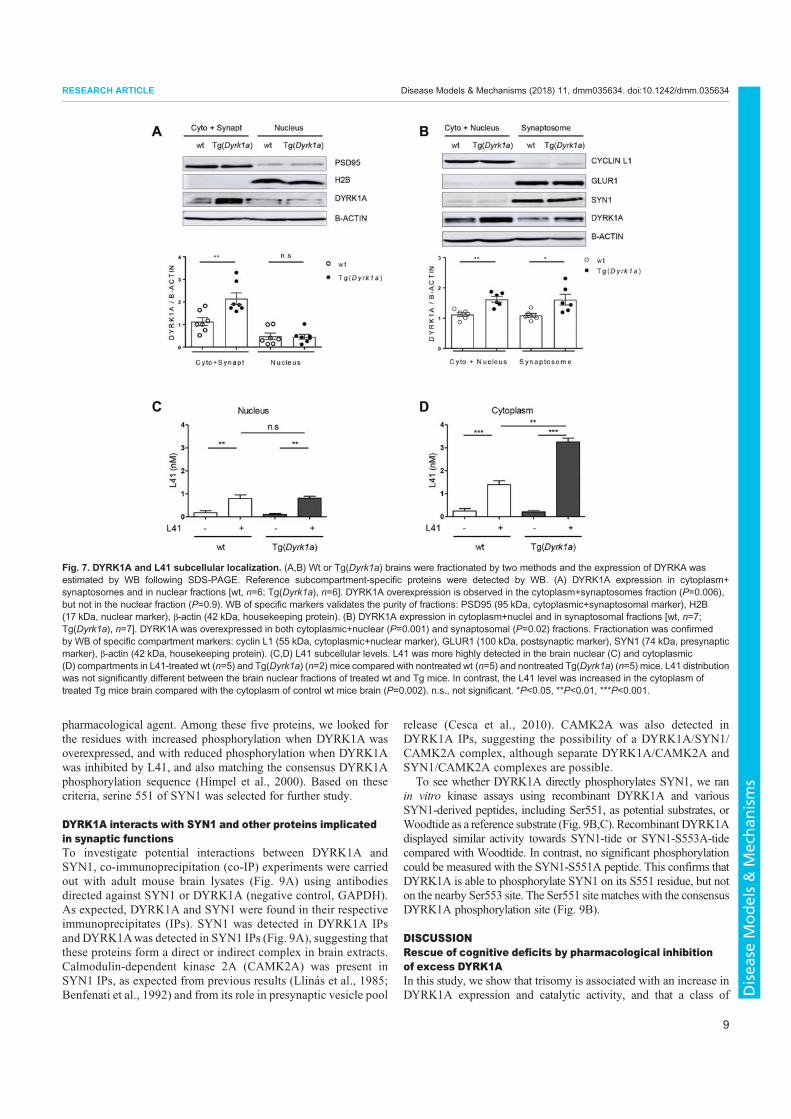
pharmacological agent. Among these five proteins, we looked forthe residues with increased phosphorylation when DYRK1A wasoverexpressed, and with reduced phosphorylation when DYRK1Awas inhibited by L41, and also matching the consensus DYRK1Aphosphorylation sequence (Himpel et al., 2000). Based on thesecriteria, serine 551 of SYN1 was selected for further study.
DYRK1A interacts with SYN1 and other proteins implicatedin synaptic functionsTo investigate potential interactions between DYRK1A andSYN1, co-immunoprecipitation (co-IP) experiments were carriedout with adult mouse brain lysates (Fig. 9A) using antibodiesdirected against SYN1 or DYRK1A (negative control, GAPDH).As expected, DYRK1A and SYN1 were found in their respectiveimmunoprecipitates (IPs). SYN1 was detected in DYRK1A IPsand DYRK1Awas detected in SYN1 IPs (Fig. 9A), suggesting thatthese proteins form a direct or indirect complex in brain extracts.Calmodulin-dependent kinase 2A (CAMK2A) was present inSYN1 IPs, as expected from previous results (Llinás et al., 1985;Benfenati et al., 1992) and from its role in presynaptic vesicle pool
release (Cesca et al., 2010). CAMK2A was also detected inDYRK1A IPs, suggesting the possibility of a DYRK1A/SYN1/CAMK2A complex, although separate DYRK1A/CAMK2A andSYN1/CAMK2A complexes are possible.
To see whether DYRK1A directly phosphorylates SYN1, we ranin vitro kinase assays using recombinant DYRK1A and variousSYN1-derived peptides, including Ser551, as potential substrates, orWoodtide as a reference substrate (Fig. 9B,C). Recombinant DYRK1Adisplayed similar activity towards SYN1-tide or SYN1-S553A-tidecompared with Woodtide. In contrast, no significant phosphorylationcould be measured with the SYN1-S551A peptide. This confirms thatDYRK1A is able to phosphorylate SYN1 on its S551 residue, but noton the nearby Ser553 site. The Ser551 site matches with the consensusDYRK1A phosphorylation site (Fig. 9B).
DISCUSSIONRescue of cognitive deficits by pharmacological inhibitionof excess DYRK1AIn this study, we show that trisomy is associated with an increase inDYRK1A expression and catalytic activity, and that a class of
Fig. 7. DYRK1A and L41 subcellular localization. (A,B) Wt or Tg(Dyrk1a) brains were fractionated by two methods and the expression of DYRKA wasestimated by WB following SDS-PAGE. Reference subcompartment-specific proteins were detected by WB. (A) DYRK1A expression in cytoplasm+synaptosomes and in nuclear fractions [wt, n=6; Tg(Dyrk1a), n=6]. DYRK1A overexpression is observed in the cytoplasm+synaptosomes fraction (P=0.006),but not in the nuclear fraction (P=0.9). WB of specific markers validates the purity of fractions: PSD95 (95 kDa, cytoplasmic+synaptosomal marker), H2B(17 kDa, nuclear marker), β-actin (42 kDa, housekeeping protein). (B) DYRK1A expression in cytoplasm+nuclei and in synaptosomal fractions [wt, n=7;Tg(Dyrk1a), n=7]. DYRK1A was overexpressed in both cytoplasmic+nuclear (P=0.001) and synaptosomal (P=0.02) fractions. Fractionation was confirmedby WB of specific compartment markers: cyclin L1 (55 kDa, cytoplasmic+nuclear marker), GLUR1 (100 kDa, postsynaptic marker), SYN1 (74 kDa, presynapticmarker), β-actin (42 kDa, housekeeping protein). (C,D) L41 subcellular levels. L41 was more highly detected in the brain nuclear (C) and cytoplasmic(D) compartments in L41-treated wt (n=5) and Tg(Dyrk1a) (n=2) mice compared with nontreated wt (n=5) and nontreated Tg(Dyrk1a) (n=5) mice. L41 distributionwas not significantly different between the brain nuclear fractions of treated wt and Tg mice. In contrast, the L41 level was increased in the cytoplasm oftreated Tg mice brain compared with the cytoplasm of control wt mice brain (P=0.002). n.s., not significant. *P<0.05, **P<0.01, ***P<0.001.
9
RESEARCH ARTICLE Disease Models & Mechanisms (2018) 11, dmm035634. doi:10.1242/dmm.035634
Disea
seModels&Mechan
isms
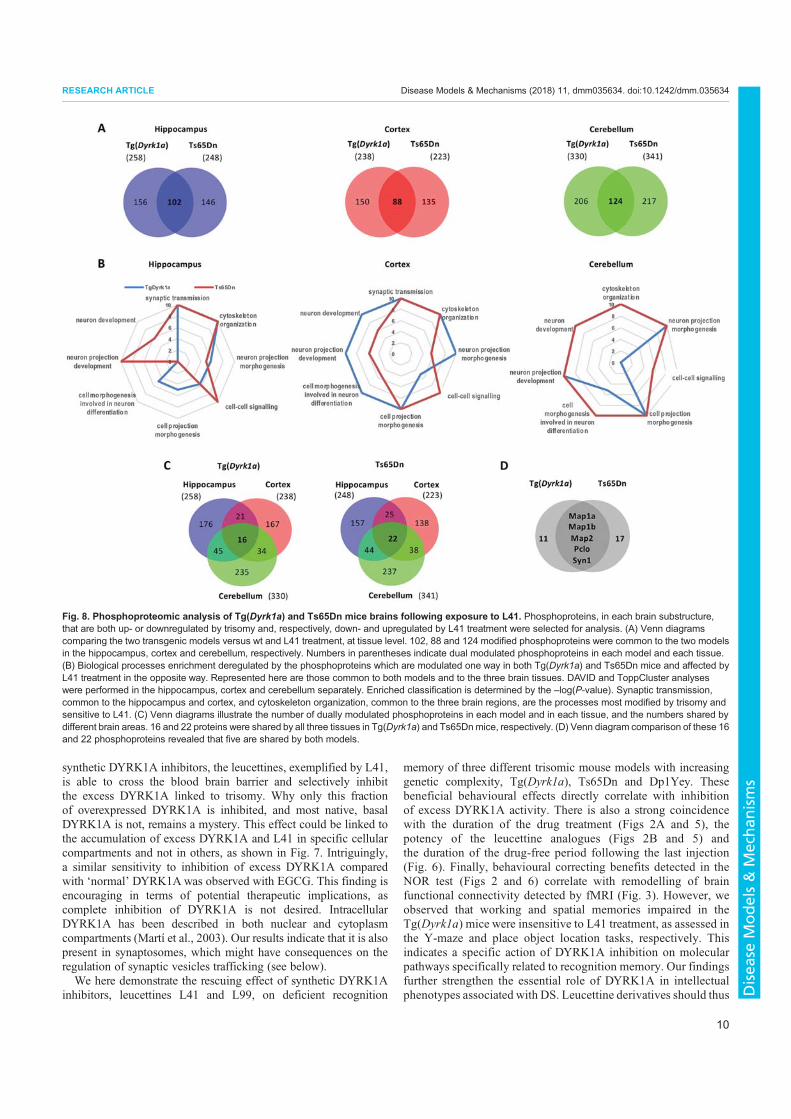
synthetic DYRK1A inhibitors, the leucettines, exemplified by L41,is able to cross the blood brain barrier and selectively inhibitthe excess DYRK1A linked to trisomy. Why only this fractionof overexpressed DYRK1A is inhibited, and most native, basalDYRK1A is not, remains a mystery. This effect could be linked tothe accumulation of excess DYRK1A and L41 in specific cellularcompartments and not in others, as shown in Fig. 7. Intriguingly,a similar sensitivity to inhibition of excess DYRK1A comparedwith ‘normal’ DYRK1A was observed with EGCG. This finding isencouraging in terms of potential therapeutic implications, ascomplete inhibition of DYRK1A is not desired. IntracellularDYRK1A has been described in both nuclear and cytoplasmcompartments (Martí et al., 2003). Our results indicate that it is alsopresent in synaptosomes, which might have consequences on theregulation of synaptic vesicles trafficking (see below).We here demonstrate the rescuing effect of synthetic DYRK1A
inhibitors, leucettines L41 and L99, on deficient recognition
memory of three different trisomic mouse models with increasinggenetic complexity, Tg(Dyrk1a), Ts65Dn and Dp1Yey. Thesebeneficial behavioural effects directly correlate with inhibitionof excess DYRK1A activity. There is also a strong coincidencewith the duration of the drug treatment (Figs 2A and 5), thepotency of the leucettine analogues (Figs 2B and 5) andthe duration of the drug-free period following the last injection(Fig. 6). Finally, behavioural correcting benefits detected in theNOR test (Figs 2 and 6) correlate with remodelling of brainfunctional connectivity detected by fMRI (Fig. 3). However, weobserved that working and spatial memories impaired in theTg(Dyrk1a) mice were insensitive to L41 treatment, as assessed inthe Y-maze and place object location tasks, respectively. Thisindicates a specific action of DYRK1A inhibition on molecularpathways specifically related to recognition memory. Our findingsfurther strengthen the essential role of DYRK1A in intellectualphenotypes associated with DS. Leucettine derivatives should thus
Fig. 8. Phosphoproteomic analysis of Tg(Dyrk1a) and Ts65Dn mice brains following exposure to L41. Phosphoproteins, in each brain substructure,that are both up- or downregulated by trisomy and, respectively, down- and upregulated by L41 treatment were selected for analysis. (A) Venn diagramscomparing the two transgenic models versus wt and L41 treatment, at tissue level. 102, 88 and 124 modified phosphoproteins were common to the two modelsin the hippocampus, cortex and cerebellum, respectively. Numbers in parentheses indicate dual modulated phosphoproteins in each model and each tissue.(B) Biological processes enrichment deregulated by the phosphoproteins which are modulated one way in both Tg(Dyrk1a) and Ts65Dn mice and affected byL41 treatment in the opposite way. Represented here are those common to both models and to the three brain tissues. DAVID and ToppCluster analyseswere performed in the hippocampus, cortex and cerebellum separately. Enriched classification is determined by the –log(P-value). Synaptic transmission,common to the hippocampus and cortex, and cytoskeleton organization, common to the three brain regions, are the processes most modified by trisomy andsensitive to L41. (C) Venn diagrams illustrate the number of dually modulated phosphoproteins in each model and in each tissue, and the numbers shared bydifferent brain areas. 16 and 22 proteins were shared by all three tissues in Tg(Dyrk1a) and Ts65Dnmice, respectively. (D) Venn diagram comparison of these 16and 22 phosphoproteins revealed that five are shared by both models.
10
RESEARCH ARTICLE Disease Models & Mechanisms (2018) 11, dmm035634. doi:10.1242/dmm.035634
Disea
seModels&Mechan
isms
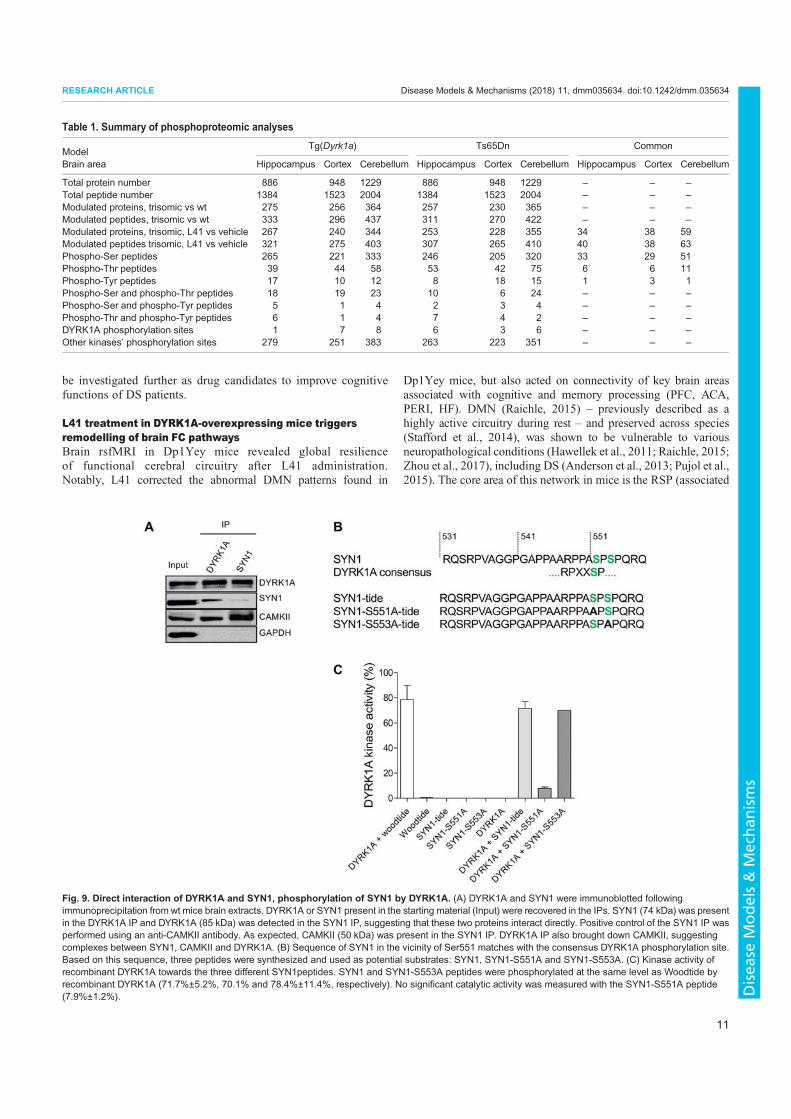
be investigated further as drug candidates to improve cognitivefunctions of DS patients.
L41 treatment in DYRK1A-overexpressing mice triggersremodelling of brain FC pathwaysBrain rsfMRI in Dp1Yey mice revealed global resilienceof functional cerebral circuitry after L41 administration.Notably, L41 corrected the abnormal DMN patterns found in
Dp1Yey mice, but also acted on connectivity of key brain areasassociated with cognitive and memory processing (PFC, ACA,PERI, HF). DMN (Raichle, 2015) – previously described as ahighly active circuitry during rest – and preserved across species(Stafford et al., 2014), was shown to be vulnerable to variousneuropathological conditions (Hawellek et al., 2011; Raichle, 2015;Zhou et al., 2017), including DS (Anderson et al., 2013; Pujol et al.,2015). The core area of this network in mice is the RSP (associated
Table 1. Summary of phosphoproteomic analyses
ModelTg(Dyrk1a) Ts65Dn Common
Brain area Hippocampus Cortex Cerebellum Hippocampus Cortex Cerebellum Hippocampus Cortex Cerebellum
Total protein number 886 948 1229 886 948 1229 – – –
Total peptide number 1384 1523 2004 1384 1523 2004 – – –
Modulated proteins, trisomic vs wt 275 256 364 257 230 365 – – –
Modulated peptides, trisomic vs wt 333 296 437 311 270 422 – – –
Modulated proteins, trisomic, L41 vs vehicle 267 240 344 253 228 355 34 38 59Modulated peptides trisomic, L41 vs vehicle 321 275 403 307 265 410 40 38 63Phospho-Ser peptides 265 221 333 246 205 320 33 29 51Phospho-Thr peptides 39 44 58 53 42 75 6 6 11Phospho-Tyr peptides 17 10 12 8 18 15 1 3 1Phospho-Ser and phospho-Thr peptides 18 19 23 10 6 24 – – –
Phospho-Ser and phospho-Tyr peptides 5 1 4 2 3 4 – – –
Phospho-Thr and phospho-Tyr peptides 6 1 4 7 4 2 – – –
DYRK1A phosphorylation sites 1 7 8 6 3 6 – – –
Other kinases’ phosphorylation sites 279 251 383 263 223 351 – – –
Fig. 9. Direct interaction of DYRK1A and SYN1, phosphorylation of SYN1 by DYRK1A. (A) DYRK1A and SYN1 were immunoblotted followingimmunoprecipitation from wt mice brain extracts. DYRK1A or SYN1 present in the starting material (Input) were recovered in the IPs. SYN1 (74 kDa) was presentin the DYRK1A IP and DYRK1A (85 kDa) was detected in the SYN1 IP, suggesting that these two proteins interact directly. Positive control of the SYN1 IP wasperformed using an anti-CAMKII antibody. As expected, CAMKII (50 kDa) was present in the SYN1 IP. DYRK1A IP also brought down CAMKII, suggestingcomplexes between SYN1, CAMKII and DYRK1A. (B) Sequence of SYN1 in the vicinity of Ser551 matches with the consensus DYRK1A phosphorylation site.Based on this sequence, three peptides were synthesized and used as potential substrates: SYN1, SYN1-S551A and SYN1-S553A. (C) Kinase activity ofrecombinant DYRK1A towards the three different SYN1peptides. SYN1 and SYN1-S553A peptides were phosphorylated at the same level as Woodtide byrecombinant DYRK1A (71.7%±5.2%, 70.1% and 78.4%±11.4%, respectively). No significant catalytic activity was measured with the SYN1-S551A peptide(7.9%±1.2%).
11
RESEARCH ARTICLE Disease Models & Mechanisms (2018) 11, dmm035634. doi:10.1242/dmm.035634
Disea
seModels&Mechan
isms
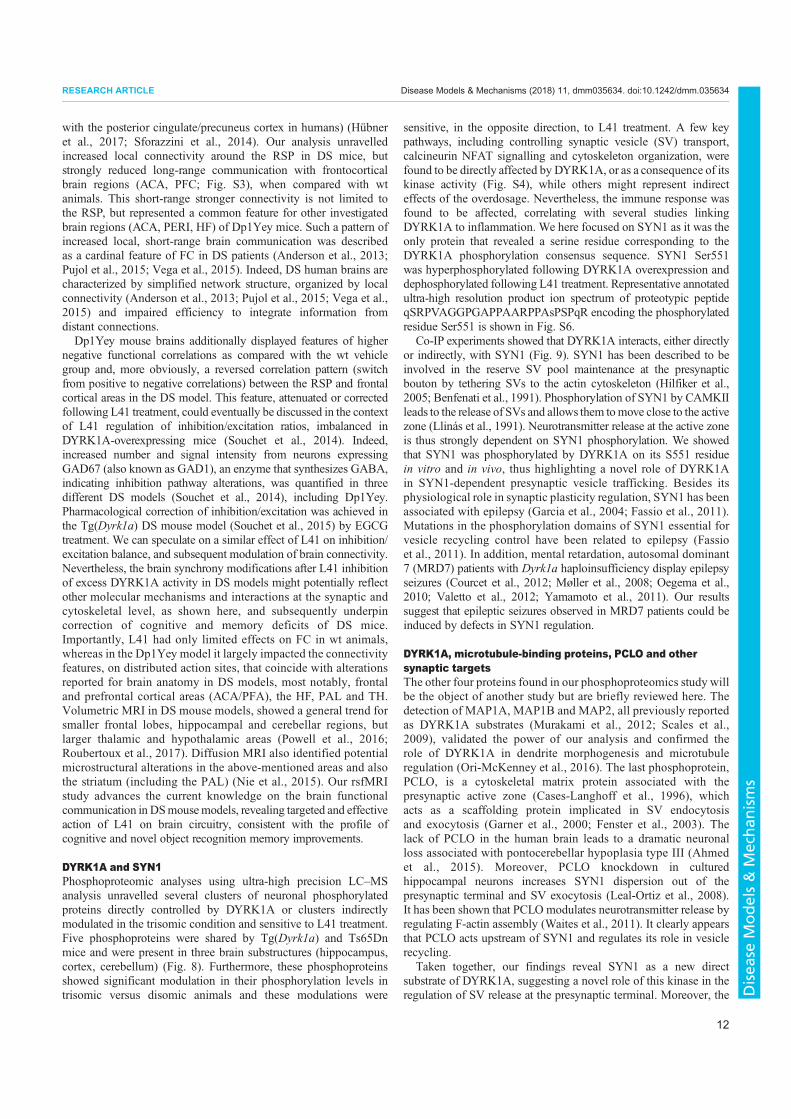
with the posterior cingulate/precuneus cortex in humans) (Hübneret al., 2017; Sforazzini et al., 2014). Our analysis unravelledincreased local connectivity around the RSP in DS mice, butstrongly reduced long-range communication with frontocorticalbrain regions (ACA, PFC; Fig. S3), when compared with wtanimals. This short-range stronger connectivity is not limited tothe RSP, but represented a common feature for other investigatedbrain regions (ACA, PERI, HF) of Dp1Yey mice. Such a pattern ofincreased local, short-range brain communication was describedas a cardinal feature of FC in DS patients (Anderson et al., 2013;Pujol et al., 2015; Vega et al., 2015). Indeed, DS human brains arecharacterized by simplified network structure, organized by localconnectivity (Anderson et al., 2013; Pujol et al., 2015; Vega et al.,2015) and impaired efficiency to integrate information fromdistant connections.Dp1Yey mouse brains additionally displayed features of higher
negative functional correlations as compared with the wt vehiclegroup and, more obviously, a reversed correlation pattern (switchfrom positive to negative correlations) between the RSP and frontalcortical areas in the DS model. This feature, attenuated or correctedfollowing L41 treatment, could eventually be discussed in the contextof L41 regulation of inhibition/excitation ratios, imbalanced inDYRK1A-overexpressing mice (Souchet et al., 2014). Indeed,increased number and signal intensity from neurons expressingGAD67 (also known as GAD1), an enzyme that synthesizes GABA,indicating inhibition pathway alterations, was quantified in threedifferent DS models (Souchet et al., 2014), including Dp1Yey.Pharmacological correction of inhibition/excitation was achieved inthe Tg(Dyrk1a) DS mouse model (Souchet et al., 2015) by EGCGtreatment. We can speculate on a similar effect of L41 on inhibition/excitation balance, and subsequent modulation of brain connectivity.Nevertheless, the brain synchrony modifications after L41 inhibitionof excess DYRK1A activity in DS models might potentially reflectother molecular mechanisms and interactions at the synaptic andcytoskeletal level, as shown here, and subsequently underpincorrection of cognitive and memory deficits of DS mice.Importantly, L41 had only limited effects on FC in wt animals,whereas in the Dp1Yey model it largely impacted the connectivityfeatures, on distributed action sites, that coincide with alterationsreported for brain anatomy in DS models, most notably, frontaland prefrontal cortical areas (ACA/PFA), the HF, PAL and TH.Volumetric MRI in DS mouse models, showed a general trend forsmaller frontal lobes, hippocampal and cerebellar regions, butlarger thalamic and hypothalamic areas (Powell et al., 2016;Roubertoux et al., 2017). Diffusion MRI also identified potentialmicrostructural alterations in the above-mentioned areas and alsothe striatum (including the PAL) (Nie et al., 2015). Our rsfMRIstudy advances the current knowledge on the brain functionalcommunication in DSmousemodels, revealing targeted and effectiveaction of L41 on brain circuitry, consistent with the profile ofcognitive and novel object recognition memory improvements.
DYRK1A and SYN1Phosphoproteomic analyses using ultra-high precision LC–MSanalysis unravelled several clusters of neuronal phosphorylatedproteins directly controlled by DYRK1A or clusters indirectlymodulated in the trisomic condition and sensitive to L41 treatment.Five phosphoproteins were shared by Tg(Dyrk1a) and Ts65Dnmice and were present in three brain substructures (hippocampus,cortex, cerebellum) (Fig. 8). Furthermore, these phosphoproteinsshowed significant modulation in their phosphorylation levels intrisomic versus disomic animals and these modulations were
sensitive, in the opposite direction, to L41 treatment. A few keypathways, including controlling synaptic vesicle (SV) transport,calcineurin NFAT signalling and cytoskeleton organization, werefound to be directly affected by DYRK1A, or as a consequence of itskinase activity (Fig. S4), while others might represent indirecteffects of the overdosage. Nevertheless, the immune response wasfound to be affected, correlating with several studies linkingDYRK1A to inflammation. We here focused on SYN1 as it was theonly protein that revealed a serine residue corresponding to theDYRK1A phosphorylation consensus sequence. SYN1 Ser551was hyperphosphorylated following DYRK1A overexpression anddephosphorylated following L41 treatment. Representative annotatedultra-high resolution product ion spectrum of proteotypic peptideqSRPVAGGPGAPPAARPPAsPSPqR encoding the phosphorylatedresidue Ser551 is shown in Fig. S6.
Co-IP experiments showed that DYRK1A interacts, either directlyor indirectly, with SYN1 (Fig. 9). SYN1 has been described to beinvolved in the reserve SV pool maintenance at the presynapticbouton by tethering SVs to the actin cytoskeleton (Hilfiker et al.,2005; Benfenati et al., 1991). Phosphorylation of SYN1 by CAMKIIleads to the release of SVs and allows them tomove close to the activezone (Llinás et al., 1991). Neurotransmitter release at the active zoneis thus strongly dependent on SYN1 phosphorylation. We showedthat SYN1 was phosphorylated by DYRK1A on its S551 residuein vitro and in vivo, thus highlighting a novel role of DYRK1Ain SYN1-dependent presynaptic vesicle trafficking. Besides itsphysiological role in synaptic plasticity regulation, SYN1 has beenassociated with epilepsy (Garcia et al., 2004; Fassio et al., 2011).Mutations in the phosphorylation domains of SYN1 essential forvesicle recycling control have been related to epilepsy (Fassioet al., 2011). In addition, mental retardation, autosomal dominant7 (MRD7) patients with Dyrk1a haploinsufficiency display epilepsyseizures (Courcet et al., 2012; Møller et al., 2008; Oegema et al.,2010; Valetto et al., 2012; Yamamoto et al., 2011). Our resultssuggest that epileptic seizures observed in MRD7 patients could beinduced by defects in SYN1 regulation.
DYRK1A, microtubule-binding proteins, PCLO and othersynaptic targetsThe other four proteins found in our phosphoproteomics study willbe the object of another study but are briefly reviewed here. Thedetection of MAP1A, MAP1B and MAP2, all previously reportedas DYRK1A substrates (Murakami et al., 2012; Scales et al.,2009), validated the power of our analysis and confirmed therole of DYRK1A in dendrite morphogenesis and microtubuleregulation (Ori-McKenney et al., 2016). The last phosphoprotein,PCLO, is a cytoskeletal matrix protein associated with thepresynaptic active zone (Cases-Langhoff et al., 1996), whichacts as a scaffolding protein implicated in SV endocytosisand exocytosis (Garner et al., 2000; Fenster et al., 2003). Thelack of PCLO in the human brain leads to a dramatic neuronalloss associated with pontocerebellar hypoplasia type III (Ahmedet al., 2015). Moreover, PCLO knockdown in culturedhippocampal neurons increases SYN1 dispersion out of thepresynaptic terminal and SV exocytosis (Leal-Ortiz et al., 2008).It has been shown that PCLO modulates neurotransmitter release byregulating F-actin assembly (Waites et al., 2011). It clearly appearsthat PCLO acts upstream of SYN1 and regulates its role in vesiclerecycling.
Taken together, our findings reveal SYN1 as a new directsubstrate of DYRK1A, suggesting a novel role of this kinase in theregulation of SV release at the presynaptic terminal. Moreover, the
12
RESEARCH ARTICLE Disease Models & Mechanisms (2018) 11, dmm035634. doi:10.1242/dmm.035634
Disea
seModels&Mechan
isms
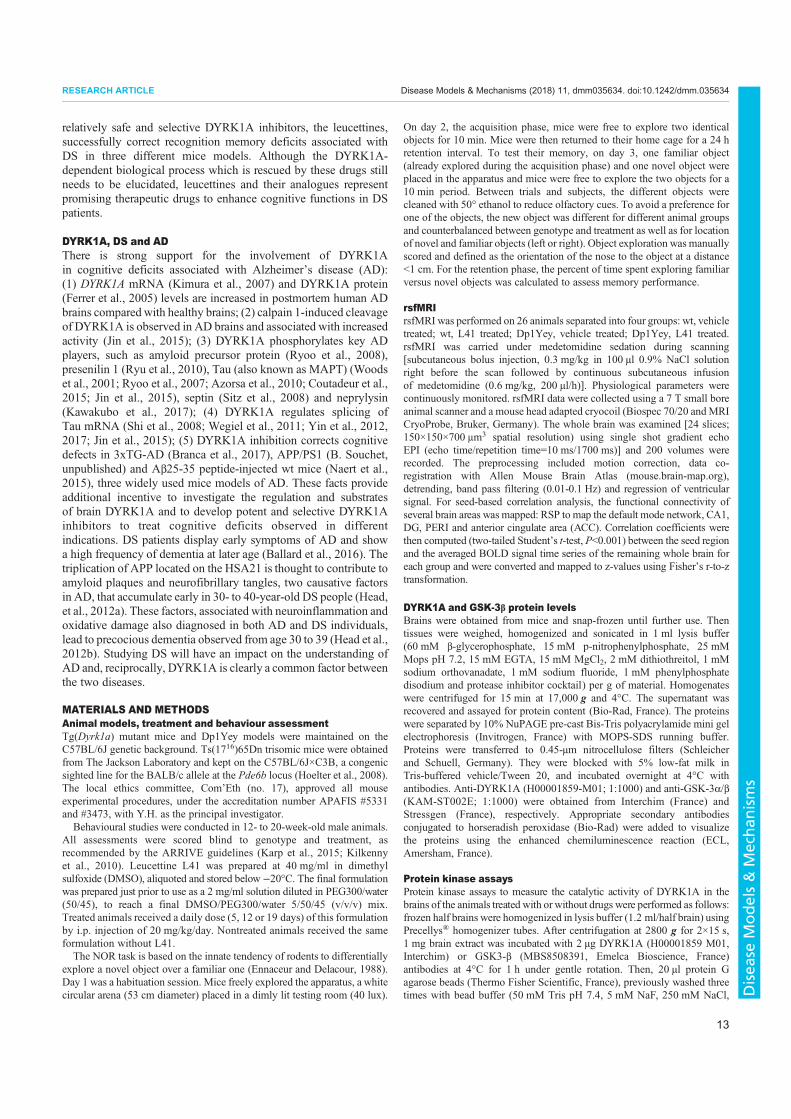
relatively safe and selective DYRK1A inhibitors, the leucettines,successfully correct recognition memory deficits associated withDS in three different mice models. Although the DYRK1A-dependent biological process which is rescued by these drugs stillneeds to be elucidated, leucettines and their analogues representpromising therapeutic drugs to enhance cognitive functions in DSpatients.
DYRK1A, DS and ADThere is strong support for the involvement of DYRK1Ain cognitive deficits associated with Alzheimer’s disease (AD):(1) DYRK1A mRNA (Kimura et al., 2007) and DYRK1A protein(Ferrer et al., 2005) levels are increased in postmortem human ADbrains compared with healthy brains; (2) calpain 1-induced cleavageof DYRK1A is observed in AD brains and associated with increasedactivity (Jin et al., 2015); (3) DYRK1A phosphorylates key ADplayers, such as amyloid precursor protein (Ryoo et al., 2008),presenilin 1 (Ryu et al., 2010), Tau (also known as MAPT) (Woodset al., 2001; Ryoo et al., 2007; Azorsa et al., 2010; Coutadeur et al.,2015; Jin et al., 2015), septin (Sitz et al., 2008) and neprylysin(Kawakubo et al., 2017); (4) DYRK1A regulates splicing ofTau mRNA (Shi et al., 2008; Wegiel et al., 2011; Yin et al., 2012,2017; Jin et al., 2015); (5) DYRK1A inhibition corrects cognitivedefects in 3xTG-AD (Branca et al., 2017), APP/PS1 (B. Souchet,unpublished) and Aβ25-35 peptide-injected wt mice (Naert et al.,2015), three widely used mice models of AD. These facts provideadditional incentive to investigate the regulation and substratesof brain DYRK1A and to develop potent and selective DYRK1Ainhibitors to treat cognitive deficits observed in differentindications. DS patients display early symptoms of AD and showa high frequency of dementia at later age (Ballard et al., 2016). Thetriplication of APP located on the HSA21 is thought to contribute toamyloid plaques and neurofibrillary tangles, two causative factorsin AD, that accumulate early in 30- to 40-year-old DS people (Head,et al., 2012a). These factors, associated with neuroinflammation andoxidative damage also diagnosed in both AD and DS individuals,lead to precocious dementia observed from age 30 to 39 (Head et al.,2012b). Studying DS will have an impact on the understanding ofAD and, reciprocally, DYRK1A is clearly a common factor betweenthe two diseases.
MATERIALS AND METHODSAnimal models, treatment and behaviour assessmentTg(Dyrk1a) mutant mice and Dp1Yey models were maintained on theC57BL/6J genetic background. Ts(1716)65Dn trisomic mice were obtainedfrom The Jackson Laboratory and kept on the C57BL/6J×C3B, a congenicsighted line for the BALB/c allele at the Pde6b locus (Hoelter et al., 2008).The local ethics committee, Com’Eth (no. 17), approved all mouseexperimental procedures, under the accreditation number APAFIS #5331and #3473, with Y.H. as the principal investigator.
Behavioural studies were conducted in 12- to 20-week-old male animals.All assessments were scored blind to genotype and treatment, asrecommended by the ARRIVE guidelines (Karp et al., 2015; Kilkennyet al., 2010). Leucettine L41 was prepared at 40 mg/ml in dimethylsulfoxide (DMSO), aliquoted and stored below −20°C. The final formulationwas prepared just prior to use as a 2 mg/ml solution diluted in PEG300/water(50/45), to reach a final DMSO/PEG300/water 5/50/45 (v/v/v) mix.Treated animals received a daily dose (5, 12 or 19 days) of this formulationby i.p. injection of 20 mg/kg/day. Nontreated animals received the sameformulation without L41.
The NOR task is based on the innate tendency of rodents to differentiallyexplore a novel object over a familiar one (Ennaceur and Delacour, 1988).Day 1 was a habituation session. Mice freely explored the apparatus, a whitecircular arena (53 cm diameter) placed in a dimly lit testing room (40 lux).
On day 2, the acquisition phase, mice were free to explore two identicalobjects for 10 min. Mice were then returned to their home cage for a 24 hretention interval. To test their memory, on day 3, one familiar object(already explored during the acquisition phase) and one novel object wereplaced in the apparatus and mice were free to explore the two objects for a10 min period. Between trials and subjects, the different objects werecleaned with 50° ethanol to reduce olfactory cues. To avoid a preference forone of the objects, the new object was different for different animal groupsand counterbalanced between genotype and treatment as well as for locationof novel and familiar objects (left or right). Object exploration was manuallyscored and defined as the orientation of the nose to the object at a distance<1 cm. For the retention phase, the percent of time spent exploring familiarversus novel objects was calculated to assess memory performance.
rsfMRIrsfMRI was performed on 26 animals separated into four groups: wt, vehicletreated; wt, L41 treated; Dp1Yey, vehicle treated; Dp1Yey, L41 treated.rsfMRI was carried under medetomidine sedation during scanning[subcutaneous bolus injection, 0.3 mg/kg in 100 μl 0.9% NaCl solutionright before the scan followed by continuous subcutaneous infusionof medetomidine (0.6 mg/kg, 200 μl/h)]. Physiological parameters werecontinuously monitored. rsfMRI data were collected using a 7 T small boreanimal scanner and a mouse head adapted cryocoil (Biospec 70/20 andMRICryoProbe, Bruker, Germany). The whole brain was examined [24 slices;150×150×700 μm3 spatial resolution) using single shot gradient echoEPI (echo time/repetition time=10 ms/1700 ms)] and 200 volumes wererecorded. The preprocessing included motion correction, data co-registration with Allen Mouse Brain Atlas (mouse.brain-map.org),detrending, band pass filtering (0.01-0.1 Hz) and regression of ventricularsignal. For seed-based correlation analysis, the functional connectivity ofseveral brain areas was mapped: RSP to map the default mode network, CA1,DG, PERI and anterior cingulate area (ACC). Correlation coefficients werethen computed (two-tailed Student’s t-test, P<0.001) between the seed regionand the averaged BOLD signal time series of the remaining whole brain foreach group and were converted and mapped to z-values using Fisher’s r-to-ztransformation.
DYRK1A and GSK-3β protein levelsBrains were obtained from mice and snap-frozen until further use. Thentissues were weighed, homogenized and sonicated in 1 ml lysis buffer(60 mM β-glycerophosphate, 15 mM p-nitrophenylphosphate, 25 mMMops pH 7.2, 15 mM EGTA, 15 mM MgCl2, 2 mM dithiothreitol, 1 mMsodium orthovanadate, 1 mM sodium fluoride, 1 mM phenylphosphatedisodium and protease inhibitor cocktail) per g of material. Homogenateswere centrifuged for 15 min at 17,000 g and 4°C. The supernatant wasrecovered and assayed for protein content (Bio-Rad, France). The proteinswere separated by 10% NuPAGE pre-cast Bis-Tris polyacrylamide mini gelelectrophoresis (Invitrogen, France) with MOPS-SDS running buffer.Proteins were transferred to 0.45-μm nitrocellulose filters (Schleicherand Schuell, Germany). They were blocked with 5% low-fat milk inTris-buffered vehicle/Tween 20, and incubated overnight at 4°C withantibodies. Anti-DYRK1A (H00001859-M01; 1:1000) and anti-GSK-3α/β(KAM-ST002E; 1:1000) were obtained from Interchim (France) andStressgen (France), respectively. Appropriate secondary antibodiesconjugated to horseradish peroxidase (Bio-Rad) were added to visualizethe proteins using the enhanced chemiluminescence reaction (ECL,Amersham, France).
Protein kinase assaysProtein kinase assays to measure the catalytic activity of DYRK1A in thebrains of the animals treated with or without drugs were performed as follows:frozen half brains were homogenized in lysis buffer (1.2 ml/half brain) usingPrecellys® homogenizer tubes. After centrifugation at 2800 g for 2×15 s,1 mg brain extract was incubated with 2 μg DYRK1A (H00001859 M01,Interchim) or GSK3-β (MBS8508391, Emelca Bioscience, France)antibodies at 4°C for 1 h under gentle rotation. Then, 20 μl protein Gagarose beads (Thermo Fisher Scientific, France), previously washed threetimes with bead buffer (50 mM Tris pH 7.4, 5 mM NaF, 250 mM NaCl,
13
RESEARCH ARTICLE Disease Models & Mechanisms (2018) 11, dmm035634. doi:10.1242/dmm.035634
Disea
seModels&Mechan
isms
5 mM EDTA, 5 mM EGTA, 0.1% Nonidet P-40 and protease inhibitorcocktail from Roche, France), were added to the mix and gently rotatedat 4°C for 30 min. After a 1 min spin at 10,000 g and removal of thesupernatant, the pelleted immune complexes were washed three times withbead buffer, and a last time with Buffer C (60 mM β-glycerophosphate,30 mM p-nitrophenolphosphate, 25 mM Mops pH 7.2, 5 mM EGTA,15 mM MgCl2, 2 mM dithiothreitol, 0.1 mM sodium orthovanadate,1 mM phenylphosphate, protease inhibitor cocktail). DYRK1A or GSK-3immobilized on beads were assayed in buffer C as described in theSupplementaryMaterials andMethods withWoodtide (KKISGRLSPIMTEQ)(1.5 μg/assay) or GSK3-tide (YRRAAVPPSPSLSRHSSPHQpSED-EEE,where pS stands for phosphorylated serine) as substrates.
Protein kinase assays to evaluate SYN1 phosphorylation by DYRK1Awere performed with 50 ng recombinant DYRK1A protein (PV3785,Thermo Fisher Scientific) and 0.98 mM Woodtide, and three peptidesderived from the SYN1 putative DYRK1A phosphorylation site (Fig. 9C).Kinase activity was then measured as described in the SupplementaryMaterials and Methods.
The selectivity of the three leucettines used in this study was evaluatedin a panel of 16 recombinant protein kinases assayed as described in theSupplementary Materials and Methods.
Subcellular fractionationNuclear, cytosolic and synaptosomal subcellular fractionation of braintissue was performed with the Syn-PER™ and ProteoExtract® TissueDissociation Buffer Kit and Subcellular Proteome Extraction Kit followingthe instructions of the manufacturer. Fractions were analysed by SDS-PAGEand WB with specific antibodies.
Phosphoproteomics results analysisGene ontology enrichment analyses of phosphoproteins that are modulated(up- or downregulated) in Tg(Dyrk1a) or Ts65Dn mice versus wt and alsomodulated in the opposite manner (down- or upregulated) by the L41treatment, were conducted using ToppCluster (Bonferroni correction,P-value cutoff 0.05). Only biological processes common to the threebrain regions and both models are presented (complete biological processesare listed in Tables S11-S13).
DYRK1A substrates and their respective phosphorylation sites wereidentified in the phosphoproteome based on the DYRK1A phosphorylationconsensus sequence R-P-x(1,3)-S/T-P (Himpel et al., 2000). Protein-proteininteractions of each substrate were generated with STRING web serverapplication. Biological process enrichments of each cluster were assessed byusing ToppCluster web server application. Phospho-network was mappedwith the Cytoscape tool. See Supplementary Materials and Methodsfor details.
Immunoprecipitation and immunoblottingAll immunoprecipitations were performed on fresh half brains of 3-month-old wt male mice. Brains were dissected and lysed in 1.2 ml RIPA lysisbuffer (Santa-Cruz Biotechnology, France) using Precellys® homogenizertubes. After centrifugation at 2800 g for 2×15 s, 1 ml brain extract wasincubated with 2 μg of antibody of interest at 4°C for 1 h under gentlerotation. An aliquot of the remaining supernatant was kept for furtherimmunoblotting as homogenate control. Then, 20 μl protein G agarosebeads, previously washed three times with bead buffer, were added to themix and gently rotated at 4°C for 30 min. After a 1 min spin at 10,000 g andremoval of the supernatant, the pelleted immune complexes were washedthree times with bead buffer beforeWB analysis with appropriate antibodiesdirected against DYRK1A (H00001859 M01, Interchim; 1:1000), PSD95(ab18258, Abcam, France; 1:1000), SYN1 (ab64581, Abcam; 1:1000),CAMK2A (PA5-14315, Thermo Fisher Scientific; 1:1000) and GAPDH(MA5-15738, Thermo Fisher Scientific; 1:3000). Immunoblots wererevealed with Clarity Western ECL Substrate (Bio-Rad).
Competing interestsL.M. is founder, CEO and CSO of ManRos Therapeutics, which licensed thepatent on leucettines and develops these as DS/AD drug candidates. L.M., F.C. andJ.-P.B. are co-inventors on the leucettine patent.
Author contributionsConceptualization: T.L.N., A.D., S.D.G., L.M., Y.H.; Methodology: T.L.N., A.D., N.L.,B.V., M.K., A.E.M., L.-A.H., E.L., J.-P.B., F.C., S.D.G.; Software: M.K., A.E.M.,L.-A.H., S.D.G.; Validation: T.L.N., B.V., L.M.; Formal analysis: T.L.N., A.M., M.K.,A.E.M., L.-A.H., S.D.G.; Investigation: T.L.N., A.D., A.M., N.L., B.V., G.P., M.K.,A.E.M., J.-P.B., F.C., S.D.G.; Resources: A.M., E.L., J.-P.B., F.C.; Data curation:A.M., M.K., A.E.M., L.-A.H., S.D.G.; Writing - original draft: T.L.N., L.M.; Writing -review & editing: T.L.N., S.D.G., L.M., Y.H.; Supervision: S.D.G., L.M., Y.H.; Projectadministration: L.M., Y.H.; Funding acquisition: L.M., Y.H.
FundingThis work was supported by Fonds Unique Interministeriel (TRIAD project;L.M., Y.H., J.-P.B.), Conseil Regional de Bretagne (L.M., Y.H., J.-P.B.),Fondation Jerome Lejeune (L.M.), Seventh Framework Programme (BlueGenics;L.M.), Agence Nationale de la Recherche (Programme Investissements d’Avenir;ANR-10-IDEX-0002-02, ANR-10-LABX-0030-INRT, ANR-10-INBS-07 PHENOMINto Y.H.) and CIFRE (T.L.N.).
Supplementary informationSupplementary information available online athttp://dmm.biologists.org/lookup/doi/10.1242/dmm.035634.supplemental
ReferencesAhmed, M. Y., Chioza, B. A., Rajab, A., Schmitz-Abe, K., Al-Khayat, A.,
Al-Turki, S., Baple, E. L., Patton, M. A., Al-Memar, A. Y., Hurles, M. E. et al.(2015). Loss of PCLO function underlies pontocerebellar hypoplasia type III.Neurology 84, 1745.
Ahn, K.-J., Jeong, H. K., Choi, H.-S., Ryoo, S.-R., Kim, Y. J., Goo, J.-S.,Choi, S.-Y., Han, J.-S., Ha, I. and Song, W.-J. (2006). DYRK1A BAC transgenicmice show altered synaptic plasticity with learning and memory defects.Neurobiol. Dis. 22, 463-472.
Altafaj, X., Dierssen, M., Baamonde, C., Martı, E., Visa, J., Guimera, J., Oset, M.,Gonzalez, J. R., Florez, J., Fillat, C. et al. (2001). Neurodevelopmental delay,motor abnormalities and cognitive deficits in transgenic mice overexpressingDyrk1A (Minibrain), a murine model of Down’s syndrome. Hum. Mol. Genet.10, 1915-1923.
Altafaj, X., Martın, E. D., Ortiz-Abalia, J., Valderrama, A., Lao-Peregrın, C.,Dierssen, M. and Fillat, C. (2013). Normalization of Dyrk1A Expression byAAV2/1-shDyrk1A attenuates hippocampal-dependent defects in the Ts65Dnmouse model of Down syndrome. Neurobiol. Dis. 52, 117-127.
Alvarez, M., Altafaj, X., Aranda, S. and de la Luna, S. (2007). DYRK1Aautophosphorylation on serine residue 520 modulates its kinase activity via14-3-3 binding. Mol. Biol. Cell 18, 1167-1178.
Anderson, J. S., Nielsen, J. A., Ferguson, M. A., Burback, M. C., Cox, E. T.,Dai, L., Gerig, G., Edgin, J. O. and Korenberg, J. R. (2013). Abnormal brainsynchrony in Down syndrome. NeuroImage 2, 703-715.
Arron, J. R., Winslow, M. M., Polleri, A., Chang, C.-P., Wu, H., Gao, X.,Neilson, J. R., Chen, L., Heit, J. J., Kim, S. K. et al. (2006). NFAT dysregulationby increased dosage of DSCR1 and DYRK1A on chromosome 21. Nature441, 595-600.
Azorsa, D. O., Robeson, R. L. H., Frost, D., Meec hoovet, B., Brautigam, G. R.,Dickey, C., Beaudry, C., Basu, G. D., Holz, D. R., Hernandez, J. A. et al. (2010).High-content siRNA screening of the kinome identifies kinases involved inAlzheimer’s disease-related tau hyperphosphorylation. BMC Genomics 11, 25.
Ballard, C., Mobley, W., Hardy, J., Williams, G. and Corbett, A. (2016). Dementiain Down’s syndrome. Lancet Neurol. 15, 622-636.
Benfenati, F., Valtorta, F. and Greengard, P. (1991). Computer modeling ofSynapsin I binding to synaptic vesicles and F-actin: implications for regulation ofneurotransmitter release. Proc. Natl Acad. Sci. USA 88, 575-579.
Benfenati, F., Valtorta, F., Rubenstein, J. L., Gorelick, F. S., Greengard, P. andCzernik, A. J. (1992). Synaptic vesicle-associated Ca2+/Calmodulin-dependentprotein kinase II is a binding protein for synapsin I. Nature 359, 417-420.
Branca, C., Shaw, D. M., Belfiore, R., Gokhale, V., Shaw, A. Y., Foley, C., Smith,B., Hulme, C., Dunckley, T., Meechoovet, B. et al. (2017). Dyrk1 inhibitionimproves Alzheimer’s disease-like pathology. Aging Cell. 16, 1146-1154.
Cases-Langhoff, C., Voss, B., Garner, A. M., Appeltauer, U., Takei, K.,Kindler, S., Veh, R. W., De Cmilli, P., Gundelfinger, E. D. and Garner, C. C.(1996). Piccolo, a novel 420 kDa protein associated with the presynapticcytomatrix. Eur. J. Cell Biol. 10, 214-223.
Cesca, F., Baldelli, P., Valtorta, F. and Benfenati, F. (2010). The synapsins: keyactors of synapse function and plasticity. Prog. Neurobiol. 91, 313-348.
Chen, C.-K., Bregere, C., Paluch, J., Lu, J. F., Dickman, D. K. and Chang, K. T.(2014). Activity-dependent facilitation of synaptojanin and synaptic vesiclerecycling by the minibrain kinase. Nat. Commun. 5, ncomms5246.
Courcet, J.-B., Faivre, L., Malzac, P., Masurel-Paulet, A., Lopez, E., Callier, P.,Lambert, L., Lemesle, M., Thevenon, J., Gigot, N. et al. (2012). The DYRK1Agene is a cause of syndromic intellectual disability with severe microcephaly andepilepsy. J. Med. Genet. 49, 731-736.
14
RESEARCH ARTICLE Disease Models & Mechanisms (2018) 11, dmm035634. doi:10.1242/dmm.035634
Disea
seModels&Mechan
isms
Coutadeur, S., Benyamine, H., Delalonde, L., de Oliveira, C., Leblond, B.,Foucourt, A., Besson, T., Casagrande, A.-S., Taverne, T., Girard, A. et al.(2015). A novel DYRK1A (Dual Specificity Tyrosine Phosphorylation-RegulatedKinase 1A) inhibitor for the treatment of Alzheimer’s disease: effect on tau andamyloid pathologies in vitro. J. Neurochem. 133, 440-451.
de la Torre, R., De Sola, S., Pons, M., Duchon, A., de Lagran, M. M., Farre, M.,Fito, M., Benejam, B., Langohr, K., Rodriguez, J. et al. (2014).Epigallocatechin-3-gallate, a DYRK1A inhibitor, rescues cognitive deficits inDown syndromemousemodels and in humans.Mol. Nutr. FoodRes. 58, 278-288.
de la Torre, R., de Sola, S., Hernandez, G., Farre, M., Pujol, J., Rodriguez, J.,Espadaler, J. M., Langohr, K., Cuenca-Royo, A., Principe, A. et al. (2016).Safety and efficacy of cognitive training plus epigallocatechin-3-gallate inyoung adults with Down’s syndrome (TESDAD): a double-blind, randomised,placebo-controlled, phase 2 trial. Lancet Neurol. 15, 801-810.
Debdab, M., Carreaux, F., Renault, S., Soundararajan, M., Fedorov, O.,Filippakopoulos, P., Lozach, O., Babault, L., Tahtouh, T., Baratte, B. et al.(2011). Leucettines, a class of potent inhibitors of cdc2-like kinases and dualspecificity, tyrosine phosphorylation regulated kinases derived from the marinesponge Leucettamine B: modulation of alternative pre-RNA splicing. J. Med.Chem. 54, 4172-4186.
Di Vona, C., Bezdan, D., Islam, A. B. M. M. K., Salichs, E., Lopez-Bigas, N.,Ossowski, S. and de la Luna, S. (2015). Chromatin-wide profiling of DYRK1Areveals a role as a gene-specific RNA polymerase II CTD kinase. Mol. Cell57, 506-520.
Duchon, A. and Herault, Y. (2016). DYRK1A, a dosage-sensitive gene involved inneurodevelopmental disorders, is a target for drug development in Downsyndrome. Front. Behav. Neurosci. 10, e54285.
Duchon, A., Raveau, M., Chevalier, C., Nalesso, V., Sharp, A. J. and Herault, Y.(2011). Identification of the translocation breakpoints in the Ts65Dn and Ts1Cjemouse lines: relevance for modeling Down syndrome. Mamm. Genome 22, 674.
Ennaceur, A. and Delacour, J. (1988). A new one-trial test for neurobiologicalstudies of memory in rats. 1: behavioral data. Behav. Brain Res. 31, 47-59.
Fassio, A., Patry, L., Congia, S., Onofri, F., Piton, A., Gauthier, J., Pozzi, D.,Messa, M., Defranchi, E., Fadda, M. et al. (2011). SYN1 loss-of-functionmutations in autism and partial epilepsy cause impaired synaptic function. Hum.Mol. Genet. 20, 2297-2307.
Fenster, S. D., Kessels, M. M., Qualmann, B., Chung, W. J., Nash, J.,Gundelfinger, E. D. and Garner, C. C. (2003). Interactions between Piccoloand the actin/dynamin-binding protein Abp1 link vesicle endocytosis topresynaptic active zones. J. Biol. Chem. 278, 20268-20277.
Ferrer, I., Barrachina, M., Puig, B., Martınez de Lagran, M., Martı, E., Avila J. andDierssen, M. (2005). Constitutive Dyrk1A is abnormally expressed in Alzheimerdisease, Down syndrome, Pick disease, and related transgenic models.Neurobiol. Dis. 20, 392-400.
Freund, T. F., Katona, I. andPiomelli, D. (2003). Role of endogenous cannabinoidsin synaptic signaling. Physiol. Rev. 83, 1017-1066.
Garcia, C. C., Blair, H. J., Seager, M., Coulthard, A., Tennant, S., Buddles, M.,Curtis, A. andGoodship, J. A. (2004). Identification of amutation in Synapsin I, asynaptic vesicle protein, in a family with epilepsy. J. Med. Genet. 41, 183-186.
Garcıa-Cerro, S., Martınez, P., Vidal, V., Corrales, A., Florez, J., Vidal, R.,Rueda, N., Arbones, M. L. and Martınez-Cue, C. (2014). Overexpressionof Dyrk1A is implicated in several cognitive, electrophysiological andneuromorphological alterations found in a mouse model of Down syndrome.PLoS ONE 9, e106572.
Garner, C. C., Kindler, S. and Gundelfinger, E. D. (2000). Molecular determinantsof presynaptic active zones. Curr. Opin. Neurobiol. 10, 321-327.
Graaf, K. d., Hekerman, P., Spelten, O., Herrmann, A., Packman, L. C.,Bussow, K., Muller-Newen, G. and Becker, W. (2004). Characterization ofCyclin L2, a novel cyclin with an arginine/serine-rich domain phosphorylation byDYRK1A and colocalization with splicing factors. J. Biol. Chem. 279, 4612-4624.
Grau, C., Arato, K., Fernandez-Fernandez, J. M., Valderrama, A., Sindreu, C.,Fillat, C., Ferrer, I., de la Luna, S. and Altafaj, X. (2014). DYRK1A-mediatedphosphorylation of GluN2A at Ser1048 regulates the surface expression andchannel activity of GluN1/GluN2A receptors. Front. Cell. Neurosci. 8, 331.
Guedj, F., Sebrie, C., Rivals, I., Ledru, A., Paly, E., Bizot, J. C., Smith, D.,Rubin, E., Gillet, B., Arbones, M. et al. (2009). Green tea polyphenols rescue ofbrain defects induced by overexpression of DYRK1A. PLoS ONE 4, e4606.
Guedj, F., Pereira, P. L., Najas, S., Barallobre, M.-J., Chabert, C., Souchet, B.,Sebrie, C., Verney, C., Herault, Y., Arbones, M. et al. (2012). DYRK1A: a masterregulatory protein controlling brain growth. Neurobiol. Dis. 46, 190-203.
Gupta, M., Dhanasekaran, A. R. and Gardiner, K. J. (2016). Mouse models ofDown syndrome: gene content and consequences.Mamm.Genome 27, 538-555.
Hawellek, D. J., Hipp, J. F., Lewis, C. M., Corbetta, M. and Engel, A. K. (2011).Increased functional connectivity indicates the severity of cognitive impairment inmultiple sclerosis. Proc. Natl Acad. Sci. USA 108, 19066-19071.
Head, E., Powell, D., Gold, B. T. and Schmitt, F. A. (2012a). Alzheimer’s disease inDown syndrome. Eur. J. Neurodegener. Dis. 1, 353-364.
Head, E., Silverman, W., Patterson, D. and Lott, I. T. (2012b). Aging and Downsyndrome. Curr. Gerontol. Geriatr. Res. 2012, 412536.
Hilfiker, S., Benfenati, F., Doussau, F., Nairn, A. C., Czernik, A. J.,Augustine, G. J. and Greengard, P. (2005). Structural domains involved in theregulation of transmitter release by synapsins. J. Neurosci. 25, 2658-2669.
Himpel, S., Tegge, W., Frank, R., Leder, S., Joost, H.-G. and Becker, W. (2000).Specificity determinants of substrate recognition by the protein kinase DYRK1A.J. Biol. Chem. 275, 2431-2438.
Hoelter, S. M., Dalke, C., Kallnik, M., Becker, L., Horsch, M., Schrewe, A., Favor,J., Klopstock, T., Beckers, J., Ivandic, B. et al. (2008). “Sighted C3H” mice - atool for analysing the influence of vision on mouse behaviour? Front. Biosci. 13,5810-5823.
Hubner, N. S., Mechling, A. E., Lee, H.-L., Reisert, M., Bienert, T., Hennig, J.,von Elverfeldt, D. and Harsan, L.-A. (2017). The connectomics of braindemyelination: functional and structural patterns in the cuprizone mouse model.Neuroimage 146, 1-18.
Jiang, X., Liu, C., Yu, T., Zhang, L., Meng, K., Xing, Z., Belichenko, P. V.,Kleschevnikov, A. M., Pao, A., Peresie, J. et al. (2015). Genetic dissection of theDown syndrome critical region. Hum. Mol. Genet. 24, 6540-6551.
Jin, N., Yin, X., Gu, J., Zhang, X., Shi, J., Qian, W., Ji, Y., Cao, M., Gu, X., Ding, F.et al. (2015). Truncation and activation of dual specificity tyrosine phosphorylation-regulated kinase 1A by calpain I. J. Biol. Chem. 290, 15219-15237.
Karp, N. A., Meehan, T. F., Morgan, H., Mason, J. C., Blake, A., Kurbatova, N.,Smedley, D., Jacobsen, J., Mott, R. F., Iyer, V. et al. (2015). Applying theARRIVE guidelines to an in vivo database. PLoS Biol. 13, e1002151.
Kawakubo, T., Mori, R., Shirotani, K., Iwata, N. and Asai, M. (2017). NeprilysinIs suppressed by dual-specificity tyrosine-phosphorylation regulated kinase1A (DYRK1A) in Down-syndrome-derived fibroblasts. Biol. Pharm. Bull. 40,327-333.
Khan, N., Afaq, F., Saleem, M., Ahmad, N. and Mukhtar, H. (2006). Targetingmultiple signaling pathways by green tea polyphenol (−)-epigallocatechin-3-gallate. Cancer Res. 66, 2500-2505.
Kilkenny, C., Browne, W. J., Cuthill, I. C., Emerson, M. and Altman, D. G. (2010).Improving bioscience research reporting: the ARRIVE guidelines for reportinganimal research. PLoS Biol. 8, e1000412.
Kim, H., Lee, K.-S., Kim, A.-K., Choi, M., Choi, K., Kang, M., Chi, S.-W.,Lee, M.-S., Lee, J.-S., Lee, S.-Y. et al. (2016). A chemical with proven clinicalsafety rescues down-syndrome-related phenotypes in through DYRK1Ainhibition. Dis. Model. Mech. 9, 839-848.
Kimura, R., Kamino, K., Yamamoto, M., Nuripa, A., Kida, T., Kazui, H.,Hashimoto, R., Tanaka, T., Kudo, T., Yamagata, H. et al. (2007). TheDYRK1A gene, encoded in chromosome 21 Down syndrome critical region,bridges between β-amyloid production and tau phosphorylation in Alzheimerdisease. Hum. Mol. Genet. 16, 15-23.
Korte, G., Dreiseitel, A., Schreier, P., Oehme, A., Locher, S., Geiger, S.,Heilmann, J. and Sand, P. G. (2010). Tea Catechins’ affinity for humancannabinoid receptors. Phytomedicine 17, 19-22.
Leal-Ortiz, S., Waites, C. L., Terry-Lorenzo, R., Zamorano, P.,Gundelfinger, E. D. and Garner, C. C. (2008). Piccolo modulation ofSynapsin1a dynamics regulates synaptic vesicle exocytosis. J. Cell Biol.181, 831.
Li, Z., Yu, T., Morishima, M., Pao, A., LaDuca, J., Conroy, J., Nowak, N.,Matsui, S.-I., Shiraishi, I. and Yu, Y. E. (2007). Duplication of the entire22.9 Mb human chromosome 21 syntenic region on mouse chromosome 16causes cardiovascular and gastrointestinal abnormalities. Hum. Mol. Genet.16, 1359-1366.
Litovchick, L., Florens, L. A., Swanson, S. K., Washburn, M. P. andDeCaprio, J. A. (2011). DYRK1A protein kinase promotes quiescence andsenescence through DREAM complex assembly. Genes Dev. 25, 801-813.
Llinas, R., McGuinness, T. L., Leonard, C. S., Sugimori, M. and Greengard, P.(1985). Intraterminal injection of Synapsin I or Calcium/Calmodulin-dependentprotein kinase II alters neurotransmitter release at the squid giant synapse. Proc.Natl. Acad. Sci. USA 82, 3035.
Llinas, R., Gruner, J. A., Sugimori, M., McGuinness, T. L. and Greengard, P.(1991). Regulation by Synapsin I and Ca(2+)-Calmodulin-dependent proteinkinase II of the transmitter release in squid giant synapse. J. Physiol. 436, 257.
Mao, J., Maye, P., Kogerman, P., Tejedor, F. J., Toftgard, R., Xie, W., Wu, G. andWu, D. (2002). Regulation of Gli1 transcriptional activity in the nucleus by Dyrk1.J. Biol. Chem. 277, 35156-35161.
Marchal, J. P., Maurice-Stam, H., Houtzager, B. A., Rutgersvan Rozenburg-Marres, S. L., Oostrom, K. J., Grootenhuis, M. A. andvan Trotsenburg, A. S. P. (2016). Growing up with Down syndrome:development from 6 months to 10.7 years. Res. Dev. Disabil. 59, 437-450.
Martı, E., Altafaj, X., Dierssen, M., de la Luna, S., Fotaki, V., Alvarez, M.,Perez-Riba, M., Ferrer, I. and Estivill, X. (2003). Dyrk1A expression patternsupports specific roles of this kinase in the adult central nervous system. BrainRes. 964, 250-263.
Martınez de Lagran, M., Altafaj, X., Gallego, X., Martı, E., Estivill, X., Sahun, I.,Fillat, C. and Dierssen, M. (2004). Motor phenotypic alterations in TgDyrk1atransgenic mice implicate DYRK1A in Down syndrome motor dysfunction.Neurobiol. Dis. 15, 132-142.
15
RESEARCH ARTICLE Disease Models & Mechanisms (2018) 11, dmm035634. doi:10.1242/dmm.035634
Disea
seModels&Mechan
isms
Møller, R. S., Kubart, S., Hoeltzenbein, M., Heye, B., Vogel, I., Hansen, C. P.,Menzel, C., Ullmann, R., Tommerup, N., Ropers, H.-H. et al. (2008). Truncationof the Down syndrome candidate gene DYRK1A in two unrelated patients withmicrocephaly. Am. J. Hum. Genet. 82, 1165-1170.
Morris, A. F., Vaughan, S. E. and Vaccaro, P. (1982). Measurements ofneuromuscular tone and strength in Down’s syndrome children. J. Intellect.Disabil. Res. 26, 41-46.
Murakami, N., Bolton, D. C., Kida, E., Xie, W. and Hwang, Y.-W. (2012).Phosphorylation by Dyrk1A of clathrin coated vesicle-associated proteins:identification of the substrate proteins and the effects of phosphorylation. PLoSONE 7, e34845.
Naert, G., Ferre, V., Meunier, J., Keller, E., Malmstrom, S., Givalois, L.,Carreaux, F., Bazureau, J.-P. and Maurice, T. (2015). Leucettine L41, aDYRK1A-preferential DYRKs/CLKs inhibitor, prevents memory impairments andneurotoxicity induced by oligomeric Aβ25–35 peptide administration in mice. Eur.Neuropsychopharmacol. 25, 2170-2182.
Nakano-Kobayashi, A., Awaya, T., Kii, I., Sumida, Y., Okuno, Y., Yoshida, S.,Sumida, T., Inoue, H., Hosoya, T. and Hagiwara, M. (2017). Prenatalneurogenesis induction therapy normalizes brain structure and function in Downsyndrome mice. Proc. Natl Acad. Sci. USA 114, 10268-10273.
Nguyen, T. L., Fruit, C., Herault, Y., Meijer, L. and Besson, T. (2017).Dual-specificity tyrosine phosphorylation-regulated kinase 1A (DYRK1A)inhibitors: a survey of recent patent literature. Expert Opin. Ther. Patents27, 1183-1199.
Nie, X., Hamlett, E. D., Granholm, A.-C., Hui, E. S., Helpern, J. A., Jensen, J. H.,Boger, H. A., Collins, H. R. and Falangola, M. F. (2015). Evidence of alteredage-related brain cytoarchitecture in mouse models of Down syndrome: adiffusional kurtosis imaging study. Magn. Reson. Imaging 33, 437-447.
Oegema, R., de Klein, A., Verkerk, A. J., Schot, R., Dumee, B., Douben, H.,Eussen, B., Dubbel, L., Poddighe, P. J., van der Laar, I. et al. (2010). Distinctivephenotypic abnormalities associated with submicroscopic 21q22 deletionincluding DYRK1A. Mol. Syndromol. 1, 113.
Olmos-Serrano, J. L., Tyler, W. A., Cabral, H. J. and Haydar, T. F. (2016).Longitudinal measures of cognition in the Ts65Dn mouse: refining windows anddefining modalities for therapeutic intervention in Down syndrome. Exp. Neurol.279, 40-56.
Ori-McKenney, K. M., McKenney, R. J., Huang, H. H., Li, T., Meltzer, S.,Jan, L. Y., Vale, R. D., Wiita, A. P. and Jan, Y. N. (2016). Phosphorylationof β-Tubulin by the Down syndrome kinase, Minibrain/DYRK1a, regulatesmicrotubule dynamics and dendrite morphogenesis. Neuron 90, 551.
Pons-Espinal, M., Martinez de Lagran, M. and Dierssen, M. (2013).Environmental enrichment rescues DYRK1A activity and hippocampal adultneurogenesis in TgDyrk1A. Neurobiol. Dis. 60, 18-31.
Powell, N. M., Modat, M., Cardoso, M. J., Ma, D., Holmes, H. E., Yu, Y.,O’Callaghan, J., Cleary, J. O., Sinclair, B., Wiseman, F. K. et al. (2016).Fully-automated μMRI morphometric phenotyping of the Tc1 mouse model ofDown syndrome. PLoS ONE 11, e0162974.
Pujol, J., del Hoyo, L., Blanco-Hinojo, L., de Sola, S., Macia, D.,Martınez-Vilavella, G., Amor, M., Deus, J., Rodrıguez, J., Farre, M. et al.(2015). Anomalous brain functional connectivity contributing to poor adaptivebehavior in Down syndrome. Cortex 64, 148-156.
Raichle, M. E. (2015a). The brain’s default mode network. Annu. Rev. Neurosci.38, 433-447.
Reeves, R. H., Irving, N. G., Moran, T. H., Wohn, A., Kitt, C., Sisodia, S. S.,Schmidt, C., Bronson, R. T. and Davisson, M. T. (1995). A mouse model forDown syndrome exhibits learning and behaviour deficits.Nat. Genet. 11, 177-184.
Roubertoux, P. L., Baril, N., Cau, P., Scajola, C., Ghata, A., Bartoli, C.,Bourgeois, P., Christofaro, J., Tordjman, S. and Carlier, M. (2017). Differentialbrain, cognitive and motor profiles associated with partial trisomy. modeling Downsyndrome in mice. Behav. Genet. 47, 305-322.
Ryoo, S.-R., Jeong, H. K., Radnaabazar, C., Yoo, J.-J., Cho, H.-J., Lee, H.-W.,Kim, I.-S., Cheon, Y.-H., Ahn, Y. S., Chung, S.-H. et al. (2007).DYRK1A-mediated hyperphosphorylation of Tau a functional link between downsyndrome and Alzheimer disease. J. Biol. Chem. 282, 34850-34857.
Ryoo, S.-R., Cho, H.-J., Lee, H.-W., Jeong, H. K., Radnaabazar, C., Kim, Y.-S.,Kim, M.-J., Son, M.-Y., Seo, H., Chung, S.-H. et al. (2008). Dual-Specificitytyrosine(Y)-phosphorylation regulated kinase 1A-mediated phosphorylation ofamyloid precursor protein: evidence for a functional link between Down syndromeand Alzheimer’s disease. J. Neurochem. 104, 1333-1344.
Ryu, Y. S., Park, S. Y., Jung, M.-S., Yoon, S.-H., Kwen, M.-Y., Lee, S.-Y.,Choi, S.-H., Radnaabazar, C., Kim, M.-K., Kim, H. et al. (2010).Dyrk1A-mediated phosphorylation of Presenilin 1: a functional link betweenDown syndrome and Alzheimer’s disease. J. Neurochem. 115, 574-584.
Scales, T. M. E., Lin, S., Kraus,M., Goold, R. G. andGordon-Weeks, P. R. (2009).Nonprimed and DYRK1A-primed GSK3β-phosphorylation sites on MAP1Bregulate microtubule dynamics in growing axons. J. Cell Sci. 122, 2424-2435.
Sforazzini, F., Schwarz, A. J., Galbusera, A., Bifone, A. and Gozzi, A. (2014).Distributed BOLD and CBV-weighted resting-state networks in the mouse brain.Neuroimage 87, 403-415.
Shi, J., Zhang, T., Zhou, C., Chohan, M. O., Gu, X., Wegiel, J., Zhou, J.,Hwang, Y.-W., Iqbal, K., Grundke-Iqbal, I. et al. (2008). Increased dosage ofDyrk1A alters alternative splicing factor (ASF)-regulated alternative splicing of tauin Down syndrome. J. Biol. Chem. 283, 28660-28669.
Sitz, J. H., Baumgartel, K., Hammerle, B., Papadopoulos, C., Hekerman, P.,Tejedor, F. J., Becker, W. and Lutz, B. (2008). The down syndrome candidatedual-specificity tyrosine phosphorylation-regulated kinase 1A phosphorylates theneurodegeneration-related Septin 4. Neuroscience 157, 596-605.
Smith, D. J., Stevens, M. E., Sudanagunta, S. P., Bronson, R. T., Makhinson, M.,Watabe, A. M., O’Dell, T. J., Fung, J., Weier, H.-U. G., Cheng, J.-F. et al. (1997).Functional screening of 2 Mb of human chromosome 21q22.2 in transgenic miceimplicates minibrain in learning defects associated with Down syndrome.Nat. Genet. 16, 28-36.
Smith, B., Medda, F., Gokhale, V., Dunckley, T. and Hulme, C. (2012).Recent advances in the design, synthesis, and biological evaluation of selectiveDYRK1A inhibitors: a new avenue for a disease modifying treatment ofAlzheimer’s? ACS Chem. Neurosci. 3, 857-872.
Soppa, U., Schumacher, J., Ortiz, V. F., Pasqualon, T., Tejedor, F. andBecker, W. (2014). The Down syndrome-related protein kinase DYRK1Aphosphorylates p27Kip1 and Cyclin D1 and induces cell cycle exit and neuronaldifferentiation. Cell Cycle 13, 2084-2100.
Souchet, B., Guedj, F., Sahun, I., Duchon, A., Daubigney, F., Badel, A.,Yanagawa, Y., Barallobre, M. J., Dierssen, M., Yu, E. et al. (2014). Excitation/inhibition balance and learning are modified by Dyrk1a gene dosage. Neurobiol.Dis. 69, 65-75.
Souchet, B., Latour, A., Gu, Y., Daubigney, F., Paul, J.-L., Delabar, J.-M. andJanel, N. (2015). Molecular rescue of DYRK1A overexpression in cystathioninebeta synthase-deficient mouse brain by enriched environment combined withvoluntary exercise. J. Mol. Neurosci. 55, 318-323.
Stafford, J. M., Jarrett, B. R., Miranda-Dominguez, O., Mills, B. D., Cain, N.,Mihalas, S., Lahvis, G. P., Lattal, K. M., Mitchell, S. H., David, S. V. et al. (2014).Large-scale topology and the default mode network in the mouse connectome.Proc. Natl Acad. Sci. USA 111, 18745-18750.
Stotani, S., Giordanetto, F. and Medda, F. (2016). DYRK1A inhibition as potentialtreatment for Alzheimer’s disease. Future Med. Chem. 8, 681-696.
Sureshbabu, R., Kumari, R., Ranugha, S., Sathyamoorthy, R., Udayashankar, C.and Oudeacoumar, P. (2011). Phenotypic and dermatological manifestations inDown syndrome. Dermatol. Online J. 17, 3. http://escholarship.org/uc/item/8jx5f2v2
Tahtouh, T., Elkins, J. M., Filippakopoulos, P., Soundararajan, M., Burgy, G.,Durieu, E., Cochet, C., Schmid, R. S., Lo, D. C., Delhommel, F. et al. (2012).Selectivity, cocrystal structures, and neuroprotective properties of leucettines, afamily of protein kinase inhibitors derived from the marine sponge alkaloidleucettamine B. J. Med. Chem. 55, 9312-9330.
Thomazeau, A., Lassalle, O., Iafrati, J., Souchet, B., Guedj, F., Janel, N.,Chavis, P., Delabar, J. and Manzoni, O. J. (2014). Prefrontal deficits in a murinemodel overexpressing the Down syndrome candidate gene Dyrk1a. J. Neurosci.34, 1138-1147.
Valetto, A., Orsini, A., Bertini, V., Toschi, B., Bonuccelli, A., Simi, F.,Sammartino, I., Taddeucci, G., Simi, P. and Saggese, G. (2012).Molecular cytogenetic characterization of an interstitial deletion ofchromosome 21 (21q22.13q22.3) in a patient with dysmorphic features,intellectual disability and severe generalized epilepsy. Eur. J. Med. Genet.Epilepsy Genet. 55, 362-366.
Vega, J. N., Hohman, T. J., Pryweller, J. R., Dykens, E. M. andThornton-Wells, T. A. (2015). Resting-state functional connectivity inindividuals with Down syndrome and williams syndrome compared withtypically developing controls. Brain Connectivity 5, 461-475.
Waites, C. L., Leal-Ortiz, S. A., Andlauer, T. F. M., Sigrist, S. J. and Garner, C. C.(2011). Piccolo regulates the dynamic assembly of presynaptic F-actin.J. Neurosci. 31, 14250.
Walte, A., Ruben, K.,Birner-Gruenberger, R., Preisinger,C., Bamberg-Lemper, S.,Hilz, N., Bracher, F. and Becker,W. (2013). Mechanism of dual specificity kinaseactivity of DYRK1A. FEBS J. 280, 4495-4511.
Wegiel, J., Kaczmarski, W., Barua, M., Kuchna, I., Nowicki, K., Wang, K.-C.,Wegiel, J., Yang Ma, S., Frackowiak, J., Mazur-Kolecka, B. et al. (2011). Thelink between DYRK1A overexpression and several-fold enhancement ofneurofibrillary degeneration with 3-repeat tau protein in Down syndrome.J. Neuropathol. Exp. Neurol. 70, 36-50.
Wilson, R. I. and Nicoll, R. A. (2002). Endocannabinoid signaling in the brain.Science 296, 678-682.
Woods, Y. L., Cohen, P., Becker, W., Jakes, R., Goedert, M., Wang, X. andProud, C. G. (2001). The kinase DYRK phosphorylates protein-synthesisinitiation factor eIF2Bepsilon at Ser539 and the microtubule-associated proteintau at Thr212: potential role for DYRK as a glycogen synthase kinase 3-primingkinase. Biochem. J. 355, 609-615.
Yamamoto, T., Shimojima, K., Nishizawa, T., Matsuo, M., Ito, M. and Imai, K.(2011). Clinical manifestations of the deletion of Down syndrome critical regionincluding DYRK1A and KCNJ6. Am. J. Med. Genet. A 155, 113-119.
16
RESEARCH ARTICLE Disease Models & Mechanisms (2018) 11, dmm035634. doi:10.1242/dmm.035634
Disea
seModels&Mechan
isms
Yang, C. S., Wang, X., Lu, G. and Picinich, S. C. (2009). Cancer prevention by tea:animal studies, molecular mechanisms and human relevance. Nat. Rev. Cancer9, 429-439.
Yin, X., Jin, N., Gu, J., Shi, J., Zhou, J., Gong, C.-X., Iqbal, K., Grundke-Iqbal, I.and Liu, F. (2012). Dual-specificity tyrosine phosphorylation-regulated kinase 1A(Dyrk1A) modulates serine/arginine-rich protein 55 (SRp55)-promoted Tau exon10 inclusion. J. Biol. Chem. 287, 30497-30506.
Yu, T., Liu, C., Belichenko, P., Clapcote, S. J., Li, S., Pao, A., Kleschevnikov, A.,Bechard, A. R., Asrar, S., Chen, R. et al. (2010). Effects of individual segmentaltrisomies of human chromosome 21 syntenic regions on hippocampal long-termpotentiation and cognitive behaviors in mice. Brain Res. 1366, 162-171.
Zhou, Y., Friston, K. J., Zeidman, P., Chen, J., Li, S. and Razi, A. (2018).The hierarchical organization of the default, dorsal attention and saliencenetworks in adolescents and young adults. Cereb. Cortex 28, 726-737.
17
RESEARCH ARTICLE Disease Models & Mechanisms (2018) 11, dmm035634. doi:10.1242/dmm.035634
Disea
seModels&Mechan
isms
Common functional networks in the mouse brain revealed by multi-centre resting-state fMRI analysis
Joanes Grandjeana, Carola Canellab,c, Cynthia Anckaertsd, Gülebru Ayrancıe, Salma Bougachaf,g, Thomas Bienertj, David Buehlmannh, Ludovico Colettab,c, Daniel Gallinoe, Natalia Gassi, Clément M. Garinf,g, Nachiket Abhay Nadkarnif,g, Neele Hübnerj, Meltem Karatask, Yuji Komakil,m, Silke Kreitzn, Francesca Mandinoa,o, Anna E. Mechlingj, Chika Satop, Katja Sauern, Disha Shahd,q, Sandra Strobeltn, Norio Takatal,r, Isabel Wankn, Tong Wus,t, Noriaki Yahatap, Ling Yun Yeowa, Yohan Yeeu, Ichio Aokip, M. Mallar Chakravartye, Wei-Tang Changa, Marc Dhenainf,g, Dominik von Elverfeldtj, Laura-Adela Harsank, Andreas Hessn, Tianzi Jiangs,v, Georgios A. Kelirisd, Jason P. Lerchu, Hideyuki Okanom,w, Markus Rudinh, Alexander Sartoriusi, Annemie Van der Lindend, Marleen Verhoyed, Wolfgang Weber-Fahri, Nicole Wenderothx, Valerio Zerbix, Alessandro Gozzib a Singapore Bioimaging Consortium, Agency for Science, Technology and Research, 11 Biopolis Way, Singapore 138667, Singapore b Functional Neuroimaging Laboratory, Istituto Italiano di Tecnologia, Centre for Neuroscience and Cognitive Systems @ UNITN, 38068 Rovereto, Italy c CIMeC, centre for Mind/Brain Sciences, University of Trento, 38068 Rovereto, Italy d Bio-Imaging Lab, University of Antwerp, CDE, Universiteitsplein 1, 2610 Antwerp, Belgium e Douglas Mental Health University Institute & Departments of Psychiatry and Biological and Biomedical Engineering, McGill University, Montreal, Quebec, Canada. f Commissariat à l'Énergie Atomique et aux Énergies Alternatives (CEA), Direction de la Recherche Fondamentale (DRF), Institut François Jacob, MIRCen, Fontenay aux roses, France g Centre National de la Recherche Scientifique (CNRS), Université Paris-Sud, Université Paris-Saclay UMR 9199, Neurodegenerative Diseases Laboratory, Fontenay-aux-Roses, France h Institute for Biomedical Engineering, University and ETH Zürich, Wolfgang-Pauli-Str. 27, 8093 Zürich, Switzerland, & Institute of Pharmacology and Toxicology, University of Zürich, Winterthurerstrasse 190, 8057 Zürich, Switzerland i Department of Neuroimaging, Central Institute of Mental Health, Medical Faculty Mannheim, University of Heidelberg, Mannheim, Germany j Department of Radiology, Medical Physics, Medical Center – University of Freiburg, Faculty of Medicine, University of Freiburg, Killianstr. 5a, 79106 Freiburg, Germany; BrainLinks-BrainTools Cluster of Excellence, University of Freiburg, Georges-Köhler-Allee 80, 79110 Freiburg, Germany k Department of Biophysics and Nuclear Medicine, University Hospital Strasbourg, 67000 Strasbourg, France l Central Institute for Experimental Animals (CIEA), 3-25-12, Tonomachi, Kawasaki, Kanagawa 210-0821, Japan m Department of Physiology, Keio University School of Medicine, 35 Shinanomachi, Shinjuku, Tokyo 160-8582, Japan n Institute of Experimental and Clinical Pharmacology and Toxicology, Friedrich-Alexander University Erlangen-Nürnberg (FAU), Fahrstraße 17, 91054, Erlangen, Germany o Faculty of Life Sciences, University of Manchester, Manchester, United Kingdom p Functional and Molecular Imaging Team, Department of Molecular Imaging and Theranostics, National Institute of Radiological Sciences, National Institutes for Quantum and Radiological Science and Technology, Anagawa 4-9-1, Inage, Chiba-city, Chiba 263-8555, Japan q Laboratory for the Research of Neurodegenerative Diseases, VIB center for Brain and Disease Research, KU Leuven, O&N4 Herestraat 49 box 602, 3000 Leuven, Belgium r Department of Neuropsychiatry, Keio University School of Medicine, 35 Shinanomachi, Shinjuku, Tokyo 160-8582, Japan s Queensland Brain Institute, The University of Queensland, Brisbane, Queensland, Australia t Centre for Medical Image Computing, Department of Computer Science, & Max Planck University College London Centre for Computational Psychiatry and Ageing Research, University College London, London, UK u Hospital for Sick Children and Department of Medical Biophysics, The University of Toronto, Toronto, Ontario, Canada v Brainnetome Centre, Institute of Automation, Chinese Academy of Sciences, Beijing & Key Laboratory for NeuroInformation of the Ministry of Education, School of Life Science and Technology, University of Electronic Science and Technology of China, Chengdu 625014, China w Laboratory for Marmoset Neural Architecture, RIKEN Brain Science Institute, Wako, Saitama 351-0198, Japan x Neural Control of Movement Lab, Department of Health Sciences and Technology, ETH Zürich, Winterthurerstrasse 190, 8057 Zurich, Switzerland Corresponding author Joanes Grandjean, PhD Singapore Bioimaging Consortium (SBIC) 11 Biopolis Way #01-02 Helios Building Singapore 138667 Tel: +65 91434319 Fax: +65 6478 9957 [email protected]
.CC-BY-ND 4.0 International licenseIt is made available under a was not peer-reviewed) is the author/funder, who has granted bioRxiv a license to display the preprint in perpetuity.
The copyright holder for this preprint (which. http://dx.doi.org/10.1101/541060doi: bioRxiv preprint first posted online Feb. 8, 2019;
Abstract
Preclinical applications of resting-state functional magnetic resonance imaging (rsfMRI) offer the
possibility to non-invasively probe whole-brain network dynamics and to investigate the
determinants of altered network signatures observed in human studies. Mouse rsfMRI has been
increasingly adopted by numerous laboratories world-wide. Here we describe a multi-centre
comparison of 17 mouse rsfMRI datasets via a common image processing and analysis
pipeline. Despite prominent cross-laboratory differences in equipment and imaging procedures,
we report the reproducible identification of several large-scale resting-state networks (RSN),
including a murine default-mode network, in the majority of datasets. A combination of factors
was associated with enhanced reproducibility in functional connectivity parameter estimation,
including animal handling procedures and equipment performance. Our work describes a set of
representative RSNs in the mouse brain and highlights key experimental parameters that can
critically guide the design and analysis of future rodent rsfMRI investigations.
.CC-BY-ND 4.0 International licenseIt is made available under a was not peer-reviewed) is the author/funder, who has granted bioRxiv a license to display the preprint in perpetuity.
The copyright holder for this preprint (which. http://dx.doi.org/10.1101/541060doi: bioRxiv preprint first posted online Feb. 8, 2019;
Introduction
The brain is the most complex organ, consisting of 86 billion neurons (Azevedo et al., 2009),
each forming on average 7000 synapses. Approaching the complexity of the brain is rendered
difficult due to the limited access to the tissue and the imperative for minimally invasive
procedures in human subjects. Resting-state functional magnetic resonance imaging (rsfMRI)
has gained attention within the human neuroimaging community due to the possibility to
interrogate multiple resting-state networks (RSNs) in parallel with a relatively high spatial and
temporal resolution (Biswal et al., 1995, 2010; Fox and Raichle, 2007). Functional connectivity
(FC), i.e. the statistical dependence of two or more time series extracted from spatially defined
regions in the brain (Friston, 2011), is the principal parameter estimated from rsfMRI studies.
The importance of FC to neuroscience research can be understood through its widespread use
to describe functional alterations in psychiatric and neurological disorders, e.g. for review
(Buckner et al., 2008; Greicius, 2008). However, despite an extensive characterization of the
functional endophenotype associated with diseased states, limitations with respect to
invasiveness and terminal experiments generally preclude the establishment of detailed
mechanisms in humans, as can be achieved with animal models.
Since its onset in 2011 (Jonckers et al., 2011), mouse rsfMRI has developed in a number of
centres and has grown to become a routine method with a number of applications, reviewed in
(Chuang and Nasrallah, 2017; Gozzi and Schwarz, 2016; Hoyer et al., 2014; Jonckers et al.,
2015, 2013; Pan et al., 2015). Prominently, mouse rsfMRI has been used to investigate an
extensive list of models, including Alzheimer’s disease (Grandjean et al., 2014b, 2016b, Shah et
al., 2013, 2016c; Wiesmann et al., 2016; Zerbi et al., 2014), motor (DeSimone et al., 2016; Li et
al., 2017), affective (Grandjean et al., 2016a), autism spectrum (Bertero et al., 2018; Haberl et
al., 2015; Liska et al., 2018; Liska and Gozzi, 2016; Michetti et al., 2017; Sforazzini et al., 2016;
Zerbi et al., 2018; Zhan et al., 2014), schizophrenia (Errico et al., 2015; Gass et al., 2016), pain
(Buehlmann et al., 2018; Komaki et al., 2016), reward (Charbogne et al., 2017; Mechling et al.,
2016), and demyelinating disorders (Hübner et al., 2017). Another application of mouse rsfMRI
is the elucidation of large-scale functional alterations exerted by pharmacological agents
(Razoux et al., 2013; Shah et al., 2016a, 2015). Finally, the method has been used to address
fundamental questions. These include the investigation of the structural basis underlying FC
(Bergmann et al., 2016; Grandjean et al., 2017b; Hübner et al., 2017; Schroeter et al., 2017;
Sforazzini et al., 2016; Stafford et al., 2014), the nature of the dynamical event encoded in the
resting-state signal (Belloy et al., 2018a, 2018b; Bukhari et al., 2018; Grandjean et al., 2017a;
.CC-BY-ND 4.0 International licenseIt is made available under a was not peer-reviewed) is the author/funder, who has granted bioRxiv a license to display the preprint in perpetuity.
The copyright holder for this preprint (which. http://dx.doi.org/10.1101/541060doi: bioRxiv preprint first posted online Feb. 8, 2019;
Sethi et al., 2017), as well as strain (Jonckers et al., 2011; Schroeter et al., 2017; Shah et al.,
2016b), and the impact of sedation or awake conditions on the underlying signal and
connectivity patterns (Bukhari et al., 2017; Grandjean et al., 2014a; Jonckers et al., 2014; Wu et
al., 2017; Yoshida et al., 2016). This body of work obtained mainly over the past 5 years reflects
the growth and interest into this modality as a translational tool to understand mechanisms
underlying RSNs organisation in the healthy and diseased states, with the promise to highlight
relevant targets in the drug development process and to advance fundamental knowledge in
neuroscience.
Despite a growing interest in the field, rsfMRI studies in animals have been inherently difficult to
compare. On top of centre-related contributions analogous to those observed in human studies
(Jovicich et al., 2016), comparisons in rodents are further confounded by greater variability in
preclinical equipment (e.g. field strength, hardware design), animal handling protocols and
sedation regimens employed to control for motion and stress. Discrepancies between reports,
such as the anatomical and spatial extent of a rodent homologue of the human default-mode
network (DMN) (Becerra et al., 2011; Gozzi and Schwarz, 2016; Guilfoyle et al., 2013; Hübner
et al., 2017; Liska et al., 2015; Lu et al., 2012; Sforazzini et al., 2014; Stafford et al., 2014;
Upadhyay et al., 2011), or the organisation of murine RSNs (Jonckers et al., 2011), have stark
consequences for the interpretations of the results. To meet a growing need to establish
standards and points of comparison in rodent fMRI, we carried out a multi-centre comparison of
mouse rsfMRI datasets. Multiple datasets representative of the local centre acquisitions were
analysed with a common preprocessing pipeline and examined with seed-based analysis (SBA)
and independent component analysis (ICA), two common brain mapping methods used to
investigate RSNs. The aims of our work were to identify representative mouse RSNs, to
establish a set of reference pre-processing and analytical steps and good-practices, and to
highlight protocol requirements enabling more sensitive and specific FC detection in the mouse
brain.
.CC-BY-ND 4.0 International licenseIt is made available under a was not peer-reviewed) is the author/funder, who has granted bioRxiv a license to display the preprint in perpetuity.
The copyright holder for this preprint (which. http://dx.doi.org/10.1101/541060doi: bioRxiv preprint first posted online Feb. 8, 2019;
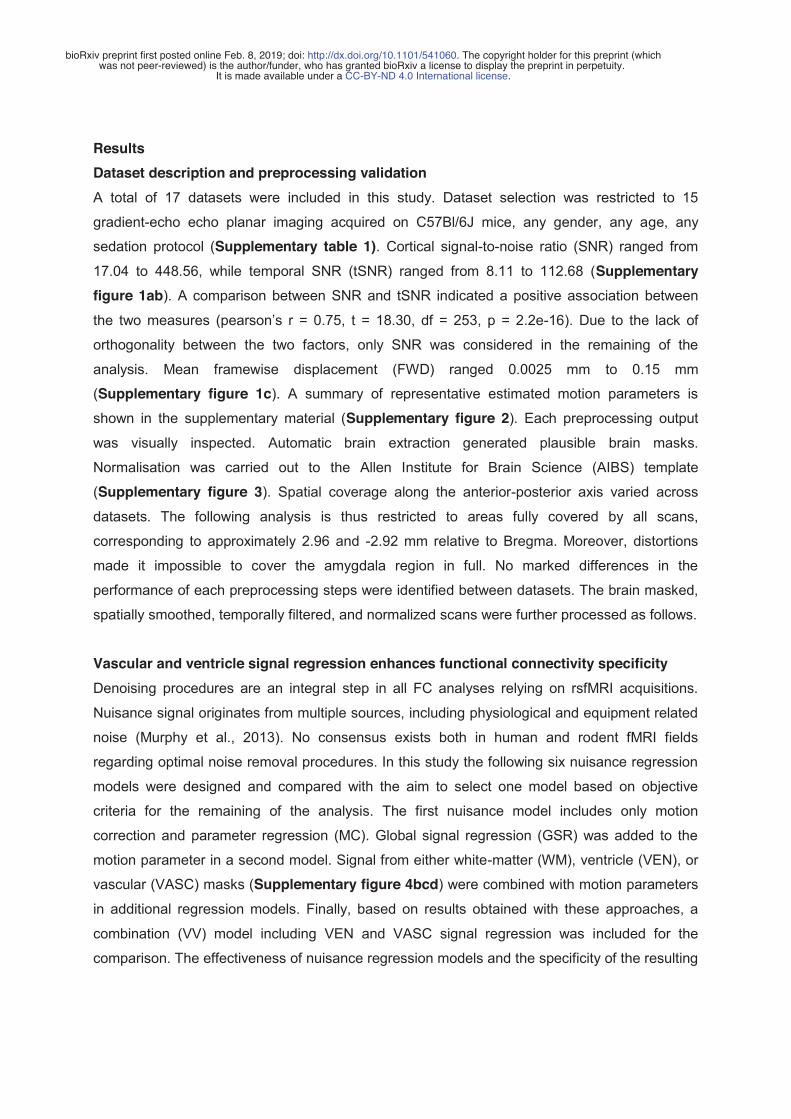
Results
Dataset description and preprocessing validation
A total of 17 datasets were included in this study. Dataset selection was restricted to 15
gradient-echo echo planar imaging acquired on C57Bl/6J mice, any gender, any age, any
sedation protocol (Supplementary table 1). Cortical signal-to-noise ratio (SNR) ranged from
17.04 to 448.56, while temporal SNR (tSNR) ranged from 8.11 to 112.68 (Supplementary
figure 1ab). A comparison between SNR and tSNR indicated a positive association between
the two measures (pearson’s r = 0.75, t = 18.30, df = 253, p = 2.2e-16). Due to the lack of
orthogonality between the two factors, only SNR was considered in the remaining of the
analysis. Mean framewise displacement (FWD) ranged 0.0025 mm to 0.15 mm
(Supplementary figure 1c). A summary of representative estimated motion parameters is
shown in the supplementary material (Supplementary figure 2). Each preprocessing output
was visually inspected. Automatic brain extraction generated plausible brain masks.
Normalisation was carried out to the Allen Institute for Brain Science (AIBS) template
(Supplementary figure 3). Spatial coverage along the anterior-posterior axis varied across
datasets. The following analysis is thus restricted to areas fully covered by all scans,
corresponding to approximately 2.96 and -2.92 mm relative to Bregma. Moreover, distortions
made it impossible to cover the amygdala region in full. No marked differences in the
performance of each preprocessing steps were identified between datasets. The brain masked,
spatially smoothed, temporally filtered, and normalized scans were further processed as follows.
Vascular and ventricle signal regression enhances functional connectivity specificity
Denoising procedures are an integral step in all FC analyses relying on rsfMRI acquisitions.
Nuisance signal originates from multiple sources, including physiological and equipment related
noise (Murphy et al., 2013). No consensus exists both in human and rodent fMRI fields
regarding optimal noise removal procedures. In this study the following six nuisance regression
models were designed and compared with the aim to select one model based on objective
criteria for the remaining of the analysis. The first nuisance model includes only motion
correction and parameter regression (MC). Global signal regression (GSR) was added to the
motion parameter in a second model. Signal from either white-matter (WM), ventricle (VEN), or
vascular (VASC) masks (Supplementary figure 4bcd) were combined with motion parameters
in additional regression models. Finally, based on results obtained with these approaches, a
combination (VV) model including VEN and VASC signal regression was included for the
comparison. The effectiveness of nuisance regression models and the specificity of the resulting
.CC-BY-ND 4.0 International licenseIt is made available under a was not peer-reviewed) is the author/funder, who has granted bioRxiv a license to display the preprint in perpetuity.
The copyright holder for this preprint (which. http://dx.doi.org/10.1101/541060doi: bioRxiv preprint first posted online Feb. 8, 2019;
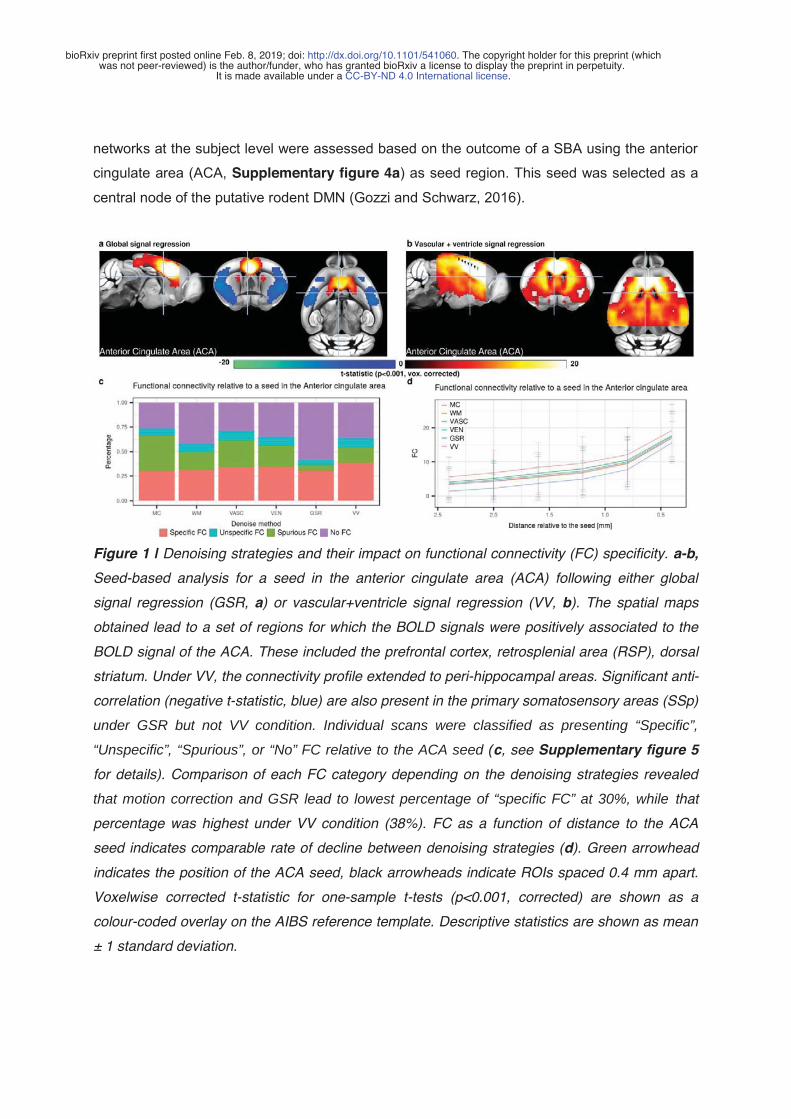
networks at the subject level were assessed based on the outcome of a SBA using the anterior
cingulate area (ACA, Supplementary figure 4a) as seed region. This seed was selected as a
central node of the putative rodent DMN (Gozzi and Schwarz, 2016).
Figure 1 | Denoising strategies and their impact on functional connectivity (FC) specificity. a-b,
Seed-based analysis for a seed in the anterior cingulate area (ACA) following either global
signal regression (GSR, a) or vascular+ventricle signal regression (VV, b). The spatial maps
obtained lead to a set of regions for which the BOLD signals were positively associated to the
BOLD signal of the ACA. These included the prefrontal cortex, retrosplenial area (RSP), dorsal
striatum. Under VV, the connectivity profile extended to peri-hippocampal areas. Significant anti-
correlation (negative t-statistic, blue) are also present in the primary somatosensory areas (SSp)
under GSR but not VV condition. Individual scans were classified as presenting “Specific”,
“Unspecific”, “Spurious”, or “No” FC relative to the ACA seed (c, see Supplementary figure 5
for details). Comparison of each FC category depending on the denoising strategies revealed
that motion correction and GSR lead to lowest percentage of “specific FC” at 30%, while that
percentage was highest under VV condition (38%). FC as a function of distance to the ACA
seed indicates comparable rate of decline between denoising strategies (d). Green arrowhead
indicates the position of the ACA seed, black arrowheads indicate ROIs spaced 0.4 mm apart.
Voxelwise corrected t-statistic for one-sample t-tests (p<0.001, corrected) are shown as a
colour-coded overlay on the AIBS reference template. Descriptive statistics are shown as mean
± 1 standard deviation.
.CC-BY-ND 4.0 International licenseIt is made available under a was not peer-reviewed) is the author/funder, who has granted bioRxiv a license to display the preprint in perpetuity.
The copyright holder for this preprint (which. http://dx.doi.org/10.1101/541060doi: bioRxiv preprint first posted online Feb. 8, 2019;
The statistical maps of the one-sample t-test across all individual maps following GSR (Figure
1a) indicated positive FC along rostro-caudal axis, through the ACA and extending to the
retrosplenial area (RSP), with anti-correlations in adjacent primary somatosensory areas (SSp).
Comparatively, in the VV nuisance model, a more extended network was revealed to include
posterior parietal cortical areas (Figure 1b), while anti-correlations in the SSp did not reach
statistical significance. To assess the specificity of the obtained functional networks, subject-
level FC parameter (z-statistic) were extracted from ROIs located in the RSP and left SSp. The
former was defined as a specific ROI, i.e. a ROI where positive FC is expected, while the latter
was defined as a non-specific ROI, i.e. a ROI where low or negative FC is expected. The
decision to consider these two areas as belonging to separable network systems reflects
several lines of converging evidence: a) these regions are not linked by major white matter
bundles or direct axonal projections in the mouse brain (Oh et al., 2014), b) they reflect
separable electrophysiological signatures in mammals (Popa et al., 2009) c) they belong to
separable functional communities (Liska et al., 2015) and are similarly characterized by the
absence of significant positive correlation in corresponding human RSN (Fox et al., 2005).
Detailed FC within the specific ROI for the GSR and VV nuisance model are shown as a
function of FC within the corresponding non-specific ROI at the single-subject level
(Supplementary figure 5). In the VV condition, 98/255 (i.e. 38%) of individual scans fell into the
“specific FC” category while both MC and GSR reach lowest percentage (30%) of scans
exhibiting “specific FC” relative to the ACA seed (Figure 1c). Out of the 98/255 scans
categorised as presenting “specific FC” relative to the ACA seed, up to 14/15 scans originated
from the same dataset (median = 6/15). Two datasets did not contain scans that met the
definition. Correspondingly, the 98 scans were also unevenly distributed according to the
different acquisition parameters, including field strength (4.7T N = 1/15, 7T N = 41/120, 9.4T N =
38/90, 11.7T = 18/30, Χ2 = 13.76, df = 3, p-value = 0.0032), coil type (room-temperature N =
26/105, cryoprobe N = 72/150, Χ2 = 13.13, df = 1, p-value = 0.00029), breathing condition (free-
breathing N = 58/180, ventilated N = 40/75, Χ2 = 9.10, df = 1, p-value = 0.0026), and sedation
condition (awake N = 7/15, isoflurane/halothane N = 18/90, medetomidine N = 26/75,
medetomidine+isoflurane N = 47/75, Χ2 = 32.42, df = 3, p-value = 4.28e-07). Hence, scans
presenting “specific FC” patterns were more often found in datasets acquired at higher field
strengths, with cryoprobes, in ventilated animals, and under medetomidine+isoflurane
combination sedation.
.CC-BY-ND 4.0 International licenseIt is made available under a was not peer-reviewed) is the author/funder, who has granted bioRxiv a license to display the preprint in perpetuity.
The copyright holder for this preprint (which. http://dx.doi.org/10.1101/541060doi: bioRxiv preprint first posted online Feb. 8, 2019;

To test how FC is affected as a function of distance to the seed and nuisance model, FC in the
ACA and RSP along the anterior - posterior axis was extracted (Figure 1d). Comparable rate of
decrease was observed in all conditions, with GSR displaying an overall decrease of FC
throughout. This is consistent with the overall decrease in FC induced by GSR relative to VV in
the specificity analysis (Supplementary figure 5). In summary, the VV nuisance model
enhanced specificity of SBA-derived DMN, as indicated by higher incidence of scans in the
“specific FC” category. Based on this criterion, this nuisance model was used in all the
subsequent analyses.
Seed-based analysis identifies common and reproducible murine resting-state networks
We sought to identify common murine RSNs by means of SBA and to compare reproducibility
across datasets. Seeds positioned in representative anatomical regions of the left hemisphere
(Supplementary figure 4a) were used to reveal the spatial extent of previously described
mouse resting-state networks. The seeds were selected to represent different cortical
(somatosensory, motor, high order processing), as well as subcortical systems (striatum,
hippocampal formation, thalamus). To obtain high-specificity and high-confidence group-level
SBA maps, we first probed only the 98/255 scans listed as containing “specific FC” in the
previous analysis. We next extended these analyses to include all the 255/255 scans
(Supplementary figure 7). For datasets comparisons, all 15 scans from each dataset were
included to reflect inter-dataset variability in the incidence maps.
All group-level SBA maps exhibited a strong bilateral and homotopic extension (Figure 2a,
Supplementary figure 6). A seed in the ACA revealed a network involving the prefrontal cortex,
RSP, dorsal striatum, dorsal thalamus and peri-hippocampal areas. This recapitulates
anatomical features reminiscent of the human, primate and rat DMN (Gozzi and Schwarz, 2016;
Hutchison and Everling, 2012; Sforazzini et al., 2014; Stafford et al., 2014). Comparable regions
were observed with a seed in the RSP, a region evolutionarily related to the posterior cingulate
cortex found in the human DMN (Supplementary figure 6). The anterior insular seed was
found to co-activate with the dorsal cingulate and the amygdalar areas, corresponding to the
putative rodent salience network (Gozzi and Schwarz, 2016), while the primary somatomotor
region (MO) defined a previously described latero-cortical network that appears to be
antagonistic to midline DMN regions, and that has been for this reason postulated to serve as a
possible rodent homologous of the primate task-positive network (Figure 2a)(Liska et al., 2015;
.CC-BY-ND 4.0 International licenseIt is made available under a was not peer-reviewed) is the author/funder, who has granted bioRxiv a license to display the preprint in perpetuity.
The copyright holder for this preprint (which. http://dx.doi.org/10.1101/541060doi: bioRxiv preprint first posted online Feb. 8, 2019;

Sforazzini et al., 2014). Corresponding network across all scans (255/255) recapitulated
features identified in the 98/255 scans listed as containing “specific FC”, but appeared to be
characterized by much lower spatial specificity (Supplementary figure 7). Maps derived from
individual datasets revealed that 70% (12/17) of the datasets presented the features listed
above (Figure 2b, Supplementary figure 8). Incidence maps indicate, on a voxel basis, the
percentage of the dataset presenting a significant FC. They confirmed the different extent of
network detection in the different dataset. In summary, this analysis revealed the commonly
shared spatial extent of mouse RSNs derived from SBA but also indicates that a small subset of
the datasets failed to present these features with sufficient sensitivity or specificity.
Figure 2 | Seed-based analysis (SBA) for 3 selected seeds positioned on the left hemisphere.
One-sample t-test maps of individual maps reveal the full extent of SBA-derived resting-state
networks in the mouse brain across 98/255 scans that presented “specific FC” following
vascular+ventricle signal regression. Functional connectivity (FC) relative to a seed located in
the anterior cingulate area reveals the extent of the murine default-mode network, including the
dorsal caudoputamen, dorsal thalamus, and peri-hippocampal areas. The seed in the insular
area reveals significant FC in dorsal cingulate and amygdalar areas, corresponding to areas
previously associated with the human salience network. Inter-hemispheric homotopic FC is
found relative to the MO seed, together with lateral striatal FC. Incidence maps, indicating the
.CC-BY-ND 4.0 International licenseIt is made available under a was not peer-reviewed) is the author/funder, who has granted bioRxiv a license to display the preprint in perpetuity.
The copyright holder for this preprint (which. http://dx.doi.org/10.1101/541060doi: bioRxiv preprint first posted online Feb. 8, 2019;

percentage of dataset presenting significant FC in one-sample t-test (p<0.05, uncorrected),
reveal that 12/17 of datasets recapitulated the features stated above. Out of these, 5 were not
considered to overlap specifically (Supplementary figure 6). Voxelwise corrected t-statistic for
one-sample t-tests and incidence maps are shown as a colour-coded overlay on the AIBS
reference template.
Sedation protocol and SNR affect connectivity strength
The datasets analysed here were acquired at varying field strengths, coil designs, EPI
sequence parameters, animal handling, and with different anesthesia protocols, i.e. either
awake or sedated states. Hence the acquisitions were not purposefully balanced to test for
specific effects. To identify factors associated with FC strength, a simplified linear model was
designed including the following explanatory factors: sedation and breathing conditions, SNR,
and motion (mean framewise displacement). Limitations in orthogonality and representation of
specific acquisition factors such as field strength, coil design, EPI sequence parameters,
number of volumes, gender and age precluded a more extensive model.
Individual-level FC values (z-statistic) were extracted from SBA maps estimated from the ACA
seed using a ROI located in the RSP and shown as a function of different acquisition
parameters (Figure 3). Sedation protocol (F(247, 251) = 18.29, p = 3.5e-13) and SNR (F(247, 248) =
12.39, p = 5.1e-4) were significantly associated with FC, while the remaining factors, breathing
condition (F(247, 248) = 3.48, p = 0.063) and motion (F(247, 248) = 0.082, p = 0.77) were not. The
awake and medetomidine+isoflurane combination led to higher FC compared to the other two
sedation categories. With respect to SNR, high FC values started to be observed at SNR > 50,
suggesting that lower SNR may not be sufficient to detect relevant fluctuations. Interestingly,
these effects were found consistently across the different ROI pairs considered
(Supplementary table 2), thus confirming the importance of sedation conditions and SNR, and
suggesting that breathing conditions impact mildly FC sensitivity.
These animal handling conditions and sedation protocols highlighted here may not be
applicable to all studies or laboratories due to local legislation, equipment availability, or
technical knowledge. Distributions of FC values may hence provide useful reference points.
Connectivity strength between the ACA and RSP, representing a central feature of the rodent
DMN, reached z = 2.77, 5.71, and 10.46 at the 50th, 75th, and 95th percentile respectively
(Pearson’s r = 0.15, 0.26, 0.43, when SBA is carried out with a correlation analysis instead of a
.CC-BY-ND 4.0 International licenseIt is made available under a was not peer-reviewed) is the author/funder, who has granted bioRxiv a license to display the preprint in perpetuity.
The copyright holder for this preprint (which. http://dx.doi.org/10.1101/541060doi: bioRxiv preprint first posted online Feb. 8, 2019;
general linear model). Additional SBA parameter distributions are provided for other ROI pairs in
Supplementary table 2. The parameters of the acquisitions featured in this analysis offer an
objective criterion to evaluate and compare sensitivity to FC in a new dataset or in previous
publications, insofar comparable metrics are available.
Figure 3 | Functional connectivity (FC) in the retrosplenial cortex relative to a seed located in
the anterior cingulate area, as a function of acquisition parameters. A statistically significant
association was determined between sedation effect and FC (a, F(247, 251) = 18.29, p = 3.5e-13)
and between SNR and FC (c, F(247,248) = 12.39, p = 5.1e-4). Neither breathing condition nor
motion effects were significant with FC (b, d). Due to limitations in the representation of each
level within a factor, coil design (e) and magnetic field (f) were omitted from the final statistical
model. Free = Free-breathing, Vent = Mechanically ventilated, Cryo = cryoprobe, RT = room-
temperature.
Network-specific functional connectivity is found in all datasets
Evidence for robust distal FC could not be established in all datasets with SBA. To investigate
the presence of network-specific FC also in datasets characterized by weaker long range
connectivity, a dual regression combined with group-level ICA (drICA) approach was
undertaken (Filippini et al., 2009). To obtain an enriched data-driven reference atlas, a group
ICA atlas was generated out of the 98 “specific FC” scans selected in the SBA above, using 20
.CC-BY-ND 4.0 International licenseIt is made available under a was not peer-reviewed) is the author/funder, who has granted bioRxiv a license to display the preprint in perpetuity.
The copyright holder for this preprint (which. http://dx.doi.org/10.1101/541060doi: bioRxiv preprint first posted online Feb. 8, 2019;
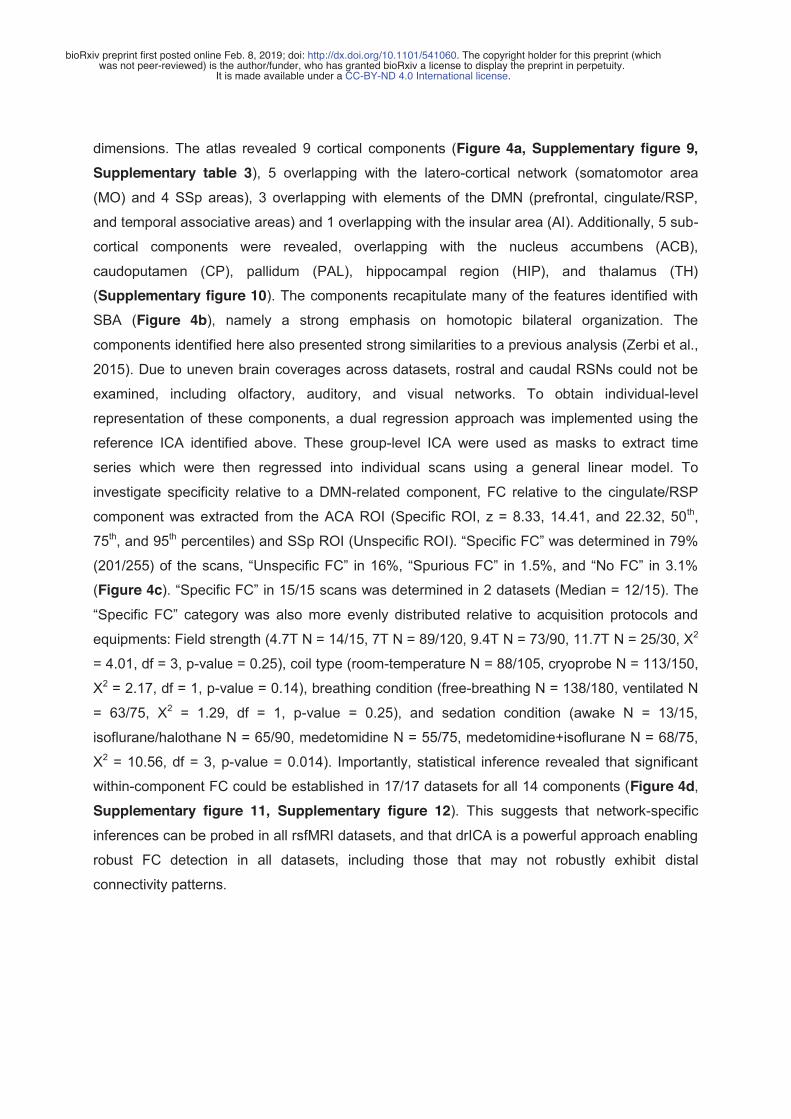
dimensions. The atlas revealed 9 cortical components (Figure 4a, Supplementary figure 9,
Supplementary table 3), 5 overlapping with the latero-cortical network (somatomotor area
(MO) and 4 SSp areas), 3 overlapping with elements of the DMN (prefrontal, cingulate/RSP,
and temporal associative areas) and 1 overlapping with the insular area (AI). Additionally, 5 sub-
cortical components were revealed, overlapping with the nucleus accumbens (ACB),
caudoputamen (CP), pallidum (PAL), hippocampal region (HIP), and thalamus (TH)
(Supplementary figure 10). The components recapitulate many of the features identified with
SBA (Figure 4b), namely a strong emphasis on homotopic bilateral organization. The
components identified here also presented strong similarities to a previous analysis (Zerbi et al.,
2015). Due to uneven brain coverages across datasets, rostral and caudal RSNs could not be
examined, including olfactory, auditory, and visual networks. To obtain individual-level
representation of these components, a dual regression approach was implemented using the
reference ICA identified above. These group-level ICA were used as masks to extract time
series which were then regressed into individual scans using a general linear model. To
investigate specificity relative to a DMN-related component, FC relative to the cingulate/RSP
component was extracted from the ACA ROI (Specific ROI, z = 8.33, 14.41, and 22.32, 50th,
75th, and 95th percentiles) and SSp ROI (Unspecific ROI). “Specific FC” was determined in 79%
(201/255) of the scans, “Unspecific FC” in 16%, “Spurious FC” in 1.5%, and “No FC” in 3.1%
(Figure 4c). “Specific FC” in 15/15 scans was determined in 2 datasets (Median = 12/15). The
“Specific FC” category was also more evenly distributed relative to acquisition protocols and
equipments: Field strength (4.7T N = 14/15, 7T N = 89/120, 9.4T N = 73/90, 11.7T N = 25/30, Χ2
= 4.01, df = 3, p-value = 0.25), coil type (room-temperature N = 88/105, cryoprobe N = 113/150,
Χ2 = 2.17, df = 1, p-value = 0.14), breathing condition (free-breathing N = 138/180, ventilated N
= 63/75, Χ2 = 1.29, df = 1, p-value = 0.25), and sedation condition (awake N = 13/15,
isoflurane/halothane N = 65/90, medetomidine N = 55/75, medetomidine+isoflurane N = 68/75,
Χ2 = 10.56, df = 3, p-value = 0.014). Importantly, statistical inference revealed that significant
within-component FC could be established in 17/17 datasets for all 14 components (Figure 4d,
Supplementary figure 11, Supplementary figure 12). This suggests that network-specific
inferences can be probed in all rsfMRI datasets, and that drICA is a powerful approach enabling
robust FC detection in all datasets, including those that may not robustly exhibit distal
connectivity patterns.
.CC-BY-ND 4.0 International licenseIt is made available under a was not peer-reviewed) is the author/funder, who has granted bioRxiv a license to display the preprint in perpetuity.
The copyright holder for this preprint (which. http://dx.doi.org/10.1101/541060doi: bioRxiv preprint first posted online Feb. 8, 2019;
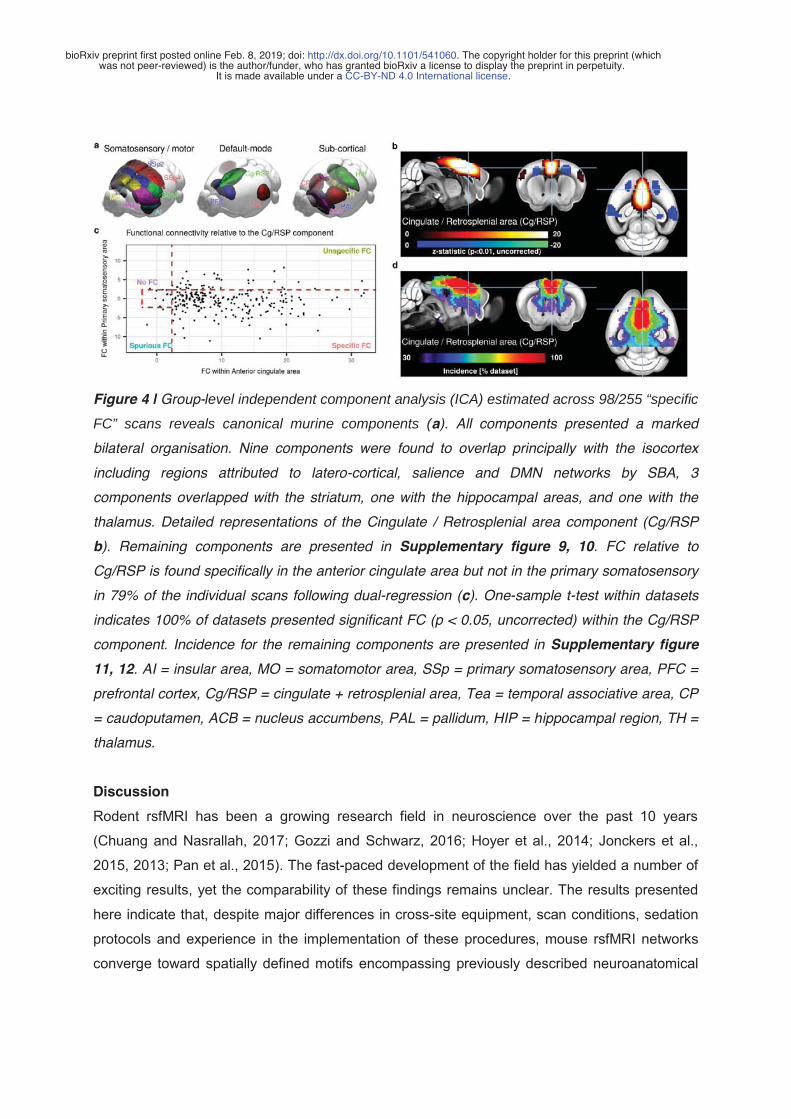
Figure 4 | Group-level independent component analysis (ICA) estimated across 98/255 “specific
FC” scans reveals canonical murine components (a). All components presented a marked
bilateral organisation. Nine components were found to overlap principally with the isocortex
including regions attributed to latero-cortical, salience and DMN networks by SBA, 3
components overlapped with the striatum, one with the hippocampal areas, and one with the
thalamus. Detailed representations of the Cingulate / Retrosplenial area component (Cg/RSP
b). Remaining components are presented in Supplementary figure 9, 10. FC relative to
Cg/RSP is found specifically in the anterior cingulate area but not in the primary somatosensory
in 79% of the individual scans following dual-regression (c). One-sample t-test within datasets
indicates 100% of datasets presented significant FC (p < 0.05, uncorrected) within the Cg/RSP
component. Incidence for the remaining components are presented in Supplementary figure
11, 12. AI = insular area, MO = somatomotor area, SSp = primary somatosensory area, PFC =
prefrontal cortex, Cg/RSP = cingulate + retrosplenial area, Tea = temporal associative area, CP
= caudoputamen, ACB = nucleus accumbens, PAL = pallidum, HIP = hippocampal region, TH =
thalamus.
Discussion
Rodent rsfMRI has been a growing research field in neuroscience over the past 10 years
(Chuang and Nasrallah, 2017; Gozzi and Schwarz, 2016; Hoyer et al., 2014; Jonckers et al.,
2015, 2013; Pan et al., 2015). The fast-paced development of the field has yielded a number of
exciting results, yet the comparability of these findings remains unclear. The results presented
here indicate that, despite major differences in cross-site equipment, scan conditions, sedation
protocols and experience in the implementation of these procedures, mouse rsfMRI networks
converge toward spatially defined motifs encompassing previously described neuroanatomical
.CC-BY-ND 4.0 International licenseIt is made available under a was not peer-reviewed) is the author/funder, who has granted bioRxiv a license to display the preprint in perpetuity.
The copyright holder for this preprint (which. http://dx.doi.org/10.1101/541060doi: bioRxiv preprint first posted online Feb. 8, 2019;
systems of the mouse brain. Importantly, we also highlight the possibility to use rsfMRI to probe
distributed network systems of high translational relevance, including a rodent DMN, salience
network, and latero-cortical network. While not reliably identified in all datasets and scan
conditions, these large-scale networks were found to colocalize into well delineated boundaries
in the majority of scans and datasets respectively, recapitulating previous descriptions in
rodents (Gozzi and Schwarz, 2016; Lu et al., 2012; Sforazzini et al., 2014; Stafford et al., 2014),
monkeys (Hutchison and Everling, 2012) and humans (Buckner et al., 2008).
Interestingly, most (70%) of the datasets converged toward spatially defined common RSN
when long-range FC relative to a seed was assessed. When the analysis was restricted to local
connectivity, all datasets converged. These results indicate that group-level, or second-level
inferences, may be assessed irrespective of acquisition protocol or animal handling procedures
in all datasets using robust analysis strategies. At the subject level, “specific FC” relative to the
DMN was found in 38% of the scans, indicating that first-level inference on long-range FC is
within reaches in some, but not all datasets. Sedation and equipment performance leading to
increased SNR were the major factors associated with both FC sensitivity and specificity,
together with breathing conditions. Awake animals presented higher FC overall, however
datasets acquired with medetomidine+isoflurane combination together with mechanical
ventilation were associated with greater specificity within elements of the DMN. Importantly, the
results converged irrespective of sedation or awake protocols. This underlines that all datasets
should be examined with the same expectations and criteria to further enhance results
comparability. Hence, the set of standards provided here (e.g. spatial maps and FC parameter
distributions), will allow the calibration of future multi-centre projects and assist in designing
meta-analysis and replication studies, the gold standards in evidence-based research.
In addition to acquisition procedures, the adoption of analysis standards must be encouraged. A
MRI template (Dorr et al., 2008) transformed into the AIBS standard space provides a common
space that extends beyond animal MRI studies, including the seamless implementation of AIBS
resources (Bergmann et al., 2016; Grandjean et al., 2017b; Oh et al., 2014; Richiardi et al.,
2015; Stafford et al., 2014). Moreover, analysis based on robust methods (Zuo and Xing, 2014),
such as drICA (Filippini et al., 2009), together with considerations for statistical analysis (Eklund
et al., 2016), and sharing datasets on online repositories (Nichols et al., 2017) provide a
comprehensive evidence-based roadmap to improve the comparability of acquisitions carried
out between centres and enhance the robustness and reproducibility of future results. In
.CC-BY-ND 4.0 International licenseIt is made available under a was not peer-reviewed) is the author/funder, who has granted bioRxiv a license to display the preprint in perpetuity.
The copyright holder for this preprint (which. http://dx.doi.org/10.1101/541060doi: bioRxiv preprint first posted online Feb. 8, 2019;

particular, all the dataset analyzed in the context of this study will be shared and therefore
provide references for scientists developing customized rsfMRI protocols.
Several major limitations within this study should be acknowledged. First and foremost, the lack
of consensus quality assurance parameters for the estimation of FC led us to devise a strategy
to examine FC specificity. Because this study grouped together a set of existing scans, factors
were not entirely orthogonal and it was not possible to model a number of potentially relevant
effects impacting FC metrics, such as specific sequence parameters (e.g. number of volumes),
as well as biologically relevant factors including sex, age, and mouse strain. Finally, lack of
distal FC in some datasets could not be attributed to specific animal handling protocols or
equipment performance. This indicates that additional experimental factors not considered here
may be better predictors estimating this particular kind of FC. For example, the implementation
of procedures to control the arterial level of carbon dioxide may be critical to prevent
hypercapnic conditions, a feature that is associated with reduced FC connectivity (Biswal et al.,
1997) and that is often observed in freely breathing anesthetized rodents. Despite these
limitations, the work presented here is likely to enhance the true scientific value of mouse
rsfMRI by establishing standards and how to attain them. With these, the field is set to meet its
goals toward the establishments and understanding of the cellular and molecular mechanisms
of large-scale brain functional reorganisation in the healthy and diseased brain.
.CC-BY-ND 4.0 International licenseIt is made available under a was not peer-reviewed) is the author/funder, who has granted bioRxiv a license to display the preprint in perpetuity.
The copyright holder for this preprint (which. http://dx.doi.org/10.1101/541060doi: bioRxiv preprint first posted online Feb. 8, 2019;
Material and methods
Comparison dataset acquisition
All animal experiments were carried out with explicit permits from local regulatory bodies.
Seventeen datasets, consisting of 15 individual pre-acquired rsfMRI scans each, were acquired
with parameters reflecting each centre standards. A summary of equipment, acquisition
parameters, and animal handling procedures is listed in Supplementary table 1. Scans were
acquired on dedicated Bruker magnets operating at 4.7T (N = 1 dataset), 7T (N = 8), 9.4T (N =
6), 11.7T (N = 2), with either room-temperature coils (N = 7) or cryoprobes (N = 10). Gradient-
echo echo planar imaging (EPI) sequences were used to acquire all datasets, with repetition
time (TR) ranging 1000 - 2000 ms, echo time (TE) 10 - 25 ms, and number of volume 150 -
1000. Acquisitions were performed on awake (N = 1) or anesthetized C57Bl/6J mice (both male
and female) with either isoflurane 1-1.25% (N = 5), halothane 0.75% (N = 1), medetomidine 0.1-
0.4 mg/kg bolus and 0.2-0.8 mg/kg/h infusion (N = 5), or a combination of isoflurane 0.2-0.5%
and medetomidine 0.05-0.3 mg/kg bolus and 0-0.1 mg/kg/h infusion (N = 5). Awake mice were
fitted with a non-magnetic head implant to fix the heads to a compatible cradle (Yoshida et al.,
2016). Animals were either freely-breathing (N = 12) or mechanically ventilated (N = 5).
Datasets are publicly available in BIDS format on openneuro.org (project ID :
Mouse_rest_multicentre, https://openneuro.org/datasets/ds001720).
Data preprocessing
Volumes were analysed in their native resolution. Firstly, image axes were reoriented into LPI
orientation (3dresample, Analysis of Functional NeuroImages, AFNI_16.1.26,
https://afni.nimh.nih.gov) (Cox, 1996). Temporal spikes were removed (3dDespike), followed by
motion correction (3dvolreg). Brain masks (RATS_MM, https://www.iibi.uiowa.edu) (Oguz et al.,
2014) were estimated on temporally averaged EPI volume (fslmaths). Motion outliers were
detected based on relative framewise displacement estimated during motion correction.
Volumes with spikes or framewise displacement greater than 0.100 mm, corresponding to
approximately 0.5 voxel of the average in-plane resolution, were labelled in a confound file to be
excluded from later seed-based analysis and dual-regression. Linear affine parameters and
nonlinear deformations with greedy SyN diffeomorphic transformation (antsIntroduction.sh) were
estimated relative to a reference T2 MRI template (Dorr et al., 2008) registered into the AIBS
Common Coordinate Framework (CCF v3, http://www.brain-map.org/) resampled to 0.200 mm3.
Normalisation to AIBS space was carried out on brain masked EPI directly using ANTS
(Advanced Normalization Tools, http://picsl.upenn.edu/software/ants/) (Avants et al., 2014,
.CC-BY-ND 4.0 International licenseIt is made available under a was not peer-reviewed) is the author/funder, who has granted bioRxiv a license to display the preprint in perpetuity.
The copyright holder for this preprint (which. http://dx.doi.org/10.1101/541060doi: bioRxiv preprint first posted online Feb. 8, 2019;
2011). Anatomical scans corresponding to each EPI acquisition were not available in all cases.
Despite this limitation, plausible registrations of murine EPI directly onto a T2 MRI template
were rendered possible due to the relatively simple structure of the lissencephalic cerebrum and
high EPI quality. Individual registered brain mask were multiplied (fslmaths) to obtain a study
mask. The analysis was bounded within this study mask, i..e the brain areas covered by all
individual scans. References to anatomical areas are made with respect to the AIBS atlas. All
brain masks and registrations were visually inspected and considered plausible.
Six different denoising approaches were applied: i) 6 motion parameters regression (MC), or the
following together with motion parameters, ii) white matter (WM), iii) ventricle (VEN), iv) vascular
(VASC), v) vascular + ventricle (VV), or vi) global (GSR) signal regression. White matter and
ventricle masks were adapted from the AIBS atlas (Supplementary figure 4cd), a vascular
mask was obtained by averaging and thresholding hand-selected individual-level independent
components registered to AIBS space (Supplementary figure 4b). Inverse transformations
were applied to each mask. Average time series within masks were extracted (fslmeants) and
regressed out (fsl_regfilt). Finally, spatial smoothing was applied with a isotropic 0.45 mm kernel
(3dBlurInMask), and bandpass filtering was applied between 0.01 - 0.1 Hz (3dBandpass). The
smoothing kernel was selected to correspond approximately to 1.5 x voxel dimension of the
lowest in-plane resolution. The bandpass filter was applied to all datasets to enhance
comparability between datasets, despite indications that medetomidine leads to a shift in resting
fluctuation frequencies (Grandjean et al., 2014a; Kalthoff et al., 2013; Paasonen et al., 2018).
The denoised and filtered individual scans were normalised to AIBS reference space
(WarpTimeSeriesImageMultiTransform).
Noise was estimated by extracting the signal standard deviation from manually defined regions-
of-interest (ROIs) in the upper corners of at least 3 slices, carefully avoiding ghosting artefacts
or tissues (brain or otherwise). Mean signal was extracted from the 20th acquisition volume
using a cortical mask spanning over the whole isocortex (defined by AIBS atlas) and registered
in individual spaces to estimate signal-to-noise ratio (SNR). The same cortical mask was used
to extract standard deviation of temporal signals to estimate temporal SNR (tSNR).
Seed-based analysis and independent component analysis
Seeds on the left hemisphere were defined in AIBS space based on the AIBS atlas using 0.300
mm3 spheres, corresponding to 27 voxels (Figure S1a). Mean BOLD signal time series within a
.CC-BY-ND 4.0 International licenseIt is made available under a was not peer-reviewed) is the author/funder, who has granted bioRxiv a license to display the preprint in perpetuity.
The copyright holder for this preprint (which. http://dx.doi.org/10.1101/541060doi: bioRxiv preprint first posted online Feb. 8, 2019;
seed were extracted (fslmeants) and regressed into individual scans to obtain z-statistic maps
(fsl_glm). Multi-session temporal concatenation ICA was carried out using MELODIC
(Multivariate Exploratory Linear Optimized Decomposition into Independent Components, v3.14)
using 20 components. Group-level component classification was adapted on a set of rules
defined in (Zerbi et al., 2015). The following were considered plausible resting-state networks:
(i) components with either bilateral organisation or (ii) unilateral components with a
corresponding separate contralateral component, (iii) minimal crossing of relevant brain
boundaries such as white matter tracts, (iv) spatial extent covering more than one slice. The
following were considered as implausible resting-state networks: (i) components overlapping
mainly with either white matter, ventricle, or vascular masks (Supplementary figure 4bcd), (ii)
components mainly localised on brain edges. Dual-regression was carried out using the
eponymous FSL function to obtain individual-level representations of 14 selected plausible
group-level components (Filippini et al., 2009).
Statistical analysis and data representation
Voxelwise statistics were carried out in FSL using either non-parametric permutation tests
(randomise) for across datasets one-sample t-tests using 5000 permutations and voxelwise
correction, or uncorrected parametric one-sample t-tests for within-dataset comparisons
(fsl_glm). Voxelwise statistical maps are shown as colour-coded t-statistics overlays on the ABI
template resampled at 25μm3 isotropic using MRIcron (Rorden et al., 2007). Statistical analysis
carried out on parameters extracted from ROIs was performed in R (v3.4.4, “Someone to Lean
on”, R Foundation for Statistical Computing, Vienna, Austria, https://R-project.org) using a linear
model (lm). A simplified model was designed including the following fixed effects: breathing
conditions (2 levels: ventilated or free-breathing), sedation conditions (4 levels: awake,
isoflurane/halothane, medetomidine, medetomidine + isoflurane combination), SNR (continuous
variable), mean FWD (continuous variable). Interactions effects between these factors were not
modeled. Fixed effects significance was tested using likelihood ratio test. Scan parameter
occurrence rates were assessed with Chi-square test (chisq.test). Residual analysis was
performed with QQ-plots to inspect normal distribution, Tukey–Anscombe plots for the
homogeneity of the variance and skewness, and scale location plots for homoscedasticity (i.e.,
the homogeneity of residual variance). The assumption of normality of the residuals was
considered plausible in all statistical tests. Plots were generated using ggplot2 (v2.1.0) package
for R. Significance level was set at p<=0.05 one-tailed with family-wise error correction at a
.CC-BY-ND 4.0 International licenseIt is made available under a was not peer-reviewed) is the author/funder, who has granted bioRxiv a license to display the preprint in perpetuity.
The copyright holder for this preprint (which. http://dx.doi.org/10.1101/541060doi: bioRxiv preprint first posted online Feb. 8, 2019;

voxelwise level, unless specified otherwise. Descriptive statistics are given as mean ± 1
standard deviation.
Acknowledgements
This work was supported by the Singapore Bioimaging Consortium (SBIC), A*STAR, Singapore.
AG acknowledges funding from the Simons Foundation (SFARI 314688 and 400101), the Brain
and Behavior Foundation (2017 NARSAD independent Investigator Grant) and the European
Research Council (ERC, G.A. 802371). This work was also supported by the JSPS KAKENHI
Grant Number 16K07032 to NT, Brain/MINDS, the Strategic Research Program for Brain
Sciences (SRPBS) from the Ministry of Education, Culture, Sports, Science, and Technology of
Japan (MEXT) and Japan Agency for Medical Research and Development (AMED) to NT and
HO. It was further supported as part of the Excellence Cluster ‘BrainLinks-BrainTools’ by the
German Research Foundation, grant EXC1086. AH acknowledges funding from the German
BMBF (NeuroImpa, 01EC1403C and NeuroRad 02NUK034D). MD acknowledges funding from
France-Alzheimer Association, Plan Alzheimer Foundation and the French Public Investment
Bank’s “ROMANE” program. This work was also supported by the Fund for Scientific Research
Flanders (FWO) (grant agreements G057615N and 12S4815N - AvL), the Stichting Alzheimer
Onderzoek (SAO-FRA, grant agreement 13026-AvL), the interdisciplinary PhD grant BOF
DOCPRO 2014 - MV). The authors would like to thank Itamar Kahn, Eyal Bergmann and Daniel
Gutierrez-Barragan for critically reading the manuscript.
Author Contributions
JG designed the study. Every author contributed to data acquisition. JG, CC and AG carried out
the analysis. Every author participated in the preparation of the manuscript.
Competing interests statement
The authors have no conflicts of interest to declare.
.CC-BY-ND 4.0 International licenseIt is made available under a was not peer-reviewed) is the author/funder, who has granted bioRxiv a license to display the preprint in perpetuity.
The copyright holder for this preprint (which. http://dx.doi.org/10.1101/541060doi: bioRxiv preprint first posted online Feb. 8, 2019;
References
Bergmann, E., Zur, G., Bershadsky, G., Kahn, I., 2016. The Organization of Mouse and Human
Cortico-Hippocampal Networks Estimated by Intrinsic Functional Connectivity. Cereb. Cortex
26, 4497–4512. doi:10.1093/cercor/bhw327resting state
Avants, B.B., Tustison, N.J., Song, G., Cook, P.A., Klein, A., Gee, J.C., 2011. A reproducible
evaluation of ANTs similarity metric performance in brain image registration. Neuroimage
54, 2033–2044. doi:10.1016/j.neuroimage.2010.09.025
Avants, B.B., Tustison, N.J., Stauffer, M., Song, G., Wu, B., Gee, J.C., 2014. The Insight ToolKit
image registration framework. Front. Neuroinformatics 8, 44. doi:10.3389/fninf.2014.00044
Azevedo, F.A.C., Carvalho, L.R.B., Grinberg, L.T., Farfel, J.M., Ferretti, R.E.L., Leite, R.E.P.,
Jacob Filho, W., Lent, R., Herculano-Houzel, S., 2009. Equal numbers of neuronal and
nonneuronal cells make the human brain an isometrically scaled-up primate brain. J. Comp.
Neurol. 513, 532–541. doi:10.1002/cne.21974
Becerra, L., Pendse, G., Chang, P.-C., Bishop, J., Borsook, D., 2011. Robust reproducible
resting state networks in the awake rodent brain. PLoS ONE 6, e25701.
doi:10.1371/journal.pone.0025701
Belloy, M.E., Naeyaert, M., Abbas, A., Shah, D., Vanreusel, V., van Audekerke, J., Keilholz,
S.D., Keliris, G.A., Van der Linden, A., Verhoye, M., 2018a. Dynamic resting state fMRI
analysis in mice reveals a set of Quasi-Periodic Patterns and illustrates their relationship
with the global signal. Neuroimage 180, 463–484. doi:10.1016/j.neuroimage.2018.01.075
Belloy, M.E., Shah, D., Abbas, A., Kashyap, A., Roßner, S., Van der Linden, A., Keilholz, S.D.,
Keliris, G.A., Verhoye, M., 2018b. Quasi-Periodic Patterns of Neural Activity improve
Classification of Alzheimer’s Disease in Mice. Sci. Rep. 8, 10024. doi:10.1038/s41598-018-
28237-9
Bergmann, E., Zur, G., Bershadsky, G., Kahn, I., 2016. The Organization of Mouse and Human
Cortico-Hippocampal Networks Estimated by Intrinsic Functional Connectivity. Cereb.
Cortex 26, 4497–4512. doi:10.1093/cercor/bhw327
Bertero, A., Liska, A., Pagani, M., Parolisi, R., Masferrer, M.E., Gritti, M., Pedrazzoli, M.,
Galbusera, A., Sarica, A., Cerasa, A., Buffelli, M., Tonini, R., Buffo, A., Gross, C.,
Pasqualetti, M., Gozzi, A., 2018. Autism-associated 16p11.2 microdeletion impairs
prefrontal functional connectivity in mouse and human. Brain 141, 2055–2065.
doi:10.1093/brain/awy111
Biswal, B., Hudetz, A.G., Yetkin, F.Z., Haughton, V.M., Hyde, J.S., 1997. Hypercapnia reversibly
suppresses low-frequency fluctuations in the human motor cortex during rest using echo-
.CC-BY-ND 4.0 International licenseIt is made available under a was not peer-reviewed) is the author/funder, who has granted bioRxiv a license to display the preprint in perpetuity.
The copyright holder for this preprint (which. http://dx.doi.org/10.1101/541060doi: bioRxiv preprint first posted online Feb. 8, 2019;

planar MRI. J. Cereb. Blood Flow Metab. 17, 301–308. doi:10.1097/00004647-199703000-
00007
Biswal, B., Yetkin, F.Z., Haughton, V.M., Hyde, J.S., 1995. Functional connectivity in the motor
cortex of resting human brain using echo-planar MRI. Magn. Reson. Med. 34, 537–541.
doi:10.1002/mrm.1910340409
Biswal, B.B., Mennes, M., Zuo, X.-N., Gohel, S., Kelly, C., Smith, S.M., Beckmann, C.F.,
Adelstein, J.S., Buckner, R.L., Colcombe, S., Dogonowski, A.-M., Ernst, M., Fair, D.,
Hampson, M., Hoptman, M.J., Hyde, J.S., Kiviniemi, V.J., Kötter, R., Li, S.-J., Lin, C.-P.,
Milham, M.P., 2010. Toward discovery science of human brain function. Proc Natl Acad Sci
USA 107, 4734–4739. doi:10.1073/pnas.0911855107
Buckner, R.L., Andrews-Hanna, J.R., Schacter, D.L., 2008. The brain’s default network:
anatomy, function, and relevance to disease. Ann. N. Y. Acad. Sci. 1124, 1–38.
doi:10.1196/annals.1440.011
Buehlmann, D., Grandjean, J., Xandry, J., Rudin, M., 2018. Longitudinal resting-state functional
magnetic resonance imaging in a mouse model of metastatic bone cancer reveals distinct
functional reorganizations along a developing chronic pain state. Pain 159, 719–727.
doi:10.1097/j.pain.0000000000001148
Bukhari, Q., Schroeter, A., Cole, D.M., Rudin, M., 2017. Resting State fMRI in Mice Reveals
Anesthesia Specific Signatures of Brain Functional Networks and Their Interactions. Front.
Neural Circuits 11, 5. doi:10.3389/fncir.2017.00005
Bukhari, Q., Schroeter, A., Rudin, M., 2018. Increasing isoflurane dose reduces homotopic
correlation and functional segregation of brain networks in mice as revealed by resting-
state fMRI. Sci. Rep. 8, 10591. doi:10.1038/s41598-018-28766-3
Charbogne, P., Gardon, O., Martín-García, E., Keyworth, H.L., Matsui, A., Mechling, A.E.,
Bienert, T., Nasseef, T., Robé, A., Moquin, L., Darcq, E., Ben Hamida, S., Robledo, P.,
Matifas, A., Befort, K., Gavériaux-Ruff, C., Harsan, L.-A., von Elverfeldt, D., Hennig, J.,
Gratton, A., Kieffer, B.L., 2017. Mu Opioid Receptors in Gamma-Aminobutyric Acidergic
Forebrain Neurons Moderate Motivation for Heroin and Palatable Food. Biol. Psychiatry 81,
778–788. doi:10.1016/j.biopsych.2016.12.022
Chuang, K.-H., Nasrallah, F.A., 2017. Functional networks and network perturbations in rodents.
Neuroimage 163, 419–436. doi:10.1016/j.neuroimage.2017.09.038
Cox, R.W., 1996. AFNI: software for analysis and visualization of functional magnetic resonance
neuroimages. Comput. Biomed. Res. 29, 162–173. doi:10.1006/cbmr.1996.0014
DeSimone, J.C., Febo, M., Shukla, P., Ofori, E., Colon-Perez, L.M., Li, Y., Vaillancourt, D.E.,
.CC-BY-ND 4.0 International licenseIt is made available under a was not peer-reviewed) is the author/funder, who has granted bioRxiv a license to display the preprint in perpetuity.
The copyright holder for this preprint (which. http://dx.doi.org/10.1101/541060doi: bioRxiv preprint first posted online Feb. 8, 2019;
2016. In vivo imaging reveals impaired connectivity across cortical and subcortical networks
in a mouse model of DYT1 dystonia. Neurobiol. Dis. 95, 35–45.
doi:10.1016/j.nbd.2016.07.005
Dorr, A.E., Lerch, J.P., Spring, S., Kabani, N., Henkelman, R.M., 2008. High resolution three-
dimensional brain atlas using an average magnetic resonance image of 40 adult C57Bl/6J
mice. Neuroimage 42, 60–69. doi:10.1016/j.neuroimage.2008.03.037
Eklund, A., Nichols, T.E., Knutsson, H., 2016. Cluster failure: Why fMRI inferences for spatial
extent have inflated false-positive rates. Proc Natl Acad Sci USA 113, 7900–7905.
doi:10.1073/pnas.1602413113
Errico, F., D’Argenio, V., Sforazzini, F., Iasevoli, F., Squillace, M., Guerri, G., Napolitano, F.,
Angrisano, T., Di Maio, A., Keller, S., Vitucci, D., Galbusera, A., Chiariotti, L., Bertolino, A.,
de Bartolomeis, A., Salvatore, F., Gozzi, A., Usiello, A., 2015. A role for D-aspartate
oxidase in schizophrenia and in schizophrenia-related symptoms induced by phencyclidine
in mice. Transl. Psychiatry 5, e512. doi:10.1038/tp.2015.2
Filippini, N., MacIntosh, B.J., Hough, M.G., Goodwin, G.M., Frisoni, G.B., Smith, S.M.,
Matthews, P.M., Beckmann, C.F., Mackay, C.E., 2009. Distinct patterns of brain activity in
young carriers of the APOE-epsilon4 allele. Proc Natl Acad Sci USA 106, 7209–7214.
doi:10.1073/pnas.0811879106
Fox, M.D., Raichle, M.E., 2007. Spontaneous fluctuations in brain activity observed with
functional magnetic resonance imaging. Nat. Rev. Neurosci. 8, 700–711.
doi:10.1038/nrn2201
Fox, M.D., Snyder, A.Z., Vincent, J.L., Corbetta, M., Van Essen, D.C., Raichle, M.E., 2005. The
human brain is intrinsically organized into dynamic, anticorrelated functional networks. Proc
Natl Acad Sci USA 102, 9673–9678. doi:10.1073/pnas.0504136102
Friston, K.J., 2011. Functional and effective connectivity: a review. Brain Connect. 1, 13–36.
doi:10.1089/brain.2011.0008
Gass, N., Weber-Fahr, W., Sartorius, A., Becker, R., Didriksen, M., Stensbøl, T.B., Bastlund,
J.F., Meyer-Lindenberg, A., Schwarz, A.J., 2016. An acetylcholine alpha7 positive allosteric
modulator rescues a schizophrenia-associated brain endophenotype in the 15q13.3
microdeletion, encompassing CHRNA7. Eur. Neuropsychopharmacol. 26, 1150–1160.
doi:10.1016/j.euroneuro.2016.03.013
Gozzi, A., Schwarz, A.J., 2016. Large-scale functional connectivity networks in the rodent brain.
Neuroimage 127, 496–509. doi:10.1016/j.neuroimage.2015.12.017
Grandjean, J., Azzinnari, D., Seuwen, A., Sigrist, H., Seifritz, E., Pryce, C.R., Rudin, M., 2016a.
.CC-BY-ND 4.0 International licenseIt is made available under a was not peer-reviewed) is the author/funder, who has granted bioRxiv a license to display the preprint in perpetuity.
The copyright holder for this preprint (which. http://dx.doi.org/10.1101/541060doi: bioRxiv preprint first posted online Feb. 8, 2019;
Chronic psychosocial stress in mice leads to changes in brain functional connectivity and
metabolite levels comparable to human depression. Neuroimage 142, 544–552.
doi:10.1016/j.neuroimage.2016.08.013
Grandjean, J., Derungs, R., Kulic, L., Welt, T., Henkelman, M., Nitsch, R.M., Rudin, M., 2016b.
Complex interplay between brain function and structure during cerebral amyloidosis in APP
transgenic mouse strains revealed by multi-parametric MRI comparison. Neuroimage 134,
1–11. doi:10.1016/j.neuroimage.2016.03.042
Grandjean, J., Preti, M.G., Bolton, T.A.W., Buerge, M., Seifritz, E., Pryce, C.R., Van De Ville, D.,
Rudin, M., 2017a. Dynamic reorganization of intrinsic functional networks in the mouse
brain. Neuroimage 152, 497–508. doi:10.1016/j.neuroimage.2017.03.026
Grandjean, J., Schroeter, A., Batata, I., Rudin, M., 2014a. Optimization of anesthesia protocol
for resting-state fMRI in mice based on differential effects of anesthetics on functional
connectivity patterns. Neuroimage 102 Pt 2, 838–847.
doi:10.1016/j.neuroimage.2014.08.043
Grandjean, J., Schroeter, A., He, P., Tanadini, M., Keist, R., Krstic, D., Konietzko, U., Klohs, J.,
Nitsch, R.M., Rudin, M., 2014b. Early alterations in functional connectivity and white matter
structure in a transgenic mouse model of cerebral amyloidosis. J. Neurosci. 34, 13780–
13789. doi:10.1523/JNEUROSCI.4762-13.2014
Grandjean, J., Zerbi, V., Balsters, J.H., Wenderoth, N., Rudin, M., 2017b. Structural Basis of
Large-Scale Functional Connectivity in the Mouse. J. Neurosci. 37, 8092–8101.
doi:10.1523/JNEUROSCI.0438-17.2017
Greicius, M., 2008. Resting-state functional connectivity in neuropsychiatric disorders. Curr.
Opin. Neurol. 21, 424–430. doi:10.1097/WCO.0b013e328306f2c5
Guilfoyle, D.N., Gerum, S.V., Sanchez, J.L., Balla, A., Sershen, H., Javitt, D.C., Hoptman, M.J.,
2013. Functional connectivity fMRI in mouse brain at 7T using isoflurane. J. Neurosci.
Methods 214, 144–148. doi:10.1016/j.jneumeth.2013.01.019
Haberl, M.G., Zerbi, V., Veltien, A., Ginger, M., Heerschap, A., Frick, A., 2015. Structural-
functional connectivity deficits of neocortical circuits in the Fmr1 (-/y) mouse model of
autism. Sci. Adv. 1, e1500775. doi:10.1126/sciadv.1500775
Hoyer, C., Gass, N., Weber-Fahr, W., Sartorius, A., 2014. Advantages and challenges of small
animal magnetic resonance imaging as a translational tool. Neuropsychobiology 69, 187–
201. doi:10.1159/000360859
Hübner, N.S., Mechling, A.E., Lee, H.-L., Reisert, M., Bienert, T., Hennig, J., von Elverfeldt, D.,
Harsan, L.-A., 2017. The connectomics of brain demyelination: Functional and structural
.CC-BY-ND 4.0 International licenseIt is made available under a was not peer-reviewed) is the author/funder, who has granted bioRxiv a license to display the preprint in perpetuity.
The copyright holder for this preprint (which. http://dx.doi.org/10.1101/541060doi: bioRxiv preprint first posted online Feb. 8, 2019;
patterns in the cuprizone mouse model. Neuroimage 146, 1–18.
doi:10.1016/j.neuroimage.2016.11.008
Hutchison, R.M., Everling, S., 2012. Monkey in the middle: why non-human primates are
needed to bridge the gap in resting-state investigations. Front. Neuroanat. 6, 29.
doi:10.3389/fnana.2012.00029
Jonckers, E., Delgado y Palacios, R., Shah, D., Guglielmetti, C., Verhoye, M., Van der Linden,
A., 2014. Different anesthesia regimes modulate the functional connectivity outcome in
mice. Magn. Reson. Med. 72, 1103–1112. doi:10.1002/mrm.24990
Jonckers, E., Shah, D., Hamaide, J., Verhoye, M., Van der Linden, A., 2015. The power of using
functional fMRI on small rodents to study brain pharmacology and disease. Front.
Pharmacol. 6, 231. doi:10.3389/fphar.2015.00231
Jonckers, E., Van Audekerke, J., De Visscher, G., Van der Linden, A., Verhoye, M., 2011.
Functional connectivity fMRI of the rodent brain: comparison of functional connectivity
networks in rat and mouse. PLoS ONE 6, e18876. doi:10.1371/journal.pone.0018876
Jonckers, E., Van der Linden, A., Verhoye, M., 2013. Functional magnetic resonance imaging in
rodents: an unique tool to study in vivo pharmacologic neuromodulation. Curr. Opin.
Pharmacol. 13, 813–820. doi:10.1016/j.coph.2013.06.008
Jovicich, J., Minati, L., Marizzoni, M., Marchitelli, R., Sala-Llonch, R., Bartrés-Faz, D., Arnold, J.,
Benninghoff, J., Fiedler, U., Roccatagliata, L., Picco, A., Nobili, F., Blin, O., Bombois, S.,
Lopes, R., Bordet, R., Sein, J., Ranjeva, J.-P., Didic, M., Gros-Dagnac, H., PharmaCog
Consortium, 2016. Longitudinal reproducibility of default-mode network connectivity in
healthy elderly participants: A multicentric resting-state fMRI study. Neuroimage 124, 442–
454. doi:10.1016/j.neuroimage.2015.07.010
Kalthoff, D., Po, C., Wiedermann, D., Hoehn, M., 2013. Reliability and spatial specificity of rat
brain sensorimotor functional connectivity networks are superior under sedation compared
with general anesthesia. NMR Biomed. 26, 638–650. doi:10.1002/nbm.2908
Komaki, Y., Hikishima, K., Shibata, S., Konomi, T., Seki, F., Yamada, M., Miyasaka, N.,
Fujiyoshi, K., Okano, H.J., Nakamura, M., Okano, H., 2016. Functional brain mapping using
specific sensory-circuit stimulation and a theoretical graph network analysis in mice with
neuropathic allodynia. Sci. Rep. 6, 37802. doi:10.1038/srep37802
Li, Q., Li, G., Wu, D., Lu, H., Hou, Z., Ross, C.A., Yang, Y., Zhang, J., Duan, W., 2017. Resting-
state functional MRI reveals altered brain connectivity and its correlation with motor
dysfunction in a mouse model of Huntington’s disease. Sci. Rep. 7, 16742.
doi:10.1038/s41598-017-17026-5
.CC-BY-ND 4.0 International licenseIt is made available under a was not peer-reviewed) is the author/funder, who has granted bioRxiv a license to display the preprint in perpetuity.
The copyright holder for this preprint (which. http://dx.doi.org/10.1101/541060doi: bioRxiv preprint first posted online Feb. 8, 2019;
Liska, A., Bertero, A., Gomolka, R., Sabbioni, M., Galbusera, A., Barsotti, N., Panzeri, S.,
Scattoni, M.L., Pasqualetti, M., Gozzi, A., 2018. Homozygous Loss of Autism-Risk Gene
CNTNAP2 Results in Reduced Local and Long-Range Prefrontal Functional Connectivity.
Cereb. Cortex 28, 1141–1153. doi:10.1093/cercor/bhx022
Liska, A., Galbusera, A., Schwarz, A.J., Gozzi, A., 2015. Functional connectivity hubs of the
mouse brain. Neuroimage 115, 281–291. doi:10.1016/j.neuroimage.2015.04.033
Liska, A., Gozzi, A., 2016. Can mouse imaging studies bring order to autism connectivity
chaos? Front. Neurosci. 10, 484. doi:10.3389/fnins.2016.00484
Lu, H., Zou, Q., Gu, H., Raichle, M.E., Stein, E.A., Yang, Y., 2012. Rat brains also have a
default mode network. Proc Natl Acad Sci USA 109, 3979–3984.
doi:10.1073/pnas.1200506109
Mechling, A.E., Arefin, T., Lee, H.-L., Bienert, T., Reisert, M., Ben Hamida, S., Darcq, E.,
Ehrlich, A., Gaveriaux-Ruff, C., Parent, M.J., Rosa-Neto, P., Hennig, J., von Elverfeldt, D.,
Kieffer, B.L., Harsan, L.-A., 2016. Deletion of the mu opioid receptor gene in mice reshapes
the reward-aversion connectome. Proc Natl Acad Sci USA 113, 11603–11608.
doi:10.1073/pnas.1601640113
Michetti, C., Caruso, A., Pagani, M., Sabbioni, M., Medrihan, L., David, G., Galbusera, A.,
Morini, M., Gozzi, A., Benfenati, F., Scattoni, M.L., 2017. The Knockout of Synapsin II in
Mice Impairs Social Behavior and Functional Connectivity Generating an ASD-like
Phenotype. Cereb. Cortex 27, 5014–5023. doi:10.1093/cercor/bhx207
Murphy, K., Birn, R.M., Bandettini, P.A., 2013. Resting-state fMRI confounds and cleanup.
Neuroimage 80, 349–359. doi:10.1016/j.neuroimage.2013.04.001
Nichols, T.E., Das, S., Eickhoff, S.B., Evans, A.C., Glatard, T., Hanke, M., Kriegeskorte, N.,
Milham, M.P., Poldrack, R.A., Poline, J.-B., Proal, E., Thirion, B., Van Essen, D.C., White,
T., Yeo, B.T.T., 2017. Best practices in data analysis and sharing in neuroimaging using
MRI. Nat. Neurosci. 20, 299–303. doi:10.1038/nn.4500
Oguz, I., Zhang, H., Rumple, A., Sonka, M., 2014. RATS: Rapid Automatic Tissue
Segmentation in rodent brain MRI. J. Neurosci. Methods 221, 175–182.
doi:10.1016/j.jneumeth.2013.09.021
Oh, S.W., Harris, J.A., Ng, L., Winslow, B., Cain, N., Mihalas, S., Wang, Q., Lau, C., Kuan, L.,
Henry, A.M., Mortrud, M.T., Ouellette, B., Nguyen, T.N., Sorensen, S.A., Slaughterbeck,
C.R., Wakeman, W., Li, Y., Feng, D., Ho, A., Nicholas, E., Zeng, H., 2014. A mesoscale
connectome of the mouse brain. Nature 508, 207–214. doi:10.1038/nature13186
Paasonen, J., Stenroos, P., Salo, R.A., Kiviniemi, V., Gröhn, O., 2018. Functional connectivity
.CC-BY-ND 4.0 International licenseIt is made available under a was not peer-reviewed) is the author/funder, who has granted bioRxiv a license to display the preprint in perpetuity.
The copyright holder for this preprint (which. http://dx.doi.org/10.1101/541060doi: bioRxiv preprint first posted online Feb. 8, 2019;

under six anesthesia protocols and the awake condition in rat brain. Neuroimage 172, 9–
20. doi:10.1016/j.neuroimage.2018.01.014
Pan, W.-J., Billings, J.C.W., Grooms, J.K., Shakil, S., Keilholz, S.D., 2015. Considerations for
resting state functional MRI and functional connectivity studies in rodents. Front. Neurosci.
9, 269. doi:10.3389/fnins.2015.00269
Popa, D., Popescu, A.T., Paré, D., 2009. Contrasting activity profile of two distributed cortical
networks as a function of attentional demands. J. Neurosci. 29, 1191–1201.
doi:10.1523/JNEUROSCI.4867-08.2009
Razoux, F., Baltes, C., Mueggler, T., Seuwen, A., Russig, H., Mansuy, I., Rudin, M., 2013.
Functional MRI to assess alterations of functional networks in response to pharmacological
or genetic manipulations of the serotonergic system in mice. Neuroimage 74, 326–336.
doi:10.1016/j.neuroimage.2013.02.031
Richiardi, J., Altmann, A., Milazzo, A.-C., Chang, C., Chakravarty, M.M., Banaschewski, T.,
Barker, G.J., Bokde, A.L.W., Bromberg, U., Büchel, C., Conrod, P., Fauth-Bühler, M., Flor,
H., Frouin, V., Gallinat, J., Garavan, H., Gowland, P., Heinz, A., Lemaître, H., Mann, K.F.,
IMAGEN consortium, 2015. BRAIN NETWORKS. Correlated gene expression supports
synchronous activity in brain networks. Science 348, 1241–1244.
doi:10.1126/science.1255905
Rorden, C., Karnath, H.-O., Bonilha, L., 2007. Improving lesion-symptom mapping. J. Cogn.
Neurosci. 19, 1081–1088. doi:10.1162/jocn.2007.19.7.1081
Schroeter, A., Grandjean, J., Schlegel, F., Saab, B.J., Rudin, M., 2017. Contributions of
structural connectivity and cerebrovascular parameters to functional magnetic resonance
imaging signals in mice at rest and during sensory paw stimulation. J. Cereb. Blood Flow
Metab. 37, 2368–2382. doi:10.1177/0271678X16666292
Sethi, S.S., Zerbi, V., Wenderoth, N., Fornito, A., Fulcher, B.D., 2017. Structural connectome
topology relates to regional BOLD signal dynamics in the mouse brain. Chaos 27, 047405.
doi:10.1063/1.4979281
Sforazzini, F., Bertero, A., Dodero, L., David, G., Galbusera, A., Scattoni, M.L., Pasqualetti, M.,
Gozzi, A., 2016. Altered functional connectivity networks in acallosal and socially impaired
BTBR mice. Brain Struct. Funct. 221, 941–954. doi:10.1007/s00429-014-0948-9
Sforazzini, F., Schwarz, A.J., Galbusera, A., Bifone, A., Gozzi, A., 2014. Distributed BOLD and
CBV-weighted resting-state networks in the mouse brain. Neuroimage 87, 403–415.
doi:10.1016/j.neuroimage.2013.09.050
Shah, D., Blockx, I., Guns, P.-J., De Deyn, P.P., Van Dam, D., Jonckers, E., Delgado Y
.CC-BY-ND 4.0 International licenseIt is made available under a was not peer-reviewed) is the author/funder, who has granted bioRxiv a license to display the preprint in perpetuity.
The copyright holder for this preprint (which. http://dx.doi.org/10.1101/541060doi: bioRxiv preprint first posted online Feb. 8, 2019;

Palacios, R., Verhoye, M., Van der Linden, A., 2015. Acute modulation of the cholinergic
system in the mouse brain detected by pharmacological resting-state functional MRI.
Neuroimage 109, 151–159. doi:10.1016/j.neuroimage.2015.01.009
Shah, D., Blockx, I., Keliris, G.A., Kara, F., Jonckers, E., Verhoye, M., Van der Linden, A.,
2016a. Cholinergic and serotonergic modulations differentially affect large-scale functional
networks in the mouse brain. Brain Struct. Funct. 221, 3067–3079. doi:10.1007/s00429-
015-1087-7
Shah, D., Deleye, S., Verhoye, M., Staelens, S., Van der Linden, A., 2016b. Resting-state
functional MRI and [18F]-FDG PET demonstrate differences in neuronal activity between
commonly used mouse strains. Neuroimage 125, 571–577.
doi:10.1016/j.neuroimage.2015.10.073
Shah, D., Jonckers, E., Praet, J., Vanhoutte, G., Delgado Y Palacios, R., Bigot, C., D’Souza,
D.V., Verhoye, M., Van der Linden, A., 2013. Resting state FMRI reveals diminished
functional connectivity in a mouse model of amyloidosis. PLoS ONE 8, e84241.
doi:10.1371/journal.pone.0084241
Shah, D., Praet, J., Latif Hernandez, A., Höfling, C., Anckaerts, C., Bard, F., Morawski, M.,
Detrez, J.R., Prinsen, E., Villa, A., De Vos, W.H., Maggi, A., D’Hooge, R., Balschun, D.,
Rossner, S., Verhoye, M., Van der Linden, A., 2016c. Early pathologic amyloid induces
hypersynchrony of BOLD resting-state networks in transgenic mice and provides an early
therapeutic window before amyloid plaque deposition. Alzheimers Dement 12, 964–976.
doi:10.1016/j.jalz.2016.03.010
Stafford, J.M., Jarrett, B.R., Miranda-Dominguez, O., Mills, B.D., Cain, N., Mihalas, S., Lahvis,
G.P., Lattal, K.M., Mitchell, S.H., David, S.V., Fryer, J.D., Nigg, J.T., Fair, D.A., 2014.
Large-scale topology and the default mode network in the mouse connectome. Proc Natl
Acad Sci USA 111, 18745–18750. doi:10.1073/pnas.1404346111
Upadhyay, J., Baker, S.J., Chandran, P., Miller, L., Lee, Y., Marek, G.J., Sakoglu, U., Chin, C.-
L., Luo, F., Fox, G.B., Day, M., 2011. Default-mode-like network activation in awake
rodents. PLoS ONE 6, e27839. doi:10.1371/journal.pone.0027839
Wiesmann, M., Zerbi, V., Jansen, D., Haast, R., Lütjohann, D., Broersen, L.M., Heerschap, A.,
Kiliaan, A.J., 2016. A Dietary Treatment Improves Cerebral Blood Flow and Brain
Connectivity in Aging apoE4 Mice. Neural Plast. 2016, 6846721.
doi:10.1155/2016/6846721
Wu, T., Grandjean, J., Bosshard, S.C., Rudin, M., Reutens, D., Jiang, T., 2017. Altered regional
connectivity reflecting effects of different anaesthesia protocols in the mouse brain.
.CC-BY-ND 4.0 International licenseIt is made available under a was not peer-reviewed) is the author/funder, who has granted bioRxiv a license to display the preprint in perpetuity.
The copyright holder for this preprint (which. http://dx.doi.org/10.1101/541060doi: bioRxiv preprint first posted online Feb. 8, 2019;
Neuroimage 149, 190–199. doi:10.1016/j.neuroimage.2017.01.074
Yoshida, K., Mimura, Y., Ishihara, R., Nishida, H., Komaki, Y., Minakuchi, T., Tsurugizawa, T.,
Mimura, M., Okano, H., Tanaka, K.F., Takata, N., 2016. Physiological effects of a
habituation procedure for functional MRI in awake mice using a cryogenic radiofrequency
probe. J. Neurosci. Methods 274, 38–48. doi:10.1016/j.jneumeth.2016.09.013
Zerbi, V., Grandjean, J., Rudin, M., Wenderoth, N., 2015. Mapping the mouse brain with rs-
fMRI: An optimized pipeline for functional network identification. Neuroimage 123, 11–21.
doi:10.1016/j.neuroimage.2015.07.090
Zerbi, V., Ielacqua, G.D., Markicevic, M., Haberl, M.G., Ellisman, M.H., A-Bhaskaran, A., Frick,
A., Rudin, M., Wenderoth, N., 2018. Dysfunctional Autism Risk Genes Cause Circuit-
Specific Connectivity Deficits With Distinct Developmental Trajectories. Cereb. Cortex 28,
2495–2506. doi:10.1093/cercor/bhy046
Zerbi, V., Wiesmann, M., Emmerzaal, T.L., Jansen, D., Van Beek, M., Mutsaers, M.P.C.,
Beckmann, C.F., Heerschap, A., Kiliaan, A.J., 2014. Resting-state functional connectivity
changes in aging apoE4 and apoE-KO mice. J. Neurosci. 34, 13963–13975.
doi:10.1523/JNEUROSCI.0684-14.2014
Zhan, Y., Paolicelli, R.C., Sforazzini, F., Weinhard, L., Bolasco, G., Pagani, F., Vyssotski, A.L.,
Bifone, A., Gozzi, A., Ragozzino, D., Gross, C.T., 2014. Deficient neuron-microglia
signaling results in impaired functional brain connectivity and social behavior. Nat.
Neurosci. 17, 400–406. doi:10.1038/nn.3641
Zuo, X.-N., Xing, X.-X., 2014. Test-retest reliabilities of resting-state FMRI measurements in
human brain functional connectomics: a systems neuroscience perspective. Neurosci.
Biobehav. Rev. 45, 100–118. doi:10.1016/j.neubiorev.2014.05.009
.CC-BY-ND 4.0 International licenseIt is made available under a was not peer-reviewed) is the author/funder, who has granted bioRxiv a license to display the preprint in perpetuity.
The copyright holder for this preprint (which. http://dx.doi.org/10.1101/541060doi: bioRxiv preprint first posted online Feb. 8, 2019;
Meltem KARATAŞ
Analyse longitudinale des réseaux cérébraux par Imagerie de Résonance
Magnétique (IRM) dans un modèle murin de dépression induite par la douleur
neuropathique
Résumé
Les douleurs chroniques développent souvent des troubles de l’anxiété et des états dépressifs. Malgré des recherches cliniques considérables, les mécanismes sous-jacents à cette comorbidité restent inconnus. Nous avons mené une étude d'imagerie non-invasive, par Imagerie de Résonance Magnétique (IRM), pour étudier les changements dans la connectivité structurelle et fonctionnelle dans un modèle murin de dépression induite par la douleur neuropathique. Nous avons utilisé deux méthodes d'IRM pour étudier les voies fonctionnelles de communication (en utilisant l’imagerie fonctionnelle de repos-IRMfr) ainsi que leurs substrats microstructuraux (imagerie du tenseur de diffusion) de manière longitudinale. Les résultats obtenus dans le cadre de ce projet démontrent des modifications structurels et fonctionnels remarquables des réseaux cérébraux suite à l'induction de la douleur neuropathique et à l'émergence de comportements dépressifs. En combinant un modèle animal pertinent et l’IRM cérébrale in-vivo nous avons identifié la signature de la dépression induite par la douleur et son évaluation longitudinale sur la connectivité cérébrale, impliquant des altérations dans le cadre des circuits de la récompense, avec un impact majeur sur la connectivité des deux centres : le CCA et l’ATV. Les résultats principales d’IRLfr montrent une modification considérable dans les réseaux englobant le MPD et le circuit de récompense, qui sont impliqués à la fois dans les pathologies de la douleur chronique et de la dépression. Il est maintenant nécessaire d’étudier la relation causale entre la dépression induite par la douleur et ses changements fonctionnels qui font partie de la perspective long-termes de ce projet.
Mots-clés : douleur neuropathique, dépression, modèle murin, IRM, connectivité cérébrale
Abstract
Chronic pain conditions frequently lead to anxiety and depressive disorders. Despite considerable clinical research, the mechanisms underlying this comorbidity remain elusive. We conducted a non-invasive brain imaging study to investigate changes in structural and functional connectivity in a mouse model of neuropathic pain-induced depression. We employed two methods of magnetic resonance imaging (MRI) to investigate functional communication pathways (using resting state functional MRI-rs-fMRI) as well as their microstructural substrates (diffusion MRI) in longitudinal manner. Brain networks demonstrate remarkable structural and functional modifications following the induction of neuropathic pain and the emergence of depressive phenotype. Combining a relevant preclinical model and in vivo brain MRI, we identified a brain connectivity signature of pain-induced depression and its evolution over time, involving alterations in reward circuits, with a major impact of the two centers: ACA and VTA. The main results of functional imaging reveal considerable changes in the networks encompassing the reward circuit and DMN, which are known to be involved in both chronic pain pathologies and major depression. The long-term perspective of this project is to investigate the causal relationship between pain and depression, reaching a mechanistic explanation for the comorbidity.
Keywords: neuropathic pain, depression, mouse model, MRI, brain connectivity
Related Documents