BioMed Central Page 1 of 14 (page number not for citation purposes) BMC Ecology Open Access Research article Longevity and growth of Acacia tortilis; insights from 14 C content and anatomy of wood Gidske L Andersen* and Knut Krzywinski Address: Department of Biology, University of Bergen, P.O.Box 7800, N-5020 Bergen, Norway Email: Gidske L Andersen* - [email protected]; Knut Krzywinski - [email protected] * Corresponding author Abstract Background: Acacia tortilis is a keystone species across arid ecosystems in Africa and the Middle East. Yet, its life-history, longevity and growth are poorly known, and consequently ongoing changes in tree populations cannot be managed in an appropriate manner. In other arid areas parenchymatic bands marking growth zones in the wood have made dendrochronological studies possible. The possibilities for using pre- and post-bomb 14 C content in wood samples along with the presence of narrow marginal parenchymatic bands in the wood is therefore tested to gain further insight into the age, growth and growth conditions of A. tortilis in the hyper-arid Eastern Desert of Egypt. Results: Based on age scenarios and the Gompertz growth equation, the age of trees studied seems to be from 200 up to 650 years. Annual radial growth estimated from calibrated dates based on the post-bomb 14 C content of samples is up to 2.4 mm, but varies both spatially and temporally. Parenchymatic bands are not formed regularly. The correlation in band pattern among trees is poor, both among and within sites. Conclusion: The post-bomb 14 C content of A. tortilis wood gives valuable information on tree growth and is required to assess the age scenario approach applied here. This approach indicates high longevities and slow growth of trees. Special management measures should therefore be taken at sites where the trend in tree population size is negative. The possibilities for dendrochronological studies based on A. tortilis from the Eastern Desert are poor. However, marginal parenchymatic bands can give insight into fine scale variation in growth conditions and the past management of trees. Background Acacia tortilis is a keystone species growing across arid eco- systems in Africa and the Middle East, from moist savan- nas to hyper-arid deserts. It is of importance for people and their domesticated animals, improves soil fertility and increases biodiversity [1-4]. It is well adapted to dis- turbances such as drought, fire, browsing and pollarding. In spite of its ecological importance and wide distribu- tion, knowledge about its long-term dynamics, including essential life historical characteristics such as longevity and growth is poor. This is also true of other Acacia species in this region and of arid land trees in general [5-9]. From a population dynamics perspective and seen in relation to ongoing vegetation changes in arid lands, this knowledge is essential to develop sustainable management strategies. Published: 15 June 2007 BMC Ecology 2007, 7:4 doi:10.1186/1472-6785-7-4 Received: 8 October 2006 Accepted: 15 June 2007 This article is available from: http://www.biomedcentral.com/1472-6785/7/4 © 2007 Andersen and Krzywinski; licensee BioMed Central Ltd. This is an Open Access article distributed under the terms of the Creative Commons Attribution License (http://creativecommons.org/licenses/by/2.0 ), which permits unrestricted use, distribution, and reproduction in any medium, provided the original work is properly cited.

Welcome message from author
This document is posted to help you gain knowledge. Please leave a comment to let me know what you think about it! Share it to your friends and learn new things together.
Transcript

BioMed CentralBMC Ecology
ss
Open AcceResearch articleLongevity and growth of Acacia tortilis; insights from 14C content and anatomy of woodGidske L Andersen* and Knut KrzywinskiAddress: Department of Biology, University of Bergen, P.O.Box 7800, N-5020 Bergen, Norway
Email: Gidske L Andersen* - [email protected]; Knut Krzywinski - [email protected]
* Corresponding author
AbstractBackground: Acacia tortilis is a keystone species across arid ecosystems in Africa and the MiddleEast. Yet, its life-history, longevity and growth are poorly known, and consequently ongoingchanges in tree populations cannot be managed in an appropriate manner. In other arid areasparenchymatic bands marking growth zones in the wood have made dendrochronological studiespossible. The possibilities for using pre- and post-bomb 14C content in wood samples along withthe presence of narrow marginal parenchymatic bands in the wood is therefore tested to gainfurther insight into the age, growth and growth conditions of A. tortilis in the hyper-arid EasternDesert of Egypt.
Results: Based on age scenarios and the Gompertz growth equation, the age of trees studiedseems to be from 200 up to 650 years. Annual radial growth estimated from calibrated dates basedon the post-bomb 14C content of samples is up to 2.4 mm, but varies both spatially and temporally.Parenchymatic bands are not formed regularly. The correlation in band pattern among trees ispoor, both among and within sites.
Conclusion: The post-bomb 14C content of A. tortilis wood gives valuable information on treegrowth and is required to assess the age scenario approach applied here. This approach indicateshigh longevities and slow growth of trees. Special management measures should therefore be takenat sites where the trend in tree population size is negative. The possibilities fordendrochronological studies based on A. tortilis from the Eastern Desert are poor. However,marginal parenchymatic bands can give insight into fine scale variation in growth conditions and thepast management of trees.
BackgroundAcacia tortilis is a keystone species growing across arid eco-systems in Africa and the Middle East, from moist savan-nas to hyper-arid deserts. It is of importance for peopleand their domesticated animals, improves soil fertilityand increases biodiversity [1-4]. It is well adapted to dis-turbances such as drought, fire, browsing and pollarding.In spite of its ecological importance and wide distribu-
tion, knowledge about its long-term dynamics, includingessential life historical characteristics such as longevityand growth is poor. This is also true of other Acacia speciesin this region and of arid land trees in general [5-9]. Froma population dynamics perspective and seen in relation toongoing vegetation changes in arid lands, this knowledgeis essential to develop sustainable management strategies.
Published: 15 June 2007
BMC Ecology 2007, 7:4 doi:10.1186/1472-6785-7-4
Received: 8 October 2006Accepted: 15 June 2007
This article is available from: http://www.biomedcentral.com/1472-6785/7/4
© 2007 Andersen and Krzywinski; licensee BioMed Central Ltd. This is an Open Access article distributed under the terms of the Creative Commons Attribution License (http://creativecommons.org/licenses/by/2.0), which permits unrestricted use, distribution, and reproduction in any medium, provided the original work is properly cited.
Page 1 of 14(page number not for citation purposes)
BMC Ecology 2007, 7:4 http://www.biomedcentral.com/1472-6785/7/4
In the area considered here, the hyper-arid Eastern Desertof Egypt (ED), no studies have attempted to estimate thelongevity and growth of A. tortilis. Local nomads say thattrees grow slowly and date to "Roman" times, i.e. the pre-islamic period [1]. This view is rendered credible by char-acteristics such as its great ability to resprout and itsinvestment in defensive characters such as spines anddense, hard wood impregnated with resins and crystals.Slow growth is indicated by the results of a change analy-sis based on historical imagery (1965) and field observa-tions (2003) [10]. Seen from a life historical perspectivesuch characteristics are often associated with great longev-ity [11,12].
If trees are old, one might wonder if they are relicts fromperiods when moisture conditions were more favourablefor recruitment. Determining the age of tropical and sub-tropical trees is, however, problematic. In temperate cli-mates annual growth rings are formed in response toclimatic seasonality. Anatomically, these rings are easilydetectable because of distinct seasonal differencesbetween early- and late-wood. In the tropics and sub-trop-ics, seasonality is less distinct and growth rings, if present,are of a different anatomical type which can be more dif-ficult to detect [13]. Nevertheless, annual growth rings areknown from a substantial number of tropical species [14].
In A. tortilis a narrow marginal parenchymatic band asso-ciated with crystalliferous calcium oxalate chains ispresent in the wood [7,15], and according to these studiesthey are formed coincidentally with a temporary pause ingrowth. Such bands are also found in A. tortilis wood fromthe ED. If these bands are formed regularly, they are inter-nal time markers that can facilitate age determination [5].If regularity is annual, standard dendrochronologicalmethods might be applied to A. tortilis [7,16]. However,even if bands don't provide any chronological informa-tion, correlations between individual band patterns are ofinterest because they mark times when conditions did notpermit growth. As such, patterns of bands may provideinsight into the spatial variability of growth conditionsand consequently into the factors affecting the growth oftrees.
Another method providing insight into tree age andgrowth is radiocarbon dating. 14C content is a temporalmarker in wood and has been successfully used for datingof wood and to confirm ages or time intervals estimatedfrom ring counts. For wood older than AD 1950, conven-tional radiocarbon ages estimated as years Before Present(0 BP = AD 1950) are calculated on the basis of the Libbyhalf-life time (5568 years) [17]. The radiocarbon age iscalibrated to calendar date (BC/AD) based on estimatesfrom dendrochronologically dated tree ring samples [18].Because the level of 14C in the atmosphere has not been
constant over time, there are variations in the calibrationcurve, including a number of plateaus. The wiggly plateauperiod between 1650 and 1950 makes tree age estimationdifficult since the 14C content of a sample from this periodsuggests more than one calendar date.
After 1950 the level of14C in the atmosphere rose to veryhigh levels as a result of the Cold War nuclear bomb test-ing. After a few years of exceptionally rapid increase fromthe late 50s, this post-bomb 14C signature curve reached apeak in 1964, thereafter the ban on nuclear bomb testinghas caused a slow decrease up to present [19,20]. Thispost-bomb 14C makes accurate dating possible and hasbeen successfully used to determine the annual characterof rings in tropical trees [14,21].
In the present study we test the possibility of using pre-and post-bomb 14C in wood samples along with the pres-ence of narrow marginal parenchymatic bands in thewood to gain further insight into the age, growth andgrowth conditions of A. tortilis in the hyper-arid ED.
Study areaMaterial has been collected in the ED (Figs. 1 and 2) fromindividuals of Acacia tortilis (Forssk.) Hayne [22]. Twosubspecies occur in the ED and those sampled here aressp. raddiana [22]. However, we refer to A. tortilis at thespecies level because gradual morphological transitionsare found and desert dwellers shape the very morphologyof trees (see below).
A. tortilis is the dominant tree species in the mountainouslandscape of the ED and is confined to seasonally dryriver-valleys, wadis, where soil moisture conditions per-mits its establishment and continued growth. Rainfall (<30 mm/year; [23]) is temporally variable, rare and spa-tially scattered. Moisture conditions vary among individ-ual catchments and drainage systems. Surface water andsoil moisture in the upper part of the soil is highly unreli-able and trees and other perennial vegetation seem there-fore to rely mainly upon deeper and permanent soilmoisture during the long dry periods between rains[24,25].
Except for water, important factors influencing treegrowth are branch cutting, i.e. pollarding, and extensivebrowsing by wild and domesticated animals. Both arewidespread traditional management strategies controlledby the pastoralists, and are securely documented in the EDat least back to ca. 3000 BP [2]. Pollarding is performedon all mature trees and contributes not only to the charac-teristic growth form of A. tortilis, but may even stopgrowth temporarily. Browsing significantly retardsgrowth, particularly in the early stages of a trees' life [26].
Page 2 of 14(page number not for citation purposes)

BMC Ecology 2007, 7:4 http://www.biomedcentral.com/1472-6785/7/4
Results14C analysesAll the oldest wood samples (Fig. 3) have a 14C contenttoo high to give a unique calibrated date (cf. Background,Fig 4). The wood in most samples was formed between1650 and 1950. However, for samples with 14C agesgreater than 200 years, it is possible that the wood wasformed as far back as the 16th century.
Calibrated dates and subsequent growth rates for hyperac-tive (i.e. post-bomb levels) samples are reported in Table1. For a few samples calibrated dates are incompatible orambiguous. For Umm Dihaysi a, sample I may be contam-inated by older material and is therefore disregarded here.Calibrations of samples II and III give a set of two similardates. The most likely dates are 1998 (II) and 1956 (III),when smoothing, combination of suggested dates and
Study areaFigure 1Study area. Sites from which cores were sampled, seen in relation to their catchments and east-west water divide. A Landsat TM image is displayed in the background.
Page 3 of 14(page number not for citation purposes)

BMC Ecology 2007, 7:4 http://www.biomedcentral.com/1472-6785/7/4
subsequent growth rates are taken into consideration. ForJimal a, samples III and IV have about the same possiblerange (ca. 1991–1993). Since sample IV is older than III,we use 1991 (IV) and 1993 (III) to estimate growth rates.For sample V two dates are possible (pre- or post- 1964),both giving reasonable growth rates, but 1963 is less likelythan 1970.
The calibrated dates of hyperactive samples show thatgrowth after 1950 varies both temporally and spatially(Table 1). Based on the oldest hyperactive calibrateddates, the overall growth is 8 times faster at Jimal than atHulus Upper. Great variation in growth is evident withinall cores where more than one sample is dated.
There is no indication in the material that bands can betaken as regular time markers within the core, and bandscannot therefore be used for dating trees (Adjusted R2:0.04, F-statistic: 1.43 on 1 and 9 DF, p-value: 0.26). ForJimal a there is an apparently significant relationshipbetween the number of bands and the time period inwhich they were generated (Adjusted R2: 0.99, F-statistic:449.4 on 1 and 3 DF, p-value < 0.001), suggesting thatone band was formed every 2.2 years. However, data arefar too few to generalize. This relationship is rejected since
it would suggest an age of 35 years (15 bands) and conse-quently that the inner sample (VI) is hyperactive, which isnot the case (Fig. 3).
Age scenariosAge scenarios (see Methods) used to approximate the ageof trees are presented in Table 2 and Fig. 5.
For Umm Dihaysi a three scenarios are plausible, suggest-ing an establishment date around either 1700 (ii), 1550(iii) or 1350 (iv). Except for the latter, the same approxi-mate dates are likely for Muwaylhah b (scenarios ii and iii),but the fit is best for scenario iii. For Hulus Upper b mostof the scenarios propose too fast growth over a continuousperiod compared to overall recent growth. The tworemaining scenarios (i and ii) again suggest establishmenteither around 1700 or 1550; the oldest scenario is, how-ever, in better agreement with recent growth, and theasymptotic value shows greater potential for continuedgrowth. For Jimal a four of the scenarios seem impossible:scenario iii, viii and ix because of high asymptotic value(the largest tree observed in this part of the ED has aradius of 444 mm), and scenario iv because of the misfitbetween the calibrated age of the oldest sample in the sce-nario and its predicted age. The growth equation could
Sites studied and trees sampledFigure 2Sites studied and trees sampled. Sampled individuals are encircled on imagery from the CORONA satellite (KH-4B, 1971), where trees are seen as black dots. Red symbols encircle individuals from which increment cores were dated. White symbols encircle other sampled individuals. Arrows indicate direction of water run-off. Letters refer to core name; named from up- to down- stream.
Page 4 of 14(page number not for citation purposes)

BMC Ecology 2007, 7:4 http://www.biomedcentral.com/1472-6785/7/4
not be fitted to scenario v and x. Of the remaining scenar-ios (i, ii, vi and vii; establishment early 1900), all predicta very abrupt cessation in growth. Consequently, we alsoconsidered 2-sigma ranges for sample VI which suggesteda possibility for establishment between 1830 and 1880(Fig. 4). Therefore we fitted additional scenarios, based on25-year interval dates from 1800 to 1900 for the oldestsample (Fig. 5; Jimal a, grey curves), on this basis we sug-gest a likely establishment for Jimal a early 1800.
Growth conditions and band patternsDistances between bands vary among cores (Fig. 6). AtHulus Upper there is generally a short distance betweenbands (mean 1.7 – 3.6 mm). The same is seen in some ofthe Muwaylhah cores. A few cores have long distancesbetween bands, e.g. Sukkari a, Nuqrus b and Jimal a. Severalcores have a few bands that are far apart; often near thecore pith. In some cores, however, bands might have beenoverlooked in certain parts because of disturbing knots(Jimal c, Nuqrus b, Sukkari a and Muwaylhah a) or becauseof slight and patchy wood decay (Jimal a and b; Nuqrus aand Muwaylhah a and e).
Correlations (expressed as t-values) between band pat-terns of cores within sites are not greater than thoseamong sites (t = -1.02, df = 34.996, p-value = 0.84). Cor-relation coefficients are generally low, with the mean forboth groups around 0. Within sites only two sets of coreswere significantly positively correlated (p < 0.05; Sukkari a& b; r = 0.32; Jimal c & b; r = 0.46), while among sites sixsets of cores were significantly positively correlated (p <0.05): Umm Dihaysi a &Sukkari b (r = 0.19), Hulus Upper c& Abu Ghusun a (r = 0.23), Nuqrus a & Jimal a (r = 0.52),Sukkari b & Nuqrus a (r = 0.26), Abu Ghusun a & Jimal b (r= 0.30) and Muwaylhah b &Umm Dihaysi a (r = 0.23).
The low correlations within sites suggest that factors oper-ating at a local level influence growth conditions andband formation. We tried to remove these local effectswithin sites by correlating only shorter segments of cores,testing also for shifts of segments in either direction alongthe core to account for missing/false bands. As expected,within sites the proportion of significantly correlated seg-ments at p < 0.05 decreases with longer segment lengths(mean 10 bands: 0.39; 15 bands: 0.32; 20 bands: 0.31)
Sketch of dated coresFigure 3Sketch of dated cores. Red areas indicate sample location. Black lines are parenchymatic bands (appear as black areas when several rings are close together). The white part of the core is sapwood, the grey is heartwood. Dashed lines indicate a gap in the core.
Page 5 of 14(page number not for citation purposes)

BMC Ecology 2007, 7:4 http://www.biomedcentral.com/1472-6785/7/4
however, the difference is insignificant (Anova: Pr (>F) =0.54). Also among sites the differences caused by segmentlengths are insignificant (mean 10 bands: 0.36; 15 bands:0.38; 20 bands: 0.39; Anova: Pr (>F) = 0.88). Further, theproportion of significantly correlated segments withinsites at segment length 10 bands is not significantly higherthan among sites (Anova: Pr (>F) = 0.59). This indicatesthat growth conditions are as variable within sites asamong sites at time scales down to the time period repre-sented by the shortest segment lengths (10 bands).
More than 50% of the segments tested (length 10) are sig-nificantly positively correlated for the following sets ofcores (p < 0.05); within sites: Hulus Upper c & b, Jimal c&b, Sukkari b &a and Muwaylhah b &d and among sites:Umm Dihaysi a &Sukkari b, Umm Dihaysi a &Muwaylhah d,
Hulus U b &Jimal b, Abu Ghusun a &Jimal b, Abu Ghusun a&Jimal c.
DiscussionOur results suggest that A. tortilis in the ED grows slowlyand that some of the individuals studied could date backto AD 1550, one individual even as far back as AD 1350.The wiggly plateau in the calibration curve between 1650and 1950 makes accurate estimates of tree longevity basedon radiocarbon measurements difficult. We haveattempted to obtain probable age estimates by fitting agescenarios that exploit all available and compatible growthrate and date information to the sigmoid Gompertzgrowth model. This model describes well the long-termtrend in tree growth [27]. Growth rate is represented by abell-shaped curve; i.e. growth rate increases at the begin-
Probability distributions of calibrated dates for samples older than AD 1950Figure 4Probability distributions of calibrated dates for samples older than AD 1950. The radiocarbon age gives ambiguous calibrated dates for all samples; i.e. wood is formed in the period between 1650 and 1950. Samples with conventional radiocar-bon ages of more than 200 years might have been formed as far back as the 16th century. Roman numerals refer to locations of samples in the core (Fig. 3). Horizontal lines below probability distributions represent the 1 (upper) and 2 sigma ranges of cali-brated dates.
Page 6 of 14(page number not for citation purposes)

BMC Ecology 2007, 7:4 http://www.biomedcentral.com/1472-6785/7/4
ning and decreases later in the lifetime of the tree. Weapplied this model because it represents the growth trendin A. tortilis better than a linear model of constant radialgrowth; a recent overall growth rate of about 0.2 mm/yrfor Hulus Upper b (Table 1) would imply an age of morethan a thousand years for the oldest sample (IV), but itsradiocarbon age contradicts this (Fig. 4). We haveassumed that there are underlying limits to long-term var-iation in growth rate; it is not expected to be persistentlyhigh, and the bell-shaped curve should therefore have ashallow slope with a low max, rather than a steep slopewith a high max. This assumption implies that the long-term environmental factors are approximately constantand they generate the characteristic water-limited condi-tions of desert environments. However, short term varia-bility in growth is expected and not in conflict with long-term trends of the growth curve model [27].
Since only a few points are used in the non-linear regres-sion and the location of core pith was estimated ratherthan observed, the age scenarios are vulnerable to errorsand variations in input data (midpoint vs. other esti-mates; 1 vs. 2 sigma ranges). Evidently, estimates of age donot claim to be accurate, but should rather be taken asindications of possible, approximate age. This approxi-mate age will, however, represent an underestimatebecause we have considered neither the time taken togrow from seedling to sampling height (50 cm) nor theeffect of growth suppression due to browsing and/ordrought on saplings. These factors probably add decadesto tree ages [26].
An obvious question is how our estimates of longevityand growth relate to other estimates from trees growing insimilar conditions. Generally, long-term data on individ-ual trees and therefore direct age estimates are lacking.
Indirect methods such as those based on mortality rates orsize-age relationships from periodic size increment meas-urements avoid the problem of long-term data access, butsuch estimates may be very inaccurate [28]. Nevertheless,the conventional wisdom that growth is slow and life islong in perennial desert plants seems to be supported byincreasing evidence [29]. Some tree species have lifespansof more than a thousand years [30,31]. High estimates(>1000 yr) have also been reported for savanna trees [6],but newer research based on 14C dating estimates the ageof some A. nigrescens and A. nilotica individuals to be lessthan 100 years [32]. Longevity estimates of greater than100 years are cast in the form of general statements (150y, Serengeti, [33]), based on mortality rates (>> 100 y,Mojave desert, [29]) and on repeat photography (> 100 y,Arizona, [34]). However, low age estimates of only about40 years have also been proposed [7,8]. Gourlay [7] con-cluded that acacias are far younger than commonlybelieved; but the majority of the trees studied grew underan annual rainfall regime, under protected conditions (inthe botanical garden, Harare, Zimbabwe), and perhapsunder the influence of underground water seepage fromnearby irrigated areas. This estimate should therefore notbe generalized for acacias as such. Ward and Rohner [8],studying A. raddiana in the Negev, Israel, based their esti-mate on a size-age relationship from the Serengeti. Newerdata from the Negev show that large trees are more prob-ably close to 200 years old [35]. This estimate is based onmean incremental trunk circumference growth, measuredover two consecutive 1-year periods. Rain conditions var-ied greatly for the two periods, and reported statistics sug-gest annual radial growth of 0.1 mm (dry year) and 2.6mm (year with rainfall) for a middle sized tree (100 cmcircumference). Other growth rate estimates for acaciasgrowing in the arid tropics vary from 2 mm/yr in SouthernTurkana (mean annual rainfall: 300 mm) to 14 mm/yr in
Table 1: Dating results for hyperactive samples.
Core Sample Lab. Ref. F14C +/- δ13C Calibrated date Intervening GR Overall GR
Umm Dihaysi a I1 TUa-5425 1.045 0.004 -25.2 - -Umm Dihaysi a II TUa-5426 1.080 0.005 -25.6 1998.1 (1956.7) 1.13 (0.13)Umm Dihaysi a III TUa-5427 1.090 0.005 -24.2 1956.5 (1996.2/1997.4) 0.29 (6.18/15.60) 0.38Muwaylhah b I TUa-5431 1.130 0.004 -28.8 1993.9 0.63Muwaylhah b II TUa-5432 1.158 0.005 -28.4 1990.2 1.93Muwaylhah b III TUa-5433 1.303 0.005 -27.0 1979.3 0.77 0.89Hulus Upper I TUa-5428 1.381 0.006 -24.3 1975.5 0.23 0.23Jimal a I TUa-5420 1.082 0.005 -27.4 1998.2 0.52Jimal a II TUa-5421 1.107 0.005 -25.5 1996.8 0.66Jimal a III1 TUa-5422 1.143 0.005 -26.7 1992.8 2.37Jimal a IV1 TUa-5423 1.141 0.005 -27.4 1991.3 2.39Jimal a V TUa-5424 1.514 0.007 -25.7 1971.0 (1963.0) 2.00 (1.44) 1.87
14C content (F14C, including measurement error (+/-) and fractionation values (δ13C)), calibrated dates (1 sigma midpoint) and estimated growth rates (GR in mm/yr) are summarised. The intervening GR is estimated, based on the period between the sample under consideration and the next youngest sample. Overall GR is estimated based on the period between the oldest date and sample date (2003).1 For ambiguous dates refer to the text for further explanation.
Page 7 of 14(page number not for citation purposes)
BMC Ecology 2007, 7:4 http://www.biomedcentral.com/1472-6785/7/4
Serengeti (mean annual rainfall: 500 mm; [7,26] and ref-erences therein). Compared to these estimates and takinginto account the hyper-arid conditions in the ED (rainfall< 30 mm/yr), our estimates of both growth (0.2 to 2.4mm/yr) and longevity (200 – 650 years) lie within theranges cited above.
Narrow, parenchymatic bands like those present in all ourA. tortilis wood cores have been successfully used as timemarkers for dendrochronological dating and in climato-logical studies elsewhere [7,16], but such methods do notseem to be applicable to A. tortilis wood from the ED.Bands are not formed regularly, nor do the band patternsof trees correlate with each other, either between or withinsites.
Formation of bands is considered to be coincidental withcambial dormancy [15,36]. Conditions that retard or
interrupt growth can be regional, caused by climatic fac-tors (e.g. temperature, soil moisture) and/or local, causedby factors operating even on individual trees (e.g. disease,browsing and pollarding). Several authors found that amain factor inducing cambial dormancy is onset of waterstress [13-15,36]. Regularity in surface and shallow soilmoisture from floods or rainfall events is not expected inthe ED since rainfall is highly irregular. Consequently, reg-ular fluctuations in deeper soil moisture are not to beexpected. Temperature and phenology are also related tocambial activity and band formation [7,13,37]. In theNegev, Israel, low activity or dormancy in A. raddianatakes place during the cold winter [37]. In the ED toothere are seasonal temperature fluctuations [23], and onemight therefore expect regular band formation, in partic-ular at high altitudes with low winter temperatures such asat Hulus Upper. However, the lack of regular band forma-tion suggests that temperature in the ED does not produce
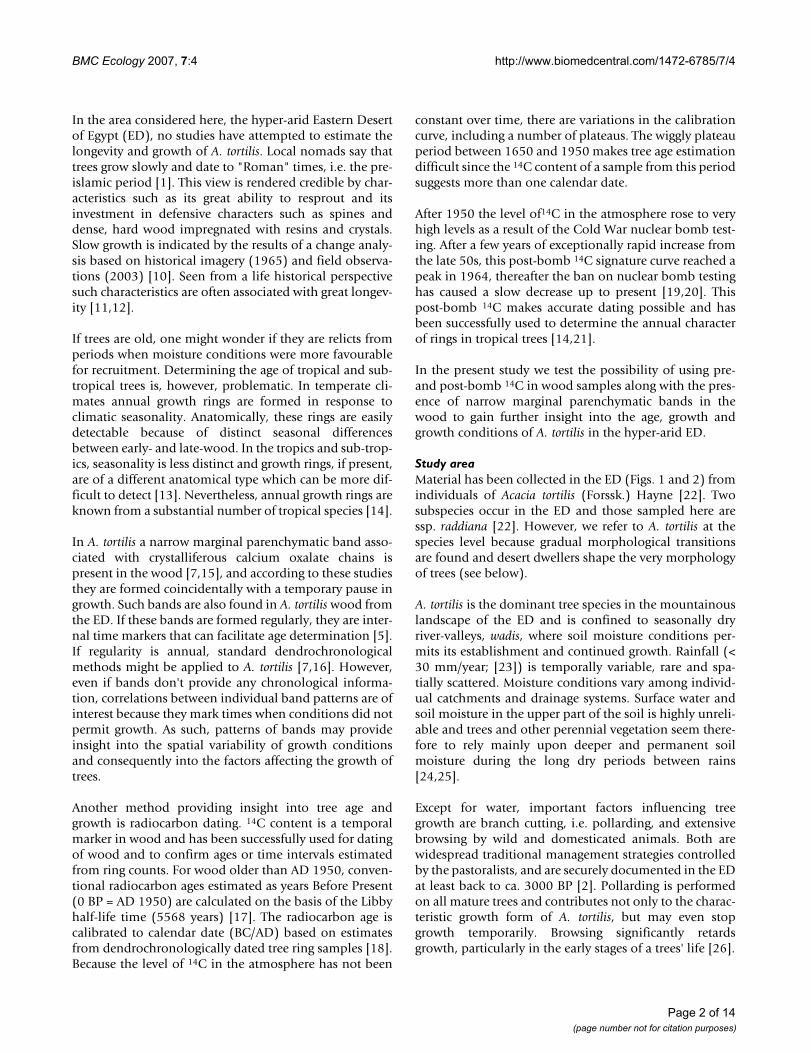
Table 2: Summary of age scenarios.
Core Scenario Date combinations Gompertz parameters Establ.
I II III IV V VI a b c
Umm Duhaysy a i - 1998.1 1956.5 1950 267.1 1.971 0.545 1948Umm Duhaysy a ii - 1998.1 1956.5 1780 282.4 2.027 0.016 1719Umm Duhaysy a iii - 1998.1 1956.5 1655 308.0 2.113 0.008 1528Umm Duhaysy a iv - 1998.1 1956.5 1545 342.0 2.218 0.005 1346Muwaylhah b i 1993.9 1990.2 1979.3 1865 1805 254.4 2.244 0.026 1772Muwaylhah b ii 1993.9 1990.2 1979.3 1865 1750 282.6 2.346 0.012 1680Muwaylhah b iii 1993.9 1990.2 1979.3 1865 1685 355.2 2.585 0.007 1561Muwaylhah b iv 1993.9 1990.2 1979.3 1710 1685 249.9 2.254 0.065 1673Hulus Upper b i* 1975.5 1940 1910 1770 253.8 1.638 0.021 1714Hulus Upper b ii* 1975.5 1940 1910 1680 261.1 1.667 0.012 1579Hulus Upper b iii 1975.5 1925 1805 1770 247.1 1.612 0.097 1759Hulus Upper b iv 1975.5 1925 1750 1680 247.1 1.612 0.049 1656Hulus Upper b v 1975.5 1855 1805 1770 247.2 1.612 0.097 1759Hulus Upper b vi 1975.5 1855 1805 1680 249.1 1.618 0.026 1634Hulus Upper b vii 1975.5 1855 1750 1680 247.1 1.612 0.049 1656Hulus Upper b viii 1975.5 1810 1805 1770 249.9 1.623 0.094 1758Hulus Upper b ix 1975.5 1810 1805 1680 250.0 1.624 0.027 1637Hulus Upper b x 1975.5 1810 1750 1680 247.5 1.613 0.048 1636Jimal a i 1998.2 1996.8 1992.8 1991.3 1971.0 1945 235.7 2.915 0.086 1939Jimal a ii** 1998.2 1996.8 1992.8 1991.3 1971.0 1930 252.1 3.024 0.051 1920Jimal a iii 1998.2 1996.8 1992.8 1991.3 1971.0 1770 4761.0 6.052 0.003 1661Jimal a iv 1998.2 1996.8 1992.8 1991.3 1971.0 1660 319.4 595.300 0.022 -Jimal a v 1998.2 1996.8 1992.8 1991.3 1971.0 1535 - - - -Jimal a via 1998.2 1996.8 1992.8 1991.3 1963.0 1945 227.8 2.937 0.134 1942Jimal a vii**a 1998.2 1996.8 1992.8 1991.3 1963.0 1930 234.4 2.923 0.069 1922Jimal a viiia 1998.2 1996.8 1992.8 1991.3 1963.0 1770 954.8 4.417 0.005 1683Jimal a ixa 1998.2 1996.8 1992.8 1991.3 1963.0 1660 719500.0 11.050 0.001 1448Jimal a xa 1998.2 1996.8 1992.8 1991.3 1963.0 1535 - - - -
Date combinations are based on calibrated calendar dates (midpoints of 1 sigma ranges) of 14C dated samples. Some scenarios use other estimates: '*' lower (sample III) and upper (sample II) 1 sigma range, '**' lower 1 sigma range (sample VI). 'a' indicates that the alternative date for sample V is used (see Table 1). Gompertz parameters in italics are not significant (p > 0.05). '-' indicates parameters that couldn't be estimated. Establishment date (Establ.) is defined as the year in which cumulative radial growth was at least 1 mm (Fig. 5).
Page 8 of 14(page number not for citation purposes)

BMC Ecology 2007, 7:4 http://www.biomedcentral.com/1472-6785/7/4
Page 9 of 14(page number not for citation purposes)
Plots of age scenariosFigure 5Plots of age scenarios. The upper panel shows cumulative growth, and the lower panel differential growth as modelled by the Gompertz equation. The oldest sample is by definition formed in year 0. Establishment is defined as the year in which cumulative radial growth is at least 1 mm, and will be negative compared to the oldest sample from the core in question. Sce-nario names refer to Table 2. Grey lines (for Jimal a) show scenarios based on 25-year interval dates within 2 sigma ranges for sample VI, i.e. 1800, 1825, 1850, 1875 and 1900. Note the different x-scale on Umm Dihaysi a.

BMC Ecology 2007, 7:4 http://www.biomedcentral.com/1472-6785/7/4
significant regular fluctuations or is not low enough toproduce a period of persistently low temperature duringthe winter [37].
That growth conditions vary between sites is indicated bythe lack of between site band correlations. However,within sites, regional factors are expected to influence alltrees in a similar manner, unless they are significantlymodified by local landscape heterogeneity. The coresshowing highest correlation (Sukkari a &b; Jimal c &b)seem to grow under homogenous conditions since thesetrees lie at short distances from one another and in a level,open part of the wadi (Fig. 2). For the same reasonshomogeneity also seems to be present at Muwaylhah, butthere correlation is poor between cores from neighbour-ing trees (a, b and c; d and e).
As for site homogeneity caused by soil moisture condi-tions, the root architecture of trees is important. Globally,rooting depth increases with aridity and roots can occupylarge volumes [24,38]. Neighbouring trees should there-
fore draw on similar resources. However, there are alsoindications that within arid zones a specific rainfallregime might cause one species to invest more either inside root growth if rainfall occurs regularly or in verticaltap root growth if rainfall is more variable [39]. In Israel ithas been reported that acacias are more dependent uponsurface water and have shallower roots than previouslybelieved [40,41]. It should also be taken into account thatlocal topography modifies water run-off and therefore soilmoisture conditions. This raises questions about the root-ing structure of individual trees at a specific site and evenat a specific location within a site. It also highlights theneed for more studies on the root-root and root-waterinteractions in arid ecosystems.
As for poor band correlation, factors making band identi-fication difficult must be acknowledged, as summarisedby Martin and Moss [26]. Taking this into account, a studyfrom Marsabit district, Kenya, concluded that growth lim-iting factors were highly variable and not simply related toclimate, and further that browsing and lopping were likely
Boxplot of distance between bandsFigure 6Boxplot of distance between bands. Distance between the narrow parenchymatic bands for all investigated cores.
Page 10 of 14(page number not for citation purposes)

BMC Ecology 2007, 7:4 http://www.biomedcentral.com/1472-6785/7/4
to be particularly significant (as referred in [26]). Trees arewidely managed also in the ED. Since our results too sug-gest that factors other than climate and soil moisture areimportant for band formation, browsing and pollardingin particular should be considered.
Pollarding is performed at irregular intervals, only onmature individuals and mainly to provide fodder fordomestic animals [2]; however, in some cases nomadspollard trees to "cure" individuals that show signs of with-ering. Browsing, on the other hand, is a continuous distur-bance. Its impact on mature trees is less dramatic sinceanimals are herded rapidly from one tree to the next, andtheir reach is limited to lower heights and to the marginsof the canopy. For saplings, however, the effect of brows-ing can be severe [26]. This suggests that browsing mightinfluence band formation in sapling stages, while pollard-ing could be a factor in mature stages.
Both browsing and pollarding remove green biomass. Insevere cases vital processes such as assimilation and tran-spiration might be retarded or stop completely. Wheneither of these processes is reduced, the water balance ofthe tree is probably disturbed, perhaps to such a degreethat bands form. While water stress and band formationare found to be simultaneous, the causal relationship andphysiological and anatomical processes have not beendescribed, and the function of the abundant calciumoxalate crystals in bands in Acacia is not properly under-stood (but see [36,42] and references there). This shouldbe further investigated to better understand band forma-tion in A. tortilis under hyper-arid conditions. A key ques-tion is whether band formation is always related tocambial dormancy, and how long periods without growthmight be. This is also of importance for describing growth,and consequently for making reliable age estimates ofdesert trees.
ConclusionThe post-bomb 14C content of A. tortilis wood provide val-uable information about tree growth and is required toassess the age scenario approach adopted here. Only sev-eral dated samples from one core can give more reliableage estimates for A. tortilis. It is evident that the approachpreliminarily explored in the present study needs to beextended to larger datasets. Also alternative methods deal-ing with whole populations should be further investigated[28].
The possibilities for dendrochronological studies basedon A. tortilis from the ED are poor. However, marginalparenchymatic bands can give insight into fine scale vari-ation in growth conditions and the past management oftrees. In order to exploit this properly, the mechanisms ofband formation should be further studied. Current results
also suggest looking further into root-root and root-waterinteractions. Based on band patterns, the growth of A. tor-tilis seems to vary greatly not only temporally but also spa-tially, suggesting that the landscape heterogeneity is muchgreater than often assumed for a seemingly homogenousand harsh desert environment. Management strategiesshould take this into account. The great longevity (200 –650 y) and slow growth (0.2 – 2.4 mm/y) indicated by ourresults also show that special care should be taken for thetree population, particularly at sites where mortality ishigh and recruitment is poor [43].
MethodsCore sampling and preparationDestructive wood section sampling was avoided out ofrespect for local management traditions and because theA. tortilis population is decreasing [43]. Within the studyarea we selected seven sites, reflecting variation in hydro-logical and topographical conditions (Fig. 1). From thesesites, 17 increment cores were sampled in February andMarch, 2003 (Fig. 2).
A. tortilis has extremely hard wood, so we developed spe-cial steel corers designed to withstand the high torque.These were powered by a rechargeable electrical drill capa-ble of taking cores up to 300 mm long and with diametersof either 20 or 13 mm. The wide diameter was chosen toallow for micro size sampling of material for 14C dating.All samples were taken at 50 cm height above groundwherever possible. Samples were dried in field, using plas-tic tubes filled with silica gel that was replaced regularly.
All cores were sanded to high clarity and investigatedmacro- and microscopically. Narrow marginal parenchy-matic bands, also referred to as bands in the following,were identifiable in all samples. In a microtome sectioninvestigated crystals were identified along these bands[36,42]. The pith is missing in the majority of the coressampled, either because the heartwood was rotten orbecause eccentric or asymmetric growth made it difficultto estimate pith location. When missing, we estimatedpith relative to the cambium by projecting the band- andwood anatomical pattern of a core onto an ideal, centricscheme until maximum correlation between patterns wasfound.
Cores were scanned at high resolution (1500 dpi), creat-ing images to be analysed in LingoVision 5.1© RINNTECH.Distance between bands and exact locations of 14C sam-ples were measured to the nearest 0.01 mm. Two analystsmade the measurements and disputed bands were re-examined for a final, agreed decision. All measurementswere made perpendicularly to the bands.
Page 11 of 14(page number not for citation purposes)

BMC Ecology 2007, 7:4 http://www.biomedcentral.com/1472-6785/7/4
14C analysesWood for accelerator mass spectroscopy (AMS) dating wassampled as drilling dust (at least 40 mg) by a 1 mm drill.To eliminate younger matter such as radially transportedresin, the cellulose was extracted and precipitated fromthe drilled material [44]. Cellulose extraction and AMSpreparation was done at the Radiological Dating Labora-tory in Trondheim, Norway, and AMS dating at the Ång-ström Laboratory in Uppsala, Sweden. Radiocarbon age iscalibrated in OxCal Version 3.10 (Copyright© C. BronkRamsey 2005). The hyperactive 14C- content of woodsamples is reported according to [45] and are calibrated inCALIBomb [46], using the Northern Hemisphere zone 2dataset, smoothing 1 ("lifespan" of sample in years) anddefault resolution.
A total of 22 wood samples were dated (Fig. 3). For eachsite the longest core was selected and a sample extractedfrom as near as possible to the pith. With the remaining15 samples, we aimed at the 1964-peak in the post-bombcurve for estimation of recent growth rate. These sampleswere extracted from four of the seven cores, from UmmDihaysi a, Muwaylhah b, Hulus Upper b and Jimal a. Samplelocations within cores were selected according to prelimi-nary indications of possible growth rates based on 14Cmeasurements from a cross section taken from a test tree.
A hyperactive sample has two possible dates, i.e. on eitherside of the bomb peak (1964); but in a sequence of sam-ples from each core, one of these ranges can be elimi-nated. Therefore, we report only possible ages of woodformation. We refer to 1 sigma ranges or their midpoints,unless otherwise mentioned. The intervening growth rateis estimated when two or more samples from one corewere hyperactive. If indicated by growth rates a moreappropriate smoothing factor was chosen (cf. above).
The hyperactive samples provide a time frame for individ-ual cores. Based on this we tested band regularity. We fit-ted a linear regression model to the number of bandsagainst the time intervals.
Age scenariosWe constructed age scenarios to give possible age esti-mates for the trees studied. Scenarios are used as an alter-native to wiggle matching, which requires several datedsamples, preferably together with information about theirtemporal relation [18,47]. We derive age scenarios fromthe bomb peak dates and possible combinations of datesof older samples, based on the midpoints of calendarranges according to 1 sigma radiocarbon ages. The cumu-lative pattern of tree growth is well described by a sigmoidmodel [27]. We apply the Gompertz model (Equation1a), which is fitted to our data by a non-linear leastsquares regression. The oldest sample is by definition set
to be formed in year 0, and the positions of the samplesare measured from the (estimated) pith. The tree estab-lishment date is defined as the year in which growth hasaccumulated to at least a radius of 1 mm (in the height ofsampling). Differential functions are derived (Equation1b), displaying growth rate at any given time.
Equation 1 – Gompertz equation(a) Integral form and (b) differential form; y = tree radialsize, y' = size increment, t = age and a, b and c = parametersof the following equation:
We assess these scenarios based on agreement betweenacquired knowledge about present growth and modelcharacteristics. Because the underlying, environmentalconstraints in the harsh desert environment are approxi-mately constant in space and time, we expect that long-term growth rate is comparable to present growth rates.The Gompertz parameter a indicates the maximum possi-ble trunk radius of the tree in question. We assume that atree had not stopped growing at the time of sampling, andwould continue to grow in the near future; i.e. that theasymptotic value would be greater than the present lengthof the core. In distinguishing likely from less likely scenar-ios this cannot be used as a strict criterion since the actualpith location is only estimated (cf. above).
Growth conditions and band patternsWe expect that trees growing under similar conditions, i.e.within sites, will exhibit very similar relative patterns ofbands. Thus the correlation between band sequencesshould be high, and higher than correlations among sites.For correlations among sites we used all the cores fromneighbouring sites (n = 32).
If correlation within sites is low, and lower than for coresamong sites, this might indicate either that soil moistureconditions varied within site or that other factors inducedband formation, e.g. browsing and lopping [26]. We try toremove the effect of such factors by correlating short seg-ments within the whole cores and by shifting segmentssuccessively in either direction to allow for missing orfalse bands. Within sites we expect that such short seg-ments will increase the proportion of significantly corre-lated segments (see below). Among sites no such effect isexpected.
Because sample size must exceed a lower limit to detect asignificant correlation, the shortest segment length testedis 10 bands. We also test segments of 15 and 20 bands.Each segment of core 1 (the longest core) is tested against
a)
b)
y ae
y abce e
be
ct be
ct
ct
=
=
−
− −
−
−’
Page 12 of 14(page number not for citation purposes)
BMC Ecology 2007, 7:4 http://www.biomedcentral.com/1472-6785/7/4
the same segment of core 2, defined relative to the cam-bium. Segments of core 2 are shifted up to 5 bands ineither direction. The best correlation (of 11 tested) isreported for each segment of core 1. Since segmentslengths are < 50, we use the z* transformation for the cal-culation of t-values, testing the null hypothesis that twovariables are uncorrelated [48]. The proportion of signifi-cant positively correlated segments is calculated for eachset of cores. We test whether these proportions are signif-icantly different for the three segment lengths, bothwithin and among sites. A generalized linear model witha quasibinomial error structure (to allow for overdisper-sion) and a logit link is fitted [49].
Because there are more dense bands than widely separatedones, measurements are log-transformed in advance ofcorrelation analysis. Standardisation, removing long-termtrends in growth, was not done because the time intervalsbetween bands are unknown and variable [50]. All statis-tical analyses were done in R 2.2.1 [51].
Authors' contributionsGLA and KK jointly carried out the fieldwork and pre-pared and analysed the cores. KK designed the equipmentand contributed to the finalisation of the manuscript. GLAdid the statistical analyses and drafted and finalised themanuscript. Both authors read and approved the finalmanuscript.
AcknowledgementsThe Norwegian Research Council (project no. 149181/730), the Faculty of Mathematics and Natural Sciences, University of Bergen, Olaf Grolle Olsens Legat and L. Meltzers Høyskolefond funded this research. Thanks to the Radiological Dating Laboratory, Trondheim, Norway, and in particular to the Director Steinar Gulliksen for support, valuable discussions and encouragement. Jonatan Krzywinski and Howaida AbdElRahman assisted in field. The authors are grateful to Prof. Richard H. Pierce who has encour-aged this research from its start and has contributed in finalising the manu-script.
References1. Hobbs JJ: Bedouin life in the Egyptian wilderness. Austin, Texas:
University of Texas Press; 1989. 2. Krzywinski K, Pierce RH, eds: Deserting the desert a threatened
cultural landscape between the Nile and the sea. 1st edition.Bergen: Alvheim og Eide Akademisk Forlag; 2001.
3. Belsky AJ: Influences of trees on savanna productivity – testsof shade, nutrients, and tree-grass competition. Ecology 1994,75(4):922-932.
4. Munzbergova Z, Ward D: Acacia trees as keystone species inNegev desert ecosystems. Journal of Vegetation Science 2002,13(2):227-236.
5. Wyant JG, Reid RS: Determining the age of Acacia tortilis withring counts for South Turkana, Kenya: a preliminary assess-ment. African Journal of Ecology 1992, 30:176-180.
6. Higgins SI, Bond WJ, Trollope WSW: Fire, resprouting and vari-ability: a recipe for grass-tree coexistence in savanna. Journalof Ecology 2000, 88(2):213-229.
7. Gourlay ID: Growth ring characteristics of some African Aca-cia species. Journal of Tropical Ecology 1995, 11:121-140.
8. Ward D, Rohner C: Anthropogenic causes of high mortalityand low recruitment in three Acacia tree taxa in the Negevdesert, Israel. Biodiversity and Conservation 1997, 6(6):877-893.
9. Wiegand K, Jeltsch F, Ward D: Minimum recruitment frequencyin plants with episodic recruitment. Oecologia 2004,141(2):363-372.
10. Andersen GL: How to detect desert trees using CORONAimages: Discovering historical ecological data. Journal of AridEnvironments 2006, 65(3):491-511.
11. Loehle C: Tree life-history strategies – the role of defenses.Canadian Journal of Forest Research-Revue Canadienne De RechercheForestiere 1988, 18(2):209-222.
12. Bond WJ, Midgley JJ: The evolutionary ecology of sprouting inwoody plants. International Journal of Plant Sciences 2003,164(3):S103-S114.
13. Carlquist S: Comparative wood anatomy: systematic, ecolog-ical, and evolutionary aspects of dicotyledon wood, 2nd,completely rev. edn. Berlin: Springer; 2001.
14. Fichtler E, Clark DA, Worbes M: Age and long-term growth oftrees in an old-growth tropical rain forest, based on analysesof tree rings and C-14. Biotropica 2003, 35(3):306-317.
15. Gourlay ID: The definition of seasonal growth zones in someAfrican Acacia species – A review. Iawa Journal 1995,16(4):353-359.
16. Eshete G, Stahl G: Tree rings as indicators of growth periodic-ity of acacias in the Rift Valley of Ethiopia. Forest Ecology andManagement 1999, 116(1–3):107-117.
17. Stuiver M, Polach HA: Reporting of C-14 data – discussion. Radi-ocarbon 1977, 19(3):355-363.
18. Blackwell PG, Buck CE, Reimer PJ: Important features of the newradiocarbon calibration curves. Quaternary Science Reviews 2006,25(5–6):408-413.
19. Nydal R, Lovseth K: Tracing bomb C-14 in the atmosphere1962–1980. Journal of Geophysical Research-Oceans and Atmospheres1983, 88(NC6):3621-3642.
20. Levin I, Kromer B, Schochfischer H, Bruns M, Munnich M, Berdau D,Vogel JC, Munnich KO: 25 years of tropospheric C-14 observa-tions in Central-Europe. Radiocarbon 1985, 27(1):1-19.
21. Worbes M, Junk WJ: Dating tropical trees by means of C-14from bomb tests. Ecology 1989, 70(2):503-507.
22. Boulos L: Flora of Egypt. Volume 1. Cairo: Al Hadara; 1999. 23. Ayyad MA, Ghabbour SI: Hot deserts of Egypt and Sudan. In Hot
desert and arid shrublands, B Volume 12B. Edited by: Evenari M, Noy-Meir I, Goodall DW. Elsevier; 1985:149-202.
24. Batanouny KH, Abdel Wahab AM: Eco-physiological studies ondesert plants VIII. Root penetration of Leptadenia pyrotech-nica (Forsk.) Decne. in relation to its water balance. Oecologia1973, 11:151-161.
25. Kassas M, Imam M: Habitat and plant communities in the Egyp-tian desert III The wadi bed ecosystem. Journal of Ecology 1954,42:424-445.
26. Martin DM, Moss JMS: Age determination of Acacia tortilis(Forsk.) Hayne from northern Kenya. African Journal of Ecology1997, 35(3):266-277.
27. Zeide B: Analysis of growth equations. Forest Science 1993,39(3):594-616.
28. Martinez-Ramos M, Alvarez-Buylla ER: How old are tropical rainforest trees? Trends in Plant Science 1998, 3(10):400-405.
29. Cody ML: Slow-motion population dynamics in MojaveDesert perennial plants. Journal of Vegetation Science 2000,11(3):351-358.
30. Lanner RM, Connor KF: Does bristlecone pine senesce? Experi-mental Gerontology 2001, 36(4–6):675-685.
31. Abdoun F, Jull AJT, Guibal F, Thinon M: Radial growth of theSahara's oldest trees: Cupressus dupreziana A. Camus.Trees-Structure and Function 2005, 19(6):661-670.
32. February EC, Mader AD, Bond WJ: Age determination of twoSouth African Acacia species using ring counts and radiocar-bon dating. African Journal of Ecology 2006, 44(3):417-419.
33. Pellew RAP: The Impacts of elephant, giraffe and fire upon theAcacia-tortilis woodlands of the Serengeti. African Journal ofEcology 1983, 21(1):41-74.
34. Bowers JE, Webb RH, Rondeau RJ: Longevity, recruitment andmortality of desert plants in Grand-Canyon, Arizona, USA.Journal of Vegetation Science 1995, 6(4):551-564.
Page 13 of 14(page number not for citation purposes)

BMC Ecology 2007, 7:4 http://www.biomedcentral.com/1472-6785/7/4
Publish with BioMed Central and every scientist can read your work free of charge
"BioMed Central will be the most significant development for disseminating the results of biomedical research in our lifetime."
Sir Paul Nurse, Cancer Research UK
Your research papers will be:
available free of charge to the entire biomedical community
peer reviewed and published immediately upon acceptance
cited in PubMed and archived on PubMed Central
yours — you keep the copyright
Submit your manuscript here:http://www.biomedcentral.com/info/publishing_adv.asp
BioMedcentral
35. Wiegand K: A model of the spatio-temporal populationdynamics of Acacia raddiana. In UFZ-Bericht Leipzig-Halle: UFZ-Umveltforschungszentrum; 1999.
36. Gourlay ID, Grime GW: Calcium-oxalate crystals in AfricanAcacia species and their analysis by scanning proton micro-probe (Spm). Iawa Journal 1994, 15(2):137-148.
37. Fahn A, Waisel Y, Benjamin L: Cambial activity in Acacia raddianaSavi. Annals of Botany 1968, 32(127):677.
38. Canadell J, Jackson RB, Ehleringer JR, Mooney HA, Sala OE, SchulzeED: Maximum rooting depth of vegetation types at the globalscale. Oecologia 1996, 108(4):583-595.
39. Vandenbeldt RJ: Rooting systems of Western and SouthernAfrican Faidherbia albida (Del.) a-Chev (Syn Acacia albidaDel) – a comparative analysis with biogeographic implica-tions. Agroforestry Systems 1991, 14(3):233-244.
40. BenDavid-Novak H, Schick AP: The response of Acacia tree pop-ulation on small alluvial fans to changes in the hydrologicalregime: Southern Negev Desert, Israel. Catena 1997, 29(3–4):341-351.
41. Shrestha MK, Stock WD, Ward D, Golan-Goldhirsh A: Water sta-tus of isolated Negev desert populations of Acacia raddianawith different mortality levels. Plant Ecology 2003,168(2):297-307.
42. Gourlay ID, Kanowski PJ: Marginal parenchyma bands and crys-talliferous chains as indicators of age in African Acacia spe-cies. Iawa Bulletin 1991, 12(2):187-194.
43. Andersen GL, Krzywinski K: Mortality, recruitment and changeof desert tree populations in a hyper-arid environment. PLoSONE 2007, 2(2):e208.
44. Olsson IU, Possnert G: C-14 activity in different sections andchemical fractions of oak tree rings, AD 1938–1981. Radiocar-bon 1992, 34(3):757-767.
45. Reimer PJ, Brown TA, Reimer RW: Discussion: Reporting andcalibration of post-bomb C-14 data. Radiocarbon 2004,46(3):1299-1304.
46. CALIB 14C Bomb Calibration [http://calib.qub.ac.uk/CALIBomb]
47. Ramsey CB, van der Plicht J, Weninger B: 'Wiggle matching' radi-ocarbon dates. Radiocarbon 2001, 43(2A):381-389.
48. Sokal RR, Rohlf FJ: Biometry The principles and practice of sta-tistics in biological research. Third edition. New York: W. H.Freeman and Company; 1995.
49. Crawley MJ: Statistical computing: an introduction to dataanalysis using S-Plus. Chichester: Wiley; 2002.
50. Cook ER, Kairiukstis LA: Methods of dendrochronology: appli-cations in the environmental sciences. Dordrecht: Kluwer Aca-demic Publishers; 1990.
51. The R Project for Statistical Computing [http://www.r-project.org/]
Page 14 of 14(page number not for citation purposes)
Related Documents