Arab J Sci Eng (2013) 38:421–437 DOI 10.1007/s13369-012-0445-5 RESEARCH ARTICLE - SPECIAL ISSUE - MECHANICAL ENGINEERING Long-Term Wind Speed Analysis and Detection of its Trends Using Mann–Kendall Test and Linear Regression Method Shafiqur Rehman Received: 27 October 2011 / Accepted: 24 April 2012 / Published online: 11 December 2012 © King Fahd University of Petroleum and Minerals 2012 Abstract Exponentially growing global population, power demands, pollution levels, and on the other hand rapid advancement in means of communication have made the people aware of the complex do or die situation. Kingdom of Saudi Arabia has vast open land, abundance of fossil fuel, not much population but has always been among the front run- ners whereas development and utilization of clean sources of energy are concerned. Long-term wind speed trends have been studied in this study using Mann–Kendall statistical trend analysis method. Historical daily mean wind speed data measured at 8–12 m above ground level at national and inter- national airports in the Kingdom over a period of 37 years was used to obtain long-term annual and monthly mean wind speeds, annual mean wind speed trends, and energy yield using an efficient modern wind turbine of 2.75 MW rated power. Trend analysis that showed a decreasing trend of 0.01852 m/s per year was observed in annual mean wind speed values based on the algebraic average of the trend coefficient (a) of all the stations used in the present work. Based on long-term annual average wind speed of more than 4 m/s, Al-Wejh, Dhahran, Guriat, Turaif, and Yanbo are placed in the preferred category for wind power develop- ment, and AlJouf, Arar, and Qaisumah with annual average wind speed 3.75 m/s range are placed in the second list of preferred locations for wind power development. At most of the locations, the wind power can be generated with 25–35 % of plant capacity factor in Saudi Arabia. Keywords Meteorology · Wind speed · Trend analysis · Mann–Kendall test · Renewable energy · Saudi Arabia S. Rehman (B ) Center for Engineering Research, Research Institute, King Fahd University of Petroleum and Minerals, Dhahran 31261, Saudi Arabia e-mail: [email protected] List of Symbols B Constant f (t ) Continuous monotonic increasing or decreasing function of time Q Slope q Number of tied groups S Statistical parameter t p Number of data values in the pth group VAR(S) Variance 123

Welcome message from author
This document is posted to help you gain knowledge. Please leave a comment to let me know what you think about it! Share it to your friends and learn new things together.
Transcript

Arab J Sci Eng (2013) 38:421–437DOI 10.1007/s13369-012-0445-5
RESEARCH ARTICLE - SPECIAL ISSUE - MECHANICAL ENGINEERING
Long-Term Wind Speed Analysis and Detection of its TrendsUsing Mann–Kendall Test and Linear Regression Method
Shafiqur Rehman
Received: 27 October 2011 / Accepted: 24 April 2012 / Published online: 11 December 2012© King Fahd University of Petroleum and Minerals 2012
Abstract Exponentially growing global population, powerdemands, pollution levels, and on the other hand rapidadvancement in means of communication have made thepeople aware of the complex do or die situation. Kingdom ofSaudi Arabia has vast open land, abundance of fossil fuel, notmuch population but has always been among the front run-ners whereas development and utilization of clean sourcesof energy are concerned. Long-term wind speed trends havebeen studied in this study using Mann–Kendall statisticaltrend analysis method. Historical daily mean wind speed datameasured at 8–12 m above ground level at national and inter-national airports in the Kingdom over a period of 37 yearswas used to obtain long-term annual and monthly mean windspeeds, annual mean wind speed trends, and energy yieldusing an efficient modern wind turbine of 2.75 MW ratedpower. Trend analysis that showed a decreasing trend of0.01852 m/s per year was observed in annual mean windspeed values based on the algebraic average of the trendcoefficient (a) of all the stations used in the present work.Based on long-term annual average wind speed of morethan 4 m/s, Al-Wejh, Dhahran, Guriat, Turaif, and Yanboare placed in the preferred category for wind power develop-ment, and AlJouf, Arar, and Qaisumah with annual averagewind speed 3.75 m/s range are placed in the second list ofpreferred locations for wind power development. At most ofthe locations, the wind power can be generated with 25–35 %of plant capacity factor in Saudi Arabia.
Keywords Meteorology · Wind speed · Trend analysis ·Mann–Kendall test · Renewable energy · Saudi Arabia
S. Rehman (B)Center for Engineering Research, Research Institute,King Fahd University of Petroleum and Minerals,Dhahran 31261, Saudi Arabiae-mail: [email protected]
List of Symbols
B Constantf (t) Continuous monotonic increasing or decreasing
function of timeQ Slopeq Number of tied groupsS Statistical parametertp Number of data values in the pth groupVAR(S) Variance
123

422 Arab J Sci Eng (2013) 38:421–437
Z Test statisticεi Residualα Confidence level
1 Introduction and Literature Review
The continued growth and expansion of the wind powerindustry in the face of a global recession and a financial crisisare testaments to the inherent attractiveness of the technology[1]. Wind power is clean, reliable, and quick to install. It is theleading electricity generation technology in the fight againstclimate change, enhancing energy security, stabilizing elec-tricity prices, cleaning up air, and creating thousands of qual-ity jobs in the manufacturing sector. Global Wind EnergyCouncil’s (GWEC’s) prediction of 12 % growth in the windsector was generally greeted with disbelief and derision butthe global market grew by 41 %, demonstrating that windpower is increasingly the power technology of choice. Windpower proved to be the leading power sector over all oth-ers by a substantial margin in the US and Europe, and withanother fantastic year of more than 100 % growth in ChinaGWEC [1].
The annual cumulative wind power installed capacityreached 194.39 GW in 2010 compared to 158.5 GW in 2009,an increase of 24.31 %, as shown in Fig. 1 [1]. This representsa year-on-year growth of 31.7 %, as can be seen from Fig. 2.One third of these additions were made in China, which dou-bled its installed capacity again. Since 2005, the global windpower growth has been always more than 25 %. For the firsttime, Asia was the world’s largest regional market for windenergy, with capacity additions amounting to 15.4 GW.
An accurate wind resource assessment is an important andcritical factor to be well understood for harnessing the powerof the wind. The beauty of wind is that it is available every-where and intermittently 24 h of the day. As we know thatwind resources are seldom consistent and vary with time ofthe day, season of the year, height above the ground, type ofterrain, and from year to year, hence should be investigatedcarefully and completely.
In Saudi Arabia, a good deal of work is reported in the lit-erature on various aspects of wind energy such as its measure-ments, conversion, and utilization. Rehman [2] presented theenergy output and economical analysis of 30 MW installedcapacity wind farms at five coastal locations using windmachines of 600, 1,000, and 1,500 kW. In another study,Rehman [3] performed a detailed analysis of wind speedin terms of energy yield, effect of hub-height on energyyield, plant capacity factor, etc. for an industrial city. Reh-man and Aftab [4] performed detailed wind data analysis forwind power potential assessment for five locations in SaudiArabia. Rehman et al. [5] computed the cost of energy gener-ation at 20 locations in Saudi Arabia using net present valueapproach. Al-Abbadi [6] utilized wind speed measurements
2 2 3 3 3 5 6 8 10 14 17 24 31 39 4859
7494
121
158
194.39
0
50
100
150
200
250
Inst
alle
d ca
paci
ty, (
GW
)
Year
Fig. 1 Global wind power cumulative installed capacity [1]
0
5
10
15
20
25
30
35
40
1990
1991
1992
1993
1994
1995
1996
1997
1998
1999
2000
2001
2002
2003
2004
2005
2006
2007
2008
2009
YearW
ind
po
wer
cap
acit
y, (
%)
Fig. 2 Annual percent wind power installed capacity [1]
taken at 20, 30, and 40 m above ground level (AGL) forfive locations for wind power assessment. The author uti-lized the wind turbine of 600 kW rated capacity and foundannual energy yields of 1,080, 990, 730, 454, and 833 MWhfor Dhulom, Arar, Yanbo, Gassim, and Dhahran, respec-tively. Earlier, Al-Abbadi [7] and Alawaji [8] presented windresources assessment in Saudi Arabia. Rehman and Halawani[9] presented the statistical characteristics of wind speed andits diurnal variation. The autocorrelation coefficients werefound to match the actual diurnal variation of the hourlymean wind speed for most of the locations used in the study.Rehman et al. [10] calculated the Weibull parameters for10 anemometer locations in Saudi Arabia and found that thewind speed was well represented by the Weibull distributionfunction.
With growing global awareness of the usage of cleansources of energy, wind energy in particular, a lot of workis being carried out in different parts of the world, as can beseen from Jaramillo and Borja [11] for La Ventosa, Mexico,Kainkwa [12] for Basotu in Tanzania, Ali Naci Celik [13],Ackermann and Soder [14], Jebaraj and Iniyan [15], Perez etal. [16], Akpinar and Akpinar [17], Acker et al. [18] for Ari-zona, USA, Shata and Hanitsch [19,20] for Egypt, Hrayshat[21] for Jordan, Bagiorgas and Assimakopoulos [22] forwestern Greece, Jiang et al. [23] for Inner Mongolia in china,Ulgen et al. [24] and Eskin et al. [25] for Turkey, ElOsta andKalifa [26] for Libya, Omar [27] for Sudan, Himri et al.[28] for Algeira, and many others. Tar [29] used statistical
123

Arab J Sci Eng (2013) 38:421–437 423
Table 1 Site specific information of meteorological stations considered in this study
Location From To Latitude (◦N) Longitude (◦E) Altitude (m)
Abha 01/09/1983 31/12/2006 18.20 42.70 2,084
Al Ahsa 01/01/1990 30/11/2006 25.30 49.50 172
Al Baha 01/09/1983 31/12/2006 20.00 41.50 1,021
Al Jouf 05/08/1970 31/12/2006 29.80 39.90 771
Al-Wejh 01/01/1970 31/12/2006 26.20 36.50 16
Arar 07/04/1970 30/11/2006 30.90 41.10 552
Bisha 01/01/1970 31/12/2006 20.00 42.60 1,157
Dhahran 01/01/1970 31/12/2006 26.30 50.20 17
Gassim 01/01/1973 31/12/2006 26.30 43.80 650
Gizan 01/01/1970 31/12/2006 16.90 42.60 3
Guriat 01/01/1984 31/12/2006 31.40 37.30 499
Hafr-Al-Batin 01/01/1990 31/12/2006 28.30 46.10 355
Hail 01/01/1990 30/11/2006 27.40 41.70 1,013
Jeddah 01/01/1970 31/12/2006 21.70 39.20 12
Khamis Mushait 01/01/1970 31/12/2006 18.30 42.80 2,054
Madinah 01/01/1970 31/12/2006 24.60 39.70 631
Makkah 03/05/1984 31/12/2006 21.50 39.80 310
Najran 04/09/1973 31/12/2006 17.60 44.40 1,203
Qaisumah 01/01/1970 31/12/2006 28.30 46.10 355
Rafha 01/01/1970 31/12/2006 29.60 43.50 447
Riyadh 01/04/1984 31/12/2006 24.70 46.70 612
Sharorah 01/01/1990 30/11/2006 17.50 47.10 722
Tabuk 01/01/1970 31/12/2006 28.40 36.60 770
Taif 01/01/1970 31/12/2006 21.50 40.60 1,449
Turaif 03/08/1970 31/12/2006 31.70 38.70 813
Wadi-Al-Dawasser 03/03/1990 31/12/2006 20.52 45.19 627
Yanbo 22/02/1977 31/12/2006 24.20 38.10 14
methods to analyze the time series of monthly average windspeed in the period between 1991 and 2000 measured at sevenHungarian meteorological stations. To date, lot of researchefforts has been witnessed on developing effective methodsfor wind speed forecasting. The approaches in the literatureto wind speed forecasting include physical methods, such asnumerical weather forecast (NWF) and mesoscale models[30], conventional statistical methods such as ARIMA mod-els [31–33], hybrid physical and statistical models, and oth-ers [34,35]. In recent years, artificial intelligence techniqueshave been adopted for the purpose of wind speed forecast-ing, such as neural networks (NN) of multi-layer perceptrons(MLP) [36,37], radial basis functions [38] and recurrent neu-ral networks [39,40], fuzzy logic [41,42], etc.
2 Site and Data Description
The Kingdom of Saudi Arabia lies between latitudes 31◦Nand 17.5◦N and longitudes 50◦E and 36.6◦E. The land
elevation varies between 0 and 2,600 m above the mean sealevel. Complex terrain is found in the southwest region ofthe Kingdom. The east and the west coasts of the Kingdomare located on the Arabian Gulf and Red Sea, respectively.Mainly two seasons, winter and summer, are observed dur-ing the year. The historical meteorological data collected atnational and international airports in the Kingdom show along-term annual wind speed of about 4–4.5 m/s at differentlocations at about 10 m AGL.
The latitude, longitude, altitude, and data collection periodfor national and international airports are summarized inTable 1. In general, the data collection period varied from1970 to 2006 for most of the data collection stations. Atall of these stations, the hourly values of all the parameterssuch as wind speed (WS), wind direction (WD), dry bulbtemperature (T), wet bulb temperature (Tw), station pressure(P), sea level pressure (Psl), relative humidity (RH), vaporpressure (Vp), total rainfall (R), and others are recorded man-ually, and then, daily average, maximum and minimum val-ues are computed. The meteorological stations at Al-Wejh,
123
424 Arab J Sci Eng (2013) 38:421–437
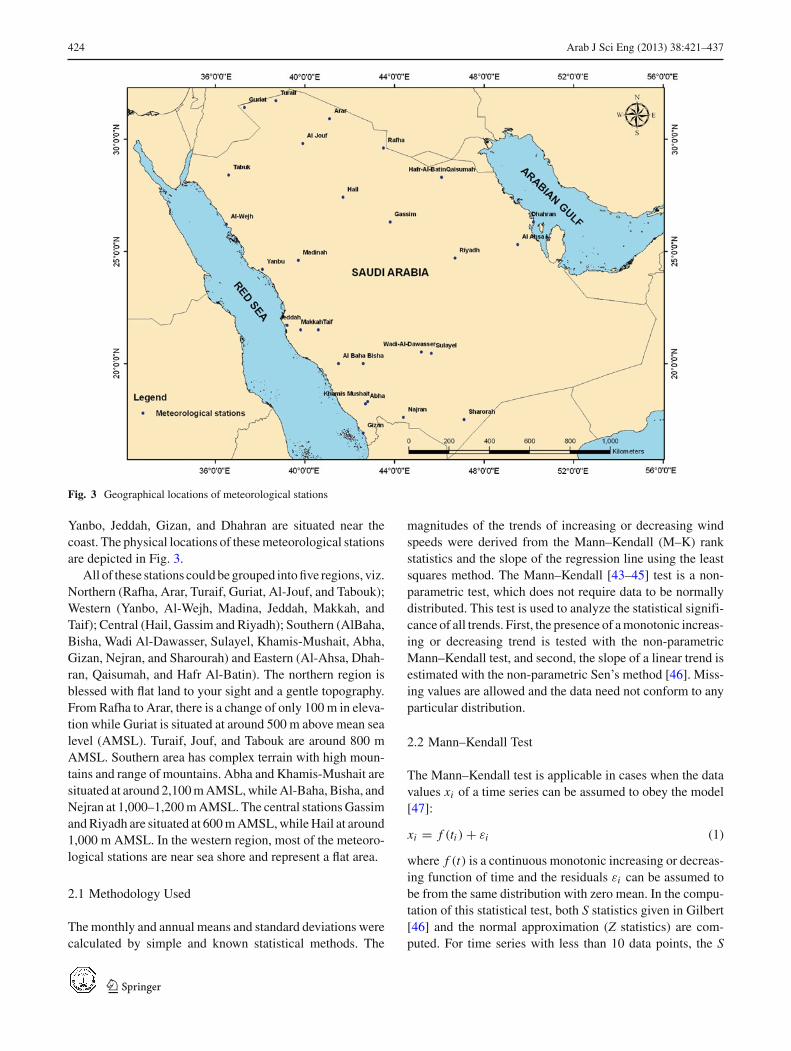
Fig. 3 Geographical locations of meteorological stations
Yanbo, Jeddah, Gizan, and Dhahran are situated near thecoast. The physical locations of these meteorological stationsare depicted in Fig. 3.
All of these stations could be grouped into five regions, viz.Northern (Rafha, Arar, Turaif, Guriat, Al-Jouf, and Tabouk);Western (Yanbo, Al-Wejh, Madina, Jeddah, Makkah, andTaif); Central (Hail, Gassim and Riyadh); Southern (AlBaha,Bisha, Wadi Al-Dawasser, Sulayel, Khamis-Mushait, Abha,Gizan, Nejran, and Sharourah) and Eastern (Al-Ahsa, Dhah-ran, Qaisumah, and Hafr Al-Batin). The northern region isblessed with flat land to your sight and a gentle topography.From Rafha to Arar, there is a change of only 100 m in eleva-tion while Guriat is situated at around 500 m above mean sealevel (AMSL). Turaif, Jouf, and Tabouk are around 800 mAMSL. Southern area has complex terrain with high moun-tains and range of mountains. Abha and Khamis-Mushait aresituated at around 2,100 m AMSL, while Al-Baha, Bisha, andNejran at 1,000–1,200 m AMSL. The central stations Gassimand Riyadh are situated at 600 m AMSL, while Hail at around1,000 m AMSL. In the western region, most of the meteoro-logical stations are near sea shore and represent a flat area.
2.1 Methodology Used
The monthly and annual means and standard deviations werecalculated by simple and known statistical methods. The
magnitudes of the trends of increasing or decreasing windspeeds were derived from the Mann–Kendall (M–K) rankstatistics and the slope of the regression line using the leastsquares method. The Mann–Kendall [43–45] test is a non-parametric test, which does not require data to be normallydistributed. This test is used to analyze the statistical signifi-cance of all trends. First, the presence of a monotonic increas-ing or decreasing trend is tested with the non-parametricMann–Kendall test, and second, the slope of a linear trend isestimated with the non-parametric Sen’s method [46]. Miss-ing values are allowed and the data need not conform to anyparticular distribution.
2.2 Mann–Kendall Test
The Mann–Kendall test is applicable in cases when the datavalues xi of a time series can be assumed to obey the model[47]:
xi = f (ti ) + εi (1)
where f (t) is a continuous monotonic increasing or decreas-ing function of time and the residuals εi can be assumed tobe from the same distribution with zero mean. In the compu-tation of this statistical test, both S statistics given in Gilbert[46] and the normal approximation (Z statistics) are com-puted. For time series with less than 10 data points, the S
123
Arab J Sci Eng (2013) 38:421–437 425
Table 2 Long-term statistics of daily mean wind speed
Location Possible records Valid records Mean (m/s) Median (m/s) Max (m/s) SD (m/s)
Abha 6,209 6,186 2.96 2.57 14.92 1.26
Al-Ahsa 6,209 6,167 3.41 3.09 11.83 1.72
Al-Baha 8,035 6,190 3.34 3.09 13.91 1.45
Al-Jouf 12,053 9,247 3.94 3.61 15.97 1.82
Al-Wejh 13,514 10,683 4.26 4.12 14.92 1.38
Arar 13,498 10,229 3.83 3.61 24.21 1.87
Bisha 13,482 10,656 2.61 2.57 12.35 1.19
Dhahran 13,514 11,067 4.40 4.12 12.86 1.70
Gassim 12,418 9,601 2.87 2.57 19.03 1.42
Gizan 13,514 10,685 3.42 3.09 13.89 1.00
Guriat 8,035 6,209 4.21 4.12 16.46 1.99
Hafr-Al-Batin 6,209 6,201 3.33 3.09 12.86 1.64
Hail 6,209 6,171 3.22 3.09 10.80 1.30
Jeddah 13,514 10,953 3.66 3.60 12.35 1.30
Khamis-Mushait 13,514 10,686 3.12 3.09 12.86 1.28
Madinah 13,514 10,670 3.33 3.09 10.29 1.16
Makkah 8,035 6,192 1.59 1.54 22.12 0.81
Nejran 11,322 8,635 2.23 2.06 8.75 1.03
Qaisumah 13,498 10,662 3.92 3.60 14.40 1.98
Rafha 13,514 10,240 3.77 3.60 17.49 1.78
Riyadh 13,514 10,664 3.23 3.09 9.77 1.51
Sharourah 6,209 6,146 3.23 3.09 16.46 1.37
Sulayel 7,305 3,619 3.50 3.09 13.89 1.63
Tabuk 13,514 10,640 2.85 2.57 15.43 1.38
Taif 13,514 10,677 3.73 3.60 10.29 1.43
Turaif 12,417 9,575 4.18 4.12 19.03 1.87
Wadi-Al-Dawasser 6,209 6,130 3.50 3.09 12.35 1.53
Yanbo 13,514 10,701 4.19 4.12 18.01 1.79
test is used, and for time series with 10 or more data points,the normal approximation is used. First, the variance of S iscomputed by the following equation which takes into accountties that may be present [47]:
VAR(S) = 1
18
⎡⎣n(n − 1)(2n + 5) −
q∑p=1
tp(tp − 1)(2tp& + 5)
⎤⎦
(2)
where q is the number of tied groups and tp is the numberof data values in the pth group. The values of S and VAR(S)are used to compute the test statistic Z as follows:
Z =
⎧⎪⎨⎪⎩
S−1√VAR(S)
if S > 0
0 if S = 0S+1√
VAR(S)if S < 0
(3)
A positive value of Z indicates an upward, while a negativevalue downward trend. To test for either an upward or down-ward monotone trend (a two-tailed test) at α level of signifi-
0.00.51.01.52.02.53.03.54.04.5
Abh
aA
l Ahs
aA
l Bah
aA
l Jou
fA
l-Wej
hA
rar
Bis
haD
hahr
anG
assi
mG
izan
Gur
iat
Haf
r-A
l-Bat
inH
ail
Jedd
ahK
ham
is M
usha
itM
adin
ahM
akka
hN
ajra
nQ
aisu
mah
Raf
haR
iyad
hS
haro
rah
Sul
ayel
Tabu
kTa
ifTu
raif
Wad
i-Al-D
awas
ser
Yanb
u
Mea
n w
ind
spee
d, (
m/s
)
Location
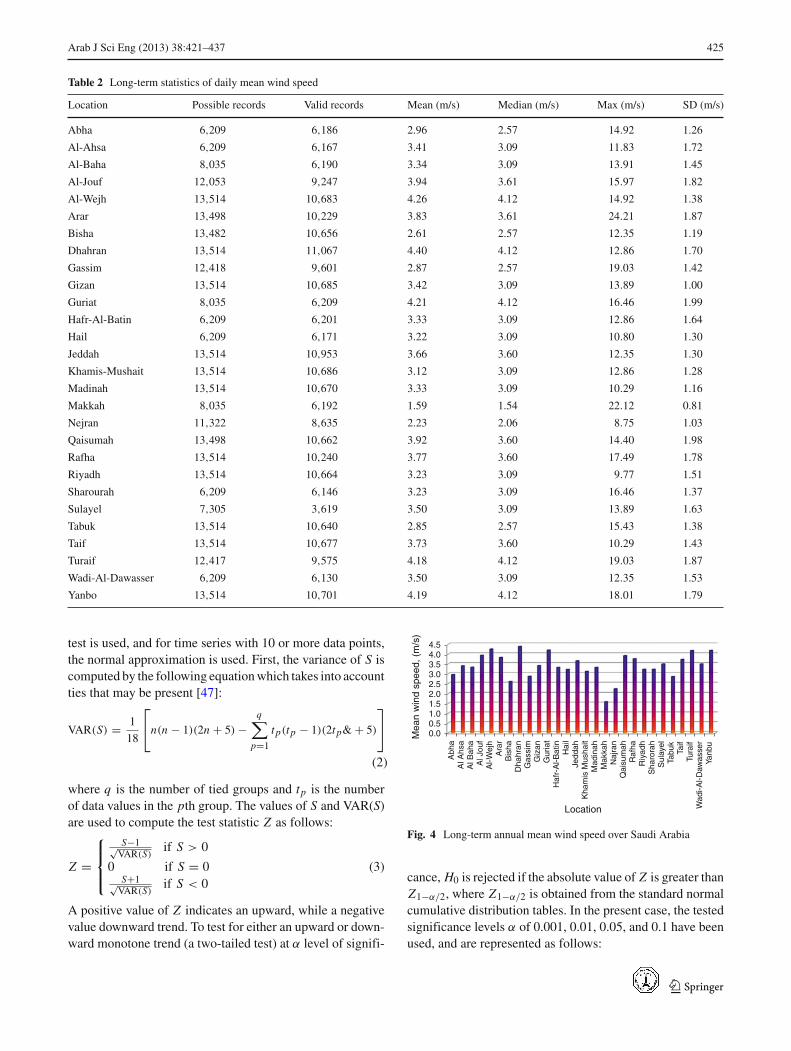
Fig. 4 Long-term annual mean wind speed over Saudi Arabia
cance, H0 is rejected if the absolute value of Z is greater thanZ1−α/2, where Z1−α/2 is obtained from the standard normalcumulative distribution tables. In the present case, the testedsignificance levels α of 0.001, 0.01, 0.05, and 0.1 have beenused, and are represented as follows:
123

426 Arab J Sci Eng (2013) 38:421–437
Fig. 5 Wind speed contourmap of Saudi Arabia
*** if trend at α = 0.001 level of significance;** if trend at α = 0.01 level of significance;* if trend at α = 0.05 level of significance;+ if trend at α = 0.1 level of significance;If the cell is blank then the significance level is said to be
greater than 0.1.
2.3 Sen’s Method
To estimate the true slope of an existing trend, as change peryear, the Sen’s non-parametric method is used. This meansthat f (t) in Eq. (1) is equal to
f (t) = Qt + B (4)
where Q is the slope and B is a constant. To get the slopeestimate Q in Eq. (4), we first calculate the slopes of all datavalue pairs
Qi = x j − xk
j − k(5)
where j > k. If there are n values x j in the time series, we getas many as N = n(n − 1)/2 slope estimates Qi . The Sen’sestimator of slope is the median of these N values of Qi . The
N values of Qi are ranked from the smallest to the largestand the Sen’s estimator is given as follows:
Q = Q[(N+1)/2], if N is odd
Q = 1
2
(Q[N/2] + Q[(N+2)/2]
), if N is even (6)
The present procedure computes the confidence interval attwo different confidence levels: α = 0.01 and α = 0.05, result-ing in two different confidence intervals. At first, we computeCα as follows:
Cα = Z1−α/ 2√
VAR(S) (7)
where VAR(S) has been defined in Eq. (2), and Z1−α/2
is obtained from the standard normal distribution. Next,M1 = (N − Cα)/2 and M2 = (N + Cα)/2 are computed.The lower and upper limits of the confidence interval, Qmin
and Qmax, are the M1 largest and the (M2+1) largest of theN ordered slope estimates Qi . If M1 is not a whole num-ber, the lower limit is interpolated. To obtain an estimateof B in Eq. (4), the n values of differences xi − Qti arecalculated. The median of these values gives an estimate ofB [48]. The estimates for the constant B of lines of the 99
123

Arab J Sci Eng (2013) 38:421–437 427
Fig. 6 a–c Variation of annual mean wind speeds along with best fit regression line
and 95 % confidence intervals are calculated by a similarprocedure.
3 Results and Discussion
3.1 Long-Term Variation of Wind Speed
The long-term average, maximum, and standard deviationvalues of wind speed for all the stations under investigation
are summarized in Table 2. The highest annual average windspeed of 4.4 m/s was observed at Dhahran, while the lowestof 1.59 m/s at Makkah as can be seen from Fig. 4. Promisinglong-term annual means of more than 4 m/s were observed atAl-Wejh, Guriat, Turaif, and Yanbo. A contour map of windspeed variation over Saudi Arabia developed using long-termmean wind speed values, given in Table 2, is shown in Fig. 5.The windy regions (Dhahran, Guriat, Turaif, Al-wejh, andYanbo) are well identified in contour map shown in Fig. 5.
123

428 Arab J Sci Eng (2013) 38:421–437
Fig. 6 continued
The long-term annual mean wind speed is observed to bemore than 4.2 m/s at 10 m AGL in all of these regions. Theannual WS was found to be greater than 3.5 m/s in northernterritory and along east and west coasts of Saudi Arabia. Asper historical available data from airports, the central, south-ern, and south western regions could be classified as lowwindy regions but need to be revisited by making new mea-surements at different heights and up to 100 m AGL beforeexcluding these for wind power development program.
In January, the windiest regions were spotted as Dhah-ran, Turaif, and Al-Wejh, while the least windy were Naj-ran and Abha. In February, the higher winds of more than4.4 m/s covered a wider region in northern territory and onthe west coast south of Al-Wejh and west of Yanbo. Stillthe least winds were noticed in Nejran and Abha regions.The situation remained almost the same in March with theexception that the WS magnitude reached 4.5 m/s. The long-term monthly mean WS reached further high (>4.6 m/s) in
123
Arab J Sci Eng (2013) 38:421–437 429
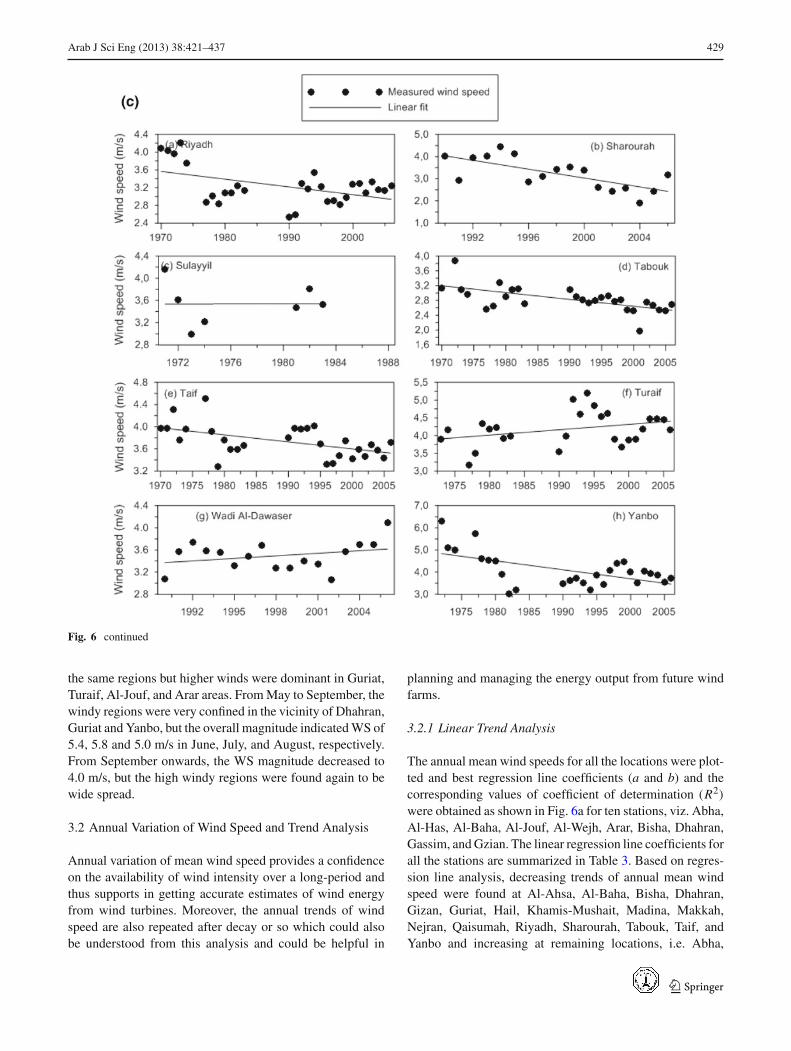
Fig. 6 continued
the same regions but higher winds were dominant in Guriat,Turaif, Al-Jouf, and Arar areas. From May to September, thewindy regions were very confined in the vicinity of Dhahran,Guriat and Yanbo, but the overall magnitude indicated WS of5.4, 5.8 and 5.0 m/s in June, July, and August, respectively.From September onwards, the WS magnitude decreased to4.0 m/s, but the high windy regions were found again to bewide spread.
3.2 Annual Variation of Wind Speed and Trend Analysis
Annual variation of mean wind speed provides a confidenceon the availability of wind intensity over a long-period andthus supports in getting accurate estimates of wind energyfrom wind turbines. Moreover, the annual trends of windspeed are also repeated after decay or so which could alsobe understood from this analysis and could be helpful in
planning and managing the energy output from future windfarms.
3.2.1 Linear Trend Analysis
The annual mean wind speeds for all the locations were plot-ted and best regression line coefficients (a and b) and thecorresponding values of coefficient of determination (R2)
were obtained as shown in Fig. 6a for ten stations, viz. Abha,Al-Has, Al-Baha, Al-Jouf, Al-Wejh, Arar, Bisha, Dhahran,Gassim, and Gzian. The linear regression line coefficients forall the stations are summarized in Table 3. Based on regres-sion line analysis, decreasing trends of annual mean windspeed were found at Al-Ahsa, Al-Baha, Bisha, Dhahran,Gizan, Guriat, Hail, Khamis-Mushait, Madina, Makkah,Nejran, Qaisumah, Riyadh, Sharourah, Tabouk, Taif, andYanbo and increasing at remaining locations, i.e. Abha,
123
430 Arab J Sci Eng (2013) 38:421–437
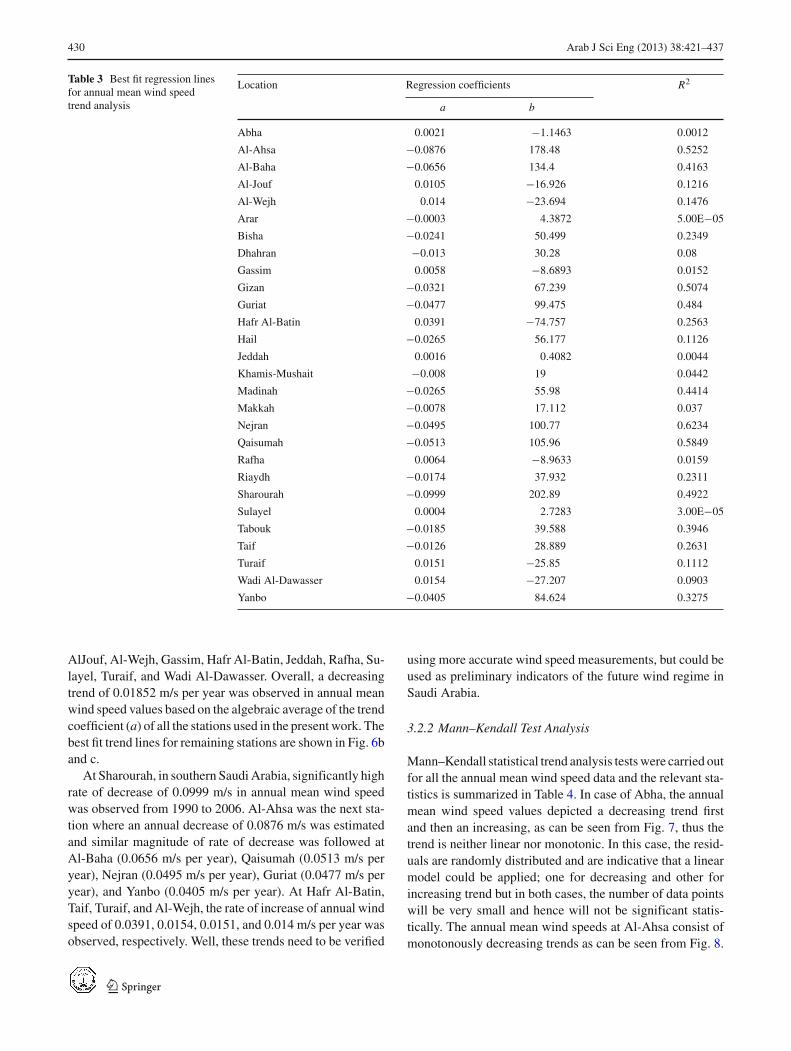
Table 3 Best fit regression linesfor annual mean wind speedtrend analysis
Location Regression coefficients R2
a b
Abha 0.0021 −1.1463 0.0012
Al-Ahsa −0.0876 178.48 0.5252
Al-Baha −0.0656 134.4 0.4163
Al-Jouf 0.0105 −16.926 0.1216
Al-Wejh 0.014 −23.694 0.1476
Arar −0.0003 4.3872 5.00E−05
Bisha −0.0241 50.499 0.2349
Dhahran −0.013 30.28 0.08
Gassim 0.0058 −8.6893 0.0152
Gizan −0.0321 67.239 0.5074
Guriat −0.0477 99.475 0.484
Hafr Al-Batin 0.0391 −74.757 0.2563
Hail −0.0265 56.177 0.1126
Jeddah 0.0016 0.4082 0.0044
Khamis-Mushait −0.008 19 0.0442
Madinah −0.0265 55.98 0.4414
Makkah −0.0078 17.112 0.037
Nejran −0.0495 100.77 0.6234
Qaisumah −0.0513 105.96 0.5849
Rafha 0.0064 −8.9633 0.0159
Riaydh −0.0174 37.932 0.2311
Sharourah −0.0999 202.89 0.4922
Sulayel 0.0004 2.7283 3.00E−05
Tabouk −0.0185 39.588 0.3946
Taif −0.0126 28.889 0.2631
Turaif 0.0151 −25.85 0.1112
Wadi Al-Dawasser 0.0154 −27.207 0.0903
Yanbo −0.0405 84.624 0.3275
AlJouf, Al-Wejh, Gassim, Hafr Al-Batin, Jeddah, Rafha, Su-layel, Turaif, and Wadi Al-Dawasser. Overall, a decreasingtrend of 0.01852 m/s per year was observed in annual meanwind speed values based on the algebraic average of the trendcoefficient (a) of all the stations used in the present work. Thebest fit trend lines for remaining stations are shown in Fig. 6band c.
At Sharourah, in southern Saudi Arabia, significantly highrate of decrease of 0.0999 m/s in annual mean wind speedwas observed from 1990 to 2006. Al-Ahsa was the next sta-tion where an annual decrease of 0.0876 m/s was estimatedand similar magnitude of rate of decrease was followed atAl-Baha (0.0656 m/s per year), Qaisumah (0.0513 m/s peryear), Nejran (0.0495 m/s per year), Guriat (0.0477 m/s peryear), and Yanbo (0.0405 m/s per year). At Hafr Al-Batin,Taif, Turaif, and Al-Wejh, the rate of increase of annual windspeed of 0.0391, 0.0154, 0.0151, and 0.014 m/s per year wasobserved, respectively. Well, these trends need to be verified
using more accurate wind speed measurements, but could beused as preliminary indicators of the future wind regime inSaudi Arabia.
3.2.2 Mann–Kendall Test Analysis
Mann–Kendall statistical trend analysis tests were carried outfor all the annual mean wind speed data and the relevant sta-tistics is summarized in Table 4. In case of Abha, the annualmean wind speed values depicted a decreasing trend firstand then an increasing, as can be seen from Fig. 7, thus thetrend is neither linear nor monotonic. In this case, the resid-uals are randomly distributed and are indicative that a linearmodel could be applied; one for decreasing and other forincreasing trend but in both cases, the number of data pointswill be very small and hence will not be significant statis-tically. The annual mean wind speeds at Al-Ahsa consist ofmonotonously decreasing trends as can be seen from Fig. 8.
123

Arab J Sci Eng (2013) 38:421–437 431
Table 4 Summary of Mann–Kendall test results
Station n Test Z Signific. Q Qmin99 Qmax99 Qmin95 Qmax95 B Bmin99 Bmax99 Bmin95 Bmax95
Abha 17 −0.12 −0.001 −0.063 0.052 −0.046 0.039 3.02 3.43 2.63 3.27 2.69
Ahsa 17 −3.09 ** −0.089 −0.182 −0.037 −0.158 −0.049 4.25 4.59 3.89 4.51 3.97
Al-Baha 17 −2.60 ** −0.065 −0.141 −0.001 −0.124 −0.020 3.88 4.70 3.35 4.53 3.39
Al-Jouf 26 1.52 0.009 −0.006 0.028 −0.002 0.024 3.72 3.97 3.50 3.87 3.55
Al-Wejh 30 0.68 0.007 −0.018 0.029 −0.012 0.024 4.18 4.65 3.78 4.54 3.87
Arar 32 −0.41 −0.008 −0.045 0.025 −0.038 0.016 3.94 4.65 3.18 4.53 3.45
Bisha 32 −1.67 + −0.013 −0.040 0.008 −0.032 0.002 2.59 3.33 2.22 3.05 2.32
Dhahran 31 −0.95 −0.007 −0.039 0.012 −0.025 0.008 4.50 5.30 3.99 4.86 4.11
Gassim 27 0.58 0.008 −0.020 0.043 −0.015 0.035 2.72 3.19 1.97 3.11 2.16
Gizan 30 −3.89 *** −0.032 −0.055 −0.015 −0.050 −0.019 3.97 4.57 3.58 4.43 3.64
Guriat 17 −2.68 ** −0.043 −0.088 −0.002 −0.072 −0.015 4.56 4.83 4.24 4.74 4.30
Hafr Al-Batin 17 1.94 + 0.043 −0.014 0.088 −0.001 0.072 2.98 3.56 2.52 3.47 2.67
Hail 17 −1.52 −0.025 −0.101 0.030 −0.082 0.012 3.42 3.85 2.97 3.76 3.14
Jeddah 30 −0.50 −0.002 −0.016 0.013 −0.010 0.009 3.73 4.00 3.37 3.87 3.48
Khamis-Mushait 30 0.18 0.002 −0.027 0.014 −0.017 0.012 2.93 3.67 2.73 3.37 2.79
Madinah 30 −3.32 *** −0.024 −0.042 −0.007 −0.038 −0.010 3.73 4.05 3.45 3.97 3.51
Makkah 17 −1.03 −0.015 −0.050 0.019 −0.042 0.015 1.67 1.92 1.49 1.87 1.50
Nejran 26 −3.66 *** −0.041 −0.064 −0.016 −0.056 −0.022 2.86 3.30 2.33 3.11 2.48
Qaisumah 31 −3.98 *** −0.045 −0.077 −0.020 −0.068 −0.027 4.73 5.46 4.24 5.25 4.29
Rafha 31 −0.82 −0.012 −0.046 0.020 −0.039 0.012 4.12 5.00 3.38 4.78 3.49
Riyadh 30 −0.86 −0.008 −0.032 0.011 −0.026 0.007 3.34 3.90 2.94 3.81 3.00
Sharourah 17 −2.76 ** −0.105 −0.185 −0.011 −0.171 −0.039 4.03 4.66 3.36 4.52 3.72
Tabouk 29 −4.11 *** −0.019 −0.031 −0.008 −0.028 −0.011 3.24 3.53 2.99 3.46 3.06
Taif 29 −2.68 ** −0.012 −0.025 0.000 −0.021 −0.003 3.97 4.27 3.73 4.15 3.79
Turaif 26 1.10 0.011 −0.014 0.040 −0.009 0.033 4.00 4.32 3.43 4.28 3.56
Wadi Al-Dawasser 17 0.70 0.010 −0.035 0.061 −0.021 0.044 3.43 3.69 3.01 3.61 3.08
Yanbo 29 −2.98 ** −0.047 −0.086 −0.007 −0.079 −0.024 5.19 6.02 4.18 5.84 4.70
-1.0-0.50.00.51.01.52.02.53.03.54.0
An
nu
al m
ean
Year
DataSen's estimate99 % conf. min99 % conf. max95 % conf. min95 % conf. maxResidual
Fig. 7 Annual mean wind speed and trend statistics for Abha
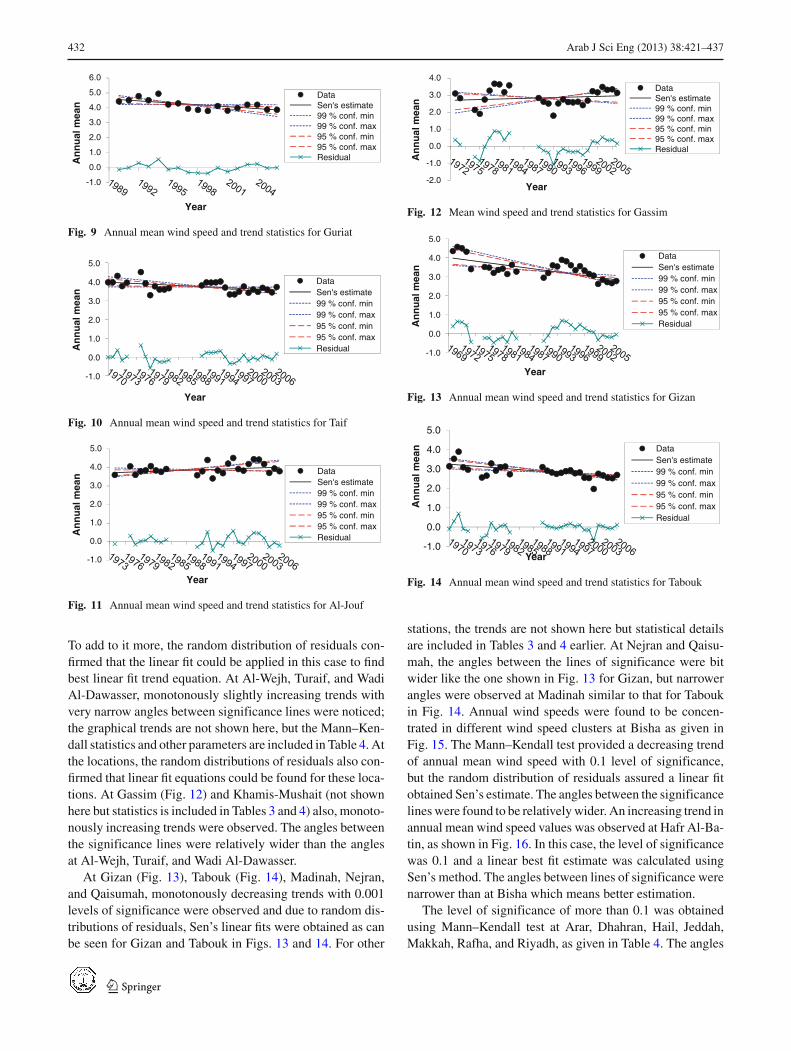
The residuals seem to be from a random distribution indicat-ing a linear model may be applied. The statistical calculationsprovide a high level of significance as can be understood withnarrow angles between the significance lines. Similar type ofdecreasing statistical significant trends were observed at Al-Baha, Guriat (Fig. 9), Sharourah, Taif (Fig. 10), and Yanbowhich are not shown here in graphical form, but linear trendsand related statistics is included in Tables 3 and 4. At Gu-
-2.0
-1.0
0.0
1.0
2.0
3.0
4.0
5.0
An
nu
al m
ean
Year
DataSen's estimate99 % conf. min99 % conf. max95 % conf. min95 % conf. maxResidual
Fig. 8 Annual mean wind speed and trend statistics for Al-Ahsa
riat and Taif, narrow angles between the significance linesconfirmed high level of statistical significance, as shown inFigs. 9 and 10; while at Al-Baha, Sharourah, and Yanbo, theangles between the significance line were relatively wider.
In case of Al-Jouf (Fig. 11), Mann–Kendall statistical testshowed monotonous increasing trends both at 0.01 and 0.05significance levels. Moreover, the angles between the signif-icance lines were very narrow as can be seen from Fig. 11.
123
432 Arab J Sci Eng (2013) 38:421–437
-1.0
0.0
1.0
2.0
3.0
4.0
5.0
6.0A
nn
ual
mea
n
Year
DataSen's estimate99 % conf. min99 % conf. max95 % conf. min95 % conf. maxResidual
Fig. 9 Annual mean wind speed and trend statistics for Guriat
-1.0
0.0
1.0
2.0
3.0
4.0
5.0
An
nu
al m
ean
Year
DataSen's estimate99 % conf. min99 % conf. max95 % conf. min95 % conf. maxResidual
Fig. 10 Annual mean wind speed and trend statistics for Taif
-1.0
0.0
1.0
2.0
3.0
4.0
5.0
An
nu
al m
ean
Year
DataSen's estimate99 % conf. min99 % conf. max95 % conf. min95 % conf. maxResidual
Fig. 11 Annual mean wind speed and trend statistics for Al-Jouf
To add to it more, the random distribution of residuals con-firmed that the linear fit could be applied in this case to findbest linear fit trend equation. At Al-Wejh, Turaif, and WadiAl-Dawasser, monotonously slightly increasing trends withvery narrow angles between significance lines were noticed;the graphical trends are not shown here, but the Mann–Ken-dall statistics and other parameters are included in Table 4. Atthe locations, the random distributions of residuals also con-firmed that linear fit equations could be found for these loca-tions. At Gassim (Fig. 12) and Khamis-Mushait (not shownhere but statistics is included in Tables 3 and 4) also, monoto-nously increasing trends were observed. The angles betweenthe significance lines were relatively wider than the anglesat Al-Wejh, Turaif, and Wadi Al-Dawasser.
At Gizan (Fig. 13), Tabouk (Fig. 14), Madinah, Nejran,and Qaisumah, monotonously decreasing trends with 0.001levels of significance were observed and due to random dis-tributions of residuals, Sen’s linear fits were obtained as canbe seen for Gizan and Tabouk in Figs. 13 and 14. For other
-2.0
-1.0
0.0
1.0
2.0
3.0
4.0
An
nu
al m
ean
Year
DataSen's estimate99 % conf. min99 % conf. max95 % conf. min95 % conf. maxResidual
Fig. 12 Mean wind speed and trend statistics for Gassim
-1.0
0.0
1.0
2.0
3.0
4.0
5.0
An
nu
al m
ean
Year
DataSen's estimate99 % conf. min99 % conf. max95 % conf. min95 % conf. maxResidual
Fig. 13 Annual mean wind speed and trend statistics for Gizan
-1.0
0.0
1.0
2.0
3.0
4.0
5.0
An
nu
al m
ean
Year
DataSen's estimate99 % conf. min99 % conf. max95 % conf. min95 % conf. maxResidual
Fig. 14 Annual mean wind speed and trend statistics for Tabouk
stations, the trends are not shown here but statistical detailsare included in Tables 3 and 4 earlier. At Nejran and Qaisu-mah, the angles between the lines of significance were bitwider like the one shown in Fig. 13 for Gizan, but narrowerangles were observed at Madinah similar to that for Taboukin Fig. 14. Annual wind speeds were found to be concen-trated in different wind speed clusters at Bisha as given inFig. 15. The Mann–Kendall test provided a decreasing trendof annual mean wind speed with 0.1 level of significance,but the random distribution of residuals assured a linear fitobtained Sen’s estimate. The angles between the significancelines were found to be relatively wider. An increasing trend inannual mean wind speed values was observed at Hafr Al-Ba-tin, as shown in Fig. 16. In this case, the level of significancewas 0.1 and a linear best fit estimate was calculated usingSen’s method. The angles between lines of significance werenarrower than at Bisha which means better estimation.
The level of significance of more than 0.1 was obtainedusing Mann–Kendall test at Arar, Dhahran, Hail, Jeddah,Makkah, Rafha, and Riyadh, as given in Table 4. The angles
123

Arab J Sci Eng (2013) 38:421–437 433
-1.0
0.0
1.0
2.0
3.0
4.0
5.0A
nn
ual
Mea
n
Year
DataSen's estimate99 % conf. min99 % conf. max95 % conf. min95 % conf. maxResidual
Fig. 15 Annual mean wind speed and trend statistics for Bisha
-1.0
0.0
1.0
2.0
3.0
4.0
5.0
An
nu
al m
ean
Year
DataSen's estimate99 % conf. min99 % conf. max95 % conf. min95 % conf. maxResidual
Fig. 16 Annual mean wind speed and trend statistics for Hafr Al-Batin
-2.0
-1.0
0.0
1.0
2.0
3.0
4.0
5.0
6.0
An
nu
al m
ean
Year
DataSen's estimate99 % conf. min99 % conf. max95 % conf. min95 % conf. maxResidual
Fig. 17 Annual mean wind speed and trend statistics for Arar
-2.0
-1.0
0.0
1.0
2.0
3.0
4.0
5.0
6.0
7.0
An
nu
al m
ean
Year
DataSen's estimate99 % conf. min99 % conf. max95 % conf. min95 % conf. maxResidual
Fig. 18 Annual mean wind speed and trend statistics for Dhahran
between significance lines were relatively wider at Arar(Fig. 17), Makkah, Rafha, and Riyadh compared to those atDhahran (Fig. 18), Hail, and Jeddah. Due to random nature ofresiduals at all of these stations, the Sen’s estimate were ableto provide linear best fit lines for the estimation of increasingor decreasing values of annual mean wind speeds.
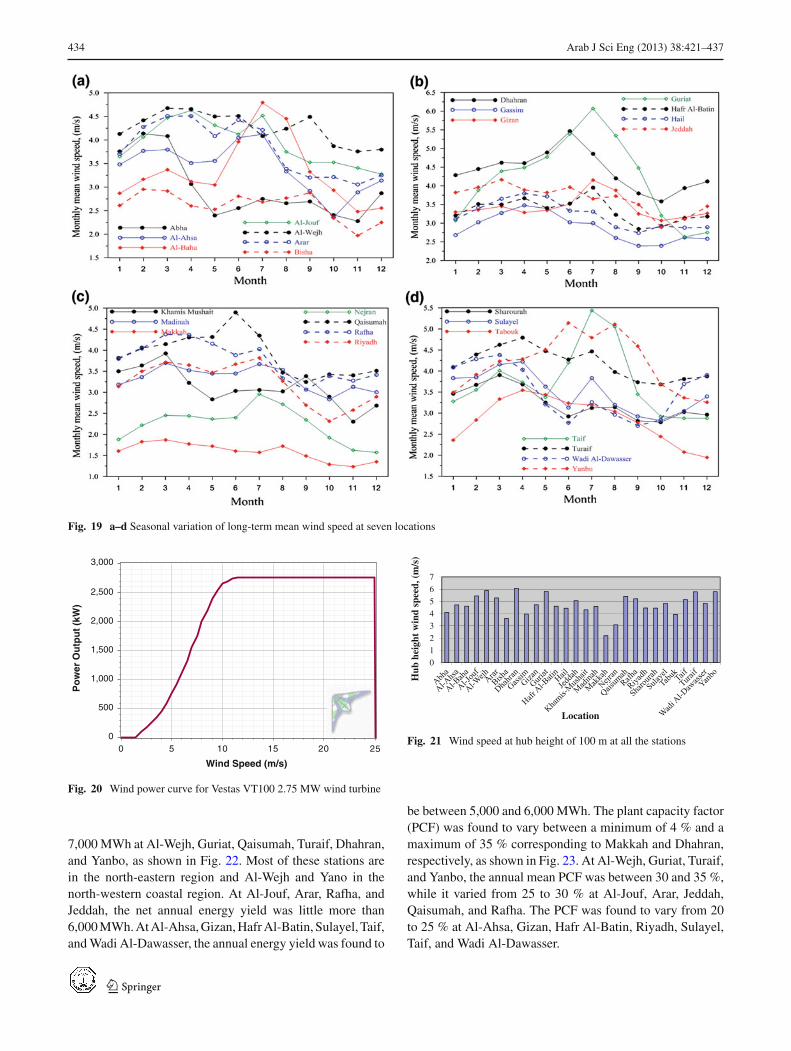
3.3 Monthly Variation of Wind Speed
The study of seasonal trends of wind speed is required tomanage the electricity production from wind during differ-ent months of the year and then to integrate it with the gridand the load centers. The monthly mean values of wind speedwere calculated over entire period of data collection and forall the locations. The monthly mean wind speed at Abhawas higher during January till March and varied between2.5 and 3 m/s during rest of the months as can be seen inFig. 19a. At Al-Ahsa and Al-Baha, the wind speed was high-est in July and lowest in October and November. At Al-Ahsa,the wind speed varied between 2.5 and 4 m/s, while at Al-Baha from 2.5 to 4.75 m/s. At Al-Jouf, Al-Wejh, and Arar,the wind speed values were always above 3 m/s, while atBisha it remained between 2.5 and 3 m/s, as depicted inFig. 19a.
Highest mean wind speed at Dhahran was observed inJune and lowest in October, as shown in Fig. 19b. Largerseasonal variations were observed at Dhahran and Guri-at, while smaller seasonal ranges (2.5–4 m/s) were seen atGassim, Gizan, Hafr Al-Batin, Hail, and Jeddah. At Kahmis-Mushait, Madinah, Qaisumah, Rafha, and Riyadh, relativelyhigher monthly mean wind speeds were observed comparedto Makkah and Nejran, as given in Fig. 19c. At Sulayel andWadi Al-Dawasser, higher values were observed during win-ter months, while lower during summer time, as observedfrom Fig. 19d. It is evident from this analysis that at mostof the stations, the wind speed values were higher duringsummer months and lower during winter months with aboveexception.
3.4 Annual Energy Yield Estimation
In order to have an idea of energy yield at all the loca-tions under investigation, an efficient wind turbine VT100of 2.75 MW from Vestas with 100 m diameter and 100 mhub height was used to get the annual energy yield. Thecut-inwind speed of this turbine was 2 m/s and the cut-outspeed was 25 m/s. The wind power curve of the chosen windturbine is shown in Fig. 20. The wind speed at hub heightwas obtained using the 1/7 wind power law and is comparedin Fig. 21 for all the stations. The long-term annual meanwind speed was between 5 and 6 m/s at Al-Jouf, AL-Wejh,Arar, Guriat, Rafha, Turaif, and Qaisumah in the northernregion and Jeddah, Taif, and Yanbo in the western region andDhahran on the east coast. At rest of the stations, the annualmean wind speed at hub-height was more than 4 m/s with theexception of Bisha, Makkah, and Nejran where it was lessthan 4 m/s, as can be seen from Fig. 21.
The net (after losses i.e. down time = 6 %, array = 5 %,icing = 4 %, and others = 4 %) annual energy yield from thechosen wind turbine at a hub height of 100 m was more than
123
434 Arab J Sci Eng (2013) 38:421–437
Fig. 19 a–d Seasonal variation of long-term mean wind speed at seven locations
0 5 10 15 20 250
500
1,000
1,500
2,000
2,500
3,000
Po
wer
Ou
tpu
t (k
W)
Wind Speed (m/s)
Fig. 20 Wind power curve for Vestas VT100 2.75 MW wind turbine
7,000 MWh at Al-Wejh, Guriat, Qaisumah, Turaif, Dhahran,and Yanbo, as shown in Fig. 22. Most of these stations arein the north-eastern region and Al-Wejh and Yano in thenorth-western coastal region. At Al-Jouf, Arar, Rafha, andJeddah, the net annual energy yield was little more than6,000 MWh. At Al-Ahsa, Gizan, Hafr Al-Batin, Sulayel, Taif,and Wadi Al-Dawasser, the annual energy yield was found to
0
123456
7
Hub
hei
ght
win
d sp
eed,
(m
/s)
Location
Fig. 21 Wind speed at hub height of 100 m at all the stations
be between 5,000 and 6,000 MWh. The plant capacity factor(PCF) was found to vary between a minimum of 4 % and amaximum of 35 % corresponding to Makkah and Dhahran,respectively, as shown in Fig. 23. At Al-Wejh, Guriat, Turaif,and Yanbo, the annual mean PCF was between 30 and 35 %,while it varied from 25 to 30 % at Al-Jouf, Arar, Jeddah,Qaisumah, and Rafha. The PCF was found to vary from 20to 25 % at Al-Ahsa, Gizan, Hafr Al-Batin, Riyadh, Sulayel,Taif, and Wadi Al-Dawasser.
123

Arab J Sci Eng (2013) 38:421–437 435
01,0002,0003,0004,0005,0006,0007,0008,0009,000
Ann
ual e
nerg
y ou
tput
, (M
Wh)
Location
Fig. 22 Annual energy yields from Vestas 2.75MW wind turbine at allthe stations
0
5
10
15
20
25
30
35
40
Net
cap
acit
y fa
ctor
, (%
)
Location
Fig. 23 Annual mean plant capacity factor at all the locations
05
10152025303540
Per
cent
zer
o an
d ra
ted
outp
ut
Location
Zero output Rated output
Fig. 24 Percentages of rated and zero output at all the stations
The percent duration during which the wind turbineremained idle or with zero energy yield was always muchless than 5 % for most of the locations, but between 5 and10 % at Al-Ahsa, Bisha, Gassim, Hafr Al-Batin, Qaisumah,Rafha, Riyadh, Sharourah, and Tabouk, as shown in Fig. 24.The percent duration during which the wind turbine producedthe rated output was almost negligible, as can be seen fromFig. 24.
4 Conclusions
From the analysis of 28 meteorological stations, the high-est annual average wind speed (at 10 m AGL) of 4.4 m/swas observed at Dhahran, while the lowest of 1.59 m/s atMakkah as can be seen from Table 2. Promising long-termannual means of more than 4 m/s were observed at Al-Wejh,Guriat, Turaif, and Yanbo.
A clear seasonal effect was noticed in wind speed inten-sities and spread of the higher wind speed in larger areas.For example, during winter months, the higher wind speedswere observed over a wide area in northern and western partsof the Kingdom, while further higher wind intensities wereconfined only fewer areas in the East, North, and West parts.
Based on regression line analysis, decreasing trends ofannual mean wind speed were found at Al-Ahsa, AlBaha,Bisha, Dhahran, Gizan, Guriat, Hail, Khamis-Mushait, Mad-ina, Makkah, Nejran, Qasumah, Riyadh, Sharourah, Tabouk,Taif, Wadi Al-Dawasser, and Yanbo, and increasing atremaining locations, i.e. Abha, Al-Jouf, Al-Wejh, Gassim,Hafr Al-Batin, Jeddah, Rafha, Sulayel, Turaif, and WadiAlDawasser. Overall, a decreasing trend of 0.01852 m/s peryear was observed in annual mean wind speed values basedon the algebraic average of the trend coefficient (a) of all thestations used in the present work.
At Sharourah, in southern Saudi Arabia, significantlyhigh rate of decrease of 0.0999 m/s in annual mean windspeed was observed from 1990 to 2006. Al-Ahsa wasthe next station where an annual decrease of 0.0876 m/swas estimated and similar magnitude of rate of decreasewas followed at Al-Baha (0.0656 m/s per year), Qaisu-mah (0.0513 m/s per year), Nejran (0.0495 m/s per year),Guriat (0.0477 m/s per year), and Yanbo (0.0405 m/s peryear). At Hafr Al-Batin, Taif, Turaif, and Al-Wejh, therate of increase of annual wind speed of 0.0391, 0.0154,0.0151, and 0.014 m/s per year were observed, respectively.Well, these trends need to be verified using more accuratewind speed measurements, but could be used as prelimi-nary indicators of the future wind regime in Saudi Ara-bia.
The net annual energy yield from the chosen wind tur-bine at a hub height of 100 m was more than 7,000 MWh atAl-Wejh, Guriat, Qaisumah, Turaif, Dhahran, and Yanbo. AtAl-Jouf, Arar, Rafha, and Jeddah, the net annual energy yieldwas little more than 6,000 MWh. At Al-Ahsa, Gizan, Hafr,Sulayel, Taif, and Wadi Al-Dawasser, the annual energy yieldwas found to be between 5,000 and 6,000 MWh.
The PCF was found to vary between a minimum of 4 % anda maximum of 35 % corresponding to Makkah and Dhahran,respectively. At Al-Wejh, Guriat, Turaif, and Yanbo, theannual mean PCF was between 30 and 35 %, while itvaried from 25 to 30 % at Al-Jouf, Arar, Jeddah, Qaisumah,and Rafha. The PCF was found to vary from 20 to 25 % at
123
436 Arab J Sci Eng (2013) 38:421–437
Al-Ahsa, Gizan, Hafr Al-Batin, Riyadh, Sulayel, Taif, andWadi Al-Dawasser.
Acknowledgments The author wishes to acknowledge the supportof the Research Institute of King Fahd University of Petroleum andMinerals, Dhahran, Saudi Arabia.
References
1. Global Wind Energy Council (GWEC): Global wind power boomcontinues despite economic woes (2011)
2. Rehman, S.: Prospects of wind farm development in Saudi Arabia.Renew. Energy. 30(3), 447–463 (2004a)
3. Rehman, S.: Wind energy resource assessment for Yanbo, SaudiArabia. Energy Convers. Manag. 45(13–14), 2019–2032 (2004b)
4. Rehman, S.; Aftab, A.: Assessment of wind energy potential forcoastal locations of the Kingdom Saudi Arabia. Energy Int. J. 29,1105–1115 (2004)
5. Rehman, S.; Halawnai, T.O.; Mohandes, M.: Wind power costassessment at twenty locations in the Kingdom of Saudi Arabia.Renew. Energy. 28, 573–583 (2003)
6. Al-Abbadi, N.M.; Wind energy resource assessment for five loca-tions in Saudi Arabia. Renew. Energy. 30, 1489–1499 (2005)
7. Al-Abbadi, N.M.; Alawaji, S.H.; Eugenio, N.N.: Wind EnergyResource Assessment: A three year Experience. In: Windpow-er 1997 Proceedings, Annual Conference of the American WindEnergy Association, AWEA, Austin, Texas, pp. 533–541 (1996)
8. Alawaji, S.H.: Wind energy resource assessment in Saudi Arabia-I network design and description. Renew. Energy. 7(4), 319–328(1996)
9. Rehman, S.; Halawani, T.O.: Statistical characteristics of wind inSaudi Arabia. Renew. Energy. 4(8), 949–956 (1996)
10. Rehman, S.; Halawani, T.O.; Husain, T.: Weibull parameters forwind speed distribution in Saudi Arabia. Solar Energy. 3(6), 473–479 (1994)
11. Jaramillo, O.A.; Borja, M.A.: Wind speed analysis in La Ventosa,Mexico: a bimodal probability distribution case. Renew. Energy.29, 1613–1630 (2004)
12. Kainkwa, R.M.R.: Wind speed pattern and the available windpower at Basotu, Tanzania. Renew. Energy. 21, 289–295 (2000)
13. Celik, A.N.: Energy output estimation for small-scale wind powergenerators using Weibull-representative wind data. J. Wind Eng.Ind. Aerodyn. 91, 693–707 (2003)
14. Ackermann, T.; Soder, L.: Wind energy technology and currentstatus: a review. Renew. Sustain. Energy Rev. 4, 315–374 (2000)
15. Jebraj, S.; Inivan, S.: A review of energy model. Renew. Sustain.Energy Rev. 10(4), 281–311 (2006)
16. Perez, I.A.; Garcia, M.A.; Sanchez M.N.; et al.: Autocorrelationanalysis of meteorological data from a RASS. J. Appl. Meteorol.43(8), 1213–1223 (2004)
17. Akpinar, K.E.; Akpinar, S.: An assessment on seasonal analy-sis of wind energycharacteristics and wind turbine characteristics.Energy Convers. Manag. 46, 1848–1867 (2005)
18. Acker, T.L.; Williams, S.K.; Duque, E.P.N.; Brummels, G.; Buech-ler, J.: Wind resource assessment in the state of Arizona: inventory,capacity factor and cost. Renew. Energy. 2, 1453–1466 (2007)
19. Shata, A.S.A.; Hanitsch, R.: The potential of electricity genera-tion on the east coast of Red Sea in Egypt. Renew. Energy. 31(10),1597–1615 (2006)
20. Shata, A.S.A.; Hanitsch, R.: Electricity generation and wind poten-tial assessment at Hurghada, Egypt. Renew. Energy. 33, 141–148(2007)
21. Hrayshat, E.S.: Wind resource assessment of the Jordanian south-ern region. Renew. Energy. 32, 1948–1960 (2007)
22. Bagiorgas, H.S.; Assimakopoulos, M.N.; Theoharopoulos, D.;Matthopoulos, D.; Mihalakakou, G.K.: Electricity generation usingwind energy conversion systems in the area of Western Greece.Energy Convers. Manag. 48, 1640–1655 (2007)
23. Jiang, Y.; Yuan, X.; Feng, J.; Cheng, X.: Wind power density sta-tistics using the Weibull model for inner Mongolia, China. WindEng. 30(2), 161–168 (2006)
24. Ulgen, K.; Genc, A.; Hepbasli, A.; et al.: Assessment of wind char-acteristics for energy generation. Energy Sources. 26(13), 1227–1237 (2004)
25. Eskin, N.; Artar, H.; Tolun, S.: Wind energy potential of GokceadaIsland in Turkey. Renew. Sustain. Energy Rev. 12, 839–851 (2008)
26. El-Osta, W.; Kalifa, Y.: Prospects of wind power plants in Libya:a case study. Renew. Energy. 28, 363–371 (2003)
27. Omer, A.M.: On the wind energy resources of Sudan. Renew. Sus-tain. Energy Rev. 12, 2117–2139 (2008)
28. Himri, Y.; Rehman, S.; Draoui, B.; Himri, S.: Wind power potentialassessment for three locations in Algeria. Renew. Sustain. EnergyRev. 12(9), 2495–2504 (2008)
29. Tar, K.: Some statistical characteristics of monthly average windspeed at various heights. Renew. Sustain. Energy Rev. 12, 1712e–1724e (2008)
30. Jones, M.S.; Colle, B.A.; Tongue, J.S.: Evaluation of a mesoscaleshort-range ensemble forecast system over the northeast UnitedStates. Weather Forecast. 22(1), 36–55 (2007)
31. Kamal, L.; Jafri, Y.Z.: Time series models to simulate and fore-cast hourly averaged wind speed in Quetta, Pakistan. Solar Energy.61(1), 23–32 (1997)
32. Torres, J.; Garcia, A.; Deblas, M.; Defrancisco, A.: Forecast ofhourly average wind speed with arma models in navarre (Spain).Solar Energy. 79(1), 65–77 (2005)
33. Kavasseri, R.; Seetharaman, K.: Day-ahead wind speed forecastingusing f-ARIMA models. Renew. Energy. 34(5), 1388–1393 (2009)
34. Shamshad, A.; Bawadi, M.A.; Wan Hussin, W.M.A.; Majid, T.A.;Sanusi, S.A.M.: First and second order Markov chain models forsynthetic generation of wind speed time series. Energy. 30, 693–708 (2005)
35. Costa, A.; Crespo, A.; Navarro, J.; Lizcano, G.; Madsen, H.; Feito-sa, E.; A review on the young history of the wind power short-termprediction. Renew. Sustain. Energy Rev. 12(6), 1725–1744 (2008)
36. Alexiadis, M.; Dokopoulos, P.; Sahsamanoglou, H.; Manousari-dis, I.: Short term forecasting of wind speed and related electricalpower. Solar Energy. 63(1), 61–68 (1998)
37. More, A.; Deo M.C.: Forecasting wind with neural networks.Marine Struct. 16(1), 35–49 (2003)
38. Maqsood, I.; Khan, M.R.; Huang, G.H.; Abdalla, R.: Applicationof soft computing models to hourly weather analysis in southernSaskatchewan, Canada. Eng. Appl. Artif. Intell. 18(1), 115–125(2005)
39. Kariniotakis, G.; Stavrakakis, G.; Nogaret, E.: Wind power fore-casting using advanced neural network models. IEEE Trans.Energy Convers. 11(4), 762–767 (1996)
40. Barbounis, T.G.; Theocharis, J.B.: Locally recurrent neural net-works for long-term wind speed and power prediction. Neurocom-puting 69(4–6), 466–496 (2006)
41. Burnham, K.P.; Anderson, D.R.: Model Selection and Multi-modelInference. 2nd edn. Springer, New York (2002)
42. Sánchez, I.: Adaptive combination of forecasts with application towind energy. Int. J. Forecast. 24(4), 679–693 (2008)
43. Kendall, M.G.: A new measure of rank correlation. Biometrika. 30,81–93 (1938)
44. Kendall, M.G.: Rank Correlation Methods. Charles Griffin, Lon-don, UK, p. 272 (1970)
123

Arab J Sci Eng (2013) 38:421–437 437
45. Mann, H.B.: Non-parametric test of randomness against trend. Eco-nometrica. 13, 245–259 (1945)
46. Gilbert, R.O.: Statistical Methods for Environmental PollutionMonitoring. Van Nostrand Reinhold, New York (1987)
47. Salmi T.; Mtt, A.; Anttila, P.; Ruoho-Airola, T.; Amnell, T.: Detect-ing trends of annual values of atmospheric pollutants by the Mann–Kendall test and Sen’s slope estimates—The EXCEL templateapplication MAKESENS. Publication on air quality, Report CodeFMI-AQ-31, Finnish Meteorological Institute, Helsinki, Finland
48. Sirois, A.: A brief and biased overview of time series analy-sis or how to find tha evasive trend. In WMO report No. 133;WMO/EMEP workshop on advanced statistical methods and theirapplications to air quality data sets, Helsinki, September 14–16(1998)
123
Related Documents